![Groby i krąg kamienny z Błędowa, w pow. wąbrzeskim [Graves and the stone circle from Błędowo, the Wąbrzeźno district (former Blandau, Kr. Culm)]](https://static.fdokumen.com/doc/165x107/633e43ec99763552dd091dc4/groby-i-krag-kamienny-z-bledowa-w-pow-wabrzeskim-graves-and-the-stone-circle.jpg)
073/MSPSE/703 Scenario Analysis of Integrated Nepal Pow
225
TRIBHUVAN UNIVERSITY INSTITUTE OF ENGINEERING PULCHOWK CAMPUS THESIS NO: 073/MSPSE/703 Scenario Analysis of Integrated Nepal Power System for Energy Banking between Nepal & India from Nepalese Perspective for Projected Ten Years by Bijay Puri A THESIS SUBMITTED TO THE DEPARTMENT OF ELECTRICAL ENGINEERING IN PARTIAL FULFILLMENT OF THE REQUIREMENT FOR THE DEGREE OF MASTERS OF SCIENCE IN POWER SYSTEM ENGINEERING DEPARTMENT OF ELECTRICAL ENGINEERING LALITPUR, NEPAL FEBRUARY, 2021
-
Upload
khangminh22 -
Category
Documents
-
view
1 -
download
0
Transcript of 073/MSPSE/703 Scenario Analysis of Integrated Nepal Pow

TRIBHUVAN UNIVERSITY
INSTITUTE OF ENGINEERING
PULCHOWK CAMPUS
THESIS NO: 073/MSPSE/703
Scenario Analysis of Integrated Nepal Power System for Energy Banking between Nepal & India
from Nepalese Perspective for Projected Ten Years
by
Bijay Puri
A THESIS
SUBMITTED TO THE DEPARTMENT OF ELECTRICAL ENGINEERING IN PARTIAL
FULFILLMENT OF THE REQUIREMENT FOR THE DEGREE OF MASTERS OF SCIENCE
IN POWER SYSTEM ENGINEERING
DEPARTMENT OF ELECTRICAL ENGINEERING
LALITPUR, NEPAL
FEBRUARY, 2021

i
COPYRIGHT
The author has agreed that the library, Department of Electrical Engineering,
Pulchowk Campus, Institute of Engineering may make this thesis freely available for
inspection. Moreover, the author has agreed that the permission for extensive copying
of this thesis for scholarly purpose may be granted by the Professor(s), who
supervised the thesis work recorded herein or, in his absence, by Head of Department
or concerning M.Sc. Program coordinator or Dean of the Institute wherein thesis work
was done. It is understood that the recognition will be given to the author of this thesis
and to the Department of Electrical Engineering, Pulchowk Campus and Institute of
Engineering in any use of the material of thesis. Copying, publication, or other use of
the material of this thesis for financial gain without approval of Department of
Electrical Engineering, Pulchowk Campus, Institute of Engineering and author’s
written permission is prohibited.
Request for permission to copy or to make any use of the material in this in whole or
part should be addressed to:
Head
Department of Electrical Engineering
Institute of Engineering
Pulchowk Campus
Lalitpur, Nepal

ii
TRIBHUVAN UNIVERSITY
INSTITUTE OF ENGINEERING
PULCHOWK CAMPUS, LALITPUR
DEPARTMENT OF ELECTRICAL ENGINEERING
The undersigned certify that they have read, and recommended to the Institute of Engineering
for acceptance, a thesis entitled "Scenario Analysis of Integrated Nepal Power System for
Energy Banking between Nepal & India from Nepalese Perspective for Projected Ten
Years" submitted by Bijay Puri in partial fulfilment of the requirements for the degree of
Master of Science in Power System Engineering.
Prof. Dr. Nava Raj Karki Assoc. Prof. Dr. Arbind Kumar Mishra
Program Coodinator Supervisor
Department of Electrical Engineering Department of Electrical Engineering
Pulchowk Campus, Lalitpur Pulchowk Campus, Lalitpur
Mahammad Badrudoza Er. Surendra Rajbhandari
Associate Professor External Examiner
Head of Department Former Deputy Managing Director
Department of Electrical Engineering Nepal Electricity Authority
Pulchowk Campus, Lalitpur
February, 2021

iii
ABSTRACT
The surplus – deficit energy analysis for projected ten years of Integrated Nepal Power System
(INPS) gives ideas about the monthly energy status in different scenarios and helps in better
planning for Energy Banking between Nepal and India from Nepalese perspective and also in
increasing the opportunities of internal consumption within the country. Energy banking
between power systems of Nepal and India will enhance the power system security and
reliability of Nepal power system. The real problems created by delays in commissioning of
upcoming generation projects due to different delaying factors such as delays in
commissioning of projects from their PPA concluded date and delays in completion of
transmission projects will change the pattern and amount of generations in upcoming periods
which results into difficulty in planning purpose. Similarly, the increase in both the
generations and expected energy consumption also impacts the INPS in future as well.
This thesis presents the scenario analysis of surplus – deficit energy for projected ten years
period with the consideration of different scenarios in both the generation and consumption
sector and simulates the load flow analysis of planned INPS after the saturation of new
generation projects for fiscal year 084/85 in most likely generation scenario i.e. Shift IPP and
NEA Plants scenario. Three scenarios viz. commissioning of upcoming projects in accordance
with the Power Purchase Agreement (PPA) concluded date, with one year delay for projects
coming under Independent Power Producers (IPPs) & additional three years delay in projects
coming under Nepal Electricity Authority (NEA) and its sister organization are considered in
generation sectors. The consumption sector is introduced with five scenarios viz. Normal,
Growth with Categorization of Consumption, Intervention with Induction Chulo, Intervention
with Electric Vehicle and Combined Intervention of Induction Chulo and Electric Vehicle.
Surplus – Deficit (S – D) ratio has been used for studying the relative dominance of surplus or
deficit energy over a year. For the projected ten years period, the surplus – deficit energy of
each month of those fiscal years are determined. This study clearly decides for monthly
energy banking scenario between two countries in both the normal load consumption growth
in Nepal and also with opportunities of increasing use of electrical energy. This study also
models and simulates the planned INPS after generation saturation in “Shift NEA and IPP
Plants” scenario for five scenarios to predict the import export options in five energy
consumption scenarios as well.

iv
When the energy demand is expected to grow at the rate of 8% per annum, the maximum
export of energy has been observed for months of Ashoj. The study shows the Dhalkebar –
Muzzafarupur 400 kV line has been fully used upto its capacity and around 2094 MW power
export has been observed through 400 kV Butwal – Gorakhpur cross border transmission link.
When the energy demand is expected to grow as per growth rate with categorization of
consumption, the maximum import (in the month of Falgun) is achieved with four import lines
viz. Dhalkebar – Muzzafarpur 400 kV line, Tanakpur – Mahendranagar 132 kV transmission
line, Butwal – Gorakhpur 400 kV line and Kusaha – Katiya 132 kV line. Similarly, when the
energy consumption policy is implemented as intervention with induction chulo or combined
intervention of both induction chulo and electric vehicle for maximum import in these
scenarios with monthly peak demands of about 5803MW and 6139 MW respectively for fiscal
year 084/85, six import lines in accordance with cross – border planning have been neede to
accommodate the total import peak demand within their loading capacity. These lines are
Tanakpur – Mahendranagar 132 kV line, Butwal – Gorakhpur 400 kV line, Dhalkebar –
Muzzafarpur 400 kV line, Kusaha – Kataiya 132 kV, Parwanipur – Raxaul 132 kV line and
Duhabi – Purnea 400 kV lines. However, Amlekhgunj – Kamane – Pathlaiya – Parwanipur –
Birgunj – Simara – Amlekhgunj loop is provided with additional capacitor banks to
compensate for convergence problem cause by reactive power need in latter two import
scenarios.
When the export scenario is analyzed with electric vehicle integration policy in the months of
Ashoj, only Dhalkebar – Muzzafarpur 400 kV line is needed to accommodate the export
demand which is in the range of capacity of this line (i.e.1200 MW).
The transformers of Balaju, Bhaktapur, Chapali, Dhalkebar, Hetauda, Suichatar, Khimti and
Parwanipur grids is found critically overloaded in all scenarios and should be upgraded once
the upcoming generation projects saturates in INPS. The 66 kV and 132 kV transmission lines
of Kathmandu sub – system and Amlekhgunj – Kamane – Pathlaiya – Parwanipur – Birgunj –
Simara – Amlekhgunj sub – sytem is found critically overloaded in all scenarios. Similarly,
all the 66 kV and 132 kV in buses in INPS have been found to operate with critical bus
voltages in all scenarios after generation saturation in planned INPS indicating vulnerability of
our INPS as well.

v
ACKNOWLEDGEMENT
The master’s thesis on topic "Scenario Analysis of Integrated Nepal Power System
for Energy Banking between Nepal & India from Nepalese Perspective for
Projected Ten Years" has been completed successfully with excellent guidance,
encouragement and the constant source of inspiration from my supervisor, friends
and family members. I take this opportunity to extend sincere thanks and
indebtedness to all those persons who helped me during the entire period of thesis
work.
First of all, I would like to express my gratitude to my project supervisor Assoc.
Prof. Dr. Arvind Kumar Mishra for his continuous guidance and support during the
entire period. I would like to express my deep sense of gratitude to Dr. Nava Raj
Karki, Head, Department of Electrical Engineering and all faculty members for
their valuable input and for taking the time to review my thesis.
I would also like to thank officers of Ministry of Energy, Water Resources and
Irrigation, Department of Electricity Development & Load Dispatch Center, Nepal
Electricity Authority who have helped me acquiring information regarding present
and projected Integrated Nepal Power System.
My special thanks go to my friend Er. Saugat Poudel, Er. Suraj Dahal and Er. Anil
Banjade for their encouraging support throughout the study period.
Last but not the least; I also acknowledge indebtedness to my parents, my wife and
all my family members for their continuous help, support and inspiration throughout
my study period.

vi
TABLE OF CONTENTS
COPYRIGHT ........................................................................................................... i
ABSTRACT ............................................................................................................. ii
ACKNOWLEDGEMENT ....................................................................................... v
TABLE OF CONTENTS ....................................................................................... vi
LIST OF TABLES ................................................................................................... x
LIST OF FIGURES ............................................................................................... xii
LIST OF ACRONYMS AND ABBREVIATION ................................................. xv
CHAPTER 1: INTRODUCTION ........................................................................... 1
1.1 Background ...................................................................................................... 1
1.2 Problem Statement ........................................................................................... 3
1.3 Objective and Scope ........................................................................................ 4
1.4 Outline of Thesis .............................................................................................. 5
CHAPTER 2: LITERATURE REVIEW................................................................ 6
2.1 Recent Trends of Energy Exchange between Nepal & India ............................. 6
2.2 Energy Consumption Growth Study ................................................................. 6
2.2.1 Demand Forecast Study by Water and Energy Commission Secretariat ..... 6
2.2.2 Energy Demand Projection Study by Investment Board of Nepal .............. 8
2.2.3 Load Forecast study by Nepal Electricity Authority .................................. 9
2.2.4 Energy Forecast Study by Asian Development Bank ............................... 10
2.2.5 Power Demand Forecast Study by Government of Nepal & Japan International Cooperation Agency (JICA) ........................................................ 10
2.2.6 Capacity and Enrgy Growth Rate Adopted in Load Dispatch Center, NEA for Analayis Purpose ........................................................................................ 11
2.2.7 Brief Introduction to Indian Power System and Its Demand Projection .... 12
2.3 Vehicle Kilometer Run & Electric Vehicle Energy Consumption Study ......... 13
2.3.1 Road Trasportation Energy Demand and Environmental Emission: A Case of Kathmandu Valley ....................................................................................... 13
2.3.2 Energy Cosumption Study of Different Electric Vehicles ........................ 14
2.4 Energy Banking Strategy between Nepal - India Cooperation in Power Sector 16

vii
CHAPTER 3: METHODOLOGY ........................................................................ 17
3.1 Methodology Approach ................................................................................. 17
3.2 Data Collection .............................................................................................. 19
3.2.1 Monthly Energy Generation and Monthly Energy Consumption Data ..... 20
3.2.1.1 Monthly Energy Generations of NEA operated ROR hydropower projects ......................................................................................................... 20
3.2.1.2 Monthly Energy Generations of Storage hydropower projects ........... 21
3.2.1.3 Monthly Energy Generations of IPP operated ROR hydropower projects ......................................................................................................... 21
3.2.1.4 Base Monthly Energy Consumptions ................................................. 22
3.2.2 Upcoming Power Purchase Agreement Concluded Projects and commissioning date ......................................................................................... 23
3.2.3 Vehicle Registration Numbers and Household Statistics .......................... 24
3.3 Plant Capacity Factor Determination .............................................................. 25
3.4 Scenarios of Upcoming PPA Concluded Generation Projects Commissioning 26
3.5 Scenarios of Expected Energy Consumption .................................................. 28
3.5.1 Expected Energy Consumption in Normal Scenario ................................ 29
3.5.2 Expected Energy Consumption in Growth with Categorization of Consumption Scenario ..................................................................................... 29
3.5.3 Expected Energy Consumption in Intervention with Induction Chulo Scenario ........................................................................................................... 31
3.5.4 Expected Energy Consumption in Intervention with Electric Vehicle Scenario ........................................................................................................... 32
3.5.5 Expected Energy Consumption in Combined Intervention of Induction Chulo and Electric Vehicle Scenario ................................................................ 34
3.6 Estimation of Expected Energy Generation .................................................... 34
3.7 Verification of Data ....................................................................................... 36
3.8 Surplus Deficit Ratio (S/D – Ratio) Estimation .............................................. 38
3.9 Modeling of Planned INPS after Saturation of Commisoning of Generation Projects for Load Flow Simulation ....................................................................... 39
3.9.1 Monthly Import and Export Peak Demand Calculation for Simulation..... 39
3.9.2 Modeling of Planned INPS ...................................................................... 40
3.9.2.1 Modeling of Zone - 1 ......................................................................... 41
3.9.2.2 Modeling of Zone - 2 ......................................................................... 42
3.9.2.3 Modeling of Zone - 3 ......................................................................... 42
3.9.2.4 Modeling of Zone - 4 ......................................................................... 45

viii
3.9.2.5 Modeling of Zone - 5 ......................................................................... 47
3.9.2.6 Additional Buses, Projects and Lines in Current INPS ....................... 48
3.9.3 Scenarios of Imports and Exports in Load Flow Simulation ..................... 50
CHAPTER 4: RESULTS AND DISCUSSIONS ................................................... 53
4.1 Weightage Average Monthly Plant Capacity Factor (WAMPCF) for Groups of Projects ................................................................................................................ 53
4.2 Monthly Expected Energy Generation & Verification Results ........................ 55
4.2.1 Monthly Expected Energy Generation ..................................................... 55
4.2.2 Verification Results ................................................................................. 57
4.3 Analysis Approach ......................................................................................... 57
4.4 Monthly Surplus Deficit Energy Results for Fiscal Year 077/78 ..................... 58
4.4.1 Normal Energy Consumption Scenario in Different Generation Scenarios58
4.4.2 Growth with Categorization of Consumption Scenario in Different Generation Scenarios ....................................................................................... 58
4.4.3 Intervention with Induction Chulo in Different Generation Scenarios ...... 59
4.4.4 Intervention with Electric Vehicle in Different Generation Scenarios ...... 60
4.4.5 Combined Intervention of Induction Chulo and Electric Vehicle in Different Generation Scenarios ........................................................................ 61
4.5 Monthly Surplus Deficit Energy Results for Fiscal Year 078/79 ..................... 62
4.5.1 Normal Energy Consumption Scenario in Different Generation Scenarios62
4.5.2 Growth with Categorization of Consumption Scenario in Different Generation Scenarios ....................................................................................... 62
4.5.3 Intervention with Induction Chulo in Different Generation Scenarios ...... 64
4.5.4 Intervention with Electric Vehicle in Different Generation Scenarios ...... 64
4.5.5 Combined Intervention of Induction Chulo and Electric Vehicle in Different Generation Scenarios ........................................................................ 65
4.6 Monthly Surplus Deficit Energy Results for Fiscal Year 083/84 ..................... 66
4.6.1 Normal Energy Consumption Scenario in Different Generation Scenarios66
4.6.2 Growth with Categorization of Consumption Scenario in Different Generation Scenarios ....................................................................................... 66
4.6.3 Intervention with Induction Chulo in Different Generation Scenarios ...... 67
4.6.4 Intervention with Electric Vehicle in Different Generation Scenarios ...... 68
4.6.5 Combined Intervention of Induction Chulo and Electric Vehicle in Different Generation Scenarios ........................................................................ 69
4.7 Monthly Surplus Deficit Energy Results for Fiscal Year 084/85 ..................... 70
4.7.1 Normal Energy Consumption Scenario in Different Generation Scenarios70

ix
4.7.2 Growth with Categorization of Consumption Scenario in Different Generation Scenarios ....................................................................................... 70
4.7.3 Intervention with Induction Chulo in Different Generation Scenarios ...... 71
4.7.4 Intervention with Electric Vehicle in Different Generation Scenarios ...... 72
4.7.5 Combined Intervention of Induction Chulo and Electric Vehicle in Different Generation Scenarios ........................................................................ 73
4.8 Monthly Surplus Deficit Energy Results for Fiscal Year 086/87 ..................... 74
4.8.1 Normal Energy Consumption Scenario in Different Generation Scenarios74
4.8.2 Growth with Categorization of Consumption Scenario in Different Generation Scenarios ....................................................................................... 75
4.8.3 Intervention with Induction Chulo in Different Generation Scenarios ...... 75
4.8.4 Intervention with Electric Vehicle in Different Generation Scenarios ...... 76
4.8.5 Combined Intervention of Induction Chulo and Electric Vehicle in Different Generation Scenarios ........................................................................ 76
4.9 Expected Surplus & Deficit Energy ................................................................ 77
4.10 Load Flow Simulation Results & Discussions .............................................. 79
4.10.1 Scenario – I: Maximum Export (Normal Energy Consumption – Ashoj) 79
4.10.2 Scenario – II: Maximum Import (Combined Intervention with Induction Chulo and Electric Vehicle – Falgun) ............................................................... 80
4.10.3 Scenario – III: Intermediate Import (Growth with Categorization of Consumption – Falgun) .................................................................................... 81
4.10.4 Scenario – IV: Intermediate Import (Intervention with Induction Chulo – Falgun) ............................................................................................................ 83
4.10.5 Scenario – V: Intermediate Export (Intervention with Electric Vehicle – Ashoj) .............................................................................................................. 84
4.11 Verification of Expected Energy Consumption Scenario .............................. 85
CHAPTER 5: CONCLUSIONS & RECOMMENDATIONS ............................. 86
5.1 Conclusions ............................................................................................... 86
5.1.1 Conclusions on Surplus – Deficit Energy ................................................ 86
5.1.2 Conclusions on Planned INPS for Fiscal Year 084/85 based on Load Flow Simulation Results ........................................................................................... 90
5.2 Recommendations .......................................................................................... 91
REFERENCES ...................................................................................................... 93
APPENDICES ....................................................................................................... 95

x
LIST OF TABLES
Table 2. 1 Final Electricity Demand from 2015 AD to 2040 AD in different Scenarios
.................................................................................................................................. 7
Table 2. 3 Average Growth Rates of Final Electricity Demand .................................. 7
Table 2. 4 Energy Demand Forecast – Base Case Scenario ........................................ 8
Table 2. 5 Electricity Demand and Supply, Fiscal year 2011 - Fiscal Year 2016 ...... 10
Table 2. 6 Sectoral GDP Growth Forecasts .............................................................. 11
Table 3. 1 Some NEA Operated ROR Projects with Capacity .................................. 21
Table 3.2 Some IPP Operated ROR Projects with Capacity ..................................... 22
Table 3. 3 Total Monthly Energy Consumption & Categorized Monthly Energy
Consumption of Base Fiscal Year 2075/76 (in MWh) .............................................. 22
Table 3. 4 Capacity of Projects Expected to be Commissioned in Each Months of
Coming Years (in MW) ........................................................................................... 23
Table 3.5 Yearly Vehicle Registration Number of Past Ten Years in Nepal ............. 24
Table 3. 6 Provincial Households Statictics of Nepal ............................................... 24
Table 3. 7 Capacity of Projects Expected to be Commissioned in Each Months of
Coming Years in Shift IPP Plants Scenario (in MW) ............................................... 27
Table 3. 8 Capacity of Projects Expected to be Commissioned in Each Months of
Coming Years in Shift IPP and NEA Plants Scenario (in MW) ............................... 28
Table 3. 9 Monthly Load Factor (MLF) for Fiscal Year 2075/76.............................. 39
Table 3. 10 Hydropower Projects and Buses in Zone – 1.......................................... 41
Table 3. 11 Transmission Projects in Zone – 1 ......................................................... 41
Table 3. 12 Hydropower Projects and Buses in Zone – 2.......................................... 42
Table 3. 13 Transmission Projects in Zone – 2 ......................................................... 42
Table 3.14 Hydropower Projects and Buses in Zone – 3 .......................................... 43
Table 3. 15 Transmission Projects in Zone – 3 ......................................................... 44
Table 3. 16 Hydropower Projects and Buses in Zone – 4.......................................... 45

xi
Table 3. 17 Transmission Projects in Zone – 4 ......................................................... 46
Table 3. 18 Hydropower Projects and Buses in Zone – 5.......................................... 47
Table 3. 19 Transmission Projects in Zone – 5 ......................................................... 48
Table 3. 20 Additional Hydropower Projects and Buses in new INPS ...................... 49
Table 4. 1 Expected Monthly Enegy Genrations from Installed Projects (in MWh) .. 55
Table 4. 2 Monthly Expected Energy Generations in Fiscal year 2077/78 (in MWh) 56
Table 4. 3 PVMI Values in Each Month of Year 2076 for Verification .................... 57

xii
LIST OF FIGURES
Figure 4. 1 Weightage Average Monthly Plant Capacity Factor of NEA Operated
ROR Projects ........................................................................................................... 53
Figure 4. 2 Weightage Average Monthly Plant Capacity Factor of Storage Projects . 54
Figure 4. 3 Weightage Average Monthly Plant Capacity Factor of IPP Operated ROR
Projects.................................................................................................................... 55
Figure 4. 4 Monthly Surplus – Deficit Energy in Normal Expected Energy
Consumption Scenario for Fiscal Year 077/78 ......................................................... 58
Figure 4. 5 Monthly Surplus – Deficit Energy in Growth with Categorization of
Consumption Scenario for Fiscal Year 077/78 ......................................................... 59
Figure 4. 6 Monthly Surplus – Deficit Energy in Intervention of Induction Chulo
Scenario for Fiscal Year 077/78 ............................................................................... 60
Figure 4. 7 Monthly Surplus – Deficit Energy in Intervention of Electric Vehicle
Scenario for Fiscal Year 077/78 ............................................................................... 61
Figure 4. 8 Monthly Surplus – Deficit Energy in Combined Intervention ofInduction
Chulo & Electric Vehicle Scenario for Fiscal Year 077/78 ....................................... 61
Figure 4. 9 Monthly Surplus – Deficit Energy in Normal Expected Energy
Consumption Scenario for Fiscal Year 078/79 ......................................................... 62
Figure 4. 10 Monthly Surplus – Deficit Energy in Growth with Categorization of
Consumption Scenario for Fiscal Year 078/79 ......................................................... 63
Figure 4. 11 Monthly Surplus – Deficit Energy in Intervention of Induction Chulo
Scenario for Fiscal Year 078/79 ............................................................................... 63
Figure 4. 12 Monthly Surplus – Deficit Energy in Intervention of Electric Vehicle
Scenario for Fiscal Year 078/79 ............................................................................... 64
Figure 4. 13 Monthly Surplus – Deficit Energy in Combined Intervention ofInduction
Chulo & Electric Vehicle Scenario for Fiscal Year 078/79 ....................................... 65
Figure 4. 14 Monthly Surplus – Deficit Energy in Normal Expected Energy
Consumption Scenario for Fiscal Year 083/84 ......................................................... 66

xiii
Figure 4. 15 Monthly Surplus – Deficit Energy in Growth with Categorization of
Consumption Scenario for Fiscal Year 083/84 ......................................................... 67
Figure 4. 16 Monthly Surplus – Deficit Energy in Intervention of Induction Chulo
Scenario for Fiscal Year 083/84 ............................................................................... 68
Figure 4. 17 Monthly Surplus – Deficit Energy in Intervention of Electric Vehicle
Scenario for Fiscal Year 083/84 ............................................................................... 68
Figure 4. 18 Monthly Surplus – Deficit Energy in Combined Intervention ofInduction
Chulo & Electric Vehicle Scenario for Fiscal Year 083/84 ....................................... 69
Figure 4. 19 Monthly Surplus – Deficit Energy in Normal Expected Energy
Consumption Scenario for Fiscal Year 084/85 ......................................................... 70
Figure 4. 20 Monthly Surplus – Deficit Energy in Growth with Categorization of
Consumption Scenario for Fiscal Year 084/85 ......................................................... 71
Figure 4. 21 Monthly Surplus – Deficit Energy in Intervention of Induction Chulo
Scenario for Fiscal Year 084/85 ............................................................................... 71
Figure 4. 22 Monthly Surplus – Deficit Energy in Intervention of Electric Vehicle
Scenario for Fiscal Year 084/85 ............................................................................... 72
Figure 4. 23 Monthly Surplus – Deficit Energy in Combined Intervention ofInduction
Chulo & Electric Vehicle Scenario for Fiscal Year 084/85 ....................................... 73
Figure 4. 24 Monthly Surplus – Deficit Energy in Normal Expected Energy
Consumption Scenario for Fiscal Year 086/87 ......................................................... 74
Figure 4. 25 Monthly Surplus – Deficit Energy in Growth with Categorization of
Consumption Scenario for Fiscal Year 086/87 ......................................................... 74
Figure 4. 26 Monthly Surplus – Deficit Energy in Intervention of Induction Chulo
Scenario for Fiscal Year 086/87 ............................................................................... 75
Figure 4. 27 Monthly Surplus – Deficit Energy in Intervention of Electric Vehicle
Scenario for Fiscal Year 086/87 ............................................................................... 76
Figure 4. 28 Monthly Surplus – Deficit Energy in Combined Intervention ofInduction
Chulo & Electric Vehicle Scenario for Fiscal Year 086/87 ....................................... 77

xiv
Figure 4. 29 Annual Surplus or Deficit Energy as Percentage of Annual Generation
for fiscal year 078/79, 080/81 & 084/85 ................................................................... 78

xv
LIST OF ACRONYMS AND ABBREVIATION
AEG Actual Energy Generations
AMEC Average Monthly Energy Consumption
AMIE Actual Monthly Imoprt Energy
AMPCF Average Monthly Plant Capacity Factor
CMIE Calculated Monthly Import Energy
DoED Department of Electricity Development
EMEG Expected Monthly Energy Generations
E2Ws Electric Two – Wheelers
E4Ws Electric Four – Wheelers
FY Fiscal Year
GDP Gross Domestic Product
GWh Gigawatt hours
HEVs Hybrid Electric Vehicles
INPS Integrated Nepal Power System
IPPs Independent Power Producers
KL Kilo Litres
kV Kilovolt
kWh Kilowatt hours
LDC Load Dispatch Centre
LPG Liquified Petroleum Gas
MAED Model for Analysis of Energy Demand
MEC Monthly Energy Consumption
MJ Mega Joule
MW Mega watt
MWh Megawatt hours

xvi
NEA Nepal Electricity Authority
PCF Plant Capacity Factor
PIC Plant Installed Capacity
PPA Power Purchase Agreement
PVMI Percentage Variartion in Monthly Import
RCOD Required Commercial Date of Operation
ROR Run of River
VKT Vehicle Kilometer Travel
WAMPCF Weightage Average Monthly Plant Capacity
Factor

1
CHAPTER 1: INTRODUCTION
1.1 Background
The scarcity of electric power always compelled electric utility to fulfill the basic
need; committing basic electric power to the consumers for meeting their needs. That
is the case which has been compelling our power plants to give emphasis to meet
active power at most at present scenario. Furthermore, the recent end of load shedding
is new achievement of Nepal in the power sector which is hugely supported by import
of electrical power from our neighboring country. To enhance the power system
security and reliability, government of Nepal and India has come up with idea of
working jointly in energy banking between these two power systems recently.
Nepal and India have agreed on energy banking action in principle (not realized in
practical) as soon as the production of Upper Tamakoshi Hydropower starts in
upcoming period. The general pattern of this banking is that surplus power available
in Nepal during the wet months is absorbed by the power system of India and Nepal
will retrieve the banked energy when the usual dire need of power strikes during dry
months.
Energy banking is accompanied by bidirectional flow of energy within two or more
synchronized power systems in similar manner to storage and retrieval of energy from
battery based syetem. Unlike battery based storage system, energy is not stored in
energy banking. For energy banking, two power systems must have surplus and
deficiencies of energy in differenet points of time but not simultaneously. If a power
system has surplus energy at one point of time and another system is suffering deficit
in same point, then the former system supplies surplus energy to latter. Similarly,
surplus and deficit status of two systems are interchanged at some other points of
time, and the latter system can supply back energy to the former one.
Nepal, which faced acute energy crisis till 2016 AD, has just become a almost load
shedding free for around four years. However, this is achieved not only by our
internal generation but also with import energy from India. The total import points in
INPS include eight points viz. Tanakpur, Birgunj, Muzzafurpur, Kataiya, Jaleshower,
Bisanpur, Ramnagar and Nepalgunj at present. Nepal is expected to have surplus

2
energy during wet months after the completion of Upper Tamakoshi Hydropower
Project with installed capacity of 456 MW. But the deficit of energy in dry months is
expected to continue even after the commissioning commissioning of Upper
Tamakoshi hydroelectric project. Regarding the generation strategy, the recently
published White Paper by Ministry of Energy, Water Resources and Irrigation has
planned 10000 MW as tenth year planning from now onward including generations
from Nepal Government, Nepal Electricity Authority and its subsidiary companies as
well as private companies (MoEN, 2018). Similarly, WECS the Government of Nepal
has also forecasted the load demand from 2015 AD to 2040 AD (MoE, 2017) as well.
However, commsioning all the generation projects in exact time in accordance with
Power Purchase Agreement (PPA) has always been biggest challenege in Nepal and
are accompanied with delays in commissioning due to different factors.
The general daily peak demand met pattern and daily energy consumption pattern of
all India have been found to increase from May (Baisakh of BS Calendar) to October
(Ashoj of BS Calendar) and then decrease from October (Kartik of BS Calendar) to
April (Chaitra of BS Calndar). Similarly, the daily peak demand met pattern and
energy consumption pattern of Uttar Pradesh and Bihar (i.e. Northern Region of
India) states follow increase from April to October and from there onwards it goes on
decreasing (Power System Operation Corporation Limited, 2016). This seasonal
variation in demand and energy of nearest Indian region to Southern Nepal shows
these regions experience high demand of energy in the period from around Baisakh to
Ashoj in which seasonal impact causes maximum generations from hydropower
projects in Nepal and INPS is expected to have surplus energy at this period. This
show there is opportunity of supplying energy in this period from Nepal to Uttar
Pradesh and Bihar at least and takes back the supplied energy during energy scarcity
period.
In this thesis, an attempt has been made to study the scenario analysis of monthly
surplus – deficit energy for projected ten years period with the consideration of
different scenarios in both the generation and consumption aspects. Three scenarios
viz. commissioning of upcoming projects in accordance to Power Purchase
Agreement (PPA) concluded date, with one year delay for projects coming under
Independent Power Producers (IPPs) & additional three years delay in projects

3
coming under Nepal Electricity Authority (NEA) and its sister organization are
considered in generation aspects. The energy sector is advancing towards replacing
the petroleum and coal based consumption by electrical energy based consumption in
recent years. So, to study opportunities of increasing internal electrical based
consumption and its influence on energy banking as well, the consumption sector is
introduced with additional scenarios of intervention with Induction Chulo,
intervention with Electric Vehicle and combined intervention of Induction Chulo and
Electric Vehicle to normal consumption growth observed in rectent years in Nepal
resulting into five scenarios in consumption aspects.
Furthermore, INPS has been modeled for third scenario of generation i.e. for
consideration of one year delay for projects coming under Independent Power
Producers (IPPs) & additional three years delay in projects coming under Nepal
Electricity Authority (NEA) and its sister organizations and five scenarios of energy
consumption are studied to predict the status of INPS for fiscal year 084/85 as well.
1.2 Problem Statement
The factors such as delays in completion of transmission projects and substations,
improper work planning while construction, lengthy paperwork procedures in
government offices and political interference in construction site are major causes
which are responsible for delay in completion of generation projects in accordance to
PPA concluded date in Nepal. The general delay encountered are; one year delay in
projects going to be constructed by IPPs and three year delay in project goint go be
constructed by NEA and its sister organizations. This delay has major impact
resulting into significant deviation from normal generation planning and import
export energy planning.
The seasonal variation in demand and energy of nearest Indian regions (Uttar Pradesh
& Bihar) to Nepal experience high demand of energy from Baisakh to Ashoj and
INPS is expected to have surplus energy at this period and remaining period of year
generally demands import from India. This show there is opportunity of Energy
Banking (supplying energy in this period from Nepal to Northern Grid of India at
least during this surplus energy period and taking back the supplied energy during
energy scarcity period in Nepal) between Nepal & India.

4
The large dependency on imported petroleum based fuel consumption for country like
us; country with technically and economically feasible hydropower potential of
around 56,278 MW on Q40 basis (Kandel, 2018), necessiates proper study for
possibility of increasing internal electrical energy consumption as well as we are
expecting surplus energy in near future.
INPS is expecting surplus energy in wet months and deficit energy in dry months in
near future. However, the lack of projection of monthly surplus – deficit energy in
future planning with possible delays in upcoming projects, as both government and
NEA present the yearly planning, is resulting into no idea about monthly quantitative
energy for energy banking strategy as well till date. Similarly, the planning for INPS
for future period to acoomodate all the genartions and expected consumption should
be studied in advance to tackle any abnormalities in future INPS. This necessitates a
through analysis of energy banking scenarios.
1.3 Objective and Scope
The main objective of this thesis work is to analyze the prospective scenarios of
energy banking between Nepal and India from Nepalese perspective and to predict the
status of INPS after saturation of generation projects in future with consideration of
opportunities for increasing internal electrical based consumption within Nepal as
well. In order to achieve the main objective, the following sub – objectives are set;
1) To determine monthly expected energy generations for projected ten years with
consideration of three scenarios in generation aspects; commissioning of
upcoming projects in accordance to Power Purchase Agreement (PPA) concluded
date, with one year delay for projects coming under Independent Power Producers
(IPPs) & additional three years delay in projects coming under Nepal Electricity
Authority (NEA) and its sister organizations.
2) To determine monthly expected energyconsumptions for projected ten years with
consideration of five scenarios in consumption aspects; Normal (eight percent per
annum growth in consumption), Growth with Categorization of Consumption,
Intervention with Induction Chulo, Intervention with Electric Vehicle and
Combined Intervention of Induction Chulo and Electric Vehicle

5
3) To verify the analysis through calculated import and actual import energy for year
2076 BS
4) To recommend monthly surplus – deficit energy for projected ten fiscal years for
each combination of scenarios generation and consumption aspects
5) To model planned INPS for most likely generation scenario and perform load flow
simulation with aim to study status of INPS just after saturation of generation
1.4 Outline of Thesis
This thesis has been organized into five chapters:
Chapter 1 gives brief introduction of energy banking, necessity of monthly surplus –
deficit energy analysis for projected ten years and objective of this thesis.
Chapter 2 gives the overview of literature review of energy banking strategy between
Nepal and India, generations planning and load demand forecast.
Chapter 3 gives the methodology used in this thesis. It also includes all the scenarios
of generation aspects, consumption apsects and verification process with necessary
formulation and calculations. This also includes modeling of planned INPS and
simulation of thus modeled INPS to study the status of INPS just after saturation of
new generation projects.
Chapter 4 describes expected monthly surplus – deficit energy results for projected
ten years period for each combination of generation and consumption scenario with
necessary discussions. This also describes the import and export possibilities through
INPS for energy banking, bus voltage results, line loading and transformer loading
results of INPS for fiscal year 084/85 for five considered scenarios.
Chapter 5 summarizes the thesis and proposes recommendations for further research.

6
CHAPTER 2: LITERATURE REVIEW
2.1 Recent Trends of Energy Exchange between Nepal & India
The yearly energy consumption of Nepal till date is balanced by generations from
hydropower projects developed by NEA and its sister organizations, hydropower
projects developed by IPPs and import energy from India. The balancing has been
used through two approaches viz. capacity balance and energy balance. The lowest
capacity balance through import from India in fiscal year 2075/76 was observed in the
month of Kartik which was about 374.77 MW. Similarly, the highest capacity balance
through import from India in fiscal year 2075/76 was observed in the month of Poush
which was about 653.47 MW. The energy balance in INPS was achieved through
import of 2813.07 GWh in fiscal year 2075/76. The highest and lowest monthly
imports were observed in the months of Kartik and Poush and the corresponding
imported energy recorded were found to be 87.05 GWh and 326.58 GWh
respectively. The total energy imported from India to balance our energy requirement
in last three years (i.e. 2016, 2017 and 2018 AD) were recored as 1777.68 GWh,
2175.04 GWh and 2581.8 GWh respectively. Similarly, there were some exports of
energy as well in fiscal year 2075/76 through four exports point viz. Kataiya I,
Kataiya II, Ramnagar and Raxaul. The total exports of around 42.5 GWh energy was
achieved in fiscal year 2075/75. The major exports of energy were achieved in the
seven months period from Baisakh to Kartik. (Nepal Electricity Authority, 2019).
2.2 Energy Consumption Growth Study
2.2.1 Demand Forecast Study by Water and Energy Commission Secretariat
Water and Energy Commission Secretariat (WECS) is mandated to carry out various
energy related studies including demand forecast. WECS had forecasted the total
installed capacity as well as energy requirement from 2015 AD to 2040 AD in Nepal.
In this forecast, three main scenarios; Business as usual (4.5% GDP growth rate),
reference (7.2% GDP growth rate), and high growth (9.2% GDP growth rate) are
considered along with two more scenarios with consideration of growth with policy
intervention as well. Policy intervention is characterized by following assumptions:
75% of water heating with electricity in urban household will be done by 2020
AD
100% of cooking with electricity in urban household will be done by 2020 AD

7
At least 7% of cooking with electricity will be done in rural area AD
18% of total passenger kilometers will be fulfilled by electric car and 7% by
electric metro in city by 2025 AD
The energy demand forecast is studied MAED model with scenarios of possible
development. The final electricity demand from this study is presented in Table 2. 1.
Table 2. 1 Final Electricity Demand from 2015 AD to 2040 AD in different Scenarios
Year (AD) Final Electricity Demand (GWh)
BAU Reference Scenario
High Scenario
Policy Intervention
@ 7.2%
Policy Intervention
@ 9.2%
2015 3866.36 3866.36 3866.36 3866.36 3866.36 2020 7600.75 8110.66 8522.97 14870.92 15304.29 2025 12998.25 14863.67 16545.84 22431.68 24265.05 2030 20073.83 24956.79 29864.09 35334.66 41264.82 2035 29744.69 40709.77 52983.16 51771.84 65657.50 2040 43016.68 66096.60 94851.97 81958.97 115294.44
Source: (MoE, 2017)
The growth rate of final electricity demand for different scenarios is concluded from
this study which is presented in Table 2. 2. (MoE, 2017)
Table 2. 2 Average Growth Rates of Final Electricity Demand
Year (AD) Growth Rate of Final Electricity Demand (% p.a.)
BAU Reference Scenario
High Scenario
Policy Intervention
@ 7.2%
Policy Intervention
@ 9.2%
2015 - - - - - 2020 14.50 15.10 17.13 30.92 31.67 2025 11.30 12.19 14.19 8.57 9.66 2030 9.10 10.25 12.54 9.51 11.20 2035 8.20 9.64 12.15 7.94 9.73 2040 7.70 9.50 12.35 9.62 11.92
Source: (MoE, 2017)

8
2.2.2 Energy Demand Projection Study by Investment Board of Nepal
The National Planning Commission and Investment Board of Nepal have jointly
conducted this energy demand projection and predicted energy requirements of Nepal
in the year 2030 AD. This study takes into account the evolution of the social needs of
population, such as the demand for transportation, lighting and air conditioning. This
model encompasses all form of energy rather than solely electricity requirements.
However, this study does not take into account the willingness and ability to pay for
energy/electricity. The base case assumptions considered in this study are (Investment
Board of Nepal, 2014):
2014 AD is base year.
Population growth is 1.35% p.a.
The urban population is 40% of total population in 2014 AD and will reach to
49% of toal population in 2013 AD.
The GDP of Nepal is 5%.
By 2030 AD, agriculture and irrigation will be powered by electricity
exclusively and fossil fuel & transportation partially.
Electricity will be 52% of total cooking energy for urban households in 2030
AD.
Electricity will be 45% of total household cooking energy in rural household.
This study has used MAED policy tool which is useful in forecasting a country’s total
energy (and electricity) demand given its economic, social and technological
evolution pattern incorporating energy mix aspects. The final electricity demand for
different scenarios is concluded from this study which is presented in Table 2. 3.
Table 2. 3 Energy Demand Forecast – Base Case Scenario
Year (AD) Energy Demand (GWyr)
2014 0.707 2020 1.493 2025 2.462 2030 3.817
Source: (Investment Board of Nepal, 2014)
While analyzing the percentage growth in forecasted electricity demand in constant
annual rise basis, there is 13.26% growth p.a. from year 2014 AD to 2020 AD,

9
10.52% growth p.a. from year 2020 AD to 2025 AD and 9.16% growth p.a. from
2025 AD to 2030 AD.
2.2.3 Load Forecast study by Nepal Electricity Authority
This study is conducted by System Planning Department, Nepal Electricity Authority
in July, 2015 and is based on Load Forecast Report, 1997 by the Norconsult under
ADB’S programme. This study covers Nepal’s internal load growth from the period
of fiscal year 2014/15 to fiscal year 2033/34. The assumptions for this study are:
The per capita GDP is projected to grow at an average rate of 1.98% on fiscal
year 2014/15, 4.59% from fiscal year 2015/16 to 2017/18, 5.08% from fiscal
year 2018/19 to 2022/23, 5.57% from fiscal year 2023/24 to 2027/28 and
6.07% from fiscal year 2028/29 to 2033/34.
The new consumers of NEA are assumed to grow by 4% annually from fiscal
year 2014/15 to 2020/21 to meet 80% electrification ratio in fiscal year
2020/21. It is assumed to reduce by 44, 100 annually from fiscal year 2021/22
to 2027/28 to meet electrification ratio of 90% in fiscal year 2027/28.
Similarly, new consumer growth rate is assumed to increase in such a way
from fiscal year 2027/28 to 2033/34 so as to keep an Electrification ratio of
90% in the subsequent years.
The remaining 10% of the population will use alternative sources as source of
electricity.
The annual consumption figure for new consumers is taken as 368 kWh in the
base case on fiscal year 2014/15.
The inflation of 7% has been taken for the whole planning period and the real
price increase is taken as 0% meaning there by tariff is increased such as to
balance the inflation.
Tariff increment is considered as 15% in fiscal year 2015/16 and 20% in
2022/23 and 2032/33 in Domestic, Industrial, Commercial and Other
consumers.
Based on those assumptions, this study concludes that the total energy
requirement in Nepal is projected to grow by an average of 8.1 % p.a. over the
forecated period, from 5988.98 GWh in fiscal year 2013/14 to 28, 329.85 GWh in
fiscal year 2033/34 including export to india as well. Similarly, the peak demand

10
is projected to grow from 1201 MW in fiscal year 2013/14 to 5785.3 MW in
2033/34 (Nepal Electricity Authority, 2015).
2.2.4 Energy Forecast Study by Asian Development Bank
This study presents the past trends of energy consumption and peak demand from
year 2011 AD to 2016 AD and annual growth rate of respective parameters which is
presented in Table 2. 4.
Table 2. 4 Electricity Demand and Supply, Fiscal year 2011 - Fiscal Year 2016
Item Year 2011 AD
Year 2012 AD
Year 2013 AD
Year 2014 AD
Year 2015 AD
Year 2016 AD
Annual Growth
Rate (%)
Installed Capacity (MW)
706 719 762 787 787 856 3.9
Peak Demand (MW) 946 1027 1095 1201 1292 1385 7.9 Supply Cpacity Shortage (MW)
240 308 333 414 505 529 17.1
Electricity Requirement (GWh)
4833 5195 5446 5910 6335 6920 7.4
Source: (Asian Development Bank, 2017)
This study concludes the respective final energy demand by both the source and
sector as well from year 2015 AD to 2035 AD. The average annual growth rate for
final energy demand by industrial and transport sectors in Nepal for the period under
consideration are 4% and 3.5% respectively. Similarly, the average annual growth rate
of final energy demand by Coal, Oil and Electricity from 2015 AD to 2035 AD is
3.5%, 3% and 5.4% respectively (Asian Development Bank, 2017).
2.2.5 Power Demand Forecast Study by Government of Nepal & Japan
International Cooperation Agency (JICA)
The Government of Nepal and JICA had jointly prepared a master plan for storage –
type hydroelectric development for domestic demand in Nepal. The power
development plan is optimized based on the power demand forecast of the sectoral
GDP growth rates, forecasted price increase of electricity and so on. This study had
forecasted 20 – year evolution of power demand using dynamic model employing
principles of economic theories. This model was then employed to determine 1997
forecasts by Asian Development Bank and 2008 forecasts by NEA and thus these

11
model implements comparisons with other demand forecasts as well. This model
considers economic, policy and technical factors of power market like the future path
of the economic development in Nepal, the pricing scenarios developed to ease
market distortion in order to attract private sector investment, a modality to handle the
lost electricity demand because of intensive power shedding, the way to handle
assumed damage caused by load shedding to the industry and service sectors etc. The
forecasted sectoral GDP growth rates for power demand forecasting from this model
are presented in Table 2. 5.
Table 2. 5 Sectoral GDP Growth Forecasts
Fiscal Year Sector – wise GDP Growth (%)
Domestic Industry Commerce Other
2019/20 4.00 5.20 6.00 5.50 2020/21 4.10 5.20 6.00 5.50 2021/22 4.20 5.30 6.00 6.00 2022/23 4.30 5.50 6.50 6.00 2023/24 4.40 6.00 6.50 6.00 2024/25 4.50 6.00 6.50 6.00 2025/26 4.50 6.00 6.50 6.00 2026/27 4.50 6.00 6.50 6.00 2027/28 4.50 6.50 6.50 6.00 2028/29 4.50 6.50 7.00 6.00 2029/30 4.50 6.50 7.00 6.00
Source: (Japan International Corporation Agency, 2014)
2.2.6 Capacity and Enrgy Growth Rate Adopted in Load Dispatch Center, NEA
for Analayis Purpose
The current INPS of Nepal has one dispatch center named as Load Dispatch Center
(LDC), NEA located at Suichatar, Kathmandu. During visit to LDC, it was found that
for the fiscal year 2078/79, 2079/80 and 2080/81, the forecast analysis is performed in
two aspects viz. Capacity Growth and Energy Growth but with different scenarios.
The capacity growth is analyzed in two scenarios viz. Genaration available from NEA
and IPP both will be 100% and 90% respectively. For the former scenario, the
analysis was performed with capacity growth rate of 6% and 8% p.a. Similarly, the
capacity growth rate for the latter scenario is taken as 8% p.a. and analysis is carried

12
out. The energy growth is analyzed in three scenarios viz. 10% growth p.a. when
generations available from both NEA and IPP will be 100%, 8% growth p.a. when
generations available from NEA will be 100% and generations available from IPP
will be 90% and 8% growth p.a. when generations available from both the NEA and
IPP will be 90%. However for the recent year i.e. from fiscal year 2017/18 to
2018/19, the energy consumption growth rate has been found as 13.89% (Nepal
Electricity Authority, 2019).
2.2.7 Brief Introduction to Indian Power System and Its Demand Projection
India ranks fourth in the world in terms of power generation capacity with a total
installed base of 274,818 MW (as on Jun’15). This is a significant increase from
120,514 MW at the end of FY05. Expansion in generation capacity has been led by
the thermal sector which recorded a growth of ~110 GW from FY05 to FY15. Coal
dominates the current capacity mix and accounts for 60.84% of installed capacity.
Analysis shows that India will continue to be a net exporter of power. Being primarily
a coal based economy, Coal will continue to account for nearly 72% of the total
electricity requirement. At the same time the importance of renewable energy is
growing with generation accounting for nearly 14% of generation by 2034.
In the near-term (2015 to 2020): India going from being a net importer in 2015 to
becoming a net exporter in 2016 and 2017 and again becoming net importer again in
2018 to 2020. In medium- to long-term (2021 to 2034), as system becomes
unconstrained (not limited by transmission constraints), India becomes a net exporter.
Study shows the peak shortages (MW) had been reduced from 15,747 MW to 6285
MW in four years from FY10. The demand projection of this study from 2019 AD to
2034 AD in subsequent five years is 231.97 GW, 329.986 GW, 468.13 GW and
662.882 GW respectively. In addition, the Indian Government has increased the solar
capacity target by five folds from 20,000 MW to 100,000 MW by 2022. This capacity
is expected to double to 200 GW by 2034. (SARI/EI Task Force-2, 2016)

13
2.3 Vehicle Kilometer Run & Electric Vehicle Energy Consumption Study
2.3.1 Road Trasportation Energy Demand and Environmental Emission: A Case
of Kathmandu Valley
Dr. Bajracharya and Dr. Bhattarai have presented the growth trend in the evolution of
different vehicle types, their energy demand and associated environmental emissions
in the Kathmandu valley in coming fifteen years with study period ranging form 2016
AD to 2030 AD and also shown the various possible mitigation scenarios to manage
growth of vehicles, reduce energy demand and environmental emissions. The
modeling tools, LEAPS (Long – range Energy Alternative Planning System) ahs been
used to develop a bottom – up road transportation model based on four parameters
viz. present and future vehicle stock, vehicle – use intensity expressed in kilometers
travelled by a vehicle per year (VKT), vehicle fuel – use intensity and emission
factors.
Table 2. 5 Average Annual Vehicle Kilometer Travel (VKT) in Kathmandu Valley
Vehicle Type Average Annual Vehicle Kilometer Travel (VKT) in Kathmandu Valley
Bus 44105 Minibus 43307
Private (Car/Jeep/Vans) 12310 Public (Taxi) 25356
Microbus 38520 Motorbike 8952
Heavy Duty Vehicles 37800 Mini truck 37415
Source: (Bajracharya & Bhattarai, 2016)
The result has shown that there will be large growth of small vehicles like motorbikes
and light duty vehicles in Kathmandu Valley in coming fifteen years and small
vehicle will consume 65% of the cumulative fuel demand in valley and produce 58%
of total CO2, 84% of total CO, 92% of total HC, 32% of total NOx and 65% of total
PM10 emissions within analysis period (Bajracharya & Bhattarai, 2016). This study
has also presented the average annual vehicle kilometer travel in Kathmandu valley
which is presented in Table 2. 5.

14
2.3.2 Energy Cosumption Study of Different Electric Vehicles
Sharmad Zaman Rajper and Johan Albrecht have presented the prospects of electric
four – wheelers (E4Ws), electric two – wheelers (E2Ws) and hybrid electric vehicles
(HEVs) in developing countries. In this paper, different types of driving forces and
their influences for the electric vehicles (EVs) are analyzed. The authors have studied
reduction in greenhouse gases emissions, energy savings, extra cost of infrastructure,
low operational cost, affordable purchase price of E2Ws, mode shift from public
transportation to E2Ws and congestion cost as driving forces for EVs. Similarly,high
cost of infrastructure for implementation of E4Ws, high purchase cost of E4Ws and
HEVs, lack of government policies, lack of awareness, presence of strong market for
gasoline – based vehicles, range anxiety, long charging time, harmful emissions,
increase in demand for power generation, low speed of E2Ws, resale issue,
consideration of E2Ws on the lack of road safety, lack of E2Ws’ capacity to carry
more people and weight are studied under resisting forces for EVs in developing
countries (Sarmad & Albrecht, 2020). A comparative analysis among different
electric mobility modes have been carried out whose result are presented in Table 2.6.
Table 2.6 Comaparative Analysis Among Different Electric Mobility Modes
Mode Tank – to – Wheel Energy Use
(kWh per km)
E – Bicycle 0.015 ± 0.005 Midsize E2Ws or electric scooters 0.045 ± 0.02
Midsize gasoline – powered two wheelers 0.25 ± 0.09 Large E2W or electric motorcycles 0.07 ± 0.03
Large gasoline – powered two wheelers 0.41 ± 0.13 E4Ws 0.15 ± 0.04 HEVs 0.4 ± 0.1
Source: (Sarmad & Albrecht, 2020)
The efficiency of electric motorcycle based on this paper is 0.07 ± 0.03 kWh per km.
The efficiency for RV400 electric motorcycle in India is 0.083 kWh per km and as
that of RV300 electric motorcycle is 0.045 kWh per km (Revolt Motors, 2019).
The efficiency of electric four wheeler vehicles based on this paper is 0.15 ± 0.04
kWh per km. For four wheelers car/jeep/van, the efficiency is different for different
models. The most used vehicles observed in Nepalses scenarios are of Hyundai, Ford,
Mahindra, Volkswagen and Suzuki. In Hyundai model, the Hyundai Kona Electric 64
kWh offers efficiency of 0.16 kWh per km, Hyundai Kona Electric 39 kWh offers

15
efficiency of 0.154 kWh per km and Hyundai IONIQ Electric offers efficiency of
0.153 kWh per km. Similarly, in Ford model, Mustang Mach variants offer efficiency
varying between 0.194 kWh per km to 0.209 kWh per km. In Volkswagen model, this
offered efficiency from company varies between 0.166 kWh per km to 0.183 kWh per
km (Electric Vehicle Database, 2020). One of the mostly observed electric four
wheelers hatchbacks in Nepalese city is Mahindra e2O plus offers efficiency of around
0.1 kWh per km (Mahindra Electric, 2020).
Global Green Growth Institute, Seoul, Republic of Korea has performed pre –
fesibility study on Deploying Electric Buses in the Kathmandu Valley to support
Sajha Yatayat’s desire to transition to electric buses.This study has considered Sajha
Yatayat’s fleet and operations to predict the electric bus feasibility in Kathmandu
Valley. This study has assumed life of electric bus as 8 – 12 years, days of operation
per year as 345 days, efficiency of electric vehicle as 1.12 kWh per km,daily distance
travelled as 126.3 km resulting into annual distance of 43, 574 km etc. This study has
proposed both the route for electric bus and vehicle options as well. The Lagankhel –
Budhanilkantha route has been concluded as effective route for electric bus transition
of Sajha Yatayat. (Global Green Growth Institute, 2018)
MARCON performed a feasibility study regarding implementation of battery electric
buses (e – buses) service in Edmonton, Canada (MARCON, 2016). It has used field
trials, expected realities of e – buses in service, costs and benefits associated with the
choice to invest in e – buses and environmental impact of e – buses as major analysis
aspects in this study. The efficiency of different electric buses as result of this study
are represented in Table 2. 7.
Table 2. 7 Efficiency of Some Electric Buses
Bus Model Efficiency (kWh per km) Estimated Range (km)
BYD 40’ 1.26 205 BYD 40’ 1.2 – 1.5 240 BYD 40’ 1.3 220
New Flyer 40’ 1.08 – 1.30 110 – 148 New Flyer 40’ 1.45 100 New Flyer 40’ 1.83 140
Proterra 35’ 1.08 – 1.34
Sourec: (MARCON, 2016)

16
2.4 Energy Banking Strategy between Nepal - India Cooperation in Power Sector
The formation of Joint Working Group (JWG) between Nepal and India has been
currently working on energy banking between these two countries and came through
some conclusions till date. The interconnections between two countries required as
proposed by these two parties are (MoEWRI, 2019):
1. For Year 2021/22
Muzzaffarpur - Dhalkebar 400 kV Double Circuit (Twin Moose) line
(Presently operated at 220 kV) & New Butwal - Gorakhpur (New) 400 kV
Double Circuit (Quad Moose) line
2. For Year 2025 AD
Muzzaffarpur - Dhalkebar 400 kV second Double Circuit (Quad Moose) line
associated with Arun - III (900 MW) Hydroelectric Project
Lumki - Bareilly 400 kV Double Circuit (Quad Moose) line associated with
upper Karnali (900 MW) Hydroelectric Project
New Duhabi - New Purnea 400 kV Double Circuit (Quad Moose) line
associated with Upper Arun (800 MW) Hydroelectric Project
3. Some of the lines with 132 kV that are to be planned are:
Stringing of second circuit of Kataiya - Kusaha 132 kV Single Circuit on
Double Circuit line
Construction of Nanpara (UP, India) - Kohalpur (Nepal) 132 kV Double
Circuit line, Construction of New Nautanwa (UP, India) - Mainhiya (Nepal)
132 kV line & Raxaul (Old) - Raxaul (New) 132 kV Double Circuit Line
The agreed planned installed capacity and peak demand of Nepal as assessed based on
the information provided by Nepal Electricity Authority in different time frames are
presented in Table 2. 8 .
Table 2. 8 Planned Installed Capacity and Peak Demand agreed in Minute
Present 2021-22 2025
Installed Capacity(MW) 1080 3112 10942 Peak Demand(MW) 1300 2415 2981
Source: (MoEWRI, 2019)

17
CHAPTER 3: METHODOLOGY
3.1 Methodology Approach
The overall algorithm that has been followed for completion of thesis is listed as
follows:
1. Identification of problems in completion of generation schedule of upcoming
projects and identification of different possibilities of scenarios of energy
consumption to determine the idea of energy banking from Nepalese
perspective and Literature Review
2. Data Collection
(i) Collection of data of monthly energy generation of hydropower plants
owned and operated by NEA and IPP & monthly energy consumption
of Nepal of past years from LDC
(ii) Collection of data of Power Purchase Agreement concluded projects
between NEA and IPPs from Power Trade Department, System
Planning Office of NEA and Department of Electricity Development
(iii) Collection of data of vehicle registration numbers of past years from
Department of Transport Management & household statistics from
population census
3. Performing the mathematical analysis in MS Excel to calculate the monthly
capacity factor of individual hydropower projects and assigning monthly
group capacity factor for upcoming IPP projects and NEA projects
4. Performing the calculations of expected energy generation in Nepal for
coming ten years and expected energy consumption for different scenarios
5. Verification of Actual import energy with Calculated import energy of last
year (2076 B.S.) to check reliability of the data
6. Performing the expected surplus/deficit energy analysis for coming ten years
with consideration of delays in completion schedule of generating projects in
generation side and different load growth possibilities in consumption side
7. Modeling and Simulating the Planned INPS after saturation of commissioning
of generation projects (for FY 084/85) in most likely “Shift IPP and NEA
Plants” generation scenario for maximum import, maximum export and
intermediate imports and exports in different energy consumption scenarios
8. Conclusion and Recommendation

18
The methodological approaches that have been adopted in this thesis are shown in
Figure 3. 1.
Figure 3. 1 Flowchart Illustrating Algorithm of Methodology of Thesis
Identification of Problems & Literature Review
Data Collection
Collection of Monthly Energy Generation and
Consumption Data
Collection of data of Power Purchase
Agreement concluded Projects
Collection of data of Vehicle Registration
Numbers & Household Statistics
Calculation of Average Monthly Plant Capacity of
Major Hydropower Projects and Average Group Plant
Capacity Factor for NEA and IPP owned Projects
Calculations of Expected Energy Generation and
Expected Energy Consumption in Nepal for
projected ten years for Different Scenarios
Verification of Data to Check Reliability of Data
Estimation of Expected Surplus/Deficit Energy for
Projected Ten Years in Different Scenarios
Conclusions & Recommendations
Documentation
&
Report Preparation
Modeling and Simulating Planned INPS

19
In brief, the historical trend for monthly energy generations from major existing Run
of River (RoR) & storage type hydropower projects of NEA and IPPs for fiscal years
in between 066/67 to 075/76 have been studied. The monthly energy generations of
upcoming projects are then calculated. Following three scenarios for the upcoming
generations have been considered in the study;
i. Normal: commissioning of upcoming projects in accordance to Power
Purchase Agreement (PPA) concluded date
ii. Likely: commissioning of upcoming projects with one-year delay for projects
coming under Independent Power Producers (IPPs)
iii. Most likely: additional three years’ delay in projects coming under Nepal
Electricity Authority (NEA) and its sister organization in addition to second
scenario
The expected monthly domestic energy consumption is estimated for following five
scenarios;
i. Normal scenario: Constant per annum energy consumption growth
ii. Most likely energy consumption: categorized growth for domestic,
commercial, industrial and other categories as per the NEA past consumption
trend
iii. Intervention with induction Chulo
iv. Intervention of Electric Vehicle
v. Combined intervention of both Induction Chulo & Electric Vehicle
The mismatch between expected generation and consumption are expressed in terms
of expected monthly surplus and deficit energy and S-D ratio. Furthermore, the
adequacies of INPS and associated cross border transmission lines have been
examined. INPS has been modelled for simulation for this purpose in the fiscal year
084/85 for most likely generation scenario.
3.2 Data Collection
The data regarding monthly energy generation for about past ten years are and
monthly energy consumption of past three years are collected from LDC, NEA. The
data regarding upcoming Power Purchase Agreement (PPA) concluded projects are

20
collected through NEA annual reports and database of Department of Electricity
Development (DoED) from which the month wise upcoming projects schedules are
finalized and some revised date of PPA concluded projects are collected through the
information from System Planning Department, NEA. The possible integration of
Induction Chulo and Electric Vehicle requires household statistics and vehicle sales
per year. These data are collected through the latest statistics of district level
population and vehicle registration number from the respective government
departments.
3.2.1 Monthly Energy Generation and Monthly Energy Consumption Data
The data of monthly energy (MWh) generation for almost all major operating projects
for about past 10 years are collected through LDC, NEA. There are two stakeholders
in the generation sector viz. NEA and IPPs in Nepal at present. Similarly, broadly
speaking, almost all projects of Nepal are of ROR type except Kulekhani (I) and
Kulekhani (II); which are storage projects. Thus collected data are categorized into
three types viz. NEA operated ROR hydropower projects, Storage hydropower
projects and Independent Power Producers (IPPs) operated Run of River (ROR)
hydropower projects so that the monthly group plant factor can be calculated to assign
to these categories and those respective values can be assigned to the future upcoming
projects to assess their monthly expected energy generation. The monthly energy
consumption data are collected to observe the trends of energy consumption in past
years.
3.2.1.1 Monthly Energy Generations of NEA operated ROR hydropower projects
There is all total of around 450.05 MW capacity of NEA operated projects which is
observed in real time simulation of LDC, NEA of which ten projects with capacity
398.05 MW had been recorded with their past generations data as these projects have
significant capacity in comparison to other remaining projects of around 52 MW.
These some major NEA operated ROR hydropower projects and their respective
capacity resulting into total capacity of 398.05 MW are presented in
Table 3. 1. The monthly energy generations of these projects in months of past fiscal
years and respective generations in megawatt hours (MWh) obtained from LDC, NEA
are presented in Appendix – A.

21
Table 3. 1 Some NEA Operated ROR Projects with Capacity
Project Name Capacity (in MW)
Kaligandaki – A Hydropower Project 144 Middle Marsyangdi Hydropower Project 70
Marsyangdi Hydropower Project 69 Trishuli Hydropower Project 24 Gandak Hydropower Project 15 Modi Hydropower Project 14.8
Devighat Hydropower Project 15 Sunkoshi Hydropower Project 10.05
Puwa Khola Hydropower Project 6.2 Chameliya Hydropower Project 30
3.2.1.2 Monthly Energy Generations of Storage hydropower projects
There are two Storage hydropower projects viz. Kulekhani (I) with 60 MW capacity
and Kulekhani (II) with 32 MW capacity operating in Makwanpur district of Bagmati
province, Nepal from past years resulting into total capacity of 92 MW for storage
hydropower projects. These are only two storage projects with past data of
generations as these projects were commissioned in 1982 AD and 1986 AD
respectively. The monthly energy generations of these projects in months of past
fiscal years and respective generations in megawatt hours (MWh) obtained from
LDC, NEA are presented in Appendix – B.
3.2.1.3 Monthly Energy Generations of IPP operated ROR hydropower projects
There is about 625 MW capacity contributions from IPP side in INPS simulated in
LDC, NEA at present of which fourteen major IPP operated ROR projects and their
respective capacities resulting into total capacity of 276.91 MW are presented in
Table 3.2. The monthly energy generations of these fourteen hydropower projects in
months of past fiscal years and respective generations in megawatt hours (MWh) are
obtained from LDC, NEA are presented in Appendix – C. The remaining IPP
operated ROR projects are classified into three types viz. less than 5 MW capacity, 5
MW to 10 MW capacity and Other IPP projects for bulk calculation of energy
generations. There is total contribution of around 109. 947 MW from projects with
capacity less than 5 MW, 111.68 MW from projects with capacity between 5 MW to
10 MW and 126.463 MW from other IPP operated projects till date. (Nepal Electricity
Authority, 2019).

22
Table 3.2 Some IPP Operated ROR Projects with Capacity
Project Name Capacity (in MW)
Khimti Hydropower Project 60 Chilime Hydropower Project 22.1
Indrawati Hydropower Project 7.5 Jhimruk Hydropower Project 12
Aandhikhola Hydropower Project 9.4 Lower Modi Hydropower Project 10 Bijaypur (I) Hydropower Project 4.41 Sanima Mai Hydropower Project 22
Sipring Khola Hydropower Project 10 Mai Khola Hydropower Project 4.5
Khudi Hydropower Project 4 Bhotekoshi Hydropower Project 36
Upper Marsyangdi A Hydropower Project 50 Upper Madi Hydropower Project 25
3.2.1.4 Base Monthly Energy Consumptions
The monthly base energy consumption is taken as that of fiscal year 2075/76 and are
calculated from daily reports collected through LDC, NEA for exact consumption.
The 42% of the total energy consumption was contributed by domestic consumers,
7.3% by commercial consumers, 38.2% by industrial consumers and remaining 12.5%
by other category (Nepal Electricity Authority, 2019). Depending upon these two
data, the monthly base energy consumption and categorized base monthly energy
consumption are presented in Table 3. 3.
Table 3. 3 Total Monthly Energy Consumption & Categorized Monthly Energy
Consumption of Base Fiscal Year 2075/76 (in MWh)
Consumption/Month
Total Consumption
Domestic Consumption
Commercial Consumption
Industrial Consumption
Other Consumption
Shrawan 700763.01 294320.4642 51155.69973 267691.4698 87595.37625
Bhadra 714660.69 300157.4898 52170.23037 273000.3836 89332.58625
Ashoj 640320.28 268934.5176 46743.38044 244602.347 80040.035
Kartik 610928.76 256590.0792 44597.79948 233374.7863 76366.095
Mangsir 553983.14 232672.9188 40440.76922 211621.5595 69247.8925
Poush 621754.8 261137.016 45388.1004 237510.3336 77719.35
Magh 570097.5 239440.95 41617.1175 217777.245 71262.1875
Falgun 580924.78 243988.4076 42407.50894 221913.266 72615.5975

23
Consumption/Month
Total Consumption
Domestic Consumption
Commercial Consumption
Industrial Consumption
Other Consumption
Chaitra 591830.53 248568.8226 43203.62869 226079.2625 73978.81625
Baisakh 706803.84 296857.6128 51596.68032 269999.0669 88350.48
Jestha 775719.49 325802.1858 56627.52277 296324.8452 96964.93625
Ashad 766213.05 321809.481 55933.55265 292693.3851 95776.63125
Source: (LDC, NEA 2019)
3.2.2 Upcoming Power Purchase Agreement Concluded Projects and
commissioning date
The data of upcoming PPA concluded projects and their required commercial date of
operation are collected from NEA and database of DoED & the revised date of some
projects are gathered from System Planning Department, NEA to identify exact
capacity and commissioning of correspondings in coming ten years. It has been
observed that hydropower projects of total capacity 5170.092 MW are PPA concluded
projects till date and these all projects will be commissioned within Bhadra, 2082 BS.
Kasuwa Khola Hydropower project of capacity 45 MW is farthest commission date
concluded project at present with commissioning date of Bhadra, 2082 BS. .
Table 3. 4 Capacity of Projects Expected to be Commissioned in Each Months of
Coming Years (in MW)
Month/FY 077/78 078/79 079/80 080/81 081/82 082/83
Shrawan 1034.877 621.76 101.406 201.75 4.99 0 Bhadra 118.46 11.8 215.974 161.709 0 45 Ashoj 110.72 83.89 30.55 64.12 0 0 Kartik 82.32 19.92 102 89.1 0 0
Mangshir 1 9.51 14.5 29 0 0 Poush 4.8 34.1 57.43 86.5 85.675 0 Magh 31.828 120 50 126.62 86.59 0 Falgun 13.5 14 41.506 58.922 0 0 Chaitra 74.196 51.58 43.52 93.55 0 0 Baisakh 13.35 52 72.4 389.14 0 0 Jestha 0.98 32 8.8 0 0 0 Ashad 296.289 0 47.46 0 30 0
Total Capacity 1782.32 1049.56 785.546 1300.411 207.255 45
Source: (Nepal Electricity Authority, 2019)

24
There will be highest capacity addition in Shrawan, 2077 which sums up to around
1034.877 MW including Upper Tamakoshi hydropower project of capacity 456 MW.
The total capacity of PPA concluded projects going to be commissioned in each
month of coming years as per PPA are presented in Table 3. 4. (Nepal Electricity
Authority, 2019)
3.2.3 Vehicle Registration Numbers and Household Statistics
The data of yearly vehicle registration is collected Department of Transport
Management, Minbhawan, Kathmandu in the view to perform analysis for electric
vehicle penetration which is presented in Table 3.5 which shows yearly registration of
vehicles from fiscal year 065/66 to 074/75 (Department of Transport Management,
2019).
Table 3.5 Yearly Vehicle Registration Number of Past Ten Years in Nepal
Fiscal Year Bus Car/Jip Van Micro Tempo Bike E Rickshaw
065/66 1843 6857 128 20 83334 0 066/067 1888 12268 145 9 168707 0 067/068 1610 8510 115 2 138907 0 068/069 2085 8711 155 10 145135 0 069/070 3263 9595 158 57 175381 0 2070/71 2776 11372 178 17 163945 0 2071/72 3737 13560 932 1541 196383 0 2072/73 4353 28361 1137 2613 267439 11894 2073/74 5342 21292 841 17782 354071 2247 2074/75 2972 24338 1934 16209 341623 12325
2075/76* 2354 17953 1431 9785 249581 8654
Source: (Department of Transport Management, 2019)
The data of household status is collected through Central Bureau of Statistics in the
view to perform analysis for Induction Chulo penetration. The corresponding
household numbers in each province of Nepal is presented in Table 3. 6 which shows
provincial household statistics of Nepal (Central Bureau of Statictics, 2019).
Table 3. 6 Provincial Households Statictics of Nepal
Province Households
1 992445 2 932308
Bagmati 1270797

25
Province Households
Gandaki 578249 5 885203
Karnali 298359 Far western 469971
Total 5427332
Source: (Central Bureau of Statictics, 2019)
3.3 Plant Capacity Factor Determination
The capacity factor of a hydropower plant or project is the ratio of its actual output
over a period of time, to its potential output if it were possible for it to operate at full
nameplate capacity indefinitely. The plant capacity factor relates actual energy
generations as a fraction of maximum energy that can be generated under the period
of consideration. The plant capacity factor is calculated using Equation 3.1.
PCF = AEG
PIC × T Equation 3. 1
Where
AEG = Actual Energy generations (MWh) in a time under consideration
PIC = Plant Installed Capacity (MW)
T = Time interval under consideration (hr)
PCF = Plant capacity Factor
PCF can be computed annually, monthly or as per the desired time frame of interest.
The actual monthly plant capacity factor of individual NEA operated ROR
hydropower projects, Storage hydropower projects and IPP operated ROR
hydropower projects are determined based on past data of energy generations from
LDC, NEA to assign most reliable plant capacity factor to these projects for reliable
calculations of energy generations from these projects in future. The actual monthly
plant capacity factor for past years of these individual NEA operated ROR
hydropower projects, Storage hydropower projects and IPP operated ROR
hydropower projects based on monthly data collected from LDC, NEA are presented
in Appendix – D, Appendix – E and Appendix – F respectively. The monthly plant
capacity factors of NEA operated ROR hydropower projects, storage projects and IPP
operated ROR hydropower projects of past years are taken into consideration and

26
average value is calculated for each month of a year by averaging the monthly data of
individual plants which are presented in Appendix – G. These average monthly plant
factors of individual projects are assigned to calculate the expected energy generation
from such individual projects in coming years as this will be the usual case of
operational availability for already operating projects at present. However, for any
ROR project going to be developed by NEA or its sister organization or storage
projects or ROR projects going to be developed by IPP and which are going to be
commissioned in coming ten years, the expected generation needs most reliable
monthly plant capacity factor for these three groups of projects. This is calculated by
taking weightage average of all monthly average plant capacity factors for a particular
month by using formula;
WAMPCF = PIC1 × AMPCF1 + PIC2 × AMPCF2 + .......................+ PICN × AMPCFN
PIC1 + PIC2 + .......................+ PICN
Where,
PICN = Plant Installed Capacity of Nth Project
AMPCFN = Average Monthly Plant Capacity Factor of same project for a
particular month
WAMPCF = Weightage Average Monthly Plant Capacity Factor for a group
of projects for a particular month
3.4 Scenarios of Upcoming PPA Concluded Generation Projects Commissioning
The generation projects that are going to be commissioned in upcoming time are
analyzed under three scenarios viz. Normal, Shift IPP Plants & Shift IPP and NEA
Plants. Normal scenario corresponds to the commissioning of the PPA concluded
projects on their exact Required Commercial Operation Date (RCOD) as of their
PPA. This case has been described earlier in section 3.2.2 which shows 5170.092 MW
is finalized till date through PPA and this capacity is going to be commissioned in
next six years.
The accomplishment of commissioning of hydropower projects on exact RCOD has
always been the biggest challenge in Nepal and is usyally encountered with delay due
to delay in transmission structure development and operation, force majeure such as
landslide, flood etc., political instability, delay in supply of materials etc. There has
been delay of about a year in completion of projects in IPP side. Similarly, for the

27
projects going to be constructed from NEA side, the delay of around two to four years
is encountered in completion and commissioning of projects. So, the second scenario
in generation aspect considered is “Shift IPP Plants” in which the required
commissioning date of all the future IPP Plants are considered with delay of a year &
the plants going to be developed by NEA and its sister organizations will come as in
Normal scenario. The total capacity of PPA concluded projects going to be
commissioned in each month of coming years under this scenario are presented in the
tabular matrix form in Table 3. 7. This will result into only about 270.3 MW addition
in fiscal year 2077/78 and significant addition of projects will be observed in fiscal
years 2078/79 and 2081/82 with capacities of 2005.02 MW and 1160.411 MW
respectively. The last addition as per present PPA concluded projects will be observed
in Bhadra of fiscal year 2083 BS and it will have addition of 45 MW at that time.
Table 3. 7 Capacity of Projects Expected to be Commissioned in Each Months of
Coming Years under Shift IPP Plants Scenario (in MW)
Month/FY 077/78 078/79 079/80 080/81 081/82 082/83 083/84
Shrawan 125.8 1365.077 165.76 101.406 201.75 4.99 0 Bhadra 0 118.46 11.8 215.974 161.709 0 45 Ashoj 0 110.72 83.89 30.55 64.12 0 0 Kartik 0 82.32 18.92 102 89.1 0 0
Mangshir 0 1 9.51 14.5 29 0 0 Poush 0 4.8 34.1 57.43 86.5 85.675 0 Magh 0 31.828 120 50 126.62 86.59 0 Falgun 0 13.5 14 41.506 58.922 0 0 Chaitra 0 111.196 14.58 43.52 93.55 0 0 Baisakh 0 13.35 52 212.4 249.14 0 0 Jestha 0 0.98 32 8.8 0 0 0 Ashad 144.5 151.789 0 47.46 0 30 0 Total
Capacity 270.3 2005.02 556.56 925.546 1160.411 207.255 45
Similarly, the third scenario in generation aspect considered is “Shift IPP and NEA
Plants” in which the required commissioning date of all the future IPP Plants are
considered with delay of a year & required commissioning date of all the NEA and its
sister organizations’ plants are considered with delay of three years. The total capacity
of PPA concluded projects going to be commissioned in each month of coming years
under this scenario are presented in the tabular matrix form in Table 3. 8. This
scenario will cause no any addition of capacity in fiscal year 2077/78. This scenario

28
will cause significant addition of projects in fiscal year 2078/79 and 2081/82 with
capacities of 1968.02 MW and 1197.411 MW respectively. Similarly, there will be
last addition of projects in Baisakh, 2084 and it will have addition of around 140 MW
at that point.
Table 3. 8 Capacity of Projects Expected to be Commissioned in Each Months of
Coming Years under Shift IPP and NEA Plants Scenario (in MW)
Month/FY 077/78 078/79 079/80 080/81 081/82 082/83 083/84
Shrawan 0 1365.07 165.76 227.206 201.75 4.99 0 Bhadra 0 118.46 11.8 215.974 161.709 0 45 Ashoj 0 110.72 83.89 30.55 64.12 0 0 Kartik 0 82.32 18.92 102 89.1 0 0
Mangshir 0 1 9.51 14.5 29 0 0 Poush 0 4.8 34.1 57.43 86.5 85.675 0 Magh 0 31.828 120 50 126.62 86.59 0 Falgun 0 13.5 14 41.506 58.922 0 0 Chaitra 0 74.196 14.58 43.52 130.55 0 0 Baisakh 0 13.35 52 72.4 249.14 0 140 Jestha 0 0.98 32 8.8 0 0 0 Ashad 0 151.789 0 191.96 0 30 0 Total
Capacity 0 1968.02 556.56 1055.846 1197.411 207.255 185
3.5 Scenarios of Expected Energy Consumption
It has been studied different forecasted growth rate of monthly energy consumption or
demand through different literatures in Chapter 2. Those growth rates are forecasted
in both the business as usual case and also with policy intervention as well. However,
the most reliable forecast till date has been as that forecasted by NEA in Nepal as
being only one major power supplying utility, it facilitates both expansion of
transmission and distributons to the consumer and it has the real data base of
consumption and customer growth. This study has focused the expected energy
consumption in normal business and also with policy intervention of Induction Chulo
and Electric Vehicles as well. So, the expected energy (MWh) consumption are
analyzed under five scenarios viz. Normal, Growth with Categorization of
Consumption, Intervention with Induction Chulo, Intervention with Electric Vehicle
and Combined Intervention of Induction Chulo and Electric Vehicle.

29
3.5.1 Expected Energy Consumption in Normal Scenario
Normal scenario corresponds to the constant yearly growth on overall energy
consumption and assumes same percentage growth in energy consumption from a
month of present year to same month of next year. In this scenario, the base monthly
energy consumption is taken for each month of FY 075/76 presented section 3.2.1.4
and the yearly MWh growth of 8% per annum is considered. In this scenario, the
expected energy consumption in each month of upcoming fiscal years is increased by
8% as that of present consumption in corresponding month using Equation 3.2.
MECi = MECbase ×
1 +
r100
i Equation 3. 2
Where,
MECbase = Monthly Energy Consumption of a particular month of base year
075/76
MECi = Monthly Energy Consumption of same month after ith year from
base year
r = Monthly Energy Consumption growth rate per annum (8%)
The expected monthly energy consumption in each month of coming ten years under
this scenario are presented in tabular form in Appendix – H.
3.5.2 Expected Energy Consumption in Growth with Categorization of
Consumption Scenario
The growth of energy consumption in categorized consumption sector viz. Domestic,
Commercial, Industrial and Other is different than the growth in bulk amount of
yearly consumption. Nepal, being developing country, these categorized growth
should also be taken under consideration as our power sector is also growing just after
the starting of post load shedding era and this will be the most likely consumption
scenario for coming ten years. While analyzing the collected categorized consumption
from LDC, NEA, the consumption of energy in fiscal year 2074/75 in domestic,
commercial, industrial and other sector were found to be 2163.51 GWh, 350.58 GWh,
1719.26 GWh and 543.18 GWh respectively. Similarly, these consumptions for fiscal
year 2075/76 were found to be 2441.67 GWh, 407.59 GWh, 2074.17 GWh and
636.81 GWh respectively. There are per annum growth of 12.85%, 16.26%, 20.64%

30
and 17.23% in Domestic consumption, Commercial consumption, Industrial
consumption, and other consumption, respectively from FY 074/75 to 075/76. The
categorized energy consuming class has different growth rate than that of 8% p.a.
growth. So, the second scenario considered is “Growth with Categorization of
Consumption”. In this scenario, instead of considering as whole energy consumption
in a month, the total monthly energy consumption in base case is categorized into four
types of consumptions viz. Domestic consumption, Commercial consumption,
Industrial consumption, and Other consumption as illustrated in section 3.2.1.4 earlier
and observed growth rate from FY 074/75 to 075/76 are considered for next ten years.
This scenario is considered in aim to determine most likely energy consumption in
future based on categorized consumption rather than as a whole growth in monthly
consumption. This scenario calculates the expected monthly energy consumption for
coming ten years considering these categorized growth rates in four categories in
similar manner to first scenario in section 3.5.1 and then sums up those energy
consumptions to determine the total expected monthly energy consumption using
Equation 3.3.
MECi = MECi,domestic + MECi,commercial + MECi,industrial + MECi,other Equation 3. 3
Where,
MECi,domestic = Monthly Energy Consumption of particular month after ith year
from base year by domestic consumers
MECi,commercial = Monthly Energy Consumption of particular month after ith
year from base year by commercial consumers
MECi,industrial = Monthly Energy Consumption of particular month after ith year
from base year by industrial consumers
MECi,others = Monthly Energy Consumption of particular month after ith year
from base year by Other consumers
The expected monthly energy consumption in each month of coming ten years under
this scenario are presented in tabular form in Appendix – H.

31
3.5.3 Expected Energy Consumption in Intervention with Induction Chulo
Scenario
The most possible internal energy consumption policy for growing electricity
generations in Nepal will be encouragement in using Induction Chulo as Nepal is
heavily dependent on Liquefied Petroleum Gas (LPG) till date and is mostly imported
from India. The LPG has dominant proportions as cooking means urban area in Nepal
and has increased exponentially in recent years. It has been consumed by around
25.8% of households and is second – most used cooking fuel in Nepal and most used
cooking fuel in urban areas, at about 58.5%. The import of LPG has increased by 3.3
times from 81,005 Metric tons in year 2005/06 AD to 258,299 Metric tons in year
2014/15. (Bhandari & Pandit, 2018). Increasing internal consumtption through
electricity as cooking means will not only reduce the dependency on neighbouring
country for its import but also strengthen national economy and incentivize the
hydropower development within the country as well.
The third scenario is “Intervention with Induction Chulo”. This intervention considers
the addition of one induction chulo per house in constant 10% household p.a. growth
rate at the start of each Fiscal Year with total households of 54,27,332 at present
(Central Bureau of Statictics, 2019). This intervention has been added to the most
likely energy consumption scenario i.e. the second scenario illustrated earlier in
section 3.5.2. This intervention considers the addition of 5,42,733 induction chulo
per year for coming ten years at the start of Fiscal Year and anticipates the one
induction chulo per household of Nepal in coming ten years so as to replace LPG and
increase the domestic consumption within Nepal.
The currently LPG of different companies are available in Nepal with net weight of
14.2 kg on one cylinder. The equivalent mega joule of energy to 1 kg of LPG is 49 MJ
and it results into total of 695.8 MJ from one cylinder LPG. One kilowatt hour (or
unit) energy consumption is equal to 3.6 MJ of energy. The consumption of one
cylinder LPG, depending upon the family members, generally varies from 45 days, 60
days or 75 days which is equivalent to per day average electrical energy consumption
of 4.295 kilowatt hours, 3.221 kilowatt hours or 2.577 kilowatt hours respectively by
a single Induction Chulo. This average daily consumption is responsible for all the
cooking application performed daily in a household. In this “ Intervention with
Induction Chulo” scenario, the daily consumption of a single Induction Chulo is

32
considered as four kilowatt-hour and the monthly energy consumption of each month
of a year is calculated using Equation 3.4.
MECinduction chulo = Number of household × Per house per day energy consumption
× 30 Equation 3. 4
Where,
MEC induction chulo = Monthly energy consumption due to induction chulo
intervention for each months of a particular fiscal year in
KWh
This causes addition of 65,127.96 MWh of energy consumption at the start of each
Fiscal Year for coming ten years. The expected monthly energy consumption in each
month of coming ten years under this scenario are presented in tabular form in
Appendix – H.
3.5.4 Expected Energy Consumption in Intervention with Electric Vehicle
Scenario
Another possible internal energy consumption policy for growing electricity
generations in Nepal will be implementation of Electric Vehicle as significantly large
volume of petroleum products are imported from India each year. The petrol and
diesel have been mostly used vehicle fuel over years in the country. The import of
petrol has increased by 162902 KL in fiscal year 2066/67 to 566827 KL in fiscal year
2075/76. Similarly, the import of diesel has increased by 608065 KL in fiscal year
2066/67 to 1714917 KL in fiscal year 2075/76 (Nepal Oil Corporation, 2020).
Increasing internal consumtption through electric vehicle as transportation will
strengthen national economy and incentivize the hydropower development within the
country as well.
The fourth scenario is “Intervention with Electric Vehicle”. This intervention
considers that 10% of total sales of Bike, Car, Jeep, Van and Bus of Nepal is electrical
energy based sales in first year and the sales fraction should be increased on integer
multiple of initial 10% in each coming fiscal year such that the aforementioned five
vehicle types will be fully electrical type in tenth year i.e. in fiscal year 086/87. This
intervention has been added to the most likely energy consumption scenario i.e. the
second scenario illustrated earlier in section 3.5.2. Unlike induction chulo

33
intervention, here the total yearly sales is divided into monthly sales and addition of
new electric vehicle sales is performed on month by month basis and expected
monthly energy consumption for each month of coming ten years is calculated by
using Equation 3.5.
MECelectric vehicle = MECelectric bike+MECelectric car,jeep,van+MECelectric bus Equation 3. 5
Where,
MEC electric bike = Number of electric bike at start of each month of a
fiscal year × Per bike KWh energy consumption by
one electric bike in a month
MEC electric car,jeep,van = Number of electric car, jeep, van at start of each month
of a fiscal year × Per car, jeep, van KWh energy
consumption by one electric car, jeep, van in a month
MEC electric bus = Number of electric bus at start of each month of a
fiscal year × Per bus KWh energy consumption by
one electric bus in a month
MEC electric vehicle = Monthly energy consumption due to electric vehicle
intervention for each months of a particular fiscal year
in KWh
The per any electric vehicle type energy (KWh) consumption in one month in each of
the quantities is calculated by using Equation 3.6.
AMECelectric vehicle type = N × Energy consumption in One Charging Equation 3. 6
Where,
N = Number of charging per month
= Average Monthly Kilometer Run
Kilometer run by vehicle type in one charge and
AMECelectric vehicle type = Average monthly energy consumption by an electric
vehicle type (i.e. per any electric vehicle type energy
(KWh) consumption in one month)
This intervention will result into 55% of total sales of aforementioned five vehicles
will be electrical energy based in coming ten years and this will surely decrease the

34
imported petroleum consumption and increase internal electrical energy consumption
in Nepal. This intervention is based on monthly energy consumption of electric bike
as 67.5 kilowatt-hours, that of car/jeep/van as 200 kilowatt-hours and that of bus as
5514 kilowatt-hour through different literature reviewed in Chapter 2. The expected
monthly energy consumption based on these data in each month of coming ten years
under this scenario are presented in tabular form in Appendix – H.
3.5.5 Expected Energy Consumption in Combined Intervention of Induction
Chulo and Electric Vehicle Scenario
Combined Intervention of Induction Chulo and Electric Vehicle is fifth scenario
considered in expected energy consumption for coming ten years. In this scenario,
both Induction Chulo and Electric Vehicle intervention strategies discussed in section
3.5.3 and 3.5.4 scenarios respectively are combined and added to the most likely
energy consumption scenario i.e. the second scenario illustrated earlier in 3.5.2
simultaneously. The extra expected monthly energy consumption due to this
combined intervention is calculated using Equation 3.7.
MECcombined = MECinduction chulo + MECelectric vehicle Equation 3. 7
The total energy consumption after intervention of this combined energy on second
scenario for each month of coming ten years are presented in tabular form in
Appendix – H.
3.6 Estimation of Expected Energy Generation
The expected energy generation estimation has been performed on monthly basis of
for coming fiscal years. These estimations have been performed considering three
scenarios of generation projects commissioning as illustrated in section 3.4.
The expected energy generation estimation involves calculation of energy generations
from the current installed hydropower projects and formthe projects that are going to
be commissioned in future. The most reliable plant capacity factor is used for each
hydropower projects to calculate these expected generations which are summarized
as:
1. The expected monthly energy generations from NEA operated major ROR
hydropower projects of capacity 398.05 MW as listed in section 3.2.1.1 are calculated

35
using their own average monthly plant capacity factor which is calculated from their
past data using Equation 3.8.
EMEG = PIC × AMPCF × T Equation 3. 8
Where,
PIC = Plant Installed Capacity (MW) of a particular plant
T = Time interval under consideration (hr)
AMPCF = Average Monthly Plant Capacity Factor of same plant
EMEG = Expected Monthly Energy generations (MWh) in a time
under consideration
2. The expected energy generations from storage hydropower projects, Kulekhani (I)
– 60 MW and Kulekhani (II) – 32 MW, are calculated using their own average
monthly plant capacity factor which is calculated from the data of past ten years using
Equation 3.8. However, the expected energy generations of Kulekhani (III) – 14 MW
which is recently added in year 2076 B.S. is calculated using Equation 3.9.
EMEG = PIC × WAMPCF × T Equation 3. 9
Where,
PIC = Plant Installed Capacity (MW) of a particular plant
T = Time interval under consideration (hr)
WAMPCF = Weightage Average Monthly Plant Capacity Factor of
storage hydropower projects
EMEG = Expected Monthly Energy generations (MWh) in a time
under consideration
3. The expected energy generations from IPP operated major ROR hydropower
projects of capacity 201.91 MW except Upper Marsyangdi A and Upper Madi as
listed in section 3.2.1.3 are calculated using Equation 3.8 using their own average
monthly plant capacity factor which is calculated from their past data. For Upper
Marsyangdi A and Upper Madi, as these projects are recently added to INPS, the
expected monthly energy generations are calculated using Equation 3.9 with
WAMPCF of IPP operated major ROR projects .

36
4. Furthermore, the other IPP operated ROR projects commissioned till date are
classified into three groups viz. less that 5 MW of total capacity 109.947 MW,
between 5 MW to 10 MW of total capacity 111.68 MW and remaining other IPP
projects of capacity 126.463 MW. Expected monthly energy generations from these
projects are calculated Equation 3.9 with WAMPCF of IPP operated major ROR
projects.
5. The other remaining projects operated by NEA constitutes for total capacity of 52
MW whose expected energy generations are calculated Equation 3.9 with WAMPCF
of NEA operated ROR hydropower projects.
6. For the PPA concluded projects which are going to be commissioned in the
required commercial operation date accordingly as their power purchase agreement,
the expected monthly energy generations are calculated Equation 3.9 with WAMPCF
of IPP operated major ROR projects.
3.7 Verification of Data
The reliability of the results is assured through this verification mechanism. In which,
the monthly consumption MWh and import MWh data of year 2076 B.S. are taken
from LDC, NEA. The monthly expected generations of the total installed projects for
this year are calculated. The difference of actual monthly consumption obtained from
LDC, NEA and these expected monthly MWh generations results into calculated
monthly import MWh which is formulated as in Equation 3.10.
CMIE = AMEC EMEG Equation 3. 10
Where,
AMEC = Actual monthly energyconsumption of 2076 B.S.
EMEG = Expected monthly energy generation of 2076 B.S.
CMIE = Calculated monthly import energy
These calculated monthly imports MWh are then compared with the actual monthly
import energy (AMIE) for verification of the data in terms of percentage variartion in
monthly import (PVMI) in positive value given by Equation 3.11 which shows
variation with reference to actual monthly import energy (AMIE).
PVMI =
AMIE CMIE
AMIE × 100% Equation 3. 11

37
The initial PVMI calculation is performed with installed capacity of NEA generations
as 450.05 MW and IPP generations of 625 MW which including 45 MW of
Bhotekoshi hydropower projects and 60 MW of Upper Trishuli 3A from initial
months of 2076 BS for calculation purpose. The PVMI calculation is performed in
two steps viz. first considering without outage of any projects and then the outages of
projects in each months of 2076 BS is taken into consideration to calculate real PVMI
for the year. Additional projects Kulekhani III (14 MW), Kapadigadh (3.3 MW),
Pikhuwa Khola (5MW), Lower Chhotte Khola (0.996 MW), Uppar mardi (7 MW),
Iwa Khola (9.9 MW) and Kabeli B1 (25 MW) had been commissioned in midway in
2076 BS. So, generation of these projects is added from the respective commissioned
months. Based on these generation capacity, PVMI without outage are calculated
firstly and then following outages are taken care in each month based on data from
LDC, NEA and equivalent outage energy is subtracted from the expected monthly
energy generation to calculate real PVMI with outage energy as well.
1. Baisakh: Bhotekoshi (45 MW) was out of service over full month and Upper
Trishuli 3A (60 MW) was still not connected at this point.
2. Jestha: Bhotekoshi, Chaku (3 MW), Lower Chaku (1.5 MW), Middle Chaku
(1.5 MW), Lower Piluwa (1 MW), Rairang (0.5 MW), Salinadi (0.3 MW),
Thapakhola (11 MW) was out of service over full month and Upper Trishuli
3A was still not connected at this point.
3. Ashad: Bhotekoshi, Chaku, Lower Chaku, Middle Chaku, Lower Piluwa,
Rairang, Salinadi, Thapakhola was out of service over full month and Upper
Trishuli 3A was still not connected at this point. Upper Madi was also out of
service for 14 days in this month.
4. Shrawan & Bhadra: Bhotekoshi was out of service for this month.
5. Ashoj & Kartik: Bhotekoshi, Chaku, Lower Chaku, Middle Chaku, Lower
Piluwa, Rairang, Salinadi, Thapakhola and Upper Trishuli 3A was out of
service over full month.
6. Mangshir: Middle Marsyangdi (70 MW), Ankhu (8.4 MW), Mardi (4.8 MW)
and Pheme (1 MW) were out of service for 15 days. Mai Cascade (7 MW) and
Mailung (5 MW) were out of service for 25 days. Maikhola (4.5 MW) and
Upper Mai (11 MW) were out of service for 26 days. Upper Madi (25MW)
and Jiri Bojini (2 MW) were out of service over full month.

38
7. Poush: Khudi (4 MW) was out of service for 9 days. Tinau (1.02 MW) was
out of service for 13 days, Uppper Madi for 14 days and Jiri Bojini for 16
days. Chilime (22.1 MW) was out of service for 20 days and Tatopani (2 MW)
was out of service for 25 days. Fewa (1 MW), Mai Cascade, Maikhola and
Mailung (5 MW) were out of service for 28 days. Upper Mai was out of
service for 29 days.
8. Magh: Chaku, Lower Chaku, Middle Chaku, Lower Piluwa, Rairang, Salinadi
and Thapakhola were out of service over full month.
9. Falgun & Chaitra: Chaku, Lower Chaku, Middle Chaku, Lower Piluwa,
Rairang, and Salinadi were out of service over full month.
3.8 Surplus Deficit Ratio (S/D – Ratio) Estimation
Surplus Deficit Ratio (S/D – Ratio) is ratio of total expected surplus energy (MWh)
and total expected deficit energy (MWh) in a fiscal year. The total expected surplus
energy is sum of surplus energy of months with monthly expected generation greater
than monthly expected consumption. In the same manner, the total expected deficit
energy is sum of deficit energy of months with monthly expected consumption greater
than monthly expected generation. This ratio has been defined to decide for as a
whole surplus or deficit of energy over a fiscal year. The S/D – Ratio is formulated as;
S/D – Ratio = Total Expected Surplus Energy(MWhr) over a yearTotal Expected Deficit Energy (MWhr) over a year
This S/D – Ratio can be interpreted as,
S/D – Ratio = 0 There is deficit of energy (MWh) in each month of a year
∞ There is surplus of energy (MWh) in each month of a year
1 Total Expected Surplus energy (MWh) and total Expected
Deficit energy (MWh) are equal over a year
> 1 Total Expected Surplus energy (MWh) exceeds total Expected
Deficit energy (MWh) over a year
< 1 Total Expected Deficit energy (MWh) exceeds total Expected
Surplus energy (MWh) over a year

39
The S/D – Ratio gives the idea of quantity of energy for banking possibility. The ideal
energy banking will be observed for unity ratio as it depicts the surplus energy over a
year will be equal to deficit of energy over a year at different months.So, energy can
be exported in banking in months with surplus energy and equal amount of energy can
be imported from the banking facility for other energy deficit months. The zero S/D –
ratio signifies for import of energy for all months and infinite ratio signifies for export
of energy for all months of year. The S/D – ratio greater than unity signifies for export
energy to banking facility to be greater than import energy. The S/D – ratio less than
unity signifies for import energy from banking facility to be greater than export
energy.
3.9 Modeling of Planned INPS after Saturation of Commisoning of Generation
Projects for Load Flow Simulation
3.9.1 Monthly Import and Export Peak Demand Calculation for Simulation
The expected energy consumption in different scenarios varies in monthly manner for
coming periods taken under consideration for study in this thesis. This expected
energy consumption will be converted into monthly peak demand using monthly load
factor. Monthly Load Factor (MLF) is defined as the ratio of actual energy used in a
given period to the total maximum possible energy that could have been used in the
same period and is given by Equation 3.12.
MLF = Atual energy consumed in a month Monthly Peak Demand × 30 × 24 Equation 3.12
The monthly load factor for fiscal year 2075/76 is calculated using Equation 3.12 and
are presented in Table 3. 9. These load factors are used for corresponding calculation
of monthly peak demand for the simulation purpose.
Table 3. 9 Monthly Load Factor (MLF) for Fiscal Year 2075/76
Month Monthly Energy Consumption
(GWh) Monthly Peak
Demand (MW) M LF
Shrawan 700.76 1242.87 0.783088962 Bhadra 714.66 1284.28 0.77287144 Ashoj 695.98 1242.87 0.777747382 Kartik 555.27 1185.76 0.650391591
Mangshir 573.35 1171.19 0.679923364 Poush 602.39 1244.17 0.672458569

40
Month Monthly Energy Consumption
(GWh) Monthly Peak
Demand (MW) M LF
Magh 570.1 1203.4 0.657973704 Falgun 580.92 1156.28 0.697783697 Chaitra 591.83 1201.44 0.684167425 Baisakh 706.8 1296.02 0.757447159 Jestha 775.72 1309.52 0.822735727
Ashadh 766.31 1343.06 0.792458598
Source: (Nepal Electricity Authority, 2019)
Similarly, there will be variation of expected energy generation in different month
from installed generation projects in accordance with the monthly plant capacity
factor as well. The total installed capacity of a particular month is calculated as sum
of capacities of each generation plants in accordance with the monthly plant capacity.
The import and export peak demand for a particular month is then calculated as the
difference between the monthly peak demand and monthly installed capacity.
3.9.2 Modeling of Planned INPS
The installed capacity of INPS is 1073 MW.The real time data of Integrated Nepal
Power System (INPS) was obtained from Load Dispatch Center (LDC), Syuchatar.
The current INPS is modeled with two sub – sytems viz. Kathmandu sub – system and
Hetauda sub – system and load flow is simulated and matched with the real time flow
of the LDC. The digaramatical representation of then matched INPS is shown in
Appendix - O (Puri, 2018).
The most likely generation scenario is “Shift IPP and NEA Plants” in which usual
delay of a year and three years are observed in Nepal in commissioning of generation
projects constructed through IPPs and NEA respectively. In this scenario, there will
be last addition of projects in Baisakh, 2084 BS and it will have addition of around
140 MW at that point. So, the planned INPS is modeled and simulated for the fiscal
year 084/85. The planned INPS for year 084/85 is modeled in ETAP 12.6.0 with the
consideration of future generations planning from Nepal Government, Nepal
Electricity Authority and its subsidiary companies as well as IPPs. Similarly,
transmission networks are proposed by Rastriya Prasaran Grid Company Limited
(RPGCL) which are also considered for future networks in this model and are planned

41
to be completed across the country by fiscal year 082/83 i.e. by 2025 AD (Nepal
Electricity Authority, 2015). The generation as well as transmission are modeled on
the zone basis i.e. five distinct zones viz. Zone – 1, Zone – 2, Zone – 3, Zone – 4 and
Zone – 5 (RPGCL, 2018). The individual Zone modeling for integration with current
INPS are described and represented as follows and the digramatical representation of
modeling are presented in Appendix - L.
3.9.2.1 Modeling of Zone - 1
Zone - 1 includes province - 7 and some districts of Province - 6 as well. The
following planned projects are commissioned to the respective buses in accordance
with their commissioning date of PPA in ETAP 12.6.0 model of Zone 1. The projects,
connected bus and respective capacity are presented in Table 3. 10.
Table 3. 10 Hydropower Projects and Buses in Zone – 1
S.N. Hydropower Projects Connected Bus Capacity (MW)
1. Chameliya
Balanch Hub ( 132 kV)
30 2. Upper Chameliya 40 3. Makarigad 10 4. Upper Naugadh Gad 8 5. Api 8.5 6. Sunigad
Upper Kalangagad Hub
( 132 kV)
11.05 7. Kalangad 15.33 8. Upper Sanigad 10.7 9. Upper Kalangagad 38.46
10. Salubyani Gad Small 0.233 11. Jeuligad Small 0.996 12. Jadari Gad Small 1 13. Upper Gaddigad West Seti
( 132 kV) 1.55
14. Ruru Banchu-1 Phukot (400 kV)
13.5 15. Ruru Banchu Khola - 2 12
Similarly, the transmission line coming under operation by 2025 AD in Zone – 1 is listed in Table 3. 11
Table 3. 11 Transmission Projects in Zone – 1
S.N.
Transmission Project Voltage Level (kV)
Conductor Length (Km)
1. Dododhara - Phukot 400 Quad Moose 80

42
S.N.
Transmission Project Voltage Level (kV)
Conductor Length (Km)
2. Balanch -Upper Kalangagad 132 Bison 54 3. Upper Kalangagad- West seti 132 Bison 64
3.9.2.2 Modeling of Zone - 2
Zone – 2 includes province – 5 and some districts of Province – 6 as well. The
following planned projects are commissioned to the respective buses in accordance
with their commissioning date of PPA in ETAP 12.6.0 model of Zone – 2. The
projects, connected bus and respective capacity are presented in Table 3. 12.
Table 3. 12 Hydropower Projects and Buses in Zone – 2
S.N. Hydropower Projects Connected Bus Capacity (MW)
1. Padam Khola
Mainatara ( 132 kV)
4.8
2. Upper Parajuli Khola 2.15
3. Lohore Khola 4.2
4. Upper Lohore 4
Similarly, the transmission line coming under operation by 2025 AD in Zone – 2 is listed in Table 3. 13.
Table 3. 13 Transmission Projects in Zone – 2
S.N.
Transmission Project Voltage Level (kV)
Conductor Length (Km)
1. Dododhara - Maina Tara 400 Quad Moose 86 2. Phulbari - Maina Tara 400 Quad Moose 62 3. Maina Tara - Kohalpur 400 Quad Moose 31 4. Maina Tara - Kohalpur 132 Bison 31
3.9.2.3 Modeling of Zone - 3
Zone – 3 includes different parts of Province – 5, Province – 4 and Province – 3 as
well. It contains major hydropower projects in Kaligandaki corridor and Marsyangdi
corridor. The following planned projects are commissioned to the respective buses in
accordance with their commissioning date of PPA in ETAP 12.6.0 model of Zone – 3.
The projects, connected bus and respective capacity are presented in Table 3.14.

43
Table 3.14 Hydropower Projects and Buses in Zone – 3
S.N. Hydropower Projects Connected Bus Capacity (MW)
1. Myagdi Khola DandaKhet ( 220 kV)
57.3 2. Upper Myagdi 20 3. Kunaban Khola 20 4. Bhim Khola 4.96 5. Lower Modi
Dana ( 220 kV)
20 6. Landruk Modi 86.59 7. Ghalemdi Khola 1 8. Super Ghalemdi 9.14 9. Thulo Khola
Rahughat (220 kV)
21.3 10. Upper Thulo Khola 15 11. Rahughat 40 12. Rahughat Mangale 35.5 13. Ghar Khola 14 14. Nilgiri Khola 38 15. Nilgiri Khola - 2 62 16. Rele Khola 6 17. Daram Khola
Kusma (220 kV)
9.6 18. Middle Daram A 3 19. Middle Daram B 4.5 20. Middle Tara Khola
Smal Kusma
(132 kV) 1.7
21. Middle Modi Upper Modi (132 kV)
15.1
22. Burtibang Burtibang (132 kV)
21
23. Tinau Khola Small Butwal (220 kV)
1.665
24. Namarjun Madi Upper Madi
(220 kV
11.8 25. Upper Bhurundi 3.75 26. Super Madi 44 27. Madame Khola 24 28. Idi Khola Lekhnath
(220 kV) 0.975
29. Chepe Khola Small
Damauli (220 kV)
8.63 30. Chepe Khola A 7.5 31. Super Chepe 9.05 32. Dudhpokhari Chepe 8.8 33. Super Trishuli 70 34. Tanahu Seti Damauli
(400 kV) 140
35. Dudh Khola Manang (220 kV)
65
36. Nyadi Khola
30 37. Nyadi Phidi 21.4

44
S.N. Hydropower Projects Connected Bus Capacity (MW)
38. Super Nyadi Khudi (220 kV)
40.27 39. Rudi Khola B 6.6 40. Upper Syange
Udipur (220 kV)
2.4 41. Midim – 1 13.424 42. Middle Midim 3.1 43. Dordi – 1 Khola 12 44. Super Dordi 54 45. Dordi Khola 27 46. Upper Dordi – A 25 47. Marsyangdi Besi 50 48. Upper Midim 7.5 49. Hidi Khola 6.82
50. Richet Khola
New Marsyangdi (220 kV)
4.98
51. Upper Richet 2
52. Upper Daraudi B 8.3
53. Upper Daraudi C 9.82
54. Middle Super Daraudi 10
55. Istul Khola 1.506
Similarly, the transmission line coming under operation by 2025 AD in Zone – 3 is listed in Table 3. 15.
Table 3. 15 Transmission Projects in Zone – 3
S.N.
Transmission Project Voltage Level (kV)
Conductor Length (Km)
1. Dadakheti - Rahughat 220 Twin Bison 15 2. Rahughat - Dana 220 Twin Bison 20 3. Rahughat - Kusma 220 Twin Zebra 30 4. Upper modi - Kusma 132 Single Bison 6.5 5. Kusma - Aandhikhola 220 Twin Bison 76 6. Kusma - New Damauli 400 Quad Moose 69 7. Aandhikhola - Butwal 220 Twin Bison 76 8. Phulbari - Butwal 400 Quad Moose 229 9. New Damauli - Butwal 400 Quad Moose 75 10. New Damauli - Ratmate 400 Quad Moose 79 11. Lekhnath - Damauli 220 Single Moose 40 12. Upper Madi - Lekhnath 220 Single Moose 46 13. Khudi - New Damauli 220 Twin Moose 60 14. Manang - Khudi 220 Twin Zebra 27 15. Khudi - Udipur 220 Twin Bison 16 16. Udipur- New Marsyangdi 220 Twin Zebra 31

45
S.N.
Transmission Project Voltage Level (kV)
Conductor Length (Km)
17. Marsyangdi - Bharatpur 220 Twin Zebra 32 18. Butwal – Gorakhpur Cross
Border Transmission Line 400 Quad Moose 125
3.9.2.4 Modeling of Zone - 4
Zone – 4 includes includes province – 3 and some districts of Province – 2 as well.
The following planned projects are commissioned to the respective buses in
accordance with their commissioning date of PPA in ETAP 12.6.0 model of Zone – 4.
The projects, connected bus and respective capacity are presented in Table 3. 16.
Table 3. 16 Hydropower Projects and Buses in Zone – 4
S.N. Hydropower Projects Connected Bus Capacity (MW)
1. Ilep (Tatopani)
Trishuli 3B Hub (220 kV)
23.675 2. Bhotekoshi - 1 40 3. Sanjen 42.5 4. Middle Trishuli Ganga 19.41 5. Sanjen Khola 78 6. Upper Sanjen 14.8 7. Rasuwagadhi 111 8. Upper Mailung A 6.42 9. Super Ankhu Khola 23.5
10. Upper Ankhu 38 11. Rasuwa Bhotekoshi 120 12. Langtang Khola 20 13. Upper Trishuli – 3A 60 14. Upper Trishuli – 3B 37 15. Nyam Nyam Khola 6 16. Upper Trishuli 1 216 17. Upper Belkhu
Ratmate (220 kV)
0.996 18. Trishuli Galchi 75 19. Menchet Khola 7 20. Khani Khola – 1
Barhabise (400 kV)
40 21. Khare 24.1 22. Khani Khola (Dolakha) 30 23. Middle Bhotekoshi 102 24. Upper Nyasim 41.4 25. Balephi 23.52 26. Bhotekoshi – 5 62 27. Nyasim Khola 35 28. Brahamayani 35.47

46
S.N. Hydropower Projects Connected Bus Capacity (MW)
29. Upper Brahamayani 15.15 30. Upper Nyasim Khola –
A 21
31. Ksumti Khola
Barhabise (220 kV)
0.683 32. Lower Balephi 20 33. Gohore Khola 0.95 34. Ghatte Khola Small 0.97 35. Upper Chauri 6 36. Lower Selang 1.5 37. Liping Khola 16.26 38. Selang 0.99 39. Upper Chaku A 22.2 40. Yambaling Khola 7.27 41. Gelun 3.2 42. Chauri Khola 6 43. Upper Balephi A 36 44. Hadi Khola Sunkoshi A 0.997
45. Upper Lapche
Tamakoshi (220 kV)
52 46. Suri Khola 6.4 47. Ghatte Khola 5 48. Lower Khare 11 49. Upper Tamakoshi 456 50. Tinekhu Khola 0.99 51. Singati Khola 9 52. Lapche Khola 99.4 53. Upper Suri 7 54. Sagu Khola 20 55. Sagu Khola – 1 5.5 56. Sangu (Sorun) 5 57. Gumu Khola 0.95 58. Buku Kapati
Likhu (132 kV)
5 59. Junbesi Khola 5.2
60. Lower Likhu 28.1 61. Likhu - IV 52.4 62. Likhu Khola - A 24.2 63. Likhu - 1 51.4 64. Likhu - 2 33.4
Similarly, the transmission line coming under operation by 2025 AD in Zone – 4 is
listed in Table 3. 17.

47
Table 3. 17 Transmission Projects in Zone – 4
S.N.
Transmission Project Voltage Level (kV)
Conductor Length (Km)
1. Trishuli 3B – Ratmate 220 Twin Moose 24 2. LapsePhedi – Ratmate 400 Quad Moose 28 3. LapsePhedi – Bahrabise 400 Quad Moose 60 4. Bahrabise – New Khimti 400 Quad Moose 46 5. Bahrabise – Tamakoshi 220 Quad Moose 6.5 6. Tamakoshi – New Khimti 220 Twin Moose 46 7. Likhu – Khimti 132 Single Bison 31 8. Trishuli 3B – Matatirtha 220 Twin Moose 45 9. New Khimti – Dhalkebar 400 Quad Moose 60
3.9.2.5 Modeling of Zone - 5
Zone – 5 includes includes province – 1 and some districts of Province – 2 as well.
The following planned projects are commissioned to the respective buses in
accordance with their commissioning date of PPA in ETAP 12.6.0 model of Zone – 5.
The projects, connected bus and respective capacity are presented in Table 3. 18.
Table 3. 18 Hydropower Projects and Buses in Zone – 5
S.N. Hydropower Projects Connected Bus Capacity (MW)
1. Upper Rawa
Tingla (220 kV)
3 2. Rawa Khola 6.5 3. Solu Khola
(Dudhkoshi) 86
4. Lower Solu 82 5. Solu 23.5 6. Middle Solu Khola 9.5 7. Upper Solu 18 8. Sisa Khola A 2.8 9. Middle Hyongu Khola
B 22.9
10. Dudhkunda Khola 12 11. Middle Hyongu Khola
A 22
12. Luja Khola 23.55 13. Rauje Khola 17.712 14. Isuwa Khola Arun
(400 kV) 97.2
15. Kasuwa Khola 45 26. Lower Irkhuwa
13.04 17. Irkhuwa Khola B 15.524 18. Lower Chirkhawa 4.06

48
S.N. Hydropower Projects Connected Bus Capacity (MW)
19. Upper Chirkhawa Sitalpati (220 kV)
4.7 20. Sabha Khola B 15.1 21. Phedi Khola
(Thumlung) 3.52
22. Lankhuwa Khola 5 23. Upper Irkhuwa 14.5 24. Sabha Khola C Khadbari
(220 kV) 4.196
25. Super Sabha Khola 4.1 26. Upper Piluwa Khola - 3
Baneshwor (220 kV)
4.95 27. Upper Piluwa Hills 4.99 28. Super Hewa 5 29. Maya Khola 14.9 30. Down Piluwa 9.5 31. Upper Piluwa Khola - 2 4.72 32. Lower Khorunga
New Basantapur (220 kV)
5.4 33. Upper Khorunga 7.5 34. Khorunga Khola 4.8 35. Sapsup Khola 6.6 36. Taksar Pikhuwa 8
Similarly, the transmission line coming under operation by 2025 AD in Zone – 5 is listed in Table 3. 19.
Table 3. 19 Transmission Projects in Zone – 5
S.N.
Transmission Project Voltage Level (kV)
Conductor Length (Km)
1. Dhalkebar - Mirchaiya 400 Quad Moose 64 2. Mirchiya - Inaruwa 400 Quad Moose 64 3. Inaruwa - Damak 400 Quad Moose 80 4. Arun Hub - Sitalpati 220 Twin Bison 9 5. Sitalpati - Khadbari 220 Twin Bison 24 6. Khadbari - Baneshwor 220 Twin Moose 10 7. Baneshwor – New Basantapur 220 Twin Moose 21 8. New Basantapur - Inaruwa 220 Quad Moose 77 9. New Khimti - Dhalkebar 400 Quad Moose 60
3.9.2.6 Additional Buses, Projects and Lines in Current INPS
The current INPS described in section 3.9.2 has been added with some projects, buses
and also transmission lines from the date of 2018 AD to till date which includes
additional Phidim (Thapatar) – 132 kV bus and Amarpur (Panchthar) – 132 kV buses.
The transmission line incterconnecting these two buses is about 13.33 km with single

49
bear consductor in double circuit configuration. The Phidim (Thapatar) bus is
connected to the 132 kV Ilam (Godak) bus through 43 km double circuit transmission
line with single Bear conductor. Similarly, Bafikot Hub – 400 kV is added in INPS
which is connected from Phulbari – 400 kV bus through 85 km quad moose double
circuit transmission line and Rukumgad Hydrpower project of capacity 5 MW is
connected to this Bafikot Hub. The following additional planned projects are
commissioned to the respective buses in accordance with their commissioning date of
PPA in ETAP 12.6.0 model of new INPS. The projects, connected bus, respective
capacity and commissioning date of peroject are presented in Table 3. 20. The overall
diagram of planned INPS with maximum import cross – border transmission line is
presented in Appendix – L.
Table 3. 20 Additional Hydropower Projects and Buses in new INPS
S.N. Hydropower Projects Connected Bus Capacity (MW)
1. Palun Khola
Amarpur (Panchthar) (132 kV)
21 2. Sona Khola 9 3. Upper Phawa 5.8 4. Mewa 50 5. Middle Tamor 73 6. Kabeli B1 25 7. Super Kabeli - A 13.5 8. Iwa Khola 9.9 9. Super Kabeli 12
10. Tamor Khola - 5 37.52 11. Kabeli 3 21.93 12. Kabeli B1 Cascade 9.94 13. Mewa Khola 23 14. Kabeli - A 37.6 15. Middle Mewa 49 16. Upper Hewa Khola
Small
Phidim (Thapatar) (132 kV)
8.5
17. Upper Hewa 14.9 18. Hewa Khola A 5 19. Lower Hewa 21.6 26. Teliya Khola
Ilam (Godak) (132 kV)
0.996 17. Jogmai Cascade 6 18. Lower Jogmai 6.2 19. Super Mai Cascade 3.8 20. Puwa - 2 4.96 21. Mai Beni 9.51 22. Super Mai - A 9.6

50
3.9.3 Scenarios of Imports and Exports in Load Flow Simulation
There will be saturation of commissioning of generation projects according to current
PPA concluded date after Baisakh, 2084 BS in “Shift IPP and NEA Plants” generation
scenario. The load flow simulation has been performed after this saturation i.e. in
fiscal year 084/85 to accommodate all the PPA finalized hydro projects till date.
There will be around 6236 MW of installed capacity in the INPS by that time.
However, monthly installed capacity will be different in each month as per monthly
plant capacity factor. While analyzing the surplus deficit expected energy in fiscal
year 084/85, in this scenario of generation, there will be maximum export in the
month of Ashoj in Normal expected energy consumption scenario.Similarly, there
will be necessary of maximum import in Falgun under Combined Intervention of
Induction Chulo and Electric Vehicle scenario of expected energy consumption.These
two scenarios have been simulated as these include maximum export and maximum
import condition. Three more scenarios viz. Growth with Categorization of
consumption – Falgun (Import), Intervention with Induction Chulo – Falgun (Import)
and Intervention with Electric Vehicle – Ashoj (Export) have also been simulated to
analyze the INPS for intermediate import and exports.
The total generations from the all installed projects in the month of Ashoj and Falgun
in accordance with calculated plant capacity factor will result into 5622.8 MW and
2427 MW respectively. The monthly expected energy consumption in each scenario is
converted into respective monthly peak demand assuming constant load factor for
planed ten years and using those load factors calculated in section 3.9.1 with the help
of Equation 3.12. The the difference between expected generation capacity and
monthly peak demand is calculated as peak import and export demand which will
occur at some point in that particular month. The load flow has been carried out then
with distribution of this corresponding peak demand all over the INPS and also the
capacitor banks (if necessary) as presented in Appendix - L and generator in voltage
control mode for following five scenarios in fiscal year 084/85 which are summarized
as follows.
1. Scenario – I: Maximum Export (Normal Energy Consumption – Ashoj)
Expected Monthly Energy Consumption: 1280003.2 MWh
Monthly Load Factor for Ashoj: 0.7777
Corresponding Monthly Peak Demand: 2285.94 MW

51
Expected Generation Capacity: 5622.8 MW
However, incase of maximum export with available surplus energy, the necessity
of running storage projects Kulekhani – I, Kulekhani – II and Kulekhani – III is
avoided.
2. Scenario – II: Maximum Import (Combined Intervention with Induction
Chulo and Electric Vehicle – Falgun)
Expected Monthly Energy Consumption: 3084460.54 MWh
Monthly Load Factor for Falgun: 0.6977
Corresponding Monthly Peak Demand: 6139.39 MW
Expected Generation Capacity: 2427 MW
3. Scenario – III: Intermediate Import (Growth with Categorization of
Consumption – Falgun)
Expected Monthly Energy Consumption: 2394500.2
Monthly Load Factor for Falgun: 0.6977
Corresponding Monthly Peak Demand: 4766.08 MW
Expected Generation Capacity: 2427 MW
4. Scenario – IV: Intermediate Import (Intervention with Induction Chulo –
Falgun)
Expected Monthly Energy Consumption: 2915523.882 MWh
Monthly Load Factor for Falgun: 0.6977
Corresponding Monthly Peak Demand: 5803.14 MW
Expected Generation Capacity: 2427 MW
5. Scenario – V: Intermediate Export (Intervention with Electric Vehicle –
Ashoj)
Expected Monthly Energy Consumption: 2791364.118 MWh
Monthly Load Factor for Falgun: 0.7777
Corresponding Monthly Peak Demand: 4985.07 MW
Expected Generation Capacity: 5622.8 MW

52
However, incase of maximum export with available surplus energy, the necessity
of running storage projects Kulekhani – I, Kulekhani – II and Kulekhani – III is
avoided.
Furthermore, load flow simulation has also been carried out for growth with
categorization of consumption incorporating sectoral energy consumption growth
rate as 1.5 times the sectoral GDP growth as forecasted by JICA for the months of
Ashoj for fiscal year 084/85 to study the comparison with different expected
energy consumption aspects adopted in this study as well.

53
CHAPTER 4: RESULTS AND DISCUSSIONS
4.1 Weightage Average Monthly Plant Capacity Factor (WAMPCF) for Groups
of Projects
The weightage average monthly plant capacity factor for NEA operated ROR projects
for all twelve months of year are calculated by taking into consideration of average
monthly plant capacity factors of ten projects of total capacity of 398.05 MW. The
WAMPCF for such NEA operated ROR projects has been found highest for the
month of Ashad with the value of 0.827334. Similarly, the lowest value has been
found for the month of Falgun with the value of 0.396320. The WAMPCF for this
group has been found more than 0.8 for the month of Jestha, Ashad, Bhadra and
Ashoj. The NEA operated ROR projects are characterized with less than 0.4
WAMPCF for the months of Magh and Falgun. The estimated WAMPCF for this
NEA operated ROR hydropower projects are presented in Appendix – G and
graphical representation of those obtained weightage average monthly plant capacity
factor is presented in Figure 4. 1.
Figure 4. 1 Weightage Average Monthly Plant Capacity Factor of NEA Operated ROR Projects
The storage hydropower projects of Nepal are Kulekhani (I) and Kulekhani (II) of
capacities 60 MW and 32 MW respectively. The monthly plant capacity factors of
these two storage hydropower projects of past ten years are taken into consideration
and average monthly plant capacity factor of individual projects is calculated.
0
0.1
0.2
0.3
0.4
0.5
0.6
0.7
0.8
0.9
Pla
nt C
apac
ity F
acto
r
Month

54
However, for any storage hydropower projects which are going to be commissioned
in coming ten years, the expected generation needs most reliable monthly plant
capacity factor. This is calculated by taking weightage average of both average plant
capacity factors of these two projects of total capacity 92 MW for each month of the
year. The highest WAMPCF calculated is found to be 0.358007 in the month of
Falgun and second highest value is found to be 0.355152 in the month of Chaitra. The
six months period from Poush to Jestha are characterized with WAMPCF greater than
0.15 and less than 0.36. The lowest WAMPCF is found to be in the month of Bhadra
and is about 0.056801. The estimated WAMPCF values are shown in Appendix – G
and the graphical representation of those weightage average monthly plant capacity
factor is presented in Figure 4. 2.
Figure 4. 2 Weightage Average Monthly Plant Capacity Factor of Storage Projects
Furthermore, almost all of the projects coming in future are of IPP operated ROR
types, the calculation of monthly expected generation needs most reliable monthly
plant capacity factor. This is calculated by taking weightage average, for total
capacity of 276.91 MW, of all average monthly plant capacity factor of such projects
operated by IPP for each month of the year. The WAMPCF for these IPP operated
ROR projects is found be highest for the month of Ashoj with value of 0.92367 and
lowest for the month of Falgunn 0.39053. This group of projects are characterized
with WAMPCF greater than 0.85 for five months viz. Ashad, Shrawan, Bhadra, Ashoj
and Kartik and found to be around 0.7 for months of Jestha and Mangshir. The
estimated values are shown in Appendix – G and the graphical representation of those
weightage average monthly plant capacity factor is presented Figure 4. 3.
0
0.05
0.1
0.15
0.2
0.25
0.3
0.35
0.4
Pla
nt C
apac
ity F
acto
r
Month

55
Figure 4. 3 Weightage Average Monthly Plant Capacity Factor of IPP Operated ROR Projects
4.2 Monthly Expected Energy Generation & Verification Results
4.2.1 Monthly Expected Energy Generation
The results from these estimations will be total expected energy generations from
presently installed projects in our INPS which is presented in Table 4. 1.
Table 4. 1 Expected Monthly Enegy Genrations from Installed Projects (in MWh)
Month/Projects
Expected Monthly Energy Generations from NEA
operated installed Projects
Expected Monthly Energy Generations from IPP
operated Installed Projects
Shrawan 259854.1515 394284.5828 Bhadra 265806.0716 391958.5918 Ashoj 271637.0346 412056.7272 Kartik 258327.7961 392014.5682
Mangshir 218454.5878 313806.4742 Poush 179761.8481 238078.4809 Magh 144917.4779 186487.2929 Falgun 149978.7515 173131.1313 Chaitra 177291.3301 181759.073 Baisakh 219620.2194 218551.6881 Jestha 275554.8964 310910.2499 Ashad 277187.7483 389211.7537
These generations are base monthly values for FY 077/78 and after then the expected
generations according to commissioning date of the PPA concluded projects as
00.10.20.30.40.50.60.70.80.9
1
Pla
nt C
apac
ity F
acto
r
Month

56
illustrated in section 3.2.2 are calculated and added with these values to calculate total
expected generations in each month of FY 077/78. The extra additional expected
energy generations due to commissioning of PPA concluded project according to their
date of commissioning and total expected energy generations for FY 077/78 are
presented in Table 4. 2. The calculations of expected energy generations for coming
ten years in Normal scenario including FY 077/78 are presented in Appendix – I.
There will be no addition of PPA concluded hydropower projects from year of FY
083/84 and the expected energy generations is considered same for next three years.
Table 4. 2 Monthly Expected Energy Generations in Fiscal year 2077/78 (in MWh)
Month/Projects
Additional Expected Monthly Energy Generations from PPA concluded
Projects Total Expected
Generations
Shrawan 658499.0547 1312637.789 Bhadra 722381.6598 1380146.323 Ashoj 840653.8795 1524347.641 Kartik 845423.9858 1495766.35
Mangshir 681721.9721 1213983.034 Poush 520567.4835 938407.8125 Magh 422670.7632 754075.534 Falgun 392952.1222 716062.005 Chaitra 442948.046 801998.4491 Baisakh 541710.2665 979882.174 Jestha 759587.7458 1346052.892 Ashad 1108705.125 1775104.627
Furthermore, the estimation of expected energy generations are also carried out for
remaining two scenarios viz. Shift IPP Plants & Shift IPP and NEA Plants in similar
manner. These generations are listed in Appendix – J in which the monthly
generations for coming Fiscal years are estimated for both the cases. There will be no
addition of PPA concluded projects from FY 084/85 in both cases. So, the expected
energy generations are considered same for next two years onwards from FY 084/85
for the purpose of performing the surplus deficit analysis.

57
4.2.2 Verification Results
Thus Percentage Variation in Monthly Import (PVMI) obtained for each month of
year 2076 are presented in Table 4. 3. The calculation of absolute PVMI is attached in
Appendix – K.
Table 4. 3 PVMI Values in Each Month of Year 2076 for Verification
Month of Year 2076 Percentage Variation in Monthly Import (PVMI)
Baisakh 0.76 Jestha 8.53 Ashad 13.86
Shrawan 14.89 Bhadra 8.42 Ashoj 6.62 Kartik 13.60
Mangshir 13.53 Poush 8.04 Magh 0.34 Falgun 6.71 Chaitra 12.98
4.3 Analysis Approach
The basis for analysis is formed with three scenarios in generation aspects; Normal,
Shift IPP Plants & Shift NEA and IPP Plants and five scenarios in demand
consumption aspects; Normal, Growth with Categorization of Consumption,
Intervention with Induction Chulo, Intervention with Electric Vehicle & Combined
Intervention of Induction Chulo and Electric Vehicle. For each of the demand
consumption scenario, the expected surplus deficit energy (MWh) are estimated for
three scenarios of generation aspects for coming ten years and the prospects of
energy banking from Nepalese perspective is analyzed with corresponding S/D –
ratio and the time period of those expected surplus or deficit of energy over a year.
The estimation of those figures are presented in Appendix –M on monthly basis for
each fiscal year of coming ten years. The surplus – deficit energy results and
discussions for fiscal years 077/78, 078/79, 083/84, 084/85 and 086/87 are presented
as follows. Furthermore, load flow simulation results of five scenarios are analyzed to
study the status of INPS for fiscal year 084/85 for Shift NEA & IPP Plants scenario.

58
-600000
-400000
-200000
0
200000
400000
600000
800000
1000000
EX
PE
CT
ED
SU
RP
LU
S/D
EFI
CIT
E
NE
RG
Y(M
Whr
)
MONTHS OF FISCAL YEAR 077/78
Normal With IPP Shift With NEA and IPP Shift
4.4 Monthly Surplus Deficit Energy Results for Fiscal Year 077/78
4.4.1 Normal Energy Consumption Scenario in Different Generation Scenarios
The expected demand growth in normal scenario has been analyzed with three
scenarios of expected generations of energy in fiscal year 077/78 which is shown in
Figure 4. 4. When the generation occurs in Normal scenario, there will be surplus
energy available in all months of the year resulting into about 5100.887 GWh surplus
energy. If generation occurs in Shift IPP Plants scenario, there will be only surplus
energy in the month of Ashoj (Mid September – Mid October) and Kartik (Mid
October – Mid November) and remaining ten months will experience deficit of energy
of about 2011.824 GWh. In this scenario, the surplus energy available during two
months will be only about 2% of the total deficit experienced throughout the year.
When the generation occurs in Shift NEA and IPP plants scenario, there will be all
deficit of about 2704.234 GWh energy throughout the year.
Figure 4. 4 Monthly Surplus – Deficit Energy in Normal Expected Energy
Consumption Scenario for Fiscal Year 077/78
4.4.2 Growth with Categorization of Consumption Scenario in Different
Generation Scenarios
When the consumption is considered in the scenario of growth with categorization of
consumption, there will be deficit of energy about 100.6 GWh in three months viz.
Magh, Falgun and Chaitra. The surplus energy in remaining nine months will be
36.51 times as that of deficit as S/D – Ratio of 36.51 is obtained for this case. When
S/D - Ratio = ∞ 0.02 0

59
the PPA concluded generations projects coming from IPP side are introduced with
delay of a year, there will be deficit of energy in each month of year resulting into
total deficit of 3498.286 GWh in fiscal year of 077/78. When this demand
consumption scenario is analyzed for third scenario of generation aspect i.e. further
three years of delay in PPA concluded generations projects coming from NEA side,
there will be deficit in all months of year and this will result into increase of about
733.679 GWh deficit in comparison to Shift IPP Plants scenario. The result is shown
in Figure 4. 5.
Figure 4. 5 Monthly Surplus – Deficit Energy in Growth with Categorization of
Consumption Scenario for Fiscal Year 077/78
4.4.3 Intervention with Induction Chulo in Different Generation Scenarios
The expected deficit of energy increases by a month i.e. Magh, Falgun, Chaitra and
Baisakh when intervention of induction chulo is implemented in consumption side in
Normal scenario of generation and S/D – Ratio observed in this scenario is 9.12. If
this intervention is implemented with a year delay in commissioning date of projects
constructed by IPPs, there will be deficit of energy in all months of year which
constitutes for almost 4289.822 GWh energy. In addition, if further delay of three
years commissioning date of projects constructed by NEA is introduced, this deficit
will increase up to 5013.5 GWh in fiscal year 077/78.
-600000
-400000
-200000
0
200000
400000
600000
800000
EX
PE
CT
ED
SU
RP
LU
S/D
EF
ICIT
E
NE
RG
Y (
MW
hr)
MONTHS OF FISCAL YEAR 077/78
Normal With IPP Shift With NEA and IPP ShiftS/D - Ratio = 36.51 0 0

60
Figure 4. 6 Monthly Surplus – Deficit Energy in Intervention of Induction Chulo
Scenario for Fiscal Year 077/78
There will be extra addition of 781.5 GWh energy in comparison to growth with
categorized consumption in Shift IPP plants scenario and Shift NEA & IPP Plants
scenario due to Induction Chulo intervention. The estimated figures are presented in
Figure 4. 6.
4.4.4 Intervention with Electric Vehicle in Different Generation Scenarios
The intervention Electric Vehicle causes a little bit lower deficit of energy than that of
intervention with Induction Chulo i.e. 1107.42 GWh in the months of Magh, Falgun
and Chaitra and the remaining nine months will have surplus energy with S/D – Ratio
of 32.96 in Normal scenario of generation. When the commissioning date of
upcoming IPP projects are introduced with a delay of a year, the S/D – Ratio turns to
zero and there will be total deficit of around 3531.229 GWh energy over year.
Similarly, if further delay of three years in upcoming NEA projects is introduced, the
deficit further rises by 733.678 GWh in fiscal year 077/78 and there will be deficit of
energy in each month of the whole year. The pictorial illustration of the estimated
figures is presented in Figure 4. 7.
-800000
-600000
-400000
-200000
0
200000
400000
600000
800000
EX
PE
CT
ED
SU
RP
LU
S/D
EFI
CIE
T
EN
ER
GY
(M
Whr
)
MONTHS OF FISCAL YEAR 077/78
Normal With IPP Shift With NEA and IPP ShiftS/D - Ratio = 9.12 0 0

61
Figure 4. 7 Monthly Surplus – Deficit Energy in Intervention of Electric Vehicle
Scenario for Fiscal Year 077/78
4.4.5 Combined Intervention of Induction Chulo and Electric Vehicle in
Different Generation Scenarios
The combined intervention results into the deficit of energy for four months viz.
Magh, Falgun, Chaitra and Baisakh which sums up to give total deficit of energy
around 357.847 GWh with S/D – Ratio of 8.7. If this combined intervention is
analyzed with Shift IPP Plants scenario, there will be all around deficit of energy of
about 4312.764 GWh over year.
Figure 4. 8 Monthly Surplus – Deficit Energy in Combined Intervention ofInduction
Chulo & Electric Vehicle Scenario for Fiscal Year 077/78
-600000
-400000
-200000
0
200000
400000
600000
800000
EX
PE
CT
ED
SU
RP
LU
S/D
EF
ICIT
E
NE
RG
Y (
MW
hr)
MONTHS OF FISCAL YEAR 077/78
Normal With IPP Shift With NEA and IPP Shift
-800000
-600000
-400000
-200000
0
200000
400000
600000
800000
EX
PE
CT
ED
SU
RP
LU
S/D
EF
ICIT
E
NE
RG
Y (
MW
hr)
MONTHS OF FISCAL YEAR 077/78
Normal With IPP Shift With NEA and IPP Shift
S/D - Ratio = 32.96 0 0
S/D - Ratio = 8.7 0 0

62
The deficit will rise to 5046.443 GWh when there is insertion of three years delay in
the commissioning date of upcoming NEA projects. The illustrations are shown in
Figure 4. 8.
4.5 Monthly Surplus Deficit Energy Results for Fiscal Year 078/79
4.5.1 Normal Energy Consumption Scenario in Different Generation Scenarios
There will be surplus energy in all months for all the scenarios of generation aspects
as S/D – Ratio for each case is infinite. There will be about 11619.385 GWh,
7891.547 GWh and 6248.568 GWh surplus energy in Normal, Shift IPP Plants and
Shift NEA & IPP Plants scenario respectively when consumption side is considered
with 8% p.a. increase in total monthly base load scenario i.e. Normal scenario of
expected energy consumption. The estimated values are shown in histogram in Figure
4. 9
Figure 4. 9 Monthly Surplus – Deficit Energy in Normal Expected Energy
Consumption Scenario for Fiscal Year 078/79
4.5.2 Growth with Categorization of Consumption Scenario in Different
Generation Scenarios
When the expected energy consumption is assumed to follow growth of last year in
category wise manner, then there will be surplus energy available in each month of
the year in Normal scenario of generation aspects. The surplus energy throughout the
year will be about 9027.012 GWh.
0200000400000600000800000
10000001200000140000016000001800000
Ene
rgy
(MW
hr)
MONTHS OF FISCAL YEAR 078/79
Normal With IPP Shift With NEA and IPP ShiftS/D - Ratio = ∞ ∞ ∞

63
Figure 4. 10 Monthly Surplus – Deficit Energy in Growth with Categorization of
Consumption Scenario for Fiscal Year 078/79
If it is analyzed in the case of shifting all upcoming IPP plants with a delay of year,
then there will be deficit of energy in the month of Falgun of about 36.515 GWh
energy with S/D – Ratio of 146.12. When this consumption scenario is considered in
combination with Shift NEA and IPP Plants scenario, the deficit will rise to four
months of the year viz. Magh, Falgun, Chaitra and Baisakh resulting into total deficit
of 208.17 GWh throughout the year with S/D – Ratio of 18.56. The estimated figures
are shown in the histogram in Figure 4. 10.
Figure 4. 11 Monthly Surplus – Deficit Energy in Intervention of Induction Chulo
Scenario for Fiscal Year 078/79
-200000
0
200000
400000
600000
800000
1000000
1200000
1400000
Ene
rgy
(MW
hr)
MONTHS OF FISCAL YEAR 078/79
Normal With IPP Shift With NEA and IPP Shift
-400000
-200000
0
200000
400000
600000
800000
1000000
1200000
1400000
Ene
rgy(
MW
hr)
MONTHS OF FISCAL YEAR 078/79
Normal With IPP Shift With NEA and IPP Shift
S/D - Ratio = ∞ 146.12 18.56
S/D - Ratio = ∞ 11.2 3.68

64
4.5.3 Intervention with Induction Chulo in Different Generation Scenarios
There will be no deficit of energy even if the intervention of induction chulo is
implemented policy wise in the case of Normal scenario commissioning of generating
projects. The country will still have a surplus of about 7463.941 GWh energy
throughout the year. However, if projects coming under IPP are delayed with a year
from their commissioning date, the country will face deficit of energy for four months
in Magh, Falgun, Chaitra and Baisakh and this deficit will be of about 366 GWh with
S/D – Ratio of 11.2. With introduction of three years delay in projects coming under
NEA or its sister organization, there will be additional deficit in the month of poush as
well and the deficit energy will rise to 780.36 GWh with S/D – Ratio of 3.68. The
estimated figures are represented in the histogram in Figure 4. 11.
4.5.4 Intervention with Electric Vehicle in Different Generation Scenarios
The intervention of Electric Vehicle taken for analysis consumes less energy than
intervention of Induction Chulo. When this policy is intervened at Normal expected
energy consumption scenario, there will be surplus in each month throughout the year
and it is of about 8900 GWh. For one year delayed commissioning of PPA concluded
IPP projects, there will be deficit of about 48.34 GWh energy in the month of Falgun
with high value of S/D – Ratio of 108.
Figure 4. 12 Monthly Surplus – Deficit Energy in Intervention of Electric Vehicle
Scenario for Fiscal Year 078/79
-200000
0
200000
400000
600000
800000
1000000
1200000
1400000
Ene
rgy
(MW
hr)
MONTHS OF FISCAL YEAR 078/79
Normal With IPP Shift With NEA and IPP ShiftS/D - Ratio = ∞ 108 14.72

65
Furthermore, for Shift NEA and IPP Plants scenario of generation, the deficit will rise
up to total value of 257.16 GWh and occurs for months of Magh, Falgun, Chaitra and
Baisakh. However, the S/D – Ratio is in higher side with the value of 14.72 for this
year in this scenario. The estimation are presented in histogram in Figure 4. 12.
4.5.5 Combined Intervention of Induction Chulo and Electric Vehicle in
Different Generation Scenarios
The combined intervention of Induction Chulo and Electric Vehicle will result into
drop of surplus energy to 7337.23 GWh and still there will be surplus in each month
of the year. In Shift IPP Plants scenario of generation, the country will face total
deficit of about 415.04 GWh in the months of Magh, Falgun, Chaitra and Baisakh
with S/D – Ratio of 9.69. This ratio will drop to 3.34 when further three years delay in
commissioning of projects under NEA or its sister organizations is considered and the
deficit lasts for five month with additional deficit in the month of Poush. There will
still be 2805.91 GWh surplus over the year in remaining seven months. The estimated
values are shown in the histogram in Figure 4. 13.
Figure 4. 13 Monthly Surplus – Deficit Energy in Combined Intervention ofInduction
Chulo & Electric Vehicle Scenario for Fiscal Year 078/79
-400000
-200000
0
200000
400000
600000
800000
1000000
1200000
1400000
Ene
rgy
(MW
hr)
MONTHS OF FISCAL YEAR 078/79
Normal With IPP Shift With NEA and IPP ShiftS/D - Ratio = ∞ 9.69 3.34

66
4.6 Monthly Surplus Deficit Energy Results for Fiscal Year 083/84
4.6.1 Normal Energy Consumption Scenario in Different Generation Scenarios
There will be surplus energy in all months for all the scenarios of generation aspects
as S/D – Ratio for each case is infinite. There will be total surplus energy of
about21952.966 GWh, 21967.146 GWh and 21360.37 GWh in Normal, Shift IPP
Plants and Shift NEA & IPP Plants respectively. The calculated values are shown
diagrammatically in Figure 4. 14.
Figure 4. 14 Monthly Surplus – Deficit Energy in Normal Expected Energy
Consumption Scenario for Fiscal Year 083/84
4.6.2 Growth with Categorization of Consumption Scenario in Different
Generation Scenarios
When the expected energy consumption is considered in constant rise of category
wise consumption at the rate of last year’s growth, there will be deficit of energy for
months of Magh, Falgun, Chaitra and Baisakh for all three scenarios of generation
aspects.
0
500000
1000000
1500000
2000000
2500000
3000000
3500000
Ene
rgy
(MW
hr)
MONTHS OF FISCAL YEAR 083/84
Normal With IPP Shift With NEA and IPP Shift
S/D - Ratio = ∞ ∞ ∞

67
Figure 4. 15 Monthly Surplus – Deficit Energy in Growth with Categorization of
Consumption Scenario for Fiscal Year 083/84
The total deficit for these time periods are 670.334 GWh, 647.556 GWh and 771.814
GWh for Normal, Shift IPP Plants and Shift NEA & IPP Plants scenarios
respectively. The corresponding S/D – Ratio values are 14.36, 14.85 and 11.84
respectively for those three scenarios of generation aspects. The estimated expected
surplus and deficit of energy are represented diagrammatically in Figure 4. 15.
4.6.3 Intervention with Induction Chulo in Different Generation Scenarios
When policy intervention of induction chulo is imposed in the consumption side,
there will be deficit of energy in five months viz. Poush, Magh, Falgun, Chaitra and
Baisakh and remaining months are characterized with surplus energy. There will be
2723.529 GWh, 2698.215 GWh and 2876.371 GWh deficit in these five months
period in Normal, Shift IPP Plants and Shift NEA & IPP Plants scenarios of
generation aspects respectively. However, the surplus energy available in remaining
seven months will be more than these respective deficits as S/D – Ratio of 2.28, 2.29
and 2 are recorded for these scenarios respectively. The calculated values are
represented diagrammatically in Figure 4. 16.
-500000
0
500000
1000000
1500000
2000000
Ene
rgy
(MW
hr)
MONTHS OF FISCAL YEAR 083/84
Normal With IPP Shift With NEA and IPP Shift
S/D - Ratio = 14.36 14.85 11.84

68
Figure 4. 16 Monthly Surplus – Deficit Energy in Intervention of Induction Chulo
Scenario for Fiscal Year 083/84
4.6.4 Intervention with Electric Vehicle in Different Generation Scenarios
When policy intervention of Electric Vehicle is imposed in the consumption side,
there will be deficit of energy in four months viz. Magh, Falgun, Chaitra and Baisakh
and remaining months are characterized with surplus energy. There will be 1196.572
Figure 4. 17 Monthly Surplus – Deficit Energy in Intervention of Electric Vehicle
Scenario for Fiscal Year 083/84
GWh, 1173.794 GWh and 1298 GWh deficit in these four months period in Normal,
Shift IPP Plants and Shift NEA & IPP Plants scenarios of generation aspects
-1000000
-500000
0
500000
1000000
1500000
2000000
Ene
rgy
(MW
hr)
MONTHS OF FISCAL YEAR 083/84
Normal With IPP Shift With NEA and IPP Shift
-1000000
-500000
0
500000
1000000
1500000
2000000
Ene
rgy
(MW
hr)
MONTHS OF FISCAL YEAR 083/84
Normal With IPP Shift With NEA and IPP Shift
S/D - Ratio = 2.28 2..29 2
S/D - Ratio = 7.22 7.36 6.28

69
respectively. However, the surplus energy available in remaining seven months will
be more than these respective deficits as S/D – Ratio of 7.22, 7.36 and 6.28 are
recorded for these scenarios respectively. The calculated values are shown in Figure
4. 17.
Figure 4. 18 Monthly Surplus – Deficit Energy in Combined Intervention ofInduction
Chulo & Electric Vehicle Scenario for Fiscal Year 083/84
4.6.5 Combined Intervention of Induction Chulo and Electric Vehicle in
Different Generation Scenarios
When the combined intervention Induction Chulo and Electric Vehicle is imposed in
the consumption side, the months with surplus and deficit energy are divided into
equal halves of year. There will be surplus energy in each generation scenario in
months of Ashad, Shrawan, Bhadra, Ashoj and Kartik. Similarly, remaining six
months will experience deficit of energy in all scenarios. There will be total deficits of
3461.895 GWh, 3428 GWh and 3606.176 GWh in Normal, Shift IPP Plants and Shift
NEA & IPP Plants scenarios respectively. Similarly, the total respective surplus
energy available in the remaining six months will be 5444.189 GWh, 5424.495 GWh
and 4995.874 GWh. The estimated values for this combined intervention are shown in
the histogram in Figure 4. 18.
-1000000
-500000
0
500000
1000000
1500000E
nerg
y (M
Whr
)
MONTHS OF FISCAL YEAR 083/84
Normal With IPP Shift With NEA and IPP Shift
S/D - Ratio = 1.57 1.58 1.38

70
4.7 Monthly Surplus Deficit Energy Results for Fiscal Year 084/85
4.7.1 Normal Energy Consumption Scenario in Different Generation Scenarios
There will be surplus energy in all months for all the scenarios of generation aspects
as S/D – Ratio for each case is infinite. There will be total surplus energy of about
20792.95 GWh in Normal scenario of generation aspects.
Figure 4. 19 Monthly Surplus – Deficit Energy in Normal Expected Energy
Consumption Scenario for Fiscal Year 084/85
The total surplus energy for Shift IPP Plants and Shift NEA & IPP Plants scenario
will be equal and will have value equal to 20835.76 GWh. The calculated expected
surplus energy values are shown in Figure 4. 19.
4.7.2 Growth with Categorization of Consumption Scenario in Different
Generation Scenarios
When the consumption is taken as growth with categorization of consumption
scenario, there will be deficit of energy in five months viz. Poush, Magh, Falgun,
Chaitra and Baisakh in all scenarios of generation aspects. There will be deficit of
2325.33 GWh energy in Normal scenario of generation aspects with S/D – Ratio of
2.79. The total deficit energy will be equal in remaining two scenarios of generation
aspects i.e. Shift IPP Plants and Shift NEA & IPP Plants. This total deficit energy will
be around 2300 GWh with S/D – Ratio of 2.82. There will still be total surplus energy
in seven months greater than that of total deficit energy in five months for each of the
0
500000
1000000
1500000
2000000
2500000
3000000
Ene
rgy
(MW
hr)
MONTHS OF FISCAL YEAR 084/85
Normal With IPP Shift With NEA and IPP Shift
S/D - Ratio = ∞ ∞ ∞

71
generation scenario. The estimated surplus and deficit of energy are shown in Figure
4. 20.
Figure 4. 20 Monthly Surplus – Deficit Energy in Growth with Categorization of
Consumption Scenario for Fiscal Year 084/85
4.7.3 Intervention with Induction Chulo in Different Generation Scenarios
There will be deficit of energy in six months viz. Poush, Magh, Falgun, Chaitra,
Baisakh and Jestha and surplus of energy in remaining six months of year. For the
first time, the total deficit of energy will exceed total surplus energy throughout year
Figure 4. 21 Monthly Surplus – Deficit Energy in Intervention of Induction Chulo
Scenario for Fiscal Year 084/85
-1000000
-500000
0
500000
1000000
1500000
2000000
Ene
rgy
(MW
hr)
MONTHS OF FISCAL YEAR 084/85
Normal With IPP Shift With NEA and IPP Shift
-1500000
-1000000
-500000
0
500000
1000000
1500000
Ene
rgy
(MW
hr)
MONTHS OF FISCAL YEAR 084/85
Normal With IPP Shift With NEA and IPP Shift
S/D - Ratio = 2.79 2.82 2.82
S/D - Ratio = 0.614 0.619 0.619

72
resulting into S/D – Ratio of value between zero and unity. The total deficit and
surplus energy for Normal scenario of generation aspects will be 5419.725 GWh and
3329.814 GWh respectively resulting into S/D – Ratio of 0.614. The total surplus and
deficit energy for Shift IPP Plants and Shift NEA & IPP Plants scenarios will be equal
and will have values of 3338.754 GWh 5385.851 GWh respectively. The S/D – Ratio
for these two scenarios will be around 0.619. The calculated values are shown in
Figure 4. 21.
4.7.4 Intervention with Electric Vehicle in Different Generation Scenarios
There will be greater total surplus energy in six months of the year than total deficit
energy in remaining six months viz. Poush, Magh, Falgun, Chaitra, Baisakh and
Jestha when policy of Electric Vehicle is implemented. There will be surplus energy
and deficit energy of around 5513.29 GWh and 3317.34 GWh respectively when all
the upcoming generating projects get commissioned in their ideal required
commercial operation date. When there is delay of one year in commissioning date of
projects coming under IPP, the total surplus energy and total deficit energy will be
around 5522.23 GWh and 3283.46 GWh respectively. If we introduce further delay of
three years in commissioning date of projects coming under NEA or its sister
organization, the total surplus energy, total deficit of energy and S/D – Ratio will not
change. The estimated values are represented diagrammatically in Figure 4. 22.
Figure 4. 22 Monthly Surplus – Deficit Energy in Intervention of Electric Vehicle
Scenario for Fiscal Year 084/85
-1000000
-500000
0
500000
1000000
1500000
Ene
rgy
(MW
hr)
MONTHS OF FISCAL YEAR 084/85
Normal With IPP Shift With NEA and IPP Shift
S/D - Ratio = 7.22 7.36 6.28

73
4.7.5 Combined Intervention of Induction Chulo and Electric Vehicle in
Different Generation Scenarios
When the combined intervention Induction Chulo and Electric Vehicle is imposed in
the consumption side, the months with surplus and deficit energy are divided into
equal halves of year. The total deficit energy resulting form deficit of energy in the
months of Poush, Magh, Falgun, Chaitra, Baisakh and Jestha will be greater than total
surplus energy available in the remaining six months.
Figure 4. 23 Monthly Surplus – Deficit Energy in Combined Intervention ofInduction
Chulo & Electric Vehicle Scenario for Fiscal Year 084/85
The total surplus energy will be around 37% of total deficit energy for each scenario
of generation aspects. There will be total surplus energy of 2387.14 GWh with S/D –
Ratio of 0.37 for Normal scenario of generation aspects. The surplus and deficit
energy will be equal for remaining two scenarios of generation aspects which will be
about 2396 GWh with S/D – Ratio of 0.373. The estimated values are shown in
Figure 4. 23.
-1500000
-1000000
-500000
0
500000
1000000
Ene
rgy
(MW
hr)
MONTHS OF FISCAL YEAR 084/85
Normal With IPP Shift With NEA and IPP Shift
S/D - Ratio = 0.370 0.373 0.373

74
4.8 Monthly Surplus Deficit Energy Results for Fiscal Year 086/87
4.8.1 Normal Energy Consumption Scenario in Different Generation Scenarios
Figure 4. 24 Monthly Surplus – Deficit Energy in Normal Expected Energy
Consumption Scenario for Fiscal Year 086/87
There will be surplus energy in all months for all the scenarios of generation aspects
as S/D – Ratio for each case is infinite. There will be total surplus energy of about
18187 GWh in Normal scenario of generation aspects. The total surplus energy for
Shift IPP Plants and Shift NEA & IPP Plants scenario will be equal and will have
value equal to 18230 GWh. The calculated values are shown in Figure 4. 24.
Figure 4. 25 Monthly Surplus – Deficit Energy in Growth with Categorization of
Consumption Scenario for Fiscal Year 086/87
0
500000
1000000
1500000
2000000
2500000
3000000
EX
PE
CT
ED
SU
RP
LS/
DE
FIC
IT
EN
ER
GY
(M
WH
R)
MONTHS OF FISCAL YEAR 086/87
Normal With IPP Shift With NEA and IPP Shift
-2000000
-1500000
-1000000
-500000
0
500000
1000000
EX
PE
CT
ED
SU
RP
LU
S/D
EF
ICIT
E
NE
RG
Y (
MW
HR
)
MONTHS OF FISCAL YEAR 086/87
Normal With IPP Shift With NEA and IPP Shift
S/D - Ratio = ∞ ∞ ∞
S/D - Ratio = 0.097 0.098 0.098

75
4.8.2 Growth with Categorization of Consumption Scenario in Different
Generation Scenarios
When the consumption is taken as growth with categorization of consumption
scenario, there will be surplus of energy in only two months viz. Ashoj and Kartik in
all scenarios of generation aspects. The total deficit energy over ten months is much
higher than the total surplus energy that will be available in only two months. The
surplus energy will only cover for 9.7% of total deficit energy in Normal generation
scenario and 9.8% for remaining two scenarios of generation aspects. The total deficit
energy that will be faced by the country will be around 9092 GWh in Normal scenario
of generation aspects. The total deficit for Shift IPP Plants and Shift NEA & IPP
Plants scenario will be equal and will have value around 9053 GWh. These estimated
values of surplus energy, deficit energy and S/D – Ratio are shown in Figure 4. 25.
4.8.3 Intervention with Induction Chulo in Different Generation Scenarios
The intervention of Induction Chulo will bring severe deficit of energy in all months
throughout the year in each generation aspects scenarios resulting into zero S/D –
Ratio. The total deficit of energy that will be faced will be around 16022 GWh in
Normal generation scenario and 15979 GWh in Shift IPP Plants and Shift NEA & IPP
Plants scenarios, respectively.
Figure 4. 26 Monthly Surplus – Deficit Energy in Intervention of Induction Chulo
Scenario for Fiscal Year 086/87
-2500000
-2000000
-1500000
-1000000
-500000
0
EX
PE
CT
ED
SU
RP
LU
S/D
EFI
CIT
E
NE
RG
Y (
MW
HR
)
MONTHS OF FISCAL YEAR 086/87
Normal With IPP Shift With NEA and IPP ShiftS/D - Ratio = 0 0 0

76
The deficit will increase from months of Ashoj and reaches at maximum deficit in
month of Baisakh and then it will again experience fall in deficit amount towards the
month of Ashoj. The estimated values are represented in Figure 4. 26.
4.8.4 Intervention with Electric Vehicle in Different Generation Scenarios
The intervention of Electric Vehicle will result into deficit of energy in all months
except Ashoj and Kartik. The total surplus energy around Ashoj and Kartik will only
about 3.4% of the total deficit of energy in remaining ten months period.
Figure 4. 27 Monthly Surplus – Deficit Energy in Intervention of Electric Vehicle
Scenario for Fiscal Year 086/87
The total deficit energy will be about 11673 GWh in Normal generation scenario and
11634 GWh for remaining two generations scenarios with delay in commissioning of
upcoming hydropower projects. The estimated surplus energy, deficit energy and S/D
– Ratio are shown in the graph in Figure 4. 27.
4.8.5 Combined Intervention of Induction Chulo and Electric Vehicle in
Different Generation Scenarios
The combined intervention of Induction Chulo and Electric Vehicle in fiscal year
086/87 will cause severe deficit of energy in all three scenarios of generation aspects
resulting into zero S/D - Ratio.
-2500000
-2000000
-1500000
-1000000
-500000
0
500000
EX
PE
CT
ED
SU
RP
LU
S/D
EF
ICIT
E
NE
RG
Y (
MW
HR
)
MONTHS OF FISCAL YEAR 086/87
Normal With IPP Shift With NEA and IPP ShiftS/D - Ratio = 0.034 0.034 0.034

77
Figure 4. 28 Monthly Surplus – Deficit Energy in Combined Intervention ofInduction
Chulo & Electric Vehicle Scenario for Fiscal Year 086/87
There will be deficit of energy 19088 GWh in Normal scenario with lowest deficit in
Ashoj and highest deficit in Baisakh. This deficit will change to 19045 GWh for
remaining two scenarios of generation aspects with respective delay in upcoming
projects. The estimated values are shown in Figure 4. 28.
4.9 Expected Surplus & Deficit Energy
Figure 4. 29 depicts the expected net annual energy surplus and deficit for three fiscal
years during the study period as a percentage of generation in each scenarios. It is to
be noted that fiscal year 078/79 will have annual surplus in each of the scenario. In
terms of energy, there will be largest surplus energy as 54% of generation energy for
Fig. (a) For fiscal year 078/79
-3000000
-2500000
-2000000
-1500000
-1000000
-500000
0
EX
PE
CT
ED
SU
RP
LU
S/D
EFI
CIT
E
NE
RG
Y (
MW
HR
)
MONTHS OF FISCAL YEAR 086/87
Normal With IPP Shift With NEA and IPP ShiftS/D - Ratio = 0 0 0

78
Fig. (b) For fiscal year 080/81
Fig. (c) For fiscal year 084/85 Figure 4. 29 Annual Surplus or Deficit Energy as Percentage of Annual Generation
for fiscal year 078/79, 080/81 & 084/85
combination of normal generation scenario and constant per annum growth in energy
consumption scenario. Similarly, lowest surplus energy as 12.2% of generation
energy is observed in Shift IPP & NEA Plants scenario of generation and combined
intervention scenario of consumption. Fiscal year 080/81 is expected to follow similar
surplus energy trend with relatively higher percentage of energy surplus in
comparison to fiscal year 078/79.
For fiscal year 084/85, annual surplus and deficit of energy varies widely depending
upon generation and consumption scenario. This year is expected to observe net
annual surplus energy for three of the consumption scenarios viz. normal, growth with
categorized and intervention with electric vehicle consumptions. However, there will

79
be net annual deficit of energy in intervention with induction Chulo and combined
intervention scenarios. Having surplus or deficit annual energy doesnot indicate there
will be surplus or deficit of energy in each months of that particular year. So, monthly
surplus and deficit energy for study periods are shown in Appendix – M.
4.10 Load Flow Simulation Results & Discussions
The load flow simulation has been carried out for following five scenarios of energy
consumption for fiscal year 084/85 for Shift NEA & IPP Plants generation scenario
and the result has been analyzed for import and export lines, line loading, transformer
loading and bus voltages. The generator are taken as voltage control modes and cross
border transmission links are provided as required export or import swing units. The
observed results are presented in Appendix – N. The results are analyzed and are
listed as follows:
4.10.1 Scenario – I: Maximum Export (Normal Energy Consumption – Ashoj)
The followings results and discussions are listed from load flow simulation:
There will be flow of around 1200 MW to the Muzzafarpur bus (400kV) and
the Gorakhpur Grid will draw around 2093.9 MW when the load flow is
carried out for load of 2285. 47 MW. This concludes the capacity of
Dhalkebar – Muzzafarpur line will be fully used whereas the Butwal –
Gorakhpur Line must be designed so as to carry the aforementioned flow.
Amlekhgunj – Hetauda (66 kV), Amlekhgunj – Simara (66 kV), Balaju –
Lainchaur (66 kV), Baneshwor – Bhakapur (66 kV), Chapali – Chabahil (66
kV), Muzzafarpur – Dhalkebar (400 kV), Dhalkebar – Hetauda (400 kV),
Duhabi – Damak (132 kV), Ilam – Damak (132 kV), Phidim – Ilam (132 kV),
Phidim – Thapatar (132 kV), Khimti – Lamosangu (132 kV), Damauli –
Butwal (400 kV), Ratamate – Damauli (400 kV), Dhalkebar – New Khimti
(400 kV), Tingla – Mirchiya (132 kV), Trishuli 3B – Ratamate (200 kV),
Butwal – Gorakhpur (400 kV), Parwanipur – Birgunj (66 kV), Teku –
Suichatar (66 kV) lines have been found as critically overloaded.
The transformer of Hetauda, Suichatar and Parwanipur grids have been found
critically overloaded.

80
Bus Results:
1. All twenty two 66 kV buses have been operating with critical bus
voltages.
2. Among sixty one 132 kV buses, only fourteen buses (Amarpur,
Bharatpur, Damauli, Kawasoti, Kaligandaki, Khimti, Lekhnath, Likhu,
Middle Marsyangdi, Marsyangdi, Modi, Phidim, Pokhara and Tingla)
have been operating with healthy bus voltages.
3. Among twenty eight 220 kV buses, no buses have been found to
operate with critical bus voltages. However, eight buses (Andhikhola,
Butwal, Damauli, Dandakhet, Dhalkebar, Inaruwa, Kusma and
Rahughat) have been found to operate with marginal bus voltage.
4. Only six buses (Arun Hub, Barhabise, Gorakhpur, Laphsiphedi, New
Khimti and Ratamate) out of twenty one 400 kV buses have been
found to operate with healthy bus voltage.
4.10.2 Scenario – II: Maximum Import (Combined Intervention with Induction
Chulo and Electric Vehicle – Falgun)
The followings results and discussions are listed from load flow simulation:
The load flow simulation is converged for addition of 260 MVar capacitor
bank on buses of Birgung loop. Capacitor Bank each of 50 MVar have been
used in buses Parwanipur (132 kV), Birgunj (66 kV), Simara (66 kV),
Amlekhgunj (66 kV), 40 MVar in Kamane (132 kV) and 20 MVar in Pathlaiya
(132 kV).
Six import lines in accordance with cross – border planning have been used to
accommodate the total import peak demand considering their capacity. The
import of 100 MW from Tanakpur import, 1200 MW from Butwal –
Gorakhpur 400 kV line, 150 MW from Parwanipur – Raxaul 132 kV line,
1200 MW from Dhalkebar – Muzzafarpur 400 kV line, 150 MW from Kusaha
– Kataiya 132 kV line and remaining 907 MW from Duhabi – Purnea 400 kV
line have been simulated to meet the monthly peak demand of around 6139
MW.
Balaju - Suichatar (66 kV), Balaju – Lainchaur (66 kV), Baneshwor –
Bhakapur (66 kV), Bhaktapur – Banepa (66 kV), Bharatpur – Damauli (132
kV), Chapali – Chabahil (66 kV), Dhalkebar – New Duhabi (400 kV), Duhabi

81
– Lahan (132 kV), Damak – Duhabi (132 kV), Hetauda – Kulekhani II (132
kV), Hetauda – Kulekhani III (132 kV), Khimti – Lamosangu (132 kV),
Kusaha – Lahan (132 kV), Kusaha – New Duhabi (132 kV), Matatirtha –
Kulekhani II (132 kV), Matatirtha – Suichatar (132 kV), Mirchiya – Lahan
(132 kV), Parwanipur – Birgunj (66 kV), Simara – Parwanipur (66 kV),
Suichatar – Singhadurbar (66 kV), Suichatar – Kulekhani I (66 kV),Teku –
Suichatar (66 kV), Butwal – Gorakhpur (400 kV) and Duhabi – Purnea (400
kV) lines have been found as critically overloaded .
The transformer of Balaju, Bhaktapur, Chapali, Dhalkebar, Hetauda, Suichatar
and Parwanipur grids have been found critically overloaded.
Bus Results:
1. None of twenty two 66 kV buses have been operating with healthy bus
voltage.
2. Among sixty two 132 kV buses, only thirteen buses (Amarpur,
Damauli, Dhalkebar, Duhabi, Kataiya, Kaligandaki, Kusaha, Lekhnath,
Likhu, Middle Marsyangdi, Phidim, Pokhara and Tingla) have been
operating with healthy bus voltages.
3. Among twenty eight 220 kV buses, eight buses (Andhikhola,
Bharatpur, Butwal, Dana, Dandakhet, Kusma, New Marsyangdi and
Rahughat) have been found to operate with critical bus voltage and
four buses (Khudi, Manang, Matatirtha, and Udipur) have been found
to operate with critical bus voltage..
4. Only nine buses (Arun Hub, Barhabise, Dhalkebar, Duhabi, Inaruwa,
Mirchiya, Muzzafarpur, New Khimti and Purnea) out of twenty three
400 kV buses have been found to operate with healthy bus voltage.
4.10.3 Scenario – III: Intermediate Import (Growth with Categorization of
Consumption – Falgun)
The followings results and discussions are listed from load flow simulation:
Four import lines in accordance with cross – border planning have been used
to accommodate the total import peak demand considering their capacity. The
import of 100 MW from Tanakpur import, 1110 MW from Butwal –
Gorakhpur 400 kV line, 1000 MW from Dhalkebar – Muzzafarpur 400 kV

82
line, 129 MW from Kusaha – Kataiya 132 kV line have been simulated to
meet the monthly peak demand of around 4766 MW.
Amlekhgunj – Hetauda (66 kV), Amlekhgunj – Simara (66 kV), Balaju -
Suichatar (66 kV), Balaju – Lainchaur (66 kV), Baneshwor – Bhakapur (66
kV), Bhaktapur – Banepa (66 kV), Bharatpur – Damauli (132 kV), Chapali –
Chabahil (66 kV), Duhabi – Damak (132 kV), Hetauda – Kamane (132 kV),
Hetauda – Kulekhani II (132 kV), Hetauda – Kulekhani I (66 kV), Hetauda –
Kulekhani III (132 kV), Hetauda – Pathlaiya (132 kV), Kamane – Pathlaiya
(132 kV) , Khimti – Lamosangu (132 kV), Teku – Singhadurbar (66 kV),
Kulekhani III – Kulekhani II (132 kV), Kusaha – New Duhabi (132 kV),
Butwal – Phulbari (400 kV), Butwal – Damauli (400 kV), Matatirtha –
Kulekhani II (132 kV), Matatirtha – Suichatar (132 kV), Parwanipur – Birgunj
(66 kV), Simara – Parwanipur (66 kV), Pathlaiya – Parwanipur (66 kV),
Suichatar – Singhadurbar (66 kV), Teku – Suichatar (66 kV), Suichatar –
Patan (66 kV), Suichatar – Kulekhani I (66 kV) lines have been found as
critically overloaded.
The transformer of Balaju, Bhaktapur, Chapali, Dhalkebar, Hetauda,
Suichatar, Khimti and Parwanipur grids have been found critically overloaded.
Bus Results:
1. Among twenty two 66 kV buses, only Birgunj bus has been found to
operate with normal bus voltage and all other buses have been
operating with critical bus voltage.
2. Among sixty one 132 kV buses, only three buses (Bharatpur, Middle
Marsyangdi and Marsyangdi) have been operating with healthy bus
voltages. All remaining buses have been found to operate under
marginal and critical bus voltage condition.
3. Among twenty eight 220 kV buses, eight buses (Barhabise, Bharatpur,
Dhalkebar, Matatirtha, New Khimti, New Marsyangdi, Tamakoshi and
Tingla) have been found to operate with normal bus voltage..
4. Only five buses (Dhalkebar, Inaruwa, Mirchiya, Muzzafarpur and New
Khimti) out of twenty one 400 kV buses have been found to operate
with healthy bus voltage.

83
4.10.4 Scenario – IV: Intermediate Import (Intervention with Induction Chulo –
Falgun)
The followings results and discussions are listed from load flow simulation:
The load flow simulation is converged for addition of 80 MVar capacitor bank
on buses of Birgung loop. Capacitor Bank each of 50 MVar have been used in
buses Parwanipur (132 kV) and Birgunj (66 kV) buses and 30 MVar capacitor
bank has been used in Pathlaiya (132 kV) bus.
Six import lines in accordance with cross – border planning have been used to
accommodate the total import peak demand considering their capacity. The
import of 100 MW from Tanakpur import, 1100 MW from Butwal –
Gorakhpur 400 kV line, 1100 MW from Dhalkebar – Muzzafarpur 400 kV
line, 125 MW from Kusaha – Kataiya 132 kV,150 MW from Parwanipur –
Raxaul 132 kV line and remaining 793.6 MW from Duhabi – Purnea 400 kV
lines have been simulated to meet the monthly peak demand of around 5803
MW.
Balaju - Suichatar (66 kV), Balaju – Lainchaur (66 kV), Baneshwor –
Bhakapur (66 kV), Bhaktapur – Banepa (66 kV), Bharatpur – Damauli (132
kV), Chapali – Chabahil (66 kV), Duhabi – Damak (132 kV), Hetauda –
Kulekhani II (132 kV), Hetauda – Kulekhani I (66 kV), Suichatar –
Singhadurbar (66 kV), Khimti – Lamosangu (132 kV), Kulekhani III –
Kulekhani II (132 kV), Kusaha – Lahan (132 kV),Duhabi – Purnea (400 kV),
Matatirtha – Kulekhani II (132 kV), Matatirtha – Suichatar (132 kV),
Parwanipur – Birgunj (66 kV), Simara – Parwanipur (66 kV), Pathlaiya –
Parwanipur (66 kV), Teku – Suichatar (66 kV), Suichatar – Kulekhani I (66
kV) lines have been found as critically overloaded.
The transformer of Balaju, Bhaktapur, Chapali, Dhalkebar, Hetauda,
Suichatar, Khimti and Parwanipur grids have been found critically overloaded.
Bus Results:
1. Among twenty two 66 kV buses, all buses have been found to operate
with critical bus voltage.
2. Among sixty two 132 kV buses, only twelve buses (Amarpur, Duhabi,
Ilam, Katiya, Kawasoti, Kusaha, Likhu, Middle Marsyangdi,
Marsyangdi, Modi, Phidim and Pokhara) have been operating with

84
healthy bus voltages. All remaining buses have been found to operate
under marginal and critical bus voltage condition.
3. Among twenty eight 220 kV buses, six buses (Andhikhola, Butwal,
Dana, Dandakhet, Kusma and Rahughat) have been found to operate
with critical bus voltage. Other six buses (Bharatpur, Damauli,
Lekhnath, Matatirtha, Tamakoshi and Upper Madi) have found to
operate on marginal bus voltage.
4. Only nine buses (Arun Hub, Barhabise, Dhalkebar, Duhabi, Inaruwa,
Mirchiya, Muzzafarpur, New Khimti and Purnea) out of twenty three
400 kV buses have been found to operate with healthy bus voltage.
4.10.5 Scenario – V: Intermediate Export (Intervention with Electric Vehicle –
Ashoj)
The followings results and discussions are listed from load flow simulation:
Only Muzzafarpur – Dhalkebar 400 kV line will be required to export 594.1
MW from Nepal to India.
Balaju - Suichatar (66 kV), Balaju – Lainchaur (66 kV), Baneshwor –
Bhakapur (66 kV), Chapali – Chabahil (66 kV), Duhabi – Damak (132 kV),
Hetauda – Kamane (132 kV), Hetauda – Kulekhani II (132 kV), Ilam – Damak
(132 kV), Ilam – Phidim (132 kV), Phidim – Amarpur (132 kV), Khimti –
Lamosangu (132 kV), Kulekhani III – Kulekhani II (132 kV), Lamosangu –
Bhaktapur (132 kV), Lekhnath - Pokhara (132), Barhabise – New Khimti
(400 kV), Dhalkebar – New Khimti (400 kV), Tingla – Mirchiya (132 kV),
Trishuli 3B – Ratamate (220 kV), Matatirtha – Kulekhani II (132 kV),
Matatirtha – Suichatar (132 kV), Parwanipur – Birgunj (66 kV), Simara –
Parwanipur (66 kV), Pathlaiya – Parwanipur (66 kV), Teku – Suichatar (66
kV), Suichatar – Singhadurbar (66 kV), lines have been found as critically
overloaded.
The transformer of Balaju, Bhaktapur, Chapali, Dhalkebar, Hetauda, Suichatar
and Parwanipur grids have been found critically overloaded.
Bus Results:
1. Among twenty two 66 kV buses, all buses have been found to operate
with critical bus voltage.

85
2. Among sixty one 132 kV buses, Kohalpur buses and Marsyangdi bus
have been operating with healthy bus voltages. All remaining buses
have been found to operate under marginal and critical bus voltage
condition.
3. Among twenty eight 220 kV buses, only Arun 3 bus has been found to
operate with normal bus voltage.
4. Only two buses (Arun Hub and Muzzafarpur) out of twenty one 400
kV buses have been found to operate with healthy bus voltage.
4.11 Verification of Expected Energy Consumption Scenario
When expected energy consumption is estimated based on sectoral energy growth rate
as 1.5 times GDP growth rate as given by study performed by Government of Nepal
and JICA, expected monthly peak demand for Ashoj of fiscal year 084/85 has been
found to decrease by 25 MW as comparison to Normal energy consumption scenario
for the same. There was flow of about 2094 MW (export) from butwal - Gorakhpur
link in Normal scenario of energy consumption in load flow simulation for Ashoj of
fiscal year 084/85 while 2118.6 MW power flow (export) is observed in this
categorized consumption with aforementioned different yearly sectoral growth rates.
These shows the results from expected energy growth implementing sectoral growth
rates for coming ten years given by study of JICA and adopted Normal consumption
scenario (8% p.a.growth on monthly bulk consumption) in this study are almost same.

86
CHAPTER 5: CONCLUSIONS & RECOMMENDATIONS
5.1 Conclusions
5.1.1 Conclusions on Surplus – Deficit Energy
The thesis studied the scenario analysis for surplus – deficit energy analysis for
projected ten years for energy banking from Nepalese perspective. The conslusions
drawn from the study are illustrated case – wise as follows:
(i) Normal Expected Energy Consumption Scenario
1. There will be surplus energy in each month from fiscal year 077/78 to 086/87 for
Normal scenario of generation. The surplus energy goes on increasing from fiscal
year 077/78 to 082/83 and starts to decrease thereafter as there will be no addition
of generation project but the consumption is assumed to be in constant growth.
The surplus energy available will increase from month of Chaitra to Ashoj and
thereafter starts to decrease in each fiscal year. There will be all export case for
energy banking facility in this scenario.
2. In “Shift IPP Plants” scenario, there will be deficit energy in all months except
months of Ashoj and Kartik in Fiscal year 077/78 resulting into need of export to
energy banking facility in these two months and remaining ten months will be
characterized with import from energy banking facility. From fiscal year 078/79 to
086/87, there will be surplus energy in each month and export of energy is needed.
3. In “Shift NEA and IPP Plants” scenario, fiscal year 077/78 will have all months
with deficit of energy and quantity of deficit will be greater than in “Shift IPP
Plants” scenario. All months of this year will need import of energy form energy
banking facility. There will be need of export of energy in each month from fiscal
year 078/79 to 086/87 but the export amount in respective months will be less than
that in “Shift IPP Plants” scenario.
(ii) Growth with Categorization of Consumption Scenario
1. There will be requirement of energy import in Magh, Falgun and Chaitra and
export of energy from energy banking facility in remaining nine months of fiscal
year 077/78 in “Normal” scenario of generation. There will be surplus energy in
each months of fiscal year 078/79 to 082/83 and there should be need of export.
There will be months with both the surplus and deficit energy onwards from fiscal

87
year 083/84 to 086/87 and need of both the export and import through banking
facility in this period. There will be deficit of energy in Magh, Falgun, Chaitra and
Baisakh in fiscal year 083/84. The deficit energy month will be added by one
month i.e. Poush in fiscal year 084/85. Fiscal year 085/86 will experience energy
deficit in six months viz.Poush, Magh, Falgun, Chaitra, Baisakh and Jestha and
remaining six months will have surplus energy. Silimarly, fiscal year 086/87 will
have ten months energy deficit except the month of Ashoj and Kartik.
2. There will be requirement of energy import in all months of fiscal year 077/78 in
“Shift IPP Plants” scenario of generation. There will be surplus energy in each
months of fiscal year 078/79 to 082/83 and there should be need of export.
However, the surplus energy in each month in this period will be less than that in
“Normal” scenario of generation. There will be months with both the surplus and
deficit energy onwards from fiscal year 083/84 to 086/87 and need of both the
export and import through banking facility in this period. There will be deficit of
energy in Magh, Falgun, Chaitra and Baisakh in fiscal year 083/84. The deficit
energy month will be added by one month i.e. Poush in fiscal year 084/85. Fiscal
year 085/86 will experience energy deficit in six months viz.Poush, Magh, Falgun,
Chaitra, Baisakh and Jestha and remaining six months will have surplus energy.
Silimarly, fiscal year 086/87 will have ten months energy deficit except the month
of Ashoj and Kartik. All these deficit and surplus energy are very near to those in
the “Normal” scenario.
3. In “Shift NEA and IPP Plants” scenario, energy import from energy banking is
needed in all months of fiscal year 077/78. There will be four months (Magh,
Falgun, Chaitra, Baisakh), two months (Falgun & Chaitra) and a month (Falgun)
with energy deficit in fiscal years 078/79, 079/80 and 080/81 respectively and
these fiscal years will need both import as well as export through energy banking.
Fisacal year 081/82 will have all months with surplus energy and energy export is
needed. There will be energy deficit in only Falgun of fiscal year 082/83. Fiscal
year 083/84 will have energy deficit from Magh to Baisakh and additional deficit
of energy in Poush will be experienced in 084/85. There will be energy deficit in
six months (Poush – Jestha) and energy surplus in remaining six months in fiscal
year 085/86. The energy deficit and surplus for fiscal year 086/87 will be same as
that in the “Shift IPP Plants” scenario.

88
(iii) Intervention with Induction Chulo Senario
1. In “Normal” scenario of generation, there will be deficit of energy in four months
viz. Magh, Falgun, Chaitra and Baisakh in fiscal year 077/78 and there will be
surplus energy in each month from fiscal year 078/79 to 080/81. There will be
deficit of energy only in the month of Falgun in fiscal year 081/82. There will be
both import as well as export through energy banking from fiscal year 082/83 to
086/87 as these fiscal year will be characterized with months with surplus and
deficit energy. There will be deficit of energy from Magh to Baisakh in fiscal year
082/83. An additional deficit of energy will be experienced in the month of Poush
as well in fiscal year 083/84 in comparison to that of fiscal year 082/83. Similarly,
there will be deficit of energy in six months i.e. Poush to Jestha in fiscal year
fiscal year 084/85. There will be only two months viz.Ashoj and Kartik with
surplus energy in fiscal year 085/86. There will be need of import of energy in all
months of fiscal year 086/87 as these months will experience deficit of energy.
2. There will be deficit of energy in all months of fiscal year 077/78 in “Shift IPP
Plants” scenario and deficit of energy in four months i.e. from Magh to Baisakh
will be experienced from fiscal year 078/79 to 080/81. Similarly, the month of
Magh, Falgun and Chaitra will experience deficit of energy and remaining nine
months with surplus energy for fiscal year 081/82. There will be deficit of energy
in four months (Magh to Baisakh), five months (Poush to Baisakh) and six months
(Poush to Jestha) in fiscal years 082/83, 083/84 and 084/85 respectively. The
fiscal year 085/86 will have only two months viz. Ashoj and Kartik with surplus
energy and there will be no surplus energy in any month of fiscal year 086/87.
The deficit of energy in each month of this fiscal year are comparable to that in
the case of “Normal” scenario of generation.
3. In “Shift NEA and IPP Plants” the fiscal years 077/78 and 086/87 will experience
deficit of energy and needs import for energy balancing. Three fiscal years
078/79, 079/80 and 083/84 will have deficit of energy from Poush to Baisakh i.e.
five months period and these deficit amount will go on increasing form initial year
to later years. The years 080/81 and 082/83 are characterzed with deficit of energy
from Magh to Baisakh & fiscal year 081/82 will experience deficit for only three
months period from Magh to Chaitra. The amount of deficit of energy and surplus

89
energy of fiscal years 085/86 and 086/87 are same for both “Shift IPP Plants” and
“Shift NEA and IPP Plants” scenarios.
(iv) Intervention with Electric Vehicle Scenario
1. The surplus and deficit energy in this intervention are greater and lesser than that
of intervention with Induction Chulo intervention. There will be energy deficit
around three months i.e. Magh, Falgun and Chaitra in fiscal year 077/78 whereas
there will be surplus energy in each month from fiscal year 078/79 to 081/82.
There will be deficit of energy in only the month of Falgun in fiscal year 082/83.
There will be around four months (Magh to Baisakh), six months ( Poush to
Jestha) and seven months (Poush to Ashad) in fiscal year 083/84, 084/85 and
085/86 respectively. Similarly, fiscal year 086/87 will experience deficit of energy
in ten months and surplus energy in the months of Ashoj and Kartik.
2. In “Shift IPP Plants” scenario, there will be deficit of energy in all months of
fiscal year 077/78. There will be deficit of energy only in the month of Falgun
from fiscal year 078/79 to 080/81.The monthly surplus and deficit of energy
scenario from fiscal year 081/82 to 086/87 are exhibits same nature as that of
“Normal” scenario of generations.
3. Fiscal year 077/78 will experience deficit of energy in each month whereas 081/82
will experience surplus of energy in each month throughout the year. There will
be deficit of energy in four months (Magh to Baisakh), three months (Magh to
Chaitra) and one month (Falgun) in fiscal years 078/79, 079/80 and 080/81
respectively and there is need of both import and export through energy banking
facility in these years. Similarly, there will be deficit of energy in two months
(Falgun and Chaitra) and four months (Magh to Baisakh) in fiscal years 082/83
and 083/84 respectively.The surplus and deficit energy monthly scenario from
fiscal years 084/85 to 086/87 in “Shift NEA and IPP Plants” scenario will be
identical to “Shift IPP Plants” scenario.
(v) Combined Intervention with Induction Chulo and Electric Vehicle Scenario
1. In “Normal” scenario of generation, there will be deficit of energy in four months
(Magh to Baisakh) in fiscal years 077/78 and 082/83. There will be surplus energy
available in each month of fiscal years 078/79 and 080/81. Fiscal year 079/80 will
experience deficit of energy in only one month i.e. Falgun and 081/82 will
experience deficit of energy for two months period i.e. Falgun and Chaitra. There

90
will be deficit of energy in six months and surplus energy in six months period in
fiscal years 083/84 and 084/85 and hence both import and export will be required
through energy banking facility in these years. Fiscal year 085/86 will be available
with two surplus energy months i.e. Ashoj and Kartik. There will be no month
with surplus energy in fiscal year 086/87.
2. In “Shift IPP Plants” scenario, there will be deficit of energy in each months of
fiscal year 077/78. There will be deficit of energy from Magh to Baisakh in each
fiscal year from 078/79 to 080/81. Similarly, the deficit will reduced to three
months i.e. Magh to Chaitra for fiscal year 081/82.The monthly surplus deficit
scenario from fiscal year 082/83 to 086/87 almost similar to as in “Normal”
scenario as surplus and deficit months of each fiscal years are same but the surplus
energy will be increased and deficit energy will be reduced in comparison to
“Normal” scenario.
3. In “Shift NEA and IPP Plants” scenario, fiscal year 077/78 will have more deficit
of energy in all months in comparison to “Shift IPP Plants” scenario. There will
be deficit of energy for five months (Poush to Baisakh) from fiscal year 078/79 to
080/81 and also in fiscal year 082/83. Fiscal year 081/82 will suffer deficit of
energy in only four months period (Magh to Baisakh). Fiscal year 083/84 will
suffer deficit and surplus of energy in same months as in “Shift IPP Plants”
scenario but with reduced surplus amount and increased deficit energy amount.
The fiscal years 084/85, 085/86 and 086/87 will experience identical surplus and
deficit energy in same months as in “Shift IPP Plants” scenario.
5.1.2 Conclusions on Planned INPS for Fiscal Year 084/85 based on Load Flow
Simulation Results
The followings have been concluded for planned INPS for coming fiscal year 084/85
based on load flow simulation incorporating the saturation of new generation projects
with “Shift IPP & NEA Plants” generation scenario and different energy consumption
scenarios:
1. When the energy demand is expected to grow at the rate of 8% per annum, the
maximum export of energy has been observed for months of Ashoj. The
Dhalkebar – Muzzafarupur 400 kV line has been fully used upto its capacity and
there has been need of two 400 kV double circuit lines in Butwal – Gorakhpur
route to send about 2094 MW power.
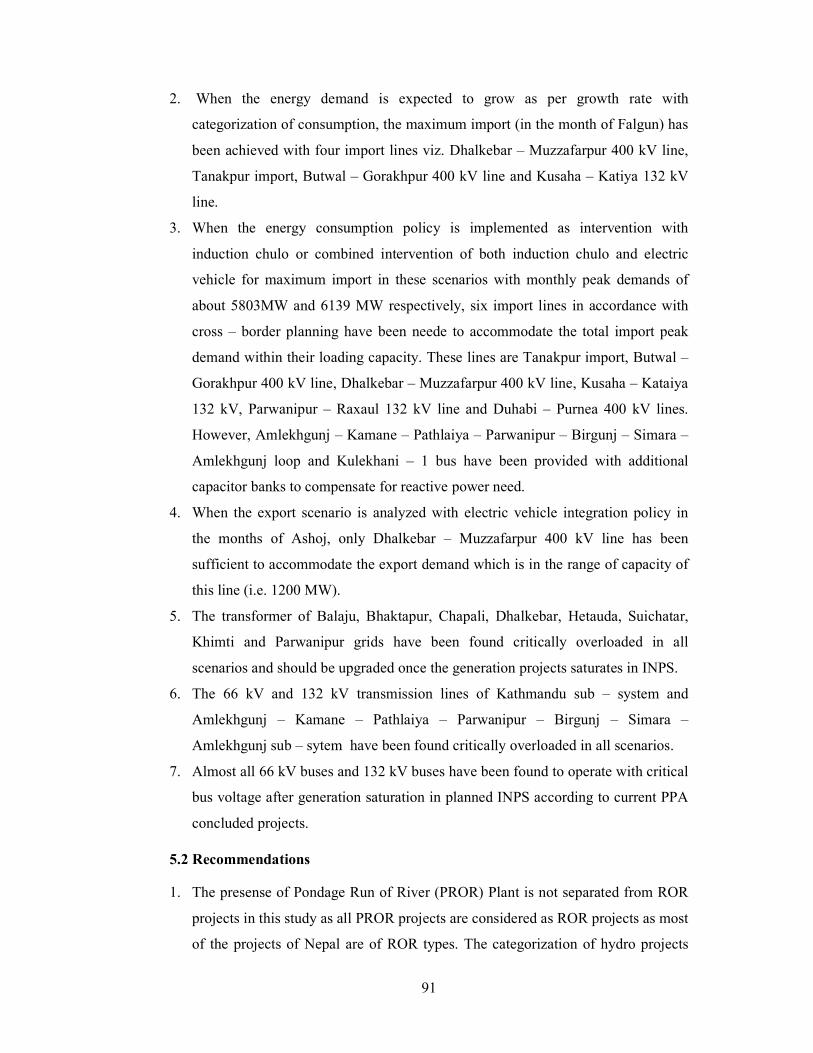
91
2. When the energy demand is expected to grow as per growth rate with
categorization of consumption, the maximum import (in the month of Falgun) has
been achieved with four import lines viz. Dhalkebar – Muzzafarpur 400 kV line,
Tanakpur import, Butwal – Gorakhpur 400 kV line and Kusaha – Katiya 132 kV
line.
3. When the energy consumption policy is implemented as intervention with
induction chulo or combined intervention of both induction chulo and electric
vehicle for maximum import in these scenarios with monthly peak demands of
about 5803MW and 6139 MW respectively, six import lines in accordance with
cross – border planning have been neede to accommodate the total import peak
demand within their loading capacity. These lines are Tanakpur import, Butwal –
Gorakhpur 400 kV line, Dhalkebar – Muzzafarpur 400 kV line, Kusaha – Kataiya
132 kV, Parwanipur – Raxaul 132 kV line and Duhabi – Purnea 400 kV lines.
However, Amlekhgunj – Kamane – Pathlaiya – Parwanipur – Birgunj – Simara –
Amlekhgunj loop and Kulekhani – 1 bus have been provided with additional
capacitor banks to compensate for reactive power need.
4. When the export scenario is analyzed with electric vehicle integration policy in
the months of Ashoj, only Dhalkebar – Muzzafarpur 400 kV line has been
sufficient to accommodate the export demand which is in the range of capacity of
this line (i.e. 1200 MW).
5. The transformer of Balaju, Bhaktapur, Chapali, Dhalkebar, Hetauda, Suichatar,
Khimti and Parwanipur grids have been found critically overloaded in all
scenarios and should be upgraded once the generation projects saturates in INPS.
6. The 66 kV and 132 kV transmission lines of Kathmandu sub – system and
Amlekhgunj – Kamane – Pathlaiya – Parwanipur – Birgunj – Simara –
Amlekhgunj sub – sytem have been found critically overloaded in all scenarios.
7. Almost all 66 kV buses and 132 kV buses have been found to operate with critical
bus voltage after generation saturation in planned INPS according to current PPA
concluded projects.
5.2 Recommendations
1. The presense of Pondage Run of River (PROR) Plant is not separated from ROR
projects in this study as all PROR projects are considered as ROR projects as most
of the projects of Nepal are of ROR types. The categorization of hydro projects

92
into ROR and PROR can be considered for further study. One can analyze the
PROR projects and their past operating conditions and also categorize coming
projects into ROR and PROR type with their monthly pondage period as well for
energy banking from Nepalese perspective.
2. The final delay of one year in completion of projects going to be constructed by
IPP and three years in completion of projects going to be consturucted by NEA
and its sister organizations are considered by taking all the delaying factors in
bulk concept for this study purpose. Similarly, completion of individual
transmission line and corridor transmission line project and associated delay can
be considered and incorporated for some corridor based generation projects in
further study as well.
3. The simulation study has shown that almost all 66 kV and 132 kV buses in
planned INPS have been suffered from undervoltage and overvoltage problem
once the generation saturates in it. Similarly, there is presence of both healthy and
abnormal 220 kV and 400 kV buses as well. One can further extend the given
study to reactive compensation study to achieve healthy planned INPS in future
incorporating both the strengthening of transmission lines of Kathmandu region
and Birgunj region with proper upgradation of aforementioned transformers as
well.

93
REFERENCES
[1]. Revolt Motors. (2019, December). Retrieved from https://www.revoltmotors.com/: https://www.revoltmotors.com/rv300,https://www.revoltmotors.com/rv400
[2]. Electric Vehicle Database. (2020, December). Retrieved from ev-database.org: https://ev-database.org/compare/electric-vehicle-longest-range#sort:path~type~order=.erange_real~number~desc|range-slider-range:prev~next=0~1200|range-slider-acceleration:prev~next=2~23|range-slider-topspeed:prev~next=110~450|range-slider-battery:prev~nex
[3]. Mahindra Electric. (2020). Retrieved from www.mahindraelectric.com: www.mahindraelectric.com/vehicles/e2oPlus/
[4]. Asian Development Bank. (2017). NEPAL ENERGY SECTOR ASSESSMENT, STRATEGY, AND ROADMAP. 6 ADB Avenue, Mandaluyong City, 1550 Metro Manila, Philippines: Asian Development Bank.
[5]. Bajracharya, D., & Bhattarai, D. (2016). Road Transportation Energy Demand and Environmental Emission: A Case of Kathmandu Valley. HYDRO NEPAL (ISSUE NO. 18), 11.
[6]. Bhandari, R., & Pandit, S. (2018). Electricity as Cooking Means in Nepal - A modelling Tool Approach. Sustainibility, MDPI, 17.
[7]. Central Bureau of Statictics. (2019). National Planning Commission, Central Bureau of Statictic. Retrieved October 10, 2019, from www.cbs.gov.np: www.cbs.gov.np
[8]. Department of Transport Management. (2019). Department of Transport Management, Kathmandu. Retrieved October 10, 2019, from www.dotm.gov.np: https://www.dotm.gov.np/Files/NoticePDF/Vehicledatatill20762020-01-17_04-54-21-965.pdf
[9]. Global Green Growth Institute. (2018). A Prefeasibility Study on Deploying Electric Buses in Kathmandu Valley . Seoul, Korea: Global Green Growth Institute.
[10]. Investment Board of Nepal. (2014). Energy Demand Projection 2030: A MAED Based Approach. Kathmandu.
[11]. Japan International Corporation Agency. (2014). Nationwide Master Plan Study on Stogae - type Hydroelectric Power Development in Nepal.
[12].Kandel, E. K. (2018, May 04). Retrieved from http://www.wecan.org.np/uploaded/Hydro%20Potential%20of%20Nepal.pdf.
[13]. MARCON. (2016). ELECTRIC BUS FEASIBILITY STUDY. MARCON.

94
[14]. MoE. (2017). Electricity Demand Forecast Report(2015-2040). Water and Energy Commission Secreteriat, Government of Nepal.
[15]. MoEN. (2018). Present Condition and Future Roadmap of Energy, Water Resources and Irrigation Sectors. Ministry of Energy, Water Resources and Irrigation, Government of Nepal.
[16]. MoEWRI. (2019, Jan 23). Minutes of Joint Working Group (JWG) Meeting on Nepal - India Cooperation in Power Sector. Retrieved from Government of Nepal, Ministry of Energy, Water Resources and Irrigation: http://www.moewri.gov.np/en
[17]. Nepal Electricity Authority. (2015). Final Transmission Master Plan R-7. Kathmandu: Nepal Electricity Authority.
[18]. Nepal Electricity Authority. (2015). Load Forecast Report. Kathmandu: Nepal Electricity Authority.
[19]. Nepal Electricity Authority. (2019). A YEAR IN REVIEW - FISCAL YEAR 2018/2019. Kathmandu: NepalElectricity Authority.
[20]. Nepal Oil Corporation. (2020). Nepal Oil Corporation. Retrieved March 13, 2020, from www.noc.org.np: www.noc.org.np/import
[21]. Power System Operation Corporation Limited. (2016). Electricity Demand Pattern Analysis Volume - I. New Delhi: POSOCO.
[22]. Puri, B. (2018). A scenario Analysis of Reactive Power Flow in Integrated Nepal Power System for 10th Year Planned Generation, Transmission and Load.
[23]. RPGCL. (2018). Transmission System Development Plan of Nepal. Rastriya Prasaran Grid Company Limited.
[24]. Sarmad , R. Z., & Albrecht, J. (2020). Prospects of Electric Vehicles in Developing Countries:A Literature Review. Sustainability, 19.
[25]. SARI/EI Task Force-2. (2016). (Assessment of the Electricity Trading Potential in the South. IRADe

95
APPENDICES
Appendix - A: Monthly Energy Generations Of NEA Operated ROR Hydropower Projects

96
1. Monthly Energy Generation (MWh) of Kaligandaki – A Hydropower Project
FY/MONTH Shrawan Bhadra Ashoj Kartik Mangsir Poush Magh Falgun Chaitra Baisakh Jestha Ashad
066/67 79908 77250.34 80453 73534 74330 51276 38365 36379 44849 52543 75813 69020.1
067/68 53322 87849.23 82754 76309 72236 65989 40701 38377 38774.22 52763 85700 93294
068/69 97246 95151 89481 85971 76340 53254 23778.3 38628.3 46979 52625 93203 90846
069/70 89658 97869 90341 82537 64872 45964 42002 33124 44129 63313 90378 94378
070/71 98236 96168 91030 90167.11 76445 54678 43803 39834 41104.8 53606 84171 97815
071/72 92888 94818 93840 89757 79806 63975 47625 50204 54446 60928 96732 94329
072/73 96662 93090 93241 87744 62800 45192 39555 36403 44056 60928 66985 68014
073/74 60206 89688 90504 90989 80126 53706 42031 39194 51122 60930 88405 96108
074/75 101934 101928 102768 92310 65176 48676 41111 36975 38915 50174 84642 104179
075/76 97837 97987 75650 67824 63725 48224 43677 44830 54340 91441 101717 99201
2. Monthly Energy Generation (MWh) of Middle Marsyangdi Hydropower Project
FY/MONTH Shrawan Bhadra Ashoj Kartik Mangsir Poush Magh Falgun Chaitra Baisakh Jestha Ashad
066/67 38089.45 40565.64 34085.09 37717.03 36881.46 26207.8 21379 18987 23862.2 32218.7 41167.79 38952
067/68 38837.1 34919.4 38295.4 38056.9 19613.61 27559.2 20940.1 19778.2 20831.4 28730.8 44814.87 43601.3
068/69 43057.2 46378.1 42883.85 45997.94 36898.2 27596.15 11167.88 22226.6 26132.2 31158.5 48522.26 44918.1
069/70 46075.19 45379.02 43397.02 41390.23 33556.14 24267.68 21573.86 21007.25 22738.41 33224.83 46612.15 46468.19
070/71 47436.35 43101.11 43464.55 44204.7 37731.77 28723.43 22539.82 20779.55 22066.22 30090.51 47470.96 48747.25
071/72 47219.8 48324.33 47179.72 47231.25 37349.3 30517.11 11838.72 23631.85 26455.01 32740.27 47694.8 50325
072/73 51717.01 49829.06 49695.87 44633.17 32917.45 25080 20686.74 19244.04 22017 32740.27 43549.63 49757.85
073/74 48932.38 49469.13 46942.38 47559.7 38548.25 27121.48 21284.83 20665.42 27627.26 32371.08 43833.28 49800.1
074/75 51183.28 50881.27 50314.74 44467.4 31968.77 24708.09 20099.48 14860.38 20346.5 27266.25 48613.38 54416.17
075/76 50759.31 49428.16 51527.68 44704.2 32082.3 24431.73 21089 23237.12 28292.7 49958.98 51147.21 48467.93

97
3. Monthly Energy Generation (MWh) of Marsyangdi Hydropower Project
FY/MONTH Shrawan Bhadra Ashoj Kartik Mangsir Poush Magh Falgun Chaitra Baisakh Jestha Ashad
066/67 37695.4 39339.3 39009.81 37150.3 39226.51 28521.7 23177.3 21406.1 24466.9 34228.5 41190.17 38850.3
067/68 38360.1 42228.3 41359.5 40607.2 39828.5 30600.3 23660 22755.7 21893.4 29347 46447.14 45385
068/69 45668.7 45603.1 37489.4 44564.46 34683 31714.7 15516.6 24526.7 26428.8 32558.2 48619.1 46720.56
069/70 48106.7 45602.8 45210.6 45619.9 38134.2 27756.7 24507.1 23506.57 23854.9 34362.73 46631.1 46186.4
070/71 61319.15 47357.8 47394.3 46238.3 42266.12 32649.99 25951.4 23348.63 24024.3 30313.8 46217.25 50190.1
071/72 45934.4 46659.27 36827.6 48993.8 41677.5 35540.8 26605.8 26809.3 29409 30725 49584.66 47863.1
072/73 48826.47 46974.5 47612.6 45791.7 36959.76 28660.4 23531.4 21779.4 22821.7 30725.6 45032.5 46102.5
073/74 46750.4 46225.1 46015.9 47621.7 43117.6 30838.2 24926 22961.17 31122 34827 44950.8 45850.3
074/75 45330.1 45987.9 48568 46168.5 35988.5 28317.7 23420.8 21454.8 23329.6 31968.8 50012.7 48746.6
075/76 45197.2 44448.51 48936.5 46863.2 36038.3 27926.5 25280.5 24821.5 30413.33 47422.2 52096.78 43832.6
4. Monthly Energy Generation (MWh) of Trishuli Hydropower Project
FY/MONTH Shrawan Bhadra Ashoj Kartik Mangsir Poush Magh Falgun Chaitra Baisakh Jestha Ashad
066/67 12614 11529.1 12206.5 11646.3 11912.57 11116.65 8664.1 8032.7 9639.7 10974.7 12767.9 12859.12
067/68 13831.6 12741.7 12016.1 10132.4 10586.9 10424.8 8562.5 7745.6 7456.1 9352.8 13428.6 12669
068/69 12250.2 11934.2 11840.3 13360 12618.4 11282.47 5108.6 8653 10258.1 11030.6 12732.7 10162.23
069/70 9557 9833 10876.07 11865.93 12017.6 9712.2 8416.5 8262.3 9759.1 11825.1 11370.2 11244.2
070/71 10313.1 9118.29 9829.3 9918.9 9716.16 9737.9 8010.9 7162 7402 9413 13293 10856.11
071/72 10471.55 10963.77 11985 12209.7 11671.6 11234 8702.2 9375.3 10898.3 4084.8 12150.9 10946.9
072/73 12799.8 11496.2 11796.1 12136.8 11766.5 10906.3 8855.4 8064.7 8351.8 4084.8 9248.4 10084.6
073/74 10410.9 10159.5 10321.6 11331 11516.5 10939.5 9568.37 9163.2 9007.67 11224.8 11481.3 10810.4
074/75 10956.5 9649 10677.3 12026.7 11331.5 9556.3 8501.51 8422.2 8761.93 9869.9 10781.7 10783.4
075/76 8739.61 11158.7 10447.3 10371.14 11178.7 9575.02 10080.56 403.6 9521 9042.1 11489.6 11382.8

98
5. Monthly Energy Generation (MWh) of Gandak Hydropower Project
FY/MONTH Shrawan Bhadra Ashoj Kartik Mangsir Poush Magh Falgun Chaitra Baisakh Jestha Ashad
066/67 2501.8 895.8 1125.5 595.3 976.8 1821.4 1132.9 1931.85 755.6 147.8 802.8 1346.3
067/68 2006.26 1285.1 1859.2 1011 0 1493.9 1563.3 896 491.9 0 0 430
068/69 2061.32 2536.7 2550.3 177.6 0 0 504.818 2856.6 926.4 0 0 392.4
069/70 2083.54 2547.9 3443.3 773.8 0 1688.1 2013.3 1348.1 997.7 0 1727.1 2476.2
070/71 1440.6 2382.2 2638.5 92.2 0 1089.5 970.1 624.4 490.48 96.9 29.7 0
071/72 0 0 0 0 0 0 0 510.7 0 0 0 1284.31
072/73 1887.5 2063.9 2398.3 570.2 0 2209.1 2376.7 2442.7 941.1 0 0 1287.1
073/74 943.1 1747.96 1926.3 28.5 927.7 3094.8 3015.1 2994.5 1254 0 1635.75 3416.2
074/75 3371.5 0 1927.9 870.5 0 1968.32 2631.9 3007.7 886.2 0 54.5 2262
075/76 1890.2 1636.5 1662.96 195.2 0 1616.3 844.99 70.07 707.5 0 479.5 1111.81
6. Monthly Energy Generation (MWh) of Modi Hydropower Project
FY/MONTH Shrawan Bhadra Ashoj Kartik Mangsir Poush Magh Falgun Chaitra Baisakh Jestha Ashad
066/67 5085.47 3610.56 4228 4973.6 4813.4 3597.4 2475.84 2429.3 3707.56 4316.4 4760.66 4353.9
067/68 3151.74 4330.3 8842.5 7433.26 4924.36 3868.26 2612.4 2033.5 2923.66 4475.86 6428.61 5950.46
068/69 3013.76 4081.8 2257 3312 2968.76 2552.1 1339.4 2279.1 3301.66 4487.6 3309.7 814
069/70 682.96 1938.6 3989.3 3612.86 2484.83 2057.26 1932.1 1840 2641.9 3007.7 3438.66 2555.3
070/71 3065.34 4762.8 4490.49 2641.3 3134.87 3537.56 2608.07 2780.1 3182.6 3963.26 5179.46 3389.84
071/72 2357.97 5560.5 6195.4 8281.96 5733.6 4430.26 3360.14 3418.9 3909 2305.2 5840.84 5859.16
072/73 4539.9 6909.66 8385.21 7294 5236.9 3890.26 3079.6 2731.3 3460 2305.2 7162.1 5294.24
073/74 4242.08 6606.5 8187.38 9022.08 6664.2 4508.32 3128.41 2952.1 4006.11 5477.3 7891 5913.1
074/75 7055.77 7352.96 10173.2 7536.6 4831.9 3607.9 2849.9 1355 794.7 3656.5 5678.3 6846.26
075/76 6021.66 7051.06 9947.53 6801.26 4738.9 3343.1 2656.72 2630.4 3646.96 6717.35 8131.76 7114.6

99
7. Monthly Energy Generation (MWh) of Devighat Hydropower Project
FY/MONTH Shrawan Bhadra Ashoj Kartik Mangsir Poush Magh Falgun Chaitra Baisakh Jestha Ashad
066/67 8117.25 6822.14 8496.74 8070.47 8593.35 7416.51 5807.39 5964.54 6744.28 7938.12 7872 8459.73
067/68 7414.15 7859.65 5873.4 0 5282.92 6195.96 6467.98 5933.61 6251.5 6196.62 6430.51 7369.43
068/69 9416.11 8338.54 9111.01 10180.66 9587.43 7240.13 4312.22 7264.76 8443.76 8988.31 9594.39 7846.06
069/70 7354.61 7477.56 8422.62 8194.8 10004.55 8549.09 7504.4 7470.31 8247.02 9247.04 8965.29 8649.85
070/71 8003.81 7680.56 8309.16 9077.2 8885.33 8956.69 9573.95 6561.18 6307.18 7810.33 8327.69 8275.71
071/72 7782.36 8735.77 9209.25 9251.27 9322.86 9276.21 7337.36 7684.29 9081.98 3215.71 7862.68 8449.1
072/73 9033.26 6914.42 6602.85 8939.6 8891.96 8994.86 7589.12 6948.52 7157.79 3215.71 7330.92 7535.29
073/74 7837.84 8092.38 7707.52 8613.44 8966.07 8679.58 7640.63 7007.29 6466.89 8246.34 8330.65 8138.78
074/75 7935.32 6712 8022.5 8811.54 8431.58 7039.53 6155.59 5203.94 6288.87 6254.12 6764.59 5327.68
075/76 5854.32 7415.5 6844.66 7841.9 6263.14 7136.13 7135.21 7053.69 7036.57 6204.44 8302.12 7922.24
8. Monthly Energy Generation (MWh) of Sunkoshi Hydropower Project
FY/MONTH Shrawan Bhadra Ashoj Kartik Mangsir Poush Magh Falgun Chaitra Baisakh Jestha Ashad
066/67 6707.8 6823.9 6784.3 6512.6 5231.5 3764.3 2956.1 2586.5 2716.5 2804.5 4284.7 5986.8
067/68 6500.2 6500.7 6698.6 6820.14 5245.5 3789.3 3160.7 2889.1 2763.35 3433.6 6966 6885.4
068/69 7213.2 6965.4 7150.6 7150.8 5715.6 4390.8 1849.2 3297.51 3704.9 3744.4 6335.21 7147.7
069/70 7131.3 7193.9 7151.2 7063.2 5097.5 3633.7 3148.3 3211.6 3338.2 5700.7 6632.2 5496.1
070/71 7049.4 6752.3 6683.11 6915 6298.02 4629.5 3512.8 3120.81 3355.16 3879.6 6164.9 6781
071/72 2943.6 483.1 0 0 3185.36 4326.86 3215.9 3170.81 3617.8 1539.7 0 0
072/73 2357 1653.8 2127.1 4766.5 4712.2 4272.4 3617.58 3193.26 2784.6 1539.7 1736 1379.7
073/74 8.6 2620.3 3118.53 6590.71 5727.7 3369.99 3318.02 2170.53 2590.27 3492.8 4593.9 3471.4
074/75 5117.7 4270.11 5829.1 5940.8 3279.9 3657.1 3092.1 3137.3 2242.9 2869.4 4495.4 5675.6
075/76 4199.4 5147.2 6451.18 6870.6 5314.6 3576.7 3260.2 3211.51 3566 6015.6 6688.9 6280.38

100
9. Monthly Energy Generation (MWh) of Puwa Khola Hydropower Project
FY/MONTH Shrawan Bhadra Ashoj Kartik Mangsir Poush Magh Falgun Chaitra Baisakh Jestha Ashad
066/67 3698.53 3387.11 4880.05 3697.23 2817.57 2070.33 1284.71 914.82 916.08 1327.68 1522.87 3499.14
067/68 3689.05 3527.08 3166.6 3694.9 1957.39 1887.9 1481.47 1005.97 1178.69 1965.41 2703.02 2895.17
068/69 3016.25 3525 3861.08 4196.44 2761.06 1621.49 829.65 989.8 1161.9 1074.23 1210.68 2305.64
069/70 4010.2 2576.23 3751.09 3372.501 2314.223 1523.45 1001.87 938.37 731.8 1783.25 2890.464 3543.738
070/71 4016.62 3341.265 3556.315 4143.968 2653.449 1935.966 1095.021 951.542 955.67 667.841 1301.707 3179.945
071/72 3363.55 3848.24 4043.28 4859.9 2544.6 1844.71 1438.38 1452.26 1208.94 1667.21 2013.66 2881.65
072/73 4097.5 3981.33 4178.6 4289.03 2700.38 2015.19 1701.45 1344.06 1281.01 1667.21 2697.12 4020.31
073/74 4454.13 4259.52 3787.42 4108.2 3407.82 2098.64 1449.16 1288.58 1701.26 3492.8 1854.23 3160.92
074/75 3364.03 3214.63 3044.25 2791.58 2043.08 1642.01 1188.98 1249.57 1129.05 2056.65 2553.851 3823.15
075/76 3947.77 3716.93 3918.34 3219.128 2189.61 1734.62 1317.366 1593.748 1295.64 1970.85 2413.61 2314.94
10. Monthly Energy Generation (MWh) of Chameliya Hydropower Project
FY/MONTH Shrawan Bhadra Ashoj Kartik Mangsir Poush Magh Falgun Chaitra Baisakh Jestha Ashad
074/75 6053.05 4839.03 6822.32 12669 12163.6 13141.26
075/76 9675.41 13407.2 21005.22 15770.6 10764.44 8576.56 6635.18 7887.41 12438.27 18363.49 17463.6 18913.12

101
Appendix - B: Monthly Energy Generations Of Storage Hydropower Projects

102
1. Monthly Energy Generation (MWh) of Kulekhani (I) Hydropower Project
FY/MONTH Shrawan Bhadra Ashoj Kartik Mangsir Poush Magh Falgun Chaitra Baisakh Jestha Ashad
066/67 4492 4641 5209 4625 6793 12672 9851 9951.5 10533.8 6798 5552 5866
067/68 9639 3018 4318.33 4141 5705 9781 12403 12528 16860 8016.73 6804.8 5651
068/69 7777 7668 13971 8070 7159 8651 5012 25971 25171 17192 4015 3767
069/70 5142 1749 462 1148 3958 8608 8281 15507 27394 10459 3613 6370
070/71 9615 3767 521 3000 4051 4539 9733 16711 15278 20471 5979 474
071/72 39 9 79 3177 3645 3732 9481 5494 9797 20800 22677 7243
072/73 626 171 221 723 297 5776 16038.57 9500 13184 20800 2844 3604
073/74 3946 576 236 723 918 6253 10773 13289 14234 13126 5978 3109
074/75 860 297 181 225 211 4345 5283 14322 12727 12669 6468 4573
075/76 4488 2894 2209 1349.85 2249 5878 5417 112.92 12936 20932 16616 13069
2. Monthly Energy Generation (MWh) of Kulekhani (II) Hydropower Project
FY/MONTH Shrawan Bhadra Ashoj Kartik Mangsir Poush Magh Falgun Chaitra Baisakh Jestha Ashad
066/67 2078 2141.66 2381.76 2185.29 3500.64 6537.84 4754.66 5041.18 5481.98 3471.96 2852.28 2642.3
067/68 4926.66 1478.04 2018.2 1892.11 3042.98 5113.01 6541 6565.7 8703.21 4144.24 3346.04 2727.19
068/69 3769.66 3559.85 6575.13 3765.22 3706.71 4499.95 2562.21 13196.17 12471.11 8913.67 2045.04 1894.26
069/70 2466.7 762.56 210.5 585.18 1948.4 4408.91 4212.37 7707.02 13636.35 1127.61 844.15 2120.33
070/71 4265.01 1686.17 228.84 1410.73 2004.29 2187.34 5074.59 8626 7659.03 10162.28 3057.42 235.87
071/72 18.9 0 25.58 1613.06 1942.35 2053.87 6614.14 2742.31 4744.73 16494.23 11188.16 3512.47
072/73 300.25 80.53 75.51 356.72 167.92 2980.03 8214.28 4847.48 6607.4 16494.23 1382.49 1720.97
073/74 1768.98 296.41 257.92 442.15 619.91 3176.09 5249.79 6573.28 7112.29 6770.2 3237.1 1643.38
074/75 526.5 176.5 231.3 266.3 281.1 2350.2 2727.4 7052.2 6453.2 6367.88 3062.27 2224.5
075/76 2094 1369.87 1054.3 701.1 1156.3 3031.2 2809.5 1359.9 6160 10042.5 8124.4 6547.8

103
Appendix - C: Monthly Energy Generations Of IPP Operated ROR Hydropower Projects

104
1. Monthly Energy Generation (MWh) of Khimti Hydropower Project
FY/MONTH Shrawan Bhadra Ashoj Kartik Mangsir Poush Magh Falgun Chaitra Baisakh Jestha Ashad
066/67 40432.04 43297.56 41627.19 39013.91 33352.08 25444.85 19338.77 16665.05 15104.44 18961.81 20027.61 41142.62
067/68 42176.65 41976.9 41876.03 38440.77 46866.59 26674.53 19950.6 18442.63 16050.54 21207.69 28973.34 43459.51
068/69 43116.86 41948.73 40880.08 40590.61 37241.85 27244.41 12800.25 17397.68 17603.91 16725.39 21357.01 40246.39
069/70 43341.93 42666.02 41099.02 42250.73 31463.22 23135.37 18884.2 17797.94 16154.87 18780.07 38149.84 43036.63
070/71 43126.63 42217.63 42478.02 42348.83 40213.18 29252.43 20633.25 18989.3 16999.19 16095.84 22284.83 42958.47
071/72 43160.72 56450.66 43787.52 42874.86 36354.27 28192.39 21089.32 20315.27 19393.21 24339.4 42123.28 42161.09
072/73 42384.27 42835.29 37909.54 40754.33 31247.9 24697.97 20305.58 17948.7 15339.55 23439.4 25690.44 42962.41
073/74 44149.92 43645.23 41826.62 43209.27 40455.18 29426.31 23152.66 17989.91 21483.41 19801.59 30482.53 39944.28
074/75 35367.63 37161.53 50657.73 42300.62 33717.62 24029.69 20065.43 17805.14 16658.17 18585.7 31374.5 44105.7
075/76 40784.3 43535.97 43493.39 41286.06 30468.76 23605.83 19727.66 17795.99 18422.91 24628.21 26886.28 41860.62
2. Monthly Energy Generation (MWh) of Chilime Hydropower Project
FY/MONTH Shrawan Bhadra Ashoj Kartik Mangsir Poush Magh Falgun Chaitra Baisakh Jestha Ashad
066/67 11260 11288 14073 14364 11089 8342 6251.4 6352.5 7765.5 9643 11723 14958.7
067/68 14427 15781 16250 15125 12227 8678 6654 5683 7417 12109 16073 16256
068/69 15968 16203 15708.8 15441 14337 9529.7 4303 6603 10407 12674 16944 14682
069/70 15884 16097 15817 14990.2 11478.55 8063 7131 7571.93 9838 14085 15768 16465
070/71 15952 16123 15949.8 16497 13673 9414 7218 6620 7967.6 10333 15343 16694
071/72 16207 13833 13284 16006 13126 10169 7663 7991.3 11500 5039 15612 16469
072/73 16371 15696 15960 15757 13778 9936 8022 7538 9679 11467 15278 14302
073/74 15441 15532 14694 14938.85 14996 10620 7451 7483 11783.9 13119.41 14707 16374
074/75 16185 15678 14889 13770 10553 8375 6979 5767 6986 10760 13115 15422.9
075/76 14529 16299 16622 15046 11507 7990 6566.42 7075 10864 15283 15717 15425

105
3. Monthly Energy Generation (MWh) of Indrawati Hydropower Project
FY/MONTH Shrawan Bhadra Ashoj Kartik Mangsir Poush Magh Falgun Chaitra Baisakh Jestha Ashad
066/67 4186.37 4354.51 4682.73 4167.26 3861.5 2790.12 2121.18 1757.25 1707.5 1966.21 2342.54 4760.74
067/68 5008.35 4581.6 3230.11 4371.29 3797.421 2932 2279.84 1871.78 1548.24 1832.94 2997.977 4498.7
068/69 4037.15 4578.12 4140.63 4845.175 3580.88 3066.32 1284.76 1827.69 2016.49 2017.57 1582.38 4586.2
069/70 4686.461 4405.25 4086.797 4352.09 4111.38 2620.63 1759.48 2048.75 1855.93 2400.71 3324.35 4070.55
070/71 4428.81 4295.76 4282.42 3847.47 3579.68 2961.356 1723.58 1920.32 1460.84 1639.307 2136.1 2490.665
071/72 4279.01 2284.68 4577.3 4172.02 3661.31 2991.03 1977.06 1701.73 2195.65 2121.01 3635.02 3339.47
072/73 3576.94 4100.09 3797.31 3720.47 2979.75 2637.28 2118.46 1897.77 1655.57 2246.05 1909.42 2315.98
073/74 2868.97 3813.4 3227.85 4014.208 3862.65 2835.47 2102.76 1822.6 1428.63 2011.55 2003.963 2525.22
074/75 2304.56 3151.28 3054.2 2132.46 2247.14 2058.03 1769.53 1564.08 1004.9 1481.74 2246.44 3293.02
075/76 4141.15 3763.3 4082.05 3463.34 3493.31 2363.43 1950.87 1485.73 1842.72 2056.52 2216.12 3190.08
4. Monthly Energy Generation (MWh) of Jhimruk Hydropower Project
FY/MONTH Shrawan Bhadra Ashoj Kartik Mangsir Poush Magh Falgun Chaitra Baisakh Jestha Ashad
066/67 2090.469 3812.809 7380.448 8103.175 7565.459 6584.773 4452.478 4150.654 3242.114 1705.908 832.47 4659.67
067/68 6853.332 4087.916 8322.498 7353.946 7979.817 7381.615 5584.688 4643.73 3880.981 2696.421 1476.328 3661.926
068/69 5150.74 4524.903 8028.941 8584.085 8277.924 7558.531 3741.571 4575.648 4093.939 1730.295 1119.41 4708.31
069/70 5406.158 5201.526 8359.326 8742.113 8153.055 4990.164 5639.765 5292.215 3509.593 2595.905 5343.988 4145.173
070/71 4772.267 5812.56 8442.747 8899.664 8405.986 7888.556 6623.319 6203.146 4362.91 2191.875 1454.204 4949.078
071/72 4398.66 7082.44 8034.24 8565.9 7974.91 8514.24 6566.88 6030.61 5168.16 3369.68 2366.27 6050.3
072/73 5568.9 6190.58 8034.31 8442.93 8074.17 6493.2 5198.09 4513.41 3650.52 3369.38 4162.9 6327.2
073/74 3795.05 5130.97 7105.06 8935.73 8865.65 6960.41 5740.01 5279.778 4400.83 2979.51 2961.591 2403.89
074/75 4874.37 4823.14 6074.05 8418.24 6651.98 6320.48 5330.56 3384.22 3430.95 2446.7 2650.771 4733.288
075/76 4888.38 5986.9 8202.08 8291.625 7173.32 6294.917 4629.038 6124.853 3344.608 2671.317 1972.258 4330.277
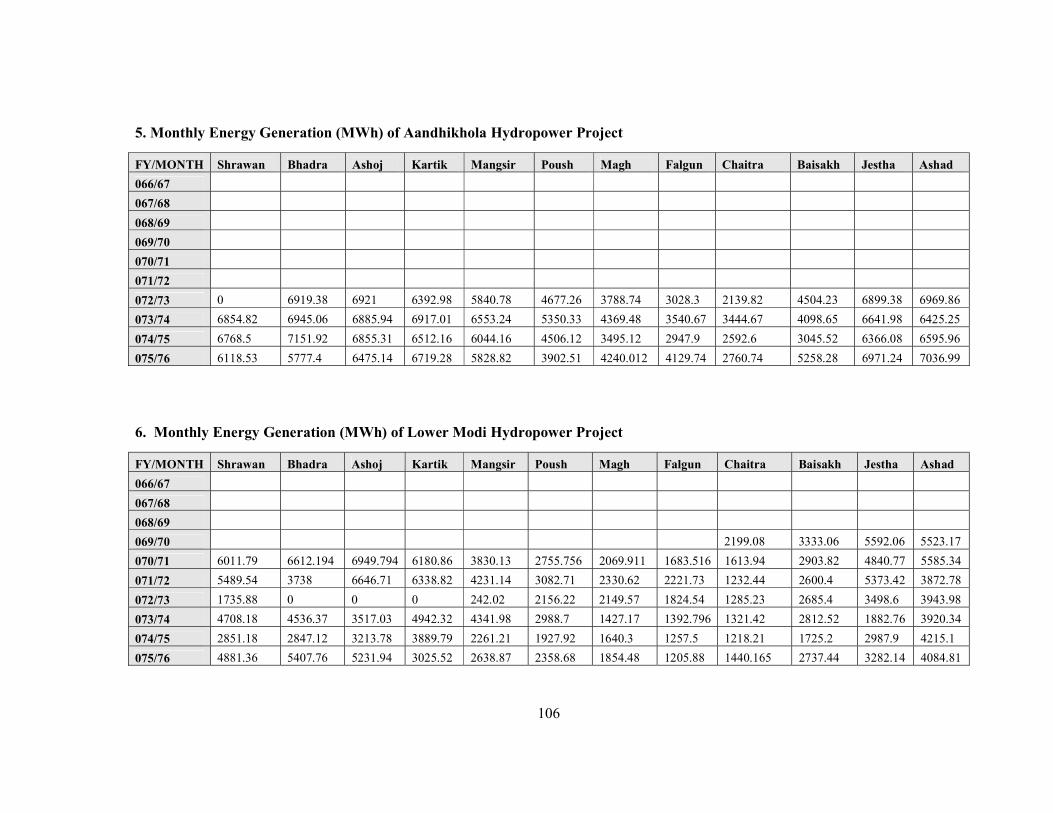
106
5. Monthly Energy Generation (MWh) of Aandhikhola Hydropower Project
FY/MONTH Shrawan Bhadra Ashoj Kartik Mangsir Poush Magh Falgun Chaitra Baisakh Jestha Ashad
066/67
067/68
068/69
069/70
070/71
071/72
072/73 0 6919.38 6921 6392.98 5840.78 4677.26 3788.74 3028.3 2139.82 4504.23 6899.38 6969.86
073/74 6854.82 6945.06 6885.94 6917.01 6553.24 5350.33 4369.48 3540.67 3444.67 4098.65 6641.98 6425.25
074/75 6768.5 7151.92 6855.31 6512.16 6044.16 4506.12 3495.12 2947.9 2592.6 3045.52 6366.08 6595.96
075/76 6118.53 5777.4 6475.14 6719.28 5828.82 3902.51 4240.012 4129.74 2760.74 5258.28 6971.24 7036.99
6. Monthly Energy Generation (MWh) of Lower Modi Hydropower Project
FY/MONTH Shrawan Bhadra Ashoj Kartik Mangsir Poush Magh Falgun Chaitra Baisakh Jestha Ashad
066/67
067/68
068/69
069/70 2199.08 3333.06 5592.06 5523.17
070/71 6011.79 6612.194 6949.794 6180.86 3830.13 2755.756 2069.911 1683.516 1613.94 2903.82 4840.77 5585.34
071/72 5489.54 3738 6646.71 6338.82 4231.14 3082.71 2330.62 2221.73 1232.44 2600.4 5373.42 3872.78
072/73 1735.88 0 0 0 242.02 2156.22 2149.57 1824.54 1285.23 2685.4 3498.6 3943.98
073/74 4708.18 4536.37 3517.03 4942.32 4341.98 2988.7 1427.17 1392.796 1321.42 2812.52 1882.76 3920.34
074/75 2851.18 2847.12 3213.78 3889.79 2261.21 1927.92 1640.3 1257.5 1218.21 1725.2 2987.9 4215.1
075/76 4881.36 5407.76 5231.94 3025.52 2638.87 2358.68 1854.48 1205.88 1440.165 2737.44 3282.14 4084.81

107
7. Monthly Energy Generation (MWh) of Bijaypur (I) Hydropower Project
FY/MONTH Shrawan Bhadra Ashoj Kartik Mangsir Poush Magh Falgun Chaitra Baisakh Jestha Ashad
066/67
067/68
068/69
069/70 2587.29 2703.753 2505.79 2354.614 2177.76 2094.56 1766.068 1458.95 1700.96 3100.93
070/71 3255.25 3126.53 2364.26 3206.337 2554.141 2508.55 2230.2 1995.791 1574.06 1528.536 1273.32 2292.39
071/72 2951.72 3064.54 2877.82 2109.79 955.55 403.77 0 166.82 1193.6 658.27 972.79 2113.34
072/73 3064.57 3274.28 2974.03 2606.51 2156.25 2292.62 2122.68 1949.92 1601.85 1728.16 1376.78 2661.88
073/74 2256.64 1588.96 1830.88 1874.43 1496.89 1464.57 1322.66 1139.755 1278.39 198.52 0 1553.03
074/75 2643.74 1986.76 2437.08 1815.83 1381.568 699.695 1097.27 1684.52 1135.5 128.82 73.44 525.65
075/76 1808.04 2569.23 2625.1 2158.67 1725.36 1729.95 1079.55 564.48 234.26 123.52 0 1194.7
8. Monthly Energy Generation (MWh) of Sanima Mai Hydropower Project
FY/MONTH Shrawan Bhadra Ashoj Kartik Mangsir Poush Magh Falgun Chaitra Baisakh Jestha Ashad
066/67
067/68
068/69
069/70
070/71
071/72 3110.01 4324.19 2251.89
072/73 2690.21 2187.95 5851.96 10891.88 6323.52 4897.62 3956.32 3073.33 2425.1 3293.08 6902.33 14489.22
073/74 16434.92 16424.29 15099.31 15889.12 9349.65 5687.24 3998.53 3319.988 4069.2 3442.08 6761.21 14393.61
074/75 13394.01 9942.109 14507.04 12028.21 6353.56 4674.72 3081.89 2843.59 2911.03 5886.363 11786.99 14419.88
075/76 16433.62 15132.87 15332.07 9563.178 5140.77 4248.89 2688.288 3691.276 3573.127 5393.249 5961.831 9375.214

108
9. Monthly Energy Generation (MWh) of Sipring Khola Hydropower Project
FY/MONTH Shrawan Bhadra Ashoj Kartik Mangsir Poush Magh Falgun Chaitra Baisakh Jestha Ashad
066/67
067/68
068/69
069/70
070/71 3491.952 2645.695 2593.351 3228.337 2480.424 1338.332 890.615 672.17 350.55 476.022 1663.476 6260.869
071/72 3882.775 6708.81 5880.81 4179.21 1952.458 1103.86 875.06 795.5 1323.53 785.61 0 0
072/73 0 9.07 0 0 0 0 0 0 0 688.42 1321.21 3852.09
073/74 4158.67 3805.81 1707.42 4278.648 2560.23 1338.09 1115.59 840.867 1292.29 1074.07 2681.95 5128.85
074/75 6332.92 4184.529 4634.92 3449.12 480.958 0 0 641.44 775.07 782.138 2670.252 5068.416
075/76 4099.19 5518.87 4764.32 2582.871 1460.57 1073.18 347.967 513.907 551.17 1245.58 1831.177 3745.225
10. Monthly Energy Generation (MWh) of Mai Khola Hydropower Project
FY/MONTH Shrawan Bhadra Ashoj Kartik Mangsir Poush Magh Falgun Chaitra Baisakh Jestha Ashad
066/67
067/68
068/69
069/70
070/71
071/72
072/73 1428.98 2307.87 2629.13 2110.09 1563.36 1062.96 913.95 793.02 576.63 1044.46 1423.86 2404.69
073/74 2547.59 2530.02 2147 2432.327 1455.97 1071.56 621 654.02 847.52 729.82 992.92 2202.1
074/75 1893.9 2231.2 1825.108 2319.68 1289.934 961.686 622.27 557.76 519.01 945.12 1728.14 2328.4
075/76 2323.89 2366.85 2150.42 1983.778 1135.64 914.77 662.812 642 629.156 1117.72 1110.08 2377.48

109
11. Monthly Energy Generation (MWh) of Khudi Hydropower Project
FY/MONTH Shrawan Bhadra Ashoj Kartik Mangsir Poush Magh Falgun Chaitra Baisakh Jestha Ashad
066/67
067/68
068/69
069/70 1131.94 1354.41 1720.348 2527.013
070/71 2487.44 2608.97 2634.834 2484.845 2023.95 1336.07 724.88 341.95 40.3 730.14 388.69 1496.47
071/72 2636.27 1235.64 1835.35 2015.67 1235.53 1123.23 381.91 528.09 343.91 736.66 765.57 998.8
072/73 1272.55 522.31 1505.04 2040.3 1904.81 1191.46 803.29 144.44 292.35 728.43 1282.82 937.03
073/74 662.06 1101.72 824.14 1151.13 2076.57 1157.65 728.11 694.58 704.39 1151.21 891.25 500.56
074/75 771.1 743.24 231.47 20.41 25 777.43 0 504.53 239.3 47.06 0 13.08
075/76 0 425.74 104.44 0 1256.1 0 0 0 0 0 0 0
12. Monthly Energy Generation (MWh) of Bhotekoshi Hydropower Project
FY/MONTH Shrawan Bhadra Ashoj Kartik Mangsir Poush Magh Falgun Chaitra Baisakh Jestha Ashad
066/67 26983.41 26224.99 25190.22 19519.39 16230.96 13732.12 10879.2 8188.382 10316.91 13175.71 13551.79 26941.44
067/68 26359.86 26066.79 25890.57 23756.27 16658.66 12477.82 11475.61 11188.27 10709.91 13639 21484.31 24208.47
068/69 26936.97 24300.64 25158.38 26644.91 19140.02 14455.58 7463.878 12528.36 9245.92 14532.48 23840 27123.11
069/70 29251.87 29976.13 28044.7 23697.83 17028.95 12778.64 10630.51 11596.43 12348.53 18188.78 29566.12 31240.52
070/71 33478.89 32674.05 32834.27 31150.93 20270.15 15451.68 12615.68 11901.11 13115.94 15768.69 25480.12 31858.07
071/72 16633.94 0 0 0 0 0 9567.57 12848.72 15099.67 6570.84 0 0
072/73 073/74
074/75
075/76

110
13. Monthly Energy Generation (MWh) of Upper Marsyangdi-A Hydropower Project
FY/MONTH Shrawan Bhadra Ashoj Kartik Mangsir Poush Magh Falgun Chaitra Baisakh Jestha Ashad
073/74 19575.3 17349.53 26280.19 34167.5 35178.88 33401
074/75 35310.79 35520.2 35688.36 35626.44 32479.23 26308.02 24973.22 18998.42 20793.71 23142.47 35712.1 35363.26
075/76 34908.41 35143.83 35532.52 34329.53 32805.36 23851.97 20356.84 18269.73 17608.55 30966.83 34977.25 34997.38
14. Monthly Energy Generation (MWh) of Upper Madi Hydropower Project
FY/MONTH Shrawan Bhadra Ashoj Kartik Mangsir Poush Magh Falgun Chaitra Baisakh Jestha Ashad
073/74 6012.92 5732.38 7078.82 9518.52 11194.4 9277.18
074/75 4213.97 11418.82 17779.66 13754.5 8239.888 7181.956 5634.74 5108.02 7737.36 5411.71 10707.86 16628.2
075/76 16020.43 10876.65 17948 11355.61 7209.8 5479.7 5318.48 5629.03 7275.7 7166.52 12918 9018

111
Appendix - D: Monthly Plant Capacity Factor Of NEA Operated ROR Hydropower Projects

112
1. Monthly Plant Capacity Factor of Kaligandaki – A Hydropower Project
FY/ MONTH Shrawan Bhadra Ashoj Kartik Mangsir Poush Magh Falgun Chaitra Baisakh Jestha Ashad
066/67 0.7707175 0.7450842 0.7759741 0.709239 0.7169174 0.4945601 0.3700327 0.3508777 0.4325713 0.506780 0.731221 0.6657
067/68 0.5142939 0.8473112 0.7981674 0.736005 0.6967206 0.6364679 0.3925636 0.3701485 0.3739797 0.508902 0.826581 0.8998
068/69 0.9379436 0.9177372 0.8630497 0.829195 0.7363040 0.5136381 0.2293431 0.3725723 0.4531153 0.507571 0.898948 0.8762
069/70 0.8647569 0.9439525 0.8713445 0.796074 0.6256944 0.4433256 0.4051118 0.3194830 0.4256269 0.610657 0.871701 0.9102
070/71 0.9474922 0.9275462 0.8779899 0.869667 0.7373167 0.5273726 0.4224826 0.3842013 0.3964583 0.517033 0.811834 0.9434
071/72 0.8959104 0.9145254 0.9050925 0.865711 0.7697337 0.6170428 0.4593460 0.4842206 0.5251350 0.587654 0.932986 0.9098
072/73 0.9323109 0.8978587 0.8993152 0.846296 0.6057098 0.4358796 0.3815104 0.3511091 0.4249228 0.587654 0.646074 0.6559
073/74 0.5806905 0.8650462 0.8729166 0.877594 0.7728202 0.5179976 0.4053915 0.3780285 0.4930748 0.587673 0.852671 0.9269
074/75 0.9831597 0.9831018 0.9912037 0.890335 0.6286265 0.4694830 0.3965181 0.3566261 0.3753375 0.483931 0.816377 1.0048
075/76 0.9436439 0.9450906 0.7296489 0.654166 0.6146315 0.4651234 0.4212673 0.4323881 0.5241126 0.881954 0.981066 0.9568
2. Monthly Plant Capacity Factor of Middle Marsyangdi Hydropower Project
FY/ MONTH Shrawan Bhadra Ashoj Kartik Mangsir Poush Magh Falgun Chaitra Baisakh Jestha Ashad
066/67 0.755743 0.8048738 0.6762914 0.748353 0.731775 0.5199960 0.4241865 0.3767261 0.4734563 0.639259 0.816821 0.77285
067/68 0.770577 0.6928452 0.7598293 0.755097 0.3891589 0.5468095 0.4154781 0.3924246 0.4133214 0.570055 0.889183 0.86510
068/69 0.854309 0.9202003 0.8508700 0.912657 0.7321071 0.5475426 0.2215849 0.4410039 0.5184960 0.618224 0.962743 0.89123
069/70 0.914190 0.9003773 0.8610519 0.821234 0.6657964 0.4815015 0.4280527 0.4168105 0.4511589 0.659222 0.924844 0.92198
070/71 0.941197 0.8551807 0.8623918 0.877077 0.7486462 0.5699093 0.4472186 0.4122926 0.4378218 0.597033 0.941884 0.96720
071/72 0.936900 0.9588160 0.9361055 0.937127 0.7410575 0.6054982 0.2348952 0.4688859 0.5249009 0.649608 0.946325 0.99851
072/73 1.026131 0.9886718 0.9860291 0.885578 0.6531240 0.4976190 0.4104511 0.3818261 0.4368452 0.649608 0.864079 0.98725
073/74 0.970880 0.9815303 0.9313964 0.943644 0.7648462 0.5381246 0.4223180 0.4100281 0.5481599 0.642283 0.869707 0.98809
074/75 1.015541 1.0095490 0.9983083 0.882289 0.6343009 0.4902398 0.3987992 0.2948488 0.4037003 0.540997 0.964551 1.07968
075/76 1.007129 0.9807174 1.0223746 0.886988 0.6365535 0.4847565 0.4184325 0.4610539 0.5613630 0.991249 1.014825 0.96166
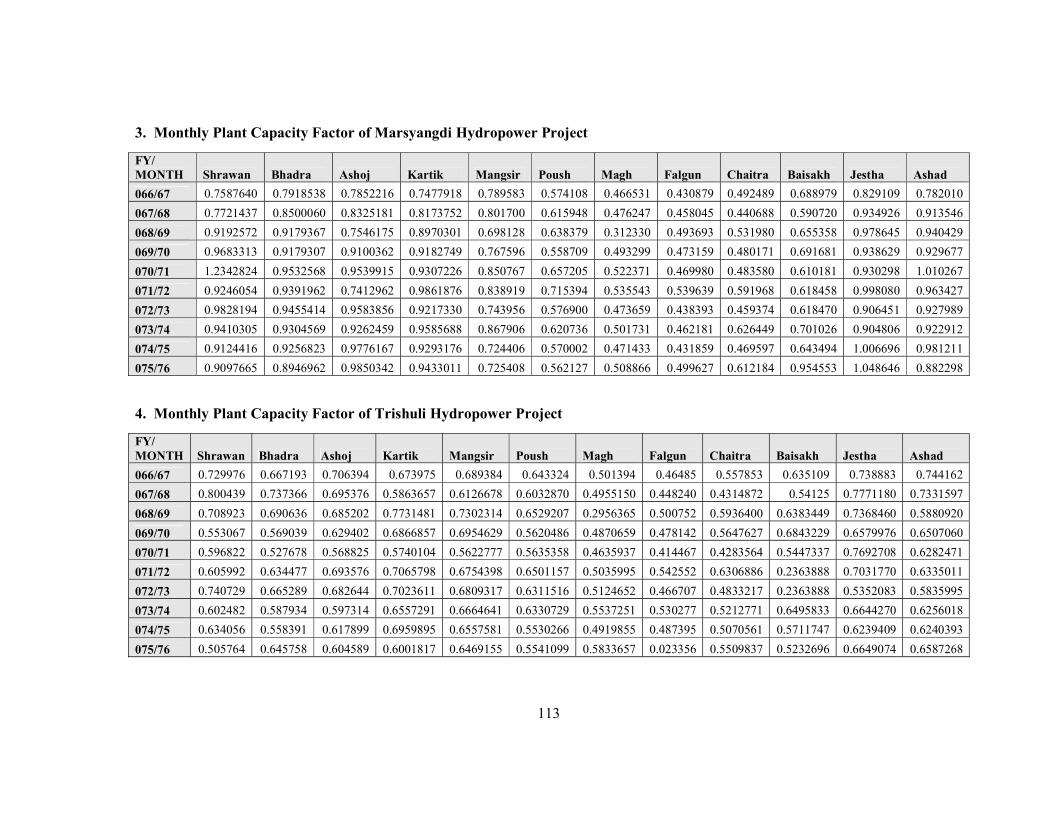
113
3. Monthly Plant Capacity Factor of Marsyangdi Hydropower Project
FY/ MONTH Shrawan Bhadra Ashoj Kartik Mangsir Poush Magh Falgun Chaitra Baisakh Jestha Ashad
066/67 0.7587640 0.7918538 0.7852216 0.7477918 0.789583 0.574108 0.466531 0.430879 0.492489 0.688979 0.829109 0.782010
067/68 0.7721437 0.8500060 0.8325181 0.8173752 0.801700 0.615948 0.476247 0.458045 0.440688 0.590720 0.934926 0.913546
068/69 0.9192572 0.9179367 0.7546175 0.8970301 0.698128 0.638379 0.312330 0.493693 0.531980 0.655358 0.978645 0.940429
069/70 0.9683313 0.9179307 0.9100362 0.9182749 0.767596 0.558709 0.493299 0.473159 0.480171 0.691681 0.938629 0.929677
070/71 1.2342824 0.9532568 0.9539915 0.9307226 0.850767 0.657205 0.522371 0.469980 0.483580 0.610181 0.930298 1.010267
071/72 0.9246054 0.9391962 0.7412962 0.9861876 0.838919 0.715394 0.535543 0.539639 0.591968 0.618458 0.998080 0.963427
072/73 0.9828194 0.9455414 0.9583856 0.9217330 0.743956 0.576900 0.473659 0.438393 0.459374 0.618470 0.906451 0.927989
073/74 0.9410305 0.9304569 0.9262459 0.9585688 0.867906 0.620736 0.501731 0.462181 0.626449 0.701026 0.904806 0.922912
074/75 0.9124416 0.9256823 0.9776167 0.9293176 0.724406 0.570002 0.471433 0.431859 0.469597 0.643494 1.006696 0.981211
075/76 0.9097665 0.8946962 0.9850342 0.9433011 0.725408 0.562127 0.508866 0.499627 0.612184 0.954553 1.048646 0.882298
4. Monthly Plant Capacity Factor of Trishuli Hydropower Project
FY/ MONTH Shrawan Bhadra Ashoj Kartik Mangsir Poush Magh Falgun Chaitra Baisakh Jestha Ashad
066/67 0.729976 0.667193 0.706394 0.673975 0.689384 0.643324 0.501394 0.46485 0.557853 0.635109 0.738883 0.744162
067/68 0.800439 0.737366 0.695376 0.5863657 0.6126678 0.6032870 0.4955150 0.448240 0.4314872 0.54125 0.7771180 0.7331597
068/69 0.708923 0.690636 0.685202 0.7731481 0.7302314 0.6529207 0.2956365 0.500752 0.5936400 0.6383449 0.7368460 0.5880920
069/70 0.553067 0.569039 0.629402 0.6866857 0.6954629 0.5620486 0.4870659 0.478142 0.5647627 0.6843229 0.6579976 0.6507060
070/71 0.596822 0.527678 0.568825 0.5740104 0.5622777 0.5635358 0.4635937 0.414467 0.4283564 0.5447337 0.7692708 0.6282471
071/72 0.605992 0.634477 0.693576 0.7065798 0.6754398 0.6501157 0.5035995 0.542552 0.6306886 0.2363888 0.7031770 0.6335011
072/73 0.740729 0.665289 0.682644 0.7023611 0.6809317 0.6311516 0.5124652 0.466707 0.4833217 0.2363888 0.5352083 0.5835995
073/74 0.602482 0.587934 0.597314 0.6557291 0.6664641 0.6330729 0.5537251 0.530277 0.5212771 0.6495833 0.6644270 0.6256018
074/75 0.634056 0.558391 0.617899 0.6959895 0.6557581 0.5530266 0.4919855 0.487395 0.5070561 0.5711747 0.6239409 0.6240393
075/76 0.505764 0.645758 0.604589 0.6001817 0.6469155 0.5541099 0.5833657 0.023356 0.5509837 0.5232696 0.6649074 0.6587268

114
5. Monthly Plant Capacity Factor of Gandak Hydropower Project
FY/ MONTH Shrawan Bhadra Ashoj Kartik Mangsir Poush Magh Falgun Chaitra Baisakh Jestha Ashad
066/67 0.2316481 0.082944 0.104212 0.055120 0.0904444 0.1686481 0.1048981 0.178875 0.0699629 0.0136851 0.0743333 0.124657
067/68 0.1857648 0.118990 0.172148 0.093611 0 0.1383240 0.14475 0.0829629 0.0455463 0 0 0.039814
068/69 0.1908629 0.234879 0.236138 0.016444 0 0 0.0467424 0.2645 0.0857777 0 0 0.036333
069/70 0.1929203 0.235916 0.318824 0.071648 0 0.1563055 0.1864166 0.1248240 0.0923796 0 0.1599166 0.229277
070/71 0.1333888 0.220574 0.244305 0.008537 0 0.1008796 0.0898240 0.0578148 0.0454148 0.008972 0.00275 0
071/72 0 0 0 0 0 0 0.0472870 0 0 0 0.118917
072/73 0.1747685 0.191101 0.222064 0.052796 0 0.2045463 0.2200648 0.2261759 0.0871388 0 0 0.119175
073/74 0.0873240 0.161848 0.178361 0.002638 0.0858981 0.2865555 0.2791759 0.2772685 0.1161111 0 0.1514583 0.316314
074/75 0.3121759 0 0.178509 0.080601 0 0.1822518 0.2436944 0.2784907 0.0820555 0 0.0050463 0.209444
075/76 0.1750185 0.151527 0.153977 0.018074 0 0.1496574 0.0782398 0.0064879 0.0655092 0 0.0443981 0.102945
6. Monthly Plant Capacity Factor of Modi Hydropower Project
FY/ MONTH Shrawan Bhadra Ashoj Kartik Mangsir Poush Magh Falgun Chaitra Baisakh Jestha Ashad
066/67 0.477240 0.338828 0.396771 0.466741 0.4517080 0.3375938 0.2323423 0.2279748 0.3479317 0.4050676 0.4467586 0.4085867
067/68 0.295771 0.406372 0.829814 0.697565 0.4621209 0.3630124 0.2451577 0.1908315 0.2743675 0.4200319 0.6032855 0.5584140
068/69 0.282822 0.383051 0.211805 0.310810 0.2785998 0.2394989 0.1256944 0.2138795 0.3098405 0.4211336 0.3105950 0.0763889
069/70 0.064091 0.181925 0.374371 0.339044 0.2331860 0.1930612 0.1813157 0.1726727 0.2479261 0.2822541 0.3226971 0.2397992
070/71 0.287663 0.446959 0.421404 0.247869 0.2941883 0.3319782 0.2447513 0.2608953 0.2986674 0.3719276 0.4860604 0.3181156
071/72 0.221281 0.521818 0.581400 0.777211 0.5380631 0.4157526 0.3153285 0.3208427 0.3668356 0.2163288 0.5481269 0.5498461
072/73 0.426041 0.648429 0.786900 0.684497 0.4914508 0.3650770 0.2890015 0.2563157 0.3246997 0.2163288 0.6721190 0.4968318
073/74 0.398093 0.619979 0.768335 0.846666 0.6253941 0.4230781 0.2935820 0.2770364 0.3759488 0.5140109 0.7405218 0.5549080
074/75 0.662140 0.690030 0.954692 0.707263 0.4534441 0.3385792 0.2674456 0.1271584 0.0745777 0.3431400 0.5328735 0.6424794
075/76 0.565095 0.661698 0.933514 0.638256 0.4447166 0.3137294 0.2493168 0.2468468 0.3422447 0.6303819 0.7631156 0.6676614

115
7. Monthly Plant Capacity Factor of Devighat Hydropower Project
FY/ MONTH Shrawan Bhadra Ashoj Kartik Mangsir Poush Magh Falgun Chaitra Baisakh Jestha Ashad
066/67 0.751597 0.631679 0.786735 0.747265 0.7956806 0.6867139 0.5377213 0.5522722 0.6244704 0.7350111 0.7288889 0.7833083
067/68 0.686495 0.727745 0.543833 0.000000 0.4891593 0.5737000 0.5988870 0.5494083 0.5788426 0.5737611 0.5954176 0.6823546
068/69 0.871862 0.772087 0.843612 0.942654 0.8877250 0.6703824 0.3992796 0.6726630 0.7818296 0.8322509 0.8883694 0.7264870
069/70 0.680982 0.692366 0.779872 0.758778 0.9263472 0.7915824 0.6948519 0.6916954 0.7636130 0.8562074 0.8301194 0.8009120
070/71 0.741093 0.711163 0.769366 0.840481 0.8227157 0.8293231 0.8864769 0.6075167 0.5839981 0.7231787 0.7710824 0.7662694
071/72 0.720588 0.808867 0.852708 0.856599 0.8632278 0.8589083 0.6793852 0.7115083 0.8409241 0.2977509 0.7280259 0.7823241
072/73 0.836413 0.640224 0.611375 0.827740 0.8233296 0.8328574 0.7026963 0.6433815 0.6627583 0.2977509 0.6787889 0.6977120
073/74 0.725725 0.749294 0.713659 0.797540 0.8301917 0.8036648 0.7074657 0.6488231 0.5987861 0.7635500 0.7713565 0.7535907
074/75 0.734751 0.621481 0.742824 0.815883 0.7807019 0.6518083 0.5699620 0.4818463 0.5823028 0.5790852 0.6263509 0.4933037
075/76 0.542066 0.686620 0.633764 0.726101 0.5799204 0.6607528 0.6606676 0.6531194 0.6515343 0.5744852 0.7687148 0.7335407
8. Monthly Plant Capacity Factor of Sunkoshi Hydropower Project
FY/ MONTH Shrawan Bhadra Ashoj Kartik Mangsir Poush Magh Falgun Chaitra Baisakh Jestha Ashad
066/67 0.927004 0.943049 0.937576 0.900028 0.722982 0.520218 0.408527 0.357449 0.375415 0.387576 0.592137 0.827363
067/68 0.898314 0.898383 0.925732 0.942529 0.724917 0.523673 0.436802 0.399268 0.381889 0.474516 0.962687 0.951548
068/69 0.996849 0.962604 0.988198 0.988226 0.789884 0.606799 0.255556 0.455709 0.512009 0.517468 0.875513 0.987797
069/70 0.985531 0.994182 0.988281 0.976119 0.704464 0.502170 0.435088 0.443836 0.461332 0.787825 0.916556 0.759549
070/71 0.974212 0.933154 0.923592 0.955638 0.870373 0.639787 0.485462 0.431289 0.463676 0.536153 0.851976 0.937120
071/72 0.406799 0.066763 0.000000 0.000000 0.440210 0.597963 0.444431 0.438199 0.499972 0.212783 0.000000 0.000000
072/73 0.325732 0.228552 0.293961 0.658720 0.651216 0.590437 0.499942 0.441302 0.384826 0.212783 0.239912 0.190672
073/74 0.001189 0.362120 0.430974 0.910822 0.791556 0.465726 0.458543 0.299963 0.357970 0.482698 0.634867 0.479740
074/75 0.707255 0.590120 0.805569 0.821006 0.453275 0.505404 0.427322 0.433568 0.309964 0.396545 0.621255 0.784356
075/76 0.580348 0.711332 0.891540 0.949502 0.734467 0.494292 0.450553 0.443824 0.492814 0.831343 0.924392 0.867935

116
9. Monthly Plant Capacity Factor of Puwa Khola Hydropower Project
FY/ MONTH Shrawan Bhadra Ashoj Kartik Mangsir Poush Magh Falgun Chaitra Baisakh Jestha Ashad
066/67 0.828524 0.758761 1.093201 0.828232 0.6311761 0.4637836 0.2877935 0.2049328 0.2052151 0.2974194 0.3411447 0.7838575
067/68 0.826400 0.790116 0.709363 0.827710 0.4384834 0.4229167 0.3318705 0.2253517 0.2640435 0.4402800 0.6055152 0.6485596
068/69 0.675683 0.789650 0.864937 0.940062 0.6185170 0.3632370 0.1858535 0.2217294 0.2602823 0.2406429 0.2712097 0.5164964
069/70 0.898342 0.577112 0.840297 0.755488 0.5184191 0.3412746 0.2244332 0.2102083 0.1639337 0.3994736 0.6475054 0.7938481
070/71 0.899780 0.748491 0.796665 0.928308 0.5944106 0.4336841 0.2453004 0.2131591 0.2140838 0.1496060 0.2916010 0.7123533
071/72 0.753483 0.862060 0.905752 1.088687 0.5700269 0.4132415 0.3222177 0.3253271 0.2708199 0.3734789 0.4510887 0.6455309
072/73 0.917899 0.891875 0.936066 0.960804 0.6049238 0.4514315 0.3811492 0.3010887 0.2869646 0.3734789 0.6041935 0.9006071
073/74 0.997789 0.954193 0.848436 0.920295 0.7634005 0.4701254 0.3246326 0.2886604 0.3811066 0.7824373 0.4153741 0.7080914
074/75 0.753590 0.720123 0.681955 0.625353 0.4576792 0.3678338 0.2663486 0.2799216 0.2529234 0.4607191 0.5720992 0.8564404
075/76 0.884357 0.832645 0.877764 0.721130 0.4905040 0.3885797 0.2951089 0.3570224 0.2902419 0.4414987 0.5406832 0.5185797
10. Monthly Energy Generation (MWh) of Chameliya Hydropower Project
FY/ MONTH Shrawan Bhadra Ashoj Kartik Mangsir Poush Magh Falgun Chaitra Baisakh Jestha Ashad
074/75 0 0 0 0 0 0 0.280234 0.224029 0.315848 0.586528 0.56313 0.608392
075/76 0.447935648 0.620704 0.972464 0.73012 0.498354 0.397063 0.307184 0.365158 0.575846 0.850162 0.8085 0.875607

117
Appendix - E: Monthly Plant Capacity Factor Of Storage Hydropower Projects

118
1. Monthly Plant Capacity Factor of Kulekhani (I) Hydropower Project
FY/ MONTH Shrawan Bhadra Ashoj Kartik Mangsir Poush Magh Falgun Chaitra Baisakh Jestha Ashad
066/67 0.103981 0.107431 0.120579 0.107060 0.157245 0.293333 0.228032 0.230359 0.243838 0.157361 0.128519 0.135787
067/68 0.223125 0.069861 0.099961 0.095856 0.132060 0.226412 0.287106 0.290000 0.390278 0.185572 0.157519 0.130810
068/69 0.180023 0.177500 0.323403 0.186806 0.165718 0.200255 0.116019 0.601181 0.582662 0.397963 0.092940 0.087199
069/70 0.119028 0.040486 0.010694 0.026574 0.091620 0.199259 0.191690 0.358958 0.634120 0.242106 0.083634 0.147454
070/71 0.222569 0.087199 0.012060 0.069444 0.093773 0.105069 0.225301 0.386829 0.353657 0.473866 0.138403 0.010972
071/72 0.000903 0.000208 0.001829 0.073542 0.084375 0.086389 0.219468 0.127176 0.226782 0.481481 0.524931 0.167662
072/73 0.014491 0.003958 0.005116 0.016736 0.006875 0.133704 0.371263 0.219907 0.305185 0.481481 0.065833 0.083426
073/74 0.091343 0.013333 0.005463 0.016736 0.021250 0.144745 0.249375 0.307616 0.329491 0.303843 0.138380 0.071968
074/75 0.019907 0.006875 0.004190 0.005208 0.004884 0.100579 0.122292 0.331528 0.294606 0.293264 0.149722 0.105856
075/76 0.103889 0.066991 0.051134 0.031247 0.052060 0.136065 0.125394 0.002614 0.299444 0.484537 0.384630 0.302523
2. Monthly Plant Capacity Factor of Kulekhani (II) Hydropower Project
FY/ MONTH Shrawan Bhadra Ashoj Kartik Mangsir Poush Magh Falgun Chaitra Baisakh Jestha Ashad
066/67 0.090191 0.092954 0.103375 0.094848 0.151938 0.283760 0.206365 0.218801 0.237933 0.150693 0.123797 0.114683
067/68 0.213831 0.064151 0.087595 0.082123 0.132074 0.221919 0.283898 0.284970 0.377743 0.179872 0.145227 0.118368
068/69 0.163614 0.154507 0.285379 0.163421 0.160882 0.195310 0.111207 0.572750 0.541281 0.386878 0.088760 0.082216
069/70 0.107062 0.033097 0.009136 0.025398 0.084566 0.191359 0.182829 0.334506 0.591855 0.048941 0.036638 0.092028
070/71 0.185113 0.073184 0.009932 0.061230 0.086992 0.094937 0.220251 0.374392 0.332423 0.441071 0.132701 0.010237
071/72 0.000820 0.000000 0.001110 0.070011 0.084303 0.089144 0.287072 0.119024 0.205934 0.715895 0.485597 0.152451
072/73 0.013032 0.003495 0.003277 0.015483 0.007288 0.129342 0.356523 0.210394 0.286780 0.715895 0.060004 0.074695
073/74 0.076779 0.012865 0.011194 0.019191 0.026906 0.137851 0.227855 0.285299 0.308693 0.293845 0.140499 0.071327
074/75 0.022852 0.007661 0.010039 0.011558 0.012201 0.102005 0.118377 0.306085 0.280087 0.276384 0.132911 0.096549
075/76 0.090885 0.059456 0.045760 0.030430 0.050187 0.131563 0.121940 0.059023 0.267361 0.435872 0.352622 0.284193

119
Appendix - F: Monthly Plant Capacity Factor Of IPP Operated ROR Hydropower Projects

120
1. Monthly Plant Capacity Factor of Khimti Hydropower Project
FY/ MONTH Shrawan Bhadra Ashoj Kartik Mangsir Poush Magh Falgun Chaitra Baisakh Jestha Ashad
066/67 0.935926 1.002258 0.963592 0.903099 0.7720389 0.5890012 0.4476567 0.3857650 0.3496398 0.4389308 0.4636021 0.9523755
067/68 0.976311 0.971687 0.969352 0.889832 1.0848748 0.6174660 0.4618194 0.4269127 0.3715403 0.4909188 0.6706792 1.0060072
068/69 0.998075 0.971035 0.946298 0.939597 0.8620799 0.6306576 0.2963021 0.4027241 0.4074979 0.3871618 0.4943752 0.9316294
069/70 1.003285 0.987639 0.951366 0.978026 0.7283153 0.5355410 0.4371343 0.4119894 0.3739553 0.4347238 0.8830981 0.9962183
070/71 0.998301 0.977260 0.983287 0.980297 0.9308606 0.6771396 0.4776215 0.4395671 0.3934998 0.3725889 0.5158525 0.9944090
071/72 0.999090 1.306728 1.013600 0.992473 0.8415340 0.6526016 0.4881787 0.4702609 0.4489169 0.5634120 0.9750759 0.9759512
072/73 0.981117 0.991557 0.877535 0.943387 0.7233310 0.5717123 0.4700366 0.4154792 0.3550822 0.5425787 0.5946861 0.9945002
073/74 1.021988 1.010306 0.968208 1.000214 0.9364625 0.6811646 0.5359412 0.4164331 0.4973012 0.4583701 0.7056141 0.9246361
074/75 0.818695 0.860220 1.172632 0.979181 0.7805005 0.5562428 0.4644775 0.4121560 0.3856058 0.4302245 0.7262616 1.0209653
075/76 0.944081 1.007777 1.006791 0.955695 0.7052954 0.5464313 0.4566588 0.4119442 0.4264563 0.5700975 0.6223676 0.9689958
2. Monthly Plant Capacity Factor of Chilime Hydropower Project
FY/ MONTH Shrawan Bhadra Ashoj Kartik Mangsir Poush Magh Falgun Chaitra Baisakh Jestha Ashad
066/67 0.707642 0.709401 0.884426 0.902714 0.6968954 0.5242584 0.3928733 0.3992270 0.4880279 0.6060206 0.7367396 0.9400892
067/68 0.906674 0.991767 1.021241 0.950540 0.7684138 0.5453746 0.4181750 0.3571518 0.4661262 0.7609980 1.0101181 1.0216189
068/69 1.003519 1.018288 0.987229 0.970399 0.9010181 0.5989002 0.2704248 0.4149698 0.6540347 0.7965058 1.0648567 0.9226998
069/70 0.998240 1.011626 0.994029 0.942068 0.7213769 0.5067245 0.4481523 0.4758629 0.6182755 0.8851810 0.9909502 1.0347536
070/71 1.002513 1.013260 1.002375 1.036764 0.8592886 0.5916290 0.4536199 0.4160382 0.5007290 0.6493841 0.9642408 1.0491453
071/72 1.018539 0.869343 0.834841 1.005907 0.8249120 0.6390774 0.4815862 0.5022185 0.7227250 0.3166792 0.9811463 1.0350050
072/73 1.028846 0.986425 1.003016 0.990258 0.8658874 0.6244344 0.5041478 0.4737305 0.6082831 0.7206511 0.9601559 0.8988185
073/74 0.970399 0.976118 0.923454 0.938841 0.9424334 0.6674208 0.4682629 0.4702740 0.7405669 0.8244979 0.9242710 1.0290347
074/75 1.017156 0.985294 0.935708 0.865384 0.6632102 0.5263323 0.4385998 0.3624309 0.4390397 0.6762192 0.8242207 0.9692622
075/76 0.913084 1.024321 1.044620 0.945575 0.7231649 0.5021368 0.4126709 0.4446330 0.6827552 0.9604701 0.9877451 0.9693942

121
3. Monthly Plant Capacity Factor of Indrawati Hydropower Project
FY/ MONTH Shrawan Bhadra Ashoj Kartik Mangsir Poush Magh Falgun Chaitra Baisakh Jestha Ashad
066/67 0.775253 0.806390 0.867172 0.771714 0.7150926 0.5166889 0.3928111 0.3254167 0.3162037 0.3641130 0.4338037 0.8816185
067/68 0.927472 0.848444 0.598168 0.809498 0.7032261 0.5429630 0.4221926 0.3466259 0.2867111 0.3394333 0.5551809 0.8330926
068/69 0.747620 0.847800 0.766783 0.897254 0.6631259 0.5678370 0.2379185 0.3384611 0.3734241 0.3736241 0.2930333 0.8492963
069/70 0.867863 0.815787 0.756814 0.805942 0.7613667 0.4853019 0.3258296 0.3793981 0.3436907 0.4445759 0.6156204 0.7538056
070/71 0.820150 0.795511 0.793040 0.712494 0.6629037 0.5483993 0.3191815 0.3556148 0.2705259 0.3035754 0.3955741 0.4612343
071/72 0.792409 0.423088 0.847648 0.772596 0.6780204 0.5538944 0.3661222 0.3151352 0.4066019 0.3927796 0.6731519 0.6184204
072/73 0.662396 0.759275 0.703205 0.688975 0.5518056 0.4883852 0.3923074 0.3514389 0.3065870 0.4159352 0.3535963 0.4288852
073/74 0.531290 0.706185 0.597750 0.743371 0.7153056 0.5250870 0.3894000 0.3375185 0.2645611 0.3725093 0.3711043 0.4676333
074/75 0.426770 0.583570 0.565592 0.394900 0.4161370 0.3811167 0.3276907 0.2896444 0.1860926 0.2743963 0.4160074 0.6098185
075/76 0.766879 0.696907 0.755935 0.641359 0.6469093 0.4376722 0.3612722 0.2751352 0.3412444 0.3808370 0.4103926 0.5907556
4. Monthly Plant Capacity Factor of Jhimruk Hydropower Project
FY/ MONTH Shrawan Bhadra Ashoj Kartik Mangsir Poush Magh Falgun Chaitra Baisakh Jestha Ashad
066/67 0.241952 0.441297 0.854218 0.937867 0.8756318 0.7621265 0.5153331 0.4803998 0.3752447 0.1974431 0.0963507 0.5393137
067/68 0.793209 0.473138 0.963252 0.851151 0.9235899 0.8543536 0.6463759 0.5374688 0.4491876 0.3120858 0.1708713 0.4238340
068/69 0.596150 0.523715 0.929275 0.993528 0.9580931 0.8748300 0.4330522 0.5295889 0.4738355 0.2002656 0.1295613 0.5449433
069/70 0.625712 0.602028 0.967514 1.011818 0.9436406 0.5775653 0.6527506 0.6125249 0.4062029 0.3004520 0.6185171 0.4797654
070/71 0.552345 0.672750 0.977169 1.030053 0.9729150 0.9130273 0.7665878 0.7179567 0.5049664 0.2536892 0.1683106 0.5728100
071/72 0.509104 0.819726 0.929888 0.991423 0.9230220 0.9854444 0.7600556 0.6979873 0.5981667 0.3900093 0.2738738 0.7002662
072/73 0.644548 0.716502 0.929897 0.977191 0.9345104 0.7515278 0.6016308 0.5223854 0.4225139 0.3899745 0.4818171 0.7323148
073/74 0.439241 0.593862 0.822344 1.034228 1.0261169 0.8056030 0.6643530 0.6110854 0.5093553 0.3448507 0.3427767 0.2782280
074/75 0.564163 0.558233 0.703015 0.974333 0.7699051 0.7315370 0.6169630 0.3916921 0.3971007 0.2831829 0.3068022 0.5478343
075/76 0.565784 0.692928 0.949314 0.959678 0.8302454 0.7285784 0.5357683 0.7088950 0.3871074 0.3091802 0.2282706 0.5011895

122
5. Monthly Plant Capacity Factor of Aandhikhola Hydropower Project
FY/ MONTH Shrawan Bhadra Ashoj Kartik Mangsir Poush Magh Falgun Chaitra Baisakh Jestha Ashad
066/67 0.0000 0.0000 0.0000 0.0000 0.0000 0.0000 0.0000 0.0000 0.0000 0.0000 0.0000 0.0000
067/68 0.0000 0.0000 0.0000 0.0000 0.0000 0.0000 0.0000 0.0000 0.0000 0.0000 0.0000 0.0000
068/69 0.0000 0.0000 0.0000 0.0000 0.0000 0.0000 0.0000 0.0000 0.0000 0.0000 0.0000 0.0000
069/70 0.0000 0.0000 0.0000 0.0000 0.0000 0.0000 0.0000 0.0000 0.0000 0.0000 0.0000 0.0000
070/71 0.0000 0.0000 0.0000 0.0000 0.0000 0.0000 0.0000 0.0000 0.0000 0.0000 0.0000 0.0000
071/72 0.0000 0.0000 0.0000 0.0000 0.0000 0.0000 0.0000 0.0000 0.0000 0.0000 0.0000 0.0000
072/73 0.0000 1.0224 1.0226 0.9446 0.8630 0.6911 0.5598 0.4474 0.3162 0.6655 1.0194 1.0298
073/74 1.0128 1.0262 1.0174 1.0220 0.9683 0.7905 0.6456 0.5231 0.5090 0.6056 0.9814 0.9494
074/75 1.0001 1.0567 1.0129 0.9622 0.8930 0.6658 0.5164 0.4356 0.3831 0.4500 0.9406 0.9746
075/76 0.9040 0.8536 0.9567 0.9928 0.8612 0.5766 0.6265 0.6102 0.4079 0.7769 1.0300 1.0397
6. Monthly Energy Generation (MWh) of Lower Modi Hydropower Project
FY/ MONTH Shrawan Bhadra Ashoj Kartik Mangsir Poush Magh Falgun Chaitra Baisakh Jestha Ashad
066/67 0.0000 0.0000 0.0000 0.0000 0.0000 0.0000 0.0000 0.0000 0.0000 0.0000 0.0000 0.0000
067/68 0.0000 0.0000 0.0000 0.0000 0.0000 0.0000 0.0000 0.0000 0.0000 0.0000 0.0000 0.0000
068/69 0.0000 0.0000 0.0000 0.0000 0.0000 0.0000 0.0000 0.0000 0.0000 0.0000 0.0000 0.0000
069/70 0.0000 0.0000 0.0000 0.0000 0.0000 0.0000 0.0000 0.0000 0.3054 0.4629 0.7767 0.7671
070/71 0.8350 0.9184 0.9652 0.8585 0.5320 0.3827 0.2875 0.2338 0.2242 0.4033 0.6723 0.7757
071/72 0.7624 0.5192 0.9232 0.8804 0.5877 0.4282 0.3237 0.3086 0.1712 0.3612 0.7463 0.5379
072/73 0.2411 0.0000 0.0000 0.0000 0.0336 0.2995 0.2986 0.2534 0.1785 0.3730 0.4859 0.5478
073/74 0.6539 0.6301 0.4885 0.6864 0.6031 0.4151 0.1982 0.1934 0.1835 0.3906 0.2615 0.5445
074/75 0.3960 0.3954 0.4464 0.5402 0.3141 0.2678 0.2278 0.1747 0.1692 0.2396 0.4150 0.5854
075/76 0.6780 0.7511 0.7267 0.4202 0.3665 0.3276 0.2576 0.1675 0.2000 0.3802 0.4559 0.5673

123
7. Monthly Plant Capacity Factor of Bijaypur (I) Hydropower Project
FY/ MONTH Shrawan Bhadra Ashoj Kartik Mangsir Poush Magh Falgun Chaitra Baisakh Jestha Ashad
066/67 0.000000 0.000000 0.000000 0.000000 0.0000000 0.0000000 0.0000000 0.0000000 0.0000000 0.0000000 0.0000000 0.0000000
067/68 0.000000 0.000000 0.000000 0.000000 0.0000000 0.0000000 0.0000000 0.0000000 0.0000000 0.0000000 0.0000000 0.0000000
068/69 0.000000 0.000000 0.000000 0.000000 0.0000000 0.0000000 0.0000000 0.0000000 0.0000000 0.0000000 0.0000000 0.0000000
069/70 0.000000 0.000000 0.814843 0.851522 0.7891755 0.7415640 0.6858655 0.6596624 0.5562069 0.4594829 0.5357017 0.9766093
070/71 1.025211 0.984671 0.744601 1.009806 0.8044032 0.7900447 0.7023810 0.6285560 0.4957357 0.4813983 0.4010204 0.7219671
071/72 0.929617 0.965148 0.906342 0.664458 0.3009417 0.1271636 0.0000000 0.0525384 0.3759133 0.2073161 0.3063713 0.6655770
072/73 0.965158 1.031204 0.936643 0.820896 0.6790911 0.7220396 0.6685185 0.6141093 0.5044879 0.5442681 0.4336042 0.8383346
073/74 0.710708 0.500428 0.576618 0.590334 0.4714317 0.4612528 0.4165596 0.3589553 0.4026172 0.0625220 0.0000000 0.4891125
074/75 0.832621 0.625711 0.767535 0.571878 0.4351121 0.2203625 0.3455751 0.5305241 0.3576153 0.0405707 0.0231293 0.1655486
075/76 0.569425 0.809155 0.826751 0.679853 0.5433862 0.5448318 0.3399943 0.1777778 0.0737780 0.0389015 0.0000000 0.3762598
8. Monthly Plant Capacity Factor of Sanima Mai Hydropower Project
FY/ MONTH Shrawan Bhadra Ashoj Kartik Mangsir Poush Magh Falgun Chaitra Baisakh Jestha Ashad
066/67 0.0000 0.0000 0.0000 0.0000 0.0000 0.0000 0.0000 0.0000 0.0000 0.0000 0.0000 0.0000
067/68 0.0000 0.0000 0.0000 0.0000 0.0000 0.0000 0.0000 0.0000 0.0000 0.0000 0.0000 0.0000
068/69 0.0000 0.0000 0.0000 0.0000 0.0000 0.0000 0.0000 0.0000 0.0000 0.0000 0.0000 0.0000
069/70 0.0000 0.0000 0.0000 0.0000 0.0000 0.0000 0.0000 0.0000 0.0000 0.0000 0.0000 0.0000
070/71 0.0000 0.0000 0.0000 0.0000 0.0000 0.0000 0.0000 0.0000 0.0000 0.0000 0.0000 0.0000
071/72 0.0000 0.0000 0.0000 0.0000 0.0000 0.0000 0.0000 0.0000 0.0000 0.1963 0.2730 0.1422
072/73 0.1698 0.1381 0.3694 0.6876 0.3992 0.3092 0.2498 0.1940 0.1531 0.2079 0.4358 0.9147
073/74 1.0376 1.0369 0.9532 1.0031 0.5903 0.3590 0.2524 0.2096 0.2569 0.2173 0.4268 0.9087
074/75 0.8456 0.6277 0.9158 0.7594 0.4011 0.2951 0.1946 0.1795 0.1838 0.3716 0.7441 0.9103
075/76 1.0375 0.9554 0.9679 0.6037 0.3245 0.2682 0.1697 0.2330 0.2256 0.3405 0.3764 0.5919

124
9. Monthly Plant Capacity Factor of Sipring Khola Hydropower Project
FY/ MONTH Shrawan Bhadra Ashoj Kartik Mangsir Poush Magh Falgun Chaitra Baisakh Jestha Ashad
066/67 0.0000 0.0000 0.0000 0.0000 0.0000 0.0000 0.0000 0.0000 0.0000 0.0000 0.0000 0.0000
067/68 0.0000 0.0000 0.0000 0.0000 0.0000 0.0000 0.0000 0.0000 0.0000 0.0000 0.0000 0.0000
068/69 0.0000 0.0000 0.0000 0.0000 0.0000 0.0000 0.0000 0.0000 0.0000 0.0000 0.0000 0.0000
069/70 0.0000 0.0000 0.0000 0.0000 0.0000 0.0000 0.0000 0.0000 0.0000 0.0000 0.0000 0.0000
070/71 0.4850 0.3675 0.3602 0.4484 0.3445 0.1859 0.1237 0.0934 0.0487 0.0661 0.2310 0.8696
071/72 0.5393 0.9318 0.8168 0.5804 0.2712 0.1533 0.1215 0.1105 0.1838 0.1091 0.0000 0.0000
072/73 0.0000 0.0013 0.0000 0.0000 0.0000 0.0000 0.0000 0.0000 0.0000 0.0956 0.1835 0.5350
073/74 0.5776 0.5286 0.2371 0.5943 0.3556 0.1858 0.1549 0.1168 0.1795 0.1492 0.3725 0.7123
074/75 0.8796 0.5812 0.6437 0.4790 0.0668 0.0000 0.0000 0.0891 0.1076 0.1086 0.3709 0.7039
075/76 0.5693 0.7665 0.6617 0.3587 0.2029 0.1491 0.0483 0.0714 0.0766 0.1730 0.2543 0.5202
10. Monthly Plant Capacity Factor of Mai Khola Hydropower Project
FY/ MONTH Shrawan Bhadra Ashoj Kartik Mangsir Poush Magh Falgun Chaitra Baisakh Jestha Ashad
066/67 0.0000 0.0000 0.0000 0.0000 0.0000 0.0000 0.0000 0.0000 0.0000 0.0000 0.0000 0.0000
067/68 0.0000 0.0000 0.0000 0.0000 0.0000 0.0000 0.0000 0.0000 0.0000 0.0000 0.0000 0.0000
068/69 0.0000 0.0000 0.0000 0.0000 0.0000 0.0000 0.0000 0.0000 0.0000 0.0000 0.0000 0.0000
069/70 0.0000 0.0000 0.0000 0.0000 0.0000 0.0000 0.0000 0.0000 0.0000 0.0000 0.0000 0.0000
070/71 0.0000 0.0000 0.0000 0.0000 0.0000 0.0000 0.0000 0.0000 0.0000 0.0000 0.0000 0.0000
071/72 0.0000 0.0000 0.0000 0.0000 0.0000 0.0000 0.0000 0.0000 0.0000 0.0000 0.0000 0.0000
072/73 0.4410 0.7123 0.8115 0.6513 0.4825 0.3281 0.2821 0.2448 0.1780 0.3224 0.4395 0.7422
073/74 0.7863 0.7809 0.6627 0.7507 0.4494 0.3307 0.1917 0.2019 0.2616 0.2253 0.3065 0.6797
074/75 0.5845 0.6886 0.5633 0.7160 0.3981 0.2968 0.1921 0.1721 0.1602 0.2917 0.5334 0.7186
075/76 0.7173 0.7305 0.6637 0.6123 0.3505 0.2823 0.2046 0.1981 0.1942 0.3450 0.3426 0.7338

125
11. Monthly Plant Capacity Factor of Khudi Hydropower Project
FY/ MONTH Shrawan Bhadra Ashoj Kartik Mangsir Poush Magh Falgun Chaitra Baisakh Jestha Ashad
066/67 0.0000 0.0000 0.0000 0.0000 0.0000 0.0000 0.0000 0.0000 0.0000 0.0000 0.0000 0.0000
067/68 0.0000 0.0000 0.0000 0.0000 0.0000 0.0000 0.0000 0.0000 0.0000 0.0000 0.0000 0.0000
068/69 0.0000 0.0000 0.0000 0.0000 0.0000 0.0000 0.0000 0.0000 0.0000 0.0000 0.0000 0.0000
069/70 0.0000 0.0000 0.0000 0.0000 0.0000 0.0000 0.0000 0.0000 0.3930 0.4703 0.5973 0.8774
070/71 0.8637 0.9059 0.9149 0.8628 0.7028 0.4639 0.2517 0.1187 0.0140 0.2535 0.1350 0.5196
071/72 0.9154 0.4290 0.6373 0.6999 0.4290 0.3900 0.1326 0.1834 0.1194 0.2558 0.2658 0.3468
072/73 0.4419 0.1814 0.5226 0.7084 0.6614 0.4137 0.2789 0.0502 0.1015 0.2529 0.4454 0.3254
073/74 0.2299 0.3825 0.2862 0.3997 0.7210 0.4020 0.2528 0.2412 0.2446 0.3997 0.3095 0.1738
074/75 0.2677 0.2581 0.0804 0.0071 0.0087 0.2699 0.0000 0.1752 0.0831 0.0163 0.0000 0.0045
075/76 0.0000 0.1478 0.0363 0.0000 0.4361 0.0000 0.0000 0.0000 0.0000 0.0000 0.0000 0.0000
12. Monthly Plant Capacity Factor of Bhotekoshi Hydropower Project
FY/ MONTH Shrawan Bhadra Ashoj Kartik Mangsir Poush Magh Falgun Chaitra Baisakh Jestha Ashad
066/67 1.041027 1.011767 0.971845 0.753063 0.626194 0.529789 0.419722 0.315910 0.398029 0.508322 0.522831 1.039407
067/68 1.016970 1.005663 0.998865 0.916523 0.642695 0.481397 0.442732 0.431646 0.413191 0.526196 0.828870 0.933969
068/69 1.039235 0.937525 0.970617 1.027967 0.738427 0.557700 0.287958 0.483347 0.356710 0.560667 0.919753 1.046416
069/70 1.128544 1.156486 1.081971 0.914268 0.656981 0.493003 0.410128 0.447393 0.476409 0.701728 1.140668 1.205267
070/71 1.291624 1.260573 1.266754 1.201811 0.782027 0.596130 0.486716 0.459148 0.506016 0.608360 0.983029 1.229092
071/72 0.641742 0.000000 0.000000 0.000000 0.000000 0.000000 0.369119 0.495707 0.582549 0.253505 0.000000 0.000000
072/73 0.000000 0.000000 0.000000 0.000000 0.000000 0.000000 0.000000 0.000000 0.000000 0.000000 0.000000 0.000000
073/74 0.000000 0.000000 0.000000 0.000000 0.000000 0.000000 0.000000 0.000000 0.000000 0.000000 0.000000 0.000000
074/75 0.000000 0.000000 0.000000 0.000000 0.000000 0.000000 0.000000 0.000000 0.000000 0.000000 0.000000 0.000000
075/76 0.000000 0.000000 0.000000 0.000000 0.000000 0.000000 0.000000 0.000000 0.000000 0.000000 0.000000 0.000000

126
13. Monthly Plant Capacity Factor of Upper Marsyangdi-A Hydropower Project
FY/ MONTH Shrawan Bhadra Ashoj Kartik Mangsir Poush Magh Falgun Chaitra Baisakh Jestha Ashad
073/74 0.000000 0.000000 0.000000 0.000000 0.000000 0.000000 0.543758 0.481931 0.730005 0.949097 0.977191 0.927806
074/75 0.980855 0.986672 0.991343 0.989623 0.902201 0.730778 0.693701 0.527734 0.577603 0.642846 0.992003 0.982313
075/76 0.969678 0.976218 0.987014 0.953598 0.91126 0.662555 0.565468 0.507493 0.489126 0.86019 0.97159 0.972149
14. Monthly Plant Capacity Factor of Upper Madi Hydropower Project
FY/ MONTH Shrawan Bhadra Ashoj Kartik Mangsir Poush Magh Falgun Chaitra Baisakh Jestha Ashad
073/74 0.000000 0.000000 0.000000 0.000000 0.000000 0.000000 0.334051 0.318466 0.393268 0.528807 0.621911 0.515399
074/75 0.234109 0.634379 0.987759 0.764139 0.457772 0.398998 0.313041 0.283779 0.429853 0.300651 0.594881 0.923789
075/76 0.890024 0.604258 0.997111 0.630867 0.400544 0.304428 0.295471 0.312724 0.404206 0.39814 0.717667 0.501

127
Appendix - G: Average Monthly Plant Capacity Factor & Weightage Average Monthly Plant Capacity Factor Of NEA Operated RoR Hydropower Projects, Storage Hydrpower Projects & IPP Operated RoR Hydropower Projects

128
1. Monthly Average Plant Capacity Factor of NEA Operated ROR Hydropower Projects
PROJECTS/ MONTHS Shrawan Bhadra Ashoj Kartik Mangshir Poush Magh Falgun Chaitra Baisakh Jestha Ashad
Kaligandaki -A 0.837092 0.898725 0.858470 0.807429 0.690448 0.512089 0.388357 0.379966 0.442433 0.577981 0.836946 0.874985 Middle Marsyangdi 0.919260 0.909276 0.888465 0.865005 0.669737 0.528200 0.382142 0.405590 0.476922 0.655754 0.919497 0.943361
Marsyangdi 0.932344 0.906656 0.882496 0.905030 0.780837 0.608951 0.476201 0.469746 0.518848 0.677292 0.947629 0.925377
Trishuli 0.647826 0.628377 0.648123 0.665503 0.661553 0.604659 0.488835 0.435675 0.526943 0.526057 0.687178 0.646984
Gandak 0.187097 0.161132 0.200949 0.044386 0.088171 0.173396 0.147053 0.154469 0.076655 0.011329 0.072984 0.144098
Modi 0.368024 0.489909 0.625901 0.571593 0.427287 0.332136 0.244394 0.229445 0.296304 0.382061 0.542615 0.451303
Devighat 0.729158 0.704153 0.727775 0.731304 0.779900 0.735969 0.643739 0.621223 0.666906 0.623303 0.738711 0.721980
Sunkoshi 0.680323 0.669026 0.798380 0.900288 0.688334 0.544647 0.430222 0.414441 0.423987 0.483969 0.735477 0.754009
Puwa Khola 0.843585 0.792503 0.855444 0.859607 0.568754 0.411611 0.286471 0.262740 0.258961 0.395903 0.474041 0.708436
Chameliya 0.447936 0.620704 0.972464 0.730120 0.498354 0.397063 0.293709 0.294594 0.445847 0.718345 0.685815 0.742000
2. Weightage Monthly Average Plant Capacity Factor of NEA Operated ROR Hydropower Projects
MONTHS Shrawan Bhadra Ashoj Kartik Mangshir Poush Magh Falgun Chaitra Baisakh Jestha Ashad Weightage Monthly Average Plant Capacity Factor 0.777453 0.806920 0.823904 0.782855 0.655196 0.516865 0.397080 0.396320 0.462813 0.594116 0.807827 0.827334

129
3. Monthly Average Plant Capacity Factor of Storage Hydropower Projects
PROJECTS/ MONTHS Shrawan Bhadra Ashoj Kartik Mangshir Poush Magh Falgun Chaitra Baisakh Jestha Ashad
Kulekhani (I) 0.107926 0.057384 0.063443 0.062921 0.080986 0.162581 0.213594 0.285617 0.366006 0.350148 0.186451 0.124366
Kulekhani (II) 0.096417 0.055708 0.056679 0.057369 0.0797335 0.157718 0.211631 0.2765245 0.343009 0.364534 0.169875 0.109674
4. Weightage Monthly Average Plant Capacity Factor of Storage Hydropower Projects
MONTHS Shrawan Bhadra Ashoj Kartik Mangshir Poush Magh Falgun Chaitra Baisakh Jestha Ashad Weightage Monthly Average Plant Capacity Factor 0.103923 0.056801 0.061091 0.060990 0.080550 0.160890 0.212911 0.282454 0.358007 0.355152 0.180686 0.119256

130
5. Monthly Average Plant Capacity Factor of IPP Operated ROR Hydropower Projects
PROJECTS/
MONTHS Shrawan Bhadra Ashoj Kartik Mangshir Poush Magh Falgun Chaitra Baisakh Jestha Ashad
Khimti 0.9677 1.0086 0.9853 0.9562 0.8365 0.6058 0.4536 0.4193 0.4009 0.4689 0.6652 0.9766
Chilime 0.9567 0.9586 0.9631 0.9548 0.7967 0.5726 0.4289 0.4317 0.5921 0.7197 0.9444 0.9870
Indrawati 0.7318 0.7283 0.7252 0.7238 0.6514 0.5047 0.3535 0.3314 0.3096 0.3662 0.4517 0.6495
Jhimruk 0.5532 0.6094 0.9026 0.9761 0.9158 0.7985 0.6193 0.5810 0.4524 0.2981 0.2817 0.5320
Aandhikhola 0.9723 0.9897 1.0024 0.9804 0.8964 0.6810 0.5871 0.5041 0.4040 0.6245 0.9929 0.9984
Lower Modi 0.5944 0.6428 0.7100 0.6771 0.4061 0.3535 0.2656 0.2219 0.2046 0.3730 0.5448 0.6180
Bijaypur (I) 0.5033 0.4916 0.5573 0.5189 0.4024 0.3607 0.5265 0.3022 0.2766 0.1834 0.3400 0.4233
Sanima Mai 0.7726 0.6895 0.8016 0.7635 0.4288 0.3079 0.2166 0.2040 0.2048 0.2667 0.4512 0.6936
Sipring Khola 0.6102 0.5295 0.5439 0.4922 0.2482 0.1685 0.1121 0.0962 0.1192 0.1169 0.2824 0.6682
Mai Khola 0.6323 0.7281 0.6753 0.6826 0.4201 0.3095 0.2176 0.2042 0.1985 0.2961 0.4055 0.7186
Khudi 0.5437 0.3841 0.4129 0.5356 0.4932 0.3879 0.2290 0.1537 0.1593 0.2748 0.3506 0.3746
Bhotekoshi 1.0265 1.0744 1.0580 0.9627 0.6893 0.5316 0.4027 0.4389 0.4555 0.5265 0.8790 1.0908
Upper Marsyangdi A 0.9753 0.9814 0.9892 0.9716 0.9067 0.6967 0.6010 0.5057 0.5989 0.8174 0.9803 0.9608
Upper Madi 0.5621 0.6193 0.9924 0.6975 0.4292 0.3517 0.3142 0.3050 0.4091 0.4092 0.6448 0.6467
6. Weightage Monthly Average Plant Capacity Factor of IPP Operated ROR Hydropower Projects
MONTHS Shrawan Bhadra Ashoj Kartik Mangshir Poush Magh Falgun Chaitra Baisakh Jestha Ashad Weightage Monthly Average Plant Capacity Factor 0.88376 0.86992 0.92367 0.87212 0.70273 0.53470 0.42416 0.39053 0.41802 0.50663 0.70993 0.86397

131
Appendix - H: Scenarios Of Monthly Expected Energy Consumption

132
1. Expected Monthly Energy (MWh) Consumption in coming ten years in Normal Scenario
FY/ Month Shrawan Bhadra Ashoj Kartik Mangshir Poush Magh Falgun Chaitra Baisakh Jestha Ashad
077/78 817370.0 833580.2 746869.6 712587.3 646165.9 725214.8 664961.7 677590.7 690311.1 824416.0 904799.2 893710.9
078/79 882759.6 900266.6 806619.1 769594.3 697859.2 783232.0 718158.7 731797.9 745536.0 890369.3 977183.2 965207.8
079/80 953380.3 972288.0 871148.7 831161.8 753687.9 845890.5 775611.4 790341.7 805178.9 961598.8 1055357.8 1042424.4
080/81 1029650.8 1050071.0 940840.6 897654.8 813983.0 913561.8 837660.3 853569.1 869593.2 1038526.7 1139786.4 1125818.3
081/82 1112022.8 1134076.7 1016107.8 969467.2 879101.6 986646.7 904673.1 921854.6 939160.7 1121608.9 1230969.3 1215883.8
082/83 1200984.7 1224802.8 1097396.4 1047024.5 949429.7 1065578.5 977046.9 995603.0 1014293.5 1211337.6 1329446.9 1313154.5
083/84 1297063.4 1322787.1 1185188.2 1130786.5 1025384.1 1150824.7 1055210.7 1075251.2 1095437.0 1308244.6 1435802.6 1418206.9
084/85 1400828.5 1428610.0 1280003.2 1221249.4 1107414.9 1242890.7 1139627.5 1161271.3 1183072.0 1412904.1 1550666.8 1531663.4
085/86 1512894.8 1542898.8 1382403.5 1318949.4 1196008.0 1342322.0 1230797.7 1254173.0 1277717.7 1525936.5 1674720.2 1654196.5
086/87 1633926.4 1666330.7 1492995.7 1424465.3 1291688.7 1449707.7 1329261.6 1354506.9 1379935.1 1648011.4 1808697.8 1786532.2
2. Expected Monthly Energy (MWh) Consumption in coming ten years in Growth with Categorization of Consumption Scenario
FY/ Month Shrawan Bhadra Ashoj Kartik Mangshir Poush Magh Falgun Chaitra Baisakh Jestha Ashad
077/78 954027.8 972948.3 871740.3 831726.3 754199.8 846465.0 776138.1 790878.5 805725.7 962251.9 1056074.5 1043132.3
078/79 1114651.2 1136757.2 1018509.5 971758.6 881179.4 988978.7 906811.4 924033.5 941380.5 1124259.9 1233878.8 1218757.7
079/80 1303480.2 1329331.1 1191051.4 1136380.6 1030456.8 1156518.0 1060430.9 1080570.6 1100856.3 1314716.6 1442905.7 1425222.9
080/81 1525652.8 1555909.9 1394061.1 1330071.9 1206093.8 1353641.6 1241176.9 1264749.3 1288492.6 1538804.5 1688842.9 1668146.1
081/82 1787271.9 1822717.5 1633114.8 1558152.8 1412914.9 1585764.2 1454014.0 1481628.6 1509443.4 1802678.8 1978445.8 1954200.0
082/83 2095590.1 2137150.3 1914839.7 1826946.1 1656653.7 1859320.8 1704842.7 1737221.0 1769834.0 2113654.9 2319743.0 2291314.6
083/84 2459231.9 2508003.9 2247116.4 2143970.9 1944128.0 2181963.4 2000679.2 2038676.0 2076948.3 2480431.4 2722281.4 2688919.9
084/85 2888458.6 2945743.1 2639321.1 2518172.9 2283450.1 2562796.5 2349871.5 2394500.2 2439452.4 2913358.1 3197419.9 3158235.6
085/86 3395485.6 3462825.6 3102615.7 2960201.6 2684276.6 3012658.3 2762357.4 2814820.0 2867662.8 3424755.9 3758680.6 3712618.0
086/87 3994862.3 4074089.3 3650294.5 3482741.3 3158109.6 3544457.7 3249973.2 3311696.7 3373867.4 4029299.5 4422169.2 4367975.5

133
3. Expected Monthly Energy (MWh) Consumption in coming ten years in Intervention with Induction Chulo Scenario
FY/ Month Shrawan Bhadra Ashoj Kartik Mangshir Poush Magh Falgun Chaitra Baisakh Jestha Ashad
077/78 1019155.8 1038076.2 936868.3 896854.3 819327.8 911593.0 841266.1 856006.5 870853.7 1027379.8 1121202.5 1108260.3
078/79 1244907.1 1267013.1 1148765.4 1102014.5 1011435.4 1119234.7 1037067.3 1054289.4 1071636.4 1254515.8 1364134.8 1349013.6
079/80 1498864.0 1524714.9 1386435.3 1331764.5 1225840.7 1351901.9 1255814.8 1275954.5 1296240.1 1510100.5 1638289.6 1620606.8
080/81 1786164.7 1816421.7 1654572.9 1590583.7 1466605.7 1614153.5 1501688.7 1525261.2 1549004.4 1799316.4 1949354.7 1928658.0
081/82 2112911.7 2148357.3 1958754.6 1883792.6 1738554.7 1911404.0 1779653.8 1807268.4 1835083.2 2128318.6 2304085.6 2279839.8
082/83 2486357.9 2527918.1 2305607.5 2217713.9 2047421.4 2250088.5 2095610.5 2127988.8 2160601.8 2504422.6 2710510.8 2682082.3
083/84 2915127.6 2963899.6 2703012.1 2599866.6 2400023.8 2637859.1 2456574.9 2494571.8 2532844.0 2936327.1 3178177.2 3144815.6
084/85 3409482.3 3466766.8 3160344.8 3039196.6 2804473.8 3083820.2 2870895.2 2915523.9 2960476.0 3434381.8 3718443.6 3679259.2
085/86 3981637.2 4048977.2 3688767.3 3546353.3 3270428.3 3598809.9 3348509.0 3400971.6 3453814.5 4010907.6 4344832.3 4298769.7
086/87 4646141.9 4725368.9 4301574.1 4134020.9 3809389.2 4195737.3 3901252.8 3962976.3 4025147.0 4680579.1 5073448.8 5019255.1
4. Expected Monthly Energy (MWh) Consumption in coming ten years in Intervention with Electric Vehicle Scenario
FY/ Month Shrawan Bhadra Ashoj Kartik Mangshir Poush Magh Falgun Chaitra Baisakh Jestha Ashad
077/78 954450.1 973793.0 873007.3 833415.7 756311.5 848999.1 779094.5 794257.2 809526.8 966475.3 1060720.3 1048200.4
078/79 1120564.0 1143514.6 1026111.6 980205.4 890471.0 999114.9 917792.2 935859.1 954050.7 1137774.8 1248238.5 1233962.0
079/80 1319951.5 1347069.4 1210056.8 1156653.0 1051996.3 1179324.5 1084504.4 1105911.1 1127463.8 1342591.2 1472047.3 1455631.5
080/81 1557750.8 1589697.2 1429537.8 1367238.0 1244949.3 1394186.4 1283411.1 1308672.8 1334105.5 1586106.8 1737834.5 1718827.1
081/82 1840064.6 1877621.9 1690130.9 1617280.6 1474154.5 1649115.4 1519477.0 1549203.3 1579129.8 1874476.9 2052355.6 2030221.5
082/83 2174145.7 2218239.9 1998463.4 1913103.8 1745345.4 1950546.6 1798602.5 1833514.9 1868662.0 2215016.9 2423639.1 2397744.7
083/84 2568618.4 2620346.8 2362415.7 2262226.6 2065340.1 2306131.9 2127804.0 2168757.3 2209985.9 2616425.4 2861231.8 2830826.7
084/85 3033744.1 3094407.4 2791364.1 2673594.6 2442250.6 2724975.7 2515429.4 2563436.9 2611767.8 3089052.3 3376492.8 3340687.2
085/86 3581738.3 3652879.3 3296470.5 3157857.5 2885733.6 3217916.3 2971416.5 3027680.2 3084324.1 3645218.3 3982944.1 3940682.5
086/87 4227150.3 4310600.6 3891029.3 3727699.5 3407291.2 3797862.7 3507601.7 3573548.5 3639942.7 4299598.2 4696691.2 4646721.0

134
5. Expected Monthly Energy (MWh) Consumption in coming ten years in Combined Intervention of Induction Chulo & Electric Vehicle Scenario
FY/ Month Shrawan Bhadra Ashoj Kartik Mangshir Poush Magh Falgun Chaitra Baisakh Jestha Ashad
077/78 1019578.1 1038920.9 938135.3 898543.6 821439.5 914127.0 844222.4 859385.2 874654.8 1031603.2 1125848.2 1113328.4
078/79 1250819.9 1273770.6 1156367.5 1110461.3 1020726.9 1129370.9 1048048.2 1066115.0 1084306.6 1268030.7 1378494.4 1364217.9
079/80 1515335.4 1542453.3 1405440.7 1352036.9 1247380.1 1374708.3 1279888.3 1301295.0 1322847.7 1537975.1 1667431.2 1651015.4
080/81 1818262.6 1850209.1 1690049.6 1627749.8 1505461.1 1654698.3 1543922.9 1569184.7 1594617.3 1846618.6 1998346.4 1979339.0
081/82 2165704.4 2203261.7 2015770.7 1942920.4 1799794.3 1974755.2 1845116.8 1874843.1 1904769.6 2200116.7 2377995.4 2355861.3
082/83 2564913.4 2609007.7 2389231.2 2303871.6 2136113.2 2341314.3 2189370.3 2224282.7 2259429.7 2605784.6 2814406.8 2788512.4
083/84 3024514.1 3076242.5 2818311.4 2718122.3 2521235.8 2762027.6 2583699.7 2624653.0 2665881.6 3072321.1 3317127.6 3286722.4
084/85 3554767.8 3615431.1 3312387.8 3194618.3 2963274.2 3245999.4 3036453.1 3084460.5 3132791.4 3610076.0 3897516.5 3861710.8
085/86 4167889.9 4239031.0 3882622.1 3744009.2 3471885.3 3804068.0 3557568.1 3613831.8 3670475.8 4231369.9 4569095.7 4526834.2
086/87 4878429.9 4961880.2 4542308.9 4378979.1 4058570.8 4449142.3 4158881.3 4224828.1 4291222.3 4950877.8 5347970.8 5298000.6

135
Appendix - I: Estimation Of Monthly Expected Energy Generations In Normal Scenario

136
1. Expected Monthly Energy (MWh) Generation in Fiscal Year 077/78
GENERATIONS/ MONTH Shrawan Bhadra Ashoj Kartik Mangshir Poush Magh Falgun Chaitra Baisakh Jestha Ashad
From 77 Shrawan 658499.1 648185.4 688239.0 649825.3 523608.8 398411.8 316048.2 290987.9 311474.1 377497.8 528979.5 643752.8
From 77 Bhadra 0.0 74196.3 78781.1 74384.0 59936.3 45605.3 36177.3 33308.7 35653.7 43211.3 60551.1 73688.9
From 77 Ashoj 0.0 0.0 73633.7 69523.9 56020.1 42625.5 33813.5 31132.4 33324.2 40387.9 56594.8 68874.2
From 77 Kartik 0.0 0.0 0.0 51690.8 41650.8 31691.9 25140.3 23146.8 24776.4 30028.3 42078.0 51207.8
From 77 Mangshir 0.0 0.0 0.0 0.0 506.0 385.0 305.4 281.2 301.0 364.8 511.2 622.1
From 77 Poush 0.0 0.0 0.0 0.0 0.0 1847.9 1465.9 1349.7 1444.7 1750.9 2453.5 2985.9
From 77 Magh 0.0 0.0 0.0 0.0 0.0 0.0 9720.2 8949.4 9579.5 11610.1 16268.9 19798.8
From 77 Falgun 0.0 0.0 0.0 0.0 0.0 0.0 0.0 3795.9 4063.2 4924.5 6900.6 8397.8
From 77 Chaitra 0.0 0.0 0.0 0.0 0.0 0.0 0.0 0.0 22331.3 27064.9 37925.4 46154.2
From 78 Baisakh 0.0 0.0 0.0 0.0 0.0 0.0 0.0 0.0 0.0 4869.8 6823.9 8304.5
From 78 Jestha 0.0 0.0 0.0 0.0 0.0 0.0 0.0 0.0 0.0 0.0 500.9 609.6
From 78 Ashad 0.0 0.0 0.0 0.0 0.0 0.0 0.0 0.0 0.0 0.0 0.0 184308.7
Ex.Gen. NEA 259854.2 265806.1 271637.0 258327.8 218454.6 179761.8 144917.5 149978.8 177291.3 219620.2 275554.9 277187.7
Ex. Gen. IPP 394284.6 391958.6 412056.7 392014.6 313806.5 238078.5 186487.3 173131.1 181759.1 218551.7 310910.2 389211.8
Ex.Gen.Additon 658499.1 722381.7 840653.9 845424.0 681722.0 520567.5 422670.8 392952.1 442948.0 541710.3 759587.7 1108705.1
Total Ex.En.Gen. 1312637.8 1380146.3 1524347.6 1495766.4 1213983.0 938407.8 754075.5 716062.0 801998.4 979882.2 1346052.9 1775104.6

137
2. Expected Monthly Energy (MWh) Generation in Fiscal Year 078/79
GENERATIONS/ MONTH Shrawan Bhadra Ashoj Kartik Mangshir Poush Magh Falgun Chaitra Baisakh Jestha Ashad
Addition in 077/78 1134102 1116339 1185322 1119164 901787 686166 544315 501155 536437 650147 911036 1108705
From 78 Shrawan 395630 389433 413498 390419 314587 239368 189884 174827 187135 226803 317814 386770
From 78 Bhadra 0 7391 7848 7410 5970 4543 3604 3318 3552 4304 6032 7340
From 78 Ashoj 0 0 55791 52677 42445 32296 25620 23588 25249 30601 42881 52184
From 78 Kartik 0 0 0 11880 9573 7284 5778 5320 5694 6902 9671 11769
From 78 Mangshir 0 0 0 0 4812 3661 2904 2674 2862 3469 4861 5916
From 78 Poush 0 0 0 0 0 13128 10414 9588 10263 12439 17430 21212
From 78 Magh 0 0 0 0 0 0 36648 33742 36117 43773 61338 74647
From 78 Falgun 0 0 0 0 0 0 0 3937 4214 5107 7156 8709
From 78 Chaitra 0 0 0 0 0 0 0 0 15524 18815 26365 32086
From 79 Baisakh 0 0 0 0 0 0 0 0 0 18968 26580 32347
From 79 Jestha 0 0 0 0 0 0 0 0 0 0 16357 19906
From 79 Ashad 0 0 0 0 0 0 0 0 0 0 0 0
Ex.Gen. NEA 259854 265806 271637 258328 218455 179762 144917 149979 177291 219620 275555 277188
Ex. Gen. IPP 394285 391959 412057 392015 313806 238078 186487 173131 181759 218552 310910 389212
Ex.Gen.Additon 395630 396824 477136 462385 377387 300280 274851 256994 290611 371181 536485 652886
Total Ex.En.Gen. 2183871 2170928 2346152 2231891 1811435 1404287 1150571 1081259 1186099 1459500 2033986 2427991

138
3. Expected Monthly Energy (MWh) Generation in Fiscal Year 079/80
GENERATIONS/ MONTH Shrawan Bhadra Ashoj Kartik Mangshir Poush Magh Falgun Chaitra Baisakh Jestha Ashad
Addition in 077/78 1134102 1116339 1185322 1119164 901787 686166 544315 501155 536437 650147 911036 1108705
Addition in 078/79 667842 657382 698004 659045 531038 404065 320532 295117 315893 382854 536485 652886
From 79 Shrawan 64525 63515 67439 63675 51308 39040 30969 28513 30521 36990 51834 63080
From 79 Bhadra 0 135273 143632 135616 109275 83147 65958 60728 65003 78782 110396 134348
From 79 Ashoj 0 0 20317 19183 15457 11761 9330 8590 9195 11144 15616 19004
From 79 Kartik 0 0 0 64048 51608 39268 31150 28680 30700 37207 52138 63450
From 79 Mangshir 0 0 0 0 7336 5582 4428 4077 4364 5289 7412 9020
From 79 Poush 0 0 0 0 0 22110 17539 16148 17285 20949 29355 35725
From 79 Magh 0 0 0 0 0 0 15270 14059 15049 18239 25558 31103
From 79 Falgun 0 0 0 0 0 0 0 11671 12492 15140 21216 25819
From 79 Chaitra 0 0 0 0 0 0 0 0 13099 15875 22245 27072
From 80 Baisakh 0 0 0 0 0 0 0 0 0 26410 37007 45037
From 80 Jestha 0 0 0 0 0 0 0 0 0 0 4498 5474
From 80 Ashad 0 0 0 0 0 0 0 0 0 0 0 29523
Ex.Gen. NEA 259854 265806 271637 258328 218455 179762 144917 149979 177291 219620 275555 277188
Ex. Gen. IPP 394285 391959 412057 392015 313806 238078 186487 173131 181759 218552 310910 389212
Ex.Gen.Additon 64525 198788 231389 282522 234984 200908 174644 172467 197708 266026 377274 488655
Total Ex.En.Gen. 2520608 2630274 2798408 2711073 2200070 1708979 1370896 1291848 1409088 1737198 2411260 2916646
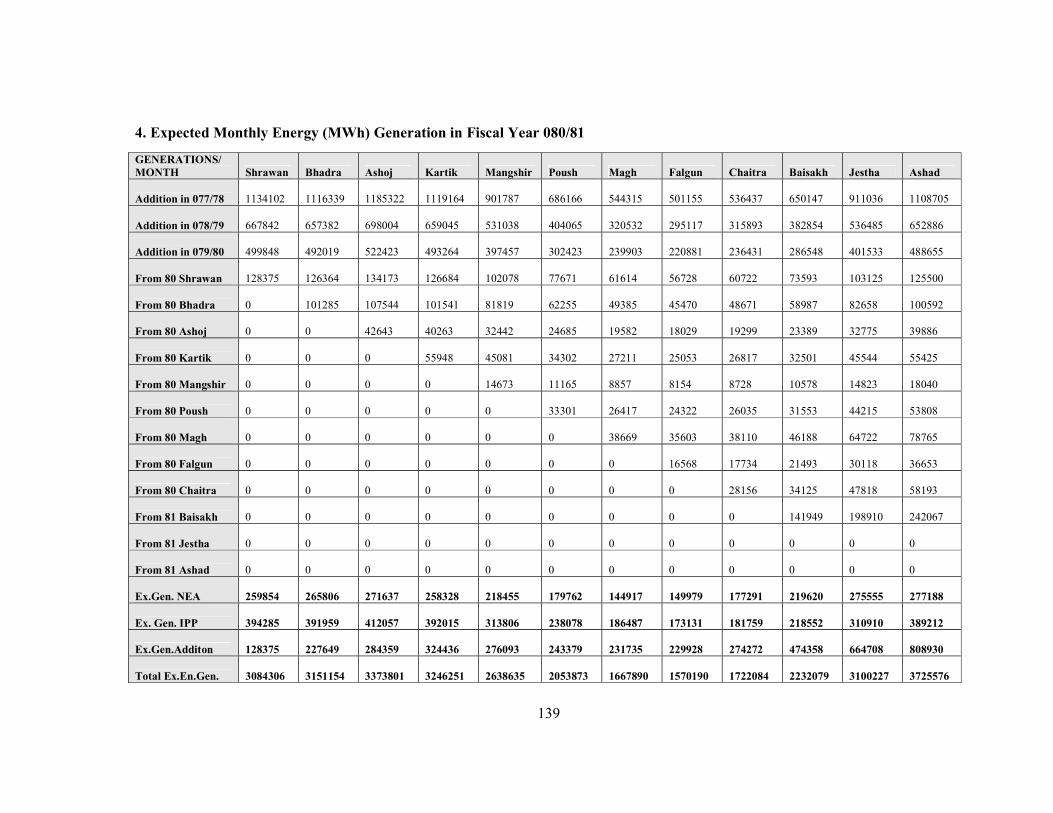
139
4. Expected Monthly Energy (MWh) Generation in Fiscal Year 080/81
GENERATIONS/ MONTH Shrawan Bhadra Ashoj Kartik Mangshir Poush Magh Falgun Chaitra Baisakh Jestha Ashad
Addition in 077/78 1134102 1116339 1185322 1119164 901787 686166 544315 501155 536437 650147 911036 1108705
Addition in 078/79 667842 657382 698004 659045 531038 404065 320532 295117 315893 382854 536485 652886
Addition in 079/80 499848 492019 522423 493264 397457 302423 239903 220881 236431 286548 401533 488655
From 80 Shrawan 128375 126364 134173 126684 102078 77671 61614 56728 60722 73593 103125 125500
From 80 Bhadra 0 101285 107544 101541 81819 62255 49385 45470 48671 58987 82658 100592
From 80 Ashoj 0 0 42643 40263 32442 24685 19582 18029 19299 23389 32775 39886
From 80 Kartik 0 0 0 55948 45081 34302 27211 25053 26817 32501 45544 55425
From 80 Mangshir 0 0 0 0 14673 11165 8857 8154 8728 10578 14823 18040
From 80 Poush 0 0 0 0 0 33301 26417 24322 26035 31553 44215 53808
From 80 Magh 0 0 0 0 0 0 38669 35603 38110 46188 64722 78765
From 80 Falgun 0 0 0 0 0 0 0 16568 17734 21493 30118 36653
From 80 Chaitra 0 0 0 0 0 0 0 0 28156 34125 47818 58193
From 81 Baisakh 0 0 0 0 0 0 0 0 0 141949 198910 242067
From 81 Jestha 0 0 0 0 0 0 0 0 0 0 0 0
From 81 Ashad 0 0 0 0 0 0 0 0 0 0 0 0
Ex.Gen. NEA 259854 265806 271637 258328 218455 179762 144917 149979 177291 219620 275555 277188
Ex. Gen. IPP 394285 391959 412057 392015 313806 238078 186487 173131 181759 218552 310910 389212
Ex.Gen.Additon 128375 227649 284359 324436 276093 243379 231735 229928 274272 474358 664708 808930
Total Ex.En.Gen. 3084306 3151154 3373801 3246251 2638635 2053873 1667890 1570190 1722084 2232079 3100227 3725576

140
5. Expected Monthly Energy (MWh) Generation in Fiscal Year 081/82
GENERATIONS/ MONTH Shrawan Bhadra Ashoj Kartik Mangshir Poush Magh Falgun Chaitra Baisakh Jestha Ashad
Addition in 077/78 1134102 1116339 1185322 1119164 901787 686166 544315 501155 536437 650147 911036 1108705
Addition in 078/79 667842 657382 698004 659045 531038 404065 320532 295117 315893 382854 536485 652886
Addition in 079/80 499848 492019 522423 493264 397457 302423 239903 220881 236431 286548 401533 488655
Addition in 080/81 827460 814500 864831 816561 657959 500638 397141 365651 391394 474358 664708 808930
From 81 Shrawan 3175 3125 3319 3133 2525 1921 1524 1403 1502 1820 2551 3104
From 81 Bhadra 0 0 0 0 0 0 0 0 0 0 0 0
From 81 Ashoj 0 0 0 0 0 0 0 0 0 0 0 0
From 81 Kartik 0 0 0 0 0 0 0 0 0 0 0 0
From 81 Mangshir 0 0 0 0 0 0 0 0 0 0 0 0
From 81 Poush 0 0 0 0 0 32984 26165 24090 25786 31252 43793 53295
From 81 Magh 0 0 0 0 0 0 26444 24347 26062 31586 44261 53864
From 81 Falgun 0 0 0 0 0 0 0 0 0 0 0 0
From 81 Chaitra 0 0 0 0 0 0 0 0 0 0 0 0
From 82 Baisakh 0 0 0 0 0 0 0 0 0 0 0 0
From 82 Jestha 0 0 0 0 0 0 0 0 0 0 0 0
From 82 Ashad 0 0 0 0 0 0 0 0 0 0 0 18662
Ex.Gen. NEA 259854 265806 271637 258328 218455 179762 144917 149979 177291 219620 275555 277188
Ex. Gen. IPP 394285 391959 412057 392015 313806 238078 186487 173131 181759 218552 310910 389212
Ex.Gen.Additon 3175 3125 3319 3133 2525 34905 54133 49841 53350 64658 90604 128924
Total Ex.En.Gen. 3786566 3741131 3957592 3741509 3023026 2346037 1887430 1755754 1892556 2296737 3190832 3854500

141
6. Expected Monthly Energy (MWh) Generation in Fiscal Year 082/83
GENERATIONS/ MONTH Shrawan Bhadra Ashoj Kartik Mangshir Poush Magh Falgun Chaitra Baisakh Jestha Ashad
Addition in 077/78 1134102 1116339 1185322 1119164 901787 686166 544315 501155 536437 650147 911036 1108705
Addition in 078/79 667842 657382 698004 659045 531038 404065 320532 295117 315893 382854 536485 652886
Addition in 079/80 499848 492019 522423 493264 397457 302423 239903 220881 236431 286548 401533 488655
Addition in 080/81 827460 814500 864831 816561 657959 500638 397141 365651 391394 474358 664708 808930
Addition in 081/82 131878 129812 137834 130141 104863 79790 63295 58276 62379 75602 105939 128924
From 82 Shrawan 0 0 0 0 0 0 0 0 0 0 0 0
From 82 Bhadra 0 28185 29927 28257 22768 17324 13743 12653 13544 16415 23002 27993
From 82 Ashoj 0 0 0 0 0 0 0 0 0 0 0 0
From 82 Kartik 0 0 0 0 0 0 0 0 0 0 0 0
From 82 Mangshir 0 0 0 0 0 0 0 0 0 0 0 0
From 82 Poush 0 0 0 0 0 0 0 0 0 0 0 0
From 82 Magh 0 0 0 0 0 0 0 0 0 0 0 0
From 82 Falgun 0 0 0 0 0 0 0 0 0 0 0 0
From 82 Chaitra 0 0 0 0 0 0 0 0 0 0 0 0
From 83 Baisakh 0 0 0 0 0 0 0 0 0 0 0 0
From 83 Jestha 0 0 0 0 0 0 0 0 0 0 0 0
From 83 Ashad 0 0 0 0 0 0 0 0 0 0 0 0
Ex.Gen. NEA 259854 265806 271637 258328 218455 179762 144917 149979 177291 219620 275555 277188
Ex. Gen. IPP 394285 391959 412057 392015 313806 238078 186487 173131 181759 218552 310910 389212
Ex.Gen.Additon 0 28185 29927 28257 22768 17324 13743 12653 13544 16415 23002 27993
Total Ex.En.Gen. 3915269 3896003 4122034 3896773 3148133 2408247 1910335 1776843 1915129 2324095 3229168 3882493

142
7. Expected Monthly Energy (MWh) Generation in Fiscal Year 083/84
GENERATIONS/ MONTH Shrawan Bhadra Ashoj Kartik Mangshir Poush Magh Falgun Chaitra Baisakh Jestha Ashad
Addition in 077/78 1134102 1116339 1185322 1119164 901787 686166 544315 501155 536437 650147 911036 1108705
Addition in 078/79 667842 657382 698004 659045 531038 404065 320532 295117 315893 382854 536485 652886
Addition in 079/80 499848 492019 522423 493264 397457 302423 239903 220881 236431 286548 401533 488655
Addition in 080/81 827460 814500 864831 816561 657959 500638 397141 365651 391394 474358 664708 808930
Addition in 081/82 131878 129812 137834 130141 104863 79790 63295 58276 62379 75602 105939 128924
Addition in 082/83 28634 28185 29927 28257 22768 17324 13743 12653 13544 16415 23002 27993
From 83 Shrawan 0 0 0 0 0 0 0 0 0 0 0 0
From 83 Bhadra 0 0 0 0 0 0 0 0 0 0 0 0
From 83 Ashoj 0 0 0 0 0 0 0 0 0 0 0 0
From 83 Kartik 0 0 0 0 0 0 0 0 0 0 0 0
From 83 Mangshir 0 0 0 0 0 0 0 0 0 0 0 0
From 83 Poush 0 0 0 0 0 0 0 0 0 0 0 0
From 83 Magh 0 0 0 0 0 0 0 0 0 0 0 0
From 83 Falgun 0 0 0 0 0 0 0 0 0 0 0 0
From 83 Chaitra 0 0 0 0 0 0 0 0 0 0 0 0
From 84 Baisakh 0 0 0 0 0 0 0 0 0 0 0 0
From 84 Jestha 0 0 0 0 0 0 0 0 0 0 0 0
From 84 Ashad 0 0 0 0 0 0 0 0 0 0 0 0
Ex.Gen. NEA 259854 265806 271637 258328 218455 179762 144917 149979 177291 219620 275555 277188
Ex. Gen. IPP 394285 391959 412057 392015 313806 238078 186487 173131 181759 218552 310910 389212
Ex.Gen.Additon 0 0 0 0 0 0 0 0 0 0 0 0
Total Ex.En.Gen. 3943902 3896003 4122034 3896773 3148133 2408247 1910335 1776843 1915129 2324095 3229168 3882493

143
Appendix - J: Estimation Of Monthly Expected Energy Generations In Shift IPP Plants & Shift IPP And NEA Plants Scenarios

144
1. Monthly Expected Energy (MWh) Generations for SHIFT IPP PLANTS scenario
FY/MONTH Shrawan Bhadra Ashoj Kartik Mangshir Poush Magh Falgun Chaitra Baisakh Jestha Ashad
077/78 737593.1 736062.5 770952.3 729774.0 598331.1 468808.4 374209.4 361089.6 403264.8 493493.7 659327.8 834115.6
078/79 1698146.9 1755768.0 1927302.7 1873274.1 1520233.4 1172128.1 941852.1 887518.4 1000222.7 1221859.6 1680472.1 2081352.9
079/80 2210821.1 2193606.9 2374354.1 2255563.1 1832575.5 1421068.1 1166256.2 1094269.5 1192450.4 1468932.6 2042546.1 2427565.1
080/81 2524015.0 2629777.9 2802004.2 2711512.1 2202489.6 1711516.0 1375282.0 1294455.4 1415440.0 1797699.7 2491381.5 3003307.7
081/82 3176795.5 3238346.0 3470503.4 3334599.1 2711890.0 2110308.1 1715031.4 1612162.3 1770572.0 2241511.5 3108787.2 3725149.8
082/83 3789973.0 3740634.7 3961187.7 3741947.9 3025445.9 2348574.0 1891815.5 1758361.0 1898907.0 2306169.8 3199391.5 3854074.3
083/84 3918675.6 3895506.8 4125629.8 3897211.8 3150552.7 2410783.7 1914720.3 1779449.6 1921480.3 2333528.0 3237727.9 3882066.9
084/85 3947309.4 3895506.8 4125629.8 3897211.8 3150552.7 2410783.7 1914720.3 1779449.6 1921480.3 2333528.0 3237727.9 3882066.9
2. Monthly Expected Energy (MWh) Generations for SHIFT NEA & IPP PLANTS scenario
FY/MONTH Shrawan Bhadra Ashoj Kartik Mangshir Poush Magh Falgun Chaitra Baisakh Jestha Ashad
077/78 657545.8 657268.9 687289.7 650781.0 534681.0 420377.3 335790.5 325717.0 365401.9 447604.9 595024.9 755860.8
078/79 1526153.3 1586468.2 1747541.2 1703545.9 1383471.8 1068066.7 859303.3 811515.1 907732.5 1109764.1 1523395.1 1890194.7
079/80 2015284.0 2001132.5 2169986.0 2062601.7 1677093.3 1302762.3 1072407.7 1007862.6 1099960.2 1356837.1 1885469.1 2236406.9
080/81 2408525.3 2516097.1 2681298.6 2597543.7 2110657.5 1641641.2 1319852.4 1243421.0 1360812.7 1680424.4 2327046.1 2893203.6
081/82 3064169.3 3127483.7 3352790.5 3223456.3 2622334.6 2042165.9 1660976.1 1562393.2 1728435.2 2190443.0 3037225.9 3638061.8
082/83 3700890.1 3652947.1 3868081.5 3654038.4 2954611.2 2294676.2 1849060.0 1718995.7 1856770.3 2255101.2 3127830.2 3766986.3
083/84 3829592.7 3807819.2 4032523.6 3809302.3 3079718.0 2356885.9 1871964.7 1740084.3 1879343.5 2333528.0 3237727.9 3882066.9
084/85 3947309.4 3895506.8 4125629.8 3897211.8 3150552.7 2410783.7 1914720.3 1779449.6 1921480.3 2333528.0 3237727.9 3882066.9

145
Appendix - K: Verification Results

146
PVMI Calculation Incorporating Actual Monthly Import Energy (GWh) and Calculated Monthly Import Energy (GWh) for Each Month of Year 2076 BS for Verification
NEA Generation: 450.05 MW
IPP Generation: 625 MW
Month Baisakh Jestha Ashar Shrawan Bhadra Ashoj Kartik Mangshir Poush Magh Falgun chaitra
Kulekhani -I (60 MW) 15.34 7.81 5.15 4.49 2.45 2.64 2.63 3.48 6.95 9.20 12.20 15.47
Kulekhani - II (32 MW) 8.18 4.16 2.75 2.39 1.31 1.41 1.41 1.86 3.71 4.91 6.51 8.25
Kulekhani -III (14 MW) 0.00 0.00 0.00 0.00 0.00 0.00 0.61 0.81 1.62 2.15 2.85 3.61
Kapadigadh HP (3.3 MW) 0.00 0.39 2.05 2.10 2.07 2.19 2.07 1.67 1.27 1.01 0.93 0.99
Pikhuwa Khola 5 (MW) 0.00 0.43 3.11 3.18 3.13 3.33 3.14 2.53 1.92 1.53 1.41 1.50 Lower Hewa Khola (22.1 MW) 0.00 0.00 0.00 5.16 13.84 14.70 13.88 11.18 8.51 6.75 6.21 6.65
Lower Chhote Kh (0.996MW) 0.00 0.00 0.00 0.00 0.23 0.66 0.63 0.50 0.38 0.30 0.28 0.30
Upper Mardi (7MW) 0.00 0.00 0.00 0.00 0.00 1.55 4.40 3.54 2.69 2.14 1.97 2.11
Iwa Khola (9.9 MW) 0.00 0.00 0.00 0.00 0.00 2.19 6.22 5.01 3.81 3.02 2.78 2.98
Kabeli B1 (25 MW) 0.00 0.00 0.00 0.00 0.00 0.00 3.66 12.65 9.62 7.63 7.03 7.52
NEA Gen 192.52 261.76 268.09 251.92 261.47 266.97 253.67 212.31 167.48 128.67 128.42 149.97
IPP Gen 227.98 319.47 388.79 397.69 391.46 415.65 392.45 316.23 240.62 190.87 175.74 188.11
EMEG 444.02 594.02 669.93 666.94 675.97 711.30 684.77 571.77 448.60 358.17 346.33 387.46
AMIE 298.82 267.83 208.80 151.45 192.97 45.59 20.24 102.07 254.85 290.49 290.06 147.60
AMEC 706.80 775.72 766.21 812.30 824.51 671.54 624.52 614.41 660.77 643.91 614.73 510.24
CMIE 262.78 181.70 96.28 145.36 148.54 -39.76 -60.25 42.64 212.17 285.74 268.40 122.78
PVMI without Outage Energy 12.06 32.16 53.89 4.02 23.02 187.21 397.68 58.22 16.75 1.64 7.47 16.82
Final PVMI with Outage Energy 0.76 8.53 13.86 14.89 8.42 6.62 13.60 13.53 8.04 0.34 6.71 12.98

147
Appendix - L: Distribution of Load and Capacitor across planned INPS for Load Flow Simulation to Accommodate the Required Monthly Peak Demand for fiscal year 084/85

148
Loads/Capacitors Connected Bus Power Factor (%)
Scenario - I Scenario - II Scenario - III Scenario - IV Scenario – V Rating %
Loading Rating %
Loading Rating %
Loading Rating %
Loading Rating %
Loading
AadhiKhola KGA 132 kV
89.44 8497 kVA
130
8497 kVA
198.7 8497 kVA
163.8 8497 kVA
173.8
8497 kVA
173.2
Added Cap_1 Parwanipur 132 kV
0 -50000
kvar 95.4
-25000 kvar
84.7
Added Cap_2 Birgunj 66 kV
0 -50000
kvar 95
-25000 kvar
79.9
Added Cap_3 Simara 66 kV
0 -50000
kvar 94.1
Added Cap_4 Amlekhgunj 66 kV
0 -50000
kvar 95.7
Added Cap_5 Pathlaiya 132 kV
0 -20000
kvar 95.3
-30000 kvar
87.2
Added Cap_6 Kamane 132 kV
0 -40000
kvar 95.5
Added L1 Balanch 132 kV
89.33 50000
kVA 267.8
20000 kVA
192.8 45000 kVA
246.7 40000 kVA
412.3
Added L3 Mainatara 132 kV
89.33 50000
kVA 246.4
20000 kVA
183.3 45000 kVA
238.9 40000 kVA
296.1
Added L5 Kusma 132 kV
89.33 50000
kVA 286.1
30000 kVA
219.5 40000 kVA
282.7 40000 kVA
326.1
Added L6 Damauli 220 kV
89.33 70000
kVA 295.7
40000 kVA
228.5 45000 kVA
288.5 45000 kVA
339.3
Added L7 Butwal 220 kV
89 80000
kVA 278.4
45000 kVA
211.4 60000 kVA
271.8 45000 kVA
320.4
Added L8 Udipur 220 kV
89.33 50000
kVA 314
30000 kVA
241.1 60000 kVA
297.6 45000 kVA
367.9
Added L9 Bharatpur 220 kV
89.33 80000
kVA 321.5
40000 kVA
246.7 60000 kVA
307.4 45000 kVA
378.7
Added L10 Trishuli 3B 220 kV
89.33 50000
kVA 305
30000 kVA
243.2 60000 kVA
306 45000 kVA
341
Added L12 Barhabise 220 kV
89.33 50000
kVA 304.1
40000 kVA
245.2 45000 kVA
304.8 45000 kVA
323
Added L13 Tamakoshi 220 kV
89.33 50000
kVA 306
30000 kVA
248.2 60000 kVA
307.6 40000 kVA
322.9
Added L14 Tingla 89.33 50000 305.1 30000 254.5 50000 306.2 45000 317.8

149
Loads/Capacitors Connected Bus Power Factor (%)
Scenario - I Scenario - II Scenario - III Scenario - IV Scenario – V Rating %
Loading Rating %
Loading Rating %
Loading Rating %
Loading Rating %
Loading 132 kV kVA kVA kVA kVA
Added L16 Khadbari 220 kV
89.33 60000
kVA 301.6
40000 kVA
260.8 50000 kVA
301.2 40000 kVA
308.2
Added L17 Damak 400 kV
89.33 80000
kVA 310.1
50000 kVA
255.4 50000 kVA
308.6 45000 kVA
318.9
Added L19 Mirchaiya 400 kV
89.33 50000
kVA 304.1
50000 kVA
251.5 50000 kVA
305.6 40000 kVA
311.5
Added L20 Hetauda 400 kV
89.33 80000
kVA 308.3
50000 kVA
260.4 50000 kVA
315.7 40000 kVA
324.9
Added L22 Dodhara 400 kV
89.33 40000
kVA 241
20000 kVA
179.7 48000 kVA
234.2 45000 kVA
288.3
Added L26 New Marsyangdi 220 kV
89.33
50000 kVA
317.5 30000 kVA
244.8 40000 kVA
303.3 48000 kVA
375.4
Added L28 Dandakhet 220 kV
89.33 50000
kVA 284.6
30000 kVA
220.5 40000 kVA
284.6 45000 kVA
324.3
Added L30 Laphsiphedi 400 kV
89.33 50000
kVA 293.2
30000 kVA
232.7 40000 kVA
291.7
Added L32 Inaruwa 220 kV
89.33 60000
kVA 300.9
50000 kVA
256.4 45000 kVA
305.3 50000 kVA
313.6
Added L35 Mahendranagar 132 kV
89.33 30000
kVA 267.8
20000 kVA
138.4 20000 kVA
249.9 45000 kVA
462.6
AirportLoad New Chabahil 66 kV
89.44 21019 kVA
150.2 21019 kVA
244.9 21019 kVA
330.1 21019 kVA
281.3 21019 kVA
241.5
Amlekhgunj Load Amlekhgunj 66 kV
88.58 2371 kVA
166.2 2371 kVA
156.8 2371 kVA
212.3 2371 kVA
222.5 2371 kVA
188.1
Anarmani Load Anarmani 132 kV
89.44 43603 kVA
139.9 43603 kVA
193.7 43603 kVA
191.4 43603 kVA
192.1 43603 kVA
167.6
AnarmaniCap Anarmani 132 kV
0 -20000
kvar 92.9
-20000 kvar
92.9 -20000
kvar 94
-20000 kvar
93.7 -20000
kvar 89.5
AshokSteel Simara 66 kV
89.44 6708 kVA
178.8 6708 kVA
159.5 6708 kVA
210.9 6708 kVA
230.2 6708 kVA
195
Attariya Load Attariya 132 kV
89.44 31305 kVA
107.1 31305 kVA
160.4 31305 kVA
138.3 31305 kVA
149 31305 kVA
208
Balaju Load Balaju 89.44 34883 71.5 34883 119.2 34883 156.4 34883 135.8 34883 117.1

150
Loads/Capacitors Connected Bus Power Factor (%)
Scenario - I Scenario - II Scenario - III Scenario - IV Scenario – V Rating %
Loading Rating %
Loading Rating %
Loading Rating %
Loading Rating %
Loading 66 kV kVA kVA kVA kVA kVA
Balaju cap Balaju 66 kV
0 -25000
kvar 87.4
-25000 kvar
75.5 -25000
kvar 57.5
-25000 kvar
66.3 -25000
kvar 64.1
Banepa Load Banepa 66 kV
89.31 15339 kVA
147.7 15339 kVA
244.6 15339 kVA
335.8 15339 kVA
279.5 15339 kVA
235.5
BaneshworCap Baneshwor 66 kV
0 -25000
kvar 87.4
-25000 kvar
75.1 -25000
kvar 56.4
-25000 kvar
65.8 -25000
kvar 63.4
Baneswor Load Baneshwor 66 kV
89.38 31439 kVA
71.5 31439 kVA
119.8 31439 kVA
159.5 31439 kVA
136.8 31439 kVA
118.2
Bardghat Load Bardghat 132 kV
89.44 8273 kVA
126.5 8273 kVA
172.8 8273 kVA
158 8273 kVA
168 8273 kVA
168.2
BhairahawaCap Shivapur 132 kV
0 -10000
kvar 107.4
-10000 kvar
109.3 -10000
kvar 120.9
-10000 kvar
112.6 -10000
kvar 92.1
Bhaktpur Cap Bhaktapur 132 kV
0 -50000
kvar 91.6
-50000 kvar
84.1 -50000
kvar 70.2
-50000 kvar
78 -50000
kvar 72.6
Bhaktpur Load Bhaktapur 132 kV
89.44 38460 kVA
136.5 38460 kVA
214.1 38460 kVA
256.4 38460 kVA
230.8 38460 kVA
206.6
Bharatpur Load Bharatpur 132 kV
89.44 99952 kVA
131.4 99952 kVA
192.4 99952 kVA
178.8 99952 kVA
185.1 99952 kVA
188.4
BharatpurCap Bharatpur 132 kV
0 -27500
kvar 99.7
-27500 kvar
93.6 -27500
kvar 100.7
-27500 kvar
97.2 -27500
kvar 79.6
Birjung Cap Birgunj 66 kV
0 -36000
kvar 70.8
-36000 kvar
95 -36000
kvar 100
-36000 kvar
79.9 -36000
kvar 72.6
Birjung Load Birgunj 66 kV
89.55 58406 kVA
183.5 58406 kVA
157.9 58406 kVA
210 58406 kVA
225.4 58406 kVA
192.7
Butwal Cap Butwal 132 kV
0 -40000
kvar 103.2
-40000 kvar
106.4 -40000
kvar 116.5
-40000 kvar
109.3 -40000
kvar 91.4
Butwal Load Butwal 132 kV
89.46 124638
kVA 121.1
124638 kVA
169.1 124638
kVA 154.4
124638 kVA
164.8 124638
kVA 164.1
Cha.pur Load Chapur 132 kV
89.4 50222 kVA
145.2 50222 kVA
189.8 50222 kVA
203.7 50222 kVA
202.9 50222 kVA
165.3
Chabel Load New Chabahil 66 kV
89.44 38908 kVA
144.4 38908 kVA
244.9 38908 kVA
330.1 38908 kVA
281.3 38908 kVA
241.5
Chapali Load Chapali 66 kV
89.36 25402 kVA
141.5 25402 kVA
236.6 25402 kVA
310 25402 kVA
268.2 25402 kVA
231.1

151
Loads/Capacitors Connected Bus Power Factor (%)
Scenario - I Scenario - II Scenario - III Scenario - IV Scenario – V Rating %
Loading Rating %
Loading Rating %
Loading Rating %
Loading Rating %
Loading
Damak Load Damak 132 kV
89.44 23702 kVA
138 23702 kVA
189.5 23702 kVA
187.4 23702 kVA
188 23702 kVA
164.5
Damauli Load Damauli 132 kV
89.03 29204 kVA
128.6 29204 kVA
179.1 29204 kVA
166.6 29204 kVA
174.4 29204 kVA
172
DevighatLoad Devighat 66 kV
89.17 7290 kVA
138.8 7290 kVA
223.8 7290 kVA
283.4 7290 kVA
250.6 7290 kVA
209.7
Dhalkebar Cap Dhalkebar 132 kV
0 -25000
kvar 94.8
-25000 kvar
98.4 -25000
kvar 96.8
-25000 kvar
97 -25000
kvar 93.2
Dhalkebar Load Dhalkebar 132 kV
89.46 89756 kVA
131.9 89756 kVA
152.4 89756 kVA
185.9 89756 kVA
185.5 89756 kVA
166.4
Duhabi Cap Duhabi 132 kV
0 -67000
kvar 87.8
-67000 kvar
99.5 -67000
kvar 86
-67000 kvar
99 -67000
kvar 81.6
DuhabiandDhankuta Duhabi 132 kV
89.44 97045 kVA
148 97045 kVA
180.8 97045 kVA
209.2 97045 kVA
177.7 97045 kVA
183.8
GhorahiCement Lamahi 132 kV
80 12500 kVA
117.8 12500 kVA
161.4 12500 kVA
145 12500 kVA
156.2 12500 kVA
161.9
Hama Steel Simara 66 kV
89.44 3801 kVA
171.9 3801 kVA
159.5 3801 kVA
210.9 3801 kVA
230.2 3801 kVA
195
Harisidhhi Patan 66 kV
89.38 29650 kVA
144.3 29650 kVA
242 29650 kVA
322.7 29650 kVA
277.2 29650 kVA
239.4
Hetauda cap Hetauda 66 kV
0 -10000
kvar 92.8
-10000 kvar
95.5 -10000
kvar 90.2
-10000 kvar
90.7 -10000
kvar 85.5
Hetauda66 Load Hetauda 66 kV
89.35 22271 kVA
148 22271 kVA
190.6 22271 kVA
208.8 22271 kVA
210.4 22271 kVA
189.8
HetaudaCement Hetauda 66 kV
89.18 7737 kVA
148 7737 kVA
190.6 7737 kVA
208.8 7737 kVA
210.4 7737 kVA
189.8
HimalIron Parwanipur 66 kV
90.02 3444 kVA
175.1 3444 kVA
156.6 3444 kVA
194.4 3444 kVA
215.8 3444 kVA
183.6
HulasSteel Simara 66 kV
89.44 11851 kVA
180.2 11851 kVA
159.5 11851 kVA
210.9 11851 kVA
230.2 11851 kVA
195
Ilam Ilam (Godak) 132 kV
89.44 55000 kVA
136 40000 kVA
153.1 55000 kVA
184.9 55000 kVA
183.7 55000 kVA
161.3
JagadambaSteel Simara 66 kV
89.44 32647 kVA
180.2 32647 kVA
159.5 32647 kVA
210.9 32647 kVA
230.2 32647 kVA
208.9
Jhimruk Load Jhimruk 89.44 5143 117.9 5143 160.7 5143 144.5 5143 155.6 5143 160.4

152
Loads/Capacitors Connected Bus Power Factor (%)
Scenario - I Scenario - II Scenario - III Scenario - IV Scenario – V Rating %
Loading Rating %
Loading Rating %
Loading Rating %
Loading Rating %
Loading 132 kV kVA kVA kVA kVA kVA
JyotiSpinning Parwanipur 66 kV
88.58 2371 kVA
176.5 2371 kVA
156.6 2371 kVA
194.4 2371 kVA
215.8 2371 kVA
183.6
K-3 Cap Singhadurbar 66 kV
0 -10 kvar 85 -10 kvar
72.9 -10 kvar
54.4 -10 kvar
63.2 -10 kvar
61.1
K-3 Load Singhadurbar 66 kV
89.49 39891 kVA
154.2 39891 kVA
247.1 39891 kVA
331.1 39891 kVA
284.7 39891 kVA
245.5
Kamane Load Kamane 132 kV
89.31 15116 kVA
142.4 15116 kVA
157 15116 kVA
201.2 15116 kVA
200 15116 kVA
165.6
Kawasoti Load Kawasoti 132 kV
89.33 17128 kVA
130.8 17128 kVA
186.3 17128 kVA
171.7 17128 kVA
179.9 17128 kVA
182.1
KL-1(DCS) Kulekhani – 1 66 kV
91.91 7616 kVA
148.5 7616 kVA
196.8 7616 kVA
223.2 7616 kVA
217.9 7616 kVA
200.6
KohalpurandSurkhet Kohalpur 132 kV
89.44 29292 kVA
110.4 29292 kVA
149.9 29292 kVA
134.3 29292 kVA
144.9 29292 kVA
152.9
Lahan Load Lahan 132 kV
89.44 72001 kVA
139.2 72001 kVA
186.2 72001 kVA
192.9 72001 kVA
186.9 72001 kVA
167.4
LahanCap Lahan 132 kV
0 -30000
kvar 94.1
-30000 kvar
96.7 -30000
kvar 93.3
-30000 kvar
96.3 -30000
kvar 89.6
Lainchor Load Lainchaur 66 kV
89.4 51340 kVA
151.4 51340 kVA
244.5 51340 kVA
328.5 51340 kVA
280.7 51340 kVA
241
LamahiDangandSalyan Lamahi 132 kV
89.44 42262 kVA
118.8 42262 kVA
161.4 42262 kVA
145 42262 kVA
156.2 42262 kVA
161.9
Leknath Load Lekhnath 132 kV
89.44 10510 kVA
130.7 10510 kVA
180.6 10510 kVA
167.2 10510 kVA
175.8 10510 kVA
174
Lumki Load Lumki 132 kV
89.76 6351 kVA
108.6 6351 kVA
155.4 6351 kVA
136.2 6351 kVA
146.8 6351 kVA
180.3
Mahendra Load Mahendranagar 132 kV
89.67 8587 kVA
107.3 8587 kVA
162.3 8587 kVA
230.6 8587 kVA
249.9 8587 kVA
231.3
MarsyandiDCS Marsyangdi 132 kV
89.44 2460 kVA
130.3 2460 kVA
189.2 2460 kVA
178.5 2460 kVA
182.7 2460 kVA
188.7
Mirchiya Load Mirchaiya 132 kV
89.44 8273 kVA
135.4 8273 kVA
184 8273 kVA
186.5 8273 kVA
308.4 8273 kVA
161.1
Modi Load Modi 132 kV
89.44 8497 kVA
129.9 8497 kVA
184.9 8497 kVA
170.8 8497 kVA
179.8 8497 kVA
175.3

153
Loads/Capacitors Connected Bus Power Factor (%)
Scenario - I Scenario - II Scenario - III Scenario - IV Scenario – V Rating %
Loading Rating %
Loading Rating %
Loading Rating %
Loading Rating %
Loading
Muzzafarpur Load Muzzafarpur 400 kV
89.25 1344550
kVA 106.4
Kulekhani Cap Kulekhani 1 66 kV
0 -20000
kvar 88.2
-20000 kvar
91.5 -20000
kvar 80.6
-20000 kvar
82.6 -20000
kvar 74.8
NewChabilCap New Chabahil 66 kV
0 -25000
kvar 86.6
-25000 kvar
73.5 -25000
kvar 54.5
-25000 kvar
64 -25000
kvar 62.1
NewDuhabi Duhabi 132 kV
89.44 97045 kVA
148 97045 kVA
180.8 97045 kVA
209.2 97045 kVA
181.8 97045 kVA
183.8
Panchkhal Load Panchkhal 66 kV
89.44 9168 kVA
147.1 9168 kVA
245.4 9168 kVA
338.4 9168 kVA
280.8 9168 kVA
234.7
Parwanipur Cap Parwanipur 132 kV
0 -48000
kvar 86.4
-48000 kvar
95.4 -48000
kvar 84.7
-48000 kvar
84.7 -48000
kvar 77.6
Parwanipur load Parwanipur 132 kV
89.55 58406 kVA
151.7 58406 kVA
157.2 58406 kVA
212.6 58406 kVA
212.5 57406 kVA
180.4
Patan Load Patan 66 kV
89.35 22271 kVA
151.2 22271 kVA
242 22271 kVA
322.7 22271 kVA
277.2 22271 kVA
239.4
PatanCap Patan 66 kV
0 -25000
kvar 86.6
-25000 kvar
74.4 -25000
kvar 55.8
-25000 kvar
64.9 -25000
kvar 62.7
Pathliya Load Pathlaiya 132 kV
85 13240 kVA
140.4 13240 kVA
154.5 13240 kVA
197.3 13240 kVA
196.6 13240 kVA
172.7
Pokhara Load Pokhara 132 kV
89.44 32647 kVA
130.1 32647 kVA
182.6 32647 kVA
169 32647 kVA
177.7 32647 kVA
175.3
ShivapurandDynasty Shivapur 132 kV
89.44 26386 kVA
121.1 26386 kVA
164.7 26386 kVA
148.9 26386 kVA
159.9 26386 kVA
162.9
simara Load Simara 66 kV
89.44 35777 kVA
180.2 35777 kVA
159.5 35777 kVA
210.9 35777 kVA
230.2 35777 kVA
208.9
SimaraCap Simara 66 kV
0 -15000
kvar 72.7
-15000 kvar
94.1 -15000
kvar 85.4
-15000 kvar
78.2 -15000
kvar 71.8
Siuchatar cap1 Suchatar 132 kV
0 -25000
kvar 91.7
-25000 kvar
85.9 -25000
kvar 75.6
-25000 kvar
80.2 -25000
kvar 75.1
SuitchatarLoad Suichatar 66 kV
89.39 39265 kVA
149.4 39265 kVA
236.4 39265 kVA
306.1 39265 kVA
268.5 39265 kVA
217.4
SunkoshiLoad Sunkoshi 66 kV
89.17 7290 kVA
147.5 7290 kVA
247 7290 kVA
343.2 7290 kVA
283.4 7290 kVA
234.2
Teku Load Teku 89.4 45526 152.3 45526 245 45526 326.2 45526 281.5 45526 243

154
Loads/Capacitors Connected Bus Power Factor (%)
Scenario - I Scenario - II Scenario - III Scenario - IV Scenario – V Rating %
Loading Rating %
Loading Rating %
Loading Rating %
Loading Rating %
Loading 66 kV kVA kVA kVA kVA kVA
Trishuli Load Trishuli 66 kV
89.31 14892 kVA
137 14892 kVA
220.5 14892 kVA
276.6 14892 kVA
246 14892 kVA
205.3
Triveni Yarn Birgunj 66 kV
89.44 4249 kVA
183.5 4249 kVA
157.9 4249 kVA
200 4249 kVA
225.4 4249 kVA
206.5
TriveniSpinningMill Birgunj 66 kV
89.12 6172 kVA
183.5 6172 kVA
189.5 6172 kVA
200 6172 kVA
225.4 6172 kVA
192.7

155
Appendix - M: Results for Expected Monthly Surplus – Deficit Energy of Projected Ten Years Period

156
1. Expected Monthly Surplus (+) & Deficit () Energy (MWh) for Fiscal Year 077/78
(i) Normal Scenario of Expected Energy Consumption
SCENARIO/MONTH Shrawan Bhadra Ashoj Kartik Mangshir Poush Magh Falgun Chaitra Baisakh Jestha Ashad
Normal 495268 546566 777478 783179 567817 213193 89114 38471 111687 155466 441254 881394
With IPP Shift -79777 -97518 24083 17187 -47835 -256406 -290752 -316501 -287046 -330922 -245471 -59595
With NEA and IPP Shift -159824 -176311 -59580 -61806 -111485 -304838 -329171 -351874 -324909 -376811 -309774 -137850
(ii) Growth with Categorization of Consumption Scenario of Expected Energy Consumption
SCENARIO/MONTH Shrawan Bhadra Ashoj Kartik Mangshir Poush Magh Falgun Chaitra Baisakh Jestha Ashad
Normal 358610 407198 652607 664040 459783 91943 -22063 -74816 -3727 17630 289978 731972
With IPP Shift -216435 -236886 -100788 -101952 -155869 -377657 -401929 -429789 -402461 -468758 -396747 -209017
With NEA and IPP Shift -296482 -315679 -184451 -180945 -219519 -426088 -440348 -465161 -440324 -514647 -461050 -287272
(iii) Intervention with Induction Chulo Scenario of Expected Energy Consumption
SCENARIO/MONTH Shrawan Bhadra Ashoj Kartik Mangshir Poush Magh Falgun Chaitra Baisakh Jestha Ashad
Normal 293482 342070 587479 598912 394655 26815 -87191 -139944 -68855 -47498 224850 666844
With IPP Shift -281563 -302014 -165916 -167080 -220997 -442785 -467057 -494917 -467589 -533886 -461875 -274145
With NEA and IPP Shift -361610 -380807 -249579 -246073 -284647 -491216 -505476 -530289 -505452 -579775 -526178 -352399
(iv) Intervention with Electric Vehicle Scenario of Expected Energy Consumption
SCENARIO/MONTH Shrawan Bhadra Ashoj Kartik Mangshir Poush Magh Falgun Chaitra Baisakh Jestha Ashad
Normal 358188 406353 651340 662351 457672 89409 -25019 -78195 -7528 13407 285333 726904
With IPP Shift -216857 -237730 -102055 -103642 -157980 -380191 -404885 -433168 -406262 -472982 -401392 -214085
With NEA and IPP Shift -296904 -316524 -185718 -182635 -221630 -428622 -443304 -468540 -444125 -518870 -465695 -292340

157
(v) Combined Intervention with Electric Vehicle Scenario of Expected Energy Consumption
SCENARIO/MONTH Shrawan Bhadra Ashoj Kartik Mangshir Poush Magh Falgun Chaitra Baisakh Jestha Ashad
Normal 293060 341225 586212 597223 392544 24281 -90147 -143323 -72656 -51721 220205 661776
With IPP Shift -281985 -302858 -167183 -168770 -223108 -445319 -470013 -498296 -471390 -538110 -466520 -279213
With NEA and IPP Shift -362032 -381652 -250846 -247763 -286758 -493750 -508432 -533668 -509253 -583998 -530823 -357468
2. Expected Monthly Surplus (+) & Deficit () Energy (MWh) for Fiscal Year 078/79
(i) Normal Scenario of Expected Energy Consumption
SCENARIO/MONTH Shrawan Bhadra Ashoj Kartik Mangshir Poush Magh Falgun Chaitra Baisakh Jestha Ashad
Normal 1301111 1270661 1539532 1462297 1113576 621055 432412 349461 440563 569130 1056803 1462783
With IPP Shift 815387 855501 1120684 1103680 822374 388896 223693 155721 254687 331490 703289 1116145
With NEA and IPP Shift 643394 686202 940922 933952 685613 284835 141145 79717 162197 219395 546212 924987
(ii) Growth with Categorization of Consumption Scenario of Expected Energy Consumption
SCENARIO/MONTH Shrawan Bhadra Ashoj Kartik Mangshir Poush Magh Falgun Chaitra Baisakh Jestha Ashad
Normal 1069219 1034171 1327642 1260133 930256 415308 243759 157225 244718 335240 800107 1209233
With IPP Shift 583496 619011 908793 901515 639054 183149 35041 -36515 58842 97600 446593 862595
With NEA and IPP Shift 411502 449711 729032 731787 502292 79088 -47508 -112518 -33648 -14496 289516 671437
(iii) Intervention with Induction Chulo Scenario of Expected Energy Consumption
SCENARIO/MONTH Shrawan Bhadra Ashoj Kartik Mangshir Poush Magh Falgun Chaitra Baisakh Jestha Ashad
Normal 938964 903915 1197386 1129877 800000 285052 113503 26969 114463 204984 669852 1078977
With IPP Shift 453240 488755 778537 771260 508798 52893 -95215 -166771 -71414 -32656 316337 732339
With NEA and IPP Shift 281246 319455 598776 601531 372036 -51168 -177764 -242774 -163904 -144752 159260 541181

158
(iv) Intervention with Electric Vehicle Scenario of Expected Energy Consumption
SCENARIO/MONTH Shrawan Bhadra Ashoj Kartik Mangshir Poush Magh Falgun Chaitra Baisakh Jestha Ashad
Normal 1063307 1027413 1320040 1251686 920964 405172 232778 145400 232048 321725 785748 1194029
With IPP Shift 577583 612253 901191 893069 629762 173013 24060 -48341 46172 84085 432234 847391
With NEA and IPP Shift 405589 442954 721430 723340 493001 68952 -58489 -124344 -46318 -28011 275157 656233
(v) Combined Intervention with Electric Vehicle Scenario of Expected Energy Consumption
SCENARIO/MONTH Shrawan Bhadra Ashoj Kartik Mangshir Poush Magh Falgun Chaitra Baisakh Jestha Ashad
Normal 933051 897158 1189784 1121430 790708 274916 102523 15144 101792 191469 655492 1063773
With IPP Shift 447327 481997 770935 762813 499506 42757 -106196 -178597 -84084 -46171 301978 717135
With NEA and IPP Shift 275333 312698 591174 593085 362745 -61304 -188745 -254600 -176574 -158267 144901 525977
3. Expected Monthly Surplus (+) & Deficit () Energy (MWh) for Fiscal Year 079/80
(i) Normal Scenario of Expected Energy Consumption
SCENARIO/MONTH Shrawan Bhadra Ashoj Kartik Mangshir Poush Magh Falgun Chaitra Baisakh Jestha Ashad
Normal 1567228 1657986 1927260 1879912 1446382 863088 595285 501507 603910 775599 1355903 1874221
With IPP Shift 1257441 1221319 1503205 1424401 1078888 575178 390645 303928 387271 507334 987188 1385141
With NEA and IPP Shift 1061904 1028845 1298837 1231440 923405 456872 296796 217521 294781 395238 830111 1193983
(ii) Growth with Categorization of Consumption Scenario of Expected Energy Consumption
SCENARIO/MONTH Shrawan Bhadra Ashoj Kartik Mangshir Poush Magh Falgun Chaitra Baisakh Jestha Ashad
Normal 1217128 1300943 1607357 1574693 1169613 552461 310465 211278 308232 422481 968355 1491423
With IPP Shift 907341 864276 1183303 1119182 802119 264550 105825 13699 91594 154216 599640 1002342
With NEA and IPP Shift 711804 671801 978935 926221 646636 146244 11977 -72708 -896 42120 442563 811184

159
(iii) Intervention with Induction Chulo Scenario of Expected Energy Consumption
SCENARIO/MONTH Shrawan Bhadra Ashoj Kartik Mangshir Poush Magh Falgun Chaitra Baisakh Jestha Ashad
Normal 1021744 1105559 1411973 1379309 974229 357077 115081 15894 112848 227098 772971 1296039
With IPP Shift 711957 668892 987919 923799 606735 69166 -89559 -181685 -103790 -41168 404256 806958
With NEA and IPP Shift 516420 476418 783551 730837 451253 -49140 -183407 -268092 -196280 -153263 247179 615800
(iv) Intervention with Electric Vehicle Scenario of Expected Energy Consumption
SCENARIO/MONTH Shrawan Bhadra Ashoj Kartik Mangshir Poush Magh Falgun Chaitra Baisakh Jestha Ashad
Normal 1200656 1283204 1588351 1554420 1148073 529655 286392 185937 281625 394607 939213 1461014
With IPP Shift 890870 846538 1164297 1098910 780579 241744 81752 -11642 64987 126341 570499 971934
With NEA and IPP Shift 695333 654063 959929 905949 625097 123438 -12097 -98049 -27504 14246 413422 780775
(v) Combined Intervention with Electric Vehicle Scenario of Expected Energy Consumption
SCENARIO/MONTH Shrawan Bhadra Ashoj Kartik Mangshir Poush Magh Falgun Chaitra Baisakh Jestha Ashad
Normal 1005273 1087820 1392968 1359036 952690 334271 91008 -9447 86241 199223 743829 1265630
With IPP Shift 695486 651154 968913 903526 585195 46360 -113632 -207025 -130397 -69042 375115 776550
With NEA and IPP Shift 499949 458679 764545 710565 429713 -71946 -207481 -293432 -222887 -181138 218038 585392
4. Expected Monthly Surplus (+) & Deficit () Energy (MWh) for Fiscal Year 080/81
(i) Normal Scenario of Expected Energy Consumption
SCENARIO/MONTH Shrawan Bhadra Ashoj Kartik Mangshir Poush Magh Falgun Chaitra Baisakh Jestha Ashad
Normal 2054655 2101083 2432961 2348596 1824652 1140312 830230 716621 852490 1193552 1960441 2599757
With IPP Shift 1494364 1579707 1861164 1813857 1388507 797954 537622 440886 545847 759173 1351595 1877489
With NEA and IPP Shift 1378875 1466026 1740458 1699889 1296674 728079 482192 389852 491219 641898 1187260 1767385

160
(ii) Growth with Categorization of Consumption Scenario of Expected Energy Consumption
SCENARIO/MONTH Shrawan Bhadra Ashoj Kartik Mangshir Poush Magh Falgun Chaitra Baisakh Jestha Ashad
Normal 1558653 1595244 1979740 1916179 1432541 700232 426713 305440 433591 693274 1411385 2057430
With IPP Shift 998362 1073868 1407943 1381440 996396 357874 134105 29706 126947 258895 802539 1335162
With NEA and IPP Shift 882873 960187 1287238 1267472 904564 288000 78676 -21328 72320 141620 638203 1225057
(iii) Intervention with Induction Chulo Scenario of Expected Energy Consumption
SCENARIO/MONTH Shrawan Bhadra Ashoj Kartik Mangshir Poush Magh Falgun Chaitra Baisakh Jestha Ashad
Normal 1298141 1334732 1719228 1655667 1172030 439720 166201 44929 173079 432762 1150873 1796918
With IPP Shift 737850 813356 1147431 1120928 735884 97362 -126407 -230806 -133564 -1617 542027 1074650
With NEA and IPP Shift 622361 699675 1026726 1006960 644052 27488 -181836 -281840 -188192 -118892 377691 964546
(iv) Intervention with Electric Vehicle Scenario of Expected Energy Consumption
SCENARIO/MONTH Shrawan Bhadra Ashoj Kartik Mangshir Poush Magh Falgun Chaitra Baisakh Jestha Ashad
Normal 1526555 1561457 1944263 1879013 1393686 659687 384479 261517 387978 645972 1362393 2006749
With IPP Shift 966264 1040081 1372466 1344274 957540 317330 91871 -14217 81335 211593 753547 1284481
With NEA and IPP Shift 850775 926400 1251761 1230306 865708 247455 36441 -65252 26707 94318 589212 1174376
(v) Combined Intervention with Electric Vehicle Scenario of Expected Energy Consumption
SCENARIO/MONTH Shrawan Bhadra Ashoj Kartik Mangshir Poush Magh Falgun Chaitra Baisakh Jestha Ashad
Normal 1266043 1300945 1683752 1618501 1133174 399175 123967 1005 127466 385460 1101881 1746237
With IPP Shift 705752 779569 1111955 1083762 697029 56818 -168641 -274729 -179177 -48919 493035 1023969
With NEA and IPP Shift 590263 665888 991249 969794 605196 -13057 -224070 -325764 -233805 -166194 328700 913865

161
5. Expected Monthly Surplus (+) & Deficit () Energy (MWh) for Fiscal Year 081/82
(i) Normal Scenario of Expected Energy Consumption
SCENARIO/MONTH Shrawan Bhadra Ashoj Kartik Mangshir Poush Magh Falgun Chaitra Baisakh Jestha Ashad
Normal 2674543 2607054 2941484 2772042 2143924 1359390 982757 833899 953395 1175128 1959862 2638616
With IPP Shift 2064773 2104269 2454396 2365132 1832788 1123661 810358 690308 831411 1119903 1877818 2509266
With NEA and IPP Shift 1952146 1993407 2336683 2253989 1743233 1055519 756303 640539 789275 1068834 1806257 2422178
(ii) Growth with Categorization of Consumption Scenario of Expected Energy Consumption
SCENARIO/MONTH Shrawan Bhadra Ashoj Kartik Mangshir Poush Magh Falgun Chaitra Baisakh Jestha Ashad
Normal 1999294 1918413 2324477 2183357 1610111 760273 433416 274125 383112 494058 1212386 1900300
With IPP Shift 1389524 1415629 1837389 1776446 1298975 524544 261017 130534 261129 438833 1130341 1770950
With NEA and IPP Shift 1276897 1304766 1719676 1665304 1209420 456402 206962 80765 218992 387764 1058780 1683862
(iii) Intervention with Induction Chulo Scenario of Expected Energy Consumption
SCENARIO/MONTH Shrawan Bhadra Ashoj Kartik Mangshir Poush Magh Falgun Chaitra Baisakh Jestha Ashad
Normal 1673654 1592773 1998837 1857717 1284471 434633 107776 -51515 57472 168418 886746 1574660
With IPP Shift 1063884 1089989 1511749 1450807 973335 198904 -64622 -195106 -64511 113193 804702 1445310
With NEA and IPP Shift 951258 979126 1394036 1339664 883780 130762 -118678 -244875 -106648 62124 733140 1358222
(iv) Intervention with Electric Vehicle Scenario of Expected Energy Consumption
SCENARIO/MONTH Shrawan Bhadra Ashoj Kartik Mangshir Poush Magh Falgun Chaitra Baisakh Jestha Ashad
Normal 1946501 1863509 2267461 2124229 1548872 696922 367953 206551 313426 422260 1138476 1824279
With IPP Shift 1336731 1360724 1780372 1717318 1237735 461193 195554 62959 191442 367035 1056432 1694928
With NEA and IPP Shift 1224105 1249862 1662660 1606176 1148180 393050 141499 13190 149305 315966 984870 1607840

162
(v) Combined Intervention with Electric Vehicle Scenario of Expected Energy Consumption
SCENARIO/MONTH Shrawan Bhadra Ashoj Kartik Mangshir Poush Magh Falgun Chaitra Baisakh Jestha Ashad
Normal 1620862 1537869 1941821 1798589 1223232 371282 42313 -119089 -12214 96620 812836 1498639
With IPP Shift 1011091 1035084 1454733 1391679 912096 135553 -130085 -262681 -134198 41395 730792 1369289
With NEA and IPP Shift 898465 924222 1337020 1280536 822540 67411 -184141 -312450 -176334 -9674 659231 1282201
6. Expected Monthly Surplus (+) & Deficit () Energy (MWh) for Fiscal Year 082/83
(i) Normal Scenario of Expected Energy Consumption
SCENARIO/MONTH Shrawan Bhadra Ashoj Kartik Mangshir Poush Magh Falgun Chaitra Baisakh Jestha Ashad
Normal 2714284 2671200 3024637 2849749 2198703 1342668 933288 781240 900835 1112757 1899721 2569338
With IPP Shift 2588988 2515832 2863791 2694923 2076016 1282996 914769 762758 884614 1094832 1869945 2540920
With NEA and IPP Shift 2499905 2428144 2770685 2607014 2005181 1229098 872013 723393 842477 1043764 1798383 2453832
(ii) Growth with Categorization of Consumption Scenario of Expected Energy Consumption
SCENARIO/MONTH Shrawan Bhadra Ashoj Kartik Mangshir Poush Magh Falgun Chaitra Baisakh Jestha Ashad
Normal 1819678 1758852 2207194 2069827 1491479 548926 205492 39621 145295 210440 909425 1591178
With IPP Shift 1694383 1603484 2046348 1915002 1368792 489253 186973 21140 129073 192515 879648 1562760
With NEA and IPP Shift 1605300 1515797 1953242 1827092 1297958 435355 144217 -18225 86936 141446 808087 1475672
(iii) Intervention with Induction Chulo Scenario of Expected Energy Consumption
SCENARIO/MONTH Shrawan Bhadra Ashoj Kartik Mangshir Poush Magh Falgun Chaitra Baisakh Jestha Ashad
Normal 1428911 1368085 1816426 1679059 1100711 158158 -185276 -351146 -245473 -180328 518657 1200411
With IPP Shift 1303615 1212717 1655580 1524234 978025 98486 -203795 -369628 -261695 -198253 488881 1171992
With NEA and IPP Shift 1214532 1125029 1562474 1436324 907190 44588 -246550 -408993 -303832 -249321 417319 1084904

163
(iv) Intervention with Electric Vehicle Scenario of Expected Energy Consumption
SCENARIO/MONTH Shrawan Bhadra Ashoj Kartik Mangshir Poush Magh Falgun Chaitra Baisakh Jestha Ashad
Normal 1741123 1677763 2123570 1983669 1402787 457700 111732 -56672 46467 109078 805529 1484748
With IPP Shift 1615827 1522395 1962724 1828844 1280101 398027 93213 -75154 30245 91153 775752 1456330
With NEA and IPP Shift 1526744 1434707 1869618 1740935 1209266 344130 50457 -114519 -11892 40084 704191 1369242
(v) Combined Intervention with Electric Vehicle Scenario of Expected Energy Consumption
SCENARIO/MONTH Shrawan Bhadra Ashoj Kartik Mangshir Poush Magh Falgun Chaitra Baisakh Jestha Ashad
Normal 1350355 1286995 1732803 1592902 1012020 66932 -279036 -447440 -344301 -281690 414761 1093980
With IPP Shift 1225060 1131627 1571957 1438076 889333 7260 -297555 -465922 -360523 -299615 384985 1065562
With NEA and IPP Shift 1135977 1043939 1478850 1350167 818498 -46638 -340310 -505287 -402659 -350683 313423 978474
7. Expected Monthly Surplus (+) & Deficit () Energy (MWh) for Fiscal Year 083/84
(i) Normal Scenario of Expected Energy Consumption
SCENARIO/MONTH Shrawan Bhadra Ashoj Kartik Mangshir Poush Magh Falgun Chaitra Baisakh Jestha Ashad
Normal 2646839 2573216 2936846 2765987 2122749 1257422 855124 701591 819692 1015850 1793365 2464286
With IPP Shift 2621612 2572720 2940442 2766425 2125169 1259959 859510 704198 826043 1025283 1801925 2463860
With NEA and IPP Shift 2532529 2485032 2847335 2678516 2054334 1206061 816754 664833 783907 1025283 1801925 2463860
(ii) Growth with Categorization of Consumption Scenario of Expected Energy Consumption
SCENARIO/MONTH Shrawan Bhadra Ashoj Kartik Mangshir Poush Magh Falgun Chaitra Baisakh Jestha Ashad
Normal 1484670 1387999 1874917 1752802 1204005 226283 -90345 -261834 -161819 -156336 506887 1193573
With IPP Shift 1459444 1387503 1878513 1753241 1206425 228820 -85959 -259226 -155468 -146903 515446 1193147
With NEA and IPP Shift 1370361 1299815 1785407 1665331 1135590 174922 -128714 -298592 -197605 -146903 515446 1193147

164
(iii) Intervention with Induction Chulo Scenario of Expected Energy Consumption
SCENARIO/MONTH Shrawan Bhadra Ashoj Kartik Mangshir Poush Magh Falgun Chaitra Baisakh Jestha Ashad
Normal 1028775 932103 1419022 1296907 748109 -229612 -546240 -717729 -617715 -612232 50991 737677
With IPP Shift 1003548 931607 1422618 1297345 750529 -227075 -541855 -715122 -611364 -602799 59551 737251
With NEA and IPP Shift 914465 843920 1329511 1209436 679694 -280973 -584610 -754488 -653500 -602799 59551 737251
(iv) Intervention with Electric Vehicle Scenario of Expected Energy Consumption
SCENARIO/MONTH Shrawan Bhadra Ashoj Kartik Mangshir Poush Magh Falgun Chaitra Baisakh Jestha Ashad
Normal 1375284 1275656 1759618 1634547 1082793 102115 -217469 -391915 -294857 -292330 367936 1051666
With IPP Shift 1350057 1275160 1763214 1634985 1085213 104652 -213084 -389308 -288506 -282897 376496 1051240
With NEA and IPP Shift 1260974 1187472 1670108 1547076 1014378 50754 -255839 -428673 -330642 -282897 376496 1051240
(v) Combined Intervention with Electric Vehicle Scenario of Expected Energy Consumption
SCENARIO/MONTH Shrawan Bhadra Ashoj Kartik Mangshir Poush Magh Falgun Chaitra Baisakh Jestha Ashad
Normal 919388 819760 1303722 1178651 626897 -353781 -673365 -847810 -750753 -748226 -87959 595770
With IPP Shift 894161 819264 1307318 1179090 629317 -351244 -668979 -845203 -744401 -738793 -79400 595344
With NEA and IPP Shift 805079 731577 1214212 1091180 558482 -405142 -711735 -884569 -786538 -738793 -79400 595344
8. Expected Monthly Surplus (+) & Deficit () Energy (MWh) for Fiscal Year 084/85
(i) Normal Scenario of Expected Energy Consumption
SCENARIO/MONTH Shrawan Bhadra Ashoj Kartik Mangshir Poush Magh Falgun Chaitra Baisakh Jestha Ashad
Normal 2543074 2467393 2842031 2675524 2040718 1165356 770707 615571 732057 911191 1678501 2350829
With IPP Shift 2546481 2466897 2845627 2675962 2043138 1167893 775093 618178 738408 920624 1687061 2350403
With NEA and IPP Shift 2546481 2466897 2845627 2675962 2043138 1167893 775093 618178 738408 920624 1687061 2350403

165
(ii) Growth with Categorization of Consumption Scenario of Expected Energy Consumption
SCENARIO/MONTH Shrawan Bhadra Ashoj Kartik Mangshir Poush Magh Falgun Chaitra Baisakh Jestha Ashad
Normal 1055444 950260 1482713 1378600 864683 -154550 -439537 -617658 -524324 -589263 31748 724257
With IPP Shift 1058851 949764 1486309 1379039 867103 -152013 -435151 -615051 -517972 -579830 40308 723831
With NEA and IPP Shift 1058851 949764 1486309 1379039 867103 -152013 -435151 -615051 -517972 -579830 40308 723831
(iii) Intervention with Induction Chulo Scenario of Expected Energy Consumption
SCENARIO/MONTH Shrawan Bhadra Ashoj Kartik Mangshir Poush Magh Falgun Chaitra Baisakh Jestha Ashad
Normal 534420 429236 961689 857577 343659 -675573 -960561 -1138681 -1045347 -1110287 -489276 203234
With IPP Shift 537827 428740 965285 858015 346079 -673036 -956175 -1136074 -1038996 -1100854 -480716 202808
With NEA and IPP Shift 537827 428740 965285 858015 346079 -673036 -956175 -1136074 -1038996 -1100854 -480716 202808
(iv) Intervention with Electric Vehicle Scenario of Expected Energy Consumption
SCENARIO/MONTH Shrawan Bhadra Ashoj Kartik Mangshir Poush Magh Falgun Chaitra Baisakh Jestha Ashad
Normal 910158 801595 1330670 1223179 705882 -316729 -605095 -786594 -696639 -764957 -147325 541806
With IPP Shift 913565 801099 1334266 1223617 708302 -314192 -600709 -783987 -690287 -755524 -138765 541380
With NEA and IPP Shift 913565 801099 1334266 1223617 708302 -314192 -600709 -783987 -690287 -755524 -138765 541380
(v) Combined Intervention with Electric Vehicle Scenario of Expected Energy Consumption
SCENARIO/MONTH Shrawan Bhadra Ashoj Kartik Mangshir Poush Magh Falgun Chaitra Baisakh Jestha Ashad
Normal 389135 280572 809646 702155 184858 -837753 -1126119 -1307618 -1217663 -1285981 -668348 20782
With IPP Shift 392542 280076 813242 702594 187278 -835216 -1121733 -1305011 -1211311 -1276548 -659789 20356
With NEA and IPP Shift 392542 280076 813242 702594 187278 -835216 -1121733 -1305011 -1211311 -1276548 -659789 20356

166
9. Expected Monthly Surplus (+) & Deficit () Energy (MWh) for Fiscal Year 085/86
(i) Normal Scenario of Expected Energy Consumption
SCENARIO/MONTH Shrawan Bhadra Ashoj Kartik Mangshir Poush Magh Falgun Chaitra Baisakh Jestha Ashad
Normal 2431008 2353104 2739630 2577824 1952125 1065925 679537 522669 637411 798158 1554448 2228296
With IPP Shift 2434415 2352608 2743226 2578262 1954545 1068462 683923 525277 643763 807592 1563008 2227870
With NEA and IPP Shift 2434415 2352608 2743226 2578262 1954545 1068462 683923 525277 643763 807592 1563008 2227870
(ii) Growth with Categorization of Consumption Scenario of Expected Energy Consumption
SCENARIO/MONTH Shrawan Bhadra Ashoj Kartik Mangshir Poush Magh Falgun Chaitra Baisakh Jestha Ashad
Normal 548417 433177 1019418 936572 463856 -604412 -852023 -1037977 -952534 -1100661 -529513 169875
With IPP Shift 551824 432681 1023014 937010 466276 -601875 -847637 -1035370 -946183 -1091228 -520953 169449
With NEA and IPP Shift 551824 432681 1023014 937010 466276 -601875 -847637 -1035370 -946183 -1091228 -520953 169449
(iii) Intervention with Induction Chulo Scenario of Expected Energy Consumption
SCENARIO /MONTH Shrawan Bhadra Ashoj Kartik Mangshir Poush Magh Falgun Chaitra Baisakh Jestha Ashad
Normal -37735 -152975 433267 350420 -122296 -1190563 -1438174 -1624129 -1538686 -1686813 -1115664 -416277
With IPP Shift -34328 -153470 436863 350859 -119876 -1188026 -1433789 -1621522 -1532334 -1677380 -1107104 -416703 With NEA and IPP Shift -34328 -153470 436863 350859 -119876 -1188026 -1433789 -1621522 -1532334 -1677380 -1107104 -416703
(iv) Intervention with Electric Vehicle Scenario of Expected Energy Consumption
SCENARIO/MONTH Shrawan Bhadra Ashoj Kartik Mangshir Poush Magh Falgun Chaitra Baisakh Jestha Ashad
Normal 362164 243123 825563 738916 262399 -809670 -1061082 -1250838 -1169195 -1321123 -753776 -58190
With IPP Shift 365571 242627 829159 739354 264819 -807133 -1056696 -1248231 -1162844 -1311690 -745216 -58616
With NEA and IPP Shift 365571 242627 829159 739354 264819 -807133 -1056696 -1248231 -1162844 -1311690 -745216 -58616

167
(v) Combined Intervention with Electric Vehicle Scenario of Expected Energy Consumption
SCENARIO/ MONTH Shrawan Bhadra Ashoj Kartik Mangshir Poush Magh Falgun Chaitra Baisakh Jestha Ashad
Normal -223988 -343028 239412 152764 -323753 -1395821 -1647234 -1836989 -1755347 -1907275 -1339928 -644341
With IPP Shift -220581 -343524 243008 153203 -321333 -1393284 -1642848 -1834382 -1748995 -1897842 -1331368 -644767 With NEA and IPP Shift -220581 -343524 243008 153203 -321333 -1393284 -1642848 -1834382 -1748995 -1897842 -1331368 -644767
10. Expected Monthly Surplus (+) & Deficit () Energy (MWh) for Fiscal Year 086/87
(i) Normal Scenario of Expected Energy Consumption
SCENARIO/MONTH Shrawan Bhadra Ashoj Kartik Mangshir Poush Magh Falgun Chaitra Baisakh Jestha Ashad
Normal 2309976 2229672 2629038 2472308 1856444 958539 581073 422336 535194 676084 1420470 2095961
With IPP Shift 2313383 2229176 2632634 2472747 1858864 961076 585459 424943 541545 685517 1429030 2095535
With NEA and IPP Shift 2313383 2229176 2632634 2472747 1858864 961076 585459 424943 541545 685517 1429030 2095535
(ii) Growth with Categorization of Consumption Scenario of Expected Energy Consumption
SCENARIO/ MONTH Shrawan Bhadra Ashoj Kartik Mangshir Poush Magh Falgun Chaitra Baisakh Jestha Ashad
Normal -50960 -178087 471739 414032 -9977 -1136211 -1339639 -1534854 -1458739 -1705205 -1193001 -485483
With IPP Shift -47553 -178582 475335 414471 -7557 -1133674 -1335253 -1532247 -1452387 -1695772 -1184441 -485909 With NEA and IPP Shift -47553 -178582 475335 414471 -7557 -1133674 -1335253 -1532247 -1452387 -1695772 -1184441 -485909

168
(iii) Intervention with Induction Chulo Scenario of Expected Energy Consumption
SCENARIO/ MONTH Shrawan Bhadra Ashoj Kartik Mangshir Poush Magh Falgun Chaitra Baisakh Jestha Ashad
Normal -702240 -829366 -179540 -237248 -661256 -1787491 -1990918 -2186134 -2110018 -2356484 -1844281 -1136762
With IPP Shift -698833 -829862 -175944 -236809 -658836 -1784954 -1986533 -2183527 -2103667 -2347051 -1835721 -1137188 With NEA and IPP Shift -698833 -829862 -175944 -236809 -658836 -1784954 -1986533 -2183527 -2103667 -2347051 -1835721 -1137188
(iv) Intervention with Electric Vehicle Scenario of Expected Energy Consumption
SCENARIO/ MONTH Shrawan Bhadra Ashoj Kartik Mangshir Poush Magh Falgun Chaitra Baisakh Jestha Ashad
Normal -283248 -414598 231005 169074 -259158 -1389616 -1597267 -1796706 -1724814 -1975503 -1467523 -764228
With IPP Shift -279841 -415094 234601 169512 -256738 -1387079 -1592881 -1794099 -1718462 -1966070 -1458963 -764654 With NEA and IPP Shift -279841 -415094 234601 169512 -256738 -1387079 -1592881 -1794099 -1718462 -1966070 -1458963 -764654
(v) Combined Intervention with Electric Vehicle Scenario of Expected Energy Consumption
SCENARIO/MONTH Shrawan Bhadra Ashoj Kartik Mangshir Poush Magh Falgun Chaitra Baisakh Jestha Ashad
Normal -934528 -1065878 -420275 -482206 -910438 -2040896 -2248547 -2447986 -2376093 -2626783 -2118803 -1415508
With IPP Shift -931120 -1066373 -416679 -481767 -908018 -2038359 -2244161 -2445378 -2369742 -2617350 -2110243 -1415934
With NEA and IPP Shift -931120 -1066373 -416679 -481767 -908018 -2038359 -2244161 -2445378 -2369742 -2617350 -2110243 -1415934

169
Appendix - N: Load Flow Simulation Results

170
Bus Voltage Results for Different Scenarios for fiscal year 084/85
Bus ID Nominal Voltage (kV)
Bus Voltage Results (kV) Scenario – I Scenario - II Scenario – III Scenario - IV Scenario - V
Amlekhgunj 66 51.61 63.147 55.945 53.401 49.132 Balaju_66 66 57.708 49.835 37.968 43.747 42.276
Banepa 66 58.082 48.56 35.378 42.499 42.03 Baneswor. 66 57.687 49.575 37.231 43.425 41.868 Bhaktpur 66 59.18 51.721 40.016 46.201 44.31 Birjung 66 46.759 62.701 66 52.718 47.949 Chapali 66 58.324 50.216 38.318 44.289 42.847
Devighat 66 61.827 53.074 41.921 47.411 47.213 Hetauda_66 66 57.956 62.314 56.89 56.473 52.147
Indrawati 66 59.169 49.39 36.432 43.421 43.308 K-3 (Singhadurbar) 66 56.081 48.081 35.878 41.735 40.333
KL-1 66 58.238 60.36 53.227 54.523 49.357 Lainchaur 66 57.101 48.592 36.168 42.324 41.071
New Chabel 66 57.139 48.51 35.99 42.235 40.999 Panchkhal 66 58.334 48.414 35.11 42.311 42.173
Parwanipur 66 66 48.998 63.209 61.111 55.057 50.33 Patan 66 57.176 49.101 36.813 42.857 41.356
Simara 66 47.984 62.082 56.341 51.601 47.386 Siuchatar66. 66 57.432 50.26 38.812 44.251 42.5
Sunkoshi 66 58.606 48.091 34.612 41.925 42.273 Teku 66 56.333 48.485 36.425 42.202 40.735
Trishuli 66 62.607 53.885 42.955 48.301 48.224 Amarpur (Panchthar) 132 131.142 132 129.036 132 126.692
Anarmani 132 122.692 122.658 124.11 123.703 118.115 Attariya 132 160.168 148.143 171.854 159.452 95.184 Bajhang 132 165.582 149.838 173.005 162.814 96.885
Balaju132 132 120.585 111.849 96.701 103.896 97.527 Balanch 132 162.929 147.862 170.453 160.51 96.05 Bardghat 132 135.702 137.522 150.346 141.464 117.734
Bhaktpur132 132 120.892 110.97 92.65 102.933 95.825 Bharatpur 132 131.633 123.51 132.867 128.339 105.1
Bhotekoshi 132 127.997 120.515 102.692 114.779 105.71 Bhuriguon 132 158.28 155.091 175.463 162.75 117.335

171
Bus ID Nominal Voltage (kV)
Bus Voltage Results (kV) Scenario – I Scenario - II Scenario – III Scenario - IV Scenario - V
Budiganga 132 160.028 153.287 174.918 162.286 110.566 Burtibang132 132 142.353 144.93 160.197 149.312 122.252
Kohalpur2 132 157.413 160.392 178.393 165.554 132.293 Butwal 132 136.235 140.467 153.842 144.216 120.647 Cha.pur 132 118.221 125.205 116.635 117.113 110.222
Changunarayan 132 120.714 110.834 92.881 102.73 95.832 Chapali 132 132 120.315 110.521 93.396 102.267 95.858
Damak 132 124.371 125.377 126.774 126.382 120.368 Damauli 132 133.452 132.695 142.599 136.205 115.089
Dhalkebar 132 125.133 129.889 127.822 128.094 122.966 Duhabi 132 115.918 131.39 113.58 130.727 107.746 Gandak 132 135.974 137.788 150.592 141.723 117.742
Hetauda132 132 122.498 126.053 119.07 119.786 112.848 Illam (Godak) 132 127.179 129.354 128.518 129.363 122.755
Jhimruk 132 146.723 147.822 164.422 152.67 123.411 Kamane 132 121.42 126.099 118.083 118.825 111.627 Katiya 132 118.641 132.508 119.648 131.671 111.169
Kawasoti 132 132.159 127.558 138.359 132.106 108.711 KGA 132 132 132.896 145.037 136.671 114.32
Khimti132 132 131.77 127.909 109.542 126.096 113.62 Kohalpur 132 156.571 158.556 176.858 164.02 129.523 KUL-II 132 122.177 123.245 114.525 116.668 109.191 KUL-III 132 122.304 124.445 116.419 117.995 110.63 Kushaha 132 118.634 131.691 118.871 130.983 111.162
kusma132 132 135.672 138.409 149.768 140.056 121.429 Kusum 132 151.171 152.957 170.417 158.119 125.997 Lahan 132 124.182 127.62 123.151 127.125 118.283
Lamahi 132 145.613 147.21 163.83 152.064 122.325 Lamosangu 132 125.799 118.2 99.984 112.351 103.068
Leknath. 132 132.259 131.59 142.141 135.151 113.8 Likhu132 132 132 132 107.856 132 112.935
Lumki 132 159.244 152.864 174.423 161.833 109.811 M-Marsyandi 132 132 132 132 132 97.932
Mahendranagar 132 159.944 146.37 171.733 158.479 85.599 Marsyandi. 132 132.684 160.723 179.281 165.75 133.75

172
Bus ID Nominal Voltage (kV)
Bus Voltage Results (kV) Scenario – I Scenario - II Scenario – III Scenario - IV Scenario - V
Matatirtha 132 121.56 125.61 133.117 130.034 104.91 Minatara_132 132 158.256 115.165 102.645 107.848 100.964
Mirchiaya 132 127.694 129.146 127.4 128.39 122.936 Modi 132 132.113 128.508 139.121 132.164 112.936
parwanipur 132 132 113.986 125.919 111.763 111.825 102.455 Pathliya 132 116.914 125.772 114.406 115.039 106.663
Phalmanpur 132 159.693 150.77 173.325 160.808 103.201 Phidim (Thapatar) 132 130.316 131.78 129.311 131.782 125.845
Pokhara 132 131.922 130.1 140.575 133.706 112.928 Raxaul - - 126.86 - 112.406 -
Shivapur. 132 141.747 144.223 159.538 148.62 121.577 Siuchatar132 132 121.022 113.427 99.84 105.833 99.132 Tingla_132 132 130.157 129.798 129.165 129.343 124.594 UModi132 132 135.673 138.344 149.708 139.992 121.43
UpperKhalangad 132 164.063 148.517 171.453 161.363 96.043 West_Seti 132 165.216 149.508 172.623 162.454 96.671
AandhiKhola 220 227.758 235.628 255.734 239.741 205.684 Arun3_220 220 220.068 220.035 209.31 220.035 215.95
Baneshwor_220 220 219.502 218.962 210.615 219.303 214.114 Barhabise220 220 220 217.01 223.372 216.57 204.315 Bharatpur220 220 220.348 205.291 222.035 214.736 174.292
Butwal220 220 228.338 237.029 259.117 242.806 205.988 Damauli220 220 223.758 223.194 239.714 228.76 194.526
Dana 220 225.646 231.832 248.857 232.608 203.573 Dandakhet 220 225.599 231.945 248.428 231.891 203.525
Dhalkebar220 220 215.193 218.129 219.617 216.578 207.746 Inaruwa_220 220 215.477 215.674 213.63 216.185 210.445 Khadbari_220 220 219.659 218.829 210.012 219.152 214.161
Khudi220 220 222.199 212.989 229.946 223.295 182.668 Kusma 220 226.287 232.659 250.639 235.086 204.272
lekhnath220 220 221.83 220.804 237.997 226.6 191.653 Manang220 220 222.302 213.017 229.986 223.33 182.754
Matatirtha_220 220 217.692 213.479 218.839 211.521 189.85 New Khimti220 220 218.573 217.705 220.121 216.462 206.384 NewBasantpur 220 218.727 218.656 211.275 219.033 213.535

173
Bus ID Nominal Voltage (kV)
Bus Voltage Results (kV) Scenario – I Scenario - II Scenario – III Scenario - IV Scenario - V
NewMarsyangdi 220 221.38 207.857 223.78 217.615 175.8 Rahughat220 220 225.67 231.958 248.967 232.733 203.612
Ratmate 220 220.275 220.26 230.236 220.467 197.406 SitalPati_220 220 220 220 209.338 220 215.357
Tamakoshi220 220 220 215.66 220.738 214.542 204.401 Tingla_220 220 220 220 220 220 212.634 Trishuli 3B 220 220 216.401 225.266 215.672 193.54 Udipur220 220 221.781 210.217 227.229 221.785 179.382 UMadi220 220 221.135 219.538 236.868 225.382 190.722
Arun Hub_400 400 400 400 380.006 400 396.524 Bafikot Hub 400 476.754 490.117 542.299 503.839 413.863 Barhabise 400 400 402.903 414.94 402.681 377.974 Butwal400 400 418.797 443.002 481.132 452.498 387.438 Damak400 400 385.509 387 389.999 388.864 376.278
Damauli400 400 412.247 425.153 455.776 432.022 376.79 Dhalkebar400 400 384.489 396.551 398.223 392.769 387.417
Dodhara 400 488.626 497.992 554.158 512.488 416.171 Duhabi_400 - - 399.057 - 398.501 - Gorkahpur 400 400 447.376 486.198 457.158 391.018
Hetauda400 400 381.2 389.205 382.491 380.13 369.358 Inaruwa400 400 388.377 392.241 393.319 392.27 382.45
Kohalpur400 400 481.052 491.318 545.87 506.003 410.387 Kusma400 400 412.843 425.258 456.653 431.426 375.914
LampsiPhedi 400 404.51 409.341 428.038 411.418 375.991 Mainatara 400 481.485 492.037 546.523 506.532 411.908 Mirchaiya 400 387.25 394.569 396.004 392.687 385.227
Muzzafapur 400 375.851 397.45 399.068 393.64 400 New Khmti400 400 394.248 400.091 407.125 398.255 381.209
Phukot 400 490.52 499.911 556.321 501.832 417.746 Pulbari 400 474.823 488.17 540.126 514.471 412.201 Purnea - - 400 - 400 -
Ratamate 400 406.06 412.435 433.865 415.435 374.557

174
Line Loadings and Transformer Loadings for Scenario –I in fiscal year 084/85
From Bus To Bus % Loading Hetauda_66 Amlekhgunj 135.4 Hetauda_66 Amlekhgunj 135.4
Simara Amlekhgunj 131.6 Simara Amlekhgunj 131.6
AandhiKhola Butwal220 48.5 AandhiKhola Butwal220 48.5
Attariya Phalmanpur 36.6 Attariya Phalmanpur 36.6
Bafikot Hub Pulbari 23.6 Bafikot Hub Pulbari 23.6
Bajhang West_Seti 4 Bajhang West_Seti 4
Balaju_66 Balaju132 88.5 Chapali 132 Balaju132 14.5 Chapali 132 Balaju132 14.5 Balaju132 Siuchatar132 37.9 Trishuli Balaju_66 70.4
Balaju_66 Lainchaur 116.1 Trishuli Balaju_66 70.4 Balanch Attariya 29.3 Balanch Attariya 73.2
UpperKhalangad Balanch 19.2 UpperKhalangad Balanch 19.2
Banepa Panchkhal 9.4 Baneswor. Bhaktpur 118.5 Bardghat Gandak 5.4 Bardghat Gandak 5.4 Kawasoti Bardghat 48.7 Bhaktpur Banepa 41.1
Bhaktpur132 Bhaktpur 89.6 Bharatpur Damauli 19.5
Marsyandi. Bharatpur 79.1 Lamosangu Bhotekoshi 44.3 Bhuriguon Kohalpur 39.7 Bhuriguon Kohalpur 39.7
Phalmanpur Lumki 36.1 Phalmanpur Lumki 36.1 Budiganga Lumki 6.9 Budiganga Lumki 6.9
Burtibang132 Shivapur. 8.6 Burtibang132 Shivapur. 8.6
Cha.pur Dhalkebar 53.5 Cha.pur Dhalkebar 53.5
Changunarayan Bhaktpur132 45.8 Changunarayan Bhaktpur132 45.8
Chapali 132 Chapali 83.9 New Chabel Chapali 120.3 New Chabel Chapali 120.3 Chapali 132 Changunarayan 45.8

175
From Bus To Bus % Loading Chapali 132 Changunarayan 45.8
Chapali Devighat 48.3 Chapali Devighat 48.3
Hetauda132 Bharatpur 53.7 Anarmani Damak 44.4
Damauli400 Kusma400 22.6 Damauli400 Kusma400 22.6
Dana Rahughat220 23.6 Dana Rahughat220 23.6
Dandakhet Rahughat220 20.9 Dandakhet Rahughat220 20.9
Dhalkebar400 Dhalkebar 15.9 Dhalkebar400 Dhalkebar 15.9 Dhalkebar400 Dhalkebar220 50.8 Dhalkebar220 New Khimti220 28.8 Muzzafapur Dhalkebar400 112 Muzzafapur Dhalkebar400 112
Dhalkebar220 New Khimti220 28.8 Dhalkebar Mirchiaya 61 Dhalkebar Mirchiaya 61
Lahan Duhabi 31 Damak Duhabi 140.1
Hetauda132 Hetauda_66 416.2 Hetauda132 Hetauda400 729.9 Hetauda132 Kamane 80.2
Kamane Pathliya 71.7 Kamane Pathliya 71.7
Hetauda_66 KL-1 12.2 Hetauda_66 KL-1 1.2 Hetauda132 KUL-II 17.9 Hetauda132 KUL-III 17.8 Hetauda132 Kamane 80.2
Illam (Godak) Damak 184.7 Illam (Godak) Damak 184.7
Phidim (Thapatar) Illam (Godak) 164.6 Phidim (Thapatar) Illam (Godak) 164.6 Phidim (Thapatar) Amarpur (Panchthar) 148.7 Phidim (Thapatar) Amarpur (Panchthar) 148.7
Teku K-3 (Singhadurbar) 45.6 Kawasoti Bharatpur 60.3
KGA Butwal 77.3 KGA Butwal 57.7
Lamosangu Khimti132 142.3 Kohalpur Minatara_132 13.3 Kohalpur Minatara_132 16.7 Kusum Kohalpur 45.1 Kusum Kohalpur 45.1 KUL-III KUL-II 17.9 Katiya Kushaha 0.5 Katiya Kushaha 0.5 Lahan Kushaha 40.1

176
From Bus To Bus % Loading Kushaha Duhabi 42 Kusma AandhiKhola 50 Kusma AandhiKhola 50 Lamahi Kusum 47 Lamahi Kusum 47 Jhimruk Lamahi 9.6
Shivapur. Lamahi 33.6 Shivapur. Lamahi 33.6
Bhaktpur132 Lamosangu 94.5 Bhaktpur132 Lamosangu 94.5
Leknath. Damauli 23.4 Pokhara Leknath. 97.1
Butwal400 Pulbari 95 Butwal400 Pulbari 95
Damauli400 Butwal400 176.3 Damauli400 Butwal400 176.3
Ratamate Damauli400 105.8 Ratamate Damauli400 105.8
LampsiPhedi Ratamate 36.4 LampsiPhedi Ratamate 36.4
Barhabise LampsiPhedi 42.2 Barhabise LampsiPhedi 42.2 Barhabise New Khmti400 63.4 Barhabise New Khmti400 63.4
Dhalkebar400 New Khmti400 106.2 Inaruwa400 Mirchaiya 47 Inaruwa400 Mirchaiya 47 Damak400 Inaruwa400 25.4 Damak400 Inaruwa400 25.4
lekhnath220 Damauli220 22.7 lekhnath220 Damauli220 22.7 UMadi220 lekhnath220 28.9
NewMarsyangdi Bharatpur220 32.4 NewMarsyangdi Bharatpur220 32.4
Udipur220 NewMarsyangdi 17.6 Udipur220 NewMarsyangdi 17.6 Khudi220 Udipur220 24.9 Khudi220 Udipur220 24.9
Manang220 Khudi220 12.3 Manang220 Khudi220 12.3 Khudi220 Damauli220 46.9 Khudi220 Damauli220 46.9 Likhu132 Khimti132 68.5 Likhu132 Khimti132 68.5
Tamakoshi220 New Khimti220 63.9 Tamakoshi220 New Khimti220 63.9 Barhabise220 Tamakoshi220 61.6 Barhabise220 Tamakoshi220 61.6 Arun3_220 SitalPati_220 29.1 Arun3_220 SitalPati_220 29.1
SitalPati_220 Khadbari_220 44.5

177
From Bus To Bus % Loading SitalPati_220 Khadbari_220 44.5 Khadbari_220 Baneshwor_220 38 Khadbari_220 Baneshwor_220 38 NewBasantpur Inaruwa_220 53 NewBasantpur Inaruwa_220 53
Baneshwor_220 NewBasantpur 45.9 Baneshwor_220 NewBasantpur 45.9
Mirchaiya Dhalkebar400 49.1 Mirchaiya Dhalkebar400 49.1
Dhalkebar400 New Khmti400 106.2 Tingla_132 Mirchiaya 164.7 Tingla_132 Mirchiaya 164.7 Trishuli 3B Ratmate 118.4 Trishuli 3B Ratmate 118.4 Trishuli 3B Matatirtha_220 29.1 Trishuli 3B Matatirtha_220 29.1 Hetauda400 Dhalkebar400 30.7 Hetauda400 Dhalkebar400 30.7 Butwal400 Gorkahpur 208 Butwal400 Gorkahpur 208
Lumki Bhuriguon 39.9 Lumki Bhuriguon 39.9
M-Marsyandi Marsyandi. 61.2 Mahendranagar Attariya 3.7 Mahendranagar Attariya 3.7
Mainatara Dodhara 33.9 Mainatara Kohalpur400 9.1 Mainatara Kohalpur400 7.3 Mainatara Dodhara 33.9
Siuchatar132 Marsyandi. 47.7 KUL-II Matatirtha 18.8 KUL-II Matatirtha 18.8
Siuchatar132 Matatirtha 59.2 Siuchatar132 Matatirtha 59.2
Mirchiaya Lahan 66.6 Mirchiaya Lahan 66.6 Bardghat Butwal 19.3 Bardghat Butwal 19.3
New Chabel Lainchaur 7.4 New Chabel Lainchaur 7.4 Panchkhal Indrawati 23 Panchkhal Sunkoshi 3.8
parwanipur 132 Parwanipur 66 150.7 parwanipur 132 Parwanipur 66 150.7 Parwanipur 66 Birjung 119.1 Parwanipur 66 Birjung 119.1
Patan Baneswor. 82.6 Pathliya Cha.pur 25.7 Pathliya Cha.pur 25.7
parwanipur 132 Pathliya 90 parwanipur 132 Pathliya 90

178
From Bus To Bus % Loading Phukot Dodhara 18.5 Phukot Dodhara 18.5 Pulbari Mainatara 39.5 Pulbari Mainatara 39.5 Modi Pokhara 73.1
Rahughat220 Kusma 84.9 Rahughat220 Kusma 84.9
Butwal Shivapur. 41.1 Butwal Shivapur. 41.1
Parwanipur 66 Simara 35.1 Parwanipur 66 Simara 35.1
Balaju_66 Siuchatar66. 20.8 Balaju_66 Siuchatar66. 20.8
Siuchatar66. K-3 (Singhadurbar) 79.4 Siuchatar66. Patan 30.6 Siuchatar66. Patan 30.6 Siuchatar66. Teku 148.1 Siuchatar66. Siuchatar132 90.5 Siuchatar66. Siuchatar132 90.5 Matatirtha Matatirtha_220 158
KL-1 Siuchatar66. 8.5 KL-1 Siuchatar66. 8.5
Leknath. KGA 11.8 Leknath. KGA 11.8
Khimti132 New Khimti220 73.1 Kohalpur Kohalpur400 9.9 Kusma Kusma400 22.5
Mainatara Minatara_132 4.9 Butwal220 Butwal400 28.4 Butwal220 Butwal 6.9 Damak400 Damak 24.4 kusma132 Kusma 1.7
Damauli220 Damauli400 45.8 Damauli Damauli220 5.1 Leknath. lekhnath220 5.9
Marsyandi. NewMarsyangdi 3.7 Bharatpur Bharatpur220 15.7
New Khmti400 New Khimti220 43 Barhabise Barhabise220 38.9
Arun Hub_400 Arun3_220 13.1 Inaruwa_220 Inaruwa400 28.5
Ratmate Ratamate 73.7 Tingla_220 Tingla_132 32.4 Devighat Trishuli 63.5
UModi132 kusma132 15 West_Seti UpperKhalangad 8 West_Seti UpperKhalangad 8

179
Line Loadings and Transformer Loadings for Scenario –II in fiscal year 084/85
From Bus To Bus % Loading Hetauda_66 Amlekhgunj 26.7 Hetauda_66 Amlekhgunj 26.7
Simara Amlekhgunj 26.9 Simara Amlekhgunj 26.9 Raxaul parwanipur 132 79.4 Raxaul parwanipur 132 79.4 Attariya Phalmanpur 42 Attariya Phalmanpur 42
Bafikot Hub Pulbari 24.1 Bafikot Hub Pulbari 24.1 Balaju_66 Balaju132 143.6
Chapali 132 Balaju132 54.5 Chapali 132 Balaju132 54.5 Balaju132 Siuchatar132 176.9 Trishuli Balaju_66 62.3
Balaju_66 Lainchaur 250.7 Trishuli Balaju_66 62.3 Balanch Attariya 15.3 Balanch Attariya 36.4
UpperKhalangad Balanch 10.5 UpperKhalangad Balanch 10.5
Banepa Panchkhal 41 Baneswor. Bhaktpur 130.8 Bardghat Gandak 5.3 Bardghat Gandak 5.3 Kawasoti Bardghat 66.3 Bhaktpur Banepa 118.7
Bhaktpur132 Bhaktpur 128.9 Bharatpur Damauli 107.6
Marsyandi. Bharatpur 40.7 Lamosangu Bhotekoshi 36.4 Bhuriguon Kohalpur 40.3 Bhuriguon Kohalpur 40.3
Phalmanpur Lumki 41.6 Phalmanpur Lumki 41.6 Budiganga Lumki 4 Budiganga Lumki 4
Cha.pur Dhalkebar 85.2 Cha.pur Dhalkebar 85.2
Changunarayan Bhaktpur132 10.8 Changunarayan Bhaktpur132 10.8
Chapali 132 Chapali 134.3 New Chabel Chapali 156 New Chabel Chapali 156 Chapali 132 Changunarayan 11.1 Chapali 132 Changunarayan 11.1
Chapali Devighat 43.9 Chapali Devighat 43.9
Hetauda132 Bharatpur 36.5

180
From Bus To Bus % Loading Anarmani Damak 62.6
Dhalkebar400 Dhalkebar 32.9 Dhalkebar400 Dhalkebar 32.9 Dhalkebar400 Dhalkebar220 1.3 Duhabi_400 Duhabi 301.4
Dhalkebar220 New Khimti220 3 Muzzafapur Dhalkebar400 96.2 Muzzafapur Dhalkebar400 96.2
Dhalkebar220 New Khimti220 3 Dhalkebar Mirchiaya 90.2 Dhalkebar Mirchiaya 90.2
Lahan Duhabi 112.9 Damak Duhabi 310.6
Hetauda132 Hetauda_66 385 Hetauda132 Hetauda400 1396 Hetauda132 Kamane 35.2
Kamane Pathliya 22.9 Kamane Pathliya 22.9
Hetauda_66 KL-1 97.5 Hetauda_66 KL-1 9.8 Hetauda132 KUL-II 130.1 Hetauda132 KUL-III 126.6 Hetauda132 Kamane 35.2
Illam (Godak) Damak 71.8 Illam (Godak) Damak 71.8
Phidim (Thapatar) Illam (Godak) 70.5 Phidim (Thapatar) Illam (Godak) 70.5 Phidim (Thapatar) Amarpur (Panchthar) 65.9 Phidim (Thapatar) Amarpur (Panchthar) 65.9
Teku K-3(Singhadurbar) 73 Kawasoti Bharatpur 41.2
KGA Butwal 41.8 KGA Butwal 31.3
Lamosangu Khimti132 138.1 Kusum Kohalpur 47.5 Kusum Kohalpur 47.5 KUL-III KUL-II 135.8 Katiya Kushaha 60.3 Katiya Kushaha 60.3 Lahan Kushaha 182.5
Kushaha Duhabi 67.7 Purnea Duhabi_400 121.5 Purnea Duhabi_400 121.5 Lamahi Kusum 47.5 Lamahi Kusum 47.5 Jhimruk Lamahi 8.4
Shivapur. Lamahi 28.3 Shivapur. Lamahi 28.3
Bhaktpur132 Lamosangu 84.7 Bhaktpur132 Lamosangu 84.7
Leknath. Damauli 20.6

181
From Bus To Bus % Loading Pokhara Leknath. 80.6
AandhiKhola Butwal220 12.8 AandhiKhola Butwal220 12.8
Kusma AandhiKhola 18.1 Kusma AandhiKhola 18.1 Bajhang West_Seti 3.6 Bajhang West_Seti 3.6
West_Seti UpperKhalangad 7 West_Seti UpperKhalangad 7
Phukot Dodhara 18.8 Phukot Dodhara 18.8
Mainatara Dodhara 31.2 Mainatara Dodhara 31.2 Kohalpur Mainatara_132 26.2 Kohalpur Mainatara_132 21.1 Mainatara Kohalpur400 17.1 Mainatara Kohalpur400 20.7
Pulbari Mainatara 47.5 Pulbari Mainatara 47.5
Butwal400 Pulbari 92.7 Butwal400 Pulbari 92.7
Damauli400 Butwal400 83 Damauli400 Butwal400 83
Ratamate Damauli400 66.8 Ratamate Damauli400 66.8
LampsiPhedi Ratamate 44.1 LampsiPhedi Ratamate 44.1
Barhabise LampsiPhedi 53.6 Barhabise LampsiPhedi 53.6 Barhabise New Khmti400 29.5 Barhabise New Khmti400 29.5
Dhalkebar400 New Khmti400 27.3 Inaruwa400 Mirchaiya 16.3 Inaruwa400 Mirchaiya 16.3 Damak400 Inaruwa400 32.6 Damak400 Inaruwa400 32.6
Burtibang132 Shivapur. 7.4 Burtibang132 Shivapur. 7.4 Rahughat220 Kusma 12 Rahughat220 Kusma 12 Dandakhet Rahughat220 19.9 Dandakhet Rahughat220 19.9
Dana Rahughat220 10.3 Dana Rahughat220 10.3
UModi132 kusma132 8 Damauli400 Kusma400 13 Damauli400 Kusma400 13 lekhnath220 Damauli220 13.6 lekhnath220 Damauli220 13.6 UMadi220 lekhnath220 14.2
NewMarsyangdi Bharatpur220 40.9

182
From Bus To Bus % Loading NewMarsyangdi Bharatpur220 40.9
Udipur220 NewMarsyangdi 57.3 Udipur220 NewMarsyangdi 57.3 Khudi220 Udipur220 83.9 Khudi220 Udipur220 83.9
Manang220 Khudi220 5.5 Manang220 Khudi220 5.5 Khudi220 Damauli220 59.1 Khudi220 Damauli220 59.1 Likhu132 Khimti132 37.7 Likhu132 Khimti132 37.7
Tamakoshi220 New Khimti220 14.7 Tamakoshi220 New Khimti220 14.7 Barhabise220 Tamakoshi220 26.6 Barhabise220 Tamakoshi220 26.6 Arun3_220 SitalPati_220 12.3 Arun3_220 SitalPati_220 12.3
SitalPati_220 Khadbari_220 23.2 SitalPati_220 Khadbari_220 23.2 Khadbari_220 Baneshwor_220 13.6 Khadbari_220 Baneshwor_220 13.6 NewBasantpur Inaruwa_220 17.6 NewBasantpur Inaruwa_220 17.6
Baneshwor_220 NewBasantpur 11.5 Baneshwor_220 NewBasantpur 11.5
Mirchaiya Dhalkebar400 21.4 Mirchaiya Dhalkebar400 21.4
Dhalkebar400 New Khmti400 27.3 Tingla_132 Mirchiaya 31.4 Tingla_132 Mirchiaya 31.4 Trishuli 3B Ratmate 45.4 Trishuli 3B Ratmate 45.4 Trishuli 3B Matatirtha_220 28.1 Trishuli 3B Matatirtha_220 28.1 Hetauda400 Dhalkebar400 81.9 Hetauda400 Dhalkebar400 81.9 Butwal400 Gorkahpur 107.5 Butwal400 Gorkahpur 107.5
Lumki Bhuriguon 40.9 Lumki Bhuriguon 40.9
M-Marsyandi Marsyandi. 36.3 Mahendranagar Attariya 17.2 Mahendranagar Attariya 17.2
Siuchatar132 Marsyandi. 30.2 KUL-II Matatirtha 139.6 KUL-II Matatirtha 139.6
Siuchatar132 Matatirtha 202.2 Siuchatar132 Matatirtha 202.2
Mirchiaya Lahan 108.9 Mirchiaya Lahan 108.9 Bardghat Butwal 34

183
From Bus To Bus % Loading Bardghat Butwal 34
New Chabel Lainchaur 20.6 New Chabel Lainchaur 20.6 Panchkhal Indrawati 22.6 Panchkhal Sunkoshi 17.7
parwanipur 132 Parwanipur 66 246.7 parwanipur 132 Parwanipur 66 246.7 Parwanipur 66 Birjung 106 Parwanipur 66 Birjung 106
Patan Baneswor. 67.6 Pathliya Cha.pur 57.9 Pathliya Cha.pur 57.9
parwanipur 132 Pathliya 71.2 parwanipur 132 Pathliya 71.2
Modi Pokhara 39.9 Butwal Shivapur. 38.6 Butwal Shivapur. 38.6
Parwanipur 66 Simara 123 Parwanipur 66 Simara 123
Balaju_66 Siuchatar66. 85.9 Balaju_66 Siuchatar66. 85.9
Siuchatar66. K-3(Singhadurbar) 127.4 Siuchatar66. Patan 87.3 Siuchatar66. Patan 87.3 Siuchatar66. Teku 237.9 Siuchatar66. Siuchatar132 143.9 Siuchatar66. Siuchatar132 143.9 Matatirtha Matatirtha_220 149.4
KL-1 Siuchatar66. 129.6 KL-1 Siuchatar66. 129.6
Leknath. KGA 8.6 Leknath. KGA 8.6
Khimti132 New Khimti220 58.5 Kohalpur Kohalpur400 23.2 Kusma Kusma400 12.8
Mainatara Mainatara_132 21.8 Butwal220 Butwal400 54.4 Butwal220 Butwal 32.1 Damak400 Damak 41.7 kusma132 Kusma 14.7
Damauli220 Damauli400 65.5 Damauli Damauli220 15.3 Leknath. lekhnath220 5.5
Marsyandi. NewMarsyangdi 5.8 Bharatpur Bharatpur220 5.6
New Khmti400 New Khimti220 9.7 Barhabise Barhabise220 16.9
Arun Hub_400 Arun3_220 5.6 Inaruwa_220 Inaruwa400 20.1
Ratmate Ratamate 27.3 Tingla_220 Tingla_132 18.4

184
From Bus To Bus % Loading Devighat Trishuli 59.3
Line Loadings and Transformer Loadings for Scenario – III in fiscal year 084/85
From Bus To Bus % Loading Hetauda_66 Amlekhgunj 156.3 Hetauda_66 Amlekhgunj 156.3
Simara Amlekhgunj 153 Simara Amlekhgunj 153 Attariya Phalmanpur 22 Attariya Phalmanpur 22
Bafikot Hub Pulbari 26.7 Bafikot Hub Pulbari 26.7 Balaju_66 Balaju132 172.3
Chapali 132 Balaju132 99.7 Chapali 132 Balaju132 99.7 Balaju132 Siuchatar132 294.2 Trishuli Balaju_66 77.2
Balaju_66 Lainchaur 342.6 Trishuli Balaju_66 77.2 Balanch Attariya 9.5 Balanch Attariya 18.3
UpperKhalangad Balanch 10.8 UpperKhalangad Balanch 10.8
Banepa Panchkhal 56.6 Baneswor. Bhaktpur 168.9 Bardghat Gandak 5 Bardghat Gandak 5 Kawasoti Bardghat 75.3 Bhaktpur Banepa 164.8
Bhaktpur132 Bhaktpur 143.9 Bharatpur Damauli 103.6
Marsyandi. Bharatpur 31.9 Lamosangu Bhotekoshi 41.9 Bhuriguon Kohalpur 15.2 Bhuriguon Kohalpur 15.2
Phalmanpur Lumki 20.1 Phalmanpur Lumki 20.1 Budiganga Lumki 4.4 Budiganga Lumki 4.4
Cha.pur Dhalkebar 93 Cha.pur Dhalkebar 93
Changunarayan Bhaktpur132 16.7 Changunarayan Bhaktpur132 16.7
Chapali 132 Chapali 153.6 New Chabel Chapali 212.2 New Chabel Chapali 212.2 Chapali 132 Changunarayan 16.6 Chapali 132 Changunarayan 16.6
Chapali Devighat 55.9 Chapali Devighat 55.9

185
From Bus To Bus % Loading Hetauda132 Bharatpur 72.8 Anarmani Damak 61.8
Dhalkebar400 Dhalkebar 79.7 Dhalkebar400 Dhalkebar 79.7 Dhalkebar400 Dhalkebar220 20.3 Dhalkebar220 New Khimti220 11.4 Muzzafapur Dhalkebar400 79.8 Muzzafapur Dhalkebar400 79.8
Dhalkebar220 New Khimti220 11.4 Dhalkebar Mirchiaya 44.3 Dhalkebar Mirchiaya 44.3
Lahan Duhabi 35.8 Damak Duhabi 150
Hetauda132 Hetauda_66 680.6 Hetauda132 Hetauda400 1942.6 Hetauda132 Kamane 111.7
Kamane Pathliya 100.2 Kamane Pathliya 100.2
Hetauda_66 KL-1 107.3 Hetauda_66 KL-1 107.3 Hetauda132 KUL-II 155.7 Hetauda132 KUL-III 150.4 Hetauda132 Kamane 111.7
Illam (Godak) Damak 53.7 Illam (Godak) Damak 53.7
Phidim (Thapatar) Illam (Godak) 74.7 Phidim (Thapatar) Illam (Godak) 74.7 Phidim (Thapatar) Amarpur (Panchthar) 73.6 Phidim (Thapatar) Amarpur (Panchthar) 73.6
Teku K-3 (Singhadurbar) 98.3 Kawasoti Bharatpur 53.1
KGA Butwal 46 KGA Butwal 34.4
Lamosangu Khimti132 144.8 Kusum Kohalpur 54.4 Kusum Kohalpur 54.4 KUL-III KUL-II 164 Katiya Kushaha 57.5 Katiya Kushaha 57.5 Lahan Kushaha 30.5
Kushaha Duhabi 119.4 Lamahi Kusum 56.3 Lamahi Kusum 56.3 Jhimruk Lamahi 8.3
Shivapur. Lamahi 34.4 Shivapur. Lamahi 34.4
Bhaktpur132 Lamosangu 90 Bhaktpur132 Lamosangu 90
Leknath. Damauli 19.5 Pokhara Leknath. 85.9
AandhiKhola Butwal220 18.5

186
From Bus To Bus % Loading AandhiKhola Butwal220 18.5
Kusma AandhiKhola 25.1 Kusma AandhiKhola 25.1 Bajhang West_Seti 4.2 Bajhang West_Seti 4.2
West_Seti UpperKhalangad 8.2 West_Seti UpperKhalangad 8.2
Phukot Dodhara 21 Phukot Dodhara 21
Mainatara Dodhara 37 Mainatara Dodhara 37 Kohalpur Mainatara_132 24.4 Kohalpur Mainatara_132 19.6 Mainatara Kohalpur400 12.1 Mainatara Kohalpur400 14.8
Pulbari Mainatara 43.3 Pulbari Mainatara 43.3
Butwal400 Pulbari 104.5 Butwal400 Pulbari 104.5
Damauli400 Butwal400 119.3 Damauli400 Butwal400 119.3
Ratamate Damauli400 95.8 Ratamate Damauli400 95.8
LampsiPhedi Ratamate 75.6 LampsiPhedi Ratamate 75.6
Barhabise LampsiPhedi 78.4 Barhabise LampsiPhedi 78.4 Barhabise New Khmti400 74.4 Barhabise New Khmti400 74.4
Dhalkebar400 New Khmti400 77.7 Inaruwa400 Mirchaiya 38.1 Inaruwa400 Mirchaiya 38.1 Damak400 Inaruwa400 31.6 Damak400 Inaruwa400 31.6
Burtibang132 Shivapur. 7 Burtibang132 Shivapur. 7 Rahughat220 Kusma 27.7 Rahughat220 Kusma 27.7 Dandakhet Rahughat220 12.2 Dandakhet Rahughat220 12.2
Dana Rahughat220 9.6 Dana Rahughat220 9.6
UModi132 kusma132 7.4 Damauli400 Kusma400 10 Damauli400 Kusma400 10 lekhnath220 Damauli220 11.3 lekhnath220 Damauli220 11.3 UMadi220 lekhnath220 13.2
NewMarsyangdi Bharatpur220 33.3 NewMarsyangdi Bharatpur220 33.3
Udipur220 NewMarsyangdi 58.1

187
From Bus To Bus % Loading Udipur220 NewMarsyangdi 58.1 Khudi220 Udipur220 69.4 Khudi220 Udipur220 69.4
Manang220 Khudi220 5.1 Manang220 Khudi220 5.1 Khudi220 Damauli220 51.2 Khudi220 Damauli220 51.2 Likhu132 Khimti132 39.1 Likhu132 Khimti132 39.1
Tamakoshi220 New Khimti220 24.4 Tamakoshi220 New Khimti220 24.4 Barhabise220 Tamakoshi220 26.3 Barhabise220 Tamakoshi220 26.3 Arun3_220 SitalPati_220 13.2 Arun3_220 SitalPati_220 13.2
SitalPati_220 Khadbari_220 23 SitalPati_220 Khadbari_220 23 Khadbari_220 Baneshwor_220 15.7 Khadbari_220 Baneshwor_220 15.7 NewBasantpur Inaruwa_220 14.1 NewBasantpur Inaruwa_220 14.1
Baneshwor_220 NewBasantpur 9.5 Baneshwor_220 NewBasantpur 9.5
Mirchaiya Dhalkebar400 47.5 Mirchaiya Dhalkebar400 47.5
Dhalkebar400 New Khmti400 77.7 Tingla_132 Mirchiaya 75.2 Tingla_132 Mirchiaya 75.2 Trishuli 3B Ratmate 58 Trishuli 3B Ratmate 58 Trishuli 3B Matatirtha_220 46.6 Trishuli 3B Matatirtha_220 46.6 Hetauda400 Dhalkebar400 94.4 Hetauda400 Dhalkebar400 94.4 Butwal400 Gorkahpur 93.4 Butwal400 Gorkahpur 93.4
Lumki Bhuriguon 17 Lumki Bhuriguon 17
M-Marsyandi Marsyandi. 28.6 Mahendranagar Attariya 16.3 Mahendranagar Attariya 16.3
Siuchatar132 Marsyandi. 98 KUL-II Matatirtha 168.2 KUL-II Matatirtha 168.2
Siuchatar132 Matatirtha 269 Siuchatar132 Matatirtha 269
Mirchiaya Lahan 72.6 Mirchiaya Lahan 72.6 Bardghat Butwal 37.7 Bardghat Butwal 37.7
New Chabel Lainchaur 29.5

188
From Bus To Bus % Loading New Chabel Lainchaur 29.5 Panchkhal Indrawati 30.6 Panchkhal Sunkoshi 24.6
parwanipur 132 Parwanipur 66 255.3 parwanipur 132 Parwanipur 66 255.3 Parwanipur 66 Birjung 318.7 Parwanipur 66 Birjung 318.7
Patan Baneswor. 76.2 Pathliya Cha.pur 53.8 Pathliya Cha.pur 53.8
parwanipur 132 Pathliya 144.8 parwanipur 132 Pathliya 144.8
Modi Pokhara 36.9 Butwal Shivapur. 40.9 Butwal Shivapur. 40.9
Parwanipur 66 Simara 164.9 Parwanipur 66 Simara 164.9
Balaju_66 Siuchatar66. 110.7 Balaju_66 Siuchatar66. 110.7
Siuchatar66. K-3 (Singhadurbar) 170.4 Siuchatar66. Patan 127 Siuchatar66. Patan 127 Siuchatar66. Teku 317.6 Siuchatar66. Siuchatar132 179 Siuchatar66. Siuchatar132 179 Matatirtha Matatirtha_220 254.3
KL-1 Siuchatar66. 160.3 KL-1 Siuchatar66. 160.3
Leknath. KGA 14.9 Leknath. KGA 14.9
Khimti132 New Khimti220 142.9 Kohalpur Kohalpur400 18.3 Kusma Kusma400 3.5
Mainatara Mainatara_132 11.9 Butwal220 Butwal400 42.5 Butwal220 Butwal 30.2 Damak400 Damak 18.4 kusma132 Kusma 7.3
Damauli220 Damauli400 55.9 Damauli Damauli220 15.4 Leknath. lekhnath220 4.3
Marsyandi. NewMarsyangdi 8.7 Bharatpur Bharatpur220 6.4
New Khmti400 New Khimti220 17.2 Barhabise Barhabise220 18.5
Arun Hub_400 Arun3_220 5.7 Inaruwa_220 Inaruwa400 12.6
Ratmate Ratamate 36 Tingla_220 Tingla_132 21.3 Devighat Trishuli 75.7

189
Line Loadings and Transformer Loadings for Scenario – IV in fiscal year 084/85
From Bus To Bus % Loading Hetauda_66 Amlekhgunj 51.7 Hetauda_66 Amlekhgunj 51.7
Simara Amlekhgunj 47 Simara Amlekhgunj 47 Attariya Phalmanpur 27.4 Attariya Phalmanpur 27.4
Bafikot Hub Pulbari 24.8 Bafikot Hub Pulbari 24.8 Balaju_66 Balaju132 156.8
Chapali 132 Balaju132 62.7 Chapali 132 Balaju132 62.7 Balaju132 Siuchatar132 205.1 Trishuli Balaju_66 70.1
Balaju_66 Lainchaur 284.4 Trishuli Balaju_66 70.1 Balanch Attariya 13.9 Balanch Attariya 31.2
UpperKhalangad Balanch 10.5 UpperKhalangad Balanch 10.5
Banepa Panchkhal 46.9 Baneswor. Bhaktpur 156.6 Bardghat Gandak 5.2 Bardghat Gandak 5.2 Kawasoti Bardghat 62.8 Bhaktpur Banepa 136.2
Bhaktpur132 Bhaktpur 140.3 Bharatpur Damauli 100.2
Marsyandi. Bharatpur 35.3 Lamosangu Bhotekoshi 37.5 Bhuriguon Kohalpur 27.5 Bhuriguon Kohalpur 27.5
Phalmanpur Lumki 27 Phalmanpur Lumki 27 Budiganga Lumki 4.2 Budiganga Lumki 4.2
Cha.pur Dhalkebar 97.5 Cha.pur Dhalkebar 97.5
Changunarayan Bhaktpur132 14.9 Changunarayan Bhaktpur132 14.9
Chapali 132 Chapali 145.5 New Chabel Chapali 184.6 New Chabel Chapali 184.6 Chapali 132 Changunarayan 15.2 Chapali 132 Changunarayan 15.2
Chapali Devighat 48.3 Chapali Devighat 48.3
Hetauda132 Bharatpur 38 Anarmani Damak 62.1
Dhalkebar400 Dhalkebar 48.7

190
From Bus To Bus % Loading Dhalkebar400 Dhalkebar 48.7 Dhalkebar400 Dhalkebar220 2 Duhabi_400 Duhabi 264.5
Dhalkebar220 New Khimti220 2 Muzzafapur Dhalkebar400 89 Muzzafapur Dhalkebar400 89
Dhalkebar220 New Khimti220 2 Dhalkebar Mirchiaya 61.4 Dhalkebar Mirchiaya 61.4
Lahan Duhabi 96.8 Damak Duhabi 248.1
Hetauda132 Hetauda_66 455 Hetauda132 Hetauda400 1619.7 Hetauda132 Kamane 66.4
Kamane Pathliya 54.6 Kamane Pathliya 54.6
Hetauda_66 KL-1 100.3 Hetauda_66 KL-1 10 Hetauda132 KUL-II 136.7 Hetauda132 KUL-III 132.8 Hetauda132 Kamane 66.4
Illam (Godak) Damak 56 Illam (Godak) Damak 56
Phidim (Thapatar) Illam (Godak) 70.5 Phidim (Thapatar) Illam (Godak) 70.5 Phidim (Thapatar) Amarpur (Panchthar) 65.9 Phidim (Thapatar) Amarpur (Panchthar) 65.9
Teku K-3 (Singhadurbar) 84.3 Kawasoti Bharatpur 38.5
KGA Butwal 41.8 KGA Butwal 31.3
Lamosangu Khimti132 156.6 Kusum Kohalpur 49.9 Kusum Kohalpur 49.9 KUL-III KUL-II 143.1 Katiya Kushaha 50.6 Katiya Kushaha 50.6 Purnea Duhabi_400 106.1 Purnea Duhabi_400 106.1 Lahan Kushaha 155.7
Kushaha Duhabi 59.5 Lamahi Kusum 49.9 Lamahi Kusum 49.9 Jhimruk Lamahi 8.3
Shivapur. Lamahi 31.2 Shivapur. Lamahi 31.2
Bhaktpur132 Lamosangu 97.3 Bhaktpur132 Lamosangu 97.3
Leknath. Damauli 19.9 Pokhara Leknath. 78.2
AandhiKhola Butwal220 18.7

191
From Bus To Bus % Loading AandhiKhola Butwal220 18.7
Kusma AandhiKhola 24.5 Kusma AandhiKhola 24.5 Bajhang West_Seti 4 Bajhang West_Seti 4
West_Seti UpperKhalangad 7.7 West_Seti UpperKhalangad 7.7
Phukot Dodhara 19.4 Phukot Dodhara 19.4
Mainatara Dodhara 31.9 Mainatara Dodhara 31.9 Kohalpur Mainatara_132 21.7 Kohalpur Mainatara_132 17.5 Mainatara Kohalpur400 14.5 Mainatara Kohalpur400 17.5
Pulbari Mainatara 48 Pulbari Mainatara 48
Butwal400 Pulbari 97 Butwal400 Pulbari 97
Damauli400 Butwal400 93.5 Damauli400 Butwal400 93.5
Ratamate Damauli400 76.9 Ratamate Damauli400 76.9
LampsiPhedi Ratamate 50.6 LampsiPhedi Ratamate 50.6
Barhabise LampsiPhedi 57.9 Barhabise LampsiPhedi 57.9 Barhabise New Khmti400 35.5 Barhabise New Khmti400 35.5
Dhalkebar400 New Khmti400 34.2 Inaruwa400 Mirchaiya 7.1 Inaruwa400 Mirchaiya 7.1 Damak400 Inaruwa400 25.7 Damak400 Inaruwa400 25.7
Burtibang132 Shivapur. 7.3 Burtibang132 Shivapur. 7.3 Rahughat220 Kusma 28.4 Rahughat220 Kusma 28.4 Dandakhet Rahughat220 21.4 Dandakhet Rahughat220 21.4
Dana Rahughat220 10.3 Dana Rahughat220 10.3
UModi132 kusma132 7.9 Damauli400 Kusma400 10.1 Damauli400 Kusma400 10.1 lekhnath220 Damauli220 12.6 lekhnath220 Damauli220 12.6 UMadi220 lekhnath220 13.9
NewMarsyangdi Bharatpur220 38.5 NewMarsyangdi Bharatpur220 38.5
Udipur220 NewMarsyangdi 59.4

192
From Bus To Bus % Loading Udipur220 NewMarsyangdi 59.4 Khudi220 Udipur220 72.1 Khudi220 Udipur220 72.1
Manang220 Khudi220 5.3 Manang220 Khudi220 5.3 Khudi220 Damauli220 49.8 Khudi220 Damauli220 49.8 Likhu132 Khimti132 47.3 Likhu132 Khimti132 47.3
Tamakoshi220 New Khimti220 13.9 Tamakoshi220 New Khimti220 13.9 Barhabise220 Tamakoshi220 24.7 Barhabise220 Tamakoshi220 24.7 Arun3_220 SitalPati_220 12.3 Arun3_220 SitalPati_220 12.3
SitalPati_220 Khadbari_220 21.1 SitalPati_220 Khadbari_220 21.1 Khadbari_220 Baneshwor_220 9.1 Khadbari_220 Baneshwor_220 9.1 NewBasantpur Inaruwa_220 15.2 NewBasantpur Inaruwa_220 15.2
Baneshwor_220 NewBasantpur 6.9 Baneshwor_220 NewBasantpur 6.9
Mirchaiya Dhalkebar400 12.7 Mirchaiya Dhalkebar400 12.7
Dhalkebar400 New Khmti400 34.2 Tingla_132 Mirchiaya 45 Tingla_132 Mirchiaya 45 Trishuli 3B Ratmate 53.5 Trishuli 3B Ratmate 53.5 Trishuli 3B Matatirtha_220 32.7 Trishuli 3B Matatirtha_220 32.7 Hetauda400 Dhalkebar400 84.1 Hetauda400 Dhalkebar400 84.1 Butwal400 Gorkahpur 97.9 Butwal400 Gorkahpur 97.9
Lumki Bhuriguon 27.2 Lumki Bhuriguon 27.2
M-Marsyandi Marsyandi. 26.3 Mahendranagar Attariya 15.1 Mahendranagar Attariya 15.1
Siuchatar132 Marsyandi. 62 KUL-II Matatirtha 147.2 KUL-II Matatirtha 147.2
Siuchatar132 Matatirtha 220 Siuchatar132 Matatirtha 220
Mirchiaya Lahan 86.9 Mirchiaya Lahan 86.9 Bardghat Butwal 32.3 Bardghat Butwal 32.3
New Chabel Lainchaur 21.8

193
From Bus To Bus % Loading New Chabel Lainchaur 21.8 Panchkhal Indrawati 25.7 Panchkhal Sunkoshi 20.3
parwanipur 132 Parwanipur 66 296.6 parwanipur 132 Parwanipur 66 296.6 Parwanipur 66 Birjung 142.7 Parwanipur 66 Birjung 142.7 parwanipur 132 Raxaul 89.6 parwanipur 132 Raxaul 89.6
Patan Baneswor. 81.8 Pathliya Cha.pur 59.1 Pathliya Cha.pur 59.1
parwanipur 132 Pathliya 101.9 parwanipur 132 Pathliya 101.9
Modi Pokhara 38.8 Butwal Shivapur. 41 Butwal Shivapur. 41
Parwanipur 66 Simara 166.1 Parwanipur 66 Simara 166.1
Balaju_66 Siuchatar66. 94.8 Balaju_66 Siuchatar66. 94.8
Siuchatar66. K-3 (Singhadurbar) 146.7 Siuchatar66. Patan 99.3 Siuchatar66. Patan 99.3 Siuchatar66. Teku 273.7 Siuchatar66. Siuchatar132 158.5 Siuchatar66. Siuchatar132 158.5 Matatirtha Matatirtha_220 172.4
KL-1 Siuchatar66. 134.1 KL-1 Siuchatar66. 134.1
Leknath. KGA 9.1 Leknath. KGA 9.1
Khimti132 New Khimti220 67.3 Kohalpur Kohalpur400 20.2 Kusma Kusma400 10.9
Mainatara Mainatara_132 19.3 Butwal220 Butwal400 48.2 Butwal220 Butwal 31 Damak400 Damak 31.6 kusma132 Kusma 11.9
Damauli220 Damauli400 56.3 Damauli Damauli220 14.7 Leknath. lekhnath220 5.1
Marsyandi. NewMarsyangdi 3.2 Bharatpur Bharatpur220 3.4
New Khmti400 New Khimti220 9.9 Barhabise Barhabise220 18
Arun Hub_400 Arun3_220 5.6 Inaruwa_220 Inaruwa400 13.8
Ratmate Ratamate 31.6 Tingla_220 Tingla_132 20.5

194
From Bus To Bus % Loading Devighat Trishuli 65.2
Line Loadings and Transformer Loadings for Scenario – V in fiscal year 084/85
From Bus To Bus % Loading Hetauda_66 Amlekhgunj 60.4 Hetauda_66 Amlekhgunj 60.4
Simara Amlekhgunj 56.1 Simara Amlekhgunj 56.1 Attariya Phalmanpur 98.2 Attariya Phalmanpur 98.2
Bafikot Hub Pulbari 20.4 Bafikot Hub Pulbari 20.4 Balaju_66 Balaju132 115.5
Chapali 132 Balaju132 43.8 Chapali 132 Balaju132 43.8 Balaju132 Siuchatar132 139.2 Trishuli Balaju_66 85.1
Balaju_66 Lainchaur 222.6 Trishuli Balaju_66 85.1 Balanch Attariya 15.8 Balanch Attariya 39
UpperKhalangad Balanch 31 UpperKhalangad Balanch 31
Banepa Panchkhal 10.3 Baneswor. Bhaktpur 162.1 Bardghat Gandak 1.5 Bardghat Gandak 1.5 Kawasoti Bardghat 49 Bhaktpur Banepa 77.1
Bhaktpur132 Bhaktpur 106.5 Bharatpur Damauli 89.4
Marsyandi. Bharatpur 81.5 Lamosangu Bhotekoshi 53.6 Bhuriguon Kohalpur 90.6 Bhuriguon Kohalpur 90.6
Phalmanpur Lumki 97.6 Phalmanpur Lumki 97.6 Budiganga Lumki 9.1 Budiganga Lumki 9.1
Cha.pur Dhalkebar 85.2 Cha.pur Dhalkebar 85.2
Changunarayan Bhaktpur132 46.6 Changunarayan Bhaktpur132 46.6
Chapali 132 Chapali 106.4 New Chabel Chapali 176.7 New Chabel Chapali 176.7 Chapali 132 Changunarayan 46.6 Chapali 132 Changunarayan 46.6
Chapali Devighat 60.7 Chapali Devighat 60.7

195
From Bus To Bus % Loading Hetauda132 Bharatpur 60.8 Anarmani Damak 53.9
Dhalkebar400 Dhalkebar 56.2 Dhalkebar400 Dhalkebar 56.2 Dhalkebar400 Dhalkebar220 57 Dhalkebar220 New Khimti220 33.6 Muzzafapur Dhalkebar400 100.2 Muzzafapur Dhalkebar400 100.2
Dhalkebar220 New Khimti220 33.6 Dhalkebar Mirchiaya 1 Dhalkebar Mirchiaya 1
Lahan Duhabi 39.4 Damak Duhabi 175.6
Hetauda132 Hetauda_66 400.8 Hetauda132 Hetauda400 1541.9 Hetauda132 Kamane 107.6
Kamane Pathliya 97.7 Kamane Pathliya 97.7
Hetauda_66 KL-1 72.5 Hetauda_66 KL-1 7.2 Hetauda132 KUL-II 116.4 Hetauda132 KUL-III 116.4 Hetauda132 Kamane 107.6
Illam (Godak) Damak 187.2 Illam (Godak) Damak 187.2
Phidim (Thapatar) Illam (Godak) 170.3 Phidim (Thapatar) Illam (Godak) 170.3 Phidim (Thapatar) Amarpur (Panchthar) 153.9 Phidim (Thapatar) Amarpur (Panchthar) 153.9
Teku K - 3 (Sighadurbar) 72.6 Kawasoti Bharatpur 35.8
KGA Butwal 73.2 KGA Butwal 54.7
Lamosangu Khimti132 168.6 Kusum Kohalpur 29.9 Kusum Kohalpur 29.9 KUL-III KUL-II 116.5 Katiya Kushaha 0.4 Katiya Kushaha 0.4 Lahan Kushaha 50.9
Kushaha Duhabi 52.8 Lamahi Kusum 31.7 Lamahi Kusum 31.7 Jhimruk Lamahi 9.2
Shivapur. Lamahi 28.2 Shivapur. Lamahi 28.2
Bhaktpur132 Lamosangu 114.7 Bhaktpur132 Lamosangu 114.7
Leknath. Damauli 39.6 Pokhara Leknath. 121.2
AandhiKhola Butwal220 30.5

196
From Bus To Bus % Loading AandhiKhola Butwal220 30.5
Kusma AandhiKhola 32.1 Kusma AandhiKhola 32.1 Bajhang West_Seti 2.4 Bajhang West_Seti 2.4
West_Seti UpperKhalangad 4.4 West_Seti UpperKhalangad 4.4
Phukot Dodhara 15.6 Phukot Dodhara 15.6
Mainatara Dodhara 24.6 Mainatara Dodhara 24.6 Kohalpur Mainatara_132 40 Kohalpur Mainatara_132 31.9 Mainatara Kohalpur400 22.2 Mainatara Kohalpur400 26.8
Pulbari Mainatara 39.4 Pulbari Mainatara 39.4
Butwal400 Pulbari 65.9 Butwal400 Pulbari 65.9
Damauli400 Butwal400 77.5 Damauli400 Butwal400 77.5
Ratamate Damauli400 34.1 Ratamate Damauli400 34.1
LampsiPhedi Ratamate 37.5 LampsiPhedi Ratamate 37.5
Barhabise LampsiPhedi 35.6 Barhabise LampsiPhedi 35.6 Barhabise New Khmti400 100.1 Barhabise New Khmti400 100.1
Dhalkebar400 New Khmti400 138.8 Inaruwa400 Mirchaiya 18.8 Inaruwa400 Mirchaiya 18.8 Damak400 Inaruwa400 30 Damak400 Inaruwa400 30
Burtibang132 Shivapur. 9.7 Burtibang132 Shivapur. 9.7 Rahughat220 Kusma 67.2 Rahughat220 Kusma 67.2 Dandakhet Rahughat220 6.4 Dandakhet Rahughat220 6.4
Dana Rahughat220 26.1 Dana Rahughat220 26.1
UModi132 kusma132 16.7 Damauli400 Kusma400 13.6 Damauli400 Kusma400 13.6 lekhnath220 Damauli220 31.3 lekhnath220 Damauli220 31.3 UMadi220 lekhnath220 33.5
NewMarsyangdi Bharatpur220 45.6 NewMarsyangdi Bharatpur220 45.6
Udipur220 NewMarsyangdi 58.2
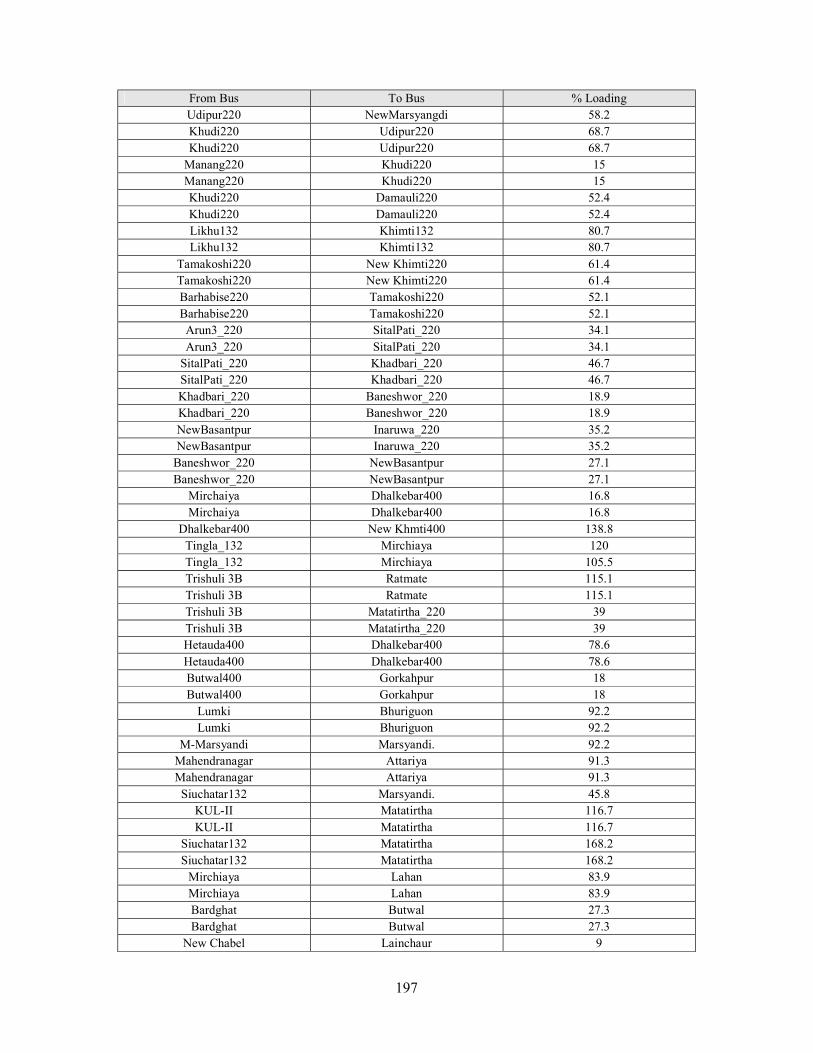
197
From Bus To Bus % Loading Udipur220 NewMarsyangdi 58.2 Khudi220 Udipur220 68.7 Khudi220 Udipur220 68.7
Manang220 Khudi220 15 Manang220 Khudi220 15 Khudi220 Damauli220 52.4 Khudi220 Damauli220 52.4 Likhu132 Khimti132 80.7 Likhu132 Khimti132 80.7
Tamakoshi220 New Khimti220 61.4 Tamakoshi220 New Khimti220 61.4 Barhabise220 Tamakoshi220 52.1 Barhabise220 Tamakoshi220 52.1 Arun3_220 SitalPati_220 34.1 Arun3_220 SitalPati_220 34.1
SitalPati_220 Khadbari_220 46.7 SitalPati_220 Khadbari_220 46.7 Khadbari_220 Baneshwor_220 18.9 Khadbari_220 Baneshwor_220 18.9 NewBasantpur Inaruwa_220 35.2 NewBasantpur Inaruwa_220 35.2
Baneshwor_220 NewBasantpur 27.1 Baneshwor_220 NewBasantpur 27.1
Mirchaiya Dhalkebar400 16.8 Mirchaiya Dhalkebar400 16.8
Dhalkebar400 New Khmti400 138.8 Tingla_132 Mirchiaya 120 Tingla_132 Mirchiaya 105.5 Trishuli 3B Ratmate 115.1 Trishuli 3B Ratmate 115.1 Trishuli 3B Matatirtha_220 39 Trishuli 3B Matatirtha_220 39 Hetauda400 Dhalkebar400 78.6 Hetauda400 Dhalkebar400 78.6 Butwal400 Gorkahpur 18 Butwal400 Gorkahpur 18
Lumki Bhuriguon 92.2 Lumki Bhuriguon 92.2
M-Marsyandi Marsyandi. 92.2 Mahendranagar Attariya 91.3 Mahendranagar Attariya 91.3
Siuchatar132 Marsyandi. 45.8 KUL-II Matatirtha 116.7 KUL-II Matatirtha 116.7
Siuchatar132 Matatirtha 168.2 Siuchatar132 Matatirtha 168.2
Mirchiaya Lahan 83.9 Mirchiaya Lahan 83.9 Bardghat Butwal 27.3 Bardghat Butwal 27.3
New Chabel Lainchaur 9

198
From Bus To Bus % Loading New Chabel Lainchaur 9 Panchkhal Indrawati 31.4 Panchkhal Sunkoshi 5.5
parwanipur 132 Parwanipur 66 224.7 parwanipur 132 Parwanipur 66 224.7 Parwanipur 66 Birjung 125.9 Parwanipur 66 Birjung 125.9
Patan Baneswor. 95.3 Pathliya Cha.pur 53.2 Pathliya Cha.pur 53.2
parwanipur 132 Pathliya 141 parwanipur 132 Pathliya 141
Modi Pokhara 84.4 Butwal Shivapur. 36.6 Butwal Shivapur. 36.6
Parwanipur 66 Simara 128.9 Parwanipur 66 Simara 128.9
Balaju_66 Siuchatar66. 26.1 Balaju_66 Siuchatar66. 26.1
Siuchatar66. K - 3 (Sighadurbar) 126.5 Siuchatar66. Patan 73.2 Siuchatar66. Patan 73.2 Siuchatar66. Teku 236.1 Siuchatar66. Siuchatar132 119.3 Siuchatar66. Siuchatar132 119.3 Matatirtha Matatirtha_220 184.7
KL-1 Siuchatar66. 75.3 KL-1 Siuchatar66. 75.3
Leknath. KGA 2.9 Leknath. KGA 2.9
Khimti132 New Khimti220 96.1 Kohalpur Kohalpur400 25.1 Kusma Kusma400 12.7
Mainatara Mainatara_132 19.6 Butwal220 Butwal400 28.3 Butwal220 Butwal 21.8 Damak400 Damak 25 kusma132 Kusma 11.1
Damauli220 Damauli400 43.8 Damauli Damauli220 11.4 Leknath. lekhnath220 7.9
Marsyandi. NewMarsyangdi 7.3 Bharatpur Bharatpur220 5.9
New Khmti400 New Khimti220 38.7 Barhabise Barhabise220 24.6
Arun Hub_400 Arun3_220 15.1 Inaruwa_220 Inaruwa400 3.7
Ratmate Ratamate 66.8 Tingla_220 Tingla_132 35.1 Devighat Trishuli 83.7

199
Appendix - O: Diagramtical Representation of Planned INPS Model

Zone1 (Load Flow Analysis)
200
Dodhara400 kV
Phukot400 kV
West_Seti132 kV
Bajhang132 kV
UpperKhalangad132 kV
Balanch132 kV
Line56
Balanch-Attariya
Chameliya130 MW
Api8.5 MW
Upper Naugadh Gad8 MW
Makari Gad10 MW Kalangad
15.33 MW
Upper Sanigad10.7 MW
Line57
Balanch-Attariya2
Ruru-Bachu Khola - 212 MW
Jeuligad Small0.996 MW
Upper Kalangagad38.46 MW
Jadari Gad Small1 MW
Salubyani Gad small0.233 MW
Sunigad11.05 MW
Upper Gaddigad1.55 MW
Ruru-Bachu - 113.5 MW
Upper Chameliya40 MW
Added L150 MVA
Added L2240 MVA
Line56
Balanch-Attariya
Balanch132 kV
Chameliya130 MW
Api8.5 MW
Upper Naugadh Gad8 MW
Makari Gad10 MW Kalangad
15.33 MW
Upper Sanigad10.7 MW
Line57
Balanch-Attariya2
UpperKhalangad132 kV
Bajhang132 kV
West_Seti132 kV
Phukot400 kV
Ruru-Bachu Khola - 212 MW
Dodhara400 kV
Jeuligad Small0.996 MW
Upper Kalangagad38.46 MW
Jadari Gad Small1 MW
Salubyani Gad small0.233 MW
Sunigad11.05 MW
Upper Gaddigad1.55 MW
Ruru-Bachu - 113.5 MW
Upper Chameliya40 MW
Added L150 MVA
Added L2240 MVA

Zone - 2 (Load Flow Analysis)
201
Mainatara_132132 kV
Mainatara400 kV
Dodhara Dodhara
Kohalpur400Kohalpur400
Pulbari Pulbari
T16
Kohalpur
Upper Parajuli Khola2.15 MW
Lohore Khola4.2 MW
Upper Lohore4 MW
Padam Khola4.8 MW
Added L350 MVA
Kohalpur

Zone-3 (Load Flow Analysis)
202
Damauli220220 kV
Burtibang132132 kV
Butwal400400 kV
Gorkahpur400 kV
Butwal220220 kV
AandhiKhola220 kV
Kusma220 kV
kusma132132 kV
UModi132132 kV
Rahughat220220 kV
Dana220 kV
Dandakhet220 kV
Kusma400400 kV
Damauli400400 kV
Khudi220220 kV
Manang220220 kV
Udipur220220 kV
NewMarsyangdi220 kV
Bharatpur220220 kV
lekhnath220220 kV
UMadi220220 kV
Butwal
T19
Ratamate
Ratamate
Damauli
T27
Leknath.
T28
Idi Khola0.975 MW
Namarjun Madi11.8 MW
Super Madi44 MW
Madame Khola24 MW
Upper Bhurundi3.75 MW
Bharatpur
T32
Added L980 MVA
Marsyandi.
T30
Middle Super Daraudi10 MW
Upper Daraudi B8.3 MW
Upper Daraudi C9.82 MW
Richet Khola4.98 MW
Upper Richet Khola2 MW
Istul Khola1.506 MW
Added L2650 MVA
Dordi - 1 Khola12 MW
Super Dordi Kha54 MW
Dordi Khola27 MW
Marsyangdi Besi50 MW
Middle Midim3.1 MW
Upper Midim7.5 MW
Midim - 1 Khola13.424 MW
Upper Syange2.4 MW
Upper Dordi - A25 MW
Hidi Khola6.82 MW
Added L850 MVA
Dudh Khola65 MW
Nyadi Phidi21.4 MW
NyadiKhola30 MW
Super Nyadi
40.27 MW
Rudi Khola B6.6 MW
Super Chepe9.05 MW
Chepe Khola Small8.63 MW
Dudhpokhari Chepe8.8 MW
Chepe Khola A7.5 MW
Super Trishuli70 MW
Added L670 MVA
T26TanahuSeti140 MW
T13
Rahughat HP40 MW
Rahughat Managle35.5 MW
Ghar Khola14 MW
Myagdi Khola57.3 MW
Upper Myagdi20 MW
Kunaban Khola20 MW
Bhim Khola4.96 MW
Added L2850 MVA
Ghalemdi Khola1 MW
Lo Modi20 MW
Super Ghalemdi9.14 MW
Landruk Modi86.59 MW
Nilgiri Khola38 MW
Nilgiri Khola 262 MW
Rele Khola6 MW
Thulo Khola21.3 MW
UpperThulo A15 MW
Middle Modi15.1 MW
Mid Tara Kh Small1.7 MW
Added L550 MVA
T25
Mid Daram A3 MW
Mid Daram B4.5 MW
Daram Khola9.6 MW
Tinau Khola Small1.665 MW
Added
L7
80 MVA
T17
Pulbari
Pulbari
Gorakhpur Grid133.52 MVAsc
Shivapur.
BadigadKholaHPP
21 MW
Shivapur.
Damauli220220 kV

Zone-4 (Load Flow Analysis)
203
Likhu132132 kV
Ratamate400 kV
Ratmate220 kV
Trishuli 3B220 kV
LampsiPhedi400 kV
Barhabise400 kV
Barhabise220220 kV
Tamakoshi220220 kV
New Khmti400400 kV
Dhalkebar400
New Khimti220
T33
Dhalkebar400
New Khimti220
New Khimti220
UpperTamakoshi456 MW
Tinekhu Khola0.99 MW
Lower Khare11 MW
Ghatte Khola5 MW
Singati Khola9 MW
Suri Khola6.4 MW
Upper Lapche52 MW
Lapche Khola99.4 MW
Upper Suri7 MW
Sagu Khola20 MW
Sagu Khola-15.5 MW
Sangu (Sorun)5 MW
Gumu Khola0.95 MW
Added L1350 MVA
Selang0.99 MW
Liping Khola16.26 MW
Upper Chaku A22.2 MWGelun
3.2 MW
Yambaling Khola7.27 MW
Chauri Khola6 MW
Hadi Khola Sunkoshi A0.997 MW
Upper Balephi A36 MW
Lower Selang1.5 MW
Upper Chauri6 MW
Ghatte Khola Small0.97 MW
Gohore Khola0.95 MW
Lower Balephi20 MW
Ksumti Khola0.683 MW
Added L1250 MVA
T38
Khani Khola-140 MW
KhareHPP24.1 MW
KhaniKholaDolakha30 MW
Middle Bhotekoshi102 MW
Upper Nyasem41.4 MW
Balephi23.52 MW
Bhotekoshi - 562 MW
Nyasim Khola35 MW
Brahamayani35.47 MW
Upper Brahamayani15.15 MW
Upper Nyasim Khola A21 MW
Added L3050 MVA
Line77
Line79
Upper Ankhu38 MW
Super Ankhu Khola23.5 MW
Upper Mailung A6.42 MW
Rasuwagadhi111 MW
Upper Sanjen14.8 MW
Sanjen Khola78 MW
Sanjen42.5 MW
Bhotekoshi - 140 MW
Rasuwa Bhotekoshi120 MW
Langtang Khola20 MW
Upper Trishuli 3B37 MW
Nyam Nyam Khola6 MW
Upper Trishuli - 1216 MW
Ilep(Tatopani)23.675 MW
Middle Trishuli Ganga19.41 MW
Upper Trishuli-3A60 MW
Matatirtha_220
Matatirtha_220Added L1050 MVA
Upper Belkhu0.996 MW
Trishuli Galchi75 MW
Menchet Khola7 MW
T47 Khimti132
Likhu- IV52.4 MW
LikhuKhola-A24.2 MWLikhu-151.4 MW
Likhu -233.4 MW
Lower Likhu28.1 MW
Junbesi Khola5.2 MW
Buku Kapati5 MW
Khimti132

Zone-5 (Load Flow Analysis)
204
Inaruwa_220220 kV
Damak400400 kV
Inaruwa400400 kV
Mirchaiya400 kV
NewBasantpur220 kV
Baneshwor_220220 kV
Khadbari_220220 kV
SitalPati_220220 kV
Arun3_220220 kV
Tingla_132132 kV
Tingla_220220 kV
Arun Hub_400400 kV
Isuwa Khola97.2 MW
Kasuwa Kh45 MW
T41
Solu Khola(Dudhkoshi)86 MW
Lower Solu HPP82 MWSoluHPP23.5 MW
Mid Solu Khola9.5 MW
Upper Solu18 MW
Sisa Khola A2.8 MW
Middle Hyongu Khola B22.9 MW
Dudhkunda Khola12 MW
Middle Hyongu Khola A22 MW
Luja Khola23.55 MW
Rauje Khola17.712 MW
Rawa Khola6.5 MW
Upper Rawa3 MW
T49
Mirchiaya Added L1450 MVAMirchiaya
Arun3_220220 kV
SitalPati_220220 kV
Upper Irkhuwa14.5 MW
Upper Irkhuwa14.5 MW
Lankhuwa Khola5 MW
Lankhuwa Khola5 MW
Phedi Khola (Thumlung)3.52 MW
Phedi Khola (Thumlung)3.52 MW
Sabha Khola B15.1 MW
Sabha Khola B15.1 MW
Upper Chirkhwa4.7 MW
Upper Chirkhwa4.7 MW
Lower Chirkhwa4.06 MW
Lower Chirkhwa4.06 MW
Irkhuwa Khola B15.524 MW
Irkhuwa Khola B15.524 MW
Lower Irkhuwa13.04 MW
Lower Irkhuwa13.04 MW
Khadbari_220220 kV
Super Sabha Khola4.1 MW
Super Sabha Khola4.1 MW
Sabha Khola C4.196 MW
Sabha Khola C4.196 MW
Upper Piluwa Khola 24.72 MW
Upper Piluwa Khola 24.72 MW
Down Piluwa9.5 MW
Down Piluwa9.5 MW
Added L1660 MVAAdded L1660 MVA
Maya Khola14.9 MW
Maya Khola14.9 MW
Super Hewa5 MW
Super Hewa5 MW
Upper Piluwa Hills4.99 MW
Upper Piluwa Hills4.99 MW
Upper Piluwa Khola-34.95 MW
Upper Piluwa Khola-34.95 MW
Baneshwor_220220 kV
Taksar Pikhuwa8 MW
Taksar Pikhuwa8 MW
Sapsup Khola6.6 MW
Sapsup Khola6.6 MW
Khorunga Khola4.8 MW
Khorunga Khola4.8 MW
Upper Khorunga7.5 MW
Upper Khorunga7.5 MW
Lower Khorunga5.4 MW
Lower Khorunga5.4 MW
NewBasantpur220 kV
~Left1~Left1~Left2~Left2
T45T45
T44T44
Mirchaiya400 kV
Added L1950 MVAAdded L1950 MVA
Dhalkebar400Dhalkebar400
Dhalkebar400Dhalkebar400
Inaruwa400400 kV
Damak400400 kV
Added L1780 MVAAdded L1780 MVA
T42T42
T20T20
DamakDamak
Inaruwa_220220 kV
Added L3260 MVAAdded L3260 MVA
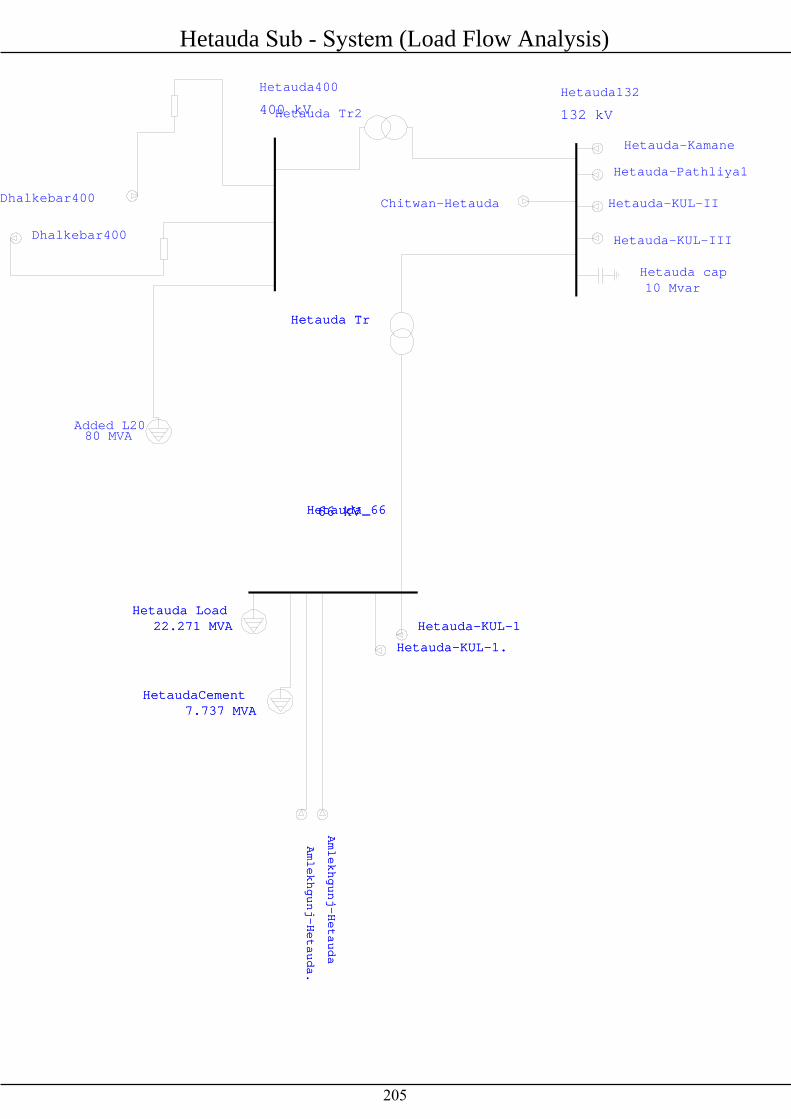
Hetauda Sub - System (Load Flow Analysis)
205
Hetauda_6666 kV
Hetauda132132 kV
Hetauda400400 kV
Chitwan-Hetauda
Hetauda cap10 Mvar
Hetauda-KUL-II
Hetauda-Pathliya1Hetauda-Kamane
Dhalkebar400
Dhalkebar400
Added L2080 MVA
Hetauda Tr2
Hetauda-KUL-III
Hetauda_6666 kV
Hetauda-KUL-1Hetauda-KUL-1Hetauda-KUL-1.Hetauda-KUL-1.
Hetauda Load22.271 MVA
HetaudaCement7.737 MVA
Hetauda Load22.271 MVA
Amlekhgunj-HetaudaAmlekhgunj-HetaudaAmlekhgunj-Hetauda.Amlekhgunj-Hetauda.
HetaudaCement7.737 MVA
Hetauda TrHetauda Tr

Kathmandu Sub - System (Load Flow Analysis)
206
Changunarayan132 kV
Chapali 132132 kV
Balaju132132 kV
Balaju_6666 kV
Lainchaur66 kV
New Chabel66 kV Chapali
66 kV
Devighat66 kV
Trishuli66 kV
Siuchatar66.66 kV
Patan66 kV
Baneswor.66 kV
Bhaktpur66 kV
Banepa66 kV
Bhaktpur132132 kV
K-3(Singhadurbar)66 kV
Teku66 kV
Siuchatar132132 kV
Matatirtha132 kV
Matatirtha_220220 kV
Balaju Load34.883 MVA
suich Tr1
Matatirtha-KUL-II
Matatirtha-KUL-II.
Line192
Line194
suich Tr3
Marsyandi-Suichtar
Siuchatar cap125 Mvar
suich Tr
K-3 Load39.891 MVA
Teku Load45.526 MVA
K-3 Cap 10 kvar
Patan Load22.271 MVA
Baneswor Load31.439 MVA
Bhaktpur Load38.46 MVA
Lamosangu-Bhaktpur
Lamosangu-Bhaktpur2
Bhaktpur Cap50 Mvar
PanautiHP2.4 MW
BhaktpurTr
Banepa Load15.339 MVA
Banepa-panchakhal
BaneshworCap25 Mvar
PatanCap25 Mvar
Harisidhhi29.65 MVA
Suichatar-KUL1
Suichatar-KUL
SuitchatarLoad39.265 MVA
Lainchor Load51.34 MVA
Chabel Load38.908 MVA
Devighat (NEA)14.1 MW
Trishuli(NEA)24 MW
Trishuli Load14.892 MVA
Chandrwati4 MW
Mailung5 MW
Tadi5 MW
Chilime.22.1 MW
Phalankhu Khola25 MW
Phalankhu Khola13.7 MW
Upper Tadi11 MW
Lower Tadi4.993 MW
DevighatLoad7.29 MVA
Chapali tr
Chapali Load25.402 MVA
NewChabilCap25 Mvar
AirportLoad21.019 MVA
Balaju cap25 Mvar
Balaju Tr

PLANNED INPS NEW (Load Flow Analysis)
207
Pulbari400 kV
Bafikot Hub400 kV
Kohalpur132 kV
Kohalpur2132 kV
Kohalpur400400 kV
Kusum132 kV
Lamahi132 kV
Jhimruk132 kV
Shivapur.132 kV
Butwal132 kV
KGA132 kV
Leknath.132 kV
Pokhara132 kV
Modi132 kV
Damauli132 kV
Bharatpur132 kV
Marsyandi.132 kV
Panchkhal66 kV
Indrawati66 kV
Sunkoshi66 kV
Lamosangu132 kV
Khimti132132 kV
New Khimti220220 kV
Dhalkebar220220 kV
Dhalkebar400400 kV
Muzzafapur400 kV
Dhalkebar132 kV
Mirchiaya132 kV
Lahan132 kV
Kushaha 132 kV
Katiya132 kV
Duhabi132 kV
Duhabi_400400 kV
Purnea400 kV
Damak132 kV
Illam (Godak)132 kV
Phidim (Thapatar)132 kV
Amarpur (Panchthar)132 kV
Anarmani132 kV
Cha.pur132 kV
Pathliya132 kV
parwanipur 132132 kV
Raxaul132 kV
Parwanipur 6666 kV
Birjung66 kV
Simara66 kV
Amlekhgunj66 kV
Kamane132 kV
KL-166 kV
KUL-III132 kV
KUL-II132 kV
Bhotekoshi132 kV
M-Marsyandi132 kV
Kawasoti132 kV
Bardghat132 kV
Gandak132 kV
Bhuriguon132 kV
Lumki132 kV
Budiganga132 kV
Phalmanpur132 kV
Attariya132 kV
Mahendranagar132 kV
KohalpurandSurkhet29.292 MVA
Lumki Load6.351 MVA
Attariya Load31.305 MVA
Mahendra Load8.587 MVA
Tanakpur56.929 MVAsc
Added L3530 MVA
Proposed 5th year-Zone1
Dwari Khola3.75 MW
Budi GangaHP20 MW
LamahiDangandSalyan42.262 MVA
ShivapurandDynasty26.386 MVA Butwal Load
124.638 MVA
KGA (NEA)144 MW
Leknath Load10.51 MVA
Damauli Load29.204 MVA
Bharatpur Load99.952 MVA
Kawasoti Load17.128 MVA
Bardghat Load8.273 MVA
GandakHp15 MW
MarsyandiDCS2.46 MVA
M-Marsyandi (NEA)70 MW
Khudi Khola4 MW
Upper-Marsyandi50 MW
Siuri Khola5 MW
Radhi Small4.4 MW
Midim3 MW
Chhyangdi Khola2 MW
Upper Chhyangdi4 MW
Marsyandi (NEA)69 MW
Chaku khola3 MW
Bhotekoshi.45 MW
Khimti HEP60 MW
Sipring10 MW
Jiri Khola2.4 MW
Dhalkebar Load89.756 MVA
Pathliya Load13.24 MVA
Parwanipur tr
Amlekhgunj Load2.371 MVA
KUL-II.32 MW
KUL-314 MW
KUL-1.60 MW
Tungun-Thosne4.36 MW
Khani Khola2 MW
KL-1(DCS)7.616 MVAKulekhani Cap
20 Mvar
Kamane Load15.116 MVA
Added Cap_640 Mvar
Hetauda
Added Cap_450 Mvar
simara Load35.777 MVA
SimaraCap15 Mvar
JagadambaSteel32.647 MVA
HulasSteel11.851 MVA
AshokSteel6.708 MVA
Hama Steel3.801 MVA
Added Cap_350 Mvar
Birjung Load58.406 MVA
Birjung Cap36 Mvar
TriveniSpinningMill6.172 MVA
Triveni Yarn4.249 MVA
Added Cap_250 Mvar
HimalIron3.444 MVA
JyotiSpinning2.371 MVAParwanipur tr.
Parwanipur load58.406 MVA
Parwanipur Cap48 Mvar
Raxaul Grid48.47 MVAsc
Added Cap_150 Mvar
Added Cap_520 Mvar
Cha.pur Load50.222 MVA
Lahan Load72.001 MVA
DuhabiandDhankuta97.045 MVA
Damak Load23.702 MVA
Anarmani Load43.603 MVA
AnarmaniCap20 Mvar
Puwa (NEA)6.2 MW
Mai khola4.5 MW
Sanima Mai22 MW
Upper Puwa3 MW
Mai Cascade7 MW
Upper Mai12 MW
Super Mai A9.6 MW
Jogmai7.6 MW
Sardi Khola4 MW
Upper MaiC6.1 MW
MaiCascadeHD8 MW
PuwaKhola14 MW
PhawaKhola5 MW
Kabeli-A37.6 MW
Kabeli B1 Cascade29.94 MW
Kabeli321.93 MW
SuperKabeli12 MW
Super Kabeli-A13.5 MW
Kabeli B125 MW
Middle Tamor73 MW
Mewa50 MW
Upper Phawa5.8 MW
Sona Khola9 MW
Palun Khola21 MW
Middle mewa49 MW
Mewa Khola23 MW
Tamor Khola - 537.52 MW
Iwa Khola9.9 MW
Lower Hewa21.6 MW
Hewa Khola A5 MW
Upper Hewa14.9 MW
Upper Hewa Khola Small8.5 MW
Siddhi Khola10 MW
Mai Beni9.51 MW
Puwa - 24.96 MW
Super Mai Cascade3.8 MW
Lower Jogmai6.2 MW
Jogmai Cascade6 MW
Teliya Khola0.996 MW
Ilam40 MVA
Zone-5Proposed
Hewa4.5 MW
Duhabi Cap67 Mvar
Piluwa3 MW
Sabha Khola3.3 MW
NewDuhabi97.045 MVA
Purnea Grid133.52 MVAsc
Dhalkebar tr4
Katiya Grid299.964 MVAsc
LahanCap30 Mvar
MolunKholaSHP7 MW
Mirchiya Load8.273 MVA
Dhalkebar tr.
Dhalkebar Cap25 Mvar
Dhalkebar tr
Muzzafarpur Grid133.52 MVAsc
Zone-3Proposed
Zone-4 Proposed
Dhalkebar tr1
Khimti-II48.8 MW
Upper Khimti12 MW
Upper Khimti 27 MW
Chulepu Khola8.52 MW
Nupche Likhu57.5 MW
Likhu Khola30 MW
T3
Sanima Sunkoshi2.5 MW
Baramchi4.2 MW
ChakeKhola2.83 MW
Sunkoshi(NEA)10.05 MW
SunkoshiLoad7.29 MVA
Indrawati(NEA)7.5 MW
M-Chaku1.8 MW
Bhairab Kunda3 MW
Panchkhal Load9.168 MVA
Jhyadi2 MW
Kathmandu
Ankhu8.4 MW
Daraudi A6 MW
Thoppal Khola1.65 MW
Upper Machha Khola Small4.55 MW
BharatpurCap27.5 Mvar
Pokhara Load32.647 MVA
Modi (NEA)14.8 MW
Modi Load8.497 MVA
Lower Modi10 MW
Upper Modi19.4 MW
TatopaniHP2 MW
Karuwa Seti32 MW
Seti Khola22 MW
Seti Nadi25 MWBhalaudi Khola
2.645 MW
Mardi Khola4.8 MW
Seti1.5 MW
Phewa1 MW
Bijayapur4.5 MWUpper Madi25 MW
MadkyuKhola13 MW
Bijayapur - 24.5 MW
Andhi Khola9.4 MWRidi2.4 MWUpper Hugdi5 MWAadhiKhola8.497 MVA
Gulangdi Khola0.98 MW
Butwal Cap40 Mvar
Tinau1.024 MW
BhairahawaCap10 Mvar
Jhimurk HEP12 MW
Jhimruk Load5.143 MVA
GhorahiCement12.5 MVA
T12Proposed 5th year-zone2
Rukumgad5 MW

208
Appendix - P: Input Parameter of Transmission Line in Planned INPS & Equivalent Month
Conversions from Nepali to English Calendar
Equivalent Month Conversions
Nepali Months English Equivalent period
Baisakh Mid April – Mid May
Jestha Mid May – Mid June
Ashad Mid June – Mid July
Shrawan Mid July – Mid August
Bhadra Mid August – Mid September
Ashoj Mid September – Mid October
Kartik Mid October – Mid November
Mangshir Mid November – Mid December
Poush Mid December – Mid January
Magh Mid January – Mid February
Falgun Mid February – Mid March
Chaitra Mid March – Mid April
Input Parameter of Transmission Line in Planned INPS (BS 215 British Standards – 54 strands)
ACSRConductor Ampacity Resistance per km (at 200C, Ω/km) Reactance per km (Ω/km)
Moose 980A 0.0546 0.1987
Zebra 860 A 0.0674 0.2079
Bison 800 A 0.0755 0.2166


![Analiza technologiczna nowożytnych fragmentów tekstylnych z Lutomierska, pow. pabianicki, województwo łódzkie [z: B. Muzolf]](https://static.fdokumen.com/doc/165x107/63197448b41f9c8c6e09be8d/analiza-technologiczna-nowozytnych-fragmentow-tekstylnych-z-lutomierska-pow.jpg)