01-335.pdf - California Air Resources Board
133
A Post Regulatory Evaluation of the Cost and Economic Impact Estimates of Air Pollution Control Regulations University of California Riverside Principal Investigator: James Lents, Kurt Schwabe Contract # 01-335 Prepared for the California Air Resources Board and the California Environmental Protection Agency April 2006
-
Upload
khangminh22 -
Category
Documents
-
view
1 -
download
0
Transcript of 01-335.pdf - California Air Resources Board

A Post Regulatory Evaluation of the Cost and Economic Impact Estimates of Air Pollution
Control Regulations
University of California Riverside Principal Investigator: James Lents, Kurt Schwabe
Contract # 01-335
Prepared for the California Air Resources Board and the California Environmental Protection Agency
April 2006

DISCLAIMER
The statements and conclusions in this Report are those of the contractor and not necessarily those of the California Air Resources Board. The mention of commercial products, their source, or their use in connection with material reported herein is not to be construed as actual or implied endorsement of such products.
ii

ACKNOWLEDGEMENTS
We wish to acknowledge the support of Mr. Michael Wehrey and Mr. Mike Canada in the completion of this study.
This Report was submitted in fulfillment of Contract # 01-335 by [University of California, Riverside] under the sponsorship of the California Air Resources Board. Work was completed as of December 15, 2004.
iii

TABLE OF CONTENTS DISCLAIMER.................................................................................................................... ii ACKNOWLEDGEMENTS............................................................................................... iii ABSTRACT...................................................................................................................... vii EXECUTIVE SUMMARY ............................................................................................. viii BODY OF REPORT........................................................................................................... 1 I. INTRODUCTION........................................................................................................... 1
I.A. Rule Selection Process............................................................................................. 1 I.B. Ex Ante Cost Analysis ............................................................................................. 4 I.C. Ex Post Analysis and Comparison........................................................................... 4 I.D. Summary.................................................................................................................. 4
II. LITERATURE REVIEW............................................................................................... 5 II.A. Procedures for Conducting Ex Ante and Ex Post Cost Evaluations ...................... 5 II.B. Ex Ante and Ex Post Cost Evaluation Studies ....................................................... 6
III. RULE SELECTION ..................................................................................................... 9 IV. ANALYSES OF SELECTED RULES....................................................................... 12
IV.A. CASE 1 - SCAQMD RULE 1153 ................................................................ 12 IV.B. CASE 2 – SCAQMD RULE 1173................................................................ 19 IV.C. CASE 3 – SCAQMD RULE 1174...................................................................... 24 IV.D. CASE 4 - SCAQMD RULE 1138 ................................................................ 35 IV.E. CASE 5 – CARB RULE 90-5-1.......................................................................... 42 IV.F. CASE 6 – CARB RULE 89-10-2........................................................................ 48 IV.G. CASE 7- CARB RULE 88-2-2 ..................................................................... 54 IV.H. CASE 8 – CARB RULE 93-12-2 (Section 93109, Title 17 CCR) ..................... 63
V. ANALYSIS OF INFORMATION GATHERING PROCCESS ................................. 69 V.A. Attempts to Obtain Ex Post Data ......................................................................... 69 V.B. Lessons Learned ................................................................................................... 73
VI. RECOMMENDATIONS AND CONCLUSIONS..................................................... 75 VI.A. Recommendations for Process Improvement ............................................... 75 VI.B. Conclusions of Analysis...................................................................................... 76
REFERENCES ................................................................................................................. 78 GLOSSARY ..................................................................................................................... 79 Appendices: ...................................................................................................................... 80 Data Related to Contact Information and Efforts to Collect Cost Information ................ 80 Appendix A: Rule 1153 ................................................................................................... 81 Appendix B: Rule 1173 ................................................................................................... 84
iv

Appendix C: Rule 1174 .................................................................................................... 91 Appendix D: Rule 89-10-2, 91-11-1, and 95-6-3 ............................................................ 98 Appendix E: Gasoline Specifications Phase II-Stakeholders List .................................. 101 Appendix F: Rule 88-2-2 List of plating (decorative, hard, trivalent) and chromic acid anodizing facilities (2003) .............................................................................................. 104 Appendix G: Potential Secondary Sources of Data ....................................................... 112 Appendix H: APC Manufacturer’s Survey..................................................................... 118 Appendix I: Consumer Price Index ................................................................................ 124
v

LIST OF TABLES
Table I-1. Rule Initially Selected for the Study ........................................................2
Table IV-8. Potential Hexavalent Chromium Control Measures Ranked by Cost-
Table IV-9. Estimated Statewide Emissions of Hexavalent Chromium in California
Table IV-10. The Overall Cost-Effectiveness Estimations, Prepared by CARB (1988$)
Table IV-11. The Costs of Compliance (median values) According to Control
Table I-2. Availability of Ex Ante and Ex Post Cost Information............................3 Table IV-1. The Total Cost per Use of Alternative Controls (2004 dollars) ............27 Table IV-2. Retail Pricing of Charcoal Grill Liquid Starting Fuels (1994$)............29 Table IV-3. Advertised Cost of Chimney Starters....................................................29 Table IV-4. Cost of Electric Starters.........................................................................30 Table IV-5. Comparison of Ex-Ante With Ex-Post Cost Estimates.........................34 Table IV-6. Projected Costs by CARB Staff (2004 dollars).....................................45 Table IV-7. Summary of Potential Hexavalent Chromium Control Measures..........57
Effectiveness and Reduction in Cancer Cases. Development Time (1988$) ............58
According to Source Category (1985) .......................................................................59
....................................................................................................................................60
Requirements. ............................................................................................................60
vi

ABSTRACT
An ex ante and ex post cost analysis was conducted on selected rules in California to compare the accuracy of both the industry’s and regulator’s estimated cost impacts with the actual cost of the rule after implementation. Ten candidate rules were identified from public hearing records at the California Air Resources Board (CARB) and the South Coast Air Quality Management District (SCAQMD). More in-depth research of these public records yielded ex ante cost information for eight of the ten rules. Three different efforts to contact stakeholders yielded ex post cost information, of varying degrees, for six of the eight rules. A comparison was made between the ex ante costs developed by the regulatory agency as well as the stakeholders to the ex post costs for the six rules. The regulatory agencies estimated capital cost impacts similar to actual impacts on five of the six rules fully analyzed. For cost per ton reduced, the agencies estimated very similar costs to the actual in two cases, overestimated somewhat for three cases, and underestimated in one of these cases. In the remaining case, the ex post cost information obtained was anecdotal and not sufficient to allow conclusion. In each case, the projection of the economic impact of the rule made by the stakeholders is significantly higher than the projection made by the agency. The capital costs comparison is considered more robust and accurate than analyses considering emissions data due to the difficulty in obtaining actual emissions reduction from stakeholders. A complete analysis of each rule along with recommendations for improving the process and availability of ex post information is discussed.
vii

EXECUTIVE SUMMARY
The regulatory process in the state of California requires the California Air Resources Board (CARB) and local air districts to make projections of the cost of compliance for every proposed rule. Typically the entities that will be regulated by the proposed rule (referred to as stakeholders) make their own estimation of the economic impacts, and quite often, the two estimates are dramatically different. To ensure its cost projections are as accurate as possible, the California Air Resources Board (CARB) requested the University of California at Riverside (UCR) conduct a “post audit” of actual costs of implementation of seven to ten rules. The goals of this project were to identify seven to ten rules where both the agency and the stakeholder projected cost estimates (ex ante) are documented, determine what the actual costs of implementation were (ex post), highlight any substantial and systematic discrepancies between actual costs and projected costs when possible, and ascertain if there are any recommendations to be made to improve the agencies cost projection process for the future.
Initially, ten rules were selected for review. Six of these rules were implemented by CARB and four by the South Coast Air Quality Management District (SCAQMD) between the years of 1985 and 1998 (See Table I-1 for a list of the ten rules selected). The projected cost estimates of both the agencies and the stakeholders were compiled and summarized for a majority of these rules and these data are documented in the body of the report. As expected, the projection of the economic impact of the rule made by the stakeholders is significantly higher in each case than the projection made by the agency.
Several obstacles were encountered during the effort to determine the actual cost of each rule. As a result, actual implementation costs to the stakeholder (ex post) were not obtained for three of the rules that were originally selected.
For the remaining seven rules, actual implementation costs have been estimated, and conclusions drawn for all but one in regard to the predictive accuracy of the agency. For all but two of the rules, 1173 (VOC Emissions from Petroleum facilities) and 90-5-1 (Ethylene Oxide Emissions), it appears that the agency’s projected costs for the rule implementation was in line with or slightly overstated the actual costs derived from this study. For Rule 1173, the VOC Emissions from Petroleum facilities Rule, it appears the district probably underestimated the costs to comply. For Rule 90-5-1, the Ethylene Oxide (EtO) rule, it appears that the cost to comply has significantly contributed to most hospitals, clinics, and other small users to discontinue operating their own EtO sterilizers and therefore, the contract sterilization industry has consolidated considerably. Beyond that, the anecdotal ex post cost information obtained was insufficient to allow a conclusion to be reached. Table I-1 summarizes the availability of cost data and the cost comparisons.
The completion of this research was made difficult by the lack of records concerning control decisions by the impacted businesses and turnover of knowledgeable staff. This problem could be remedied to a great extent by requiring businesses to maintain records
viii

of steps taken to comply with the various rules and possibly report the steps taken and associated cost to comply back to the original regulatory agency.
In general, it appears that the ex-ante cost estimates did not fully address the impacts of future technology development or industry trends, especially toward consolidation. The result of this lack of analysis is that the rule costs were overstated by the adopting agency in several cases. The accuracy of ex-ante cost estimates could be improved if regulators can develop methods to better forecast the impacts of technology development and industry trends/reactions that might occur subsequent to the rulemaking process.
ix

BODY OF REPORT
I. INTRODUCTION
In California, authorities for air quality management rules are required to project the implementation cost of proposed rulemaking and consider that cost during their deliberation on the rulemaking proposal. It is not uncommon for agency-projected implementation costs to vary significantly from cost projections developed by the industry sector affected by the proposed rulemaking. The actual cost following adoption of the rule is generally not tracked and, subsequently, it is not clear whether the agency-projected cost is more or less accurate than the stakeholder-estimated cost. In an effort to ensure its cost projections are as accurate as possible, CARB requested the University of California at Riverside to undertake a study. The goals of the study were to: 1) determine the agency-projected cost (ex ante) for seven to ten rulemakings; 2) determine the stakeholder-projected cost for those same rulemakings; 3) determine the actual implementation cost to the stakeholders (ex post); 4) compare both agency and stakeholder projections to the actual cost and determine which projection had been more accurate; 5) if stakeholder cost projections turned out to be more accurate in any of the rulemakings, determine the source(s) of error in the agency projection and recommend approaches to avoid such error in future cost projections.
I.A. Rule Selection Process Ten rules were initially selected for review: six of these rules were implemented by CARB and four by SCAQMD between 1985 and 1998. The process used to select these ten rules, with criteria developed and agreed upon by both agencies, relied on information obtained from the initial rule making process (e.g., the minutes from the board meetings during which the rules were approved). The criteria required that any selected rule must (i) be unique to California (i.e., not the outfall from a federal rule), (ii) have a clear stakeholder list, (iii) show evidence of detailed ex ante cost information and emission data, and (iv) have been approved and implemented so that compliance had already been met. Of the 678 regulations that were initially looked at, only 109 appeared to meet the criteria specified above. Closer examination and critiques produced 37 regulations. Of those 37, 6 regulations were selected from CARB rules and 4 from SCAQMD. Table I-1 identifies the ten specific rules and the relevant regulated sectors. Section III describes the rule selection procedure and criteria process in detail.
- 1 -

Table I-1: Rules Initially Selected for the Study Case
# Hearing Date
Hearing Number
Regulation Affected Sector
1 July 1990 1153 Volatile Organic Compound emissions from Bakeries
Commercial bakeries
2 May 1989 1173 Control of VOC Leaks and Releases from Components at Petroleum Facilities and Chemical Plants
Petroleum facilities
3 Sep 1990 1174 Control of VOC Emissions from the Ignition of Barbecue Charcoal
Charcoal producers
4 Nov 1997 1138 Control of Emissions from Restaurant Operations
Restaurants
5 5/10/1990 90-5-1 Airborne Toxic Control Measure for Ethylene Oxide Emissions from Sterilizers and Aerators
Hospitals, laboratories, veterinary care facilities, and museums
6 6/8/1989 89-10-2 Amendments to Regulations Regarding Exhaust Emission Standards, Test Procedures and Durability Requirements Applicable to Passenger Cars and Light-Duty Trucks for the Control of Hydrocarbon, Carbon Monoxide and Benzene Emissions
Automobile manufacturers
7 2/ 18/1988 88-2-2 Airborne Toxic Control Measure for Hexavalent Chromium Emissions From Chrome Plating and Chromic Acid Anodizing Facilities
Hard plating, anodizing and decorative plating facilities
8 10/14/93 93-12-2 Airborne Toxic Control Measure for Perchloroethylene Emissions from Dry Cleaning Operations and a Regulation for an Environmental Training Program for Perchloroethylene Dry Cleaning Operations
Dry cleaning facilities
9 6/29/ 1995 95-6-3 Onboard Refueling Vapor Recovery Standards and Test Procedures and Modifications to Evaporative Test Procedures Applicable to 1998 and Subsequent Model-Year Passenger Cars, Light-Duty Trucks, and Medium-Duty Vehicles
Automobile manufacturers
10 11/ 1/1991 91-11-1 Amendments to Regulations Regarding Reformulated Gasoline (Phase 2 Gasoline Specifications), and the Wintertime Oxygen Content of Gasoline
Petroleum refineries
- 2 -

Table I-2. Availability of Ex Ante and Ex Post Cost Information
Case Rule/Ref. Regulation
Ex Ante Cost Information Ex Post Cost Information Identified
Comparisons / Comments Regulator Industry
1 1153 Volatile Organic Compound emissions from Bakeries
$174m to $589m $625m to $748m
$441m to $852m
Regulator ex ante average cost estimates lower than industry ex ante cost estimates. Both overestimate ex post cost per ton.
2 1173 Control of VOC Leaks and Releases from Components at Petroleum Facilities and Chemical Plants
$36 mm District Total
Comments on technical feasibility only
$90mm to $100mm for 2 refineries
Regulator ex ante cost estimates considerable lower than ex post costs.
3 1174 Control of VOC Emissions from the Ignition of Barbecue Charcoal
Yes yes (only comments)
Yes Regulators ex ante costs slightly overestimate ex post costs.
4 1138 Control of Emissions from Restaurant Operations
$3300/ton $1180 to $8730/ton
$1085 to $1250/ton
Industry ex ante cost estimates higher than regulator. Both overestimate ex post costs.
5 90-5-1 Airborne Toxic Control Measure (ATCM) for Ethylene Oxide Emissions from Sterilizers and Aerators
Yes Yes Anecdotal and insufficient
Industry ex ante cost estimates slightly higher than regulator.
6 89-10-2 Exhaust Emission Standards, Test Emission Standards, Test Procedures, and Durability Requirements: Applicable to Passenger Cars and Light-Duty Trucks for the Control of Hydrocarbon, CO, and Benzene Emissions
Yes Yes No Cooperation between industry and regulatory seemed to address major issues. Differences existed.
7 88-2-2 ATCM for Emissions of Hexavalent Chromium from Chrome Plating and Chromic Acid Anodizing Operations
$550/pound reduced
No data $100 to $50/ pound reduced
Regulator ex ante estimate significantly overestimates ex post cost per ton estimates
8 93-12-2 ATCM for Perchloroethylene Emissions from Dry Cleaning Processes
$55m to $83m No Data $76m to $83m Regulator ex ante estimates fairly close to ex post estimates.
9 91-11-1 Reformulated Gasoline Yes no No Not evaluated 10 95-6-3 Onboard Refueling Vapor Recovery
Standard No no No Not evaluated
- 3 -

I.B. Ex Ante Cost Analysis Considerable effort was spent analyzing and interpreting both the agency and stakeholder cost estimates for each of the 10 proposed rules. In this analysis process, it was decided in conjunction with CARB that two of the original 10 rules would not be analyzed due to difficulties in the ability to obtain information and other extenuating circumstances. Section III and the appendices describe this process and documents estimates obtained from the meeting minutes of the various board meetings. This effort produced positive returns. A summary of the ex ante cost estimates for each rule is included in Section IV.
I.C. Ex Post Analysis and Comparison Following the ex ante analysis, an ex post analysis and comparison was attempted for the 8 rules. Significant effort was mounted to obtain ex post data from the industry affected in each rule through three different techniques. These techniques and the difficulties encountered in obtaining the ex post information are described in detail in Section V. The data collection effort was successful enough to develop an ex post rule analysis for six of the eight rules. More often than not, though, efforts to collect an abundance of ex post cost data were severely hampered by informational shortfalls arising from a reluctance or inability on industry’s part to participate. While strategic reasons are partly to blame, so too was the lack of an incentive to companies to divert scarce monitoring and data-keeping resources to assist us in these data collection efforts. These and other obstacles are discussed in more detail below. When ex post information was obtained, it was compared with both agency and stakeholder projections. Finally, an analysis of which projection had been more accurate and causes for discrepancies are described.
I.D. Summary This report contains, then, an ex ante analysis of eight rules and a complete analysis of six rules. Section II describes some previous studies on cost analysis and guidelines for conducting cost analysis for rules. The case studies for each of the 8 rules are presented in Section IV, and include a rule description, ex ante and ex post analysis and comparison. Experiences associated with efforts to obtain ex post estimates are enumerated and suggestions for increasing the likelihood of future success are made in Section V. Section VI summarizes the recommendations and conclusions from this effort. The appendices provide updated lists and other contact-related information.
It should be noted that all cost estimates – both ex ante and ex post – are presented in 2004 dollars unless otherwise noted using a general inflation-adjustment calculator from the United States Department of Labor - Bureau of Labor Statistics (Appendix I). Many different types of indices could be used to make this adjustment given the heterogeneity across and within rules with respect to the products and control factors priced. While the absolute magnitude of the cost differences are likely to vary some depending on which index is used, the ordinal ranking across alternatives is unlikely to change, nor are our conclusions about (i) whether industry ex ante cost estimates are typically lower or higher than the regulator’s ex ante cost estimates and (ii) whether industry and the regulator’s ex ante estimates under or over-estimate the ex post estimates.
- 4 -

II. LITERATURE REVIEW
II.A. Procedures for Conducting Ex Ante and Ex Post Cost Evaluations From a methodological perspective, a very comprehensive study that highlights important factors to consider when one intends to perform an ex ante and ex post cost comparison is contained in a report presented to the South Coast Air Quality Management District entitled “Criteria and Resources for Facility-based and Post-Rule Assessment” (BBC 2002). The purpose of the report was to provide guidance on how to choose the best rules to perform either a facility-based assessment (FBA) or a post-rule assessment (PRA). A FBA consists of collecting information about a potentially regulated industry and, among other things, estimating the costs of the proposed rule. Alternatively, a PRA requires gathering and analyzing information on, among other things, the costs incurred by firms to meet existing rules. Many of the guidelines outlined in the BBC report on how to conduct a successful FBA and PRA were followed in this study.
The information provided in the BBC (2002) report is extremely relevant to future endeavors to estimate both ex ante and ex post costs of regulations. For instance, the report lists three steps to consider when performing a FBA. First, consider the type of rule. It suggests not focusing on administrative rules or consumer product rules but rather rules that impact industrial processes. Second, consider the significance of the rule and whether it targets an industry that has been regulated in the past. If it has been regulated, there will be difficulty in dealing with the cumulative effects of both regulations. Third, consider the feasibility of completing the FBA. The more difficult it will be to complete, the less meaningful the results may be. The report suggests focusing on rules where this is some degree of homogeneity across the production processes of potentially impacted businesses.
Interestingly, the BBC (2002) report presents information on the time required to perform such analysis. This can be useful to future efforts in terms of better aligning information demands with the scarce supply of resources. For instance, it is estimated that it took the BBC staff approximately 240 staff hours (6 weeks) for each FBA rule. They stress, though, that this process typically involves much more total time since there is much waiting involved. So, the 240 staff hours is spread out over a much longer period. As a rough estimate, they estimate that it will take approximately 1 to 3 months to complete an FBA. Clearly, these are general estimates and will vary by rule and the quality expected.
Alternatively, the lessons associated with performing a PRA include familiarizing oneself with the uncertainty associated with the compliance costs at the time of the rule’s adoption. The greater the uncertainty, the greater the difficulty in drawing conclusions about ex ante versus ex post costs. Also, if there is feedback from the industry after adoption, this can provide useful information. The report stresses the importance of reporting and data tracking procedures at the outset of the rule adoption to aid in the success of performing a PRA. The report also stresses the types of entities regulated as influencing the feasibility of successfully performing a PRA. As the report suggests,
- 5 -

PRA will require the use of existing data on industry performance, data that may be limited or nonexistent to the general public, even more so when a rule is very narrowly tailored. As an example, BBC (2002, page 4) that “…it would be more feasible to perform a PRA of economic effects for a rule involving the wood furniture industry (which comprises most of a 2-digit SIC code) than for a rule involving the dry cleaning industry (which is a 4-digit SIC code). A PRA on the economic impacts of rules which pertain to only a subset of firms within a 4-digit SIC code (such as restaurants using charcoal broiling processes) will be most difficult of all.”
In terms of resources devoted to accomplishing a PRA, if the focus is on compliance costs alone, BBC (2002) estimated an effort of between 120 to 400 staff hours to complete an estimate. If the costs included a wider economic impact study, then the time to complete a PRA was estimated to be between 160 to 360 staff hours. Again, these are crude estimates suggested in the report and will vary by characteristics of the particular rule. Yet, given that so few of these assessments have been done, having any information on what the resource commitments might be will certainly aid in more effectively assigning the appropriate amount of resources to the task to increase the probability of a successful effort.
Finally, it should be emphasized that the ease of performing an ex post assessment is primarily driven by data availability, a point emphasized in BBC (2002). With this in mind, they suggest that if one wants information only on the compliance costs associated with a regulation, then the impacts of consumer product regulations and market based regulations can be easily ascertained from observed market prices.
II.B. Ex Ante and Ex Post Cost Evaluation Studies The literature on estimating ex ante and ex post costs of a regulation is evolving. Recent studies by Resources for the Future (RFF) (Harrington, Morgenstern, and Nelson 1999), the Natural Resources Defense Council (NRDC 2004), BBC Research and Consulting (BBC 2002), and Hammitt (2000) provide a comprehensive and detailed summary of evidence at the federal, state, industry and firm-level that suggest ex ante costs by both the regulator and the regulated have underestimated and overestimated the ex posts costs. For instance, of the over two dozen environmental and occupational safety regulations reviewed by Harrington et al. (1999), 12 of the 25 rules provided strong evidence that the ex ante costs overestimated the ex post direct costs of the rule, while 6 of the rules were characterized by ex ante costs that underestimated the ex post direct costs. Interestingly, if one focuses on per unit costs, there is approximately an equal mix of rules where the ex ante costs both over- and under-estimate the ex post costs. Finally, if one focuses on regulations that employed economic incentives, per unit costs are consistently overestimated. The conclusions of the RFF study suggested that whether ex ante cost estimates systematically under- or overestimated ex post realized costs was partially a function of how costs are defined – e.g., per unit, total, direct, indirect, whether general equilibrium effects or health impacts are included. They are also a function of the fact that unanticipated innovations do occur (and are more likely to occur under incentive-based policy instruments) and policies do change in terms of what firms/industries need to do to achieve compliance relative to what was assumed in the ex ante estimation.
- 6 -

It should be noted that of the rules analyzed by RFF, 11 could be categorized as rules affecting industrial processes, 5 could be categorized as a consumer product mandate, and 5 could be classified as a market based approach. Interestingly, of the 10 ex post analyses on non-federal regulations that RFF could identify that included ex ante cost information, all were either consumer product or market-based regulations. Interestingly, none of the rules we analyzed were rules that included market-based regulations and only one, Rule 1174, could be classified under the consumer product moniker.
While evidence of ex ante cost over-estimation by the regulator does exist, there seems to be much stronger evidence and occurrence of ex ante cost over-estimation by the regulated community. Perhaps the poster child of this artifact is the industry cost estimates to achieve Sulfur Dioxide emissions reduction under the Clean Air Act Amendments of 1990. Early industry estimates suggest per unit costs of $1500 per ton of emissions reduced, while actual permit prices (a common metric for the per unit abatement costs) were around $150 per ton (Harrington et al. 1999).
The Natural Resources Defense Council (NRDC 2004) also provided analysis and commentary on the ability of both regulators and industry to accurately predict ex post costs estimates. Focusing on the compliance costs to the automobile industry, NRDC surmises that regulator’s ex ante costs have typically overestimated the actual costs by a factor of between 1 and 2, while the automobile industry’s ex ante estimates range between 2 and 10 times the actual costs. The reasons they give for the potentially large divergences between ex ante and ex post costs include (NRDC 2004, p. 6): unanticipated innovation, conservative estimates by regulators and industry, asymmetric information on the regulators side, and strategic behavior on industry to weaken or delay the regulation. Supporting their claims are case studies, many involving California’s Low Emission Vehicle (LEV) program. Other examples the NRDC cites provide strong evidence supporting their claims includes regulations associated with (i) the 1966 California HC and CO standards, (ii) 1975 requirement for catalytic converters, and (iii) the LEV I and II program.
The difficulty of estimating the cost of a regulation, be it ex ante or ex post, may vary with the extent of the impacts one is interested in considering. That is, accounting for the larger indirect impacts (e.g., employment effects within and across industries) or downstream impacts of a rule (e.g., impacts on human health) clearly complicates the estimation process and requires many more (possibly heroic) assumptions. Yet estimating and comparing the ex ante and ex post costs of a regulation that will focuses on the implementation of a particular technology alone has its difficulties as well. For instance, often at the time of the regulatory process the technology has only been applied in limited situations, and the only certain costs are those associated with these initial pilot applications. The cost reductions associated with widespread use of a new technology and further manufacturing innovations are difficult to make and often much disputed. Furthermore, the accuracy of reported cost estimates is confounded by uncertainty surrounding the specifics of the regulation, inadequate data, and even strategic behavior (Goodstein 1997).
- 7 -

For instance, consider the following example illustrating the difficulty of estimating the costs and effectiveness of a new technology provided in Hammitt (2000) in his analysis of the ex ante and ex post costs of meeting the CFC Phase-out requirements under the Montreal Protocol. The two groups providing cost estimates were RAND and the EPA. RAND, based on the lack of development of substitute compounds, seemed to err on the side of conservatism in estimating the time and costs to bring these compounds to development. EPA, which performed its study 2 years later than RAND, had additional information on which to base its more optimistic predictions of the ability of firms to develop these substitute compounds. Additional reasons for the poor predictions were that firms and regulators failed to reasonably predict the impact of incentive-based instruments on encouraging innovation. There is clear evidence that ex post control costs of meeting the CFC Phase-out requirements under the Montreal Protocol were substantially smaller than the earlier ex ante estimates. Hammitt (2000, p. 296) concludes by suggesting, “Cost overestimates appear to be more likely when compliance involves the innovation and diffusion of a technology not currently in commerce…”
Another example of the difficulty in estimating the cost and emission reductions is illustrated by the SCAQMD’s regulation of NOx from natural gas fired power plants and the 1990 CARB vehicle regulatory process (Lents et al., 2000). Both took place in the 1988 to 1991 timeframe. At the time of the power plant regulation adoption, the SCAQMD estimated the cost of this NOx control to be on the order of $25,000 per ton of NOx controlled. The industry estimate at the time was about $45,000 per ton of NOx controlled. By 1995, when the requirements were coming into effect, NOx control was being applied to power plants for about $12,000 per ton. Costs have continued to drop for this technology since then. Similarly, in 1990, CARB estimated vehicle control costs for the proposed regulation to be about $170 per vehicle while the industry argued that the costs would be on the order of $783 per vehicle. Subsequent experience has indicated that the original CARB cost estimates, while overestimating the actual costs, were closer to the actual estimates than were the industry’s estimates (Lents et al., 2000).
Hammitt (2000) provides an explanation as to why ex ante costs might be overestimated. First, an information asymmetry exists such that the firms have more up-to-date information than regulators about alternatives for meeting the stipulations of the regulations. Such information provides the opportunity for strategic behavior from the firm’s perspective to overestimate the costs of the regulation. Second, firms are likely to have under-invested in identifying low cost compliance measures such that when push comes to shove and the regulation is implemented, it is in the firm’s best interest to invest, investigate, and implement lower cost alternatives that were un- or underdeveloped prior to the rule implementation.
Finally, it should be noted that not all industry ex ante costs overestimate ex post costs. Indeed, some control options may not have been as cost effective as originally anticipated. For example, Inspection/Maintenance programs were less cost effective than originally anticipated (Cackette, 2000). Also, the original vehicular OBD (on-board diagnostics) requirements did not meet initial expectations.
- 8 -

III. RULE SELECTION
Through discussions with the California Air Resources Board (CARB) and the South Coast Air Quality Management District, approximately 10 rules would be targeted for analysis. The following approach was discussed, agreed upon, and executed.
The initial intention was to focus on approximately 7 air quality regulations approved by CARB and 3 approved by SCAQMD. It was agreed upon that a few more might be evaluated if time and other resource constraints do not become binding. These 10 rules would be the result of an iterative process by which all the rules approved by CARB and SCAQMD between 1/1/85 and 12/31/98 would be identified and analyzed for possible selection. Project associates from UCR and CECERT would identify all rules between these dates that appeared to be amenable to economic analysis. Of the candidate rules identified by these associates, between 15 and 20 would be selected by the PI and Co-Investigator along with associates as being a representative set of the approved air quality regulations and for which data was available, or could be collected, for analysis. From these 15 to 20 rules, the final 10 would be identified at a meeting with the relevant UCR/CECERT and CARB members.
To this end, project team associates traveled to Sacramento to identify any rules between the designated time frame that contained economic data or provided information that economic data could be collected within a reasonable time frame to maintain project deadlines. The majority of the associates work consisted of going through the electronic copies of the CARB hearings from 1985 through 1998. From this two-day activity, annual tables of rulemaking actions along with copies of hearing summaries covering the rulemaking records were made. Perusing the hearings looking for rulemaking actions was an arduous task. The hearings, which consist of the minutes, and all written and oral testimony, were scattered throughout various sources, including books in the CARB library, the web, and on microfiche. It was discovered after the first day that individual rulemaking files are available through the Board Administrator and Regulatory Coordination Unit at CARB.1
Out of the approximately 700 rules that were looked at, 109 met the initial requirements for pre-selection. These 109 rules consisted of a variety of regulations ranging from VOC emissions reduction requirements, implementation of low-emission vehicles, evaporative emission requirements, and toxic control requirements, to name a few. Upon returning from Sacramento, the associates identified approximately 35 of the 109 rules that seemed the most appropriate and amenable for analysis. It was noted at that time that the rule making records were not ordered along a consistent timeline, some gaps in the archived microfiche existed between months and years.
In early January, 2003, the associates, PI, and Co-Investigator, narrowed the list down to 15 CARB rules and approximately 6 SCAQMD rules with the intention of selecting the
1 We acknowledge the helpful assistance of Artavia Edwards in assisting us in obtaining and arranging the appropriate files.
- 9 -
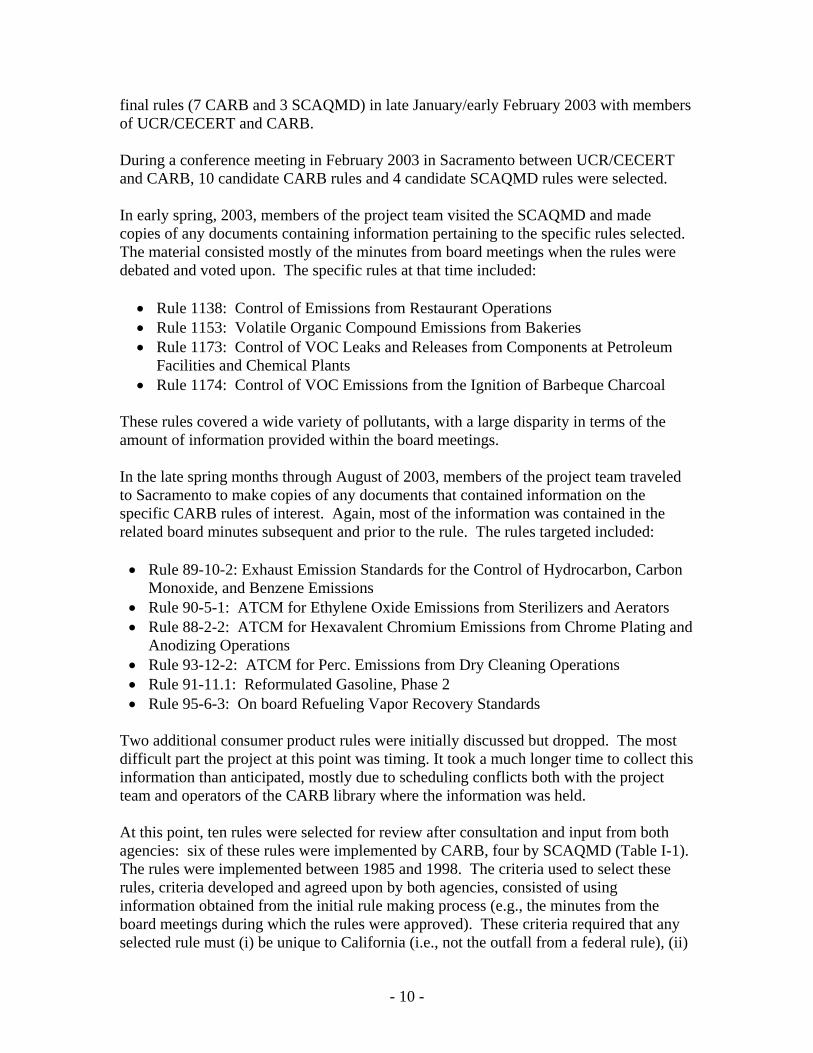
final rules (7 CARB and 3 SCAQMD) in late January/early February 2003 with members of UCR/CECERT and CARB.
During a conference meeting in February 2003 in Sacramento between UCR/CECERT and CARB, 10 candidate CARB rules and 4 candidate SCAQMD rules were selected.
In early spring, 2003, members of the project team visited the SCAQMD and made copies of any documents containing information pertaining to the specific rules selected. The material consisted mostly of the minutes from board meetings when the rules were debated and voted upon. The specific rules at that time included:
• Rule 1138: Control of Emissions from Restaurant Operations • Rule 1153: Volatile Organic Compound Emissions from Bakeries • Rule 1173: Control of VOC Leaks and Releases from Components at Petroleum
Facilities and Chemical Plants • Rule 1174: Control of VOC Emissions from the Ignition of Barbeque Charcoal
These rules covered a wide variety of pollutants, with a large disparity in terms of the amount of information provided within the board meetings.
In the late spring months through August of 2003, members of the project team traveled to Sacramento to make copies of any documents that contained information on the specific CARB rules of interest. Again, most of the information was contained in the related board minutes subsequent and prior to the rule. The rules targeted included:
• Rule 89-10-2: Exhaust Emission Standards for the Control of Hydrocarbon, Carbon Monoxide, and Benzene Emissions
• Rule 90-5-1: ATCM for Ethylene Oxide Emissions from Sterilizers and Aerators • Rule 88-2-2: ATCM for Hexavalent Chromium Emissions from Chrome Plating and
Anodizing Operations • Rule 93-12-2: ATCM for Perc. Emissions from Dry Cleaning Operations • Rule 91-11.1: Reformulated Gasoline, Phase 2 • Rule 95-6-3: On board Refueling Vapor Recovery Standards
Two additional consumer product rules were initially discussed but dropped. The most difficult part the project at this point was timing. It took a much longer time to collect this information than anticipated, mostly due to scheduling conflicts both with the project team and operators of the CARB library where the information was held.
At this point, ten rules were selected for review after consultation and input from both agencies: six of these rules were implemented by CARB, four by SCAQMD (Table I-1). The rules were implemented between 1985 and 1998. The criteria used to select these rules, criteria developed and agreed upon by both agencies, consisted of using information obtained from the initial rule making process (e.g., the minutes from the board meetings during which the rules were approved). These criteria required that any selected rule must (i) be unique to California (i.e., not the outfall from a federal rule), (ii)
- 10 -

have clear stakeholder list, (iii) show evidence of detailed ex ante cost information and emission data, and (iv) have been approved and implemented so that compliance had already been met. This information was all gleaned from files located at both agencies.
It should be emphasized that during the rule selection period the majority of work consisted of going through the electronic copies of CARB hearings from 1/1/85 through 12/31/98. From that, annual tables of rulemaking actions were created, along with copies of the hearing summaries covering the rulemaking contained in the tables. To some extent, those tables (as reported in the 1st two quarterly reports) reflect a culling of rulemaking actions along with changes to testing protocols that would not be appropriate subjects for the cost study. These rule action files contain the minutes, and all written and oral testimony provided by both the CARB, SCAQMD and affected parties.
An analysis and interpretation was performed on the agency and stakeholder cost estimates for each of the 10 proposed rules. Included in this report are all of the documented estimates obtained from the meeting minutes of the various board meetings and from other sources. Unfortunately, two rules were not completed - Rule 91-11-1 and Rule 95-6-3, neither for the ex ante cost estimate nor the ex post cost estimates. This should not be surprising when one considers the amount of time it has taken prior studies to complete one-half of a single rule. For instance, as discussed below in the Literature Review section, it is estimated that a single facility based assessment to analyze the ex ante costs of a proposed regulation can take up to 240 hours of staff time. These six weeks, unfortunately, are spread out over a much longer time given the logistics with obtaining this type of information from a variety of sources. In our particular case, the ex ante information from Rule 91-11-1 was collected but after review of initial rule making minutes and the subsequent law suits, it was concluded that any ex ante estimates derived might have been influenced by expectations associated with future enforcement of the rule, including perhaps when and if particular components of the rule would be relaxed. Initial efforts to contact industry were also unsuccessful. Indeed, our attempts to even copy the rule making minutes were delayed due to the fact that the documents were being held by lawyers involved in what appears to be an ongoing, or potential, lawsuit associated with this rule. For Rule 95-6-3, we were able to copy the minutes from the rule making sessions, but did not have enough time to follow up on estimating the ex ante nor ex post costs. Fortunately, we do not feel that the addition of these two rules would have added any additional information to this report beyond what is already included related to the relative size of industry and regulator ex ante cost estimates or how these estimates might compare with what actually occurs. An analysis of the basis for each estimate is included, and, where possible, an explanation of significant differences between the agency and stakeholders assumptions is given. A summary of the ex ante cost estimates for each rule is included in the next section.
- 11 -

IV. ANALYSES OF SELECTED RULES
IV.A. CASE 1 - SCAQMD RULE 1153
CONTROL OF VOLATILE ORGANIC COMPOUNDS (VOC) IN COMMERCIAL BAKERY OVENS
IV.A.1 Background In 1987, ozone, which is formed by photochemical reactions between directly emitted nitrous oxides (NOx) and volatile organic compounds (VOC), was monitored at 28 locations in the South Coast Air Basin by the South Coast Air Quality Management District (SCAQMD). Measurements indicated that both federal and state ozone standards were exceeded at all locations, with Basin ozone levels often exceeding Federal standards by a factor of three. A primary health concern associated with elevated ozone concentrations is reduced lung function, particularly during vigorous physical activity. In response to these concerns, SCAQMD implemented a variety of control measures designed to reduce VOC emissions from stationary sources in pursuit of its commitment to attain the National Ambient Air Quality Standard (NAAQS) for ozone. One such measure, Rule 1153, was developed as part of the 1989 Air Quality Management Plan. The main purpose of Rule 1153, which was adopted in 1991, was to control VOC emissions from commercial bread bakery ovens, an industry which had not been targeted under any prior regulations.2
The specific target of Rule 1153 was VOC emissions, primarily ethanol, emitted from bakery ovens. Ethanol, along with carbon dioxide, is a by-product of the leaving process of bread. It is produced during the metabolic fermentation reaction among yeast enzymes, sugars and starches present in the dough. While carbon dioxide is retained in the dough, causing it to rise, ethanol remains as a liquid in the dough and is emitted during the baking process.
Prior studies contributed greatly to the development of Rule 1153, mostly through efforts to establish an emission factor for estimating ethanol emissions from bakeries. The Bay Area Air Quality Management District’s (BAAQMD) Rule 42, for example, adopted on September 20, 1989, entailed actual source testing of bakery oven emissions. During the study, a total of 16 ovens were tested with results ranging from 0.3 lbs to 7.0 lbs of ethanol per 1,000 lbs of bread baked. The American Institute of Baking (AIB) conducted a study that further investigated the same bakeries as in Rule 42. The AIB study included efforts to control for the impacts on emissions from a variety of process parameters, including yeast and sweetener concentrations, fermentation time, process type (e.g., sponge dough vs. straight dough), product type (e.g., white bread or sourdough), and baking conditions (e.g., time and temperature). The results of the AIB study suggested a
2 Rule 1153 was amended once, in 1995. The amendment addressed modifications to test method specifications and was in response to a request by the USEPA to correct Sate Implementation Plan deficiencies and improve its enforceability.
- 12 -

strong relationship between ethanol emissions and initial yeast concentration, total fermentation time, and proof time.3 Process type had a small, but noticeable, impact.
SCAQMD also performed a study to quantify ethanol emissions and determine the number, type, and characteristics of bakery ovens in the Basin. The study consisted of a survey questionnaire designed by its staff that was distributed to bakery operators in the newly formed Southern California Bakers’ Air Quality Association (SCBAQA) to obtain actual operation data from the major bakeries in the Association. Results from the questionnaire suggested that 24 major bakeries using approximately 72 bakery ovens operated in the Basin. Total bread production in the Basin was estimated at 446,700 tons per year; total ethanol emissions from these major operators were approximately 4.1 tons per day. From these results, an average ethanol emission factor of 2.5 pounds of ethanol per 1000 pounds of bread produced was calculated. A 1989 report from the Air Quality Management Plan Control Measure #88-C-1 estimated daily VOC emissions from commercial bakery ovens at 5.8 tons per day. Alternatively, SCAQMD’s Emission Inventory Unit also attempted to quantify ethanol emissions generated by bread bakeries. Based on their 1988 report, the total VOC emissions from bakeries in the South Coast Air Basin was 2,442 tons per year, or approximately 9.4 tons per day.
IV.A.2 Bread Production Process and Equipment Large commercial bakeries use highly automated bread production processes. At full capacity, a single large bread bakery can produce up to 300,000 pounds of over 100 different varieties of bread and other bakery products per day. Mixing and blending of ingredients, as well as the working and dividing of the dough, is performed mechanically. The dough is continuously conveyed through each step of the process without any manual handling. Three basic dough processes are used by commercial bread bakeries: sponge dough, brew (also called liquid sponges), and straight dough. The sponge dough and brew processes are the mostly widely used by large commercial bakeries; straight dough processes are used for a few types of variety breads only.
Sponge Dough: The sponge dough process is the most common form of bread production. In a sponge dough process, the sponge is allowed to ferment for several hours, after which the remaining flour and water are mixed in. The dough then stands for an additional 40 minutes to relax before it is molded and divided to the individual loaves and put into pans on a tray conveyor. The panned dough are first conveyed to the proofing box, a humid chamber (100°F) where the dough are allowed to rise to the desired volume. Most breads are baked for approximately 20 minutes around 450°F, although some are baked for as little as 8 minutes. In the sponge dough process, 99% of the total VOC emissions occur during baking. Brew: The liquid brew, or preferment process, allows for somewhat easier material handling. It differs from the sponge dough process primarily in that the initial mixture is a slurry containing only yeast, yeast food, and water, with little or no flour. Liquid brews are especially well-suited for continuous bread baking operations.
3 Proof time is analogous to “rising time” of the bread before baking.
- 13 -

Straight Dough: The straight dough process is similar to home baking in that all of the ingredients are mixed together to form the dough in a single step. Straight dough are primarily used for sourdough and specialty breads. In the straight dough process, 75% of the total VOC emissions occur during baking.
Each bakery uses versions of these processes in accordance with its production equipment which further varies for each individual type of product.
Generally, large commercial bakeries operate one very large oven for baking high-volume products and one or more smaller ovens for producing short-run specialty breads. Large ovens have three basic configurations: tunnel oven, single lap oven, and a Lanham oven. Each oven is also equipped with a purge stack for discharging residual oven gases prior to burner ignition each day. The damper for this stack is normally closed during baking. When an oven is first installed, it takes approximately two weeks to balance the airflows before it is ready for production. Turbulence in the exhaust airflow can cause unstable flames, extinguished burner flames, and lead to non-uniform lateral heat distribution throughout the zones. This may result in some undesirable quality problems with the bread, such as poor texture or poor flavor.
IV.A.3 Best Available Control Technologies and Emissions A number of VOC control technologies to reduce emissions from commercial bakery ovens exist, including thermal incineration, catalytic incineration, carbon absorption, scrubbing, condensation, biofiltration, and process changes. Each control technology requires an exhaust system ducting all stacks in multi-stack ovens through a single plenum for delivery to the control device. Incinerators were the most effective means of controlling exhaust streams with relatively high concentrations of organics. During the SCAQMD rule action period, only two control technologies were considered in estimating costs: regenerative thermal oxidation and catalytic oxidation. Although other technologies could be used, these two technologies appeared to be the most economically and technologically feasible. Implementation of Rule 1153 was expected to reduce VOC emissions from bakery sources by 83%, or by 3.4 tons of VOC per day.
Total bread production for the 30 bakeries that were potentially impacted by this rule in 1989 (which included the 24 that were part of the SCBAQA survey) was estimated at 446,700 tons/year. Total emissions were 1,077 tons/year (4.1 tons/day), and the desired total emission reduction target was 3.4 tons/day. In 1989, overall reduction efficiency was 83%. Bakery ovens that emitted less than 50 pounds of VOC per operating day were exempt from this rule.
IV.A.4 Cost Effectiveness for Ex-Ante Evaluation Cost estimates related to the implementation of Rule 1153 were developed by both SCAQMD and industry. These estimates are summarized below.
Cost-Effectiveness Scenarios Developed by SCAQMD SCAQMD performed cost calculations for nine different size ovens, of which is developed best estimates for construction, maintenance, and operation costs. For the
- 14 -

regenerative thermal oxidation option, cost effectiveness estimates ranged from $760 to $26,600 per ton of VOC reduced.4 Conversely, the cost-effectiveness estimates under the catalytic oxidation strategy varied from around $1,064 to $21,300 per ton.
Using these estimates, along with the distribution of oven size throughout the Basin, Basin-wide estimates of total costs and emissions reduction were calculated for each strategy. These estimates resulted in an average per ton estimate of $2,400 and $3,100 for the regenerative thermal oxidation and catalytic oxidation strategy, respectively. SCAQMD assumed that the implementation of Rule 1153 was expected to have minor price impacts, ranging from 0.09 to 2.28 cents per pound of bread baked. Basinwide annual compliance costs were $2.02 million to $2.69 million, respectively, depending on the selected control strategy.
Cost-Effectiveness Scenarios Developed by Industry On the industry side, only the costs associated with the catalytic oxidation were estimated. The Southern California Bakers’ Air Quality Association (SCBAQA) and some other companies also submitted their own cost estimates. Industry wide average cost effectiveness was estimated to be $6,100 per ton of VOC reduced.
There are many reasons for the differences in the ex ante cost estimates. For instance, given the different number of bakeries that each agency evaluated (30 for the SCAQMD and 24 for the SCBAQA), they assumed a different average oven size for the Basin. They also assumed different % heat exchange, emission factors, exit temperatures of stack emissions, heat recovery, time of operation, and cost of natural gas.
The bakery industry also had a regional economic analysis performed that would be similar to a social accounting matrix or input-output approach using regional multipliers. First, they estimated that bakery production has direct impacts on local communities in the SCAQMD Basin. Based on multipliers from a 1984 model (and in 1984 dollars), $640 million dollars worth of bakery products were produced (output) for the year of 1984. In 1984 the bakery industry employed about 10,000 persons in the Los Angeles Basin. The specific regional multiplier model categorized the region into 66 sectors. The direct effects of the proposed control measure are the annual operating costs of $204,500. The indirect effect of compliance with this control measure was to be $186,990 (in lost output). Income loss from lower wages and/or lost jobs was estimated to be $67,783. They estimated that for every job gained or lost in the bakery industry, an additional 2.8 jobs are generated or lost in other industries. When the total economic impact is considered, wages and salaries totaling $100,903 are lost due to compliance, $34,788 of which is directly linked to the bakery industry.
IV.A.5 Cost Effectiveness for Ex-Post Evaluation This rule controls volatile organic compound (VOC) emissions from commercial bakery ovens with a rated heat input capacity of 2 million BTU per hour or more and with an average daily emission of 50 pounds or more of VOC. For a bakery with average daily
4 As mentioned above (Section I.D), all dollar cost estimates are in 2004 dollars unless otherwise noted.
- 15 -

VOC emissions between 50 and 100 pounds per year, the VOC emissions must be reduced by at least 70%. For bakeries emitting over 100 pounds per day of VOC, the emissions must be reduced by at least 95%.
The baking industry has undergone considerable consolidation since the implementation of this rule. Thirty bakeries were listed as potentially being affected during the initial rule making process over 10 years ago. During this same time period, the SCBAQA identified 24 bakeries that would be potentially impacted by the rule. Contact was made with over 20 bakeries in the Southern California area and in the final analysis, 5 companies representing 7 bakeries that were impacted by Rule 1153 agreed to participate in our study. Some of the businesses agreed to participate only if there was a degree of confidentiality provided, and thus, individual bakeries’ data will not be divulged in this report. It should be noted that only about 10 to 12 companies of the approximately 30 companies that were potentially affected by this rule are still in business. Conversations with the 5 companies suggest that other bakeries shut down or consolidated due to inefficient practices.
Appendix A shows the list of Bakeries that were attempted to be contacted during this study, and the progress made from that attempt. The five companies that agreed to participate are:
• Freund Baking • Interstate Brands • Kroger • Entemanns/Oroweat Bakery (Bimbo) • Fresh Start Bakeries
These five companies represent 7 bakeries with 17 ovens, venting into 11 catalytic oxidizers. The industry as a whole chose to install catalytic oxidizers instead of thermal oxidizers. This is consistent with pre-rule thinking of several industry experts. These 7 bakeries represent slightly more than 50% of the estimated pre-rule throughput of 446,700 tons/year of bread baked.
The aggregate cost of these 11 catalytic oxidizers is over $6 million, with the average cost being just over $550,000 per oxidizer. The least expensive oxidizer was installed in 1994 at a cost of $441,500, and one of the most expensive was installed in 1993 at a cost of $851,500. About half of the oxidizers have 2 ovens venting into them, while the others are tied to only one oven. Nine of the oxidizers are manufactured by CSM Worldwide Corp., and the other two by Anguile oxidizers. The total ex ante capital costs provided by the SCAQMD for the catalytic oxidizers ranged from $589,360 down to $173,750 depending on oven size, whereas the Industry’s ex ante estimates of capital costs for a catalytic oxidizer ranged from $747,800 to $625,500. As it appears, the industry’s estimates are slightly higher than the ex post estimates, while the District’s estimates appear to be slightly on the lower side of the ex post estimates.
- 16 -

The bakeries that are fully utilized and operating at a high throughput present the best cost-effectiveness estimates by having the largest output. Four of the companies (representing 6 bakeries) show a minimal cost per pound of bread, at less than $0.01 per pound of bread baked. However, the other companies do not have as large a throughput to spread the cost over, and they spent essentially the same amount of money to comply. Their cost of compliance was $1.75/lb of bread baked. Compared with the ex ante estimates ($0.09 to $2.28), and assuming all real price differences are due to cost changes from implementing these technologies, the Districts ex ante estimates are certainly in line with the ex post estimates.
Only two companies provided emissions data. The cost of compliance per ton of VOC reduced ranged from about $400/ton to just over $1,250/ton VOC reduced. These estimates are considerably lower than both the District’s and Industry’s ex ante per ton average estimates - $3,100/Ton VOC reduced and $6,100/Ton VOC reduced, respectively.
IV.A.6 Conclusions In developing this rule, the District consulted APC vendors and regulated industries for their cost estimates during rule action. The District performed a survey of the impacted industries. It tried to quantify ethanol emissions and determine the number, types and characteristics of bakery ovens operating in the Basin. Performing a survey prior to rule preparation offers more tangible and immediate benefits for both policy makers and stakeholders. Surveys and studies conducted prior to rule action offer opportunities for significant findings leading to modifications to the proposed rule and avoidance or mitigation of possible adverse impacts on the regulated community. Such efforts appeared to have very useful in aiding the District in its efforts to develop as accurate an ex ante cost estimates as possible. Yet, there were many parameters and assumptions that were valid in the construction of the cost estimates to create the justified differences in the ex ante cost estimates of the Industry relative to the District. As shown above, Industry ex ante estimates were higher than the District’s estimates.
The results from our efforts to estimate the ex post costs of this rule suggest that considerable bakery industry consolidation has taken place in the past 10 or more years. Some of this might be attributed to increased regulation (like Rule 1153) driving the older and less efficient bakeries out of business. Other factors might include some companies purchasing competitor operations and running more than one bakery in the basin. There has also been a small amount of decentralization in the industry, with specialty operations, primarily in large chain grocery stores moving from the centralized bakery into the actual stores. Some grocery store centralized bakeries were sold, or shut down, and smaller, non regulated ovens were started up in individual grocery stores to make specialty products (fresh bread baked on premises). Although probably not a significant factor in VOC emissions, directionally this points to a potential weakness in the regulation where smaller operations can avoid regulations.
On the other hand, as indicated, this industry has gone through considerable consolidation, and that may have a significant impact on a surviving Company’s
- 17 -

profitability, and throughput, and thus the ex-post versus ex-ante differences. If consolidation resulted in larger firms, economies of scale might have resulted thereby lowering the overall average costs of production. Yet if more consolidation resulted in less competition, perhaps some monopolistic power resulted thereby encouraging firms to produce at a level greater than would occur under perfect competition; hence, increasing marginal costs of production could suggest higher per lb costs after consolidation. Analyses of these issues extend beyond the scope of the present research yet future ex ante analyses may want to consider, and in the very least enumerate, the potential effects of such consolidation.
Results from this study indicate that although the industry spent considerable capital to comply with this regulation, the overall cost per pound of bread baked was insignificant for fully utilized bakeries. The average cost of the catalytic oxidizers the industry installed was over $550,000. The estimated cost of this regulation per pound of bread baked ranged from an insignificant $0.01 for a fully utilized bakery to a much more significant $1.75 for a smaller, lower production bakery.
Emission data was obtained from only two companies, but the results indicate that the cost per ton of VOC reduced is quite low compared to the ex ante estimates. The per unit costs of VOC reduction ranged from $400/ton to just over $1,250/ton, compared to industry estimates of $6,100, and the District estimate of about $3,100.
- 18 -

IV.B. CASE 2 – SCAQMD RULE 1173
CONTROL OF CHEMICAL LEAKS AND RELEASES FROM COMPONENTS AT PETROLEUM FACILITIES AND CHEMICAL PLANTS
IV.B.1 Background Rule 1173 was developed to implement Air Quality Management Plan (AQMP) Control Measure Number 88-B-13 and reduce fugitive emissions of reactive organic compounds (ROC) from specified components at affected facilities. These facilities are refineries, chemical plants, oil and gas fields, natural gas processing plants, and pipeline transfer stations operating within the South Coast Air Quality Management District jurisdiction. Equipment subject to leak control includes valves, pumps, compressors, pressure relief devices, diaphragms, fittings, sight-glasses, and meters. Going beyond AQMP Control Measure Number 88-B-13, the Rule provides additional reductions in ROC emissions. It also provides more stringent, uniform and clear definitions.
An allowable number of leaks is a “good performance” standard for each type of equipment at a given facility. All liquid leaks over 3 drops/minute or gross leaks for gases of over 50,000 PPM are violations of the Rule when detected by District inspections. Leaks detected must be fixed within a specified time period that depends on the severity of the leak. All facilities are required to permanently identify relevant pieces of equipment, and use a specific identification method for submitting inspection records to the District. Compliance with the Rule was scheduled for February 1991.
Fugitive reactive organic compound emissions from pumps, compressors, valves, and pressure relief valves in refineries, oil and gas production fields, and chemical plants had been under District Rules 466, 466.1, and 467 for over a decade. Rule 1173 expanded the list of equipment and affected facilities; provided more stringent and uniform leak control requirements and improved inspection, maintenance, and record keeping by the operator. The rule was also designed to meet or exceed the requirements of the Environmental Protection Agency (EPA) and eliminate other deficiencies found in existing District rules.
Emissions from valves and pumps generally depend on the type of fluid (light or heavy) processed, component size, inspection frequency, operating conditions and other parameters of lesser significance. Control of valve leaks can produce a significant amount of emission reductions because of the large population of valves involved. Compressors, which operate at higher pressures, generally show highest emission rates; yet their numbers are fewer. Hatches, sight-glasses, meters, and fittings usually generate less leakage. They require regular inspection and maintenance for leak-free operation.
Three sources of information on fugitive ROC in refineries supported the Rule during the rule action period. The Radian Corporation conducted an analytical study for CARB in 1986 to evaluate fugitive emissions and factors contributing to such emissions throughout
- 19 -

California. The study concluded that significant uncertainties existed in emission estimates from the database then available. Another finding was that refineries differed significantly in the number of leaking components. Emissions from non-exempt components had already been reduced by about 50% under pre-existing rules. At that time, these exempt components produced 40% to 80% of all fugitive refinery emissions.
The second source was the 1989 AQMP Control Measure Number 88-B-13. The 1989 AQMP had recommended further development for control of fugitive ROC. In 88-B-13 the control methods included use of equipment less prone to leaks, more stringent enforcement, self-auditing by operators, and the use of methane as a calibration compound for the measurement method. In the 1989 AQMP, fugitive ROC amounts were estimated in the District’s air basin at 12.7 tons/day. Potential emission reduction under investigations was 11.4 tons/day. Average cost effectiveness, excluding valves in heavy liquid service, was found to be $15,000 per ton of ROC reduced.
The District conducted its own study in 1988 with the cooperation of affected refineries. Pieces of equipment under the leak control rule were surveyed at 13 refineries in the District. ROC emissions from valves, pumps, compressors, and pressure relief valves in refinery service within the District jurisdiction were estimated to be about 9.5 tons/day.
Rule 1173 was adopted on July 7, 1989, and amended on December 7, 1990, May 13, 1994, and December 7, 2002 as part of the State Implementation Plan (SIP).
IV.B.2 Air Quality and Best Available Control Technologies Rule 1173 was enacted to reduce liquid and gaseous leaks from specified pieces of equipment in refineries, chemical plants, oil and gas production fields, natural gas processing plants, and pipeline transfer stations.
Commercial Natural Gas has been defined as a mixture of hydrocarbons with at least 80% methane, and less than 10% ROC. EPA recommends a limit of 1% (by weight) VOC in their Control Technology Guidelines. However, EPA also defines ethane as an “exempt” compound. Since the District does not exempt ethane it is included in the 10% ROC as defined in Rule 1173.
For purposes of identification, pieces of equipment are subdivided into major and minor categories according to detectable emission levels. This distinction reduces the identification burden on operators without compromising emission reductions. A 10,000 PPM threshold has been selected for the definition of major gas leaks, for all types of equipment except pressure relief devices (PRD). Their level is set at 200 PPM. The 10,000 PPM threshold was arrived at using data obtained from surveys conducted by the District as well as following EPA’s standards.
Available control technologies are valves, pumps, compressors, and pressure relief devices which are inspected and maintained on a regular basis. These pieces of equipment are identified and tracked. Records of inspection, repair, and replacement are kept.
- 20 -

IV.B.3 Emissions and Emission Reductions For Rule 1173, ROC will be used synonymously with ROG and VOC. Fugitive ROC emissions are dependent on the number of pieces of equipment present and on typical emission factors. These numbers are estimated from data compiled from a District database.
Rule 1173 was expected to affect approximately 18 refineries, 60 chemical plants, 300 oil and gas production fields, and 10 natural gas plants and pipeline transfer stations. The distribution of fugitive emissions among these facilities is as follows:
• Refineries - 60% • Chemical plants - 20% • Oil and gas production fields - 15% • Remaining facilities - 5%
The contribution of refineries for rule-affected equipment was estimated at 10 tons/day, with fittings, hatches, sight-glasses, and meters producing 5% of this amount. The total annual emission reductions were estimated at 13.4 tons/day. Significant emission reductions can be achieved by correcting gaseous leaks above 10,000 PPM, measured as methane above background. Such leaks, called “major gas leaks,” result in nearly 80 to 95% of emissions from any particular type of equipment.
IV.B.4 Cost Effectiveness for Ex-Ante Evaluation Control costs, estimated by the District for equipment such as valves, pumps, compressors, and pressure relief devices, were $5,445 for an inspection, $1,602 for repair and $20,352 for replacement.
Inspection costs were based on a labor rate of about $25 per hour, and average inspection time of 10 minutes for valves and small components, and 15 minutes for pumps, compressors, and PRD. Component repair costs were calculated assuming that 5% of the total equipment population inspected needing repairs, with an average expenditure of 1 man-hour for each repair.
In the Staff report, the total cost for the program was estimated at $27.4 million. This number included a 20% additional cost contribution for other components, such as fittings, sight-glasses, meters, and hatches, and an overhead of 10% for identification, recordkeeping, etc. The total cost of the program to affected facilities in the District was calculated as $36 million, with a cost-effectiveness of $7,400 per ton ROC reduced.
During the development of Rule 1173 no estimates of its cost effectiveness were prepared by the industry. There were some public comments about the rule, mainly about technical feasibility. They were made by the Western States Petroleum Association, the Southern California Gas Company, Chevron USA Inc., Chevron Chemical Company, PPG Industries, Inc., Kaman Sciences Corporation, the U.S. EPA, and CARB.
- 21 -

IV.B.5 Cost Effectiveness for Ex-Post Evaluation SCAQMD sent the study team a list of permitted facilities which included 74 petroleum facilities. Telephone calls to all 74 facilities were made in November 2003. Only eight expressed interest in cooperating.
Three months later, however, and after several phone conversations, several fax messages, and emails, no data had been collected due to lack of cooperation from the stakeholders. Many of the smaller scale facilities said that the rule imposed very expensive record-keeping and that, due to limited budgets, they were unable to organize and compile data in a manner amenable to analysis. Appendix B contains documentation on the efforts to collect ex post cost data.
Efforts to estimate ex post costs from secondary sources were unsuccessful as well. Any pollution control expenditures associated with the SIC code for this industry would also include control costs from a myriad of other regulations (e.g., AQMP Control Measure #88-B-13). Hence, using such sources as the PACE survey would be unproductive. Finally, since the equipment is not necessarily air pollution control equipment, but rather necessary pieces of equipment in the production of the good, the survey of APC manufacturers would not be useful. Hence, without additional time and experts with contacts in this field, we are unable to collect information on ex post costs for this rule.
Another attempt to determine ex-post costs was made in March 2005 with limited success. Again, many facilities were reluctant to share information with the team, and in the final analysis, only 4 different companies agreed to participate. Of these 4, only 2 provided meaningful data. Both facilities requested that their company names not be used in this report, and that request has been honored.
Both facilities are refineries, with Refinery A being one of the larger facilities in the South Coast Basin, and Refinery B being a medium sized refinery. Both facilities indicated that they spent a considerable amount of time and money to comply with the rule, both in capital expenditures and on-going maintenance costs. Refinery A spent between $85 million and $90 million in capital projects to comply, and about $2 million the first year of the rule implementation to a contractor for tagging, and monitoring affected equipment. They spend about $800,000/year presently for the monitoring services (not including maintenance costs). Refinery B indicated they spent something between $5 million to $10 million for capital projects and approximately $1 million for the tagging and monitoring of equipment the first year.
The capital costs included factors such as replacing packing in pumps with mechanical seals, changing gasket materials on flanges, installing rupture discs under pressure relief valves, and replacing or connecting relief valves to a closed system.
- 22 -

IV.B.6 Conclusions Because data from only 2 facilities was obtained during this study, any conclusions drawn from this analysis must be considered in that light. The sample size is clearly not sufficient enough to give a broad understanding of the impact of the Rule’s implementation. That being said, there are some general conclusions that can be drawn from the data collected.
As with most other business sectors, the petroleum industry has certainly undergone considerable consolidation since the implementation of Rule 1173. This has been primarily due to market forces, but nevertheless, it can impact the ex post costs a company is willing or able to pay. Clearly the ex post costs of just these two refineries overwhelm the ex ante estimates of $36 million for the entire basin. By far the biggest contributor to the capital cost for Refinery A was the pressure relief valve project. Refinery A’s management chose a conservative path and decided to connect all pressure relief valves that released to the atmosphere, into closed systems, and the recollection of the individuals involved is that that was the requirement of Rule 1173. In a conversation with the refinery manager at the time of the rule implementation, he stated that the decision was made to connect the refineries atmospheric relief valves to closed systems specifically due to Rule 1173. Currently the rule states that if a relief valve leaks or relieves more than 500 pounds of VOC twice in a 5 year period of time or more than 2,000 pounds of VOC in a 24 hour period, it has to be connected to a closed system, or a substantial fine ($350,000 per occurrence) can be paid. Again, Refinery A made the choice to spend the money and “over comply” it appears.
Refinery B did not choose to connect all atmospheric relief valves into a closed system, but did spend between $5 and $10 million for other compliance issues. In a conversation with the ex-refinery manager of Refinery B, he stated his facility decided to accept additional risk and comply with the minimal capital expenditure due to their smaller size and lower capital resources.
This Rule did allow the facility’s management some latitude in interpretation, and thus each company’s risk management philosophy had some impact on the final ex-post costs. However, it appears from these two data points, that independent of risk management philosophy, the district did considerably underestimate the cost to comply from a capital investment perspective. However, as noted earlier, one factor driving the high cost is the decision by the larger refinery to simply connect all relief valves into a central system, which significantly exceeded the direct requirements of the rule. One could interpret this decision as an indication that these extra expenditures could be made without substantially impacting the profitability of the operation.
In any case, there is nothing in the ex-ante cost estimates that forecasts interpretation of a rule or risk management principles. Likewise, consolidation of the industry, such as observed in this case, can also have an impact in terms of cost per pound of pollutant removed.
- 23 -

IV.C. CASE 3 – SCAQMD RULE 1174
CONTROL OF VOC EMISSIONS FROM THE IGNITION OF BARBECUE CHARCOAL
IV.C.1 BackgroundRule 1174 applies to manufacturers, distributors, and/or retailers of materials and/or methods used to ignite barbecue charcoal. Emissions of volatile organic compounds (VOC) contribute to the formation of surface-level ozone. To attain federal and state ambient air quality standards for ozone, the SCAQMD investigated the control of sources which had not been previously targeted.
Air Quality Management Plan (AQMP) Control Number D-1 “Control of Emissions from Starter Fluid (ROG)” considered emissions from starter fluid used with barbecues. In the control measure, several approaches to reduce emissions were considered:
• Prohibit the sale of barbecues which require lighter fluid • Require lighter fluid manufacturers to reformulate with less photo chemically
reactive constituents • Restrict use of lighter fluid on episode days • Discourage use of lighter fluid in general through a public information program
Reactive organic compound emissions (ROG) from the use of charcoal lighter fluid in 1985 were estimated to be about 2 tons/day. The AQMP at that time projected emissions in year 2000 at 2.5 tons/day. Based on an overall 50 percent control efficiency, the control measure was designed to reduce annual emissions by 1.3 tons/day by year 2000.
Rule 1174 establishes a limit of emissions resulting from the ignition of barbecue charcoal. Any of a number of methods could be used to control the volatile organic compound (VOC) emissions, not ROG which was the focus of the AQMP, from ignition of barbecue charcoal as long as it received certification as a low-polluting method. Certification required that the demonstration that the VOC emissions resulting from the ignition of barbecue charcoal will be less than a baseline of 0.02 pound VOC per start. The following methods and materials used to ignite barbecue charcoal were exempt from certification requirements:
• Electric starter • Chimney with paper tinder • Propane • Natural gas
The District’s jurisdiction represented only 6.1% of the charcoal lighter fluid market. To prohibit the sale of this volatile substance in the same area would lead to industry revenue losses estimated to range from $3.3 to $8.4 million per year. Implementation of Rule
- 24 -

1174 was expected to result in average VOC reductions of 2 to 2.5 tons/day. During peak barbecue season (summer), VOC emissions were approximately 4 tons/day.
IV.C. 2 General Description of the Rule Rule 1174 prohibits the supply, or sale, of materials or methods used to ignite barbecue charcoal unless they can be demonstrated to not generate emissions exceeding 0.02 pound VOC per start. According to the rule, manufacturers, retailers and/or distributors must provide the certification of a test which establishes the emissions level. They must clearly state the testing method or material, and label their product to show compliance. Subsequent material and/or method reformulation require recertification as well.
According to a SCAQMD technical report, implementation of rule 1174 would not result in any significant impact to the industry. Nonpolluting and inexpensive charcoal ignition methods are available, allowing consumers to continue barbecuing. The industries directly affected by the rule included manufacturers of charcoal lighter fluid, ready-to-light charcoal briquettes, gel starters, and solid starters. Other entities possibly affected were general merchandise and food stores, and consumers. Also affected were the manufacturers of charcoal lighter fluid, self-lighting charcoal, wax-coated charcoal, and bag-light charcoal such as Clorox Corporate, located in the Bay area, Boyle-Midway, located on the east coast, and Royal Oak Enterprise, Inc., located in Oregon and Missouri. The percentage of sales in the Basin varies by company, ranging from less than 1% for Royal Oaks Enterprise, to approximately 6% for Clorox Corp. The only affected manufacturer in the South Coast Air Quality Basin was Meteor Inc., located in Monrovia, California and a manufacturer of electric probes and metal chimneys.
Rule 1174 was adopted on October 5, 1990. Compliance with the rule was to be effective on January 1, 1992.
IV.C.3 Air Quality and Best Available Technologies for the Rule A 1990 EPA report entitled “Estimation of Emissions from Charcoal Lighter Fluid and Review of Alternatives” estimated that 14,500 tons of VOC are emitted annually in the U.S. from evaporation and combustion of lighter fluid. Using population as a conversion factor, one can derive an estimate of 2 tons of emissions per day. For emissions from lighter fluid evaporation only, industry estimated emissions of 0.038 tons per day in the Basin. The SCAQMD supported an average estimated value for emissions from evaporation and combustion of 2 tons of VOC per day.
In 1990 SCAQMD conducted a study to assess VOC emission levels from the ignition of charcoal briquettes with various ignition methods. Two tests were performed. The first test consisted of 21 sampling sessions with lighter fluid, an electric charcoal lighter, and treated wood chips. The second test consisted of an improved testing configuration with lighter fluid, an electric charcoal lighter, treated wood chips, paraffin cubes, gel, a chimney charcoal lighter, and a portable propane gas grill in 44 sampling sessions. VOC emissions levels were relatively consistent throughout the testing sessions. The highest levels occurred with the lighter fluid ignition method. Lowest VOC emissions were observed with the electric, chimney, and propane ignition methods. Emissions from wood
- 25 -

chips and gel ranged from 12 to 17 % of lighter fluid emissions. Paraffin cubes levels were about 24% of those of lighter fluid.5
IV.C.4 Emissions and Emissions Reductions VOC emissions from charcoal lighter fluid and other ignition materials and methods are difficult to quantify. Evaporative VOC emissions occur from the lighter fluid itself, and additional VOC emissions result from the combustion of saturated charcoal briquettes. Some ignition materials or methods, such as chimney with paper tinder and electric starters, do not produce evaporative emissions. Ignitions using these methods nevertheless result in emissions from the combustion of the charcoal itself. Self-starting materials such as presoaked briquettes and bag-light charcoal produce emissions from the volatile components of the briquettes or bag, and the combustion of the charcoal itself. The combustion of natural gas and propane also produce emissions.
Emissions estimates were calculated based on annual sales in the U.S. and the findings adjusted by a proportional population factor. An evaporation rate of 10 to 25 % prior to ignition was assumed. Emission factors of 0.1 and 0.25 were used to generate two estimates. ROC emissions from fluid were 0.0813 lb/start. The density of lighter fluid was assumed to be the same as for kerosene. Using these assumptions and factors, the District estimated emissions to be between one and two tons per days.
IV.C.5 Cost Effectiveness for Ex-Ante Evaluation Table IV-1 lists the ex ante cost estimates developed by SCAQMD for a number of methods. The two least cost methods were chimneys with paper tinder and electric starters. A chimney, which resembles a metal stovepipe, can be purchased from retail stores or home-improvement centers for $16 to $23 each. Depending on size, an electric starter sells for $7 to $22. The average cost of lighter fluid was assumed to be $2.18 per quart. A final option that was considered was a freestanding or tabletop propane grill for outdoors cooking. The marginal cost of owning a 26,000 BTU propane grill was $171, a figure slightly less than twice the cost of conventional grills such as a freestanding barbecue kettle.
Converting from starter fluid to chimney or electric starters was estimated to add only 5 to 10% to the cost of charcoal per barbecue use. Barbecuing cost of using chimney and electric starters ranged from $0.87 to $0.94 while using a propane grill was from $0.17 to $0.62. Chimney and electric starters have the lower cost per use when compared to options of ready-to-light charcoal briquettes, lighter fluid, and solid and gel starters.
Data provided to the study team indicated that barbecuing with natural gas is the least expensive of the three alternatives and is less time consuming than barbecuing with charcoal briquettes. Charcoal barbecuing costs were almost thirty times more than natural gas barbecuing and propane barbecuing was almost three times more.
5 SCAQMD. Report on Pollutant Emissions Resulting from Various Methods of Igniting Charcoal Briquettes, El Monte, California, October 6, 1989.
- 26 -

Table IV-1. The Total Cost per Use of Alternative Controls (2004 dollars)
Alternatives Average Cost of Equipment
Capital Cost/Use
Cost of Materials/Use Total Cost/Use
Chimney Starter $22.30 $0.15 $0.80 $0.94 Electric Starter $16.05 $0.07 $0.80 $0.87
Free-Standing Propane Grill (40,000 Btu) $275.50 $0.62 $0.62
Free-Standing Propane Grill (26,000 Btu) $171.00 $0.38 $0.38 Tabletop Propane Grill $43.50 $0.17 $0.17
Self-starting Charcoal in Bag $2.31 $2.31 Self-starting Charcoal $1.55 $1.55
Charcoal Briquettes with Solid Starter $1.33 $1.33
Charcoal Briquettes with Lighter Fluid $1.02 $1.02
Charcoal Briquettes with Gel Starter $1.00 $1.00 Source: The staff’ report of Rule 1174, 1990.
According to the District, Rule 1174 affects manufacturers, distributors such as general merchandise and food stores, and the consumers of starter fluid. However, the manufacturers of these products are not located in Southern California. For that reason implementation of Rule 1174 was not expected to have an adverse economic impact on local industries. Distributors can alternatively sell low-emitting substitutes such as electric and chimney starters.
In the rule making process, industry was represented by the Barbecue Industry Association (BIA), a group of manufacturers of charcoal, grills, lighter products and other accessories for backyard barbecuing. The BIA provided some comments about SCAQMD’s Environmental Assessment Report (EA) and its technical feasibility. While the study team did not find any ex ante cost estimates for comparison, two complaints were filed by the BIA. First, the BIA suggested that the SCAQMD EA did not consider the cost of retrofitting and replacing recreational barbecues. In a letter provided to the District, BIA claimed that based on the need for a durable and permanent barbecue at park and recreation sites, the costs to install these grill would easily exceed $1.5 million. We found no comment from the District contending this claim. Second, the BIA made claims that the District’s ex ante estimates were likely too conservative since the method of estimating emissions was flawed and lead to an overestimate of current emissions (this would lead to a greater reduction in emissions thereby lowering the average costs of emissions reduction). Coordinated efforts between the District and a large industry representative, Kingsford, eventually led to an agreed upon usage estimate of approximately 550,000 gallons in 1988. Hence, the rule went forward with essentially only cost estimates from the District.
- 27 -

IV.C.6 Cost Effectiveness for Ex-Post Evaluation Adoption of Rule 1174 by the South Coast Air Quality Management District required owners of charcoal fueled barbeque grills to take one of five steps. They could:
• Purchase approved low emitting lighter fluid or self-starting briquettes for starting their grills.
• Purchase a chimney starter that required waste paper to start their grill. • Purchase an electric starter to start their grill. • Convert to a propane fired grill. • Convert to a natural gas fired grill.
When the study team contacted SCAQMD for permitted and/or registered facilities list, the district sent a list of approved manufacturers for Charcoal Ignition Products in Southern California under Rule 1174. In the list, 93 companies are identified by name, but no telephone number or contact name were listed. Initial efforts to compile this contact information via other routes (e.g., the internet) resulted in virtually no information. Following a first round effort to contact potentially affected companies resulted in a mere four companies indicating they were willing to participate. After several follow up calls, no data was collected from these companies. Appendix C details the effort to collect ex post cost data.
Subsequent efforts were more fruitful. Information on viably certified strategies is presented below.
Liquid Starters At the time of rule adoption there were no complying lighter fluids. However, within two months of adoption of the rule, the major producers of lighter fluids announced complying liquids. The complying liquids were marketed at the same price as the original liquids at the time of introduction based on a brief survey by the author near the time of rule adoption (Lents 2005). Thus, to the consumer there was in essence no additional cost to purchasing approved low emission lighter fluid. This does not guarantee that there was no cost increase to producing the fuels. The producers could have believed that an increase in cost would jeopardize sales and thus they absorbed the cost and realized lower profit margins on this product. It is overwhelmingly likely, however, that liquid manufacturers continued then and today to make an adequate profit or they would have discontinued producing the liquid starters.
Manufacturers were contacted seeking information on the process used to develop complying liquids. They provided no information on the reformulation process or associated costs after repeated contacts. They did indicate that they complied by adding heavier hydrocarbons to the mix to reduce volatility. These statements indicate that the compliance issue involved some initial fuel reformulation, which could be spread over the long term with little or no additional cost. A survey was carried out to establish present cost for approved liquid starter fuels to see if values have changed significantly from the SCAQMD’s initial studies. Table IV-2 presents pricing for the fuels.
- 28 -

Table IV-2: Retail Pricing of Charcoal Grill Liquid Starting Fuels (1994$) Retail Outlet Size Low End Price (per oz) High End Price (per oz)
Vons Grocery Store 32 oz $0.0859 $0.1091 Ralphs Grocery Store 32 oz $0.0622 $0.0997
Albertsons Grocery Store 32 oz $0.0747 $0.0934 Wallmart Store 32, 64 oz $0.0459 $0.0378
Average $0.0672 $0.085
As can be seen in table IV-2, there is considerable variation in the price of complying liquid fuels; however, the range of present prices includes the price originally used by the SCAQMD at rule adoption. According to the Kingsford web site (www.kingsford.com), 2 ounces of liquid starter are required to start a typical barbeque grill and recommend that the briquettes be stacked to speed up the lighting process. Kingsford also indicates that it should take 20 minutes for coals to be ready to use and recommends 1.5 pounds of charcoal for a typical grilling (1 pound of meat). The website www.ehow.com indicates that 4 ounces of starter liquid should be used to start a typical grill, that it requires 30 minutes for the charcoal to be ready to use, and that a typical grilling will require 2 pounds of charcoal. An antidotal check of persons who use liquid starters suggest that an amount on the order of 4 ounces is more typical with little stacking of the briquettes due to the hand soiling that they cause. The SCAQMD appears to have assumed that 16 ounces were typically used to start a barbeque. This seems to be high based on the more recent data collected. For this analysis a conservative 2-4 ounces per start will be used. Based on data in table 3.2 and assuming 2 ounces to 4 ounces of fluid per start results in an estimate of a cost range to start a barbeque of $0.134 to $0.340.
Chimney Starters Chimney starters were available, although not widely sold, at the time of adoption of Rule 1174 and were defined in the rule to be automatically compliant with the rule at the time of adoption. There was some effort at the SCAQMD to get retailers to feature chimney starters shortly after rule adoption since they produced lower emissions than complying liquid starters. Initially, chimneys were readily available in most retail outlets in the South Coast Air Basin. In the recent survey to establish liquid fuel costs, chimneys were found to be available only at a few local retail outlets, perhaps because it was the winter season at the time of the survey. The Home Depot did offer chimney starters. Chimney starters are widely available through web marketers. Table IV-3 indicates the cost for chimney starters found on web sites. These costs are comparable to the Home Depot price of $14.95.
Table IV-3: Advertised Cost of Chimney Starters Brand Cost
Charcoal Companion by Kodar $14.95 Chimney by Cummins Industrial Tools $9.99
Charcoal Chimney by Onward Manufacturing $11.09 Chimney by USA Hardware $14.99
Chimney by Weber $15.99 Sears Chimney $12.99
Average $13.33
- 29 -

It should be noted that the value originally assumed by the SCAQMD during the original rule making was $22.30. This significantly exceeds the present cost of the chimneys indicating that improvements in the manufacturing process have reduced the cost over time. While there were no studies available on the life of a chimney starter, they are typically made of heavy gauge galvanized metal with no moving parts and should be expected to last for 20 years with reasonable care. This appears to be the value assumed by the SCAQMD in its original analysis. If it is assumed that the typical charcoal grill owner barbeques 8 times per year (the SCAQMD chose a similar value), then the per use cost of starting the charcoal would be between $0.0624 and $0.100 assuming that the waste paper used in the burning process has no commercial value. This is somewhat cheaper than the use of a liquid starter. However, since it requires a higher initial outlay of cash and is a little more difficult to store it is easy to see how owners might default to liquid starters.
As an inducement to purchase chimney starters, producers argue that the chimney starters produce hot coals faster than liquid starters do. One producer indicated a charcoal ready to cook time of about 5 minutes (www.kountrylife.com). This, of course, would save time and thus produce time cost savings as well for users of chimney starters if it is true. It is also possible that the reduction in cost might have happened due to the change in the location of manufacturing. Manufacturers of the chimneys might have moved to lower cost areas. But no analysis has been made in this study.
Electric Starters Electric starters were available at the time of the adoption of Rule 1174 and were defined as complying with the rule. During the liquid fuel survey discussed above, electric starters were found to be available at only one of the retail outlets surveyed. They are available through the internet, however. Table IV-4 indicates the cost of electric barbeque starters found on the web.
Table IV-4: Cost of Electric Starters Brand Cost
Electric Lighter by Big Green Egg $23.99 Electric Starter by ME Heuck $14.99 Electric Starter by BBQ Guys $24.95 Electric Starter by Char-Broil $9.85
Electric Starter by Colorado Aggregate $8.99 Electric Starter by Grilling Depot $20.00
Average $17.13
The SCAQMD originally indicated a cost of $16.05 for the cost of an electric starter. This is well within the range of values found today and very close to the average. The difference in cost is likely due to inflationary increases. The fact that the prices did not drop as was the case for chimney starters is likely due to the fact that the technology used to produce electric starters is essentially the same as that for electric stove tops, which was well developed by 1990 when the rule analysis was being made. Only one source of electric starters indicated the wattage of the starter, which is 500 watts. This is a reasonable energy consumption rate and will be used for the analysis. As with the
- 30 -

chimney starter, electric starters have no moving parts and should be expected to last 20 years if properly cared for. No estimates were provided for the time it takes an electric starter to properly light a typical grill. It will be assumed that it requires the same as the liquid starter. Electricity costs in California averages $0.123 per kilowatt-hour at the time of this analysis. An electric starter running for 30 minutes will require 0.25 kilowatt-hours of power, which will cost $0.0308 per start. The cost of the grill using 8 uses per year over 20 years as for the case of chimney starters will range from $0.0562 to $0.156 per start. With electricity cost considered, the per start cost for an electric starter is between $0.087 to $0.194. Thus, the electric starter is also cheaper on a per use basis than the liquid starter. As is the case with the chimney, the electric starter does require an initial cash outlay and must be stored over multiple years. The electric starter must also be plugged in, which may indicate why they are not more popular.
Gas and Electric Grills Gas and electric grills were defined as compliant with Rule 1174 at the time of rule adoption. The sale of gas and electric grills has surpassed charcoal grills in recent years as shown in Figure IV-1 (http://hpba.org). Beginning in 1985 and before Rule 1174 was adopted, the annual number of gas and electric grills sold increased while the annual number of charcoal grills sold decreased. Since 1995, the number of gas and electric grills sold exceeded the number of charcoal grills sold. Since this trend was already in progress at the time of adoption of Rule 1174, it is doubtful that the rule caused this trend. As noted earlier, Rule 1174 did not directly impact consumer costs associated with use charcoal grills.
The Southern California Gas Company indicates that 59% of barbeque grill owners use gas grills. The typical energy consumption of a smaller sized gas grill is about 25,000 BTU. Natural gas cost varies but residential gas costs are about $10 per million BTU (www.eia.doe.gov). Operation of a gas grill for 45 minutes will thus cost about $0.19. An equivalent charcoal grill will use about 2 pounds of charcoal. The cost of 2 pounds of charcoal plus the cost to start the charcoal burning will run about $1.20. Thus operational cost of a gas grill is much lower than those of a charcoal grill. The annualized cost of the gas grill itself will be about $1.87 per use. The annualized cost of the charcoal grill itself will be about $0.43. Both calculations assume 160 uses over the life of the grills. Thus, the use of a natural gas grill will run about $2.06 while a charcoal grill will cost about $1.63 with all costs included. Thus, the use of a charcoal grill overall will be cheaper but more time consuming due to the need to light the charcoal briquettes.
- 31 -

'\__ -- -"--- / ----
I-
4,000,000
6,000,000
8,000,000
10,000,000
12,000,000 A
nnua
l Sal
es
-
2,000,000 19
85
1986
1987
1988
1989
1990
1991
1992
1993
1994
1995
1996
1997
1998
1999
2000
2001
2002
2003
2004
Year
Charcoal Gas&Electric
Figure IV-1. Annual Sales of Charcoal and Gas/Electric Grills (1985-2004)
- 32 -

IV.C.7 Conclusions Rule 1174, adopted in 1990, applies to manufacturers, distributors and/or retailers of materials and/or methods used to ignite barbecue charcoal. The rule allows for several control options for the ignition of barbecue charcoal, based on baseline of 0.02 pound per start or less of VOC emissions. The exempt methods and materials used to ignite barbecue charcoal were electric starters, chimney with paper tinders, propane, and natural gas. From the ex ante analysis, barbecuing with natural gas was determined the least expensive of three alternatives and less time consuming than with charcoal briquettes. Table IV-5 compares the ex-ante evaluation with the ex-post evaluation.
Chimney and electric starters have the lower cost per use when compared to ready-to-light charcoal briquettes, lighter fluid, and solid and gel starters. The cost estimates by the SCAQMD at the time of rule adoption are consistent with the costs found today for the Chimney Starter and Electric Starter methods. However, consumers appear to be choosing the highest cost option, gas grills, over time. This is likely due to the ease of use of the gas grills.
Implementation of rule 1174 was expected to result in an average daily VOC reduction of 2 to 2.5 tons per average day and as high as 4 tons per day during the peak barbecue season. The increasing use of gas grills is likely resulting in a greater emission reduction than originally anticipated. In spite of the fact that chimney and electric starters are cheaper and likely faster than liquid starters, most persons using charcoal continue to opt for the liquid starter. Presumably, the cost of starting charcoal is so low regardless of the method used that consumers make no effort to evaluate cost effectiveness and simply choose the easiest approach at the time. The only lasting trend that is observable is the increasing use of propane and natural gas fired grills, which in effect are displacing the use of liquid starter.
Based on information collected and assembled for the ex post cost estimation, the original SCAQMD cost projections of the impact of Rule 1174 have proved to be reasonably accurate, if not slightly too high.
- 33 -

Table IV-5. Comparison of Ex-Ante With Ex-Post Cost Estimates
Starter Type Original SCAQMD Estimate (per
start) Study Estimate (per start)
Liquid Starter $0.134 - $0.340
Chimney Starter $0.94 $0.062 - $0.100
Electric Starter $0.87 $0.087 - $0.194
Liquid Starter + Charcoal $1.02 $1.63
Gas Grill + Gas $0.62 $2.06
- 34 -

IV.D. CASE 4 - SCAQMD RULE 1138
CONTROL OF VOC AND PARTICULATE MATTER (PM) EMISSIONS FROM RESTAURANT OPERATIONS
IV.D.1 BackgroundRule 1138 applies to the operators and owners of commercial restaurants. Food preparation emits volatile organic compound (VOC) and particulate matter (PM) that contribute to ozone formation. Charbroilers, griddles and deep fat fryers contribute to the emissions of VOC and PM. In the South Coast Air Basin, daily VOC emissions from restaurants are approximately 1.6 tons and PM about 11.6 tons, according to a South Coast Air Quality Management District (SCAQMD) report. The Rule was adopted in 1997.
Charbroilers are classified as “chain-driven” and “under-fired”. Installations of flameless catalytic oxidizers, the “Best Available Control Technology” (BACT) for chain-driven charbroilers, could eliminate 0.2 tons/day of VOC and 0.5 tons/day of PM emissions. This technology was considered easy to install and maintain. Use of a catalyst could reduce natural gas usage by 3 to 7% and decrease the amount of grease buildup in exhaust ducts. In 1991, approximately twenty flameless catalytic oxidizers were operating in the Basin.
Rule 1138 partially implemented control measure PRC-03 from the 1197 Air Quality Management Plan and tried to make progress towards attainment of Federal and State particulate matter (PM) and ozone standards. In addition, Rule 1138 was the first rule adopted to address the National Ambient Air Quality Standard for PM2.5. Implementation of the rule was expected to decrease of the number of visible emission violators from the restaurant industry in the Basin.
AQMD has jurisdiction over four counties: Los Angeles, San Bernardino, Orange and Riverside. Levels of pollutants vary within these areas. Some portions of the Basin have been designated by the EPA as extreme non-attainment areas for ozone.
IV.D.2 General Description of the Rule Rule requirements initially targeted chain-driven charbroilers used to cook meat since they were the only restaurant emissions that were thought to be amenable to cost-effective control with proven, available control technology. SCAQMD had specifically identified catalytic oxidizers as BACT which could effectively control PM and VOC emissions. The majority of emissions from charbroilers are PM emissions.
The 1997 Air Quality Management Plan (AQMP) outlined standards to achieve emission reductions and air quality goals through the implementation of control measures. Rule 1138 partially implemented PRC-03 – Emission Reductions from Restaurant Operations (VOC, PM10), a control measure listed in the AQMP under “Fugitive Dust and
- 35 -

Miscellaneous Source Categories.” This measure projected emission reductions of 1.2 tons/day for VOC and 8.2 tons/day for PM10. The first rule development based on control measures started in 1991. Until 1997, AQMD worked with industry to develop the rule and possible best available control technologies. During the rule action period, a survey was conducted in cooperation with the California Restaurant Association. There were approximately 31,000 restaurants in the jurisdictional boundaries of AQMD. Results from the survey suggested that commercial restaurants produce emissions from several types of cooking equipment.
The Rule requires existing chain-driven broilers with an average life of 10 years to be operated with certified pollution control equipment within twenty-four months of the rule adoption. A certification and/or registration program was developed for equipment manufacturers. They could obtain pre-approval of equipment certification after it had been shown to meet all of AQMD’s requirements.
Rule 1138 allowed existing chain-driven charbroilers with control equipment to continue operation until the end of their functional life, but not more than ten years after the adoption of the Rule. AQMD typically applies a 10-year life to any piece of standard control equipment fitted with BACT. At the end of this period operators should install or replace a catalyst or other certified control equipment. There are some exemptions to the rule and record-keeping requirements are minimal.
IV.D.3 Air Quality and Best Available Technologies for the Rule Restaurants emit particulate matter (PM) and volatile organic compounds (VOC), which contribute to ozone formation. PM less than 2.5 microns in diameter are referred to as “fine” particles. Those larger than 2.5 microns are termed “coarse”. The federal standard, and most of the focus on controls and the impact of particulate emissions, has been on PM measured at 10 microns or less, termed PM10. The maximum 24 hour PM10 concentration recorded in the Basin in 1995 was 45% larger than the federal standard and 429% of the State standard. The Antelope Valley and Coachella Valley Planning Areas, Mojave Desert, Ventura and San Diego County are impacted by transport of pollutants from the Basin.6 In 1993, EPA reclassified the Basin and Coachella Valley as a serious non-attainment zone for PM10. Rule 1138 focuses on reducing both PM10 and a subset, PM 2.5.
PM and VOC reductions are accomplished with a catalytic oxidizer, self-cleaning ceramic filters, fiber-bed filters, and incineration (catalytic and thermal). A staff technical report determined the BACT to be the flameless catalytic oxidizer. In this process, the exhaust stream containing PM and VOC is mixed with air before entering a flameless reactor vessel. The air mixture is evenly distributed into a bed of inert ceramic material coated with a special metal catalyst. This bed provides complete mixing of PM, VOC and oxygen. PM and VOC oxidize into carbon dioxide and water vapor once the mixture reaches the combustion temperature. Temperature control is very important for
6 South Coast Air Quality Management District, Air Quality Management Plan, 1997, Appendix Chapter 2-Air Quality and Health Effects.
- 36 -

effective oxidation of VOC and PM. For restaurant applications, exhaust gas entering the reactor needs to be at least 600°F. A removal efficiency approaching 85% can be achieved using this process. The cost estimates used by the agency and industry assume an 83% effectiveness.
Several companies have developed and were producing certified catalytic reactors that were operating successfully at about 15 restaurant locations in the South Coast Air Basin at the time of the rule making.
IV.D.4 Emissions and Emissions Reductions During the rule action period, significant testing had been done with emissions from restaurant operation. Important findings were that the food type and appliance used were important to the level of emissions observed. The largest amount of emissions came from under-fired charbroilers. PM size distribution in cooking appliance exhaust was below PM10, and even mostly below PM2.5. Installation of catalytic oxidizers was responsible for significantly reducing both VOC and PM.
Testing during the rule action period was aimed at developing suitable VOC test methods and emission factors for different types of foods and appliances. Four types of cooking appliances were tested: under-fired charbroilers, chain-driven charbroilers (with and without catalytic oxidizer), deep-fat fryers, and flat griddles. Five types of food were tested: hamburger patties, steaks, chicken, fish and potatoes.
Chain-driven charbroilers accounted for 12% of the VOC restaurant emission inventory and 4% of PM restaurant emission inventory. Under-fired charbroiling was the cooking method which resulted in the largest amount of PM and VOC emissions. Emission levels were deemed to depend on the type of food cooked. For instance, hamburger meat produced the most PM emissions, while deep-fat fryers had PM emissions below detectable levels regardless of the food cooked. VOC emissions ranged from 0 to 0.042 lb per 1000 lb of food. Flat griddles gave PM emissions below detectable levels when cooking fish and chicken, and their VOC emissions ranged from 0.02 lb VOC/1000 lb to 0.56 lb VOC/1000 lb. With hamburgers on the flat griddle, emissions increased significantly to an average of 5.08 lb PM/1000 lb and 0.12 lb VOC/1000 lb, respectively.
In summary, test data showed that the type of food and appliance used had a large impact on emission levels. Installation of catalytic oxidizers to chain-driven charbroilers was expected to significantly reduced both PM and VOC emissions.
IV.D.5 Cost Effectiveness for Ex-Ante Evaluation Owners of restaurants with chain driven charbroilers were expected to incur additional costs when installing catalytic oxidizers. SCAQMD calculated the average cost effectiveness for catalytic oxidizers based on two sources of data (Dabirian 1997).7 First, the equipment manufacturers submitted cost information. Capital equipment costs were
7 Addendum to Staff Report, Socio Economic Assessment of Proposed Rule 1138 prepared by S. Dabirian, November 1997.
- 37 -

estimated to be $4,366, with installation and retrofit costs of $1,180. Annual O&M costs were estimated to be $590. Savings from less cleaning of the exhaust stack was estimated at $885 annually. Assuming a 5-year catalyst life, a 4% interest rate, and an 83% PM and VOC emissions reduction, the cost per ton of emissions reduced was estimated to be $1,980 from the equipment manufacturers.
Restaurant operators also provided information related to the ex ante costs of meeting this regulation. Their per ton cost estimates ranged from $1,180 to $8,730 per ton depending on the extent of the retrofit. While annual O&M were not listed in any of the documentation viewed, it was noted that the affected restaurants assumed no cost savings from fewer stack cleaning events.
Based on the information the District received from the potentially affected restaurants and equipment manufacturers, the District assumed the average cost estimate was approximately $3,300/ton of PM and VOC reduced. Finally, cost estimates indicated that catalytic oxidizers were a cost-effective control option. It was determined that other control technologies, such as ceramic filters, fiber-bed filters, and wet scrubbers did not appear technologically or economically feasible.
The total gross sales of an average large volume quick service franchise ranged from $590,000 to $1,180,000, according to the Directory of High Volume Independent Restaurants and American Business Information Inc. Total annual costs of complying with Rule 1138 to individual restaurants were estimated between $950 and $1,500. The total annual compliance cost for a restaurant was 0.13-0.16 % of its total gross annual sales. Since affected restaurants are local businesses, they were expected to pass the cost of compliance to customers.
Rule 1138 was estimated to result in an average annual loss of 28 jobs in the four-county area. The facilities generally affected were large volume fast food restaurants, such as Burger King, Carl’s Jr., and some restaurants located in amusement parks. During the rule action period, business impacts were not calculated due to lack of information. However, comments were submitted by several impacted industries in the South Coast Air Basin. None of these comments were about the economical feasibility of the rule; rather, they focused on cost effectiveness calculations involving maintenance or labor.
IV.D.6 Cost Effectiveness for Ex-Post Evaluation Initial contact with the SCAQMD to request an updated list of restaurants indicated that for Rule 1138, the SCAQMD only maintained restaurant registration numbers. Additional contact information was not available. Initial contact with four of the major companies affected by the rule - Burger King Corp., Carl Karcher Enterprises, Inc., Knott’s Berry Farm, and McDonald’s Corporation – was also unproductive due to company representatives being unresponsive to data requests.
A follow up campaign to gather ex post information on the restaurant rule was conducted in 2005, and useful contacts at the South Coast Air Quality Management District, as well
- 38 -

as Engelhard Catalyst Company and Carl Karcher Enterprises were obtained8. The information on the costs and implementation of the required catalysts for this rule below are based on these contacts.
Carl Karcher Enterprises, owner of Carl’s Junior restaurants, represents approximately half of the 800 affected restaurants in the District. Burger King represents the other major restaurant chain affected, although efforts to obtain information from Burger King during this time period were unsuccessful. However, because of the large percentage of affected restaurants, the information received from Carl Karcher Enterprises is expected to be representative of all restaurants where the rule applied. At the time of the rulemaking there were three companies identified as having acceptable products for meeting this rule’s requirements. The vast majority of restaurants chose Engelhard’s CharCat Series 900 to meet their needs.
According to Carl Karcher Enterprises, the implementation of the catalysts was straightforward and consistent with the anticipated costs of implementation, in a large part due to industry’s active participation in the rule making process. As part of the rule, the companies are required to keep records on the installation of these units and their maintenance, and be provided to District on request. Although the district could not provide an updated list of affected restaurants and has not ever requested this information from the restaurants, it appears that there are some records being maintained by the restaurants. For Carl’s Junior restaurants, this responsibility was transferred from the headquarters to the individual franchisees several years ago. Due to time constraints as well as the difficulties associated with collecting information from franchisees directly, this information was not collected. However, general information from the headquarters, which has the responsibility of training the franchisees on where to buy the equipment and how to maintain the equipment, was provided and considered useful for this analysis.
Capital Cost and Maintenance The current capital cost of a CharCat ranges from $1507 to $3000 depending on the size of the charbroiler9. The estimated cost from both the affected restaurants and the equipment manufactures during the rulemaking was $3700.
Engelhard has recently reported that the CharCat has very low maintenance and lowers operating costs by decreasing their gas usage and reducing the frequency of duct and roof cleaning, enabling capital and installation costs to be paid back in less than a year.10
Carl’s Junior representatives reported similar findings of lowered gas usage and less duct cleaning. The reason for the decreased gas usage is that the catalyst actually increases the operating temperature, so less gas is used in the heating process than if the same
8 Mike Kissell, Carl Karcher Enterprises 714-778-7150, conversations on February 14th, 2005; Pamela Periman SCAQMD, 909 396 3103, conversations on February 11th,2005; Ed Pupka, SCAQMD,
th thconversations on February 11 and 12 , 2005 9 Information obtained from Golden West Equipment, 714-879-3850, February 16, 200510 Restaurant Chains Clear the Air With Engelhard Technology, Iselin, NJ November 24, 2004. http://www.engelhard.com/Lang1/xDocIDBC755A528F4D45AAA7BE71371B34FDBA/xDocTable_News /Tab_Overview/TechnologyClassID0/MarketID0/TechnologyID0/ApplicationID563CDEACDEAD4F15A EAA62BE1FCDD7F5/ProductID0/up1/SubSiteID0
- 39 -

charbroiler was operating without the catalyst. The reason for the decreased duct cleaning is that approximately 85% of the particulates are removed using the catalyst. The particulates are what cause clogged ducts because they condense as they cool and attach themselves to the walls of the duct, requiring periodic cleaning. The only maintenance recommended and performed by Carl’s restaurants is when weekly cleaning on the charbroiler is performed, which is soaking the catalyst for a few minutes. This results in virtually no increase in routine maintenance as these weekly cleanings need to be performed anyway. Hence, the $590 that was part of the ex ante costs for operation and maintenance was a clear overestimate.
Other identified costs for the affected restaurants included retrofitting the charbroiler to allow enough room for the catalyst to fit. In actuality, the retrofit was a very minor modification and cost and only affected approximately 1% of Carl’s existing charbroilers. The other potential up-front cost of complying with the rule was that the use of the catalyst recommended having a liquid fire suppressant installed at the restaurant. Carl’s was in the process already of converting from powder to liquid fire suppressants but this rule accelerated the process in a few restaurants. Both of these costs were included in the ex-ante analysis provided by the restaurants, and the actual costs realized are probably slightly less than the projected costs. Furthermore, neither of these costs applies to a new restaurant.
The ex ante cost analysis estimated a savings for less duct cleaning of between $0 and $885 per year, operational costs estimated at $590 per year with no estimate of savings from reduced gas usage. Although no specific numbers on operational savings and installation were provided from Engelhard or Carl’s, the ex-ante numbers are probably an overestimate of the costs, since no gas usage savings were factored in and Engelhard’s recent reports of operational savings in excess of $3000 per year.
Performance Although the district has not performed any field emissions testing since the rule has been implemented, it is believed that the performance of the catalyst is maintaining at least the originally estimated removal efficiencies of 85% in the field. This assumption, in part, is due to the minimal maintenance requirements for proper functioning of the catalysts. Furthermore, Engelhard reports the efficiency to be over 95% for gases and 90% for particulates for its CharCat technology11.
Per Unit Cost Comparison Indeed, if we overlook gas savings, the per ton costs of compliance using the updated capital costs, assuming no retrofit costs nor operation and maintenance costs, and, finally, assuming an 85% efficiency is $1,250/ton, a 90% efficiency is $1,150/ton, and a 95% efficiency of $1,085/ton. This is a very conservative estimate (i.e., the costs are likely to be considerably less if fuel savings is included), and is significantly less than the
11 Charbroiler catalysts, Product information on Engelhard website, Accessed February 16th, 2005. http://www.engelhard.com/Lang1/xDocIDAB366D76201F471EA789C6D03D0D7F03/xDocTable_Techno logy/Tab_Overview/TechnologyClassID0/MarketID0/TechnologyIDAB366D76201F471EA789C6D03D0 D7F03/up1/SubSiteID0
- 40 -

$1,980/ton and $3,300/ton based on ex ante estimates provided by the equipment manufacturers and affected restaurants in 1997.
IV.D.7 Conclusions Restaurant operators using existing or new chain-driven charbroilers that cook more than 875 pounds of meat per week (that is 500 quarter pounders a day) were required to install a catalytic converter by 1999. Records were to be kept for a minimum of 5 years. It was estimated that approximately 800 restaurants within the basin were affected by this rule.
The various cooking equipment contributing to the emissions of PM10 and VOCs includes deep-fat fryers, griddles, and charbroilers. Rule 1138 applies only to chain-driven charbroilers used to cook meat. During the rule action, there were approximately 1,000 chain-driven charbroilers being used in 800 restaurants located in the Basin, contributing approximately 0.5 tons per day of PM10 and 0.2 tons per day of VOC. Rule 1138 requires the installation of a catalytic oxidizer control device on new and existing chain-driven charbroilers. The record-keeping requirement is for the installation dates of catalytic oxidizer, cleaning, maintenance and replacement of the catalyst for a period of five years.
The restaurants with chain driven charbroilers will incur additional costs as a result of installing catalytic oxidizers. The SCAQMD calculated the average cost effectiveness value for catalytic oxidizer to be $3,300 per ton of emissions reduced based on data submitted by affected restaurants and equipment manufacturers. The average cost calculated from equipment manufacturers was $1,980 per ton of PM and VOC emissions reduced, and the industry estimates ranged from $1,180 to $8,730 per ton reduced emissions. The actual annual cost of complying with Rule 1138 for each restaurant was estimated to be between $1,085 and $1,250. The actual annual compliance cost for each restaurant ranged between 0.13-0.16 percent of total gross annual sales. At the time of the rule making, information from the affected industries suggested that due to the economic impact of Rule 1138 on industries, it could result in an average annual loss of 28 jobs in the four-county area. The ex post cost estimates are considerably smaller than either parties ex ante estimates. Most likely the rule did not result in significant job losses.
The discrepancies in the ex ante and ex post cost analysis can be attributed to a combination of the following misassumptions made during the ex ante analysis:
• An overestimate of operating and maintenance costs of the catalyst • An underestimate of operational savings (less duct cleanings) from the catalyst • An underestimate of the capital cost of the equipment • An overestimate of the number of retrofits required for compliance in the industry • An underestimate of the catalyst efficiency improvements over time for new units
Some of these assumptions could not have been improved upon before the rulemaking, such as forecasting technological improvements of the catalyst efficiency. A more detailed look at the operational and maintenance costs by the AQMD and the fraction of required retrofits, though, might have improved the ex ante analysis considerably.
- 41 -

IV.E. CASE 5 – CARB RULE 90-5-1
AIRBORNE TOXIC CONTROL MEASURE FOR ETHYLENE OXIDE EMISSIONS FROM STERILIZERS AND AERATORS
IV.E.1 BackgroundEthylene oxide (EtO), a registered pesticide, is widely used as a biocide to sterilize medical products and fumigate foodstuffs. EtO is classified as a “probable human carcinogen” by the International Agency for Research on Cancer (IARC) and the California Department of Health Services (DHS). The California Air Resources Board (ARB) identified EtO as a toxic air contaminant on November 12, 1987. California’s Health and Safety Code Section 39665 requires ARB to establish Best Available Control Technology (BACT) limits for toxic air contaminants identified by their board. Only the Department of Food and Agriculture has the authority at the state level to regulate the pesticide use of EtO. By agreement between the two agencies, ARB would regulate the routine discharge of “waste” EtO from sterilization and, thus, not require changes in EtO usage. On May 10, 1990, the California Air Resources Board approved an Air Toxic Control Measure (ATCM) 90-5-1 governing the control of EtO emissions from sterilizers and aerators. The ARB executive officer subsequently adopted the regulation through Executive Order G-586 on November 16, 1990. By state law, local air districts had 120 days to propose, and six months to adopt, a regulation at least as stringent as the ATCM.
IV.E.2. Air Quality and Best Available Control Technology The control measure required that any EtO be vented to a control device, with none lost due to leaks or discharge in wastewater streams. Chlorofluorocarbon-12 (CFC-12) is the most common gas used as a diluent in EtO sterilization mixtures. In 1987, the United States signed the Montreal Protocol, an international agreement to reduce the production and consumption of ozone-depleting compounds over a 10-year period. In 1989 a national tax was imposed on CFC production to reduce its consumption.
The concentration of EtO in exhaust streams strongly influences the applicability and efficiency of the various control technologies. Source tests of catalytic oxidation and acid-catalyzed scrubbing technologies showed that EtO in sterilizer exhaust had been reduced by more than 99.9% with these technologies. In a technical report by ARB, these levels of emissions are possible for sterilizer exhaust through thermal oxidation. Reclamation systems can recover 60-80% of the sterilant gas exhausted from a sterilizer and it might be more effective for using them in conjunction with other technologies to reduce emissions further.
At the time of their proposal, ARB staff believed there were 650 facilities statewide that would be affected by the control measure. EtO emissions were estimated at 796,000 lbs/year representing a cancer burden of 360-510 over a seventy-year period. Hospitals and veterinary clinics were stated to represent over eighty-five percent of the number of sources in the state, but less than twenty percent of the EtO emissions. Commercial
- 42 -

facilities, including medical/food products manufacturers and contract sterilizers, were stated to represent less than ten percent of the sources, but accounted for more than eighty percent of the EtO emissions.
In establishing the BACT levels for EtO, ARB evaluated five types of add-on controls: catalytic oxidation, thermal oxidation, acid-scrubbing, solid reactant bed, and reclamation. While there were no known “drop-in substitutes” for EtO, gamma radiation and electron beam irradiation did have limited application as alternate sterilization techniques.
Instead of specifying control technologies, ARB chose to define BACT as levels of control. This approach allows a facility to select the control technology that is most appropriate to their situation. The ATCM established different levels of control efficiency based upon the facility’s level of EtO usage as follows: < 25 lbs of EtO/year – no control required; > 25 lbs/year and < 600 lbs/year – 99% control on the sterilizer; > 600 lbs/year and < 5000 lbs/year – 99.9% control on the sterilizer and 95% control on the aerator; > 5000 lbs/year – 99.9% control on the sterilizer and 99% control on the aerator. Aeration-only facilities were required to control their emissions by 95%. Compliance timeframes ranged from 12 to 24 months depending on the level of EtO usage with the highest users having the shortest timeframe.
IV.E.3. Cost Effectiveness for Ex-Ante Evaluation ARB staff included the following considerations in their calculations of projected compliance costs:
• Capital equipment costs – including taxes and freight • Installation costs – including minor building modifications • Indirect costs – including site engineering, source testing and district fees • Contingency and retrofit costs – including other site-specific expenses • Office of Statewide Health Planning and Development (OSHPD) fees – for
modification of health care facilities
While small (< 25lbs/year) users were exempt from the control measure, they were still required to obtain permits and thus some administrative costs at the local air district existed.
ARB staff also annualized the cost of compliance over ten years at ten percent interest and added operation and maintenance costs to estimate an annual cost for typical facilities. Table IV-6 provides information on the projected costs developed by ARB staff. ARB staff estimated the total statewide initial cost of compliance for all facilities, excluding operation and maintenance, to be $87,000,000. The annualized statewide cost of compliance was estimated to be $21,750,000.
- 43 -

Table IV-6. Projected Costs by CARB Staff (2004 dollars)
Control Category Initial Cost per Facility
(excluding O&M) Annualized Cost per
Facility (including O&M) Exempt $ 435 $ 290 Small $152,000 $ 33,350 Medium $188,500 $ 50,750 Large $674,250 $188,500 Aeration-only $174,000 $ 50,750
Specifically, ARB had determined that the regulation would create a cost burden to the State, local government, and customers. According to the rule action files, the costs associated with this control measure would result from the purchase, installation, operation, and testing of emission control equipment. A breakdown of the initial cost of compliance to different levels of government is provided.
Costs to State Government The affected state agencies operate ethylene oxide sterilizers in hospitals, laboratories, veterinary care facilities, and museums. These agencies include the University of California, California State University, the California Department of Developmental Services, and the California Department of Mental Health. For facilities within these agencies that use less than 25 pounds EtO per year, the cost associated with this regulation would be for record keeping and demonstrating to the applicable air pollution control and air quality management districts that these levels are not exceeded.
For facilities using more than 25 pounds of EtO per year, the expenses associated with this regulation would be for purchasing, installing, operating, and testing EtO emission control equipment. The total annual estimated cost to these agencies was $420,500.
Costs to Local Governments Costs to Districts for implementing this regulation were expected to be $1.0 million the first year and $246,500 annually thereafter. The regulation would create costs to, and impose a mandate upon, some local public agencies, specifically counties and local hospital districts. Thirty-one local agencies owning or operating hospitals were expected to incur costs totaling $1.1 million annually. Costs to individual agencies were expected to range from $290 to $50,750 annually.
Costs to Hospital Patients Cost burdens to hospital patients were expected from $0.58 to $1.74 per bed per day (an increase of 0.1% to 0.2%). The costs to customers of commercial sources were estimated at $0.23 per cubic foot of material (an increase of 3% to10%).
- 44 -

ATCM 90-5-1 control technologies included catalytic oxidation, thermal oxidation, catalyzed scrubbing, and solid reactant. The capital cost of the largest device, excluding installation and any necessary instrumentation, was between $116,000 and $290,000 for thermal oxidation.
Annualized costs to various sources were also estimated by CARB. The highest annualized costs were to the large EtO users, which numbered 25 in California. The largest numbers resulted from small facilities, and their annualized cost was $33,350. The highest installation and annualized costs for both control technologies were to facilities using more than 5,000 pounds of EtO per year. These facilities incurred additional permitting costs. Based on the SCAQMD permit fee schedule, permitting costs were a $232 to $479 one time fee and a $218 annual renewal fee.
It should be noted that in 1988 EPA produced a technical report on EtO control measures. EPA and CARB estimates for capital and annual costs were generally in agreement. In some instances ARB used EPA data in its report.
Comments from industry representatives reflect a higher estimation of costs than those projected by ARB. Presco Food Products Inc. claimed they would have to pay approximately $116,000 for a scrubber in order to comply with the regulation and that such a cost would shut down their operation because they could not bear that cost. Griffith Micro Science Inc. reported the cost to implement the control technology proposed by CARB at their two Vernon facilities (including extensive modification of aeration room and warehouse areas to comply with both CARB and OSHA regulations, purchase and install equipment, non-process related facilities upgrades that would be required by the City of Vernon, and production down time) would be $2.18 to over $3.6 million. They also reported annual operating costs of this technology to be in excess of $435,000. The Health Industry Manufacturer’s Association (HIMA) claimed that the costs associated with aeration room emissions controls were understated by ARB, especially for large EtO users.
IV.E.4. Cost Effectiveness for Ex-Post Evaluation In the CARB Rule Action files, there were 58 hospital names, but no addresses or telephone numbers. A contact list was developed; however, stakeholders were non-responsive to subsequent telephone requests for cost information.
In February, 2005, the Director of Hospital Operations at the University of California at Irvine, was contacted by telephone. She had been a Deputy Executive Officer at the South Coast Air Quality Management District. While in that position, she was responsible for developing the AQMD regulation for EtO Emissions from Sterilizers and Aerators. She subsequently left the SCAQMD in 1998 to become the Director of Hospital Operations at the Children’s Hospital in San Diego (CHSD). During the telephone interview, the Director indicated that virtually all of the hospitals in Los Angeles and Orange counties had moved away from in-house EtO sterilization. She further reported that EtO continues to be a critical sterilization technique, especially in pediatric care. She stated that CHSD was engaged in a physical change in its sterilization
- 45 -

processes and may or may not still have an on-site EtO sterilizer. She recommended our team contact the director of the Peri-Operative Department at CHSD. We subsequently contacted the director of Peri-Operative Department at CHSD. She confirmed that EtO continues to be a critical sterilization technique, especially in light of the direction that endoscopic surgery has taken in recent years. She recommended we contact a particular staff employee who would have access to the technical and cost information related to their sterilization program. Ultimately, that staff person reported that CHSD owns and operates two AMSCO 100% EtO sterilizers. Each unit is connected to a “catalytic converter” that scrubs the residual EtO from the chamber. No by-products, such as ethylene glycol, are produced. Approximately, 10% of the total sterilization is performed using EtO. CHSD never used EtO exclusively. It is now the primary method of sterilization for heat sensitive items. CHSD also conducts sterilization using steam (autoclave) and “paracetic acid.” The staff person reported that he had no readily available cost information and would provide after researching the hospital records. To date, no further information has been forthcoming although subsequent contact attempts have been made.
The website for the “Medical Device Link’s North American Suppliers’ Directory – Sterilization Services” was used to develop a contact list. Subsequently, telephone contact was made with a representative of Sterilization Validation Services. Telephone contact was made with an employee at this company. The representative reported that at the time of the rule adoption, he worked for Pfizer at a facility located in the Basin. Prior to the rule, Pfizer operated an EtO sterilization process equipped with a control system that was 97% efficient and produced ethylene glycol as a by-product. The ethylene glycol was then sold to manufacturers of anti-freeze. He further recalled that compliance with this rule would have required catalytic or flame oxidation and,at that time, the cost was on the order of $2,000,000 (or $2.9 million in 2004). He reported that Pfizer made the decision to shut the EtO operation down and to outsource their sterilizations.
According to this source, there are now only two contract sterilizers: Steris (plants in Otai Mesa and Temecula) and Sterigenics (plants in Ontario and downtown L.A., which has recently been purchased by IBA, a Belgian company. When asked whether outsourcing was actually more economical than maintaining an onsite sterilization system, his reply was that there may have been an initial saving but related that, as the field of contract sterilizers has narrowed, the costs per chamber run have risen dramatically (perhaps less competition and supply). He cited a cost increase from $500 to $1800 per chamber run over a 10 year period.12 He noted that validations are required on a more frequent basis for radiation sterilization than for EtO, which has cost implications. This contact also indicated a continuing need for EtO sterilization for items that can't be radiated (electronics), subjected to steam or dry heat, or to hydrogen peroxide.
12 He is willing to be contacted if further information is needed. He is a microbiologist and now performs validations of sterilization systems. He noted that validations are required on a more frequent basis for radiation sterilization than for EtO. Mr. Davis indicated a continuing need for EtO sterilization for items that can't be radiated (electronics), subjected to steam or dry heat, or to hydrogen peroxide.
- 46 -

Additionally, two medical equipment providers, BC Technology Inc. and Special Team Medical Services Inc. were contacted (by phone). BC Technology Inc. reported they outsource their sterilization. The contact at Special Team Medical Services Inc., reported they use gamma radiation and have never used EtO. Yet, it was noted, they do send out items from intermittently for EtO sterilization, mostly to IBA in the Los Angeles area and Steris in Ontario.
Following up, telephone contact was made with the plant manager at the Steris facility in Ontario. He stated he did not have the needed information but would identify the correct person(s) to contact in order to obtain that information. Subsequently, he provided the address for the Vice President for Operations, in Illinois and suggested a letter be sent that describes the purpose of the study and identifies the information being requested. A letter was sent on 2/21/05. To date, no response has been received.
IV.E.5. Conclusion The ATCM, and subsequent local air district rules on EtO Sterilizers/Aerators, appear to have catalyzed a substantial movement toward the outsourcing of EtO sterilization. It would seem illogical such a movement would have occurred if the outsourced costs of sterilization were higher than the costs for compliant in-house sterilization. Having said that, it is unclear what role external influences, such as the CFC phaseout, CalOSHA EtO worker exposure requirements, and Proposition 65 notification requirements, may have had in outsourcing decisions. As a result, the vast majority of EtO sterilization in California is now performed by contract sterilizers, such as Steris and Sterigenics (IBA).
While it is anecdotal, the information provided above indicates that consolidation of the contract sterilization industry may have resulted in a more rapid increase in EtO sterilization costs than originally projected by ARB. Regardless, there is nothing in the ex-ante cost estimates that forecasts the significant move toward contract sterilization and away from the smaller individual EtO sterilization units that were in existence prior to rule adoption. Consolidation of the industry, such as observed in this case, can result in greater cost effectiveness in terms of cost per pound of pollutant removed. At the same time, the law of supply and demand can result in a greater cost to the ultimate consumer (in this case hospitals and hospital patients) as the numbers of locations available to provide the needed service are decreased.
EtO sterilization continues to be a valuable tool in the sterilization arsenal, although other sterilization processes such as steam, high heat, irradiation, and hydrogen peroxide vapor have grown in their usage.
- 47 -

IV.F. CASE 6 – CARB RULE 89-10-2
EXHAUST EMISSION STANDARDS, TEST PROCEDURES, AND DURABILITY REQUIREMENTS APPLICABLE TO PASSENGER CARS AND LIGHT-DUTY TRUCKS FOR THE CONTROL OF HYDROCARBON, CARBON MONOXIDE AND BENZENE EMISSIONS
IV.F.1. Background With Rule 89-10-2, several standards were amended. These standards were the “California Exhaust Emission Standards and Test Procedures for 1988 and Subsequent Model Passenger Cars, Light-Duty Trucks, and Medium-Duty Vehicles”, “Guidelines for Certification of 1983 and Subsequent Model-Year Federally Certified Light-Duty Motor Vehicles for Sale in California”, and “California In-Use Vehicle Emissions-Related Recall Procedures for 1982 and Subsequent Model-Year Passenger Cars, Light-Duty Trucks, Medium-Duty Vehicles, Heavy-Duty Vehicles and Engines, and Motorcycles.” In the new standard, the ARB, by Resolution 89-61, approved adoption of regulations for the implementation of more stringent emission standards and durability requirements for hydrocarbon (HC) and carbon monoxide (CO) exhaust emissions from passenger cars and light-duty trucks. The Board also approved adoption of regulations related to the sale of federally certified vehicles in California.
The Rule was phased-in over a three-year period with 40, 80 and 100 percent of a manufacturer’s vehicles in 1993, 1994, and 1995, respectively. Manufacturers were permitted to use alternative, less stringent standards to determine the compliance status of vehicles in customer use. In addition, ARB amended the procedures for certifying federal vehicles, such as motor vehicles certified by EPA as meeting federal standards for sale in California.
In the Staff report, it was determined that the proposed regulations would not create either costs or savings. It was also determined that these regulations would not have a significant adverse economic impact on small businesses, and that there would not be a significant, potential cost impact on private persons or businesses directly affected by the proposed action. The Board further determined that no alternative considered by the agency would be more effective in carrying out the purpose for which the regulations were proposed or would be as effective as and less burdensome to affected private persons than the adopted regulations.
IV.F.2. General Description of the Rule With Rule 89-10-2, the following sections were amended:
1. “California Exhaust Emission Standards and Test Procedures for 1988 and Subsequent Model Passenger Cars, Light-Duty Trucks, and Medium-Duty
- 48 -

Vehicles.” The standard is adopted on May 20, 1987, and amended in 1989 and 1990. In this rule, there are amendments related to exhaust emission standards in the years 1988, 1989, and 1993, 1995. The California Exhaust Emission Standards and Test Procedures for 1988 and Subsequent Model Passenger Cars, Light-Duty Trucks, and Medium-Duty Vehicles, Section 1960.1 would require manufacturers to meet more stringent HC and CO exhaust emission standards for passenger cars and light-duty trucks. The proposal would also extend the current durability demonstration requirement to 100,000 miles”.
2. “Guidelines for Certification of 1983 and Subsequent Model-Year Federally Certified Light-Duty Motor Vehicles for Sale in California.” The Guideline is adopted in July, 1982, amended twice at 1983, and again in 1985, 1987, and 1989. These guidelines are not applicable to medium-duty trucks, motorcycles, heavy-duty engines, heavy-duty vehicles, emergency vehicles, or vehicles with engine having a displacement less than 50 cubic inches. In this section, which includes guidelines from Section 1960.5 and 2061, the criteria are specified for manufacturers to sell federally certified vehicles in California and for those vehicles that have emission levels that are higher than the California standards. The proposed amendments would reduce by 50% the percentage of available credits manufacturers may use in the AB 965 program. Adoption of the proposed HC exhaust emission standards would permit a HC offset procedure for the first time because the California standards would be lower than the corresponding federal standards.”
3. “California In-Use Vehicle Emissions-Related Recall Procedures for 1982 and Subsequent Model-Year Passenger Cars, Light-Duty Trucks, Medium-Duty Vehicles, Heavy-Duty Vehicles and Engines, and Motorcycles.” This section, Section 2112, requires manufacturers to submit warranty failure and defects reports and to recall and correct nonconforming vehicles. The staff proposes to amend the procedures to specify that “useful life” for passenger cars and light duty trucks subject to the proposed 100,000 miles HC and CO standards is ten years or 100,000 miles, whichever first occurs.”
According to a technical report prepared by CARB in 1989, the regulation was technologically feasible and cost-effective. Vehicle manufacturers would be required to comply with the emission standards and durability requirements beginning in the 1993 model year. During the first two years under the new standard, manufacturers would be permitted to comply with less stringent in-use standards, and in-use compliance would be waived after 50,000 miles.
During the 45-day comment period, CARB received comments from the following companies, government agencies, and individuals: the American Gas Association (AGA), Austin Rover (Austin), Automobile Club of Southern California (AAA), Chrysler Motors Corporation (Chrysler), Ford Motor Company (Ford), Bert Growald, Manufacturers of Emission Controls Association (MECA), Nissan Research and Development (Nissan),
- 49 -

Rolls Royce Motor Cars (RRMC), SCAQMD, Toyota Technical Center, U.S.A. (Toyota), Robert Presley and Byron D. Chairs of the California Legislature.
In Public Hearings, oral comments were received from American Honda (Honda), American Importers Association (AIA), Champion Spark Plugs (Champion), Chrysler, Ford, General Motors Corporation (GM), MECA, California Air Pollution Control Officers Association (CAPCOA), Sierra Club, SCAQMD, Toyota, Volkswagen.
IV.F.3. Air Quality and Best Available Control Technologies for the Rule During the Rule Action period the most significant air pollution problem in California was ozone. Ambient ozone concentrations in parts of the South Coast Air Basin had been recorded at more than three times the national standard.13 The Rule “Exhaust Emission Standards, Test Procedures, And Durability Requirements Applicable To Passenger Cars And Light-Duty Trucks For The Control Of Hydrocarbon, Carbon Monoxide And Benzene Emissions” applied to the manufacturers to certify all passenger cars and light duty trucks to new 50,000 miles and 100,000 miles hydrocarbon and carbon monoxide emission standards.
The Staff predicted that the following emission control technologies would be necessary:
• Fuel injection • Platinum-tipped spark plugs • Dual oxygen sensors • Increased catalyst loading-80%; warm-up converters • Bypass converter
IV.F.4. Emissions and Emissions Reductions Hydrocarbon (HC) emissions, which are a major precursor in the photochemical formation of ozone, have been classified as a toxic air contaminant. HC emissions also contain Benzene, which is a known carcinogen chemical and has no minimum threshold level below which its effects are not of concern. Carbon monoxide (CO) is not as severe as ozone, but it is a significant health concern. During Rule Action the CO levels in California reached levels exceeding twice the national standard. In 1989, the certification and in-use compliance period for most passenger cars and light duty trucks was 50,000 miles. Only a few manufacturers were chosen to certify diesel vehicles to an optional 100,000 miles standard. In addition, over 60% of the in-use vehicles in California had accumulated more than 50,000 miles. These vehicles accounted for 55% of California’s total vehicle travel fraction and nearly 70% of California’s passenger car emissions.
The adoption and implementation of Rule 89-10-2 to govern vehicles up to 100,000 miles was necessary to combat the deterioration of emission control system occurring beyond the 50,000 miles period. Manufacturers would also improve the in-use durability of their vehicles. In the Staff report, by the year 2010 emission reductions would be 70 tons/day HC, 1000 tons per day for CO and 3.6 tons per day for benzene.
13 The Technical Support Document prepared by California Air Resource Board, Sacramento, CA 1989.
- 50 -

The Rule required all manufacturers to meet non-methane hydrocarbon (NMHC) standards because NMHC emissions are more indicative of the pollution effects of motor vehicles. More specifically, the 50,000 miles emission standards were 0.25 g/mi NMHC and 3.4 g/mi carbon monoxide (CO) for passenger cars and light-duty trucks from 0-3,750 lbs, loaded vehicle weight. The 100,000 miles emission standards were 0.31 g/mi NMHC and 4.2 g/mi CO. The emission standards for light-duty trucks from 3,751-5,750 lbs loaded vehicle weight were 0.32 g/mi NMHC and 4.4 g/mi CO at 50,000 miles and 0.40 g/mi NMHC and 5.5 g/mi CO at 100,000 miles.
Thereafter, in-use compliance would be limited to 75,000 miles. According to test data the lowest NMHC and NOx emissions were achieved by the 1986 Model Isuzu I-Mark, and the lowest CO emission by the 1986 Model Volkswagen Jetta. Under Rule 89-10-2, possible emission reductions were estimated by assuming that in-use emission would be reduced by the same percentage as the proposed 50,000 miles standard when compared to current standards. The percentage reduction was 36% for NMHC and 51% for CO. CARB estimated emission benefits in year 2010 of the proposed standards based upon an average implementation date of 1995.
IV.F.5. Cost Effectiveness for Ex-Ante Evaluation The cost effectiveness of Rule 89-10-2 is the incremental cost per vehicle divided by the expected reduction in emissions over the lifetime of the vehicle. The incremental cost of the Rule was estimated at $65 per vehicle. The cost effectiveness of the proposed regulations was estimated as $1.20 per pound of NMHC and $0.10 per pound of CO reduced. In-use emission benefits from an ARB technical report were estimated at 56 pounds of NMHC and 580 pounds of CO per vehicle. The cost effectiveness of benzene reduction, attributing the entire cost to the benzene benefit, was from $4.0 to $31 million per cancer case reduced.
In 2010, emission reductions would be 70 tons per day for HC, 1,000 tons per day for CO, and 3.6 tons per day for Benzene.
General responses to the Rule were about the emission standards and the adoption of more stringent motor vehicle emissions standards. There were also issues regarding cost estimates:
1. There were concerns from companies about the durability data for vehicles. Current protocol allows manufacturers to certify in California using federal durability data even if the engine calibration and catalyst loading and location are significantly different. These factors can affect emissions and deterioration, and therefore it is appropriate to require a California durability test. Volkswagen claimed that the cost of running durability tests is approximately $250,000 per 50,000 miles. Nissan said that durability requires large expenditures of cost and time. The comments from Ford were that durability tests would cost $20.0 million to run for 17 durability families in order to generate deterioration lines under the 1993 to 1995 California certification standards.
- 51 -

2. The original staff proposal required manufacturers to demonstrate compliance with the Inspection and Maintenance (I/M) standards between 35 and 50 degrees Fahrenheit in order to improve the effectiveness of the I/M program. But some companies said that the estimated cost is $400,000 for building new facilities in order to test each 4K certification vehicle. The Board revised the staff proposal to eliminate the need for cold temperature testing and the need to build additional cold testing facilities.
3. The most likely emission control technology that would be employed on passenger cars and light duty trucks to meet the proposed standards were sequential fuel injection, increased catalyst loading and volume, distributor-less ignition systems, and aspirator with shut off system. The estimated cost of these systems was $200-$300 to the consumer (Chrysler). The response of CARB was that “the emission control measures listed by Chrysler are likely to be necessary for only worst-case vehicles and it was not appropriate to associate the cost of these control measures with the entire fleet.”
4. Ford disagreed with the technical report prepared by CARB which would restrict the efficient use of shared durability vehicles for Federal and California certification. They estimated that disallowance of this practice could cost Ford about $20 million in the 1993 to 1995 period. This was about $20 per California vehicle. The Board revised the Staff proposal.
IV.F.6. Cost Effectiveness for Ex-Post Evaluation This rule affected the automobile manufacturers. In the CARB Rule Action files, there were only a few automobile manufacturers’ names and phone numbers and three related trade association’s names: Manufacturers of Emission Controls Association (MECA) (Washington DC), Automobile Importers of America (Arlington), Motor and Equipment Manufacturers Association (MEMA).
The study team was unable to get representative name and phone numbers from trade associations. When the team tried to contact manufacturers and trade association representatives, some of the manufacturers (American Honda, Aston Martin, Jaguar, Mercedes, BMW and Ford) indicated a willingness to participate in a limited manner. After several follow-up attempts the team did not manage to obtain any meaningful data. MECA at first indicated that they would supply cost information but later declined.
This rule did not lend itself well to ex post cost estimation for a number of reasons. First, there is a high degree of competitiveness in the automobile industry and thus unless the industry sees some tangible benefits from providing this information (i.e., costs, emissions, technologies), they do not want to share any information with any outside sources. This is clearly a strategic, and understandable, decision on their part. Second, there were many amendments to the Rule afterwards, as well as this Rule was in essence an amendment (or an additional requirement) to other earlier rules. Hence, there is likely to be an aggregation issue in terms of how to parcel out any cost increases to which rules, or expected rules for that matter. That is, any cost increases today could be a result of other rules or the anticipation of other rules that came afterwards.
- 52 -

Appendix D contained a detailed description of efforts to collect ex post cost data. Appendix E provides information on efforts to collect data for Rule 91-11-1, Reformulated Gasoline-Phase II and the Wintertime Oxygen Content of Gasoline.
IV.F.7. Conclusions Rule 89-10-2 required manufacturers to certify all passenger cars and light duty trucks to a new 50,000 miles and 100,000 miles hydrocarbon and carbon monoxide emission standards. Major requirements were lower exhaust emission standards and extended durability. In 1989, the current durability period was 50,000 miles, and nearly 70% of vehicle emissions would occur after 50,000 miles. In addition to the durability period, other extended durability requirements were increased warranty periods: cars for 7 years/70,000 miles, federal light-duty trucks for 120,000 miles, and optional California diesel standards for 100,000 miles.
In 1989, the available control technologies were electronic fuel-injection, close-coupled catalysts, dual oxygen sensors, increased catalyst loading, platinum-tipped spark plugs, and on-board diagnostics (OBD). For the Rule, future control technologies included bypass catalysts, electrically-heated catalysts, on-board diagnostics (OBD), and other measures.
The Rule was to be phased-in over a three year period with 40, 80 and 100 percent of a manufacturer’s vehicles in 1993, 1994, and 1995, respectively. Manufacturers would be permitted to use alternative, less stringent standards to determine the compliance status of vehicles in costumer use.
Incremental costs of the Rule were estimated at $65 per vehicle and the cost effectiveness of the regulation was estimated as $1.20 per pound of NMHC and $0.10 per pound of CO reduced. In-use emission benefits from an ARB technical report were estimated at 56 pounds of NMHC and 580 pounds of CO per vehicle. The cost effectiveness of benzene reduction, attributing the entire cost to the benzene benefit, was from $4.0 to $31 million per cancer case reduced. In 2010, emission reductions would be 70 tons per day for HC, 1,000 tons per day for CO; and 3.6 tons per day for Benzene.
During the Rule Action period, some automobile manufacturers prepared written and oral testimonies. Most of the comments addressed the technical feasibility of the regulation and others its economical feasibility. However, the Board worked closely with industry in several phases of rule preparation and in several instances revised the regulations after receiving the stakeholders’ comments.
During ex-post evaluation, the study team tried to contact manufacturers and trade association representatives. Some of the manufacturers (American Honda, Aston Martin, Jaguar, Mercedes, BMW and Ford) were willing to participate in a limited manner at the beginning of the contacts. After several follow-up attempts, the team has did not manage to acquire any meaningful data.
- 53 -

IV.G. CASE 7- CARB RULE 88-2-2
AIRBORNE TOXIC CONTROL MEASURE (ATCM) FOR EMISSIONS OF HEXAVALENT CHROMIUM FROM CHROME PLATING AND CHROMIC ACID ANODIZING OPERATIONS
IV.G.1. BackgroundChrome plating, chromic acid anodizing facilities and chromate-treated cooling towers cause up to 98% of the total emissions of hexavalent chromium. According to a report prepared by ARB, potential statewide cancer cases by hexavalent chromium over a 70 year period could reach 400 to 4,900.14 However, with implementation of Rule 88-2-2, cancer cases attributable to chrome plating and anodizing facilities were estimated to be reduced to between 220 and 2,700 over a 70 year period.
Rule 88-2-2 would affect decorative chrome plating shops, hard chrome plating shops, and chromic acid anodizing shops which generally meet the definition of a small business (manufacturers with fewer than 250 employees).
IV.G.2. General Description of the Rule Hexavalent Chromium was identified by the Board as a toxic air contaminant on January 23, 1986. ARB approved the control plan as an appropriate overall course of action for the Staff to follow when developing hexavalent chromium control measures. Chrome plating, chromic acid anodizing shops, and chromate-treated cooling towers were believed to be responsible for 98% of hexavalent chromium emissions in the State. Hexavalent chromium emissions from chrome plating results in a greater potential adverse impact on public health than do emissions from chrome-treated cooling towers because of the localized exposure associated with chrome plating operations. A measure given high priority in the plan was the control of hexavalent chromium emissions from chrome plating and chromic acid anodizing facilities. At the time of rule enactment, CARB identified a total of 416 chrome plating and anodizing shops in the State, located in 18 different air districts to meet the following targets:
• 95% control efficiency: 242 decorative chrome shops and 74 small hard chrome shops
• 99% control efficiency: 87 medium size shops • 99.8% control efficiency: 13 large shops.
CARB performed a survey to gather information on hexavalent chromium facilities in the State. The survey analysis emphasized hard chrome firms in California over the chrome
14 State of California Air Resource Board, Proposed Hexavalent Chromium Control Plan Staff Report, prepared by Toxic Air Contaminant Control Branch Stationary Source Division with the Participation of the Technical Review Group, January 1988, pp: 1-40.
- 54 -

plating industry as a whole. It indicated that small and large firms could generate the profits needed to finance the annualized cost of the regulation. However, results suggested that a typical medium-sized firm may not generate enough profits to finance the regulation.
Exposure to an air pollutant is determined by the concentration of the pollutant in the air, the number of the people breathing that air, and the amount of time the pollutant is breathed (concentration x population x duration). The potential cancer risk due to exposure to carcinogenic pollutants such as hexavalent chromium can be computed from estimated exposure using carcinogenic potency factors. Based on an analysis of exposure to hexavalent chromium prepared by CARB, approximately 21 million Californians were thought to be exposed to chromium emissions. Most of this exposure would come from chrome plating operations and chrome-treated cooling towers. The 21 million people are exposed to a population-weighted annual average concentration of 1.59 ng/m3. Cooling towers contribute 45%, and plating facilities contribute 55%.
IV.G.3. Air Quality and Best Available Control Technologies for the Rule The control of hexavalent chromium emissions would cause a significant positive effect on air quality and human health. Implementing Rule 88-2-2 would avert a very large number of potential cancer cases.
Control measures were thought capable of controlling 97% of emissions of hexavalent chromium. The emissions from chromate-treated cooling towers were twice as large as the ones from chrome plating and anodizing facilities. However, emissions from cooling towers were estimated to cause only 80% of the number of potential cancer cases caused by chrome plating and anodizing facilities due to the location and emission characteristics of the sources.
Depending on the type of facilities, and objectives of reducing emissions, the Best Available Control Technology (BACT) would vary. Regardless of measure, a 97% control efficiency of hexavalent chromium was expected. Control measures are summarized in table IV-7.
CARB analyses have determined that the cost per cancer case reduced is from $176,000 to $2.24 million for chrome plating and anodizing facilities. The reduction in cancer cases over 70 years would be between 220 and 2,700 for chrome plating and anodizing facilities. Table IV-8 summarizes the potential control measures ranked by cost-effectiveness, reduction in cancer cases, and development time.
- 55 -

Table IV-7 Summary of Potential Hexavalent Chromium Control Measures
Source Category Emissions (TPY) Control Red uction
Cost/lb duced Re
Average Cost/Cancer
Reduced
Cum. Annu al
2Cost
% ti Contribu on
otal to T issionEm
Control Measure
toBoard Priority3
Current roposed P
Controls Approaches1
# Cance r Cases 6)($*10
Chrome Plating and
nodizing A 6.0 0.19 ADD-ON 260-
3,300 0.00034 0.087-1.1 3 31 Feb 8-8 H Fuel Combustion (Oil and Coal) 0.4 22. Jun-88 M
>0.04 ADD-ON 1 _ 12 0.011-0.035 35-2,500 70
0 MOD.&SUB. 1 _ 12 0.26-1.5 910-
120,000 276 Other 4 0.1 0.05 1_14 n/a n/a n/a 0.3 Sep-89 L
Totals 19.5 1.4 463-
6,138 0.045-0.60 276 100 1 control technology approaches: sub.=substitution, add-on= add-on controls, mod.=fuel modification (e.g., metals removal from fuel oil) 2 cumulative control cost 3 H: high, M: medium, L: low 4 includes chromate pigment usage, motor vehicle emissions, sewage sludge incineration, and refractory production Source: The California Air Resource Board’s rule action files.
- 56 -

Table IV-8 Potential Hexavalent Chromium Control Measures Ranked by Cost-Effectiveness and Reduction in Cancer Cases. Development Time (1988$) Measure Cost per
Pound Reduced (dollars)
Cost per Cancer Case
Reduce d
eR duction in Cancer Cases
Control Measure to Board
Chrome Plating an d Anodizing
340 0,000-1.4 11 mil.
220-2,700 Fe 8b-8
Fuel Combustion A. Add-on Controls
11,000-39,000
160 mil.-2 bi l. 0.8 -9 *
B. Fuel Modification and Sunstitution
,000-2.4 260 mil.
2.7 bil.-33 bi l. 0.8-9 *
* not determined mil.= million, bil.=billion Source: The California Air Resource Board’s rule action files.
IV.G.4 Emissions and Emissions Reductions Most hexavalent chromium emissions result from two industrial processes that use hexavalent chromium compounds: chrome plating and chromic acid anodizing, and cooling towers treated with chromate corrosion inhibitors. These two categories account for 98% of the emissions. As presented in table IV-9, chromate-treated cooling towers were estimated to emit 68% of all statewide hexavalent chromium emissions while chrome plating and anodizing operations were estimated to emit 30%. All other sources account for the remaining 2% of emissions.
Future qualitative changes in hexavalent chromium emissions are important for establishing control plans. In the Board’s projections, during the period 1985 and 2000, chromate-treated cooling towers were projected to decrease due to the increased use of nonchromate corrosion-inhibiting water treatments. Emissions from the second largest emitting category, chrome plating and chromic acid anodizing facilities, were expected to increase because of growth in hard chrome plating activity. These estimates of future emissions were based on projections of trends in industrial activity or vehicle population growth.
- 57 -
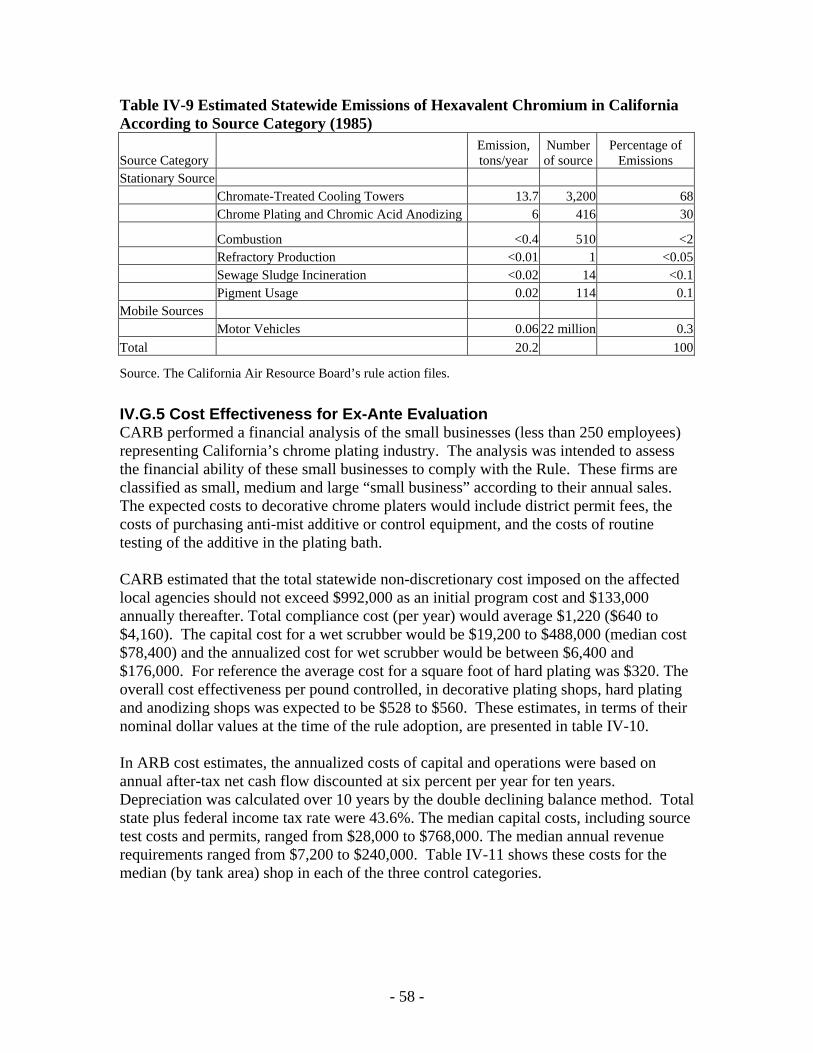
Table IV-9 Estimated Statewide Emissions of Hexavalent Chromium in California According to Source Category (1985)
Source Category Emission, tons/year
Number of source
Percentage of Emission s
Stationary Source Chromate-Treated Cooling Towers 13.7 3,200 68 Chrome Plating and Chromic Acid Anodizing 6 416 30
Combustion <0.4 510 <2 Refractory Production <0.01 1 <0.05 Sewage Sludge Incineration <0.02 14 <0.1 Pigment Usage 0.02 114 0.1
Mobile Sources Motor Vehicles 0.06 22 million 0.3
Total 20.2 100
Source. The California Air Resource Board’s rule action files.
IV.G.5 Cost Effectiveness for Ex-Ante Evaluation CARB performed a financial analysis of the small businesses (less than 250 employees) representing California’s chrome plating industry. The analysis was intended to assess the financial ability of these small businesses to comply with the Rule. These firms are classified as small, medium and large “small business” according to their annual sales. The expected costs to decorative chrome platers would include district permit fees, the costs of purchasing anti-mist additive or control equipment, and the costs of routine testing of the additive in the plating bath.
CARB estimated that the total statewide non-discretionary cost imposed on the affected local agencies should not exceed $992,000 as an initial program cost and $133,000 annually thereafter. Total compliance cost (per year) would average $1,220 ($640 to $4,160). The capital cost for a wet scrubber would be $19,200 to $488,000 (median cost $78,400) and the annualized cost for wet scrubber would be between $6,400 and $176,000. For reference the average cost for a square foot of hard plating was $320. The overall cost effectiveness per pound controlled, in decorative plating shops, hard plating and anodizing shops was expected to be $528 to $560. These estimates, in terms of their nominal dollar values at the time of the rule adoption, are presented in table IV-10.
In ARB cost estimates, the annualized costs of capital and operations were based on annual after-tax net cash flow discounted at six percent per year for ten years. Depreciation was calculated over 10 years by the double declining balance method. Total state plus federal income tax rate were 43.6%. The median capital costs, including source test costs and permits, ranged from $28,000 to $768,000. The median annual revenue requirements ranged from $7,200 to $240,000. Table IV-11 shows these costs for the median (by tank area) shop in each of the three control categories.
- 58 -

Table IV-10. The Overall Cost-Effectiveness Estimations, Prepared by CARB (1988$)
Overall cost effectiveness (per pound controlled at decorative plating shops) $330
Overall cost effectiveness (per pound controlled at hard plating and anodizing shops) 50 $3
Cost to individual facilities for lowest emitting (per year) $400
Cost to individual facilities for highest-emitting one (per year) $340,000
Cost attributable to hard plating and anodizing operations (per cancer prevented) $110,000-$1,3 million
Cost attributable to decorative plating (per cancer prevented) $100,000-$1.2 million
Source. The California Air Resource Board’s rule action files.
Table IV-11. The Costs of Compliance (median values) According to Control Requirements
Control Requirement 95%a 95 to 99%b 99%c
Capital cost (initial investment) $17,500 $61,000 $480,000 Operation &maintenance (annual) $2,400 $11,000 $94,000 Annualized cost (revenue required) $4,500 $18,000 $150,000 a de-mister; b packed bed scrubber; c high-efficiency de-mister; Source. The California Air Resource Board’s rule action files.
Hexavalent chromium facilities were located mostly in the South Coast Air Quality Management District. The highest initial permit cost for complying with Rule 88-2-2 was $656,000 and the annual permit cost was $88,000. The highest hourly labor rate between Districts was in the Ventura Air Pollution Control District ($98.60). In the same District, the initial fiscal cost to hexavalent chromium facilities was $4,355, and the annual fiscal cost was $581.
IV.G.6. Cost Effectiveness for Ex-Post Evaluation Rule 88-2-2 applied to decorative chrome plating shops, hard chrome plating shops, and chromic acid anodizing shops. Most of these firms were considered small business given they had fewer than 250 employees.
In the CARB Rule Action files, 88 hard plating facilities, 21 anodizing facilities, and 129 decorative plating facilities’ were identified by facility type. Some of these facilities have since gone out of business and/or phone numbers and addresses have changed. Upon notifying CARB and the SCAQMD of this situation, the team was able to compile a contact list of 44 facilities (with contact names and telephone numbers) of which 13 facilities were from the San Diego Air Pollution Control District (APCD), 1 facility from the Ventura County APCD, 11 facilities from the Sacramento Metro AQMD, and 19 facilities from the San Joaquin Valley APCD. The Shasta County AQMD was unable to help due to their lack of data. Subsequent research by CARB has lead to an updated list of facilities as of 2003 (Appendix F).
- 59 -

Numerous attempts were made to contact some Hexavalent Chromium facilities to gather information on compliance costs and emission reductions. At first, progress was not gained in obtaining any data due to the facilities’ unwillingness to share such data.
In January of 2005, though, we were able to contact over 30 facilities, several from the SCAQMD, and request relevant cost and emissions information. After numerous discussions, 6 different business owners agreed to participate in this survey. Although this is not a large enough sample size to make an accurate judgment on cost estimates, the data collected do give some indication of such. In order to keep a certain degree of confidentiality, individual company names are not mentioned anywhere in this report.
In discussions with business owners, it is apparent that the chromium plating industry has undergone considerable consolidation during the past few years. Many of the more inefficient and more expensive shops to operate have gone out of business, or moved their business to neighboring states or countries. There has also been considerable pressure from local activist groups to shut down some of the worst polluters, especially in areas near schools. Almost all of the affected companies are small businesses with fewer than 250 employees, most with considerably less than that.
Of the 6 companies participating in this study, 2 are decorative chrome shops, 2 are anodizing shops and 2 are hard chrome plating shops. The decorative shops fall into the 95% reduction category, the 2 anodizing facilities fall into the 99% reduction category, and both of the hard chrome plating shops fall into the 99.8% reduction category.
Decorative shops The 2 participating decorative shops indicated that they are able to comply with Rule 88-2-2, simply by using suppressant in the plating tanks. Shop A has annual operating costs to comply of about $7400, and Shop B complied with a cost of about $4000 annually.
Anodizing facilities The 2 anodizing facilities that participated each had to install a wet scrubber with an anti-mist section. The capital cost to install the required equipment was stated to be $22,800 for one of the facilities and $67,500 for the other (in 2004$). The difference in cost can be primarily attributed to the cost to retrofit the scrubber onto existing equipment. In one case the retrofit was very simple, and in the other case it was very complex due to space constraints and other issues. The annual operating costs for the scrubber and associated compliance costs (not including depreciation costs) were similar for each facility, $2,000 compared to $1,500. Annual amortized costs assuming a 15-year life expectancy and a 4% interest rate was $4,050 and $7,568.
One of the anodizing facilities provided emissions data, and the cost per pound of Chromium reduced for that facility was approximately $100. This is considerably lower than the $330 to $350 per pound controlled that was estimated. It should be pointed out that the emissions data is somewhat suspect as the business owner was uncertain of its accuracy but indicated it was the best number he had.
- 60 -

Hard Plating Facilities As mentioned, the 2 hard plating facilities were classified as large emitters and needed to reduce emissions by 99.8% to comply with Rule 88-2-2. Again, both facilities had to install wet scrubbers and associated equipment, and the capital cost / scrubber was $381,000 for one facility and $347,500 for the other. The second facility had to install 2 scrubbers for a total cost of $695,000. Operating costs (not including depreciation) ranged from $7,000 / year to $16,000 / year. Together, the amortized yearly costs for these control strategies were $50,000 and $69,000.
One of the hard plating facilities provided emission data, and the cost / pound of Chromium reduced was about $50. Again, this is considerably lower than the ex ante costs. Likewise, this emissions data could be suspect for this facility too, however, it probably represents a minimum of Chromium reduction, and thus a maximum cost / pound of Chromium reduced. The business owner indicated he had to meet the 99.8% reduction by the narrowest of margins. If you assume the 99% controlled emissions were greater than 10 lbs / yr, then the uncontrolled emissions had to be greater than 1000 lbs / yr. This yields a minimum cost / lb of Chromium reduced of about $50, which correlates exactly with the emissions data supplied by the business owner.
IV.G.7. Conclusions The chrome plating industry in California is a rather large group of highly competitive, owner operated small businesses. Considerable consolidation has taken place over the past several years due to regulatory pressures, consumer group activities and the business climate. Although many business owners will say regulation has created this consolidation, the evidence is only anecdotal. However, regardless of the cause, consolidation certainly can have an impact on the ex-ante and ex-post cost differences. As mentioned in a previous rule (Bakeries), consolidation can result in a number of different scenarios that might affect the overall costs of production. While an evaluation of the impacts of consolidation would require additional assumptions and a more general equilibrium approach to analyzing this problem which go well beyond the scope of the present report, consideration of these potential impacts may want to be considered in future ex-ante cost projections by CARB.
Rule 88-2-2 impacted 3 classes of chrome plating shops in California, the decorative shops, the anodizing shops and the hard chrome plating shops. These facilities fell into three categories of emissions, small, medium or large, with required reductions of Chromium emissions of 95%, 99%, and 99.8% respectively. There were 6 facilities that agreed to share their data with this study team, 2 decorative shops, 2 anodizing shops, and 2 hard plating shops.
The small emitters were able to comply with simply using a chemical suppressant that controls the surface tension in the Chromium bath tanks. Both decorative shops had similar chemical costs, and minimal capital costs.
- 61 -

The medium emitters both had to install wet scrubbers, and the capital costs were significant, ranging from approximately $23,000 to $68,000. The difficulty in retrofitting the scrubber into an existing facility drove the cost of one of the scrubbers up significantly. The capital cost of the scrubbers was in line with CARB estimates of $19,200 to $488,000. The one piece of emissions data that was supplied indicates that the cost of reducing Chromium levels was about $100 / pound of Chromium reduced.
Both of the large emitters also had to install wet scrubbers and associated equipment to comply with the 99.8% reduction levels. The capital costs to the facilities were $381,000 and $695,000, as the second facility installed 2 scrubbers, each costing $347,000. Annual operating costs for each facility not including depreciation costs average around $7,000 and $16,000. The emissions data supplied indicate that the cost of reducing Chromium levels for a large emitter is about $50 / pound of Chromium reduced.
In summary, it appears that for the small emitters, the cost estimates were fairly accurate. The ability of the facilities to comply with little or no capital cost, while using a chemical suppressant was realized. For the larger emitters that required the installation of wet scrubbers, it appears the estimates may have been low. The cost to retrofit a scrubber onto an existing facility where space constraints are an issue can significantly increase the capital expenditure. The capital costs of the installed scrubbers fell into the high end of the estimates. Based on the two sources that provided emissions data, the cost per pound of Chromium removed ranged between $100 and $50, considerably lower than the approximately $550 ex ante estimate from CARB.
It should be noted that on May 21st of 1996, the United States Environmental Protection Agency approved a Air Resources Board request to substitute the 1988 Chrome Plating ATCM for the National Emissions Standards for Chromium Emissions from Hard and Decorative Chromium Electroplating and Chromium Anodizing Tanks (referred to as NESHAP). From a federal perspective, the substitution became effective June 20th, 1996. The main difference between these two rules (CARB 1998, p. 4-2), is that California’s 1988 Chrome Plating ATCM does not allow research and laboratory operations to be exempt from emissions control, contrary to the federal NESHAP. An additional benefit of the 1988 Chrome Plating ATCM, based on source testing information, is greater emission reductions than observed under the hard chrome standard in the federal NESHAP rule. The revised Chrome Plating ATCM, as a substitute for the federal NESHAP, was approved by the Office of Administrative Law on June 26th, 1998. This additional revision of the 1988 Chrome Plating ATCM does not affect any of the ex ante or ex post cost estimates presented above given that the California standards were both broader than the federal standards and observably more stringent. Hence comparisons of ex ante cost estimates, and subsequently with ex post cost estimates, would consistently use the 1988 standards throughout.
- 62 -

IV.H. CASE 8 – CARB RULE 93-12-2 (Section 93109, Title 17 CCR)
ATCM FOR PERCHLOROETHYLENE EMISSIONS FROM DRY CLEANING OPERATIONS & REGULATION FOR ENVIRONMENTAL TRAINING
IV.H.1. Background The CARB Board-approved Airborne Toxic Control Measure (ATCM) for Perchloroethylene emissions from Dry Cleaning Operations was designed to reduce statewide emissions of perchloroethylene from dry cleaning operations by about 75%. Perchloroethylene (Perc) is a substance listed as a toxic air contaminant (TAC) with no identified exposure threshold level. For a TAC with no identifiable threshold level, Health and Safety Codes require that a regulation be designed to obtain the lowest achievable emission rate through application of a Best Available Control Technology (BACT) in consideration of cost and risk. Based upon prior research performed by CARB, Perc emissions from dry cleaning operations were not adequately regulated to protect public health statewide.
Perc emissions from dry cleaning facilities result in public exposure. It was estimated that a lifetime exposure (70 years) to Perc emitted from dry cleaning facilities would contribute an additional 250 potential cancer cases statewide. The facilities’ potential cancer risk was assessed at 50-500 cases per million.
Perchloroethylene is widely used in California in a variety of processes and products including dry cleaning, degreasing, paints and coatings, adhesives, aerosols, specialty chemical production, printing inks, silicones, rug shampoos, and laboratory solvents. In 1987, an estimated 17,000 tons of emissions resulted from these uses as well as from the production, distribution, recycling, and disposal of Perc.
According to a report prepared by CARB, adoption of the proposed rule would not have a significant adverse economic impact on most small businesses. At the time of rule adoption, more than half of the dry cleaners already had machines complying with the ATCM.
IV.H.2. General Description of the Rule Rule 93-12-2 required dry cleaning facilities to reduce their Perc emissions to the lowest level achievable through the application of a BACT. The regulation also required dry cleaning facilities to have trained operators who have successfully attended a CARB approved environmental training course. The Dry Cleaning ATCM specified equipment, recordkeeping and reporting, good operating practices, training, and other requirements for these facilities.
- 63 -

The dry cleaning regulation ensured that every dry cleaner had the three essential elements it needed to minimize Perc emissions. These elements were the BACT, the knowledge to reduce emissions, and a periodic measurement of their performance. The total statewide Perc emissions from dry cleaning were about 742,000 gallons per year. This represented about three-fourths of the total Perc used by dry cleaners in the State. After use, the remaining Perc was shipped off-site as hazardous waste and recycling. A typical commercial dry cleaner emitted about 100 to 300 gallons of Perc per year depending on the machine type and operating practices.
Prior to developing the regulation, the Board visited over 70 dry cleaning plants, participated in 80 industry meetings and conferences, and mailed out notices and documents to approximately 6,000 people. Based on the 1991 survey data provided by nearly 2,100 Perc dry cleaners, ARB characterized Perc dry cleaning operations in California prior to the regulations as follows:
• 4,800 Perc dry cleaning facilities; • 5,300 Perc dry cleaning machines; • 247 million pounds of materials dry cleaned annually; • One million gallons of Perc used annually.
Rule 93-12-2 provided significant benefits such as reduced emissions and risk by 75%, reduced worker exposure, and reduced hazardous wastes. Finally, it was estimated that 88% of California dry cleaners are independently owned commercial operations.
IV.H.3. Emissions and Emissions Reductions Perc is a volatile organic hydrocarbon with a chloroform-like odor used as a solvent in dry cleaning operations. Most emissions from dry cleaning operations are from dryers and solvent recovery residues. During the drying portion of the dry cleaning process, Perc is either vented to the atmosphere or recovered in a carbon absorber or refrigerated condenser. Carbon absorbers reduce vent emissions by about 95% while refrigerated condensers reduce vent emissions by about 70%.
When drying units are equipped with absorber and condensers, recovery residues become more significant as a source of Perc emissions. In solvent recovery, used Perc is purified by filtration and distillation so that it can be reused. Perc waste adsorbs on the filters and still-bottoms and then vaporizes into the atmosphere.
Additional emissions result from the disposal of waste, equipment leaks, and the transfer of clothes from washer to dryer. “Dry-to-dry” cleaning operations use and emit less Perc per pound of clothes cleaned than “transfer” operations. Most new dry cleaning operations are dry-to-dry operations in which clothes are washed and dried in the same unit. Transfer operations are those in which clothes are manually transferred from washer to dryer.
Apart from controlling Perc as a toxic air contaminant (TAC), about 25% of California’s air pollution control districts have adopted control measures specifying the installation of
- 64 -

emission reduction devices (e.g., carbon absorbers or refrigerated condensers) at larger dry cleaning facilities.
In California, the second major source of Perc emissions was degreasing operations. Degreasing is an integral part of many manufacturing industries including automobile, electronic, furniture, appliance, textile, paper, plastic, and glass. Based on EPA and ARB estimates in 1985 and 1989, respectively, the use of 3,300 tons of Perc by degreasers in California in 1987 resulted in estimated emissions of about 3,000 tons.
The other Perc emission sources were paints and coatings (1,300 tons in 1987), adhesives (340 tons in 1987), and some other sources like aerosols, pharmaceuticals, textiles, printing inks, and dielectric fluid for power transformers (960 tons).
IV.H.4. Cost Effectiveness for Ex-Ante Evaluation ARB based their ex ante cost estimates on the following characteristics. Perc dry cleaning operators would be required to replace all dry cleaning machines with either a new closed loop machine with primary control or convert their existing machines to a closed loop machine with a primary control system. As part of the rule, an extensive operator training program would be instituted and various record keeping and annual reporting requirements would be put in place. Finally, an extensive leak check, repair, and operation and maintenance program would be implemented. Records would be required to be maintained for a minimum of 2 years. This rule was estimated to affect about 4,800 Perc dry cleaning facilities in the State.
In the Staff report, adoption of the proposed rule was suggested to not have a significant adverse economic impact on most small businesses. More than half of the dry cleaners already had machines that met the requirements specified in the ATCM.
The annualized cost of the Rule 93-12-2 to most dry cleaners was estimated to range from $417 to $4,170 per year, with the typical dry cleaner, which produced $333,600 in annual revenues, incurring an annual cost of around $1,700. Annual costs included operation and maintenance, record keeping and reporting, training, and miscellaneous equipment. The annualized cost was based on a 15-year equipment lifetime and represented an incremental cost over what the dry cleaners would incur without regulation. ARB extrapolated this estimate statewide, assuming the industry produced $1 billion in annual revenues, the sum being under $7 million per year. About 40% of existing dry cleaners would need to either purchase new equipment or convert existing equipment. A one time cost to replace a machine was estimated to cost between $55,000 and $83,000.
In addition to developing one time and amortized cost estimates, ARB evaluated the performance of dry cleaning machines with a BACT over time, including the influence of operating practices. In the dry cleaners 1991 survey performed by CARB, three cost categories were developed that differed based on size of facility - small, medium, and large. Size of a facility was a function of pounds of clothes cleaned per year, machine capacity, number of machines, and annual Perc usage.
- 65 -

The estimated gross income for a total of 4,830 facilities in California in 1991 was $1,435 million per year. The initial total out-of-pocket cost of the regulation was $29 million per year. Total initial Perc emission reduction was 578,000 gallons per year, and the initial cost-effectiveness was $3.60 per pound reduced. The long-term regulation cost was $6.8 million per year. The total long-term emission reduction was 310,000 gallons per year. For small facilities, then, the cost-effectiveness of the regulation was $22 per gallon reduced. Total cancer burden reduction was 195 cases for 70 years.
IV.H.5. Cost Effectiveness for Ex-Post Evaluation Based on a 1991 survey performed by CARB during the Rule Action period, approximately 4,800 Perc dry cleaning operations in California were identified. In 2005, the study team contacted the CARB representatives to obtain telephone numbers and contact person’s names. A CARB representative familiar with this rule informed the team that CARB was considering reevaluating dry cleaning operations in California, and had performed a survey to do so. The representative also advised the team that they do not have any post-implementation emission testing from operations impacted by the Rule. The representative provided the team with the survey sheet prepared when reevaluating the dry cleaner industry. After reviewing the survey the team identified data relevant to the study and made a request to CARB. Three months later they sent an address list containing more than 5,000 dry cleaning operations in California.
The CARB representative also sent information on two trade associations: the California Cleaners Associations and the Korean Dry Cleaners Association. The California Cleaners Association refused to participate because of the confidentially of their membership addresses and telephone numbers. The Korean Dry Cleaners Association sent their complete membership database, but emphasized that since many of their members speak primarily Korean, communication would be a problem. Efforts to contact individual members of the Korean Dry Cleaners Association did confirm this problem. Hence, these initial efforts did not lead to much information on the ex post costs.
Subsequent efforts were considerably more successful. Several contacts were made with individual dry cleaner owners, South Coast Air Quality Management District (SCAQMD) personnel, and 2 trade organizations; The Greater Los Angeles Area Dry Cleaners Association (GLADCA) and The International Fabricare Institute (IFI). Information obtained during this process was said to be confidential, and therefore individual businesses are not identified here.15
It appears that the replacement costs for a new closed loop machine were in line with CARB estimates of $55,000 to $83,000, although on the high end. Most owners who had to replace their machines reported that they paid in between $76,000 to $83,000. However, as indicated, most of the industry already had closed loop machines installed before this rule was implemented, and those who did not have closed loop machines
15 However, the author would like to thank Mr. Bobby Smerling, owner Royal Cleaners, and past president GLADCA for his contributions to this study.
- 66 -

needed to replace their machines regardless. The actual cost to the industry was, therefore, probably overstated.
The objective of this rule of reducing statewide emissions of Perc from dry cleaning operations by 75% is still being evaluated by the CARB. IFI, however, has estimated that Perc usage in the United States has dropped about 70% over the past several years. With California’s stricter regulations, it appears this goal has been attained. One owner stated his Perc usage dropped from almost 8,000 gallons per year to about 200 gallons per year with the new closed loop machine, a reduction of over 97%. A corollary benefit of the closed loop machine is the reduced operating costs to the owners due to the reduction in solvent (Perc) costs. Although this example is perhaps extreme, this would provide a savings of some $7,800 per year based costs seven or eight years ago when Perc was priced at about $1 per gallon or a savings of between $54,600 to $132,600 per year with today’s Perc prices ranging from $7 to $17 per gallon.
Likewise, water quality regulations are putting additional pressure on owners to switch to other solvents and away from the toxic issues related to Perc. Other solvents and technologies like Hydrocarbon, Green Jet, Silicon, and even carbon dioxide (CO2) are being used as an alternative. It is estimated that Perc is used in only about 50 to 60% of the machines in the South Coast Basin today. While there is a noticeable switch away from Perc, there is concern within the industry that some of the other solvents will also eventually come under regulatory scrutiny. The Hydrocarbon alternative is a petroleum based product that requires special handling. In fact one owner has anticipated the imposition of future regulations on these other chemicals and, approximately one year ago, installed a new CO2 machine at a cost of about $200,000. This may be the future of the dry cleaning industry, but presently there are only a few machines in the United States and only two in the Los Angeles basin.
IV.H.6. Conclusions The objective of CARB Rule 93-12-2 was to reduce statewide emissions of Perc from dry cleaning operations by about 75 percent. Although this objective is still being evaluated by the CARB, it appears that considerable progress has been made, and has been accomplished by not only forcing the industry to replace their old vented machines with new or converted closed loop machines, but also by the industry switching to various alternative solvents. There are some in the industry that believe that the rest of the state will phase out Perc in the next several years just as is being done in the South Coast Basin where regulations require alternative solvents.
From conversations with various owners, it appears the cost to replace their old vented machines with closed loop machines was $76,000 to $83,000, in line with, but on the high side of the CARB estimates. It should be noted however, that almost all of the older vented type machines were at the end of their useful life, and the owners needed to replace them anyway. There are exceptions to this, but overall the industry was converting to the closed loop machines before the implementation of this rule. In fact, as stated, about 60 pecent of the industry did not need to upgrade their equipment at all. For those owners who did have to purchase new machinery, some significant savings in Perc
- 67 -

usage were realized. This correlated into monetary savings to help offset the added cost of the new machines. It does not appear that this savings was included in the ex-ante projections.
In summary, it appears that CARB Rule 93-12-2 was implemented at a cost about equal to the preliminary estimates. Perhaps there was a bit of an overstatement of actual costs because most of the open vented machines that were replaced with the new closed loop machines were near the end of their useful life, and the capital expenditures were mostly needed anyway. Likewise, a substantial savings of operating costs was realized due to significant reductions in Perc usage. Although the goal of reducing Perc usage by 75 percent is still being assessed, significant progress appears to have been made towards that goal. Although this study did not quantify the actual Perc reduction statewide, the efficiency of the closed loop machines has been demonstrated and actual reductions have been substantial, some approaching 98 percent.
- 68 -

V. ANALYSIS OF INFORMATION GATHERING PROCCESS
In general, while there were positive returns from the efforts to compile and summarize the ex ante cost estimates, the returns from nearly two years of effort to collect data on the ex post costs were disappointing. Three separate approaches were employed to gather ex post cost information during this study. This effort was limited by an impending deadline for completing the project as well as remaining funding; however, the final effort yielded enough information to allow for a useful analysis for 6 of the 8 rules. In addition to what is described above in each case study, a description of some of the problems encounter during this process is described in Section V.A below, followed by a summary of lessons learned in Section V.B.
V.A. Attempts to Obtain Ex Post Data It should not be surprising that many, if not most, of the stakeholders, trade associations, or industry representatives contacted initially were either unable or unwilling to provide cost and/or emissions data to the study team. The difficulty in collecting information from stakeholders has been made apparent in many prior studies. For instance, as pointed out in a very comprehensive report by the BBC Consulting and Research Group (BBC 2002,: page 2-4), prior efforts by CARB and the United States General Accounting Office (GAO) have been relatively unsuccessful with this approach. Of the 51 companies contacted in the GAO study in 1996, only 17 agreed to participate, 15 provided data, and none provided complete data. Alternatively, CARB was only able to get an 11.8% response rate to its survey despite a “very time-consuming and intensive effort at survey completion.”16 From an objective standpoint, there are logical reasons why stakeholders would be reluctant to provide this type of information. As the BBC (2002) report points out, there is very little incentive for the firm to share such information and often the information is not easily separated from other costs the firm incurs. For smaller businesses, expending resources to provide this data may pose a significant burden with no reward. Finally, some businesses view this data as confidential information and don’t want to share it for competitive purposes.
V.A.1. Approach One: Industry Contact lists The first approach to collect ex post cost information initially consisted of contacting affected industries. Contact lists were difficult to appropriate, and the ones that were finally obtained were mostly outdated and/or inaccurate. As mentioned above, when firms were finally reached, very little if any relevant information related to their cost changes could be gleaned. In total, more than 500 phone calls were made in conjunction with a similar amount of emails in an effort to contact some 400 of the companies that were impacted by these regulations. Unfortunately, these efforts were, for the most part, unproductive. It has been observed that many interviewed businesses were reluctant or unwilling to share any information related to compliance costs, emissions, or
16 Significance of California Air Pollution Control Regulation for Business Location Decision. California Environmental Protection Agency, Air Resources Board, Research Division. May, 1995.
- 69 -

technologies. Several firm representatives stated that such cost data is confidential and considered sensitive due to the high degree of competitiveness in their industry (this was especially true of the automobile industry and refineries - Rules 95-6-3, 91-11-1, 89-10-2, and 1173). They responded that sharing cost, emission, and technology data is not considered a very prudent strategy for a firm trying to compete in the fluid and fast-paced industry such as automobile industry. On the other hand, many of the smaller scale facilities stated, understandably so, that record-keeping is very expensive and their limited budgets impinge up their efforts -both then and now- to organize and compile the data in a manner amenable to analysis.17
The appendix shows contact lists for many of the rules analyzed. Most of these companies’ lists were outdated; hence, considerable effort was expended trying to get up to date lists and contact information. Explanations are often provided in these appendices related to why we were not able to obtain information from a particular firm. It should be noted that not all efforts are documented since after some time, it became an unproductive time sink given the scarcity of resources and time that were initially budgeted into this component of the project.
A second part to this first approach included perusing published records on industry cost estimates, by SIC code for example, with the idea of identifying cost changes. This is data that exists typically because of prior studies or for other entities. The benefit of this data, referred to as secondary data, is that it requires fewer resources to collect and is not subject to the strategic responses/biases inherent in conducting original studies. One major source of secondary data on environmental compliance costs is the Pollution Abatement Costs and Expenditures (PACE dataset) compiled by the U.S. Department of Commerce, Bureau of the Census. The dates on this data are from 1989 to 1994, and then again from 1999 to the present. Unfortunately, the PACE is designed to be statistically representative at the 3-digit SIC level on a national basis and may not be a representative sample of smaller geographic regions (BBC 2002). This certainly limits its usefulness in this study. Furthermore, the data is published at the 2-digit SIC level of detail by state, whereas the types of information required for this study is more micro-level data to enable analysis at the geographic level and industry specificity required. Additionally, PACE includes manufacturing establishments with 20 or more employees (our rules affect many establishments with firms in other sectors and with smaller businesses) and the costs are broken down by pollutant, not by specific rule or regulation.
This avenue was also unfruitful given the reasons listed above and also that expenditures are typically listed as total expenditures and at a unit of analysis larger or different than what would be required for this analysis. Rules that are narrowly tailored, such as many of the rules in this analysis, do not lend themselves well to being analyzed using the PACE data set. As an example, BBC (2002, page 4) states that “…it would be more
17 Whether the firms from which we did finally gather cost information from – either directly or indirectly – are characteristically different from those that we did was not analyzed. Given the difficulties associated with not only getting firms to participate, but even with getting contact information, we attempted to contact any and all firms possible – in effect, we attempted to perform a census rather than extract a representative sample of the affected firms.
- 70 -

feasible to perform a PRA of economic effects for a rule involving the wood furniture industry (which comprises most of a 2-digit SIC code) than for a rule involving the dry cleaning industry (which is a 4-digit SIC code). A PRA on the economic impacts of rules which pertain to only a subset of firms within a 4-digit SIC code (such as restaurants using charcoal broiling processes) will be most difficult of all.”
In our efforts to obtain cost and emissions information from secondary data, we evaluated the following well-known sources of secondary data: PACE (Survey of Pollution Abatement Cost and Expenditures Data), SBO (Survey of Business Owners), BES (Business Expenses Survey), LRD (Longitudinal Research Database), Annual Survey of Manufacturers, Facility Search Engine from CARB Database. However, as listed in Appendix G, table G1, all of these databases present some difficulties to perform the ex-post analysis on a regional base, and for small-scale industries. For informational purposes, the SIC codes are listed for each rule in table G2.
V.A.2. Approach Two: Equipment manufacturers With the assistance of Dr. Reza Mahdavi of the CARB, a second approach was undertaken to gather cost information from air pollution control (APC) equipment manufacturers. If current cost estimates were obtained from the APC list, it should be acknowledged that backing out a comparison of ex ante vs. ex post cost estimates based on the price of capital equipment, pollution expenditures today is a tenuous task given it would require accounting for the many factors that would cause the cost to change over time, especially over 5 to 10 years. These include: changes in input prices or technological efficiency, and changes in market conditions that affect market prices. It is noted, however, such information could be useful in understanding what technologies are currently being used, or perhaps have been used in the past. Coupling this with best estimates of the capital and operations and maintenance costs would provide some information for comparison with ex ante estimates. Yet, as indicated in Rule 90-5-1, it is important to contact APC manufacturers that are very specific to the rule at hand (such as the two medical equipment providers, BC Technology Inc. and Special Team Medical Services Inc. we contacted). Else, efforts using much more aggregated data (such as from the PACE website) or obtaining information from manufacturers not really familiar with the industry will likely to lead to poor estimates at best, and no estimates at worst.
V.A.3. Approach Three: Technical ContactsBecause of the lack of progress from approaches one and two, a third approach was undertaken in January of 2005. In this instance, engineers and specialists with expertise in air quality management from UCR and NN Environmental Consulting developed contact lists for stakeholders of six of the ten rules and attempted to collect cost data. The contact lists were developed in a number of ways including internet searches, ex-coworkers, and information provided by ARB and SCAQMD personnel. This effort was limited by an impending deadline for completing the project as well as remaining funding; however, it did provide limited success in obtaining some ex post cost and technology data. It also provided some insight into how greater success in obtaining ex post cost information might be achieved in the future, as described in the next section.
- 71 -

V.A.4. Difficulties Encountered on Individual Rules Below are some suggestions or comments related to a few of the rules that proved to be difficult to obtain ex post costs and implementation data from:
(i) Rules 89-10-2 and 95-6-3 These rules involve modifications to engine, fuel and exhaust systems from on-road vehicles. These rules are inherently more difficult to identify and analyze since emission controls are incremental. The data needed for the study is mostly confidential for competitive reasons, and are extremely difficult to obtain though voluntary cooperation with the industry.
(ii) Rules 91-11-1 and 1173 These rules require engineering and process changes specific to affected fuel refineries. The data needed to estimate ex post costs include rule impact on design, retrofit work, and operations modified as a result of the rule. Active cooperation of the local refinery, as well as its parent company is needed on a voluntary basis to obtain this data for this study. Because there is no incentive for the refineries to participate in this study and with much of the information deemed confidential, it is difficult to obtain meaningful information from the affected industries. Personal contacts were used to obtain the small amount of information obtained for Rule 1173.
(iii) Rule 1138 This rule applies mostly to fast food (hamburger) facilities. Headquarter representatives from each affected facility participated or followed along with the rulemaking process, and trained franchise owners on how to comply with the rule. The most helpful information was obtained from the industry headquarters and persons initially involved in the rule-making process. Although the franchise owners are required to maintain the records individually, they were not as receptive to providing this type of information on a voluntary basis.
(iv) Rule 1153 This rule applies to bakeries in the South Coast Basin. Although about half of the baking capacity is represented in the responses to this study, some companies declined to participate due to competitive purposes. However, the cost data is generally thought to be quite accurate. There is not as much confidence in the emissions data that was collected. Most companies either wouldn’t say what their VOC reductions were, or they didn’t know.
(v) Rules 93-12-2 and 88-2-2 These rules apply to the dry cleaning and Chrome plating industries. These industries are both represented by a rather large group of highly competitive, owner operated small businesses, and it is difficult to obtain a representative sample of the industry due to the number of businesses in operation. Over 400 Chrome plating businesses and almost 5,000 dry cleaning businesses are affected by these rules. The costs associated with the dry cleaners are probably quite accurate. It is likely that the costs did not vary significantly from business to business. The same probably cannot be said for the
- 72 -

Chrome plating industry. As evidenced by the limited data obtained during this study, the installation costs can vary significantly from business to business.
It was the observation of team members that plating shops seem unlikely to have the financial resources to install expensive APC. They either operate in margin of the law or are in the process of disappearing in California. It was learned that much of the plating done for bathroom fixtures is outside the U.S. where environmental laws are more lenient.
V.B. Lessons Learned As described in the previous section, an extensive campaign to collect data on ex post costs was conducted over two years, with few successes and many difficulties. In total, over 1000 attempts were made to contact entities affected by the rules via telephone, email, and hardcopy mail.18 Specifically, using telephone surveys as a method of gathering data often produces a low information yield because:
• Accurate and up-to-date phone lists are difficult to produce • The right person to talk to is seldom answering the phone • Any request done in the name of the ARB or SCAQMD will raise suspicion • The person making the call should “speak the language” of the industry contacted • If the entity is willing to share some data there is little assurance that the data will
be complete, accurate or up to date
In the instance that industry representatives were successfully contacted, many were either unable or unwilling to provide the necessary cost and emissions data to the study team. The main reasons that industries did not provide information include:
• Lack of resources (particularly for the smaller firms) for allocation to record keeping as well as extracting and reducing relevant data when requested.
• Length of time between rule implementation and request for data (due primarily to changing personnel/companies or loss of data files over time).
• Strategic behavior (reluctance from the firm’s perspective) to provide information contradicting original industry estimates
• Rule contained no provisions to require record keeping, therefore no records were ever made
• Confidentiality concerns • Lack of financial or other incentive to cooperate (information was being requested
on a voluntary basis by a non-enforcement entity)
18 As mentioned previously, given the expected difficulties of getting even a reasonably sized sample, we made an effort to contact all firms and industries affected - i.e., a census rather than a sample. If we had a list containing a large number of contacts (e.g., > 1000), we would choose every 10th contact. In the end, we used the data from any firm that would agree to participate. Whether these estimates are from a representative sample is not a luxury we were afforded.
- 73 -

In contrast, there were some very helpful firms and industries that were able to provide some useful information. The main reasons these specific individuals could and did provide information include:
• The rule contained specific provisions requiring record keeping of cost and maintenance data
• Industry representatives had a true interest in the outcome of the study and believed it was in their best interest to cooperate and have a chance to share their experience with no repercussions or contact with a regulatory agency
• Industry representatives had cooperated in the initial rulemaking and had first hand knowledge and easy access to information.
- 74 -

VI. RECOMMENDATIONS AND CONCLUSIONS
VI.A. Recommendations for Process Improvement
Several recommendations for improving the approach and information gathering process on ex ante and ex post data were developed during this study. Existing recommendations for selecting appropriate rules for conducting ex ante and ex post costs analysis have been documented by the BBC. While these recommendations were found to be useful in determining good candidate rules for a successful analysis, additional guidelines gleaned from this study include the following:
• Encourage strong industry participation throughout the entire rulemaking process. It should be emphasized that more reliable estimations are obtained when there is effective communication with the regulator and affected industries from theory to post implementation phase of the regulation.
• Require each affected industry to report their contact information to the rulemaking agency on who is responsible for implementing the controls and maintaining any records. The rulemaking agency should maintain this list electronically and update as needed. This would immensely improve the ability to gather ex post data while requiring minimal time effort on the part of industry and enforcers.
• As part of the rule, require record keeping and reporting to the agency cost, maintenance, and emissions data as deemed cost effective and reasonable.
• Collaboration between the regulatory agency and industry stakeholders via the setting of a working group is important during and after the rulemaking process in generating ex ante and ex post cost estimates.
• Surveys and focus groups of industry stakeholders should be conducted with the participation of actual data users to strengthen quality of data.
• Use of third party technical experts to collect information on cost and emission reductions for control equipment may be considered. In some instances, third party technical experts can have greater knowledge in specific areas. Third party experts may also have better access to industry stakeholders (under the condition of anonymity).
• As part of the FBA and rule selection process, choose rules that have recently been adopted or amended (~1-2 years) to maximize the availability of knowledgeable personnel, correct contact information, and access to data files.
- 75 -

In summary, the approach upon which this study was based is not an optimum approach to achieve the desired goal. For all the reasons noted previously in this report, it is difficult to obtain the desired ex post information and, if obtained, may be of questionable value due to a variety of potential biases. We certainly support and encourage the idea of the use of more frequent post rule analysis, especially for the more controversial rules. Additionally, more accurate audits would be possible if the rulemaking authority also included, and followed up on, a cost reporting requirement in the rule. In this way, regulated entities would be required to report their capital and installation costs upon achieving compliance with the rule and annual operating costs for each of the first three years of operation. This would greatly improve the opportunity to make ex ante to ex post comparisons with sufficient validity to base changes in the methodologies for ex ante determinations.
VI.B. Conclusions of Analysis Based on the analysis of the eight rules in this study, the following summary statements and conclusions were drawn:
• The rulemaking agency considerably overestimated the actual costs for three rules, underestimated the costs for one rule, and estimated very similar to actual costs for two rules. The ex post cost information obtained for one rule was insufficient to allow a conclusion to be reached.
• In the instances where ex ante costs between the agency and industry were similar, significant stakeholder involvement beginning early in the rule formulation was observed. Additionally, the ex ante costs were generally closer to actual costs than if industry was not involved in the process. The collaboration between industry and the rule makers appear to have very useful benefits in aiding CARB and the District to develop more accurate ex ante cost estimates.
• In all cases where both industry and CARB or the SCAQMD provided ex ante costs, the industry’s predicted costs were higher.
• In developing predicted costs, it is not an uncommon practice for the regulatory agency to generate a range of estimates. This would lead to an expectation that if the ex ante costs are accurate, the typical actual costs would occur within the midpoint of that range. In 5 of the 7 cases, actual capital costs were within the range of the agency estimates, however, they fell into the upper 50% of the range and, for 4 of the rules (Rules 1153,1174, 88-2-2, and 93-12-2), were in the very upper range of the estimated capital costs. It must be mentioned, however, that the overestimation of predicting capital costs does not necessarily result in an overestimation of the overall cost per ton emission reduced. In fact, there are several instances where the capital costs were in the high range, and the actual ex post cost in dollars / ton reduced was lower than that predicted by both industry and the agency.
- 76 -

• Regulations can have a significant effect on the direction of growth within an industry. The evidence is mostly anecdotal, but several of the industries, most notably the contract sterilization industry, which were part of this study, have undergone considerable consolidation in the past several years. This has been, at least in part, due to the regulations impacting their businesses.
• In some instances, size-related exemptions may result in unwanted effects. In the case of the bread bakeries, the small oven exemption appears to have catalyzed a movement toward decentralization of the industry. A proliferation of small specialty operations, primarily in large chain grocery stores has occurred since the time of the initial rule adoption. Some grocery store centralized bakeries were sold, or shut down, and smaller, non-regulated ovens were started up in individual grocery stores to make specialty products (fresh baked bread on premises). Decentralization and the proliferation of exempt ovens were not envisioned during the rulemaking and, as a result, the full reduction potential of the adopted rule was probably not realized.
Although there is a fairly good correlation between ex ante and ex post capital costs for most cases, the correlation breaks down for cost per pound of pollutant reduced. In general, most of the participants were comfortable giving the actual costs to install the pollution control equipment when those costs were readily available. An understanding of emissions requires a higher degree of technical knowledge than an understanding of the cost of a control device and is generally not germane to the operation of most businesses. As a result, the emissions data obtained from stakeholders may not be sufficiently accurate to support some of the conclusions regarding the cost per unit mass of pollutant reduced. Additionally, there was a general reluctance to share emissions data. This is probably due to concern of reprisal if the data is used in the wrong manner or can somehow show non-compliance. This attitude can be attributed in part to a failure of small business owners to fully understand the regulations they are under and, perhaps, an inherent concern on their part of making an error or mistake in reporting.
- 77 -

REFERENCES
BBC Research and Consulting. 2002. “Anticipated Guidelines and Methodology for Post-Rule Assessment.” Report prepared for the South Coast Air Quality Management District by BBC Research and Consulting. July 17th, 2002. Denver, Colorado.
Cackette, T. (2000) Personal communication.
California Air Resources Board (CARB). 1998. “Application to the United States Environmental Protection Agency for Delegation of the Hexavalent Chromium Airborne Toxic Control Measure for Chrome Planting and Chromic Acid Anodizing Facilities.” July. Sacramento, California.
Goodstein, E. 1997. Polluted Data. The American Prospect 8(35): 1-9.
Harrington, W., R.D. Morgenstern, and P. Nelson. 1999. “On the Accuracy of Regulatory Cost Estimates.” Discussion Paper 99-18. Resources for the Future. Washington, D.C.
Hammitt, J.K. 2000. “Are the Costs of Proposed Environmental Regulations Overestimated? Evidence from the CFC Phaseout.” Environmental and Resource Economics 16: 281-301.
Lents, J.; Barnes, K.; Nikkila, N.; and Tatsutani, M. (2000) The Regulation of Automobile Emissions: A Case Study. In Environmental Regulation and Technology Innovation: Controlling Mercury Emissions from Coal-Fired Boilers. Northeast States for Coordinated Air Use Management, Boston, MA. September.
Natural Resources Defense Council. 2004. “Comments on the Proposed Adoption of Regulations by the California Air Resources Board to Control Greenhouse Gas Emissions from Motor Vehicles.” by R. Hwang and D. Doniger. September 23rd. Sacramento, CA.
- 78 -

GLOSSARY
: Air pollution control
: California Air Resources Board
: Airborne toxic control measure
: Air quality management plan
: Best available control technology
CARB: California Air Resources Board
CO: Carbon monoxide
District: Air quality management district
EtO: Ethylene oxide
Ex Ante: Beforehand
Ex Post: After the fact
FBA: Facility-based assessment
HC: Hydrocarbon
O&M: Operations and maintenance
Perc: Perchloroethylene
PM: Particulate matter
PRA: Post-rule assessment
ROC: Reactive organic compounds
SCAQMD: South Coast Air Quality Management District
VOC: Volatile organic compound
APC
ARB
ATCM
AQMP
BACT
- 79 -

Appendices:
Data Related to Contact Information and E forts to Collect Cost Information f
- 80 -

Appendix A: Rule 1153
Table A1. Commercial Bakeries’ List (original list)
Company' Name cess Calling Pro Number Provided Ex Post
rmation info Miscellaneous 1 Western Bagel Corp. Disconnected 2 Vons. Comp. Inc. Disconnected
3 Foix French Baking Co. Disconnected 4 Van de Kamp's Holland
Dutch Bakery Disconnected
5 Pacific Multigrain Foods and Fornaca Family Bakery
Disconnected
6 Alpha Beta Co. Disconnected 7 Freund Baking Co. (818) 502 1400 (323) 724 3000 Plant Manager's Yes
Assistant ey were willing to participate for preparing the data Th ission and actual cost data). After a few weeks, they (em
informed us it that it might be difficult to gather data since it was nearly 10 years ago.
8 Albertson's Central Bakery Disconnected 9 Galasso's Bakery Disconnected 10 Certiified Grocers of
California Disconnected
11 Martino's Bakery Inc. Disconnected
- 81 -

Table A1. Commercial Bakeries’ List (continued)
12 ands Corp. Interstate Br (818) 846 3671 323) 660 ( 455 ext. 119 4 David Gravys Yes
hey talked with their law division about our request. T o months later they sent annual operations cost for Tw
ACT, not emission data. This is current costs, not B sts after ruling. Many variables have changed. co
13 Peter Pan of Hollywood change of business
14 Fornaca Family Bakery change of business
15 Best Foo d Baking Group (714) 996 7910 eral times called and left a message. No response Sev or months. Have responded but no data available. f
16 Bridgford Foods Group (714) 526 5533 14) 992 (7 9321 faks
ill Bridgford B 714) 526 (
5533 ext. 5200
hey requested detailed info with fax for contact T rsonpe 's name. Left messages with manager. Manager
nally responded, advised us that they have since fi changed production area and are not subject to Rule 1153.
17 Ralphs Grocery Co Bakery Disconnected Yes
18 Entenmann's/Oroweat Bakery Disconnected Yes
19 Pioneer French Baking Disconnected
20 International Baking Co. Inc. Disconnected
21 Fresh Start Bakeries Disconnected Yes 22 Harvest Day Bakery Disconnected
- 82 -

Table A1. Commercial Bakeries’ List (continued) 23 Division of American
Bakeries Disconnected
24 Bell Brand Foods Disconnected 25 Bob's Big Boy, Inc. Disconnected 26 CAL French Inc. Disconnected 27 Chippers Not Hut Disconnected 28 Four-S Bakeries Disconnected 29 Fr ench Americanm
Bakery Disconnected
30 Frisco Baking Co. connect Dis ed 31 Fri to-Lay Inc. Disconnect ed 32 ITT Continental Baking
Co . Disconn ect ed
- 83 -

Appendix B: Rule 1173
Table B1. The Permitted Petroleum Facilities under Rule 1173 Facility ID
Facility Name City State Zip Rep. Name Phone Updated Contact
Updated Phone Response
162 Continental Airlines Unit No.02 Los Angeles CA 90045 Thomas Braun 310-258-3300 Anna Schmitt 713 324 6942 Left messages, no responses.
4945 Chevron Products Company El Segundo CA 90245 Neal Truong 310-615-5889 left messages 8439 Exxon Mobil Corp Long Beach CA 90803 Laura Johnson 714-431-1213 wrong number 10805 Chevron U.S.A. Inc Unit No. 88 El Segundo CA 90245 Neal Truong 310-615-5889 left messages 11076 Shell Oil Co Unit No. 63 Carson CA 90745 R. Kawczynski 310-816-2340 Tom Jackson 310 816 2046 eft messages. L
hey said they T ould be willing to w
participate. No ata or effort to d ate. d
11922 Union Oil Co Of Cal Unit No. 46 Wilmington CA 90744 D N Price 213-513-7600 wrong number 12066 Chevron Products Company El Segundo CA 90245 Neal Truong 310-615-5889 left messages 13189 Unocal Corp #47 Wilmington CA 90744 M. Marrinan 310-952-6116 left messages 13990 Us Govt, Veterans Affairs Medical
Center Long Beach CA 90822 Al Greenrock 562-494-2611
14066 Chevron Products Company El Segundo CA 90245 Neal Truong 310-615-5889 left messages
- 84 -

Table B1. The Permitted Petroleum Facilities under Rule 1173 (continued)
18609 Exxonmobil Oil Corporation Torrance CA 90504 oSharon Cristin 310-212-3763 sleft message Returned ou t calls. e send Requested w
email to sing@ tiffany.l.men
exxonmobile.com. nd Sent email a nderseveral remi
phone calls. To onse date, no resp
or data. 21537 Chevron Products Company El Segundo CA 90245 Neal Truong 310-615-5889 left messages 32272 Union Pacific Resources Wilmington CA 90744 Davis Scharff 40552 Golden West Ref Co Santa Fe Springs CA 90670 David J. Drag t 10-921-3581 3 disconnected 40563 Golden West Ref Co Unit No. 22 Santa Fe Springs CA 90670 gt David J. Dra 310-921-3581 disconnected 40583 Golden West Ref Co Santa Fe Springs CA 90670 Douglas B. Ayer 213-921-3581 disconnected 40898 Trans World Airlines Inc, Unit No.02 Los Angeles CA 90009 40951 Dominguez Energy Co Carson CA 90746 Jaimie J Clark 714-981-0459 disconnected 44586 Rohrig Petr Co Signal Hill CA 90806 John Rohrig 714-842-6338 left messages 46875 Scott Oil Co Huntington Beach CA 92646 William J. Scott 714-662-5718 Tom Scott (son
of owner) and Daryl Scott (562) 843 6903
714- 535-1011/714-432- 9255
After several phone onversations with c aryl Scott, they D
were willing to participate but to date no data
rovided. p 46992 Brindle & Thomas Huntington Beach CA 92648 John Thomas 714-556-1834 they didn't
want to talk Refused to
participate.
- 85 -

Table B1. The Permitted Petroleum Facilities under Rule 1173 (continued)
6992 4 Brindle & Thomas Huntington Beach CA 92648 John Thomas 714-556-1834 they didn't want to talk
Refused to participate.
47005 Brindle & Thomas Huntington Beach CA 92648 John Thomas 714-556-1834 they didn't want to talk
Refused to participate.
47006 Brindle & Thomas, Talbert Lease Huntington Beach CA 92648 John Thomas 714-556-1834 they didn't want to talk
Refused to participate.
47009 Brindle & Thomas Huntington Beach CA 92648 John Thomas 714-556-1834 they didn't want to talk
Refused to participate.
47022 Weir Oil Co Huntington Beach CA 92648 Don Weir 714-960-3744 he doesn't want to talk
efused to R participate.
47385 Capro Oil Co Huntington Beach CA 92648 47397 Cather Production C0, Tenycke
Lease Long Beach CA 90807 Kurt Elliott left messages
47399 Cather Production Co, James Lease Long Beach CA 90807 tKurt Elliot 14-534-2048 7 eft messages l 47402 Cather Production Co, Green Lease Long Beach CA 90807 K Elliott 714-534-2048 left messages 47403 Cather Production Co, Lamb Lease Long Beach CA 90807 K Elliott 714-534-2048 left messages 47445 Herley-Kelly Co (Fee Lease) Long Beach CA 90807 David Herley 47651 Us Govt Naval Air Station North
Island San Diego CA 92135 sDavid Nicholl 619-545-1125 Disconnected
47708 Hellman Properties Llc Seal Beach CA 90740 nnahMike Ha 213-431-6022 Disconnected 49475 H & L Operators, Hannah/Laney
Dba ill Signal H CA 90806 John Rohring 714-842-6338 left message s
49966 Texaco Ref & Marketing Inc, Unit No. 20
Wilmington CA 90744 Martin Arteaga 310-522-6411 Disconnected
49993 Texaco Ref & Marketing Inc Unit No.54
Wilmington CA 90744 Gregory Brandt 310-522-6380 Disconnected
49994 Texaco Ref & Marketing Inc Unit No. 57
Wilmington CA 90744 nDoug Thompso 310-522-6130 Disconnected
- 86 -

Table B1. The Permitted Petroleum Facilities under Rule 1173 (continued) 54615 Fletcher Oil & Refining Co
Gnrl Carson CA 90745 eWilliam Thorp 562-531-2060 Left messages
to Jim Cresma n from the
ivision of D Env.
I have positive response
nitially suggested I hey were willing t
to participate. othing to date. N
54940 Laxfuel Corp Unit No.04 Los Angeles CA 90045 Andrew K Grant 213-646-2990 Disconnected 57756 Texaco Refining & Marketing Inc
Gnrl Wilmington CA 90744 William H
Freedman 213-680-6400 wrong number
62146 Chemoil Ref Corp Unit 02 Signal Hill CA 90806 Ted Chrestensen 213-424-8515 wrong number 62165 Chemoil Refining Corp Signal Hill CA 90806 Ken Ezoe 562-427-6611 Left messages 63013 Cooper And Brain Inc Los Angeles CA 90044 Don King 213-834-4411 Disconnected 63401 Ultramar Refining Unit No.21 Wilmington CA 90744 Steven O.
Epperson 63731 Ultramar Inc, Unit No.15 Wilmington CA 90744 James Hatchell 310-491-6631 Disconnected 63742 Ultramar Inc Wilmington CA 90744 Leslie E Norton 310-491-6677 left messages 63746 Ultramar Inc, Unit No.13 Wilmington CA 90744 Jason R. Lee 62-491-6608 5 eft messages l 65358 Trans World Airlines Inc, Unit No.03 Los Angeles CA 90045 Charles A.
Soules 213-646-5907 Disconnected
65380 Sfpp, L.P. Unit No.01 Orange CA 92867 Jack Freeman 714-538-0207 fax number Sent a fax No response. 66816 Lbth Inc. Castaic CA 91310 W.J. Lovingfoss 805-642-6881 They wanted a
detail fax about our request, Fax: (805) 654 8557
I sent the faks on Friday 19th
December
Said willing to participate. No effort or data to date though.
67434 Laxfuel Corp Unit No.05 Los Angeles CA 90045 ng J. Eric Boli 213-646-5915 ted Disconnec 67852 Brindle & Thomas Huntington Beach CA 92648 John Thomas 714-556-1834 Refused to talk
- 87 -

Table B1. The Permitted Petroleum Facilities under Rule 1173 (continued) 68846 Laxfuel Corp Unit No.08 Los Angeles CA 99000 Andrew Grant 213-646-5915 Disconnected 68954 E.D. Mitchell, An Individual Santa Fe Springs CA 90670 llE.D. Mitche 213-595-5775 69537 Herley Petroleum (Dell Lease) Long Beach CA 90807 David Herley 213-424-2523 Disconnected 70105 ergy, L.P.,Carson Dominguez En
Estate Co. Torrance CA 90503 C A Champion 213-638-7791 Disconnected
70206 Harbor Investment Co Wilmington CA 90744 Richard Young 71189 Old-Field Assoc./M, Bair, T. Cacek
Etal Signal Hill CA 90807 Mike Bair 310-595-4475 Disconnected
73752 Delta Air Lines, Inc. Los Angeles CA 90045 Dave Wallace 213-646-6925 Disconnected 77259 Lbth, Inc./Sepulveda Lease Saugus CA 90631 R W Bowman 805-642-6881 left messages There is not any
response. 78148 Laxfuel Corp Unit No.12 Los Angeles CA 90045 James Moses 213-646-1334 Disconnected 78212 Dentino Oil Co Yorba Linda CA 92868 Mauro Dentino 714-528-2347 They are
changing the business for some personal reasons
84135 Golden West Refining Unit #41 Santa Fe Springs CA 90670 101299 Tidelands Oil Production Co Wilmington CA 90744 Mark Shemaria 310-436-9918 wrong number 104013 Aera Energy Llc Brea CA 92821 Milan Steube 714-969-3234 Left messages ckThey called ba
and will try to compile some cost data for the project and send.
No data sent.
113160 ilton Costa Mesa H Costa Mesa CA 92626 Patrick Serge 714-540-7000 124589 Breitburn Energy Company Llc Brea CA 92823 Pat Gorski 213-225-5900 They will
compile cost and emission
d.data and sen
After several reminder phone calls, still no data.
- 88 -

Table B1. The Permitted Petroleum Facilities under Rule 1173 (continued)
125905 mental GE Energy & Environ Research Corp
vineIr
CA
92618 Peter Maly 949-552-1803 They haven't done anything for Rule 1173, but they gave a Lab name (Quantum Analytical Lab. 310 830 2226)
ab said they L have some emission and cost data but person who worked on Rule, Dr. Andrew Requito, gone til February. Left messages.
To date, no response.
136475 Lomita Rail Terminal, Llc Carson CA 90810 Gary Lawrence 281-648-1111 Left messages No data.
800030 Chevron Products Co. El Segundo CA 90245 Neal Truong 310-651-5669 Disconnected
800193 La City, Dwp Valley Generating Station
Sun Valley CA 91352 Tim Conkin 213-367-0443 Left message, they returned my call and they said they sold the facilities to the ULTRAMAR (Jason Lee, (562) 491 6608).
ULTRAMAR called and said there is not any facility under Rule 1173.
June Christman 562-748-4704 jchristman@pp cla.com, Contact suggest she will try to gather data.
- 89 -

Table B1. The Permitted Petroleum Facilities under Rule 1173 (continued)
Shell Oil Products-Us Chris Rathbun 310-522-6451 ctrathbun@she llopus.com, called me back and wanted to send email about our request (Chris: ctrathbun @she llopus.com I sent the em lai and he will gather the info
After several phone conversations and emails, they were willing to help, but after a couple
ks later they wee ed that they inform
cannot to participate because of the lack of data and time
- 90 -

Appendix C: Rule 1174
Table C1. The Approved Manufacturers’ List for Charcoal Ignition Products in Southern California
Product Mfgr. Address Product Name Web Browsing Response
Classic Fuels 2506 Zurich Dr., Ste. 5, Fort Collins, CO 80524 CRL's Ultra-Lite Garrut Mfg. Corp. 15775 N. Hillcrest, Ste. 108, Dallas, TX 75248 Fire-Up Charcoal AOK Products 7984 Stagecoach Rd., Cross Plaines, WI 54615 AOK Fireliters EZ-Lite P.O. Box 33942, San Antonio, TX 78265 EZ-Lite Fire Starter (800) 707-EASY Called several
times. Contacted - they will call back. Subsequently, advised us that they do not ell in the area. s
Tyson Consumer Products 15237 Sunset Blvd., Pacific Palisdes, CA 90272 Lightnin' Rods Gelron Corp. 1616 Ogden Ave., Lisle, IL 60532 Enviro-Fuel w/Hawaiian Lovoc, Inc. 12932 Victory Church Rd., Raleigh, NC 27613 Bon Fire Happy Jack Corp. P.O. Box 711, Pacific Palisades, CA 90272 Happy Jack's Bag Light Two Trees Products P.O. Box 4527, Carson, CA 90749 East Start Charcoal 1-888 505-
WEST (9378 ) left messages Peter Wyckoff, (818) 353
1189, fax:(818) 353 5578. Send them fax and the summaries of rule. No data yet.
NU-TECH 8001 SE King Rd., Milwaukie, OR 97222 NU-TECH Start-UP Hexacorp, Inc. P.O. Box 370, Bass Lake, CA 93604 Hexaflame Master Start Charcoal Master, Int'l. 1731 10165 Valley Blvd., El Monte, CA 0 Charcoal Master 415-647-2088, wrong number P.C. Campana, Inc. 2115 W. Park Dr., Lorain, OH 44053 Camp's Fire BBQ Box EEB, Inc. 67 35th St., Manhattan Beach, CA 90266 5 avajo Charcoal Lighter N Griffo Products, Inc. 1400 N. 30th St., Quincy, IL 62301 Cob Lites Alkohol Handelskontor 101 E. Key Capri, Treasure Island, FL 33796 rilly Willy G Safelite, Inc. 245 SE International Way, Ste. A, Milwaukie, 4
OR 97222 Safelite 14-210-9000 6 left messages
- 91 -

Table C1. The Approved Manufacturers’ List for Charcoal Ignition Products in Southern California… (continued)
Coldiron Wood Products 136 E. Hill St., Oklahoma City, OK 74145 ht-A-Bag Mesquite Lig 405-525-5541 sleft message Royal Oak Enterprises hwood Pkwy., Ste 800, Atlanta, GA 30338 900 As Re-packaged Charcoal
Lighter 678-461-3200 ges left messa
Clorox P.O. Box 493, Pleasanton, CA 94566 Kingsford BBQ Bag 510-271-7000 (510) 271 7000 R&D
Talked with Ryan Williams (925) 425
ent an email 4338 and s about our project (as requested). They advise will talk in their group meeting and inform me. No response or data to date.
Clorox P.O. Box 493, Pleasanton, CA 94566 Kingsford Match Light Clorox P.O. Box 493, Pleasanton, CA 94566 Kingsford Char. Lighter Seymour Mfg. Co. 500 N. Broadway, P.O. Box 248, Seymour, IN
42274 Seymour Fire Blox 812-522-2900 Left phone and
fax messages. They replied.
bout Sent fax a Rule1174 , fax:(812) 522 6109
No subsequent response to date.
Forest Technology Corp. 299 N. Arlington St., Akron, OH 44305 Starterlogg™ Brand Reckitt & Colman 1655 Valley Rd., Wayne, NJ 07474 Wizard Char. Ltr./Gulf
Lite Char. Str. Reckitt & Colman 1655 Valley Rd., Wayne, NJ 07474 Wizard Char . Lighter
Blocks
- 92 -

Table C1. The Approved Manufacturers’ List for Charcoal Ignition Products in Southern California… (continued)
Diamond Brands, Inc. 1820 Orangewood Ave., Ste. 101, Orange, CA 92668
Supermatch 800-777-7942 Christoph er Schaefer
uality Q Assurance Manager/Plant Chemist Alltrista C eronsum Products Company 1800 Cloquet Avenue
loquet,C Minnesota 55720
At the first phone conversations they were
illing to participate, w but there is no any data
: (218) to date. Phone 878-2755 Fax: (218) 879-6369
Bortz Distributing Co., Inc. 6043 Tampa Ave., Ste 205, Tarzana, CA 91356 Klear-Lite Char. Lighter Gel
818-342-8922 Talked with the owner.
ldCompany so vision di
related to arcoal. ch
Horizon nvironmental E
Lab. might have cost and emission data
Pine Mountain Corp. 1375 Grand Ave., Piedmont, CA 92610 Fire Flakes Weber-Stephen Products 200 E. Daniels Rd., Palatine, IL 60067 Flamgo 17 g 00-446-1071, 8
866-249-3237, 847-202-2773.
47-934-5700 8 Env. safety
ivision, Chris D
eft messages. No L response.
Weber-Stephen Products 200 E. Daniels Rd., Palatine, IL 60067 Flamgo 12.5 g Pacer Technology 9420 Santa Anita Ave., Rancho Cucamonga, CA
90670 tBar-B-Bric Zap Ligh 00-538-3091 8
909-987-0550.
- 93 -

Table C1. The Approved Manufacturers’ List for Charcoal Ignition Products in Southern California… (continued)
Angeles Chemical Co. 8915 Sorenson Ave., Santa Fe Springs, CA 90607 Klear-Lite Fluid Phillips 66 337 Phillips Bldg. Annex, Bartlesville, OK 74004 Soltrol 100 281-293-1000 left messages
(environmental safety division,
ary) M
No response.
Phillips 66 337 Phillips Bldg. Annex, Bartlesville, OK 74004 Soltrol 130 Royal Oak Enterprises a, GA 30338 900 Ashwood Pkwy., Ste 800, Atlant One-Time Instant
Lighting 678-461-3200 ivision D
anager Bob M Gossip.
eft messages, no L sponse. re
Royal Oak Enterprises 900 Ashwood Pkwy., Ste 800, Atlanta, GA 30338 Multi-Use Instant Lighting
Imperial Products P.O. Box 549, Salem, MO 65560 Instant Lighting Char. 800-537-7285, 765-966-0322
They do not ll any se oduct under pr ule 1174 R
Royal Oak Enterprises hwood Pkwy., Ste 800, Atlanta, GA 30338 900 As 2lb. Wax-coated Lump Char.
Royal Oak Enterprises 900 Ashwood Pkwy., Ste 800, Atlanta, GA 30338 Brix Instant Lighting Char.
Unocal Chemicals & Minerals Div.
14445 Alondra Blvd., La Mirada, CA 90638 Napthol Spirits 66/3 310-726-7600
Arrow Industries 845 Crossover Lane, Ste. 124. Mem phis, TN 38117
Just Light 4.0lb. 00-242-7769 8 headquarter: (317) 888 9800). Indiana
eft messages, no L response.
Arrow Industries 845 Crossover Lane, Ste. 124. Mem phis, TN 38117
Just Light 2.5lb.
Trans America Chemical 9511 E. 54th St., Tulsa, OK 74145 Dragon Light Instant Briquets
Royal Oak Enterprises 900 Ashwood Pkwy., Ste 800, Atlanta, GA 30338 R.O. Char. Ignition Product
Ashland Chemical 45608600 Enterprise Dr., Newark, CA 9 Kwik-Dri 614-790-3475 t messagelef No response
- 94 -

Table C1. The Approved Manufacturers’ List for Charcoal Ignition Products in Southern California… (continued)
Exxon Chemical Co. P.O. Box 5200, Baytown, TX 77522 Char. Lighter 105 81-834-1000, 2 248-350-6500, 732-321-6000
Rutland, Inc. 801 N. Church St., Jacksonville, IL 62650 Safe Light Fire Lighters 00-438-5134, 8 704-553-0046
ft messages le No response
Exxon Chemical Co. P.O. Box 5200, Baytown, TX 77522 Char. Lighter 105 LO Exxon Chemical Co. P.O. Box 5200, Baytown, TX 77522 Char. Lighter 142 CA Exxon Chemical Co. P.O. Box 5200, Baytown, TX 77522 Char. Lighter 125 Trans America Chemical 9511 E. 54th St., Tulsa, OK 74145 Red Hot Char. Briquets Shell DevelopmentCenter P.O. Box 1380, Houston, TX 77251 Envirolite Fluid 713-348-4614 left messages No response Reckitt & Colman e, NJ 07474 1655 Valley Rd., Wayn Wizard/Gulf Lite Product Safeway, Inc. 1100 7th Ave., Oakland, CA 94621 Ozark Just Light The Bag 877-723-3929 eft messages l o response N West Plains Charcoal P.O. Box 850, West Plains, MO 65775 Just Light The Bag West Plains Charcoal P.O. Box 850, West Plains, MO 65775 Instant Char. Briquets H.O.F. Enterprises, Inc. 200 N. Harvey, Ste. 1415, Oklahoma City, OK
73102 Hot Light
EES 1725 Business Center Dr., Duarte, CA 91010 Might Lites Gulf Lite & Wizard, Inc. 2605 Nonconnah Blvd., Ste. 100, Memphis, TN
38132 Gulf Lite One Match
Gulf Lite & Wizard, Inc. 2605 Nonconnah Blvd., Ste. 100, Memphis, TN 38132
Wizard One Match
Arrow Industries P.O. Box 81049, Dallas, TX 75381 Re-packaged under various names
Forest Tech. Corp. 299 N. Arlington St., Akron, OH Starterlogg Packaging Services Co. P.O. Box 875, Pearland, TX 77581 Re-packaged under
various names Hickory Specialities, Inc. P.O. Box 1669, Brentwood, TN 37024 Instant Lighting Char. Forest Tech. Corp. 299 N. Arlington St., Akron, OH Starterlogg 7oz. Phillips 66 337 Phillips Bldg. Annex, Bartlesville, OK 74004 Char. Lighter Distillate Nature's Fire P.O. Box 773, Anoka, MN 55303 Instant Char. Starter
- 95 -

Table C1. The Approved Manufacturers’ List for Charcoal Ignition Products in Southern California… (continued)
Clorox P.O. Box 493, Pleasanton, CA 94566 Match Light w/Mesquite Young's Choice Supertech ngeles, CA 2975 Wilshire Blvd., Ste. 500, Los A
90010 Coconut Coal 213-380-1188 eft messages l No response
Kwik Organic Products, Inc. 46 E. 70th St., New York, NY 10021 Greenheat Fire Lighter 6oz.
Tradco Chemical Corp., Inc. 1081 Rosemary Blvd., Akron, OH 44306 Hearth & Grill Char. Lighter
Duraflame P.O. Box 1230, Stockton, CA 95201 Quick Start Fire Lighter 209-461-6600, 800-342-2896
left messages No response
Calumet Lubricants Co. 2780 Waterfront Parkway E. Dr., Ste. 200, Indianapolis, IN 46214
Cal-Lite Lighter Fluid 317-328-5660, 800-437-3188
left messages No response
General Produce Co., Ltd. 1330 North B St., Sacramento, CA 95814 Blue Flower H.O.C. Industries, Inc. 3511 N. Ohio, Wichita, KS 67201 Re-packaged under
various names Stephanos Associates 1255 Juanita Dr., Walnut Creek, CA 94595 Sure Light Fluid Twinco Romax Wisconsin, Inc.
4635 Willow Dr., Medina, MN 55340 Char. Starting Fluid 414-247-8770 left messages No response
Chevron Phillips Chemical Co.
1301 McKinney St., Ste. 2137, Houston, TX 77010
Char. Lighter Distillate High Flash
Packaging Services Co. P.O Box 875, Pearland, TX 77508 Instant Char. Briquets Royal Oak Enterprises One Royal Oak Ave., Boswell, GA 30076 CRKDFP Royal Oak Enterprises One Royal Oak Ave., Boswell, GA 30076 OCSHFP Royal Oak Enterprises One Royal Oak Ave., Boswell, GA 30076 SASHFP Royal Oak Enterprises One Royal Oak Ave., Boswell, GA 30076 BRSHFP Royal Oak Enterprises One Royal Oak Ave., Boswell, GA 30076 WPSH2.5FP Royal Oak Enterprises One Royal Oak Ave., Boswell, GA 30076 BR2.5BBSHFP Royal Oak Enterprises One Royal Oak Ave., Boswell, GA 30076 SASH2.5FP Royal Oak Enterprises One Royal Oak Ave., Boswell, GA 30076 ELBRFP General Produce Co., Ltd. 1330 North B St., Sacramento, CA 95814 Miracle Blaze Greenheat South Africa Ltd. 5 Sneezewood Ln., Glen Anil, 4051 South Africa Gel Pack Char. Starter
- 96 -

fire Trading Co. 9 S. Pion1001 eer Blvd., Santa Fe Springs, CA 90670
Magic Lite Char.
Sunfire Trading Co. 10019 S. Pione vd., Sant er Bl rings, CA a Fe Sp 90670
Sunfire Instant Light II Char. Briquets
Char Sales 549 Mercury Lane, Brea, CA 92821 Quik Glow Bag Light
Sun
- 97 -

Appendix D: Rule 89-10-2, 91-11-1, and 95-6-3
Table D1. The Updated Automobile Manufacturers’ Name and Addresses for Rule 89-10-2 (Exhaust Emissions), Rule 91-11-1 (Reformulated Gasoline Phase-II), Rule 95-6-3 (Onboard Refueling Vapor Recovery) Company Contact Address Company Name Aston Martin kRandal K. Busic
(313) 668-7300
ration Vehicle Science Corpo
rive No. 2 740 Woodland D
hey requested an email about T ur project. Sent to them. o
No response since.
X(313) 668-0001 FA line, MI 48176-1620Sa (313) 600-5959 MOBILE
Audi Lamborghini
-Royce Rolls olkswagen V
Wolfgang Groth Volkswagen of America, Inc. 00 Hamlin Road EEO, 38
Auburn Hills, MI 48326
eft messages L
Manager-Emissions Regulations (248) 754-4701 (248) 754-4 707 FAX
Richard E. Thomas lyst Certification Ana
(248) 75 4-4713
(248) 754-4707 FAX Dennis E. Reineke
st Certification Analy (248) 754-4715 (248) 754-4707 FAX
BMW Wilhelm Hall
Manager (201) 573-2177
ing Emission Control Engineer
BMW of North America, Inc. BMW Plaza
They requested an email about our project and an email sent to them. No response since.
(201) 782-0764 FAX Montvale, New Jersey 07645
Chrysler LeeAnn Doherty (Cars) DaimlerChrysler Corporation Left messages
(248) 576-5454 800 Chrysler Drive, Auburn Hills, MI 48326-2757
Chuch Paterka (Trucks) (248) 576-5465 (248) 576-7922 FAX
aewoo D
Ferrari
Kenneth J. Boshart (909) 946-0491 (909) 946-0494 FAX Frank Maloziec
utomotive Testing Services A 222 N. Mountain Ave., # 203 Upland, CA 91786 Fiat Auto R&D USA
isconnected D
Number no further exists.
(248) 488-5600 (248) -488-5820 FAX
39300 Country Club Driv e 31Farmington Hills, MI 483
- 98 -

Table D1. The Updated Automobile Manufacturers… (continued) Ford Bill Kostin
Passenger Cars
(313) 594-1206
E-mail: [email protected]
Todd Fagerman
LDT/MDV (313) 594-0680 E-mail: [email protected]
Vehicle Environmental Engineering
Certification Engineering Department Ford Motor Company
1500 Enterprise Drive, Allen Park, MI 48101
They sent a CD about their post implementation emission testing, but there is not any cost data.
GM Randall C. Harvey General Motors Proving Ground Left messages
Manager, Compliance & M/C 483-331-500 Certification
(248) 685-6976 3300 GM Rd, Milford, MI 48380-3726
Honda Brian Gill American Honda Motor Co., Brian Tinkler from Inc. Certification Center
(310) 783-3414 1919 Torrance Blvd. [email protected] m They requested project info retired Torrance, CA 90501-2746 and stressed that the cost info is very sensitive data -unlikely to give out.
Hyundai Alfred Gloddeck Hyundai American Technical Center, Inc.
(909) 627-3525 12610 East End Avenue (909) 628-7682 FAX Chino, CA 91710
Jaguar Diane Black-Nixon Legislation & Compliance They advised might have cost Manager Jaguar Cars Inc. and emissions data but must
request from England (201) 818-8171 555 MacArthur Boulevard (201) 818-8490 FAX Mahwah, NJ 07430-2327 E-mail: [email protected]
Mazda Hisao Nishitani Mazda North American Left messages Operations
Senior Engineer 1421 Reynolds Avenue (949) 852-7292 Irvine, CA 92614 (949) 261-8071
E-mail: [email protected]
Mercedes Bernd Herrbrich Mercedes-Benz Service They requested detail info Corporation about project. We obliged. No
response to date. Manager 4035 Via Oro Avenue (310) 549-7600 Long Beach, CA 90810
- 99 -

Table D1. The Updated Automobile Manufacturers’ Porsche Walter J. Lewis Porsche Cars North America
Senior Compliance Engineer 980 Hammond Drive, Ste 1000
(770) 290-3627 Atlanta, GA 30328 (770) 290-3711 FAX
E-mail:[email protected]
Rover Group Dennis T n. Joh ston r North America Land Rove Manager rliament Place 4731 Pa
(301) 73 1-6583 Lanh , MD20706 am
(301 ) 731-5408 FAX E-mail:
djohnston@land r.com rove
Saab arvey Randall C. H General M otors Proving Ground
Manager, Comp liance & M/C 483-3 31-500 Certification
(248 ) 68 5-6976 3300 GM Rd.
Milford, MI 48380-3726 Subaru James Murphy Subaru Research and Left messages
Development, Inc. (734) 623-0075 3995 Research Park Drive Ann
Arbor, MI 48108 (734) 623-0076 FAX
E-mail: [email protected]
Suzuki Jeff . Linkrey L Cert ification M anager
(714 ) 996-7040 , ext.2 201-07
Governme tions D nt Rela ept American Suz oto uki M r Corporation (ASMC) 3251 East ighwImperial H ay Brea, CA 9 2621
Toyota Mike Lord (310) 538-2570
(310) 787-5655 (LAPT) FAX
Toyota Technical Center, USA 1630 West 186th Street Gardena, CA 90248
(310 ) 787-5675 (Cer tification & Regulatory Affairs) FAX
ail: lord@ttc-u E-m msa.co Volvo ory Buffa Greg lino
Manager
Emissions/Fuel Economy nCertificatio
ulations & Co Reg mplian ce (201 ) 768-7300 25Ext. 71 (201) 768-8695
Volvo Car orth Ams of N erica Volvo Driv ckleigh e Ro , NJ 07647-0913
- 100 -

Appendix E: Gasoline Specifications Phase II-Stakeholders List
Table E.1. Stakeholders List and Contact Efforts Company's Name Person's Name Phone No Updated phones Response I Response II Response III Unocal (LA, CA) Laurence Popofsky 213-977-5974 Barry Lane
Manager, Public Relations 310-726-7731
Did not want to talk since no facility in California
William Almas Government Affairs Manager 805-784-0494
Left messages
Exxon Mobil Corp. Michael F. Smith, Lauren Bird 713-656-3554, Left message 972-444-1000 They called back , Left message to Tom. (Houston, TX) 707-745 7878 Richi (310) 212 4002 Tom called back and
310-212-1874 ovided two other pr names: Tom Kiliany 310-212-1727, Jeff Joyce 310-212-4787
ovided another pr ame, name: Chris n
Armstrong, 713-656-1722,
alled and left a C message but to no
ail. av Shell Oil Produc ts Bruce Irion 510-313-3000, ny Paul, To (Martinez, CA) 510-313-3198 perations o
anager m 925-313-3000,
Shell Western E&P Inc. W. P. Harper 805-326-5545 Martinez Manufacturing Tom Wickiser 713-241-7035 Wrong no (not in web) It retired Texaco Refining and Marketing Inc. (Universal City, CA) (ARCO)
Charles Walz 818-505-2641 Wrong no ohn E. J Bethancourt technology and service 925-842-1000, 513-880-0362
Left message
Ultramar D. Green 310-491-7126, 310-495-5300
Disconnected
- 101 -

Table E.1. Stakeholders List and Contact Efforts… (continued) Steven Epperson 10-495-5466 3
310-495-5426 Disconnected
Paramount Petroleum Glenn Lingle 310-531-2060 Wrong no 562-531-2060 Talked with ngineering Division. E
They do not have any gasoline products, nor records for five
o.and ten years ag Kern Oil and Refining Thomas Eveland 805-845-0761 661-845-0761 Left Messages Southern California Edison Comp.
818-302-9459 Disconnected 626-302-1212, 800-333-4766
Left Messages
Southern California Gas 213-689-2410 Wrong no 877-866-2066 California Council for Environmental and Economic Balance
415-512-7890 415-512-7890
General Motor S.A. Leonard, G.J. Barnes, Automotive Emission Control
313-947-1894 Disconnected
Fletcher Oil and Refining Comp.
yron P.Gee, Technical and B Environmental Services
213-518-4270 213-775-3731
isconnected D
Powerine Oil Comp. A. L. Gualtieri 310-944-9861, 310-944-6111
Disconnected
Motor Vehicle Manufacturers Association
echnical Affairs) Gerald Esper (t 313-872-4311 isconnected D
Ford Motor Company Richard L. Dugally, Governmental Affairs
916-442-0111 Left messages, they called me back, Walter Kreucher ([email protected]) (313) 845 8247, they w/ collect and send.
They responded. Sent CD.
They sent the data CD. No cost data. Useful emissions and technology data.
Arco Timothy J. Clossey 714-491-6866 800-322-2726, 202-879-9260
American Independent Refiners Association (West Coast Office)
Craig A. Meyer, Counsel 213-488-1748
- 102 -

Table E.1. Stakeholders List and Contact Efforts… (continued)
Amer ican epe Ind ndent Refin ers cia Asso tion
fi (DC Of ce)
202-6 025-385
Tosco Re gfinin Corp. Du ane B. vBord ick, vir En onme ntal External Affairs
6415- 02-4120 0-31 952- 0, 600 0-51 235- 0760
ssagesLeft me
Chevron USA inc. 8925- 42-1 000 I talked w ith Sheri Hu ber f rom Environmental sion Divi . [email protected]
ft Le ssage me s rmatio No info n.
TESORO Tara Ford Payne 210-283-2676 Left messages Weste rn S tate s Petrol uem As atsoci ion
Gina Grey 480-595-7131 sLeft messages for several time
Chevr on-Tex aco Fuels Regul atio ns and Emiss ion s Gr oup
John 925-842-5825 eL ft messages
MathPro inc. 301-951-9006 Wayne Miller CE-C TER
wayne@c cr.edu ert.u 909-781- 9557 Lef essa t m ges
Alliance o f A uto mobile anu M fact urer s
Ellen Shapiro 202-326-5533
- 103 -

I
Appendix F: Rule 88-2-2 List of plating (decorative, hard, trivalent) and chromic acid anodizing facilities (2003)
FACILITY ADDRESS CITY STATE ZIP EXCELLO PLATING CO INC 4057 GOODWIN AVE LOS ANGELES CA 90039 VELING PLATING COMPANY
763 N SEWARD HOLLYWOOD CA 90038
HIGHLAND PLATING CO 1001 N ORANGE DR SLOS ANGELE CA 90038 MULTICHROME CO INC 11165 TENNESSEE AVE WEST LOS ANGELES CA 90064 CHROMPLATE COMPANY 1127 W HILLCREST
BLVD INGLEWOOD CA 90301
HAWKER PACIFIC INC Y11310 SHERMAN WA YSUN VALLE CA 91352 EL MONTE PLATING CO , DARREL JENSEN
11409 STEWART ST EL MONTE CA 91731
ACCU CROME PLATING CO INC
T115 W 154TH S GARDENA CA 90248
D & S Custom Plating 11552 Anabel Garden Grove CA 92843 COASTAL MULTICHROME 1160 Mercantile Street OXNARD CA 93030 NATIONAL O-RINGS 11634 PATTON RD DOWNEY CA 90241 DIXON HARD CHROME INC ON ST 11645 PENDLET YSUN VALLE CA 91352 OMNI METAL FINISHING 11665 COLEY RIVER CIR FOUNTAIN VALLEY CA 92708 BABBITT BEARING 1170 N 5th St San Jose CA 95112 QUAKER CITY PLATING 11729 E WASHINGTON
BLVD WHITTIER CA 90606
Sanchez Polishing and Plating 1175 Industrial Ave #W Escondido CA 92029 UNITED CUSTOM POLISHING, A MARTINEZ ETC
Y1179 N FOUNTAIN WA ANAHEIM CA 92806
VALLEY CHROME PLATING 1000 HOBLITT AVE CLOVIS CA 93612 SPENCE ELECTRO PLATING 1001 CHESTNUT ST BURBANK CA 91506 HIGHLAND PLATING CO 1001 N ORANGE DR LOS ANGELES CA 90038 LOCKHEED ADVANC ED DEV CO-PLANT 10,B/ 608
1011 LOCKHEED WAY PALMDALE CA 93599
MULTICHROME CO INC / MICROPLATE
EST1013 W. HILLCR BLVD
ODINGLEWO CA 90301
WHITING ENTERPRISES 10140 ROMANDEL AVE SANTA FE SPRINGS CA 90670 KP METAL FINISHING INC 1022 PETROLIA AVE COMPTON CA 90221 PREMIUM PLATING 1026 N. 10th St San Jose CA 95112 SIGMA PLATING CO INC 1040 OTTERBEIN LA PUENTE CA 91748 KENNETH JEFFERS
ME PLATINGCHRO 1044 E 2 ND ST POMONA CA 91767
ANADITE INC 10647 GARFIELD AVE SOUTH GATE CA 90280 CENTRAL PLATING SERV 10930 SCHMIDT RD EL MONTE CA 91733 CYCLE SHACK 1104 San Mateo Ave South San Francisco CA 94080 CAL-TRON PLATING INC 919 RIVERA RD 11 SANTA FE SPRINGS CA 90670
- 104 -

FACILITY ADDRESS CITY STATE ZIP K & L ANODIZING CORP 1200 S VICTORY BLVD BURBANK CA 91502 KRYLER CORP 1217 E ASH AVE FULLERTON CA 92631 PLATECORP 1223 N BATAVIA ST ORANGE CA 92867 AIRCRAFT PLATING CO INC 12233-12 S PRAIRIE AVE HAWTHORNE CA 90250 WRE/COLORTECH 1225 6th St Berkeley CA 94710 INDUSTRIAL METAL PLATING
12300 BRANFORD ST SUN VALLEY CA 91352
VALLEY PLATING 1236 N FILBERT STOCKTON CA 95205 BRICO METAL FINISHING 12416 BENEDICT AVE DOWNEY CA 90242 AMERICAN ELECTRO PLATING CO
1245-47 E FLORENCE AVE
LOS ANGELES CA 90001
COAST PLATING INC 128 150 W 154TH ST GARDENA CA 90248 VALLEY-TODECO, INC 12975 BRADLEY AVE SYLMAR CA 91342 ELECTRO FORMING 130 Nevin Ave Richmond CA 94801 BRITE PLATING CO INC 1313 MIRASOL ST LOS ANGELES CA 90023 SIZE CONTROL PLATING CO INC
13349 E TEMPLE AVE LA PUENTE CA 91746
SW PLATING CO 1344 W SLAUSON AVE LOS ANGELES CA 90044 J & R PLATING / RA FAEL ALFREDO LEAL
1353 W 134 ST GARDENA CA 90247
GRANT PISTON RING CO 1360 JEFFERSON ST ANAHEIM CA 92807 AERODYNAMICS PLATING CO. INC.
13620 S ST ANDREWS PL GARDENA CA 90815
CLOVIS SPECIALTY PLATING
A1366 N SIERRA VIST FRESNO CA 93703
WEST COAST CYLINDER WORKS
13907 MARQUA RDT AVE
SANTA FE SPRINGS CA 90670
Lemon Grove Plating Inc 1400 Cleveland Ave National City CA 91950 ALCO CAD-NICKEL PLATING CORP
1400 LONG BEACH AVE LOS ANGELES CA 90021
METAL FINISHING MARKETERS INC
1401 MIRASOL ST LOS ANGELES CA 90023
V & M PLATING CO 14024 S AVALON BLVD LOS ANGELES CA 90061 VISALIA CHROME 1414 SWITZER VISALIA CA 93291 CYTEC INDUSTRIES INC 1440 N KRAEMER BLVD ANAHEIM CA 92806 CROWN CHROME PLATING INC
A ST 14660 ARMINT VAN NU YS CA 91402
U.S. CHROME CORP OF CALIFORNIA
1480 CANAL AVE HLONG BEAC CA 90813
S & S POLISHING & PLATING INC
1503 N MILLER ST ANAHEIM CA 92806
CALIFORNIA POLISHING & PLATING, IN C.
15125 S ILLINOIS AVE PARAMOU NT CA 90723
Allfast Fastening System Inc 15200 Don Julian Rd CITY OF INDUSTRY CA 91745
- 105 -

FACILITY ADDRESS CITY STATE ZIP ASTRO CHROME & POLISHING CORP
15236 ERWIN ST VAN NUYS CA 91411
UNIVERSAL METAL PLATING & POLISHING
1526 W 1ST ST AZUSA CA 91702
A & Z GRINDING, INC. 1543 NADEAU ST LOS ANGELES CA 90001 UNITED STATES MINT 155 Hermann Street San Francisco CA 91402 CUSTOM METAL FINISHING 1550 SHAW ROAD STOCKTON CA 95215 ANAPLEX CORP 15547 GARFIELD AVE PARAMOUNT CA 90723 CAL BUMPER CO INC 1555 W ANAHEIM ST LONG BEACH CA 90813 VERNE'S CHROME PLATIN G INC
1559 W EL SEGUNDO BLVD
GARDENA CA 90249
DNR INDUSTRIES, INC. 1562 S. Anaheim Blvd. ANAHEIM CA 92805 TECHPLATE ENGINEERING CO
1571-H S SUNKIST ST ANAHEIM CA 92806
GARDENA SPECIALIZ ED PROCESSING INC
16520 S FIGUEROA ST GARDENA CA 90248
AMERICAN RACING EQUIP INC
A ST 17006 S FIGUERO GARDENA CA 90248
CONTROL PLATING CO INC 17014 GRAMERCY PL GARDENA CA 90247 ANGELUS PLATING WKS 1713 W 134TH ST GARDENA CA 90249 ALTA PLATING & CHEMICAL, CORP.
1733 'S' STREET TO SACRAMEN CA 95814
CHROMAL PLATING CO 1748 N WORKMAN ST LOS ANGELES CA 90031 PCA INDUSTRIES, LLC 1818 E ROSSLYNN AVE FULLERTON CA 92831 CHROME CRAFT 5950 88TH STREET SACRAMENTO CA 95828 A-H PLATING INC 1837 VICTORY PL BURBANK CA 91504 DOLPHIN ENGINEERING 1842 E 41ST PL LOS ANGELES CA 90058 CARTER PLATING INC 1842 N KEYSTONE ST BURBANK CA 91504 SERV PLATING CO INC 1855 E 62ND ST LOS ANGELES CA 90001 PLATO PROD INC/techspray P.O. BOX 949 AMARILLO TX 79105 COMMERCIAL EL ECTRO PLATING
1937 S CHERRY ST FRESNO CA 93721
ELECTROLIZING INC 1947 HOOPER AVE PO BOX 11900
LOS ANGELES CA 90011
MECLEC PLATING 5945 E HARVARD FRESNO CA 93702 Vanier Mfg In 200 Motor Ave AZUSA CA 91702 MOOG, INC (HARD &ANODIZING)
20263 S WESTERN AVE TORRANCE CA 90501
SOUTH BAY CHROME 2041 S GRAND AVE SANTA ANA CA 92705 AAA PLATING 2081 RENE AVE. BLDG.
C SACRAMENTO CA 95838
HIGHTOWER PLATING COMPANY
2090 N GLASSELL BLVD ORANGE CA 92665
GARY'S GRINDING & HARD CHROME INC
2124 S GROVE AVE UNIT A
ONTARIO CA 91761
- 106 -

FACILITY ADDRESS CITY STATE ZIP PEMACO METAL PROCESSING CORP
2125 LEMON ST ALHAMBRA CA 91803
MIL-SPEC PLATING CORP VE 2134 SEAMAN A ONTE SOUTH EL M CA 91733 SHERMS CUSTOM PLATING 2140 Acoma Street SACRAMENTO CA 95815 Carlson & Beauloye Mach ine Shop Inc
2141 Newton Ave San Diego CA 92112
NEWAGE METAL FINISHING 2142 N PLEASANT FRESNO CA 93705 Walkers Custom Chrome 2145 Grand Coulee Blvd Shasta Lake CA 96019 ALL AMERICAN MANUFACTURING CO
2201 E 51ST ST ES LOS ANGEL CA 90058
BARRY AVE PLATING CO INC
2210 BARRY AVE LOS ANGELES CA 90064
ANODYNE INC 2226-223 S SUSAN ST SANTA ANA CA 92704 RE-BILT METALIZI NG CO
2229 E 38TH ST VERNON CA 90058
WESTERN CHROME 2306 E MCKINLEY FRESNO CA 93703 CHROME TECH INC 2309 W 2ND ST SANTA ANA CA 92705 Artistic Silver Plating 2344 Orange Ave Signal Hill CA 90755 M J B CHROME PLATING & POLISHING
236 S RIVERSIDE AVE RIALTO CA 92376
BARKEN'S HARDCHROM E, INC
239 E GREENLEAF BLVD
COMPTON CA 90220
PRIME WHEEL CORPORATION
24000 S VERMONT HARBOR CITY CA 90710
CHRISTENSEN PLATIN G WKS INC
2455 E 52ND ST VERNON CA 90058
HIGH LUSTER METAL FINISHING
2466 American Way Hayward CA 94545
WHEEL SERVICES GROUP INC
2525 S BIRCH ST SANTA ANA CA 92707
JOHNSON PLATING 2526 Telegraph Oakland CA 94612 DV INDUSTRIES INC UNIT NO.01
2605 INDUSTRY WAY LYNWOOD CA 90262
West Coast Plating 2613 Temple Heights Dr #D
Oceanside CA 92056
KOTOFF & CO INC 2620 N DURFEE AVE EL MONTE CA 91732 AIRCRAFT X-RAY LABS INC
2627 E 53RD & 521 6 PACIFIC ST
HUNTINGTON PARK CA 90255
BOWMAN PLATING CO INC 2631 E 126TH ST COMPTON CA 90222 WADE CLINE PLATING CO 2634 E 126TH ST COMPTON CA 90222 PRODUCT ENGINEERING CORPORATION
2645 MARICOPA ST TORRANCE CA 90503
RUTTER ARMEY 2684 S CHERRY FRESNO CA 93706 VALLEY PLATING WORKS, INC
2701 SAN FERNANDO RD
SLOS ANGELE CA 90065
S & K PLATING INC 2727 N COMPTON AVE COMPTON CA 90222 CA Plating 2802 Imperial Ave San Diego CA 92102
- 107 -

FACILITY ADDRESS CITY STATE ZIP ARTISTIC PLATING & METAL FINISHING INC
2801 E MIRALOMA AVE ANAHEIM CA 92806
I W INDUSTRIES CORP 28238 AVENUE CROCKER
VALENCIA CA 91355
ESPOSITO PLATING CORP 2904 Chapman St Oakland CA 94601 Andres Tech Plating Inc 2921 E Miraloma, SUITE 5 ANAHEIM CA 92806 PHYLRICH INTERNATIONAL 2937 N. ONTARIO ST BURBANK CA 91504 CLASSIC PLATING INC 2985 E MIRALOMA AVE ANAHEIM CA 92806 NEUTRON PLATING INC 2993 E BLUE STAR ST ANAHEIM CA 92806 Avis Roto-Die Co, Inc P O BOX 65617 LOS ANGELES CA 90065 DECOR METAL FINISHING INC
3041 ORANGE AVE SANTA ANA CA 92707
REID METAL FINISHING 3110 W HARVARD 14 SANTA ANA CA 92704 STEVE'S PLATING CORPORATION
3111 N SAN FERNANDO BLVD
BURBANK CA 91504
TEIKURO AMERICA CO LTD 31499 Hayman St Hayward CA 94544 LODI CHROME 316 N MAIN STREET LODI CA 95240 A C PLATING 317 MT VERNON
AVENUE BAKERSFIELD CA 93307
BRASSTECH INC 3230 S STANDARD AVE SANTA ANA CA 92705 SUPREME PLATING & COATING, L DE LA ROSA
330 E BEACH AVE INGLEWOOD CA 90302
BROS PLATING 334 S MOTOR AVE AZUSA CA 91702 TECHNICAL METAL FINISHING CO INC
3401 PACIFIC AVE BURBANK CA 91505
SAL'S PLATING 3419 UNION PACIFIC AVE
LOS ANGELES CA 90023
GROVER PROD. CO, UNIT NO. 1
VD3424 E OLYMPIC BL SLOS ANGELE CA 90023
BRONZEWAY PLATING CORP
3432 E 15TH ST LOS ANGELES CA 90023
PALM SPRINGS PLATING 345 DEL SOL PALM SPRINGS CA 92262 GENE'S PLATING WORKS 3498 e. 14TH STREET LOS ANGELES CA 90023 CAL ELECTROPLATING INC 3510 E PICO BLVD SLOS ANGELE CA 90023 Gene's Plating Works 3656 E Naokes LOS ANGELES CA 90023 SUPERIOR PLATING CO 389 N EAST END POMONA CA 91767 CANYON PRECI SION PLATING & G RINDING
3911 E MIRALOMA AVE ANAHEIM CA 92806
EXCELLO PLATING CO INC
E4057 GOODWIN AV ES LOS ANGEL CA 90039
SANTA ANA PLATING INC 411 E ALTON AVE SANTA ANA CA 92707 COAST PLATING INC 417 W 164 TH ST CARSON CA 90248 CONSOLIDATED FOUNDRIES
4200 W VALLEY BLVD POMONA CA 91766
AAA PLATING & ECTION INC INSP
424 E. DIXON ST COMPTON CA 90222
- 108 -

FACILITY ADDRESS CITY STATE ZIP E.M.E. INC/ELECTRO MACHINE & ENGINEERING
431 E OAKS ST COMPTON CA 90222
MORRELL'S ELECTRO PLATING INC
432 E EUCLID AVE COMPTON CA 90222
Decore Plating 434 W 164th St GARDENA CA 90248 CROWN CITY PLATING CO 4350 TEMPLE CITY
BLVD EL MONTE CA 91731
MODESTO PLATING 436 MITCHELL ROAD STE D
MODESTO CA 95354
WEST COAST CHROME 451 SONORA AVE, #J & D
MODESTO CA 95356
S.J. VALLEY PLATING 491 Perry Court Santa Clara CA 95054 STUTZMAN PLATING INC 5045 EXPOSITION BLVD LOS ANGELES CA 90016 Taylor Made Plating 5110-A Caterpillar Rd Redding CA 95812 J & M ANODIZING, INC. 525 S FLOWER ST BURBANK CA 91502 DOMAR PRECISION INC 5250 E SOUTHERN AVE SOUTH GATE CA 90280 MCDONNELL DOUGLAS AEROSPACE
VE 5301 BOLSA A ON BEACH HUNTINGT CA 92647
MODERN PLATING CO 5400 W 104TH LOS ANGELES CA 90045 RMS SERVICES, INC/ AMERICAN EAGLE
5777 SOESTERN COURT CHINO CA 91710
Specialized Processing Co Inc
581 Marshall Ave. S El Cajon CA 92020
COLLINS TECHNOLOGIES 5875 OBISPO AVE HLONG BEAC CA 90805 VALLEY PLATING WORKS INC
5900 E SHEILA ST COMMERCE CA 90040
STANISLAUS CHROME PLATING
610 7TH STREET MODESTO CA 95354
VAN NUYS PLATING INC
6109 VESPER AVE VAN NUYS CA 91411
ULTRA WHEEL CO 6300 VALLEY VIEW A PARK BUEN CA 90620 BROWN INTL CORP 633 N BARRANCA COVINA CA 91723 Gorilla's Plating 654 E Young St SANTA ANA CA 92704 PONAM LTD, INC. 6618 SAN FERNANDO
RD GLENDALE CA 91201
PENNOYER-DODGE CO 6634 SAN FERNANDO RD
GLENDALE CA 91201
LUBECO INC 6859 DOWNEY AVE LONG BEACH CA 90805 Palace Plating 710 E 29th St LOS ANGELES CA 90011 ROTO-DIE COMPANY INC
712 N VALLEY ST ANAHEIM CA 92801
QUALITY CUSTOM CHROME / WESTERN PLATING/ quality custom chrome
714 Francisco Blvd-W San Rafael CA 94902
FAITH PLATING / JAN IV CORP
7141 SANTA MONICA BLVD
LOS ANGELES CA 90046
JANKENS CO INC
715 E CYPRESS AVE MONROVIA CA 91016
- 109 -

FACILITY ADDRESS CITY STATE ZIP ACE PLATING CO INC 719 TOWNE ST LOS ANGELES CA 90021 VELING PLATING COMPANY
763 N SEWARD HOLLYWOOD CA 90038
TOOL & JIG PLATING COMPANY, A. WILLIAMS
7635 S BALDWIN PL WHITTIER CA 90602
HARD CHROME PLATING INCORPORATED
7635 S BALDWIN PL WHITTIER CA 90602
WALLY'S METAL POLISHING & PLATING
7810 JACKSON ST PARAMOUNT CA 90723
DUCOMMUN AEROTRUCTURES
801 ROYAL OAKS DR MONROVIA CA 91016
INDUSTRIAL PLATING CO 803 Amer. St San Carlos CA 94070 ALUMINUM ART PLATING INC
803 W STATE ST ONTARIO CA 91762
BUMPER SHOP INC. 808 - 828 E FLORENCE AVE
LOS ANGELES CA 90001
FOSS PLATING CO INC. 8140 SECURA WAY SANTA FE SPRINGS CA 90670 EQUALITY PLAING CO 8172 Center St La Mesa CA 91942 HIXSON METAL FINISHING 817-853 PRODUCTION
PL NEWPORT BEACH CA 92663
DELTA PLATING INC 818 S STANISLAUS ST STOCKTON CA 95206 ALL METALS PROCESSING OF ORANGE CO INC
8401 STANDUSTRIAL ST STANTON CA 90680
ESCONDIDO PLATING 860 Metcalf St Escondido CA 92025 ELECTR0 COATINGS -BRKLY
893 Carleton Street Berkeley CA 94710
USS-POSCO 900 Loveridge Pittsburg CA 94565 LA HABRA PLATING CO INC 900 S CYPRESS ST LA HABRA CA 90631 SUPERIOR PLATING 9001 GLENOAKS BLVD SUN VALLEY CA 91352 SAN JOAQUIN CHROMEWORKS
910 BLACK DIAMOND UNIT B
LODI CA 95240
ELECTRONIC CHROME GRINDING CO INC
9128 DICE RD SANTA FE SPRINGS CA 90670
ANAHEIM PLATING INC 928 E SOUTH ST ANAHEIM CA 92805 INTERMETRO INDUSTRIES CORP
9393 ARROW ROUTE RANCHO CUCAMONGA
CA 91730
C&M GOLD PLATING 948 INDUSTRIAL WAY AZUSA CA 91702 GENERAL PLATING CO 951 W VERNON AVE LOS ANGELES CA 90037 DYNAMIC PLATING 952 W 9TH ST UPLAND CA 91786 OR. CO. PLATING CO INC 960 N PARKER ST ORANGE CA 92667 Allen Insustrial & Machine 960 S Hathaway St BANNING CA 92220 NETWORKS ELECTRONIC CORP
9750 DE SOTO AVE CHATSWORTH CA 91311
HARTWELL CORP 9810 6TH ST RANCHO CUCAMONGA
CA 91730
L & R METAL FINISHING CO 9912 1/2 RUSH ST SOUTH EL MONTE CA 91733 DOE-SANDIA LABS 7011 East Avenue Livermore CA 94550
- 110 -

FACILITY ADDRESS CITY STATE ZIP N Aviation Depot NAS North Island San Diego CA 92135
C. PO BOX 15705 SANTA ANA CA 92735 D CHROME PO BOX 2447 Oakland CA 94614
WEST PO Box 472 Pittsburg CA 94565 FIC HARD CHROME 3105 S 51ST STREET Richmond CA 94804
335 GARDEN HWY YUBA CITY 95991
UAKER CITY PLATING 11729 E WASHINGTON BLVD
WHITTIER CA 90606
RKLAND ANUFACTURING
1111 E McFadden Ave SANTA ANA CA 92705
cDonnell Douglas (Boeing C-)
15400 Grahan St #101 HUNTINGTON BEACG CA 92647
LEY PLATING WORKS 5900 E SHEILA ST COMMERCE CA 90040
A ENTERPRISES 1733 S STREET SACRAMENTO CA 95814 G, INC (HARD
NODIZING) 20263 S WESTERN AVE TORRANCE 90501
LEY PLATING WORKS, 2701 SAN FERNANDO RD
LOS ANGELES CA 90065
ULTICHROME 1160 Mercantile Street OXNARD CA 93030 TS METAL
HING 15131 S ILLINOIS AVE PARAMOUNT CA 90723
C. PO BOX 15705 SANTA ANA 92735 IOR PLATING 9001 GLENOAKS BLVD SUN VALLEY 91352
WAY PLATING 3432 E 15TH ST LOS ANGELES 90023
US EMBEE IN HAR ENGINEERING ROLL TECHNOLOGY PACI CUSTOM CHROME AND BUMPER Q
MA M M 13 VAL INC A & MOO &A VAL INC COASTAL M LEAVIT FINIS EMBEE IN SUPER BRONZE CORP
- 111 -

Appendix G: Potential Secondary Sources of Data
Table G1. Secondary Sources of Data Considered Secondary Sources
Industries Indicators Years Classification System
Explanation
PACE (Survey of Pollution Abatement Cost and Expenditures Data)
All Industries (in 1999: manufacturing, mining and electric utility industries)
Capital expenditures and operating costs by type of media and percent that is attributed to hazardous materials. Types of pollutans; air, water and solid waste. Also disposal and recycling expenditures and costs, pollution prevention, site cleanup, habitat protection, environmental monitoring and testing, administrative environmental programs, permits, fees, penalties and fines (by major groups and states)
1973 through 1994, except 1987 (the survey was discontinued after 1994 and re-instated in 1999) 1994, 1999
In 1999: NAICS (North America Industry Classification System) and in 1994: SIC (Standard Industry Classification system)
No industries are shown where total abatement capital expenditures and total abatement operating costs are each less than $1,0 million and no plants with fewer than 20 employees (in 1999, there is a small representation of that)
SBO (Survey of Business Owners)
All nonfarm businesses with receipts of $1,000 or more
Gender, ethnicity, race for up to three persons owning the majority of rights, equity, or interest in the business, and some additional demographic and economic characteristics of the business owners and their businesses such as: owner's age, education level etc, types of costumers and workers, source of financing for expansion, capital improvements. According to state, counties, metro areas (all firms' numbers, and sales and receipts; and firms with paid employees with employees' number and payroll)
Every five years since 1972 (for years ending "2" and "7") 1992, 1997. In 1997, the survey was conducted as the 1997 Economic Census Surveys of Minority and Women-Owned Business Enterprises (SMOBE/SWOBE)
SIC Mostly demographic data, might be usefull for state and selected areas
- 112 -

Table G1. Secondary Sources of Data Considered (continued)
BES (Business Merchant Wholesale, General Operating Statistics Every five years NAICS (North America Not very detail as Expenses Survey) Retail Trade, Service
Industries, Communications, Trucking and Warehousing, Arrangement of Passenger Transportation, Manufacturing, Mining, Construction
Operating Expenses by Type and Kind of Business. Detail lease and rental payments and cost of repair services by kind of business. Detail purchase utilities by kind of business. Detail cost for data processing and other computer related services by kind of business Sales, annual payroll, employer costs for fringe benefits, and contract labor by kind of business. Sales, cost of goods sold, and measures of value produced by kind of business. Estimated relative standard errors by kind of business
since 1958 (for years ending "2" and "7") 1992, 1997
Industry Classification System) and SIC (Standard Industry Classification system)
industries
Selected Air Pollution Control Equipment's Cost Data
Selected industrial air-pollution control equipment used in the seperation, removal, or collection of particulate and gaseous emissions
Companies number, net new orders (quanitity and value), shipments (quantity and value), backlog of orders-December 31- (quantity and value), particulate emissions collectors, gaseous emissions control devices
1996, 1997, 1998 (between 1990-1994 is in PACE survey)
Product Code Not very detail control equipment devices and limited years
LRD (Longitudinal Research Database)
All manufacturing companies
Individual establishments, detail manufacturing inputs and manufactured products, industry codes, location, current status, legal status, employment, number of production workers, hours worked, labor costs, materials cost, materials consumed, services and energy used, inventory levels, depreciable assets, and capital expenditures. Product data include receipts (value of shipments, value added, value of resales); production details SIC codes, quantities of production, value and quantity of product shipped, value and quantity of interplant transfers, and internal consumptions) and exports.
Continuously since 1980, updated with annually
SIC Looks very detail but in the web, need to contact with CES (Center for Economic Studies) one of its Research data Center and only for manufacturing
- 113 -

Table G1. Secondary Sources of Data Considered (continued)
Annual Survey of Manufacturers
All manufacturing companies with one or more paid employee
Statistics for employment, payroll, value added by manufacture, cost of materials consumed, value of shipments, detailed capital expenditures, supplemental labor costs, fuels and electric energy used, and inventories by fabrication stage.
1993-96, 98-2000 NAICS (North America Industry Classification System) and SIC (Standard Industry Classification system)
no data according to state and/or region
Facility Search Engine from CARB Database
All Industries TOG, ROG, NOx, PM, PM10, PM2,5, CO, and SOx, according to District, facility name, air basin, county.
1990-2002 SIC and/or Facility ID
- 114 -

Table G2. CARB Post Rule Assessment- SIC and NAICS Codes for Secondary Sources
Rule No Rules Affected Industries SIC Codes (4 digit) NAICS Rule 88-2-2 ATCM for Hexavalent Chromium Emissions from
Chrome Plating and Chromic Acid Anodizing Facilities
Hexavalent Chromium Facilities, Hard Plating Facilities, Anodizing Facilities, Decorative Plating Facilities
3471 Electroplating, Plating, Polishing, Anodizing, and Coloring
332813 (Electroplating, plating, polishing, anodizing, and coloring)
Rule 90-5-1 ATCM for Ethylene Oxide Emissions from Sterilizers and Aerators
Own or operate EtO Sterilizers
* 3821 Sterilizers, laboratory
* 3842 Sterilizers, hospital and surgical
* 3843 Sterilizers, dental
* 2869 Ethylene oxide
339111 (Laboratory apparatus and furniture manufacturing)
Rule 89-10-2 Exhaust Emission Standards, Test Procedures and Durability Requirements Applicable to Passenger Cars and Light-Duty Trucks for the Control of Hydrocarbon, Carbon Monoxide and Benzene Emissions
Automobile Manufacturers 3711 Motor Vehicles and Passenger Car Bodies
336111 (automobile manufacturing)
Rule 93-12-2 ATCM for Perchloroethylene Emissions from Dry Cleaning Operations and a Regulation for and Environmental Training Program for Perchloroethylene Dry Cleaning Operations
Dry Cleaning Operations/Dry Cleaners
7212 Garment Pressing, and Agents for Laundries and Drycleaners
812320 (Drycleaning and laundry services -except coin-operated-)
Rule 91-11-1 Reformulated Gasoline-Phase II and the Wintertime Oxygen Content of Gasoline
Petroluem Refineries, Automobile Manufacturers
2911 Petroleum Refineries, oil refineries 324110 (Petroluem refineries)
- 115 -

Table G2. CARB Post Rule Assessment- SIC and NAICS Codes for Secondary Sources (continued)
Rule 95-6-3 Onboard Refueling Vapor Recovery Standards and Test Procedures and Modifications to Evaporative Test Procedures Applicable to 1998 and Subsequent Model-Year Passenger Cars, Light-Duty Trucks, and Medium-Duty Vehicles
Automobile Manufacturers 3711 Motor Vehicles and Passenger Car Bodies (Establishments primarily engaged in manufacturing or assembling complete passenger automobiles, trucks, commercial cars and buses, and special purpose motor vehicles which are for highway use. This industry also includes establishments primarily engaged in manufacturing chassis and passenger car bodies. Such establishments may also manufacture motor vehicle parts, but establishments primarily engaged in manufacturing motor vehicle parts except chassis and passenger car bodies are classified in Industry 3714, 2899 Fuel tank and engine cleaning chemicals, automotive and aircraft -not related to vapor recovery-, 3569 Vapor separators -machinery-)
336111 (automobile manufacturing, 336211 motor vehicle body manufacturing, 336112 light truck and utility vehicle manufacturing, 333999 all other miscellaneous general purpose machinery manufacturing (vapor))
Rule 1153 VOC Emissions from Commercial Bakeries Commercial Bakeries 5461 Retail Bakeries (Bagel stores-retail, 311811 (Retail bakeries, Bakeries-retail, Cookie stores-retail, Doughnut shops-retail, Pretzel stores and stands-retail )
445291 baked goods stores)
Rule 1173 Control of VOC Leaks and Releases from Components at Petroleum Facilities and Chemical Plants
Petroleum Refineries, Chemical Plants, Oil and Gas Production Fields, Natural Gas Processing Plants,
2911 Petroleum Refineries, Oil refineries, Acid oil produced in petroleum refineries, Gas, refinery or still oil produced in petroleum refineries, Mineral oils, natural: produced in petroleum refineries, Road oils, produced in petroleum refineries
324110 (Petroleum refineries)
- 116 -

Table G2. CARB Post Rule Assessment- SIC and NAICS Codes for Secondary Sources (continued)
Rule 1174 Control of VOC Emissions from the Ignition of Barbecue Charcoal
Manufacturers, Distributors and/or Retailers of materials and/or methods used to Ignite Barbecue Charcoal
2861 Gum and Wood Chemicals (as charcoal and wood distillates), Tar and tar oils, products of wood distillation (2491 Wood products, creosoted, 2499 Bentwood (steam bent) products, -except furniture-, 2679 Pressed products from wood pulp-mfpm, 5031 Composite board products, wood-based-wholesale
325191 (Gum and Wood Chemical Manufacturing)
Rule 1138 Control of Emissions from Restaurant Operations Restaurant Operations 5812 Eating Places 722110 (Full-service restaurants, 722310 food service contractors, 722320 caterers, 722212 cafeterias, 722211 limited service restaurants)
- 117 -

Appendix H: APC Manufacturer’s Survey
Near the end of the study period the team decided to refocus its work away from rules 90-5-1, 89-10-2, 91-11-1, 95-6-3, 1173 and 1174. Instead, for the remaining rules, it would do a survey of the manufacturers and installers of APC equipment. They were expected to be more responsive since they should not have a defensive attitude, they should have more resources to generate the needed cost data, and they need that data to help generate future business. The following simple questions were asked:
1. Who are your clients?
2. Do you provide equipment and retrofit services to assist o Plating shops comply with ARB rule 88-2-2? o Dry Cleaners comply with ARB rule 93-12-2? o Bread bakeries comply with SCAQMD rule 1153? o Fast food restaurants comply with SCAQMD rule 1138?
3. If so could you please share with us your cost data on equipment, installation, operation and maintenance?
The issues encountered during our data collection were the following:
• The limited knowledge of the listed companies regarding the specified regulations;
• The lack of cooperation to describe their product in fear that we may be a regulatory agency;
• The APC manufacturer list did not contain current contact information.
Cost varied depending on equipment specifications, efficiency, and dimensions. The team did not get through the entire contact list due to time and budget constraints.
The results of the survey are summarizes in Table III-1 below.
- 118 -

I I I I I
Table H.1: APC Manufacturer’s Survey
Company Applicable to the Study?
Contact Name Information Given
A.V.C. Specialists, Inc. No Business trade is not applicable to the study. They serve power plants.
Adwest Technologies No Joe Terry Business trade is not applicable to the survey. They handle printing and pharmaceuticals.
Aerovironment Pending Mail box no. Left a message on December 6, 2004.
Aeroject Propulsion Div. Not willing to answer
Aeroenvironment Inc. Pending Left a message on December 6, 2004. Air Blast Inc No Business trade is not applicable to the
survey. They handle labels for bottles (pre-manufacturer).
Air Chem Systems Yes Bob Lease-Sales manager
Example for a plating shop: Can only design original equipment. For a small system (exhaust system of 2,000 cf/min with a fan, scrubber, and duct) $45,000 to $50,000. For installing the equipment cost would be from $15,000 to $20,000.00.
Air Cleaning Specialists Number is no longer in service
Air Cleaning Systems Number is no longer in service
Air Cleaning Technology Yes Sergio Example for a fast food restaurant: For an original exhaust system for a 10 foot long 4 foot deep collection hood: Equipment is $20,000 (air cleaner) $150 to $160 (monthly maintenance) $150 (duct cleaning)
Air Exchange Inc. Number is no longer in service
Air Factors-Lok Number is no longer in service
Air instruments & Measurements
Number is no longer in service
- 119 -

Table H.1: APC Manufacturer’s Survey (continued)
Company Applicable to the Study?
Contact Name Information Given
Air Pollution Control Co. Number is no longer in service
Aircorp No Dale Hickens Business trade is not applicable to the survey. They only perform remediation and waste clean-up.
Airex Corp. Div. Of Adwest No. Same contact as for Adwest Technologies.
Joe Terry
Airfoil Management Company
No Business trade is not applicable to the survey.
Airguard Industries of California
Yes. The business changed its name to “TFS” as of 2003.
The business specializes in filters. Example for a fast food restaurant: For a metal degreaser filter for flame hoods $20. Filter lasts 3 to 4 years.
Airtech No Business trade is not applicable to the survey.
Alita Industries Inc. No Specialize in air pumps. Business trade is not applicable to the survey.
Allied Environmental Technologies, Inc.
Pending Left a message December 7, 2004. No reply as of December 9, 2004.
Alphagaz Number is no longer in service
Alzeta Corp. Yes Jim (Out of the country starting December 7, 2004).
For a catalytic oxidizer, depending on the size of the machine would run from a small amount to $50,000. Source gave me very generic information.
Aapplied Air Technology Number is no longer in service
Baghouse Services, Inc. Number is no longer in service
Baker Furnace Inc. Yes Faxed an information request regarding catalytic oxidizers December 7, 2004.
Banyan Industries No Business specializes in portable potties. Bioscreen Testing Services No Business specializes only in sample
testing, not manufacturing.
- 120 -

Table H.1: APC Manufacturer’s Survey (continued)
Company Applicable to the Study?
Contact Name Information Given
Biosolve Western States Pending Left a message December 7, 2004. California Analytical Instrument, Inc.
Not willing to help
California Clean Air, Inc. Number is no longer in service
Caltest Instruments, Inc. No Business only manufactures machines that test diesel equipment for trucks.
CALVERT Environmental Number is no longer in service
Camfil Farr Number is no longer in service
Car Sound Exhaust Systems No Business handles catalytic converters, mufflers, ect. for vehicles only.
Catalytic Solutions No Business handles catalytic converters for vehicles only.
Catalytica Pending No message allowed as of December 7, 2004.
CJI Process Systems, Inc. Pending Faxed an information request regarding an exhaust system for a plating shop December 7, 2004.
Coen Company Inc. Number is no longer on service
Conserve Engineering Company, LIc
Number is no longer on service
Crown Chrome No Davy Environmental Number is no
longer in service
Business handles aircraft equipment only.
Delatech Incorporated No number listed on the APC list
Delta Circuits Tech, Inc. No Du-All Safety No Specialize in window tinting only. Dynamic Air Engineering Inc No number
listed on the APC list
Only provide safety training.
- 121 -

Table H.1: APC Manufacturer’s Survey (continued)
Company Applicable to The Study?
Contact Name Information Given
Eco-Air Products, Inc. No Eldridge Products Inc. No Sell heating and air filters. Emcotek Corp. Yes Left a message December 7, 2004.
Manufacture meters for natural gas. Not relevant for air pollution control.
Envir-Alert Inc Number is no longer in service
Envirocare International Inc No number listed on the APC list
Environmental Combustion Sys. Number is no longer in service
Environmental Engineering Concepts Inc.
No Jim Murphy (sales representative)
Company makes misting products (makes fog).
Environmental Filter Corp No answer. Could not leave a message December 7, 2004.
Environmental Instruments Number is no longer in service
Environmental Silica Products No number listed in the APC list
Envirosupply and Service Inc. Pending Left a message for Shelly December 7, 2004.
ESA Engineering Corp. Pending Left a message. The number may be incorrect as of December 7, 2004.
ESS No Company manufactures supplies for water treatment and one air product (tetler bag).
Florence Filter Corporation Yes Company manufactures filters for food processors, plating, etc. A Hepa filter with 99.9% efficiency (used in hospital clean rooms) would run for $200 to $300 and would be changed every 3 to 4 years. For regular air filters, one would run for $5 to $6 that would need to be changed once per month.
Forney Corporation No number listed
- 122 -

Table H.1: APC Manufacturer’s Survey (continued)
Company Applicable to the Study?
Contact Name Information Given
Gas Tech, Inc. Number is no longer in service
GC Industries Inc. Pending Left a message December 7, 2004. Hal Murphree and Associates Number is no
longer in service
Harel International, Ltd. Number is no longer in service
- 123 -

TP PT
TP PT
Appendix I: Consumer Price Index19
U.S. City Average Base Period: 1992-84=100.
Year Annual 1980 82.4 1981 90.9 1982 96.5 1983 99.6 1984 103.9 1985 107.6 1986 109.6 1987 113.6 1988 118.3 1989 124.0 1990 130.7 1991 136.2 1992 140.3 1993 144.5 1994 148.2 1995 152.4 1996 156.9 1997 160.5 1998 163.0 1999 166.6 2000 172.2 2001 177.1 2002 179.9 2003 184.0 2004 188.9
19 http://www.bls.gov/data/home.htm
- 124 -