WEST NUSA TENGGARA Province eng -...
2
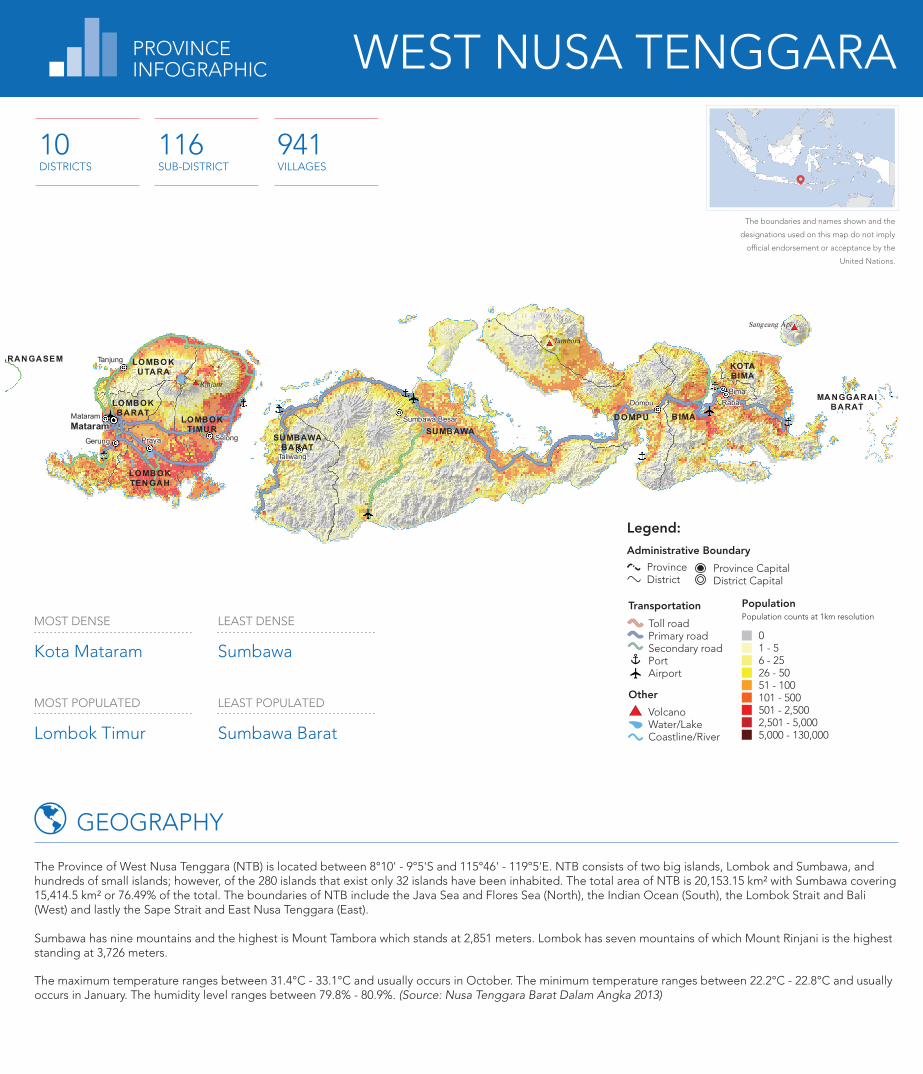
ARANGASEM LOMBOK BARAT LOMBOK TENGAH LOMBOK TIMUR SUMBAWA DOMPU BIMA SUMBAWA BARAT LOMBOK UTARA KOTA BIMA MANGGARAI BARAT Rinjani Sangeang Api Tambora Mataram Mataram Bima Dompu Gerung Praya Selong Sumbawa Besar Raba Tanjung Taliwang 0 1 - 5 6 - 25 26 - 50 51 - 100 101 - 500 501 - 2,500 2,501 - 5,000 5,000 - 130,000 Population Population counts at 1km resolution Transportation Toll road Primary road Secondary road Port Airport Province Capital District Capital Other Volcano Water/Lake Coastline/River Administrative Boundary Legend: Province District LEAST POPULATED Sumbawa Barat MOST DENSE Kota Mataram MOST POPULATED Lombok Timur LEAST DENSE Sumbawa 10 DISTRICTS 116 SUB-DISTRICT 941 VILLAGES The Province of West Nusa Tenggara (NTB) is located between 8°10' - 9°5'S and 115°46' - 119°5'E. NTB consists of two big islands, Lombok and Sumbawa, and hundreds of small islands; however, of the 280 islands that exist only 32 islands have been inhabited. The total area of NTB is 20,153.15 km² with Sumbawa covering 15,414.5 km² or 76.49% of the total. The boundaries of NTB include the Java Sea and Flores Sea (North), the Indian Ocean (South), the Lombok Strait and Bali (West) and lastly the Sape Strait and East Nusa Tenggara (East). Sumbawa has nine mountains and the highest is Mount Tambora which stands at 2,851 meters. Lombok has seven mountains of which Mount Rinjani is the highest standing at 3,726 meters. The maximum temperature ranges between 31.4°C - 33.1°C and usually occurs in October. The minimum temperature ranges between 22.2°C - 22.8°C and usually occurs in January. The humidity level ranges between 79.8% - 80.9%. (Source: Nusa Tenggara Barat Dalam Angka 2013) GEOGRAPHY The boundaries and names shown and the designations used on this map do not imply official endorsement or acceptance by the United Nations. PROVINCE INFOGRAPHIC WEST NUSA TENGGARA
Transcript of WEST NUSA TENGGARA Province eng -...
SUMENEP
KARAN GASEM
LOMBOKBARAT
LOMBOKTEN GAH
LOMBOKTIMU R SUMBAWA
DOMPU BIMA
SUMBAWABARAT
LOMBO KUTARA KOTA
BIMA
SUMBABARAT
MA NGGARAIBARAT
SUMBATEN GAH
SUMBABARAT DAYA
PANGKAJENEDAN
KEPULAUAN
Rinjani
Sangeang Api
Tambora
MataramMataram
BimaDompu
Gerung Praya Selong
Sumbawa Besar
Raba
Tanjung
Taliwang
Waikabubak
Tambolaka
01 - 56 - 2526 - 5051 - 100101 - 500501 - 2,5002,501 - 5,0005,000 - 130,000
PopulationPopulation counts at 1km resolution
Transportation
Toll roadPrimary roadSecondary roadPortAirport
Province CapitalDistrict Capital
Other
VolcanoWater/LakeCoastline/River
Administrative Boundary
Legend:
ProvinceDistrict
LEAST POPULATED
Sumbawa Barat
MOST DENSE
Kota Mataram
MOST POPULATED
Lombok Timur
LEAST DENSE
Sumbawa
10DISTRICTS
116SUB-DISTRICT
941VILLAGES
The Province of West Nusa Tenggara (NTB) is located between 8°10' - 9°5'S and 115°46' - 119°5'E. NTB consists of two big islands, Lombok and Sumbawa, and hundreds of small islands; however, of the 280 islands that exist only 32 islands have been inhabited. The total area of NTB is 20,153.15 km² with Sumbawa covering 15,414.5 km² or 76.49% of the total. The boundaries of NTB include the Java Sea and Flores Sea (North), the Indian Ocean (South), the Lombok Strait and Bali (West) and lastly the Sape Strait and East Nusa Tenggara (East).
Sumbawa has nine mountains and the highest is Mount Tambora which stands at 2,851 meters. Lombok has seven mountains of which Mount Rinjani is the highest standing at 3,726 meters.
The maximum temperature ranges between 31.4°C - 33.1°C and usually occurs in October. The minimum temperature ranges between 22.2°C - 22.8°C and usually occurs in January. The humidity level ranges between 79.8% - 80.9%. (Source: Nusa Tenggara Barat Dalam Angka 2013)
GEOGRAPHY
The boundaries and names shown and the
designations used on this map do not imply
official endorsement or acceptance by the
United Nations.
PROVINCEINFOGRAPHIC WEST NUSA TENGGARA

POPULATION
24
TOTAL HOUSEHOLD
1,371,183
TOTAL POPULATION
4,500,181
MALE
2,183,62948.52% from Total Population
Sex Ratio
94.26
FEMALE
2,316,55251.48% from Total Population 41.73%
Urban Population
58.27%Rural Population
0-4
5-9
10-14
15-19
20-24
25-29
30-34
35-39
40-44
45-49
50-54
55-59
60-64
65-69
70-74
75+
2015
4,835,600
2020
5,125,600
2025
5,375,600
POPULATION PROJECTION
Total Fertility Rate
Infant Mortality Rate (Male + Female)
Dependency Ratio (%)
EO (Male + Female)
53.80
2.56
65.40
44.30
50.20
2.31
67.30
36.50
52.20
2.44
66.50
39.60
DISABLE
From Total Population
0.27%Visual
0.19%Walking
0.16%Hearing
0.13%Memory impairment
0.04%Not able to taking care
of themselves
WATER & SANITATION
Private Public OthersShared
HEALTH
HEALTH FACILITIES
MEDICAL STAFF
489 113 2,8891,740
DENTIST MIDWIFEDOCTOR OTHERS
PUSKESMAS PUSTUHOSPITAL POSYANDU OTHERS
151 52917 7,213 689
SANITATION TYPES55.17%
1.20%
38.84%4.80%
91.73% 8.27%
42.15% 15.54%
10.14%
6.27%
5.62%9.19%
WATER SOURCES
Protected well Unprotected well
RiverUnprotected spring
Subscribed water
Packaged water
Protected springDrilled well/pump
Refilled water
Retailed water
1.59%
6.01%0.67%2.82%
Clean Drinking Water Sources Not Clean Drinking Water Sources
Percentage of households based on the usage of water resources
NATURAL DISASTER (2008-2012)
2008 2009 2010 2011 2012
282327716
LANDSLIDE 8
FLOOD & LANDSLIDE 3
EARTHQUAKE 2
HIGH TIDE 4
FLOOD 54
WHIRLWIND 15
DROUGHT 15
FOOD SECURITY IN 2009
LIVELIHOOD
Highest contributor for GDP:
1. Agriculture, Veterinary, Forestry, and Fishery (28.39%)2. Trading, Hotel, dan Restaurant (16.65%)3. Mining (16.14%)
ServicesFinance, Leasing and Services companyOthers
Transportation and CommunicationTrading, Hotel, dan Restaurant
Processing IndustryElectricity, Gas and Clean waterConstruction
MiningAgriculture, Veterinary, Forestry, and Fishery
4.34%89.76%
Note: The livelihood under 1% are not displayed on the chart.
2.95%
1.11%
EDUCATION
EDUCATIONAL ATTAINMENT LITERACY RATE
State-owned public schoolsInclude private schoolsMadrasah
KIND
ERGA
RTEN
ELEM
ENTA
RY
JUNI
OR
SENI
OR (I
NCL.
SMK)
MAD
RASA
H
SCHOOL FACILITIES
0500
1000150020002500300035004000
Senior
14.38%
Vocational
0.85%
Not graduatedfrom Elementary
20.34%
Elementary
25.10%
Junior
14.79%
Diploma
1.43%
Undergraduate
2.78%
Postgraduate
0.15%Never attendingschool
20.54%
78.94% From Total Population
Priority 1 DistrictsPriority 2 DistrictsPriority 3 DistrictsPriority 4 DistrictsPriority 5 DistrictsPriority 6 DistrictsNo Data/Urban Area
The prevalence of food security is based on the WFP Food Security and Vulnerability Atlas. Vulnerability to food insecurity was determined based on nine indicators which are related to food availability, food access, food utilization and nutrition. The map was produced by combining the indicators into a composite food security index.
Areas in red shades are less food secure compared to areas in green shades. The map highlights the prevalence of food insecurity at the district level and it should be noted that not all household living in dark red (priority 1) districts are food insecure, and conversely that not all household living in green (priority 6) districts are food secure.
VULNERABILITYTO FOOD INSECURITY
Source: SUSENAS year 2011, BPS
Source: Census year 2010, BPS
Source: Census year 2010, BPS
Source: PDRB 2012, based on dated price
Source: Census year 2010, BPS
DATA SOURCES
PROVINCE BPBD CONTACT DETAILS: Jl. Dr. Soedjono Lingkar
Selatan, Mataram.
Phone. (0370) 646972,
Fax. (0370) 646972
Landscan Global Population Databaseshttp://web.ornl.gov/sci/ landscan/
Road Networkhttp://maps.navigasi.net
Administrative Boundaryhttp://bps.go.id
Food Security and Airporthttp://www.wfp.org/countries/ indonesia
Admin Capitalhttp://geospasial.bnpb.go.id
SRTM Relief Backgroundhttp://www2.jpl.nasa.gov/srtm/
Port, Volcano, Coastline and Riverhttp://geospasial.bnpb.go.id
Population, Water & Sanitation, Education, Health, Vulnerable Groups, Livelihood, Natural Disasterhttp://dibi.bnpb.go.id/
0 50 100 150 200 250050100150200250 (in thousand)
This products is prepared by: