Techno-economic Analysis for the Production of Silica ...
18
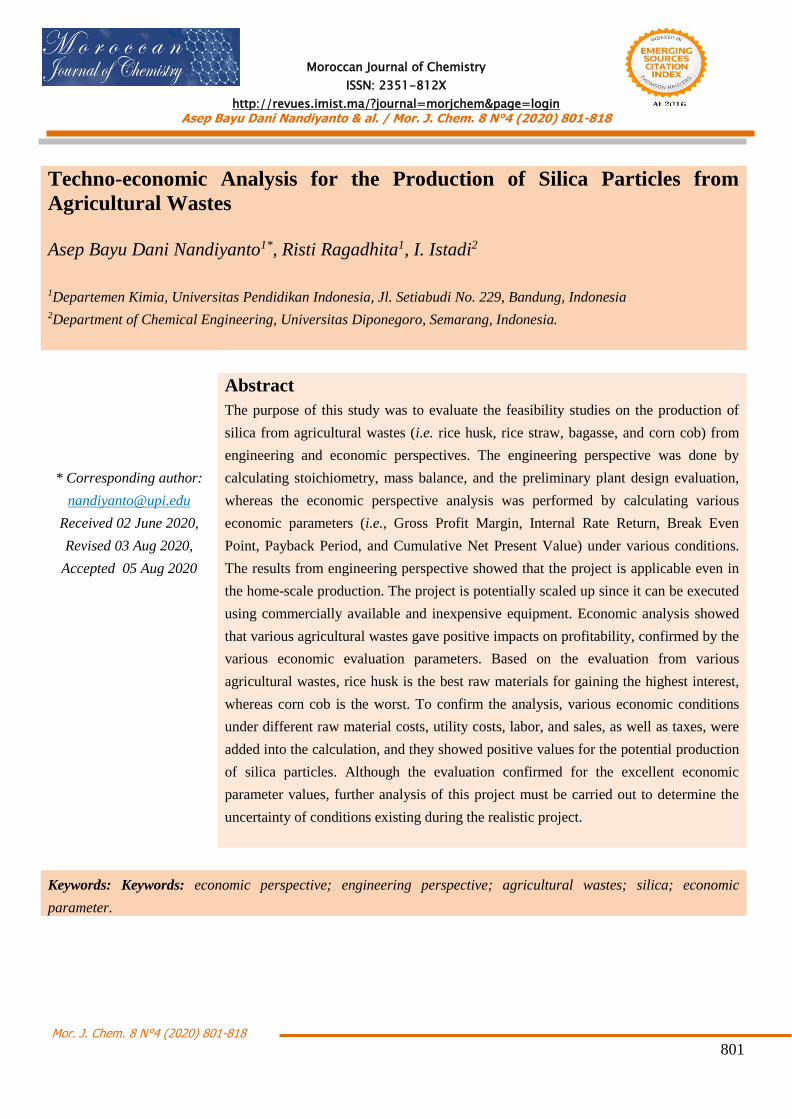
Moroccan Journal of Chemistry ISSN: 2351-812X http://revues.imist.ma/?journal=morjchem&page=login Asep Bayu Dani Nandiyanto & al. / Mor. J. Chem. 8 N°4 (2020) 801-818 Mor. J. Chem. 8 N°4 (2020) 801-818 801 Techno-economic Analysis for the Production of Silica Particles from Agricultural Wastes Asep Bayu Dani Nandiyanto 1* , Risti Ragadhita 1 , I. Istadi 2 1 Departemen Kimia, Universitas Pendidikan Indonesia, Jl. Setiabudi No. 229, Bandung, Indonesia 2 Department of Chemical Engineering, Universitas Diponegoro, Semarang, Indonesia. * Corresponding author: [email protected] Received 02 June 2020, Revised 03 Aug 2020, Accepted 05 Aug 2020 Abstract The purpose of this study was to evaluate the feasibility studies on the production of silica from agricultural wastes (i.e. rice husk, rice straw, bagasse, and corn cob) from engineering and economic perspectives. The engineering perspective was done by calculating stoichiometry, mass balance, and the preliminary plant design evaluation, whereas the economic perspective analysis was performed by calculating various economic parameters (i.e., Gross Profit Margin, Internal Rate Return, Break Even Point, Payback Period, and Cumulative Net Present Value) under various conditions. The results from engineering perspective showed that the project is applicable even in the home-scale production. The project is potentially scaled up since it can be executed using commercially available and inexpensive equipment. Economic analysis showed that various agricultural wastes gave positive impacts on profitability, confirmed by the various economic evaluation parameters. Based on the evaluation from various agricultural wastes, rice husk is the best raw materials for gaining the highest interest, whereas corn cob is the worst. To confirm the analysis, various economic conditions under different raw material costs, utility costs, labor, and sales, as well as taxes, were added into the calculation, and they showed positive values for the potential production of silica particles. Although the evaluation confirmed for the excellent economic parameter values, further analysis of this project must be carried out to determine the uncertainty of conditions existing during the realistic project. Keywords: Keywords: economic perspective; engineering perspective; agricultural wastes; silica; economic parameter.
Transcript of Techno-economic Analysis for the Production of Silica ...
Moroccan Journal of Chemistry
ISSN: 2351-812X
http://revues.imist.ma/?journal=morjchem&page=login
Asep Bayu Dani Nandiyanto & al. / Mor. J. Chem. 8 N°4 (2020) 801-818
Mor. J. Chem. 8 N°4 (2020) 801-818
801
Techno-economic Analysis for the Production of Silica Particles from
Agricultural Wastes
Asep Bayu Dani Nandiyanto1*, Risti Ragadhita1, I. Istadi2
1Departemen Kimia, Universitas Pendidikan Indonesia, Jl. Setiabudi No. 229, Bandung, Indonesia 2Department of Chemical Engineering, Universitas Diponegoro, Semarang, Indonesia.
* Corresponding author:
Received 02 June 2020,
Revised 03 Aug 2020,
Accepted 05 Aug 2020
Abstract
The purpose of this study was to evaluate the feasibility studies on the production of
silica from agricultural wastes (i.e. rice husk, rice straw, bagasse, and corn cob) from
engineering and economic perspectives. The engineering perspective was done by
calculating stoichiometry, mass balance, and the preliminary plant design evaluation,
whereas the economic perspective analysis was performed by calculating various
economic parameters (i.e., Gross Profit Margin, Internal Rate Return, Break Even
Point, Payback Period, and Cumulative Net Present Value) under various conditions.
The results from engineering perspective showed that the project is applicable even in
the home-scale production. The project is potentially scaled up since it can be executed
using commercially available and inexpensive equipment. Economic analysis showed
that various agricultural wastes gave positive impacts on profitability, confirmed by the
various economic evaluation parameters. Based on the evaluation from various
agricultural wastes, rice husk is the best raw materials for gaining the highest interest,
whereas corn cob is the worst. To confirm the analysis, various economic conditions
under different raw material costs, utility costs, labor, and sales, as well as taxes, were
added into the calculation, and they showed positive values for the potential production
of silica particles. Although the evaluation confirmed for the excellent economic
parameter values, further analysis of this project must be carried out to determine the
uncertainty of conditions existing during the realistic project.
Keywords: Keywords: economic perspective; engineering perspective; agricultural wastes; silica; economic
parameter.

Mor. J. Chem. 8 N°4 (2020) 801-818
802
1. Introduction
Silica is one of the most abundant materials in the earth's crust. This material is a type of inorganic compound that has
unique characteristics such as having a porous structure, thermally stable, good mechanical properties, and low
density, making it important for wide range of uses in industries, such as catalysts, adsorbents, biomedicine,
composites, drug delivery systems, and electricity and daily life [1-5]. In industry, silica is usually obtained from the
quartz sand mining process (as a raw material) through a conventional extraction process [4, 6-7], reforming it into
chemical precursors such as tetraethylorthosilicate (TEOS), sodium silicate, and tetramethylor-thosilicate for being
used for further production of silica-related products [8]. However, current production methods have met problems in
the high production costs and not environmentally friendly [4, 8]. To against this circumstance, the agricultural wastes
are potential to be used as a silica raw material since they have a high silica content. The chemical compositions in the
agricultural wastes are presented in Tables 1 and 2. They are also harmless, inexpensive, and environmentally friendly
[9]. The management and utilization of agricultural wastes also bring additional benefits for environmental
preservation for the prospect in achieving renewable energy. Agricultural wastes are also sustainable at the global
level, shown by the fact that they are widely produced continuously and annually they disposed in the world reaching
millions tons per year. However, the progress in the use of them is still minimal [10-12], in which this can be found
from the fact that they are only either burned in an open field or disposing to the ground. Yet, this practice is no longer
allowed based on regulations on environmental issues [13]. Examples of the most abundant agricultural wastes are rice
husk, rice straw, bagasse, and corn cob [8]. Several studies have reported the successful processes for gaining the
silica component since silica is the main content in the agricultural wastes [8,14,16]. Although reports have been well-
documented [8], shown the prospective insight for being utilized in industry, they presented in the lab-scale production
only. In fact, utilization of agricultural wastes is expected to be an excellent alternative for substituting current silica
raw materials that are scarce and expensive.
Table 1. Silica content in the ash of the agricultural wastes
Raw Material Silica Content in Ash (%) Reference
Rice Husk 90 [14]
>90 [15]
90-93 [16]
Rice Straw 75 [17]
65 [18-19]
74.6 [20]
Bagasse 92.5 [21]
96 [22]
89 [23]
70 [24]
Corn Cob 90.6 [25]
>60 [26-27]
27 [21]
52 [28]

Mor. J. Chem. 8 N°4 (2020) 801-818
803
Table 2. Silica composition in the agricultural wastes
Type of
agricultural
waste
Cellulose
(%)
Hemicellulose
(%)
Lignin
(%)
Silica
(%)
Others
components
(%)
Total
(%)
Reference
Corn Cob 42.5 32.5 15 10 0 100 [29]
Rice Husk 36 26 21 17 0 100 [30]
Rice straw 44 20 20 16 0 100 [31]
Sugarcane
bagasse
38 27 22 9 4 100 [32]
Here, the objective of this study was to evaluate the production of silica from agricultural wastes from engineering and
economic perspective. The engineering perspective was done by calculating stoichiometry, mass balance, and the
preliminary plant design evaluation, whereas the economic perspective analysis was performed by calculating various
economic parameters (i.e., Gross Profit Margin, Internal Rate Return, Break Even Point, Payback Period, and
Cumulative Net Present Value) under various conditions. The evaluation used and compared the effectiveness of the
use of rice husk, rice straw, bagasse, and corn cob as models of agricultural wastes. The main method for extracting
silica from these wastes is combination of burning process and acid-based extraction. Illustration for the process is
presented in Figure 1. These combinations were selected because burning can create energy and the acid-basic
extraction can be done using commercially available apparatuses. In the acid-basic extraction process, we selected the
use of sodium hydroxide (NaOH) and phosphoric acid. NaOH is used due to its inexpensive raw chemical. Phosphoric
acid is because this chemical can be directly neutralized and disposed to environment. This chemical also acts as
fertilizer in environment.
Figure 1. Illustration of steps for the extraction of silica from agricultural wastes
2. Fundamental Explanation in the Extraction of Silica from Agricultural Wastes
2.1. Burning Process
The burning process is conducted to get the advantages: creating energy from the combustion, removing most of the
organic components, converting embeded silica in the cellulose structure into silicon oxide. Indeed, conducting the
Mor. J. Chem. 8 N°4 (2020) 801-818
804
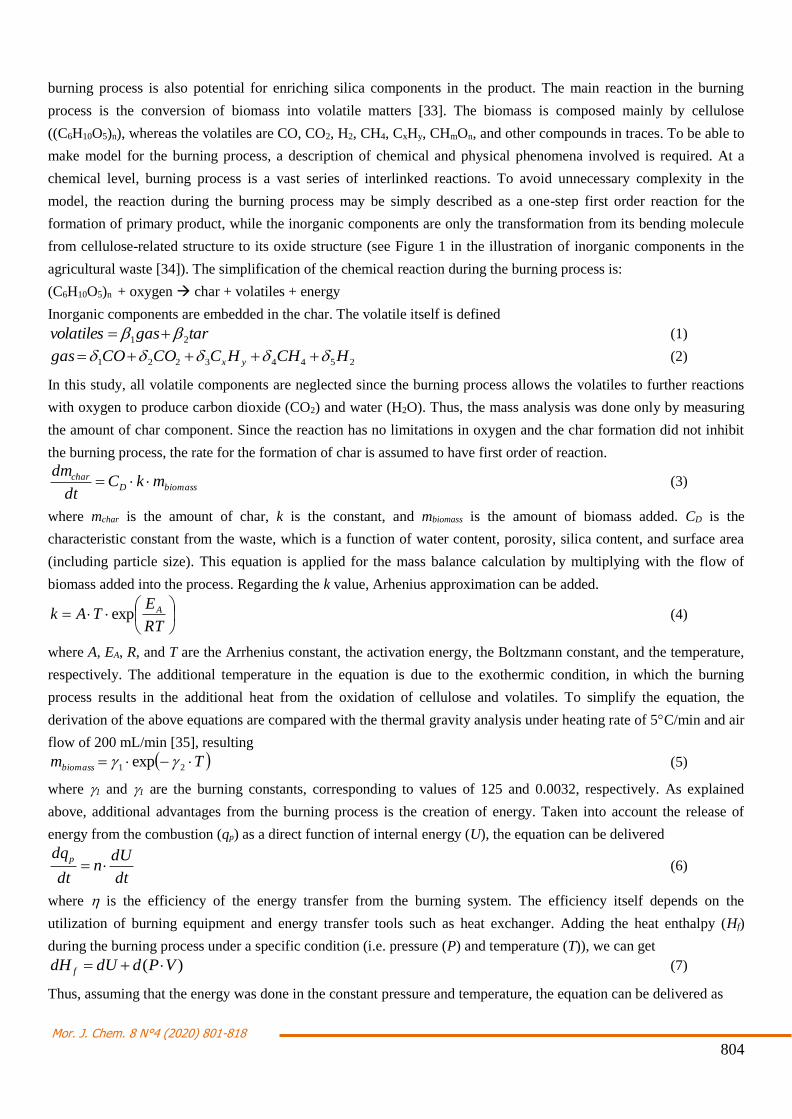
burning process is also potential for enriching silica components in the product. The main reaction in the burning
process is the conversion of biomass into volatile matters [33]. The biomass is composed mainly by cellulose
((C6H10O5)n), whereas the volatiles are CO, CO2, H2, CH4, CxHy, CHmOn, and other compounds in traces. To be able to
make model for the burning process, a description of chemical and physical phenomena involved is required. At a
chemical level, burning process is a vast series of interlinked reactions. To avoid unnecessary complexity in the
model, the reaction during the burning process may be simply described as a one-step first order reaction for the
formation of primary product, while the inorganic components are only the transformation from its bending molecule
from cellulose-related structure to its oxide structure (see Figure 1 in the illustration of inorganic components in the
agricultural waste [34]). The simplification of the chemical reaction during the burning process is:
(C6H10O5)n + oxygen char + volatiles + energy
Inorganic components are embedded in the char. The volatile itself is defined
targasvolatiles 21 (1)
25443221 HCHHCCOCOgas yx (2)
In this study, all volatile components are neglected since the burning process allows the volatiles to further reactions
with oxygen to produce carbon dioxide (CO2) and water (H2O). Thus, the mass analysis was done only by measuring
the amount of char component. Since the reaction has no limitations in oxygen and the char formation did not inhibit
the burning process, the rate for the formation of char is assumed to have first order of reaction.
biomassDchar mkC
dt
dm (3)
where mchar is the amount of char, k is the constant, and mbiomass is the amount of biomass added. CD is the
characteristic constant from the waste, which is a function of water content, porosity, silica content, and surface area
(including particle size). This equation is applied for the mass balance calculation by multiplying with the flow of
biomass added into the process. Regarding the k value, Arhenius approximation can be added.
RT
ETAk Aexp (4)
where A, EA, R, and T are the Arrhenius constant, the activation energy, the Boltzmann constant, and the temperature,
respectively. The additional temperature in the equation is due to the exothermic condition, in which the burning
process results in the additional heat from the oxidation of cellulose and volatiles. To simplify the equation, the
derivation of the above equations are compared with the thermal gravity analysis under heating rate of 5C/min and air
flow of 200 mL/min [35], resulting
Tmbiomass 21 exp (5)
where 1 and 1 are the burning constants, corresponding to values of 125 and 0.0032, respectively. As explained
above, additional advantages from the burning process is the creation of energy. Taken into account the release of
energy from the combustion (qp) as a direct function of internal energy (U), the equation can be delivered
dt
dUn
dt
dqp (6)
where is the efficiency of the energy transfer from the burning system. The efficiency itself depends on the
utilization of burning equipment and energy transfer tools such as heat exchanger. Adding the heat enthalpy (Hf)
during the burning process under a specific condition (i.e. pressure (P) and temperature (T)), we can get
)( VPddUdH f (7)
Thus, assuming that the energy was done in the constant pressure and temperature, the equation can be delivered as

Mor. J. Chem. 8 N°4 (2020) 801-818
805
fdfp HCq (8)
where Cdf is the characteristic constant from the burning equipment for generating electricity.
2.2. Silica extraction process
This step is a method for purifying silicon dioxide (as it is formed from the burning process). The process is conducted
using a basic solution to form silicic acid (Si(OH)4), and subsequently it is added to acid solution at 70C to form
precipitated silicon dioxide (SiO2) or silica. The reaction can be written as:
SiO2 + acid Si(OH)4 (chemical reaction is not equalized)
and
Si(OH)4 + base SiO2 (chemical reaction is not equalized)
The main parameters in the silica extraction process are the acid and basic solutions, in which this must be optimized
to get optimum condition. The reaction rate can be approximated by
acidr
basicq
silicapsilica mkmkmk
dt
dm210 (9)
where msilica, mbasic, and macid are the amount of silica, basic (NaOH), and acid (H3PO4), respectively. In addition, the
amount of silica must be calculated carefully since it is embedded in the char.
3. Method
In this study, feasibility study was assessed from engineering and economics perspectives. We evaluated the process
and compared several sources of agricultural wastes (i.e., rice husk, rice straw, bagasse, and corn cob). The
engineering perspective was used to evaluate the production of silica from agricultural wastes using combination of
burning and acid-basic extraction processes [36]. The method was done by making simulation the process in the large-
scale production using existing commercially available apparatuses. The process was then simulated based on mass
balance involved during the process. In the economic evaluation, several assumptions were used based on all
apparatus’ specifications, prices for raw materials/chemicals, utility system, and equipment costs, in which these were
adopted from online web stores, such as: Alibaba, Bukalapak, Tokopedia, etc. These data were then used and included
in the calculations for economic feasibility analysis. The analysis was done by applying the calculation in the ideal and
non-ideal conditions (by changing several variables: raw material prices, utilities, labor, and sales capacity). Then, the
calculation used for the economic feasibility analysis was adopted from the literature [37-38]. Different from typical
calculation of economic parameters [39], additional stoichiometry from the chemical reaction were added. The
calculation is explained as follows:
Gross Profit Margin (GPM) is gained through a reduction selling price and raw materials price.
tQPCRMSGPMt
t
)(1
(10)
where S, RM, and PC is the total sales, the total raw material, the production capacity, respectively. Q is the capacity of
raw material inputted and applied in the process (kg/h), and t is the production time. is the efficiency of the
conversion, in which this is mainly depending on the chemical reaction in the burning and extraction processes.
Cumulative Net Present Value (CNPV) is gained by totaling a Net Present Value (NPV) at a certain time from the
start of the project. The NPV can be calculated by multiplying the cash flow with a discount factor:
tr
ttr
tr i
RNPV
)1(1 (11)

Mor. J. Chem. 8 N°4 (2020) 801-818
806
where Rt is the net cash inflow subtracted by outflows during a single period of tr, i is the discount rate that could be
earned in alternative investment, tr is the project time (in year), and Tr is the final year of the project..
Internal Rate Return (IRR) was calculated using following equations:
otr
ttr
trC
i
CNPV
)1(1
(12)
where Co and Ct are the total investment costs and the net cash inflow during the tr period, respectively. IRR is
calculated from the value of r when the NPV is zero.
Payback Period (PBP) predicts the length of time a project has to get its initial capital back. PBP is calculated when
CNPV/TIC reaches zero.
Break Event Point (BEP) is calculated by dividing fixed costs by profit.
Profitability Index (PI) is estimated by dividing CNPV by sales and the total investment cost depending on the type
of PI whether PI to sales or PI to investment.
4. Results
4.1. Engineering Perspective
In this study, silica particles from various sources of agricultural wastes (i.e., rice husk, rice straw, bagasse, and corn
cob) are fabricated through combination of burning and acid-based extraction methods, which are adopted from the
literature [36-38]. The illustration process of silica fabrication is shown in Figure 2. The silica fabrication process is
based on the bottom-up approach. The first step is the preparation and carbonization of agricultural wastes.
Agricultural wastes are washed and soaked with water for 15 minutes to remove impurities attached to the agricultural
wastes. After washing, they are dried (using an oven at 200C for 2 hours), grinding (using a saw-milling process) and
carbonized (using furnaces at 600C for 4 hours). The second step is the silica extraction process. Carbonized
agricultural wastes are then washed with water and centrifuged until the washing water no longer looks turbid (about 5
times washed). Then, the solution is put into a polymeric batch reactor and NaOH solution. The process using NaOH
extracted is for 2 hours at temperature of 70°C to obtain silicic acid solution. The silicic acid solution is then washed
by the centrifugation for 10 minutes at 11000 rpm to separate the silicate solution from the carbon residue. The third
step is the nucleation process. The silicic acid solution extract is then added with phosphoric acid until the pH reaches
10 and white solids are formed. The white solid formed is then washed with methanol, centrifuged, and dried using an
oven for 30 minutes at 50°C, and ground to obtain dry silica powder. The silica fabrication (as illustrated in Figure 2)
was done through the following assumptions: (1). Raw materials were agricultural wastes (i.e., rice husk, rice straw,
bagasse, and corn cob), NaOH, and Phosphoric Acid, which are calculated and compared to literature [36-38]; (2). All
raw materials were scaled up to 50,000 times from lab scale in the literature; (3). The conversion rates (for the gaining
silica from agricultural waste ashes) are 91, 70, 85, and 60%, respectively, corresponding to the use of i.e., rice husk,
rice straw, bagasse, and corn cob [16, 40-41]; (4). Existence of losses during the process of transferring, drying,
heating, and collecting products is 5%; (5). Assumptions for silica fabrication are taken based on 3 cycles in a day,
with the composition of each raw material and yields of silica products on 1 cycle in a day are presented in Table 3.

Mor. J. Chem. 8 N°4 (2020) 801-818
807
Figure 2. Ilustration Process of Silica Fabrication
Table 3. Composition of Raw Material and Silica Yield Product
Type of Agricultural
Wastes
Amount of
Agricultural
Wastes (kg)
NaOH (kg) Phosporic Acid (L) Silica Yield (kg)
Rice Husk 2500 1800 38 400
Rice Straw 2500 2000 30 280
Bagasse 2500 4000 35 200
Corn Cob 2500 4500 25 150
Figure 3. Production Capacity of agricultural waste on energy gained
Based on the assumptions, the silica produced during one year of production for i.e., rice husk, rice straw, bagasse, and
corn cob are 360,000; 352,000; 180,000; and 135,000 kg/year, respectively. In addition to the prospective use of

Mor. J. Chem. 8 N°4 (2020) 801-818
808
agricultural wastes (i.e., rice husk, rice straw, bagasse, and corn cob) as the silica raw material, they produce energy
from the conversion of organic biomass, giving a problem solver for against the dependence of fossil fuels. Energy
calculation assumes the composition of waste are mostly cellulose (Hf = -2828 kJ/mol; molecular weight = 162.1406)
and silica (while other components are neglected), and the Cdf value is 50%, the energy gained from the burning
process is shown in Figure 3. The figure presents the availability of agricultural waste of the obtainment of energy.
The more availability of agricultural waste correlates with the greater energy produced. Indeed, energy can be re-
generated from the process itself and can be reused as an alternative energy used in this project, including reducing the
project utility costs.
4.2. Economic Evaluation
Several assumptions were used to analyze the economic perspective of the silica project. i.e.: (a). Conversion from
USD to Rupiah is 1 USD = Rp. 15.000; (b). All raw material prices and sales refer to online shopping web such as
Alibaba, Bukalapak, Tokopedia, etc. The prices of raw materials such as NaOH and phosphoric acid are 0.26 USD/Kg
and 2 USD/Liter, respectively. Meanwhile, agricultural waste can be obtained free of charge. The selling price of silica
is 7.3 USD/kg; (c). Stoichiometry calculations are used to calculate all raw materials used during the silica fabrication
process; (d). The discount rate and income tax are 15 and 10%, respectively; (e). Electric utility costs are 0.15
USD/kWh; (f). The water source is free of charge because the project is located near the river; (g). Silica production
consists of 3 cycles per day. The time required for one cycle in the silica production is 2 hours; (h). Labor works for
300 days per year; (i). Lang Factor is used to analyze the project's total investment cost (TIC) (see Table 4); (j). The
manufacturing cost is changeable and predicted from the beginning of the project.
Table 4. Lang Factor for Estimating Total Investment Cost
Component Factor
Purchased Equipment 1
Piping 0.5
Electrical 0.1
Instrumentation 0.2
Utilities 0.5
Foundations 0.1
Insulations 0.06
Painting, fireprofing, safety 0.05
Yard Improvement 0.08
Environmental 0.2
Building 0.08
Land 0.5
Construction, engineering 0.6
Contractors fee 0.3
Contigency 0.2
The estimation of manufacturing cost is shown in Table 5; (k). Other supporting costs such as instrumentation, factory
start-up, and electrical related components are neglected; (l). The project operated under a purchased land. Therefore,

Mor. J. Chem. 8 N°4 (2020) 801-818
809
the land is calculated as the initial cost of project construction which is then recovered after the project runs (at the end
of the project); (m). Direct depreciation is used to calculate the depreciation value of the project; (n). The total wage is
in a fixed value of 8 USD/day and the number of workers in this project is 50 people; and (o). The project operates for
20 years.
Table 5. Factor for estimating manufacturing cost
Component Factor
1. Labor related cost
a. Payroll overhead 30% of labor
b. Supervisory, misc. labor 25% of labor
c. Laboratory charges 12% of labor
2. Capital related cost
a. Maintenance 6% of (TPC-land)
b. Operating supplies 1.75% of (TPC-land)
c. Environmental 2.25% of (TPC-land)
d. Depreciation 5.00% of (TPC-land)
e. Local taxes, insurance 4% of (TPC-land)
f. Plant overhead cost 3% of (TPC-land)
3. Sales related cost
a. Packaging 1.00% of sales
b. Administration 2.00% of sales
c. Distribution and marketing 2% of sales
d. Research and development 1% of sales
e. Patents and royalties 1% of sales
4.3. Ideal Condition
The engineering perspective shows that the project is easily operated, simply improved, and developed using
technologies and apparatuses that are currently available and inexpensive equipment. In the economic evaluation,
analysis in the ideal condition (shown in the 20-year CNPV curve in Figure 4) is very promising, confirmed by the
PBP values that are relatively short (in only 2 years) to return all capital costs. Sorting the final CNPV values of
various wastes from highest to lowest profits is sequentially for rice husk, rice straw, bagasse, and corn cob. CNPV
relates to the number of product yield. The more product yields have direct correlations to the obtainment of more
sales targets and profits by a project in certain periods [42]. Rice Husk source leads to getting the highest CNPV value
since it has the highest silica content, making the process allowing the highest product. The CNPV curves from the
corn cob is the lowest compared to others. This is because corn cob has the smallest content of silica, making the final
product to have less amount of silica product. Besides CNPV analysis, overall economic feasibility parameter shows a
positive value (see Table 6), confirming silica project is promising. The GPM value depends on the product capacity.
The higher product capacity relates to the higher final CNPV value obtained. Based on the analysis of the profitability
index (PI) based on PI to sales and PI to TIC, the most profitable silica projects are sequentially for rice husk, rice
straw, bagasse, and corn cob. The higher of PI to sales and PI to TIC value replies the higher profitability. The BEP
project values are almost the same for all cases. BEP is the point where income equals to capital spent (no loss or

Mor. J. Chem. 8 N°4 (2020) 801-818
810
profit is obtained). The greater project's profitability implies the better the BEP value of the project. The higher BEP
value obtained correlates to the higher risk [42].
Figure 4. CNPV/TIC analysis of silica production
Table 6. Economic Parameter
Source TIC
(USD)
GPM/Year
(USD)
PBP
(Year)
IRR
(%)
CNPV/TIC
(USD)
PI to Sales
(%)
PI to
TIC (%)
BEP/year
(Pack)
Rice
Husk
430,3
00
3,687,1
00
4.
54
2
.83
3078 86.09 762.
36
15,996
Rice
Straw
430,3
00
2,902,6
00
4.
54
2
.43
2367 82.74 591.
95
16,457
Bagasse 430,3
00
1,978,9
00
4.
54
1
.71
1380 80.47 393.
17
16,720
Corn Cob 430,3
00
1,474,0
00
4.
54
1
.46
1080 74.22 283.
31
17,801
4.4. Effect of Raw Materials and Sales
Figure 5 shows the effect of production factors (raw materials) on the GPM value of silica projects. In this study, since
agricultural wastes are obtained free of charge, agricultural wastes are not included in the raw material calculation.
Fluctuations in the price for raw materials are presented in Figures 5(a) and (b), corresponding to caustic soda and
phosphoric acid, respectively. Fluctuations in prices significantly affect the GPM profits [42]. The analysis showed
that all projects using various sources of wastes can still survive and operate until the price of raw materials reaches
200% of the estimated price. In the case of raw materials, caustic soda gave slightly higher impacts compared to the
phosphoric acid. Assuming that the selling price of silica products (sales) is the same, the increases in prices of raw
materials have a negative impact on profits [39].

Mor. J. Chem. 8 N°4 (2020) 801-818
811
Figure 5. Effect of Caustic Soda (a) and Phosporic Acid (b) on GPM
Figure 6. Effect of Cost of Raw Material on Profitability (a) and BEP (b)

Mor. J. Chem. 8 N°4 (2020) 801-818
812
Figure 6(a) shows analysis of sensitivity in the price change of raw material (caustic soda and phosphoric acid) on the
profitability. In line with the GPM analysis, the increases in the raw material price of caustic soda and phosphoric acid
has a direct impact to the continuity of the project (less profitability). The BEP analysis for the change in raw materials
(i.e. caustic soda and phosphoric acid) is shown in Figure 6(b). The results showed that the higher prices of raw
materials brought good influences on the obtainment of higher BEP values. Indeed, this informs that the costs of raw
materials must be decreased as much as possible, in which this can be done by making agreements with the raw
materials producers
4.5. Effect of Sales
Analysis of GPM in sales is presented in Figure 7(a). The results indicated that increases in selling prices had a
positive impact on the profits [43]. All projects must be done using sales of higher than 50%. When the prices of
product is less than 50% of the ideal sales, the project will be failure. Profitability analysis on sales is presented in
Figures 7(b and c). The analysis showed that the higher sales allow more profits to be achieved. Based on GPM and
profitability analysis results, in general, this study found that the project fails if the price of products is less than 50%
of the estimated sales. The BEP analysis for the change in sales is shown in Figure 7(d). Increases in sales lead to the
obtainment of smaller BEP value. Above results agree that higher sales will permit the higher profits from the project
(see Figure 7(c)). However, too high prices of product does not give significant impacts on the project since it can
cause decreases in the number of consumed products by market [44]. To improve the number of sold products, an
agreement between producer and consumer is required, including understanding for absorbing the products. Indeed,
this will correlate to the optimization of product price, especially in the situation when the increases in competition
and limited demand development.
Figure 7. Effect of Sales on GPM (a), Profitability (b), and BEP (c) of the project
4.6. Effect of Utilities and Labor Cost
Results from the analysis of utilities and labor costs in the project are presented in Figures 8(a) and (b), respectively.

Mor. J. Chem. 8 N°4 (2020) 801-818
813
Different from raw materials and sales (as shown in Figures 5 and 6), utilities and labor have less impacts on the
project profits, informing that the change in this parameter (up to 200%) is not a big issue in the sustainability of all
projects (i.e., rice husk, rice straw, bagasse, and corn cob).
Figure 8. Effect of Utility (a) and Labor cost (b) on Profitability
4.7. Effect of Variable Costs
Variable costs are the combination of cost of raw materials, labor, utilities, and overhead costs. Variable costs are
the largest costs that must be provided by the project. These costs must be used efficiently to achieve optimal profits
[45]. Analysis of changes in variable costs to CNPV is shown in Figure 9. The change in the variable costs gave
impacts on profits (shown by the change in the CNPV curves). Lower variable costs can produce maximum profits.
The maximum value for the changes in the variable costs is 500% of the estimated values for all three projects (i.e.,
rice husk, rice straw, and bagasse). As for silica projects from corn cob raw material, the maximum variable cost value
is 400% of the estimated value. The impacts of the wastes influences on the consumption of raw material (i.e., caustic
soda and phosphoric acid) and variable costs used.

Mor. J. Chem. 8 N°4 (2020) 801-818
814
Figure 9. Variable cost analysis on silica project produced from rice husk (a); Rice Straw (b); Bagasse (c); and
Corn Cob (d).
4.8. Effect of Production Capacity
Production capacity is the number of units produced and needed by a company to meet demands of products in the
market [46]. Sometimes product capacity relates to the condition when there is a failure in the production process,
such as limitations of raw materials and problems the production (such as equipment issue, product error, etc).
Analysis of production capacity to the CNPV value is shown in Figure 10. The results showed that the minimum
production capacity to maintain the project is 25%. If the production capacity does not reach the minimum capacity
(less than 25%), the project suffer losses. Indeed, the higher production capacity has a correlation to the higher profit
gained by the project, and it has impacts on the change of PBP [47].

Mor. J. Chem. 8 N°4 (2020) 801-818
815
Figure 10. Production capacity analysis on silica project made from Rice Husk (a); Rice Straw (b); Bagasse (c);
and Corn Cob (d).
4.9. Effect of External Condition
In addition to the internal factors such as raw materials, utilities, and labor, as well as production capacity, external
factors must be considered since it gives influences on the successful project. External factors relate to the economic
condition of a country where the project is established, including taxes and subsidiaries from the state imposing on
companies [48]. To find out the effect of taxes imposed to companies, this study used speculative tax values that must
be paid starting from 10 to 100% of the predictive value for the worst cases in Indonesia. Analysis of tax variations on
the value of CNPV is shown in Figure 11. Analysis was done by comparing four types of the wastes (i.e., Rice Husk
(a); Rice Straw (b); Bagasse (c); and Corn Cob (d), corresponding to Figures 11(a), (b), (c), and (d), respectively).
Similar trend in the CNPV curves were obtained for these types of wastes. In the year 0 to the second year, the taxes
have not been charged to the company because this year is the project when is still under construction. The tax effect
was investigated after two years of the established project. The analysis shows that the higher taxes imposed on a
project result in the obtainment of smaller final CNPV value. The largest tax values to make the project still getting
minimum profit is 75% of the predicted value. If the tax charged is more than 75%, then the project fails.

Mor. J. Chem. 8 N°4 (2020) 801-818
816
Figure 11. Tax Analysis on silica project made from rice husk (a); Rice Straw (b); Bagasse (c); and Corn Cob (d).
4.9. Engineering Perspective
The daily needs of silica projects and the number of yields produced per day for each type of agricultural waste (i.e.,
rice husk, rice straw, bagasse, and corn cob) can be seen in Table 2. The results of the engineering analysis of silica
projects with various raw materials originating from agricultural wastes are considered perspectives based on
engineering evaluation and feasibility to scale-up process using available and inexpensive equipment. It confirmed by
excellent TIC for each project. TIC values for each raw materials are shown in Table 5. The TIC value of the project is
calculated using the Lang Factor.
4.10. Economic Perspective
Silica projects were analyzed based on ideal and non-ideal conditions. The results of the project analysis showed that
the silica project from various agricultural wastes as raw materials shows promising results. However, when there is a
change in economic conditions as shown in several cases the results of the analysis of non-ideal conditions of the
project, it gets only minimal benefits. In detail, the economic conditions of the project are explained as follows: (1).
The project is still profitable despite an increase in the price of production parameters such as raw materials (caustic
soda and phosphoric acid), utilities, and labor of up to 200%. In this study, production parameters did not significantly
affect the project profits; (2). Sales must be increased to get the maximum profit of a project. However, the selling
price must also be optimized with the cost of production parameters. To maintain the project profit, the reduction in
selling price must not be less than 25% for all cases; (3). The project is still profitable even though the tax charged is
more than 75% for all projects. When the tax charged reaches 75%, the project is at a disadvantage and no loss
condition. However, if the tax charged exceeds 75% the project fails; and (4). To find out the maximum profit of the
project, we must look at the profitability analysis. The most profitable projects are silica projects sourced from rice

Mor. J. Chem. 8 N°4 (2020) 801-818
817
husk, rice straw, bagasse, and corn cob. The results of the economic analysis of silica projects with various agricultural
wastes (i.e., rice husk, rice straw, and bagasse) showed promising results. This is shown from the positive values of
economic parameters such as GPM, PBP, PI to sales, PI to TIC, and the final CNPV. PBP analysis shows that the
project requires a relatively short in time to make a profit, which takes only 4 years to achieve the project's profit. In
addition, indicators of the level of efficiency of the investment is confirmed by the IRR value. IRR of silica projects
shows a small value (between 1.43 – 2.83%). The IRR value indicates that the proposed investment project should be
rejected because it is not financially feasible. The final CNPV value for 20 years also shows a relatively small value.
This provides unattractive perspective for investors for long-term investment, thus this project must be done in a short
period. We also suggest that the project can be done under governmental project or Corporate Social Responsibility
(CSR).
4. Conclusion
The results of the silica project analysis from an engineering perspective showed that the scale up of this project can
be done using currently available and inexpensive tools. Analysis engineering showed that silica conversion from
agricultural wastes was perspective and can be done under inexpensive investment. The economic perspective of silica
projects shows the project is profitable but it is not attractive to industrial investors for long period. This project is a
perspective solution to solve the problems of agricultural waste in agricultural countries. Whether this project is
profitable or not, this project must still be built with additional financial support which is the social responsibility of
the government or industry.
Acknowledgements- This study acknowledged RISTEK DIKTI for Grant-in-aid Penelitian Terapan Unggulan
Perguruan Tinggi (PTUPT).
References
[1] N. K. Mondal, A. Roy, Moroccan Journal of Chemistry, 3(1) (2015) 3-1.
[2] H. Bouhali, N. Chalal, H. Hamaizi, A. Bengueddach, Moroccan Journal of Chemistry, 3(4) (2015) 3-4. [3] B. Bensafi, F. Djafri, N. Chaout, R. Djari, I. Benchikh, D. Dari, A. Bengueddach, Moroccan Journal of Chemistry,
4(4) (2016) 4-4.
[4] F. Ghorbani, H. Younesi, Z. Mehraban, M. S. Celik, A. A. Ghoreyshi, M. Anbia, Journal of the Taiwan Institute
of Chemical Engineers, 44 (5) (2013) 821-828.
[5] A. E. Hadrami, S. Ojala, E. M. Chatir, J. Assaoui, R. Bbrahmi, Moroccan Journal of Chemistry, 8(3) (2020) 8-3.
[6] C. P. Faizul, C. Abdullah, B. Fazlul, Advanced Materials Research, 626 (2013) 997-1000
[7] U. Kalapathy, A. Proctor, J. Shultz, Bioresource Technology, 73 (3) (2000) 257-262.
[8] N. Permatasari, T. N. Sucahya, A. B. D. Nandiyanto, Indonesian Journal of Science and Technology, 1 (1) (2016)
82-106.
[9] K. G. Patel, R. R. Shettigar, N. M. Misra, Journal of Advanced Agricultural Technologies, 4 (3) (2017) 274-279.
[10] L. Nahali, Y. Miyah O. Assila, A. El Badraoui, B. El Khazzan, F. Zerrouq, Moroccan Journal of Chemistry, 7(4)
(2019) 7-4.
[11] S. Kumar, P. Sangwan, R. M. V. Dhankhar, S. Bidra, Research Journal of Chemical and Environmental Sciences,
1 (5) (2013) 126-129.
[12] A. S. Muhammad, Moroccan Journal of Chemistry, 8(2) (2020) 8-2.
[13] A. B. D. Nandiyanto, A. Machmud, A. G. Abdullah, Advanced Science Letters, 24(12) (2018), 9303-9306.
[14] B. S. Todkar, O. A. Deorukhkar, S. M. Deshmukh, International Journal of Engineering Research and
Development, 12 (3) (2016), 69-74.
[15] R. A. Bakar, R. Yahya, S. N. Gan, Procedia Chemistry, 19 (2016) 189-195.
[16] S. Azat, A. V. Korobeinyk, K. Moustakas, V. J. Inglezakis, Journal of Cleaner Production, 217 (2019) 352-359.
[17] H. Khaleghian, M. Molaverdi, K. Karimi, Industrial and Engineering Chemistry Research, 56 (35) (2017) 9793-
9798.
Mor. J. Chem. 8 N°4 (2020) 801-818
818
[18] M. S. U. Rehman, M. A. Umer, N. Rashid, I. Kima, J. Han, Industrial Crops and Products, 49 (2013) 705–711.
[19] M. M. Abou-Sekkina, R. M. A. Issa, A. E. M. Bastawisy, W. A. El-Helece, International Journal of Chemistry, 2
(2010) 81–88.
[20] A. B. D. Nandiyanto, N. Permatasari, T. N. Sucahya, S. T. Purwanti, H. S. H. Munawaroh, A. G. Abdullah, L.
Hasanah, IOP Conference Series: Materials Science and Engineering, 180 (1) (2017) 012138.
[21] N. Sapawe, N. S. Osman, M. Z. Zakaria, S. A. S. S. M. Fikry, M. A. M. Aris, Materials Today: Proceedings, 5
(10) (2018) 21861-21866
[22] A. R. F. Drummond, I. W. Drummond, Industrial and Engineering Chemistry Research, 35 (4) (1996) 1263-
1268.
[23] S. Norsuraya, H. Fazlena, R. Norhasyimi, Procedia Engineering, 148 (2016) 839-846.
[24] A. Bahurudeen, M. Santhanam, Cement and Concrete Composites, 56 (2015) 32-45.
[25] T. Chanadee, S. Chaiyarat, Journal of Materials and Environmental Science, 7 (7) (2016) 2369-2374.
[26] P. Velmurugan, J. Shim, K. J. Lee, M. Cho, S. S. Lim, S. K. Seo, B. T. Oh, Journal of Industrial and Engineering
Chemistry, 29 (2015) 298-303.
[27] J. Shim, P. Velmurugan, B. T. Oh, Journal of Industrial and Engineering Chemistry, 30 (2015) 249-253.
[28] E.A Okoronkwo, P.E Imoisili, S.O.O Olusunle. Chemistry and Material Research, 4, 2013: 68-72.
[29] G. A. P. K. Wardhani, Jurnal Kimia Riset, 2 (1) (2017) 37-42.
[30] F. P. Syahrani, E. E. Ernawati, Solihudin, Haryono, R. A. Tjokronegoro, Prosiding Seminar Nasional MIPA
2016, (2016) 12-16.
[31] E. A. P. Wibowo, A. W. Arzanto, K. D. Maulana, A. D. Rizkita, Jurnal Ilmiah Sains, 18 (1) (2018) 35-40.
[32] D. Szczerbowski, A. P. Pitarelo, A. Zandoná Filho, L. P. Ramos, Carbohydrate Polymers, 114 (2014) 95-101.
[33] B. Miljković, I. Pešenjanski, M. Vićević, Fuel, 104 (2013) 351-364.
[34] Y. Shen, Renewable and Sustainable Energy Reviews, 80 (2017) 453-466.
[35] J. A. S. Costa, C. M. Paranhos, Journal of Cleaner Production, 192 (2018) 688-697.
[36] A. B. D. Nandiyanto, T. Rahman, M. A. Fadhlulloh, A. G. Abdullah, I. Hamidah, B. Mulyanti, IOP Conference
Series: Materials Science and Engineering, 128 (1) (2016) 012040.
[37] A. B. D. Nandiyanto, Journal of Engineering, Science and Technology, 13 (6) (2018) 1523-1539.
[38] R. Ragadhita, A. B. D. Nandiyanto, W. C. Nugraha, A. Mudzakir, Journal of Engineering, Science and
Technology, 14 (4) (2019) 2052-2062.
[39] R. Ragadhita, A. B. D. Nandiyanto, A. C. Maulana, R. Oktiani, A. Sukmafitri, A. Machmud, E. Surachman,
Journal of Engineering, Science and Technology, 14 (3) (2019) 1639-1652.
[40] P. Simatupang, C. P. Timmer, Bulletin of Indonesian Economic Studies, 44(1) (2008) 65-80.
[41] A. Sukmafitri, R. Ragadhita, A. B. D. Nandiyanto, W. C. Nugraha, B. Mulyanti, Journal of Engineering, Science
and Technology, 15 (2) (2020) 991-1000.
[42] H. Hendrawati, Jurnal Akuntansi, 11(1) (2017) 154-178.
[43] F. H. E. Prabowo, Management Review, 3 (1) (2019) 273-275.
[44] P. Novák, B. Popesko, Economics and Sociology, 7 (4) (2014) 89-103.
[45] T. T. Siyanbola, G. M. Raji, International Journal of Management and Social Sciences Research, 2(4)(2013) 1-7.
[46] L.K.,Bhullar, Z.A. Putra, Indonesian Journal of Science and Technology, 2(2) (2017) 166-182.
[47] B. Sarkar, A. Majumder, M. Sarkar, N. Kim, M. Ullah, International Journal of Advanced Manufacturing
Technology, 99 (2018) 567–581.
[48] R. Macek, Review of Economic Perspectives, 14 (4) (2014) 309-328.