PT Perusahaan Listrik Negara (Persero) - ESMAP Perusahaan... · PT Perusahaan Listrik Negara...
17
PT Perusahaan Listrik Negara (Persero) Going Through the 2008 Global Financial Crisis Electricity for a Better Life
Transcript of PT Perusahaan Listrik Negara (Persero) - ESMAP Perusahaan... · PT Perusahaan Listrik Negara...
PT Perusahaan Listrik Negara (Persero)
Going Through the 2008 Global Financial Crisis Electricity for a Better Life

TABLE OF CONTENTS
COMPANY OVERVIEW1
MACROECONOMIC & INDUSTRY ANALYSIS2
1
APPENDIX 5
COMPANY’S STRATEGIC INITIATIVES3
THE CRISIS & COMPANY’S ACTIONS4
2
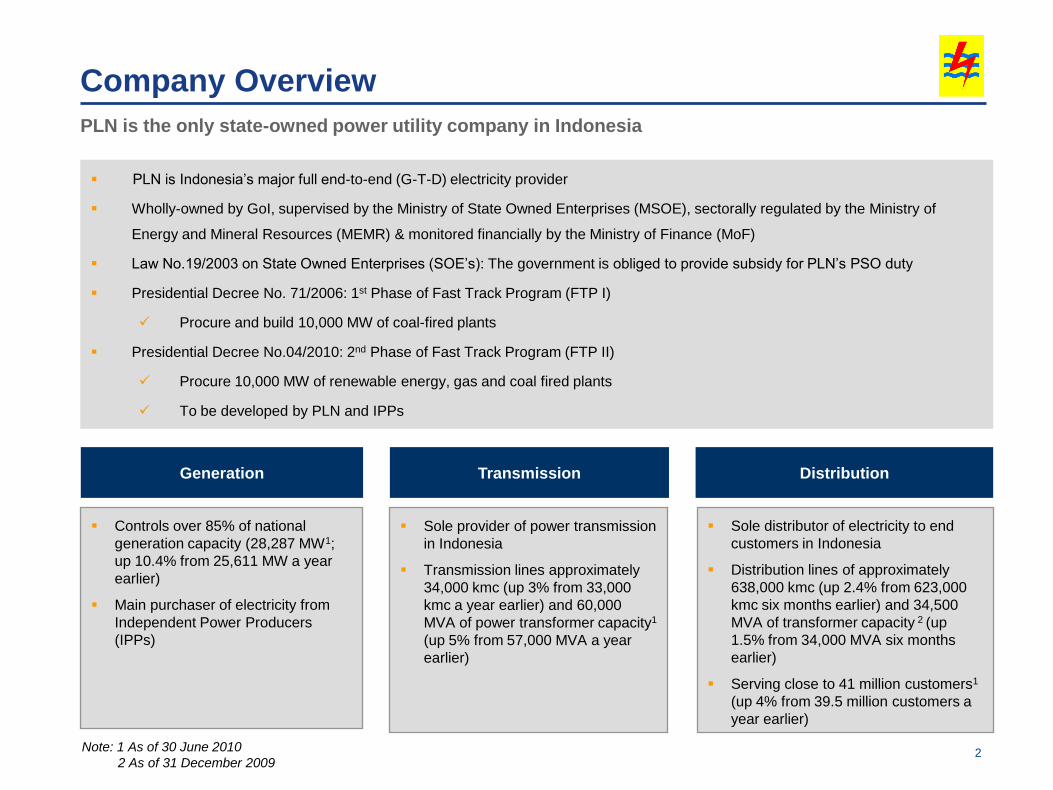
PLN is Indonesia’s major full end-to-end (G-T-D) electricity provider
Wholly-owned by GoI, supervised by the Ministry of State Owned Enterprises (MSOE), sectorally regulated by the Ministry of
Energy and Mineral Resources (MEMR) & monitored financially by the Ministry of Finance (MoF)
Law No.19/2003 on State Owned Enterprises (SOE’s): The government is obliged to provide subsidy for PLN’s PSO duty
Presidential Decree No. 71/2006: 1st Phase of Fast Track Program (FTP I)
Procure and build 10,000 MW of coal-fired plants
Presidential Decree No.04/2010: 2nd Phase of Fast Track Program (FTP II)
Procure 10,000 MW of renewable energy, gas and coal fired plants
To be developed by PLN and IPPs
Company Overview
PLN is the only state-owned power utility company in Indonesia
Controls over 85% of national
generation capacity (28,287 MW1;
up 10.4% from 25,611 MW a year
earlier)
Main purchaser of electricity from
Independent Power Producers
(IPPs)
Sole provider of power transmission
in Indonesia
Transmission lines approximately
34,000 kmc (up 3% from 33,000
kmc a year earlier) and 60,000
MVA of power transformer capacity1
(up 5% from 57,000 MVA a year
earlier)
Sole distributor of electricity to end
customers in Indonesia
Distribution lines of approximately
638,000 kmc (up 2.4% from 623,000
kmc six months earlier) and 34,500
MVA of transformer capacity 2 (up
1.5% from 34,000 MVA six months
earlier)
Serving close to 41 million customers1
(up 4% from 39.5 million customers a
year earlier)
Generation Transmission Distribution
Note: 1 As of 30 June 2010
2 As of 31 December 2009

3
MACROECONOMIC & INDUSTRY ANALYSIS
3

4
Indonesia remains in strong position to continue the improvement in its economy
Better than expected economic
outlook, upgraded ratings
Indonesia’s economy grew at a faster-than
expected 6.2% in the 2nd quarter on strong
exports, investment and consumer demand
S&P upgraded Indonesia’s credit ratings to BB
from BB- in March 2010
Fitch Ratings upgraded Indonesia’s credit ratings
to BB+ in January 2010
Global economic recovery bolster the
external sector
Economic indicators from developed and
emerging markets are showing signs of a global
economic recovery
Stronger private consumption coupled with rising
production levels are leading US economic
recovery
Meanwhile, Japan began to experience positive
economic growth in the final quarter of 2009.
Strong growth in India and China are fuelling
import. This will have a positive impact on trade
partner countries, including Indonesia
Solid Rupiah, Current Account & FX
Reserves Support
Foreign exchange reserves have rose over 3% in
a month to US$78.8 billion at end July 2010. This
is equivalent to financing more than half a year of
imports and foreign debt repayment
The IDR has appreciated 7% against USD since
July, reflecting increasing capital inflows and
exports growth of 54% yoy
The 2010 state budget currently has a surplus of
around Rp150 trillion (+ US$17 billion), Because
of the surplus, the government saw no urgency in
the issuance of foreign currency-denominated
bonds, including Samurai bonds.
Fiscal Stimulus had seen rise in
consumption
Private consumption rose 3.9% yoy in the 1st
quarter on top of stronger export performance
This was confirmed by increases in a number of
consumption indicators such as imports of
consumption goods, automobile and motorcycle
sales, and retail sales.
Further growth in household consumption is
expected with higher income levels as Indonesia
progresses
Source: BPS, Bank Indonesia, Ministry of Finance
Controllable Inflation
Indonesia’s central bank has pledged special
attention to rising inflation which is projected to
remain within its target corridor of 5% + 1% in
2010 and 2011
Core inflation declined 1.42% to 3.88% in
February 2010 over January reflects relatively
controllable inflation
The proposed electricity tariff hike is not expected
to trigger any large impact on inflation if
implemented on larger customers
Growth-supporting Interest Rate
Despite rising borrowing cost in the region,
Indonesia has kept interest rates unchanged for
an 11th month at 6.5% to strengthen economic
growth before responding to faster inflation
BI will continue to monitor and respond in order to
maintain currency strength and anchor inflationary
expectations
Higher CAR then most regional banks and
declining NPLs numbers ensure a healthy
banking system in Indonesia
Resilience of the Indonesian Economy
33
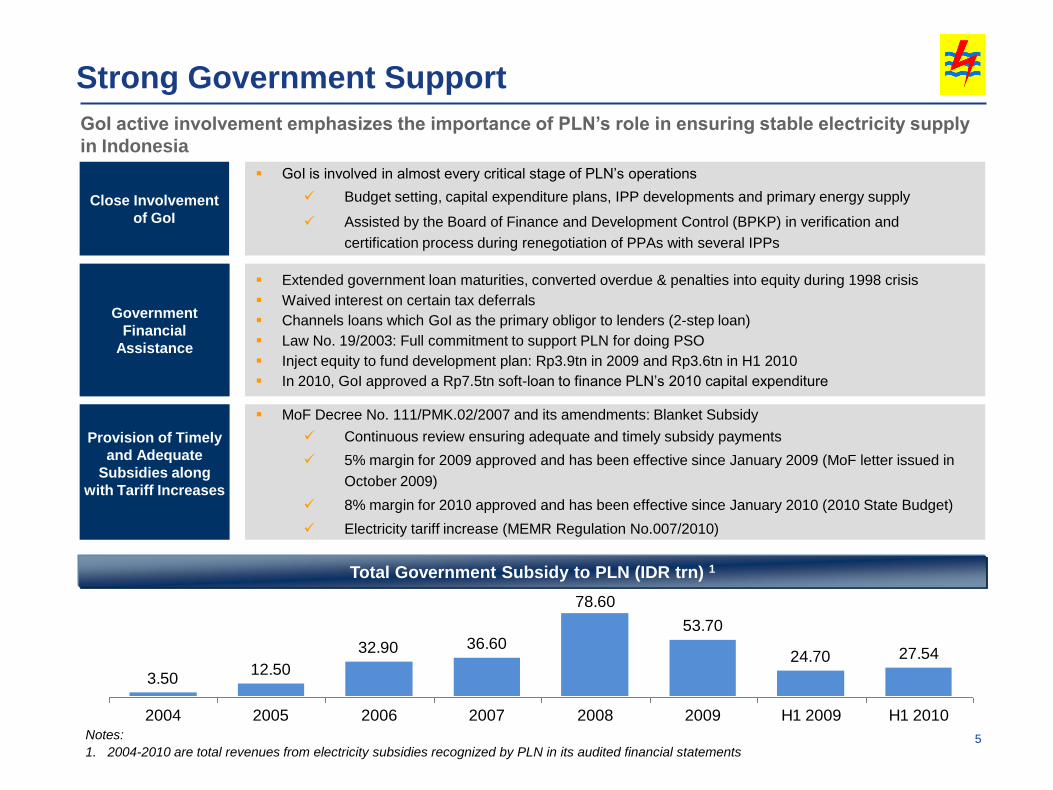
3.5012.50
32.90 36.6053.70
24.70 27.54
78.60
2004 2005 2006 2007 2008 2009 H1 2009 H1 2010
MoF Decree No. 111/PMK.02/2007 and its amendments: Blanket Subsidy
Continuous review ensuring adequate and timely subsidy payments
5% margin for 2009 approved and has been effective since January 2009 (MoF letter issued in
October 2009)
8% margin for 2010 approved and has been effective since January 2010 (2010 State Budget)
Electricity tariff increase (MEMR Regulation No.007/2010)
GoI active involvement emphasizes the importance of PLN’s role in ensuring stable electricity supply
in Indonesia
Total Government Subsidy to PLN (IDR trn) 1
Strong Government Support
Extended government loan maturities, converted overdue & penalties into equity during 1998 crisis
Waived interest on certain tax deferrals
Channels loans which GoI as the primary obligor to lenders (2-step loan)
Law No. 19/2003: Full commitment to support PLN for doing PSO
Inject equity to fund development plan: Rp3.9tn in 2009 and Rp3.6tn in H1 2010
In 2010, GoI approved a Rp7.5tn soft-loan to finance PLN’s 2010 capital expenditure
Government
Financial
Assistance
GoI is involved in almost every critical stage of PLN’s operations
Budget setting, capital expenditure plans, IPP developments and primary energy supply
Assisted by the Board of Finance and Development Control (BPKP) in verification and
certification process during renegotiation of PPAs with several IPPs
Close Involvement
of GoI
Provision of Timely
and Adequate
Subsidies along
with Tariff Increases
5Notes:
1. 2004-2010 are total revenues from electricity subsidies recognized by PLN in its audited financial statements
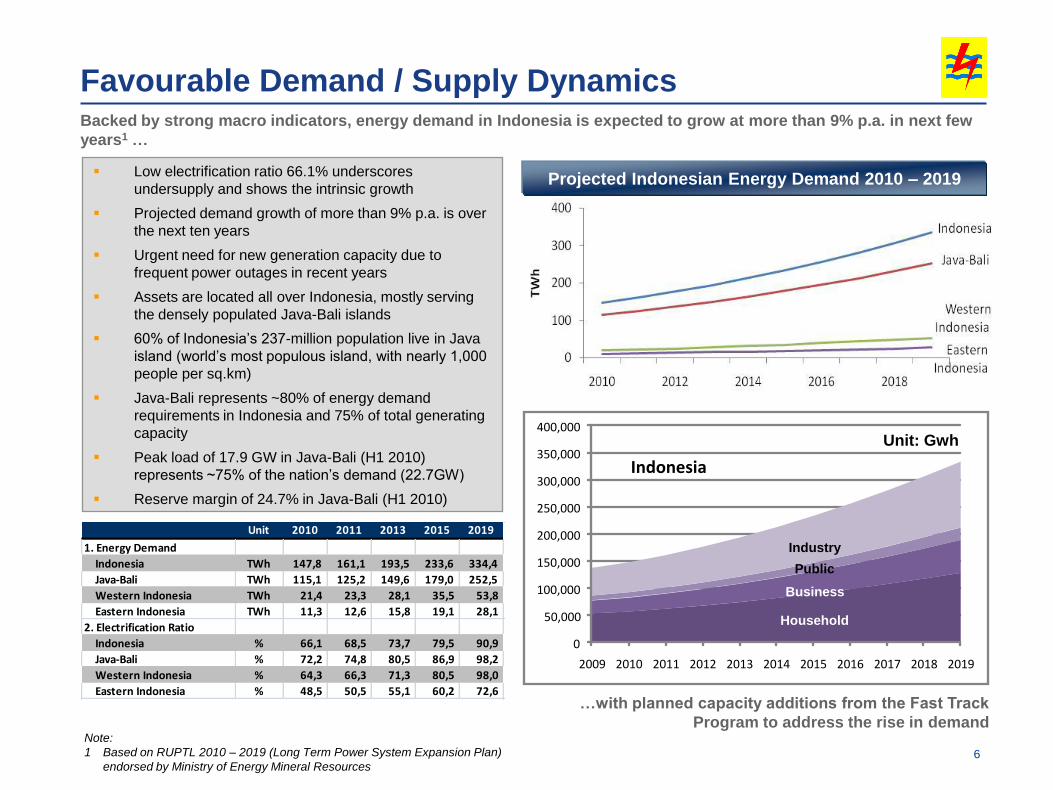
Favourable Demand / Supply Dynamics Backed by strong macro indicators, energy demand in Indonesia is expected to grow at more than 9% p.a. in next few
years1 …
…with planned capacity additions from the Fast Track
Program to address the rise in demand
Projected Indonesian Energy Demand 2010 – 2019 Low electrification ratio 66.1% underscores
undersupply and shows the intrinsic growth
Projected demand growth of more than 9% p.a. is over
the next ten years
Urgent need for new generation capacity due to
frequent power outages in recent years
Assets are located all over Indonesia, mostly serving
the densely populated Java-Bali islands
60% of Indonesia’s 237-million population live in Java
island (world’s most populous island, with nearly 1,000
people per sq.km)
Java-Bali represents ~80% of energy demand
requirements in Indonesia and 75% of total generating
capacity
Peak load of 17.9 GW in Java-Bali (H1 2010)
represents ~75% of the nation’s demand (22.7GW)
Reserve margin of 24.7% in Java-Bali (H1 2010)
6
Note:
1 Based on RUPTL 2010 – 2019 (Long Term Power System Expansion Plan)
endorsed by Ministry of Energy Mineral Resources
0
50,000
100,000
150,000
200,000
250,000
300,000
350,000
400,000
2009 2010 2011 2012 2013 2014 2015 2016 2017 2018 2019
Indonesia
Industry
Public
Business
Household
Unit: Gwh
Unit 2010 2011 2013 2015 2019
1. Energy Demand
Indonesia TWh 147,8 161,1 193,5 233,6 334,4
Java-Bali TWh 115,1 125,2 149,6 179,0 252,5
Western Indonesia TWh 21,4 23,3 28,1 35,5 53,8
Eastern Indonesia TWh 11,3 12,6 15,8 19,1 28,1
2. Electrification Ratio
Indonesia % 66,1 68,5 73,7 79,5 90,9
Java-Bali % 72,2 74,8 80,5 86,9 98,2
Western Indonesia % 64,3 66,3 71,3 80,5 98,0
Eastern Indonesia % 48,5 50,5 55,1 60,2 72,6

COMPANY’S STRATEGIC INITIATIVES
7
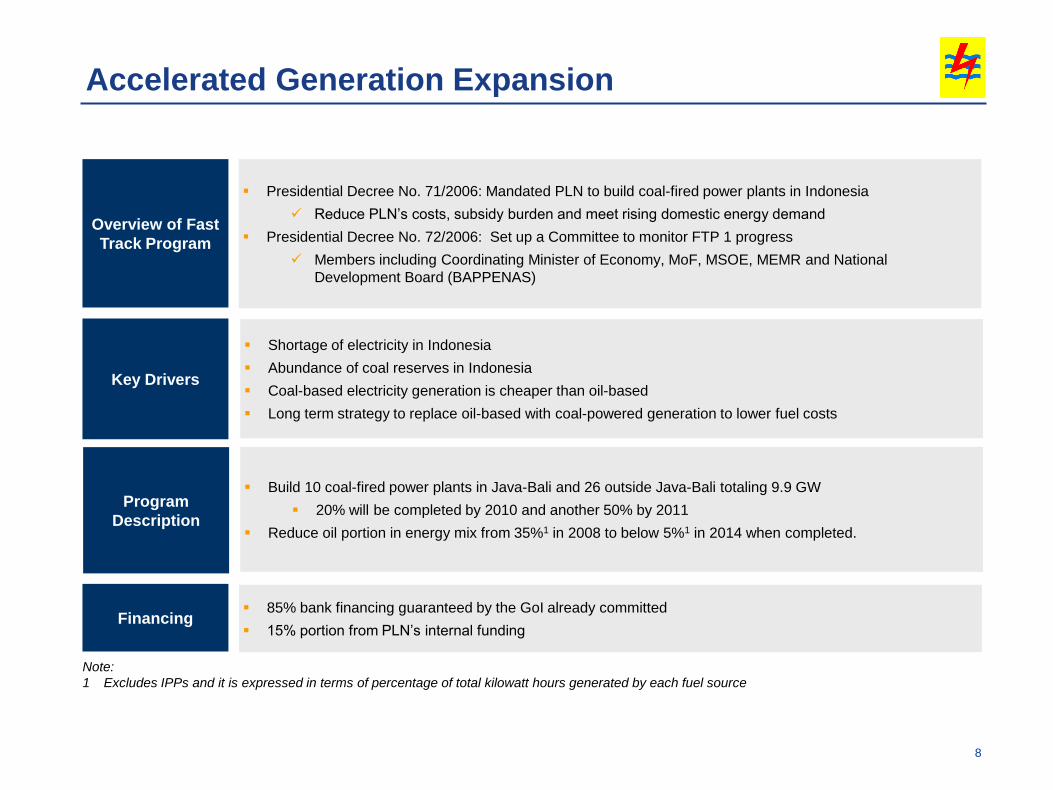
Shortage of electricity in Indonesia
Abundance of coal reserves in Indonesia
Coal-based electricity generation is cheaper than oil-based
Long term strategy to replace oil-based with coal-powered generation to lower fuel costs
Key Drivers
Overview of Fast
Track Program
Presidential Decree No. 71/2006: Mandated PLN to build coal-fired power plants in Indonesia
Reduce PLN’s costs, subsidy burden and meet rising domestic energy demand
Presidential Decree No. 72/2006: Set up a Committee to monitor FTP 1 progress
Members including Coordinating Minister of Economy, MoF, MSOE, MEMR and National
Development Board (BAPPENAS)
Build 10 coal-fired power plants in Java-Bali and 26 outside Java-Bali totaling 9.9 GW
20% will be completed by 2010 and another 50% by 2011
Reduce oil portion in energy mix from 35%1 in 2008 to below 5%1 in 2014 when completed.
Program
Description
85% bank financing guaranteed by the GoI already committed
15% portion from PLN’s internal fundingFinancing
Accelerated Generation Expansion
8
Note:
1 Excludes IPPs and it is expressed in terms of percentage of total kilowatt hours generated by each fuel source
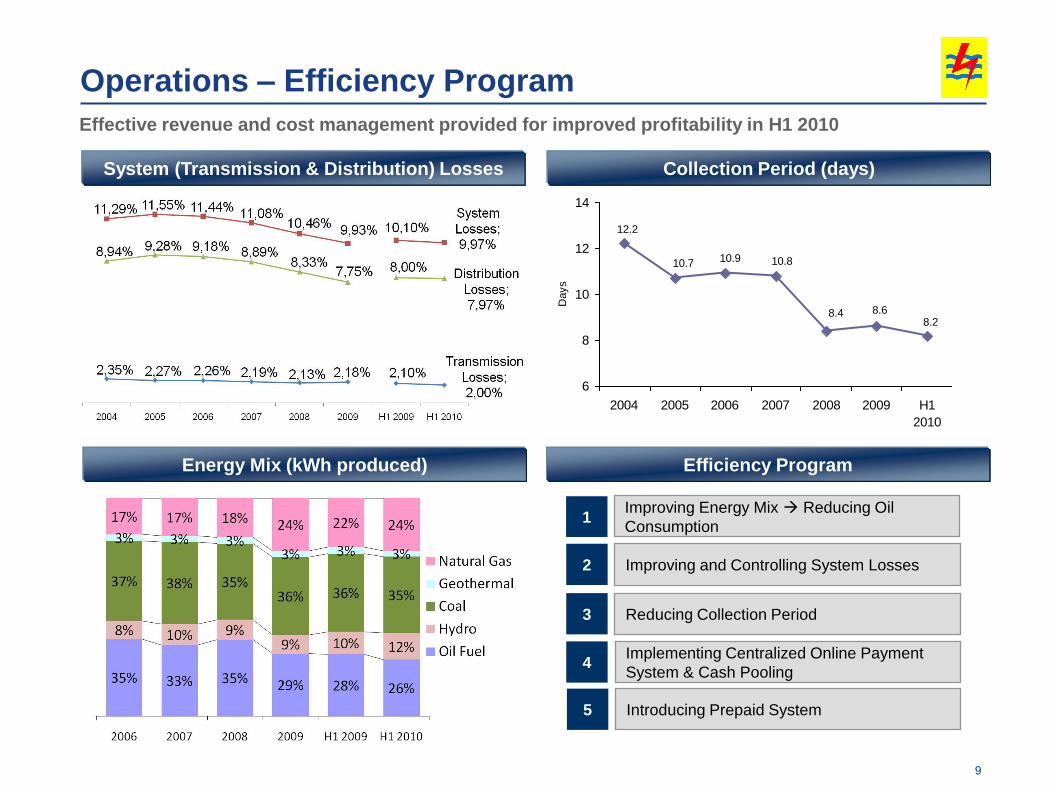
Operations – Efficiency Program
System (Transmission & Distribution) Losses Collection Period (days)
Improving and Controlling System Losses2
3 Reducing Collection Period
Efficiency ProgramEnergy Mix (kWh produced)
9
Effective revenue and cost management provided for improved profitability in H1 2010
4Implementing Centralized Online Payment
System & Cash Pooling
Improving Energy Mix Reducing Oil
Consumption1
8.2
12.2
10.7 10.9 10.8
8.4 8.6
6
8
10
12
14
2004 2005 2006 2007 2008 2009 H1
2010
Days
5 Introducing Prepaid System
THE CRISIS & COMPANY’S ACTIONS
10
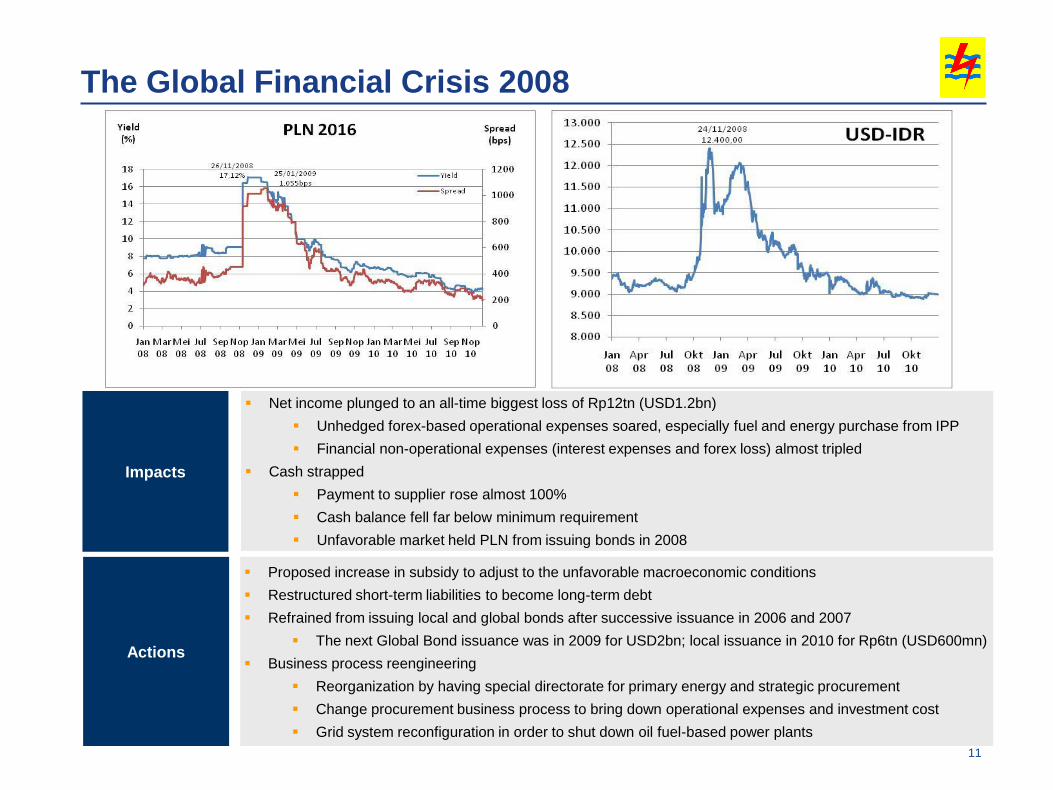
The Global Financial Crisis 2008
11
Impacts
Proposed increase in subsidy to adjust to the unfavorable macroeconomic conditions
Restructured short-term liabilities to become long-term debt
Refrained from issuing local and global bonds after successive issuance in 2006 and 2007
The next Global Bond issuance was in 2009 for USD2bn; local issuance in 2010 for Rp6tn (USD600mn)
Business process reengineering
Reorganization by having special directorate for primary energy and strategic procurement
Change procurement business process to bring down operational expenses and investment cost
Grid system reconfiguration in order to shut down oil fuel-based power plants
Actions
Net income plunged to an all-time biggest loss of Rp12tn (USD1.2bn)
Unhedged forex-based operational expenses soared, especially fuel and energy purchase from IPP
Financial non-operational expenses (interest expenses and forex loss) almost tripled
Cash strapped
Payment to supplier rose almost 100%
Cash balance fell far below minimum requirement
Unfavorable market held PLN from issuing bonds in 2008
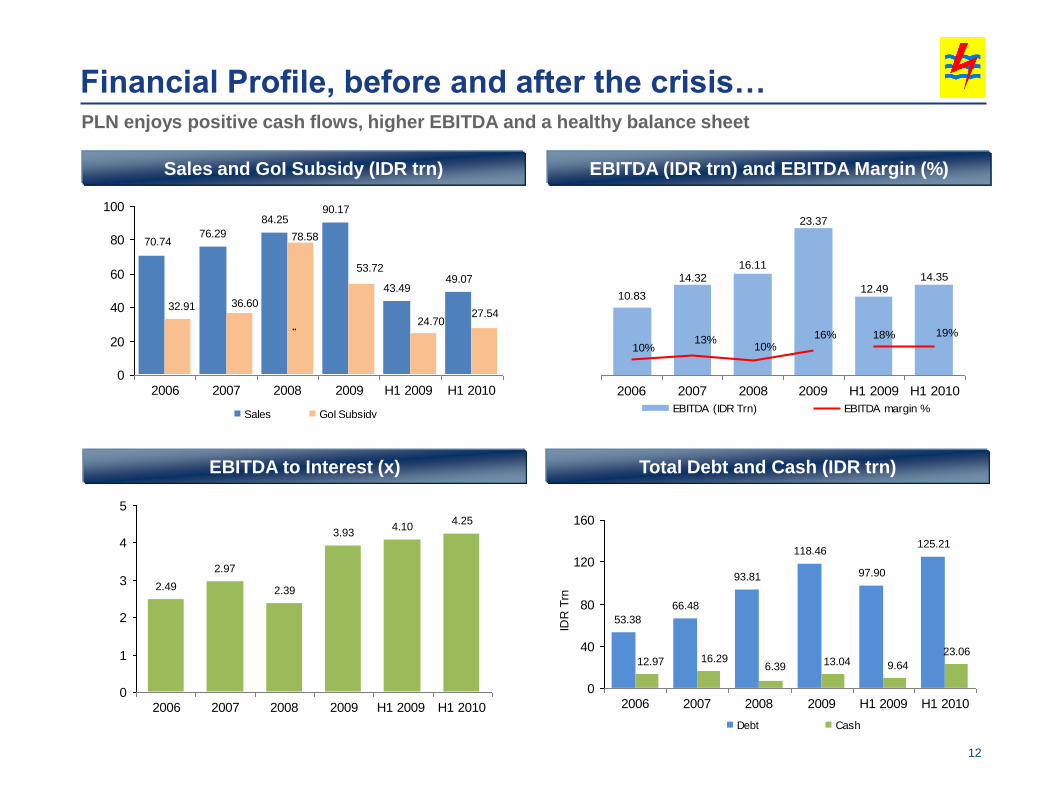
10.83
14.32
16.11
23.37
12.4914.35
10%13%
10%16% 18% 19%
2006 2007 2008 2009 H1 2009 H1 2010
EBITDA (IDR Trn) EBITDA margin %
66.48
93.81
118.46
97.90
125.21
53.38
12.97 16.296.39 13.04 9.64
23.06
0
40
80
120
160
2006 2007 2008 2009 H1 2009 H1 2010
IDR
Trn
Debt Cash
76.29
84.2590.17
43.4949.07
70.74
36.6032.91
53.72
78.58
24.7027.54
0
20
40
60
80
100
2006 2007 2008 2009 H1 2009 H1 2010
Sales GoI Subsidy
..
Financial Profile, before and after the crisis…
EBITDA (IDR trn) and EBITDA Margin (%)
EBITDA to Interest (x)
Sales and GoI Subsidy (IDR trn)
Total Debt and Cash (IDR trn)
PLN enjoys positive cash flows, higher EBITDA and a healthy balance sheet
12
2.49
2.97
2.39
3.934.10
4.25
0
1
2
3
4
5
2006 2007 2008 2009 H1 2009 H1 2010

38.2
48.7
73.9
83.9
73.2
87.1
0
20
40
60
80
100
2006 2007 2008 2009 H1 2009 H1 2010
Financial Profile, before and after the crisis (cont’d)
Debt to EBITDA (x)
Debt to Equity Ratio (%)
Consolidated Interest Coverage Ratio (CICR)
Profitability Ratio
The Company has sustainable gearing, higher return and good cash flow coverage
13
THANK YOU
14
APPENDIX
15

100% Owned by GoI
99.99% 99.99%
99.99%99.99% 99.99%
99.99% 99.99%
Indonesia Power
Electricity
Generation
PT PLN (Persero)
99.99%
PLN Geothermal
Geothermal
Generation
Ministry of State Owned
Enterprises (MSOE)
Ministry of Energy and
Mineral Resources (MEMR)
Ministry of Finance (MoF) Oversight
Corporate Structure
100%
PLN Batu Bara
Coal Supplier
Majapahit Holding B.V.
Offshore Bond
Financing Vehicle
Icon+
Information &
Communication
Technology
PLN Enjiniring
Engineering Services
Pembangkitan
Jawa Bali
Electricity
Generation
PLN Batam
Electric Utility
PLN Tarakan
Electric Utility
16