
Proses Desain · 2019-02-25 · Desain produk Desain proses produksi Proses manufaktur Digunakan...
30
Proses Desain [email protected]
Transcript of Proses Desain · 2019-02-25 · Desain produk Desain proses produksi Proses manufaktur Digunakan...
Proses Desain
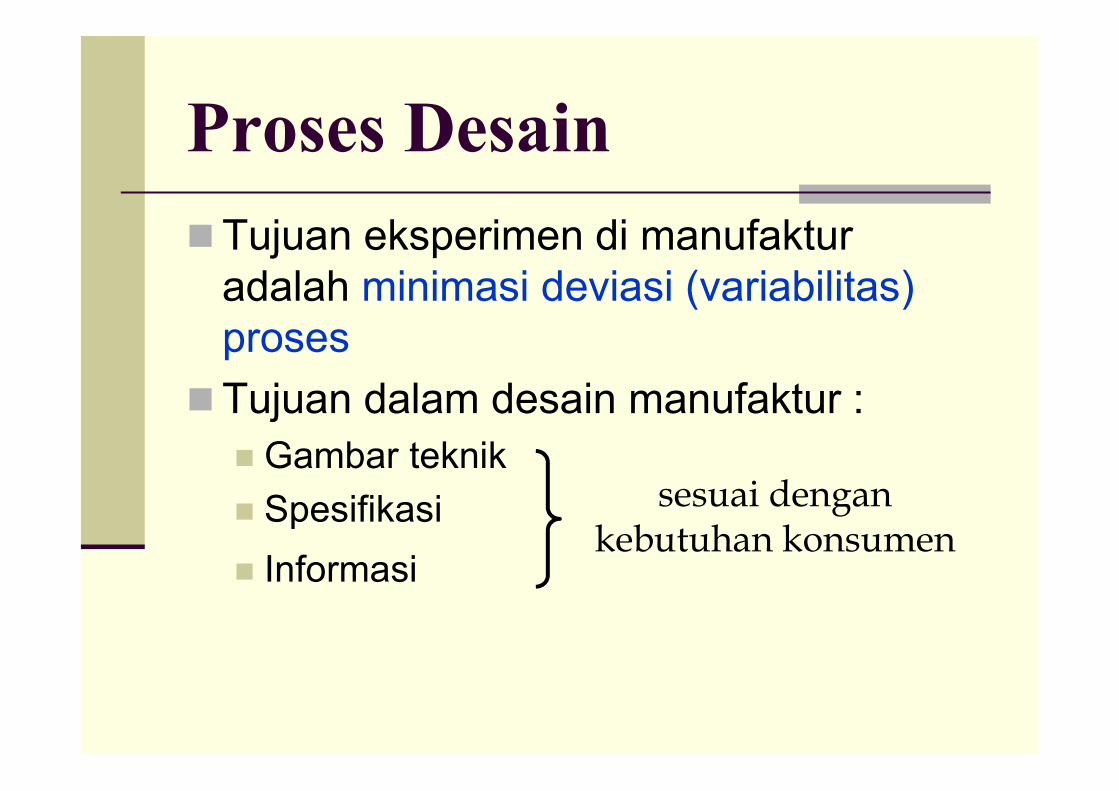
Tujuan eksperimen di manufakturadalah minimasi deviasi (variabilitas) proses
Tujuan dalam desain manufaktur :
Gambar teknik
Spesifikasi
Informasi
sesuai dengankebutuhan konsumen

Life Cycle Produk
Desain produk
Desain proses produksi
Proses manufaktur
Digunakan konsumen
Off-line quality controlOff-line quality controlOn-line quality controlOn-line quality control
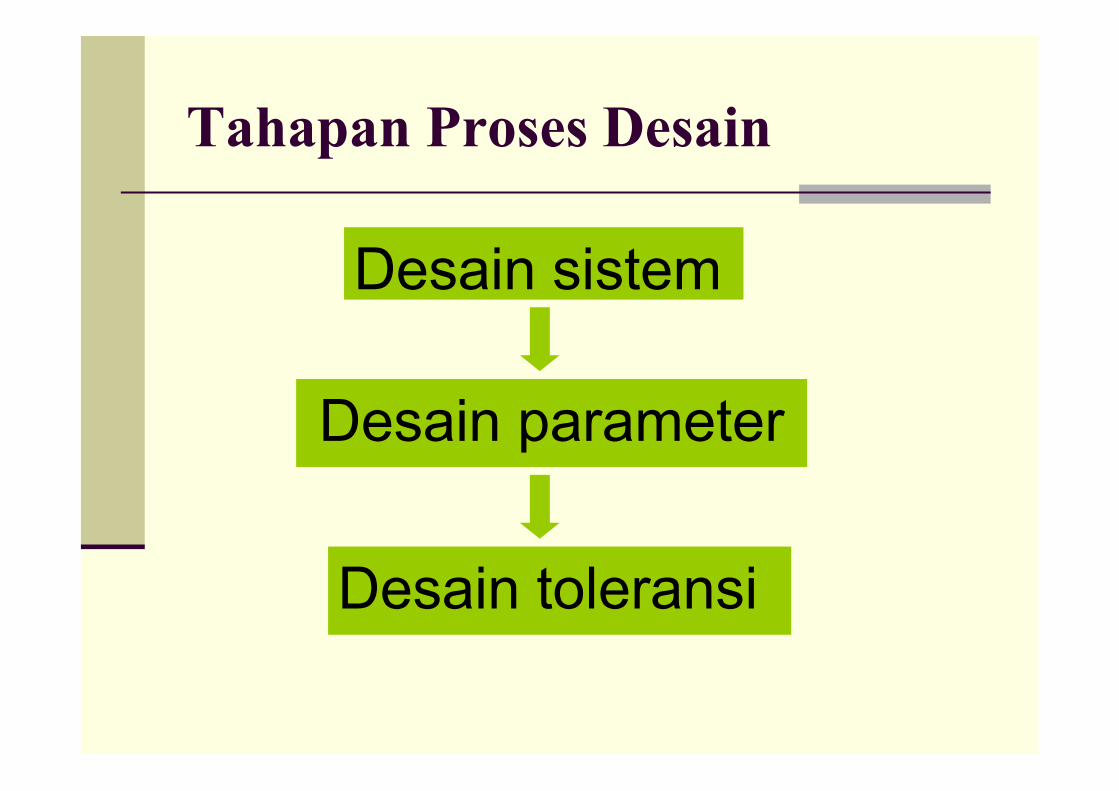
Tahapan Proses Desain
Desain sistemDesain sistem
Desain parameter Desain parameter
Desain toleransi Desain toleransi

Berkaitan dengan tekonologi yang digunakan
Membutuhkan pengetahuan teknis dan pengalaman yang luas
Contoh : Ahli motor bakar diperlukan untuk mendesain sistem mesin mobil tipe baru
Desain sistemDesain sistem
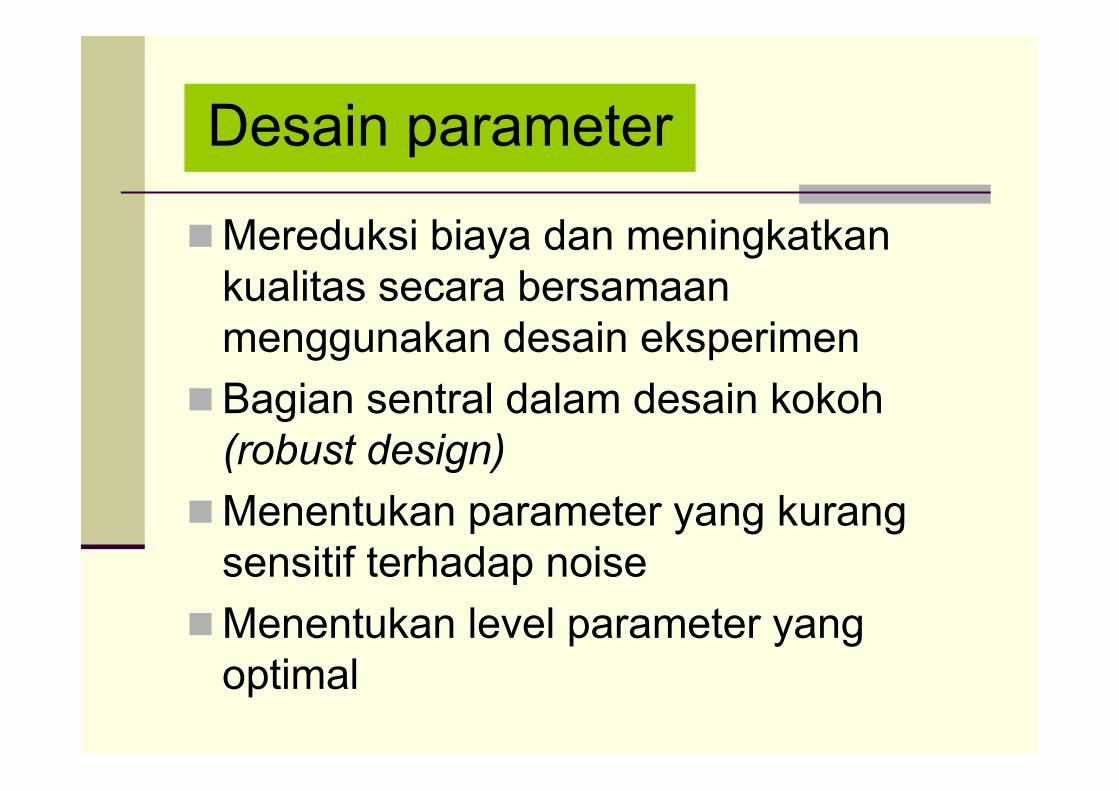
Mereduksi biaya dan meningkatkan kualitas secara bersamaan menggunakan desain eksperimen
Bagian sentral dalam desain kokoh (robust design)
Menentukan parameter yang kurang sensitif terhadap noise
Menentukan level parameter yang optimal
Desain parameter Desain parameter

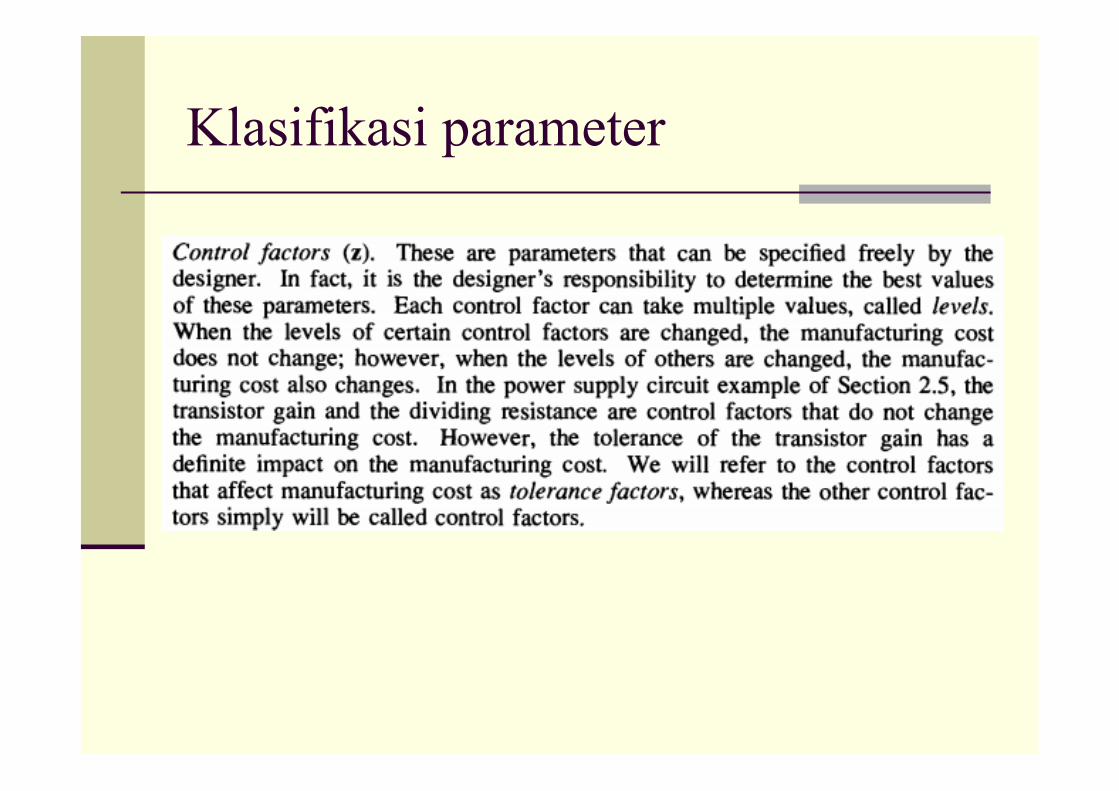
Mengontrol faktor yang berpengaruh terhadap target
Mengontrol noise factor padatoleransi yang kecil
Mengoptimasikan trade off antarakualitas dengan biaya
Desain toleransi Desain toleransi
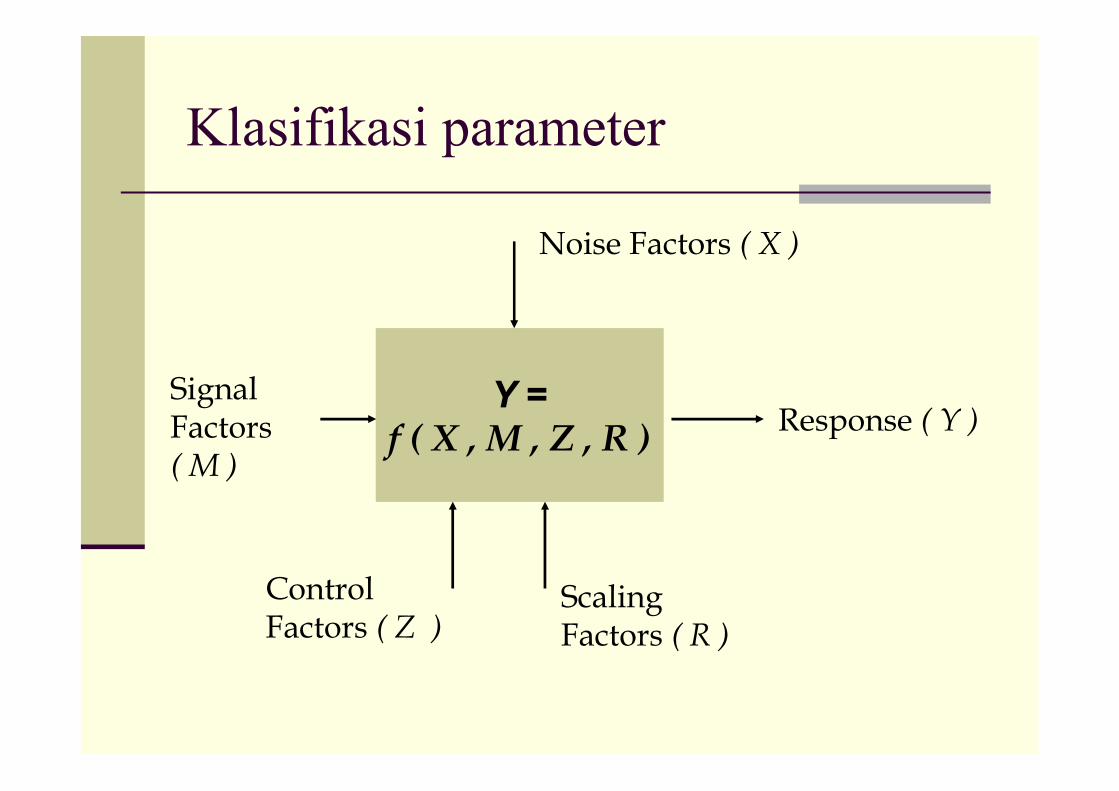
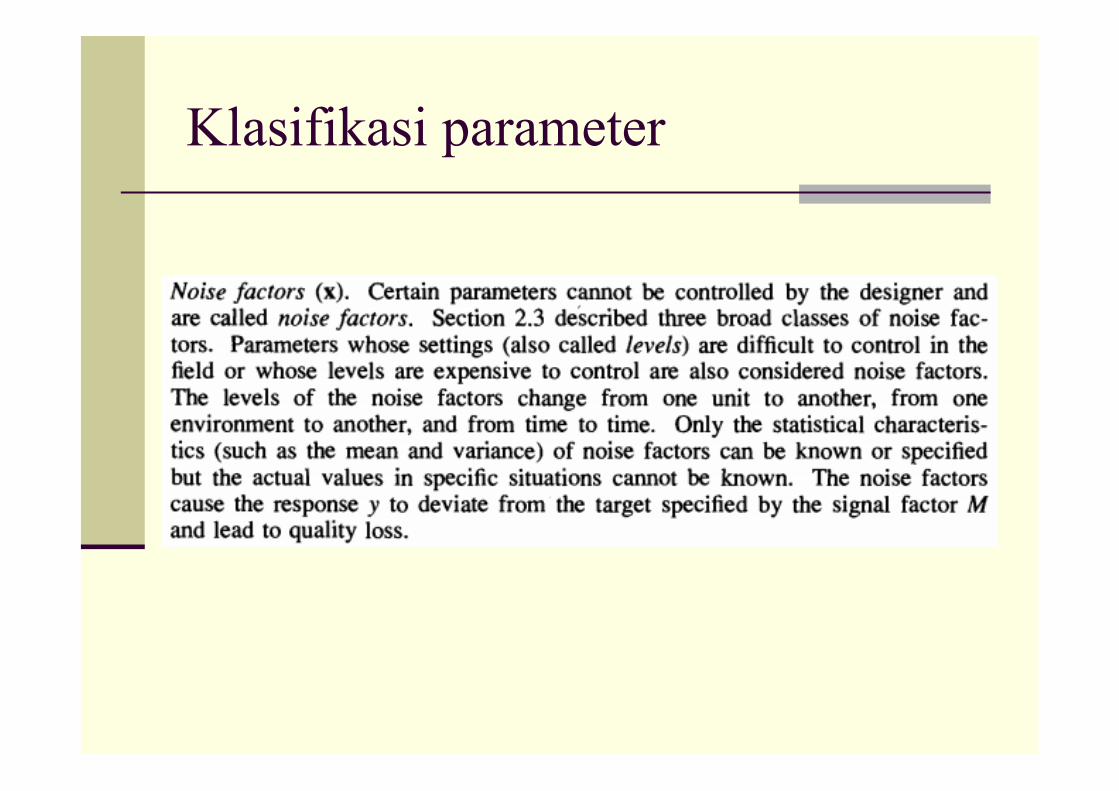
Klasifikasi parameter
Y =f ( X , M , Z , R )
Y =f ( X , M , Z , R )
Noise Factors ( X )
Response ( Y )Signal Factors ( M )
ControlFactors ( Z )
ScalingFactors ( R )

Klasifikasi parameter
Klasifikasi parameter
Klasifikasi parameter

Noise Factor
Tiga jenis tipe noise factor ( yang menyebabkan variabilitas proses )
External noise
Internal noise
Unit-to-unit noise
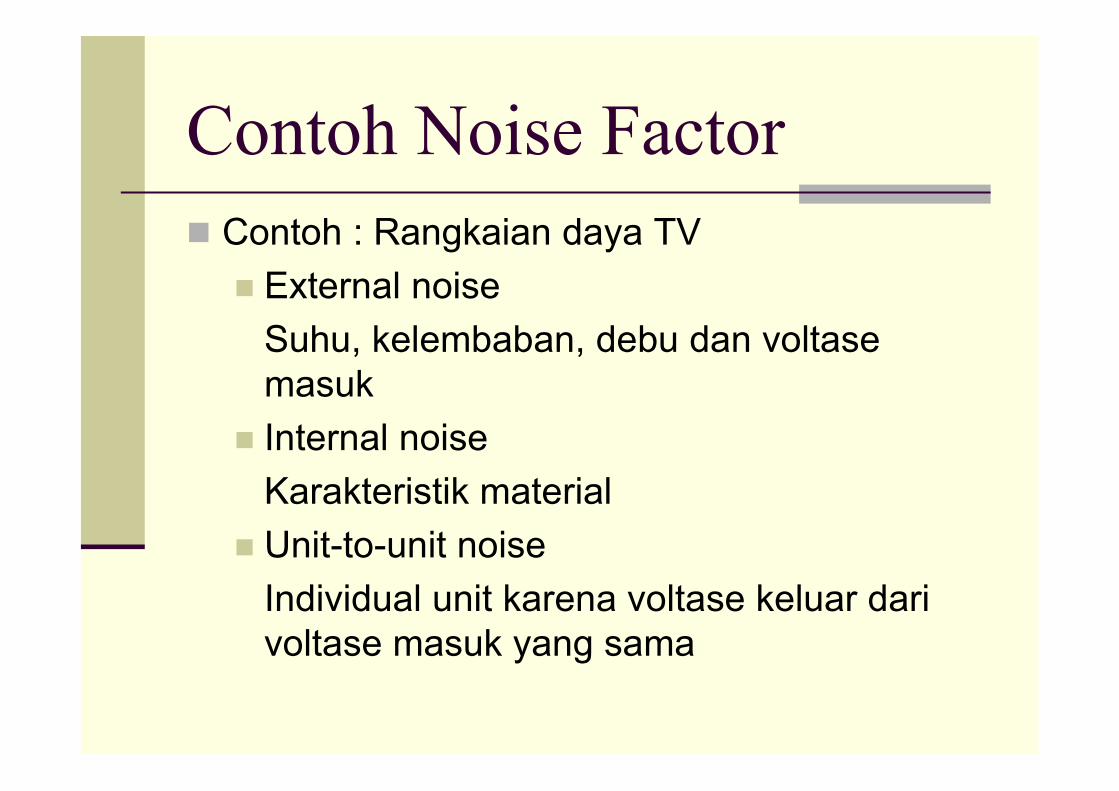
Contoh Noise Factor
Contoh : Rangkaian daya TV
External noise
Suhu, kelembaban, debu dan voltase masuk
Internal noise
Karakteristik material
Unit-to-unit noise
Individual unit karena voltase keluar dari voltase masuk yang sama

Memilih Faktor-Faktor
Sifat-sifat faktor yang harus diperhatikan
Level factor
Jumlah level factor
Efek Jumlah level factor
Jangkauan level factor
Kelayakan level
Pergeseran level
Keamanan pabrik atau operator
Efek factor yang mungkin terjadi
Hanya berpengaruh pada mean
Hanya berpengaruh pada variansi
Berpengaruh pada mean dan variansi
Tidak berpengaruh

Hanya berpengaruh pada mean
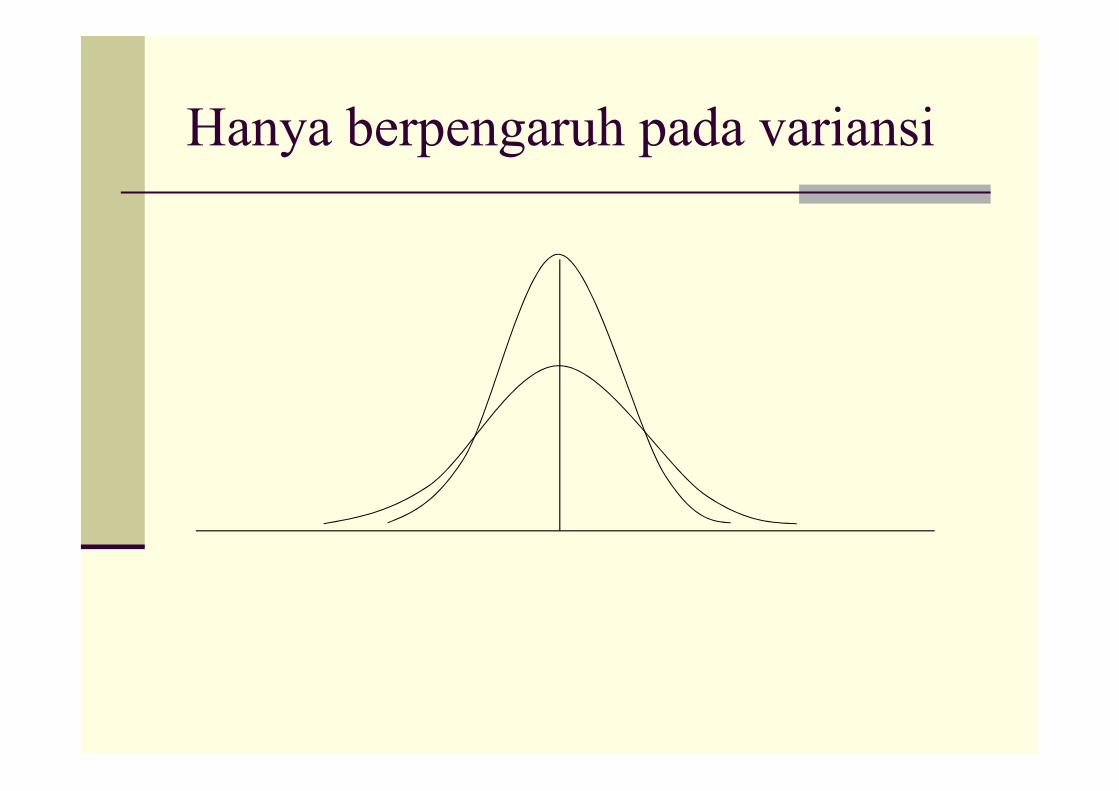
Hanya berpengaruh pada variansi

Berpengaruh mean dan variansi

Tidak berpengaruh
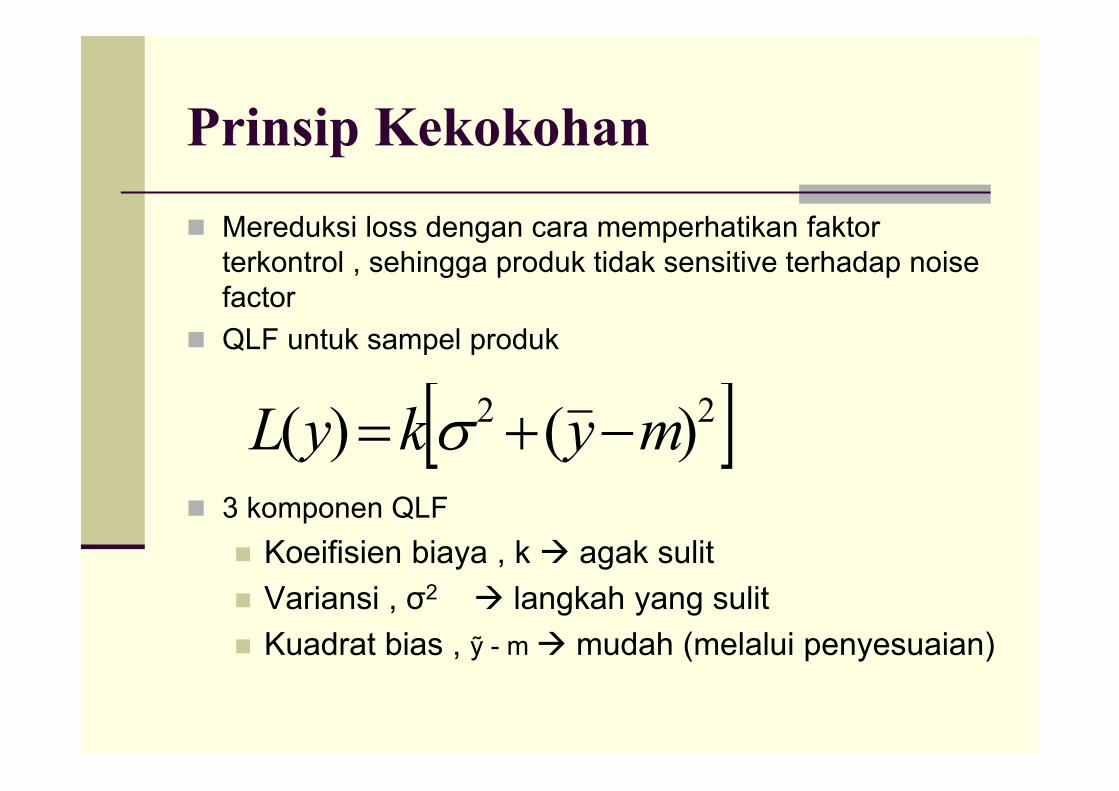
Prinsip Kekokohan
Mereduksi loss dengan cara memperhatikan faktorterkontrol , sehingga produk tidak sensitive terhadap noise factor
QLF untuk sampel produk
3 komponen QLF
Koeifisien biaya , k agak sulit
Variansi , σ2 langkah yang sulit
Kuadrat bias , ỹ - m mudah (melalui penyesuaian)
22 )()( mykyL
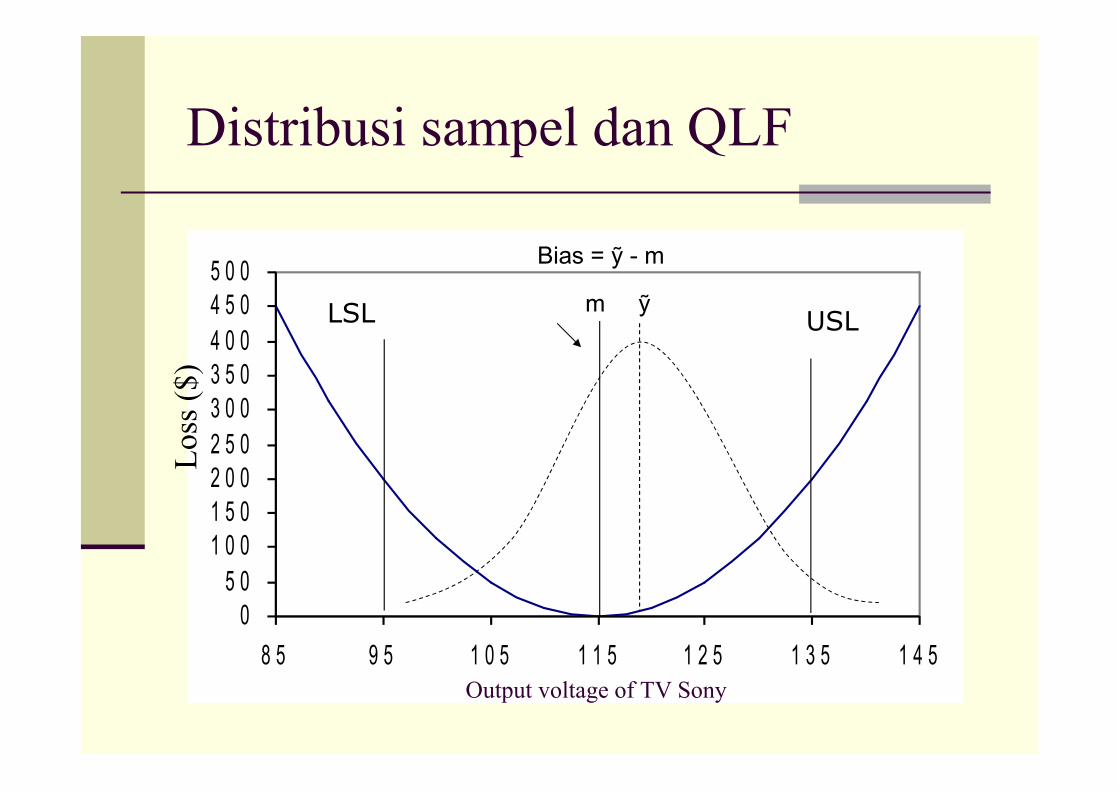
Distribusi sampel dan QLF
05 0
1 0 01 5 02 0 02 5 0
3 0 03 5 04 0 0
4 5 05 0 0
8 5 9 5 1 0 5 1 1 5 1 2 5 1 3 5 1 4 5Output voltage of TV Sony
Los
s ($
)
LSL USLm ỹ
Bias = ỹ - m

Prinsip Kekokohan
Mereduksi loss melalui reduksi variansi dapat dilakukan dengan 4 cara :
Screening produk yang gagal
Menghilangkan penyebab variansi
Menyempitkan toleransi
Mengaplikasikan desain kokoh ( robust design )

Contoh Desain Parameter
Ina seito tile experiment
1950 problem with variability in dimension
More than 50% outside specification
Problem with kiln
Redesign kiln expensive
Use parameter design
Contoh Desain Parameter
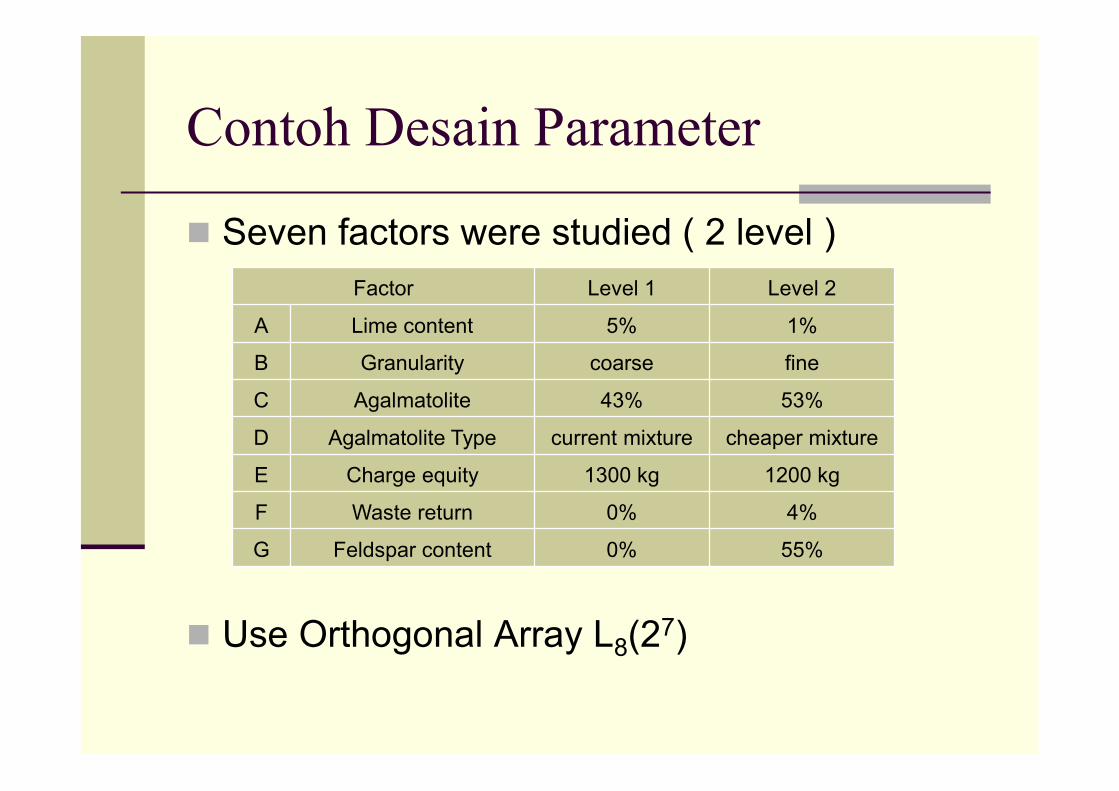
Seven factors were studied ( 2 level )
Use Orthogonal Array L8(27)
Factor Level 1 Level 2
A Lime content 5% 1%
B Granularity coarse fine
C Agalmatolite 43% 53%
D Agalmatolite Type current mixture cheaper mixture
E Charge equity 1300 kg 1200 kg
F Waste return 0% 4%
G Feldspar content 0% 55%
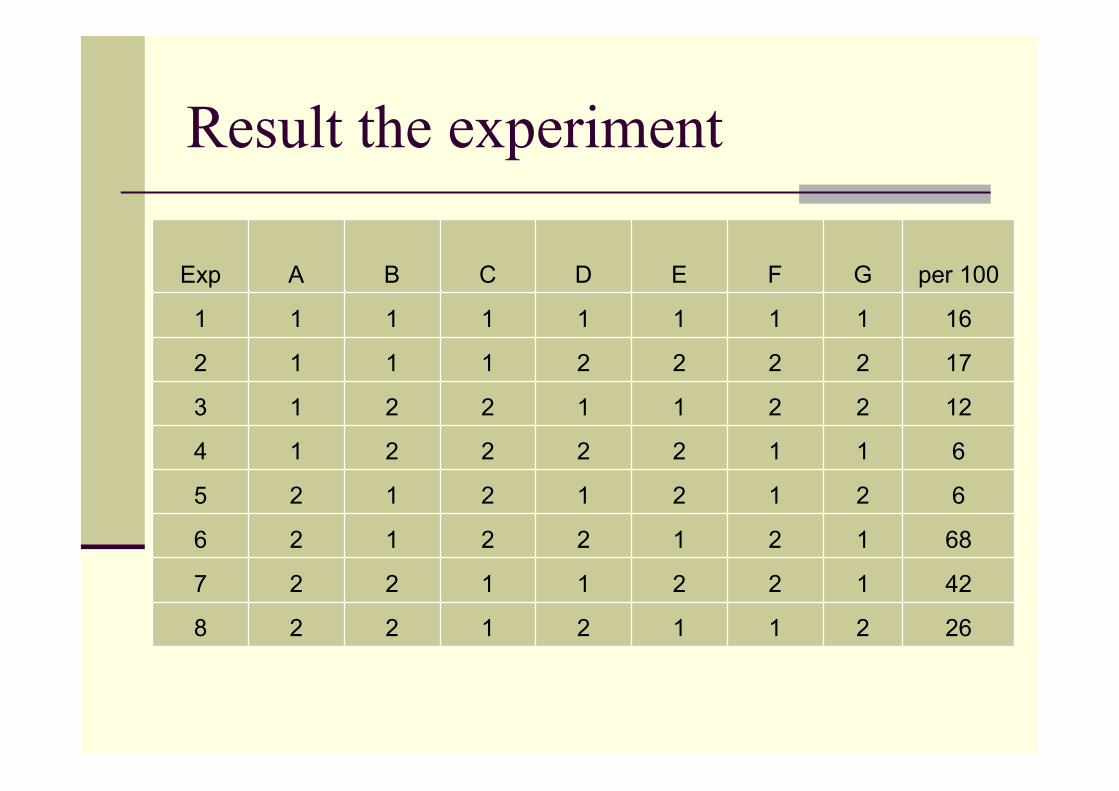
Result the experiment
Exp A B C D E F G per 100
1 1 1 1 1 1 1 1 16
2 1 1 1 2 2 2 2 17
3 1 2 2 1 1 2 2 12
4 1 2 2 2 2 1 1 6
5 2 1 2 1 2 1 2 6
6 2 1 2 2 1 2 1 68
7 2 2 1 1 2 2 1 42
8 2 2 1 2 1 1 2 26
Result the experiment
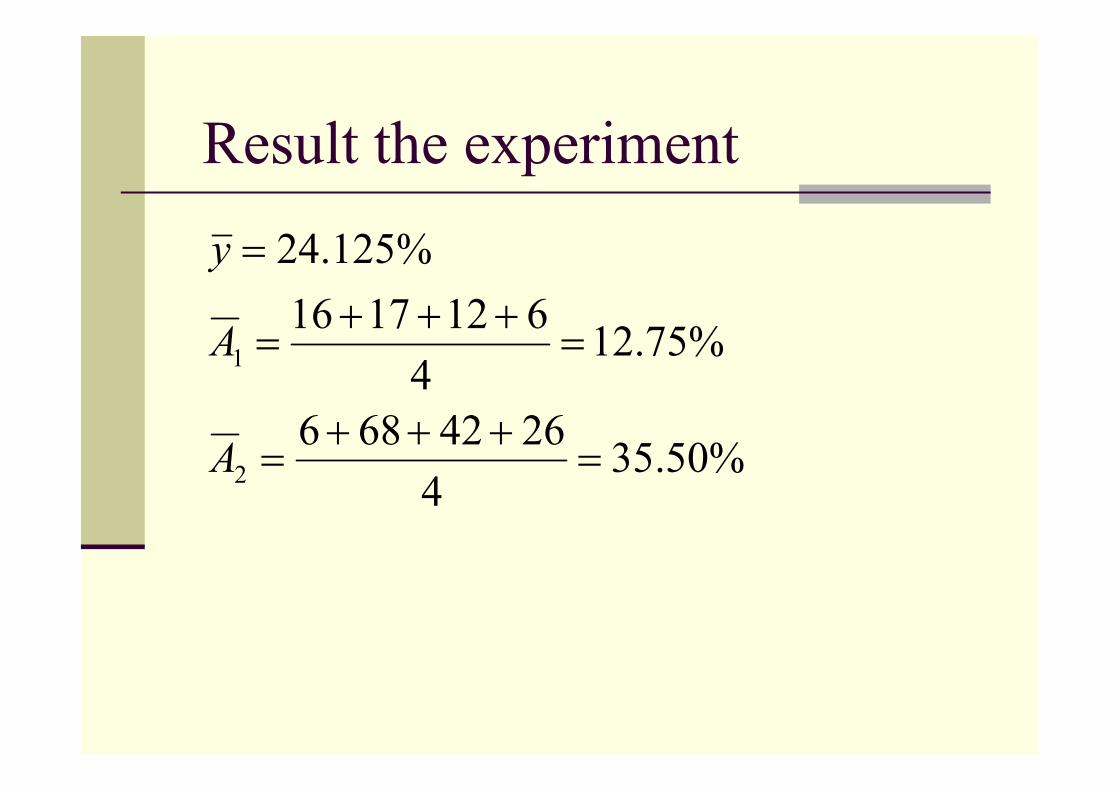
%50.354
2642686
%75.124
6121716
%125.24
2
1
A
A
y

Result the experiment
A B C D E F G
Level 1 12.75 26.75 25.25 19 30.5 13.5 33
Level 2 35.5 21.5 23 29.25 17.75 34.75 15.25
Diference 22.75 5.25 2.25 10.25 12.75 21.25 17.75
Rank 1 6 7 5 4 2 3
Response table of factor effect
Result the experiment
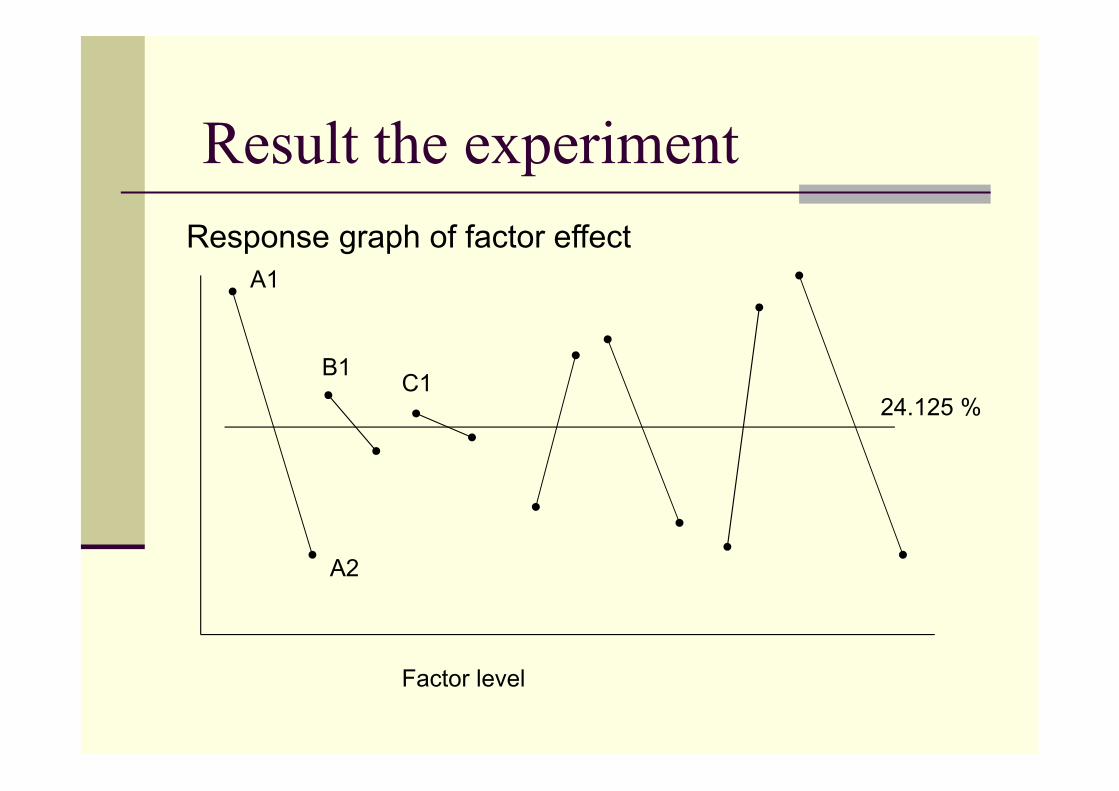
Response graph of factor effect
Factor level
24.125 %
A1
B1C1
A2

Prediction of the process average
Optimum condition
A1 , F1, G2 , E2, D1 , B2 , C2
Conclusion
C small effect most expensive
Robust design minimizing the effect of the cause of variation without eliminating the cause
%75.62111
)1()1()1(
yGFA
yGyFyAypredicted

Discussion
1. What is robust design process ?
2. Distinguish between external, internal and unit-to-unit noise factors ?
3. Describe 4 ways of reducing the variation in a production sample ?
4. An engineer wishes to increase the fuel efficiency and the power output of an automobile engine. It feasible ? What constrains is the engineer likely to face