of Malayastudentsrepo.um.edu.my/9520/9/hamed.k.pdf · 2019. 11. 10. · distributor yang membuka...
134
HEAT TRANSFER ENHANCEMENT BY CARBON NANOSTRUCTURE-BASED NANOFLUIDS IN AN ANNULAR HEAT EXCHANGER HAMED KHAJEH ARZANI THESIS SUBMITTED IN FULFILMENT OF THE REQUIREMENTS FOR THE DEGREE OF DOCTOR Of PHILOSOPHY FACULTY OF ENGINEERING UNIVERSITY OF MALAYA KUALA LUMPUR 2016 University of Malaya
Transcript of of Malayastudentsrepo.um.edu.my/9520/9/hamed.k.pdf · 2019. 11. 10. · distributor yang membuka...
HEAT TRANSFER ENHANCEMENT BY CARBON NANOSTRUCTURE-BASED NANOFLUIDS IN AN ANNULAR HEAT
EXCHANGER
HAMED KHAJEH ARZANI
THESIS SUBMITTED IN FULFILMENT OF THE REQUIREMENTS FOR THE DEGREE OF DOCTOR Of PHILOSOPHY
FACULTY OF ENGINEERING
UNIVERSITY OF MALAYA
KUALA LUMPUR
2016
Univers
ity of
Mala
ya
ii
UNIVERSITI MALAYA ORIGINAL LITERARY WORK DECLARATION
Name of Candidate: Hamed Khajeh Arzani
Registration/Matric No: KHA130111
Name of Degree: Doctor of Philosophy Title of Project Paper/Research Report/Dissertation/Thesis (“this Work”):
Heat Transfer Enhancement by Nanofluid Flowing in an Annular Heat Exchanger Field of Study: Heat Transfer
I do solemnly and sincerely declare that:
(1) I am the sole author of this Work; (2) This Work is original; (3) Any use of any work in which copyright exists was done by way of fair dealing and for
permitted purposes and any excerpt or extract from, or reference to or reproduction of any copyright work has been disclosed expressly and sufficiently and the title of the Work and its authorship have been acknowledged in this Work;
(4) I do not have any actual knowledge nor do I ought reasonably to know that the making of this work constitutes an infringement of any copyright work;
(5) I hereby assign all and every rights in the copyright to this Work to the University of Malaya (“UM”), who henceforth shall be owner of the copyright in this Work and that any reproduction or use in any form or by any means whatsoever is prohibited without the written consent of UM having been first had and obtained;
(6) I am fully aware that if in the course of making this Work I have infringed any copyright whether intentionally or otherwise, I may be subject to legal action or any other action as may be determined by UM.
Candidate’s Signature Date
Subscribed and solemnly declared before,
Witness’s Signature Date
Name: Designation:
Univers
ity of
Mala
ya

iii
ABSTRACT
Present thesis work introduces a new design of heat exchangers utilizing an annular
profile which opens a new gateway for realizing optimization of higher energy transfer.
To apprehend this goal, nanofluids have been studied for this application as it has got
thermal conductivity higher than conventional liquids. In this study, a cooling loop
apparatus was designed and built to evaluate the transition and turbulent heat transfer
performance of water and ethylene glycol based nanofluids. Also numerical simulation
was employed as an approximating procedure for prediction of the results in this study.
Two-phase mixture model has been considered for simulation of the nanofluids flow in
two and three dimensional annular heat exchanger.
Graphene Nanoplatelets (GNP) were stably dispersed in aqueous media by covalent and
non-covalent functionalization. At a constant concentration, the measurement has shown
that the thermal conductivity of covalent nanofluid (GNP-COOH/water) is higher than
the non-covalent nanofluid (GNP-SDBS/water), which is higher than distilled water.
In the second phase of the study, multi-walled carbon nanotubes (MWCNT) has been
covalently functionalized with Aspartic acid (Asp) to achieve a highly dispersed colloidal
suspension of MWCNT. After investigation of stability of colloidal suspensions with Uv-
vis spectroscopy, the prepared coolants have the promising properties such as high
thermal conductivity as compared with water. Forced convection heat transfer coefficient
and pressure drop were also investigated at three different heat fluxes and four weight
concentrations. The observed high heat transfer rate, poor change in the pressure drop in
the presence of different weight concentrations provided a suitable condition for this
novel alternative coolant.
Univers
ity of
Mala
ya

iv
In the third phase of study, the improvement of colloidal stability of Graphene
Nanoplatelets (GNP) in aqueous media has been implemented by functionalization with
tetrahydrofurfuryl polyethylene glycol in a quick electrophonic addition reaction method.
To address this issue, surface functionalization of GNP was analyzed by Raman
spectroscopy, and thermogravimetric analysis. In addition, the morphology of treated
samples was investigated by transmission electron microscopy (TEM). The steady-state
forced convective heat transfer experiments and the simulation results confirmed the
promising cooling capabilities of the TGNP/water.
The last phase is related to the thermophysical and heat transfer performance of
covalently functionalized GNP-based water/ethylene glycol nanofluid in an annular
channel. After experimentally measuring thermophysical properties of the prepared
samples, a computational fluid dynamics study has been carried out to study the heat
transfer and pressure drop of well-dispersed and stabilized nanofluids. Based on the
results of this investigation, there is a significant enhancement on the heat transfer rate
associated with the loading of well-dispersed GNP in basefluid.
Univers
ity of
Mala
ya

v
ABSTRAK
Thesis ini memperkenalkan reka bentuk terbaru penukar haba menggunakan annular
distributor yang membuka ruang baru untuk merealisasikan penggunaan tenaga yang
lebih optimum. Bagi merealisasikan matlamat ini, nanofluids telah digunakan seperti
dalam kerja yang diterbitkan. Ia menunjukkan peningkatan konduksi haba yang lebih
tinggi berbanding cecair konvensional. Dalam kajian ini, satu kelengkapan coolant loop
telah direka dan dibina untuk menilai kecekapan kadar peralihan dan turbulent heat
transfer oleh air dan nanofluids berasaskan ethylene glycol. Simulasi perangkaan turut
digunakan sebagai prosedur untuk menganggar dan meramal keputusan dalam kajian ini.
Model two-phase mixture telah digunakan untuk simulasi aliran nanofluids dalam
penukar haba annular bagi simulasi dua dan tiga dimensi.
Graphene Nanoplatelets (GNP) tersebar secara stabil dalam medium aqueous dengan
ikatan kovalen dan bukan kovalen. Pada kepekatan yang sama, kekonduksian haba untuk
ikatan kovalen nanofluids (GNP-COOH / air) adalah lebih tinggi berbanding ikatan bukan
kovalen nanofluids (GNP-SDBS / air). Kekonduksian haba kedua-duanya adalah lebih
tinggi berbanding air suling.
Pada fasa kedua kajian, Multi-walled carbon nanotubes (MWCNT) adalah berikatan
kovalen dengan asid Aspartic (Asp) untuk mencapai bentuk MWCNT dengan dispersed
colloidal suspension. Selepas penilaian kestabilan colloidal suspension melalui
spektroskopi Uv-vis, penyejuk yang tersedia didapati mempunyai ciri-ciri yang
dikehendaki iaitu kekonduksian haba yang lebih tinggi berbanding air. Selain itu, forced
convection heat transfer coefficient dan penurunan tekanan turut disiasat pada tiga heat
fluxes yang berlainan dan empat weight fractions. Kadar tinggi pemindahan haba, juga
Univers
ity of
Mala
ya
vi
kadar penurunan tekanan yang sedikit dalam kehadiran weight fractions yang berbeza
menyediakan keadaan yang sesuai untuk penyejuk alternatif ini.
Sebagai fasa ketiga kajian, bagi tujuan meningkatkan kestabilan colloidal Graphene
Nanoplatelets (GNP) di dalam medium aqueous, ikatan perlu terlebih dahulu dibentuk
dengan tetrahydrofurfuryl polyethylene glycol dengan tindak balas penambahan
electrophonic yang cepat. Untuk menangani isu ini, functionalization permukaan GNP
telah dianalisis menggunakan Raman spectroscopy dan analisis Termogravimetri. Di
samping itu, morfologi sampel yang telah dirawat dikaji menggunakan transmission
electron microscopy (TEM). Hasil eksperimen dan simulasi kajian telah mengesahkan
keupayaan penyejukan TGNP / air.
Fasa terakhir kajian merujuk kepada termofizikal dan prestasi pemindahan haba GNP
nanofluid berikatan kovalen berasaskan air / ethylene glycol melalui saluran anulus.
Selepas uji kaji untuk mengukur sifat termofizikal sampel dibuat, satu kajian dinamik
bendalir telah dijalankan untuk mengkaji pemindahan haba dan penurunan tekanan oleh
nanofluids yang well-dispersed dan stabil. Berdasarkan hasil siasatan ini, terdapat
peningkatan yang ketara ke atas kadar pemindahan haba yang dikaitkan dengan loading
well-dispersed GNP in base-fluid.
Univers
ity of
Mala
ya
vii
ACKNOWLEDGEMENTS
First, I would like to thank my parents for guiding me through my first steps of life and
education. I would also like to thank my supervisors, Dr. Kazi Md. Salim Newaz and Dr.
Ahmad Badaruddin at UM university, who have guided my academic and professional
development for the past three years. I would also like to thank my love, my wife,
Maryam, who has been supportive of me and my study throughout my graduate
educations.
Univers
ity of
Mala
ya
viii
TABLE OF CONTENTS
ABSTRACT ..................................................................................................................... iii
ABSTRAK ........................................................................................................................ v
ACKNOWLEDGEMENTS ............................................................................................ vii
TABLE OF CONTENTS ............................................................................................... viii
LIST OF FIGURES ........................................................................................................ xii
LIST OF TABLES ......................................................................................................... xvi
LIST OF SYMBOLS AND ABBREVIATIONS ......................................................... xvii
1 CHAPTER 1: INTRODUCTION ............................................................................. 1
1.1 Motivation ......................................................................................................... 3
1.2 Objective ........................................................................................................... 3
2 CHAPTER 2: LITERATURE REVIEW .................................................................. 5
2.1 Introduction ....................................................................................................... 5
2.2 Nanofluids Preparation ..................................................................................... 6
2.2.1 One-Step Method .......................................................................................... 6
2.2.2 Two-Step Method ......................................................................................... 6
2.2.3 Stability ......................................................................................................... 7
2.3 Effective Parameters on Thermal Conductivity .............................................. 10
2.3.1 Particle Size ................................................................................................ 10
2.3.2 Particle Shape .............................................................................................. 11
2.3.3 Base Fluid ................................................................................................... 12
2.3.4 Temperature-Dependent Thermal Conductivity ......................................... 12
2.4 Mechanisms of Thermal Conduction Enhancement ....................................... 13
2.4.1 Brownian Motion ........................................................................................ 14
2.4.2 Molecular-level Layering ............................................................................ 15
Univers
ity of
Mala
ya
ix
2.4.3 Clustering .................................................................................................... 17
2.5 Carbon Nanotubes ........................................................................................... 18
2.6 Modeling Studies ............................................................................................ 23
2.7 Measurement of Thermal Conductivity of Liquids ........................................ 27
2.7.1 Transient Hot Wire Method (THW) ........................................................... 27
2.7.2 Steady-State Parallel-Plate Method ............................................................ 28
2.7.3 Temperature Oscillation Method ................................................................ 29
2.8 Dynamic Thermal Test ................................................................................... 30
2.8.1 Shear Flow Test .......................................................................................... 30
2.8.2 Pipe Flow Test ............................................................................................ 31
2.9 Carbon nanostructure-based nanofluids .......................................................... 32
2.10 Research gap ................................................................................................... 33
3 CHAPTER 3: METHODOLOGY .......................................................................... 34
3.1 Experimental apparatus ................................................................................... 34
3.2 Numerical Study ............................................................................................. 37
3.2.1 Numerical implementation .......................................................................... 39
3.2.2 Accuracy ..................................................................................................... 40
3.3 Physical Properties .......................................................................................... 42
4 CHAPTER 4: THERMOPHYSICAL AND HEAT TRANSFER PERFORMANCE
OF COVALENT AND NON-COVALENT FUNCTIONALIZED NANOFLUIDS IN
AN ANNULAR HEAT EXCHANGER ......................................................................... 44
4.1 Covalent functionalization of GNP ................................................................. 45
4.2 Thermophysical properties .............................................................................. 46
4.2.1 Viscosity ..................................................................................................... 46
4.2.2 Density ........................................................................................................ 47
Univers
ity of
Mala
ya

x
4.2.3 Thermal conductivity .................................................................................. 48
4.2.4 Specific heat capacity.................................................................................. 49
4.3 Numerical study .............................................................................................. 49
5 CHAPTER 5: INVESTIGATION OF THERMOPHYSICAL PROPERTIES AND
HEAT TRANSFER RATE OF COVALENTLY FUNCTIONALIZED MWCNT IN AN
ANNULAR HEAT EXCHANGER ................................................................................ 55
5.1 Functionalization procedure............................................................................ 56
5.2 Preparation of nanofluid ................................................................................. 57
5.3 Dispersibility ................................................................................................... 57
5.4 Functionalization analysis ............................................................................... 58
5.5 Physical Properties .......................................................................................... 61
5.6 Thermal analysis ............................................................................................. 64
5.7 Pressure drop ................................................................................................... 69
6 CHAPTER 6: HEAT TRANSFER PERFORMANCE OF WATER-BASED
TETRAHYDROFURFURYL POLYETHYLENE GLYCOL-TREATED GRAPHENE
NANOPLATELETS SUPER-COOLANT ..................................................................... 72
6.1 Functionalization procedure and preparation of coolants ............................... 73
6.2 Functionalization and Morphology ................................................................. 73
6.3 Dispersibility ................................................................................................... 78
6.4 Physical Properties .......................................................................................... 79
6.5 Thermal analysis ............................................................................................. 83
6.6 Pressure drop ................................................................................................... 88
7 CHAPTER 7: THERMOPHYSICAL AND HEAT TRANSFER PERFORMANCE
OF STABILIZED GRAPHENE NANOPLATELETS-ETHYLENE GLYCOL/WATER
NANOFLUIDS THROUGH AN ANNULAR CHANNEL ........................................... 90
Univers
ity of
Mala
ya
xi
7.1 Preparation of EGNP-WEG Coolants ............................................................. 92
7.2 Thermophysical properties .............................................................................. 92
7.3 Numerical study .............................................................................................. 95
8 CHAPTER 8: CONCLUSIONS AND FUTURE WORK .................................... 103
8.1 Conclusion .................................................................................................... 103
8.2 Future work ................................................................................................... 105
REFERENCES ............................................................................................................. 107
LIST OF PUBLICATIONS AND PAPER PRESENTED ........................................... 116
APPENDIX A: WILSON PLOT .................................................................................. 117
APPENDIX B: TABLES OF NUMERICAL AND EXPERIMENTAL RESULTS ... 120
APPENDIX C: UNCERTAINTY ANALYSIS ............................................................ 129
Univers
ity of
Mala
ya

xii
LIST OF FIGURES
Figure 2.1: Schematic of Well-dispersed Aggregates.................................................... 17
Figure 2.2: SWCNT and MWCNT ................................................................................ 19
Figure 2.3: Steady State Parallel-plate Setup for thermal conductivity measurement .. 29
Figure 2.4: Temperature Oscillation Setup .................................................................... 30
Figure 3.1: (a) Schematic diagram of the experimental setup (b) Experimental test
Section for the measurement of the convective heat transfer coefficient. ...................... 35
Figure 3.2: Geometrical configuration and boundary conditions of the present study. . 36
Figure 3.3: Mesh configuration of the present study. .................................................... 40
Figure 3.4: Comparison of Nusselt numbers versus Reynolds numbers for basefluid at
three different grid distributions. .................................................................................... 40
Figure 3.5: Comparison of the experimental Nusselt numbers for distilled water in
relation to obtained by the Dittus-Boelter correlation at (a) 800W, (b) 1000W and (c)
1200W. ............................................................................................................................ 42
Figure 4.1: Average heat transfer coefficients of GNP-SDBS and GNP-COOH-based
water nanofluids as a function of Reynolds numbers. .................................................... 51
Figure 4.2: Average Nusselt numbers of GNP-SDBS and GNP-COOH-based water
nanofluids as a function of Reynolds numbers. .............................................................. 51
Figure 4.3: Friction factor of GNP-SDBS and GNP-COOH-based water nanofluids as a
function of Reynolds numbers. ....................................................................................... 52
Figure 4.4: Friction factor throughout the tube for different concentrations of GNP-
SDBS and GNP-COOH. ................................................................................................. 53
Figure 4.5: Relation between pressure drops along the annulus for various Reynolds
numbers and concentrations. ........................................................................................... 53
Univers
ity of
Mala
ya
xiii
Figure 5.1: Colloidal stability of the MWCNT-Asp/water as a function of time at
different volume fractions. .............................................................................................. 58
Figure 5.2: Raman Spectra of pristine MWCNT and Asp-treated MWCNT. ............... 60
Figure 5.3: TGA curves of pristine MWCNT and Asp-treated MWCNT. .................... 60
Figure 5.4: TEM images of MWCNT-Asp. ................................................................... 61
Figure 5.5: Densities of the MWCNT-Asp/water and water for different weight
concentrations (kg/m3) as a function of temperature. ..................................................... 62
Figure 5.6: Dynamic viscosity of the MWCNT-Asp/water and water as a function of
temperature and weight concentration at shear rate of 140 s-1 (mPa.s). ......................... 63
Figure 5.7: Thermal conductivity of MWCNT-Asp/water and pure water (W/m.K) as a
function of temperature. .................................................................................................. 63
Figure 5.8: Comparison of the heat transfer coefficient obtained for distilled water and
MWCNT-Asp/water nanofluid for different weight concentrations at (a) 800W, (b)
1000W and (c) 1200W. ................................................................................................... 66
Figure 5.9: Comparison of Nusselt numbers obtained for distilled water and MWCNT-
Asp/water for different weight concentrations at (a) 800W, (b) 1000W and (c) 1200W.
......................................................................................................................................... 68
Figure 5.10: Comparison of Nusselt numbers of MWCNT-Asp/water for different heat
fluxes at 0.1% weight concentration. .............................................................................. 68
Figure 5.11: Test section pressure gradient versus Reynolds number for all samples at
input power of 800W. ..................................................................................................... 70
Figure 5.12: Test section pressure gradient versus Reynolds number for three different
hear fluxes at concentration of 0.1%. .............................................................................. 70
Figure 5.13: Pumping power as a function of weight concentrations of the MWCNT-Asp
samples at different heat fluxes to the test section. ......................................................... 71
Univers
ity of
Mala
ya
xiv
Figure 6.1: Raman analysis of the pristine GNP and TGNP. ........................................ 75
Figure 6.2: TGA analysis of the pristine GNP and TGNP. ........................................... 76
Figure 6.3: panels (a) and (b) display the TEM images of TGNP. ................................ 77
Figure 6.4: (a) UV–vis absorbance spectrum for the four different weight concentration
of the water-based TGNP nanofluids and (b) colloidal stability of the TGNP/water as a
function of time at different weight concentrations. ....................................................... 79
Figure 6.5: Densities of the TGNP/water and water for different weight concentrations
(kg/m3). ........................................................................................................................... 80
Figure 6.6: Specific heat capacity of the TGNP/water and water for different weight
concentrations (J/kg.K) as a function of temperature. .................................................... 81
Figure 6.7: Dynamic viscosity of the TGNP/water and water as the functions of
temperature and weight concentration at shear rate of 140 s-1 (mPa.s). .......................... 82
Figure 6.8: Thermal conductivity of TGNP/water and pure water (W/m.K) as a function
of temperature and concentrations. ................................................................................. 83
Figure 6.9: Comparison of the heat transfer coefficient obtained for distilled water and
TGNP/water for different weight concentrations at different heat fluxes of (a) 800W, (b)
1000W and (c) 1200W to the text section....................................................................... 85
Figure 6.10: Comparison of Nusselt numbers obtained for distilled water and
TGNP/water for different weight concentrations and at different heat fluxes (a) 800W,
(b) 1000W and (c) 1200W to the test section. ................................................................ 87
Figure 6.11: Comparison of Nusselt numbers of TGNP/water for different heat fluxes at
weight concentration of 0.1%. ........................................................................................ 87
Figure 6.12: Test section pressure gradient versus Reynolds number for all the samples
at the input power of 800W............................................................................................. 89
Univers
ity of
Mala
ya

xv
Figure 6.13: Test section pressure gradient versus Reynolds number for three different
hear fluxes and at the concentration of 0.1%. ................................................................. 89
Figure 7.1: (a) Distributions of velocity and (b) inner wall temperature of EGNP-WEG
fluid flow in an annular test section at Re=5000 ............................................................ 96
Figure 7.2: Variation of the local Nusselt number of EGNP-WEG fluid flow in the
annular passage for different weight concentrations and Re=5000 (a), Re=10000 (b),
Re=15000 (c). ................................................................................................................. 98
Figure 7.3: Average heat transfer coefficients for various Reynolds numbers and weight
concentrations of EGNP-WEG coolants flow in annular test section. ........................... 99
Figure 7.4: Average Nusselt numbers for various Reynolds numbers and weight
concentrations of EGNP-WEG coolants flow in annular test section. ......................... 100
Figure 7.5: Friction factor at various Reynolds numbers. ........................................... 101
Figure 7.6: (a) Distribution of flow pressure and (b) the performance index of the
synthesized coolant versus weight concentrations of EGGNP for various Reynolds
numbers in annular flow. .............................................................................................. 102
Univers
ity of
Mala
ya
xvi
LIST OF TABLES
Table 4-1: Dynamic viscosity of the GNP-SDBS and GNP-COOH-based water
nanofluids as the functions of temperature and weight concentration at the shear rate of
140 s-1. ............................................................................................................................. 47
Table 4-2: Densities of the GNP-SDBS- and GNP-COOH-based water nanofluids for
different concentrations................................................................................................... 47
Table 4-3: Thermal conductivity of the GNP-SDBS- and GNP-COOH-based water
nanofluids for different concentrations ........................................................................... 48
Table 4-4: The specific heat capacity of the GNP-SDBS- and GNP-COOH-based water
nanofluids for different concentrations ........................................................................... 49
Table 7.1: Thermal conductivity of the water-EG mixture and EGNP-WEG as a function
of temperature and weight concentration (W/mK). ........................................................ 93
Table 7.2: Dynamic viscosity (kg/ms) of the water-EG mixture and EGNP-WEG as a
function of temperature and weight concentration at shear rate of 140 s-1. ................... 94
Table 7.3: Densities of the water-EG mixture and EGNP-WEG at different
concentrations (gr∕cm3). .................................................................................................. 94
Table 7.4: Specific heat capacity of the water-EG mixture and EGNP-WEG at different
concentrations (J/kgK). ................................................................................................... 95
Univers
ity of
Mala
ya

xvii
LIST OF SYMBOLS AND ABBREVIATIONS
Roman symbols
Cp specific heat capacity at constant pressure (J/kg.K)
dp nanoparticle diameter (m)
h heat transfer coefficient based on mean temperature (w/m2k)
I turbulent intensity
I0 initial turbulent intensity
k turbulence kinetic energy (m2/s2)
Nu Nusselt number (h.D/k)
p static pressure (N/m2)
Pr liquid Prandtl number
"q heat flux (w/m2)
Re Reynolds number ( )inv D
r,z 2-D axisymmetric coordinates (m)
S rate of deformation (s-1)
T temperature (K)
v velocity (m/s)
SSA Specific Surface Area
Greek letters
ε performance
µ dynamic viscosity (kg/m s)
µt turbulent viscosity (kg/m s)
Univers
ity of
Mala
ya
xviii
ρ density (kg/m3)
τ shear stress (Pa)
friction coefficient(kg m-3s-1)
thermal conductivity (W/m K)
ν kinematic viscosity
φ mass fraction
γ ratio of nanolayer thermal conductivity to particle thermal conductivity
λ nanoparticle with interfacial shell
Subscriptions
eff effective
f fluid
p particle phase
r radial direction
s solid
w wall
x axial direction
- mean
0 initialUnivers
ity of
Mala
ya
1
1 CHAPTER 1: INTRODUCTION
Recently almost all advances and developments in industrial technology are being
focused on the reduction of system processes leading to higher power concentrations for
a wide range of applications. Consequently the need to increase in cooling capacities has
been vital for these compact thermal systems. The conventional methods for example
using extension surfaces like fins or utilizing micro channels with high heat transfer
surface availability to obtain this prompted cooling efficiency have been extensively
employed and are restricted in effectiveness. On the other hand, the cooling fluid
characteristics, have been investigated recently.
Due to low conductivity characteristic of fluids, they do not have the enough capability
to be used in high heat transfer efficiency equipment. In other words, fluids with
characteristically poor heat transfer in one hand and increasing needs to micro-scale
thermal systems in today’s world on the other, have forced the researchers to find the new
techniques of heat transfer enhancement. Inevitably one possible solution to overcome
this restriction can be obtained by the high heat transfer ability of solid metal particles
which are suspended inside flowing fluid. Previously there have been some efforts to add
micro-scale metal particles into conventional fluids. Although this way had caused some
remarkable improvement but it led to some significant shortcomings. These micro-
particles, could enhance the heat transfer rate while impose some negative effect such as
increase of viscosity resulting in the need to a more pumping power. To solve all the
aforementioned problems with micro structure-based fluids, nanofluids was proposed.
The study of convective heat transfer in nanofluids is gaining a lot of attention. The
nanofluids have many applications in the industries since materials of nanometer size
Univers
ity of
Mala
ya
2
have unique physical and chemical properties. Nanofluids are solid-liquid composite
materials consisting of solid nanoparticles or nanofibers with sizes typically of 1-100 nm
suspended in liquid. Nanofluids have attracted great interest recently because of reports
of greatly enhanced thermal properties. For example, a small amount (< 1% volume
fraction) of Cu nanoparticles or carbon nanotubes dispersed in ethylene glycol or oil is
reported to increase the inherently poor thermal conductivity of the liquid by 40% and
150% respectively (Choi et al., 2001; J. A. Eastman et al., 2001). Conventional particle-
liquid suspensions require high concentration (>10%) of particles to achieve such
enhancement. However, problems of rheology and stability are amplified at high
concentration, precluding the widespread use of conventional slurries as heat transfer
fluids. In some cases, the observed enhancement in thermal conductivity of nanofluids is
orders of magnitude larger than predicted by well-established theories. Other perplexing
results in this rapidly evolving field include a surprisingly strong temperature dependence
of the thermal conductivity (Patel et al., 2003) and a three-fold higher critical heat flux
compared with the base fluids (Sakiadis, 1961; You et al., 2003). These enhanced thermal
properties are not merely of academic interest. If confirmed and found consistent, they
would make nanofluids promising for application in thermal management. Furthermore,
suspensions of metal nanoparticles are also being developed for other purposes, such as
medical applications including cancer therapy. The interdisciplinary nature of nanofluid
research presents a great opportunity for exploration and discovery at the frontiers of
nanotechnology. The application of high conductive fluids will collect entirely the
accessible and usable energy of a system which will associate the reduction of negative
environmental impacts of companies as well as their operating costs. One of the
advantages of nanoparticles in nanofluids is that these nano-particles have great surface
Univers
ity of
Mala
ya
3
area which contributes to the enhanced thermal conductivity than pure fluids (Ghobadian
et al., 2011; Vishwanadula, 2008).
1.1 Motivation
Fluids flow in the annular channels and their convective heat transfer are important
phenomena in the engineering systems due to their technological applications such as
cooling core of nuclear reactors, electrical gas-insulated transmission lines, thermal
insulation, gas-cooled electrical cables, cooling systems, compact heat exchangers,
cooling of electronic devices, boilers, solar energy systems, aircraft fuselage insulation to
underground electrical transmission cables and thermal storage systems (Eiyad Abu-Nada
et al., 2009; Duka et al., 2007; Mohammed, 2008; Passerini et al., 2008). As a result,
studies on the heat transfer enhancement in annular pipe heat exchangers are essential
(Kashani et al., 2013).
1.2 Objective
This study is focused on a horizontal annulus formed between an inner heat generating
solid circular cylinder and an outer isothermal cylindrical boundary undergoing transition
and turbulent convection nanofluid flow for different conditions (i.e. nanoparticle volume
fractions, inlet mass flux and wall heat flux). Moreover, three types of tests studies were
performed on three types of carbon nanostructure-based nanofluids and various
functionalization methods. Experimental and numerical investigations were performed to
obtain thermal conductivity data, pressure drops and frictional coefficient in the presence
of nanofluidss.
The objectives of the present study is presented as follows:
Univers
ity of
Mala
ya
4
To compare thermophysical properties and heat transfer enhancement of covalent
and non-covalent nanofluids in an annular heat exchanger.
To investigate thermophysical properties and heat transfer rate of covalently
functionalized multi-walled Carbon nanoplateles in an annular heat exchanger.
To analyse heat transfer performance of water-based tetrahydrofurfuryl
polyethylene glycol-treated graphene nanoplatelets super-coolant in an annular
heat exchanger.
To investigate the thermophysical and heat transfer performance of stabilized
graphene nanoplatelets-ethylene glycol/water nanofluids in an annular heat
exchanger.
Univers
ity of
Mala
ya
5
2 CHAPTER 2: LITERATURE REVIEW
2.1 Introduction
Nanofluids are nanoscale colloidal suspensions containing nanoscalematerials
(nanoparticles, nanotubes, nanorods) with diameter sizes in the order of 1 to 100
nanometers suspended in heat transfer base fluids. Nanofluids have been found to possess
enhanced thermophysical properties such as thermal conductivity, thermal diffusivity,
viscosity, and convective heat transfer coefficients compared to those of base fluids like
oil or water (Wei Yu et al., 2012). The thermal conductivity of working fluids is important
to determine the efficiency of heat exchange systems. Since the size of heat exchange
systems can be reduced with the highly efficient heat transfer fluids, the enhancement of
the thermal conductivity will contribute to the cooling of miniature devices.
Several investigations have revealed that the thermal conductivity of the fluid containing
nanoparticles could be increased by more than 20% in the case of very low nanoparticles
concentrations. When nanofluids were explored by Choi and his group at the Argonne
National Laboratory, they first tried to use metal oxide particles of nanometer size to
suspend them in the common coolants (e.g., water, ethylene glycol) (Maxwell, 1904).
All the physical mechanisms are governed by a critical length scale below which the
physical properties of materials are changed, therefore, particles smaller than 100 nm
exhibit properties different from those of conventional solids. The properties of nanoscale
materials come from the relatively high surface area or volume ratio, which is due to the
high proportion of constituent atoms residing at the grain boundaries (Sarit K Das et al.,
2007).
Univers
ity of
Mala
ya
6
Production of nanoparticles materials used in nanofluids can be classified into two main
categories: physical processes and chemical processes. Typical physical process includes
the mechanical grinding method and the inert-gas-condensation technique. Chemical
process for producing nanoparticles includes chemical precipitation, spray pyrolysis, and
thermal spraying (Wenhua Yu et al., 2008).
2.2 Nanofluids Preparation
2.2.1 One-Step Method
To reduce the agglomeration of nanoparticles, Eastman et al. developed a one-step
physical vapor condensation method to prepare Cu-ethylene glycol nanofluids (J. A.
Eastman et al., 2001). Liu et al. synthesized nanofluids containing Cu nanoparticles in
water through chemical reduction method (M.-S. Liu et al., 2006). The one-step process
consists of simultaneously making and dispersing the particles in the fluid.
This method has some advantages, the processes of drying, storage, transportation, and
dispersion of nanoparticles are avoided, so the agglomeration of nanoparticles is
minimized, and the stability of fluids is increased, but disadvantage of this method is that
only low vapour pressure fluids are compatible with the process. This limits the
application of the method (Y. Li et al., 2009). One-step processes can prepare uniformly
dispersed nanoparticles, and the particles can be stably suspended in the base fluid (Wei
Yu et al., 2012).
2.2.2 Two-Step Method
This is the first and the most classic synthesis method of nanofluids, which is extensively
used in the synthesis of nanofluids considering the available commercial nano-powders
supplied by several companies. Nanoparticles such as metal or metal oxides, and other
Univers
ity of
Mala
ya

7
nanostructures used in this method are first produced as dry powders by chemical or
physical methods. Then, the nanosized powder is dispersed into a fluid in the second
processing step with the help of intensive magnetic force agitation, ultrasonic agitation,
high-shear mixing, and homogenizing. Two-step method is the most economic method to
produce nanofluids in large scale, because nanopowders synthesis techniques have
already been scaled up to industrial production levels. Due to the high surface area and
surface activity, nanoparticles have the tendency to aggregate. The important technique
to enhance the stability of nanoparticles in fluids is the use of nan-covalently
functionalization (Wei Yu et al., 2012).
2.2.3 Stability
The stability of nanofluids is very important for practical applications. It is strongly
affected by the characteristics of the suspended particles such as the particle morphology,
the chemical structure of the particles and the basefluids (Hwang et al., 2007). Because
of the attractive Van der Waals forces between the particles, they tend to agglomerate as
they are dispersed in the liquids (especially if nanopowders are used); therefore, a means
of separating the particles is necessary. Groups of particles will settle out of the liquid and
decrease the conductivity of the nanofluid. Only by fully separating all the agglomerating
nanoparticles into their individual particles in the host liquid will be well-dispersed, and
with the sustainability of this dispersion the optimum thermal conductivity exists (Wong
et al., 2010).
Nanoparticles used in nanofluids have been made of various materials, such as metals
(Cu, Ag, Au), metals oxides (Al2O3, CuO), carbide ceramics (SiC, TiC) and carbon
nanotubes. Metal oxides were tried mainly for ease of manufacturing and stabilization
compared to the pure metallic particles, which are difficult to suspend without
Univers
ity of
Mala
ya
8
agglomeration. Subsequently, many investigators have carried out experiments with the
oxide particles, predominantly Al2O3 particles, as well as CuO, TiO2, and stable
compounds such as SiC (Sarit K Das et al., 2007).
Eastman et al. (1996) stated that an aqueous nanofluid containing 5% volume fraction
CuO nanoparticles exhibited a thermal conductivity 60% greater than that of water.
Additionally, they reported 40% greater thermal conductivity compared to water for an
aqueous nanofluid containing 5% volume fraction of Al2O3 nanoparticles (J. Eastman et
al., 1996). Lee et al. (1999) and Wang et al. showed that alumina and copper oxide
nanoparticles suspended in water and ethylene glycol significantly enhanced the fluid
thermal conductivity (X. Wang et al., 1999).
Xie et al. (2002) observed 21% increase in fluid thermal conductivity of water with 5 vol.
% of alumina nanoparticles. Pang et al. (2012) demonstrated 10.74% improvement of the
effective thermal conductivity at 0.5 vol. % concentration of Al2O3 nanoparticles and
about 14.29% increment at the same volume concentration of SiO2 nanoparticles.
Particle loading would be the main parameter that influences the thermal transport in
nanofluids and that is investigated in almost all of the experimental studies. Most of the
nanofluid thermal conductivity data in the literature exhibit a linear relationship with the
volume fraction of particles (J. A. Eastman et al., 2001; S. Lee et al., 1999; H.-q. Xie et
al., 2002; H. Xie et al., 2002). However, some exceptions have shown a non-linear
relationship (T.-K. Hong et al., 2005; Murshed et al., 2005; Zhu et al., 2006). Kwak et al.
(2005) in their investigation on CuO–ethylene glycol nanofluid, observed that substantial
enhancement in thermal conductivity with respect to particle concentration is attainable
only when particle concentration is below the dilute limit.
Univers
ity of
Mala
ya

9
The particle material is an important parameter that affects the thermal conductivity of
nanofluids, it seems that better enhancement in thermal conductivity can be achieved with
the higher thermal conductivity particles. Eastman et al. (2001) investigated thermal
conductivity enhancement of nanofluid consisting of copper nanometer-sized particles
dispersed in ethylene glycol. The effective thermal conductivity is shown to be increased
by up to 40% at 0.3 vol. % of Cu nanoparticles which is much higher than ethylene glycol
containing the same volume fraction of dispersed oxide nanoparticles of Cu. However,
the thermal conductivity of dispersed nanoparticles is not crucial to determine the thermal
conductivity of nanofluids; some research show that particle type may affect the thermal
conductivity of nanofluids in other ways. Hong et al. (2005) reported an interesting result
that the thermal conductivity of Fe based nanofluid was higher than the one obtained for
Cu nanofluids of the same volume fraction. This is opposite to the expectation that the
dispersion of the higher thermal conductive material is more effective in improving the
thermal conductivity.
The intrinsic properties of nano scaled materials become different from those of the bulk
materials due to the size confinement and surface effect (Hong et al., 2005). From the
previous researches it is observed that with using the same particle materials there are a
discrepancy in the thermal conductivity results even for the same particle load. This
discrepancy is attributed to variety of physical and chemical parameters, in addition to
the volume fraction, and the species of the nanoparticles, the other parameters such as the
size, the shape, pH value and temperature of the fluids and the aggregation of the
nanoparticles, have been considered playing roles on the heat transfer characteristics of
nanofluids.
Univers
ity of
Mala
ya

10
2.3 Effective Parameters on Thermal Conductivity
2.3.1 Particle Size
It is expected that the thermal conductivity enhancement increases with decreasing the
particles size, which leads to increasing the Specific Surface Area (SSA):
particle surface areaSSAparticle volume
(2-1)
For the sphere particles:
2
3
6 / 6
p
p p
dSSA
d d
(2-2)
This is clearly indicating that a decrease in particle diameter (dp) causes the SSA to
increase, which giving more heat transfer area between the particles and fluid surrounding
the particles. Lee et al. (1999) suspended CuO and Al2O3 (18.6 and 23.6nm, 24.4 and
38.4nm, respectively) in two different base fluids: water and ethylene glycol (EG) and
obtained four combinations of nanofluids: CuO in water, CuO in EG, Al2O3 in water and
Al2O3 in EG. Their results show that the thermal conductivity ratios increase almost
linearly with volume fraction. Results suggested that not only particle shape but size of
nanoparticle is considered to be dominant in enhancing the thermal conductivity of
nanofluids.
Xie et al. (2002) demonstrated the nanoparticle size effect on the thermal conductivity
enhancement; they measured the effective thermal conductivity of nanofluids (Al2O3 in
ethylene glycol) with different nanoparticle sizes. They reported that an almost linear
increase in conductivity was obtained with the increase of volume fraction, but the rates
Univers
ity of
Mala
ya
11
of the enhancement ratios with the volume fraction was dependent on the dispersed
nanoparticles. They stated that the enhancements of the thermal conductivities are
dependent on the specific surface area (SSA) and the mean free path of the nanoparticles
and the base fluid. With the decrease of the particle size the Brownian motion of
nanoparticles enhances which dominates the nanoconvection. As a result, the effective
thermal conductivity of nanofluids becomes higher.
Yoo et al. (2007) investigated the thermal conductivities of (TiO2, Al2O3, Fe, and WO3)
nanofluids. It shows that the surface-to-volume ratio of nanoparticles is a key factor which
influences thermal conductivity of nanofluids.
2.3.2 Particle Shape
Murshed et al. (2005) measured the effective thermal conductivity of rod-shapes (10nm
x 40 nm; diameter by length) and spherical shapes (15nm) of TiO2 nanoparticles in
deionized water. The results show that the cylindrical particles present a higher
enhancement which is consistent with theoretical prediction, i.e., Hamilton-Crosser
(Hamilton et al., 1962) model.
Evans et al. (2008) investigated the effect of the aspect ratio on the enhancement of the
thermal conductivity of nanofluids. They have compared the thermal conductivity
enhancement of long fibers in flat plates at a specific concentration for different aspect
ratios. The results suggest that the optimum design for nanofluids for thermal conductivity
enhancement would involve the use of high-aspect-ratio fibers, e.g. carbon nanotubes,
rather than spherical or ellipsoidal particles.
Univers
ity of
Mala
ya

12
2.3.3 Base Fluid
Different types of fluids, such as water, ethylene glycol, vacuum pump oil and engine oil,
have been used as base fluid in nanofluids. It is clearly seen that no matter what kind of
nanoparticle was used, the thermal conductivity enhancement decreases with an increase
in the thermal conductivity of the base fluid (Xie et al., 2011). Xie et al. (2002)
investigated the thermal conductivity of suspensions containing nanosized alumina
particles, for the suspensions using the same nanoparticles; the enhanced thermal
conductivity ratio is reduced with increasing thermal conductivity of the base fluid. Liu
et al. (2005) also investigated base fluid effect with MWCNT nanofluids; they used
ethylene glycol and synthetic engine oil as base fluids in the experiments. 1 vol. %
MWCNT/ethylene glycol nanofluid showed 12.4% thermal conductivity enhancement
over the base fluid, whereas at 2 vol. % MWCNT/synthetic engine oil nanofluid, the
enhancement was 30%. It was observed that higher enhancements was achieved with
synthetic engine oil as the base fluid.
2.3.4 Temperature-Dependent Thermal Conductivity
In conventional suspensions of solid particles (with sizes in the order of millimeters or
micrometers) in liquids, thermal conductivity of the mixture depends on temperature only
due to the dependence of thermal conductivity of base liquid and solid particles on
temperature (Özerinç et al., 2010). However, in case of nanofluids, change of temperature
affects the Brownian motion of nanoparticles and clustering of nanoparticles (C. H. Li et
al., 2008) which results in dramatic changes of thermal conductivity of nanofluids with
temperature.
Das et al. (2003) discovered that the nanofluids have strongly temperature-dependent
conductivity compared to base fluids. They measured effective thermal conductivities of
Univers
ity of
Mala
ya
13
Al2O3 and CuO nanoparticles in water when the mixture temperature was varied between
21 to 51oC. It is observed that a 2 to 4 fold increase in thermal conductivity enhancement
of nanofluids can be achieved over that range of temperature. Patel et al (2003) reported
that the thermal conductivity enhancement ratios of Au nanofluids were enlarged
considerably when the temperature increased.
Zhang et al. (2006) measured effective thermal conductivity of Al2O3-distilled water in
the temperature range of 5-50oC, were in a good agreement to Das et al. (2003). However,
in other experimental investigations, it showed different thermal conductivity
enhancement behaviours. Yu et al., investigated the nanofluids containing GONs
(Graphene Oxide Nanosheets), the thermal conductivity enhancement ratios remain
almost constant when they tested by varying temperatures. This indicates that many
factors may affect the thermal conductivity enhancement ratios. One of these factors is
the viscosities of the base fluids. In their experiments, Ethylene Glycol was used as the
base fluid and the viscosity value was high. On the other hand, GONs were large, so the
effect of Brownian motion was not obvious (Wei Yu et al., 2009).
2.4 Mechanisms of Thermal Conduction Enhancement
Heat conduction mechanisms in nanofluids have been extensively investigated in the past
decades to explain the experimental observations of the enhanced thermal conductivities.
Keblinski et al. (2002) and Eastman et al. (2004) proposed four possible mechanisms,
e.g., Brownian motion of the nanoparticles, molecular-level layering of the liquid at the
liquid/particle interface, the nature of heat transport in the nanoparticles, and the effects
of nanoparticle clustering. Other groups have started from the nanostructure of
nanofluids. These investigators assume that the nanofluid is a composite, formed by the
nanoparticle as a core, and surrounded by a nanolayer as a shell, which in turn is immersed
Univers
ity of
Mala
ya

14
in the base fluid, and from which a three-component medium theory for a multiphase
system is developed (X.-Q. Wang et al., 2008).
2.4.1 Brownian Motion
The Brownian motion of nanoparticles could contribute to the thermal conduction
enhancement through two ways, a direct contribution due to motion of nanoparticles that
transport heat, and an indirect contribution due to micro-convection of fluid surrounding
individual nanoparticles. The studies of Wang et al. (1999) clearly showed that Brownian
motion is not a significant contributor to heat conduction. Keblinski et al. (2002)
concluded that the movement of nanoparticles due to Brownian motion was too slow in
transporting heat through a fluid. To travel from one point to another, a particle moves a
large distance over many different paths in order to reach a destination that may be
apparently a short distance from the starting point. Therefore, the random motion of
particles cannot be a key factor in the improvement of heat transfer based on the results
of a time-scale study. Evans et al. (2006) suggested that the contribution of Brownian
motion to the thermal conductivity of the nanofluids is very small and cannot be
responsible for the extraordinary thermal transport properties of nanofluids.
Even though it stated that Brownian motion is not a significant contributor to enhance
heat conduction, some authors showed the key role of Brownian motion in nanoparticles
in enhancing the thermal conductivity of nanofluids. (Sarit K Das et al., 2007) Jang and
Choi (2004) proposed the new concept that the convection induced by purely Brownian
motion of nanoparticles at the molecular and nanoscale level is a key nanoscale
mechanism governing their thermal behavior. In this mechanism, the thermal
conductivity of nanofluids is strongly dependent on the temperature and particle size.
Univers
ity of
Mala
ya
15
Patel et al. (2006) developed microconvection model for evaluation of thermal
conductivity of nanofluids by taking into account nanoconvection induced by Brownian
nanoparticles and their specific surface area. Koo et al. (2005) discussed the effects of
Brownian motion, thermo-phoretic, and osmo-phoretic motions on the effective thermal
conductivities. They found that the role of Brownian motion is much more important than
that of the thermo-phoretic and osmo-phoretic motions. Furthermore, the particle
interaction can be neglected when the nanofluids’ concentration are low (< 0.5%). The
contribution of Brownian motion for high aspect ratio nanotube dispersions may not be
as important as that for spherical particle dispersions. Xie et al. (2003) pointed out from
their experimental observations that the thermal conductivity of nanofluids seems to be
very dependent on the interfacial layer between the nanotube and base fluids.
2.4.2 Molecular-level Layering
At the solid-liquid interface, liquid molecules could be significantly more ordered than
those in the bulk liquid alone. In the direction normal to the liquid–solid interface, liquid
density profiles exhibit oscillatory behavior on the molecular scale due to the interactions
between the atoms in the liquid and the solid (C.-J. Yu et al., 1999; Wenhua Yu et al.,
2008). The magnitude of the layering increases with the increase of the solid–liquid
bonding strength, and the layering extends into the liquid over several atomic or molecular
distances. In addition, with the increasing strength of the liquid–solid bonding, crystal-
like order develops in the liquid in the lateral directions (L. Xue et al., 2004). Therefore,
Choi et al. postulated that this organized solid/liquid interfacial shell makes the transport
of energy across the interface effect (Choi et al., 2001).
There is no experimental data regarding the thickness and thermal conductivity of these
nanolayers which is an important drawback of the proposed mechanism (Özerinç et al.,
Univers
ity of
Mala
ya
16
2010). To develop a theoretical model by considering liquid layering around
nanoparticles some authors assumed some values for the thermal conductivity and
thickness of the nanolayer (W Yu et al., 2003).
Recently, Tillman and Hill (2007) proposed another theoretical way to calculate the
thickness and thermal conductivity of the nanolayer. Their approach requires a prior
assumption about the functional form of the thermal conductivity in the nanolayer and
iterations of the calculation process are required. They used the classical heat conduction
equation together with proper boundary conditions to obtain a relation between the radial
distribution of thermal conductivity in the nanolayer and nanolayer thickness.
Lee (2007) proposed a way of calculating the thickness and thermal conductivity of the
nanolayer by considering the formation of electric double layer around the nanoparticles.
So, the thickness of nanolayer depends on the dielectric constant, ionic strength, and
temperature of the nanofluid. The thermal conductivity of the nanolayer depends on the
total charged surface density, ion density in the electric double layer, pH value of the
nanofluid, and thermal conductivities of the base fluids and the nanoparticles (X.-Q.
Wang et al., 2008).
Xue (2003) proposed a model of the effective thermal conductivity for nanofluids
considering the interface effect between the solid particles and the base fluid of the
nanofluids, his model is based on Maxwell theory and average polarization theory. The
theoretical results on the effective thermal conductivity of nanotube/oil nanofluid and
Al2O3/water nanofluid are in good agreement with the experimental data.
Among those studies, Xue et al. (2004) examined the effect of nanolayer by molecular
dynamics simulations and showed that nanolayers have no effect on the thermal transport.
Univers
ity of
Mala
ya

17
They said that despite the large degree of orderly appearance, these liquid layers are still
more disordered than the crystals.
2.4.3 Clustering
Clustering is the formation of larger particles through aggregation of nanoparticles.
Clustering effect is always present in nanofluids and it is an effective parameter in thermal
conductivity (Özerinç et al., 2010). Figure (2-1) schematically shows aggregation. The
probability of aggregation increases with decreasing of particle size at a constant volume
fraction, because the average interparticle distance decreases, which makes the attractive
van der Waals force more important (Sarit K Das et al., 2007). Aggregation will decrease
the Brownian motion due to the increase in the mass of the aggregates, whereas it can
increase the thermal conductivity due to the percolation effects in the aggregates, as
highly conducting particles touch each other in the aggregate (Prasher, Phelan, et al.,
2006). However, larger clusters tend to settle out from the base fluids and therefore
decrease the thermal conductivity enhancement.
Figure 2.1: Schematic of Well-dispersed Aggregates.
A number of authors strongly suggested that nanoparticle aggregation plays a significant
role in the thermal transport in nanofluids. Using effective medium theory Prasher et al.
Univers
ity of
Mala
ya

18
(2006) demonstrated that the thermal conductivity of nanofluids can be significantly
enhanced by the aggregation of nanoparticles into clusters. Hong et al. (2006)
investigated the effect of the clustering of nanoparticles on the thermal conductivity of
nanofluids. Large enhancement of the thermal conductivity is observed in Fe nanofluids
sonicated with high powered pulses. The average size of the nanoclusters and thermal
conductivity of sonicated nanofluids are measured as time passes after the sonication
stopped. It has been observed that the reduction of the thermal conductivity of nanofluids
is directly related to the agglomeration of the nanoparticles. Kwak and Kim (2005)
demonstrated that larger thermal conductivity enhancements are accompanied by sharp
viscosity increases at low (<1%) nanoparticle volume fractions, thus it is more effective
to use small volume fractions than otherwise, in nanofluids. Lee et al. (2006)
demonstrated the critical importance of particle surface charge in nanofluids thermal
conductivity. The surface charge is one of the primary factors controlling the nanoparticle
aggregation.
Furthermore, Putnam et al. (2006) and Zhang et al. (2006) and Venerus et al. (2006) have
demonstrated that nanofluids exhibiting good dispersion do not show any unusual
enhancement of thermal conductivity (Evans et al., 2008).
2.5 Carbon Nanotubes
The largest increases in thermal conductivity have been observed in suspensions of
carbon nanotubes (CNT), which has very high aspect ratio (~2000), and very high thermal
conductivity along their alignment axis, similar to the in-plane conductivity of graphite
(2000 W/m K); but the conductivity perpendicular to the axis is similar to that for
transplanar conduction in carbon. The first report on the synthesis of nanotubes was
conducted by Iijima (1991).
Univers
ity of
Mala
ya
19
CNTs are one-dimensional cylinder of carbon with single or multiple layers of carbon..
carbon is a densely packed single, hexagonal layer of carbon-bonded atoms that are rolled
to form a cylindrical microstructure. The ends of the cylindrical microstructure can be
capped with a hemispherical structure from the fullerene family or left open. Planner
carbon sheets can be rolled in a number of ways. The orientation of rolling gives different
possible structures of carbon nanotubes. Each type of CNT structure has their unique
strength, electrical and thermal properties (Sarit K Das et al., 2007).
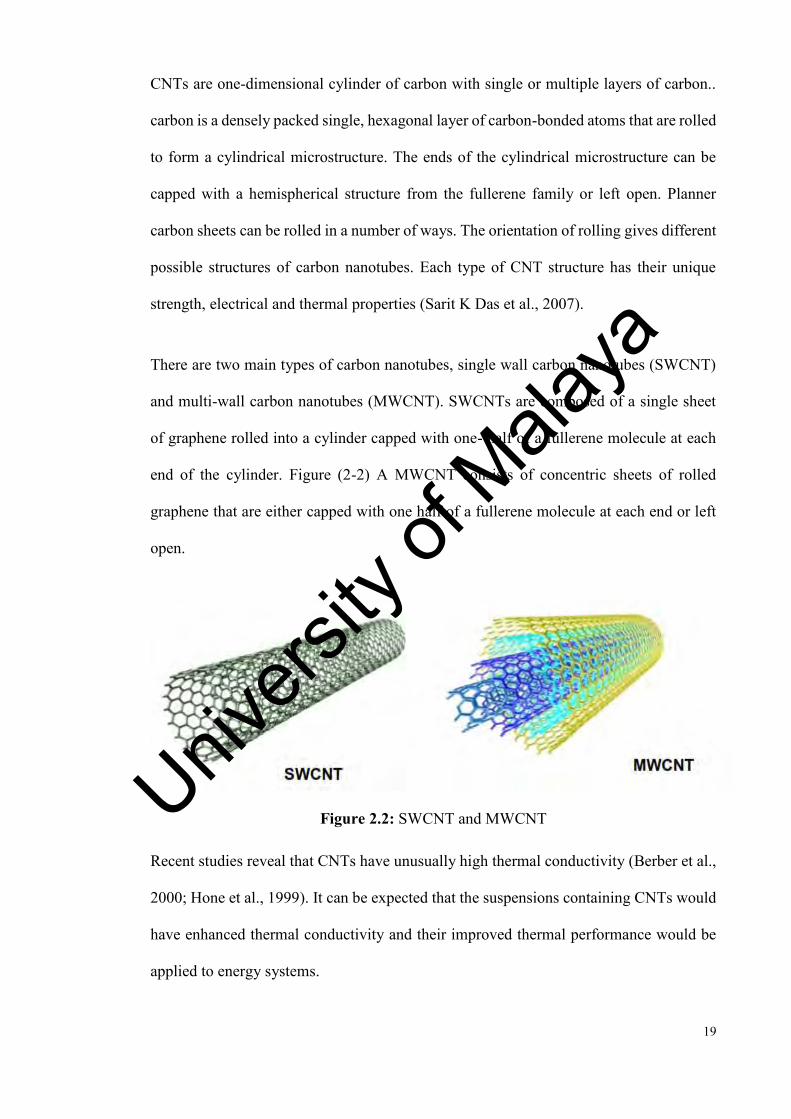
There are two main types of carbon nanotubes, single wall carbon nanotubes (SWCNT)
and multi-wall carbon nanotubes (MWCNT). SWCNTs are composed of a single sheet
of graphene rolled into a cylinder capped with one- half of a fullerene molecule at each
end of the cylinder. Figure (2-2) A MWCNT consists of concentric sheets of rolled
graphene that are either capped with one half of a fullerene molecule at each end or left
open.
Figure 2.2: SWCNT and MWCNT
Recent studies reveal that CNTs have unusually high thermal conductivity (Berber et al.,
2000; Hone et al., 1999). It can be expected that the suspensions containing CNTs would
have enhanced thermal conductivity and their improved thermal performance would be
applied to energy systems.
Univers
ity of
Mala
ya
20
The first experimental observation of thermal conductivity enhancement was reported by
Choi and co-workers for the case of MWNTs dispersed in poly- (α olefin) oil (Choi et al.,
2001). They reported an enhancement of 160% at a nanotube loading of 1.0 vol. %. To
get stable nanofluids, Xie et al. (2003) functionalized CNTs using concentrated nitric acid
which reduced aggregation and entanglement of the CNTs. Functionalized CNTs were
successfully dispersed into polar liquids like distilled water, ethylene glycol without the
need of surfactant and into non polar fluid like decene (DE) with oleylamine as surfactant.
Functionalized CNTs are stable in both water and ethylene glycol for more than two
months. At 1.0 vol. % the thermal conductivity enhancements are 19.6%, 12.7%, and
7.0% for functionalized CNT suspension in DE, EG, and DW, respectively.
It is known that CNTs have a hydrophobic surface, which is prone to aggregation and
precipitation in water in the absence of dispersant/surfactant (Zhang et al., 2004). The
method of making a stable suspension includes physical mixing in combination with
chemical treatments. The physical mixing includes magnetic force agitation and
ultrasonic vibration. The chemical treatment is achieved by changing the pH value and
by using surface activators and/or surfactant.
Various dispersion methods have been used to ensure a homogenous dispersion of the
CNTs throughout the nanofluid (Ryglowski, 2009). The use of surfactants includes two-
steps approach: dissolving the surfactant into the liquid medium, and then adding the
selected carbon nanotube into the surfactant liquid medium with mechanical agitation
and/or ultra-sonication (Zhang et al., 2004) All these techniques used in preparation
process and the addition of surfactant, aim at changing the surface properties of suspended
particles and suppressing formation of particles aggregation, so, nanofluids can keep
stable without visible sedimentation of nanoparticles (Xuan et al., 2000).
Univers
ity of
Mala
ya

21
Assael et al. (2004) measured the enhancement of the thermal conductivity of MWCNTs-
water suspensions with 0.1 wt% Sodium Dodeycyl Sulfate (SDS) as a surfactant. The
maximum thermal conductivity enhancement was 38% for a 0.6 vol. % suspension.
Results showed that the additional SDS would interact with MWCNTs in which the outer
surface was affected. Later, Assael et al. (2005) repeated the similar measurements using
MWCNTs and double walled carbon nanotubes (DWNTs), but by using
Hexadecyltrimethyl ammonium bromide (CTAB) and nanosphere AQ as dispersants. The
maximum thermal conductivity enhancement was obtained 34% for a 0.6 vol. %
MWCNTs –water suspension with CTAB. They also discussed the effect of surfactant
concentration on the effective thermal conductivity of the suspensions and found that
CTAB is better for MWCNTs and DWNTs.
Liu et al. (2005) tested nanofluids containing CNTs. They used ethylene glycol and
synthetic engine oil as base fluids. N-hydroxysuccinimide (NHS) was employed as the
dispersant in carbon nanotube–synthetic engine oil suspensions. It was found that in
CNT/ethylene glycol nanofluids, the thermal conductivity was enhanced by 12.4% with
1 vol. % CNT, while in CNT/engine oil nanofluids; the thermal conductivity was
enhanced by 30.3% with 2 vol. % CNT. Based on experimental observations of CNT–
liquid and CNT–CNT interactions, CNT dispersed in base fluid; where CNT orientation
and CNT–CNT contacts, can form extensive three-dimensional CNT network chain that
facilitate thermal transport (Sastry et al., 2008).
Nanda et al. (2008) reported up to 35% enhancement in thermal conductivity for 1.1 vol.
% CNTs (single wall) glycol nanofluid. Shaikh et al. (2007) used the modern light flash
technique and measured the thermal conductivity of three types of nanofluids. They
reported a maximum enhancement of 160% for the thermal conductivity of carbon
Univers
ity of
Mala
ya
22
nanotube (CNT)-polyalphaolefin (PAO) suspensions. Ding et al. (2006) studied the heat
transfer behavior of aqueous suspensions of multi-walled carbon nanotubes flowing
through a horizontal tube. Wen and Ding found a 25% enhancement in the conductivity
of carbon nanotubes suspended in water. The enhancement in the conductivity of the
suspension increases rapidly with loading up to 0.2 vol. % and then begins to saturate, the
measurements are taken up to 0.8 vol (Wen et al., 2004).
Significant enhancement of the convective heat transfer is observed and the enhancement
depends on the flow conditions and CNT concentrations. They found that the
enhancement is a function of the axial distance from the inlet of the test section and they
proposed that particle re-arrangement, shear induced thermal conduction enhancement,
reduction of thermal boundary layer thickness are due to the presence of nanoparticles, as
well as the very high aspect ratio of CNTs are to be the possible mechanisms. Jiang et al.
(2009) tested the thermal characteristics of CNT nanorefrigerants, where four kinds of
CNTs employed in this research with different diameters and aspect ratios. The
experimental results show that the thermal conductivities of CNT nanorefrigerants have
increased significantly with the increase of the CNT volume fraction; the diameter and
aspect ratio of CNT can influence the thermal conductivities of CNT nanorefrigerants, in
which the smaller the diameter of CNT the larger the aspect ratio of CNT which provides
the higher thermal conductivity of CNT nanorefrigerant. They reported that the influence
of aspect ratio of CNT on nanorefrigerants’ thermal conductivities is less than the
influence of diameter of CNT.
Meibodi et al. (2010) investigated the stability and thermal conductivity of CNT/water
nanofluids. They examined the affecting parameters including size, shape, and source of
nanoparticles, surfactants, power of ultrasonic, time of ultra-sonication, elapsed time after
Univers
ity of
Mala
ya

23
ultra-sonication, pH, temperature, particle concentration, and surfactant concentration.
The work on CNTs containing nanofluids cited above clearly which indicates that
nanotubes have a higher potential to be used in nanofluids.
2.6 Modeling Studies
The conventional understanding of the effective thermal conductivity of multiphase
systems originates from continuum formulations which typically involve the particle
size/shape and volume fraction and assume diffusive heat transfer in both fluid and solid
phases. Researchers have proposed many theories to explain the anomalous behaviour
observed in nanofluids. First attempt to explain the thermal improvement in nanofluids
was made by using Maxwell theory (Maxwell, 1904). This theory is valid for diluted
suspension of spherical particles in homogeneous isotropic material.
2 2 ( )2 ( )
p f f peff
f p f f p
k k k kkk k k k k
(2-3)
The Maxwell equation takes into account only the particle volume concentration and the
thermal conductivities of particle and liquid. Hamilton and Crosser (1962) developed this
theory for non-spherical particles shapes their model allows calculation of the effective
thermal conductivity (keff) of two component heterogeneous mixtures and includes
empirical shape factor n given by n=3/ψ; (ψ is the sphericity defined as ratio between the
surface area of the sphere and the surface area of the real particle with equal volumes),
0
0 0
( 1) ( 1)( )( 1) ( )
p f peff
f p p
k n k n k kkk k n k k k
(2-4)
Univers
ity of
Mala
ya

24
where, kp and k0 are the conductivities of the particle material and the base fluid and ϕ is
volume fraction of the nanoparticles Hamilton-Crosser theory takes into account the
increase in surface area of the particles by taking the shape factor into account, but it does
not consider the size of the particles. This is an obvious shortcoming of this theory. It was
not surprising that both Maxwell’s theory and HC theory were not able to predict the
enhancement in thermal conductivity of nanofluids because it did not take into account
the various important parameters affecting the heat transport in nanofluids like the effect
of size of nanoparticle and modes of thermal transport in nanostructures. Other classical
models include the effects of particle distribution developed by Cheng & Vachon (1969),
and particle/particle interaction developed by Jeffrey (1973). Although they can give
good predictions for micrometer or larger-size multiphase systems, the classical models
usually underestimate the thermal conductivity increase of nanofluids as a function of
volume fraction.
Keblinski et al. (2002) investigated the possible factors of increasing thermal conductivity
of nanofluids such as the size, the clustering of the particles, Brownian motion of particles
and the nanolayer between the nanoparticles and base fluids. Yu and Choi (2003)
proposed a modified Maxwell model to account for the effect of the nanolayer by
replacing the thermal conductivity of solid particles kp in Eq.(2-1) with the modified
thermal conductivity of particles kpe, which is based on the so called effective medium
theory developed by Schwartz et al. (1995);
3
3
2(1 ) (1 ) (1 2 )(1 ) (1 ) (1 2 )
eff
f
kk
(2-5)
Univers
ity of
Mala
ya

25
Where, /layer pk k is the ratio of nanolayer thermal conductivity to particle
thermal conductivity and /h r is the ratio of the nanolayer thickness to the original
particle radius. This model can predict that the presence of very thin nanolayer, even
though only a few nanometers thick, can measurably increase effective volume fraction
and subsequently the thermal conductivity of nanofluids.
Xue (2006) proposed a model for calculating the effective thermal conductivity of
nanofluids, which is expressed as
,y,
2, , 2, ,
9(1 ) 4 02 ( ) 2 (1 )( )
eff eeff e xeff f
eff f eff x e x eff eff x e y eff
k kk kk kk k k B k k k B k k
(2-6)
Where ke,x and ke,y are the thermal conductivity components of the complex elliptical
particles along the x and y axes, respectively, ν and
are the volume fractions of the
nanoparticles and the complex nanoparticles (nanoparticle with interfacial shell),
respectively. His model is based on the Maxwell theory and average polarization theory,
which includes the interfacial shell effect.
Shukla et al. (2005) developed a model for thermal conductivity of nanofluids based on
the theory of Brownian motion of particles in a homogeneous liquid combined with the
macroscopic Hamilton- Crosser model and predicted that the thermal
conductivitydepends on the temperature and particle size. The model predicts a linear
dependence of the increase in thermal conductivity of the nanofluid with their volume
fraction of solid nanoparticles.
Univers
ity of
Mala
ya
26
Xue and Xu (2005) derive an expression for the effective thermal conductivity of
nanofluids with interfacial shells, the expression is not only dependent on the thermal
conductivity of the solid and liquid and their relative volume fraction, but also dependent
on the particle size and interfacial properties.
Patel et al. (2008) proposed a cell model to predict the thermal conductivity enhancement
of nanofluids. Effects due to the high specific surface area of the mono-dispersed
nanoparticles (in which, inter-particle interactions are neglected, as the particle–fluid heat
transfer is expected to be much more significant compared to the particle–particle heat
transfer), and the micro-convective heat transfer enhancement associated with the
Brownian motion of particles are addressed in this model. In this model it is assumed that
there are two paths for the heat flux, one corresponding to the heat conduction directly
through the stationary liquid without involving the particle phase and the other in which
heat passes from the liquid to the moving particle, propagates by conduction within the
particle and finally returns to the liquid from particle phase, the convective resistance
between the fluid and the particle due to particle motion and the conductive resistance
through the particle are in series.
Akbari et al. (2011) proposed an expression for the effective conductivity of nanofluids;
this model is based on Nan et al. model (Nan et al., 1997). It takes into consideration
micro-convection between the liquid and the nanoparticles due to Brownian motion, the
effect of particle clustering size and the effects of the interfacial thermal resistance.
In the last few years, attempts have been made to model the enhancement in thermal
conductivity of CNT nanofluids using liquid layering scenario, fractal theory etc. Xue
(1999) modeled the thermal conductivity of CNT nanofluids using field factor `approach,
Univers
ity of
Mala
ya
27
with a depolarization factor and an effective dielectric constant. Hosseini et al. (2011)
uses a set of dimensionless groups based upon the properties of the base fluid, the CNT-
fluid interface, and characteristics of the nanotubes themselves, such as diameter, aspect
ratio, and thermal conductivity. Patel et al. model (2008) is derived from Hemanth et al
(2004), which is given for nanoparticle suspensions. The model considers two paths for
heat to flow in a CNT nanofluid, one through the base liquid and the other one through
the CNTs. These two paths are assumed to be in parallel to each other. Thus, two
continuous media are considered here, participating in the conductive heat transfer mode.
Usually, the aspect ratio of CNTs is very high and hence, a continuous net of CNTs
available for heat transfer is a valid assumption.
2.7 Measurement of Thermal Conductivity of Liquids
There are three main methods commonly employed to measure the thermal conductivity
of nanofluids: The transient hot wire method, the steady- state parallel plate and
temperature oscillation.
2.7.1 Transient Hot Wire Method (THW)
In the ideal mode of the transient hot-wire apparatus, an infinitely long, vertical, line
source of heat possessing zero heat capacity and infinite thermal conductivity is immersed
in a sample fluid whose thermal conductivity is to be measured (Wakeham et al., 1991).
The hot wire served both as a heating unit and as an electrical resistance thermometer. In
practice, the ideal case is approximated with a finite long wire embedded in a finite
medium. Because in general nanofluids are electrically conductive, a modified hot-wire
cell and electrical system was proposed by Nagasaka et al. (1981) by coating the hot wire
(typically platinum) with an epoxy adhesive which has excellent electrical insulation and
heat conduction.
Univers
ity of
Mala
ya
28
The wire is electrically heated, and the rise in temperature over the time elapsed is
measured. Since the wire is essentially wrapped in the liquid, the heat generated will be
diffused into the liquid. The higher the thermal conductivity of the surrounding liquid, the
lower the rise in temperature will be. To calculate the thermal conductivity of the
surrounding liquid, a derivation of Fourier’s law for radial transient heat conduction is
used (Sarit K Das et al., 2007). The differential equation for the conduction of heat is
2 2 2
2 2 2
1T T T Tx y z t
(2-6)
Using a solution presented by Carslaw and Jaeger (1959), the conductivity of a solution
can be expressed as
2
2 1 1
ln4 ( )
tqkT T t
(2.7)
Where, T1 and T2 represent the temperature of the heat source at time t1 and t2
respectively.
The transient hot wire method has been used widely to measure the thermal conductivities
of nanofluids. However, Das et al. (2003) pointed that possible concentration of ions of
the conducting fluids around the hot wire may affect the accuracy of such experimental
results.
2.7.2 Steady-State Parallel-Plate Method
This method produces the thermal conductivity data from the measurement in a
straightforward manner, the fluid sample is placed in the volume between two parallel
Univers
ity of
Mala
ya
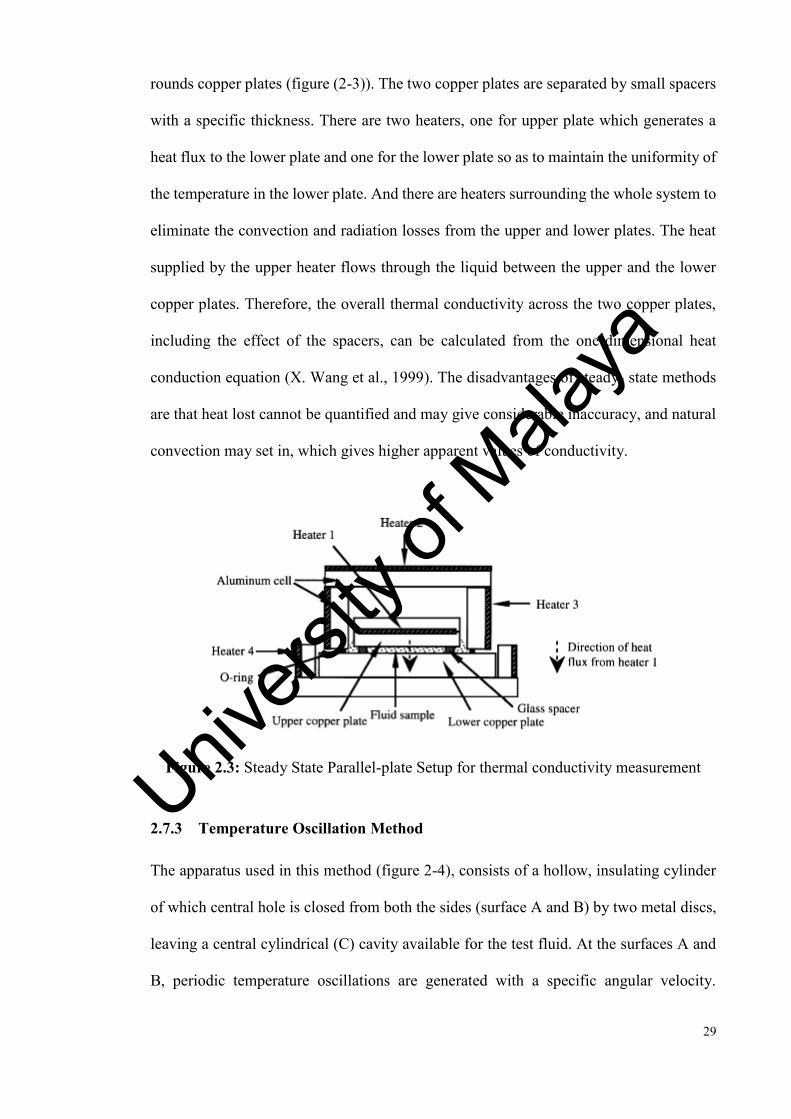
29
rounds copper plates (figure (2-3)). The two copper plates are separated by small spacers
with a specific thickness. There are two heaters, one for upper plate which generates a
heat flux to the lower plate and one for the lower plate so as to maintain the uniformity of
the temperature in the lower plate. And there are heaters surrounding the whole system to
eliminate the convection and radiation losses from the upper and lower plates. The heat
supplied by the upper heater flows through the liquid between the upper and the lower
copper plates. Therefore, the overall thermal conductivity across the two copper plates,
including the effect of the spacers, can be calculated from the one-dimensional heat
conduction equation (X. Wang et al., 1999). The disadvantages of steady- state methods
are that heat lost cannot be quantified and may give considerable inaccuracy, and natural
convection may set in, which gives higher apparent values of conductivity.
Figure 2.3: Steady State Parallel-plate Setup for thermal conductivity measurement
2.7.3 Temperature Oscillation Method
The apparatus used in this method (figure 2-4), consists of a hollow, insulating cylinder
of which central hole is closed from both the sides (surface A and B) by two metal discs,
leaving a central cylindrical (C) cavity available for the test fluid. At the surfaces A and
B, periodic temperature oscillations are generated with a specific angular velocity.
Univers
ity of
Mala
ya

30
Analytical solution for temperature distribution for one dimensional, transient heat
conduction with periodic boundary condition is used to find the thermal conductivity of
test fluid by measuring amplitude attenuation and phase shift in the temperature wave at
the inner face of the disc and at the center of cavity. (Patel et al., 2010) The details of the
technique are given by Das et al. (1999).
Figure 2.4: Temperature Oscillation Setup
2.8 Dynamic Thermal Test
2.8.1 Shear Flow Test
The primary interest in nanofluids is the possibility of using these fluids for heat transfer
purposes. So, the nanofluids are expected to be used under flow condition. To know how
these fluids will behave, more studies on its flow and heat transfer feature are needed.
Shear rate is a parameter which can affect the thermal conductivity of nanofluid. Lee and
Irvine investigated the effect of shear rate on the thermal conductivity of Non-Newtonian
fluids (D.-L. Lee et al., 1997). They found that increasing the shear rate would increase
the thermal conductivity of the fluid. Shin and Lee measured the thermal conductivity of
suspensions containing micro particles (20-300μm) under Couette flow (Shin et al.,
Univers
ity of
Mala
ya

31
2000). This study also showed that increasing the shear rate had increased the thermal
conductivity of the fluids. Although neither of these studies used nanofluids, they are still
relevant. Any practical application of nanofluids would subject them to shear.
Understanding how they perform under shear, is therefore critical. A setup of similar to
that used by Shin and Lee was used in this study to determine the effects of shear on
nanofluids.
2.8.2 Pipe Flow Test
Convective heat transfer refers to heat transfer between a fluid and a surface due to the
microscopic motion of the fluid relative to the surface. The effectiveness of heat transfer
is described by the heat transfer Coefficient, h, which is a function of a number of thermo-
physical properties of the heat transfer fluids, the most significant ones are thermal
conductivity, k, heat capacity, Cp, viscosity, μ, density, ρ, and surface tension, σ.
Although, measurement of the thermal conductivity provides an idea of how effective a
nanofluid is as a thermal fluid, it does not show the entire picture. Recently, more tests
have been performed to see how nanofluids perform in a convective situation. This is a
more telling test because it is much more similar to practical applications, and shows what
effects of particle size and viscosity might have on a nanofluid’s performance. The
majority of these studies have used a pipe flow set up (Anoop et al., 2009; Ding et al.,
2006; Fotukian et al., 2010a, 2010b; Heris et al., 2006; Z.-H. Liu & Liao, 2010; Williams
et al., 2008). These studies agreed that nanofluids heat transfer coefficient had
significantly improved.
Anoop et al. (2009) found 25% increase in alumina nanofluids, with even greater
increases in the entrance region. However, an increase in thermal conductivity does not
necessarily imply an increase in heat transfer coefficient. Heris et al. (2006) found that
Univers
ity of
Mala
ya

32
copper based nanofluids had provided an increase in thermal conductivity. However,
aluminium based nanofluids showed greater increases in heat transfer coefficient. The
authors suggested that the larger particle size and larger viscosity of the copper fluids
caused them to perform worse in convection tests. Although these anomalies have been
reported by others, there has been far too little testing done to offer conclusive
explanations why some nanofluids offer small improvement in convection than in
conduction.
2.9 Carbon nanostructure-based nanofluids
Shanbedi et al. (2013) investigated the performance of two-phase closed thermosyphon
(TPCT) and multiwalled carbon nanotubes (MWCNT). They reported that presence of
functionalized MWCNT leads to 11% improvement in the thermal efficiency of the
TPCT. The researchers had reported that the thermo-physical properties such as the
thermal conductivity of the nanoparticles played the key role in their applications in heat
exchangers (Afshar et al., 2009; Garg et al., 2009; Mahian et al., 2013; Mehta et al., 2007).
Graphene nanoparticles (GNP) have higher thermal conductivity than other carbon
allotropes such as diamond, SWNT and MWNT (Azizi et al., 2013). As a result GNP has
attracted researcher’s attention in various scientific fields for manufacturing some items
like sensors and batteries. A majority of these usages, however, cannot completely be
realized due to poor interaction among GNP and other materials. Thus, in order to increase
the interactivity of carbon nanostructures, covalent (aminoacids) and non-covalent (GA)
functionalizations were proposed as the common solutions by the researchers (Amiri et
al., 2012). Covalent and non-covalent functionalizations are two promising approaches to
enhance the GNP dispersibility in aqueous/organic solvents. Non-covalent
functionalization of carbon nanostructures is performed by engaging several surfactants
Univers
ity of
Mala
ya
33
(Amiri et al., 2012; Arzani et al., 2015; Brege et al., 2007; Silvera-Batista et al., 2011;
Suttipong et al., 2011). In order to enhance the dispersibility of carbon nano-structures in
aqueous media, four common surfactants such as triton X-100, sodium dodecyl benzene
sulphonate (SDBS), sodium dodecyl sulphonate (SDS) and gum Arabic (GA) are
commonly applied. SDBS and triton X-100 have a benzene function, which produces the
powerful 𝛑–𝛑 interactions with the surface of carbon nanostructures. It is noteworthy that
SDBS has higher dispersibility than that of Triton X-100. This is attributed to the steric
hindrance tip chains in triton X-100, which resulted in low concentration of triton on the
carbon nanostructures surface (Islam et al., 2003). On the other hand, although GA can
provide better condition for dispersion of carbon nanostructures in comparison with
SDBS and triton X-100, but it significantly increases the viscosity of the suspension,
which may cause numerous problems including increase in pressure drop in thermal
equipment (Shanbedi et al., 2013).
2.10 Research gap
There are many theoretical and experimental works have been done on internal flow of
nanofluids under different geometries and flow regimes,
There are a few investigations considering annular pipes. Moreover, there is no
comprehensive study on nanofluids flow and their functionalizations in annular
pipes.
Covalent and non-covalent functionalization are two possible methods to prepare
carbon nanostructure-based nanofluids, but there is no investigation compare their
thermophysical and heat transfer performance.
Fouling and corrosion phenomena are major problems in heat exchangers
Univers
ity of
Mala
ya
34
CHAPTER 3: METHODOLOGY
2.11 Experimental apparatus
In the field of heat transfer, the heat transfer coefficient (h) plays a key role in the rate of
heat transfer and the performance of thermal equipment. The experimental setup for this
work is shown in Figure 3-1. It contains a flow loop, measuring instruments, a cooler, a
heating unit and a control unit. The flow loop includes a reservoir tank, a pump, a
magnetic flow meter, a differential pressure transmitter, and an annulus test section. The
nanofluids were pumped from a 7 Liter capacity stainless steel jacketed tank by a Cole-
Parmer magnetic drive pump at a flow rate of 0–8 liter/min, and the pump flow was
controlled by a Hoffman Muller inverter. The flow rate and the pressure loss were
measured by a magnetic flow meter and a differential pressure transmitter, respectively.
Univers
ity of
Mala
ya
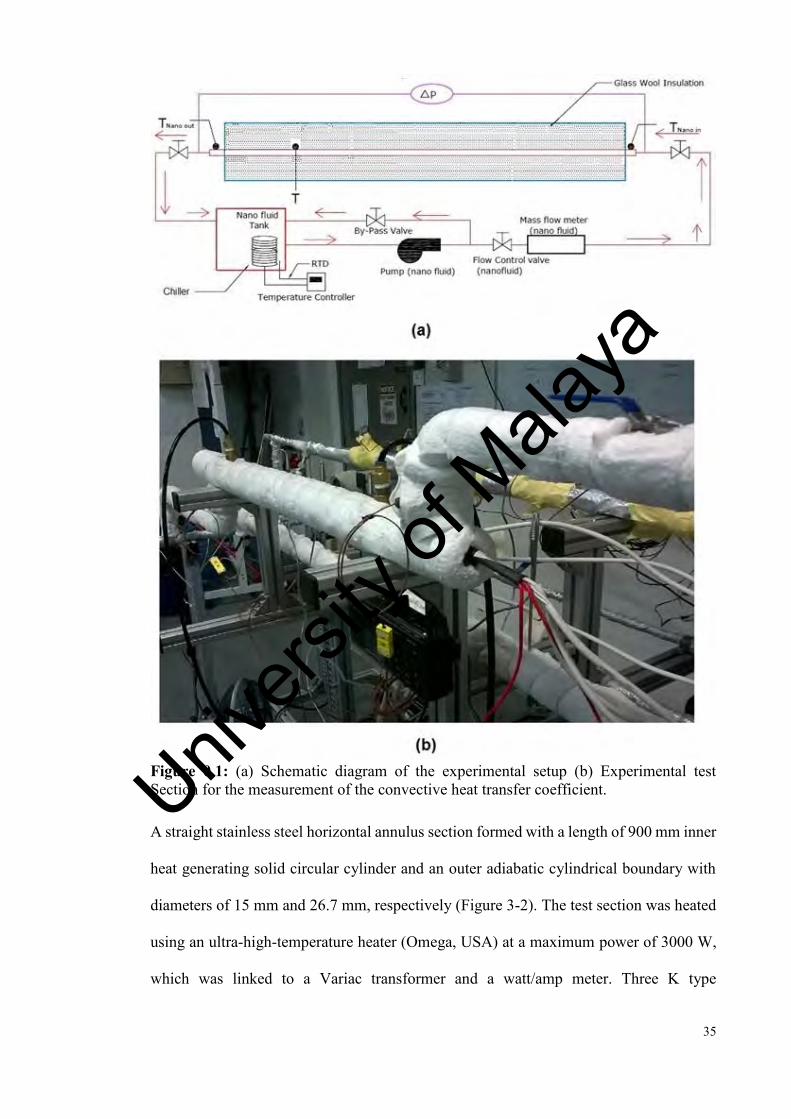
35
Figure 0.1: (a) Schematic diagram of the experimental setup (b) Experimental test Section for the measurement of the convective heat transfer coefficient.
A straight stainless steel horizontal annulus section formed with a length of 900 mm inner
heat generating solid circular cylinder and an outer adiabatic cylindrical boundary with
diameters of 15 mm and 26.7 mm, respectively (Figure 3-2). The test section was heated
using an ultra-high-temperature heater (Omega, USA) at a maximum power of 3000 W,
which was linked to a Variac transformer and a watt/amp meter. Three K type
Univers
ity of
Mala
ya

36
thermocouples (Omega, Singapore) were embedded at the outer surface of the inner heat
generating tube.
To measure the cold and hot nanofluid temperatures, two RTD (PT-100) sensors (Omega,
Singapore) were inserted to measure the bulk temperatures at the inlet and outlet of the
test section.
Figure 0.2: Geometrical configuration and boundary conditions of the present study.
Convective heat transfer coefficient is calculated from the measured temperature of
surface and bulk by using Eq. (3-1), which is the Newton’s cooling law:
w b
qhT T
(3-1)
Where, q, Tb and Tw, are heat flux, bulk temperature and wall temperature, respectively.
Heat flux can be found by using Eq. (3-2).
Univers
ity of
Mala
ya

37
VIqA
(3-2)
Where, V and I are representing the voltage and the current respectively. Internal surface
area of the tube is defined as A DL . Three input powers (VI) were considered for the
current study are 800, 1000 and 1200W. Also, the temperature profile between the
thermocouples and the outer surface of the inner circular pipe were calculated by the
Wilson plot method (Fernandez-Seara et al., 2007).
2.12 Numerical Study
The present study employs the mixture model by assuming that two phases are
interpenetrating, meaning there is a velocity vector field of the primary phase and also a
velocity vector field of the secondary phase, within any control volume each phase has
its own volume fraction, and the connection between phases is strong, so nanoparticles
closely follow the basefluid flow. The mixture method applications and its accuracy in
calculation for nanofluids has been showed by several researchers such as Lotfi et al.
(2010), Bianco et al. (2009), Akbarinia and Laur (2009); Mirmasoumi and Behzadmehr
and his research group (2007, 2008a and 2008b).
As an alternative for applying the governing equations for each phase, the continuity,
momentum and fluid energy equations for the mixture are employed. By looking at the
forced convection heat transfer in the turbulent region for incompressible and Newtonian
fluid, the governing equations can be presented by equations 3-3 to 3-5 (Shih, 1984):
a). Continuity equation:
. 0eff V (3-3)
Univers
ity of
Mala
ya
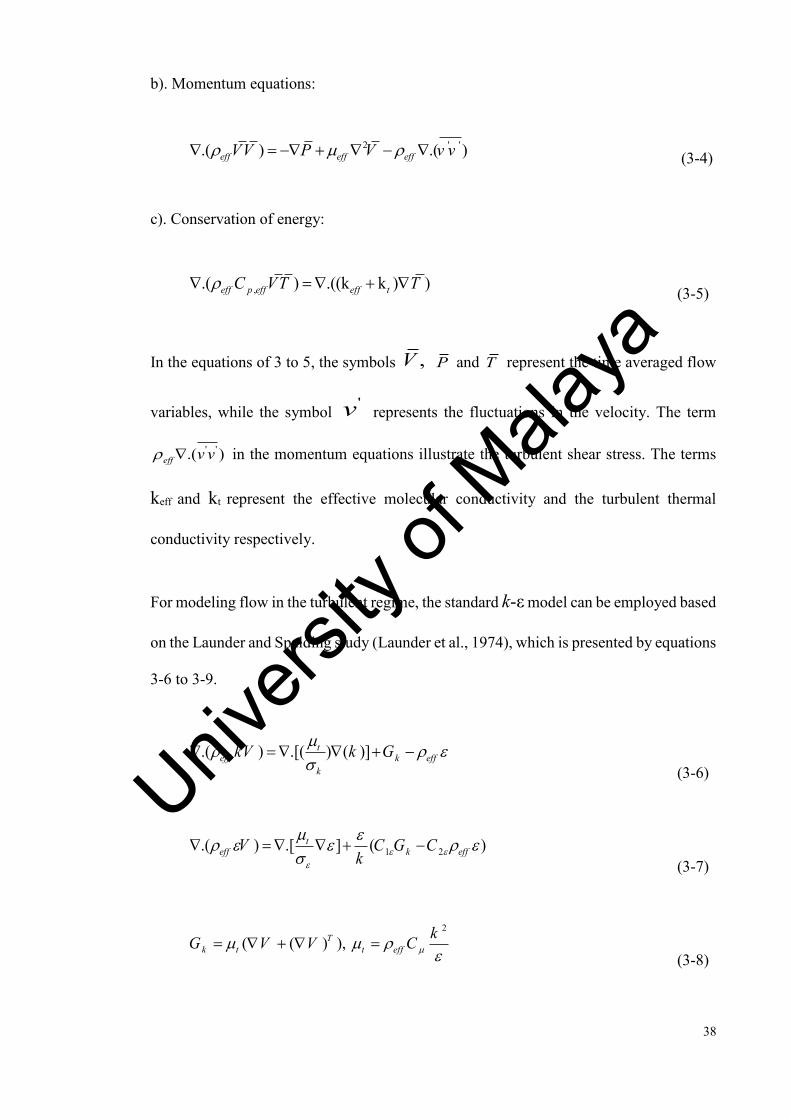
38
b). Momentum equations:
2 ' '.( ) .( )eff eff effVV P V v v (3-4)
c). Conservation of energy:
,.( ) .((k k ) )eff p eff eff tC VT T (3-5)
In the equations of 3 to 5, the symbols ,V P and T represent the time averaged flow
variables, while the symbol 'v represents the fluctuations in the velocity. The term
' '.( )eff v v in the momentum equations illustrate the turbulent shear stress. The terms
keff and kt represent the effective molecular conductivity and the turbulent thermal
conductivity respectively.
For modeling flow in the turbulent regime, the standard k-ε model can be employed based
on the Launder and Spalding study (Launder et al., 1974), which is presented by equations
3-6 to 3-9.
.( ) .[( ) ( )]teff k eff
k
kV k G
(3-6)
1 2.( ) .[ ] ( )teff k effV C G C
k
(3-7)
2
( ( ) ), Tk t t eff
kG V V C
(3-8)
Univers
ity of
Mala
ya
39
1 20.09, 1.00, 1.30, 1.44, 1.92kC C C (3-9)
where, µeff and µt are the effective viscosity of nanofluid and coefficient of viscosity in
turbulent regime, respectively.
2.12.1 Numerical implementation
Herein, the numerical method available in the commercial CFD package is ANSYS-
Fluent, V15 which has been used. Fluent uses a finite volume approach to convert the
governing partial differential equations into a system of discrete algebraic equations.
Based on the discretization methods, a second-order upwind scheme has been selected
for the momentum, turbulent kinetic energy and turbulent dissipation rate equations,
whereas the second order upwind for energy equation is selected. For two-phase
calculations, the phase momentum equations with the shared pressure are solved in a
coupled and segregated fashion. The phase coupled SIMPLE (PC-SIMPLE) algorithm is
employed for the pressure-velocity coupling. PC-SIMPLE is an extension of the SIMPLE
algorithm to multiphase flows. The scaled residuals for the velocity components and
energy are set equal to 10-8 and 10-9, respectively.
A structured non-uniform grid distribution has been used to discretize the computational
domain as shown in Figure 3-3. Finer grids have been used close to the inner wall where
the temperature gradients are high. Several different grid distributions have been tested
to ensure that the calculated results are grid independent. It is shown in Figure 3-4 that
increasing the grid numbers does not change significantly the Nusselt numbers.
Therefore, the total grid points and the elements employed in the whole tube are 147,358
and 395,977, respectively.
Univers
ity of
Mala
ya

40
Figure 0.3: Mesh configuration of the present study.
Figure 0.4: Comparison of Nusselt numbers versus Reynolds numbers for basefluid at three different grid distributions.
2.12.2 Accuracy
To evaluate the accuracy and reliability of the experimental and numerical systems before
conducting systematic experiments with nanofluids, pure water was tested as the working
fluid and compared with the standard empirical equations. Figure 3-5 panels (a) to (c)
show a comparison between the Nusselt numbers obtained experimentally and
numerically for distilled water and that calculated using theoretically validated equations
e.g. the Dittus-Boelter correlation, which is shown in Eq. 3-10.
0
5
10
15
20
25
30
35
40
2,000 2,500 3,000 3,500 4,000 4,500 5,000
Nu
sse
lt N
um
be
r
Re
147,358
311,510
930,205
Univers
ity of
Mala
ya
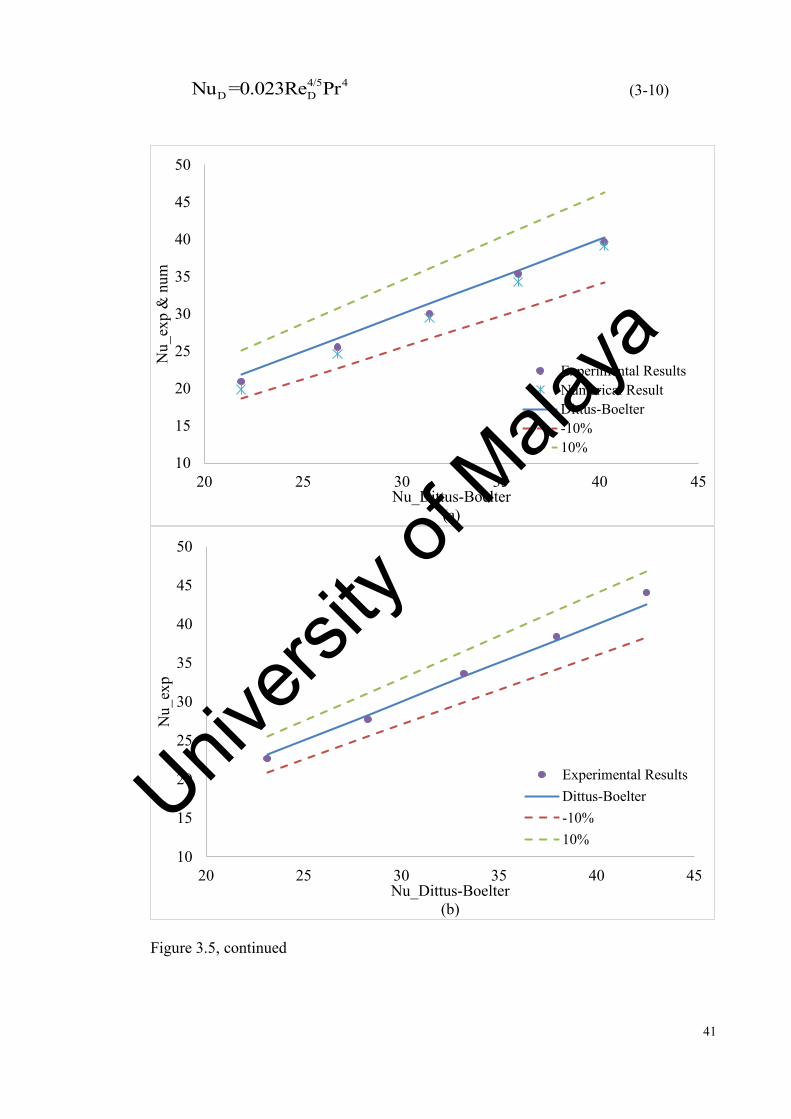
41
4/5 4D DNu =0.023Re Pr (3-10)
Figure 3.5, continued
10
15
20
25
30
35
40
45
50
20 25 30 35 40 45
Nu_
exp
& n
um
Nu_Dittus-Boelter(a)
Experimental ResultsNumerical ResultDittus-Boelter-10%10%
10
15
20
25
30
35
40
45
50
20 25 30 35 40 45
Nu_
exp
Nu_Dittus-Boelter(b)
Experimental ResultsDittus-Boelter-10%10%
Univers
ity of
Mala
ya
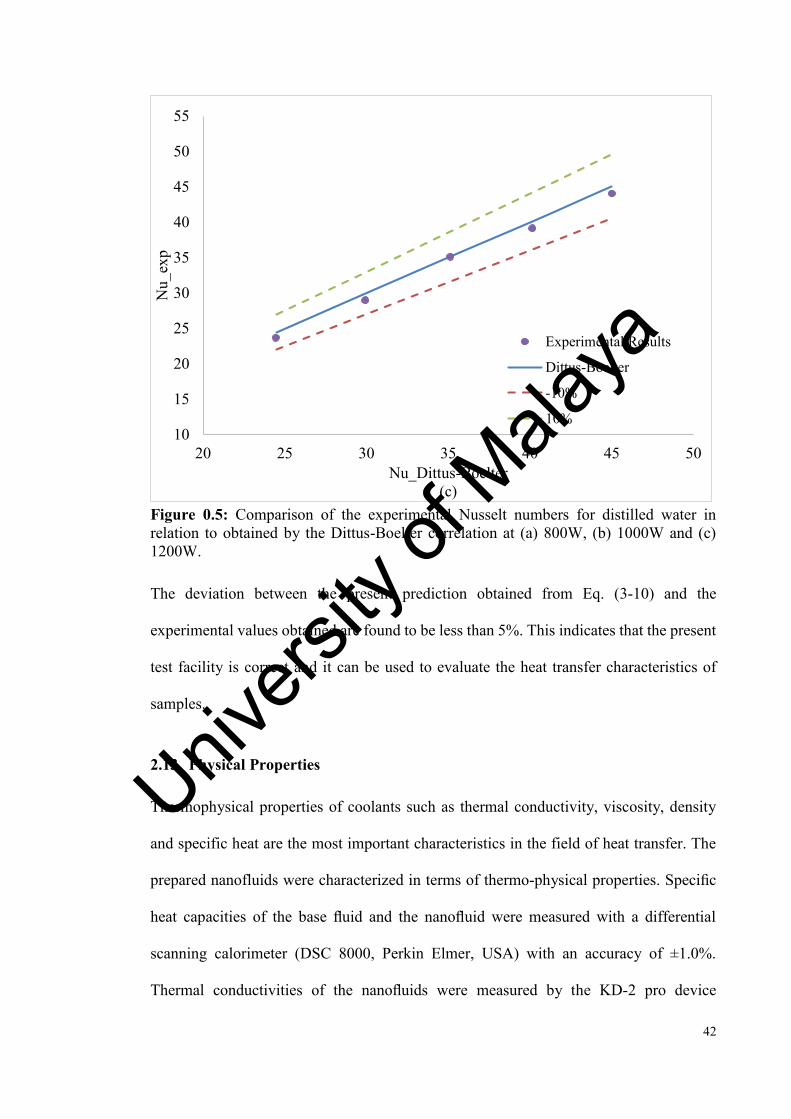
42
Figure 0.5: Comparison of the experimental Nusselt numbers for distilled water in relation to obtained by the Dittus-Boelter correlation at (a) 800W, (b) 1000W and (c) 1200W.
The deviation between the present prediction obtained from Eq. (3-10) and the
experimental values obtained are found to be less than 5%. This indicates that the present
test facility is correct and it can be used to evaluate the heat transfer characteristics of
samples.
2.13 Physical Properties
Thermophysical properties of coolants such as thermal conductivity, viscosity, density
and specific heat are the most important characteristics in the field of heat transfer. The
prepared nanofluids were characterized in terms of thermo-physical properties. Specific
heat capacities of the base fluid and the nanofluid were measured with a differential
scanning calorimeter (DSC 8000, Perkin Elmer, USA) with an accuracy of ±1.0%.
Thermal conductivities of the nanofluids were measured by the KD-2 pro device
10
15
20
25
30
35
40
45
50
55
20 25 30 35 40 45 50
Nu_
exp
Nu_Dittus-Boelter(c)
Experimental Results
Dittus-Boelter
-10%
10%
Univers
ity of
Mala
ya
43
(Decagon, USA) where KS-1 probe sensors were used having 6 cm and 1.3 mm length
and diameter, respectively. The accuracy of the measured thermal conductivity is 5%.To
ensure the equilibrium of the nanofluids, an average of 16 measurements were recorded
during 4 h for each temperature and weight concentrations. Calibration of instrument with
DI water was performed before starting of the measurements of nanofluids. The thermal
conductivity of DI water at 30 °C was measured and a value of 0.61 W/mK was found.
Also, the rheological properties of the samples were measured on a shear-rate controlled
Anton Paar rotational rheometer (model Physica MCR301, Anton Paar GmbH). The
densities of water and nanofluids were measured experimentally by Mettler Toledo DE-
40 density meter. The accuracy of the density measurement is 10g/cm3. For each
temperature and sample, the measurements were recorded 3 times.
Univers
ity of
Mala
ya

44
3 CHAPTER 4: THERMOPHYSICAL AND HEAT TRANSFER PERFORMANCE OF COVALENT AND NON-COVALENT
FUNCTIONALIZED NANOFLUIDS IN AN ANNULAR HEAT EXCHANGER
About 24% maximal reduction of thermal resistance in gold-water and titanium dioxide-
water nanofluids was presented by Buschmann and Franzke (2014). Shanbedi et al.
(2013) investigated the performance of two-phase closed thermosyphon (TPCT) and
multiwalled carbon nanotubes (MWCNT). They reported that presence of functionalized
MWCNT leads to 11% improvement in the thermal efficiency of the TPCT. The
researchers had reported that the thermo-physical properties such as the thermal
conductivity of the nanoparticles played the key role in their applications in heat
exchangers (Afshar et al., 2009; Garg et al., 2009; Mahian et al., 2013; Mehta et al., 2007).
Graphene nanoparticles (GNP) have higher thermal conductivity than other carbon
allotropes such as diamond, SWNT and MWNT (Azizi et al., 2013). As a result GNP has
attracted researcher’s attention in various scientific fields for manufacturing some items
like sensors and batteries. A majority of these usages, however, cannot completely be
realized due to poor interaction among GNP and other materials. Thus, in order to increase
the interactivity of carbon nanostructures, covalent (aminoacids) and non-covalent (GA)
functionalizations were proposed as the common solutions by the researchers (Amiri et
al., 2012). Covalent and non-covalent functionalizations are two promising approaches to
enhance the GNP dispersibility in aqueous/organic solvents. Non-covalent
functionalization of carbon nanostructures is performed by engaging several surfactants
(Amiri et al., 2012; Arzani et al., 2015; Brege et al., 2007; Silvera-Batista et al., 2011;
Suttipong et al., 2011). In order to enhance the dispersibility of carbon nano-structures in
aqueous media, four common surfactants such as triton X-100, sodium dodecyl benzene
sulphonate (SDBS), sodium dodecyl sulphonate (SDS) and gum Arabic (GA) are
Univers
ity of
Mala
ya
45
commonly applied. SDBS and triton X-100 have a benzene function, which produces the
powerful 𝛑–𝛑 interactions with the surface of carbon nanostructures. It is noteworthy that
SDBS has higher dispersibility than that of Triton X-100. This is attributed to the steric
hindrance tip chains in triton X-100, which resulted in low concentration of triton on the
carbon nanostructures surface (Islam et al., 2003). On the other hand, although GA can
provide better condition for dispersion of carbon nanostructures in comparison with
SDBS and triton X-100, but it significantly increases the viscosity of the suspension,
which may cause numerous problems including increase in pressure drop in thermal
equipment (Shanbedi et al., 2013).
The objective of the present chapter is abstracted in the synthesizing of the new kind of
fluids, such as graphene nanopletelets-based water nanofluids at different weight
concentrations, the experimental investigation of thermophysical properties of covalent
and non-covalent nanofluids (GNP-SDBS- and GNP-COOH-based water nanofluids) and
numerical simulation of annular heat exchanger in the presence of prepared nanofluids.
To realize this goal appropriately, two-phase has been employed. The comparison of
analytical and proposed result by simulation in two-phase method confirmed the validity
of work. Then, the nanofluids flow in a two dimensional annular pipe has been
investigated in different weight concentrations and ratio of heat flux. As a result, Nusselt
number profiles and friction factor are measured for both of the synthesized nanofluids.
3.1 Covalent functionalization of GNP
To provide non-covalent nanofluids (GNP-SDBS-based water nanofluid) of known
weight concentrations, the given amount of pristine GNP was first weighted, followed by
pouring a weight ratio of SDBS/pristine GNP at 0.5:1 into a vessel filled with the given
distillated water.
Univers
ity of
Mala
ya
46
Regarding covalent nanofluid (GNP-COOH-based water nanofluids), based on the
technique explained by Wang et al. (1999) with slight modification, carboxylation of
GNP was performed. In order to generate carboxylated GNP, 1gr pristine GNP with a
mixture of HNO3 and H2SO4 (1:3 volume ratio) were first sonicated for 0.5 h at room
temperature in a closed vessel. The GNP suspension was then poured into a Teflon
reaction vessel and placed in an industrial microwave (Milestone MicroSYNTH
programmable microwave system) with output power of 700 W and heated up to 90ºC
for 15 min. The resulting suspension was cooled at room temperature and then diluted
with 200mL deionized water to reduce the intensity of acids for filtration. The GNP
suspension was filtered through 45 µm polytetrafluoroethylene (PTFE) membrane, and
the filtrate was continually washed with the deionized water to remove any unreacted
acids. The functionalized sample was dried overnight at 40 ºC in a vacuum. Then, the
GNP-COOH produced after microwave phase were dispersed in the deionized water at
room temperature. Dispersed concentration of 0.1 wt% was easily obtained in water in
the presence of COOH groups on the surface of GNPs.
3.2 Thermophysical properties
3.2.1 Viscosity
The viscosities of GNP-SDBS- and GNP-COOH-based water nanofluids were
investigated at different temperatures and concentrations, as presented in Table 4-1.
Similar to other coolants, the rheological behaviour of GNP-SDBS and GNP-COOH-
based water nanofluids show two essential characteristics: (i) an enhancement in the
viscosity with increasing concentration, which means that the concentration of GNP
increases, the viscosity increases, and (ii) a decrease in viscosity with increasing
temperature, which is due to weakening of the intermolecular forces of the particles and
Univers
ity of
Mala
ya

47
fluid itself. It can be seen that the enhancement in the viscosity of both synthesized
nanofluids are not similar with increase in weight concentration, which obtained by higher
viscosity of SDBS. In addition, the results are in agreement with Ko et al. (2007) and
Aravind et al. (2011) where viscosity decreases with the increase of temperature.
Table 3-1: Dynamic viscosity of the GNP-SDBS and GNP-COOH-based water nanofluids as the functions of temperature and weight concentration at the shear rate of 140 s-1.
Temp. Water GNP-SDBS/Water GNP-COOH/Water 0.025% 0.05% 0.1% 0.025% 0.05% 0.1%
20 0.001002 0.0013 0.0014506 0.0015478 0.0010961 0.0011494 0.0012166 35 0.000761 0.00100985 0.0011418 0.0012785 0.0008407 0.0008639 0.0009264 50 0.000557 0.000789185 0.0009397 0.001118 0.0006293 0.0006757 0.0007313 65 0.000441 0.0006635 0.0008001 0.0009831 0.0004781 0.0005244 0.0006032 80 0.000353 0.000547265 0.000647 0.000835 0.000358 0.000406 0.000457
3.2.2 Density
Also, the densities of GNP-SDBS- and GNP-COOH-based water nanofluids are
investigated as the functions of temperature and weight concentration, which are shown
in Table 4-2. It could be seen that the density of GNP-SDBS- and GNP-COOH-based
water nanofluids decline by increasing the temperature, which can be related to the
enhancement in the volume of the liquid with enhancing the temperature. There is an
upward trend between the density of GNP-SDBS- and GNP-COOH-based water
nanofluids and their weight concentration.
Table 3-2: Densities of the GNP-SDBS- and GNP-COOH-based water nanofluids for different concentrations
Temp. Water GNP-SDBS/Water GNP-COOH/Water 0.025% 0.05% 0.1% 0.025% 0.05% 0.1%
20 ºC 0.99823 0.99888 0.99901 0.99991 0.99858 0.99896 0.99966 30 ºC 0.99532 0.99668 0.99783 0.99899 0.99668 0.99733 0.99835 40 ºC 0.99222 0.99355 0.99594 0.99732 0.99323 0.99451 0.99543 50 ºC 0.98411 0.98794 0.98906 0.99134 0.98955 0.99063 0.98878
Univers
ity of
Mala
ya
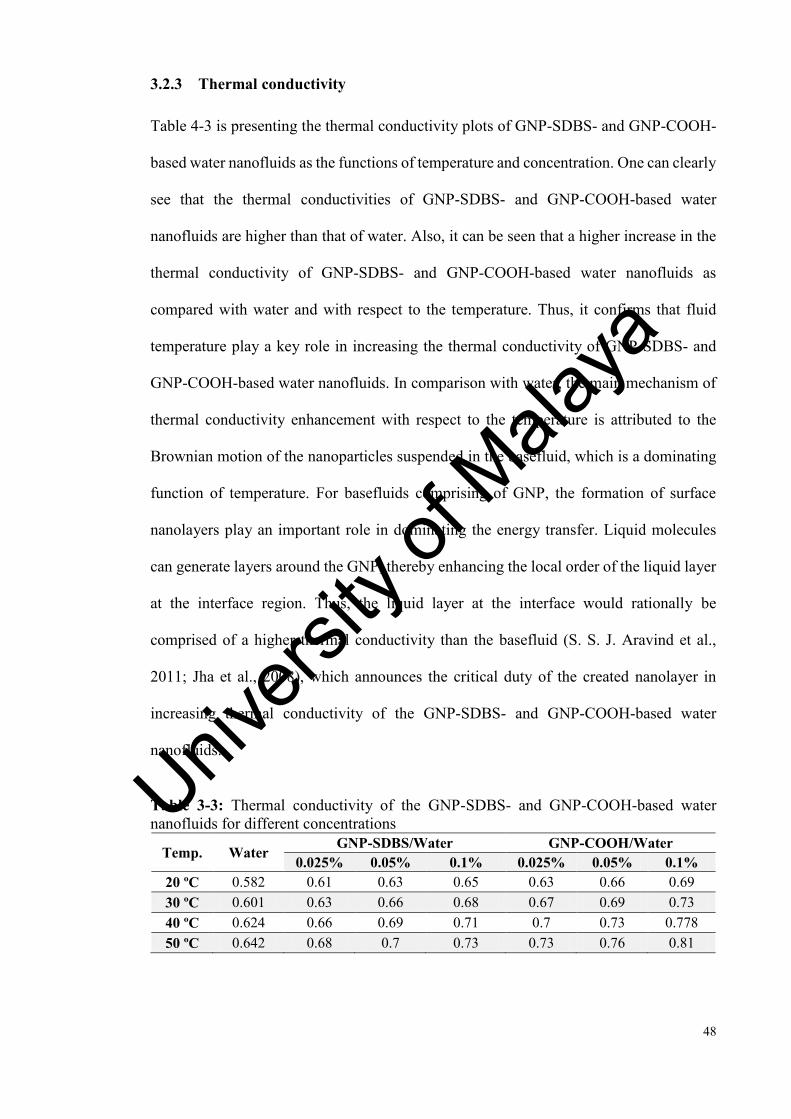
48
3.2.3 Thermal conductivity
Table 4-3 is presenting the thermal conductivity plots of GNP-SDBS- and GNP-COOH-
based water nanofluids as the functions of temperature and concentration. One can clearly
see that the thermal conductivities of GNP-SDBS- and GNP-COOH-based water
nanofluids are higher than that of water. Also, it can be seen that a higher increase in the
thermal conductivity of GNP-SDBS- and GNP-COOH-based water nanofluids as
compared with water and with respect to the temperature. Thus, it confirms that fluid
temperature play a key role in increasing the thermal conductivity of GNP-SDBS- and
GNP-COOH-based water nanofluids. In comparison with water, the main mechanism of
thermal conductivity enhancement with respect to the temperature is attributed to the
Brownian motion of the nanoparticles suspended in the basefluid, which is a dominating
function of temperature. For basefluids comprising of GNP, the formation of surface
nanolayers play an important role in dominating the energy transfer. Liquid molecules
can generate layers around the GNP, thereby enhancing the local order of the liquid layer
at the interface region. Thus, the liquid layer at the interface would rationally be
comprised of a higher thermal conductivity than the basefluid (S. S. J. Aravind et al.,
2011; Jha et al., 2008), which announces the critical duty of the created nanolayer in
increasing thermal conductivity of the GNP-SDBS- and GNP-COOH-based water
nanofluids.
Table 3-3: Thermal conductivity of the GNP-SDBS- and GNP-COOH-based water nanofluids for different concentrations
Temp. Water GNP-SDBS/Water GNP-COOH/Water
0.025% 0.05% 0.1% 0.025% 0.05% 0.1% 20 ºC 0.582 0.61 0.63 0.65 0.63 0.66 0.69 30 ºC 0.601 0.63 0.66 0.68 0.67 0.69 0.73 40 ºC 0.624 0.66 0.69 0.71 0.7 0.73 0.778 50 ºC 0.642 0.68 0.7 0.73 0.73 0.76 0.81
Univers
ity of
Mala
ya
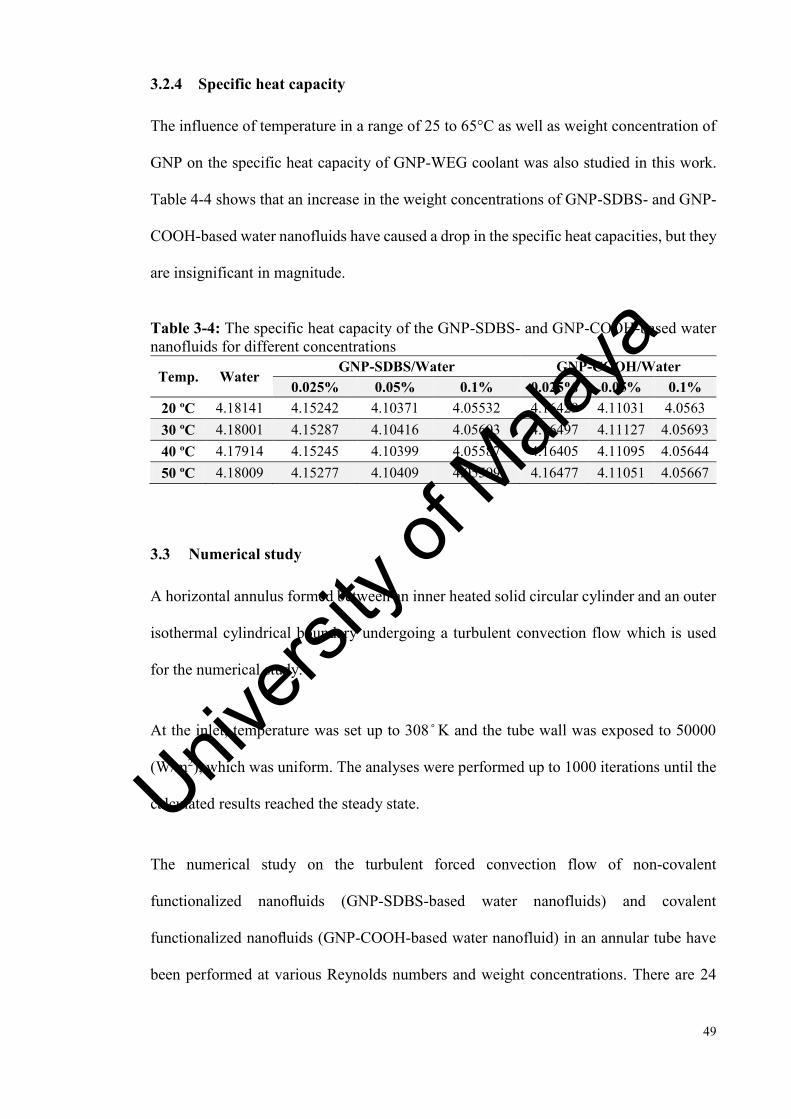
49
3.2.4 Specific heat capacity
The influence of temperature in a range of 25 to 65°C as well as weight concentration of
GNP on the specific heat capacity of GNP-WEG coolant was also studied in this work.
Table 4-4 shows that an increase in the weight concentrations of GNP-SDBS- and GNP-
COOH-based water nanofluids have caused a drop in the specific heat capacities, but they
are insignificant in magnitude.
Table 3-4: The specific heat capacity of the GNP-SDBS- and GNP-COOH-based water nanofluids for different concentrations
Temp. Water GNP-SDBS/Water GNP-COOH/Water
0.025% 0.05% 0.1% 0.025% 0.05% 0.1% 20 ºC 4.18141 4.15242 4.10371 4.05532 4.16429 4.11031 4.0563 30 ºC 4.18001 4.15287 4.10416 4.05603 4.16497 4.11127 4.05693 40 ºC 4.17914 4.15245 4.10399 4.05587 4.16405 4.11095 4.05644 50 ºC 4.18009 4.15277 4.10409 4.05599 4.16477 4.11051 4.05667
3.3 Numerical study
A horizontal annulus formed between an inner heated solid circular cylinder and an outer
isothermal cylindrical boundary undergoing a turbulent convection flow which is used
for the numerical study.
At the inlet, temperature was set up to 308 ̊ K and the tube wall was exposed to 50000
(W/m2), which was uniform. The analyses were performed up to 1000 iterations until the
calculated results reached the steady state.
The numerical study on the turbulent forced convection flow of non-covalent
functionalized nanofluids (GNP-SDBS-based water nanofluids) and covalent
functionalized nanofluids (GNP-COOH-based water nanofluid) in an annular tube have
been performed at various Reynolds numbers and weight concentrations. There are 24
Univers
ity of
Mala
ya
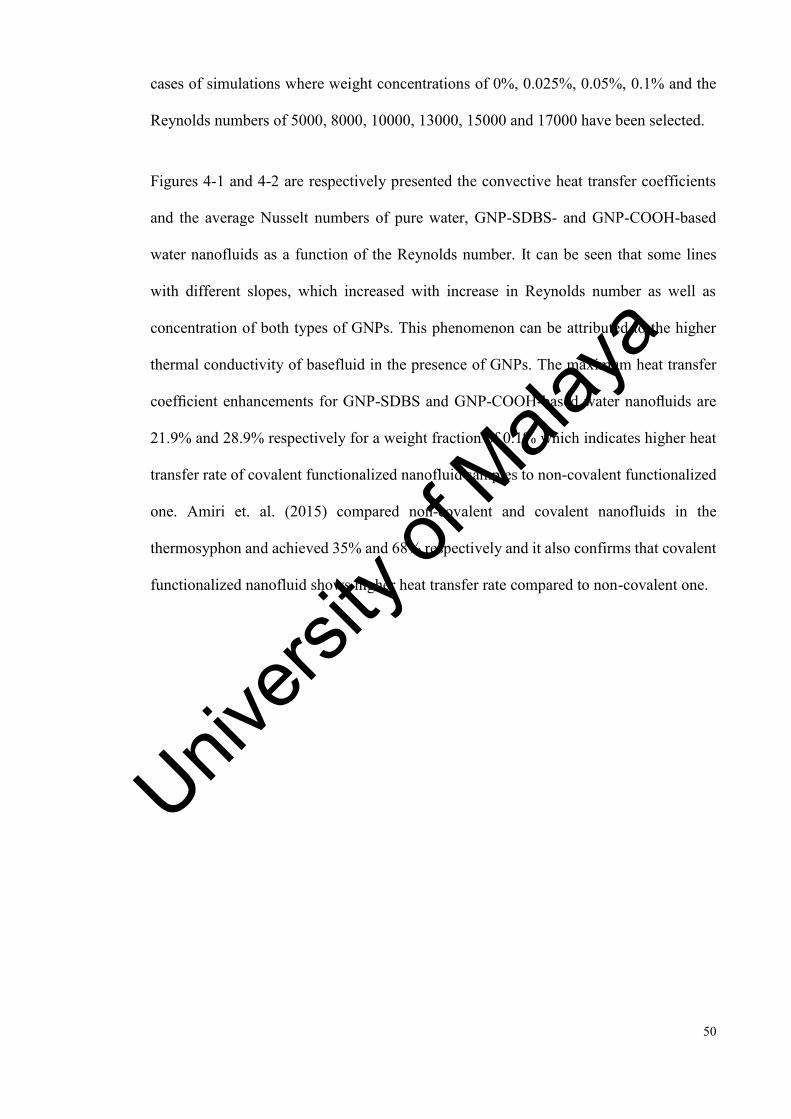
50
cases of simulations where weight concentrations of 0%, 0.025%, 0.05%, 0.1% and the
Reynolds numbers of 5000, 8000, 10000, 13000, 15000 and 17000 have been selected.
Figures 4-1 and 4-2 are respectively presented the convective heat transfer coefficients
and the average Nusselt numbers of pure water, GNP-SDBS- and GNP-COOH-based
water nanofluids as a function of the Reynolds number. It can be seen that some lines
with different slopes, which increased with increase in Reynolds number as well as
concentration of both types of GNPs. This phenomenon can be attributed to the higher
thermal conductivity of basefluid in the presence of GNPs. The maximum heat transfer
coefficient enhancements for GNP-SDBS and GNP-COOH-based water nanofluids are
21.9% and 28.9% respectively for a weight fraction of 0.1% which indicates higher heat
transfer rate of covalent functionalized nanofluid samples to non-covalent functionalized
one. Amiri et. al. (2015) compared non-covalent and covalent nanofluids in the
thermosyphon and achieved 35% and 68% respectively and it also confirms that covalent
functionalized nanofluid shows higher heat transfer rate compared to non-covalent one.
Univers
ity of
Mala
ya
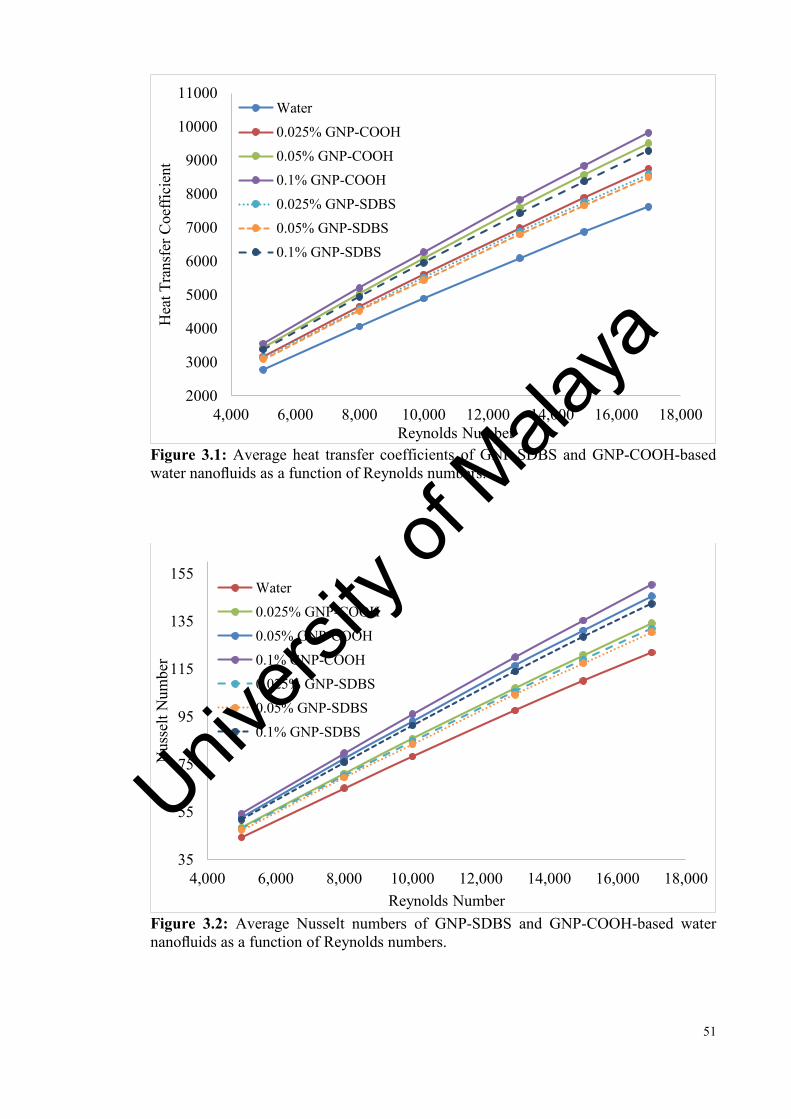
51
Figure 3.1: Average heat transfer coefficients of GNP-SDBS and GNP-COOH-based water nanofluids as a function of Reynolds numbers.
Figure 3.2: Average Nusselt numbers of GNP-SDBS and GNP-COOH-based water nanofluids as a function of Reynolds numbers.
2000
3000
4000
5000
6000
7000
8000
9000
10000
11000
4,000 6,000 8,000 10,000 12,000 14,000 16,000 18,000
Hea
t Tra
nsfe
r Coe
ffici
ent
Reynolds Number
Water0.025% GNP-COOH0.05% GNP-COOH0.1% GNP-COOH0.025% GNP-SDBS0.05% GNP-SDBS0.1% GNP-SDBS
35
55
75
95
115
135
155
4,000 6,000 8,000 10,000 12,000 14,000 16,000 18,000
Nus
selt
Num
ber
Reynolds Number
Water0.025% GNP-COOH0.05% GNP-COOH0.1% GNP-COOH0.025% GNP-SDBS0.05% GNP-SDBS0.1% GNP-SDBS
Univers
ity of
Mala
ya

52
The friction factor at different Reynolds number and weight concentrations of GNP-
SDBS and GNP-COOH are shown in Figure 4-3. It can be seen that the friction factor
decreases with increasing of the Reynolds number and/or volume flow rate at different
concentrations. The friction factor also increases as the concentration of GNP increases
in both the samples comprised of GNP-SDBS and GNP-COOH and the minimum value
of friction factor is indicated for the basefluid.
Figure 3.3: Friction factor of GNP-SDBS and GNP-COOH-based water nanofluids as a function of Reynolds numbers.
Also, as the Reynolds number increases, friction factor dependence on the concentration
is not changed, implying more similarity to the data obtained for water. It is obvious that
Brownian motion play an essential role in momentum transfer between the nanoparticles
and basefluid molecules at low Reynolds numbers, resulting in an enhancement in the
friction factor than that of the basefluid (Amiri et al., 2015; Amiri et al., 2012). However,
this mechanism cannot be dominant at high Reynolds numbers. In summary, the viscosity
of the working fluid has not played a key role in decreasing the friction factor at high
0.007
0.008
0.009
0.01
0.011
0.012
0.013
3000 5000 7000 9000 11000 13000 15000 17000 19000
Fric
tion
fact
or
Reynolds Number
Water0.025% GNP-SDBS0.05% GNP-SDBS0.1% GNP-SDBS0.025% GNP-COOH0.05% GNP-COOH0.1% GNP-COOH
Univers
ity of
Mala
ya

53
Reynolds numbers and the velocity can be considered as the most important parameter in
increasing the friction factor compared to the basefluid results.
Figure 3.4: Friction factor throughout the tube for different concentrations of GNP-SDBS and GNP-COOH.
Figure 3.5: Relation between pressure drops along the annulus for various Reynolds numbers and concentrations.
0
0.01
0.02
0.03
0.04
0.05
0.06
0.07
0 0.1 0.2 0.3 0.4 0.5
Fric
tion
fact
or
Pipe Length (m)
Water
0.025% GNP-SDBS
0.05% GNP-SDBS
0.1% GNP-SDBS
0.025% GNP-COOH
0.05% GNP-COOH
0.1% GNP-COOH
0
500
1000
1500
2000
2500
4,000 6,000 8,000 10,000 12,000 14,000 16,000 18,000
Pres
sure
dro
p [P
a]
Re
Water
0.025% GNP-SDBS
0.05% GNP-SDBS
0.1% GNP-SDBS
0.025% GNP-COOH
0.05% GNP-COOH
0.1% GNP-COOH
Univers
ity of
Mala
ya
54
The friction factor at different Reynolds number and weight concentrations of GNP-
SDBS and GNP-COOH as function of axial positions are shown in Figure 4-4. The extent
of friction factor remains same throughout the tube.
Figure 4-5 shows the measured pressure drop at different Reynolds numbers and
concentrations of nanofluids. Figure 4-5 predicts that with the increase of the inlet velocity
and concentration of nanofluids the pressure drop increases. The pressure drops for GNP-
COOH/water nanofluids at various concentrations are not quit close to that for water. This
observation confirms that the effect of GNP concentration on the viscosity of nanofluids
and consequently on the pressure drop is significant, especially in the presence of GNP-
SDBS. On the other hand, as the concentration of GNP-SDBS increases, the variation of
pressure drop with the Reynolds number shows sharper slope. Thus the GNP-SDBS/water
nanofluid at the mass fraction of 0.1% and Reynolds number of 17,000 shows the
maximum pressure drop. Expectedly, the viscosity curves and the pressure drop curves
have represented similar trends in the presence of covalent and non-covalent samples,
which could have been caused from the direct connection between the viscosity and the
pressure drop.
Univers
ity of
Mala
ya

55
4 CHAPTER 5: INVESTIGATION OF THERMOPHYSICAL PROPERTIES AND HEAT TRANSFER RATE OF COVALENTLY
FUNCTIONALIZED MWCNT IN AN ANNULAR HEAT EXCHANGER
Among the different nanostructures applied for creating nanofluids, carbon nanotubes
(CNT) have enhanced the thermal efficiency of different setups due to promising thermal
properties (Amiri et al., 2012; Shanbedi et al., 2013). The results reported by Azizi et al.
(2013), Xue et al. (2006) and Liu et al. (2010) shown that nanofluids including
nanoparticles with higher heat transfer coefficient like graphene and CNT can be more
appropriate for heat transfer applications.
Azizi et al. (2013) studied the influence of graphene-water nanofluid on the heat transfer
performance and resistance of two-phase closed thermosyphon (TPCT). They reported
that increasing the volume fraction leads to the heat transfer enhancement of the TPCT.
On the other hand, increase of the input power and nanoparticles’ concentrations have
caused a decrease in the thermal resistance of the TPCT. In two investigations, Shanbedi
et al. (2013) considered influence of the covalent and noncovalent functionalization on
the performance of TPCT. They concluded that functionalized carbon nanotubes with
ethylene diamine had better heat transfer coefficient than the non-covalent functional
groups. They also presented that covalent functionalization of CNT improved the thermal
efficiency of the TPCT more than those functionalized by gum Arabic as a non-covalent
group. In the field of functionalization, decreasing in the heat transfer efficiency was
attributed to the non-covalent groups. Non-covalent functional groups cover around the
carbon nanotubes surface and reduce the effective area which leads to less TPCT
efficiency. Amiri et al. (2012) reported that the nature of covalent functional groups may
also affect the thermal performance.
Univers
ity of
Mala
ya
56
The objectives of the present chapter are abstracted in introducing a promising, potentially
industrially scalable, cost-effective method for preparing highly-dispersive carbon
nanotubes in aqueous media, and investigation of the thermophysical properties of the
synthesized samples at different weight fractions. Accordingly, the experimental study on
the convective heat transfer in an annular heat exchanger was performed. The obtained
results were validated with the analytical results and confirmed the authenticity of the test
rig. Then, the nanofluids flow through annular pipe was investigated for different weight
fractions and Reynolds numbers. Here, the results of heat transfer coefficient, Nusselt
number profiles, pressure drop and the pumping power were are evaluated for the
synthesized nanofluids.
4.1 Functionalization procedure
To reach suitable colloidal suspension with multi-walled carbon nanotubes (MWCNT),
covalent functionalization could be selected as one of the best methods. Therefore,
aspartic acid as a hydrophilic group was selected to decorate on the surface of MWCNT.
To reach highly-dispersive MWCNT in water, a pre-functionalization with carboxyl
groups was done to make a bridge for attaching Asp molecules. So, pristine MWCNT
was stirred with a mixture of H2SO4-HNO3 acids in a volume ratio of 1:1 for 24 h at 60°C.
After filtering and simultaneously rinsed with deionized water, the filtrate cake was dried.
Then, 1gr oxidized MWCNT and 1gr aspartic acid in 200ml DMF and 10ml toluene was
kept under ultrasonic for 2 hours and then stirred for 12 hours. To increase reaction rate,
ZrCl4 (5% mol) as catalyst was used for doing direct amidation (Allen et al., 2012).
Eventually, the resulting suspension was filtered, rinsed with deionized water, DMF and
THF to delete non-reacted aspartic acid and dried in the oven for 48h at 50°C.
Univers
ity of
Mala
ya

57
4.2 Preparation of nanofluid
Anton Paar rheometer (Physica MCR 301, Anton Paar GmbH) was employed to
investigate the rheological behavior of the suspensions. The experiment was performed
three times in order to approve the accuracy of the data measured by rheometer. With a
KD2 thermal properties analyzer based on the transient hot-wire method, thermal
conductivity of the suspension was measured. For synthesizing MWCNT-Asp/water
nanofluids, the MWCNT-Asp was first dispersed in the given amount of water for 1 hr
by a probe ultrasonic with the power of 600 W and 20 kHz (Sonics & Materials, Inc.,
USA). Next, the abovementioned MWCNT-Asp/water nanofluids were prepared for the
measurements of their thermophysical properties.
4.3 Dispersibility
Figure 5-1 shows the quantitative analysis of the dispersion state and the long-term
stability of the MWCNT-Asp/water coolants in UV–Vis spectroscopy for different weight
fractions. Here the absorbance at the wavelength of 264 nm was measured during 30 days
for different weight concentrations. It can be seen that the relative concentration of
MWCNT-Asp decrease insignificantly over time. As a result, the maximum sediment of
about 20% was obtained for highest weight concentration of 0.1, which confirmed the
suitable dispersibility of MWCNT-Asp in water.
Univers
ity of
Mala
ya
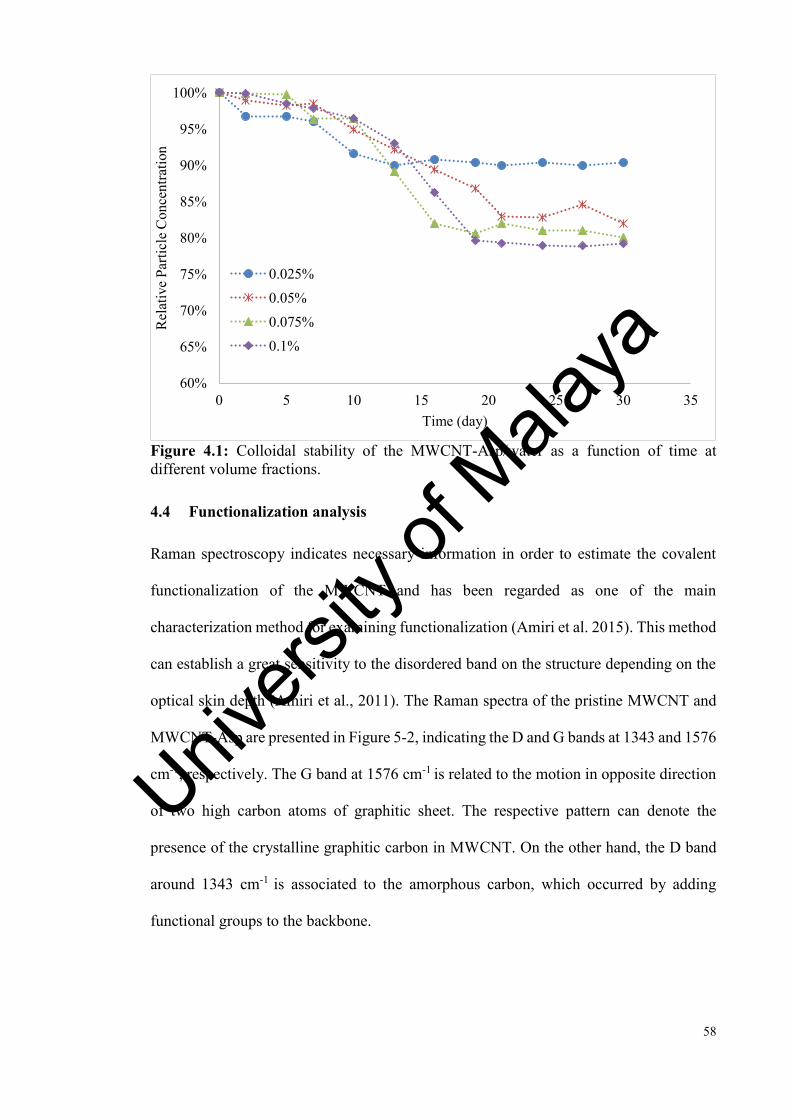
58
Figure 4.1: Colloidal stability of the MWCNT-Asp/water as a function of time at different volume fractions.
4.4 Functionalization analysis
Raman spectroscopy indicates necessary information in order to estimate the covalent
functionalization of the MWCNT and has been regarded as one of the main
characterization method for examining functionalization (Amiri et al. 2015). This method
can establish a great sensitivity to the disordered band on the structure depending on the
optical skin depth (Amiri et al., 2011). The Raman spectra of the pristine MWCNT and
MWCNT-Asp are presented in Figure 5-2, indicating the D and G bands at 1343 and 1576
cm-1, respectively. The G band at 1576 cm-1 is related to the motion in opposite direction
of two high carbon atoms of graphitic sheet. The respective pattern can denote the
presence of the crystalline graphitic carbon in MWCNT. On the other hand, the D band
around 1343 cm-1 is associated to the amorphous carbon, which occurred by adding
functional groups to the backbone.
60%
65%
70%
75%
80%
85%
90%
95%
100%
0 5 10 15 20 25 30 35
Rel
ativ
e Pa
rticl
e C
once
ntra
tion
Time (day)
0.025%0.05%0.075%0.1%
Univers
ity of
Mala
ya
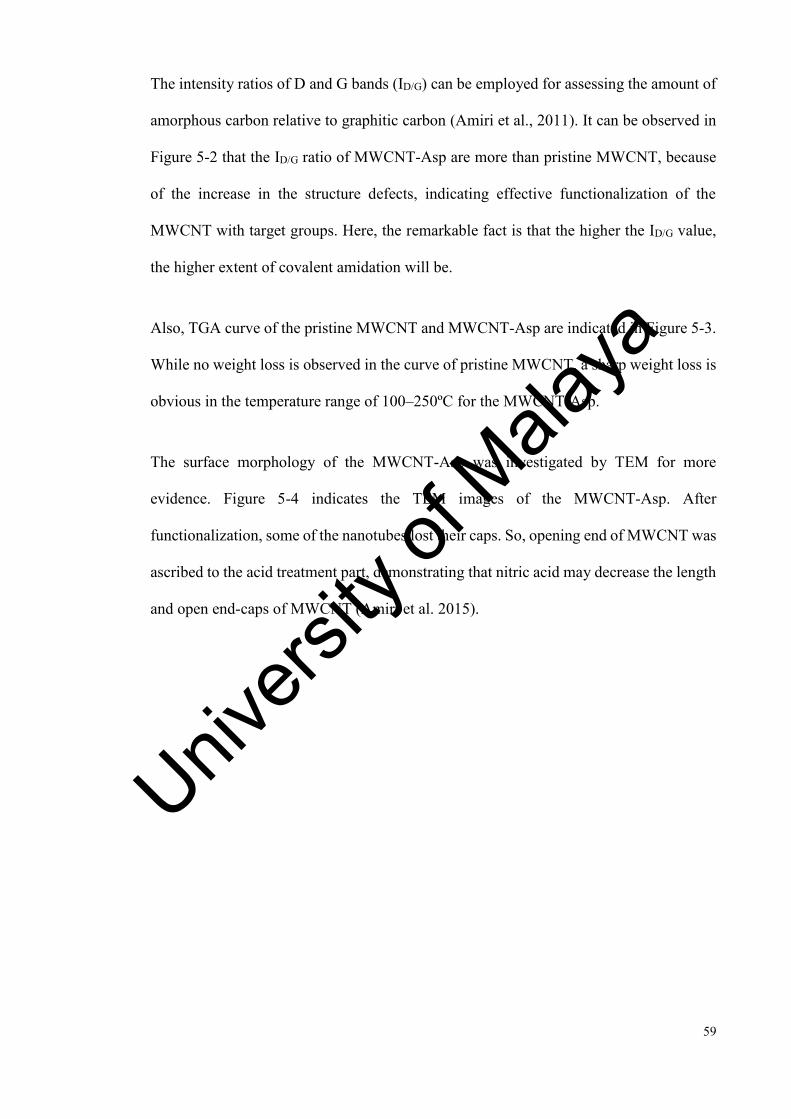
59
The intensity ratios of D and G bands (ID/G) can be employed for assessing the amount of
amorphous carbon relative to graphitic carbon (Amiri et al., 2011). It can be observed in
Figure 5-2 that the ID/G ratio of MWCNT-Asp are more than pristine MWCNT, because
of the increase in the structure defects, indicating effective functionalization of the
MWCNT with target groups. Here, the remarkable fact is that the higher the ID/G value,
the higher extent of covalent amidation will be.
Also, TGA curve of the pristine MWCNT and MWCNT-Asp are indicated in Figure 5-3.
While no weight loss is observed in the curve of pristine MWCNT, a sharp weight loss is
obvious in the temperature range of 100–250ºC for the MWCNT-Asp.
The surface morphology of the MWCNT-Asp was investigated by TEM for more
evidence. Figure 5-4 indicates the TEM images of the MWCNT-Asp. After
functionalization, some of the nanotubes lost their caps. So, opening end of MWCNT was
ascribed to the acid treatment part, demonstrating that nitric acid may decrease the length
and open end-caps of MWCNT (Amiri et al. 2015).
Univers
ity of
Mala
ya
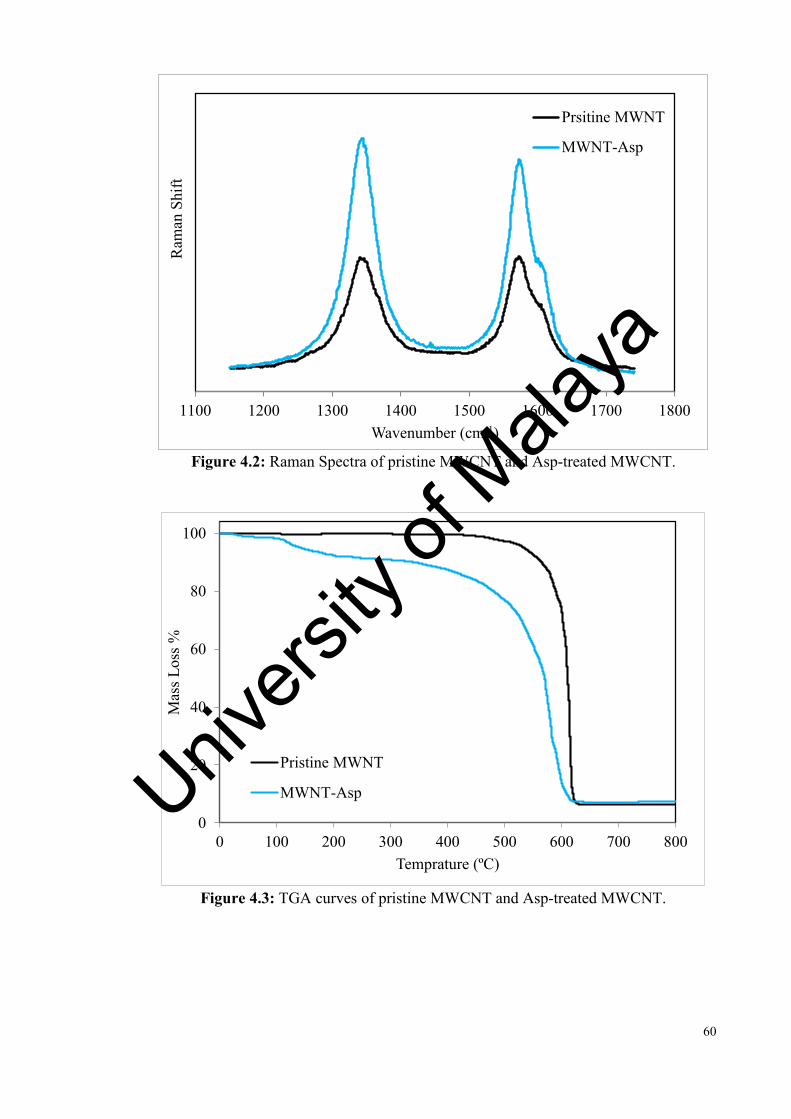
60
Figure 4.2: Raman Spectra of pristine MWCNT and Asp-treated MWCNT.
Figure 4.3: TGA curves of pristine MWCNT and Asp-treated MWCNT.
1100 1200 1300 1400 1500 1600 1700 1800
Ram
an S
hift
Wavenumber (cm-1)
Prsitine MWNT
MWNT-Asp
0
20
40
60
80
100
0 100 200 300 400 500 600 700 800
Mas
s Los
s %
Temprature (ºC)
Pristine MWNT
MWNT-AspUnivers
ity of
Mala
ya

61
Figure 4.4: TEM images of MWCNT-Asp.
4.5 Physical Properties
Thermophysical properties of coolants such as thermal conductivity, viscosity and density
are the most important characteristics in the field of heat transfer. Experimental results
about thermophysical properties of MWCNT-Asp/water was compared with pure water,
which are shown in Figures 5-5 to 5-7. Figure 5-5, 5-6 and 5-7 show the experimental
data of the density, viscosity and thermal conductivity at different temperatures of 20, 40,
60 and 80°C, respectively. Density is one of the thermophysical properties of fluids that
can affect the convective heat transfer coefficient. Experimentally measured densities of
Univers
ity of
Mala
ya
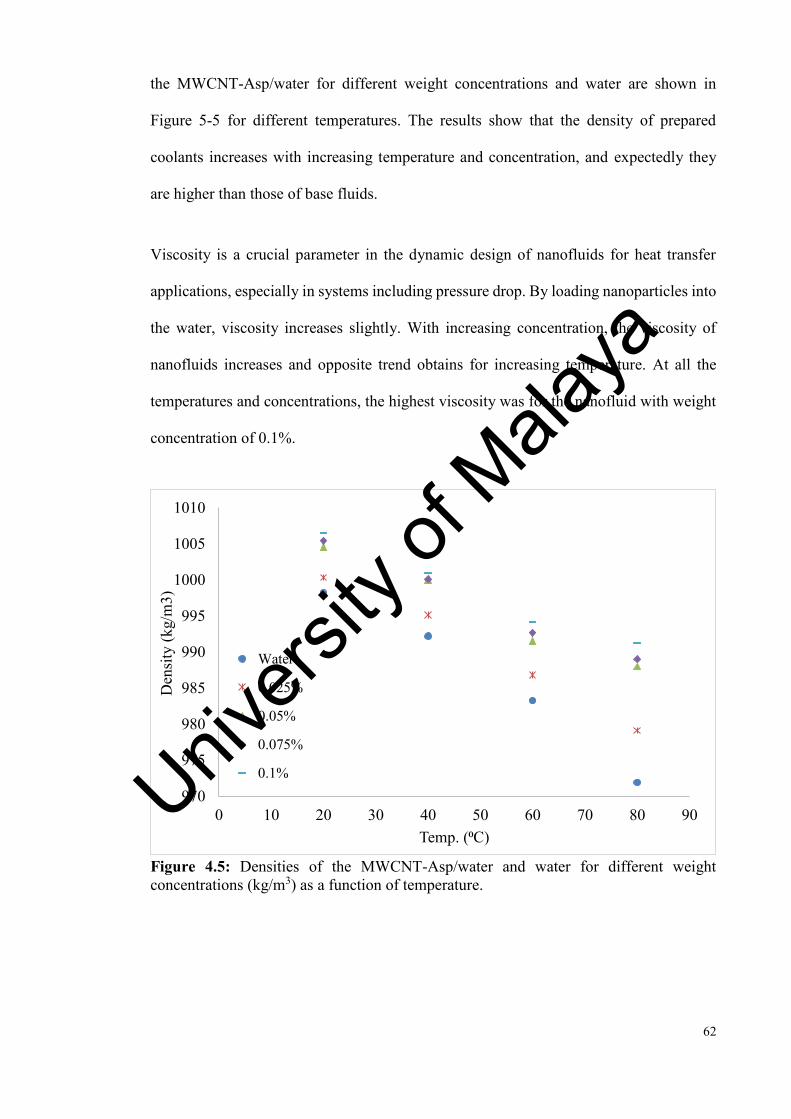
62
the MWCNT-Asp/water for different weight concentrations and water are shown in
Figure 5-5 for different temperatures. The results show that the density of prepared
coolants increases with increasing temperature and concentration, and expectedly they
are higher than those of base fluids.
Viscosity is a crucial parameter in the dynamic design of nanofluids for heat transfer
applications, especially in systems including pressure drop. By loading nanoparticles into
the water, viscosity increases slightly. With increasing concentration, the viscosity of
nanofluids increases and opposite trend obtains for increasing temperature. At all the
temperatures and concentrations, the highest viscosity was for the nanofluid with weight
concentration of 0.1%.
Figure 4.5: Densities of the MWCNT-Asp/water and water for different weight concentrations (kg/m3) as a function of temperature.
970
975
980
985
990
995
1000
1005
1010
0 10 20 30 40 50 60 70 80 90
Den
sity
(kg/
m3)
Temp. (⁰C)
Water
0.025%
0.05%
0.075%
0.1%Univers
ity of
Mala
ya
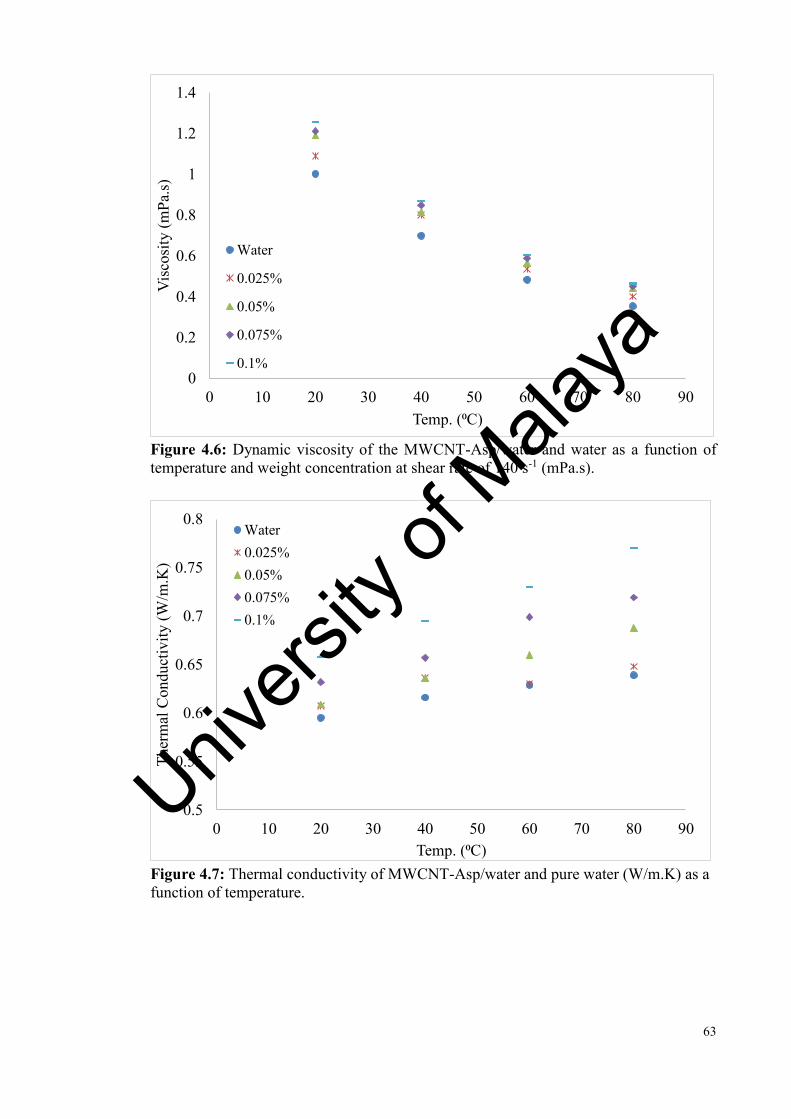
63
Figure 4.6: Dynamic viscosity of the MWCNT-Asp/water and water as a function of temperature and weight concentration at shear rate of 140 s-1 (mPa.s).
Figure 4.7: Thermal conductivity of MWCNT-Asp/water and pure water (W/m.K) as a function of temperature.
0
0.2
0.4
0.6
0.8
1
1.2
1.4
0 10 20 30 40 50 60 70 80 90
Vis
cosi
ty (m
Pa.s)
Temp. (⁰C)
Water
0.025%
0.05%
0.075%
0.1%
0.5
0.55
0.6
0.65
0.7
0.75
0.8
0 10 20 30 40 50 60 70 80 90
Ther
mal
Con
duct
ivity
(W/m
.K)
Temp. (⁰C)
Water0.025%0.05%0.075%0.1%
Univers
ity of
Mala
ya

64
Thermal conductivity of working fluid is one of the key parameters in evaluating heat
transfer rate of heat exchangers. It can be seen that the thermal conductivities of
nanofluids were experimentally obtained and shown in Figure 5-7. The results show that
the thermal conductivities of the nanofluids improve with increasing MWCNT-Asp and
is definitely higher than pure water. Also, as the temperature increases, the thermal
conductivity increases, which is more significant at higher concentration.
4.6 Thermal analysis
MWCNT-Asp/water was tested for the Reynolds numbers range of 2440± 20 to 6800±
20, four weight concentrations (0.025, 0.05, 0.075 and 0.1%) and three input powers to
the test section (800, 1000 and 1200W). Figure 5-8(a-c) shows the heat transfer
coefficient plots of MWCNT-ASP as a function of Reynolds number and weight
concentrations. In addition, the comparison between the measurements and the predicted
results are illustrated in Figure 5-8(a) and 5-9(a). The experimental results were in a good
agreement with the numerical with a deviation percentage of 4.6%. It is realized that the
enhancement of heat transfer coefficient of MWCNT remarkably exceeded those of the
thermal conductivity improvements for different weight concentrations. The maximum
heat transfer coefficient at concentration of 0.1%, Reynolds number of 6,807 and input
power of 1200W is 22.4%. According to Aravind et al. (2013 and 2011), applying a
simple analogy that the convective heat transfer is proportional to k/δt, where δt is the
boundary thickness of thermal boundary layer. Therefore, increasing k and/or decreasing
δt lead to an increase in the heat transfer coefficient. Noticeably, as reported by some
researchers (Aravind et al., 2013; Ding et al., 2006), carbon nanostructures such as
graphene and CNTs decrease thickness of thermal boundary layer. As a result heat
transfer coefficient improves significantly compared to that of thermal conductivity.
Univers
ity of
Mala
ya

65
Figure 5.8, continued
0
500
1000
1500
2000
2500
3000
2,000 2,500 3,000 3,500 4,000 4,500 5,000
Hea
t tra
nsfe
r Coe
ffici
ent
Reynolds Number(a)
Exp_Water Exp_0.025%Exp_0.05% Exp_0.075%Exp_0.1% Num_WaterNum_0.025% Num_0.05%Num_0.075% Num_0.1%
0
500
1000
1500
2000
2500
3000
2,500 3,000 3,500 4,000 4,500 5,000 5,500 6,000
Hea
t tra
nsfe
r Coe
ffici
ent
Reynolds Number(b)
Exp_Water
Exp_0.025%
Exp_0.05%
Exp_0.075%
Exp_0.1%Univers
ity of
Mala
ya

66
Figure 4.8: Comparison of the heat transfer coefficient obtained for distilled water and MWCNT-Asp/water nanofluid for different weight concentrations at (a) 800W, (b) 1000W and (c) 1200W.
Figures 5-9(a-c) show the average Nusselt numbers of MWCNT-Asp/water nanofluids
for various weight concentrations and Reynolds numbers. To evaluate the ratio of
convective to conductive heat transfer of MWCNT-Asp/water coolants, Nusselt number
plots have been employed. The results suggest that the Nusselt number increases
remarkably in the presence of treated samples in comparison to the applied basefluid. The
MWCNT-Asp loading in basefluid improves the thermal conductivity of basefluid, which
leads to the lower temperature difference between the bulk fluid and the tube wall,
indicating higher Nusselt numbers and subsequently heat transfer rate. Figure 5-10
illustrates heat transfer performance of the MWCNT-Asp/water coolant at different heat
fluxes for a constant weight concentration of 0.1%, where Nusselt number increases with
the enhancement of Reynolds number. It could also be noted that the Nusselt number
increases with the increase of heat fluxes to the test section.
0
500
1000
1500
2000
2500
3000
3500
2,500 3,500 4,500 5,500 6,500
Hea
t tra
nsfe
r Coe
ffici
ent
Reynolds Number(c)
Exp_Water
Exp_0.025%
Exp_0.05%
Exp_0.075%
Exp_0.1%
Univers
ity of
Mala
ya
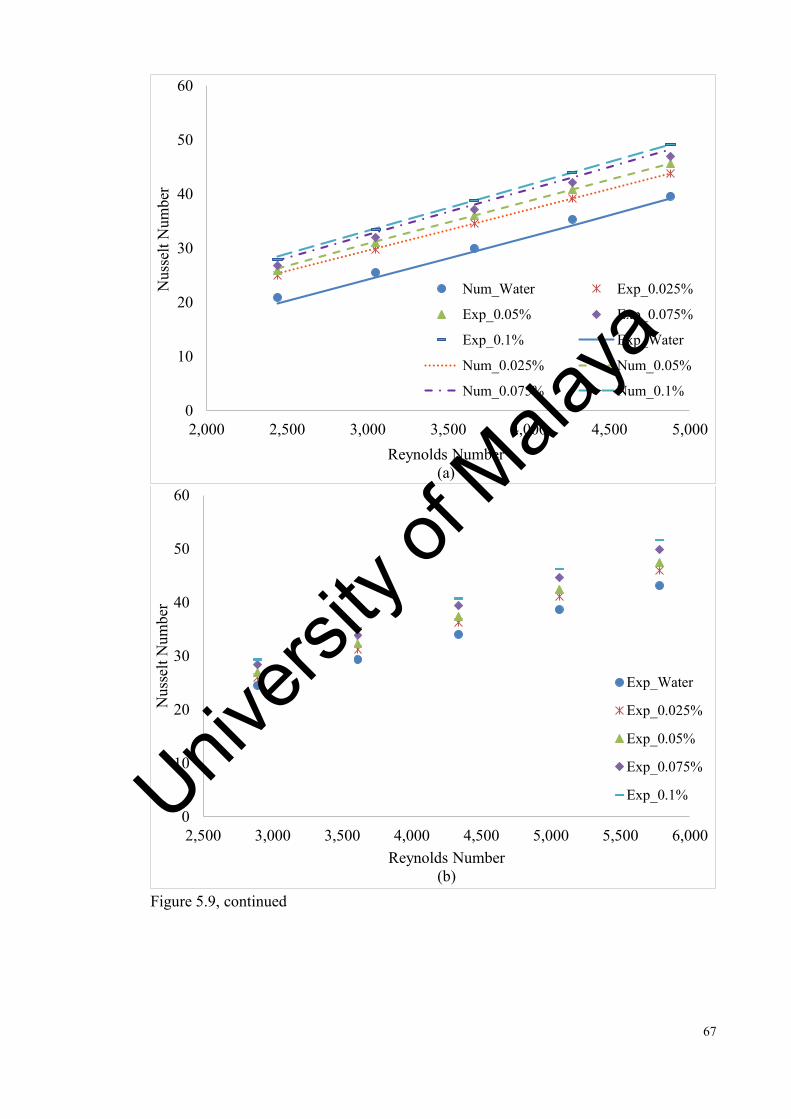
67
Figure 5.9, continued
0
10
20
30
40
50
60
2,000 2,500 3,000 3,500 4,000 4,500 5,000
Nus
selt
Num
ber
Reynolds Number(a)
Num_Water Exp_0.025%
Exp_0.05% Exp_0.075%
Exp_0.1% Exp_Water
Num_0.025% Num_0.05%
Num_0.075% Num_0.1%
0
10
20
30
40
50
60
2,500 3,000 3,500 4,000 4,500 5,000 5,500 6,000
Nus
selt
Num
ber
Reynolds Number(b)
Exp_Water
Exp_0.025%
Exp_0.05%
Exp_0.075%
Exp_0.1%Univers
ity of
Mala
ya

68
Figure 4.9: Comparison of Nusselt numbers obtained for distilled water and MWCNT-Asp/water for different weight concentrations at (a) 800W, (b) 1000W and (c) 1200W.
Figure 4.10: Comparison of Nusselt numbers of MWCNT-Asp/water for different heat fluxes at 0.1% weight concentration.
0
10
20
30
40
50
60
2,500 3,000 3,500 4,000 4,500 5,000 5,500 6,000 6,500 7,000
Nus
selt
Num
ber
Reynolds Number(c)
Exp_Water
Exp_0.025%
Exp_0.05%
Exp_0.075%
Exp_0.1%
0
10
20
30
40
50
60
2000 2500 3000 3500 4000 4500 5000 5500
Nus
selt
Num
ber
Reynolds Number
800 (W)
1000 (W)
1200 (W)
Univers
ity of
Mala
ya

69
4.7 Pressure drop
The experimental and numerical results for the pressure drop of the fluid flow between
the inlet and outlet of the test section as a function of Reynolds number for various weight
concentrations are shown in Figure 5-11. The maximum deviation between the present
prediction and the experimental values obtained are found to be less than 15%. It can be
seen that the pressure drop of MWCNT-Asp/water increases continuously with increasing
of the MWCNT-Asp concentration and Reynolds number, in which the dependence of
the pressure drop on Reynolds number is almost linear. According to the results, the
working fluid showed a pressure drop of average, 38% greater than that of the base fluid,
which emphasizes that the viscosity of these samples resulted an increase of 31%
compared with that of distilled water. The highest increase in pressure drop of MWCNT-
Asp/water is obtained at the weight concentration of 0.1%, Reynolds number of 4880 and
input power of 800W. As compared to the pure water, the maximum increase in the
pressure drop in the presence of MWCNT-Asp is about 62%. Thus the higher weight
concentration of MWCNT-Asp in the base fluids means the higher viscosity is implying
more pressure drop.
In order to evaluate influence of temperature on pressure drop of MWCNT-Asp/water
coolants, experiments were performed for different input powers (800, 1000 and 1200W)
at the constant weight concentration of 0.1% in a range of inlet velocities and the pressure
drops are evaluated and presented in Figure 5-12. This figure shows that for the MWCNT-
Asp/water coolants the pressure drop decreases significantly with the increase of
circulation temperature. It is also noteworthy that the pressure drop and viscosity curves
exhibit similar trends, which can be attributed to the direct relationship between pressure
drop and viscosity.
Univers
ity of
Mala
ya
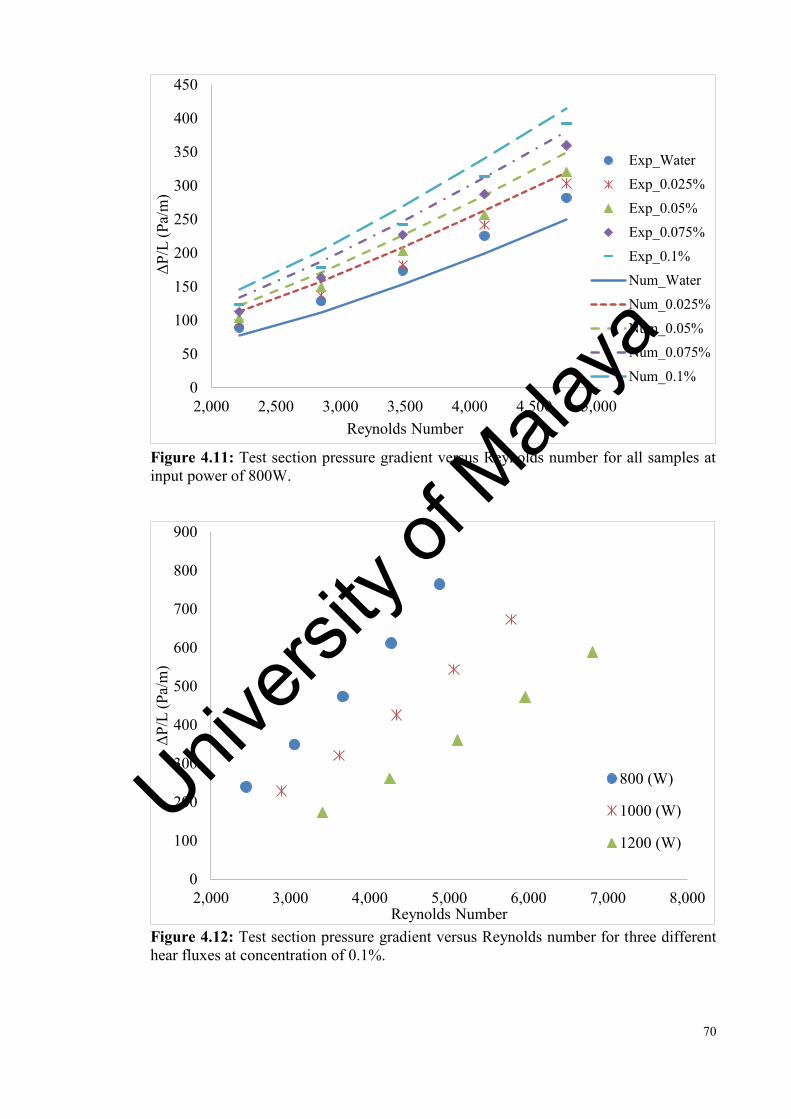
70
Figure 4.11: Test section pressure gradient versus Reynolds number for all samples at input power of 800W.
Figure 4.12: Test section pressure gradient versus Reynolds number for three different hear fluxes at concentration of 0.1%.
0
50
100
150
200
250
300
350
400
450
2,000 2,500 3,000 3,500 4,000 4,500 5,000
ΔP/L
(Pa/
m)
Reynolds Number
Exp_WaterExp_0.025%Exp_0.05%Exp_0.075%Exp_0.1%Num_WaterNum_0.025%Num_0.05%Num_0.075%Num_0.1%
0
100
200
300
400
500
600
700
800
900
2,000 3,000 4,000 5,000 6,000 7,000 8,000
ΔP/L
(Pa/
m)
Reynolds Number
800 (W)
1000 (W)
1200 (W)Univ
ersity
of M
alaya
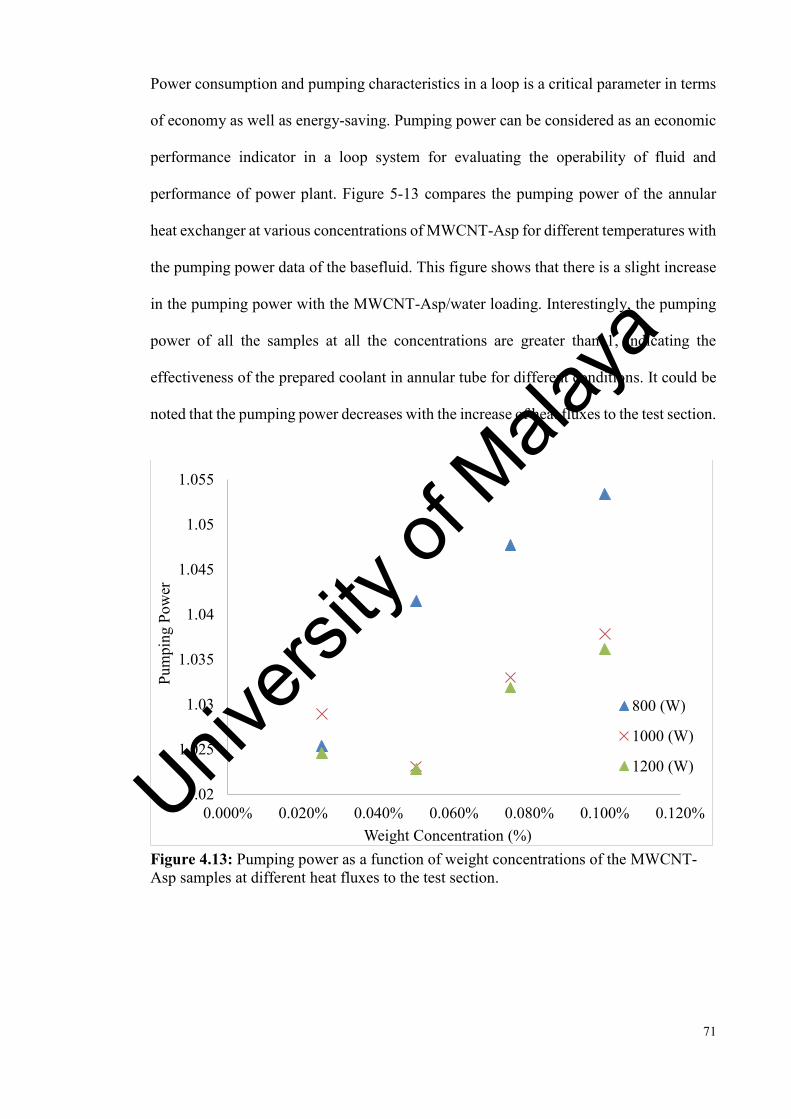
71
Power consumption and pumping characteristics in a loop is a critical parameter in terms
of economy as well as energy-saving. Pumping power can be considered as an economic
performance indicator in a loop system for evaluating the operability of fluid and
performance of power plant. Figure 5-13 compares the pumping power of the annular
heat exchanger at various concentrations of MWCNT-Asp for different temperatures with
the pumping power data of the basefluid. This figure shows that there is a slight increase
in the pumping power with the MWCNT-Asp/water loading. Interestingly, the pumping
power of all the samples at all the concentrations are greater than 1, indicating the
effectiveness of the prepared coolant in annular tube for different conditions. It could be
noted that the pumping power decreases with the increase of heat fluxes to the test section.
Figure 4.13: Pumping power as a function of weight concentrations of the MWCNT-Asp samples at different heat fluxes to the test section.
1.02
1.025
1.03
1.035
1.04
1.045
1.05
1.055
0.000% 0.020% 0.040% 0.060% 0.080% 0.100% 0.120%
Pum
ping
Pow
er
Weight Concentration (%)
800 (W)
1000 (W)
1200 (W)Univers
ity of
Mala
ya
72
5 CHAPTER 6: HEAT TRANSFER PERFORMANCE OF WATER-BASED TETRAHYDROFURFURYL POLYETHYLENE GLYCOL-TREATED
GRAPHENE NANOPLATELETS SUPER-COOLANT
The main problem with applying surfactants are the reduction of specific surface area of
carbon nanostructures, implying a significant decrease in thermal properties of
nanofluids. So, to avoid this issue and removing foaming in the flow-systems, covalent
functionalization was suggested. However, most of the covalently functionalization
procedures are complex and multi-step (Amiri et al., 2011). As some new studies in this
field, Sun et al. (2010) and our group (Amiri, 2015) employed in situ diazonium formation
procedure to functionalize thermally expanded graphite with 4-bromophenyl. They
reported higher solubility for the chemically-assisted exfoliated graphene sheets than
pristine graphene without any stabilizer additive. Sarsam et al. (2016) also reported a
novel synthesis procedure for preparing triethanolamine-treated graphene nanoplatelets
with different specific areas (SSAs). Using ultrasonication, the covalently functionalized
graphene nanoplatelets with different weight concentrations and SSAs were dispersed in
distilled water to prepare a new version of nanofluids.
Here, a quick and efficient covalent route is employed to synthesize tetrahydrofurfuryl
polyethylene glycol-treated Graphene Nanoplatelets (TGNP). To prove functionalization,
the TGNP sample was subjected to morphological and chemical characterization. The
treated sample was then added to the pure water as a base fluid to synthesis the TGNP
nanofluid and its thermo-physical properties were investigated. Finally, the convective
heat transfer coefficient and pressure drop of the prepared supercoolants were studied in
an annular heat exchanger.
Univers
ity of
Mala
ya

73
5.1 Functionalization procedure and preparation of coolants
To synthesize TGNP, the pristine GNP (7 g) and AlCl3 as a Lewis acid (129.8 g) were
poured into an agate mortar and were grounded for several minutes. This mentioned
mixture and 400 mL TFPEG were then poured into a vessel and stirred for 30 min at room
temperature until a homogeneous suspension was produced. Then, 0.5 mL concentrated
hydrochloric acid was added drop by drop. The mixture was then sonicated at 100ºC for
36 hrs. The resulting mixture was then cooled to the room temperature, centrifuged in
ethanol, methanol and water for 9 times to remove any unreacted materials, and finally
the sample was dried at 60ºC.
To synthesize the TGNP/water coolant, the given amount of TGNP was sonicated with
water as a basefluid for 10 min at power of 480W. The TGNP/water coolants were
synthesized at the weight concentrations of 0.025%, 0.05%, 0.075% and 0.1%.
The mechanism of the reaction can be summarized as follows:
With a Lewis acid (AlCl3) as a catalyst and a trifle amount of concentrated hydrochloric
acid (HCl) to protonate tetrahydrofurfuryl polyethylene glycol, electrophilic addition
reactions were carried out between tetrahydrofurfuryl polyethylene glycol and GNPs
through a sonication method. The reaction resulted in the attachment of tetrahydrofurfuryl
polyethylene glycol and hydroxyl groups on the surface of the GNP (Tian et al., 2008).
5.2 Functionalization and Morphology
Raman characterization is a strong measurement for analyzing structure, having sp2 and
sp3 hybridized carbon atoms in carbon-based materials and functionalization by following
alterations in holes. The Raman spectra of the pristine GNP, and TGNP are presented in
Univers
ity of
Mala
ya

74
Figure 6-1. While the pristine GNP is weak in terms of D band intensity, the fairly strong
D band in the TGNP sample can be seen at 1343 cm-1. The ratio of the intensities of the
D-band to that of the G-band (ID/G) was considered to be the amount of disordered carbon
(sp3-hybridized carbon) relative to graphitic carbon (sp2-hybridized carbon). In
functionalization studies of GNP, the higher intensity ratio of ID/G indicates a higher
disruption of aromatic π-π electrons, implying partial damage of the graphitic carbon
produced by covalent functionalization. The ID/G ratio of TGNP is relatively higher than
that of pristine GNP, which confirmed the successful functionalization via an
electrophilic addition reaction under microwave irradiation. A significant increase in ID/G
can also confirm that the present method is completely successful for functionalization of
GNP without acid-treatment phase.
As a further evidence, thermogravimetric analysis (TGA) was conducted to investigate
functionalization of GNP with tetrahydrofurfuryl polyethylene glycol. TGA is a technique
for thermally analysis in which alterations in the structure of materials are measured as a
function of temperature. Figure 6-2 presents the TGA curve of the pristine GNP and
TGNP. It can be seen that the TGA results of the pristine sample illustrate no mass loss
up to 600ºC. However, there is an obvious weight loss in the temperature range of 100–
200ºC in the TGNP curve. This mass loss was attributed to the functionality of
tetrahydrofurfuryl polyethylene glycol as an unstable organic part on the surface of the
GNP.
Figure 6-3 panels (a) and (b) display the TEM images of TGNP, where all the images
reveal the presence of some multi-layer structure of GNPs. Images of the TGNP sample
provide layer’s surface full of wrinkles. Although TEM images are not able to show
minute functional groups, some changes in morphology and surface deterioration can be
Univers
ity of
Mala
ya
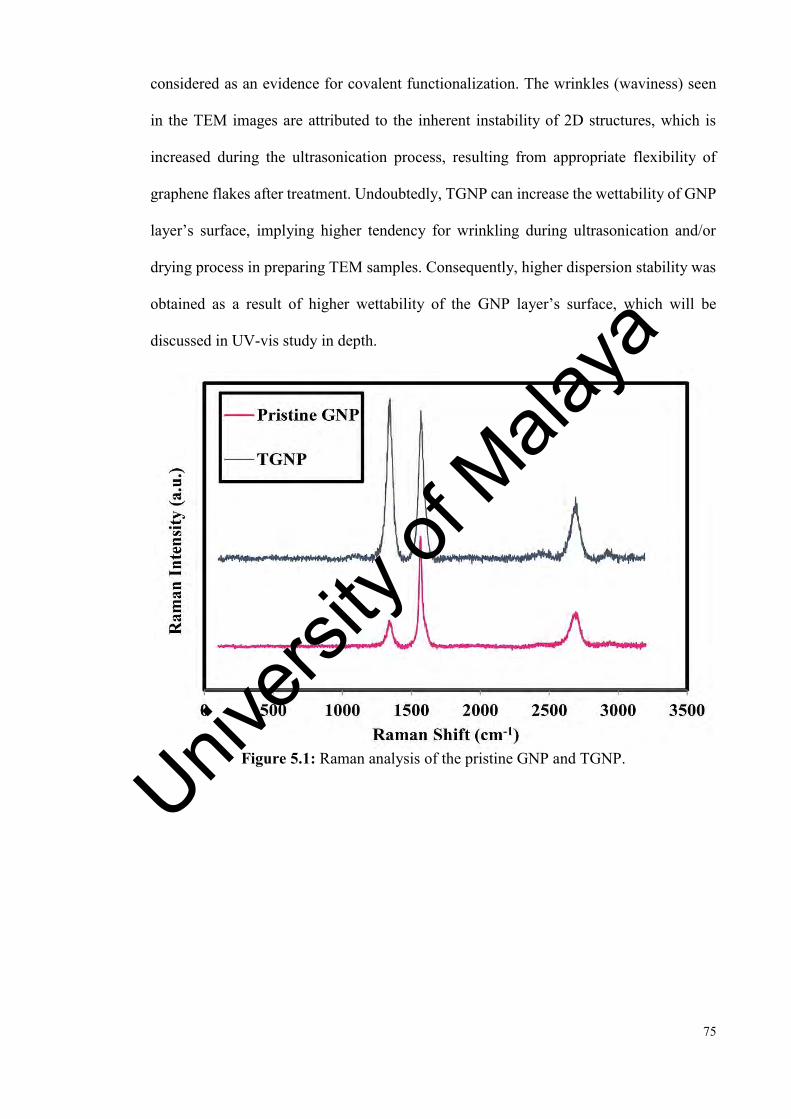
75
considered as an evidence for covalent functionalization. The wrinkles (waviness) seen
in the TEM images are attributed to the inherent instability of 2D structures, which is
increased during the ultrasonication process, resulting from appropriate flexibility of
graphene flakes after treatment. Undoubtedly, TGNP can increase the wettability of GNP
layer’s surface, implying higher tendency for wrinkling during ultrasonication and/or
drying process in preparing TEM samples. Consequently, higher dispersion stability was
obtained as a result of higher wettability of the GNP layer’s surface, which will be
discussed in UV-vis study in depth.
Figure 5.1: Raman analysis of the pristine GNP and TGNP.
Univers
ity of
Mala
ya
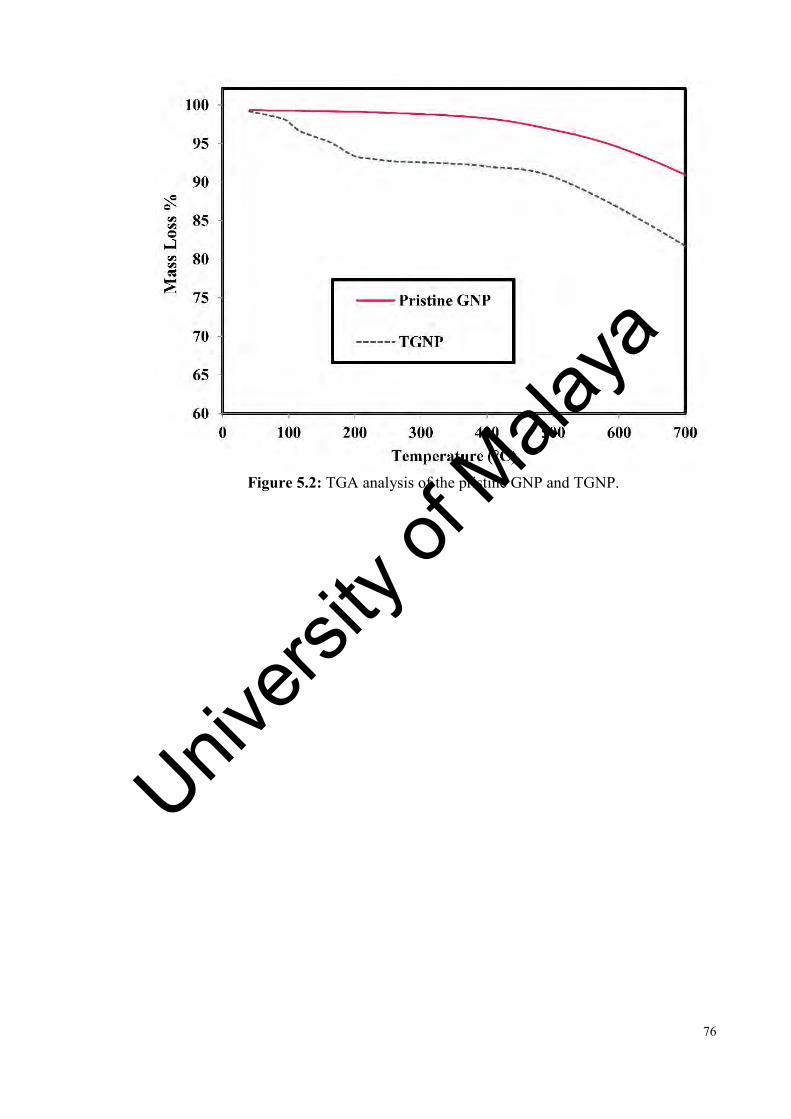
76
Figure 5.2: TGA analysis of the pristine GNP and TGNP.
Univers
ity of
Mala
ya

77
Figure 5.3: Panels (a) and (b) display the TEM images of TGNP.
Univers
ity of
Mala
ya

78
5.3 Dispersibility
The UV–vis spectrum for the water-based TGNP nanofluids with different weight
concentrations is presented in Figure 6.4(a), from which it can be realized that the peak
value of absorbance for all samples due to the presence of TGNP lies almost at 268 nm.
Photometric analysis of the UV–vis spectrometer was used to track the weight
concentration of all the samples that were prepared at different times for 30 days. To this
end, a standard curve was prepared for each nanofluid sample relating its weight
concentration with the value of absorbance. Also, Figure 6.4(b) shows the quantitative
analysis of the dispersion state and the long-term stability of the TGNP/water coolants in
UV–Vis spectroscopy for different weight fractions. It can be seen that the relative
concentration of TGNP/water nanofluid decrease insignificantly over time. As a result,
the maximum sediment of about 15 % was obtained for highest weight concentration of
0.1, which confirmed the suitable dispersibility of TGNP in water as the basefluid.
Figure 6.4, continued
0
0.5
1
1.5
2
2.5
3
3.5
190 290 390 490 590 690 790 890 990 1090 1190
Abs
orba
nce
Wavelengt h (nm)(a)
0.1%
0.075%
0.05%
0.025%
Univers
ity of
Mala
ya
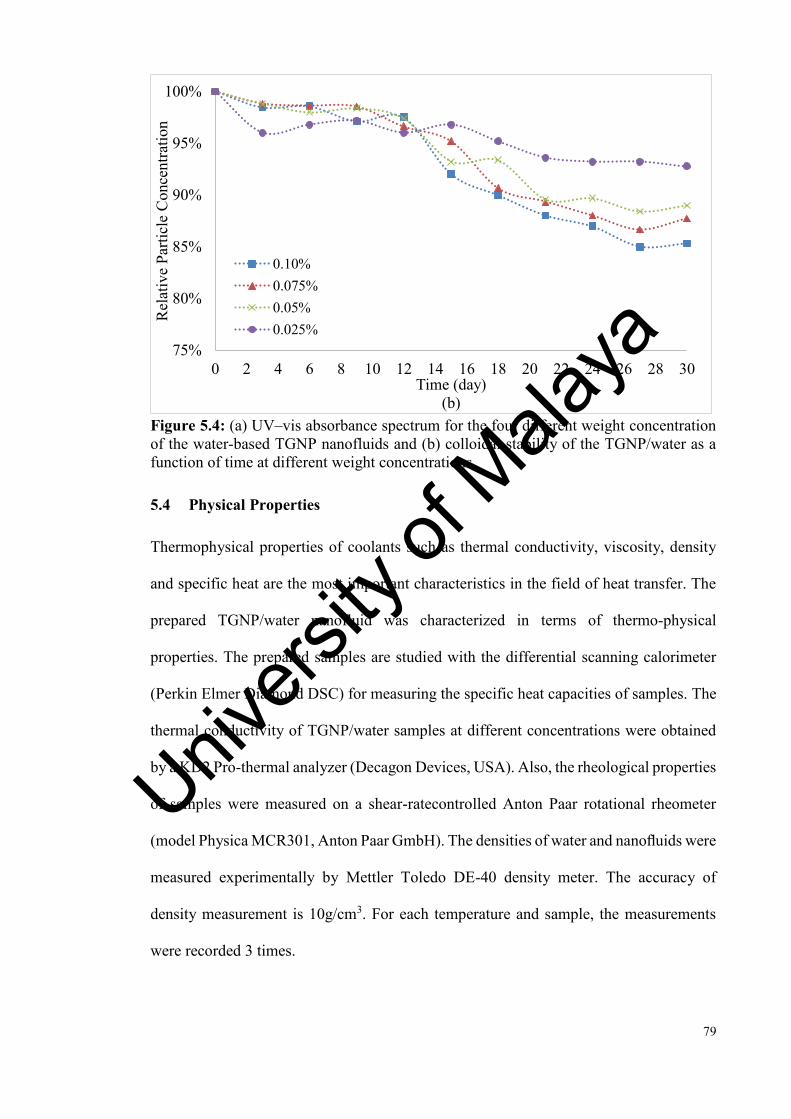
79
Figure 5.4: (a) UV–vis absorbance spectrum for the four different weight concentration of the water-based TGNP nanofluids and (b) colloidal stability of the TGNP/water as a function of time at different weight concentrations.
5.4 Physical Properties
Thermophysical properties of coolants such as thermal conductivity, viscosity, density
and specific heat are the most important characteristics in the field of heat transfer. The
prepared TGNP/water nanofluid was characterized in terms of thermo-physical
properties. The prepared samples are studied with the differential scanning calorimeter
(Perkin Elmer Diamond DSC) for measuring the specific heat capacities of samples. The
thermal conductivity of TGNP/water samples at different concentrations were obtained
by a KD2 Pro-thermal analyzer (Decagon Devices, USA). Also, the rheological properties
of samples were measured on a shear-ratecontrolled Anton Paar rotational rheometer
(model Physica MCR301, Anton Paar GmbH). The densities of water and nanofluids were
measured experimentally by Mettler Toledo DE-40 density meter. The accuracy of
density measurement is 10g/cm3. For each temperature and sample, the measurements
were recorded 3 times.
75%
80%
85%
90%
95%
100%
0 2 4 6 8 10 12 14 16 18 20 22 24 26 28 30
Rel
ativ
e Pa
rticl
e C
once
ntra
tion
Time (day)(b)
0.10%0.075%0.05%0.025%
Univers
ity of
Mala
ya

80
Experimental results about thermophysical properties of TGNP/water nanofluid were
compared with pure water, which are shown in Figures 6.5 to 6.8. Figure 6.5, 6.6, 6.7 and
6.8 show the experimental data of the density, specific heat, viscosity and thermal
conductivity at different temperatures of 20 to 60°C. Density is one of the thermophysical
properties of fluids that can affect the convective heat transfer coefficient. Experimentally
measured density of the GNP/water nanofuids at different weight concentrations as well
as basefluid are shown in Figure 6.5 as a function of temperature. The results show that
the density of the prepared coolants decreases with temperature and increases with
concentration, and expectedly are higher than that of the basefluid.
Figure 5.5: Densities of the TGNP/water and water for different weight concentrations (kg/m3).
As another thermo-physical property, the specific heat capacity plot of TGNP as the
functions of temperature and weight concentration of TGNP is illustrated in Figure 6.6.
The results suggest that an increase in the weight concentration of TGNP leads a drop in
the specific heat capacity. Also, the specific heat capacity of all samples increases
gradually with the temperature, which is sharper in coolants including TGNP. It is
986
988
990
992
994
996
998
1000
1002
1004
1006
0 10 20 30 40 50 60
Den
sity
(kg/
m3)
Temp. (⁰C)
Water0.025%0.05%0.075%0.1%
Univers
ity of
Mala
ya
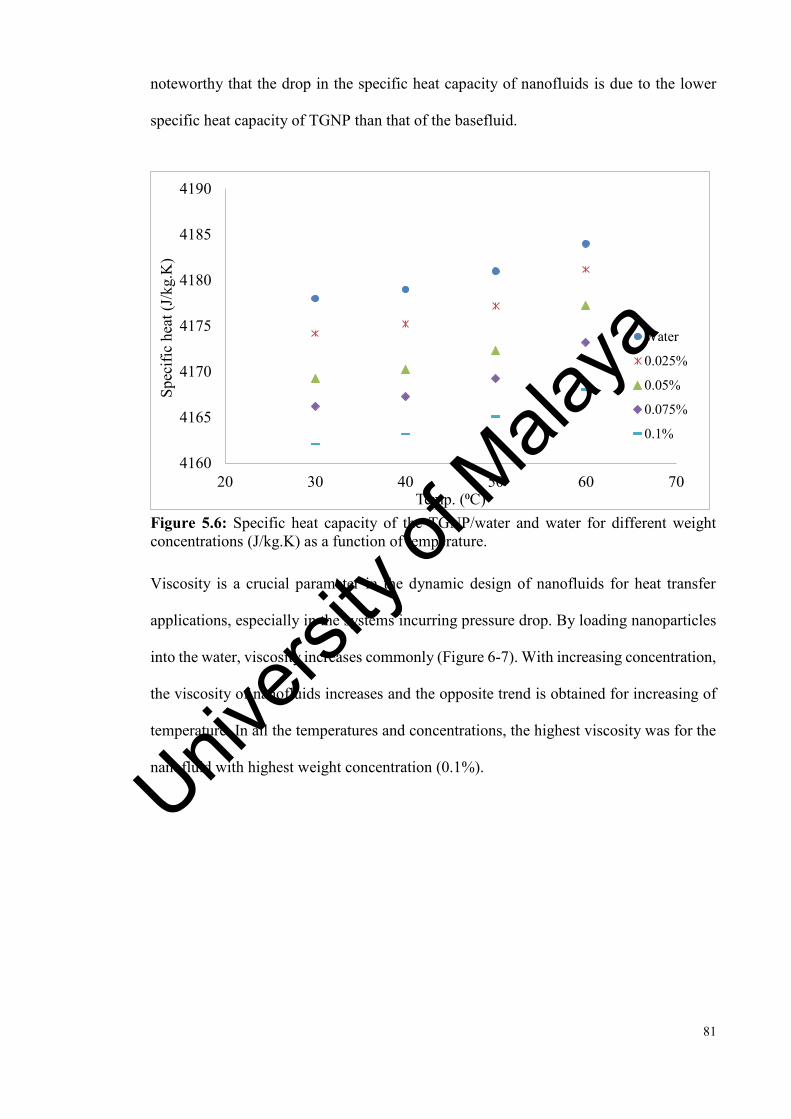
81
noteworthy that the drop in the specific heat capacity of nanofluids is due to the lower
specific heat capacity of TGNP than that of the basefluid.
Figure 5.6: Specific heat capacity of the TGNP/water and water for different weight concentrations (J/kg.K) as a function of temperature.
Viscosity is a crucial parameter in the dynamic design of nanofluids for heat transfer
applications, especially in the systems incurring pressure drop. By loading nanoparticles
into the water, viscosity increases commonly (Figure 6-7). With increasing concentration,
the viscosity of nanofluids increases and the opposite trend is obtained for increasing of
temperature. In all the temperatures and concentrations, the highest viscosity was for the
nanofluid with highest weight concentration (0.1%).
4160
4165
4170
4175
4180
4185
4190
20 30 40 50 60 70
Spec
ific
heat
(J/k
g.K
)
Temp. (⁰C)
Water
0.025%
0.05%
0.075%
0.1%
Univers
ity of
Mala
ya

82
Figure 5.7: Dynamic viscosity of the TGNP/water and water as the functions of temperature and weight concentration at shear rate of 140 s-1 (mPa.s).
Thermal conductivity of working fluids is one of the key parameters in evaluating heat
transfer rate of heat exchanger. Figure 6-8 represents the thermal conductivity of
nanofluids and water as a function of temperature. The results show that the thermal
conductivity of nanofluids improves with the loading of TGNP in the basefluid and they
are higher in comparison to the water. Also, as the temperature increases, thermal
conductivity increases, which is more significant at higher concentration.
0.0004
0.0005
0.0006
0.0007
0.0008
0.0009
0.001
0.0011
0.0012
15 20 25 30 35 40 45 50 55
Vis
cosi
ty [P
a·s]
Temp. ( ºC)
Water
TGNP/Water (0.025%)
TGNP/Water (0.05%)
TGNP/Water (0.075%)
TGNP/Water (0.1%)
Univers
ity of
Mala
ya
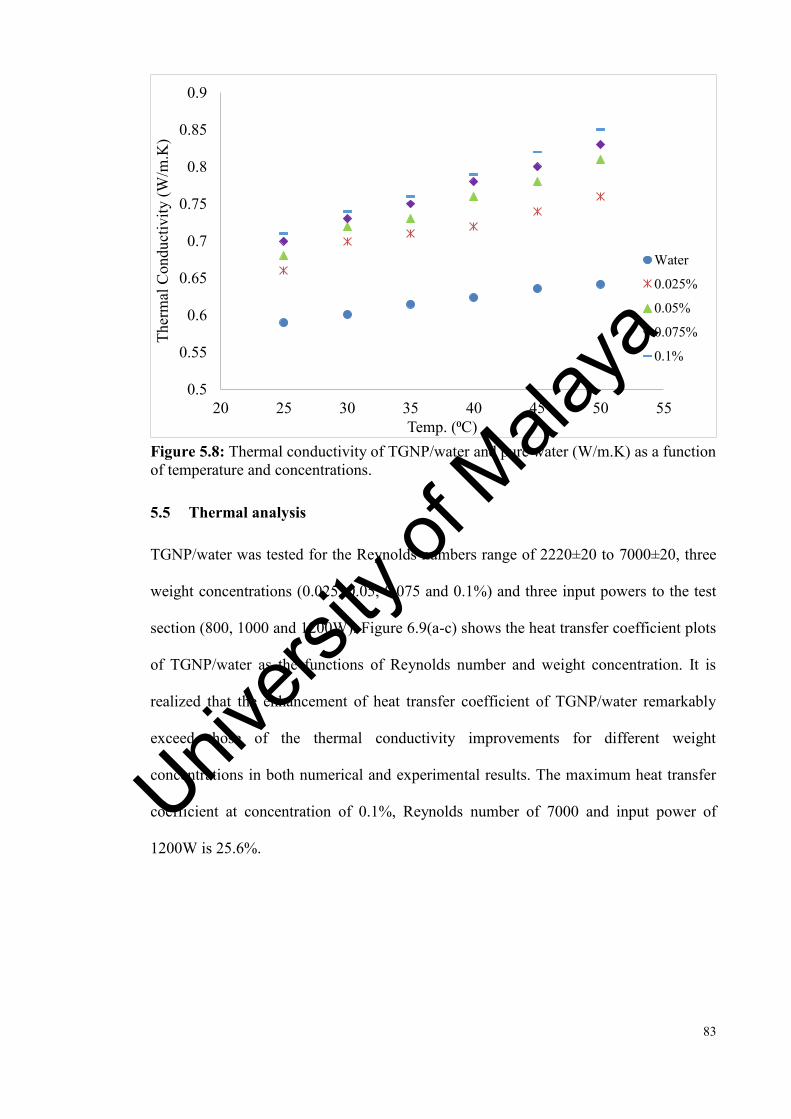
83
Figure 5.8: Thermal conductivity of TGNP/water and pure water (W/m.K) as a function of temperature and concentrations.
5.5 Thermal analysis
TGNP/water was tested for the Reynolds numbers range of 2220±20 to 7000±20, three
weight concentrations (0.025, 0.05, 0.075 and 0.1%) and three input powers to the test
section (800, 1000 and 1200W). Figure 6.9(a-c) shows the heat transfer coefficient plots
of TGNP/water as the functions of Reynolds number and weight concentration. It is
realized that the enhancement of heat transfer coefficient of TGNP/water remarkably
exceed those of the thermal conductivity improvements for different weight
concentrations in both numerical and experimental results. The maximum heat transfer
coefficient at concentration of 0.1%, Reynolds number of 7000 and input power of
1200W is 25.6%.
0.5
0.55
0.6
0.65
0.7
0.75
0.8
0.85
0.9
20 25 30 35 40 45 50 55
Ther
mal
Con
duct
ivity
(W/m
.K)
Temp. (⁰C)
Water
0.025%
0.05%
0.075%
0.1%
Univers
ity of
Mala
ya
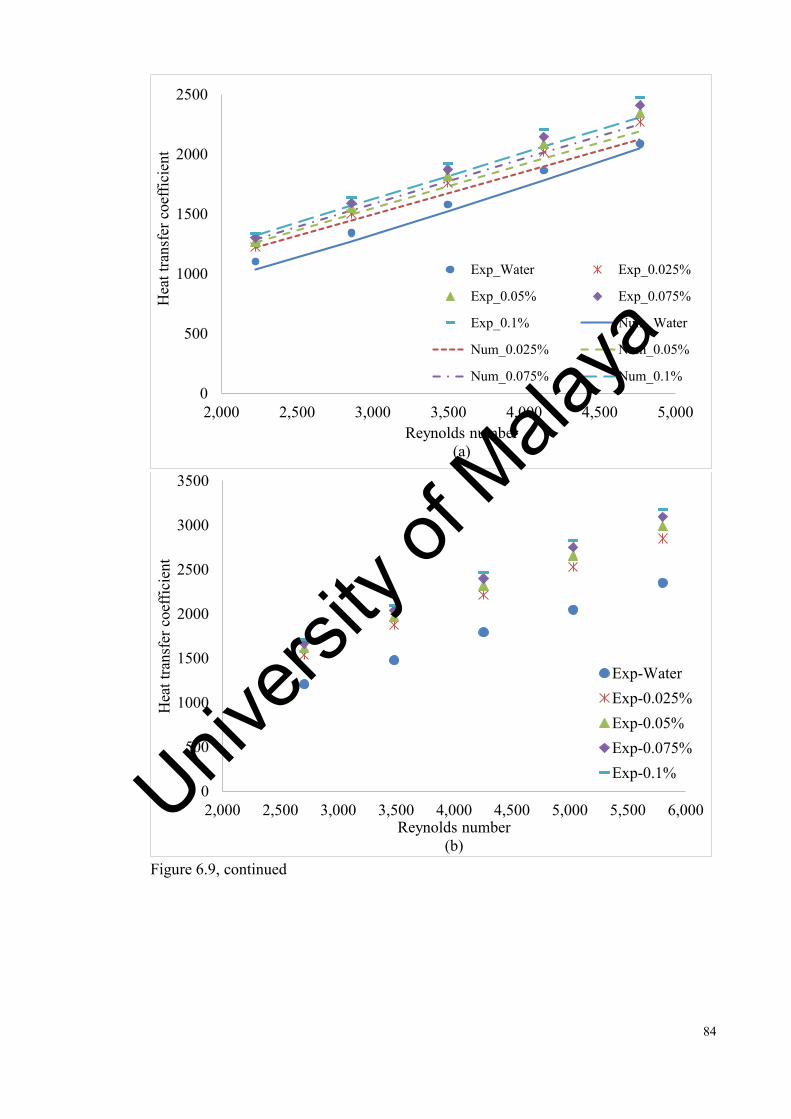
84
Figure 6.9, continued
0
500
1000
1500
2000
2500
2,000 2,500 3,000 3,500 4,000 4,500 5,000
Hea
t tra
nsfe
r coe
ffici
ent
Reynolds number(a)
Exp_Water Exp_0.025%
Exp_0.05% Exp_0.075%
Exp_0.1% Num_Water
Num_0.025% Num_0.05%
Num_0.075% Num_0.1%
0
500
1000
1500
2000
2500
3000
3500
2,000 2,500 3,000 3,500 4,000 4,500 5,000 5,500 6,000
Hea
t tra
nsfe
r coe
ffici
ent
Reynolds number(b)
Exp-WaterExp-0.025%Exp-0.05%Exp-0.075%Exp-0.1%Univ
ersity
of M
alaya

85
Figure 5.9: Comparison of the heat transfer coefficient obtained for distilled water and TGNP/water for different weight concentrations at different heat fluxes of (a) 800W, (b) 1000W and (c) 1200W to the text section.
Figure 6-10(a-c) shows the average Nusselt numbers of GNP/water nanofluid for various
weight concentrations and Reynolds numbers. To evaluate the ratio of convective to
conductive heat transfer of GNP/water coolants, Nusselt number plots have been
employed. The results suggest that the Nusselt number increases remarkably in the
presence of treated samples in comparison to the applied basefluid. The TGNP loading in
basefluid improves the thermal conductivity of the basefluid, which leads to the lower
temperature difference between the bulk fluid and wall tube, indicating higher Nusselt
numbers or the heat transfer rate. The comparison between the measurements and the
predicted results are illustrated in Figures 6.9(a) and 6.10(a). The experimental results
were in a good agreement with numerical results, indicating a deviation percentage of
6.58.
0
500
1000
1500
2000
2500
3000
3500
4000
2,000 3,000 4,000 5,000 6,000 7,000 8,000
Hea
t tra
nsfe
r coe
ffici
ent
Reynolds number(c)
Exp-Water
Exp-0.025%
Exp-0.05%
Exp-0.075%
Exp-0.1%
Univers
ity of
Mala
ya

86
Figure 6.11 illustrates the heat transfer performance of the TGNP/water coolant at
different heat fluxes and at constant weight concentration of 0.1%, where increase in
Reynolds number increases the Nusselt number (heat transfer performance) of the
working fluid.
Figure 6.10, continued
15
20
25
30
35
40
45
50
2,000 2,500 3,000 3,500 4,000 4,500 5,000
Nus
selt
num
ber
Reynolds numbe(a)
Exp_Water Exp_0.025%Exp_0.05% Exp_0.075%Exp_0.1% Num_WaterNum_0.025% Num_0.05%Num_0.075% Num_0.1%
0
10
20
30
40
50
60
2,000 2,500 3,000 3,500 4,000 4,500 5,000 5,500 6,000
Nus
selt
num
ber
Reynolds number(b)
Exp-Water
Exp-0.025%
Exp-0.05%
Exp-0.075%
Exp-0.1%
Univers
ity of
Mala
ya
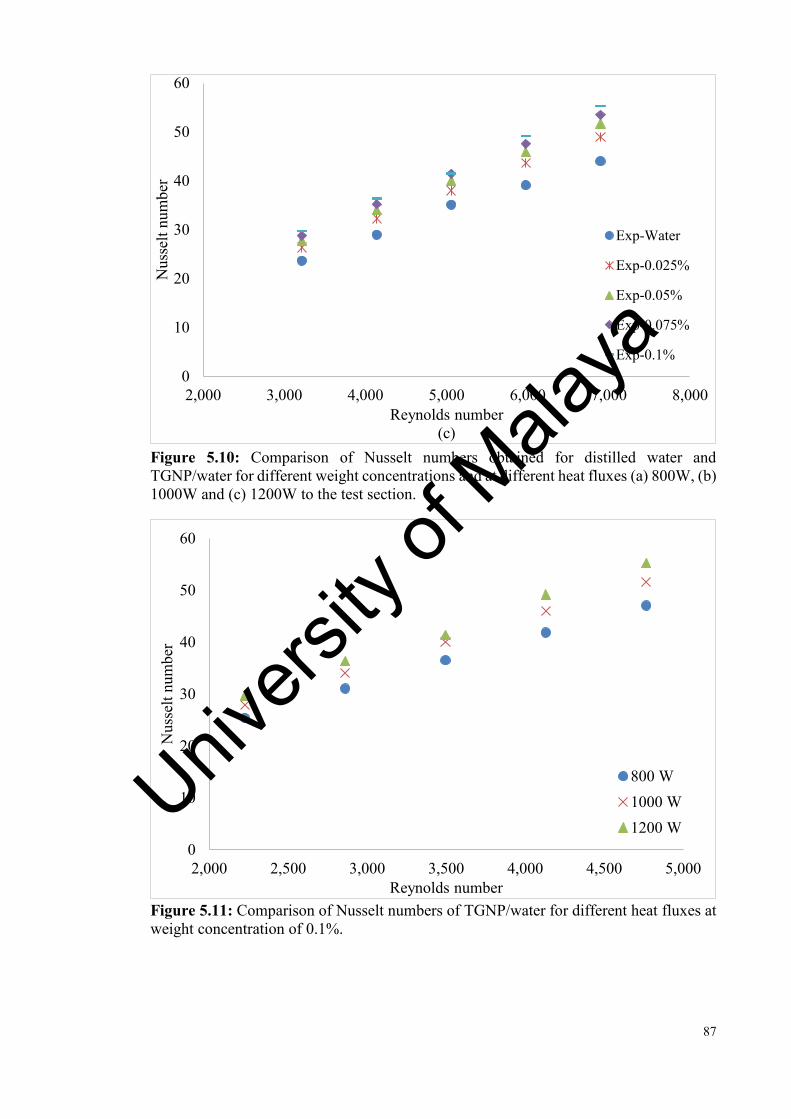
87
Figure 5.10: Comparison of Nusselt numbers obtained for distilled water and TGNP/water for different weight concentrations and at different heat fluxes (a) 800W, (b) 1000W and (c) 1200W to the test section.
Figure 5.11: Comparison of Nusselt numbers of TGNP/water for different heat fluxes at weight concentration of 0.1%.
0
10
20
30
40
50
60
2,000 3,000 4,000 5,000 6,000 7,000 8,000
Nus
selt
num
ber
Reynolds number(c)
Exp-Water
Exp-0.025%
Exp-0.05%
Exp-0.075%
Exp-0.1%
0
10
20
30
40
50
60
2,000 2,500 3,000 3,500 4,000 4,500 5,000
Nus
selt
num
ber
Reynolds number
800 W1000 W1200 WUniv
ersity
of M
alaya
88
5.6 Pressure drop
The pressure gradient between inlet and outlet of the pipe is depicted in Figure 6.12. The
pressure drop increases dramatically with the increment of the Reynolds number in both
numerical and experimental results. The increasing rate of the pressure drop at the
concentration of 0.1% with respect to pure water appears nearly 39.3% higher at Reynolds
number of 4760 and the power supply of 800W to the test section. This value is
considerably low in comparison with the increasing rate of the heat transfer.
In order to evaluate influence of temperature on pressure drop of TGNP/water coolants,
experiments were performed for different input powers (800, 1000 and 1200W) at the
constant weight concentration of 0.1% where the inlet velocities and the pressure drops
are evaluated and presented in Figure 6.13. This figure shows that the pressure drop
decreases significantly by increase the heat fluxes for the TGNP/water coolants. It is also
noteworthy that the pressure drop and viscosity curves exhibit similar trends, which can
be attributed to the direct relationship between pressure drop and viscosity and density.
Univers
ity of
Mala
ya

89
Figure 5.12: Test section pressure gradient versus Reynolds number for all the samples at the input power of 800W.
Figure 5.13: Test section pressure gradient versus Reynolds number for three different hear fluxes and at the concentration of 0.1%.
0
50
100
150
200
250
300
350
400
450
2,000 2,500 3,000 3,500 4,000 4,500 5,000
ΔP/L
(Pa/
m)
Reynolds Number
Exp_WaterExp_0.025%Exp_0.05%Exp_0.075%Exp_0.1%Num_WaterNum_0.025%Num_0.05%Num_0.075%Num_0.1%
0
50
100
150
200
250
300
350
400
450
2,000 2,500 3,000 3,500 4,000 4,500 5,000
ΔP/L
(Pa/
m)
Reynolds Number
800 W
1000 W
1200 WUnivers
ity of
Mala
ya
90
6 CHAPTER 7: THERMOPHYSICAL AND HEAT TRANSFER PERFORMANCE OF STABILIZED GRAPHENE NANOPLATELETS-
ETHYLENE GLYCOL/WATER NANOFLUIDS THROUGH AN ANNULAR CHANNEL
The single-phase or two-phase approaches could be applied in simulating convective heat
transfer by nanofluid. The single-phase method assumes that nanoparticles and base fluids
move with the same velocity and they are in thermal equilibrium, so this method is easier
and needs less computational time. But it is important and notable to find applicable
equations which compute properties of single-phase nanofluids. However, the single-
phase method has been employed in a number of numerical researches of convective heat
transfer by nanofluids. (Akbarinia et al., 2007; Akbarinia et al., 2009; Barbés et al., 2014;
Khanafer et al., 2003; Roy et al., 2004; Shahi et al., 2010; Sundar et al., 2010; Talebi et
al., 2010). In general, the single-phase approach and the experimental results have not
shown good agreement, due to lack of appropriate equations for predicting both
nanoparticles and basefluid, which implies the low extent of validation in results and lack
of realizing nanofluids properties. Also, some nanofluid parameters such as dispersibility,
sedimentation, Brownian motion of nanoparticles in basefluids, Brownian forces, volume
or weight concentration of solid particles in basefluids etc. may influence nanofluids flow
regime and heat transfer rate. Therefore, the slip velocity between nanoparticles and
basefluid must be considered for simulating nanofluid flows and/or heat transfer (Xuan
et al., 2000). Due to Brownian movement of particles in basefluids, two-phase approach
open a new gateway for introducing the main characteristics of nanofluids, indicating a
good agreement with theorical and experimental results. Various multiphase approaches
have been presented to predict and describe behaviour of complex flows. Numerous
multiphase flow studies used the theory of interacting continua or the “Mixture Theory”
(Crowe et al., 1996; Ishii, 1975; Manninen et al., 1996; Xu, 2004). This method works
Univers
ity of
Mala
ya

91
based on the underlying theory that each phase can be mathematically defined as a
continuum.
Lotfi and his colleagues (2010) employed single-phase, two-phase Eulerian and two-
phase mixture approaches to simulate flow behaviour in the presence of nanofluids
through a straight pipe. They concluded that two-phase mixture method has more accurate
results than the other two approaches. Some investigators have used this approach to
simulate the behaviour of nanofluids (Akbarinia et al., 2007; Akbarinia et al., 2009;
Bianco et al., 2009; Mirmasoumi et al., 2008a, 2008b). Mirmasoumi and Behzadmehr
(2008a) Akbarinia and Laur (2009) considered the influence of nanoparticles size on
nanofluid flow in a horizontal pipe.
Abu-Nada et. al. (2008) investigated heat transfer rate of annular heat exchanger in the
presence of Al2O3- based water nanofluid with single phase method. They considered
different thermal conductivity and viscosity models to evaluate heat transfer improvement
in the annular heat exchanger. Izadi et al. (2009) have also simulated laminar forced
convection of Al2O3-based water nanofluid in a two dimensional annular heat exchanger
with the single-phase method.
The present chapter introduces a promising, potential to industrially scalable, cost-
effective functionalization approach for preparing ethylene glycol-treated Graphene
Nanoplatelets (EGNP). Also, EGNP-based water-ethylene glycol nanofluids (EGNP-
WEG) were prepared and the thermophysical properties of the synthesized samples were
experimentally investigated for different weight fractions. Then, the numerical simulation
of the convective heat transfer coefficient in an annular heat exchanger was evaluated. To
realize this goal appropriately, two-phase mixture model wasemployed. The obtained
Univers
ity of
Mala
ya

92
results by simulation with two-phase method was validated with the analytical results and
the authenticity of the data was confirmed. Then, the nanofluids flow in a three
dimensional annular pipe was investigated for different weight fractions and Reynolds
numbers. As a result, Nusselt number profiles, friction factor and the performance index
were measured for the synthesized nanofluids.
6.1 Preparation of EGNP-WEG Coolants
To prepare EGNP, the pristine GNP (0.5g) and AlCl3 (9.27g) were first poured into a
vessel of planetary ball mill and agitated at the speed of 500 rpm for 1 h. The black-
mixture was again placed into another vessel filled with 80 ml of anhydrous EG and then
sonicated for 15 min with a probe-sonicator to reach a homogeneous back suspension.
The concentrated hydrochloric acid (1 ml) was used into the vessel over sonication time.
After doing sonication, the suspension was transferred into a microwave (Milestone
MicroSYNTH programmable microwave system) and heated for 15 min at 150°C. The
resultant mixture was filtered and subsequently washed. Filtration cake was then dried
for 48 h at 50°C and labelled as EGNP. While the raw GNP is not dispersed in most
organic solvents, the EGNP is significantly dispersed in both water and EG. The easily-
miscible functional group on the structure of EGNP could cause a significant increase in
dispersibility of the functionalized GNP with EG in both the medias of water and EG. To
synthesize EGNP-WEG at various weight concentrations, the known amount of EGNP
was poured in to a vessel filled with a mixture of water and EG with a volumetric ratio of
40:60 and sonicated for 10 min with a probe-sonicator.
6.2 Thermophysical properties
The thermal conductivity of EGNP-WEG for the temperature range of 25-65°C and the
weight concentrations of 0.01%, 0.05%, 0.1% and 0.2% are shown in Table 7.1. The
Univers
ity of
Mala
ya

93
effect of concentration and temperature on the thermal conductivity of the nanofluids
were systematically investigated. First, the thermal conductivity of EGNP-WEG is higher
than that of water–EG mixture at different temperatures and concentrations. Similar to
the conventional working fluids, the thermal conductivity of EGNP-WEG increases with
increasing of the temperature. The main mechanism for increasing thermal conductivity
with temperature is attributed to the Brownian motion of the EGNP suspended in the
basefluid (Aravind et al., 2011). It can also be seen that there is a rising trend between the
thermal conductivity of EGNP-WEG samples and the weight concentration of EGNP. For
EGNP-WEG, the formation of surface nanolayers can be the main reason for heat transfer
rate enhancement. Liquid molecules generate layers around the EGNP, thereby enhancing
the local ordering of the liquid layer at the interface region. Thus, the liquid layer at the
interface would exhibit a higher thermal conductivity compared to the basefluid (Aravind
et al., 2011).
Table 6.1: Thermal conductivity of the water-EG mixture and EGNP-WEG as a function of temperature and weight concentration (W/mK).
Temperature (◦C)
Water-EG
0.01 wt%
0.05 wt%
0.1 wt%
0.2 wt%
25 0.28 0.3 0.37 0.42 0.46 35 0.31 0.32 0.39 0.43 0.47 45 0.33 0.35 0.4 0.44 0.49 55 0.33 0.36 0.41 0.45 0.51 65 0.34 0.38 0.43 0.46 0.53
Dynamic viscosities of water–EG mixture and EGNP-WEG were experimentally
determined at high shear rate of 140 s−1 for different temperatures, which are illustrated
in Table 7.2. It can be seen that the viscosity of EGNP-WEG increases with increasing
the concentration of EGNP. Also, a decrease in the viscosity with increasing of
temperature is another obvious trend in the figure, which is obtained from weakening of
the intermolecular forces of the fluid itself (Ko et al., 2007).
Univers
ity of
Mala
ya
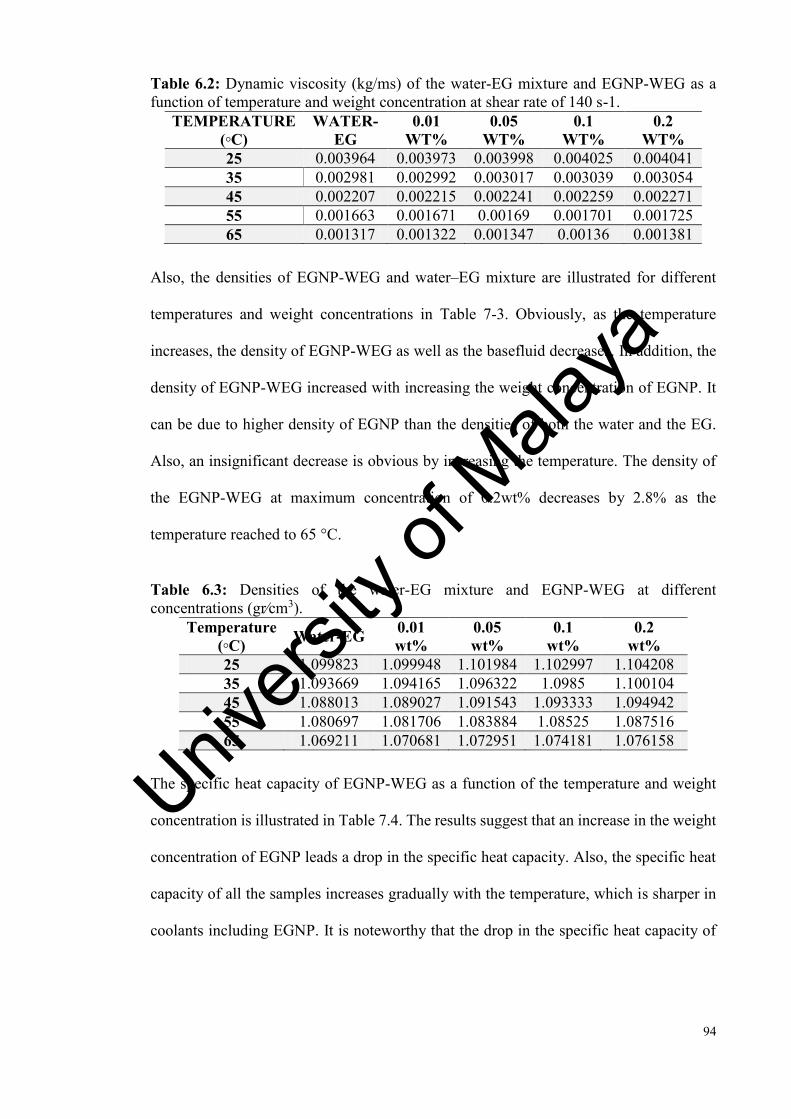
94
Table 6.2: Dynamic viscosity (kg/ms) of the water-EG mixture and EGNP-WEG as a function of temperature and weight concentration at shear rate of 140 s-1.
TEMPERATURE (◦C)
WATER-EG
0.01 WT%
0.05 WT%
0.1 WT%
0.2 WT%
25 0.003964 0.003973 0.003998 0.004025 0.004041 35 0.002981 0.002992 0.003017 0.003039 0.003054 45 0.002207 0.002215 0.002241 0.002259 0.002271 55 0.001663 0.001671 0.00169 0.001701 0.001725 65 0.001317 0.001322 0.001347 0.00136 0.001381
Also, the densities of EGNP-WEG and water–EG mixture are illustrated for different
temperatures and weight concentrations in Table 7-3. Obviously, as the temperature
increases, the density of EGNP-WEG as well as the basefluid decreases. In addition, the
density of EGNP-WEG increased with increasing the weight concentration of EGNP. It
can be due to higher density of EGNP than the densities of both the water and the EG.
Also, an insignificant decrease is obvious by increasing the temperature. The density of
the EGNP-WEG at maximum concentration of 0.2wt% decreases by 2.8% as the
temperature reached to 65 °C.
Table 6.3: Densities of the water-EG mixture and EGNP-WEG at different concentrations (gr∕cm3).
Temperature (◦C) Water-EG 0.01
wt% 0.05 wt%
0.1 wt%
0.2 wt%
25 1.099823 1.099948 1.101984 1.102997 1.104208 35 1.093669 1.094165 1.096322 1.0985 1.100104 45 1.088013 1.089027 1.091543 1.093333 1.094942 55 1.080697 1.081706 1.083884 1.08525 1.087516 65 1.069211 1.070681 1.072951 1.074181 1.076158
The specific heat capacity of EGNP-WEG as a function of the temperature and weight
concentration is illustrated in Table 7.4. The results suggest that an increase in the weight
concentration of EGNP leads a drop in the specific heat capacity. Also, the specific heat
capacity of all the samples increases gradually with the temperature, which is sharper in
coolants including EGNP. It is noteworthy that the drop in the specific heat capacity of
Univers
ity of
Mala
ya
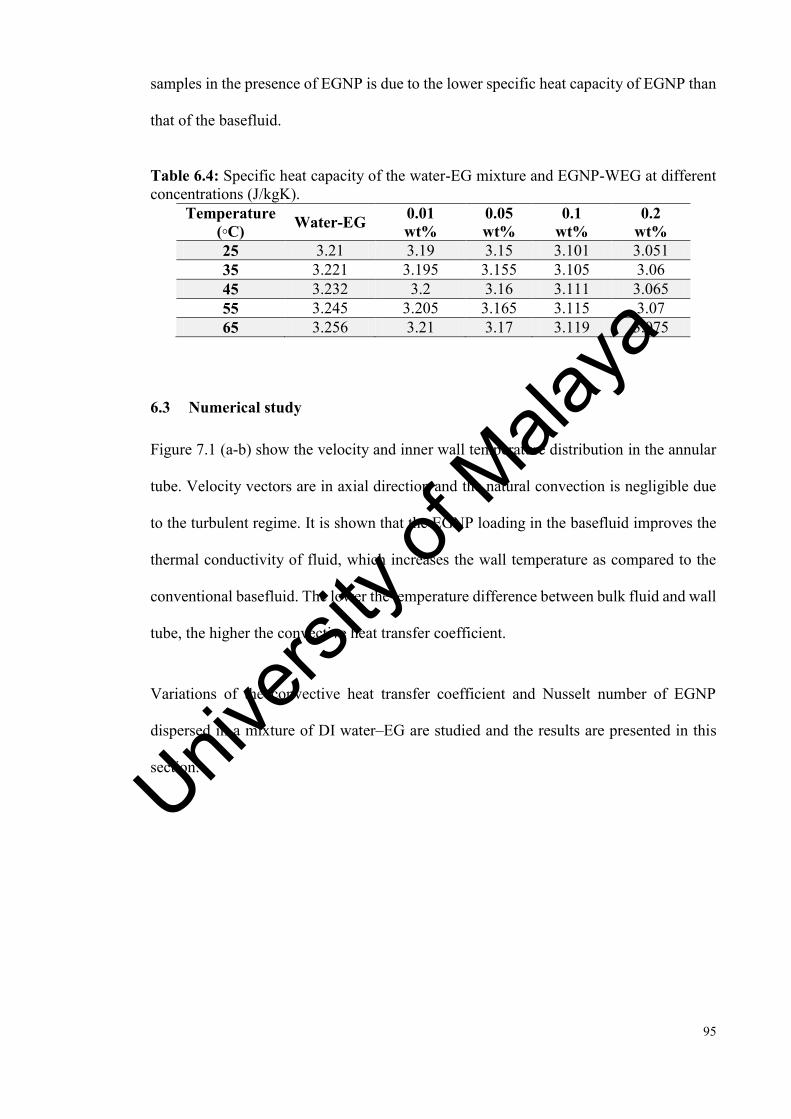
95
samples in the presence of EGNP is due to the lower specific heat capacity of EGNP than
that of the basefluid.
Table 6.4: Specific heat capacity of the water-EG mixture and EGNP-WEG at different concentrations (J/kgK).
Temperature (◦C) Water-EG 0.01
wt% 0.05 wt%
0.1 wt%
0.2 wt%
25 3.21 3.19 3.15 3.101 3.051 35 3.221 3.195 3.155 3.105 3.06 45 3.232 3.2 3.16 3.111 3.065 55 3.245 3.205 3.165 3.115 3.07 65 3.256 3.21 3.17 3.119 3.075
6.3 Numerical study
Figure 7.1 (a-b) show the velocity and inner wall temperature distribution in the annular
tube. Velocity vectors are in axial direction and the natural convection is negligible due
to the turbulent regime. It is shown that the EGNP loading in the basefluid improves the
thermal conductivity of fluid, which increases the wall temperature as compared to the
conventional basefluid. The lower the temperature difference between bulk fluid and wall
tube, the higher the convective heat transfer coefficient.
Variations of the convective heat transfer coefficient and Nusselt number of EGNP
dispersed in a mixture of DI water–EG are studied and the results are presented in this
section. Univers
ity of
Mala
ya

96
Figure 6.1: (a) Distributions of velocity and (b) inner wall temperature of EGNP-WEG fluid flow in an annular test section at Re=5000
Figure 7.2 shows the local Nusselt number at the inner wall at a constant heat flux (q″),
different weight concentrations (ϕ), and various inlet velocities (u). The curves for all the
simulations show the highest local Nu at the entry region due to entry length effect and
Univers
ity of
Mala
ya
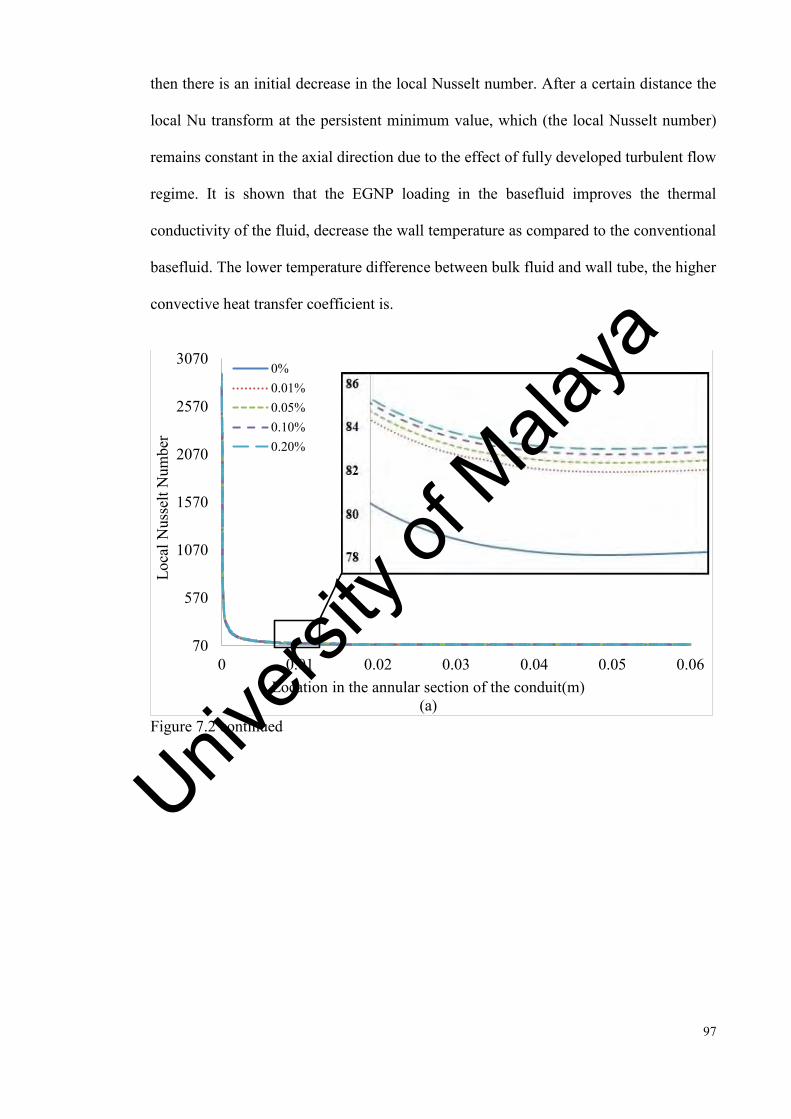
97
then there is an initial decrease in the local Nusselt number. After a certain distance the
local Nu transform at the persistent minimum value, which (the local Nusselt number)
remains constant in the axial direction due to the effect of fully developed turbulent flow
regime. It is shown that the EGNP loading in the basefluid improves the thermal
conductivity of the fluid, decrease the wall temperature as compared to the conventional
basefluid. The lower temperature difference between bulk fluid and wall tube, the higher
convective heat transfer coefficient is.
Figure 7.2 continued
70
570
1070
1570
2070
2570
3070
0 0.01 0.02 0.03 0.04 0.05 0.06
Loca
l Nus
selt
Num
ber
Location in the annular section of the conduit(m)(a)
0%0.01%0.05%0.10%0.20%
Univers
ity of
Mala
ya
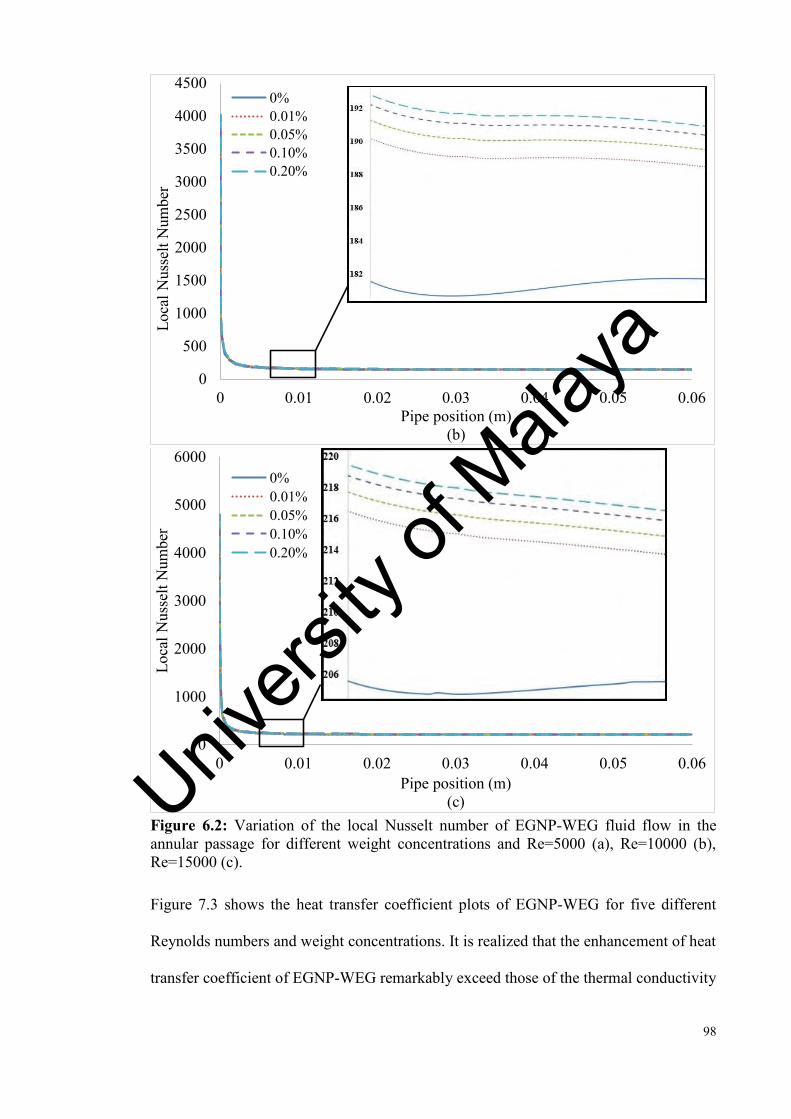
98
Figure 6.2: Variation of the local Nusselt number of EGNP-WEG fluid flow in the annular passage for different weight concentrations and Re=5000 (a), Re=10000 (b), Re=15000 (c).
Figure 7.3 shows the heat transfer coefficient plots of EGNP-WEG for five different
Reynolds numbers and weight concentrations. It is realized that the enhancement of heat
transfer coefficient of EGNP-WEG remarkably exceed those of the thermal conductivity
0
500
1000
1500
2000
2500
3000
3500
4000
4500
0 0.01 0.02 0.03 0.04 0.05 0.06
Loca
l Nus
selt
Num
ber
Pipe position (m)(b)
0%0.01%0.05%0.10%0.20%
0
1000
2000
3000
4000
5000
6000
0 0.01 0.02 0.03 0.04 0.05 0.06
Loca
l Nus
selt
Num
ber
Pipe position (m)(c)
0%0.01%0.05%0.10%0.20%
Univers
ity of
Mala
ya

99
improvements for different weight concentrations. The maximum heat transfer coefficient
at concentration of 0.2% and Reynolds number of 17,000 is 64%.
Figure 6.3: Average heat transfer coefficients for various Reynolds numbers and weight concentrations of EGNP-WEG coolants flow in annular test section.
Figure 7.4 shows the average Nusselt numbers of EGNP-WEG for various weight
concentrations and Reynolds numbers. To evaluate the ratio of convective to conductive
heat transfer of EGNP-WEG coolants, Nusselt number plots have been employed. The
results suggest that the Nusselt number increases remarkably in the presence of treated
samples in comparison to the applied basefluid. The EGNP loading in basefluid improves
the thermal conductivity of basefluid, which leads to the lower temperature difference
between the bulk fluid and wall of the tube, indicating higher Nusselt numbers and
subsequently heat transfer rate.
0
5000
10000
15000
20000
25000
30000
35000
4000 6000 8000 10000 12000 14000 16000 18000
Hea
t Tra
nsfe
r Coe
ffici
ent [
W/(m
2 •K
)]
Re
0%0.01%0.05%0.10%0.20%
Univers
ity of
Mala
ya

100
Figure 6.4: Average Nusselt numbers for various Reynolds numbers and weight concentrations of EGNP-WEG coolants flow in annular test section.
Figure 7.5 represents the friction factor for EGNP-WEG coolants in the annular tube at
various weight concentrations and Reynolds numbers. Here the friction factor increases
with the increase of concentration of EG-treated GNP. In addition, the friction factor
decreases with increasing the flow velocity, which is a common phenomenon. The
minimum value of the friction factor occurs for the basefluid.
0
20
40
60
80
100
120
140
160
180
200
220
240
260
4000 6000 8000 10000 12000 14000 16000 18000
Nus
selt
Num
ber
Re
0%
0.01%
0.05%
0.10%
0.20%
Univers
ity of
Mala
ya
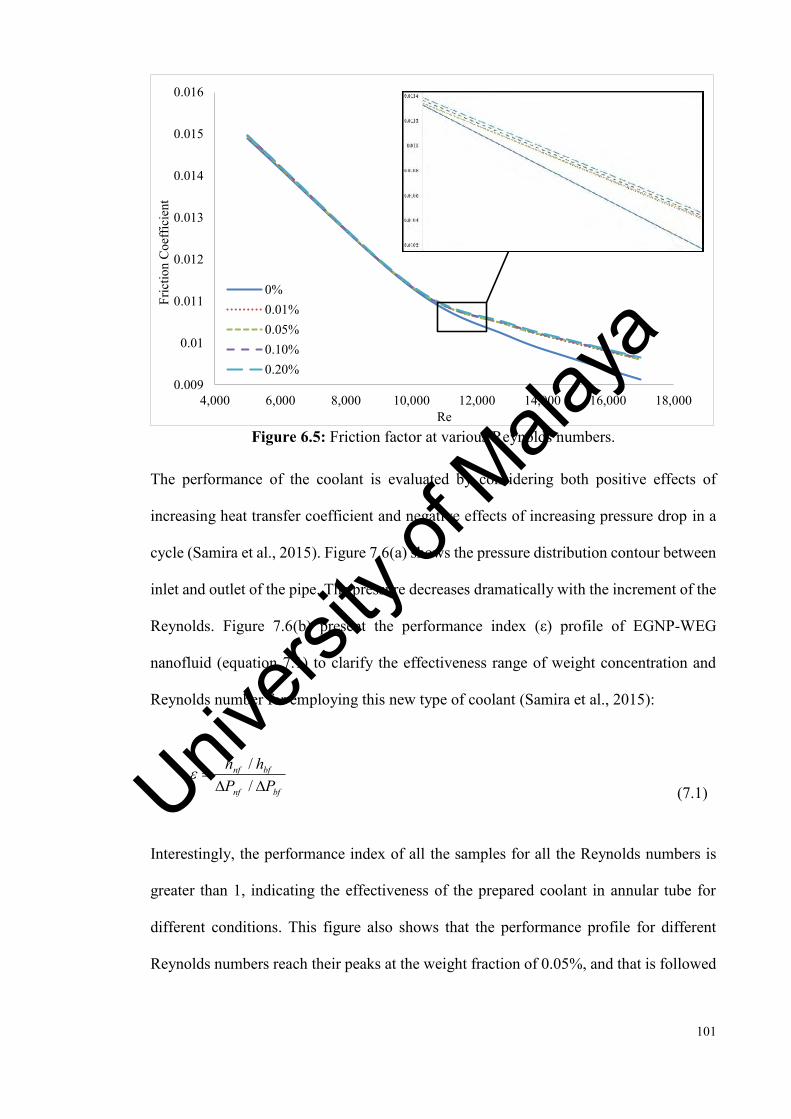
101
Figure 6.5: Friction factor at various Reynolds numbers.
The performance of the coolant is evaluated by considering both positive effects of
increasing heat transfer coefficient and negative effects of increasing pressure drop in a
cycle (Samira et al., 2015). Figure 7.6(a) shows the pressure distribution contour between
inlet and outlet of the pipe. The pressure decreases dramatically with the increment of the
Reynolds. Figure 7.6(b) present the performance index (ε) profile of EGNP-WEG
nanofluid (equation 7.1) to clarify the effectiveness range of weight concentration and
Reynolds number for employing this new type of coolant (Samira et al., 2015):
//
nf bf
nf bf
h hP P
(7.1)
Interestingly, the performance index of all the samples for all the Reynolds numbers is
greater than 1, indicating the effectiveness of the prepared coolant in annular tube for
different conditions. This figure also shows that the performance profile for different
Reynolds numbers reach their peaks at the weight fraction of 0.05%, and that is followed
0.009
0.01
0.011
0.012
0.013
0.014
0.015
0.016
4,000 6,000 8,000 10,000 12,000 14,000 16,000 18,000
Fric
tion
Coe
ffici
ent
Re
0%0.01%0.05%0.10%0.20%
Univers
ity of
Mala
ya

102
by a decrease in the performance index for further increase in the weight fraction of
EGNP.
Figure 6.6: (a) Distribution of flow pressure and (b) the performance index of the synthesized coolant versus weight concentrations of EGGNP for various Reynolds numbers in annular flow.
1.08
1.1
1.12
1.14
1.16
1.18
1.2
0.00% 0.02% 0.04% 0.06% 0.08% 0.10% 0.12% 0.14% 0.16% 0.18% 0.20% 0.22%
Perf
orm
ance
(ɛ)
Concentration (ϕ)(b)
5000
10000
13000
15000
17000
Univers
ity of
Mala
ya
103
7 CHAPTER 8: CONCLUSIONS AND FUTURE WORK
7.1 Conclusion
The new design of heat exchangers utilizing an annular distributor opens a new gateway
for realizing higher energy transportation. To realize this goal, graphene nanoplatelet-
Based Water Nanofluids with promising thermophysical properties were synthesized in
the presence of covalent and non-covalent functionalization. Thermal conductivity,
density, viscosity and specific heat capacity were investigated and employed as a raw data
for ANSYS-Fluent for utilizing in two-phase approach. After validation of the obtained
results by analytical equations, two special parameters the convective heat transfer
coefficient and the pressure drop were investigated. The study followed by investigation
of other heat transfer parameters in annular passage in the presence of graphene
nanoplatelets-based water nanofluids at different weight concentrations, input powers and
temperatures. As a result, Nusselt number profiles and friction factors are measured for
both of the synthesized nanofluids.
In a novel direct amidation, the multi-walled carbon nanotubes (MWCNT) are covalently
functionalized with Aspartic acid (Asp) to achieve a highly dispersible colloidal
suspension including MWCNT. Stability of the colloidal suspensions were estimated with
Uv-vis spectroscopy, where less than 20% sedimentation at the highest weight
concentration of 0.1% could be obtained. The prepared coolants have the promising
properties such as high thermal conductivity as compared with water. The prepared water-
based coolants with different weight fractions of MWCNT-Asp were experimentally and
numerically investigated in terms of heat transfer rate in a horizontal annular heat
exchanger. Forced convection heat transfer coefficient and pressure drop were
investigated in transition and turbulent regimes for three different heat fluxes and four
Univers
ity of
Mala
ya
104
weight fractions. A significant increase in heat transfer rate in the annular heat exchanger
has been obtained with the use of MWCNT-Asp nanofluid. Also poor change in the
pressure drop in the presence of different weight concentrations ensures this novel
alternative coolant as an alternative heat exchanging liquid. Also, the investigated
insignificant increase in pumping power for the nanofluids show its suitability for
industrial applications.
In order to improve the colloidal stability of Graphene Nanoplatelets (GNP) in aqueous
media, they were first functionalized with tetrahydrofurfuryl polyethylene glycol in a
quick electrophonic addition reaction method. To address this issue, surface
functionalization of GNP was analyzed by Raman spectroscopy, and thermogravimetric
analysis. In addition, the morphology of the treated samples were investigated by
transmission electron microscopy (TEM). The thermophysical properties of the samples
were experimentally investigated. In another investigation the convective heat transfer
coefficient and pressure drop of water-based TFPEG-treated GNP nanofluids
(TGNP/water) at various weight concentrations were numerically and experimentally
investigated and compared with that of the base fluid in an annular heat exchanger. From
the results it could be inferred that the addition of TGNP into the water improved the
convective heat transfer coefficient dramatically. The pressure drop of the prepared
samples generates an insignificant variation as compared with the base fluid. The steady-
state forced convective heat transfer experiments and simulation have been confirmed the
promising cooling capabilities of the TGNP/water.
Since graphene nanoplatelets (GNP) is a promising material due to desirable thermal
properties. The thermo-physical and heat transfer performance of the covalently
functionalized GNP-based water/ethylene glycol nanofluid in an annular channel has
Univers
ity of
Mala
ya

105
been taken under consideration. After measuring thermophysical properties of the
prepared samples, a computational fluid dynamics and experimental study has been
carried out to study the heat transfer and pressure drop of well-dispersed and stabilized
GNP nanofluids. The effect of concentration of GNP and Reynolds number at constant
heat flux (Check) / wall temperature boundary condition under turbulent flow regime on
convective heat transfer coefficient have been investigated. Based on the results, at
different Reynolds numbers, the convective heat transfer coefficient of the prepared
nanofluid is higher than that of the basefluid. Also, the enhancement of convective heat
transfer coefficient and the thermal conductivity increase with increase of GNP
concentration in basefluid. A significant enhancement on the heat transfer rate is
associated with the loading and well-dispersion of the GNP in the basefluid.
7.2 Future work
Experimental and numerical works in this study have shown some potential
improvements by using nanofluids for laminar convective heat transfer. The following
questions, however, should be addressed in future work:
1. The aggregation stage of nanoparticles in suspension, calculated by DLVO theory or
measured by DLS, was considered and thermal conductivity of nanofluid was able to be
calculated (Prasher, Phelan, et al., 2006). However, he model did not include the effects
from the flow field. Therefore, the aggregation kinetics and its related thermal
conductivity models in flowing conditions are unknown and require further research.
2. From the data and analysis of nanofluid viscosity, this study showed that nanofluid
could have an elongated aggregation chain in the flow field. Therefore, it is of interest to
Univers
ity of
Mala
ya
106
understand how nanoparticles will align in the flow field and affect the convective heat
transfer path.
3. Different base fluids and mixtures were studied. It was shown that different base fluids
changed the Hamaker constant between nanoparticles and hence changed the adhesive
potential between nanoparticles. The thermal conductivity results also indicated the
nanoparticle aggregation stage could change the enhancement magnitude of nanofluid
thermal conductivity. The change in adhesive potential between particles will also affect
aggregation kinetics no matter if the nanofluid is stationary or under flow. Therefore, will
different particle combinations affect convective heat transfer efficiency?
4. It is interesting to point out that since the size of nanoparticles is extremely small, the
interaction phenomena between nanoparticles, fluid molecules and the tube wall remains
unknown. Is there an optimal condition, such as flow loop geometry, nanoparticle size to
flow loop diameter, etc., when utilizing specific nanofluids?
5. As for stability point of view, how will nanofluids perform over a long time period?
Univers
ity of
Mala
ya
107
REFERENCES
Abu-Nada, E., Masoud, Z., & Hijazi, A. (2008). Natural convection heat transfer enhancement in horizontal concentric annuli using nanofluids. International Communications in Heat and Mass Transfer, 35(5), 657-665.
Abu-Nada, E., & Oztop, H. F. (2009). Effects of inclination angle on natural convection in enclosures filled with Cu–water nanofluid. International Journal of Heat and Fluid Flow, 30(4), 669-678.
Afshar, H., Shams, M., Nainian, S., & Ahmadi, G. (2009). Microchannel heat transfer and dispersion of nanoparticles in slip flow regime with constant heat flux. International Communications in Heat and Mass Transfer, 36(10), 1060-1066.
Akbari, M., Galanis, N., & Behzadmehr, A. (2011). A new model for nanofluid conductivity based on the effects of clustering due to Brownian motion. Heat Transfer—Asian Research, 40(4), 352-368.
Akbarinia, A., & Behzadmehr, A. (2007). Numerical study of laminar mixed convection of a nanofluid in horizontal curved tubes. Applied Thermal Engineering, 27(8), 1327-1337.
Akbarinia, A., & Laur, R. (2009). Investigating the diameter of solid particles effects on a laminar nanofluid flow in a curved tube using a two phase approach. International Journal of Heat and Fluid Flow, 30(4), 706-714.
Allen, C. L., Chhatwal, A. R., & Williams, J. M. (2012). Direct amide formation from unactivated carboxylic acids and amines. Chemical Communications, 48(5), 666-668.
Amiri, A., Ahmadi, G., Shanbedi, M., Savari, M., Kazi, S., & Chew, B. (2015). Microwave-assisted synthesis of highly-crumpled, few-layered graphene and nitrogen-doped graphene for use as high-performance electrodes in capacitive deionization. Scientific reports, 5.
Amiri, A., Maghrebi, M., Baniadam, M., & Heris, S. Z. (2011). One-pot, efficient functionalization of multi-walled carbon nanotubes with diamines by microwave method. Applied Surface Science, 257(23), 10261-10266.
Amiri, A., Maghrebi, M., Baniadam, M., & Zeinali Heris, S. (2011). One-pot, efficient functionalization of multi-walled carbon nanotubes with diamines by microwave method. Applied Surface Science, 257(23), 10261-10266. doi:http://dx.doi.org/10.1016/j.apsusc.2011.07.039
Amiri, A., Sadri, R., Ahmadi, G., Chew, B., Kazi, S., Shanbedi, M., & Alehashem, M. S. (2015). Synthesis of polyethylene glycol-functionalized multi-walled carbon nanotubes with a microwave-assisted approach for improved heat dissipation. RSC Advances, 5(45), 35425-35434.
Amiri, A., Sadri, R., Shanbedi, M., Ahmadi, G., Chew, B., Kazi, S., & Dahari, M. (2015). Performance dependence of thermosyphon on the functionalization approaches: An experimental study on thermo-physical properties of graphene nanoplatelet-based water nanofluids. Energy Conversion and Management, 92, 322-330.
Amiri, A., Sadri, R., Shanbedi, M., Ahmadi, G., Kazi, S., Chew, B., & Zubir, M. N. M. (2015). Synthesis of ethylene glycol-treated Graphene Nanoplatelets with one-pot, microwave-assisted functionalization for use as a high performance engine coolant. Energy Conversion and Management, 101, 767-777.
Amiri, A., Shanbedi, M., Eshghi, H., Heris, S. Z., & Baniadam, M. (2012). Highly dispersed multiwalled carbon nanotubes decorated with Ag nanoparticles in water and experimental investigation of the thermophysical properties. The Journal of Physical Chemistry C, 116(5), 3369-3375.
Univers
ity of
Mala
ya
108
Anoop, K., Sundararajan, T., & Das, S. K. (2009). Effect of particle size on the convective heat transfer in nanofluid in the developing region. International Journal of Heat and Mass Transfer, 52(9), 2189-2195.
Aravind, S. J., & Ramaprabhu, S. (2013). Graphene–multiwalled carbon nanotube-based nanofluids for improved heat dissipation. RSC Advances, 3(13), 4199-4206.
Aravind, S. S. J., Baskar, P., Baby, T. T., Sabareesh, R. K., Das, S., & Ramaprabhu, S. (2011). Investigation of Structural Stability, Dispersion, Viscosity, and Conductive Heat Transfer Properties of Functionalized Carbon Nanotube Based Nanofluids. The Journal of Physical Chemistry C, 115(34), 16737-16744. doi:10.1021/jp201672p
Arzani, H. K., Amiri, A., Kazi, S., Chew, B., & Badarudin, A. (2015). Experimental and numerical investigation of thermophysical properties, heat transfer and pressure drop of covalent and noncovalent functionalized graphene nanoplatelet-based water nanofluids in an annular heat exchanger. International Communications in Heat and Mass Transfer, 68, 267-275.
Assael, M., Chen, C.-F., Metaxa, I., & Wakeham, W. (2004). Thermal conductivity of suspensions of carbon nanotubes in water. International Journal of Thermophysics, 25(4), 971-985.
Assael, M., Metaxa, I., Arvanitidis, J., Christofilos, D., & Lioutas, C. (2005). Thermal conductivity enhancement in aqueous suspensions of carbon multi-walled and double-walled nanotubes in the presence of two different dispersants. International Journal of Thermophysics, 26(3), 647-664.
Azizi, M., Hosseini, M., Zafarnak, S., Shanbedi, M., & Amiri, A. (2013). Experimental analysis of thermal performance in a two-phase closed thermosiphon using graphene/water nanofluid. Industrial & Engineering Chemistry Research, 52(29), 10015-10021.
Barbés, B., Páramo, R., Blanco, E., & Casanova, C. (2014). Thermal conductivity and specific heat capacity measurements of CuO nanofluids. Journal of Thermal Analysis and Calorimetry, 115(2), 1883-1891.
Behzadmehr, A., Saffar-Avval, M., & Galanis, N. (2007). Prediction of turbulent forced convection of a nanofluid in a tube with uniform heat flux using a two phase approach. International Journal of Heat and Fluid Flow, 28(2), 211-219.
Berber, S., Kwon, Y.-K., & Tománek, D. (2000). Unusually high thermal conductivity of carbon nanotubes. Physical Review Letters, 84(20), 4613.
Bianco, V., Chiacchio, F., Manca, O., & Nardini, S. (2009). Numerical investigation of nanofluids forced convection in circular tubes. Applied Thermal Engineering, 29(17), 3632-3642.
Brege, J. J., Gallaway, C., & Barron, A. R. (2007). Fluorescence quenching of single-walled carbon nanotubes in SDBS surfactant suspension by metal ions: Quenching efficiency as a function of metal and nanotube identity. The Journal of Physical Chemistry C, 111(48), 17812-17820.
Buschmann, M. H., & Franzke, U. (2014). Improvement of thermosyphon performance by employing nanofluid. International Journal of Refrigeration, 40, 416-428.
Calmidi, V., & Mahajan, R. (1999). The effective thermal conductivity of high porosity fibrous metal foams. Journal of Heat transfer, 121(2), 466-471.
Carslaw, H. S., & Jaeger, J. C. (1959). Conduction of heat in solids. Oxford: Clarendon Press, 1959, 2nd ed.
Cheng, S., & Vachon, R. (1969). The prediction of the thermal conductivity of two and three phase solid heterogeneous mixtures. International Journal of Heat and Mass Transfer, 12(3), 249-264.
Univers
ity of
Mala
ya
109
Choi, S., Zhang, Z., Yu, W., Lockwood, F., & Grulke, E. (2001). Anomalous thermal conductivity enhancement in nanotube suspensions. Applied physics letters, 79(14), 2252-2254.
Crowe, L. M., Reid, D. S., & Crowe, J. H. (1996). Is trehalose special for preserving dry biomaterials? Biophysical journal, 71(4), 2087.
Das, S. K., Choi, S. U., Yu, W., & Pradeep, T. (2007). Nanofluids: science and technology: John Wiley & Sons.
Das, S. K., Putra, N., Thiesen, P., & Roetzel, W. (2003). Temperature dependence of thermal conductivity enhancement for nanofluids. Journal of Heat transfer, 125(4), 567-574.
Ding, Y., Alias, H., Wen, D., & Williams, R. A. (2006). Heat transfer of aqueous suspensions of carbon nanotubes (CNT nanofluids). International Journal of Heat and Mass Transfer, 49(1), 240-250.
Duka, B., Ferrario, C., Passerini, A., & Piva, S. (2007). Non-linear approximations for natural convection in a horizontal annulus. International Journal of Non-Linear Mechanics, 42(9), 1055-1061.
Eastman, J., Choi, U., Li, S., Thompson, L., & Lee, S. (1996). Enhanced thermal conductivity through the development of nanofluids. Paper presented at the MRS proceedings.
Eastman, J. A., Choi, S., Li, S., Yu, W., & Thompson, L. (2001). Anomalously increased effective thermal conductivities of ethylene glycol-based nanofluids containing copper nanoparticles. Applied physics letters, 78(6), 718-720.
Eastman, J. A., Phillpot, S., Choi, S., & Keblinski, P. (2004). Thermal transport in nanofluids 1. Annu. Rev. Mater. Res., 34, 219-246.
Evans, W., Fish, J., & Keblinski, P. (2006). Role of Brownian motion hydrodynamics on nanofluid thermal conductivity. Applied physics letters, 88(9), 093116.
Evans, W., Prasher, R., Fish, J., Meakin, P., Phelan, P., & Keblinski, P. (2008). Effect of aggregation and interfacial thermal resistance on thermal conductivity of nanocomposites and colloidal nanofluids. International Journal of Heat and Mass Transfer, 51(5), 1431-1438.
Fernandez-Seara, J., Uhía, F. J., Sieres, J., & Campo, A. (2007). A general review of the Wilson plot method and its modifications to determine convection coefficients in heat exchange devices. Applied Thermal Engineering, 27(17), 2745-2757.
Fotukian, S., & Esfahany, M. N. (2010a). Experimental investigation of turbulent convective heat transfer of dilute γ-Al 2 O 3/water nanofluid inside a circular tube. International Journal of Heat and Fluid Flow, 31(4), 606-612.
Fotukian, S., & Esfahany, M. N. (2010b). Experimental study of turbulent convective heat transfer and pressure drop of dilute CuO/water nanofluid inside a circular tube. International Communications in Heat and Mass Transfer, 37(2), 214-219.
Garg, P., Alvarado, J. L., Marsh, C., Carlson, T. A., Kessler, D. A., & Annamalai, K. (2009). An experimental study on the effect of ultrasonication on viscosity and heat transfer performance of multi-wall carbon nanotube-based aqueous nanofluids. International Journal of Heat and Mass Transfer, 52(21), 5090-5101.
GHOBADIAN, R., & MOHAMMADI, K. (2011). Simulation of subcritical flow pattern in 180 uniform and convergent open-channel bends using SSIIM 3-D model. 水科学与水工程, 4(3).
Hamilton, R., & Crosser, O. (1962). Thermal conductivity of heterogeneous two-component systems. Industrial & Engineering chemistry fundamentals, 1(3), 187-191.
Univers
ity of
Mala
ya
110
Heris, S. Z., Etemad, S. G., & Esfahany, M. N. (2006). Experimental investigation of oxide nanofluids laminar flow convective heat transfer. International Communications in Heat and Mass Transfer, 33(4), 529-535.
Hone, J., Whitney, M., Piskoti, C., & Zettl, A. (1999). Thermal conductivity of single-walled carbon nanotubes. Physical Review B, 59(4), R2514.
Hong, K., Hong, T.-K., & Yang, H.-S. (2006). Thermal conductivity of Fe nanofluids depending on the cluster size of nanoparticles. Applied physics letters, 88(3), 031901.
Hong, T.-K., Yang, H.-S., & Choi, C. (2005). Study of the enhanced thermal conductivity of Fe nanofluids. Journal of Applied Physics, 97(6), 064311.
Hosseini, S. M., Moghadassi, A., & Henneke, D. (2011). Modelling of the effective thermal conductivity of carbon nanotube nanofluids based on dimensionless groups. The Canadian Journal of Chemical Engineering, 89(1), 183-186.
Hwang, Y., Lee, J., Lee, C., Jung, Y., Cheong, S., Lee, C., . . . Jang, S. (2007). Stability and thermal conductivity characteristics of nanofluids. Thermochimica Acta, 455(1), 70-74.
Iijima, S. (1991). Helical microtubules of graphitic carbon. nature, 354(6348), 56-58. Ishii, M. (1975). Thermo-fluid dynamic theory of two-phase flow. NASA STI/Recon
Technical Report A, 75, 29657. Islam, M., Rojas, E., Bergey, D., Johnson, A., & Yodh, A. (2003). High weight fraction
surfactant solubilization of single-wall carbon nanotubes in water. Nano letters, 3(2), 269-273.
Izadi, M., Behzadmehr, A., & Jalali-Vahida, D. (2009). Numerical study of developing laminar forced convection of a nanofluid in an annulus. International Journal of Thermal Sciences, 48(11), 2119-2129.
Jang, S. P., & Choi, S. U. (2004). Role of Brownian motion in the enhanced thermal conductivity of nanofluids. Applied physics letters, 84(21), 4316-4318.
Jeffrey, D. J. (1973). Conduction through a random suspension of spheres. Paper presented at the Proceedings of the Royal Society of London A: Mathematical, Physical and Engineering Sciences.
Jha, N., & Ramaprabhu, S. (2008). Synthesis and Thermal Conductivity of Copper Nanoparticle Decorated Multiwalled Carbon Nanotubes Based Nanofluids. The Journal of Physical Chemistry C, 112(25), 9315-9319. doi:10.1021/jp8017309
Jiang, W., Ding, G., & Peng, H. (2009). Measurement and model on thermal conductivities of carbon nanotube nanorefrigerants. International Journal of Thermal Sciences, 48(6), 1108-1115.
Kashani, A., Jalali-vahid, D., & Hossainpour, S. (2013). Numerical study of laminar forced convection of water/Al2O3 nanofluid in an annulus with constant wall temperature. IIUM Engineering Journal, 14(1).
Keblinski, P., Phillpot, S., Choi, S., & Eastman, J. (2002). Mechanisms of heat flow in suspensions of nano-sized particles (nanofluids). International Journal of Heat and Mass Transfer, 45(4), 855-863.
Khanafer, K., Vafai, K., & Lightstone, M. (2003). Buoyancy-driven heat transfer enhancement in a two-dimensional enclosure utilizing nanofluids. International Journal of Heat and Mass Transfer, 46(19), 3639-3653.
Ko, G. H., Heo, K., Lee, K., Kim, D. S., Kim, C., Sohn, Y., & Choi, M. (2007). An experimental study on the pressure drop of nanofluids containing carbon nanotubes in a horizontal tube. International Journal of Heat and Mass Transfer, 50(23), 4749-4753.
Univers
ity of
Mala
ya

111
Koo, J., & Kleinstreuer, C. (2005). Impact analysis of nanoparticle motion mechanisms on the thermal conductivity of nanofluids. International Communications in Heat and Mass Transfer, 32(9), 1111-1118.
Kumar, D. H., Patel, H. E., Kumar, V. R., Sundararajan, T., Pradeep, T., & Das, S. K. (2004). Model for heat conduction in nanofluids. Physical Review Letters, 93(14), 144301.
Kwak, K., & Kim, C. (2005). Viscosity and thermal conductivity of copper oxide nanofluid dispersed in ethylene glycol. Korea-Australia Rheology Journal, 17(2), 35-40.
Launder, B. E., & Spalding, D. (1974). The numerical computation of turbulent flows. Computer methods in applied mechanics and engineering, 3(2), 269-289.
Lee, D.-L., & Irvine, T. F. (1997). Shear rate dependent thermal conductivity measurements of non-Newtonian fluids. Experimental Thermal and Fluid Science, 15(1), 16-24.
Lee, D. (2007). Thermophysical properties of interfacial layer in nanofluids. Langmuir, 23(11), 6011-6018.
Lee, D., Kim, J.-W., & Kim, B. G. (2006). A new parameter to control heat transport in nanofluids: surface charge state of the particle in suspension. The Journal of Physical Chemistry B, 110(9), 4323-4328.
Lee, S., Choi, S.-S., Li, S., and, & Eastman, J. (1999). Measuring thermal conductivity of fluids containing oxide nanoparticles. Journal of Heat transfer, 121(2), 280-289.
Li, C. H., Williams, W., Buongiorno, J., Hu, L.-W., & Peterson, G. (2008). Transient and Steady-State Experimental Comparison Study of Effective Thermal Conductivity of Al2O3∕ Water Nanofluids. Journal of Heat transfer, 130(4), 042407.
Li, Y., Tung, S., Schneider, E., & Xi, S. (2009). A review on development of nanofluid preparation and characterization. Powder Technology, 196(2), 89-101.
Liu, M.-S., Lin, M. C.-C., Huang, I.-T., & Wang, C.-C. (2005). Enhancement of thermal conductivity with carbon nanotube for nanofluids. International Communications in Heat and Mass Transfer, 32(9), 1202-1210.
Liu, M.-S., Lin, M. C.-C., Tsai, C., & Wang, C.-C. (2006). Enhancement of thermal conductivity with Cu for nanofluids using chemical reduction method. International Journal of Heat and Mass Transfer, 49(17), 3028-3033.
Liu, Z.-H., & Liao, L. (2010). Forced convective flow and heat transfer characteristics of aqueous drag-reducing fluid with carbon nanotubes added. International Journal of Thermal Sciences, 49(12), 2331-2338.
Liu, Z.-h., Yang, X.-f., & Guo, G.-l. (2010). Influence of carbon nanotube suspension on the thermal performance of a miniature thermosyphon. International Journal of Heat and Mass Transfer, 53(9), 1914-1920.
Lotfi, R., Saboohi, Y., & Rashidi, A. (2010). Numerical study of forced convective heat transfer of nanofluids: comparison of different approaches. International Communications in Heat and Mass Transfer, 37(1), 74-78.
Mahian, O., Kianifar, A., Kleinstreuer, C., Moh’d A, A.-N., Pop, I., Sahin, A. Z., & Wongwises, S. (2013). A review of entropy generation in nanofluid flow. International Journal of Heat and Mass Transfer, 65, 514-532.
Manninen, M., Taivassalo, V., & Kallio, S. (1996). On the mixture model for multiphase flow: Technical Research Centre of Finland Finland.
Maxwell, J. C. (1904). A Treatise on Electricity and Magnetism, vol. II. Clarendon: Oxford.
Univers
ity of
Mala
ya
112
Mehta, B., & Khandekar, S. (2007). Two-phase closed thermosyphon with nanofluids. Paper presented at the 14th International Heat Pipe Conference, April 22-27, 2007, Florianopolis, Brazil.
Meibodi, M. E., Vafaie-Sefti, M., Rashidi, A. M., Amrollahi, A., Tabasi, M., & Kalal, H. S. (2010). The role of different parameters on the stability and thermal conductivity of carbon nanotube/water nanofluids. International Communications in Heat and Mass Transfer, 37(3), 319-323.
Mirmasoumi, S., & Behzadmehr, A. (2008a). Effect of nanoparticles mean diameter on mixed convection heat transfer of a nanofluid in a horizontal tube. International Journal of Heat and Fluid Flow, 29(2), 557-566.
Mirmasoumi, S., & Behzadmehr, A. (2008b). Numerical study of laminar mixed convection of a nanofluid in a horizontal tube using two-phase mixture model. Applied Thermal Engineering, 28(7), 717-727.
Mohammed, H. A. (2008). Laminar mixed convection heat transfer in a vertical circular tube under buoyancy-assisted and opposed flows. Energy Conversion and Management, 49(8), 2006-2015.
Murshed, S., Leong, K., & Yang, C. (2005). Enhanced thermal conductivity of TiO 2—water based nanofluids. International Journal of Thermal Sciences, 44(4), 367-373.
Nagasaka, Y., & Nagashima, A. (1981). Absolute measurement of the thermal conductivity of electrically conducting liquids by the transient hot-wire method. Journal of Physics E: Scientific Instruments, 14(12), 1435.
Nan, C.-W., Birringer, R., Clarke, D. R., & Gleiter, H. (1997). Effective thermal conductivity of particulate composites with interfacial thermal resistance. Journal of Applied Physics, 81(10), 6692-6699.
Nanda, J., Maranville, C., Bollin, S. C., Sawall, D., Ohtani, H., Remillard, J. T., & Ginder, J. (2008). Thermal conductivity of single-wall carbon nanotube dispersions: role of interfacial effects. The Journal of Physical Chemistry C, 112(3), 654-658.
Özerinç, S., Kakaç, S., & Yazıcıoğlu, A. G. (2010). Enhanced thermal conductivity of nanofluids: a state-of-the-art review. Microfluidics and Nanofluidics, 8(2), 145-170.
Pang, C., Jung, J.-Y., Lee, J. W., & Kang, Y. T. (2012). Thermal conductivity measurement of methanol-based nanofluids with Al 2 O 3 and SiO 2 nanoparticles. International Journal of Heat and Mass Transfer, 55(21), 5597-5602.
Passerini, A., Ferrario, C., & Thäter, G. (2008). Natural convection in horizontal annuli: a lower bound for the energy. Journal of Engineering Mathematics, 62(3), 247-259.
Patel, H., Anoop, K., Sundararajan, T., & Das, S. K. (2008). Model for thermal conductivity of CNT-nanofluids. Bulletin of Materials Science, 31(3), 387-390.
Patel, H. E., Anoop, K., Sundararajan, T., & Das, S. K. (2006). A micro-convection model for thermal conductivity of nanofluids. Paper presented at the International Heat Transfer Conference 13.
Patel, H. E., Das, S. K., Sundararajan, T., Nair, A. S., George, B., & Pradeep, T. (2003). Thermal conductivities of naked and monolayer protected metal nanoparticle based nanofluids: Manifestation of anomalous enhancement and chemical effects. Applied physics letters, 83(14), 2931-2933.
Patel, H. E., Sundararajan, T., & Das, S. K. (2008). A cell model approach for thermal conductivity of nanofluids. Journal of Nanoparticle Research, 10(1), 87-97.
Univers
ity of
Mala
ya

113
Patel, H. E., Sundararajan, T., & Das, S. K. (2010). An experimental investigation into the thermal conductivity enhancement in oxide and metallic nanofluids. Journal of Nanoparticle Research, 12(3), 1015-1031.
Prasher, R., Evans, W., Meakin, P., Fish, J., Phelan, P., & Keblinski, P. (2006). Effect of aggregation on thermal conduction in colloidal nanofluids. Applied physics letters, 89(14), 143119.
Prasher, R., Phelan, P. E., & Bhattacharya, P. (2006). Effect of aggregation kinetics on the thermal conductivity of nanoscale colloidal solutions (nanofluid). Nano letters, 6(7), 1529-1534.
Putnam, S. A., Cahill, D. G., Braun, P. V., Ge, Z., & Shimmin, R. G. (2006). Thermal conductivity of nanoparticle suspensions. Journal of Applied Physics, 99(8), 084308.
Roy, G., Nguyen, C. T., & Lajoie, P.-R. (2004). Numerical investigation of laminar flow and heat transfer in a radial flow cooling system with the use of nanofluids. Superlattices and Microstructures, 35(3), 497-511.
Ryglowski, B. K. (2009). Characterization of Carbon Nanotube-Enhanced water as a phase change material for thermal energy storage systems. Monterey, California. Naval Postgraduate School.
Sakiadis, B. (1961). Boundary‐layer behavior on continuous solid surfaces: I. Boundary‐
layer equations for two‐dimensional and axisymmetric flow. AIChE Journal, 7(1), 26-28.
Samira, P., Saeed, Z. H., Motahare, S., & Mostafa, K. (2015). Pressure drop and thermal performance of CuO/ethylene glycol (60%)-water (40%) nanofluid in car radiator. Korean Journal of Chemical Engineering, 32(4), 609-616.
Sarsam, W. S., Amiri, A., Zubir, M. N. M., Yarmand, H., Kazi, S. N., & Badarudin, A. (2016). Stability and thermophysical properties of water-based nanofluids containing triethanolamine-treated graphene nanoplatelets with different specific surface areas. Colloids and Surfaces A: Physicochemical and Engineering Aspects, 500, 17-31. doi:http://dx.doi.org/10.1016/j.colsurfa.2016.04.016
Sastry, N. V., Bhunia, A., Sundararajan, T., & Das, S. K. (2008). Predicting the effective thermal conductivity of carbon nanotube based nanofluids. Nanotechnology, 19(5), 055704.
Schwartz, L. M., Garboczi, E. J., & Bentz, D. P. (1995). Interfacial transport in porous media: Application to dc electrical conductivity of mortars. Journal of Applied Physics, 78(10), 5898-5908.
Shahi, M., Mahmoudi, A. H., & Talebi, F. (2010). Numerical study of mixed convective cooling in a square cavity ventilated and partially heated from the below utilizing nanofluid. International Communications in Heat and Mass Transfer, 37(2), 201-213.
Shaikh, S., Lafdi, K., & Ponnappan, R. (2007). Thermal conductivity improvement in carbon nanoparticle doped PAO oil: An experimental study. Journal of Applied Physics, 101(6), 064302.
Shanbedi, M., Zeinali Heris, S., Baniadam, M., & Amiri, A. (2013). The effect of multi-walled carbon nanotube/water nanofluid on thermal performance of a two-phase closed thermosyphon. Experimental Heat Transfer, 26(1), 26-40.
Shih, T. M. (1984). Numerical heat transfer: CRC Press. Shin, S., & Lee, S.-H. (2000). Thermal conductivity of suspensions in shear flow fields.
International Journal of Heat and Mass Transfer, 43(23), 4275-4284. Shukla, R. K., & Dhir, V. K. (2005). Numerical study of the effective thermal conductivity
of nanofluids. Paper presented at the ASME 2005 Summer Heat Transfer
Univers
ity of
Mala
ya
114
Conference collocated with the ASME 2005 Pacific Rim Technical Conference and Exhibition on Integration and Packaging of MEMS, NEMS, and Electronic Systems.
Silvera-Batista, C. A., Scott, D. C., McLeod, S. M., & Ziegler, K. J. (2011). A mechanistic study of the selective retention of SDS-suspended single-wall carbon nanotubes on agarose gels. The Journal of Physical Chemistry C, 115(19), 9361-9369.
Sun, Z., Kohama, S.-i., Zhang, Z., Lomeda, J. R., & Tour, J. M. (2010). Soluble graphene through edge-selective functionalization. Nano Research, 3(2), 117-125.
Sundar, L. S., & Sharma, K. (2010). Turbulent heat transfer and friction factor of Al 2 O 3 nanofluid in circular tube with twisted tape inserts. International Journal of Heat and Mass Transfer, 53(7), 1409-1416.
Suttipong, M., Tummala, N. R., Kitiyanan, B., & Striolo, A. (2011). Role of surfactant molecular structure on self-assembly: aqueous SDBS on carbon nanotubes. The Journal of Physical Chemistry C, 115(35), 17286-17296.
Talebi, F., Mahmoudi, A. H., & Shahi, M. (2010). Numerical study of mixed convection flows in a square lid-driven cavity utilizing nanofluid. International Communications in Heat and Mass Transfer, 37(1), 79-90.
Tian, R., Wang, X., Li, M., Hu, H., Chen, R., Liu, F., . . . Wan, L. (2008). An efficient route to functionalize singe-walled carbon nanotubes using alcohols. Applied Surface Science, 255(5), 3294-3299.
Tillman, P., & Hill, J. M. (2007). Determination of nanolayer thickness for a nanofluid. International Communications in Heat and Mass Transfer, 34(4), 399-407.
Venerus, D. C., Kabadi, M. S., Lee, S., & Perez-Luna, V. (2006). Study of thermal transport in nanoparticle suspensions using forced Rayleigh scattering. Journal of Applied Physics, 100(9), 094310.
Vishwanadula, H. (2008). Experimental investigations on the flow of nanofluids through circular pipes: Southern Illinois University at Carbondale.
Wakeham, W. A., Nagashima, A., & Sengers, J. (1991). Measurement of the transport properties of fluids (Vol. 3): Blackwell Science Inc.
Wang, X.-Q., & Mujumdar, A. S. (2008). A review on nanofluids-part I: theoretical and numerical investigations. Brazilian Journal of Chemical Engineering, 25(4), 613-630.
Wang, X., Xu, X., & S. Choi, S. U. (1999). Thermal conductivity of nanoparticle-fluid mixture. Journal of thermophysics and heat transfer, 13(4), 474-480.
Wen, D., & Ding, Y. (2004). Effective thermal conductivity of aqueous suspensions of carbon nanotubes (carbon nanotube nanofluids). Journal of thermophysics and heat transfer, 18(4), 481-485.
Williams, W., Buongiorno, J., & Hu, L.-W. (2008). Experimental investigation of turbulent convective heat transfer and pressure loss of alumina/water and zirconia/water nanoparticle colloids (nanofluids) in horizontal tubes. Journal of Heat transfer, 130(4), 042412.
Wong, K. V., & Castillo, M. J. (2010). Heat transfer mechanisms and clustering in nanofluids. Advances in Mechanical Engineering, 2, 795478.
Xie, H.-q., Wang, J.-c., Xi, T.-g., & Liu, Y. (2002). Thermal conductivity of suspensions containing nanosized SiC particles. International Journal of Thermophysics, 23(2), 571-580.
Xie, H., Lee, H., Youn, W., & Choi, M. (2003). Nanofluids containing multiwalled carbon nanotubes and their enhanced thermal conductivities. Journal of Applied Physics, 94(8), 4967-4971.
Univers
ity of
Mala
ya

115
Xie, H., Wang, J., Xi, T., Liu, Y., Ai, F., & Wu, Q. (2002). Thermal conductivity enhancement of suspensions containing nanosized alumina particles. Journal of Applied Physics, 91(7), 4568-4572.
Xie, H., Yu, W., Li, Y., & Chen, L. (2011). Discussion on the thermal conductivity enhancement of nanofluids. Nanoscale research letters, 6(1), 124.
Xu, H.-K. (2004). Viscosity approximation methods for nonexpansive mappings. Journal of Mathematical Analysis and Applications, 298(1), 279-291.
Xuan, Y., & Li, Q. (2000). Heat transfer enhancement of nanofluids. International Journal of Heat and Fluid Flow, 21(1), 58-64.
Xue, H., Fan, J., Hu, Y., Hong, R., & Cen, K. (2006). The interface effect of carbon nanotube suspension on the thermal performance of a two-phase closed thermosyphon. Journal of Applied Physics, 100(10), 104909.
Xue, L., Keblinski, P., Phillpot, S., Choi, S.-S., & Eastman, J. (2004). Effect of liquid layering at the liquid–solid interface on thermal transport. International Journal of Heat and Mass Transfer, 47(19), 4277-4284.
Xue, Q.-Z. (2003). Model for effective thermal conductivity of nanofluids. Physics letters A, 307(5), 313-317.
Xue, Q. (2006). Model for the effective thermal conductivity of carbon nanotube composites. Nanotechnology, 17(6), 1655.
Xue, Q., & Xu, W.-M. (2005). A model of thermal conductivity of nanofluids with interfacial shells. Materials Chemistry and Physics, 90(2), 298-301.
Yoo, D.-H., Hong, K., & Yang, H.-S. (2007). Study of thermal conductivity of nanofluids for the application of heat transfer fluids. Thermochimica Acta, 455(1), 66-69.
You, S., Kim, J., & Kim, K. (2003). Effect of nanoparticles on critical heat flux of water in pool boiling heat transfer. Applied physics letters, 83(16), 3374-3376.
Yu, C.-J., Richter, A., Datta, A., Durbin, M., & Dutta, P. (1999). Observation of molecular layering in thin liquid films using X-ray reflectivity. Physical Review Letters, 82(11), 2326.
Yu, W., & Choi, S. (2003). The role of interfacial layers in the enhanced thermal conductivity of nanofluids: a renovated Maxwell model. Journal of Nanoparticle Research, 5(1-2), 167-171.
Yu, W., France, D. M., Routbort, J. L., & Choi, S. U. (2008). Review and comparison of nanofluid thermal conductivity and heat transfer enhancements. Heat Transfer Engineering, 29(5), 432-460.
Yu, W., & Xie, H. (2012). A review on nanofluids: preparation, stability mechanisms, and applications. Journal of Nanomaterials, 2012, 1.
Yu, W., Xie, H., & Bao, D. (2009). Enhanced thermal conductivities of nanofluids containing graphene oxide nanosheets. Nanotechnology, 21(5), 055705.
Zhang, Z., & Lockwood, F. E. (2004). Preparation of stable nanotube dispersions in liquids: Google Patents.
Zhu, H., Zhang, C., Liu, S., Tang, Y., & Yin, Y. (2006). Effects of nanoparticle clustering and alignment on thermal conductivities of Fe3O4 aqueous nanofluids. Applied physics letters, 89(2), 23123-23123.
Univers
ity of
Mala
ya

116
LIST OF PUBLICATIONS AND PAPER PRESENTED
ISI publications
1- Experimental and numerical investigation of thermophysical properties, heat transfer and pressure drop of covalent and noncovalent functionalized graphene nanoplatelet-based water nanofluids in an annular heat exchanger, HK Arzani, A Amiri, SN Kazi, BT Chew, A Badarudin, International Communications in Heat and Mass Transfer 68, 267-275 (2015)
2- Experimental investigation of thermophysical properties and heat transfer rate of
covalently functionalized MWCNT in an annular heat exchanger, HK Arzani, A Amiri, SN Kazi, BT Chew, A Badarudin, International Communications in Heat and Mass Transfer 75, 67-77 (2016)
3- Toward improved heat transfer performance of annular heat exchangers with
water/ethylene glycol-based nanofluids containing graphene nanoplatelets, HK Arzani, A Amiri, S Rozali , SN Kazi, A Badarudin, Journal of Thermal Analysis and Calorimetry (2016)
4- Heat transfer performance of water-based tetrahydrofurfuryl polyethylene glycol-
treated graphene nanoplatelet nanofluids, HK Arzani, A Amiri, SN Kazi, A Badarudin, BT Chew, RSC Advances 6 (70), 65654-65669 (2016)
5- Backward-facing step heat transfer of the turbulent regime for functionalized graphene nanoplatelets based water–ethylene glycol nanofluids, A Amiri, HK Arzani, SN Kazi, BT Chew, A Badarudin, International Journal of Heat and Mass Transfer 97, 538-546 (2016)
Conference Papers
1- Numerical Study of Developing Laminar Forced Convection Flow of Water/CuO Nanofluid in a Circular Tube with a 180 Degrees Curve, HK Arzani, HK Arzani, SN Kazi, A Badarudin, International Conference on Nanomaterials Science and Engineering (2016)
2- Thermophysical and Heat Transfer Performance of Covalent and Noncovalent
Functionalized Graphene Nanoplatelet-Based Water Nanofluids in an Annular Heat Exchanger, HK Arzani, A Amiri, HK Arzani, SN Kazi, A Badarudin, International Conference on Nanomaterials Science and Engineering (2016)
Univers
ity of
Mala
ya