LAMPlRAN - repository.wima.ac.idrepository.wima.ac.id/2747/9/Lampiran.pdf · Kuesioner ini...
24
LAMPlRAN
Transcript of LAMPlRAN - repository.wima.ac.idrepository.wima.ac.id/2747/9/Lampiran.pdf · Kuesioner ini...

LAMPlRAN
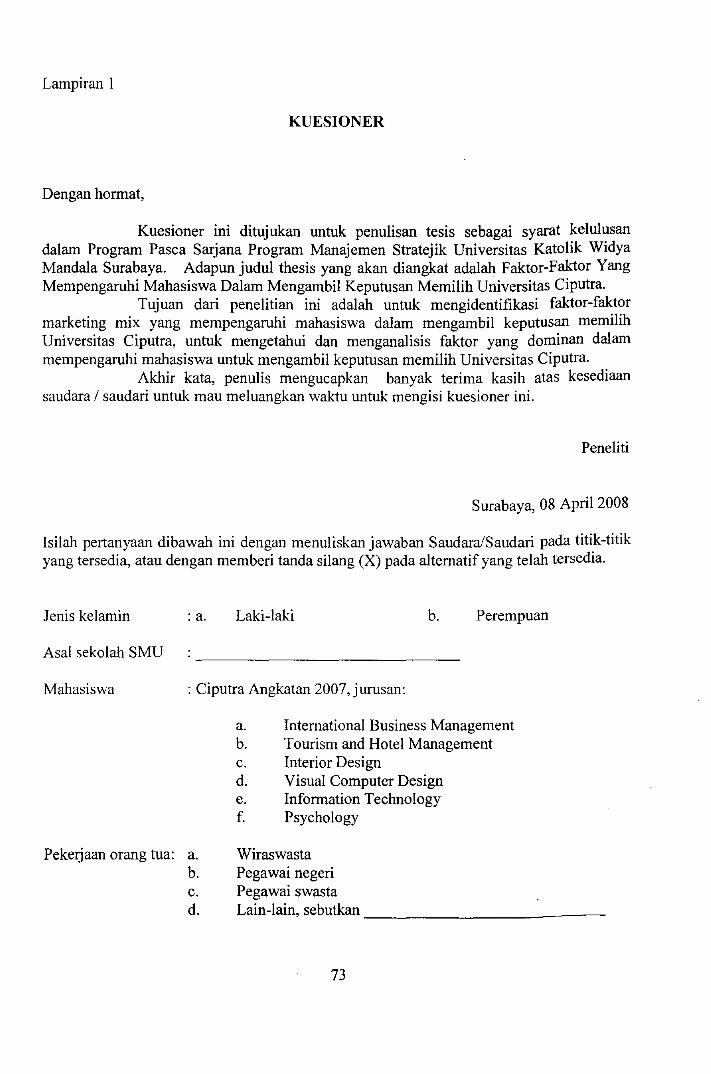
Lampiran 1
KUESIONER
Dengan hormat,
Kuesioner ini ditujukan untuk penulisan tesis sebagai syarat kelulusan dalam Program Pasca Sarjana Program Manajemen Stratejik Universitas Katolik Widya Mandala Surabaya. Adapun judul thesis yang akan diangkat adalah Faktor-Faktor Yang Mempengaruhi Mahasiswa Dalam Mengambil Keputusan Memilih Universitas Ciputra.
Tujuan dari peneiitian ini adalah untuk mengidentifikasi faktor-faktor marketing mix yang mempengaruhi mahasiswa dalam mengambil keputusan memilih Universitas Ciputra, untuk mengetahui dan menganalisis faktor yang dominan dalam mempengaruhi mahasiswa untuk mengambil keputusan memilih Universitas Ciputra.
Akhir kata, penulis mengucapkan banyak terima kasih atas kesediaan saudara / saudari untuk mau meluangkan waktu untuk mengisi kuesioner ini.
Peneliti
Surabaya, 08 April 2008
Isilah pertanyaan dibawah ini dengan menuliskan jawaban SaudaraiSaudari pada titik-titik yang tersedia, atau dengan memberi tanda silang (X) pada alternatif yang telah tersedia.
Jenis kelamin : a. Laki-Iaki b. Perempuan
Asal sekolah SMU
Mahasiswa : Ciputra Angkatan 2007, jurusan:
Pekerjaan orang tua: a. b. c. d.
a. International Business Management b. Tourism and Hotel Management c. Interior Design d. Visual Computer Design e. Information Technology f. Psychology
Wiraswasta Pegawai negeri Pegawai swasta Lain-lain, sebutkan ___________ ---
73
74
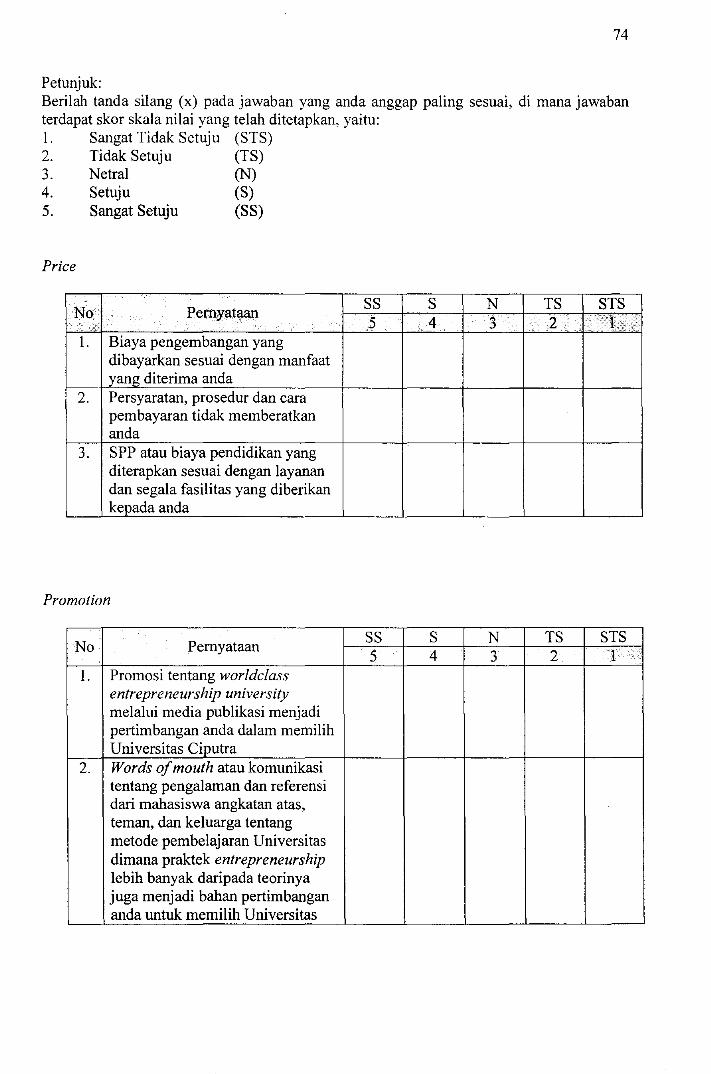
Petunjuk: Berilah tanda silang (x) pada jawaban yang anda anggap paling sesuai, di mana jawaban terdapat skor skala nilai yang te1ah ditetapkan, yaitu: I. Sangat Tidak Setuju (STS) 2. Tidak Setuju (TS) 3. N etral (N) 4. Setuju (S) 5. Sangat Setuju (SS)
Price
SS S N TS STS No Pernyataan
5 4 3 '. 2 ·1 •. · ... ···· 1. Biaya pengembangan yang
dibayarkan sesuai dengan manfaat yang diterima anda
2. Persyaratan, prosedur dan cara pembayaran tidak memberatkan anda
3. SPP atau biaya pendidikan yang diterapkan sesuai dengan layanan dan segala fasilitas yang diberikan kep.ada anda
Promotion
No Pemyataan SS S N TS STS 5 4 3 2 1
...
1. Promosi tentang worldclass entrepreneurship university melalui media publikasi menjadi pertimbangan anda dalam memilih Universitas Ciputra
2. Words o/mouth atau komunikasi tentang pengalaman dan referensi dari mahasiswa angkatan atas, ternan, dan keluarga tentang metode pembelajaran Universitas dimana praktek entrepreneurship lebih banyak daripada teorinya juga menjadi bahan pertimbangan anda untuk memilih Universitas
75
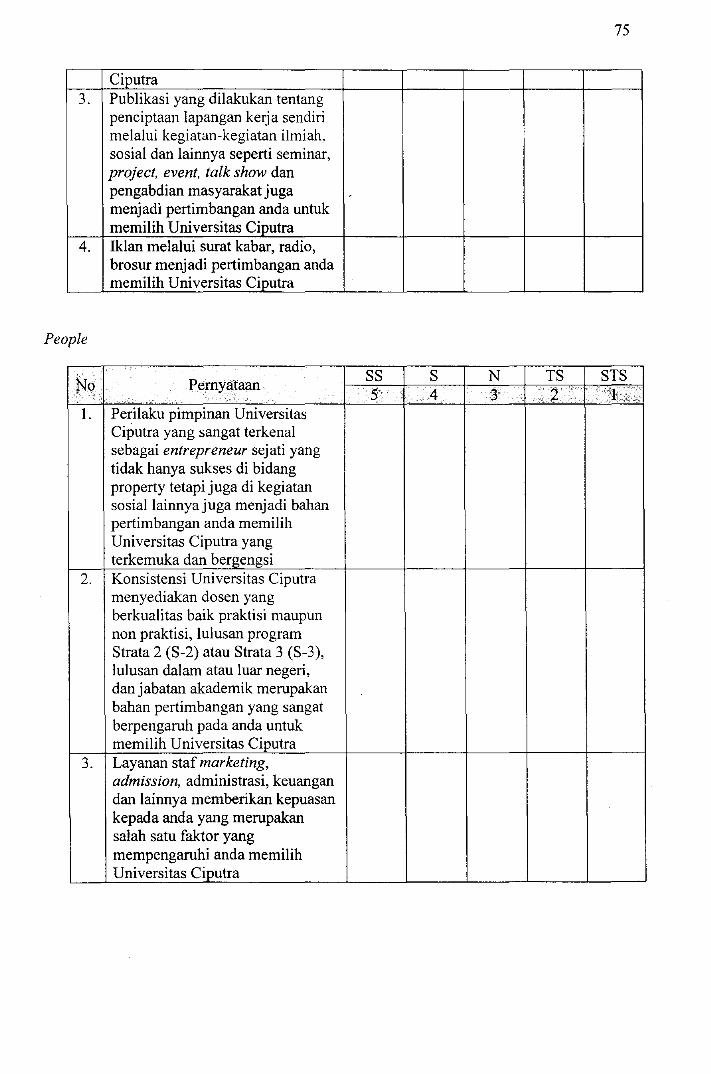
Ciputra 3. Publikasi yang dilakukan tentang
penciptaan lapangan kerja sendiri melalui kegiatan-kegiatan ilmiah, so sial dan lainnya seperti seminar, project, event, talk show dan pengabdian masyarakat juga menjadi pertimbangan anda untuk memilih Universitas Ciputra
4. Iklan melalui surat kabar, radio, brosur menjadi pertimbangan anda memilih Universitas Ciputra
People
No Pemyataan SS S N IS SIS 5 .. 4 3 2 ...•. .·..l:>T
1. Perilaku pimpinan Universitas Ciputra yang sangat terkenal sebagai entrepreneur sejati yang tidak hanya sukses di bidang property tetapi juga di kegiatan sosiallainnyajuga menjadi bahan pertimbangan anda memilih Universitas Ciputra yang terkemuka dan bergengsi
2. Konsistensi Universitas Ciputra menyediakan dosen yang berkualitas baik praktisi maupun non praktisi, lulusan program Strata 2 (S-2) atau Strata 3 (S-3), lulusan dalam atau luar negeri, danjabatan akademik merupakan bahan pertimbangan yang sangat berpengaruh pada anda untuk memilih Universitas Ciputra
3. Layanan staf marketing, admission, administrasi, keuangan dan lainnya memberikan kepuasan kepada anda yang merupakan salah satu faktor yang mempengaruhi anda memilih Universitas CiRutra
76
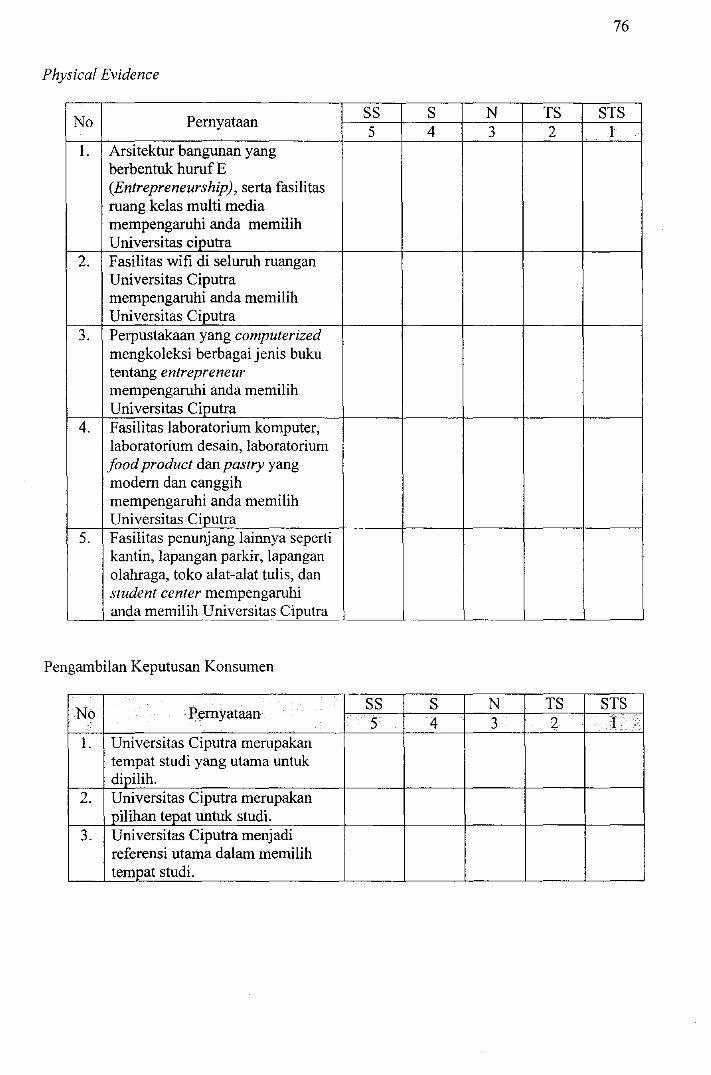
Physical Evidence
No Pemyataan SS S N TS STS 5 4 3 2 1
1. Arsitektur bangunan yang berbentuk huruf E (Entrepreneurship), serta fasilitas ruang kelas multi media mempengaruhi anda memilih Universitas cip_utra
2. Fasilitas wifi di seluruh ruangan Universitas Ciputra mempengaruhi anda memilih Universitas Ciputra
3. Perpustakaan yang computerized mengkoleksi berbagai jenis buku tentang entrepreneur mempengaruhi anda memilih Universitas Ciputra
4. Fasilitas laboratorium komputer, laboratorium desain, laboratorium food product dan pastry yang modem dan canggih mempengaruhi anda memilih Universitas Ciputra
5. Fasilitas penunjang lainnya seperti kantin, lapangan parkir, lapangan olahraga, toko alat-alat tulis, dan student center mempengaruhi anda memilih Universitas Ciputra
Pengambilan Keputusan Konsumen
No Pemyataan SS S N TS STS 5 4 3 2 1
1. Universitas Ciputra merupakan tempat studi yang utama untuk dipilih.
2. Universitas Ciputra merupakan pilihan tepat untuk studio
3. Universitas Ciputra menjadi referensi utama dalam memilih tempat studio
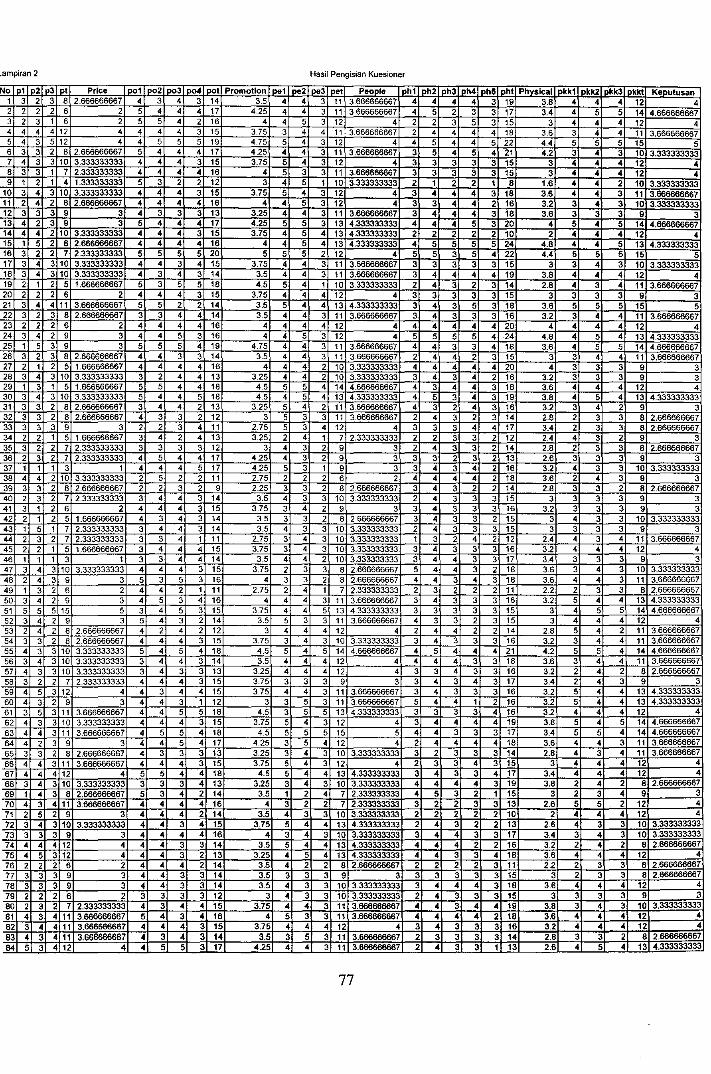
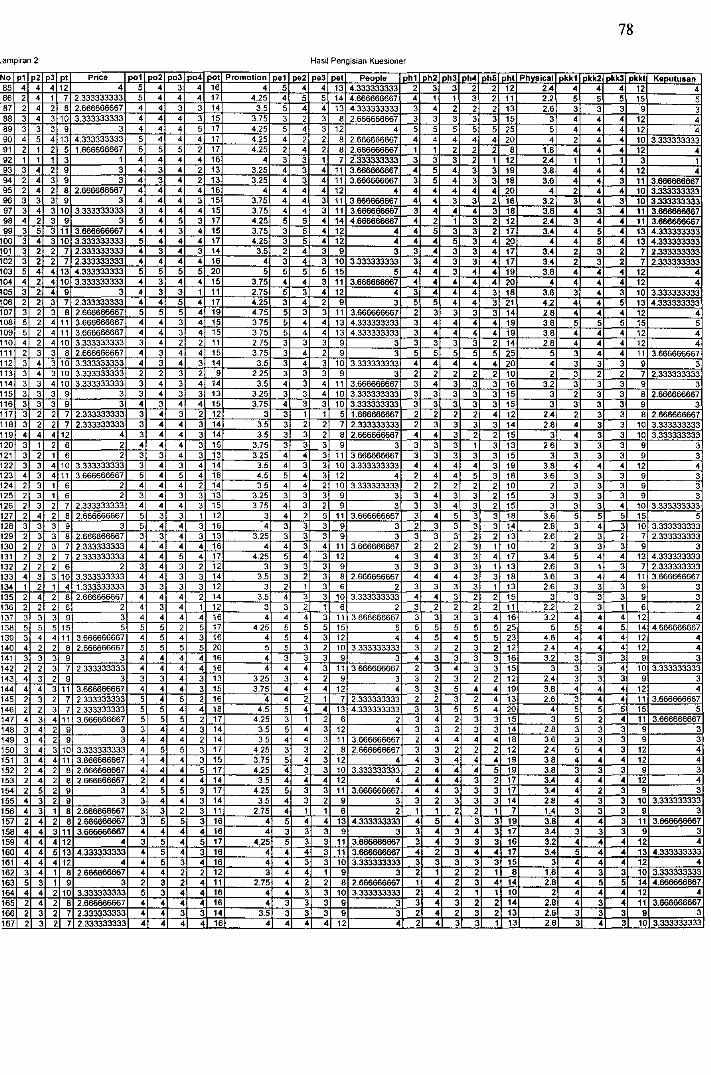
ILamp;ran 2 HasH Pengisian Kuesioner
INc a' I a2iP3 at Price Ip01 Ip02 p03 I P<>' pc ; loe2 loe3 IDet Ie I ah1 I ph: lah, I ah4 ph I aht rDkk' Dkk: I Dkk3 8 4 4 3.5 4 -. jC • 4 4 4 4 1:
26 2 5 4 4 _1 4.2' 4 4 4 ,. 6 5 4 4 .-,c
4 4 4 1: 4 4 1 ~ 4 4 4 4 4 5 4. 4 5
8 4 4.2' --, riO 4 H 3.71
4 4 H
~I~ 10 2 :aI 4 4 4 ~. •
8 4 4 -5 ., I. 6::~: 13 .
,." 3. 4 1: 3 • 4,
" • 3. -, :~ --,-,
~ 4 5 • ,.
~E 4 15 3. " 1
~ ~
11 3 _'4 3 1! 5 18 4.5 5 11 4 -< , ~ 2.
20 22 6 4 4 ....1§. '1,75 4 4 4 4 21 5 14 3.5 1: 4. 4 '" " 2: 4 14 3.5 4 4 2: 6 4 4 4 16 4 4 4 4 " 24 -. 9 4 4 16 4 312 4 5 1.8 5 1: 25 5 3 5 5 19 4.75 4 \6 5 1· I~ 26 8~ 4 4 14 3.5 " 1 ';~
, 4 !5 3 4 1 3.6666 27 12 5 1. 4 4 4 ...!!j 4 4 4 4 28 4 110 4 1: 3. 4 4 3 29 5 18 1 .~ ...... 3 4
30 4 18 4 4. 333: 4 3 4 4 1: 3 4 32 11 1
33 3 , 2 , .J ~, 4 1: 4
• 1 3.25 U 3 1 E .3 2.8
4 1 4.25 4 2.6 4.25 , 4 4 111~~ 1 2 --, 3.6
35 12. 2.2 2.6 4C 4 14 3 1 41 3 , 1 3. ~ 2 " 42 4 3 8 4 15 4 1C
4 , 4 3. 4 1[ 3 3 1 ... 3 4 1[ 4 2 2.4 4 ., 4 3: 1C 4 4 4 46 -, -, 1 4 3. 1C 47 4 11C 4 4 3. 8 3.1 -." 5 8
~ 4 4 18 4
49 4 4 2 1 2.75 4 3 !~ 50 4 4 4 ,. 3.: 5 4
5" 5 5 1 3 4 -4 " 1:
5: " 3. 5 4 4 4 4 5: 4 1: 4 4 4 • 4 2. 54 2 ~ 4 4 15 3.75 10 4 3 :f 4 55 4 5 18 4.5 5 4 14 4 5 4 4. 4 I~ 56 4 4 14 3.5 4 -4 4 4 4 4 3 4 3. 5~ 4 3 3 13 3.25 4 -. 412 4 3 3 3. 58 4 4 15 3.75 4 3.4 59 It 15 3.75 -. 1 :~ 4 :f -. 6C 4 9 4 1: 3 4 3. 4
-61
I~ 4 11 4.5 ' 4. 4 3 4 4
62 4 4 4 .J 3. 5 -" 2 12 4 4 1 3]j ! -. 6 4-" 4 5 3.4 5 I~ 64 4 3 9 3 4 4 5 4. 3 -5 4 1, 4 1 -'0 65 4 3. 3 14 2.8 66 4 4" 4 4 1
~ 4
4 5 " 1 ....,.. 1 4 I} 33333: 1C 3.8
3 ,:3: 3333: I 9 3
4 4 4
" EI 4 1! 3.7: --,-:
I~ 1G :3333 33: 4 4 1: 16
4 5 4 4 1: 1.3331 4 4 18 4 8 " ~ 3 , 3 3 15
7' 4 11 4 4 1E 3.' -y, 4 11
I~ 15
8' 3.75 4 -. 1· -" 4 l-"
" • 4 18 3.6 8 13.66€ 4 4 1 3.75
,~ 16 :f
B 3. 4 5 14 2. I~ 8 4 5 5 1: -. 1: -.: 1 14.
77
78
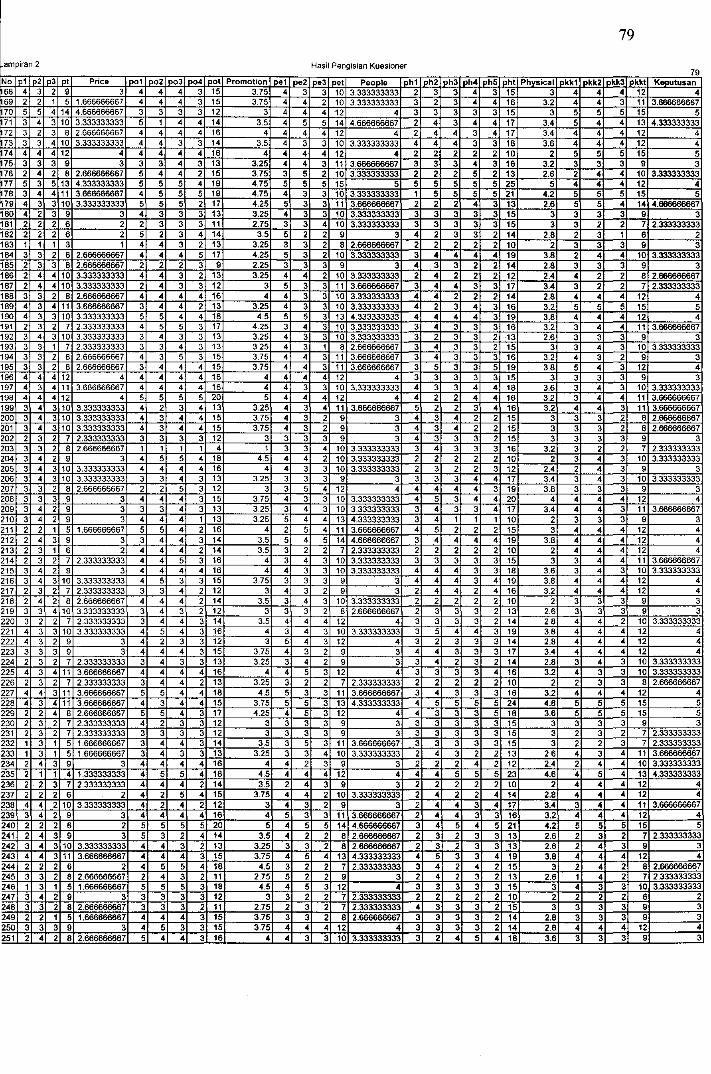
,ampiran 2 Hasil Pengisian Kuesioner
No I 011 0: IDllDt Price 1001 1002 00: 10041 pot ,e1 I De: I De: IDet PeDDie IDh1 loh2 oh: loh loh! 101 -. 5 4 16 "5 "4 "4 13 4 4 4 5 4 4 4 4. 4 5 5 14 :~ 4 " 1 4 ~
4 3. .. 4 '" 2 4 13.33: 4 4 1Ji 3. 8
IRQ 4 4 4. .. -" -. 5 4 4 190 4 5 4 4 4..1 4.2 8 4 4 4 19' 11. 5 5 4 8
~ 2 4 4 4
192 4 4 4 193 4 4 4 3.2 4
~ 4 IQ;j -. 4 4 3.25 -. 4 195 4 4 4 4 4 4 4
II If) 4 4 3.7
IE
4 3.7! 5 4.2! 2.4
g 4 3. 3A 4 4.2! 4 4
4 4 3. 3.4
~ '111 4 4 L333~
3.33~ 3'- l' 2.-
4 4.: 4 4
~ 4. ~
4 15 3.71 4 5 5 15 3 4 4 4 l' 2.71 12 4
4 4 15 3.71 5 10 4 14 3. 4 4 9 3
11 10 l333~~ 9 2.25 3 10 3.333: l3~ 14 3. 4 4 9
1 9 1: 3.25 ~~33: "3 3 8 9 4 15 1.7 4 3 3.: l333: 3 3 9
11' 1:
Immi 2.4 8~ i1R 4 14 , 12. 3 l 2.8 3 1013.
119 4 4 4 14 12. 4 4 10 121: 4 4 1 3 2. "3 3 12 3 4 4 4 12:
I~ 4 4 4 4 -.
12: 4 4. -. ,. 4 3 3 12' 4 4 , 125 E 3.21 4
15 3.71 -. 1 , 4 10
! : 4 4 5 5 5 , 4 1 lC:~ 129 3 EI~ 3 3.25 1 " 2. l333~
13' 4 4 425 4 4 1l 6 3 1: 3 f6 ,
I~ 13: 4 10 4 4 3.5 4 4 l.6 4 134 1 1 1.6 9 135 4 8 4 4 4 " 3.5 10 4 3 "3 "3 3 136 4
"'" 4 4 1 1 -. 138 ..1 42: 1 E 5 5 4 139 4 4 4 4 4 1: 4 4 4.' 4 4 i4n 5 5 20 1C 1 141 4 4 4 16 4 3 9 ,. 4 4 4 4 l' 4 1 4 143 4 '3 4 ~ 3.25 4 9 14. 44
111& 4 3.7 4 4 4 4 19 4
145 12.33: 5 1 4 ,. ?: 1
146 2.33: 4. 4 4 2( i4' 111 l' 4. l' 14! 4 9 14 3. 12 4 3 2
'" 9 14 3. 4 4 4 3 11[ 4. a 1: 4
4 11 3.7 1 4 j] " 4
I~ 4 4 4 4.2! 10
4 4 l' 3. 1 1: 4 3 4 5 5 4.2! 1
9 4 4 l' 3. 9 1C 4 a . l 3 2 11 2.15 6 1
15, 81~ 5 1. 4 I' 158 11 3 9 3: 159 4 " 4.25 3. 4 1:
'~ :l 1:
4 10 3.: l33~ 1: -4 9 10
2.75 8~ 3 4 '2 14 110 10 3. 1:
a~ 9 4 2. 1 .
14 3.5 3 4 3 2 Ts 9 4 16 4 4 2.6 10
79
.ampiran 2 Hasil Pengisian Kuesioner 79
No I e' Ie: I e: let Price leo' Ip02 I po: Ip,,",lpo I pOl pet People ,ph2 loh3 ,ph4 I phS ph. Ie' iBA" Q 4 1! 3.75 4 4 4 4 169 4 • 1! 3.75 • • • 4 4 17[ 5 5 .11. 1: " --. " 171 34 3116 • ~4 3.5 4 5 4 4 5 4 17: 8 • • 16 4 4 4 4 m --:, !iii 4 3 3. 4 4 4 ~74 • • 4 4 4 • 5 5 m , g 3 • 1.25 --. 3 3 H6 4 8 4 4 4 ~T 5 5
.1
4 '78 -" :~ 5 --. 5 5 \7 3 1 • 4
1 4 1 3 1 --, 3 · ,. 4
1 3 ~ 5 4 13.333: 3 4 4
185 2 4 186 24 4m 4 4 3 2 3.25 4 4 1( 187 4 411( 4 ~~ 4 11 , ~
4 4 310 a; 4 411' 4 4
11 " 110 5 • 18 ,-~ 4 4
3 • 3 1: 4 3.333: 4 4 4
4
~ 3 3 l' 19 33 28 • 3 5 3 15 3.75 4 : 3· 3 3 195 4 4 15 3.75 4 196 " - 4 " • • • ,-197 4 4 4 4 • 4 4 4 4 198 4 4 4 5 5 5 4 4 • 4 iQO ~
4 3.25 1 3. 11 '~ 20C • • 4 3.7 4 4 12. 201 = 4 4 3.7 202 3 1 2[ 4 11 16 2I>i 4 • 4. " 2 10 1C 205 4 • 16 11 3 1: !O< 4 32 9 • 4 1: 4
5 -",- • 4 19 ,
!Of 4 1 3. 3 1( 3 , • 20 , 4 , !Of 4 325 1( 4 1 , 4 >1 g 4 3.25 --. --. "1'l 4 1 10 l 3 2 5 4 , 5 • 1 , 5 15 , • 1: 71 9 4 3 4 51.
~~~~ 4 • 4 1! 1:
2' 3.1 11 1: 2' 4 5 • 10
33:~ 1! 4 11
?iC 9 3 • , 1C 4 4 11 3.' 10 2' 10 4 3.71 9 4 4 4 • 11 4 4 12 21 4 9 4 4 4 11 4 4 4 1: 2iB 24 28 • 4 4 1, 3. 4 310 2 10 3 3 2' ,10 8 no
1101~333~ 14 3. 1: --. 10
22' 4 16 10 4 1: 4 2: 4 9 1: • !.8 4 1: 4 , 9 15 3.75 4 9 f4 -" 1: 4 2: 3.25 3 3 1.8 4 1013.~ 2: 4 ~
4 4 • 4 16 10 3.33: 2: 2 4 4 3.25 3 '2 2 2 2 10 3
• 4. 5 I~
4 228 4 3.75 " 4 '.2' 4 4
2:l1 9 1 232 4 4 3 3 3 3 ~ 23 4 3. 4 1C 2.6 234 4 .' I , , 4 4 --. l 4 1l 2.4 :~ 235 , 5 4. 4 4 , 4 5 5 2: 4.6 --, 4 3. 4
€ 3.71 4 4 4 --. 11C 1: 4 1 -j, 4
5 5 ~
5 15 4 5 3 4 3.
~ --. 3.
~ 2. f6
~ 3 18 12 4 247 1:
"4' ~ 1 2.
~ ~
4 15 3. 12.' 3 4 15 3.75 4 1 -2 4 5 _l~ 4 4 3 4 5 3
80
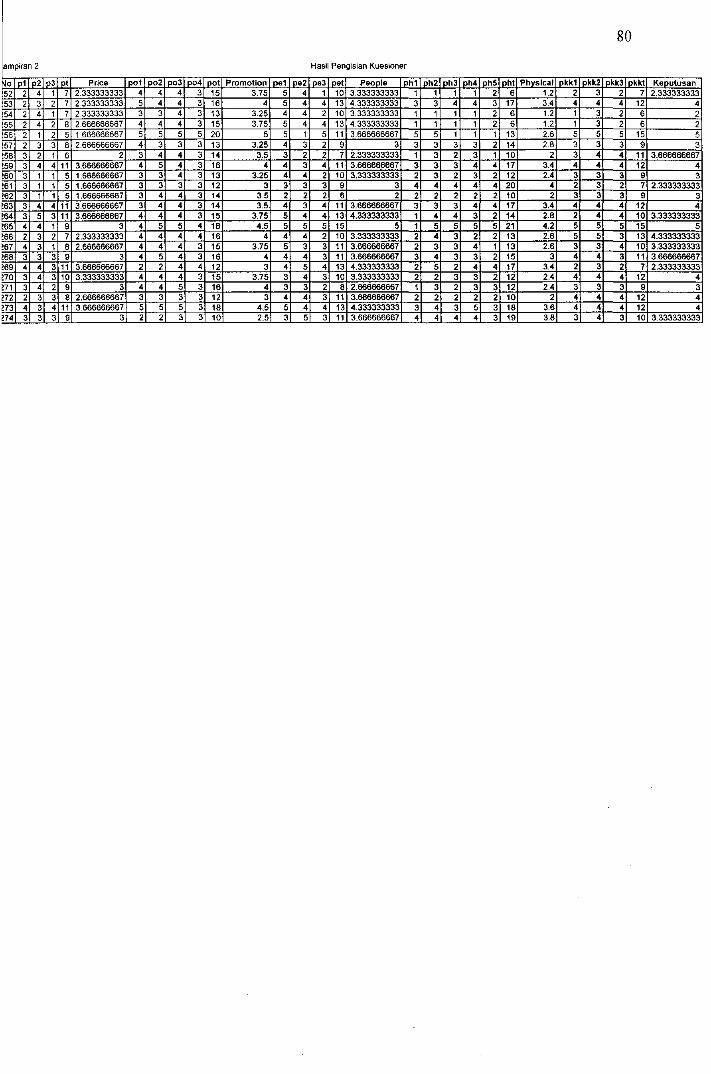
lamPiran 2 Hasil Pengisian Kuesioner
Ipllp: Ip: Price I pOl I po, pOJ Ip041 pc i I pe' I pe2 IpeJlp, People I ph Iph. I ph: I ph4 I ph5 I phil Physical I pkk' , 4 4 4 1 3. 5 4
I~ 1 6
4 4 4 4 3 . 3.4 1, 54 , 4 4 3.2E 4 4 6
155 4 4 1 E 3.lE 5 4 4 13 . 6 1 '2 E 156 51~ 5 2C 5 5 2.6 15
8 2. 4 3 3 1, 3.2E 4 3 2 9 3 3 3 2 14 2.8 '1 '9 6 4 4 3. 1
~ 5 4 4 11~ 3.4 --, 3 4 3. 4 4 13.33: 2.4
1 1 :& 4 3.
!~ 4 4 3. 4 4 3 5 4 1 3. 5 4 4 4 3 5 11 4.
L~ 4 11
'I 4 3 4 3.71
5 13. !69 4 4
~ 4
170 3 4 3 4 3.71 1 . 4 4
17: 3
~ 4
17: 4 4 5 5 4. 4 174 11 2. 4 4 19 3.:
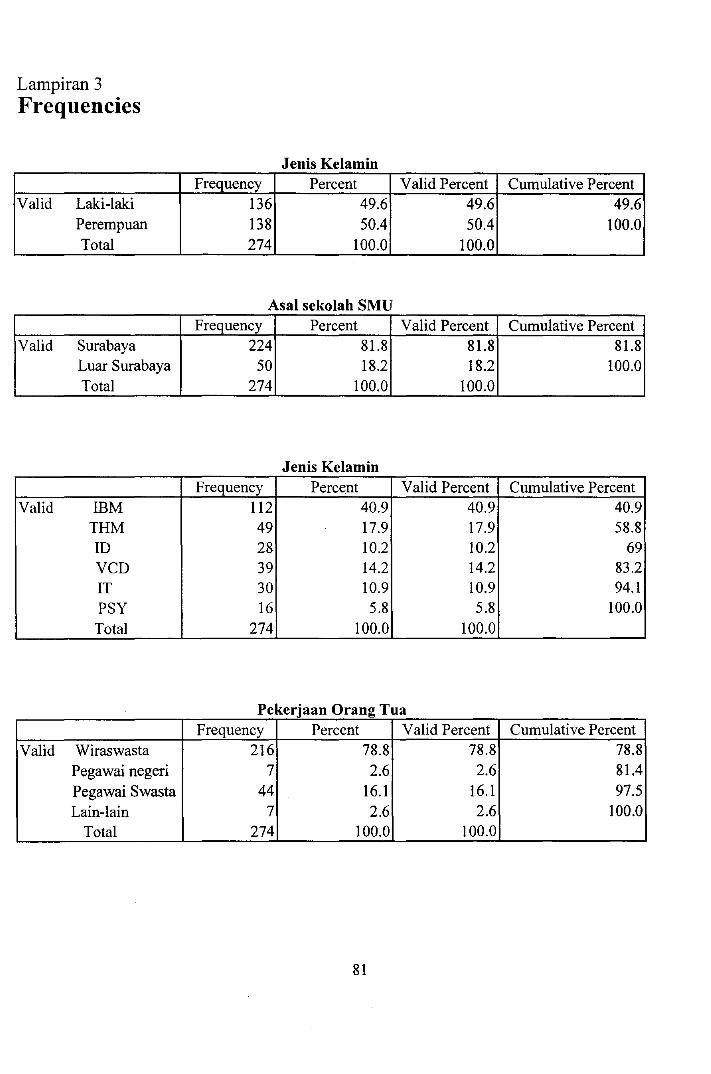
Lampiran 3 Frequencies
Valid LaId -laId Perempuan Total
Valid Surabaya Luar Surabaya Total
Valid IBM THM ID VCD IT PSY Total
Valid Wiraswasta Pegawai negeri Pegawai Swasta Lain-lain
Total
Jenis Kelamin Frequency Percent Valid Percent Cumulative Percent
136 49.6 49.6 49.6 138 50.4 50.4 100.0 274 100.0 100.0
Asal sekolah SMU Frequency Percent Valid Percent Cumulative Percent
224 81.8 81.8 81.8 50 18.2 18.2 100.0
274 100.0 100.0
Jenis Kelamin Frequency Percent Valid Percent Cumulative Percent
112 40.9 40.9 40.9 49 17.9 17.9 58.8 28 10.2 10.2 69 39 14.2 14.2 83.2 30 10.9 10.9 94.1 16 5.8 5.8 100.0
274 100.0 100.0
Pekerjaan Orang Tua Frequency Percent Valid Percent Cumulative Percent
216 78.8 78.8 78.8 7 2.6 2.6 81.4
44 16.1 16.1 97.5 7 2.6 2.6 100.0
274 100.0 100.0
81
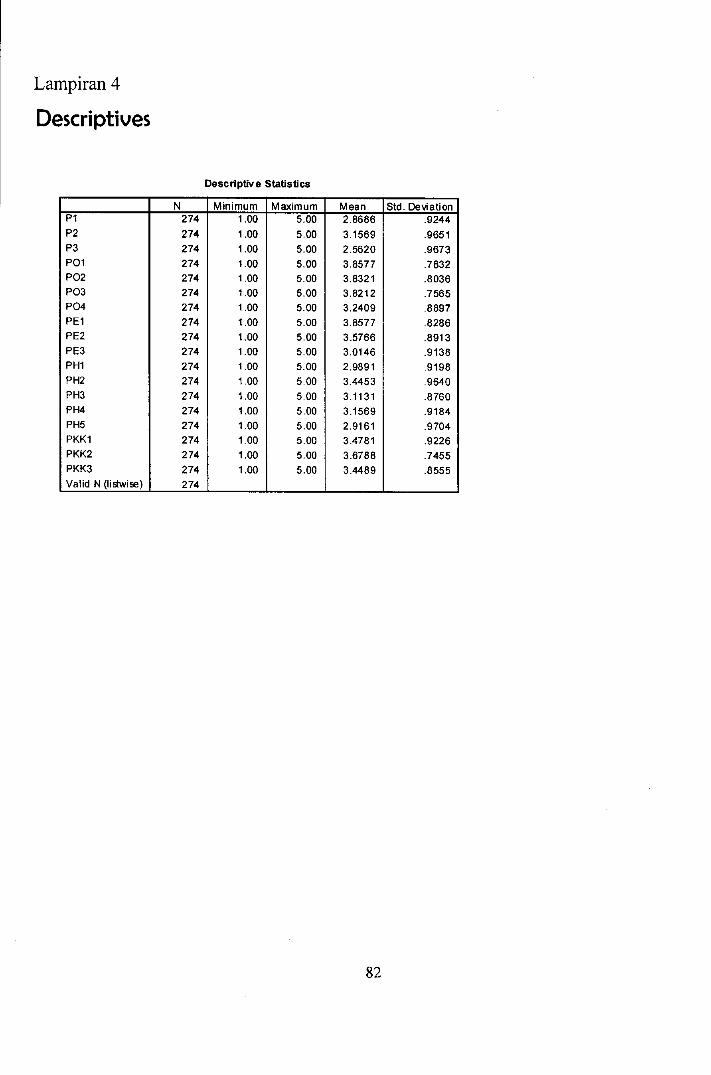
Lampiran 4
Descriptives
Descriptive Statistics
N Minimum Maximum Mean Std. Deviation Pl 274 1.00 5.00 2.8686 .9244 P2 274 1.00 5.00 3.1569 .9651 P3 274 1.00 5.00 2.5620 .9673 POl 274 1.00 5.00 3.8577 .7832 P02 274 1.00 5.00 3.8321 .8036 P03 274 1.00 5.00 3.8212 .7565 P04 274 1.00 5.00 3.2409 .8897 PEl 274 1.00 5.00 3.8577 .8286 PE2 274 1.00 5.00 3.5766 .8913 PE3 274 1.00 5.00 3.0146 .9138 PHl 274 1.00 5.00 2.9891 .9198 PH2 274 1.00 5.00 3.4453 .9640 PH3 274 1.00 5.00 3.1131 .8760 PH4 274 1.00 5.00 3.1569 .9184 PH5 274 1.00 5.00 2.9161 .9704 PKKl 274 1.00 5.00 3.4781 .9226 PKK2 274 1.00 5.00 3.6788 .7455 PKK3 274 1.00 5.00 3.4489 .8555 Valid N (Iistwise) 274
82
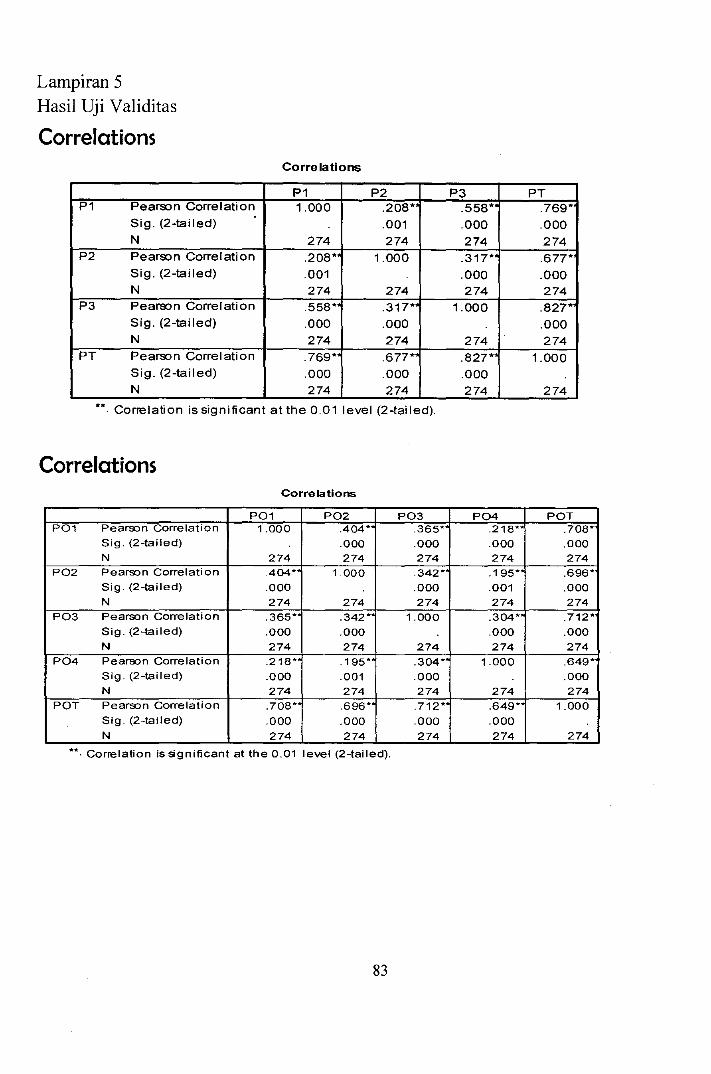
Lampiran 5 Hasil Uji Validitas
Correlations Correlations
P1 P2 P3 PT P1 Pear&>n Correlation 1.000 .208* .558* .769*
Sig. (2-tailed) .001 .000 .000 N 274 274 274 274
P2 Pear&>n Correlation .208* 1.000 .317*' .677* Sig. (2-tailed) .001 .000 .000 N 274 274 274 274
P3 Pear&>n Correlation .558* .317* 1.000 .827* Sig. (2-tailed) .000 .000 .000 N 274 274 274 274
PT Pear&>n Correlation .769* .677* .827*' 1.000 Sig. (2-tailed) .000 .000 .000 N 274 274 274 274
**. Correlation is significant at the 0.01 level (2-tailed).
Correlations Correlations
P01 P02 P03 P04 POT P01 Pearson Correlation 1.000 .404* .365*' .21S* .70S*
Sig. (2-tailed) .000 .000 .000 .000 N 274 274 274 274 274
P02 Pearson Correlation .404* 1.000 .342* .195* .696* Sig. (2-tailed) .000 .000 .001 .000 N 274 274 274 274 274
P03 Pearson Correlation .365* .342* 1.000 .304* .712* Sig. (2-tailed) .000 .000 .000 .000 N 274 274 274 274 274
P04 Pearson Correlation .21S* .195* .304* 1.000 .649* Sig. (2-tailed) .000 .001 .000 .000 N 274 274 274 274 274
POT Pearson Correlation .70S* .696* .712* .649* 1.000 Sig. (2-tailed) .000 .000 .000 .000 N 274 274 274 274 274
**. Correlation is significant at the 0.01 level (2-tailed).
83
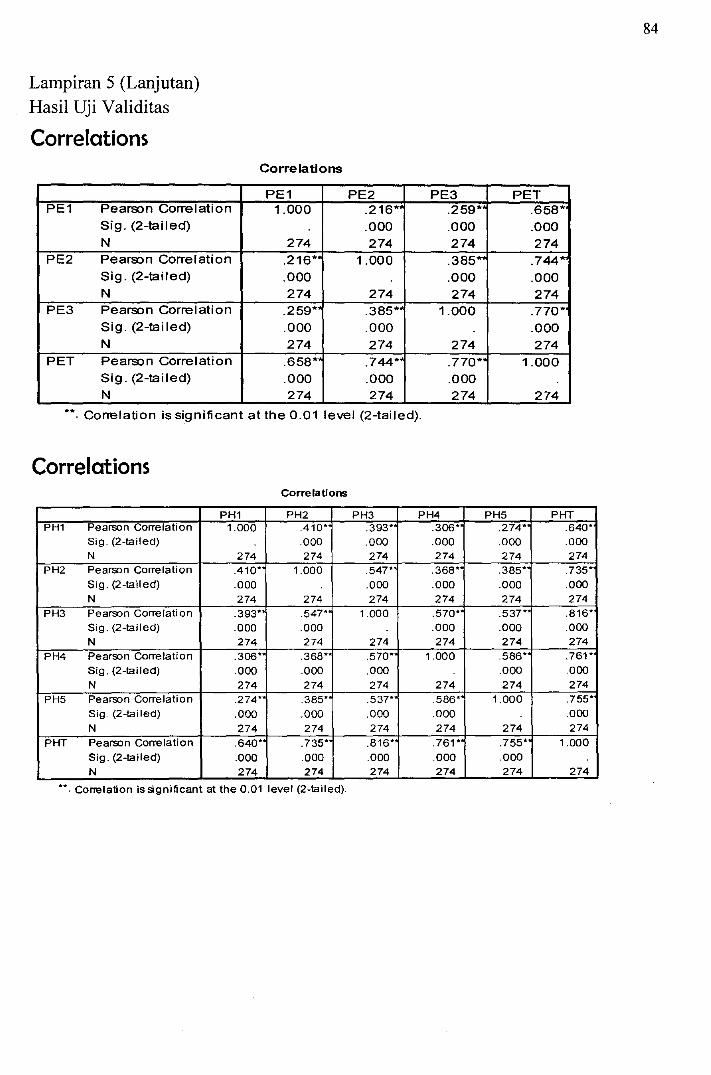
Lampiran 5 (Lanjutan) Hasil Uji Validitas
Correlations
PE1 Pearson Correlation Sig. (2-tailed) N
PE2 Pearson Correlation Sig. (2-tailed) N
PE3 Pearson Correlation Sig. (2-tailed) N
PET Pearson Correlation Sig. (2-tailed) N
Correlations
PE1 1.000
274 .216*' .000 274
.259*'
.000 274
.658*
.000 274
PE2 PE3 PET .216* .259*' .658* .000 .000 .000 274 274 274
1.000 .385*' .744~
.000 .000 274 274 274
.385* 1.000 .770*
.000 .000 274 274 274
.744* .770* 1.000
.000 .000 274 274 274
**. Correlation is significant at the 0.01 level (2-tailed).
Correlations Correlations
PH1 PH2 PH3 PH4 PH5 PHT PH1 Pearson Correlation 1.000 .410' .393' .306' .274' .640'
5ig. (2-tailed) .000 .000 .000 .000 .000 N 274 274 274 274 274 274
PH2 Pearson Correlati on .410' 1.000 .547' .368' .385' .735' 5ig. (2-tailed) .000 .000 .000 .000 .000 N 274 274 274 274 274 274
PH3 Pearson Correlation .393' .547' 1.000 .570' .537* .816' 5ig. (2-tailed) .000 .000 .000 .000 .000 N 274 274 274 274 274 274
PH4 Pearson Correlation .306' .368' .570' 1.000 .586' .761' 5ig. (2-tailed) .000 .000 .000 .000 .000 N 274 274 274 274 274 274
PH5 Pearson Correlation .274' .385' .537' .586' 1.000 .755' 5ig (2-tailed) .000 .000 .000 .000 .000
N 274 274 274 274 274 274
PHT Pearson Correlation .640' .735' .816' .761' .755' 1.000
Sig. (2-tailed) .000 .000 .000 .000 .000
N 274 274 274 274 274 274
". Conelation is significant at the 0.01 level (2-tailed).
84
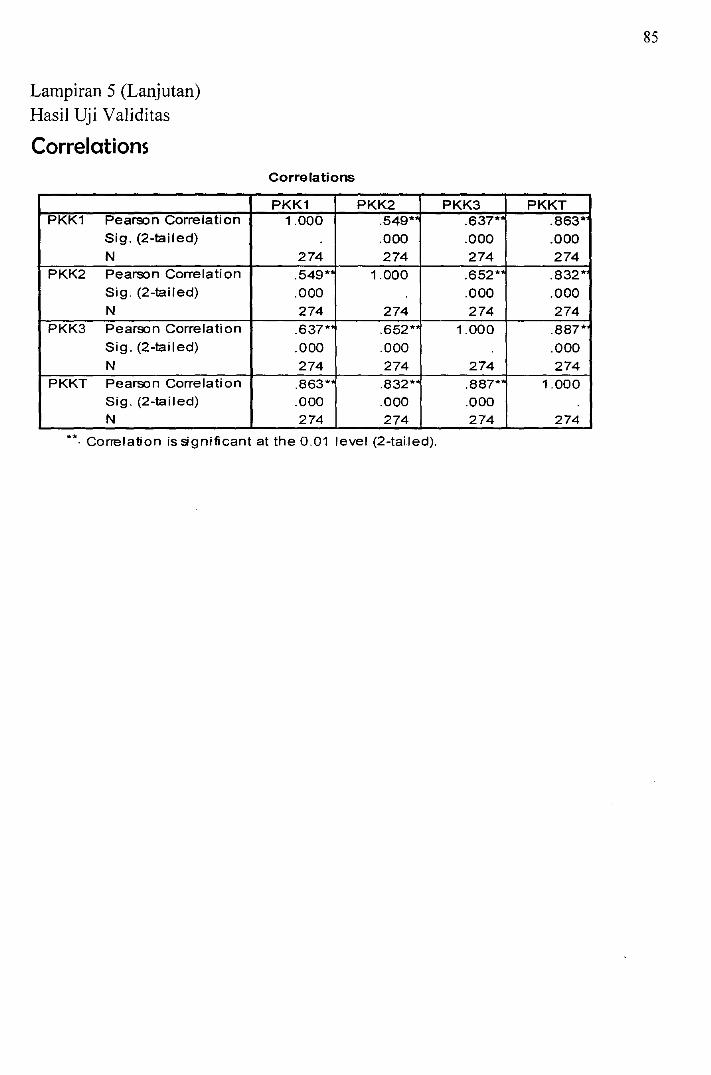
Lampiran 5 (Lanjutan) Hasil Uji Validitas
Correlations
PKK1 Pearson Correlation Sig. (2-tailed)
N PKK2 Pearson Correlation
Sig. (2-tailed)
N PKK3 Pearson Correlation
Sig. (2-tailed)
N PKKT Pearson Correlation
Sig. (2-tailed)
N
Correlations
PKK1 PKK2 1.000 .549*
.000 274 274
.549* 1.000
.000 274 274
.637* .652*'
.000 .000
274 274
.863*' .832*'
.000 .000 274 274
**. Correlation is significant at the 0.01 level (2-tailed).
85
PKK3 PKKT .637* .863* .000 .000 274 274 .652* .832* .000 .000 274 274
1.000 .887*
.000 274 274
.887* 1.000
.000 274 274
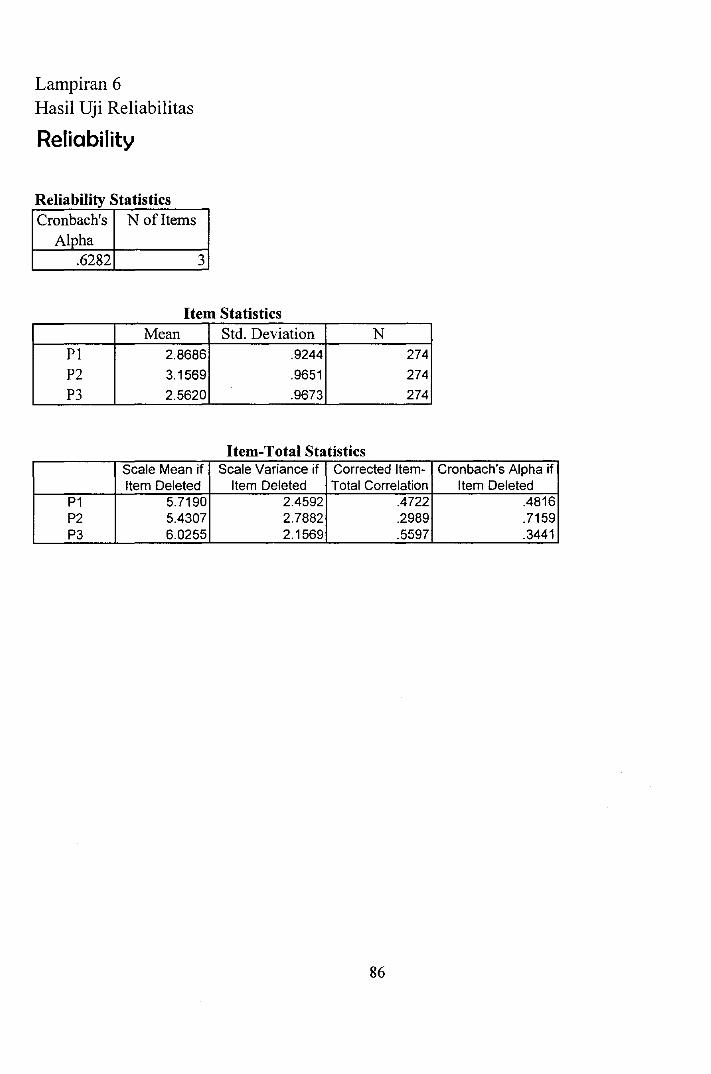
Lampiran 6 Hasil Uji Reliabilitas
Reliability
Reliability Statistics Cronbach's N ofItems
Alpha .6282 3
Item Statistics Mean Std. Deviation N
PI 2.8686 .9244 274
P2 3.1569 .9651 274
P3 2.5620 .9673 274
Item-Total Statistics Scale Mean if Scale Variance if Corrected Item- Cronbach's Alpha if Item Deleted Item Deleted Total Correlation Item Deleted
P1 5.7190 2.4592 .4722 .4816 P2 5.4307 2.7882 .2989 .7159 P3 6.0255 2.1569 .5597 .3441
86
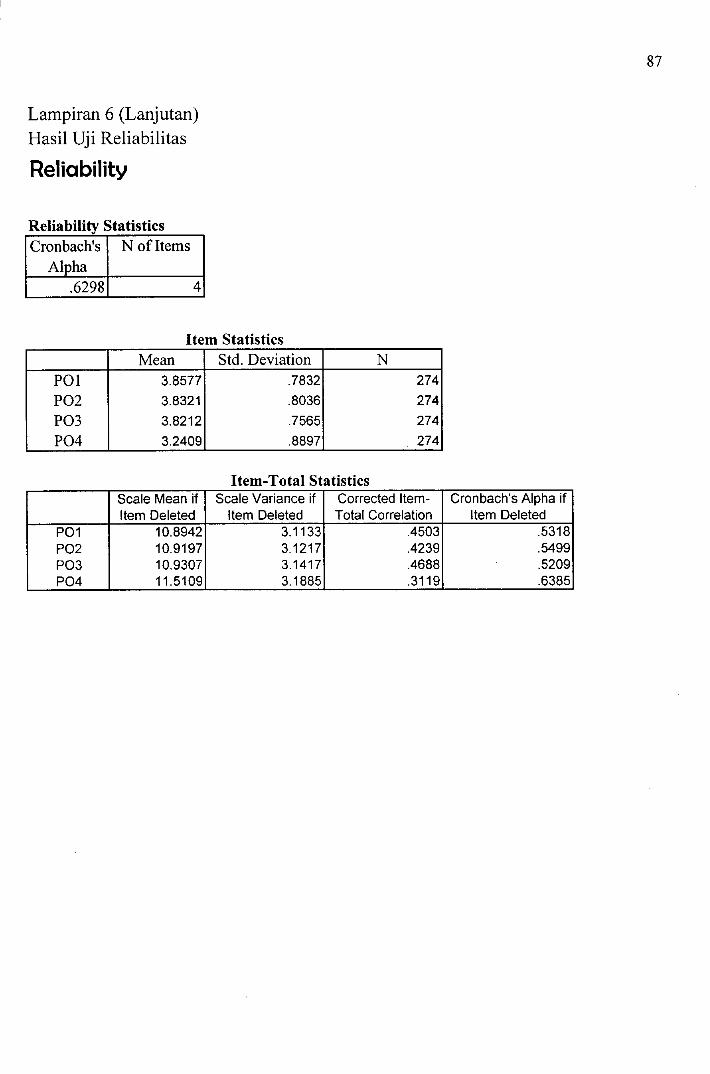
Lampiran 6 (Lanjutan) Hasil Uji Reliabilitas
Reliability
Reliability Statistics Cronbach's N ofItems
Alpha .6298 4
Item Statistics Mean Std. Deviation N
POI 3.8577 .7832 274
P02 3.8321 .8036 274
P03 3.8212 .7565 274
P04 3.2409 .8897 274
Item-Total Statistics Scale Mean if Scale Variance if Corrected Item-Item Deleted Item Deleted Total Correlation
P01 10.8942 3.1133 .4503 P02 10.9197 3.1217 .4239 P03 10.9307 3.1417 .4688 P04 11.5109 3.1885 .3119
87
Cronbach's Alpha if Item Deleted
.5318
.5499
.5209
.6385
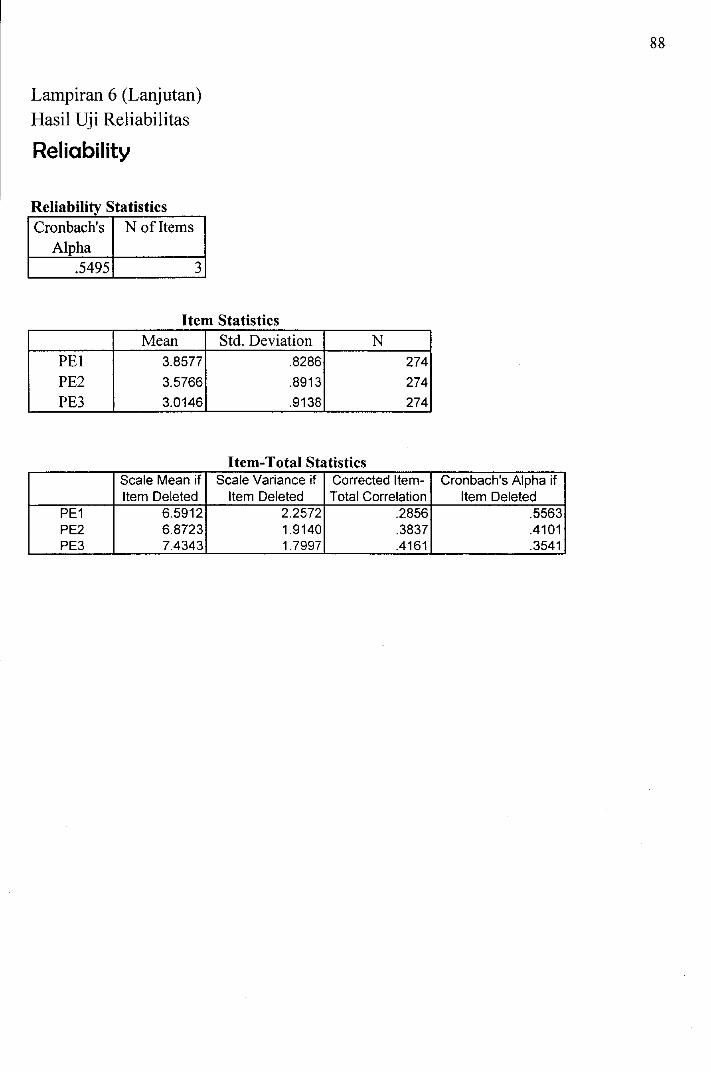
Lampiran 6 (Lanjutan) Hasil Uji Reliabilitas
Reliability
Reliability Statistics Cronbach's N of Items
Alpha .5495 3
Item Statistics Mean Std. Deviation N
PEl 3.8577 .8286 274
PE2 3.5766 .8913 274
PE3 3.0146 .9138 274
Item-Total Statistics Scale Mean if Scale Variance if Corrected Item-Item Deleted Item Deleted Total Correlation
PE1 6.5912 2.2572 .2856 PE2 6.8723 1.9140 .3837 PE3 7.4343 1.7997 .4161
88
Cronbach's Alpha if Item Deleted
.5563
.4101
.3541
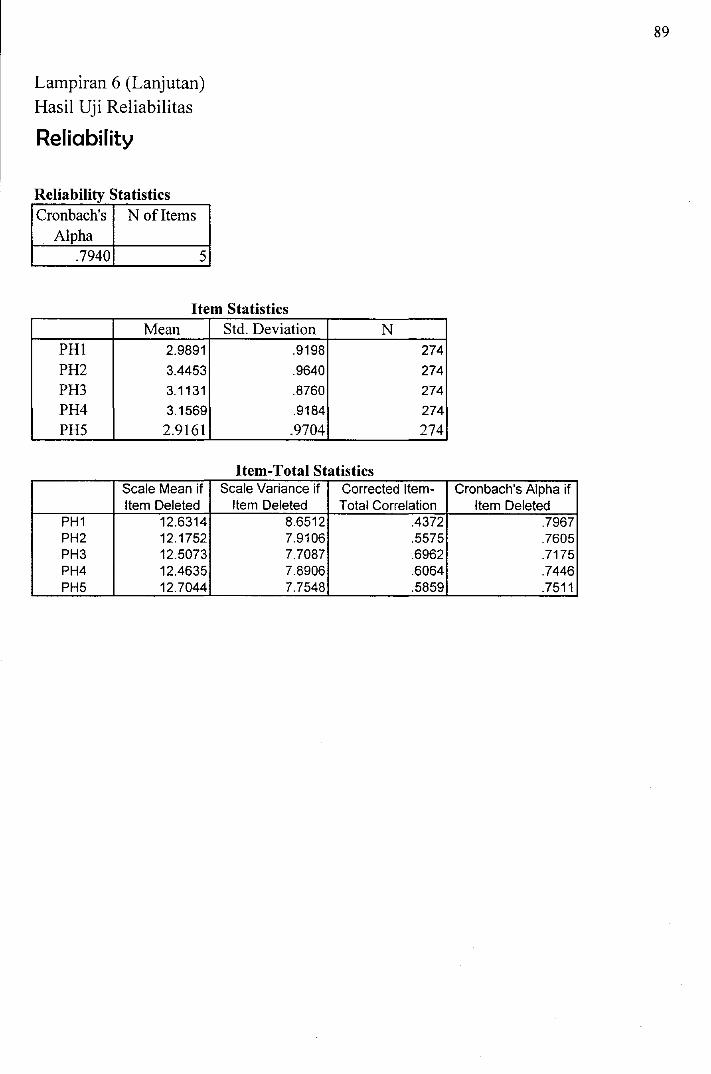
Lampiran 6 (Lanjutan) Hasil Uji Reliabilitas
Reliability
Reliability Statistics Cronbach's N of Items
Alpha .7940 5
Item Statistics Mean Std. Deviation N
PHI 2.9891 .9198 274
PH2 3.4453 .9640 274
PH3 3.1131 .8760 274
PH4 3.1569 .9184 274
PH5 2.9161 .9704 274
Item-Total Statistics Scale Mean if Scale Variance if Corrected Item-Item Deleted Item Deleted Total Correlation
PH1 12.6314 8.6512 .4372 PH2 12.1752 7.9106 .5575 PH3 12.5073 7.7087 .6962 PH4 12.4635 7.8906 .6064 PH5 12.7044 7.7548 .5859
89
Cronbach's Alpha if Item Deleted
.7967
.7605
.7175
.7446
.7511

Lampiran 6 (Lanjutan) Hasil Uji Reliabilitas
Reliability
Reliability Statistics Cronbach's N of Items
Alpha .8218 3
Item Statistics Mean Std. Deviation N
PKKI 3.4781 .9226 274
PKK2 3.6788 .7455 274
PKK3 3.4489 .8555 274
Item-Total Statistics Scale Mean if Scale Variance if Corrected Item-Item Deleted Item Deleted Total Correlation
PKK1 7.1277 2.1192 .6553 PKK2 6.927 2.5881 .6615 PKK3 7.1569 2.1621 .7300
90
Cronbach's Alpha if Item Deleted
.7848
.7767
.6985
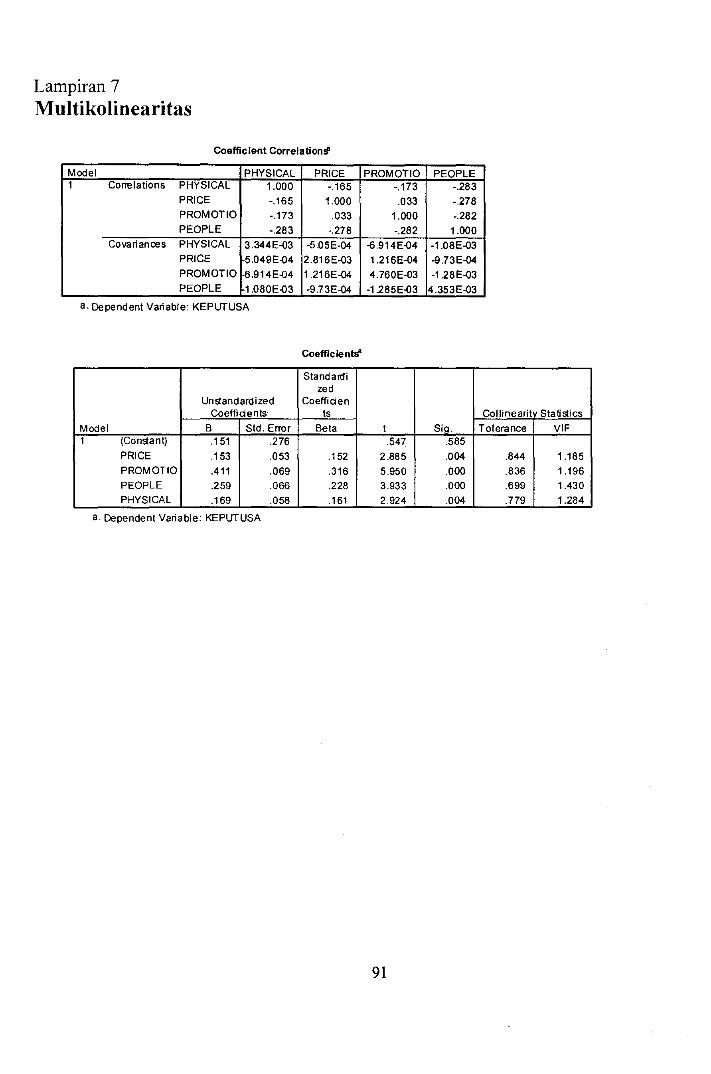
Lampiran 7 Multikolinearitas
Coefficient CorrelationS'
Model PHYSICAL PRICE 1 Correlations PHYSICAL 1.000 -.165
PRICE -.165 1.000 PROMOTIO -.173 .033 PEOPLE -.283 -.278
Covariances PHYSICAL 3.344E-03 -5.05E-04 PRICE 5.049E-04 2.816E-03 PROMOTIO i-e.914E-04 1.216E-04 PEOPLE 1.080E-03 -9.73E-04
a. Dependenl Variable: KEPUTUSA
CoefficientS'
Standardi zed
Unstandardized Coefficien Coefficients ts
Model B Sid. Error Bela 1 (Constant) .151 .276
PRICE .153 .053 .152 PROMOTIO .411 .069 .316 PEOPLE .259 .066 .228 PHYSICAL .169 .058 .161
a. Dependent Variable: KEPUTUSA
PROMOTIO PEOPLE -.173 -.283 .033 -.278
1.000 -.282 -.282 1.000
-6.914E-04 -1.08E-03 1.216E-04 -9.73E-04 4.760E-03 -1.28E-03
-1.285E-03 4.353E-03
Collinearil Slatistics
t SiQ. Tolerance VIF .547 .585
2.885 .004 .844 1.185
5.950 .000 .836 1.196 3.933 .000 .699 1.430 2.924 .004 .779 1.284
91
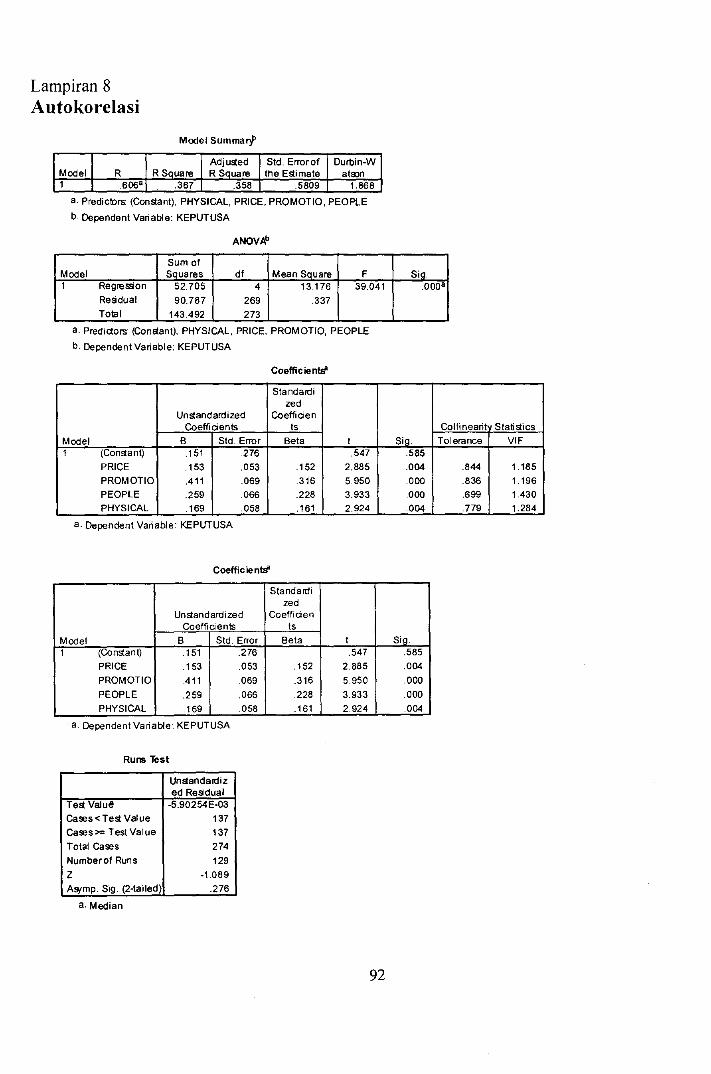
Lampiran 8 Autokorelasi
Model R 1 .606"
Model SummarY'
Adjusted R Square R Square
.367 .358
Std. Errorof Durbin-W the Estimate atron
.5809 1.868
a. Prediclors (Constant), PHYSICAL, PRICE, PROMOTIO, PEOPLE
b. Dependent Variable: KEPUTUSA
ANovlif
Sum of Model Squares df Mean Square F 1 Regression 52.705 4 13176 39.041
Residual 90.787 269 .337 Total 143.492 273
a. Predictors (Constant), PHYSICAL, PRICE, PROMOTIO, PEOPLE
b. Dependent Variable: KEPUTUSA
Coefficients'
Standardi zed
Un standardized Coefficien Coefficients ts
Model B Std. Error Beta t 1 (Constant) .151 .276 .547
PRICE .153 .053 .152 2.885 PROMOTIO .411 .069 .316 5.950 PEOPLE .259 .066 .228 3.933 PHYSICAL .169 .058 .161 2.924
a. Dependent Variable: KEPUTUSA
Coeffic ie nts'
Standardi zed
Unstandardized Coeffiden Coefficients ts
Model B Std. Error Beta t 1 (Constant) .151 .276 .547
PRICE .153 .053 .152 2.885
PROMOTIO .411 .069 .316 5.950
PEOPLE .259 .066 .228 3.933
PHYSICAL .169 .058 .161 2.924
a. Dependent Variable: KEPUTUSA
Runs Test
Unstandardiz ed Residual
Test Value -5.902S4E-03
Cases < Test Value 137 Cases>= Test Value 137
Total Cases 274
Numberof Runs 129
Z -1.089
AO¥mp. Sig. (2-tailed) .276
a. Median
92
Sig. .000"
Collinearit Statistics
Sig. Tolerance VIF .585
.004 .844 1.185
.000 .836 1.196
.000 .699 1.430
.004 .779 1.284
Sig. .585
.004
.000
.000
.004
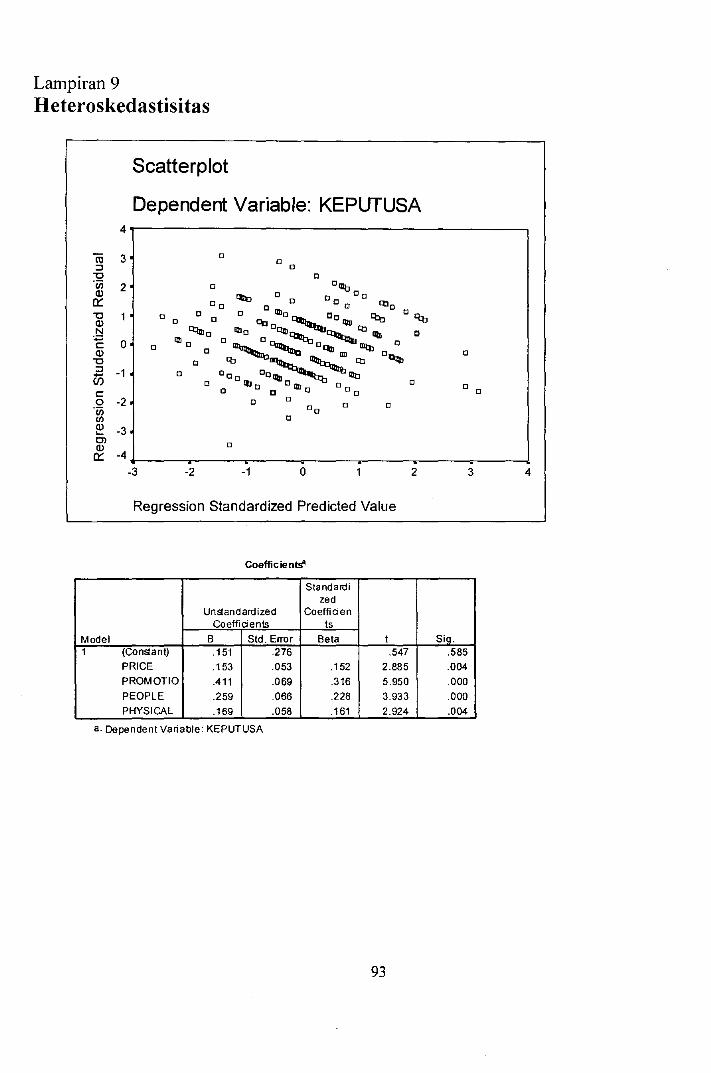
Lampiran 9 Heteroskedastisitas
Scatterplot
Dependent Variable: KEPUTUSA 4r--------------------------------------------,
ro 3 a a
::::J a "0 a 'iii 2 a a
illb Q)
~ a a c 0:: a c o 0 0 [) 0 ctlo "0 a c c Ql]a Cc "I<:J a cq, Q) c c C%la , IlID .~ Cl:!a.a Ql]c a~' ,ctJ lIIIl C - 0 Ql]c c: a a" a~ mq, a Q) a
lID D~ a "0 a a~a aa~'~ctJ ::::J -1 a -(J) 0 1110 DIln
O 00 a
0 c: a D a a 0 -2 c c 'iii Cc 0 0
'" a Q) -3 "-OJ c Q)
0:: -4
-3 -2 -1 0 2 3 4
Regression Standardized Predicted Value
Coeflic ie"1s"
Standaldi zed
Unstandardized Coefficien Coefficients ts
Model B Std. Error Beta t SiQ. 1 (Constant) .151 .276 .547 .585
PRICE .153 .053 .152 2.885 .004 PROMOTIO .411 .069 .316 5.950 .000 PEOPLE .259 .066 .228 3.933 .000 PHYSICAL .169 .058 .161 2.924 .004
a. Dependent Variable: KEPUTUSA
93
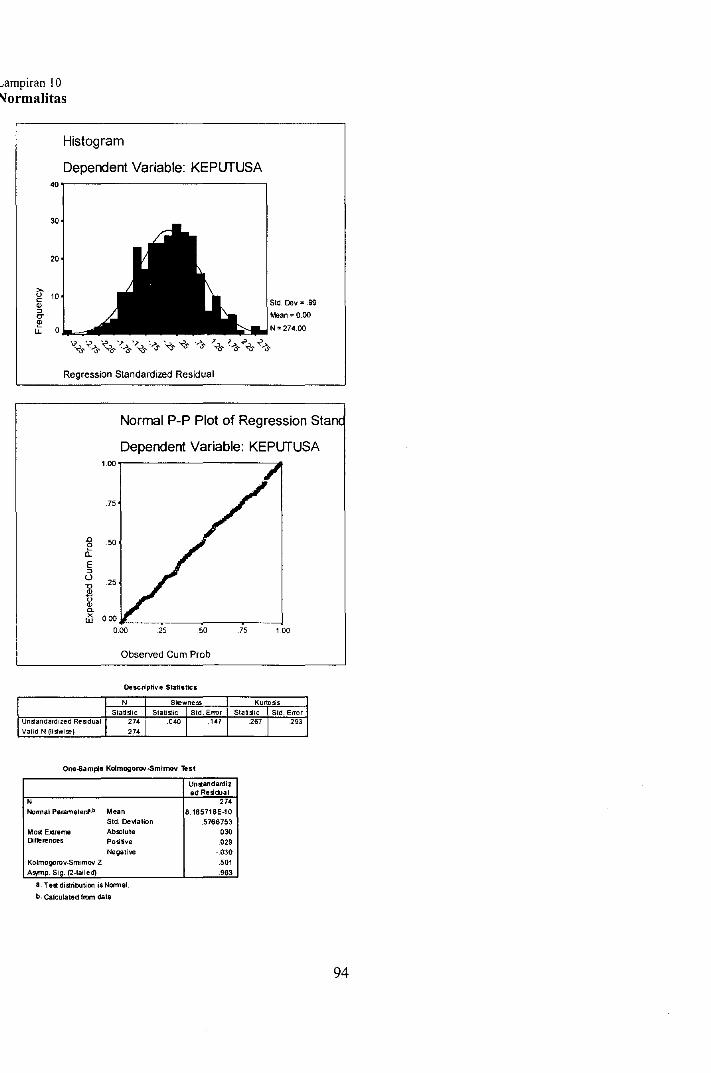
ampiran 10 ormalitas
Histogram
Dependent Variable: KEPUTUSA 'o~----------------------------.
30
20
g 10
" => CT ~ U.
Regression Standardized Residual
Normal P-P Plot of Regression Sta
Dependent Variable: KEPUTUSA 1.00 ~--------------------~
.0 o 0: E => u
* '" "-tll
Unslandardized Residual Valid N (lislwise)
.75
50
25
0.00 25 50
Observed Cum Prob
Descrlptive Statistics
N Slewness
Slati!iliC Statistic I Std. Error 27. 040 I 147
274
One-Sample Koimogot'O'l-8mimov Test
Unstandardiz ed RelidJal
N 274 No,",81 Parametenl'·b Mean 8.185718E·10
Std. Deviation .5766753 Mos Extreme Ab!Olute 030 Differences Positive .2.
Negative -.030 Kolmogorov-Smimov Z .501 A¥'1p. 5ig. (2-tailed) .963
a. TeSidlstnbution ,.NormaL b. Calculated from data
75 100
Kurtosis
StaU!I:: I Std. Error
267 I 293
94
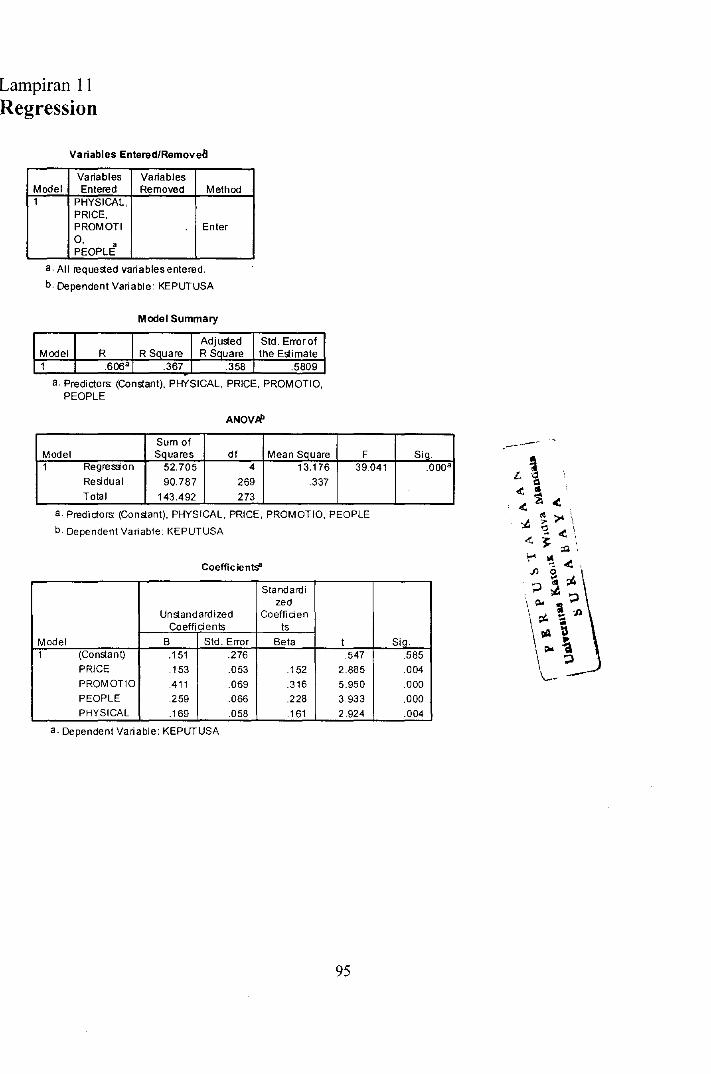
Lampiran 11 Regression
Variables Entered/Removeli
Variables Variables Model Entered Removed Method 1 PHYSICAL,
PRICE, PROMOTI Enter 0,
" PEOPLE
a. All requested variables entered.
b. Dependent Variable: KEPUTUSA
Model Summary
Adjusted Model R R Square R Square 1 .606" .367 .358
Std. Error of the Esti mate
.5809
a. Predictors: (Constant), PHYSICAL, PRICE, PROMOTIO, PEOPLE
ANOV*
Sum of Model Squares df Mean Square 1 RegresSon 52.705 4 13.176
Resdual 90.787 269 .337 Total 143.492 273
F 39.041
a. Predictors: (Constant). PHYSICAL. PRICE, PROMOTIO, PEOPLE
b. Dependent Variable: KEPUTUSA
Coeffic ie nls"
Standartli zed
Unstandardized Co effiden Coeffidents ts
Model B Std. Error Beta t 1 (Constant) .151 .276 .547
PRICE .153 .053 .152 2.885 PROMOTIO .411 .069 .316 5.950 PEOPLE .259 .066 .228 3.933 PHYSICAL .169 .058 .161 2.924
a. Dependent Variable: KEPUTUSA
95
,---'---SiQ.
.000"
Sig. .585 .004
.000
.000
.004