LAMPIRAN - repository.maranatha.eduSaya menganggap Starbucks Coffee PVJ adalah ... Extraction Sums...
37
50 LAMPIRAN
Transcript of LAMPIRAN - repository.maranatha.eduSaya menganggap Starbucks Coffee PVJ adalah ... Extraction Sums...

50
LAMPIRAN

51
No. Atribut 1 2 3 4 5
9. Pegawai di counter penjualan Starbucks Coffee
PVJ memahami kebutuhan Saya secara spesifik
10. Merek Starbucks Coffee PVJ dapat dipercaya
11. Starbucks Coffee PVJ dapat diandalkan
12. Starbucks Coffee PVJ sangat bertanggung jawab
13. Starbucks Coffee PVJ memahami konsumen
14. Starbucks Coffee PVJ selalu profesional
15. Saya memilih Starbucks Coffee PVJ dibanding
coffee shop lainnya
16. Saya menganggap Starbucks Coffee PVJ adalah
coffee shop terbaik
17. Saya merasa loyal dengan merek Starbucks
Coffee PVJ
18. Bagi Saya Starbucks Coffee PVJ sama dengan
coffee shop lainnya
KUESIONER PENELITIAN
No. Responden: Kepada Yth. Saudara/i
di tempat
Dengan hormat,
Berkaitan dengan penelitian yang Saya lakukan dalam
rangka menyelesaikan Tugas Akhir Jurusan Manajemen
Fakultas Ekonomi Universitas Kristen Maranatha yang berjudul
”Pengaruh Kualitas Pelayanan Terhadap Loyalitas
Konsumen Dengan Kepercayaan Sebagai Variabel Mediasi
Pada Starbucks Coffee Paris Van Java”.
Saya mohon kesediaan Saudara/i untuk mengisi/menjawab
kuesioner ini dengan sejujur-jujurnya. Jawaban yang Saudara/i
diberikan akan dijamin kerahasiaannya dan hanya akan
digunakan untuk kepentingan ilmiah.
Atas kerjasama yang baik dan kesungguhan Saudara/i
dalam mengisi kuesioner ini, Saya mengucapkan banyak terima
kasih.
Peneliti,
Andreas Wibowo

52
I. IDENTITAS PRIBADI
Umur :
Jenis kelamin: P / W
Tingkat Pendidikan:
II. DAFTAR PERTANYAAN RESPONDEN
PETUNJUK:
Berikan jawaban terhadap semua pernyataan dalam kuesioner
ini dengan memberikan penilaian tentang sejauh mana
pernyataan itu sesuai dengan realita (sesuai dengan apa yang
Anda rasakan), Beri tanda () pada kolom yang telah
disediakan.
Keterangan:
1: Sangat Tidak Setuju
2: Tidak Setuju
3: Netral
4: Setuju
5: Sangat Setuju
No. Atribut 1 2 3 4 5
1. Fasilitas counter Starbucks Coffee PVJ memiliki
visual yang menarik
2. Starbucks Coffee PVJ memiliki peralatan yang
terlihat modern
3. Ketika Saya memiliki masalah, pegawai
Starbucks Coffee PVJ langsung berinisiatif
untuk membantu Saya
4. Starbucks Coffee PVJ melakukan pelayanan
yang benar pada saat pertama kali Saya membeli
produk tersebut
5. Pegawai di counter penjualan Starbucks Coffee
PVJ memberikan pelayanan yang cepat
6. Pegawai di counter penjualan Starbucks Coffee
PVJ selalu siaga untuk melayani Saya
7. Pegawai di counter penjualan Starbucks Coffee
PVJ berlaku sopan secara konsisten
8. Pegawai di counter penjualan Starbucks Coffee
PVJ dapat menjawab pertanyaan Saya

53
UJI VALIDITAS
Factor Analysis
KMO and Bartlett's Test
Kaiser-Meyer-Olkin Measure of Sampling Adequacy. ,692
Bartlett's Test of Sphericity
Approx. Chi-Square 2433,466
df 153
Sig. ,000
Communalities
Initial Extraction
SQ1 1,000 ,652
SQ2 1,000 ,524
SQ3 1,000 ,401
SQ4 1,000 ,727
SQ5 1,000 ,859
SQ6 1,000 ,347
SQ7 1,000 ,438
SQ8 1,000 ,551
SQ9 1,000 ,408
T1 1,000 ,727
T2 1,000 ,716
T3 1,000 ,460
T4 1,000 ,344
T5 1,000 ,543
L1 1,000 ,697
L2 1,000 ,576
L3 1,000 ,651
L4 1,000 ,253
Extraction Method: Principal Component Analysis.

54
Total Variance Explained
Component
Initial Eigenvalues Extraction Sums of Squared
Loadings Rotation Sums of Squared
Loadings
Total % of
Variance Cumulative
% Total % of
Variance Cumulative
% Total % of
Variance Cumulative
%
1 5,638 31,320 31,320 5,638 31,320 31,320 5,152 28,624 28,624
2 2,185 12,141 43,461 2,185 12,141 43,461 2,395 13,308 41,932
3 2,051 11,396 54,857 2,051 11,396 54,857 2,326 12,925 54,857
4 1,886 10,480 65,337
5 1,211 6,729 72,066
6 1,153 6,403 78,469
7 ,741 4,119 82,588
8 ,640 3,554 86,141
9 ,516 2,865 89,006
10 ,454 2,520 91,526
11 ,401 2,230 93,756
12 ,328 1,819 95,576
13 ,212 1,180 96,755
14 ,195 1,085 97,841
15 ,122 ,676 98,516
16 ,106 ,591 99,108
17 ,100 ,554 99,662
18 ,061 ,338 100,000
Extraction Method: Principal Component Analysis. Component Matrix(a)
Component
1 2 3
SQ1 ,467 -,533
SQ2 ,462 -,481
SQ3 ,623
SQ4 ,583 ,529
SQ5 ,851
SQ6 ,522
SQ7 ,640
SQ8 ,645
SQ9 -,500
T1 ,550 ,628
T2 ,537 ,635
T3 ,674
T4 ,517
T5 ,726
L1 ,792
L2 ,744
L3 ,782
L4 -,502
Extraction Method: Principal Component Analysis. a 3 components extracted.

55
Rotated Component Matrix(a)
Component
1 2 3
SQ1 ,755
SQ2 ,665
SQ3 ,609
SQ4 ,810
SQ5 ,922
SQ6 ,460
SQ7 ,596
SQ8 ,462 ,459
SQ9 ,510
T1 ,684 -,452
T2 ,667 -,455
T3 ,650
T4 ,563
T5 ,637
L1 ,823
L2 ,743
L3 ,792
L4 -,479
Extraction Method: Principal Component Analysis. Rotation Method: Varimax with Kaiser Normalization. a Rotation converged in 6 iterations. Component Transformation Matrix
Component 1 2 3
1 ,928 ,302 ,219
2 -,324 ,359 ,876
3 ,186 -,883 ,430
Extraction Method: Principal Component Analysis. Rotation Method: Varimax with Kaiser Normalization.
Factor Analysis KMO and Bartlett's Test
Kaiser-Meyer-Olkin Measure of Sampling Adequacy. ,687
Bartlett's Test of Sphericity
Approx. Chi-Square 2129,550
df 136
Sig. ,000

56
Communalities
Initial Extraction
SQ1 1,000 ,307
SQ2 1,000 ,293
SQ3 1,000 ,593
SQ4 1,000 ,557
SQ5 1,000 ,840
SQ6 1,000 ,563
SQ7 1,000 ,473
SQ8 1,000 ,532
SQ9 1,000 ,374
T2 1,000 ,213
T3 1,000 ,619
T4 1,000 ,432
T5 1,000 ,575
L1 1,000 ,882
L2 1,000 ,852
L3 1,000 ,815
L4 1,000 ,535
Extraction Method: Principal Component Analysis. Total Variance Explained
Component
Initial Eigenvalues Extraction Sums of Squared
Loadings Rotation Sums of Squared
Loadings
Total % of
Variance Cumulative
% Total % of
Variance Cumulative
% Total % of
Variance Cumulative
%
1 5,383 31,666 31,666 5,383 31,666 31,666 3,578 21,050 21,050
2 2,178 12,812 44,478 2,178 12,812 44,478 3,388 19,931 40,980
3 1,893 11,136 55,614 1,893 11,136 55,614 2,488 14,634 55,614
4 1,708 10,044 65,658
5 1,195 7,030 72,688
6 1,025 6,029 78,718
7 ,679 3,996 82,713
8 ,595 3,498 86,211
9 ,515 3,031 89,241
10 ,450 2,649 91,891
11 ,399 2,344 94,235
12 ,293 1,726 95,961
13 ,210 1,238 97,199
14 ,194 1,144 98,343
15 ,116 ,680 99,023
16 ,103 ,603 99,626
17 ,064 ,374 100,000
Extraction Method: Principal Component Analysis.
57
Component Matrix(a)
Component
1 2 3
SQ1 ,429
SQ2 ,499
SQ3 ,630 ,427
SQ4 ,671
SQ5 ,894
SQ6 ,539 ,506
SQ7 ,628
SQ8 ,656
SQ9 ,406
T2 ,458
T3 ,670 ,405
T4 ,501
T5 ,730
L1 ,791 -,429
L2 ,745 -,523
L3 ,786
L4 -,509 ,524
Extraction Method: Principal Component Analysis. a 3 components extracted. Rotated Component Matrix(a)
Component
1 2 3
SQ1 ,467
SQ2
SQ3 ,745
SQ4 ,728
SQ5 ,904
SQ6 ,745
SQ7 ,663
SQ8 ,457 ,483
SQ9 ,606
T2
T3 ,746
T4 ,628
T5 ,617
L1 ,898
L2 ,909
L3 ,857
L4 -,724
Extraction Method: Principal Component Analysis. Rotation Method: Varimax with Kaiser Normalization. a Rotation converged in 4 iterations.

58
Component Transformation Matrix
Component 1 2 3
1 ,693 ,651 ,311
2 -,191 -,251 ,949
3 -,695 ,717 ,049
Extraction Method: Principal Component Analysis. Rotation Method: Varimax with Kaiser Normalization.
Factor Analysis KMO and Bartlett's Test
Kaiser-Meyer-Olkin Measure of Sampling Adequacy. ,712
Bartlett's Test of Sphericity
Approx. Chi-Square 1870,003
df 120
Sig. ,000
Communalities
Initial Extraction
SQ1 1,000 ,454
SQ2 1,000 ,332
SQ4 1,000 ,705
SQ5 1,000 ,861
SQ6 1,000 ,412
SQ7 1,000 ,484
SQ8 1,000 ,573
SQ9 1,000 ,508
T2 1,000 ,276
T3 1,000 ,443
T4 1,000 ,402
T5 1,000 ,591
L1 1,000 ,877
L2 1,000 ,816
L3 1,000 ,813
L4 1,000 ,474
Extraction Method: Principal Component Analysis.
59
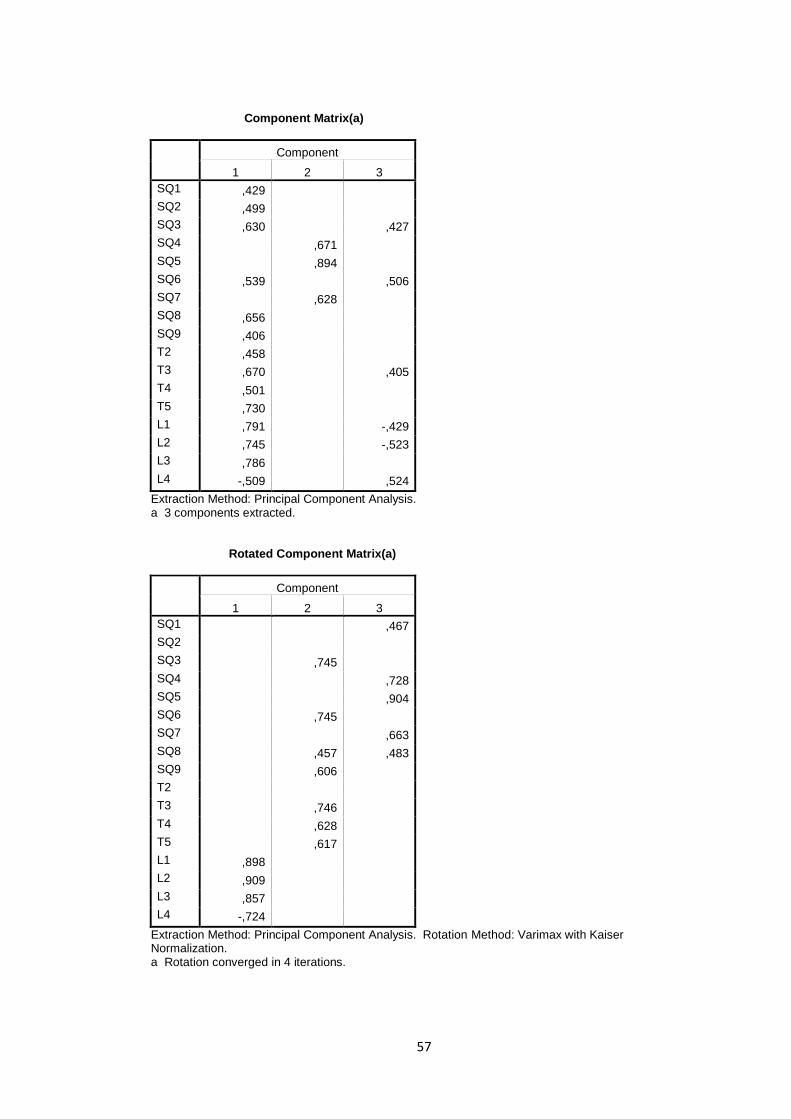
Total Variance Explained
Component
Initial Eigenvalues Extraction Sums of Squared
Loadings Rotation Sums of Squared
Loadings
Total % of
Variance Cumulative
% Total % of
Variance Cumulative
% Total % of
Variance Cumulative
%
1 5,042 31,514 31,514 5,042 31,514 31,514 3,499 21,868 21,868
2 2,171 13,570 45,084 2,171 13,570 45,084 3,218 20,111 41,979
3 1,806 11,288 56,373 1,806 11,288 56,373 2,303 14,394 56,373
4 1,585 9,906 66,278
5 1,144 7,151 73,429
6 ,933 5,828 79,257
7 ,673 4,207 83,464
8 ,548 3,426 86,890
9 ,463 2,896 89,786
10 ,450 2,815 92,600
11 ,369 2,303 94,904
12 ,293 1,830 96,734
13 ,210 1,313 98,047
14 ,128 ,797 98,844
15 ,110 ,686 99,530
16 ,075 ,470 100,000
Extraction Method: Principal Component Analysis. Component Matrix(a)
Component
1 2 3
SQ1 ,465
SQ2 ,521
SQ4 ,678
SQ5 ,886
SQ6 ,485 ,412
SQ7 ,633
SQ8 ,664
SQ9 ,558
T2 ,453
T3 ,620
T4 ,489
T5 ,731
L1 ,811
L2 ,777 -,412
L3 ,805
L4 -,531 ,429
Extraction Method: Principal Component Analysis. a 3 components extracted.

60
Rotated Component Matrix(a)
Component
1 2 3
SQ1 ,568
SQ2 ,485
SQ4 ,772
SQ5 ,926
SQ6 ,633
SQ7 ,627
SQ8 ,598
SQ9 ,688
T2 ,503
T3 ,590
T4 ,569
T5 ,660
L1 ,886
L2 ,877
L3 ,849
L4 -,681
Extraction Method: Principal Component Analysis. Rotation Method: Varimax with Kaiser Normalization. a Rotation converged in 5 iterations. Component Transformation Matrix
Component 1 2 3
1 ,718 ,660 ,219
2 -,251 -,048 ,967
3 -,649 ,750 -,131
Extraction Method: Principal Component Analysis. Rotation Method: Varimax with Kaiser Normalization.
Factor Analysis KMO and Bartlett's Test
Kaiser-Meyer-Olkin Measure of Sampling Adequacy. ,714
Bartlett's Test of Sphericity
Approx. Chi-Square 1753,903
df 105
Sig. ,000

61
Communalities
Initial Extraction
SQ1 1,000 ,646
SQ2 1,000 ,438
SQ4 1,000 ,792
SQ5 1,000 ,866
SQ7 1,000 ,485
SQ8 1,000 ,558
SQ9 1,000 ,478
T2 1,000 ,353
T3 1,000 ,364
T4 1,000 ,352
T5 1,000 ,551
L1 1,000 ,858
L2 1,000 ,779
L3 1,000 ,803
L4 1,000 ,407
Extraction Method: Principal Component Analysis. Total Variance Explained
Component
Initial Eigenvalues Extraction Sums of Squared
Loadings Rotation Sums of Squared
Loadings
Total % of
Variance Cumulative
% Total % of
Variance Cumulative
% Total % of
Variance Cumulative
%
1 4,847 32,314 32,314 4,847 32,314 32,314 3,701 24,673 24,673
2 2,168 14,452 46,766 2,168 14,452 46,766 2,822 18,815 43,487
3 1,715 11,437 58,202 1,715 11,437 58,202 2,207 14,715 58,202
4 1,546 10,306 68,508
5 1,132 7,550 76,058
6 ,690 4,602 80,660
7 ,635 4,235 84,895
8 ,534 3,559 88,454
9 ,460 3,066 91,519
10 ,401 2,670 94,190
11 ,335 2,232 96,422
12 ,212 1,411 97,833
13 ,136 ,907 98,740
14 ,110 ,735 99,475
15 ,079 ,525 100,000
Extraction Method: Principal Component Analysis.

62
Component Matrix(a)
Component
1 2 3
SQ1 ,474 ,564
SQ2 ,523
SQ4 ,663 -,510
SQ5 ,876
SQ7 ,635
SQ8 ,651
SQ9 ,558
T2 ,466
T3 ,594
T4 ,479
T5 ,715
L1 ,822
L2 ,799
L3 ,821
L4 -,555
Extraction Method: Principal Component Analysis. a 3 components extracted. Rotated Component Matrix(a)
Component
1 2 3
SQ1 ,775
SQ2 ,632
SQ4 ,829
SQ5 ,926
SQ7 ,572
SQ8 ,607
SQ9 ,632
T2 ,571
T3 ,419 ,432
T4 ,446
T5 ,450 ,582
L1 ,892
L2 ,858
L3 ,857
L4 -,628
Extraction Method: Principal Component Analysis. Rotation Method: Varimax with Kaiser Normalization. a Rotation converged in 5 iterations.

63
Component Transformation Matrix
Component 1 2 3
1 ,787 ,592 ,174
2 -,317 ,146 ,937
3 -,529 ,793 -,303
Extraction Method: Principal Component Analysis. Rotation Method: Varimax with Kaiser Normalization.
Factor Analysis KMO and Bartlett's Test
Kaiser-Meyer-Olkin Measure of Sampling Adequacy. ,731
Bartlett's Test of Sphericity
Approx. Chi-Square 1526,593
df 91
Sig. ,000
Communalities
Initial Extraction
SQ2 1,000 ,219
SQ4 1,000 ,735
SQ5 1,000 ,864
SQ7 1,000 ,555
SQ8 1,000 ,527
SQ9 1,000 ,472
T2 1,000 ,260
T3 1,000 ,504
T4 1,000 ,594
T5 1,000 ,615
L1 1,000 ,881
L2 1,000 ,847
L3 1,000 ,804
L4 1,000 ,523
Extraction Method: Principal Component Analysis.

64
Total Variance Explained
Component
Initial Eigenvalues Extraction Sums of Squared
Loadings Rotation Sums of Squared
Loadings
Total % of
Variance Cumulative
% Total % of
Variance Cumulative
% Total % of
Variance Cumulative
%
1 4,667 33,333 33,333 4,667 33,333 33,333 3,574 25,530 25,530
2 2,119 15,136 48,469 2,119 15,136 48,469 2,574 18,384 43,914
3 1,615 11,535 60,004 1,615 11,535 60,004 2,253 16,090 60,004
4 1,265 9,038 69,043
5 1,062 7,589 76,631
6 ,651 4,652 81,284
7 ,600 4,282 85,566
8 ,508 3,626 89,193
9 ,406 2,901 92,093
10 ,399 2,850 94,943
11 ,335 2,389 97,333
12 ,180 1,288 98,621
13 ,114 ,816 99,437
14 ,079 ,563 100,000
Extraction Method: Principal Component Analysis. Component Matrix(a)
Component
1 2 3
SQ2 ,456
SQ4 ,764
SQ5 ,902
SQ7 ,617
SQ8 ,630
SQ9 ,534
T2 ,499
T3 ,604
T4 ,489 ,550
T5 ,713
L1 ,845
L2 ,818
L3 ,844
L4 -,566 ,446
Extraction Method: Principal Component Analysis. a 3 components extracted.

65
Rotated Component Matrix(a)
Component
1 2 3
SQ2 ,421
SQ4 ,815
SQ5 ,923
SQ7 ,641
SQ8 ,517 ,403
SQ9 ,666
T2
T3 ,642
T4 ,754
T5 ,659
L1 ,901
L2 ,906
L3 ,841
L4 -,719
Extraction Method: Principal Component Analysis. Rotation Method: Varimax with Kaiser Normalization. a Rotation converged in 5 iterations. Component Transformation Matrix
Component 1 2 3
1 ,798 ,558 ,229
2 -,188 -,130 ,973
3 -,573 ,820 -,001
Extraction Method: Principal Component Analysis. Rotation Method: Varimax with Kaiser Normalization.
Factor Analysis KMO and Bartlett's Test
Kaiser-Meyer-Olkin Measure of Sampling Adequacy. ,715
Bartlett's Test of Sphericity
Approx. Chi-Square 1410,918
df 78
Sig. ,000

66
Communalities
Initial Extraction
SQ2 1,000 ,217
SQ4 1,000 ,753
SQ5 1,000 ,861
SQ7 1,000 ,490
SQ9 1,000 ,396
T2 1,000 ,322
T3 1,000 ,579
T4 1,000 ,646
T5 1,000 ,628
L1 1,000 ,881
L2 1,000 ,852
L3 1,000 ,804
L4 1,000 ,543
Extraction Method: Principal Component Analysis. Total Variance Explained
Component
Initial Eigenvalues Extraction Sums of Squared
Loadings Rotation Sums of Squared
Loadings
Total % of
Variance Cumulative
% Total % of
Variance Cumulative
% Total % of
Variance Cumulative
%
1 4,332 33,323 33,323 4,332 33,323 33,323 3,417 26,285 26,285
2 2,067 15,899 49,222 2,067 15,899 49,222 2,425 18,653 44,938
3 1,574 12,106 61,329 1,574 12,106 61,329 2,131 16,390 61,329
4 1,169 8,996 70,324
5 1,061 8,161 78,485
6 ,643 4,945 83,431
7 ,578 4,447 87,878
8 ,451 3,468 91,346
9 ,406 3,123 94,469
10 ,337 2,594 97,063
11 ,187 1,436 98,498
12 ,115 ,887 99,385
13 ,080 ,615 100,000
Extraction Method: Principal Component Analysis.

67
Component Matrix(a)
Component
1 2 3
SQ2 ,445
SQ4 ,813
SQ5 ,915
SQ7 ,569
SQ9 ,438
T2 ,514
T3 ,608 ,456
T4 ,495 ,588
T5 ,702
L1 ,874
L2 ,840
L3 ,860
L4 -,579 ,455
Extraction Method: Principal Component Analysis. a 3 components extracted. Rotated Component Matrix(a)
Component
1 2 3
SQ2 ,438
SQ4 ,834
SQ5 ,921
SQ7 ,615
SQ9 ,588
T2 ,413
T3 ,700
T4 ,794
T5 ,675
L1 ,894
L2 ,906
L3 ,837
L4 -,733
Extraction Method: Principal Component Analysis. Rotation Method: Varimax with Kaiser Normalization. a Rotation converged in 5 iterations. Component Transformation Matrix
Component 1 2 3
1 ,817 ,550 ,174
2 -,090 -,176 ,980
3 -,570 ,816 ,094
Extraction Method: Principal Component Analysis. Rotation Method: Varimax with Kaiser Normalization.

68
Factor Analysis KMO and Bartlett's Test
Kaiser-Meyer-Olkin Measure of Sampling Adequacy. ,714
Bartlett's Test of Sphericity
Approx. Chi-Square 1355,294
df 66
Sig. ,000
Communalities
Initial Extraction
SQ2 1,000 ,225
SQ4 1,000 ,720
SQ5 1,000 ,884
SQ7 1,000 ,465
T2 1,000 ,417
T3 1,000 ,649
T4 1,000 ,625
T5 1,000 ,624
L1 1,000 ,881
L2 1,000 ,855
L3 1,000 ,808
L4 1,000 ,593
Extraction Method: Principal Component Analysis. Total Variance Explained
Component
Initial Eigenvalues Extraction Sums of Squared
Loadings Rotation Sums of Squared
Loadings
Total % of
Variance Cumulative
% Total % of
Variance Cumulative
% Total % of
Variance Cumulative
%
1 4,254 35,453 35,453 4,254 35,453 35,453 3,270 27,252 27,252
2 2,014 16,781 52,234 2,014 16,781 52,234 2,410 20,082 47,334
3 1,479 12,323 64,557 1,479 12,323 64,557 2,067 17,224 64,557
4 1,098 9,153 73,711
5 ,934 7,787 81,498
6 ,623 5,188 86,686
7 ,466 3,881 90,567
8 ,407 3,393 93,960
9 ,338 2,817 96,776
10 ,187 1,557 98,334
11 ,120 1,000 99,334
12 ,080 ,666 100,000
Extraction Method: Principal Component Analysis.
69
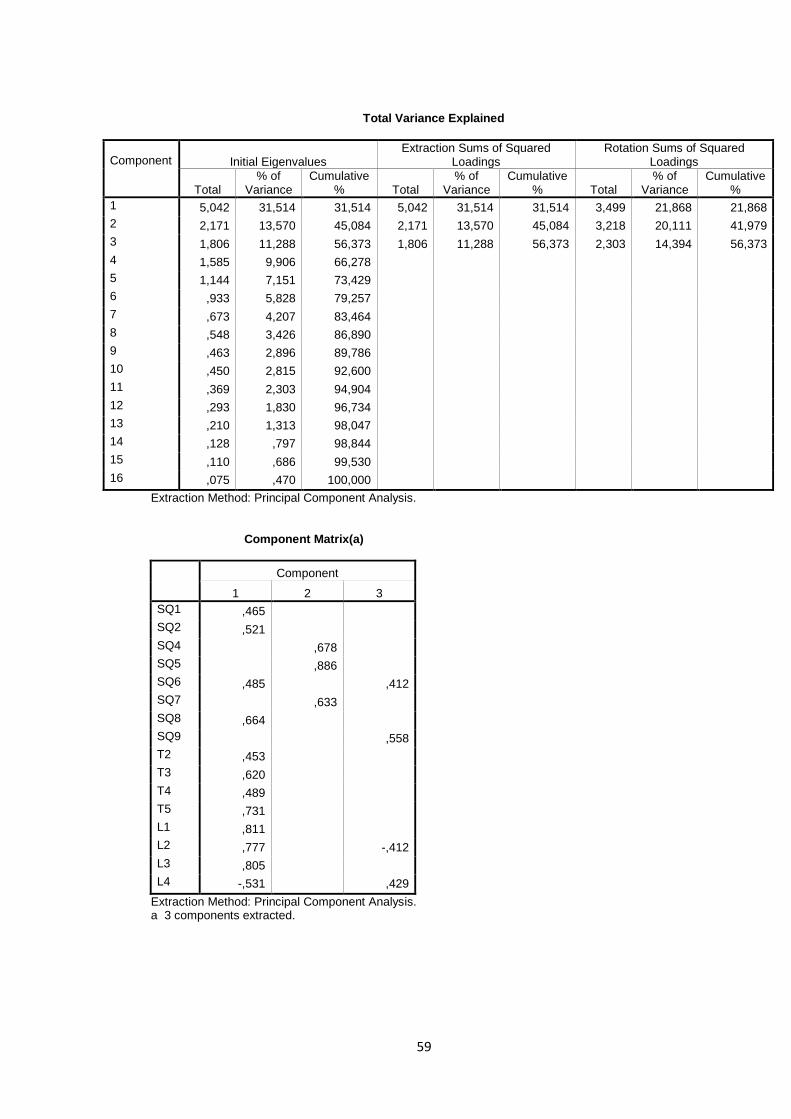
Component Matrix(a)
Component
1 2 3
SQ2 ,449
SQ4 ,771
SQ5 ,907
SQ7 ,649
T2 ,528
T3 ,602 ,531
T4 ,470 ,616
T5 ,693
L1 ,877
L2 ,846
L3 ,862
L4 -,584 ,498
Extraction Method: Principal Component Analysis. a 3 components extracted. Rotated Component Matrix(a)
Component
1 2 3
SQ2 ,447
SQ4 ,824
SQ5 ,937
SQ7 ,637
T2 ,593
T3 ,782
T4 ,775
T5 ,703
L1 ,874
L2 ,899
L3 ,824
L4 -,762
Extraction Method: Principal Component Analysis. Rotation Method: Varimax with Kaiser Normalization. a Rotation converged in 4 iterations. Component Transformation Matrix
Component 1 2 3
1 ,799 ,579 ,162
2 -,192 -,009 ,981
3 -,570 ,815 -,104
Extraction Method: Principal Component Analysis. Rotation Method: Varimax with Kaiser Normalization.

70
Factor Analysis KMO and Bartlett's Test
Kaiser-Meyer-Olkin Measure of Sampling Adequacy. ,721
Bartlett's Test of Sphericity
Approx. Chi-Square 1275,879
df 55
Sig. ,000
Communalities
Initial Extraction
SQ4 1,000 ,738
SQ5 1,000 ,876
SQ7 1,000 ,465
T2 1,000 ,415
T3 1,000 ,656
T4 1,000 ,612
T5 1,000 ,622
L1 1,000 ,892
L2 1,000 ,856
L3 1,000 ,836
L4 1,000 ,610
Extraction Method: Principal Component Analysis. Total Variance Explained
Component
Initial Eigenvalues Extraction Sums of Squared
Loadings Rotation Sums of Squared
Loadings
Total % of
Variance Cumulative
% Total % of
Variance Cumulative
% Total % of
Variance Cumulative
%
1 4,094 37,219 37,219 4,094 37,219 37,219 3,062 27,835 27,835
2 2,014 18,307 55,526 2,014 18,307 55,526 2,447 22,249 50,084
3 1,470 13,363 68,889 1,470 13,363 68,889 2,069 18,805 68,889
4 ,950 8,637 77,527
5 ,743 6,750 84,277
6 ,552 5,017 89,294
7 ,431 3,916 93,209
8 ,338 3,074 96,284
9 ,204 1,853 98,136
10 ,122 1,112 99,249
11 ,083 ,751 100,000
Extraction Method: Principal Component Analysis.

71
Component Matrix(a)
Component
1 2 3
SQ4 ,771
SQ5 ,907
SQ7 ,649
T2 ,555
T3 ,598 ,543
T4 ,492 ,587
T5 ,679
L1 ,878
L2 ,842
L3 ,872
L4 -,582 ,517
Extraction Method: Principal Component Analysis. a 3 components extracted. Rotated Component Matrix(a)
Component
1 2 3
SQ4 ,833
SQ5 ,934
SQ7 ,635
T2 ,580
T3 ,794
T4 ,766
T5 ,725
L1 ,874
L2 ,893
L3 ,835
L4 -,773
Extraction Method: Principal Component Analysis. Rotation Method: Varimax with Kaiser Normalization. a Rotation converged in 5 iterations. Component Transformation Matrix
Component 1 2 3
1 ,773 ,610 ,174
2 -,211 -,011 ,977
3 -,598 ,792 -,121
Extraction Method: Principal Component Analysis. Rotation Method: Varimax with Kaiser Normalization.
72
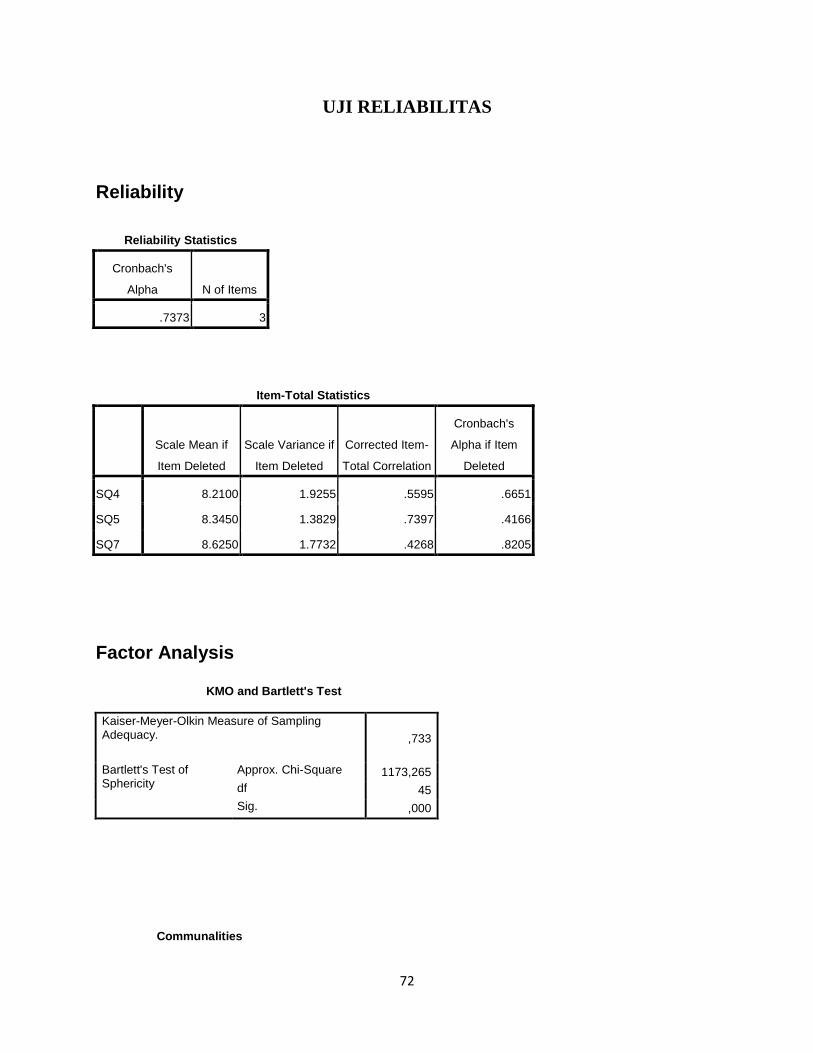
UJI RELIABILITAS
Reliability
Reliability Statistics
Cronbach's
Alpha N of Items
.7373 3
Item-Total Statistics
Scale Mean if
Item Deleted
Scale Variance if
Item Deleted
Corrected Item-
Total Correlation
Cronbach's
Alpha if Item
Deleted
SQ4 8.2100 1.9255 .5595 .6651
SQ5 8.3450 1.3829 .7397 .4166
SQ7 8.6250 1.7732 .4268 .8205
Factor Analysis KMO and Bartlett's Test
Kaiser-Meyer-Olkin Measure of Sampling Adequacy. ,733
Bartlett's Test of Sphericity
Approx. Chi-Square 1173,265
df 45
Sig. ,000
Communalities

73
Initial Extraction
SQ4 1,000 ,847
SQ5 1,000 ,838
T2 1,000 ,496
T3 1,000 ,677
T4 1,000 ,601
T5 1,000 ,614
L1 1,000 ,893
L2 1,000 ,851
L3 1,000 ,860
L4 1,000 ,617
Extraction Method: Principal Component Analysis. Total Variance Explained
Component
Initial Eigenvalues Extraction Sums of Squared
Loadings Rotation Sums of Squared Loadings
Total % of
Variance Cumulative
% Total % of
Variance Cumulative
% Total % of
Variance Cumulative
%
1 4,083 40,833 40,833 4,083 40,833 40,833 3,046 30,459 30,459
2 1,764 17,637 58,470 1,764 17,637 58,470 2,428 24,276 54,735
3 1,446 14,461 72,931 1,446 14,461 72,931 1,820 18,196 72,931
4 ,757 7,569 80,500
5 ,653 6,532 87,032
6 ,433 4,327 91,359
7 ,421 4,212 95,571
8 ,214 2,144 97,715
9 ,146 1,459 99,174
10 ,083 ,826 100,000
Extraction Method: Principal Component Analysis. Component Matrix(a)
Component
1 2 3
SQ4 ,866
SQ5 ,905
T2 ,556
T3 ,595 ,568
T4 ,490 ,515
T5 ,675
L1 ,885
L2 ,848
L3 ,874
L4 -,586 ,522
Extraction Method: Principal Component Analysis. a 3 components extracted. Rotated Component Matrix(a)
Component
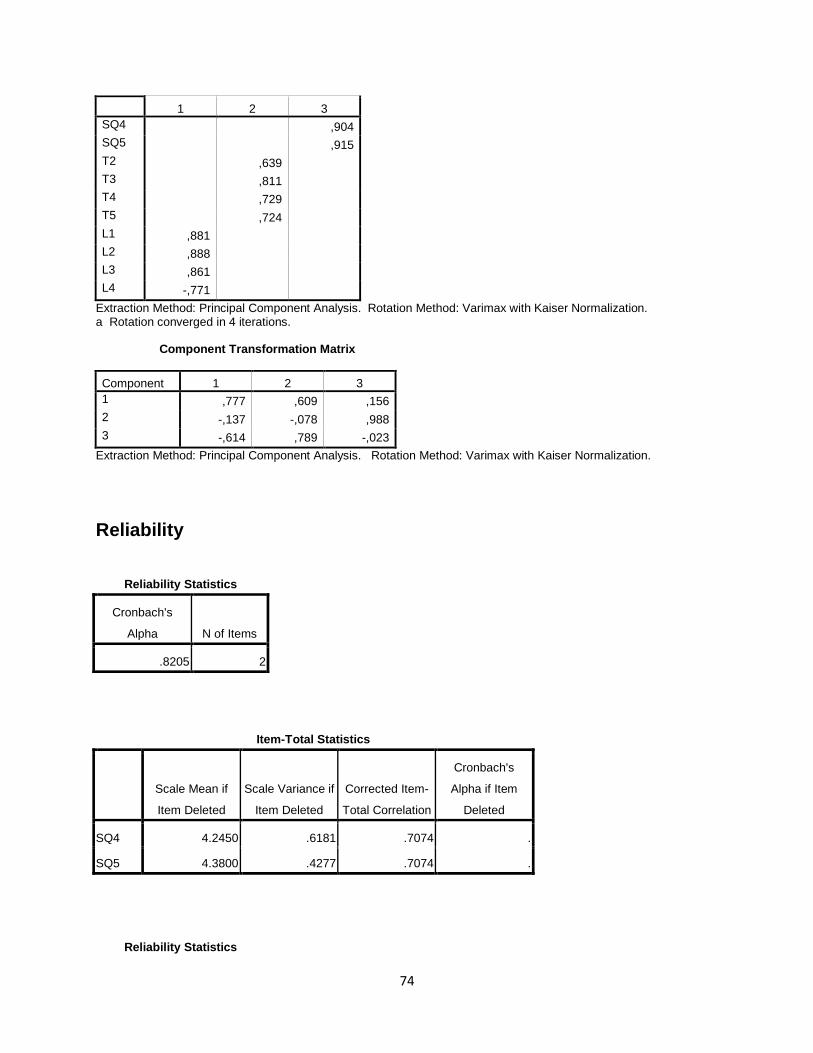
74
1 2 3
SQ4 ,904
SQ5 ,915
T2 ,639
T3 ,811
T4 ,729
T5 ,724
L1 ,881
L2 ,888
L3 ,861
L4 -,771
Extraction Method: Principal Component Analysis. Rotation Method: Varimax with Kaiser Normalization. a Rotation converged in 4 iterations. Component Transformation Matrix
Component 1 2 3
1 ,777 ,609 ,156
2 -,137 -,078 ,988
3 -,614 ,789 -,023
Extraction Method: Principal Component Analysis. Rotation Method: Varimax with Kaiser Normalization.
Reliability
Reliability Statistics
Cronbach's
Alpha N of Items
.8205 2
Item-Total Statistics
Scale Mean if
Item Deleted
Scale Variance if
Item Deleted
Corrected Item-
Total Correlation
Cronbach's
Alpha if Item
Deleted
SQ4 4.2450 .6181 .7074 .
SQ5 4.3800 .4277 .7074 .
Reliability Statistics

75
Cronbach's
Alpha N of Items
.7420 4
Item-Total Statistics
Scale Mean if
Item Deleted
Scale Variance if
Item Deleted
Corrected Item-
Total Correlation
Cronbach's
Alpha if Item
Deleted
T2 11.1800 4.3594 .4588 .7249
T3 11.6750 4.0094 .5993 .6471
T4 11.7600 4.1230 .5073 .6993
T5 11.5400 3.9783 .5792 .6575
Reliability Statistics
Cronbach's
Alpha N of Items
.4269 4
Item-Total Statistics
Scale Mean if
Item Deleted
Scale Variance if
Item Deleted
Corrected Item-
Total Correlation
Cronbach's
Alpha if Item
Deleted
L1 9.8750 2.4516 .7744 -.3733
L2 9.8550 2.7678 .6892 -.2047
L3 9.9800 2.8237 .7305 -.2240
L4 11.3900 8.5205 -.5667 .9450
Factor Analysis KMO and Bartlett's Test

76
Kaiser-Meyer-Olkin Measure of Sampling Adequacy. ,703
Bartlett's Test of Sphericity
Approx. Chi-Square 1082,226
df 36
Sig. ,000
Communalities
Initial Extraction
SQ4 1,000 ,848
SQ5 1,000 ,836
T2 1,000 ,500
T3 1,000 ,643
T4 1,000 ,676
T5 1,000 ,608
L1 1,000 ,936
L2 1,000 ,897
L3 1,000 ,882
Extraction Method: Principal Component Analysis. Total Variance Explained
Component
Initial Eigenvalues Extraction Sums of Squared
Loadings Rotation Sums of Squared
Loadings
Total % of
Variance Cumulative
% Total % of
Variance Cumulative
% Total % of
Variance Cumulative
%
1 3,805 42,283 42,283 3,805 42,283 42,283 2,733 30,366 30,366
2 1,763 19,589 61,871 1,763 19,589 61,871 2,276 25,288 55,654
3 1,257 13,966 75,838 1,257 13,966 75,838 1,816 20,183 75,838
4 ,744 8,272 84,109
5 ,554 6,155 90,264
6 ,433 4,807 95,071
7 ,215 2,384 97,455
8 ,146 1,627 99,081
9 ,083 ,919 100,000
Extraction Method: Principal Component Analysis. Component Matrix(a)
Component
1 2 3
SQ4 ,867

77
SQ5 ,904
T2 ,587
T3 ,650 ,468
T4 ,518 ,566
T5 ,707
L1 ,868
L2 ,822 -,466
L3 ,855
Extraction Method: Principal Component Analysis. a 3 components extracted. Rotated Component Matrix(a)
Component
1 2 3
SQ4 ,908
SQ5 ,913
T2 ,632
T3 ,772
T4 ,779
T5 ,699
L1 ,931
L2 ,927
L3 ,897
Extraction Method: Principal Component Analysis. Rotation Method: Varimax with Kaiser Normalization. a Rotation converged in 4 iterations. Component Transformation Matrix
Component 1 2 3
1 ,757 ,632 ,166
2 -,178 -,046 ,983
3 -,629 ,774 -,078
Extraction Method: Principal Component Analysis. Rotation Method: Varimax with Kaiser Normalization.
Reliability
Reliability Statistics
Cronbach's
Alpha N of Items

78
Reliability Statistics
Cronbach's
Alpha N of Items
.9450 3
Item-Total Statistics
Scale Mean if
Item Deleted
Scale Variance if
Item Deleted
Corrected Item-
Total Correlation
Cronbach's
Alpha if Item
Deleted
L1 7.5650 3.6339 .9203 .8923
L2 7.5450 3.9477 .8610 .9379
L3 7.6700 4.0916 .8777 .9264

79
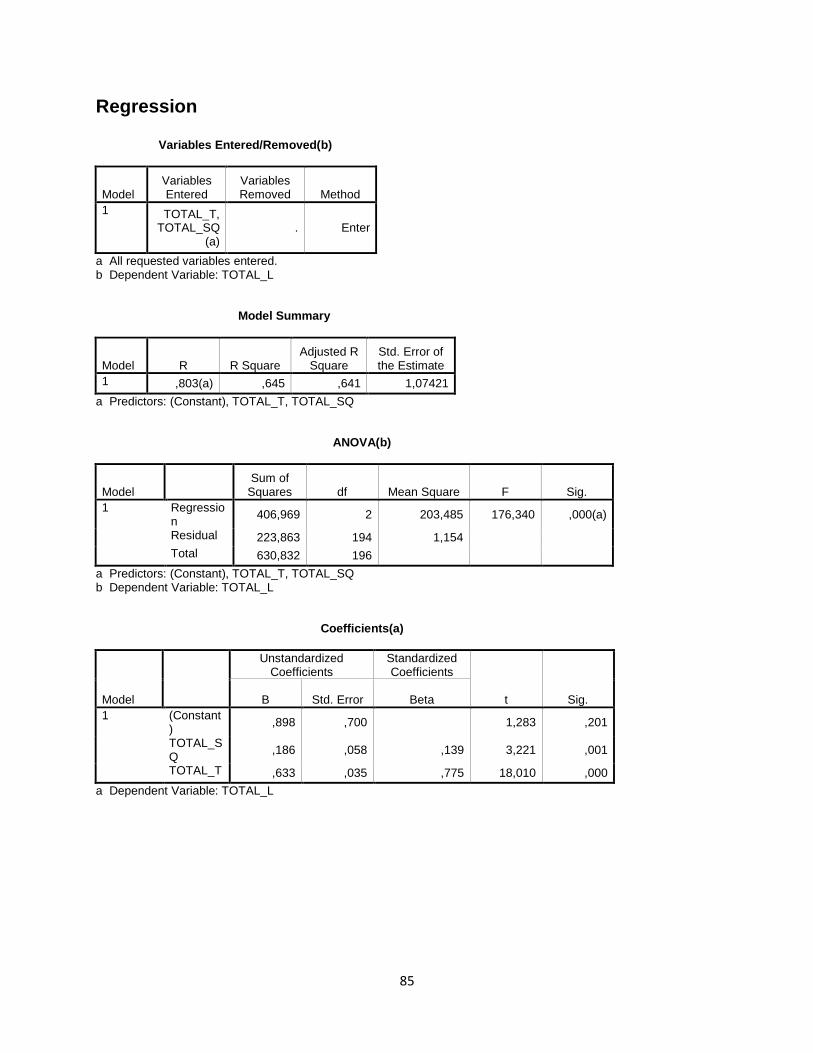
UJI ANALISIS REGRESI DENGAN VARIABEL MEDIASI
Regression Variables Entered/Removed(b)
Model Variables Entered
Variables Removed Method
1 TOTAL_T, TOTAL_SQ
(a) . Enter
a All requested variables entered. b Dependent Variable: TOTAL_L Model Summary(b)
Model R R Square Adjusted R
Square Std. Error of the Estimate
1 ,860(a) ,740 ,737 1,08407
a Predictors: (Constant), TOTAL_T, TOTAL_SQ b Dependent Variable: TOTAL_L ANOVA(b)
Model Sum of
Squares df Mean Square F Sig.
1 Regression
657,662 2 328,831 279,805 ,000(a)
Residual 231,518 197 1,175
Total 889,180 199
a Predictors: (Constant), TOTAL_T, TOTAL_SQ b Dependent Variable: TOTAL_L Coefficients(a)
Model
Unstandardized Coefficients
Standardized Coefficients
t Sig. B Std. Error Beta
1 (Constant)
,134 ,640 ,210 ,834
TOTAL_SQ
,184 ,058 ,116 3,157 ,002
TOTAL_T ,682 ,030 ,838 22,849 ,000
a Dependent Variable: TOTAL_L Residuals Statistics(a)

80
Minimum Maximum Mean Std. Deviation N
Predicted Value 4,3316 14,7440 12,2100 1,81792 200
Std. Predicted Value -4,334 1,394 ,000 1,000 200
Standard Error of Predicted Value ,08092 ,34567 ,12431 ,04675 200
Adjusted Predicted Value 4,4823 14,7402 12,2094 1,81029 200
Residual -2,4688 2,5276 ,0000 1,07861 200
Std. Residual -2,277 2,332 ,000 ,995 200
Stud. Residual -2,289 2,364 ,000 1,003 200
Deleted Residual -2,4934 2,5985 ,0006 1,09688 200
Stud. Deleted Residual -2,314 2,392 ,001 1,008 200
Mahal. Distance ,114 19,238 1,990 2,928 200
Cook's Distance ,000 ,063 ,006 ,011 200
Centered Leverage Value ,001 ,097 ,010 ,015 200
a Dependent Variable: TOTAL_L
Regression Variables Entered/Removed(b)
Model Variables Entered
Variables Removed Method
1 TOTAL_T, TOTAL_SQ
(a) . Enter
a All requested variables entered. b Dependent Variable: TOTAL_L Model Summary(b)
Model R R Square Adjusted R
Square Std. Error of the Estimate
1 ,803(a) ,645 ,641 1,07421
a Predictors: (Constant), TOTAL_T, TOTAL_SQ b Dependent Variable: TOTAL_L ANOVA(b)
Model Sum of
Squares df Mean Square F Sig.
1 Regression
406,969 2 203,485 176,340 ,000(a)
Residual 223,863 194 1,154
Total 630,832 196
a Predictors: (Constant), TOTAL_T, TOTAL_SQ b Dependent Variable: TOTAL_L

81
Coefficients(a)
Model
Unstandardized Coefficients
Standardized Coefficients
t Sig. B Std. Error Beta
1 (Constant)
,898 ,700 1,283 ,201
TOTAL_SQ
,186 ,058 ,139 3,221 ,001
TOTAL_T ,633 ,035 ,775 18,010 ,000
a Dependent Variable: TOTAL_L Residuals Statistics(a)
Minimum Maximum Mean Std. Deviation N
Predicted Value 8,7140 14,5967 12,3503 1,44096 197
Residual -2,6130 2,2816 ,0000 1,06872 197
Std. Predicted Value -2,523 1,559 ,000 1,000 197
Std. Residual -2,432 2,124 ,000 ,995 197
a Dependent Variable: TOTAL_L
NPar Tests One-Sample Kolmogorov-Smirnov Test
Unstandardize
d Residual
N 197
Normal Parameters(a,b) Mean ,0000000
Std. Deviation 1,06871896
Most Extreme Differences
Absolute ,080
Positive ,080
Negative -,078
Kolmogorov-Smirnov Z 1,123
Asymp. Sig. (2-tailed) ,161
a Test distribution is Normal. b Calculated from data.
Regression Variables Entered/Removed(b)
Model Variables Entered
Variables Removed Method
1 TOTAL_T, TOTAL_SQ
(a) . Enter
a All requested variables entered. b Dependent Variable: TOTAL_L Model Summary

82
Model R R Square Adjusted R
Square Std. Error of the Estimate
1 ,803(a) ,645 ,641 1,07421
a Predictors: (Constant), TOTAL_T, TOTAL_SQ ANOVA(b)
Model Sum of
Squares df Mean Square F Sig.
1 Regression
406,969 2 203,485 176,340 ,000(a)
Residual 223,863 194 1,154
Total 630,832 196
a Predictors: (Constant), TOTAL_T, TOTAL_SQ b Dependent Variable: TOTAL_L Coefficients(a)
Model
Unstandardized Coefficients
Standardized Coefficients
t Sig.
Collinearity Statistics
B Std. Error Beta Tolerance VIF
1 (Constant)
,898 ,700 1,283 ,201
TOTAL_SQ
,186 ,058 ,139 3,221 ,001 ,987 1,013
TOTAL_T ,633 ,035 ,775 18,010 ,000 ,987 1,013
a Dependent Variable: TOTAL_L Collinearity Diagnostics(a)
Model Dimension Eigenvalue
Condition Index
Variance Proportions
(Constant) TOTAL_SQ TOTAL_T
1 1 2,973 1,000 ,00 ,00 ,00
2 ,019 12,477 ,00 ,67 ,44
3 ,008 19,385 ,99 ,33 ,56
a Dependent Variable: TOTAL_L

83
Regression Variables Entered/Removed(b)
Model Variables Entered
Variables Removed Method
1 TOTAL_T, TOTAL_SQ
(a) . Enter
a All requested variables entered. b Dependent Variable: ABS Model Summary
Model R R Square Adjusted R
Square Std. Error of the Estimate
1 ,453(a) ,205 ,197 ,53962
a Predictors: (Constant), TOTAL_T, TOTAL_SQ ANOVA(b)
Model Sum of
Squares df Mean Square F Sig.
1 Regression
14,557 2 7,279 24,996 ,000(a)
Residual 56,491 194 ,291
Total 71,048 196
a Predictors: (Constant), TOTAL_T, TOTAL_SQ b Dependent Variable: ABS Coefficients(a)
Model
Unstandardized Coefficients
Standardized Coefficients
t Sig.
Collinearity Statistics
B Std. Error Beta Tolerance VIF
1 (Constant)
1,924 ,352 5,471 ,000
TOTAL_SQ
,091 ,029 ,202 3,137 ,002 ,987 1,013
TOTAL_T -,117 ,018 -,429 -6,655 ,000 ,987 1,013
a Dependent Variable: ABS Collinearity Diagnostics(a)
Model Dimension Eigenvalue
Condition Index
Variance Proportions
(Constant) TOTAL_SQ TOTAL_T
1 1 2,973 1,000 ,00 ,00 ,00
2 ,019 12,477 ,00 ,67 ,44
3 ,008 19,385 ,99 ,33 ,56
a Dependent Variable: ABS

84
Regression Variables Entered/Removed(b)
Model Variables Entered
Variables Removed Method
1 TOTAL_T, TOTAL_SQ
(a) . Enter
a All requested variables entered. b Dependent Variable: ABS Model Summary
Model R R Square Adjusted R
Square Std. Error of the Estimate
1 ,453(a) ,205 ,197 ,53962
a Predictors: (Constant), TOTAL_T, TOTAL_SQ ANOVA(b)
Model Sum of
Squares df Mean Square F Sig.
1 Regression
14,557 2 7,279 24,996 ,000(a)
Residual 56,491 194 ,291
Total 71,048 196
a Predictors: (Constant), TOTAL_T, TOTAL_SQ b Dependent Variable: ABS Coefficients(a)
Model
Unstandardized Coefficients
Standardized Coefficients
t Sig. B Std. Error Beta
1 (Constant)
1,924 ,352 5,471 ,000
TOTAL_SQ
,091 ,029 ,202 3,137 ,002
TOTAL_T -,117 ,018 -,429 -6,655 ,000
a Dependent Variable: ABS
85
Regression Variables Entered/Removed(b)
Model Variables Entered
Variables Removed Method
1 TOTAL_T, TOTAL_SQ
(a) . Enter
a All requested variables entered. b Dependent Variable: TOTAL_L Model Summary
Model R R Square Adjusted R
Square Std. Error of the Estimate
1 ,803(a) ,645 ,641 1,07421
a Predictors: (Constant), TOTAL_T, TOTAL_SQ ANOVA(b)
Model Sum of
Squares df Mean Square F Sig.
1 Regression
406,969 2 203,485 176,340 ,000(a)
Residual 223,863 194 1,154
Total 630,832 196
a Predictors: (Constant), TOTAL_T, TOTAL_SQ b Dependent Variable: TOTAL_L Coefficients(a)
Model
Unstandardized Coefficients
Standardized Coefficients
t Sig. B Std. Error Beta
1 (Constant)
,898 ,700 1,283 ,201
TOTAL_SQ
,186 ,058 ,139 3,221 ,001
TOTAL_T ,633 ,035 ,775 18,010 ,000
a Dependent Variable: TOTAL_L

86
Regression Variables Entered/Removed(b)
Model Variables Entered
Variables Removed Method
1 TOTAL_SQ(a)
. Enter
a All requested variables entered. b Dependent Variable: TOTAL_T Model Summary
Model R R Square Adjusted R
Square Std. Error of the Estimate
1 ,115(a) ,013 ,008 2,18868
a Predictors: (Constant), TOTAL_SQ ANOVA(b)
Model Sum of
Squares df Mean Square F Sig.
1 Regression
12,462 1 12,462 2,602 ,108(a)
Residual 934,116 195 4,790
Total 946,579 196
a Predictors: (Constant), TOTAL_SQ b Dependent Variable: TOTAL_T Coefficients(a)
Model
Unstandardized Coefficients
Standardized Coefficients
t Sig. B Std. Error Beta
1 (Constant)
13,933 1,020 13,663 ,000
TOTAL_SQ
,188 ,117 ,115 1,613 ,108
a Dependent Variable: TOTAL_T