LAMPIRAN A SKALA PENELITIAN - core.ac.uk · 54 melakukan pembelian 10 Pembelian minimal anda di CV...
41
51 LAMPIRAN A SKALA PENELITIAN
Transcript of LAMPIRAN A SKALA PENELITIAN - core.ac.uk · 54 melakukan pembelian 10 Pembelian minimal anda di CV...

51
LAMPIRAN A
SKALA PENELITIAN

52
A 1
SKALA PERILAKU MEMBELI DAGING SAPI IMPOR
53
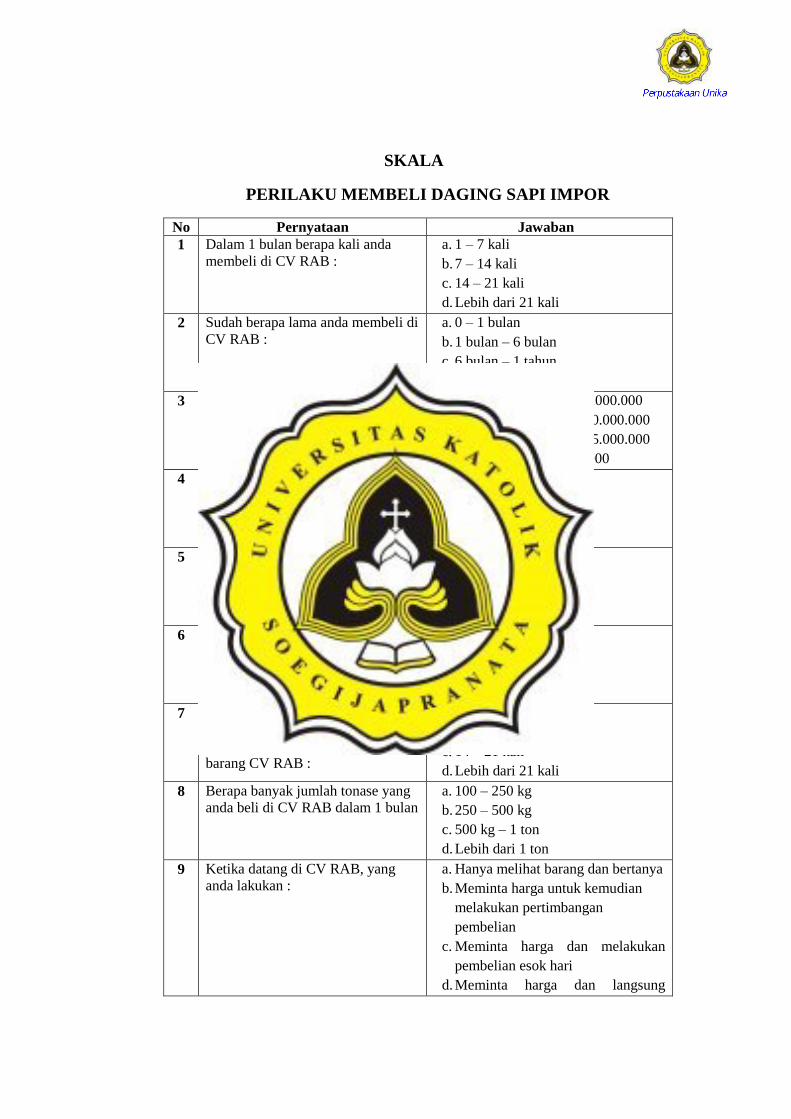
SKALA
PERILAKU MEMBELI DAGING SAPI IMPOR
No Pernyataan Jawaban
1 Dalam 1 bulan berapa kali anda
membeli di CV RAB :
a. 1 – 7 kali
b. 7 – 14 kali
c. 14 – 21 kali
d. Lebih dari 21 kali
2 Sudah berapa lama anda membeli di
CV RAB :
a. 0 – 1 bulan
b. 1 bulan – 6 bulan
c. 6 bulan – 1 tahun
d. Lebih dari 1 tahun
3 Dalam 1 bulan berapa uang yang
anda keluarkan di CV RAB :
a. Rp. 1.000.000 – Rp. 25.000.000
b. Rp. 25.000.000 – Rp. 50.000.000
c. Rp. 50.000.000 – Rp. 75.000.000
d. Lebih dari Rp. 75.000.000
4 Dalam 1 bulan berapa kali anda
meminta order ke CV RAB :
a. 1 – 7 kali
b. 7 – 14 kali
c. 14 – 21 kali
d. Lebih dari 21 kali
5 Berapa lama waktu yang anda
butuhkan untuk memilih CV RAB
dalam melakukan pembelian :
a. Lebih dari 3 hari
b. 2 – 3 hari
c. 1 – 2 hari
d. Saat itu juga
6 Berapa banyak jumlah box yang
anda beli di CV RAB dalam 1 bulan
a. 1 – 25 box
b. 25 – 50 box
c. 50 – 100 box
d. Lebih dari 100 box
7 Dalam 1 bulan berapa kali
keputusan membeli yang anda
lakukan dari setiap penawaran
barang CV RAB :
a. 1 – 7 kali
b. 7 – 14 kali
c. 14 – 21 kali
d. Lebih dari 21 kali
8 Berapa banyak jumlah tonase yang
anda beli di CV RAB dalam 1 bulan
a. 100 – 250 kg
b. 250 – 500 kg
c. 500 kg – 1 ton
d. Lebih dari 1 ton
9 Ketika datang di CV RAB, yang
anda lakukan :
a. Hanya melihat barang dan bertanya
b. Meminta harga untuk kemudian
melakukan pertimbangan
pembelian
c. Meminta harga dan melakukan
pembelian esok hari
d. Meminta harga dan langsung
54
melakukan pembelian
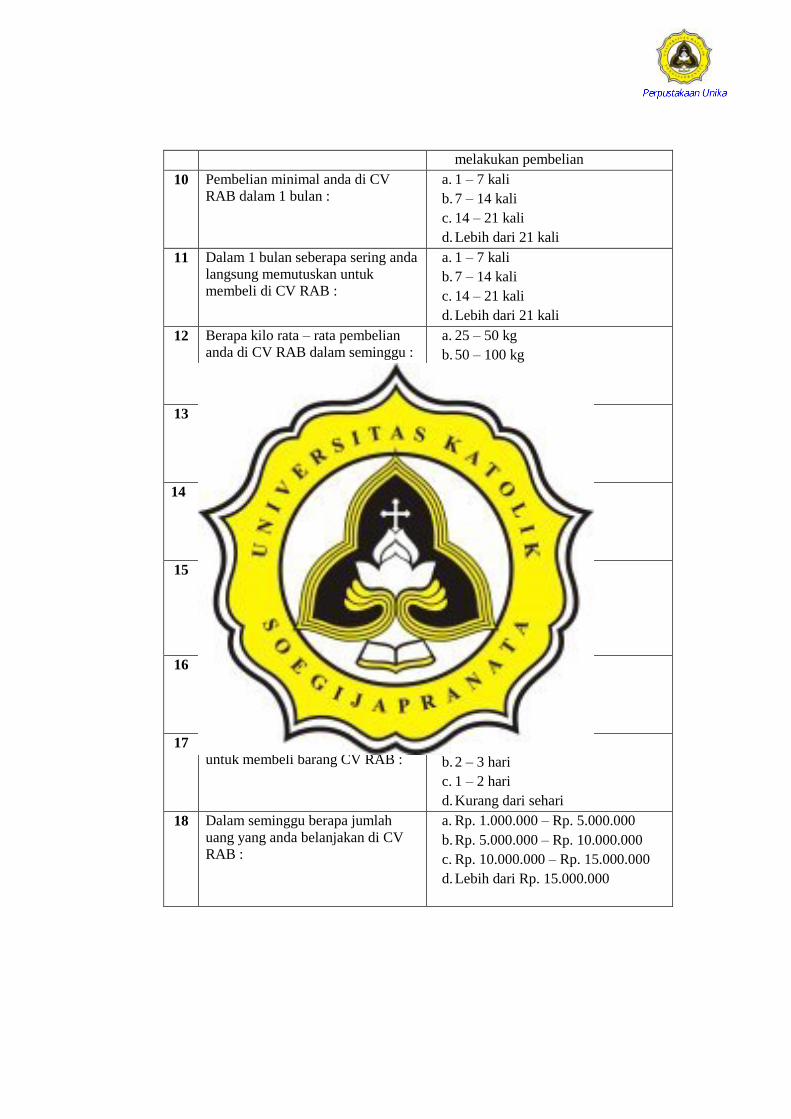
10 Pembelian minimal anda di CV
RAB dalam 1 bulan :
a. 1 – 7 kali
b. 7 – 14 kali
c. 14 – 21 kali
d. Lebih dari 21 kali
11 Dalam 1 bulan seberapa sering anda
langsung memutuskan untuk
membeli di CV RAB :
a. 1 – 7 kali
b. 7 – 14 kali
c. 14 – 21 kali
d. Lebih dari 21 kali
12 Berapa kilo rata – rata pembelian
anda di CV RAB dalam seminggu :
a. 25 – 50 kg
b. 50 – 100 kg
c. 100 – 250 kg
d. Lebih dari 250 kg
13 Seberapa sering keputusan anda
membeli barang di CV RAB karena
penawaran yang lebih menarik
dibanding distributor lain :
a. 1 – 2 kali
b. 3 – 4 kali
c. 5 – 6 kali
d. Lebih dari 6 kali
14 Dalam melakukan pembelian,
seberapa sering anda langsung
memilih CV RAB :
a. 1 – 7 kali
b. 7 – 14 kali
c. 14 – 21 kali
d. Lebih dari 21 kali
15 Berapa rata – rata jumlah box yang
anda beli dalam seminggu di CV
RAB :
a. 1 – 10 box
b. 10 – 25 box
c. 25 – 50 box
d. Lebih dari 50 box
16 Berapa kali anda melakukan
pembelian di CV RAB dalam
seminggu :
a. 1 – 2 kali
b. 2 – 4 kali
c. 4 – 6 kali
d. Lebih dari 6 kali
17 Berapa hari yang anda butuhkan
untuk membeli barang CV RAB :
a. Lebih dari 3 hari
b. 2 – 3 hari
c. 1 – 2 hari
d. Kurang dari sehari
18 Dalam seminggu berapa jumlah
uang yang anda belanjakan di CV
RAB :
a. Rp. 1.000.000 – Rp. 5.000.000
b. Rp. 5.000.000 – Rp. 10.000.000
c. Rp. 10.000.000 – Rp. 15.000.000
d. Lebih dari Rp. 15.000.000

55
A 2
SKALA HARGA

56
SKALA HARGA
SS S TS STS
19
Harga daging yang ditawarkan CV RAB
lebih terjangkau
20 Harga daging CV RAB lebih murah
dibandingkan harga daging distributor yang
lain
21 Harga yang anda keluarkan sesuai dengan
kualitas daging CV RAB yang anda dapat
22 Kualitas daging CV RAB sesuai dengan
harga yang diberikan kepada anda
23 Harga daging distributor lain tidak lebih
murah dari harga daging CV RAB
24 Anda dapat membeli daging dengan harga
yang telah ditetapkan CV RAB
25 Harga daging yang diberikan CV RAB tidak
mampu anda beli
26 Harga daging CV RAB lebih mahal
dibandingkan harga daging distributor yang
lain
27 Harga yang anda keluarkan tidak sesuai
dengan kualitas daging CV RAB yang anda
dapat
28 Kualitas daging CV RAB tidak sesuai dengan
harga yang diberikan kepada anda
29 Harga distributor lain lebih murah
dibandingkan dengan harga daging CV RAB
30 Anda meminta pengurangan harga daging
yang diberikan CV RAB
31 Anda tidak meminta pengurangan harga
daging yang diberikan CV RAB
32 Harga daging distributor lain lebih mahal
dibandingkan CV RAB
33 Harga dan kualitas daging yang anda
dapatkan dari CV RAB memuaskan
34 Harga dan kualitas daging yang anda
dapatkan dari CV RAB tidak memuaskan
35 Harga daging CV RAB jauh lebih mahal
dibandingkan harga daging distributor lain
36 Harga daging yang diberikan CV RAB tidak
mampu anda beli

57
LAMPIRAN B
DATA KASAR

58
B 1
DATA KASAR PERILAKU MEMBELI DAGING SAPI IMPOR

59
SKALA PERILAKU MEMBELI DAGING SAPI IMPOR
y1 y2 y3 y4 y5 y6 y7 y8 y9 y10 y11 y12 y13 y14 y15 y16 y17 y18
3 3 4 4 3 3 3 3 3 3 3 3 3 3 4 3 4 4
3 3 4 4 3 3 3 3 3 3 3 3 3 3 4 3 4 4
3 3 4 4 4 4 4 4 4 3 4 3 3 3 4 3 4 4
3 3 3 3 3 3 3 3 3 3 2 2 3 3 3 3 3 3
4 3 3 3 4 4 3 3 3 3 4 1 3 3 3 4 4 4
3 4 3 4 4 3 4 3 4 3 3 3 3 4 4 3 3 4
3 4 3 4 4 3 4 3 4 3 3 3 3 4 4 3 3 4
4 3 4 4 4 4 4 3 4 3 4 3 4 4 4 4 4 3
3 3 4 4 3 3 3 3 3 3 3 3 3 3 4 3 4 4
3 3 3 3 3 4 3 3 3 3 3 2 2 3 3 3 3 3
4 3 3 3 4 4 4 4 4 4 3 3 3 3 3 4 4 3
4 3 3 4 4 4 4 3 3 4 3 3 4 3 3 3 3 3
3 3 3 3 3 3 3 3 3 3 3 3 3 3 3 3 3 3
3 3 3 3 3 3 3 3 3 3 3 2 3 3 3 3 3 3
3 3 3 3 3 3 3 3 3 3 3 3 3 3 3 3 3 3
3 3 3 3 3 3 3 3 3 3 3 3 3 3 3 3 3 3
4 4 4 4 4 4 4 4 4 4 4 3 4 3 4 4 4 3
3 2 3 3 3 3 3 3 3 3 2 2 3 3 3 3 3 3
3 2 3 3 3 3 3 3 3 3 3 3 3 3 3 3 3 2
4 3 3 3 4 4 3 3 3 3 4 2 3 3 3 3 3 4
3 3 4 3 4 4 4 4 4 4 4 3 4 4 4 4 4 3
3 3 3 3 4 3 3 3 4 3 2 2 3 3 3 3 3 3
3 4 3 4 4 4 3 4 3 3 3 2 3 3 3 3 4 3
3 3 3 3 3 3 3 3 3 3 3 3 3 3 3 3 3 3
3 3 3 3 3 3 3 3 3 3 3 3 3 3 3 3 3 3
2 2 3 3 3 3 3 3 3 3 3 2 3 3 3 3 3 3
3 2 3 3 3 3 3 3 3 3 3 2 4 3 3 3 3 3
3 3 3 3 3 3 4 4 4 3 3 3 4 3 3 4 3 3
3 2 3 2 4 4 4 3 3 2 2 2 3 2 2 3 3 2
4 4 3 4 4 4 4 4 3 3 3 3 3 4 4 3 4 3
3 3 3 3 3 3 3 4 3 3 3 3 3 3 4 3 3 3
3 4 3 3 3 3 3 4 3 3 3 3 3 3 4 3 3 3
3 3 3 3 3 3 3 3 3 3 3 3 3 3 3 3 3 3
3 3 3 4 4 4 3 4 4 4 4 4 3 4 4 4 4 4
3 4 3 4 4 4 4 3 4 4 4 3 3 3 3 3 3 3

60
B 2
DATA KASAR HARGA

61
SKALA HARGA
x1 x2 x3 x4 x5 x6 x7 x8 x9 x10 x11 x12 x13 x14 x15 x16 x17 x18
3 3 3 3 3 3 3 3 3 3 3 3 4 3 4 4 3 4
3 3 2 3 3 3 3 3 3 3 3 3 4 3 4 4 2 4
4 3 3 3 4 3 3 4 3 3 3 4 3 3 3 4 3 4
3 3 2 3 3 3 3 3 2 2 3 3 3 3 3 3 3 3
4 3 4 4 4 4 4 4 3 3 4 4 3 4 4 4 3 4
4 3 3 3 3 3 3 3 3 3 3 3 3 3 3 2 3 2
4 3 3 3 3 3 3 3 3 3 3 3 3 3 3 2 3 2
3 4 4 4 4 4 4 4 4 3 3 4 4 3 3 4 4 4
3 3 3 3 3 3 3 3 3 3 3 3 4 3 4 4 3 4
3 3 2 3 3 4 3 3 3 3 3 4 3 3 3 3 3 4
4 4 4 3 2 3 3 4 4 4 4 4 4 3 3 4 4 4
4 4 3 3 3 3 4 4 3 3 3 3 3 4 3 4 4 4
3 3 3 2 3 3 3 3 3 3 3 3 3 2 3 3 2 3
3 3 3 3 4 3 3 3 3 3 3 3 3 3 3 3 3 3
3 3 3 2 4 3 4 3 3 3 3 3 3 2 3 3 3 3
3 3 3 3 4 3 4 3 3 3 3 3 3 2 3 3 3 3
4 4 4 4 4 4 4 4 4 4 4 4 4 4 4 4 4 4
3 3 3 3 2 3 3 3 3 3 3 3 2 3 2 3 3 3
3 4 2 3 3 4 4 3 3 3 3 3 3 3 3 3 3 3
4 4 3 2 3 3 3 3 3 3 3 4 4 4 3 3 3 3
4 4 2 4 4 4 4 4 4 4 4 4 3 3 3 3 3 4
3 3 3 3 2 3 3 2 3 4 4 3 3 3 3 3 2 3
3 3 3 3 3 3 3 3 3 3 3 3 3 3 3 3 3 3
3 3 3 3 3 3 3 3 3 3 3 3 3 3 3 3 3 3
4 4 4 3 3 3 1 1 3 3 3 4 4 3 2 3 3 1
3 3 2 3 3 3 3 3 3 3 3 3 2 3 3 3 3 3
3 3 3 3 3 3 3 3 2 3 3 3 3 2 3 3 3 3
4 4 3 2 3 3 3 3 3 3 3 4 3 2 3 3 3 4
2 2 2 3 3 2 4 3 1 2 3 4 3 3 2 3 3 4
4 4 2 3 3 3 3 4 3 3 4 4 3 3 4 4 3 4
3 4 3 2 2 3 2 3 4 4 3 4 3 2 2 2 3 3
3 4 3 2 2 3 3 3 3 3 3 4 3 2 2 3 3 3
3 3 3 3 3 3 3 3 3 3 3 4 4 3 3 3 3 3
3 3 3 2 4 4 4 4 4 4 4 4 4 4 4 4 4 4
4 4 4 3 3 3 3 2 3 3 3 2 3 3 3 3 3 3

62
LAMPIRAN C
UJI VALIDITAS DAN RELIABILITAS

63
C 1
UJI RELIABILITAS DAN VALIDITAS
SKALA PERILAKU MEMBELI DAGING SAPI IMPOR

64
PERILAKU MEMBELI
PUTARAN 1 Case Processing Summary
N %
Cases Valid 35 100.0
Excluded(a)
0 .0
Total 35 100.0
a Listwise deletion based on all variables in the procedure. Reliability Statistics
Cronbach's Alpha N of Items
.898 18
Item-Total Statistics
Scale Mean if Item Deleted
Scale Variance if
Item Deleted
Corrected Item-Total Correlation
Cronbach's Alpha if Item
Deleted
y1 54.71 26.504 .451 .895
y2 54.83 25.440 .506 .894
y3 54.69 26.634 .480 .894
y4 54.54 24.903 .672 .888
y5 54.43 25.429 .613 .890
y6 54.49 25.963 .513 .893
y7 54.54 25.785 .571 .892
y8 54.60 26.247 .501 .894
y9 54.57 25.487 .652 .889
y10 54.74 26.020 .594 .891
y11 54.77 24.652 .660 .888
y12 55.20 26.047 .407 .898
y13 54.74 27.020 .359 .898
y14 54.74 26.020 .594 .891
y15 54.54 25.020 .649 .889
y16 54.69 26.281 .568 .892
y17 54.54 25.373 .661 .889
y18 54.69 26.516 .368 .898
Level of significance for one-tailed test 5% = 0.3 Scale Statistics
Mean Variance Std. Deviation N of Items
57.89 28.810 5.368 18

65
C 2
UJI RELIABILITAS DAN VALIDITAS
SKALA HARGA

66
HARGA
PUTARAN 1 Case Processing Summary
N %
Cases Valid 35 100.0
Excluded(a)
0 .0
Total 35 100.0
a Listwise deletion based on all variables in the procedure. Reliability Statistics
Cronbach's Alpha N of Items
.865 18
Item-Total Statistics
Scale Mean if Item Deleted
Scale Variance if
Item Deleted
Corrected Item-Total Correlation
Cronbach's Alpha if Item
Deleted
x1 53.46 29.608 .386 .862
x2 53.46 29.961 .324 .864
x3 53.86 29.891 .267 .868
x4 53.89 29.457 .392 .862
x5 53.69 28.928 .418 .861
x6 53.63 28.829 .644 .853
x7 53.60 29.012 .404 .862
x8 53.66 27.291 .658 .850
x9 53.74 28.197 .576 .854
x10 53.69 29.634 .450 .860
x11 53.60 29.247 .627 .855
x12 53.37 29.652 .363 .863
x13 53.57 29.429 .411 .861
x14 53.86 28.538 .519 .857
x15 53.74 28.432 .537 .856
x16 53.57 27.782 .638 .851
x17 53.74 28.903 .585 .855
x18 53.49 27.728 .518 .857
Level of significance for one-tailed test 5% = 0.3
Scale Statistics
Mean Variance Std. Deviation N of Items
56.80 32.165 5.671 18
67
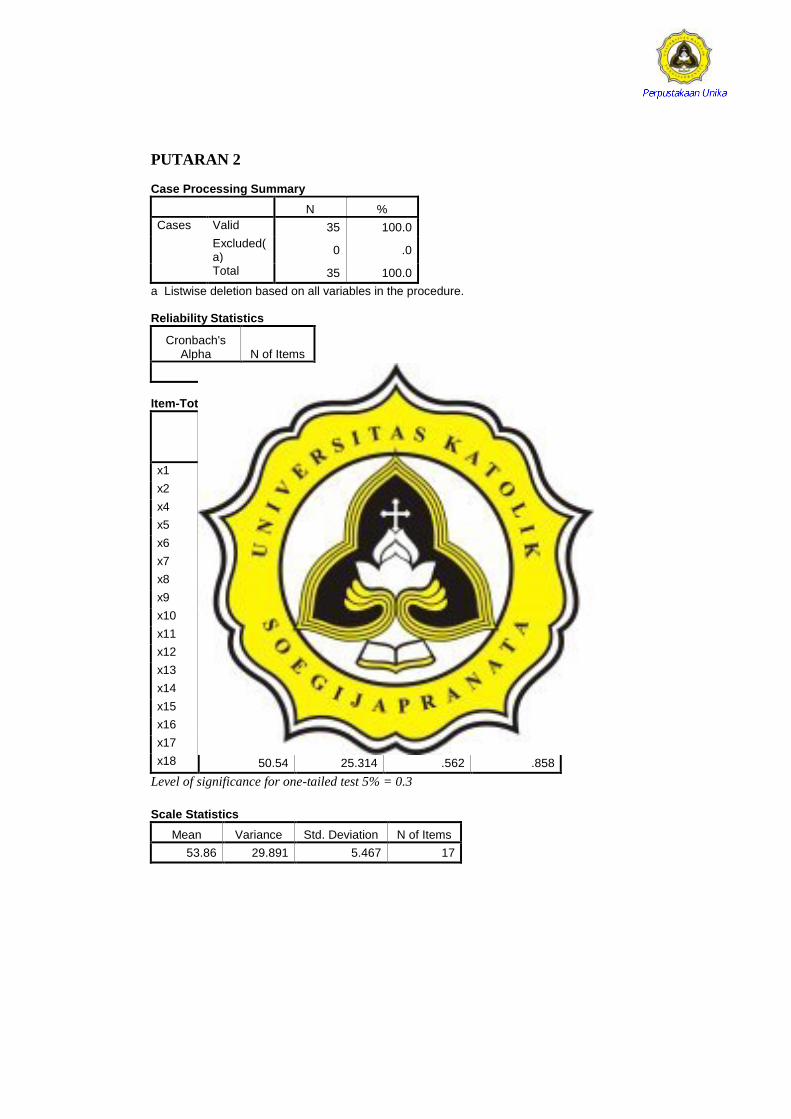
PUTARAN 2 Case Processing Summary
N %
Cases Valid 35 100.0
Excluded(a)
0 .0
Total 35 100.0
a Listwise deletion based on all variables in the procedure. Reliability Statistics
Cronbach's Alpha N of Items
.868 17
Item-Total Statistics
Scale Mean if Item Deleted
Scale Variance if
Item Deleted
Corrected Item-Total Correlation
Cronbach's Alpha if Item
Deleted
x1 50.51 27.610 .351 .866
x2 50.51 27.904 .298 .869
x4 50.94 27.291 .389 .865
x5 50.74 26.726 .424 .864
x6 50.69 26.634 .653 .856
x7 50.66 26.644 .436 .864
x8 50.71 24.975 .694 .851
x9 50.80 26.224 .548 .858
x10 50.74 27.550 .429 .863
x11 50.66 27.055 .633 .857
x12 50.43 27.429 .368 .866
x13 50.63 27.417 .380 .865
x14 50.91 26.375 .521 .859
x15 50.80 26.165 .558 .858
x16 50.63 25.652 .640 .854
x17 50.80 26.871 .558 .859
x18 50.54 25.314 .562 .858
Level of significance for one-tailed test 5% = 0.3
Scale Statistics
Mean Variance Std. Deviation N of Items
53.86 29.891 5.467 17

68
PUTARAN 3 Case Processing Summary
N %
Cases Valid 35 100.0
Excluded(a)
0 .0
Total 35 100.0
a Listwise deletion based on all variables in the procedure. Item-Total Statistics
Scale Mean if Item Deleted
Scale Variance if
Item Deleted
Corrected Item-Total Correlation
Cronbach's Alpha if Item
Deleted
x1 47.17 25.970 .299 .870
x4 47.60 25.306 .404 .865
x5 47.40 24.659 .454 .864
x6 47.34 24.820 .638 .857
x7 47.31 24.575 .467 .863
x8 47.37 23.064 .710 .850
x9 47.46 24.608 .502 .861
x10 47.40 25.776 .398 .865
x11 47.31 25.163 .633 .858
x12 47.09 25.610 .351 .868
x13 47.29 25.563 .369 .867
x14 47.57 24.429 .535 .860
x15 47.46 24.138 .588 .857
x16 47.29 23.739 .653 .854
x17 47.46 25.079 .538 .860
x18 47.20 23.341 .583 .857
Level of significance for one-tailed test 5% = 0.3 Scale Statistics
Mean Variance Std. Deviation N of Items
50.51 27.904 5.282 16
69
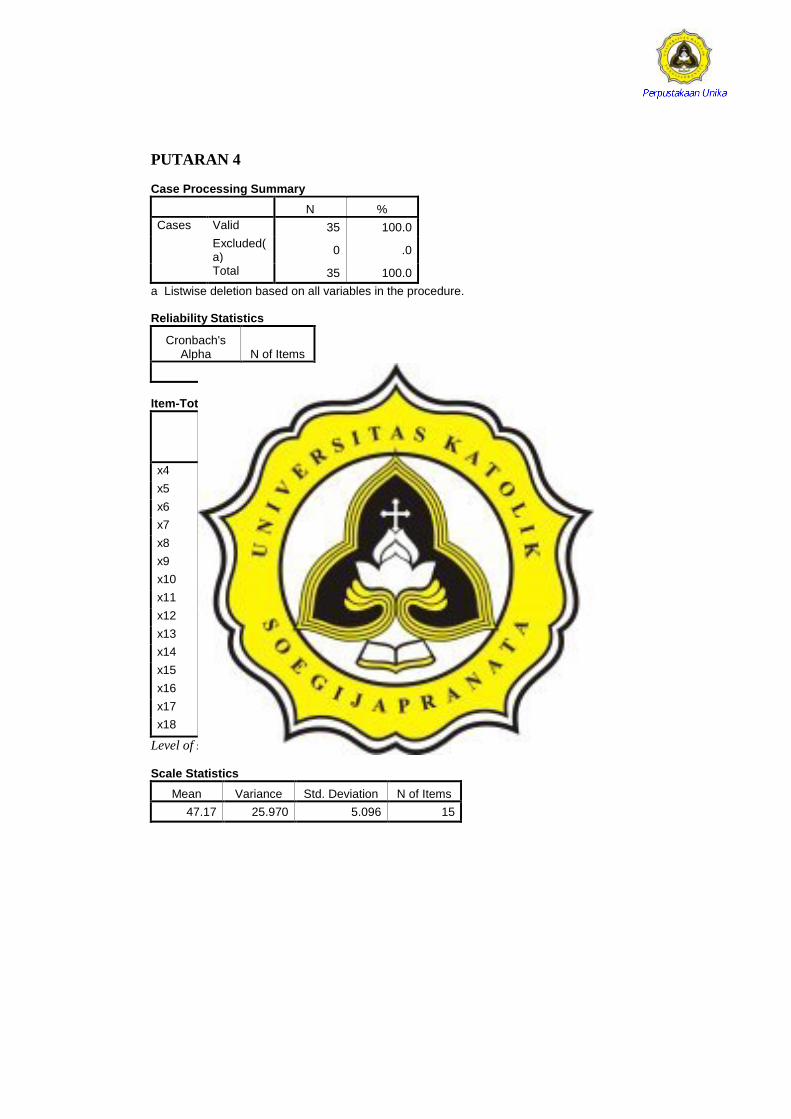
PUTARAN 4 Case Processing Summary
N %
Cases Valid 35 100.0
Excluded(a)
0 .0
Total 35 100.0
a Listwise deletion based on all variables in the procedure. Reliability Statistics
Cronbach's Alpha N of Items
.870 15
Item-Total Statistics
Scale Mean if Item Deleted
Scale Variance if
Item Deleted
Corrected Item-Total Correlation
Cronbach's Alpha if Item
Deleted
x4 44.26 23.491 .397 .867
x5 44.06 22.820 .456 .865
x6 44.00 23.000 .637 .858
x7 43.97 22.558 .501 .863
x8 44.03 21.264 .717 .851
x9 44.11 22.928 .476 .864
x10 44.06 23.997 .380 .867
x11 43.97 23.382 .617 .859
x12 43.74 23.785 .345 .870
x13 43.94 23.703 .370 .868
x14 44.23 22.711 .516 .862
x15 44.11 22.339 .587 .858
x16 43.94 21.879 .667 .854
x17 44.11 23.281 .529 .861
x18 43.86 21.361 .616 .856
Level of significance for one-tailed test 5% = 0.3 Scale Statistics
Mean Variance Std. Deviation N of Items
47.17 25.970 5.096 15

70
LAMPIRAN D
DATA ITEM VALID

71
D 1
DATA ITEM VALID
PERILAKU MEMBELI DAGING SAPI IMPOR
72
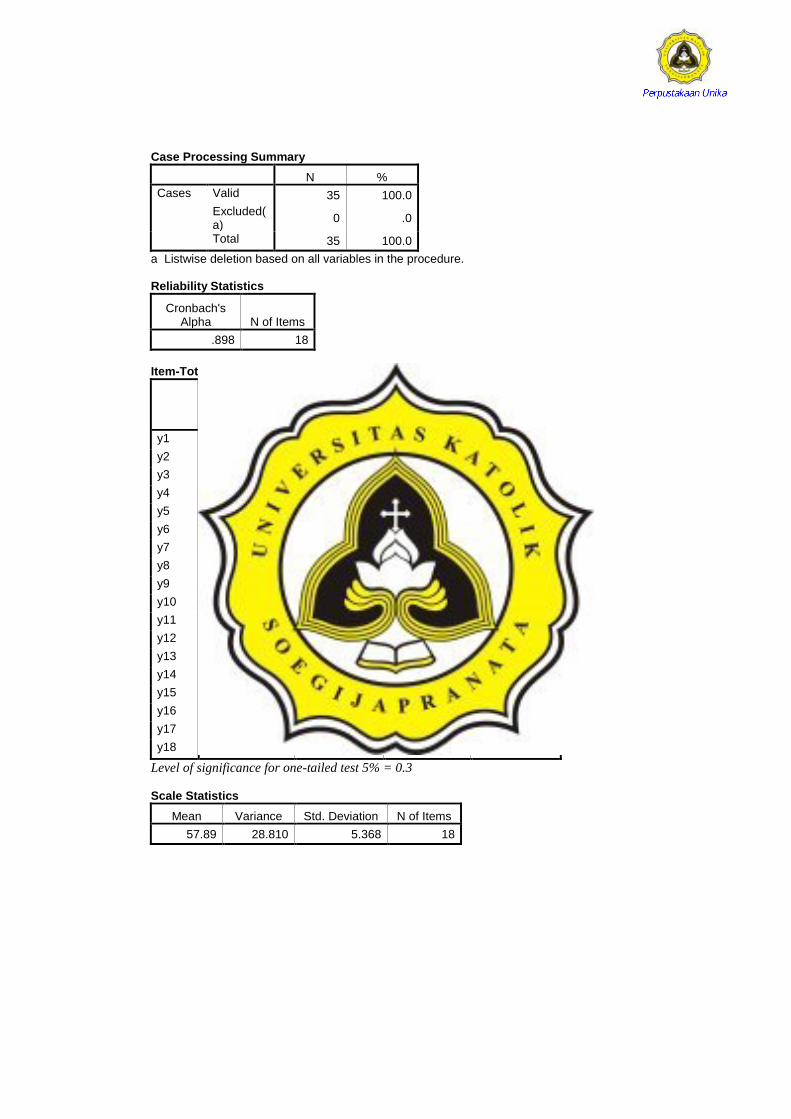
Case Processing Summary
N %
Cases Valid 35 100.0
Excluded(a)
0 .0
Total 35 100.0
a Listwise deletion based on all variables in the procedure. Reliability Statistics
Cronbach's Alpha N of Items
.898 18
Item-Total Statistics
Scale Mean if Item Deleted
Scale Variance if
Item Deleted
Corrected Item-Total Correlation
Cronbach's Alpha if Item
Deleted
y1 54.71 26.504 .451 .895
y2 54.83 25.440 .506 .894
y3 54.69 26.634 .480 .894
y4 54.54 24.903 .672 .888
y5 54.43 25.429 .613 .890
y6 54.49 25.963 .513 .893
y7 54.54 25.785 .571 .892
y8 54.60 26.247 .501 .894
y9 54.57 25.487 .652 .889
y10 54.74 26.020 .594 .891
y11 54.77 24.652 .660 .888
y12 55.20 26.047 .407 .898
y13 54.74 27.020 .359 .898
y14 54.74 26.020 .594 .891
y15 54.54 25.020 .649 .889
y16 54.69 26.281 .568 .892
y17 54.54 25.373 .661 .889
y18 54.69 26.516 .368 .898
Level of significance for one-tailed test 5% = 0.3 Scale Statistics
Mean Variance Std. Deviation N of Items
57.89 28.810 5.368 18

73
D 2
DATA ITEM VALID
SKALA HARGA

74
Case Processing Summary
N %
Cases Valid 35 100.0
Excluded(a)
0 .0
Total 35 100.0
a Listwise deletion based on all variables in the procedure. Reliability Statistics
Cronbach's Alpha N of Items
.870 15
Item-Total Statistics
Scale Mean if Item Deleted
Scale Variance if
Item Deleted
Corrected Item-Total Correlation
Cronbach's Alpha if Item
Deleted
x4 44.26 23.491 .397 .867
x5 44.06 22.820 .456 .865
x6 44.00 23.000 .637 .858
x7 43.97 22.558 .501 .863
x8 44.03 21.264 .717 .851
x9 44.11 22.928 .476 .864
x10 44.06 23.997 .380 .867
x11 43.97 23.382 .617 .859
x12 43.74 23.785 .345 .870
x13 43.94 23.703 .370 .868
x14 44.23 22.711 .516 .862
x15 44.11 22.339 .587 .858
x16 43.94 21.879 .667 .854
x17 44.11 23.281 .529 .861
x18 43.86 21.361 .616 .856
Level of significance for one-tailed test 5% = 0.3 Scale Statistics
Mean Variance Std. Deviation N of Items
47.17 25.970 5.096 15

75
LAMPIRAN E
TOTAL NILAI DATA PENELITIAN VALID
76
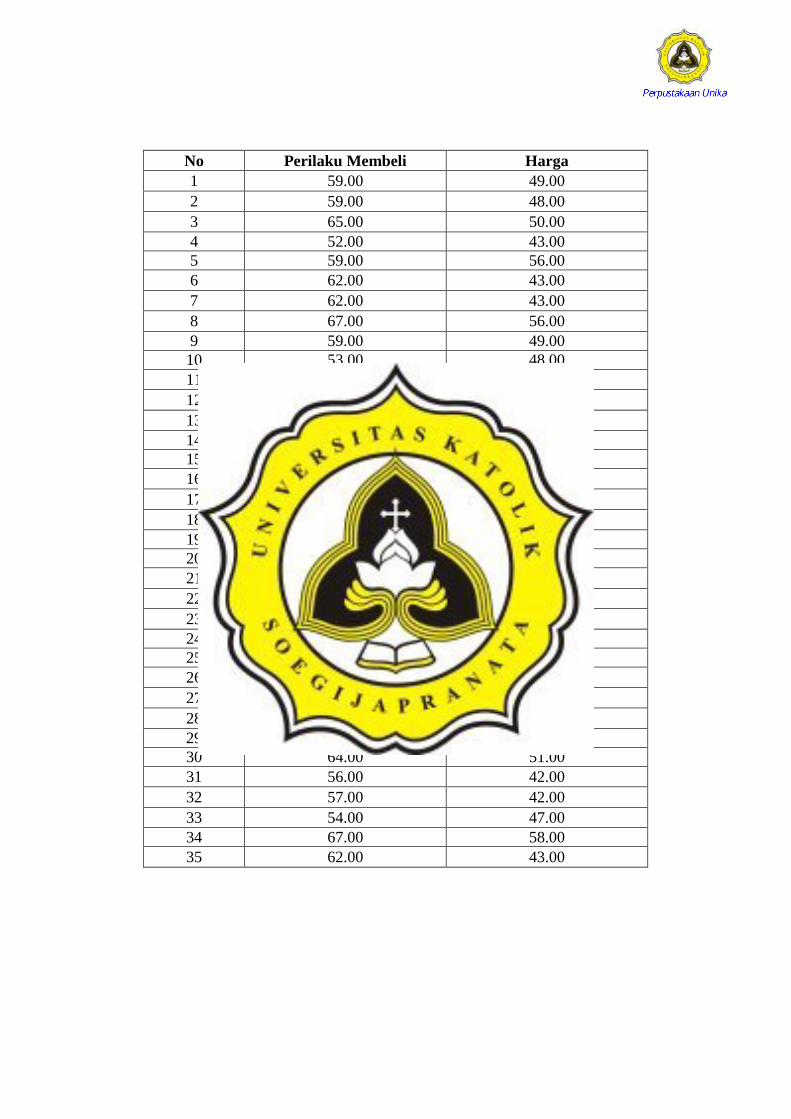
No Perilaku Membeli Harga
1 59.00 49.00
2 59.00 48.00
3 65.00 50.00
4 52.00 43.00
5 59.00 56.00
6 62.00 43.00
7 62.00 43.00
8 67.00 56.00
9 59.00 49.00
10 53.00 48.00
11 63.00 53.00
12 61.00 51.00
13 54.00 42.00
14 53.00 46.00
15 54.00 45.00
16 54.00 46.00
17 69.00 60.00
18 51.00 42.00
19 52.00 47.00
20 58.00 47.00
21 67.00 55.00
22 54.00 44.00
23 59.00 45.00
24 54.00 45.00
25 54.00 40.00
26 51.00 44.00
27 53.00 43.00
28 59.00 45.00
29 49.00 43.00
30 64.00 51.00
31 56.00 42.00
32 57.00 42.00
33 54.00 47.00
34 67.00 58.00
35 62.00 43.00

77
LAMPIRAN F
UJI ASUMSI DAN HIPOTESIS

78
F 1
UJI ASUMSI
79
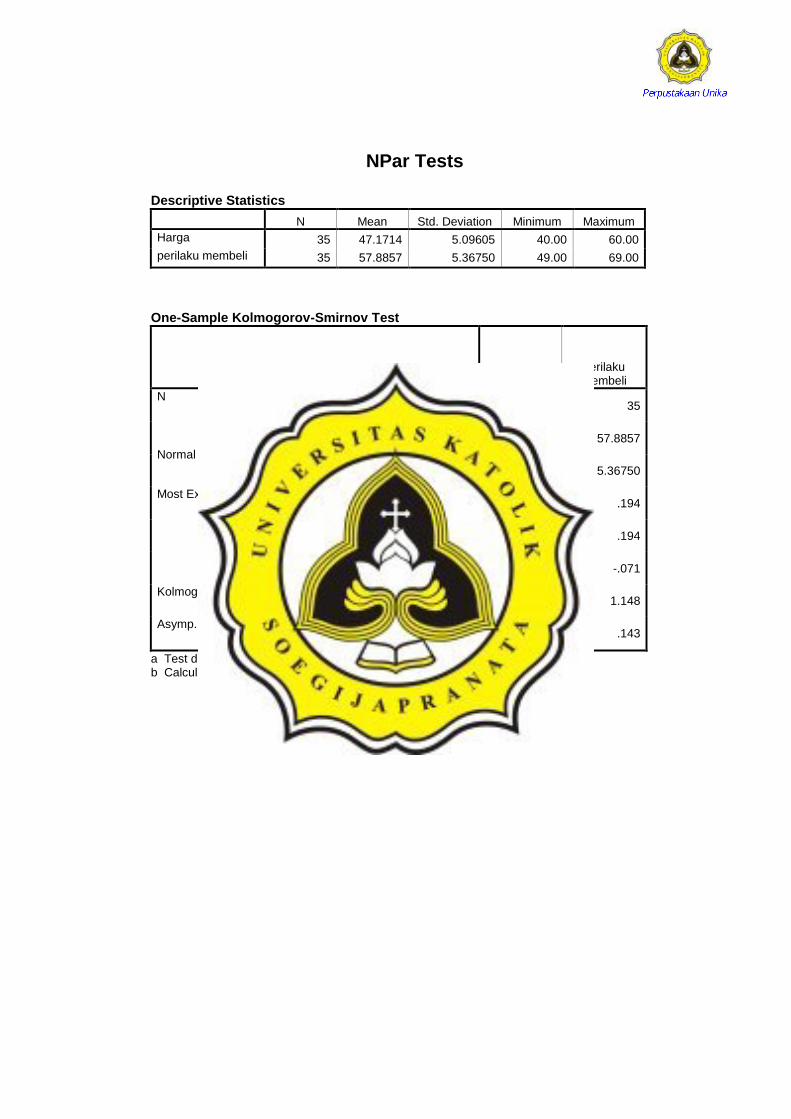
NPar Tests Descriptive Statistics
N Mean Std. Deviation Minimum Maximum
Harga 35 47.1714 5.09605 40.00 60.00
perilaku membeli 35 57.8857 5.36750 49.00 69.00
One-Sample Kolmogorov-Smirnov Test
harga perilaku membeli
N 35 35
Normal Parameters(a,b)
Mean 47.1714 57.8857
Std. Deviation 5.09605 5.36750
Most Extreme Differences Absolute .151 .194
Positive .151 .194
Negative -.127 -.071
Kolmogorov-Smirnov Z .892 1.148
Asymp. Sig. (2-tailed) .405 .143
a Test distribution is Normal. b Calculated from data.
80
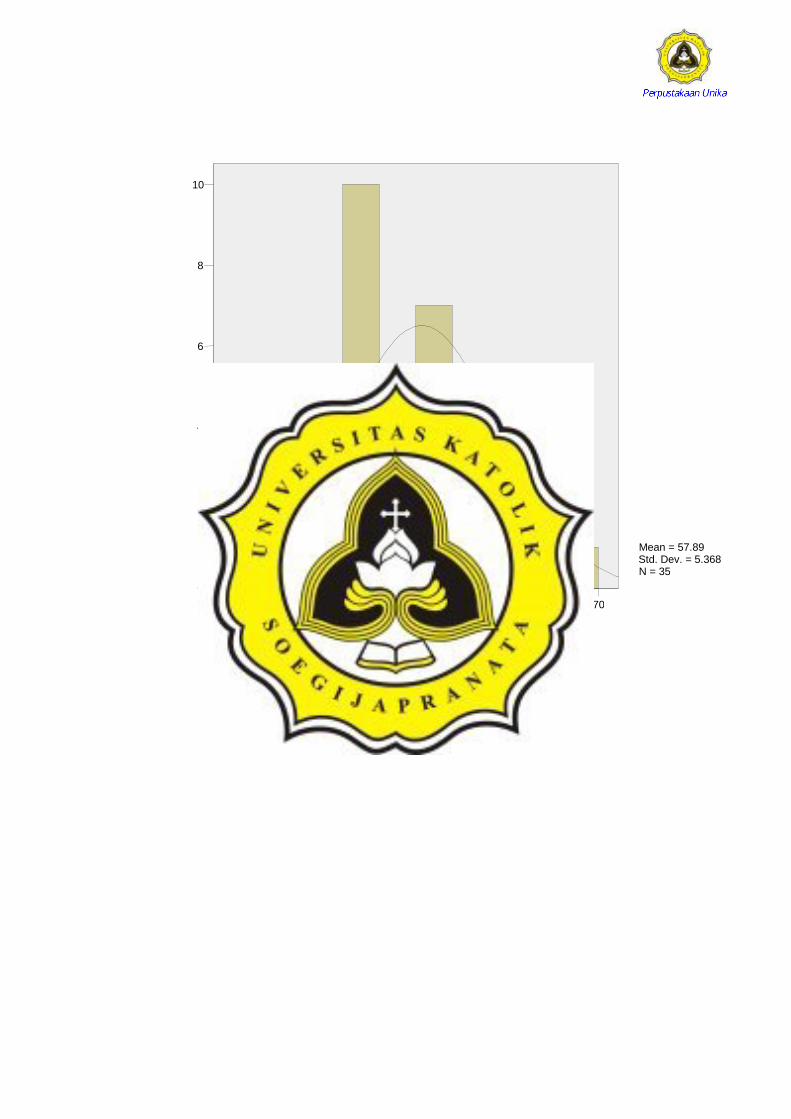
70 65 60 55 50 45
Perilaku Membeli
10
8
6
4
2
0
1
4
2
4
7
2
10
4
1
Mean = 57.89 Std. Dev. = 5.368 N = 35

81
60 55 50 45 40
Harga
10
8
6
4
2
0
2
3
1
3
4
9
8
5
Mean = 47.17 Std. Dev. = 5.096 N = 35

82
Curve Fit
Model Description
Model Name MOD_1
Dependent Variable 1 perilaku membeli
Equation 1 Linear
2 Quadratic
3 Cubic
Independent Variable harga
Constant Included
Variable Whose Values Label Observations in Plots Unspecified
Tolerance for Entering Terms in Equations .0001
Case Processing Summary
N
Total Cases 35
Excluded Cases(a) 0
Forecasted Cases 0
Newly Created Cases 0
a Cases with a missing value in any variable are excluded from the analysis.
Variable Processing Summary
Variables
Dependent Independent
perilaku membeli harga
Number of Positive Values 35 35
Number of Zeros 0 0
Number of Negative Values 0 0
Number of Missing Values
User-Missing 0 0
System-Missing 0 0
Model Summary and Parameter Estimates Dependent Variable: perilaku membeli
Equation
Model Summary Parameter Estimates
R Square F df1 df2 Sig. Constant b1 b2 b3
Linear .528 36.895 1 33 .000 21.788 .765
Quadratic .545 19.146 2 32 .000 84.608 -1.805 .026
Cubic .544 19.063 2 32 .000 62.343 -.482 .000 .000
The independent variable is harga.

83

84
F 2
UJI HIPOTESIS

85
Correlations
Descriptive Statistics
Mean Std. Deviation N
harga 47.1714 5.09605 35
perilaku membeli 57.8857 5.36750 35
Correlations
harga perilaku membeli
harga Pearson Correlation 1 .727(**)
Sig. (1-tailed) .000
N 35 35
perilaku membeli Pearson Correlation .727(**) 1
Sig. (1-tailed) .000
N 35 35
** Correlation is significant at the 0.01 level (1-tailed).

86
LAMPIRAN G
SURAT PENELITIAN

87
G 1
SURAT IJIN PENELITIAN

88

89
G 2
SURAT JAWABAN IJIN PENELITIAN

90

91
G 3
SURAT KETERANGAN PENELITIAN