LAMPIRAN 1. KUESIONER - repository.unika.ac.idrepository.unika.ac.id/7323/8/12.61.0049 Linda Amelia...
116
99 LAMPIRAN 1. KUESIONER Kuesioner tentang Persepsi Kesiapan Mahasiswa Akuntansi dalam Menghadapi Asean Economic Community (AEC) 2015: Studi Empiris pada Mahasiswa Akuntansi Universitas Katholik Soegijapranata Semarang, Indonesia Sehubungan dengan penelitian saya yang berjudul “Kesiapan Mahasiswa Akuntasi dalam Asean Economic Community ( AEC ) 2015” Studi Empiris Pada Mahasiswa Akuntansi Universitas Katholik Soegijapranata Semarang, Indonesia. Maka saya mohon kesediaan anda untuk mengisi kuesioner penelitian ini, atas kesediaan dan partisipasi anda sekalian untuk mengisi kuesioner ini saya ucapkan terima kasih. PENDAHULUAN. Dimulainya Asean Economic Community (AEC) atau yang biasa kita sebut dengan Masyarakat Ekonomi Asean ( MEA ) atau pasar bebas antara negara – negara anggota ASEAN di tahun 2015 ini maka memungkinkan produk entah itu barang ataupun jasa asing masuk ke Indonesia tanpa hambatan tarif, begitu pula sebaliknya. Sebagai salah satu dari anggota ASEAN maka Indonesia harus bersiap – siap atas persaingan yang harus dihadapi dengan negara – negara lain dari bidang usaha perdagangan, bisnis, pendidikan, tenaga kerja, dll. Adanya persaingan tenaga kerja yang akan dihadapi Indonesia nantinya juga menjadi tantangan bagi mahasiswa – mahasiwa yang masih menjalankan studi di universitas, karena sebelum memasuki dunia kerja nantinya mereka harus mempersiapkan diri sebaik mungkin agar bisa bersaing dengan para mahasiswa
Transcript of LAMPIRAN 1. KUESIONER - repository.unika.ac.idrepository.unika.ac.id/7323/8/12.61.0049 Linda Amelia...

99
LAMPIRAN 1. KUESIONER
Kuesioner tentang Persepsi Kesiapan Mahasiswa Akuntansi dalam
Menghadapi Asean Economic Community (AEC) 2015: Studi Empiris pada
Mahasiswa Akuntansi Universitas Katholik Soegijapranata Semarang,
Indonesia
Sehubungan dengan penelitian saya yang berjudul “Kesiapan Mahasiswa
Akuntasi dalam Asean Economic Community ( AEC ) 2015” Studi Empiris Pada
Mahasiswa Akuntansi Universitas Katholik Soegijapranata Semarang, Indonesia.
Maka saya mohon kesediaan anda untuk mengisi kuesioner penelitian ini, atas
kesediaan dan partisipasi anda sekalian untuk mengisi kuesioner ini saya ucapkan
terima kasih.
PENDAHULUAN.
Dimulainya Asean Economic Community (AEC) atau yang biasa kita sebut
dengan Masyarakat Ekonomi Asean ( MEA ) atau pasar bebas antara negara –
negara anggota ASEAN di tahun 2015 ini maka memungkinkan produk entah itu
barang ataupun jasa asing masuk ke Indonesia tanpa hambatan tarif, begitu pula
sebaliknya. Sebagai salah satu dari anggota ASEAN maka Indonesia harus bersiap
– siap atas persaingan yang harus dihadapi dengan negara – negara lain dari
bidang usaha perdagangan, bisnis, pendidikan, tenaga kerja, dll. Adanya
persaingan tenaga kerja yang akan dihadapi Indonesia nantinya juga menjadi
tantangan bagi mahasiswa – mahasiwa yang masih menjalankan studi di
universitas, karena sebelum memasuki dunia kerja nantinya mereka harus
mempersiapkan diri sebaik mungkin agar bisa bersaing dengan para mahasiswa
100
dari Negara lainnya.
Part 1: Informasi Umum.
( Beri tanda silang ( X ) Pada Jawaban Yang Anda Pilih. )
1. Jenis Kelamin : PRIA WANITA
2. Umur :…………………………th
3. Tahun Angkatan
2011 2012
2013 2014
4. IPK………………………………………………………………………………
5. Medias’s Interest (anda dapat menjawab lebih dari satu )
TV Radio
Internet Koran
Teman Orang Tua
Dosen Lainnya……
6. Apakah anda mengetahui tentang AEC ( Asean Economic Community ) ?
YA TIDAK
7. Apakah anda mengetahui tentang AEC dan dampaknya bagi akuntan ?
YA TIDAK
8. Apakah anda berencana untuk melanjutkan studi ke tingkat S2 ?
YA TIDAK
Jika ya, Universitas apa dan dinegara mana yang kamu pilih untuk studi ?
…………………………………………….

101
Part 2. Faktor yang Mempengaruhi Perkembangan Pendidikan Akuntansi
Uutuk Menghadapi AEC 2015.
Dalam part 2 ini anda diharuskan meranking dari 1 sampai 18, dimana angka
paling kecil (1) menunjukan anda sangat setuju apabila faktor tersebut
mempengaruhi perkembangan pendidikan akuntansi di Indonesia untuk
menghadapi AEC 2015, dan angka paling besar (18) menunjukan anda sangat
tidak setuju apabila faktor tersebut mempengaruhi perkembangan pendidikan
akuntansi di Indonesia untuk menghadapi AEC 2015
Kemampuan berbahasa InggrisMoral dan Etika seorang akuntan.Kesiapan Universitas dalam memberikan pelajaran mengenai program – program akuntansi.Pengetahuan dari International Accounting Standarts dan International Financial Reports (IFRS).Pengetahuan tentang pekerjaan dalam akuntansi.Kerjasama antar kelompok.Kemampuan dasar dalam pengoperasian computer.Teknologi tentang akuntansi ( Accounting Software).Kesiapan dalam perubahan system managerial.Kompetisi / persaingan antar para akuntan di AEC.Pengetahuan tentang AEC. Isu – isu politik diatara negara – negara anggota AEC. Pengetahuan tentang kebudayaan dari negara – negara anggota AEC. Kemampuan berbahasa lain ( bahasa negara – negara anggota AEC ). kemampuan teknologi untur berkomunikasi.Kemampuan bernegosiasi. Pengetahuan tentang perubahan manajeman. Kerjasama antar pemerintah, lembaga swasta, dan pendidikan.
Faktor yang mempengaruhi pendidikan akuntansi di Indonesia untuk menghadapi AEC 2015
Ranking
1 Sangat Setuju
Sangat Tidak
Setuju 18
102
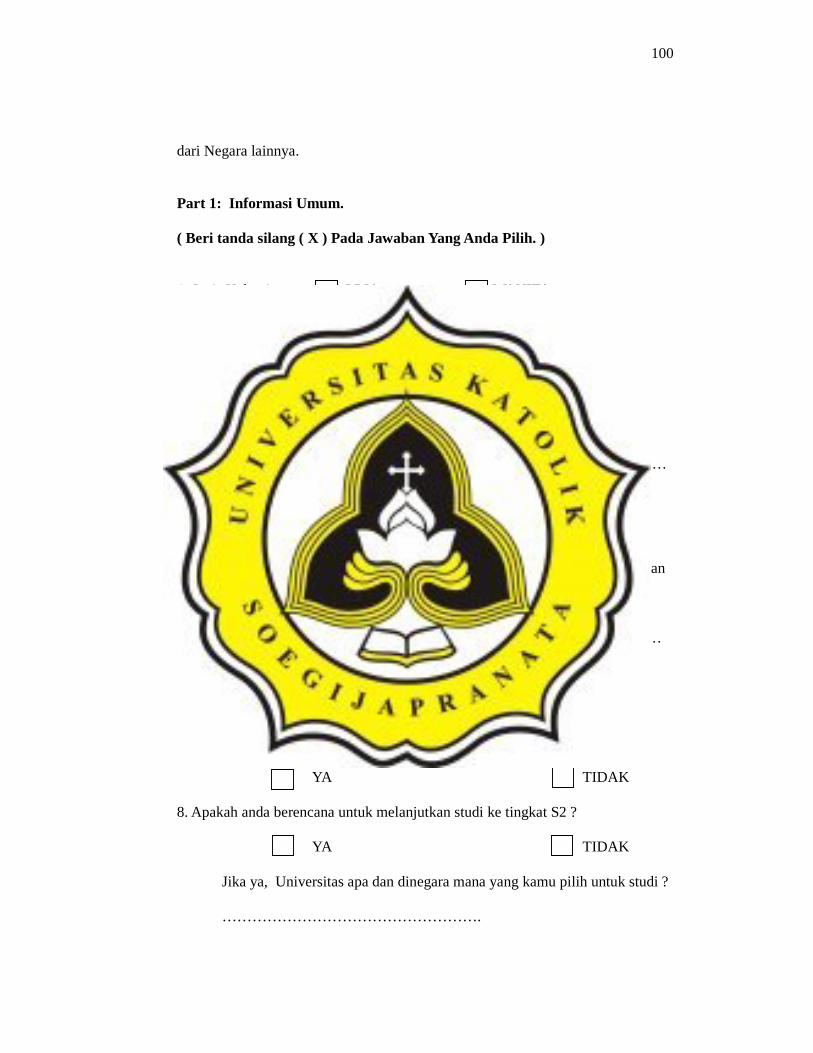
Part 3. Kesiapan Mahasiswa Akuntansi di Indonesia Dalam Menghadapi AEC 2015. Dari pernyataan – pernyataan yang ada dibawah ini anda diharuskan memilih dari
angka 1 – 5 dimana angka paling kecil (1) menunjukan bahwa anda Sangat Tidak
Setuju dengan pernyataan tersebut, dan angka paling besar (5) menunjukan bahwa
anda Sangat Setuju dengan pernyataan tersebut.
*) Informasi : Sangat Setuju menunjukan bahwa anda Siap menghadapi AEC sebaliknya bila anda Sangat Tidak Setuju menunjukan bahwa anda Tidak Siap menghadapi AEC dilihat dari faktor – faktor dalam pernyataan – pernyataan tersebut.
Tidak Setuju <--- --- ---> Setuju NO Keterangan
1 2 3 4 5
1 Dengan Kemampuan Bahasa Inggris yang saya miliki saat ini, saya sudah siap untuk menghadapi AEC 2015
2 Dengan pengetahuan saya tentang Moral dan Etika seorang akuntan, saya sudah siap untuk menghadapi AEC 2015
3 Dari Kesiapan yang dimiliki Universitas tempat saya studi dalam memberikan pelajaran mengenai program – program akuntansi, Saya sudah siap untuk menghadapi AEC 2015
4 Dengan Pengetahuan saya tentang International Accounting Standarts dan International Financial Report Standart (IFRS), saya sudah siap untuk menghadapi AEC 2015.
5
Dengan pengetahuan yang saya miliki tentang apa saja pekerjaan - pekerjaan yang akan dilakukan dalam dunia kerja yang berhubungan dengan akuntansi, saya sudah siap untuk menghadapi AEC 2015.
6 Dengan kemampuan saya dalam membangun kerjasama dalam sebuah kelompok, saya sudah siap untuk menghadapi AEC 2015.
7 Dengan Kemampuan dasar yang saya miliki dalam pengoperasian computer, saya sudah siap untuk menghadapi AEC 2015.
8 Dengan pengetahuan yang saya miliki mengenai Teknologi tentang akuntansi ( Accounting Software), saya sudah siap untuk menghadapi AEC 2015.

103
9
Adanya AEC 2015 akan membawa perubahan dalam system managerial suatu perusahaan hal tersebut dikarenakan banyaknya perusahaan asing atau orang asing yang masuk ke Indonesia akan membawa pengaruh yang besar pada perusahaan - perusahaan yang mereka masukki, saat memasuki dunia kerja nanti saya sudah siap untuk menghadapi perubahan tersebut saat AEC 2015 berlangsung.
10
Dari Kompetisi / persaingan yang terjadi antar para Mahasiswa Akuntansi anggota negara AEC lainnya dalam dunia kerja, Saya sudah siap untuk bersaing dengan para mahasiswa negara AEC lainnya untuk menghadapi AEC 2015.
Tidak Setuju <--- --- ---> Setuju
NO Keteranagan 1 2 3 4 5
11 Dengan pengetahuan yang saya miliki tentang AEC, Saya sudah siap untuk menghadapi AEC 2015.
12 Dengan pengetahuan saya mengenai isu – isu politik diantara negara – negara anggota AEC, Saya sudah siap menghadapi AEC 2015.
13 Dengan pengetahuan saya tentang kebudayaan yang dimiliki oleh negara – negara anggota AEC lainnya, Saya sudah siap menghadapi AEC 2015.
14 Dengan kemampuan yang saya miliki dalam berbahasa lain ( bahasa negara – negara anggota AEC ), Saya sudah siap menghadapi AEC 2015.
15 Dengan kemampuan yang saya miliki dalam teknologi untuk berkomunikasi, saya sudah siap untuk menghadapi AEC 2015.
16 Dengan Kemampuan saya dalam bernegosiasi, Saya sudah siap untuk menghadapi AEC 2015.
17
Dengan Pengetahuan saya tentang perubahan manajeman yang akan terjadi dalam perusahaan saat AEC 2015 berlangsung ( Contohnya dalam perusahaan yang banyak dimasuki / bekerjasama oleh pihak asing ), Saya sudah siap menghadapai AEC 2015.
18
Dilihat dari Kerjasama yang sudah dilakukan antara pemerintah, lembaga swasta, dan pendidikan di Indonesia dalam mempersiapkan segala sesuatu nya atas berlangsungnya AEC 2015 ini, Saya sudah siap dalam menghadapi AEC 2015.
Thankyou ☺ ☺ ☺

104
LAMPIRAN 2. VALIDITAS & RELIABILITAS FAKTOR YANG MEMPENGARUHI PERKEMBANGAN PENDIDIKAN AKUNTANSI UNTUK MENGHADAPI AEC DITINJAU DARI KARAKTERISTIK RESPONDEN
Warnings
Scale or part of scale has zero variance and will be bypassed.
Case Processing Summary
N %
Valid 274 100.0
Excludeda 0 .0
Cases
Total 274 100.0
a. Listwise deletion based on all variables in the procedure.
Item Statistics
Mean Std. Deviation N
Faktor 1 15.77 3.249 274
Faktor 2 11.91 4.417 274
Faktor 3 13.64 3.619 274
Faktor 4 13.85 4.272 274
Faktor 5 9.77 4.480 274
Faktor 6 8.70 4.394 274
Faktor 7 9.65 4.043 274
Faktor 8 8.98 3.911 274
Faktor 9 6.59 4.764 274
Faktor 10 7.84 4.898 274
Faktor 11 9.93 5.356 274
Faktor 12 6.51 4.470 274
Faktor 13 8.20 4.927 274
Faktor 14 8.22 4.954 274
Faktor 15 9.16 3.909 274
Faktor 16 6.15 4.640 274
Faktor 17 5.82 4.153 274
Faktor 18 10.32 4.882 274
Keterangan: koefisien validitas dan reliabilitas tidak bisa dihitung karena skor konstan
105
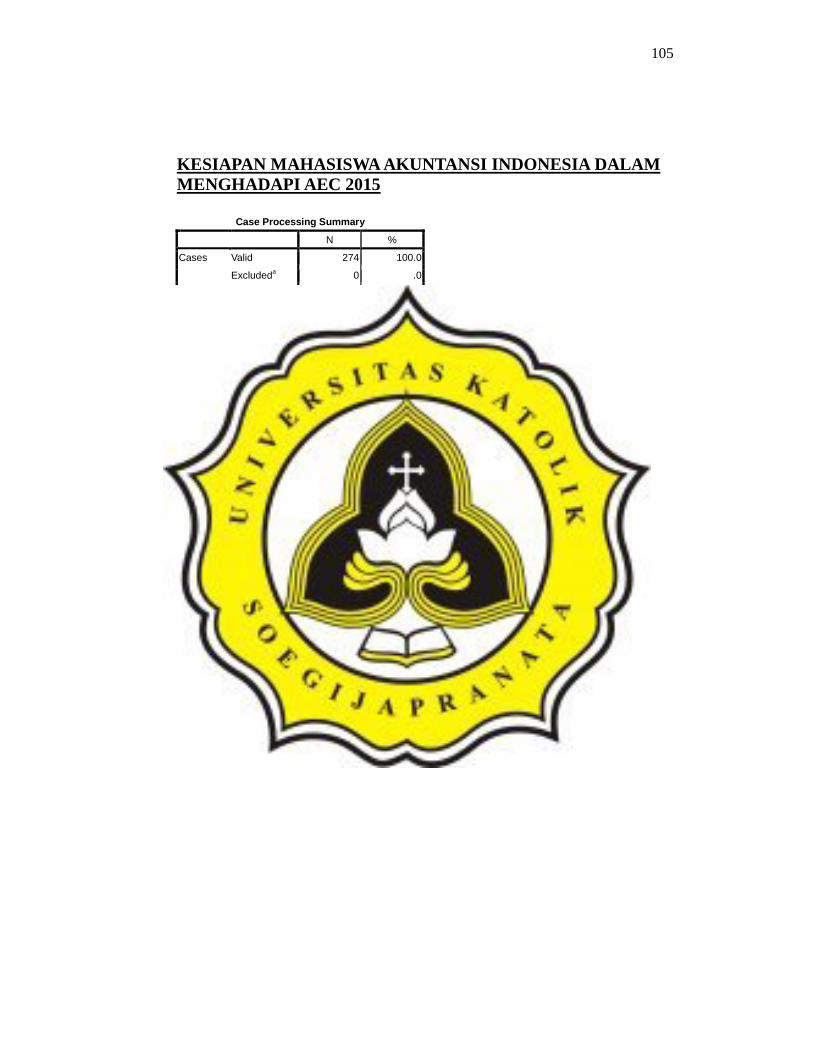
KESIAPAN MAHASISWA AKUNTANSI INDONESIA DALAM MENGHADAPI AEC 2015
Case Processing Summary
N %
Valid 274 100.0
Excludeda 0 .0
Cases
Total 274 100.0
a. Listwise deletion based on all variables in the procedure.
Reliability Statistics
Cronbach's Alpha N of Items
.913 18
Item-Total Statistics
Scale Mean if Item Deleted
Scale Variance if Item Deleted
Corrected Item-Total Correlation
Cronbach's Alpha if Item Deleted
Kesiapan 1 56.88 85.479 .535 .909
Kesiapan 2 56.88 85.210 .712 .904
Kesiapan 3 56.76 89.002 .446 .911
Kesiapan 4 56.88 84.944 .629 .906
Kesiapan 5 56.98 87.758 .532 .909
Kesiapan 6 56.78 87.803 .510 .910
Kesiapan 7 56.80 88.935 .442 .911
Kesiapan 8 56.90 85.733 .624 .907
Kesiapan 9 56.99 86.762 .494 .910
Kesiapan 10 56.85 85.212 .665 .905
Kesiapan 11 56.90 85.305 .612 .907
Kesiapan 12 56.98 85.186 .677 .905
Kesiapan 13 57.03 84.823 .641 .906
Kesiapan 14 57.30 84.773 .567 .908
Kesiapan 15 56.77 87.006 .583 .908
Kesiapan 16 56.84 86.770 .592 .908
Kesiapan 17 57.06 85.535 .625 .907
Kesiapan 18 56.83 87.557 .543 .909

92
LAMPIRAN 3. ANALISIS DESKRIPTIF KARAKTERISTIK RESPONDEN
Jenis Kelamin
Frequency Percent Valid Percent
Cumulative Percent
Pria 113 41.2 41.2 41.2
wanita 161 58.8 58.8 100.0
Valid
Total 274 100.0 100.0
Usia
Frequency Percent Valid Percent
Cumulative Percent
17-18 tahun 32 11.7 11.7 11.7
19-20 tahun 94 34.3 34.3 46.0
21-22 tahun 100 36.5 36.5 82.5
23-24 tahun 37 13.5 13.5 96.0
>25 tahun 11 4.0 4.0 100.0
Valid
Total 274 100.0 100.0
Tahun Angkatan
Frequency Percent Valid Percent
Cumulative Percent
2011 85 31.0 31.0 31.0
2012 72 26.3 26.3 57.3
2013 63 23.0 23.0 80.3
2014 54 19.7 19.7 100.0
Valid
Total 274 100.0 100.0
IPK
Frequency Percent Valid Percent
Cumulative Percent
<2,00 6 2.2 2.2 2.2
2,00-2,99 111 40.5 40.5 42.7
3,00-3,49 105 38.3 38.3 81.0
>3,5 52 19.0 19.0 100.0
Valid
Total 274 100.0 100.0

93
RANGKING DARI FAKTOR YANG MEMPENGARUHI PERKEMBANGAN PENDIDIKAN AKUNTANSI UNTUK MENGHADAPI AEC DITINJAU DARI KARAKTERISTIK RESPONDEN
Statistics
N
Valid Missing Mean Std. Deviation Rangking
Faktor 1 274 0 15.77 3.249 1
Faktor 4 274 0 13.85 4.272 2
Faktor 3 274 0 13.64 3.619 3
Faktor 2 274 0 11.91 4.417 4
Faktor 18 274 0 10.32 4.882 5
Faktor 11 274 0 9.93 5.356 6
Faktor 5 274 0 9.77 4.480 7
Faktor 7 274 0 9.65 4.043 8
Faktor 15 274 0 9.16 3.909 9
Faktor 8 274 0 8.98 3.911 10
Faktor 6 274 0 8.70 4.394 11
Faktor 13 274 0 8.20 4.927 12
Faktor 14 274 0 8.22 4.954 13
Faktor 10 274 0 7.84 4.898 14
Faktor 9 274 0 6.59 4.764 15
Faktor 12 274 0 6.51 4.470 16
Faktor 16 274 0 6.15 4.640 17
Faktor 17 274 0 5.82 4.153 18

94
RANGKING DARI KESIAPAN MAHASISWA AKUNTANSI INDONESIA DALAM MENGHADAPI AEC 2015
Statistics
N
Valid Missing Mean Std. Deviation Rangking
Kesiapan 3 274 0 3.50 .790 1
Kesiapan 15 274 0 3.49 .795 2
Kesiapan 6 274 0 3.47 .817 3
Kesiapan 7 274 0 3.46 .803 4
Kesiapan 18 274 0 3.43 .796 5
Kesiapan 16 274 0 3.42 .804 6
Kesiapan 10 274 0 3.41 .843 7
Kesiapan 1 274 0 3.38 .992 8
Kesiapan 2 274 0 3.38 .794 9
Kesiapan 4 274 0 3.38 .907 10
Kesiapan 8 274 0 3.36 .850 11
Kesiapan 11 274 0 3.36 .900 12
Kesiapan 5 274 0 3.28 .792 13
Kesiapan 12 274 0 3.28 .833 14
Kesiapan 9 274 0 3.27 .939 15
Kesiapan 13 274 0 3.23 .902 16
Kesiapan 17 274 0 3.20 .864 17
Kesiapan 14 274 0 2.96 1.005 18

95
LAMPIRAN 4. HASIL CROSTABB KESIAPAN
K_BI * Jenis Kelamin Crosstabulation
Jenis Kelamin
pria wanita Total
Count 68 67 135 0
% within K_BI 50.4% 49.6% 100.0%
Count 45 94 139
K_BI
1
% within K_BI 32.4% 67.6% 100.0%
Count 113 161 274 Total
% within K_BI 41.2% 58.8% 100.0%
K_ME * Jenis Kelamin Crosstabulation
Jenis Kelamin
pria wanita Total
Count 22 18 40 0
% within K_ME 55.0% 45.0% 100.0%
Count 91 143 234
K_ME
1
% within K_ME 38.9% 61.1% 100.0%
Count 113 161 274 Total
% within K_ME 41.2% 58.8% 100.0%
K_KU * Jenis Kelamin Crosstabulation
Jenis Kelamin
pria wanita Total
Count 50 77 127 0
% within K_KU 39.4% 60.6% 100.0%
Count 63 84 147
K_KU
1
% within K_KU 42.9% 57.1% 100.0%
Count 113 161 274 Total
% within K_KU 41.2% 58.8% 100.0%

96
K_IFRS * Jenis Kelamin Crosstabulation
Jenis Kelamin
pria wanita Total
Count 25 18 43 0
% within K_IFRS 58.1% 41.9% 100.0%
Count 88 143 231
K_IFRS
1
% within K_IFRS 38.1% 61.9% 100.0%
Count 113 161 274 Total
% within K_IFRS 41.2% 58.8% 100.0%
K_PA * Jenis Kelamin Crosstabulation
Jenis Kelamin
pria wanita Total
Count 23 19 42 0
% within K_PA 54.8% 45.2% 100.0%
Count 90 142 232
K_PA
1
% within K_PA 38.8% 61.2% 100.0%
Count 113 161 274 Total
% within K_PA 41.2% 58.8% 100.0%
K_KK * Jenis Kelamin Crosstabulation
Jenis Kelamin
pria wanita Total
Count 51 75 126 0
% within K_KK 40.5% 59.5% 100.0%
Count 62 86 148
K_KK
1
% within K_KK 41.9% 58.1% 100.0%
Count 113 161 274 Total
% within K_KK 41.2% 58.8% 100.0%
K_PC * Jenis Kelamin Crosstabulation
Jenis Kelamin
pria wanita Total
Count 55 76 131 0
% within K_PC 42.0% 58.0% 100.0%
Count 57 85 142
K_PC
1
% within K_PC 40.1% 59.9% 100.0%
Count 112 161 273 Total
% within K_PC 41.0% 59.0% 100.0%

97
K_AS * Jenis Kelamin Crosstabulation
Jenis Kelamin
pria wanita Total
Count 21 18 39 0
% within K_AS 53.8% 46.2% 100.0%
Count 92 143 235
K_AS
1
% within K_AS 39.1% 60.9% 100.0%
Count 113 161 274 Total
% within K_AS 41.2% 58.8% 100.0%
K_PSM * Jenis Kelamin Crosstabulation
Jenis Kelamin
pria wanita Total
Count 33 26 59 0
% within K_PSM 55.9% 44.1% 100.0%
Count 80 135 215
K_PSM
1
% within K_PSM 37.2% 62.8% 100.0%
Count 113 161 274 Total
% within K_PSM 41.2% 58.8% 100.0%
K_KP * Jenis Kelamin Crosstabulation
Jenis Kelamin
pria wanita Total
Count 20 18 38 0
% within K_KP 52.6% 47.4% 100.0%
Count 93 143 236
K_KP
1
% within K_KP 39.4% 60.6% 100.0%
Count 113 161 274 Total
% within K_KP 41.2% 58.8% 100.0%
K_PAEC * Jenis Kelamin Crosstabulation
Jenis Kelamin
pria wanita Total
Count 65 69 134 0
% within K_PAEC 48.5% 51.5% 100.0%
Count 48 92 140
K_PAEC
1
% within K_PAEC 34.3% 65.7% 100.0%
Count 113 161 274 Total
% within K_PAEC 41.2% 58.8% 100.0%
98
K_IP * Jenis Kelamin Crosstabulation
Jenis Kelamin
pria wanita Total
Count 24 25 49 0
% within K_IP 49.0% 51.0% 100.0%
Count 89 136 225
K_IP
1
% within K_IP 39.6% 60.4% 100.0%
Count 113 161 274 Total
% within K_IP 41.2% 58.8% 100.0%
K_KB * Jenis Kelamin Crosstabulation
Jenis Kelamin
pria wanita Total
Count 34 27 61 0
% within K_KB 55.7% 44.3% 100.0%
Count 79 134 213
K_KB
1
% within K_KB 37.1% 62.9% 100.0%
Count 113 161 274 Total
% within K_KB 41.2% 58.8% 100.0%
K_BHL * Jenis Kelamin Crosstabulation
Jenis Kelamin
pria wanita Total
Count 43 47 90 0
% within K_BHL 47.8% 52.2% 100.0%
Count 70 114 184
K_BHL
1
% within K_BHL 38.0% 62.0% 100.0%
Count 113 161 274 Total
% within K_BHL 41.2% 58.8% 100.0%
K_TB * Jenis Kelamin Crosstabulation
Jenis Kelamin
pria wanita Total
Count 60 76 136 0
% within K_TB 44.1% 55.9% 100.0%
Count 53 85 138
K_TB
1
% within K_TB 38.4% 61.6% 100.0%
Count 113 161 274 Total
% within K_TB 41.2% 58.8% 100.0%

99
K_BN * Jenis Kelamin Crosstabulation
Jenis Kelamin
pria wanita Total
Count 54 82 136 0
% within K_BN 39.7% 60.3% 100.0%
Count 59 79 138
K_BN
1
% within K_BN 42.8% 57.2% 100.0%
Count 113 161 274 Total
% within K_BN 41.2% 58.8% 100.0%
K_PM * Jenis Kelamin Crosstabulation
Jenis Kelamin
pria wanita Total
Count 29 25 54 0
% within K_PM 53.7% 46.3% 100.0%
Count 84 136 220
K_PM
1
% within K_PM 38.2% 61.8% 100.0%
Count 113 161 274 Total
% within K_PM 41.2% 58.8% 100.0%
K_KPLP * Jenis Kelamin Crosstabulation
Jenis Kelamin
pria wanita Total
Count 62 75 137 0
% within K_KPLP 45.3% 54.7% 100.0%
Count 51 86 137
K_KPLP
1
% within K_KPLP 37.2% 62.8% 100.0%
Count 113 161 274 Total
% within K_KPLP 41.2% 58.8% 100.0%
K_BI * Usia Crosstabulation
Usia
17-18 tahun 19-20 tahun 21-22 tahun 23-24 tahun >25 tahun Total
Count 18 48 46 16 7 135 0
% within K_BI 13.3% 35.6% 34.1% 11.9% 5.2% 100.0%
Count 14 46 54 21 4 139
K_BI
1
% within K_BI 10.1% 33.1% 38.8% 15.1% 2.9% 100.0%
Count 32 94 100 37 11 274 Total
% within K_BI 11.7% 34.3% 36.5% 13.5% 4.0% 100.0%

100
K_ME * Usia Crosstabulation
Usia
17-18 tahun 19-20 tahun 21-22 tahun 23-24 tahun >25 tahun Total
Count 5 16 12 5 2 40 0
% within K_ME 12.5% 40.0% 30.0% 12.5% 5.0% 100.0%
Count 27 78 88 32 9 234
K_ME
1
% within K_ME 11.5% 33.3% 37.6% 13.7% 3.8% 100.0%
Count 32 94 100 37 11 274 Total
% within K_ME 11.7% 34.3% 36.5% 13.5% 4.0% 100.0%
K_KU * Usia Crosstabulation
Usia
17-18 tahun 19-20 tahun 21-22 tahun 23-24 tahun >25 tahun Total
Count 13 39 54 14 7 127 0
% within K_KU 10.2% 30.7% 42.5% 11.0% 5.5% 100.0%
Count 19 55 46 23 4 147
K_KU
1
% within K_KU 12.9% 37.4% 31.3% 15.6% 2.7% 100.0%
Count 32 94 100 37 11 274 Total
% within K_KU 11.7% 34.3% 36.5% 13.5% 4.0% 100.0%
K_IFRS * Usia Crosstabulation
Usia
17-18 tahun 19-20 tahun 21-22 tahun 23-24 tahun >25 tahun Total
Count 3 11 17 9 3 43 0
% within K_IFRS 7.0% 25.6% 39.5% 20.9% 7.0% 100.0%
Count 29 83 83 28 8 231
K_IFRS
1
% within K_IFRS 12.6% 35.9% 35.9% 12.1% 3.5% 100.0%
Count 32 94 100 37 11 274 Total
% within K_IFRS 11.7% 34.3% 36.5% 13.5% 4.0% 100.0%
K_PA * Usia Crosstabulation
Usia
17-18 tahun 19-20 tahun 21-22 tahun 23-24 tahun >25 tahun Total
Count 5 15 11 10 1 42 0
% within K_PA 11.9% 35.7% 26.2% 23.8% 2.4% 100.0%
Count 27 79 89 27 10 232
K_PA
1
% within K_PA 11.6% 34.1% 38.4% 11.6% 4.3% 100.0%
Count 32 94 100 37 11 274 Total
% within K_PA 11.7% 34.3% 36.5% 13.5% 4.0% 100.0%
101
K_KK * Usia Crosstabulation
Usia
17-18 tahun 19-20 tahun 21-22 tahun 23-24 tahun >25 tahun Total
Count 15 45 44 14 8 126 0
% within K_KK 11.9% 35.7% 34.9% 11.1% 6.3% 100.0%
Count 17 49 56 23 3 148
K_KK
1
% within K_KK 11.5% 33.1% 37.8% 15.5% 2.0% 100.0%
Count 32 94 100 37 11 274 Total
% within K_KK 11.7% 34.3% 36.5% 13.5% 4.0% 100.0%
K_PC * Usia Crosstabulation
Usia
17-18 tahun 19-20 tahun 21-22 tahun 23-24 tahun >25 tahun Total
Count 19 50 42 16 4 131 0
% within K_PC 14.5% 38.2% 32.1% 12.2% 3.1% 100.0%
Count 13 44 57 21 7 142
K_PC
1
% within K_PC 9.2% 31.0% 40.1% 14.8% 4.9% 100.0%
Count 32 94 99 37 11 273 Total
% within K_PC 11.7% 34.4% 36.3% 13.6% 4.0% 100.0%
K_AS * Usia Crosstabulation
Usia
17-18 tahun 19-20 tahun 21-22 tahun 23-24 tahun >25 tahun Total
Count 3 13 13 8 2 39 0
% within K_AS 7.7% 33.3% 33.3% 20.5% 5.1% 100.0%
Count 29 81 87 29 9 235
K_AS
1
% within K_AS 12.3% 34.5% 37.0% 12.3% 3.8% 100.0%
Count 32 94 100 37 11 274 Total
% within K_AS 11.7% 34.3% 36.5% 13.5% 4.0% 100.0%
K_PSM * Usia Crosstabulation
Usia
17-18 tahun 19-20 tahun 21-22 tahun 23-24 tahun >25 tahun Total
Count 6 20 17 13 3 59 0
% within K_PSM 10.2% 33.9% 28.8% 22.0% 5.1% 100.0%
Count 26 74 83 24 8 215
K_PSM
1
% within K_PSM 12.1% 34.4% 38.6% 11.2% 3.7% 100.0%
Count 32 94 100 37 11 274 Total
% within K_PSM 11.7% 34.3% 36.5% 13.5% 4.0% 100.0%

102
K_KP * Usia Crosstabulation
Usia
17-18 tahun 19-20 tahun 21-22 tahun 23-24 tahun >25 tahun Total
Count 4 12 13 7 2 38 0
% within K_KP 10.5% 31.6% 34.2% 18.4% 5.3% 100.0%
Count 28 82 87 30 9 236
K_KP
1
% within K_KP 11.9% 34.7% 36.9% 12.7% 3.8% 100.0%
Count 32 94 100 37 11 274 Total
% within K_KP 11.7% 34.3% 36.5% 13.5% 4.0% 100.0%
K_PAEC * Usia Crosstabulation
Usia
17-18 tahun 19-20 tahun 21-22 tahun 23-24 tahun >25 tahun Total
Count 17 44 48 17 8 134 0
% within K_PAEC 12.7% 32.8% 35.8% 12.7% 6.0% 100.0%
Count 15 50 52 20 3 140
K_PAEC
1
% within K_PAEC 10.7% 35.7% 37.1% 14.3% 2.1% 100.0%
Count 32 94 100 37 11 274 Total
% within K_PAEC 11.7% 34.3% 36.5% 13.5% 4.0% 100.0%
K_IP * Usia Crosstabulation
Usia
17-18 tahun 19-20 tahun 21-22 tahun 23-24 tahun >25 tahun Total
Count 7 15 17 9 1 49 0
% within K_IP 14.3% 30.6% 34.7% 18.4% 2.0% 100.0%
Count 25 79 83 28 10 225
K_IP
1
% within K_IP 11.1% 35.1% 36.9% 12.4% 4.4% 100.0%
Count 32 94 100 37 11 274 Total
% within K_IP 11.7% 34.3% 36.5% 13.5% 4.0% 100.0%
K_KB * Usia Crosstabulation
Usia
17-18 tahun 19-20 tahun 21-22 tahun 23-24 tahun >25 tahun Total
Count 9 19 18 12 3 61 0
% within K_KB 14.8% 31.1% 29.5% 19.7% 4.9% 100.0%
Count 23 75 82 25 8 213
K_KB
1
% within K_KB 10.8% 35.2% 38.5% 11.7% 3.8% 100.0%
Count 32 94 100 37 11 274 Total
% within K_KB 11.7% 34.3% 36.5% 13.5% 4.0% 100.0%
103
K_BHL * Usia Crosstabulation
Usia
17-18 tahun 19-20 tahun 21-22 tahun 23-24 tahun >25 tahun Total
Count 14 24 32 16 4 90 0
% within K_BHL 15.6% 26.7% 35.6% 17.8% 4.4% 100.0%
Count 18 70 68 21 7 184
K_BHL
1
% within K_BHL 9.8% 38.0% 37.0% 11.4% 3.8% 100.0%
Count 32 94 100 37 11 274 Total
% within K_BHL 11.7% 34.3% 36.5% 13.5% 4.0% 100.0%
K_TB * Usia Crosstabulation
Usia
17-18 tahun 19-20 tahun 21-22 tahun 23-24 tahun >25 tahun Total
Count 16 46 45 20 9 136 0
% within K_TB 11.8% 33.8% 33.1% 14.7% 6.6% 100.0%
Count 16 48 55 17 2 138
K_TB
1
% within K_TB 11.6% 34.8% 39.9% 12.3% 1.4% 100.0%
Count 32 94 100 37 11 274 Total
% within K_TB 11.7% 34.3% 36.5% 13.5% 4.0% 100.0%
K_BN * Usia Crosstabulation
Usia
17-18 tahun 19-20 tahun 21-22 tahun 23-24 tahun >25 tahun Total
Count 20 41 48 19 8 136 0
% within K_BN 14.7% 30.1% 35.3% 14.0% 5.9% 100.0%
Count 12 53 52 18 3 138
K_BN
1
% within K_BN 8.7% 38.4% 37.7% 13.0% 2.2% 100.0%
Count 32 94 100 37 11 274 Total
% within K_BN 11.7% 34.3% 36.5% 13.5% 4.0% 100.0%
K_PM * Usia Crosstabulation
Usia
17-18 tahun 19-20 tahun 21-22 tahun 23-24 tahun >25 tahun Total
Count 9 16 17 10 2 54 0
% within K_PM 16.7% 29.6% 31.5% 18.5% 3.7% 100.0%
Count 23 78 83 27 9 220
K_PM
1
% within K_PM 10.5% 35.5% 37.7% 12.3% 4.1% 100.0%
Count 32 94 100 37 11 274 Total
% within K_PM 11.7% 34.3% 36.5% 13.5% 4.0% 100.0%

104
K_KPLP * Usia Crosstabulation
Usia
17-18 tahun 19-20 tahun 21-22 tahun 23-24 tahun >25 tahun Total
Count 17 41 54 18 7 137 0
% within K_KPLP 12.4% 29.9% 39.4% 13.1% 5.1% 100.0%
Count 15 53 46 19 4 137
K_KPLP
1
% within K_KPLP 10.9% 38.7% 33.6% 13.9% 2.9% 100.0%
Count 32 94 100 37 11 274 Total
% within K_KPLP 11.7% 34.3% 36.5% 13.5% 4.0% 100.0%
K_BI * Tahun Angkatan Crosstabulation
Tahun Angkatan
2011 2012 2013 2014 Total
Count 31 41 35 28 135 0
% within K_BI 23.0% 30.4% 25.9% 20.7% 100.0%
Count 54 31 28 26 139
K_BI
1
% within K_BI 38.8% 22.3% 20.1% 18.7% 100.0%
Count 85 72 63 54 274 Total
% within K_BI 31.0% 26.3% 23.0% 19.7% 100.0%
K_ME * Tahun Angkatan Crosstabulation
Tahun Angkatan
2011 2012 2013 2014 Total
Count 14 11 7 8 40 0
% within K_ME 35.0% 27.5% 17.5% 20.0% 100.0%
Count 71 61 56 46 234
K_ME
1
% within K_ME 30.3% 26.1% 23.9% 19.7% 100.0%
Count 85 72 63 54 274 Total
% within K_ME 31.0% 26.3% 23.0% 19.7% 100.0%
K_KU * Tahun Angkatan Crosstabulation
Tahun Angkatan
2011 2012 2013 2014 Total
Count 38 35 31 23 127 0
% within K_KU 29.9% 27.6% 24.4% 18.1% 100.0%
Count 47 37 32 31 147
K_KU
1
% within K_KU 32.0% 25.2% 21.8% 21.1% 100.0%
Count 85 72 63 54 274 Total
% within K_KU 31.0% 26.3% 23.0% 19.7% 100.0%
105
K_IFRS * Tahun Angkatan Crosstabulation
Tahun Angkatan
2011 2012 2013 2014 Total
Count 16 16 5 6 43 0
% within K_IFRS 37.2% 37.2% 11.6% 14.0% 100.0%
Count 69 56 58 48 231
K_IFRS
1
% within K_IFRS 29.9% 24.2% 25.1% 20.8% 100.0%
Count 85 72 63 54 274 Total
% within K_IFRS 31.0% 26.3% 23.0% 19.7% 100.0%
K_PA * Tahun Angkatan Crosstabulation
Tahun Angkatan
2011 2012 2013 2014 Total
Count 16 13 4 9 42 0
% within K_PA 38.1% 31.0% 9.5% 21.4% 100.0%
Count 69 59 59 45 232
K_PA
1
% within K_PA 29.7% 25.4% 25.4% 19.4% 100.0%
Count 85 72 63 54 274 Total
% within K_PA 31.0% 26.3% 23.0% 19.7% 100.0%
K_KK * Tahun Angkatan Crosstabulation
Tahun Angkatan
2011 2012 2013 2014 Total
Count 34 36 30 26 126 0
% within K_KK 27.0% 28.6% 23.8% 20.6% 100.0%
Count 51 36 33 28 148
K_KK
1
% within K_KK 34.5% 24.3% 22.3% 18.9% 100.0%
Count 85 72 63 54 274 Total
% within K_KK 31.0% 26.3% 23.0% 19.7% 100.0%
K_PC * Tahun Angkatan Crosstabulation
Tahun Angkatan
2011 2012 2013 2014 Total
Count 33 34 32 32 131 0
% within K_PC 25.2% 26.0% 24.4% 24.4% 100.0%
Count 52 37 31 22 142
K_PC
1
% within K_PC 36.6% 26.1% 21.8% 15.5% 100.0%
Count 85 71 63 54 273 Total
% within K_PC 31.1% 26.0% 23.1% 19.8% 100.0%
106
K_AS * Tahun Angkatan Crosstabulation
Tahun Angkatan
2011 2012 2013 2014 Total
Count 14 11 7 7 39 0
% within K_AS 35.9% 28.2% 17.9% 17.9% 100.0%
Count 71 61 56 47 235
K_AS
1
% within K_AS 30.2% 26.0% 23.8% 20.0% 100.0%
Count 85 72 63 54 274 Total
% within K_AS 31.0% 26.3% 23.0% 19.7% 100.0%
K_PSM * Tahun Angkatan Crosstabulation
Tahun Angkatan
2011 2012 2013 2014 Total
Count 16 22 12 9 59 0
% within K_PSM 27.1% 37.3% 20.3% 15.3% 100.0%
Count 69 50 51 45 215
K_PSM
1
% within K_PSM 32.1% 23.3% 23.7% 20.9% 100.0%
Count 85 72 63 54 274 Total
% within K_PSM 31.0% 26.3% 23.0% 19.7% 100.0%
K_KP * Tahun Angkatan Crosstabulation
Tahun Angkatan
2011 2012 2013 2014 Total
Count 10 13 8 7 38 0
% within K_KP 26.3% 34.2% 21.1% 18.4% 100.0%
Count 75 59 55 47 236
K_KP
1
% within K_KP 31.8% 25.0% 23.3% 19.9% 100.0%
Count 85 72 63 54 274 Total
% within K_KP 31.0% 26.3% 23.0% 19.7% 100.0%
K_PAEC * Tahun Angkatan Crosstabulation
Tahun Angkatan
2011 2012 2013 2014 Total
Count 35 37 37 25 134 0
% within K_PAEC 26.1% 27.6% 27.6% 18.7% 100.0%
Count 50 35 26 29 140
K_PAEC
1
% within K_PAEC 35.7% 25.0% 18.6% 20.7% 100.0%
Count 85 72 63 54 274 Total
% within K_PAEC 31.0% 26.3% 23.0% 19.7% 100.0%

107
K_IP * Tahun Angkatan Crosstabulation
Tahun Angkatan
2011 2012 2013 2014 Total
Count 14 13 11 11 49 0
% within K_IP 28.6% 26.5% 22.4% 22.4% 100.0%
Count 71 59 52 43 225
K_IP
1
% within K_IP 31.6% 26.2% 23.1% 19.1% 100.0%
Count 85 72 63 54 274 Total
% within K_IP 31.0% 26.3% 23.0% 19.7% 100.0%
K_KB * Tahun Angkatan Crosstabulation
Tahun Angkatan
2011 2012 2013 2014 Total
Count 18 18 12 13 61 0
% within K_KB 29.5% 29.5% 19.7% 21.3% 100.0%
Count 67 54 51 41 213
K_KB
1
% within K_KB 31.5% 25.4% 23.9% 19.2% 100.0%
Count 85 72 63 54 274 Total
% within K_KB 31.0% 26.3% 23.0% 19.7% 100.0%
K_BHL * Tahun Angkatan Crosstabulation
Tahun Angkatan
2011 2012 2013 2014 Total
Count 27 27 18 18 90 0
% within K_BHL 30.0% 30.0% 20.0% 20.0% 100.0%
Count 58 45 45 36 184
K_BHL
1
% within K_BHL 31.5% 24.5% 24.5% 19.6% 100.0%
Count 85 72 63 54 274 Total
% within K_BHL 31.0% 26.3% 23.0% 19.7% 100.0%
K_TB * Tahun Angkatan Crosstabulation
Tahun Angkatan
2011 2012 2013 2014 Total
Count 36 43 31 26 136 0
% within K_TB 26.5% 31.6% 22.8% 19.1% 100.0%
Count 49 29 32 28 138
K_TB
1
% within K_TB 35.5% 21.0% 23.2% 20.3% 100.0%
Count 85 72 63 54 274 Total
% within K_TB 31.0% 26.3% 23.0% 19.7% 100.0%

108
K_BN * Tahun Angkatan Crosstabulation
Tahun Angkatan
2011 2012 2013 2014 Total
Count 41 36 31 28 136 0
% within K_BN 30.1% 26.5% 22.8% 20.6% 100.0%
Count 44 36 32 26 138
K_BN
1
% within K_BN 31.9% 26.1% 23.2% 18.8% 100.0%
Count 85 72 63 54 274 Total
% within K_BN 31.0% 26.3% 23.0% 19.7% 100.0%
K_PM * Tahun Angkatan Crosstabulation
Tahun Angkatan
2011 2012 2013 2014 Total
Count 13 19 8 14 54 0
% within K_PM 24.1% 35.2% 14.8% 25.9% 100.0%
Count 72 53 55 40 220
K_PM
1
% within K_PM 32.7% 24.1% 25.0% 18.2% 100.0%
Count 85 72 63 54 274 Total
% within K_PM 31.0% 26.3% 23.0% 19.7% 100.0%
K_KPLP * Tahun Angkatan Crosstabulation
Tahun Angkatan
2011 2012 2013 2014 Total
Count 40 38 35 24 137 0
% within K_KPLP 29.2% 27.7% 25.5% 17.5% 100.0%
Count 45 34 28 30 137
K_KPLP
1
% within K_KPLP 32.8% 24.8% 20.4% 21.9% 100.0%
Count 85 72 63 54 274 Total
% within K_KPLP 31.0% 26.3% 23.0% 19.7% 100.0%
K_BI * IPK Crosstabulation
IPK
<2,00 2,00-2,99 3,00-3,49 >3,5 Total
Count 3 60 48 24 135 0
% within K_BI 2.2% 44.4% 35.6% 17.8% 100.0%
Count 3 51 57 28 139
K_BI
1
% within K_BI 2.2% 36.7% 41.0% 20.1% 100.0%
Count 6 111 105 52 274 Total
% within K_BI 2.2% 40.5% 38.3% 19.0% 100.0%

109
K_ME * IPK Crosstabulation
IPK
<2,00 2,00-2,99 3,00-3,49 >3,5 Total
Count 3 22 11 4 40 0
% within K_ME 7.5% 55.0% 27.5% 10.0% 100.0%
Count 3 89 94 48 234
K_ME
1
% within K_ME 1.3% 38.0% 40.2% 20.5% 100.0%
Count 6 111 105 52 274 Total
% within K_ME 2.2% 40.5% 38.3% 19.0% 100.0%
K_KU * IPK Crosstabulation
IPK
<2,00 2,00-2,99 3,00-3,49 >3,5 Total
Count 2 57 50 18 127 0
% within K_KU 1.6% 44.9% 39.4% 14.2% 100.0%
Count 4 54 55 34 147
K_KU
1
% within K_KU 2.7% 36.7% 37.4% 23.1% 100.0%
Count 6 111 105 52 274 Total
% within K_KU 2.2% 40.5% 38.3% 19.0% 100.0%
K_IFRS * IPK Crosstabulation
IPK
<2,00 2,00-2,99 3,00-3,49 >3,5 Total
Count 1 19 17 6 43 0
% within K_IFRS 2.3% 44.2% 39.5% 14.0% 100.0%
Count 5 92 88 46 231
K_IFRS
1
% within K_IFRS 2.2% 39.8% 38.1% 19.9% 100.0%
Count 6 111 105 52 274 Total
% within K_IFRS 2.2% 40.5% 38.3% 19.0% 100.0%
K_PA * IPK Crosstabulation
IPK
<2,00 2,00-2,99 3,00-3,49 >3,5 Total
Count 1 22 11 8 42 0
% within K_PA 2.4% 52.4% 26.2% 19.0% 100.0%
Count 5 89 94 44 232
K_PA
1
% within K_PA 2.2% 38.4% 40.5% 19.0% 100.0%
Count 6 111 105 52 274 Total
% within K_PA 2.2%
40.5% 38.3% 19.0% 100.0%

110
K_KK * IPK Crosstabulation
IPK
<2,00 2,00-2,99 3,00-3,49 >3,5 Total
Count 1 55 46 24 126 0
% within K_KK .8% 43.7% 36.5% 19.0% 100.0%
Count 5 56 59 28 148
K_KK
1
% within K_KK 3.4% 37.8% 39.9% 18.9% 100.0%
Count 6 111 105 52 274 Total
% within K_KK 2.2% 40.5% 38.3% 19.0% 100.0%
K_PC * IPK Crosstabulation
IPK
<2,00 2,00-2,99 3,00-3,49 >3,5 Total
Count 3 56 52 20 131 0
% within K_PC 2.3% 42.7% 39.7% 15.3% 100.0%
Count 3 54 53 32 142
K_PC
1
% within K_PC 2.1% 38.0% 37.3% 22.5% 100.0%
Count 6 110 105 52 273 Total
% within K_PC 2.2% 40.3% 38.5% 19.0% 100.0%
K_AS * IPK Crosstabulation
IPK
<2,00 2,00-2,99 3,00-3,49 >3,5 Total
Count 2 17 13 7 39 0
% within K_AS 5.1% 43.6% 33.3% 17.9% 100.0%
Count 4 94 92 45 235
K_AS
1
% within K_AS 1.7% 40.0% 39.1% 19.1% 100.0%
Count 6 111 105 52 274 Total
% within K_AS 2.2% 40.5% 38.3% 19.0% 100.0%
K_PSM * IPK Crosstabulation
IPK
<2,00 2,00-2,99 3,00-3,49 >3,5 Total
Count 0 23 22 14 59 0
% within K_PSM .0% 39.0% 37.3% 23.7% 100.0%
Count 6 88 83 38 215
K_PSM
1
% within K_PSM 2.8% 40.9% 38.6% 17.7% 100.0%
Count 6 111 105 52 274 Total
% within K_PSM 2.2% 40.5% 38.3% 19.0% 100.0%
111
K_KP * IPK Crosstabulation
IPK
<2,00 2,00-2,99 3,00-3,49 >3,5 Total
Count 2 19 10 7 38 0
% within K_KP 5.3% 50.0% 26.3% 18.4% 100.0%
Count 4 92 95 45 236
K_KP
1
% within K_KP 1.7% 39.0% 40.3% 19.1% 100.0%
Count 6 111 105 52 274 Total
% within K_KP 2.2% 40.5% 38.3% 19.0% 100.0%
K_PAEC * IPK Crosstabulation
IPK
<2,00 2,00-2,99 3,00-3,49 >3,5 Total
Count 3 59 51 21 134 0
% within K_PAEC 2.2% 44.0% 38.1% 15.7% 100.0%
Count 3 52 54 31 140
K_PAEC
1
% within K_PAEC 2.1% 37.1% 38.6% 22.1% 100.0%
Count 6 111 105 52 274 Total
% within K_PAEC 2.2% 40.5% 38.3% 19.0% 100.0%
K_IP * IPK Crosstabulation
IPK
<2,00 2,00-2,99 3,00-3,49 >3,5 Total
Count 1 22 17 9 49 0
% within K_IP 2.0% 44.9% 34.7% 18.4% 100.0%
Count 5 89 88 43 225
K_IP
1
% within K_IP 2.2% 39.6% 39.1% 19.1% 100.0%
Count 6 111 105 52 274 Total
% within K_IP 2.2% 40.5% 38.3% 19.0% 100.0%
K_KB * IPK Crosstabulation
IPK
<2,00 2,00-2,99 3,00-3,49 >3,5 Total
Count 0 28 20 13 61 0
% within K_KB .0% 45.9% 32.8% 21.3% 100.0%
Count 6 83 85 39 213
K_KB
1
% within K_KB 2.8% 39.0% 39.9% 18.3% 100.0%
Count 6 111 105 52 274 Total
% within K_KB 2.2% 40.5% 38.3% 19.0% 100.0%

112
K_BHL * IPK Crosstabulation
IPK
<2,00 2,00-2,99 3,00-3,49 >3,5 Total
Count 1 33 30 26 90 0
% within K_BHL 1.1% 36.7% 33.3% 28.9% 100.0%
Count 5 78 75 26 184
K_BHL
1
% within K_BHL 2.7% 42.4% 40.8% 14.1% 100.0%
Count 6 111 105 52 274 Total
% within K_BHL 2.2% 40.5% 38.3% 19.0% 100.0%
K_TB * IPK Crosstabulation
IPK
<2,00 2,00-2,99 3,00-3,49 >3,5 Total
Count 3 53 58 22 136 0
% within K_TB 2.2% 39.0% 42.6% 16.2% 100.0%
Count 3 58 47 30 138
K_TB
1
% within K_TB 2.2% 42.0% 34.1% 21.7% 100.0%
Count 6 111 105 52 274 Total
% within K_TB 2.2% 40.5% 38.3% 19.0% 100.0%
K_BN * IPK Crosstabulation
IPK
<2,00 2,00-2,99 3,00-3,49 >3,5 Total
Count 2 53 54 27 136 0
% within K_BN 1.5% 39.0% 39.7% 19.9% 100.0%
Count 4 58 51 25 138
K_BN
1
% within K_BN 2.9% 42.0% 37.0% 18.1% 100.0%
Count 6 111 105 52 274 Total
% within K_BN 2.2% 40.5% 38.3% 19.0% 100.0%
K_PM * IPK Crosstabulation
IPK
<2,00 2,00-2,99 3,00-3,49 >3,5 Total
Count 1 24 18 11 54 0
% within K_PM 1.9% 44.4% 33.3% 20.4% 100.0%
Count 5 87 87 41 220
K_PM
1
% within K_PM 2.3% 39.5% 39.5% 18.6% 100.0%
Count 6 111 105 52 274 Total
% within K_PM 2.2% 40.5% 38.3% 19.0% 100.0%

113
K_KPLP * IPK Crosstabulation
IPK
<2,00 2,00-2,99 3,00-3,49 >3,5 Total
Count 4 60 48 25 137 0
% within K_KPLP 2.9% 43.8% 35.0% 18.2% 100.0%
Count 2 51 57 27 137
K_KPLP
1
% within K_KPLP 1.5% 37.2% 41.6% 19.7% 100.0%
Count 6 111 105 52 274 Total
% within K_KPLP 2.2% 40.5% 38.3% 19.0% 100.0%

114
FAKTOR
kf_BI * Jenis Kelamin Crosstabulation
Jenis Kelamin
pria wanita Total
Count 104 153 257 tidak penting
% within kf_BI 40.5% 59.5% 100.0%
Count 9 8 17
kf_BI
penting
% within kf_BI 52.9% 47.1% 100.0%
Count 113 161 274 Total
% within kf_BI 41.2% 58.8% 100.0%
kf_ME * Jenis Kelamin Crosstabulation
Jenis Kelamin
pria wanita Total
Count 91 111 202
% within kf_ME 45.0% 55.0% 100.0%
tidak penting
% of Total 33.2% 40.5% 73.7%
Count 22 50 72
% within kf_ME 30.6% 69.4% 100.0%
kf_ME
penting
% of Total 8.0% 18.2% 26.3%
Count 113 161 274
% within kf_ME 41.2% 58.8% 100.0%
Total
% of Total 41.2% 58.8% 100.0%
kf_KU * Jenis Kelamin Crosstabulation
Jenis Kelamin
pria wanita Total
Count 101 137 238
% within kf_KU 42.4% 57.6% 100.0%
tidak penting
% of Total 36.9% 50.0% 86.9%
Count 12 24 36
% within kf_KU 33.3% 66.7% 100.0%
kf_KU
penting
% of Total 4.4% 8.8% 13.1%
Count 113 161 274
% within kf_KU 41.2% 58.8% 100.0%
Total
% of Total 41.2% 58.8% 100.0%

115
kf_IFRS * Jenis Kelamin Crosstabulation
Jenis Kelamin
pria wanita Total
Count 88 132 220
% within kf_IFRS 40.0% 60.0% 100.0%
tidak penting
% of Total 32.1% 48.2% 80.3%
Count 25 29 54
% within kf_IFRS 46.3% 53.7% 100.0%
kf_IFRS
penting
% of Total 9.1% 10.6% 19.7%
Count 113 161 274
% within kf_IFRS 41.2% 58.8% 100.0%
Total
% of Total 41.2% 58.8% 100.0%
kf_PA * Jenis Kelamin Crosstabulation
Jenis Kelamin
pria wanita Total
Count 55 82 137
% within kf_PA 40.1% 59.9% 100.0%
tidak penting
% of Total 20.1% 29.9% 50.0%
Count 58 79 137
% within kf_PA 42.3% 57.7% 100.0%
kf_PA
penting
% of Total 21.2% 28.8% 50.0%
Count 113 161 274
% within kf_PA 41.2% 58.8% 100.0%
Total
% of Total 41.2% 58.8% 100.0%
kf_KK * Jenis Kelamin Crosstabulation
Jenis Kelamin
pria wanita Total
Count 47 65 112
% within kf_KK 42.0% 58.0% 100.0%
tidak penting
% of Total 17.2% 23.7% 40.9%
Count 66 96 162
% within kf_KK 40.7% 59.3% 100.0%
kf_KK
penting
% of Total 24.1% 35.0% 59.1%
Count 113 161 274
% within kf_KK 41.2% 58.8% 100.0%
Total
% of Total 41.2% 58.8% 100.0%
116
kf_PC * Jenis Kelamin Crosstabulation
Jenis Kelamin
pria wanita Total
Count 67 95 162
% within kf_PC 41.4% 58.6% 100.0%
tidak penting
% of Total 24.5% 34.7% 59.1%
Count 46 66 112
% within kf_PC 41.1% 58.9% 100.0%
kf_PC
penting
% of Total 16.8% 24.1% 40.9%
Count 113 161 274
% within kf_PC 41.2% 58.8% 100.0%
Total
% of Total 41.2% 58.8% 100.0%
kf_AS * Jenis Kelamin Crosstabulation
Jenis Kelamin
pria wanita Total
Count 61 71 132
% within kf_AS 46.2% 53.8% 100.0%
tidak penting
% of Total 22.3% 25.9% 48.2%
Count 52 90 142
% within kf_AS 36.6% 63.4% 100.0%
kf_AS
penting
% of Total 19.0% 32.8% 51.8%
Count 113 161 274
% within kf_AS 41.2% 58.8% 100.0%
Total
% of Total 41.2% 58.8% 100.0%
kf_PSM * Jenis Kelamin Crosstabulation
Jenis Kelamin
pria wanita Total
Count 30 48 78
% within kf_PSM 38.5% 61.5% 100.0%
tidak penting
% of Total 10.9% 17.5% 28.5%
Count 83 113 196
% within kf_PSM 42.3% 57.7% 100.0%
kf_PSM
penting
% of Total 30.3% 41.2% 71.5%
Count 113 161 274
% within kf_PSM 41.2% 58.8% 100.0%
Total
% of Total 41.2% 58.8% 100.0%
117
kf_KP * Jenis Kelamin Crosstabulation
Jenis Kelamin
pria wanita Total
Count 38 59 97
% within kf_KP 39.2% 60.8% 100.0%
tidak penting
% of Total 13.9% 21.5% 35.4%
Count 75 102 177
% within kf_KP 42.4% 57.6% 100.0%
kf_KP
penting
% of Total 27.4% 37.2% 64.6%
Count 113 161 274
% within kf_KP 41.2% 58.8% 100.0%
Total
% of Total 41.2% 58.8% 100.0%
kf_PAEC * Jenis Kelamin Crosstabulation
Jenis Kelamin
pria wanita Total
Count 58 82 140
% within kf_PAEC 41.4% 58.6% 100.0%
tidak penting
% of Total 21.2% 29.9% 51.1%
Count 55 79 134
% within kf_PAEC 41.0% 59.0% 100.0%
kf_PAEC
penting
% of Total 20.1% 28.8% 48.9%
Count 113 161 274
% within kf_PAEC 41.2% 58.8% 100.0%
Total
% of Total 41.2% 58.8% 100.0%
kf_IP * Jenis Kelamin Crosstabulation
Jenis Kelamin
pria wanita Total
Count 19 35 54
% within kf_IP 35.2% 64.8% 100.0%
tidak penting
% of Total 6.9% 12.8% 19.7%
Count 94 126 220
% within kf_IP 42.7% 57.3% 100.0%
kf_IP
penting
% of Total 34.3% 46.0% 80.3%
Count 113 161 274
% within kf_IP 41.2% 58.8% 100.0%
Total
% of Total 41.2% 58.8% 100.0%
118
kf_KB * Jenis Kelamin Crosstabulation
Jenis Kelamin
pria wanita Total
Count 39 70 109
% within kf_KB 35.8% 64.2% 100.0%
tidak penting
% of Total 14.2% 25.5% 39.8%
Count 74 91 165
% within kf_KB 44.8% 55.2% 100.0%
kf_KB
penting
% of Total 27.0% 33.2% 60.2%
Count 113 161 274
% within kf_KB 41.2% 58.8% 100.0%
Total
% of Total 41.2% 58.8% 100.0%
kf_BHL * Jenis Kelamin Crosstabulation
Jenis Kelamin
pria wanita Total
Count 40 61 101
% within kf_BHL 39.6% 60.4% 100.0%
tidak penting
% of Total 14.6% 22.3% 36.9%
Count 73 100 173
% within kf_BHL 42.2% 57.8% 100.0%
kf_BHL
penting
% of Total 26.6% 36.5% 63.1%
Count 113 161 274
% within kf_BHL 41.2% 58.8% 100.0%
Total
% of Total 41.2% 58.8% 100.0%
kf_TB * Jenis Kelamin Crosstabulation
Jenis Kelamin
pria wanita Total
Count 65 82 147
% within kf_TB 44.2% 55.8% 100.0%
tidak penting
% of Total 23.7% 29.9% 53.6%
Count 48 79 127
% within kf_TB 37.8% 62.2% 100.0%
kf_TB
penting
% of Total 17.5% 28.8% 46.4%
Count 113 161 274
% within kf_TB 41.2% 58.8% 100.0%
Total
% of Total 41.2% 58.8% 100.0%

119
kf_BN * Jenis Kelamin Crosstabulation
Jenis Kelamin
pria wanita Total
Count 28 35 63
% within kf_BN 44.4% 55.6% 100.0%
tidak penting
% of Total 10.2% 12.8% 23.0%
Count 85 126 211
% within kf_BN 40.3% 59.7% 100.0%
kf_BN
penting
% of Total 31.0% 46.0% 77.0%
Count 113 161 274
% within kf_BN 41.2% 58.8% 100.0%
Total
% of Total 41.2% 58.8% 100.0%
kf_PM * Jenis Kelamin Crosstabulation
Jenis Kelamin
pria wanita Total
Count 19 30 49
% within kf_PM 38.8% 61.2% 100.0%
tidak penting
% of Total 6.9% 10.9% 17.9%
Count 94 131 225
% within kf_PM 41.8% 58.2% 100.0%
kf_PM
penting
% of Total 34.3% 47.8% 82.1%
Count 113 161 274
% within kf_PM 41.2% 58.8% 100.0%
Total
% of Total 41.2% 58.8% 100.0%
kf_KPLP * Jenis Kelamin Crosstabulation
Jenis Kelamin
pria wanita Total
Count 67 101 168
% within kf_KPLP 39.9% 60.1% 100.0%
tidak penting
% of Total 24.5% 36.9% 61.3%
Count 46 60 106
% within kf_KPLP 43.4% 56.6% 100.0%
kf_KPLP
penting
% of Total 16.8% 21.9% 38.7%
Count 113 161 274
% within kf_KPLP 41.2% 58.8% 100.0%
Total
% of Total 41.2% 58.8% 100.0%

120
kf_BI * Usia Crosstabulation
Usia
17-18 tahun 19-20 tahun 21-22 tahun 23-24 tahun >25 tahun Total
Count 30 87 94 36 10 257
% within kf_BI 11.7% 33.9% 36.6% 14.0% 3.9% 100.0%
tidak penting
% of Total 10.9% 31.8% 34.3% 13.1% 3.6% 93.8%
Count 2 7 6 1 1 17
% within kf_BI 11.8% 41.2% 35.3% 5.9% 5.9% 100.0%
kf_BI
penting
% of Total .7% 2.6% 2.2% .4% .4% 6.2%
Count 32 94 100 37 11 274
% within kf_BI 11.7% 34.3% 36.5% 13.5% 4.0% 100.0%
Total
% of Total 11.7% 34.3% 36.5% 13.5% 4.0% 100.0%
kf_ME * Usia Crosstabulation
Usia
17-18 tahun 19-20 tahun 21-22 tahun 23-24 tahun >25 tahun Total
Count 22 65 75 29 11 202
% within kf_ME 10.9% 32.2% 37.1% 14.4% 5.4% 100.0%
tidak penting
% of Total 8.0% 23.7% 27.4% 10.6% 4.0% 73.7%
Count 10 29 25 8 0 72
% within kf_ME 13.9% 40.3% 34.7% 11.1% .0% 100.0%
kf_ME
penting
% of Total 3.6% 10.6% 9.1% 2.9% .0% 26.3%
Count 32 94 100 37 11 274
% within kf_ME 11.7% 34.3% 36.5% 13.5% 4.0% 100.0%
Total
% of Total 11.7% 34.3% 36.5% 13.5% 4.0% 100.0%
kf_KU * Usia Crosstabulation
Usia
17-18 tahun 19-20 tahun 21-22 tahun 23-24 tahun >25 tahun Total
Count 26 84 84 34 10 238
% within kf_KU 10.9% 35.3% 35.3% 14.3% 4.2% 100.0%
tidak penting
% of Total 9.5% 30.7% 30.7% 12.4% 3.6% 86.9%
Count 6 10 16 3 1 36
% within kf_KU 16.7% 27.8% 44.4% 8.3% 2.8% 100.0%
kf_KU
penting
% of Total 2.2% 3.6% 5.8% 1.1% .4% 13.1%
Count 32 94 100 37 11 274
% within kf_KU 11.7% 34.3% 36.5% 13.5% 4.0% 100.0%
Total
% of Total 11.7% 34.3% 36.5% 13.5% 4.0% 100.0%

121
kf_IFRS * Usia Crosstabulation
Usia
17-18 tahun 19-20 tahun 21-22 tahun 23-24 tahun >25 tahun Total
Count 25 77 75 33 10 220
% within kf_IFRS 11.4% 35.0% 34.1% 15.0% 4.5% 100.0%
tidak penting
% of Total 9.1% 28.1% 27.4% 12.0% 3.6% 80.3%
Count 7 17 25 4 1 54
% within kf_IFRS 13.0% 31.5% 46.3% 7.4% 1.9% 100.0%
kf_IFRS
penting
% of Total 2.6% 6.2% 9.1% 1.5% .4% 19.7%
Count 32 94 100 37 11 274
% within kf_IFRS 11.7% 34.3% 36.5% 13.5% 4.0% 100.0%
Total
% of Total 11.7% 34.3% 36.5% 13.5% 4.0% 100.0%
kf_PA * Usia Crosstabulation
Usia
17-18 tahun 19-20 tahun 21-22 tahun 23-24 tahun >25 tahun Total
Count 22 44 51 14 6 137
% within kf_PA 16.1% 32.1% 37.2% 10.2% 4.4% 100.0%
tidak penting
% of Total 8.0% 16.1% 18.6% 5.1% 2.2% 50.0%
Count 10 50 49 23 5 137
% within kf_PA 7.3% 36.5% 35.8% 16.8% 3.6% 100.0%
kf_PA
penting
% of Total 3.6% 18.2% 17.9% 8.4% 1.8% 50.0%
Count 32 94 100 37 11 274
% within kf_PA 11.7% 34.3% 36.5% 13.5% 4.0% 100.0%
Total
% of Total 11.7% 34.3% 36.5% 13.5% 4.0% 100.0%
kf_KK * Usia Crosstabulation
Usia
17-18 tahun 19-20 tahun 21-22 tahun 23-24 tahun >25 tahun Total
Count 18 43 34 13 4 112
% within kf_KK 16.1% 38.4% 30.4% 11.6% 3.6% 100.0%
tidak penting
% of Total 6.6% 15.7% 12.4% 4.7% 1.5% 40.9%
Count 14 51 66 24 7 162
% within kf_KK 8.6% 31.5% 40.7% 14.8% 4.3% 100.0%
kf_KK
penting
% of Total 5.1% 18.6% 24.1% 8.8% 2.6% 59.1%
Count 32 94 100 37 11 274
% within kf_KK 11.7% 34.3% 36.5% 13.5% 4.0% 100.0%
Total
% of Total 11.7% 34.3% 36.5% 13.5% 4.0% 100.0%

122
kf_PC * Usia Crosstabulation
Usia
17-18 tahun 19-20 tahun 21-22 tahun 23-24 tahun >25 tahun Total
Count 18 56 57 23 8 162
% within kf_PC 11.1% 34.6% 35.2% 14.2% 4.9% 100.0%
tidak penting
% of Total 6.6% 20.4% 20.8% 8.4% 2.9% 59.1%
Count 14 38 43 14 3 112
% within kf_PC 12.5% 33.9% 38.4% 12.5% 2.7% 100.0%
kf_PC
penting
% of Total 5.1% 13.9% 15.7% 5.1% 1.1% 40.9%
Count 32 94 100 37 11 274
% within kf_PC 11.7% 34.3% 36.5% 13.5% 4.0% 100.0%
Total
% of Total 11.7% 34.3% 36.5% 13.5% 4.0% 100.0%
kf_AS * Usia Crosstabulation
Usia
17-18 tahun 19-20 tahun 21-22 tahun 23-24 tahun >25 tahun Total
Count 19 47 48 14 4 132
% within kf_AS 14.4% 35.6% 36.4% 10.6% 3.0% 100.0%
tidak penting
% of Total 6.9% 17.2% 17.5% 5.1% 1.5% 48.2%
Count 13 47 52 23 7 142
% within kf_AS 9.2% 33.1% 36.6% 16.2% 4.9% 100.0%
kf_AS
penting
% of Total 4.7% 17.2% 19.0% 8.4% 2.6% 51.8%
Count 32 94 100 37 11 274
% within kf_AS 11.7% 34.3% 36.5% 13.5% 4.0% 100.0%
Total
% of Total 11.7% 34.3% 36.5% 13.5% 4.0% 100.0%
kf_PSM * Usia Crosstabulation
Usia
17-18 tahun 19-20 tahun 21-22 tahun 23-24 tahun >25 tahun Total
Count 10 26 29 10 3 78
% within kf_PSM 12.8% 33.3% 37.2% 12.8% 3.8% 100.0%
tidak penting
% of Total 3.6% 9.5% 10.6% 3.6% 1.1% 28.5%
Count 22 68 71 27 8 196
% within kf_PSM 11.2% 34.7% 36.2% 13.8% 4.1% 100.0%
kf_PSM
penting
% of Total 8.0% 24.8% 25.9% 9.9% 2.9% 71.5%
Count 32 94 100 37 11 274
% within kf_PSM 11.7% 34.3% 36.5% 13.5% 4.0% 100.0%
Total
% of Total 11.7% 34.3% 36.5% 13.5% 4.0% 100.0%

123
kf_KP * Usia Crosstabulation
Usia
17-18 tahun 19-20 tahun 21-22 tahun 23-24 tahun >25 tahun Total
Count 9 37 36 11 4 97
% within kf_KP 9.3% 38.1% 37.1% 11.3% 4.1% 100.0%
tidak penting
% of Total 3.3% 13.5% 13.1% 4.0% 1.5% 35.4%
Count 23 57 64 26 7 177
% within kf_KP 13.0% 32.2% 36.2% 14.7% 4.0% 100.0%
kf_KP
penting
% of Total 8.4% 20.8% 23.4% 9.5% 2.6% 64.6%
Count 32 94 100 37 11 274
% within kf_KP 11.7% 34.3% 36.5% 13.5% 4.0% 100.0%
Total
% of Total 11.7% 34.3% 36.5% 13.5% 4.0% 100.0%
kf_PAEC * Usia Crosstabulation
Usia
17-18 tahun 19-20 tahun 21-22 tahun 23-24 tahun >25 tahun Total
Count 14 44 56 18 8 140
% within kf_PAEC 10.0% 31.4% 40.0% 12.9% 5.7% 100.0%
tidak penting
% of Total 5.1% 16.1% 20.4% 6.6% 2.9% 51.1%
Count 18 50 44 19 3 134
% within kf_PAEC 13.4% 37.3% 32.8% 14.2% 2.2% 100.0%
kf_PAEC
penting
% of Total 6.6% 18.2% 16.1% 6.9% 1.1% 48.9%
Count 32 94 100 37 11 274
% within kf_PAEC 11.7% 34.3% 36.5% 13.5% 4.0% 100.0%
Total
% of Total 11.7% 34.3% 36.5% 13.5% 4.0% 100.0%
kf_IP * Usia Crosstabulation
Usia
17-18 tahun 19-20 tahun 21-22 tahun 23-24 tahun >25 tahun Total
Count 9 20 19 4 2 54
% within kf_IP 16.7% 37.0% 35.2% 7.4% 3.7% 100.0%
tidak penting
% of Total 3.3% 7.3% 6.9% 1.5% .7% 19.7%
Count 23 74 81 33 9 220
% within kf_IP 10.5% 33.6% 36.8% 15.0% 4.1% 100.0%
kf_IP
penting
% of Total 8.4% 27.0% 29.6% 12.0% 3.3% 80.3%
Count 32 94 100 37 11 274
% within kf_IP 11.7% 34.3% 36.5% 13.5% 4.0% 100.0%
Total
% of Total 11.7% 34.3% 36.5% 13.5% 4.0% 100.0%
124
kf_KB * Usia Crosstabulation
Usia
17-18 tahun 19-20 tahun 21-22 tahun 23-24 tahun >25 tahun Total
Count 14 39 38 17 1 109
% within kf_KB 12.8% 35.8% 34.9% 15.6% .9% 100.0%
tidak penting
% of Total 5.1% 14.2% 13.9% 6.2% .4% 39.8%
Count 18 55 62 20 10 165
% within kf_KB 10.9% 33.3% 37.6% 12.1% 6.1% 100.0%
kf_KB
penting
% of Total 6.6% 20.1% 22.6% 7.3% 3.6% 60.2%
Count 32 94 100 37 11 274
% within kf_KB 11.7% 34.3% 36.5% 13.5% 4.0% 100.0%
Total
% of Total 11.7% 34.3% 36.5% 13.5% 4.0% 100.0%
kf_BHL * Usia Crosstabulation
Usia
17-18 tahun 19-20 tahun 21-22 tahun 23-24 tahun >25 tahun Total
Count 6 42 39 12 2 101
% within kf_BHL 5.9% 41.6% 38.6% 11.9% 2.0% 100.0%
tidak penting
% of Total 2.2% 15.3% 14.2% 4.4% .7% 36.9%
Count 26 52 61 25 9 173
% within kf_BHL 15.0% 30.1% 35.3% 14.5% 5.2% 100.0%
kf_BHL
penting
% of Total 9.5% 19.0% 22.3% 9.1% 3.3% 63.1%
Count 32 94 100 37 11 274
% within kf_BHL 11.7% 34.3% 36.5% 13.5% 4.0% 100.0%
Total
% of Total 11.7% 34.3% 36.5% 13.5% 4.0% 100.0%
kf_TB * Usia Crosstabulation
Usia
17-18 tahun 19-20 tahun 21-22 tahun 23-24 tahun >25 tahun Total
Count 14 43 58 23 9 147
% within kf_TB 9.5% 29.3% 39.5% 15.6% 6.1% 100.0%
tidak penting
% of Total 5.1% 15.7% 21.2% 8.4% 3.3% 53.6%
Count 18 51 42 14 2 127
% within kf_TB 14.2% 40.2% 33.1% 11.0% 1.6% 100.0%
kf_TB
penting
% of Total 6.6% 18.6% 15.3% 5.1% .7% 46.4%
Count 32 94 100 37 11 274
% within kf_TB 11.7% 34.3% 36.5% 13.5% 4.0% 100.0%
Total
% of Total 11.7% 34.3% 36.5% 13.5% 4.0% 100.0%

125
kf_BN * Usia Crosstabulation
Usia
17-18 tahun 19-20 tahun 21-22 tahun 23-24 tahun >25 tahun Total
Count 7 23 24 7 2 63
% within kf_BN 11.1% 36.5% 38.1% 11.1% 3.2% 100.0%
tidak penting
% of Total 2.6% 8.4% 8.8% 2.6% .7% 23.0%
Count 25 71 76 30 9 211
% within kf_BN 11.8% 33.6% 36.0% 14.2% 4.3% 100.0%
kf_BN
penting
% of Total 9.1% 25.9% 27.7% 10.9% 3.3% 77.0%
Count 32 94 100 37 11 274
% within kf_BN 11.7% 34.3% 36.5% 13.5% 4.0% 100.0%
Total
% of Total 11.7% 34.3% 36.5% 13.5% 4.0% 100.0%
kf_PM * Usia Crosstabulation
Usia
17-18 tahun 19-20 tahun 21-22 tahun 23-24 tahun >25 tahun Total
Count 7 14 20 8 0 49
% within kf_PM 14.3% 28.6% 40.8% 16.3% .0% 100.0%
tidak penting
% of Total 2.6% 5.1% 7.3% 2.9% .0% 17.9%
Count 25 80 80 29 11 225
% within kf_PM 11.1% 35.6% 35.6% 12.9% 4.9% 100.0%
kf_PM
penting
% of Total 9.1% 29.2% 29.2% 10.6% 4.0% 82.1%
Count 32 94 100 37 11 274
% within kf_PM 11.7% 34.3% 36.5% 13.5% 4.0% 100.0%
Total
% of Total 11.7% 34.3% 36.5% 13.5% 4.0% 100.0%
kf_KPLP * Usia Crosstabulation
Usia
17-18 tahun 19-20 tahun 21-22 tahun 23-24 tahun >25 tahun Total
Count 20 55 61 27 5 168
% within kf_KPLP 11.9% 32.7% 36.3% 16.1% 3.0% 100.0%
tidak penting
% of Total 7.3% 20.1% 22.3% 9.9% 1.8% 61.3%
Count 12 39 39 10 6 106
% within kf_KPLP 11.3% 36.8% 36.8% 9.4% 5.7% 100.0%
kf_KPLP
penting
% of Total 4.4% 14.2% 14.2% 3.6% 2.2% 38.7%
Count 32 94 100 37 11 274
% within kf_KPLP 11.7% 34.3% 36.5% 13.5% 4.0% 100.0%
Total
% of Total 11.7% 34.3% 36.5% 13.5% 4.0% 100.0%

126
kf_BI * Tahun Angkatan Crosstabulation
Tahun Angkatan
2011 2012 2013 2014 Total
Count 83 67 58 49 257
% within kf_BI 32.3% 26.1% 22.6% 19.1% 100.0%
tidak penting
% of Total 30.3% 24.5% 21.2% 17.9% 93.8%
Count 2 5 5 5 17
% within kf_BI 11.8% 29.4% 29.4% 29.4% 100.0%
kf_BI
penting
% of Total .7% 1.8% 1.8% 1.8% 6.2%
Count 85 72 63 54 274
% within kf_BI 31.0% 26.3% 23.0% 19.7% 100.0%
Total
% of Total 31.0% 26.3% 23.0% 19.7% 100.0%
kf_ME * Tahun Angkatan Crosstabulation
Tahun Angkatan
2011 2012 2013 2014 Total
Count 62 55 50 35 202
% within kf_ME 30.7% 27.2% 24.8% 17.3% 100.0%
tidak penting
% of Total 22.6% 20.1% 18.2% 12.8% 73.7%
Count 23 17 13 19 72
% within kf_ME 31.9% 23.6% 18.1% 26.4% 100.0%
kf_ME
penting
% of Total 8.4% 6.2% 4.7% 6.9% 26.3%
Count 85 72 63 54 274
% within kf_ME 31.0% 26.3% 23.0% 19.7% 100.0%
Total
% of Total 31.0% 26.3% 23.0% 19.7% 100.0%
kf_KU * Tahun Angkatan Crosstabulation
Tahun Angkatan
2011 2012 2013 2014 Total
Count 72 64 58 44 238
% within kf_KU 30.3% 26.9% 24.4% 18.5% 100.0%
tidak penting
% of Total 26.3% 23.4% 21.2% 16.1% 86.9%
Count 13 8 5 10 36
% within kf_KU 36.1% 22.2% 13.9% 27.8% 100.0%
kf_KU
penting
% of Total 4.7% 2.9% 1.8% 3.6% 13.1%
Count 85 72 63 54 274
% within kf_KU 31.0% 26.3% 23.0% 19.7% 100.0%
Total
% of Total 31.0% 26.3% 23.0% 19.7% 100.0%

127
kf_IFRS * Tahun Angkatan Crosstabulation
Tahun Angkatan
2011 2012 2013 2014 Total
Count 69 58 52 41 220
% within kf_IFRS 31.4% 26.4% 23.6% 18.6% 100.0%
tidak penting
% of Total 25.2% 21.2% 19.0% 15.0% 80.3%
Count 16 14 11 13 54
% within kf_IFRS 29.6% 25.9% 20.4% 24.1% 100.0%
kf_IFRS
penting
% of Total 5.8% 5.1% 4.0% 4.7% 19.7%
Count 85 72 63 54 274
% within kf_IFRS 31.0% 26.3% 23.0% 19.7% 100.0%
Total
% of Total 31.0% 26.3% 23.0% 19.7% 100.0%
kf_PA * Tahun Angkatan Crosstabulation
Tahun Angkatan
2011 2012 2013 2014 Total
Count 38 34 33 32 137
% within kf_PA 27.7% 24.8% 24.1% 23.4% 100.0%
tidak penting
% of Total 13.9% 12.4% 12.0% 11.7% 50.0%
Count 47 38 30 22 137
% within kf_PA 34.3% 27.7% 21.9% 16.1% 100.0%
kf_PA
penting
% of Total 17.2% 13.9% 10.9% 8.0% 50.0%
Count 85 72 63 54 274
% within kf_PA 31.0% 26.3% 23.0% 19.7% 100.0%
Total
% of Total 31.0% 26.3% 23.0% 19.7% 100.0%
kf_KK * Tahun Angkatan Crosstabulation
Tahun Angkatan
2011 2012 2013 2014 Total
Count 34 24 25 29 112
% within kf_KK 30.4% 21.4% 22.3% 25.9% 100.0%
tidak penting
% of Total 12.4% 8.8% 9.1% 10.6% 40.9%
Count 51 48 38 25 162
% within kf_KK 31.5% 29.6% 23.5% 15.4% 100.0%
kf_KK
penting
% of Total 18.6% 17.5% 13.9% 9.1% 59.1%
Count 85 72 63 54 274
% within kf_KK 31.0% 26.3% 23.0% 19.7% 100.0%
Total
% of Total 31.0% 26.3% 23.0% 19.7% 100.0%
128
kf_PC * Tahun Angkatan Crosstabulation
Tahun Angkatan
2011 2012 2013 2014 Total
Count 54 41 37 30 162
% within kf_PC 33.3% 25.3% 22.8% 18.5% 100.0%
tidak penting
% of Total 19.7% 15.0% 13.5% 10.9% 59.1%
Count 31 31 26 24 112
% within kf_PC 27.7% 27.7% 23.2% 21.4% 100.0%
kf_PC
penting
% of Total 11.3% 11.3% 9.5% 8.8% 40.9%
Count 85 72 63 54 274
% within kf_PC 31.0% 26.3% 23.0% 19.7% 100.0%
Total
% of Total 31.0% 26.3% 23.0% 19.7% 100.0%
kf_AS * Tahun Angkatan Crosstabulation
Tahun Angkatan
2011 2012 2013 2014 Total
Count 39 35 32 26 132
% within kf_AS 29.5% 26.5% 24.2% 19.7% 100.0%
tidak penting
% of Total 14.2% 12.8% 11.7% 9.5% 48.2%
Count 46 37 31 28 142
% within kf_AS 32.4% 26.1% 21.8% 19.7% 100.0%
kf_AS
penting
% of Total 16.8% 13.5% 11.3% 10.2% 51.8%
Count 85 72 63 54 274
% within kf_AS 31.0% 26.3% 23.0% 19.7% 100.0%
Total
% of Total 31.0% 26.3% 23.0% 19.7% 100.0%
kf_PSM * Tahun Angkatan Crosstabulation
Tahun Angkatan
2011 2012 2013 2014 Total
Count 26 18 18 16 78
% within kf_PSM 33.3% 23.1% 23.1% 20.5% 100.0%
tidak penting
% of Total 9.5% 6.6% 6.6% 5.8% 28.5%
Count 59 54 45 38 196
% within kf_PSM 30.1% 27.6% 23.0% 19.4% 100.0%
kf_PSM
penting
% of Total 21.5% 19.7% 16.4% 13.9% 71.5%
Count 85 72 63 54 274
% within kf_PSM 31.0% 26.3% 23.0% 19.7% 100.0%
Total
% of Total 31.0% 26.3% 23.0% 19.7% 100.0%

129
kf_KP * Tahun Angkatan Crosstabulation
Tahun Angkatan
2011 2012 2013 2014 Total
Count 31 25 19 22 97
% within kf_KP 32.0% 25.8% 19.6% 22.7% 100.0%
tidak penting
% of Total 11.3% 9.1% 6.9% 8.0% 35.4%
Count 54 47 44 32 177
% within kf_KP 30.5% 26.6% 24.9% 18.1% 100.0%
kf_KP
penting
% of Total 19.7% 17.2% 16.1% 11.7% 64.6%
Count 85 72 63 54 274
% within kf_KP 31.0% 26.3% 23.0% 19.7% 100.0%
Total
% of Total 31.0% 26.3% 23.0% 19.7% 100.0%
kf_PAEC * Tahun Angkatan Crosstabulation
Tahun Angkatan
2011 2012 2013 2014 Total
Count 43 38 37 22 140
% within kf_PAEC 30.7% 27.1% 26.4% 15.7% 100.0%
tidak penting
% of Total 15.7% 13.9% 13.5% 8.0% 51.1%
Count 42 34 26 32 134
% within kf_PAEC 31.3% 25.4% 19.4% 23.9% 100.0%
kf_PAEC
penting
% of Total 15.3% 12.4% 9.5% 11.7% 48.9%
Count 85 72 63 54 274
% within kf_PAEC 31.0% 26.3% 23.0% 19.7% 100.0%
Total
% of Total 31.0% 26.3% 23.0% 19.7% 100.0%
kf_IP * Tahun Angkatan Crosstabulation
Tahun Angkatan
2011 2012 2013 2014 Total
Count 13 15 9 17 54
% within kf_IP 24.1% 27.8% 16.7% 31.5% 100.0%
tidak penting
% of Total 4.7% 5.5% 3.3% 6.2% 19.7%
Count 72 57 54 37 220
% within kf_IP 32.7% 25.9% 24.5% 16.8% 100.0%
kf_IP
penting
% of Total 26.3% 20.8% 19.7% 13.5% 80.3%
Count 85 72 63 54 274
% within kf_IP 31.0% 26.3% 23.0% 19.7% 100.0%
Total
% of Total 31.0% 26.3% 23.0% 19.7% 100.0%
130
kf_KB * Tahun Angkatan Crosstabulation
Tahun Angkatan
2011 2012 2013 2014 Total
Count 37 21 23 28 109
% within kf_KB 33.9% 19.3% 21.1% 25.7% 100.0%
tidak penting
% of Total 13.5% 7.7% 8.4% 10.2% 39.8%
Count 48 51 40 26 165
% within kf_KB 29.1% 30.9% 24.2% 15.8% 100.0%
kf_KB
penting
% of Total 17.5% 18.6% 14.6% 9.5% 60.2%
Count 85 72 63 54 274
% within kf_KB 31.0% 26.3% 23.0% 19.7% 100.0%
Total
% of Total 31.0% 26.3% 23.0% 19.7% 100.0%
kf_BHL * Tahun Angkatan Crosstabulation
Tahun Angkatan
2011 2012 2013 2014 Total
Count 29 29 24 19 101
% within kf_BHL 28.7% 28.7% 23.8% 18.8% 100.0%
tidak penting
% of Total 10.6% 10.6% 8.8% 6.9% 36.9%
Count 56 43 39 35 173
% within kf_BHL 32.4% 24.9% 22.5% 20.2% 100.0%
kf_BHL
penting
% of Total 20.4% 15.7% 14.2% 12.8% 63.1%
Count 85 72 63 54 274
% within kf_BHL 31.0% 26.3% 23.0% 19.7% 100.0%
Total
% of Total 31.0% 26.3% 23.0% 19.7% 100.0%
kf_TB * Tahun Angkatan Crosstabulation
Tahun Angkatan
2011 2012 2013 2014 Total
Count 50 45 30 22 147
% within kf_TB 34.0% 30.6% 20.4% 15.0% 100.0%
tidak penting
% of Total 18.2% 16.4% 10.9% 8.0% 53.6%
Count 35 27 33 32 127
% within kf_TB 27.6% 21.3% 26.0% 25.2% 100.0%
kf_TB
penting
% of Total 12.8% 9.9% 12.0% 11.7% 46.4%
Count 85 72 63 54 274
% within kf_TB 31.0% 26.3% 23.0% 19.7% 100.0%
Total
% of Total 31.0% 26.3% 23.0% 19.7% 100.0%

131
kf_BN * Tahun Angkatan Crosstabulation
Tahun Angkatan
2011 2012 2013 2014 Total
Count 17 19 13 14 63
% within kf_BN 27.0% 30.2% 20.6% 22.2% 100.0%
tidak penting
% of Total 6.2% 6.9% 4.7% 5.1% 23.0%
Count 68 53 50 40 211
% within kf_BN 32.2% 25.1% 23.7% 19.0% 100.0%
kf_BN
penting
% of Total 24.8% 19.3% 18.2% 14.6% 77.0%
Count 85 72 63 54 274
% within kf_BN 31.0% 26.3% 23.0% 19.7% 100.0%
Total
% of Total 31.0% 26.3% 23.0% 19.7% 100.0%
kf_PM * Tahun Angkatan Crosstabulation
Tahun Angkatan
2011 2012 2013 2014 Total
Count 14 11 16 8 49
% within kf_PM 28.6% 22.4% 32.7% 16.3% 100.0%
tidak penting
% of Total 5.1% 4.0% 5.8% 2.9% 17.9%
Count 71 61 47 46 225
% within kf_PM 31.6% 27.1% 20.9% 20.4% 100.0%
kf_PM
penting
% of Total 25.9% 22.3% 17.2% 16.8% 82.1%
Count 85 72 63 54 274
% within kf_PM 31.0% 26.3% 23.0% 19.7% 100.0%
Total
% of Total 31.0% 26.3% 23.0% 19.7% 100.0%
kf_KPLP * Tahun Angkatan Crosstabulation
Tahun Angkatan
2011 2012 2013 2014 Total
Count 52 49 34 33 168
% within kf_KPLP 31.0% 29.2% 20.2% 19.6% 100.0%
tidak penting
% of Total 19.0% 17.9% 12.4% 12.0% 61.3%
Count 33 23 29 21 106
% within kf_KPLP 31.1% 21.7% 27.4% 19.8% 100.0%
kf_KPLP
penting
% of Total 12.0% 8.4% 10.6% 7.7% 38.7%
Count 85 72 63 54 274
% within kf_KPLP 31.0% 26.3% 23.0% 19.7% 100.0%
Total
% of Total 31.0% 26.3% 23.0% 19.7% 100.0%
132
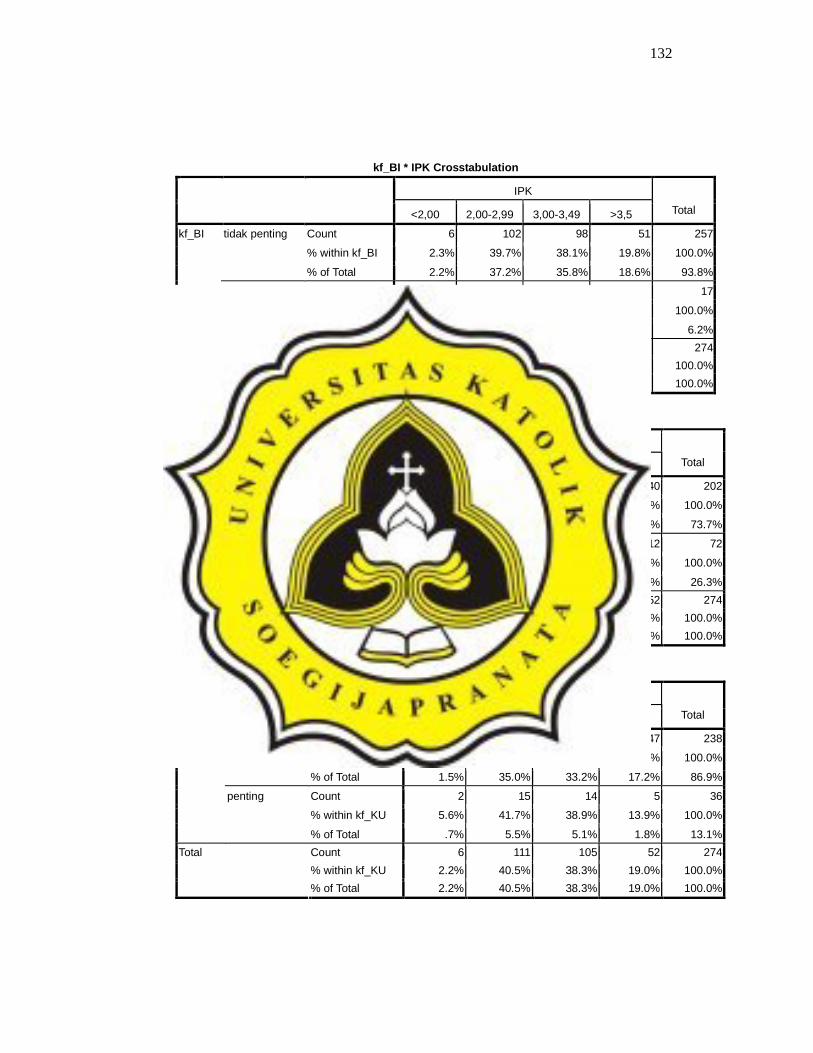
kf_BI * IPK Crosstabulation
IPK
<2,00 2,00-2,99 3,00-3,49 >3,5 Total
Count 6 102 98 51 257
% within kf_BI 2.3% 39.7% 38.1% 19.8% 100.0%
tidak penting
% of Total 2.2% 37.2% 35.8% 18.6% 93.8%
Count 0 9 7 1 17
% within kf_BI .0% 52.9% 41.2% 5.9% 100.0%
kf_BI
penting
% of Total .0% 3.3% 2.6% .4% 6.2%
Count 6 111 105 52 274
% within kf_BI 2.2% 40.5% 38.3% 19.0% 100.0%
Total
% of Total 2.2% 40.5% 38.3% 19.0% 100.0%
kf_ME * IPK Crosstabulation
IPK
<2,00 2,00-2,99 3,00-3,49 >3,5 Total
Count 1 80 81 40 202
% within kf_ME .5% 39.6% 40.1% 19.8% 100.0%
tidak penting
% of Total .4% 29.2% 29.6% 14.6% 73.7%
Count 5 31 24 12 72
% within kf_ME 6.9% 43.1% 33.3% 16.7% 100.0%
kf_ME
penting
% of Total 1.8% 11.3% 8.8% 4.4% 26.3%
Count 6 111 105 52 274
% within kf_ME 2.2% 40.5% 38.3% 19.0% 100.0%
Total
% of Total 2.2% 40.5% 38.3% 19.0% 100.0%
kf_KU * IPK Crosstabulation
IPK
<2,00 2,00-2,99 3,00-3,49 >3,5 Total
Count 4 96 91 47 238
% within kf_KU 1.7% 40.3% 38.2% 19.7% 100.0%
tidak penting
% of Total 1.5% 35.0% 33.2% 17.2% 86.9%
Count 2 15 14 5 36
% within kf_KU 5.6% 41.7% 38.9% 13.9% 100.0%
kf_KU
penting
% of Total .7% 5.5% 5.1% 1.8% 13.1%
Count 6 111 105 52 274
% within kf_KU 2.2% 40.5% 38.3% 19.0% 100.0%
Total
% of Total 2.2% 40.5% 38.3% 19.0% 100.0%

133
kf_IFRS * IPK Crosstabulation
IPK
<2,00 2,00-2,99 3,00-3,49 >3,5 Total
Count 6 90 84 40 220
% within kf_IFRS 2.7% 40.9% 38.2% 18.2% 100.0%
tidak penting
% of Total 2.2% 32.8% 30.7% 14.6% 80.3%
Count 0 21 21 12 54
% within kf_IFRS .0% 38.9% 38.9% 22.2% 100.0%
kf_IFRS
penting
% of Total .0% 7.7% 7.7% 4.4% 19.7%
Count 6 111 105 52 274
% within kf_IFRS 2.2% 40.5% 38.3% 19.0% 100.0%
Total
% of Total 2.2% 40.5% 38.3% 19.0% 100.0%
kf_PA * IPK Crosstabulation
IPK
<2,00 2,00-2,99 3,00-3,49 >3,5 Total
Count 2 60 47 28 137
% within kf_PA 1.5% 43.8% 34.3% 20.4% 100.0%
tidak penting
% of Total .7% 21.9% 17.2% 10.2% 50.0%
Count 4 51 58 24 137
% within kf_PA 2.9% 37.2% 42.3% 17.5% 100.0%
kf_PA
penting
% of Total 1.5% 18.6% 21.2% 8.8% 50.0%
Count 6 111 105 52 274
% within kf_PA 2.2% 40.5% 38.3% 19.0% 100.0%
Total
% of Total 2.2% 40.5% 38.3% 19.0% 100.0%
kf_KK * IPK Crosstabulation
IPK
<2,00 2,00-2,99 3,00-3,49 >3,5 Total
Count 3 49 37 23 112
% within kf_KK 2.7% 43.8% 33.0% 20.5% 100.0%
tidak penting
% of Total 1.1% 17.9% 13.5% 8.4% 40.9%
Count 3 62 68 29 162
% within kf_KK 1.9% 38.3% 42.0% 17.9% 100.0%
kf_KK
penting
% of Total 1.1% 22.6% 24.8% 10.6% 59.1%
Count 6 111 105 52 274
% within kf_KK 2.2% 40.5% 38.3% 19.0% 100.0%
Total
% of Total 2.2% 40.5% 38.3% 19.0% 100.0%

134
kf_PC * IPK Crosstabulation
IPK
<2,00 2,00-2,99 3,00-3,49 >3,5 Total
Count 4 61 63 34 162
% within kf_PC 2.5% 37.7% 38.9% 21.0% 100.0%
tidak penting
% of Total 1.5% 22.3% 23.0% 12.4% 59.1%
Count 2 50 42 18 112
% within kf_PC 1.8% 44.6% 37.5% 16.1% 100.0%
kf_PC
penting
% of Total .7% 18.2% 15.3% 6.6% 40.9%
Count 6 111 105 52 274
% within kf_PC 2.2% 40.5% 38.3% 19.0% 100.0%
Total
% of Total 2.2% 40.5% 38.3% 19.0% 100.0%
kf_AS * IPK Crosstabulation
IPK
<2,00 2,00-2,99 3,00-3,49 >3,5 Total
Count 5 58 45 24 132
% within kf_AS 3.8% 43.9% 34.1% 18.2% 100.0%
tidak penting
% of Total 1.8% 21.2% 16.4% 8.8% 48.2%
Count 1 53 60 28 142
% within kf_AS .7% 37.3% 42.3% 19.7% 100.0%
kf_AS
penting
% of Total .4% 19.3% 21.9% 10.2% 51.8%
Count 6 111 105 52 274
% within kf_AS 2.2% 40.5% 38.3% 19.0% 100.0%
Total
% of Total 2.2% 40.5% 38.3% 19.0% 100.0%
kf_PSM * IPK Crosstabulation
IPK
<2,00 2,00-2,99 3,00-3,49 >3,5 Total
Count 3 34 31 10 78
% within kf_PSM 3.8% 43.6% 39.7% 12.8% 100.0%
tidak penting
% of Total 1.1% 12.4% 11.3% 3.6% 28.5%
Count 3 77 74 42 196
% within kf_PSM 1.5% 39.3% 37.8% 21.4% 100.0%
kf_PSM
penting
% of Total 1.1% 28.1% 27.0% 15.3% 71.5%
Count 6 111 105 52 274
% within kf_PSM 2.2% 40.5% 38.3% 19.0% 100.0%
Total
% of Total 2.2% 40.5% 38.3% 19.0% 100.0%

135
kf_KP * IPK Crosstabulation
IPK
<2,00 2,00-2,99 3,00-3,49 >3,5 Total
Count 1 40 34 22 97
% within kf_KP 1.0% 41.2% 35.1% 22.7% 100.0%
tidak penting
% of Total .4% 14.6% 12.4% 8.0% 35.4%
Count 5 71 71 30 177
% within kf_KP 2.8% 40.1% 40.1% 16.9% 100.0%
kf_KP
penting
% of Total 1.8% 25.9% 25.9% 10.9% 64.6%
Count 6 111 105 52 274
% within kf_KP 2.2% 40.5% 38.3% 19.0% 100.0%
Total
% of Total 2.2% 40.5% 38.3% 19.0% 100.0%
kf_PAEC * IPK Crosstabulation
IPK
<2,00 2,00-2,99 3,00-3,49 >3,5 Total
Count 2 51 58 29 140
% within kf_PAEC 1.4% 36.4% 41.4% 20.7% 100.0%
tidak penting
% of Total .7% 18.6% 21.2% 10.6% 51.1%
Count 4 60 47 23 134
% within kf_PAEC 3.0% 44.8% 35.1% 17.2% 100.0%
kf_PAEC
penting
% of Total 1.5% 21.9% 17.2% 8.4% 48.9%
Count 6 111 105 52 274
% within kf_PAEC 2.2% 40.5% 38.3% 19.0% 100.0%
Total
% of Total 2.2% 40.5% 38.3% 19.0% 100.0%
kf_IP * IPK Crosstabulation
IPK
<2,00 2,00-2,99 3,00-3,49 >3,5 Total
Count 1 23 20 10 54
% within kf_IP 1.9% 42.6% 37.0% 18.5% 100.0%
tidak penting
% of Total .4% 8.4% 7.3% 3.6% 19.7%
Count 5 88 85 42 220
% within kf_IP 2.3% 40.0% 38.6% 19.1% 100.0%
kf_IP
penting
% of Total 1.8% 32.1% 31.0% 15.3% 80.3%
Count 6 111 105 52 274
% within kf_IP 2.2% 40.5% 38.3% 19.0% 100.0%
Total
% of Total 2.2% 40.5% 38.3% 19.0% 100.0%

136
kf_KB * IPK Crosstabulation
IPK
<2,00 2,00-2,99 3,00-3,49 >3,5 Total
Count 4 47 43 15 109
% within kf_KB 3.7% 43.1% 39.4% 13.8% 100.0%
tidak penting
% of Total 1.5% 17.2% 15.7% 5.5% 39.8%
Count 2 64 62 37 165
% within kf_KB 1.2% 38.8% 37.6% 22.4% 100.0%
kf_KB
penting
% of Total .7% 23.4% 22.6% 13.5% 60.2%
Count 6 111 105 52 274
% within kf_KB 2.2% 40.5% 38.3% 19.0% 100.0%
Total
% of Total 2.2% 40.5% 38.3% 19.0% 100.0%
kf_BHL * IPK Crosstabulation
IPK
<2,00 2,00-2,99 3,00-3,49 >3,5 Total
Count 3 43 37 18 101
% within kf_BHL 3.0% 42.6% 36.6% 17.8% 100.0%
tidak penting
% of Total 1.1% 15.7% 13.5% 6.6% 36.9%
Count 3 68 68 34 173
% within kf_BHL 1.7% 39.3% 39.3% 19.7% 100.0%
kf_BHL
penting
% of Total 1.1% 24.8% 24.8% 12.4% 63.1%
Count 6 111 105 52 274
% within kf_BHL 2.2% 40.5% 38.3% 19.0% 100.0%
Total
% of Total 2.2% 40.5% 38.3% 19.0% 100.0%
kf_TB * IPK Crosstabulation
IPK
<2,00 2,00-2,99 3,00-3,49 >3,5 Total
Count 2 59 64 22 147
% within kf_TB 1.4% 40.1% 43.5% 15.0% 100.0%
tidak penting
% of Total .7% 21.5% 23.4% 8.0% 53.6%
Count 4 52 41 30 127
% within kf_TB 3.1% 40.9% 32.3% 23.6% 100.0%
kf_TB
penting
% of Total 1.5% 19.0% 15.0% 10.9% 46.4%
Count 6 111 105 52 274
% within kf_TB 2.2% 40.5% 38.3% 19.0% 100.0%
Total
% of Total 2.2% 40.5% 38.3% 19.0% 100.0%

137
kf_BN * IPK Crosstabulation
IPK
<2,00 2,00-2,99 3,00-3,49 >3,5 Total
Count 1 25 27 10 63
% within kf_BN 1.6% 39.7% 42.9% 15.9% 100.0%
tidak penting
% of Total .4% 9.1% 9.9% 3.6% 23.0%
Count 5 86 78 42 211
% within kf_BN 2.4% 40.8% 37.0% 19.9% 100.0%
kf_BN
penting
% of Total 1.8% 31.4% 28.5% 15.3% 77.0%
Count 6 111 105 52 274
% within kf_BN 2.2% 40.5% 38.3% 19.0% 100.0%
Total
% of Total 2.2% 40.5% 38.3% 19.0% 100.0%
kf_PM * IPK Crosstabulation
IPK
<2,00 2,00-2,99 3,00-3,49 >3,5 Total
Count 1 20 19 9 49
% within kf_PM 2.0% 40.8% 38.8% 18.4% 100.0%
tidak penting
% of Total .4% 7.3% 6.9% 3.3% 17.9%
Count 5 91 86 43 225
% within kf_PM 2.2% 40.4% 38.2% 19.1% 100.0%
kf_PM
penting
% of Total 1.8% 33.2% 31.4% 15.7% 82.1%
Count 6 111 105 52 274
% within kf_PM 2.2% 40.5% 38.3% 19.0% 100.0%
Total
% of Total 2.2% 40.5% 38.3% 19.0% 100.0%
kf_KPLP * IPK Crosstabulation
IPK
<2,00 2,00-2,99 3,00-3,49 >3,5 Total
Count 5 61 65 37 168
% within kf_KPLP 3.0% 36.3% 38.7% 22.0% 100.0%
tidak penting
% of Total 1.8% 22.3% 23.7% 13.5% 61.3%
Count 1 50 40 15 106
% within kf_KPLP .9% 47.2% 37.7% 14.2% 100.0%
kf_KPLP
penting
% of Total .4% 18.2% 14.6% 5.5% 38.7%
Count 6 111 105 52 274
% within kf_KPLP 2.2% 40.5% 38.3% 19.0% 100.0%
Total
% of Total 2.2% 40.5% 38.3% 19.0% 100.0%

138
LAMPIRAN 5. HASIL ANALISIS REGRESI LOGISTIK
F-K BI (1)
Case Processing Summary
Unweighted Casesa N Percent
Included in Analysis 274 98.9
Missing Cases 3 1.1
Selected Cases
Total 277 100.0
Unselected Cases 0 .0
Total 277 100.0
a. If weight is in effect, see classification table for the total number of cases.
Dependent Variable
Encoding
Original Value Internal Value
0 0
1 1
Block 0: Beginning Block
Iteration Historya,b,c
Coefficients Iteration -2 Log likelihood Constant
1 379.786 .029 Step 0
2 379.786 .029
a. Constant is included in the model.
b. Initial -2 Log Likelihood: 379.786
c. Estimation terminated at iteration number 2 because parameter estimates changed by less than .001.
Classification Tablea,b
Predicted
K_BI
Observed 0 1
Percentage Correct
0 0 135 .0 K_BI
1 0 139 100.0
Step 0
Overall Percentage 50.7
a. Constant is included in the model. b. The cut value is .500
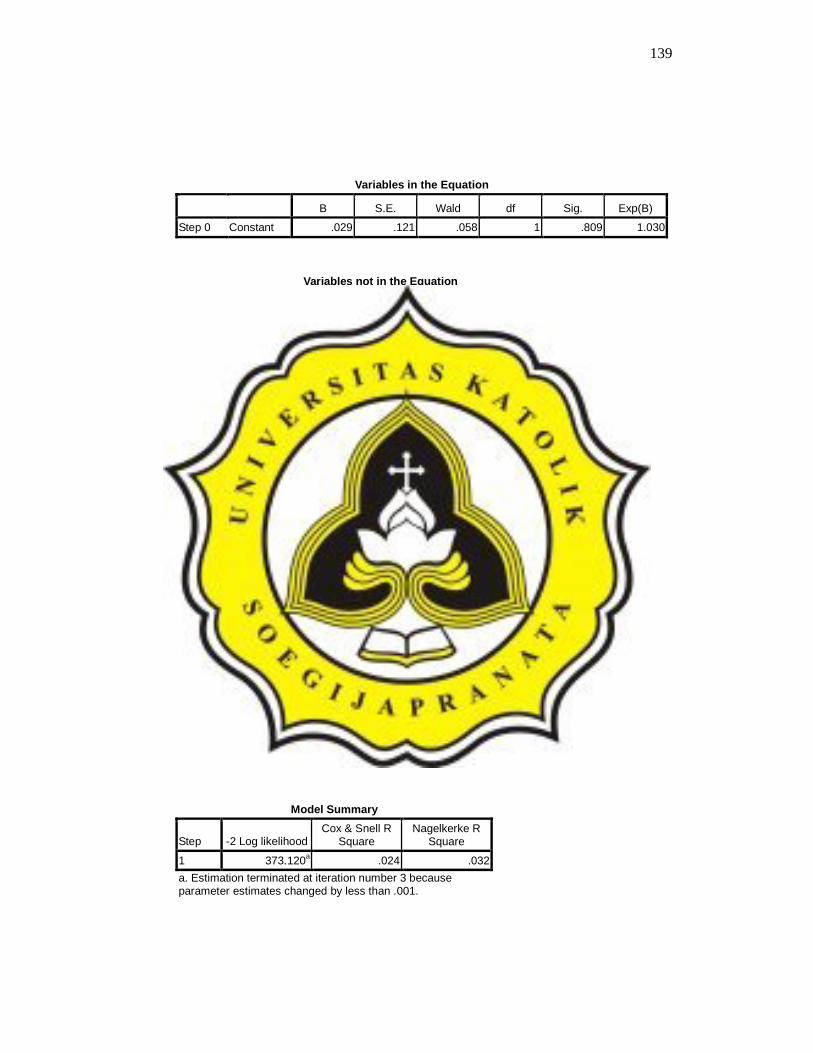
139
Variables in the Equation
B S.E. Wald df Sig. Exp(B)
Step 0 Constant .029 .121 .058 1 .809 1.030
Variables not in the Equation
Score df Sig.
Variables F_BI 6.510 1 .011 Step 0
Overall Statistics 6.510 1 .011
Block 1: Method = Enter
Iteration Historya,b,c,d
Coefficients Iteration -2 Log likelihood Constant F_BI
1 373.135 -1.470 .095
2 373.120 -1.548 .100
Step 1
3 373.120 -1.549 .100
a. Method: Enter b. Constant is included in the model. c. Initial -2 Log Likelihood: 379.786 d. Estimation terminated at iteration number 3 because parameter estimates changed by less than .001.
Omnibus Tests of Model Coefficients
Chi-square df Sig.
Step 6.666 1 .010
Block 6.666 1 .010
Step 1
Model 6.666 1 .010
Model Summary
Step -2 Log likelihood Cox & Snell R
Square Nagelkerke R
Square
1 373.120a .024 .032
a. Estimation terminated at iteration number 3 because parameter estimates changed by less than .001.

140
Hosmer and Lemeshow Test
Step Chi-square df Sig.
1 1.203 4 .878
Contingency Table for Hosmer and Lemeshow Test
K_BI = 0 K_BI = 1
Observed Expected Observed Expected Total
1 21 19.973 9 10.027 30
2 13 13.204 10 9.796 23
3 10 11.830 12 10.170 22
4 18 16.912 16 17.088 34
5 13 14.353 18 16.647 31
Step 1
6 60 58.729 74 75.271 134
Classification Tablea
Predicted
K_BI
Observed 0 1
Percentage Correct
0 52 83 38.5 K_BI
1 36 103 74.1
Step 1
Overall Percentage 56.6
a. The cut value is .500

141
F-K ME (2)
Case Processing Summary
Unweighted Casesa N Percent
Included in Analysis 274 98.9
Missing Cases 3 1.1
Selected Cases
Total 277 100.0
Unselected Cases 0 .0
Total 277 100.0
a. If weight is in effect, see classification table for the total number of cases.
Dependent Variable
Encoding
Original Value Internal Value
0 0
1 1
Block 0: Beginning Block
Iteration Historya,b,c
Coefficients Iteration -2 Log likelihood Constant
1 232.344 1.416
2 227.840 1.730
3 227.794 1.766
Step 0
4 227.794 1.766
a. Constant is included in the model.
b. Initial -2 Log Likelihood: 227.794
c. Estimation terminated at iteration number 4 because parameter estimates changed by less than .001.
Classification Tablea,b
Predicted
K_ME
Observed 0 1
Percentage Correct
0 0 40 .0 K_ME
1 0 234 100.0
Step 0
Overall Percentage 85.4
a. Constant is included in the model.

142
Classification Tablea,b
Predicted
K_ME
Observed 0 1
Percentage Correct
0 0 40 .0 K_ME
1 0 234 100.0
Step 0
Overall Percentage 85.4
b. The cut value is .500
Variables in the Equation
B S.E. Wald df Sig. Exp(B)
Step 0 Constant 1.766 .171 106.592 1 .000 5.850
Variables not in the Equation
Score df Sig.
Variables F_ME .832 1 .362 Step 0
Overall Statistics .832 1 .362
Block 1: Method = Enter
Iteration Historya,b,c,d
Coefficients Iteration -2 Log likelihood Constant F_ME
1 231.773 1.626 -.018
2 227.008 2.116 -.032
3 226.943 2.209 -.036
4 226.943 2.212 -.037
Step 1
5 226.943 2.212 -.037
a. Method: Enter b. Constant is included in the model. c. Initial -2 Log Likelihood: 227.794 d. Estimation terminated at iteration number 5 because parameter estimates changed by less than .001.
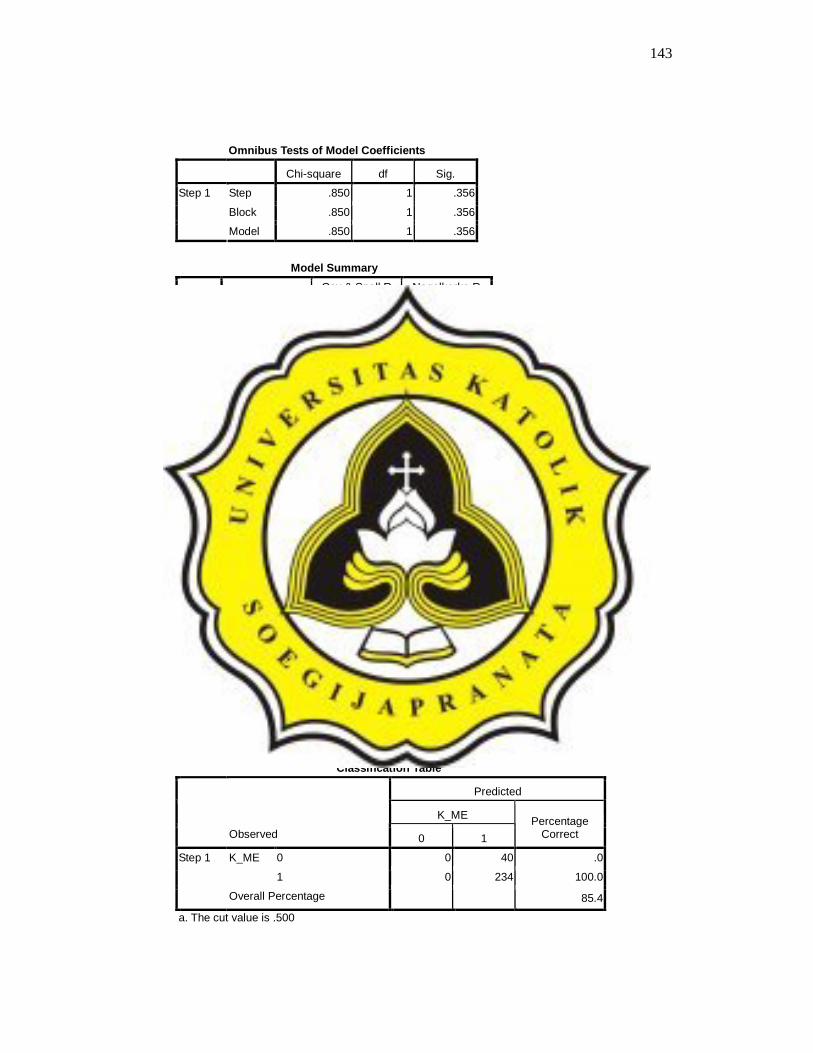
143
Omnibus Tests of Model Coefficients
Chi-square df Sig.
Step .850 1 .356
Block .850 1 .356
Step 1
Model .850 1 .356
Model Summary
Step -2 Log likelihood Cox & Snell R
Square Nagelkerke R
Square
1 226.943a .003 .005
a. Estimation terminated at iteration number 5 because parameter estimates changed by less than .001.
Hosmer and Lemeshow Test
Step Chi-square df Sig.
1 4.700 8 .789
Contingency Table for Hosmer and Lemeshow Test
K_ME = 0 K_ME = 1
Observed Expected Observed Expected Total
1 4 2.970 13 14.030 17
2 5 6.610 34 32.390 39
3 5 6.133 33 31.867 38
4 5 3.401 17 18.599 22
5 3 2.398 13 13.602 16
6 5 3.486 19 20.514 24
7 1 3.097 21 18.903 22
8 3 3.273 21 20.727 24
9 3 2.742 18 18.258 21
Step 1
10 6 5.891 45 45.109 51
Classification Tablea
Predicted
K_ME
Observed 0 1
Percentage Correct
0 0 40 .0 K_ME
1 0 234 100.0
Step 1
Overall Percentage 85.4
a. The cut value is .500

144
Variables in the Equation
B S.E. Wald df Sig. Exp(B)
F_ME -.037 .040 .828 1 .363 .964 Step 1a
Constant 2.212 .528 17.563 1 .000 9.131
a. Variable(s) entered on step 1: F_ME.

145
F-K KU (3)
Case Processing Summary
Unweighted Casesa N Percent
Included in Analysis 274 98.9
Missing Cases 3 1.1
Selected Cases
Total 277 100.0
Unselected Cases 0 .0
Total 277 100.0
a. If weight is in effect, see classification table for the total number of cases.
Dependent Variable Encoding
Original Value Internal Value
0 0
1 1
Block 0: Beginning Block
Iteration Historya,b,c
Coefficients Iteration -2 Log likelihood Constant
1 378.384 .146 Step 0
2 378.384 .146
a. Constant is included in the model.
b. Initial -2 Log Likelihood: 378.384
c. Estimation terminated at iteration number 2 because parameter estimates changed by less than .001.
Classification Tablea,b
Predicted
K_KU
Observed 0 1
Percentage Correct
0 0 127 .0 K_KU
1 0 147 100.0
Step 0
Overall Percentage 53.6
a. Constant is included in the model.

146
Classification Tablea,b
Predicted
K_KU
Observed 0 1
Percentage Correct
0 0 127 .0 K_KU
1 0 147 100.0
Step 0
Overall Percentage 53.6
b. The cut value is .500
Variables in the Equation
B S.E. Wald df Sig. Exp(B)
Step 0 Constant .146 .121 1.457 1 .227 1.157
Variables not in the Equation
Score df Sig.
Variables F_KU 1.217 1 .270 Step 0
Overall Statistics 1.217 1 .270
Block 1: Method = Enter
Iteration Historya,b,c,d
Coefficients Iteration -2 Log likelihood Constant F_KU
1 377.160 .648 -.037
2 377.160 .657 -.037
Step 1
3 377.160 .657 -.037
a. Method: Enter b. Constant is included in the model. c. Initial -2 Log Likelihood: 378.384 d. Estimation terminated at iteration number 3 because parameter estimates changed by less than .001.
Omnibus Tests of Model Coefficients
Chi-square df Sig.
Step 1.224 1 .269
Block 1.224 1 .269
Step 1
Model 1.224 1 .269

147
Model Summary
Step -2 Log likelihood Cox & Snell R
Square Nagelkerke R
Square
1 377.160a .004 .006
a. Estimation terminated at iteration number 3 because parameter estimates changed by less than .001.
Hosmer and Lemeshow Test
Step Chi-square df Sig.
1 7.464 7 .382
Contingency Table for Hosmer and Lemeshow Test
K_KU = 0 K_KU = 1
Observed Expected Observed Expected Total
1 16 13.104 10 12.896 26
2 20 21.269 23 21.731 43
3 18 19.897 23 21.103 41
4 11 13.803 18 15.197 29
5 11 10.733 12 12.267 23
6 8 8.690 11 10.310 19
7 15 10.754 9 13.246 24
8 16 13.934 16 18.066 32
Step 1
9 12 14.816 25 22.184 37
Classification Tablea
Predicted
K_KU
Observed 0 1
Percentage Correct
0 16 111 12.6 K_KU
1 10 137 93.2
Step 1
Overall Percentage 55.8
a. The cut value is .500

148
Variables in the Equation
B S.E. Wald df Sig. Exp(B)
F_KU -.037 .034 1.210 1 .271 .963 Step 1a
Constant .657 .481 1.867 1 .172 1.929
a. Variable(s) entered on step 1: F_KU.

149
F-K IFRS (4)
Case Processing Summary
Unweighted Casesa N Percent
Included in Analysis 274 98.9
Missing Cases 3 1.1
Selected Cases
Total 277 100.0
Unselected Cases 0 .0
Total 277 100.0
a. If weight is in effect, see classification table for the total number of cases.
Dependent Variable
Encoding
Original Value Internal Value
0 0
1 1
Block 0: Beginning Block
Iteration Historya,b,c
Coefficients Iteration -2 Log likelihood Constant
1 241.844 1.372
2 238.163 1.653
3 238.134 1.681
Step 0
4 238.134 1.681
a. Constant is included in the model.
b. Initial -2 Log Likelihood: 238.134
c. Estimation terminated at iteration number 4 because parameter estimates changed by less than .001.
Classification Tablea,b
Predicted
K_IFRS
Observed 0 1
Percentage Correct
0 0 43 .0 K_IFRS
1 0 231 100.0
Step 0
Overall Percentage 84.3
a. Constant is included in the model. b. The cut value is .500

150
Variables in the Equation
B S.E. Wald df Sig. Exp(B)
Step 0 Constant 1.681 .166 102.466 1 .000 5.372
Variables not in the Equation
Score df Sig.
Variables F_IFRS 5.388 1 .020 Step 0
Overall Statistics 5.388 1 .020
Block 1: Method = Enter
Iteration Historya,b,c,d
Coefficients Iteration -2 Log likelihood Constant F_IFRS
1 237.899 2.035 -.048
2 232.233 2.957 -.092
3 231.995 3.275 -.110
4 231.994 3.301 -.112
Step 1
5 231.994 3.301 -.112
a. Method: Enter b. Constant is included in the model. c. Initial -2 Log Likelihood: 238.134 d. Estimation terminated at iteration number 5 because parameter estimates changed by less than .001.
Omnibus Tests of Model Coefficients
Chi-square df Sig.
Step 6.140 1 .013
Block 6.140 1 .013
Step 1
Model 6.140 1 .013
Model Summary
Step -2 Log likelihood Cox & Snell R
Square Nagelkerke R
Square
1 231.994a .022 .038
a. Estimation terminated at iteration number 5 because parameter estimates changed by less than .001.

151
Hosmer and Lemeshow Test
Step Chi-square df Sig.
1 7.524 6 .275
Contingency Table for Hosmer and Lemeshow Test
K_IFRS = 0 K_IFRS = 1
Observed Expected Observed Expected Total
1 10 9.724 35 35.276 45
2 14 12.063 47 48.937 61
3 6 7.044 33 31.956 39
4 2 4.701 27 24.299 29
5 5 3.040 19 20.960 24
6 0 2.356 22 19.644 22
7 4 2.658 26 27.342 30
Step 1
8 2 1.415 22 22.585 24
Classification Tablea
Predicted
K_IFRS
Observed 0 1
Percentage Correct
0 0 43 .0 K_IFRS
1 0 231 100.0
Step 1
Overall Percentage 84.3
a. The cut value is .500
Variables in the Equation
B S.E. Wald df Sig. Exp(B)
F_IFRS -.112 .049 5.145 1 .023 .894 Step 1a
Constant 3.301 .761 18.808 1 .000 27.142
a. Variable(s) entered on step 1: F_IFRS.

152
F-K PA (5)
Case Processing Summary
Unweighted Casesa N Percent
Included in Analysis 274 98.9
Missing Cases 3 1.1
Selected Cases
Total 277 100.0
Unselected Cases 0 .0
Total 277 100.0
a. If weight is in effect, see classification table for the total number of cases.
Dependent Variable Encoding
Original Value Internal Value
0 0
1 1
Block 0: Beginning Block
Iteration Historya,b,c
Coefficients Iteration -2 Log likelihood Constant
1 238.717 1.387
2 234.778 1.678
3 234.744 1.709
Step 0
4 234.744 1.709
a. Constant is included in the model.
b. Initial -2 Log Likelihood: 234.744
c. Estimation terminated at iteration number 4 because parameter estimates changed by less than .001.
Variables in the Equation
B S.E. Wald df Sig. Exp(B)
Step 0 Constant 1.709 .168 103.874 1 .000 5.524

153
Variables not in the Equation
Score df Sig.
Variables F_PA .302 1 .583 Step 0
Overall Statistics .302 1 .583
Block 1: Method = Enter
Iteration Historya,b,c,d
Coefficients Iteration -2 Log likelihood Constant F_PA
1 238.503 1.491 -.011
2 234.479 1.863 -.019
3 234.440 1.914 -.021
Step 1
4 234.440 1.915 -.021
a. Method: Enter b. Constant is included in the model. c. Initial -2 Log Likelihood: 234.744 d. Estimation terminated at iteration number 4 because parameter estimates changed by less than .001.
Omnibus Tests of Model Coefficients
Chi-square df Sig.
Step .304 1 .582
Block .304 1 .582
Step 1
Model .304 1 .582
Model Summary
Step -2 Log likelihood Cox & Snell R
Square Nagelkerke R
Square
1 234.440a .001 .002
a. Estimation terminated at iteration number 4 because parameter estimates changed by less than .001.
Hosmer and Lemeshow Test
Step Chi-square df Sig.
1 6.354 8 .608

154
Contingency Table for Hosmer and Lemeshow Test
K_PA = 0 K_PA = 1
Observed Expected Observed Expected Total
1 6 4.296 19 20.704 25
2 5 5.193 26 25.807 31
3 1 3.951 23 20.049 24
4 2 3.041 17 15.959 19
5 5 3.750 19 20.250 24
6 3 2.149 11 11.851 14
7 7 4.827 25 27.173 32
8 3 3.557 21 20.443 24
9 3 4.043 25 23.957 28
Step 1
10 7 7.194 46 45.806 53
Classification Tablea
Predicted
K_PA
Observed 0 1
Percentage Correct
0 0 42 .0 K_PA
1 0 232 100.0
Step 1
Overall Percentage 84.7
a. The cut value is .500
Variables in the Equation
B S.E. Wald df Sig. Exp(B)
F_PA -.021 .038 .302 1 .583 .979 Step 1a
Constant 1.915 .416 21.214 1 .000 6.787
a. Variable(s) entered on step 1: F_PA.

155
F-K KK (6)
Case Processing Summary
Unweighted Casesa N Percent
Included in Analysis 274 98.9
Missing Cases 3 1.1
Selected Cases
Total 277 100.0
Unselected Cases 0 .0
Total 277 100.0
a. If weight is in effect, see classification table for the total number of cases.
Dependent Variable
Encoding
Original Value Internal Value
0 0
1 1
Block 0: Beginning Block
Iteration Historya,b,c
Coefficients Iteration -2 Log likelihood Constant
1 238.717 1.387
2 234.778 1.678
3 234.744 1.709
Step 0
4 234.744 1.709
a. Constant is included in the model.
b. Initial -2 Log Likelihood: 234.744
c. Estimation terminated at iteration number 4 because parameter estimates changed by less than .001.
Classification Tablea,b
Predicted
K_PA
Observed 0 1
Percentage Correct
0 0 42 .0 K_PA
1 0 232 100.0
Step 0
Overall Percentage 84.7
a. Constant is included in the model. b. The cut value is .500
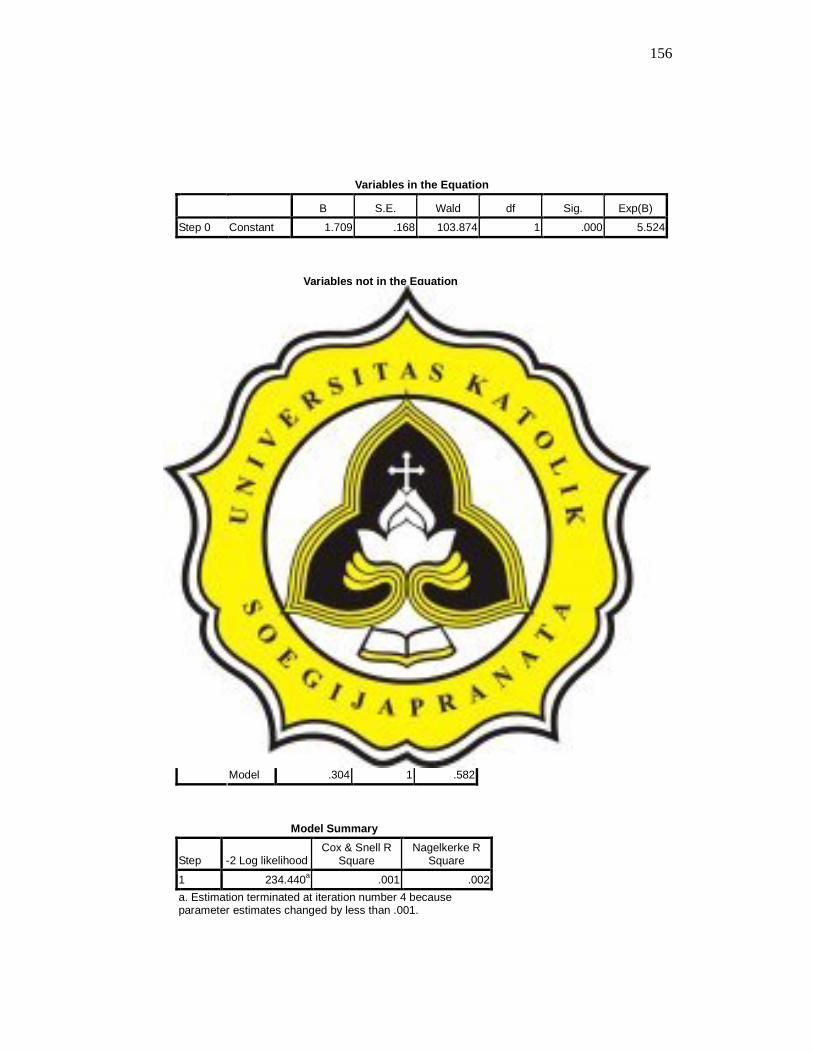
156
Variables in the Equation
B S.E. Wald df Sig. Exp(B)
Step 0 Constant 1.709 .168 103.874 1 .000 5.524
Variables not in the Equation
Score df Sig.
Variables F_PA .302 1 .583 Step 0
Overall Statistics .302 1 .583
Block 1: Method = Enter
Iteration Historya,b,c,d
Coefficients Iteration -2 Log likelihood Constant F_PA
1 238.503 1.491 -.011
2 234.479 1.863 -.019
3 234.440 1.914 -.021
Step 1
4 234.440 1.915 -.021
a. Method: Enter b. Constant is included in the model. c. Initial -2 Log Likelihood: 234.744 d. Estimation terminated at iteration number 4 because parameter estimates changed by less than .001.
Omnibus Tests of Model Coefficients
Chi-square df Sig.
Step .304 1 .582
Block .304 1 .582
Step 1
Model .304 1 .582
Model Summary
Step -2 Log likelihood Cox & Snell R
Square Nagelkerke R
Square
1 234.440a .001 .002
a. Estimation terminated at iteration number 4 because parameter estimates changed by less than .001.

157
Hosmer and Lemeshow Test
Step Chi-square df Sig.
1 6.354 8 .608
Contingency Table for Hosmer and Lemeshow Test
K_PA = 0 K_PA = 1
Observed Expected Observed Expected Total
1 6 4.296 19 20.704 25
2 5 5.193 26 25.807 31
3 1 3.951 23 20.049 24
4 2 3.041 17 15.959 19
5 5 3.750 19 20.250 24
6 3 2.149 11 11.851 14
7 7 4.827 25 27.173 32
8 3 3.557 21 20.443 24
9 3 4.043 25 23.957 28
Step 1
10 7 7.194 46 45.806 53
Classification Tablea
Predicted
K_PA
Observed 0 1
Percentage Correct
0 0 42 .0 K_PA
1 0 232 100.0
Step 1
Overall Percentage 84.7
a. The cut value is .500
Variables in the Equation
B S.E. Wald df Sig. Exp(B)
F_PA -.021 .038 .302 1 .583 .979 Step 1a
Constant 1.915 .416 21.214 1 .000 6.787
a. Variable(s) entered on step 1: F_PA.

158
F-K PC (7)
Case Processing Summary
Unweighted Casesa N Percent
Included in Analysis 273 98.6
Missing Cases 4 1.4
Selected Cases
Total 277 100.0
Unselected Cases 0 .0
Total 277 100.0
a. If weight is in effect, see classification table for the total number of cases.
Dependent Variable Encoding
Original Value Internal Value
0 0
1 1
Block 0: Beginning Block
Iteration Historya,b,c
Coefficients Iteration -2 Log likelihood Constant
1 378.015 .081 Step 0
2 378.015 .081
a. Constant is included in the model.
b. Initial -2 Log Likelihood: 378.015
c. Estimation terminated at iteration number 2 because parameter estimates changed by less than .001.
Classification Tablea,b
Predicted
K_PC
Observed 0 1
Percentage Correct
0 0 131 .0 K_PC
1 0 142 100.0
Step 0
Overall Percentage 52.0
a. Constant is included in the model.

159
Classification Tablea,b
Predicted
K_PC
Observed 0 1
Percentage Correct
0 0 131 .0 K_PC
1 0 142 100.0
Step 0
Overall Percentage 52.0
b. The cut value is .500
Variables in the Equation
B S.E. Wald df Sig. Exp(B)
Step 0 Constant .081 .121 .443 1 .506 1.084
Variables not in the Equation
Score df Sig.
Variables F_PC .043 1 .835 Step 0
Overall Statistics .043 1 .835
Block 1: Method = Enter
Iteration Historya,b,c,d
Coefficients Iteration -2 Log likelihood Constant F_PC
1 377.972 .021 .006 Step 1
2 377.972 .021 .006
a. Method: Enter b. Constant is included in the model. c. Initial -2 Log Likelihood: 378.015 d. Estimation terminated at iteration number 2 because parameter estimates changed by less than .001.
Omnibus Tests of Model Coefficients
Chi-square df Sig.
Step .043 1 .835
Block .043 1 .835
Step 1
Model .043 1 .835

160
Model Summary
Step -2 Log likelihood Cox & Snell R
Square Nagelkerke R
Square
1 377.972a .000 .000
a. Estimation terminated at iteration number 2 because parameter estimates changed by less than .001.
Hosmer and Lemeshow Test
Step Chi-square df Sig.
1 5.342 7 .618
Contingency Table for Hosmer and Lemeshow Test
K_PC = 0 K_PC = 1
Observed Expected Observed Expected Total
1 9 9.349 10 9.651 19
2 16 17.077 19 17.923 35
3 16 12.138 9 12.862 25
4 17 15.915 16 17.085 33
5 8 9.107 11 9.893 19
6 11 12.422 15 13.578 26
7 16 16.667 19 18.333 35
8 18 21.359 27 23.641 45
Step 1
9 20 16.966 16 19.034 36
Classification Tablea
Predicted
K_PC
Observed 0 1
Percentage Correct
0 0 131 .0 K_PC
1 0 142 100.0
Step 1
Overall Percentage 52.0
a. The cut value is .500

161
Variables in the Equation
B S.E. Wald df Sig. Exp(B)
F_PC .006 .030 .043 1 .835 1.006 Step 1a
Constant .021 .313 .004 1 .948 1.021
a. Variable(s) entered on step 1: F_PC.

162
F-K AS (8)
Case Processing Summary
Unweighted Casesa N Percent
Included in Analysis 274 98.9
Missing Cases 3 1.1
Selected Cases
Total 277 100.0
Unselected Cases 0 .0
Total 277 100.0
a. If weight is in effect, see classification table for the total number of cases.
Dependent Variable
Encoding
Original Value Internal Value
0 0
1 1
Block 0: Beginning Block
Iteration Historya,b,c
Coefficients Iteration -2 Log likelihood Constant
1 229.097 1.431
2 224.285 1.756
3 224.231 1.795
Step 0
4 224.231 1.796
a. Constant is included in the model.
b. Initial -2 Log Likelihood: 224.231
c. Estimation terminated at iteration number 4 because parameter estimates changed by less than .001.
Classification Tablea,b
Predicted
K_AS
Observed 0 1
Percentage Correct
0 0 39 .0 K_AS
1 0 235 100.0
Step 0
Overall Percentage 85.8
a. Constant is included in the model.

163
Classification Tablea,b
Predicted
K_AS
Observed 0 1
Percentage Correct
0 0 39 .0 K_AS
1 0 235 100.0
Step 0
Overall Percentage 85.8
b. The cut value is .500
Variables in the Equation
B S.E. Wald df Sig. Exp(B)
Step 0 Constant 1.796 .173 107.896 1 .000 6.026
Variables not in the Equation
Score df Sig.
Variables F_AS .208 1 .649 Step 0
Overall Statistics .208 1 .649
Block 1: Method = Enter
Iteration Historya,b,c,d
Coefficients Iteration -2 Log likelihood Constant F_AS
1 228.958 1.342 .010
2 224.082 1.597 .018
3 224.023 1.616 .020
Step 1
4 224.023 1.616 .020
a. Method: Enter b. Constant is included in the model. c. Initial -2 Log Likelihood: 224.231 d. Estimation terminated at iteration number 4 because parameter estimates changed by less than .001.
Omnibus Tests of Model Coefficients
Chi-square df Sig.
Step .208 1 .648 Step 1
Block .208 1 .648

164
Omnibus Tests of Model Coefficients
Chi-square df Sig.
Step .208 1 .648
Block .208 1 .648
Model .208 1 .648
Model Summary
Step -2 Log likelihood Cox & Snell R
Square Nagelkerke R
Square
1 224.023a .001 .001
a. Estimation terminated at iteration number 4 because parameter estimates changed by less than .001.
Hosmer and Lemeshow Test
Step Chi-square df Sig.
1 2.620 7 .918
Contingency Table for Hosmer and Lemeshow Test
K_AS = 0 K_AS = 1
Observed Expected Observed Expected Total
1 4 3.655 19 19.345 23
2 2 3.406 20 18.594 22
3 5 5.563 32 31.437 37
4 4 3.823 22 22.177 26
5 5 4.849 29 29.151 34
6 5 4.327 26 26.673 31
7 4 4.114 26 25.886 30
8 6 3.908 23 25.092 29
Step 1
9 4 5.355 38 36.645 42
Classification Tablea
Predicted
K_AS
Observed 0 1
Percentage Correct
0 0 39 .0 K_AS
1 0 235 100.0
Step 1
Overall Percentage 85.8
a. The cut value is .500

165
Variables in the Equation
B S.E. Wald df Sig. Exp(B)
F_AS .020 .045 .207 1 .649 1.020 Step 1a
Constant 1.616 .427 14.352 1 .000 5.034
a. Variable(s) entered on step 1: F_AS.

166
F-K PSM (9)
Case Processing Summary
Unweighted Casesa N Percent
Included in Analysis 274 98.9
Missing Cases 3 1.1
Selected Cases
Total 277 100.0
Unselected Cases 0 .0
Total 277 100.0
a. If weight is in effect, see classification table for the total number of cases.
Dependent Variable Encoding
Original Value Internal Value
0 0
1 1
Block 0: Beginning Block
Iteration Historya,b,c
Coefficients Iteration -2 Log likelihood Constant
1 286.607 1.139
2 285.472 1.287
3 285.470 1.293
Step 0
4 285.470 1.293
a. Constant is included in the model.
b. Initial -2 Log Likelihood: 285.470
c. Estimation terminated at iteration number 4 because parameter estimates changed by less than .001.
Classification Tablea,b
Predicted
K_PSM
Observed 0 1
Percentage Correct
0 0 59 .0 K_PSM
1 0 215 100.0
Step 0
Overall Percentage 78.5
a. Constant is included in the model.

167
Classification Tablea,b
Predicted
K_PSM
Observed 0 1
Percentage Correct
0 0 59 .0 K_PSM
1 0 215 100.0
Step 0
Overall Percentage 78.5
b. The cut value is .500
Variables in the Equation
B S.E. Wald df Sig. Exp(B)
Step 0 Constant 1.293 .147 77.411 1 .000 3.644
Variables not in the Equation
Score df Sig.
Variables F_PSM 1.245 1 .265 Step 0
Overall Statistics 1.245 1 .265
Block 1: Method = Enter
Iteration Historya,b,c,d
Coefficients Iteration -2 Log likelihood Constant F_PSM
1 285.534 .985 .023
2 284.200 1.066 .034
3 284.195 1.065 .036
Step 1
4 284.195 1.065 .036
a. Method: Enter b. Constant is included in the model. c. Initial -2 Log Likelihood: 285.470 d. Estimation terminated at iteration number 4 because parameter estimates changed by less than .001.
Omnibus Tests of Model Coefficients
Chi-square df Sig.
Step 1.275 1 .259
Block 1.275 1 .259
Step 1
Model 1.275 1 .259

168
Model Summary
Step -2 Log likelihood Cox & Snell R
Square Nagelkerke R
Square
1 284.195a .005 .007
a. Estimation terminated at iteration number 4 because parameter estimates changed by less than .001.
Hosmer and Lemeshow Test
Step Chi-square df Sig.
1 12.865 7 .075
Contingency Table for Hosmer and Lemeshow Test
K_PSM = 0 K_PSM = 1
Observed Expected Observed Expected Total
1 8 7.736 23 23.264 31
2 13 8.259 21 25.741 34
3 4 10.637 41 34.363 45
4 5 5.892 21 20.108 26
5 8 6.442 22 23.558 30
6 6 6.128 24 23.872 30
7 6 5.425 22 22.575 28
8 7 4.412 18 20.588 25
Step 1
9 2 4.070 23 20.930 25
Classification Tablea
Predicted
K_PSM
Observed 0 1
Percentage Correct
0 0 59 .0 K_PSM
1 0 215 100.0
Step 1
Overall Percentage 78.5
a. The cut value is .500
Variables in the Equation
B S.E. Wald df Sig. Exp(B)
F_PSM .036 .032 1.238 1 .266 1.036 Step 1a
Constant 1.065 .246 18.694 1 .000 2.901

169
Variables in the Equation
B S.E. Wald df Sig. Exp(B)
F_PSM .036 .032 1.238 1 .266 1.036 Step 1a
Constant 1.065 .246 18.694 1 .000 2.901
a. Variable(s) entered on step 1: F_PSM.

170
F-K KP (10)
Case Processing Summary
Unweighted Casesa N Percent
Included in Analysis 274 98.9
Missing Cases 3 1.1
Selected Cases
Total 277 100.0
Unselected Cases 0 .0
Total 277 100.0
a. If weight is in effect, see classification table for the total number of cases.
Dependent Variable Encoding
Original Value Internal Value
0 0
1 1
Block 0: Beginning Block
Iteration Historya,b,c
Coefficients Iteration -2 Log likelihood Constant
1 225.811 1.445
2 220.672 1.782
3 220.609 1.826
Step 0
4 220.609 1.826
a. Constant is included in the model.
b. Initial -2 Log Likelihood: 220.609
c. Estimation terminated at iteration number 4 because parameter estimates changed by less than .001.
Classification Tablea,b
Predicted
K_KP
Observed 0 1
Percentage Correct
0 0 38 .0 K_KP
1 0 236 100.0
Step 0
Overall Percentage 86.1
a. Constant is included in the model.

171
Classification Tablea,b
Predicted
K_KP
Observed 0 1
Percentage Correct
0 0 38 .0 K_KP
1 0 236 100.0
Step 0
Overall Percentage 86.1
b. The cut value is .500
Variables in the Equation
B S.E. Wald df Sig. Exp(B)
Step 0 Constant 1.826 .175 109.160 1 .000 6.211
Variables not in the Equation
Score df Sig.
Variables F_KP .416 1 .519 Step 0
Overall Statistics .416 1 .519
Block 1: Method = Enter
Iteration Historya,b,c,d
Coefficients Iteration -2 Log likelihood Constant F_KP
1 225.535 1.359 .011
2 220.262 1.625 .020
3 220.188 1.647 .023
Step 1
4 220.188 1.647 .024
a. Method: Enter b. Constant is included in the model. c. Initial -2 Log Likelihood: 220.609 d. Estimation terminated at iteration number 4 because parameter estimates changed by less than .001.
Omnibus Tests of Model Coefficients
Chi-square df Sig.
Step .421 1 .516 Step 1
Block .421 1 .516

172
Omnibus Tests of Model Coefficients
Chi-square df Sig.
Step .421 1 .516
Block .421 1 .516
Model .421 1 .516
Model Summary
Step -2 Log likelihood Cox & Snell R
Square Nagelkerke R
Square
1 220.188a .002 .003
a. Estimation terminated at iteration number 4 because parameter estimates changed by less than .001.
Hosmer and Lemeshow Test
Step Chi-square df Sig.
1 4.531 8 .806
Contingency Table for Hosmer and Lemeshow Test
K_KP = 0 K_KP = 1
Observed Expected Observed Expected Total
1 4 2.852 14 15.148 18
2 4 3.261 17 17.739 21
3 1 2.893 18 16.107 19
4 3 4.776 29 27.224 32
5 6 4.535 25 26.465 31
6 4 3.260 19 19.740 23
7 5 4.488 28 28.512 33
8 3 3.400 23 22.600 26
9 2 3.265 24 22.735 26
Step 1
10 6 5.271 39 39.729 45
Classification Tablea
Predicted
K_KP
Observed 0 1
Percentage Correct
0 0 38 .0 K_KP
1 0 236 100.0
Step 1
Overall Percentage 86.1

173
Classification Tablea
Predicted
K_KP
Observed 0 1
Percentage Correct
0 0 38 .0 K_KP
1 0 236 100.0
Step 1
Overall Percentage 86.1
a. The cut value is .500
Variables in the Equation
B S.E. Wald df Sig. Exp(B)
F_KP .024 .037 .415 1 .520 1.024 Step 1a
Constant 1.647 .323 25.949 1 .000 5.189
a. Variable(s) entered on step 1: F_KP.
174
F-K PAEC (11)
Case Processing Summary
Unweighted Casesa N Percent
Included in Analysis 274 98.9
Missing Cases 3 1.1
Selected Cases
Total 277 100.0
Unselected Cases 0 .0
Total 277 100.0
a. If weight is in effect, see classification table for the total number of cases.
Dependent Variable Encoding
Original Value Internal Value
0 0
1 1
Block 0: Beginning Block
Iteration Historya,b,c
Coefficients Iteration -2 Log likelihood Constant
1 379.713 .044 Step 0
2 379.713 .044
a. Constant is included in the model.
b. Initial -2 Log Likelihood: 379.713
c. Estimation terminated at iteration number 2 because parameter estimates changed by less than .001.
Classification Tablea,b
Predicted
K_PAEC
Observed 0 1
Percentage Correct
0 0 134 .0 K_PAEC
1 0 140 100.0
Step 0
Overall Percentage 51.1
a. Constant is included in the model.
175
Classification Tablea,b
Predicted
K_PAEC
Observed 0 1
Percentage Correct
0 0 134 .0 K_PAEC
1 0 140 100.0
Step 0
Overall Percentage 51.1
b. The cut value is .500
Variables in the Equation
B S.E. Wald df Sig. Exp(B)
Step 0 Constant .044 .121 .131 1 .717 1.045
Variables not in the Equation
Score df Sig.
Variables F_PAEC 3.092 1 .079 Step 0
Overall Statistics 3.092 1 .079
Block 1: Method = Enter
Iteration Historya,b,c,d
Coefficients Iteration -2 Log likelihood Constant F_PAEC
1 376.612 .438 -.040
2 376.612 .441 -.040
Step 1
3 376.612 .441 -.040
a. Method: Enter b. Constant is included in the model. c. Initial -2 Log Likelihood: 379.713 d. Estimation terminated at iteration number 3 because parameter estimates changed by less than .001.
Omnibus Tests of Model Coefficients
Chi-square df Sig.
Step 3.102 1 .078
Block 3.102 1 .078
Step 1
Model 3.102 1 .078

176
Model Summary
Step -2 Log likelihood Cox & Snell R
Square Nagelkerke R
Square
1 376.612a .011 .015
a. Estimation terminated at iteration number 3 because parameter estimates changed by less than .001.
Hosmer and Lemeshow Test
Step Chi-square df Sig.
1 6.759 7 .454
Contingency Table for Hosmer and Lemeshow Test
K_PAEC = 0 K_PAEC = 1
Observed Expected Observed Expected Total
1 21 16.379 8 12.621 29
2 14 17.583 18 14.417 32
3 20 20.794 19 18.206 39
4 14 14.370 14 13.630 28
5 12 11.152 11 11.848 23
6 10 13.061 18 14.939 28
7 19 16.875 19 21.125 38
8 16 15.288 20 20.712 36
Step 1
9 8 8.497 13 12.503 21
Classification Tablea
Predicted
K_PAEC
Observed 0 1
Percentage Correct
0 66 68 49.3 K_PAEC
1 56 84 60.0
Step 1
Overall Percentage 54.7
a. The cut value is .500

177
Variables in the Equation
B S.E. Wald df Sig. Exp(B)
F_PAEC -.040 .023 3.073 1 .080 .961 Step 1a
Constant .441 .258 2.936 1 .087 1.555
a. Variable(s) entered on step 1: F_PAEC.

178
F-K IP (12)
Case Processing Summary
Unweighted Casesa N Percent
Included in Analysis 274 98.9
Missing Cases 3 1.1
Selected Cases
Total 277 100.0
Unselected Cases 0 .0
Total 277 100.0
a. If weight is in effect, see classification table for the total number of cases.
Dependent Variable
Encoding
Original Value Internal Value
0 0
1 1
Block 0: Beginning Block
Iteration Historya,b,c
Coefficients Iteration -2 Log likelihood Constant
1 259.780 1.285
2 257.361 1.508
3 257.351 1.524
Step 0
4 257.351 1.524
a. Constant is included in the model.
b. Initial -2 Log Likelihood: 257.351
c. Estimation terminated at iteration number 4 because parameter estimates changed by less than .001.
Classification Tablea,b
Predicted
K_IP
Observed 0 1
Percentage Correct
0 0 49 .0 K_IP
1 0 225 100.0
Step 0
Overall Percentage 82.1
a. Constant is included in the model. b. The cut value is .500

179
Variables in the Equation
B S.E. Wald df Sig. Exp(B)
Step 0 Constant 1.524 .158 93.488 1 .000 4.592
Variables not in the Equation
Score df Sig.
Variables F_IP .250 1 .617 Step 0
Overall Statistics .250 1 .617
Block 1: Method = Enter
Iteration Historya,b,c,d
Coefficients Iteration -2 Log likelihood Constant F_IP
1 259.587 1.352 -.010
2 257.116 1.616 -.016
3 257.105 1.638 -.017
Step 1
4 257.105 1.639 -.017
a. Method: Enter b. Constant is included in the model. c. Initial -2 Log Likelihood: 257.351 d. Estimation terminated at iteration number 4 because parameter estimates changed by less than .001.
Omnibus Tests of Model Coefficients
Chi-square df Sig.
Step .246 1 .620
Block .246 1 .620
Step 1
Model .246 1 .620
Omnibus Tests of Model Coefficients
Chi-square df Sig.
Step .246 1 .620
Block .246 1 .620
Step 1
Model .246 1 .620

180
Model Summary
Step -2 Log likelihood Cox & Snell R
Square Nagelkerke R
Square
1 257.105a .001 .001
a. Estimation terminated at iteration number 4 because parameter estimates changed by less than .001.
Hosmer and Lemeshow Test
Step Chi-square df Sig.
1 6.692 8 .570
Contingency Table for Hosmer and Lemeshow Test
K_IP = 0 K_IP = 1
Observed Expected Observed Expected Total
1 4 6.500 28 25.500 32
2 6 4.432 17 18.568 23
3 7 5.335 22 23.665 29
4 2 2.877 14 13.123 16
5 8 5.673 24 26.327 32
6 6 6.641 32 31.359 38
7 3 4.307 22 20.693 25
8 5 3.736 17 18.264 22
9 7 6.529 32 32.471 39
Step 1
10 1 2.970 17 15.030 18
Classification Tablea
Predicted
K_IP
Observed 0 1
Percentage Correct
0 0 49 .0 K_IP
1 0 225 100.0
Step 1
Overall Percentage 82.1
a. The cut value is .500
Variables in the Equation
B S.E. Wald df Sig. Exp(B)
F_IP -.017 .035 .249 1 .618 .983 Step 1a
Constant 1.639 .281 33.940 1 .000 5.148
a. Variable(s) entered on step 1: F_IP.

181
F-K KB (13)
Case Processing Summary
Unweighted Casesa N Percent
Included in Analysis 274 98.9
Missing Cases 3 1.1
Selected Cases
Total 277 100.0
Unselected Cases 0 .0
Total 277 100.0
a. If weight is in effect, see classification table for the total number of cases.
Dependent Variable
Encoding
Original Value Internal Value
0 0
1 1
Block 0: Beginning Block
Iteration Historya,b,c
Coefficients Iteration -2 Log likelihood Constant
1 291.523 1.109
2 290.558 1.245
3 290.557 1.250
Step 0
4 290.557 1.250
a. Constant is included in the model.
b. Initial -2 Log Likelihood: 290.557
c. Estimation terminated at iteration number 4 because parameter estimates changed by less than .001.
Classification Tablea,b
Predicted
K_KB
Observed 0 1
Percentage Correct
0 0 61 .0 K_KB
1 0 213 100.0
Step 0
Overall Percentage 77.7
a. Constant is included in the model.

182
Classification Tablea,b
Predicted
K_KB
Observed 0 1
Percentage Correct
0 0 61 .0 K_KB
1 0 213 100.0
Step 0
Overall Percentage 77.7
b. The cut value is .500
Variables in the Equation
B S.E. Wald df Sig. Exp(B)
Step 0 Constant 1.250 .145 74.143 1 .000 3.492
Variables not in the Equation
Score df Sig.
Variables F_KB .894 1 .344 Step 0
Overall Statistics .894 1 .344
Block 1: Method = Enter
Iteration Historya,b,c,d
Coefficients Iteration -2 Log likelihood Constant F_KB
1 290.745 .951 .019
2 289.658 1.024 .028
Step 1
3 289.656 1.024 .028
a. Method: Enter b. Constant is included in the model. c. Initial -2 Log Likelihood: 290.557 d. Estimation terminated at iteration number 3 because parameter estimates changed by less than .001.
Omnibus Tests of Model Coefficients
Chi-square df Sig.
Step .901 1 .342
Block .901 1 .342
Step 1
Model .901 1 .342

183
Model Summary
Step -2 Log likelihood Cox & Snell R
Square Nagelkerke R
Square
1 289.656a .003 .005
a. Estimation terminated at iteration number 3 because parameter estimates changed by less than .001.
Hosmer and Lemeshow Test
Step Chi-square df Sig.
1 6.631 8 .577
Contingency Table for Hosmer and Lemeshow Test
K_KB = 0 K_KB = 1
Observed Expected Observed Expected Total
1 4 5.176 16 14.824 20
2 8 8.293 25 24.707 33
3 6 6.071 19 18.929 25
4 8 4.516 11 14.484 19
5 8 6.513 20 21.487 28
6 5 4.552 15 15.448 20
7 2 4.434 18 15.566 20
8 5 6.501 26 24.499 31
9 3 3.386 14 13.614 17
Step 1
10 12 11.558 49 49.442 61
Classification Tablea
Predicted
K_KB
Observed 0 1
Percentage Correct
0 0 61 .0 K_KB
1 0 213 100.0
Step 1
Overall Percentage 77.7
a. The cut value is .500
Variables in the Equation
B S.E. Wald df Sig. Exp(B)
F_KB .028 .030 .891 1 .345 1.029 Step 1a
Constant 1.024 .276 13.792 1 .000 2.784
a. Variable(s) entered on step 1: F_KB.

184
F-K BHL (14)
Case Processing Summary
Unweighted Casesa N Percent
Included in Analysis 274 98.9
Missing Cases 3 1.1
Selected Cases
Total 277 100.0
Unselected Cases 0 .0
Total 277 100.0
a. If weight is in effect, see classification table for the total number of cases.
Dependent Variable
Encoding
Original Value Internal Value
0 0
1 1
Block 0: Beginning Block
Iteration Historya,b,c
Coefficients Iteration -2 Log likelihood Constant
1 346.983 .686
2 346.932 .715
Step 0
3 346.932 .715
a. Constant is included in the model.
b. Initial -2 Log Likelihood: 346.932
c. Estimation terminated at iteration number 3 because parameter estimates changed by less than .001.
Classification Tablea,b
Predicted
K_BHL
Observed 0 1
Percentage Correct
0 0 90 .0 K_BHL
1 0 184 100.0
Step 0
Overall Percentage 67.2
a. Constant is included in the model. b. The cut value is .500

185
Variables in the Equation
B S.E. Wald df Sig. Exp(B)
Step 0 Constant .715 .129 30.908 1 .000 2.044
Variables not in the Equation
Score df Sig.
Variables F_BHL .064 1 .801 Step 0
Overall Statistics .064 1 .801
Block 1: Method = Enter
Iteration Historya,b,c,d
Coefficients Iteration -2 Log likelihood Constant F_BHL
1 346.921 .639 .006
2 346.868 .661 .007
Step 1
3 346.868 .661 .007
a. Method: Enter b. Constant is included in the model. c. Initial -2 Log Likelihood: 346.932 d. Estimation terminated at iteration number 3 because parameter estimates changed by less than .001.
Omnibus Tests of Model Coefficients
Chi-square df Sig.
Step .064 1 .801
Block .064 1 .801
Step 1
Model .064 1 .801
Hosmer and Lemeshow Test
Step Chi-square df Sig.
1 21.013 8 .007
186
Contingency Table for Hosmer and Lemeshow Test
K_BHL = 0 K_BHL = 1
Observed Expected Observed Expected Total
1 9 9.492 19 18.508 28
2 5 12.124 31 23.876 36
3 8 8.671 18 17.329 26
4 8 4.312 5 8.688 13
5 14 9.576 15 19.424 29
6 11 7.232 11 14.768 22
7 11 8.827 16 18.173 27
8 8 8.742 19 18.258 27
9 5 9.307 24 19.693 29
Step 1
10 11 11.718 26 25.282 37
Classification Tablea
Predicted
K_BHL
Observed 0 1
Percentage Correct
0 0 90 .0 K_BHL
1 0 184 100.0
Step 1
Overall Percentage 67.2
a. The cut value is .500
Variables in the Equation
B S.E. Wald df Sig. Exp(B)
F_BHL .007 .026 .064 1 .801 1.007 Step 1a
Constant .661 .249 7.077 1 .008 1.937
a. Variable(s) entered on step 1: F_BHL.

187
F-K TB (15)
Case Processing Summary
Unweighted Casesa N Percent
Included in Analysis 274 98.9
Missing Cases 3 1.1
Selected Cases
Total 277 100.0
Unselected Cases 0 .0
Total 277 100.0
a. If weight is in effect, see classification table for the total number of cases.
Dependent Variable
Encoding
Original Value Internal Value
0 0
1 1
Block 0: Beginning Block
Iteration Historya,b,c
Coefficients Iteration -2 Log likelihood Constant
1 346.983 .686
2 346.932 .715
Step 0
3 346.932 .715
a. Constant is included in the model.
b. Initial -2 Log Likelihood: 346.932
c. Estimation terminated at iteration number 3 because parameter estimates changed by less than .001.
Classification Tablea,b
Predicted
K_BHL
Observed 0 1
Percentage Correct
0 0 90 .0 K_BHL
1 0 184 100.0
Step 0
Overall Percentage 67.2
a. Constant is included in the model. b. The cut value is .500
188
Variables in the Equation
B S.E. Wald df Sig. Exp(B)
Step 0 Constant .715 .129 30.908 1 .000 2.044
Variables not in the Equation
Score df Sig.
Variables F_BHL .064 1 .801 Step 0
Overall Statistics .064 1 .801
Block 1: Method = Enter
Iteration Historya,b,c,d
Coefficients Iteration -2 Log likelihood Constant F_BHL
1 346.921 .639 .006
2 346.868 .661 .007
Step 1
3 346.868 .661 .007
a. Method: Enter b. Constant is included in the model. c. Initial -2 Log Likelihood: 346.932 d. Estimation terminated at iteration number 3 because parameter estimates changed by less than .001.
Omnibus Tests of Model Coefficients
Chi-square df Sig.
Step .064 1 .801
Block .064 1 .801
Step 1
Model .064 1 .801
Hosmer and Lemeshow Test
Step Chi-square df Sig.
1 21.013 8 .007

189
Contingency Table for Hosmer and Lemeshow Test
K_BHL = 0 K_BHL = 1
Observed Expected Observed Expected Total
1 9 9.492 19 18.508 28
2 5 12.124 31 23.876 36
3 8 8.671 18 17.329 26
4 8 4.312 5 8.688 13
5 14 9.576 15 19.424 29
6 11 7.232 11 14.768 22
7 11 8.827 16 18.173 27
8 8 8.742 19 18.258 27
9 5 9.307 24 19.693 29
Step 1
10 11 11.718 26 25.282 37
Classification Tablea
Predicted
K_BHL
Observed 0 1
Percentage Correct
0 0 90 .0 K_BHL
1 0 184 100.0
Step 1
Overall Percentage 67.2
a. The cut value is .500
Variables in the Equation
B S.E. Wald df Sig. Exp(B)
F_BHL .007 .026 .064 1 .801 1.007 Step 1a
Constant .661 .249 7.077 1 .008 1.937
a. Variable(s) entered on step 1: F_BHL.

190
F-K BN (16)
Case Processing Summary
Unweighted Casesa N Percent
Included in Analysis 274 98.9
Missing Cases 3 1.1
Selected Cases
Total 277 100.0
Unselected Cases 0 .0
Total 277 100.0
a. If weight is in effect, see classification table for the total number of cases.
Dependent Variable Encoding
Original Value Internal Value
0 0
1 1
Block 0: Beginning Block
Iteration Historya,b,c
Coefficients Iteration -2 Log likelihood Constant
1 379.830 .015 Step 0
2 379.830 .015
a. Constant is included in the model.
b. Initial -2 Log Likelihood: 379.830
c. Estimation terminated at iteration number 2 because parameter estimates changed by less than .001.
Iteration Historya,b,c
Coefficients Iteration -2 Log likelihood Constant
1 379.830 .015 Step 0
2 379.830 .015
a. Constant is included in the model.
b. Initial -2 Log Likelihood: 379.830
c. Estimation terminated at iteration number 2 because parameter estimates changed by less than .001.

191
Classification Tablea,b
Predicted
K_TB
Observed 0 1
Percentage Correct
0 0 136 .0 K_TB
1 0 138 100.0
Step 0
Overall Percentage 50.4
a. Constant is included in the model. b. The cut value is .500
Variables in the Equation
B S.E. Wald df Sig. Exp(B)
Step 0 Constant .015 .121 .015 1 .904 1.015
Variables not in the Equation
Score df Sig.
Variables F_TB 1.152 1 .283 Step 0
Overall Statistics 1.152 1 .283
Block 1: Method = Enter
Iteration Historya,b,c,d
Coefficients Iteration -2 Log likelihood Constant F_TB
1 378.677 .319 -.033
2 378.677 .320 -.033
Step 1
3 378.677 .320 -.033
a. Method: Enter b. Constant is included in the model. c. Initial -2 Log Likelihood: 379.830 d. Estimation terminated at iteration number 3 because parameter estimates changed by less than .001.
Omnibus Tests of Model Coefficients
Chi-square df Sig.
Step 1.153 1 .283
Block 1.153 1 .283
Step 1
Model 1.153 1 .283
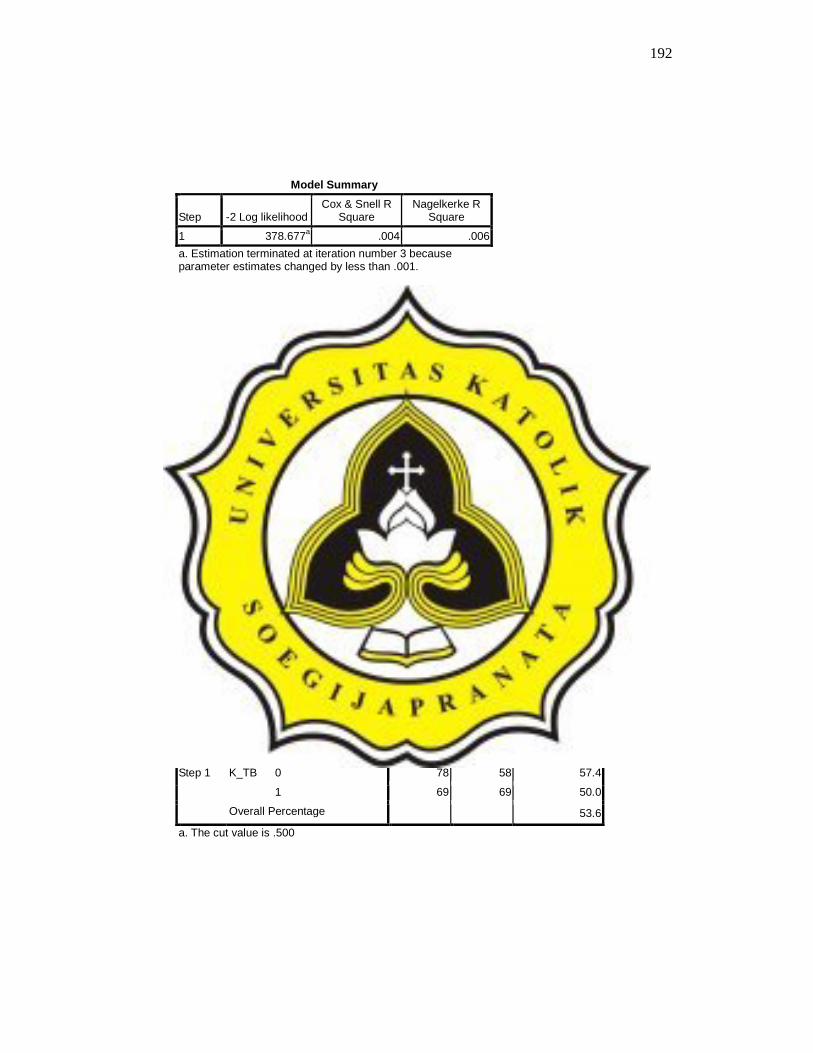
192
Model Summary
Step -2 Log likelihood Cox & Snell R
Square Nagelkerke R
Square
1 378.677a .004 .006
a. Estimation terminated at iteration number 3 because parameter estimates changed by less than .001.
Hosmer and Lemeshow Test
Step Chi-square df Sig.
1 7.267 7 .402
Contingency Table for Hosmer and Lemeshow Test
K_TB = 0 K_TB = 1
Observed Expected Observed Expected Total
1 15 17.486 17 14.514 32
2 16 12.151 7 10.849 23
3 17 16.640 15 15.360 32
4 16 14.327 12 13.673 28
5 14 16.107 18 15.893 32
6 15 16.647 19 17.353 34
7 18 16.602 17 18.398 35
8 9 12.360 18 14.640 27
Step 1
9 16 13.679 15 17.321 31
Classification Tablea
Predicted
K_TB
Observed 0 1
Percentage Correct
0 78 58 57.4 K_TB
1 69 69 50.0
Step 1
Overall Percentage 53.6
a. The cut value is .500

193
Variables in the Equation
B S.E. Wald df Sig. Exp(B)
F_TB -.033 .031 1.148 1 .284 .967 Step 1a
Constant .320 .310 1.067 1 .302 1.377
a. Variable(s) entered on step 1: F_TB.
194
F-K PM (17)
Case Processing Summary
Unweighted Casesa N Percent
Included in Analysis 274 98.9
Missing Cases 3 1.1
Selected Cases
Total 277 100.0
Unselected Cases 0 .0
Total 277 100.0
a. If weight is in effect, see classification table for the total number of cases.
Dependent Variable
Encoding
Original Value Internal Value
0 0
1 1
Block 0: Beginning Block
Iteration Historya,b,c
Coefficients Iteration -2 Log likelihood Constant
1 273.665 1.212
2 271.992 1.395
3 271.988 1.405
Step 0
4 271.988 1.405
a. Constant is included in the model.
b. Initial -2 Log Likelihood: 271.988
c. Estimation terminated at iteration number 4 because parameter estimates changed by less than .001.
Iteration Historya,b,c
Coefficients Iteration -2 Log likelihood Constant
1 273.665 1.212
2 271.992 1.395
3 271.988 1.405
Step 0
4 271.988 1.405
a. Constant is included in the model.
b. Initial -2 Log Likelihood: 271.988
195
Iteration Historya,b,c
Coefficients Iteration -2 Log likelihood Constant
1 273.665 1.212
2 271.992 1.395
3 271.988 1.405
Step 0
4 271.988 1.405
a. Constant is included in the model.
b. Initial -2 Log Likelihood: 271.988
c. Estimation terminated at iteration number 4 because parameter estimates changed by less than .001.
Classification Tablea,b
Predicted
K_PM
Observed 0 1
Percentage Correct
0 0 54 .0 K_PM
1 0 220 100.0
Step 0
Overall Percentage 80.3
a. Constant is included in the model. b. The cut value is .500
Variables in the Equation
B S.E. Wald df Sig. Exp(B)
Step 0 Constant 1.405 .152 85.546 1 .000 4.074
Variables not in the Equation
Score df Sig.
Variables F_PM 2.883 1 .090 Step 0
Overall Statistics 2.883 1 .090

196
Block 1: Method = Enter
Iteration Historya,b,c,d
Coefficients Iteration -2 Log likelihood Constant F_PM
1 271.278 .982 .039
2 268.986 1.045 .063
3 268.965 1.037 .067
Step 1
4 268.965 1.037 .067
a. Method: Enter b. Constant is included in the model. c. Initial -2 Log Likelihood: 271.988 d. Estimation terminated at iteration number 4 because parameter estimates changed by less than .001.
Omnibus Tests of Model Coefficients
Chi-square df Sig.
Step 3.023 1 .082
Block 3.023 1 .082
Step 1
Model 3.023 1 .082
Model Summary
Step -2 Log likelihood Cox & Snell R
Square Nagelkerke R
Square
1 268.965a .011 .017
a. Estimation terminated at iteration number 4 because parameter estimates changed by less than .001.
Model Summary
Step -2 Log likelihood Cox & Snell R
Square Nagelkerke R
Square
1 268.965a .011 .017
a. Estimation terminated at iteration number 4 because parameter estimates changed by less than .001.
Hosmer and Lemeshow Test
Step Chi-square df Sig.
1 12.423 8 .133

197
Contingency Table for Hosmer and Lemeshow Test
K_PM = 0 K_PM = 1
Observed Expected Observed Expected Total
1 16 9.957 24 30.043 40
2 8 10.174 35 32.826 43
3 5 4.494 15 15.506 20
4 3 4.691 19 17.309 22
5 3 5.459 24 21.541 27
6 5 6.592 31 29.408 36
7 3 3.262 16 15.738 19
8 2 3.843 22 20.157 24
9 5 3.601 21 22.399 26
Step 1
10 4 1.927 13 15.073 17
Classification Tablea
Predicted
K_PM
Observed 0 1
Percentage Correct
0 0 54 .0 K_PM
1 0 220 100.0
Step 1
Overall Percentage 80.3
a. The cut value is .500
Variables in the Equation
B S.E. Wald df Sig. Exp(B)
F_PM .067 .040 2.841 1 .092 1.069 Step 1a
Constant 1.037 .255 16.499 1 .000 2.821
a. Variable(s) entered on step 1: F_PM.

198
F-K KPLP (18)
Case Processing Summary
Unweighted Casesa N Percent
Included in Analysis 274 98.9
Missing Cases 3 1.1
Selected Cases
Total 277 100.0
Unselected Cases 0 .0
Total 277 100.0
a. If weight is in effect, see classification table for the total number of cases.
Dependent Variable
Encoding
Original Value Internal Value
0 0
1 1
Block 0: Beginning Block
Iteration Historya,b,c
Coefficients Iteration -2 Log likelihood Constant
Step 0 1 379.845 .000
a. Constant is included in the model.
b. Initial -2 Log Likelihood: 379.845
c. Estimation terminated at iteration number 1 because parameter estimates changed by less than .001.
Classification Tablea,b
Predicted
K_KPLP
Observed 0 1
Percentage Correct
0 0 137 .0 K_KPLP
1 0 137 100.0
Step 0
Overall Percentage 50.0
a. Constant is included in the model. b. The cut value is .500
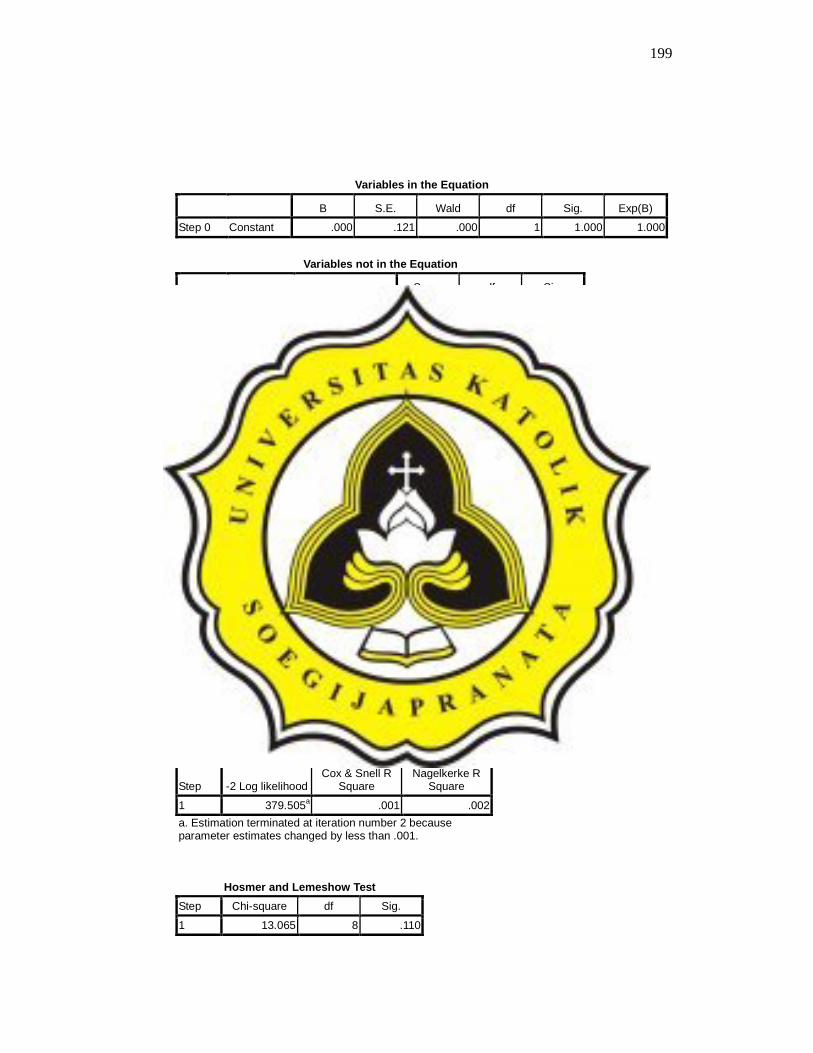
199
Variables in the Equation
B S.E. Wald df Sig. Exp(B)
Step 0 Constant .000 .121 .000 1 1.000 1.000
Variables not in the Equation
Score df Sig.
Variables F_KPLP .339 1 .560 Step 0
Overall Statistics .339 1 .560
Block 1: Method = Enter
Iteration Historya,b,c,d
Coefficients Iteration -2 Log likelihood Constant F_KPLP
1 379.505 .149 -.014 Step 1
2 379.505 .149 -.014
a. Method: Enter b. Constant is included in the model. c. Initial -2 Log Likelihood: 379.845 d. Estimation terminated at iteration number 2 because parameter estimates changed by less than .001.
Omnibus Tests of Model Coefficients
Chi-square df Sig.
Step .340 1 .560
Block .340 1 .560
Step 1
Model .340 1 .560
Model Summary
Step -2 Log likelihood Cox & Snell R
Square Nagelkerke R
Square
1 379.505a .001 .002
a. Estimation terminated at iteration number 2 because parameter estimates changed by less than .001.
Hosmer and Lemeshow Test
Step Chi-square df Sig.
1 13.065 8 .110
200
Contingency Table for Hosmer and Lemeshow Test
K_KPLP = 0 K_KPLP = 1
Observed Expected Observed Expected Total
1 18 15.717 12 14.283 30
2 22 16.541 10 15.459 32
3 15 17.452 19 16.548 34
4 6 11.723 17 11.277 23
5 16 15.146 14 14.854 30
6 10 10.960 12 11.040 22
7 14 16.654 20 17.346 34
8 17 14.987 14 16.013 31
9 8 8.492 10 9.508 18
Step 1
10 11 9.327 9 10.673 20
Classification Tablea
Predicted
K_KPLP
Observed 0 1
Percentage Correct
0 77 60 56.2 K_KPLP
1 72 65 47.4
Step 1
Overall Percentage 51.8
a. The cut value is .500
Variables in the Equation
B S.E. Wald df Sig. Exp(B)
F_KPLP -.014 .025 .339 1 .560 .986 Step 1a
Constant .149 .283 .277 1 .598 1.161
a. Variable(s) entered on step 1: F_KPLP.