Katalog/Cataloge.1102001.7308 KABUPATEN MAROS DALAM …
224
KABUPATEN MAROS DALAM ANGKA 2020 Maros Regency in Figures 2020 Katalog/Cataloge.1102001.7308 BADAN PUSAT STATISTIK KABUPATEN MAROS BPS-STATISTICS MAROS REGENCY
Transcript of Katalog/Cataloge.1102001.7308 KABUPATEN MAROS DALAM …
KABUPATENMAROSDALAMANGKA2020MarosRegencyin Figures2020
Katalog/Cataloge.1102001.7308
BADAN PUSAT STATISTIKKABUPATEN MAROSBPS-STATISTICS MAROS REGENCY


KABUPATEN MAROS DALAM ANGKAMaros Regency in Figures2020
ISSN: 0215-6709No. Publikasi/Publication Number: 73080.2002Katalog /Catalog: 1102001.7308Ukuran Buku/Book Size: 14,8 cm x 21 cmJumlah Halaman/Number of Pages : XXXI+ 196 hal/pagesNaskah/Manuscript:BPS Kabupaten MarosBPS-Statistics of Maros RegencyPenyunting/Editor:BPS Kabupaten MarosBPS-Statistics of Maros RegencyGambar Kover/Cover Design:Seksi Integrasi Pengolahan dan Diseminasi StatistikSection of Integration Processing and Statistics DisseminationIlustrasi Kover/Cover Illustration:Seksi Integrasi Pengolahan dan Diseminasi StatistikSection of Integration Processing and Statistics DisseminationDiterbitkan oleh/Published by:©BPS Kabupaten Maros/BPS-Statistics of Maros RegencyDicetak oleh/Printed by:Media Art Design
Dilarang mengumumkan, mendistribusikan, mengomunikasikan, dan/atau menggandakansebagian atau seluruh isi buku ini untuk tujuan komersil tanpa izin tertulisdari Badan Pusat Statistik.Prohibited to announce, distribute, communicate, and/or copy part or all of this book forcommercial purpose without permission from BPS-Statistics Indonesia.
iiiKabupaten Maros Dalam Angka 2020
PETA WILAYAH KABUPATEN MAROSMAP OF MAROS REGENCY


vKabupaten Maros Dalam Angka 2020
KEPALA BPS KABUPATEN MAROSCHIEF STATISTICIAN OF MAROS REGENCY
MARWANTO, S.Si.,M.S.i

viiKabupaten Maros Dalam Angka 2020
KATA PENGANTAR
Buku Maros Dalam Angka 2020 ini merupakan publikasi statistik tahunan yang diterbitkan oleh Badan Pusat Statistik (BPS) Kabupaten Maros. Berhasilnya penerbitan publikasi ini tepat waktu berkat dukungan dan kerjasama yang baik dari semua pihak, untuk itu kami mengucapkan terima kasih terutama kepada Pemerintah Daerah.
Data yang disajikan dalam buku ini diperoleh dari berbagai sumber, baik yangbersifat data primer, seperti sensus dan survei yang dilakukan oleh Badan Pusat Statistik, maupun data sekunder dari berbagai Instansi, Dinas, Jawatan, di Kabupaten Maros.
Publikasi Kabupaten Maros Dalam Angka 2020 disempurnakan secarabertahap baik tampilan maupun kualitasnya, namun demikian isinya akan sangat bergantung pada ketersediaan data dimasing-masing dinas dan instansi sebagai sumber data. Kepada semua pihak yang telah membantu keberhasilan penerbitan buku ini, terutama Pemerintah Daerah Kabupaten Maros, kami sampaikan ucapan terima kasih.
Dan akhirnya saran dan kritik dari semua pihak sangat kami hargai untukperbaikan publikasi berikutnya. Semoga publikasi ini dapat membantu kebutuhan data tatistik yang diperlukan baik pemerintah, swasta maupun masyarakat.
April 2020Kepala BPS
Kabupaten Maros
Marwanto, S.Si.,M.Si.
Kata Pengantar/Preface ....................................................................................................

viii Maros Regency in Figures 2020
P R E F A C E
Books Maros in Figures 2020 is an annual statistical publication issued bythe Central Statistics Agency (BPS) Maros Regency. The success of these publications ontime thanks to the support and good cooperation from all parties, for that we thankyou especially to local government.
The data presented in this book are derived from various sources, bothprimary data, such as censuses and surveys conducted by the Central Bureau of Statistics, as well as secondary data from various agencies, the Office, Bureau, in Maros Regency.
Publication 2020 Maros in Figures gradually refined both the look and quality, however it will greatly depend on the availability of data enter the respective offices and agencies as a source of data. To all who assisted in the successful publication of this book, especially the Maros regency administration, we say thank you.
And finally, suggestions and criticisms from all parties are very muchappreciated for the improvement of the next publication. Hopefully this publication can assist the needs of statistical data needed, whether government, private and community.
April 2020Chief Statistician of
Maros Regency
Marwanto, S.Si.,M.Si.

ixKabupaten Maros Dalam Angka 2020
Kata Pengantar/Preface .................................................................................................... viiDaftar Isi/Contents .............................................................................................................. ixDaftar Tabel/List of Tables ................................................................................................. xiDaftar Gambar/List of Figures ......................................................................................... xxvDaftar Singkatan/List of Abbreviations ........................................................................ xxixStatistik Kunci/Key Statistics ............................................................................................ xxxi1. Geografi dan Iklim/Geography and Climate ..................................................... 12. Pemerintahan/Government ................................................................................... 113. Penduduk dan Ketenagakerjaan/Population and Employment ................ 274. Sosial dan Kesejahteraan Rakyat/Social and Welfare ................................... 515. Pertanian, Kehutanan, Peternakan, dan Perikanan/Agriculture,
Forestry, Livestock, and Fishery .............................................................................. 976. Industri, Pertambangan, dan Energi/Industry, Mining, and Energy ........ 1357. Pariwisata/Tourism ................................................................................................... 1418. Transportasi dan Komunikasi/Transportation and Communication ........ 1459. Perbankan,Koperasi, dan Harga-harga/Banking,Cooperative, dan
Prices .............................................................................................................................. 15310. Pengeluaran Penduduk/Population Expenditure ........................................... 15911. Perdagangan/Trade .................................................................................................. 16512. Sistem Neraca Regional/System of Regional Accounts ................................. 16913. Perbandingan Antar Kabupaten/Kota/Regency/Municipal Comparison 187
DAFTAR ISI / CONTENTS
HalamanPage
Daftar Isi/Contents ..............................................................................................................

xiKabupaten Maros Dalam Angka 2020
DAFTAR TABEL/LIST OF TABLES
Daftar Tabel/List of Tables .................................................................................................
HalamanPage
1. GEOGRAFI DAN IKLIM/GEOGRAPHY AND CLIMATE 1.1 KEADAAN GEOGRAFI GEOGRAPHY CONDITION1.1.1 Luas Daerah dan Jumlah Pulau Menurut
Kecamatan di Kabupaten Maros, 2019 Total Area and Number of Islands by Subdistrict in Maros Regency,
2019 ......................................................................................................................... 51.1.2 Tinggi Wilayah dan Jarak ke Ibukota Kabupaten/
Kota Menurut Kecamatan di Kabupaten Maros, 2019 Altitude and Distance to the Capital of Regency/Municipality by
Subdistrict in Maros Regency, 2019 ................................................................. 71.2 KEADAAN IKLIM CLIMATE CONDITION1.2.1 Pengamatan Unsur Iklim Menurut Bulan
di Stasiun Klimatologi 1 Maros, 2019 Observation of Climate Elements By Months at Klimatologi 1 Maros
Station, 2019 ......................................................................................................... 8
2. PEMERINTAHAN/GOVERNMENT 2.1 WILAYAH ADMINISTRATIF ADMINISTRATIVE AREA2.1.1 Jumlah Desa1/Kelurahan Menurut Kecamatan
di Kabupaten Maros, 2015–2019 Number of Villages1/Kelurahan by Subdistrict in Maros Regency,
2015–2019 ............................................................................................................. 142.2 DEWAN PERWAKILAN RAKYAT DAERAH REGIONAL HOUSE OF REPRESENTATIVE2.2.1 Jumlah Anggota Dewan Perwakilan Rakyat Daerah Menurut
Partai Politik dan Jenis Kelamin di Kabupaten Maros, 2019
xii Maros Regency in Figures 2020
HalamanPage
Number of Regional House of Representatives’s Members by Political Parties and Sex in Maros Regency 2019.......................................................... 15
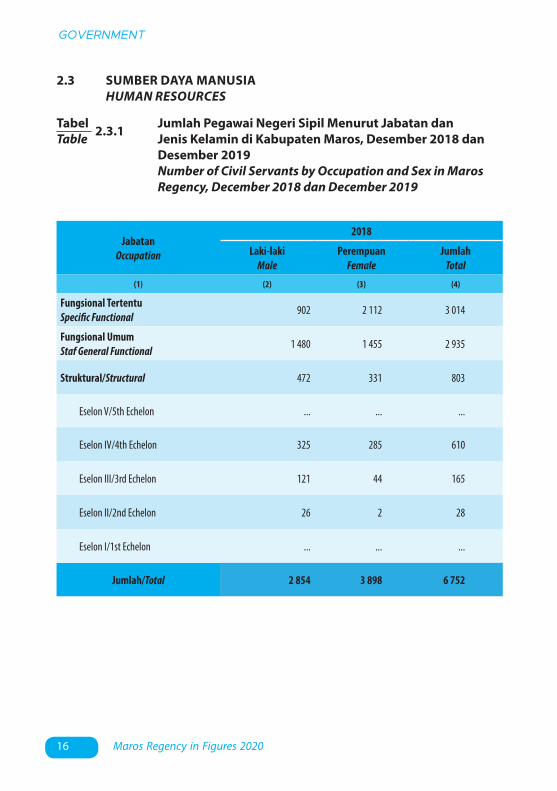
2.3 SUMBER DAYA MANUSIA HUMAN RESOURCES2.3.1 Jumlah Pegawai Negeri Sipil Menurut Jabatan dan Jenis
Kelamin di Kabupaten Maros, Desember 2018 dan Desember 2019 Number of Civil Servants by Occupation and Sex in Maros Regency,
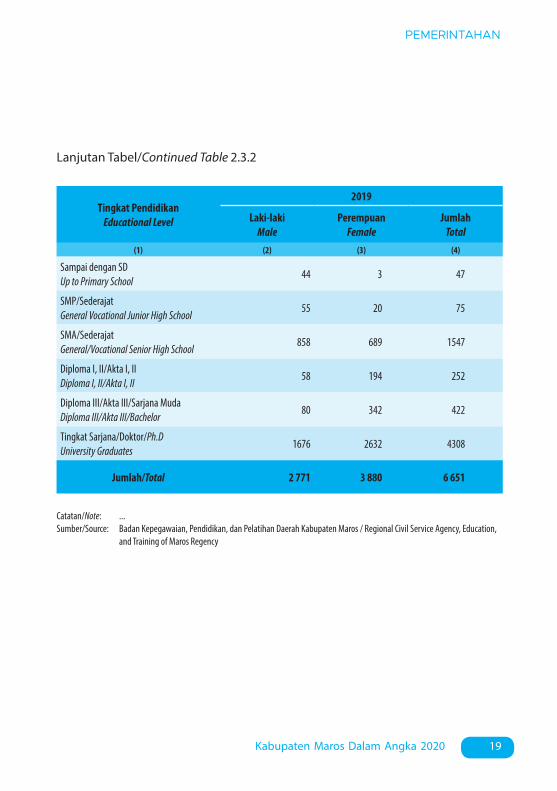
December 2018 dan December 2019 ............................................................. 162.3.2 Jumlah Pegawai Negeri Sipil Menurut Tingkat Pendidikan dan
Jenis Kelamin di Kabupaten Maros, Desember 2018 dan Desember 2019 Number of Civil Servants by Educational Level and Sex in Maros
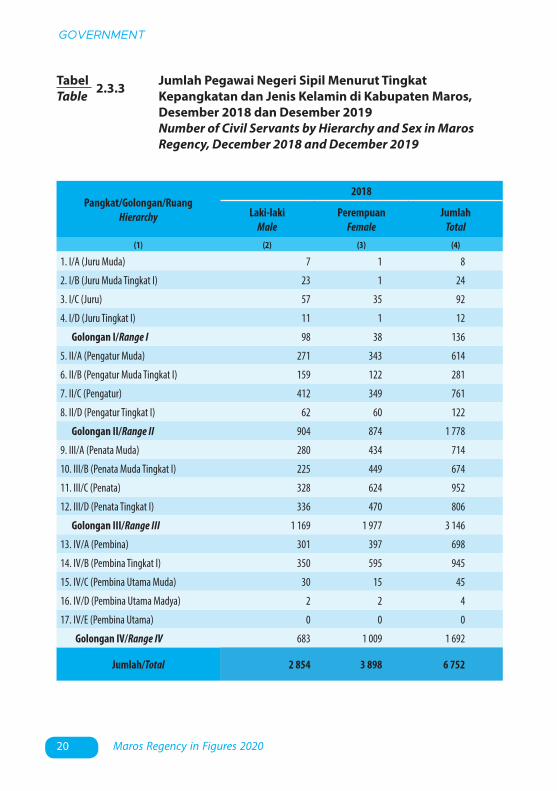
Regency, December 2018 and December 2019 ............................................ 182.3.3 Jumlah Pegawai Negeri Sipil Menurut Tingkat Kepangkatan dan
Jenis Kelamin di Kabupaten Maros, Desember 2018 dan Desember 2019 Number of Civil Servants by Hierarchy and Sex in Maros Regency,
December 2018 and December 2019 .............................................................. 202.4 KEUANGAN PEMERINTAH GOVERNMENT FINANCE2.4.1 Realisasi Pendapatan Pemerintah Kabupaten Maros
Menurut Jenis Pendapatan (ribu rupiah), 2016–2019 Actual Maros Regency Government Revenues by Kind of Revenues
(thousand rupiahs), 2016–2019 ....................................................................... 222.4.2 Realisasi Belanja Pemerintah Kabupaten/Maros
Menurut Jenis Belanja (ribu rupiah), 2016–2019 Actual Maros Regency Government Expenditures by Kind of
Expenditures (thousand rupiahs), 2016–2019 .............................................. 24
xiiiKabupaten Maros Dalam Angka 2020
HalamanPage
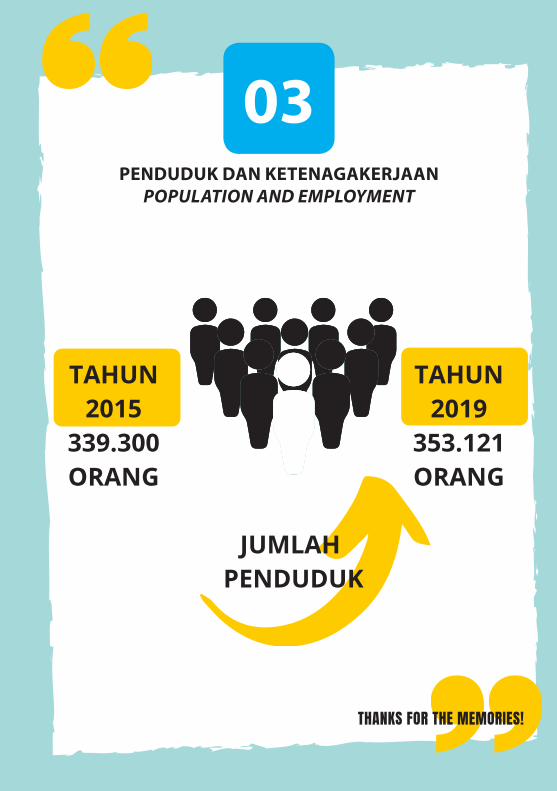
3. PENDUDUK DAN KETENAGAKERJAAN/POPULATION AND EMPLOYMENT
3.1 PENDUDUK POPULATION3.1.1 Penduduk, Laju Pertumbuhan Penduduk per Tahun, Distribusi
Persentase Penduduk, Kepadatan Penduduk, Rasio Jenis Kelamin Penduduk Menurut Kecamatan di Kabupaten Maros, 2019
Population, Annual Population Growth Rate, Percentage Distribution of Population, Population Density, and Population Sex Ratio by Subdistrict in Maros Regency, 2019 ................................................................. 43
3.2 KETENAGAKERJAAN EMPLOYMENT3.2.1 Jumlah Penduduk Berumur 15 Tahun Keatas
Menurut Jenis Kegiatan Selama Seminggu yang Lalu dan Jenis Kelamin di Kabupaten Maros, 2019
Population Aged 15 Years and Over by Type of Activity During The Previous Week and Sex in Maros Regency, 2019........................................... 46
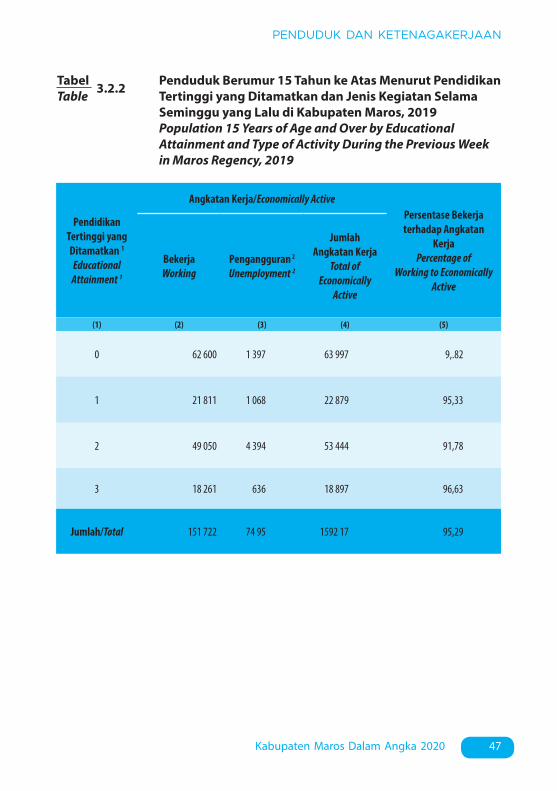
3.2.2 Penduduk Berumur 15 Tahun ke Atas Menurut Pendidikan Tertinggi yang Ditamatkan dan Jenis Kegiatan Selama Seminggu yang Lalu di Kabupaten Maros, 2019
Population 15 Years of Age and Over by Educational Attainment and Type of Activity During the Previous Week in Maros Regency, 2019 ........ 47
3.2.3 Penduduk Berumur 15 Tahun Ke Atas yang Bekerja Selama Seminggu yang Lalu Menurut Status Pekerjaan Utama dan Jenis Kelamin di Kabupaten Maros, 2019
Population 15 Years of Age and Over who Worked During The Previous Week by Main Employment Status and Sex in Maros Regency, 2019 ....................................................................................................... 49
4. SOSIAL DAN KESEJAHTERAAN RAKYAT/SOCIAL AND WELFARE
xiv Maros Regency in Figures 2020
HalamanPage
4.1 PENDIDIKAN EDUCATION4.1.1 Jumlah Sekolah, Guru, dan Murid Taman Kanak-Kanak (TK) di
Bawah Kementerian Pendidikan dan Kebudayaan Menurut Kecamatan di Kabupaten Maros, 2018/2019 dan 2019/2020
Number of Schools, Teachers, and Pupils in Kindergarten Under The Ministry of Education and Culture by Subdistrict in Maros Regency, 2018/2019 dan 2019/2020 ................................................................................. 58
4.1.2 Jumlah Sekolah, Guru, dan Murid Raudatul Athfal (RA) di Bawah Kementerian Agama Menurut Kecamatan di Kabupaten Maros, 2018/2019 dan 2019/2020
Number of Schools, Teachers, and Pupils in Raudatul Athfal (RA) Under The Ministry of Religious Affairs by Subdistrict in Maros Regency, 2018/2019 dan 2019/2020 ............................................................... 61
4.1.3 Jumlah Sekolah, Guru, dan Murid Sekolah Dasar (SD) di Bawah Kementerian Pendidikan dan Kebudayaan Menurut Kecamatan di Kabupaten Maros, 2018/2019 dan 2019/2020
Number of Schools, Teachers, and Pupils in Primary Schools Under The Ministry of Education and Culture by Subdistrict in Maros Regency, 2018/2019 dan 2019/2020 ............................................................... 62
4.1.4 Jumlah Sekolah, Guru, dan Murid Madrasah Ibtidaiyah (MI) di Bawah Kementerian Agama Menurut Kecamatan Menurut Kecamatan di Kabupaten Maros, 2018/2019 dan 2019/2020
Number of Schools, Teachers, and Pupils in Madrasah Ibtidaiyah (MI) Under The Ministry of Religious Affairs by Subdistrict in Maros Regency, 2018/2019 dan 2019/2020 ............................................................... 65
4.1.5 Jumlah Sekolah, Guru, dan Murid Sekolah Menengah Pertama (SMP) di Bawah Kementerian Pendidikan dan Kebudayaan Menurut Kecamatan di Kabupaten Maros, 2018/2019 dan 2019/2020
Number of Schools, Teachers, and Pupils in Junior High Schools Under The Ministry of Education and Culture by Subdistrict in Maros Regency, 2018/2019 dan 2019/2020 ............................................................... 66
4.1.6 Jumlah Sekolah, Guru, dan Murid Madrasah Tsanawiyah
xvKabupaten Maros Dalam Angka 2020
HalamanPage
(MTs) di Bawah Kementerian Agama Menurut Kecamatan di Kabupaten Maros, 2018/2019 dan 2019/2020
Number of Schools, Teachers, and Pupils in Madrasah Tsanawiyah (MTs) Under The Ministry of Religious Affairs by Subdistrict in Maros Regency , 2018/2019 dan 2019/2020 .............................................................. 69
4.1.7 Jumlah Sekolah, Guru, dan Murid Sekolah Menengah Atas (SMA) di Bawah Kementerian Pendidikan dan Kebudayaan Menurut Kecamatan di Kabupaten Maros, 2018/2019 dan 2019/2020
Number of Schools, Teachers, and Pupils in Senior High Schools Under The Ministry of Education and Culture by Subdistrict in Maros Regency, 2018/2019 dan 2019/2020 ............................................................... 70
4.1.8 Jumlah Sekolah, Guru, dan Murid Sekolah Menengah Kejuruan (SMK) di Bawah Kementerian Pendidikan dan Kebudayaan Menurut Kecamatan di Kabupaten Maros, 2018/2019 dan 2019/2020
Number of Schools, Teachers, and Pupils in Vocational High Schools Under The Ministry of Education and Culture by Subdistrict in Maros Regency, 2018/2019 dan 2019/2020 ............................................................... 73
4.1.9 Jumlah Sekolah, Guru, dan Murid Madrasah Aliyah (MA) di Bawah Kementerian Agama Menurut Kecamatan di Kabupaten Maros, 2018/2019 dan 2019/2020
Number of Schools, Teachers, and Pupils in Madrasah Aliyah (MA) Under the Ministry of Religious Affairs by Subdistrict in Maros Regency, 2018/2019 dan 2019/2020 ............................................................... 74
4.1.10 Jumlah Desa1/Kelurahan yang Memiliki Fasilitas Sekolah Menurut Kecamatan dan Tingkat Pendidikan di Kabupaten Maros, 2014– 2019
Number of Villages1/Kelurahan Having Educational Facilities by Subdistrict and Educational Level in Maros Regency, 2014– 2019 .......... 77
4.1.11 Angka Partisipasi Murni (APM) dan Angka Partisipasi Kasar (APK) Menurut Jenjang Pendidikan di Kabupaten Maros, 2018 dan 2019
Net Participation Rates and Gross Participation Rates by Educational Level in Maros Regency, 2018 and 2019 ......................................................... 82
4.1.12 Persentase Penduduk Berumur 15 Tahun ke Atas yang Melek Huruf Menurut Kelompok Umur di Kabupaten Maros, 2018 dan 2019
xvi Maros Regency in Figures 2020
HalamanPage
Percentage of Literate People Aged 15 Years and Over by Age Group in Maros Regency, 2018 and 2019 .................................................................... 83
4.2 KESEHATAN ..................................................................................... HEALTH .............................................................................................4.2.1 Jumlah Desa1/Kelurahan Yang Memiliki Sarana Kesehatan
Menurut Kecamatan di Kabupaten Maros, 2014–2019 Number of Villages1/Kelurahan Having Health Facilities by Subdistrict
in Maros Regency, 2014–2019 ............................................................. 844.3 AGAMA DAN SOSIAL LAINNYA RELIGION AND OTHER SOCIAL AFFAIRS4.3.1 Jumlah Penduduk Menurut Kecamatan dan
Agama yang Dianut di Kabupaten Maros, 2019 Population by Subdistrict and Religion in Maros Regency, 2019 ............. 904.3.2 Jumlah Tempat Peribadatan Menurut
Kecamatan di Kabupaten Maros, 2019 Number of Places of Worship by Subdistrict in Maros Regency, 2019 .... 914.3.3 Jumlah Desa1/Kelurahan yang Mengalami Bencana
Alam2 Menurut Kecamatan di Kabupaten Maros, 2011–2018 Number of Villages1/Kelurahan that Had Natural Disaster2 by
Subdistrict in Maros Regency, 2011–2018 ..................................................... 924.4 KEMISKINAN POVERTY4.4.1 Garis Kemiskinan, Jumlah, dan Persentase
Penduduk Miskin di Kabupaten Maros, 2012–2019 Poverty Line, Number, and Percentage of Poor People in Maros
Regency, 2012–2019 .......................................................................................954.4.2 Indeks Kedalaman Kemiskinan dan Indeks Keparahan
Kemiskinan di Kabupaten Maros, 2012–2019 Poverty Gap Index and Poverty Severity Index in Maros Regency,
2012–2019 ..................................................................................................... .... 965. PERTANIAN, KEHUTANAN, PETERNAKAN, DAN PERIKANAN/
AGRICULTURE, FORESTRY, LIVESTOCK, AND FISHERY 5.1 HORTIKULTURA HORTICULTURE
xviiKabupaten Maros Dalam Angka 2020
HalamanPage
5.1.1 Luas Panen Tanaman Sayuran Menurut Kecamatan dan Jenis Tanaman di Kabupaten Maros (ha), 2018 dan 2019
Harvested Area of Vegetables by Subdistrict and Kind of Plant in Maros Regency (ha), 2018 and 2019 ............................................................... 102
5.1.2 Produksi Tanaman Sayuran Menurut Kecamatan dan Jenis Tanaman di Kabupaten Maros (ton), 2018 dan 2019
Production of Vegetables by Subdistrict and Kind of Plant in Maros Regency (ton), 2018 dan 2019 ........................................................................... 105
5.1.3 Luas Panen Tanaman Sayuran dan Buah-buahan Semusim Menurut Jenis Tanaman di Kabupaten Maros (ha), 2016–2019
Harvested Area of Seasonal Vegetables and Fruits by Kind of Plant in Maros Regency (ha), 2016–2019 ...................................................................... 108
5.1.4 Produksi Tanaman Sayuran dan Buah-buahan Semusim Menurut Jenis Tanaman di Kabupaten Maros (ton), 2016–2019
Production of Seasonal Vegetables and Fruits by Kind of Plant in Maros Regency (ha), 2016–2019 ...................................................................... 109
5.1.5 Luas Panen Tanaman Biofarmaka Menurut Kecamatan dan Jenis Tanaman di Kabupaten Maros (m2),
2018 dan 2019 Harvested Area of Medicinal Plants by Subdistrict and Kind of Plant in
Maros Regency (m2), 2018 and 2019 .............................................................. 1105.1.6 Produksi Tanaman Biofarmaka Menurut Kecamatan dan
Jenis Tanaman di Kabupaten Maros (kg), 2018 and 2019 Production of Medicinal Plants by Subdistrict and Kind of Plant in
Maros Regency (kg), 2018 and 2019 ................................................................ 1125.1.7 Luas Panen Tanaman Biofarmaka Menurut Jenis
Tanaman di Kabupaten Maros (m2), 2016–2019 Harvested Area of Medicinal Plants by Kind of Plant in Maros Regency
(m2), 2016–2019 .................................................................................................... 1145.1.8 Produksi Tanaman Biofarmaka Menurut Jenis
Tanaman di Kabupaten Maros (kg), 2016–2019 Production of Medicinal Plants by Kind of Plant in Maros Regency
(kg), 2016–2019 .................................................................................................... 1155.1.9 Luas Panen Tanaman Hias Menurut Kecamatan dan

xviii Maros Regency in Figures 2020
HalamanPage
Jenis Tanaman di Kabupaten Maros (m2), 2018 and 2019 Harvested Area of Ornamental Plants by Subdistrict and Kind of Plant
in Maros Regency (m2), 2018 and 2019 ........................................................... 1165.1.10 Produksi Tanaman Hias Menurut Kecamatan dan Jenis
Tanaman di Kabupaten Maros (tangkai), 2018 and 2019 Production of Ornamental Plants by Subdistrict and Kind of Plant in
Maros Regency (stalks), 2018 and 2019 .......................................................... 1185.1.11 Luas Panen Tanaman Hias Menurut Jenis
Tanaman di Kabupaten Maros (m2), 2016–2019 Harvested Area of Ornamental Plants by Kind of Plant in Maros
Regency (m2), 2016–2019 ................................................................................... 1205.1.12 Produksi Tanaman Hias Menurut Jenis Tanaman
di Kabupaten Maros (tangkai), 2016–2019 Production of Ornamental Plants by Kind of Plant n Maros Regency
(stalks), 2016–2019 .............................................................................................. 1215.1.13 Produksi Buah-buahan Menurut Kecamatan dan Jenis
Tanaman di Kabupaten Maros (ton), 2018 and 2019 Production of Fruits by Subdistrict and Kind of Plant in Maros
Regency (ton), 2018 and 2019 ........................................................................... 1225.1.14 Produksi Buah–Buahan dan Sayuran Tahunan Menurut
Jenis Tanaman (ton) di Kabupaten Maros, 2016–2019 Production of Annual Fruits and Vegetables by Kind of Plant in Maros
Regency (ton), 2016–2019 ................................................................................. 1255.2 PERKEBUNAN ESTATE CROPS5.2.1 Luas Areal Tanaman Perkebunan Menurut Kecamatan
dan Jenis Tanaman di Kabupaten Maros (ha), 2018 dan 2019 Planted Area of Estate Crops by Subdistrict and Type of Crops in
Maros Regency (ha), 2018 dan 2019 ............................................................... 1265.2.2 Produksi Perkebunan Menurut Kecamatan dan Jenis
Tanaman di Kabupaten Maros (ton), 2018 dan 2019 Production of Estate by Subdistrict and Type of Crops in Maros
Regency (ton), 2018 and 2019 ........................................................................... 130
xixKabupaten Maros Dalam Angka 2020
HalamanPage
6. INDUSTRI, PERTAMBANGAN, DAN ENERGI/INDUSTRY, MINING, AND ENERGY
6.1 Daya Terpasang, Produksi, dan Distribusi Listrik PT. PLN (Persero) pada Cabang/Ranting PLN Menurut Kecamatan di Kabupaten Maros, 2019
Installed Electricity Power, Production, and Distribution of PT. PLN (Persero) at PLN Branch by Subdistrict in Maros Regency, 2019 ............... 138
6.2 Jumlah Pelanggan Listrik Menurut Kecamatan di Kabupaten Maros, 2015–2019
Number of Electricity Customers by Subdistrict in Maros Regency, 2015–2019 ............................................................................................................. 139
6.3 Jumlah Pelanggan dan Air yang Disalurkan Menurut Kecamatan di Kabupaten Maros, 2019
Number of Customers and Distributed Water by Subdistrict in Maros Regency, 2019 ....................................................................................................... 140
7. PARIWISATA/TOURISM 7.1 Jumlah Rumah Makan/Restoran Menurut
Kecamatan di Kabupaten Maros, 2016–2019 Number of Restaurants by Subdistrict in Maros Regency, 2016–2019 ... 144
8. TRANSPORTASI DAN KOMUNIKASI/TRANSPORTATION AND COMMUNICATION
8.1 TRANSPORTASI TRANSPORTATION8.1.1 Panjang Jalan Menurut Tingkat Kewenangan
Pemerintahan di Kabupaten/Kota XXX (km), 2017–2019 Length of Roads by Level of Government Authority in Maros Regency

xx Maros Regency in Figures 2020
HalamanPage
(km), 2017–2019 ................................................................................................... 1488.1.2 Panjang Jalan Menurut Jenis Permukaan Jalan
di Kabupaten/Kota XXX (km), 2017–2019 Length of Roads by Type of Road Surface in Maros Regency (km),
2017–2019 ............................................................................................................. 1498.1.3 Panjang Jalan Menurut Kondisi Jalan
di Kabupaten/Kota XXX (km), 2017–2019 Length of Roads by Condition of Roads in Maros Regency (km),
2017–2019 ............................................................................................................. 1508.2 KOMUNIKASI COMMUNICATION8.2.1 Jumlah Kantor Pos Pembantu Menurut
Kecamatan di Kabupaten/Kota XXX, 2016–2019 Number of Post Offices Subsidiaries by Subdistrict in Maros Regency,
2016–2019 ............................................................................................................. 151
9. PERBANKAN, KOPERASI, DAN HARGA-HARGA/BANKING, COOPERATIVE, AND PRICES
9.1 Jumlah Koperasi Aktif Menurut Kecamatan di Kabupaten Maros, 2016–2019
Number of Active Cooperative by Subdistrict in Maros Regency, 2016–2019 ............................................................................................................. 156
9.2 Jumlah Koperasi Menurut Jenis Koperasi dan Kecamatan di Kabupaten Maros, 2019
Number of Cooperative by Kind of Cooperative and Subdistrict in Maros Regency, 2019 ........................................................................................... 157
10. PENGELUARAN PENDUDUK/POPULATION EXPENDITURE 10.1 Rata-rata Pengeluaran per Kapita Sebulan Menurut Kelompok
Komoditas (rupiah) di Kabupaten Maros, 2018 dan 2019 Monthly Average Expenditure per Capita by Commodity Group
(rupiahs) in Maros Regency, 2018 and 2019 .................................................. 16210.2 Persentase Pengeluaran per Kapita Sebulan Menurut
Kelompok Komoditas di Kabupaten Maros, 2018 dan 2019
xxiKabupaten Maros Dalam Angka 2020
HalamanPage
Percentage of Monthly Expenditure per Capita by Commodity Group in Maros Regency, 2018 and 2019 .................................................................... 163
10.3 Persentase Penduduk Menurut Golongan Pengeluaran Per Kapita Sebulan di Kabupaten Maros, 2018 dan 2019
Percentage of Population by Per Capita Spending Group a Month in Maros Regency, 2018 and 2019 ........................................................................ 164
11. PERDAGANGAN/TRADE 11.1 Jumlah Sarana Perdagangan Menurut
Jenisnya di Kabupaten Maros, 2016–2019 Number of Trading Facilities by Type of Facility in Maros Regency,
2016–2019 ............................................................................................................. 168
12. SISTEM NERACA REGIONAL/SYSTEM OF REGIONAL ACCOUNTS 12.1. Produk Domestik Regional Bruto Atas Dasar Harga Berlaku
Menurut Lapangan Usaha di Kabupaten Maros (miliar rupiah), 2015–2019 Gross Regional Domestic Product at Current Market Prices by Industry
in Maros Regency (billion rupiahs), 2015–2019 ............................................ 17712.2 Produk Domestik Regional Bruto Atas Dasar Harga Konstan 2010
Menurut Lapangan Usaha di Kabupaten Maros (miliar rupiah), 2015–2019 Gross Regional Domestic Product at 2010 Constant Market Prices by
Industry in Maros Regency (billion rupiahs), 2015–2019 ........................... 17912.3 Distribusi Persentase Produk Domestik Regional Bruto Atas Dasar
Harga Berlaku Menurut Lapangan Usaha di Kabupaten Maros, 2015–2019 Percentage Distribution of Gross Regional Domestic Product at
Current Market Prices by Industry in Maros Regency, 2015–2019 ............ 18112.4 Laju Pertumbuhan Produk Domestik Regional Bruto
Atas Dasar Harga Konstan 2010 Menurut Lapangan Usaha di Kabupaten Maros (persen), 2016–2019
Growth Rate of Gross Regional Domestic Product at 2010 Constant Market Prices by Industry in Maros Regency (percent), 2016–2019 ........ 183
xxii Maros Regency in Figures 2020
HalamanPage
12.5 Produk Domestik Regional Bruto Atas Dasar Harga Berlaku Menurut Jenis Pengeluaran di Kabupaten Maros (miliar rupiah), 2015–2019
Gross Regional Domestic Product at Current Market Prices by Type of Expenditure in Maros Regency (billion rupiahs), 2015–2019 .................... 185
12.6 Produk Domestik Regional Bruto Atas Dasar Harga Konstan 2010 Menurut Jenis Pengeluaran di Kabupaten Maros (miliar rupiah), 2015–2019
Gross Regional Domestic Product at 2010 Constant Market Prices by Type of Expenditure in Maros Regency (billion rupiahs), 2015–2019 ...... 186
13. PERBANDINGAN ANTAR KABUPATEN/KOTA/ REGENCY/MUNICIPAL COMPARISON
13.1 Jumlah Penduduk Menurut Kabupaten/Kota di Provinsi Sulawesi Selatan (ribu), 2015–2019
Population by Regency/Municipality in South Sulawesi Province (thousand), 2015–2019....................................................................................... 189
13.2 Laju Pertumbuhan Produk Domestik Regional Bruto Atas Dasar Harga Konstan 2010 Menurut Kabupaten/Kota di Provinsi Sulawesi Selatan (persen), 2015–2019
Rate of Growth of Gross Regional Domestic Products at Constant 2010 Prices by Regency/Municipality in South Sulawesi Province (percent), 2015–2019........................................................................................... 191
13.3 Jumlah Penduduk Miskin Menurut Kabupaten/Kota di Provinsi Sulawesi Selatan (ribu), 2015–2019
Number of Poor Population by Regency/Municipality in South Sulawesi Province (thousand), 2015–2019 .................................................... 193
13.4 Indeks Pembangunan Manusia Menurut Kabupaten/Kota di Provinsi Sulawesi Selatan, 2015–2019
Human Development Index by Regency/Municipality in South Sulawesi Province, 2015–2019 .......................................................................... 195

xxiiiKabupaten Maros Dalam Angka 2020
HalamanPage

xxvKabupaten Maros Dalam Angka 2020
DAFTAR GAMBAR/LIST OF FIGURES
Daftar Gambar/List of Figures .........................................................................................

xxvi Maros Regency in Figures 2020
xxviiKabupaten Maros Dalam Angka 2020
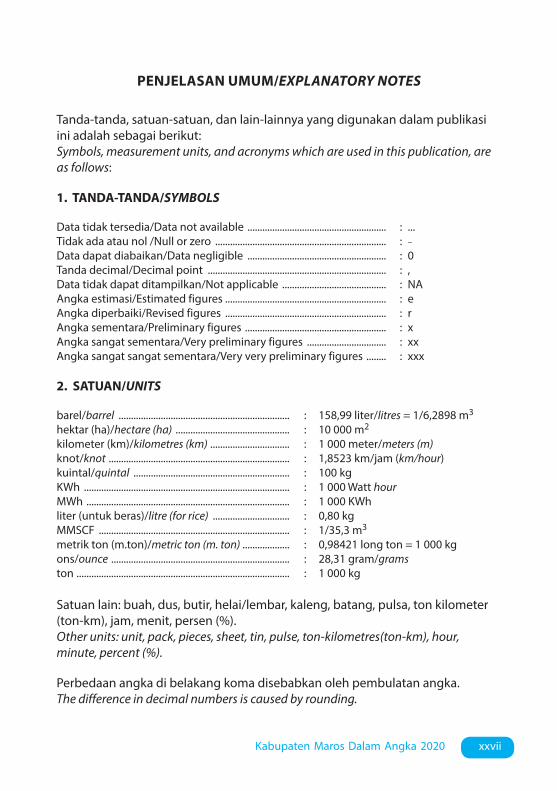
PENJELASAN UMUM/EXPLANATORY NOTES
Tanda-tanda, satuan-satuan, dan lain-lainnya yang digunakan dalam publikasi ini adalah sebagai berikut: Symbols, measurement units, and acronyms which are used in this publication, are as follows:
1. TANDA-TANDA/SYMBOLS
Data tidak tersedia/Data not available ........................................................ : ...Tidak ada atau nol /Null or zero ..................................................................... : –
Data dapat diabaikan/Data negligible ........................................................ : 0Tanda decimal/Decimal point ........................................................................ : ,Data tidak dapat ditampilkan/Not applicable .......................................... : NAAngka estimasi/Estimated figures ................................................................. : eAngka diperbaiki/Revised figures ................................................................. : rAngka sementara/Preliminary figures ......................................................... : xAngka sangat sementara/Very preliminary figures ................................ : xxAngka sangat sangat sementara/Very very preliminary figures ........ : xxx
2. SATUAN/UNITS
barel/barrel ..................................................................... : 158,99 liter/litres = 1/6,2898 m3
hektar (ha)/hectare (ha) .............................................. : 10 000 m2
kilometer (km)/kilometres (km) ................................ : 1 000 meter/meters (m)knot/knot ......................................................................... : 1,8523 km/jam (km/hour)kuintal/quintal ............................................................... : 100 kgKWh ................................................................................... : 1 000 Watt hourMWh .................................................................................. : 1 000 KWhliter (untuk beras)/litre (for rice) ............................... : 0,80 kgMMSCF ............................................................................. : 1/35,3 m3
metrik ton (m.ton)/metric ton (m. ton) ................... : 0,98421 long ton = 1 000 kgons/ounce ........................................................................ : 28,31 gram/gramston ...................................................................................... : 1 000 kg
Satuan lain: buah, dus, butir, helai/lembar, kaleng, batang, pulsa, ton kilometer (ton-km), jam, menit, persen (%). Other units: unit, pack, pieces, sheet, tin, pulse, ton-kilometres(ton-km), hour, minute, percent (%).
Perbedaan angka di belakang koma disebabkan oleh pembulatan angka. The difference in decimal numbers is caused by rounding.

xxixKabupaten Maros Dalam Angka 2020
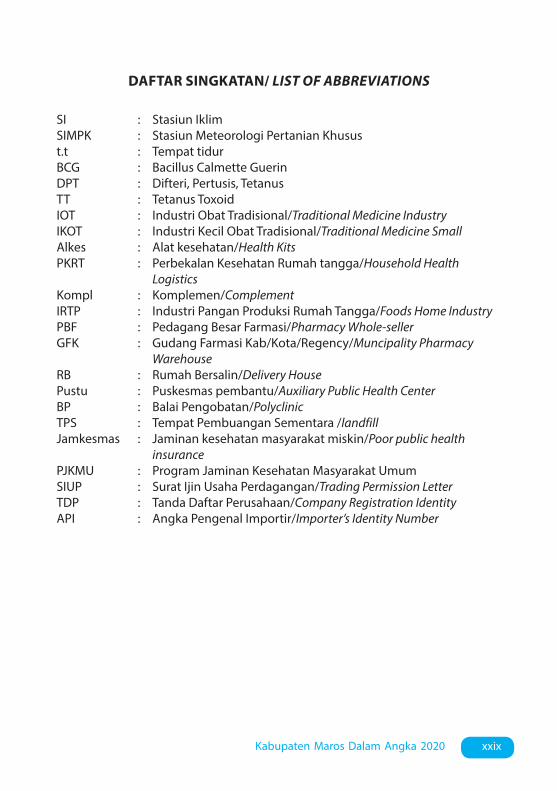
DAFTAR SINGKATAN/ LIST OF ABBREVIATIONS
SI : Stasiun IklimSIMPK : Stasiun Meteorologi Pertanian Khusust.t : Tempat tidurBCG : Bacillus Calmette GuerinDPT : Difteri, Pertusis, TetanusTT : Tetanus ToxoidIOT : Industri Obat Tradisional/Traditional Medicine IndustryIKOT : Industri Kecil Obat Tradisional/Traditional Medicine SmallAlkes : Alat kesehatan/Health KitsPKRT : Perbekalan Kesehatan Rumah tangga/Household Health
LogisticsKompl : Komplemen/ComplementIRTP : Industri Pangan Produksi Rumah Tangga/Foods Home IndustryPBF : Pedagang Besar Farmasi/Pharmacy Whole-sellerGFK : Gudang Farmasi Kab/Kota/Regency/Muncipality Pharmacy
WarehouseRB : Rumah Bersalin/Delivery HousePustu : Puskesmas pembantu/Auxiliary Public Health CenterBP : Balai Pengobatan/PolyclinicTPS : Tempat Pembuangan Sementara /landfillJamkesmas : Jaminan kesehatan masyarakat miskin/Poor public health
insurancePJKMU : Program Jaminan Kesehatan Masyarakat UmumSIUP : Surat Ijin Usaha Perdagangan/Trading Permission LetterTDP : Tanda Daftar Perusahaan/Company Registration IdentityAPI : Angka Pengenal Importir/Importer’s Identity Number
Daftar Singkatan/List of Abbreviations

xxxiKabupaten Maros Dalam Angka 2020
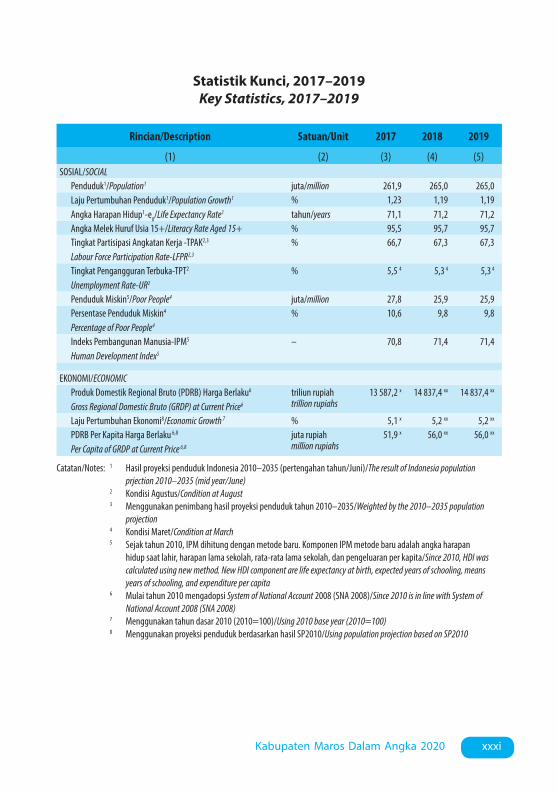
Statistik Kunci, 2017–2019Key Statistics, 2017–2019
Rincian/Description Satuan/Unit 2017 2018 2019
(1) (2) (3) (4) (5)SOSIAL/SOCIAL
Penduduk1/Population1 juta/million 261,9 265,0 265,0Laju Pertumbuhan Penduduk1/Population Growth1 % 1,23 1,19 1,19Angka Harapan Hidup1-e0/Life Expectancy Rate1 tahun/years 71,1 71,2 71,2Angka Melek Huruf Usia 15+/Literacy Rate Aged 15+ % 95,5 95,7 95,7Tingkat Partisipasi Angkatan Kerja -TPAK2,3
Labour Force Participation Rate-LFPR2,3
% 66,7 67,3 67,3
Tingkat Pengangguran Terbuka-TPT2
Unemployment Rate-UR2
% 5,5 4 5,3 4 5,3 4
Penduduk Miskin5/Poor People4 juta/million 27,8 25,9 25,9Persentase Penduduk Miskin4
Percentage of Poor People4
% 10,6 9,8 9,8
Indeks Pembangunan Manusia-IPM5
Human Development Index5
– 70,8 71,4 71,4
EKONOMI/ECONOMICProduk Domestik Regional Bruto (PDRB) Harga Berlaku6
Gross Regional Domestic Bruto (GRDP) at Current Price6
triliun rupiahtrillion rupiahs
13 587,2 x 14 837,4 xx 14 837,4 xx
Laju Pertumbuhan Ekonomi8/Economic Growth 7 % 5,1 x 5,2 xx 5,2 xx
PDRB Per Kapita Harga Berlaku 6,8
Per Capita of GRDP at Current Price 6,8
juta rupiahmillion rupiahs
51,9 x 56,0 xx 56,0 xx
Statistik Kunci/Key Statistics
Catatan/Notes: 1 Hasil proyeksi penduduk Indonesia 2010–2035 (pertengahan tahun/Juni)/The result of Indonesia population prjection 2010–2035 (mid year/June)
2 Kondisi Agustus/Condition at August 3 Menggunakan penimbang hasil proyeksi penduduk tahun 2010–2035/Weighted by the 2010–2035 population
projection 4 Kondisi Maret/Condition at March 5 Sejak tahun 2010, IPM dihitung dengan metode baru. Komponen IPM metode baru adalah angka harapan
hidup saat lahir, harapan lama sekolah, rata-rata lama sekolah, dan pengeluaran per kapita/Since 2010, HDI was calculated using new method. New HDI component are life expectancy at birth, expected years of schooling, means years of schooling, and expenditure per capita
6 Mulai tahun 2010 mengadopsi System of National Account 2008 (SNA 2008)/Since 2010 is in line with System of National Account 2008 (SNA 2008)
7 Menggunakan tahun dasar 2010 (2010=100)/Using 2010 base year (2010=100) 8 Menggunakan proyeksi penduduk berdasarkan hasil SP2010/Using population projection based on SP2010

1. Geografi dan Iklim/Geography and Climate .....................................................1. GEOGRAFI DAN IKLIM/GEOGRAPHY AND CLIMATE
THANKS FOR THE MEMORIES!
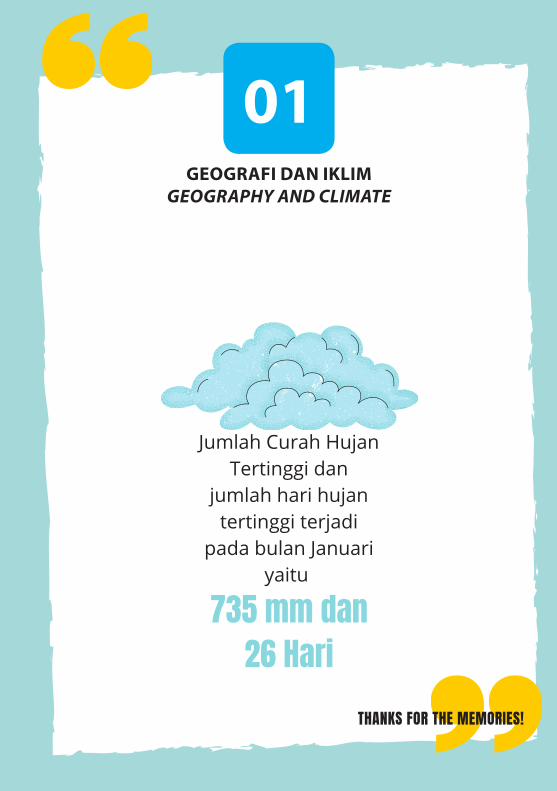
Jumlah Curah HujanTertinggi dan
jumlah hari hujantertinggi terjadi
pada bulan Januariyaitu
735 mm dan26 Hari
GEOGRAFI DAN IKLIMGEOGRAPHY AND CLIMATE
01


3
GEOGRAFI DAN IKLIM
Kabupaten Maros Dalam Angka 2020
PENJELASAN TEKNIS TECHNICAL NOTES
1. Kabupaten Maros terletak di bagian barat Sulawesi Selatan antara 40º45’-50º07’ Lintang Selatan dan 109º205’-129º12’ Bujur Timur yang berbatasan dengan Kabupaten Pangkep sebelah Utara, Kota Makassar dan Kabupaten Gowa sebelah Selatan, Kabupaten Bone disebelah Timur dan Selat Makassar disebelah Barat. Luas wilayah Kabupaten Maros 1.619,12 km² yang secara administrasi pemerintahnya terdiri 14 Kecamatan dan 103 Desa/ Kelurahan.
2. Kecamatan adalah bagian wilayah dari daerah kabupaten/kota yang dipimpin oleh Camat. Kecamatan diatur sesuai dengan ketentuan Pasal 1 angka 24 Undang-Undang Republik Indonesia Nomor 23 Tahun 2014 tentang Pemerintahan Daerah yang menyatakan bahwa “Kecamatan atau yang disebut dengan nama lain adalah bagian wilayah dari Daerah kabupaten/kota yang dipimpin oleh camat”.
3. Iklim adalah kondisi rata-rata cuaca berdasarkan waktu yang panjang untuk suatu lokasi di bumi atau planet lain. Beberapa variabel meteorologis yang biasanya diukur adalah suhu,kelembapan, tekanan atmosfer, angin, dan curah hujan.
4. Suhu menunjukkan derajat panas benda
1. Maros Regency is located in the western part of South Sulawesi between 40º45´-50º 07´ South Latitude and 109º205´-129º 12´ East longitude, which borders northern Pangkep District, Makassar and Gowa south, eastward of Bone and Makassar Strait next to the West. The total area of 1619.12 km Maros regency that the administration of its government into 14 district and 103 Villages/ Kelurahan.
2. Subdistrict is part of the area of the district / city that is headed by the District Head. Subdistricts are regulated in accordance with Article 1 number 24 of the Law of the Republic of Indonesia Number 23 of 2014 concerning Regional Government which states that “Subdistricts or referred to by other names are parts of the regions of regency / city areas led by camats”.
3. Climate is an average weather condition based on a long time for a location on earth or another planet. Some meteorological variables that are usually measured are temperature, humidity, atmospheric pressure, wind, and rainfall.
4. Temperature indicates the degree of heat objects
5. Humidity (or humidity) is the concentration of water vapor in the air.
4
GEOGRAPHY AND CLIMATE
Maros Regency in Figures 2020
5. Kelembapan (atau kelembaban) adalah konsentrasi uap air di udara.
5
GEOGRAFI DAN IKLIM
Kabupaten Maros Dalam Angka 2020
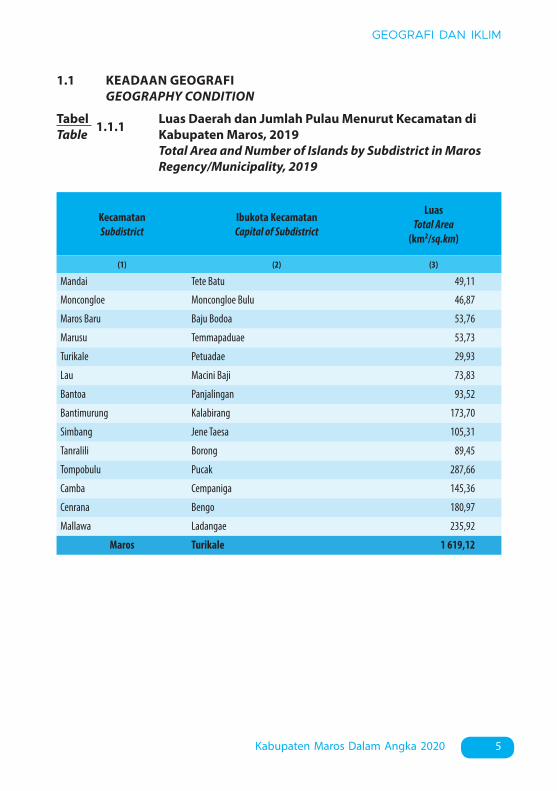
TabelTable 1.1.1 Luas Daerah dan Jumlah Pulau Menurut Kecamatan di
Kabupaten Maros, 2019 Total Area and Number of Islands by Subdistrict in Maros
Regency/Municipality, 2019
1.1 KEADAAN GEOGRAFI GEOGRAPHY CONDITION
KecamatanSubdistrict
Ibukota KecamatanCapital of Subdistrict
Luas Total Area
(km2/sq.km)
(1) (2) (3)
Mandai Tete Batu 49,11
Moncongloe Moncongloe Bulu 46,87
Maros Baru Baju Bodoa 53,76
Marusu Temmapaduae 53,73
Turikale Petuadae 29,93
Lau Macini Baji 73,83
Bantoa Panjalingan 93,52
Bantimurung Kalabirang 173,70
Simbang Jene Taesa 105,31
Tanralili Borong 89,45
Tompobulu Pucak 287,66
Camba Cempaniga 145,36
Cenrana Bengo 180,97
Mallawa Ladangae 235,92
Maros Turikale 1 619,12
6
GEOGRAPHY AND CLIMATE
Maros Regency in Figures 2020
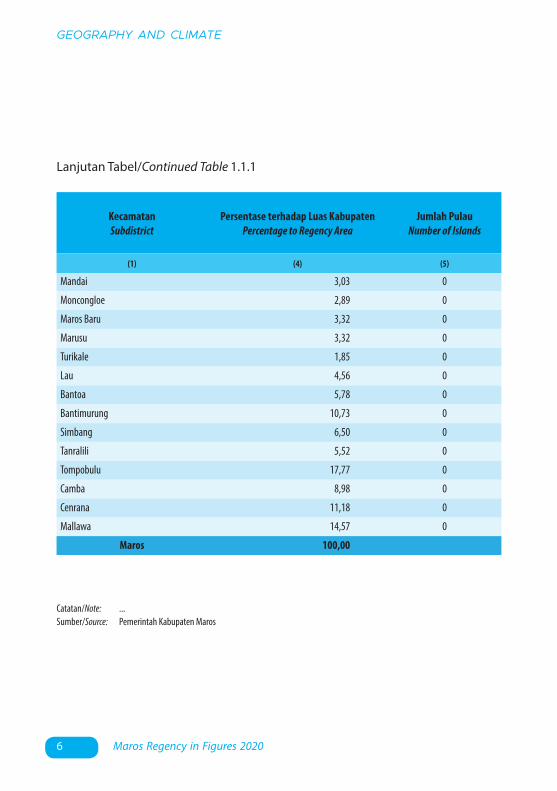
KecamatanSubdistrict
Persentase terhadap Luas Kabupaten Percentage to Regency Area
Jumlah PulauNumber of Islands
(1) (4) (5)
Mandai 3,03 0
Moncongloe 2,89 0
Maros Baru 3,32 0
Marusu 3,32 0
Turikale 1,85 0
Lau 4,56 0
Bantoa 5,78 0
Bantimurung 10,73 0
Simbang 6,50 0
Tanralili 5,52 0
Tompobulu 17,77 0
Camba 8,98 0
Cenrana 11,18 0
Mallawa 14,57 0
Maros 100,00
Catatan/Note: ...Sumber/Source: Pemerintah Kabupaten Maros
Lanjutan Tabel/Continued Table 1.1.1
7
GEOGRAFI DAN IKLIM
Kabupaten Maros Dalam Angka 2020
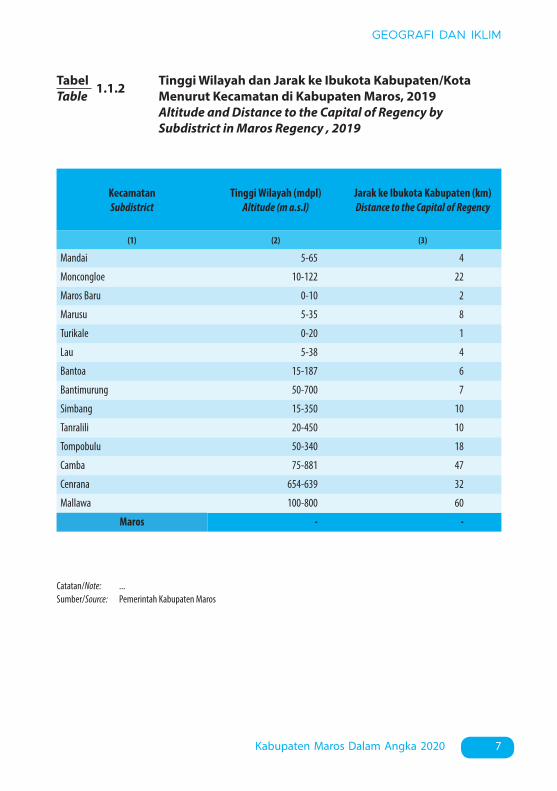
TabelTable 1.1.2 Tinggi Wilayah dan Jarak ke Ibukota Kabupaten/Kota
Menurut Kecamatan di Kabupaten Maros, 2019 Altitude and Distance to the Capital of Regency by
Subdistrict in Maros Regency , 2019
KecamatanSubdistrict
Tinggi Wilayah (mdpl)Altitude (m a.s.l)
Jarak ke Ibukota Kabupaten (km)Distance to the Capital of Regency
(1) (2) (3)
Mandai 5-65 4
Moncongloe 10-122 22
Maros Baru 0-10 2
Marusu 5-35 8
Turikale 0-20 1
Lau 5-38 4
Bantoa 15-187 6
Bantimurung 50-700 7
Simbang 15-350 10
Tanralili 20-450 10
Tompobulu 50-340 18
Camba 75-881 47
Cenrana 654-639 32
Mallawa 100-800 60
Maros - -
Catatan/Note: ...Sumber/Source: Pemerintah Kabupaten Maros
8
GEOGRAPHY AND CLIMATE
Maros Regency in Figures 2020
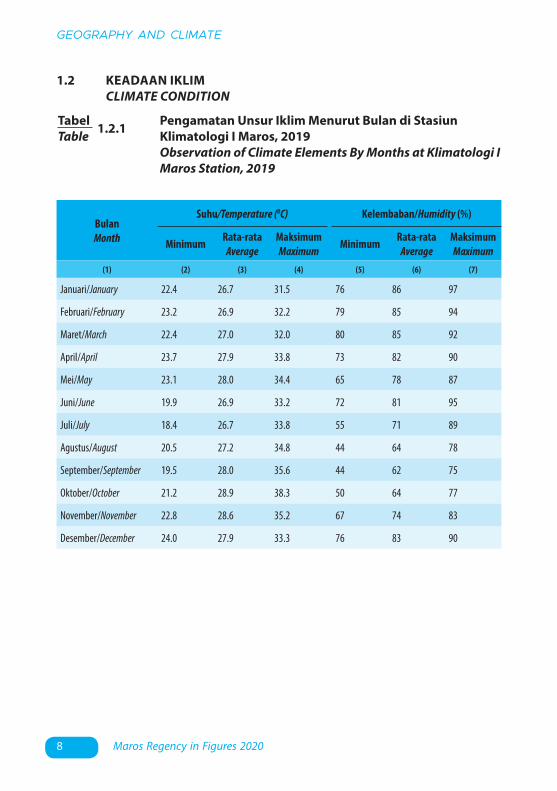
TabelTable 1.2.1 Pengamatan Unsur Iklim Menurut Bulan di Stasiun
Klimatologi I Maros, 2019 Observation of Climate Elements By Months at Klimatologi I
Maros Station, 2019
1.2 KEADAAN IKLIM CLIMATE CONDITION
BulanMonth
Suhu/Temperature (0C) Kelembaban/Humidity (%)
Minimum Rata-rataAverage
MaksimumMaximum Minimum Rata-rata
AverageMaksimumMaximum
(1) (2) (3) (4) (5) (6) (7)
Januari/January 22.4 26.7 31.5 76 86 97
Februari/February 23.2 26.9 32.2 79 85 94
Maret/March 22.4 27.0 32.0 80 85 92
April/April 23.7 27.9 33.8 73 82 90
Mei/May 23.1 28.0 34.4 65 78 87
Juni/June 19.9 26.9 33.2 72 81 95
Juli/July 18.4 26.7 33.8 55 71 89
Agustus/August 20.5 27.2 34.8 44 64 78
September/September 19.5 28.0 35.6 44 62 75
Oktober/October 21.2 28.9 38.3 50 64 77
November/November 22.8 28.6 35.2 67 74 83
Desember/December 24.0 27.9 33.3 76 83 90

9
GEOGRAFI DAN IKLIM
Kabupaten Maros Dalam Angka 2020
BulanMonth
Kecepatan Angin (m/det)Wind Velocity (m/sec)
Tekanan Udara/Atmospheric Pressure (mb)
Minimum Rata-rataAverage
MaksimumMaximum Minimum Rata-rata
AverageMaksimumMaximum
(1) (8) (9) (10) (11) (12) (13)
Januari/January ... 4 ... ... 1011,3 ...
Februari/February ... 6 ... ... 1012,5 ...
Maret/March ... 6 ... ... 1011,4 ...
April/April ... 5 ... ... 1010,3 ...
Mei/May ... 6 ... ... 1011,3 ...
Juni/June ... 5 ... ... 1011,1 ...
Juli/July ... 6 ... ... 1012,1 ...
Agustus/August ... 9 ... ... 1012,1 ...
September/September ... 8 ... ... 1012,9 ...
Oktober/October ... 8 ... ... 1012,8 ...
November/November ... 7 ... ... 1010,9 ...
Desember/December ... 7 ... ... 1010,5 ...
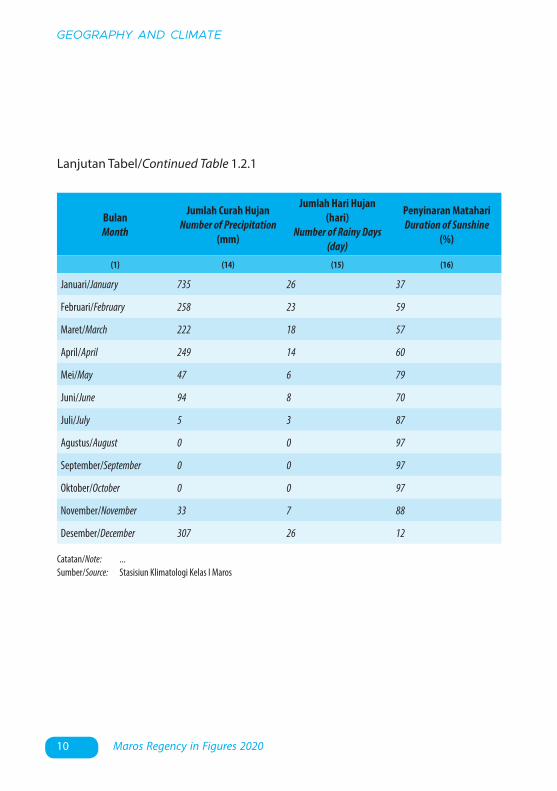
Lanjutan Tabel/Continued Table 1.2.1
10
GEOGRAPHY AND CLIMATE
Maros Regency in Figures 2020
BulanMonth
Jumlah Curah HujanNumber of Precipitation
(mm)
Jumlah Hari Hujan (hari)
Number of Rainy Days(day)
Penyinaran MatahariDuration of Sunshine
(%)
(1) (14) (15) (16)
Januari/January 735 26 37
Februari/February 258 23 59
Maret/March 222 18 57
April/April 249 14 60
Mei/May 47 6 79
Juni/June 94 8 70
Juli/July 5 3 87
Agustus/August 0 0 97
September/September 0 0 97
Oktober/October 0 0 97
November/November 33 7 88
Desember/December 307 26 12
Lanjutan Tabel/Continued Table 1.2.1
Catatan/Note: ...Sumber/Source: Stasisiun Klimatologi Kelas I Maros
2. PEMERINTAHAN/GOVERNMENT 2. Pemerintahan/Government ...................................................................................
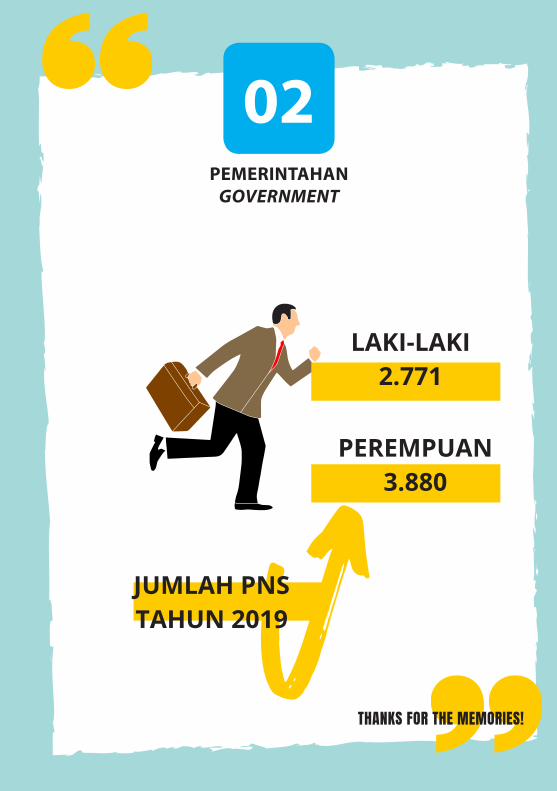
PEREMPUAN3.880
JUMLAH PNSTAHUN 2019
THANKS FOR THE MEMORIES!
LAKI-LAKI2.771
PEMERINTAHANGOVERNMENT
02

PEMERINTAHAN
13Kabupaten Maros Dalam Angka 2020
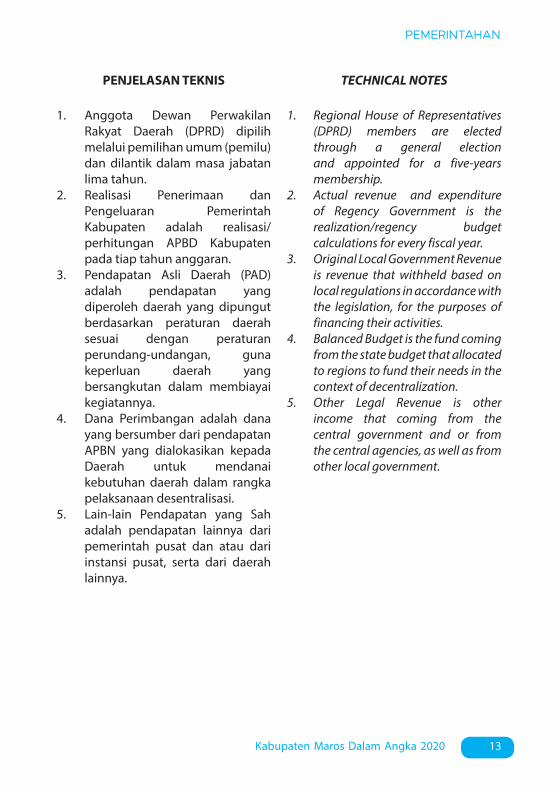
PENJELASAN TEKNIS TECHNICAL NOTES
1. Anggota Dewan Perwakilan Rakyat Daerah (DPRD) dipilih melalui pemilihan umum (pemilu) dan dilantik dalam masa jabatan lima tahun.
2. Realisasi Penerimaan dan Pengeluaran Pemerintah Kabupaten adalah realisasi/perhitungan APBD Kabupaten pada tiap tahun anggaran.
3. Pendapatan Asli Daerah (PAD) adalah pendapatan yang diperoleh daerah yang dipungut berdasarkan peraturan daerah sesuai dengan peraturan perundang-undangan, guna keperluan daerah yang bersangkutan dalam membiayai kegiatannya.
4. Dana Perimbangan adalah dana yang bersumber dari pendapatan APBN yang dialokasikan kepada Daerah untuk mendanai kebutuhan daerah dalam rangka pelaksanaan desentralisasi.
5. Lain-lain Pendapatan yang Sah adalah pendapatan lainnya dari pemerintah pusat dan atau dari instansi pusat, serta dari daerah lainnya.
1. Regional House of Representatives (DPRD) members are elected through a general election and appointed for a five-years membership.
2. Actual revenue and expenditure of Regency Government is the realization/regency budget calculations for every fiscal year.
3. Original Local Government Revenue is revenue that withheld based on local regulations in accordance with the legislation, for the purposes of financing their activities.
4. Balanced Budget is the fund coming from the state budget that allocated to regions to fund their needs in the context of decentralization.
5. Other Legal Revenue is other income that coming from the central government and or from the central agencies, as well as from other local government.

14 Maros Regency in Figures 2020
GOVERNMENT
2.1 WILAYAH ADMINISTRATIF ADMINISTRATIVE AREA
Catatan/Note: 1 Termasuk Unit Permukiman Transmigrasi (UPT)/Include Transmigration Settlement UnitSumber/Source: Peraturan Kepala Badan Pusat Statistik Nomor 1 Tahun 2020 Tanggal 5 Februari 2020 tentang Perubahan Atas
Peraturan Kepala Badan Pusat Statistik Nomor 3 Tahun 2019 tentang Kode dan Nama Wilayah Kerja Statistik Tahun 2019/Chief Statistician Regulation Number 1/2020, February 5 2020, as a revision of Chief Statistician Regulation Number 3 of 2019 on Code and Name of Regional Level of Data Collection.
TabelTable 2.1.1 Jumlah Desa1/Kelurahan Menurut Kecamatan di
Kabupaten Maros, 2015–2019 Number of Villages1/Kelurahan by Subdistrict in Maros
Regency, 2015–2019
KecamatanSubdistrict 2015 2016 2017 2018 2019
(1) (2) (3) (4) (5) (6)
Mandai 6 6 6 6 6
Moncongloe 5 5 5 5 5
Maros Baru 7 7 7 7 7
Marusu 7 7 7 7 7
Turikale 7 7 7 7 7
Lau 6 6 6 6 6
Bantoa 9 9 9 9 9
Bantimurung 8 8 8 8 8
Simbang 6 6 6 6 6
Tanralili 8 8 8 8 8
Tompobulu 8 8 8 8 8
Camba 8 8 8 8 8
Cenrana 7 7 7 7 7
Mallawa 11 11 11 11 11
Maros 103 103 103 103 103

15Kabupaten Maros Dalam Angka 2020
PEMERINTAHAN
2.2 DEWAN PERWAKILAN RAKYAT DAERAH REGIONAL HOUSE OF REPRESENTATIVE
TabelTable 2.2.1 Jumlah Anggota Dewan Perwakilan Rakyat Daerah
Menurut Partai Politik dan Jenis Kelamin di Kabupaten Maros, 2019
Number of Regional House of Representatives’s Members by Political Parties and Sex in Maros Regency, 2019
Catatan/Note: ...Sumber/Source: Skretaris DPRD Kabupaten Maros/ People Representative Secretariat of Maros Regency
Partai PolitikPolitical Parties
Laki-lakiMale
PerempuanFemale
JumlahTotal
(1) (2) (3) (4)
Partai Golkar 5 2 7
Partai Demokrat 1 - 1
Partai Amanat Nasional 4 2 6
Partai Nasdem 4 1 5
Partai Hanura 3 1 4
Partai Gerindra 2 1 3
Partai Kebangkitan Bangsa 3 1 4
Partai Keadilan Sosial 2 - 2
Partai Bulan Bintang - 1 1
Partai Persatuan Pembangunan 2 - 2
Nama Kabupaten/Kota 26 9 35
16 Maros Regency in Figures 2020
GOVERNMENT
TabelTable 2.3.1 Jumlah Pegawai Negeri Sipil Menurut Jabatan dan
Jenis Kelamin di Kabupaten Maros, Desember 2018 dan Desember 2019
Number of Civil Servants by Occupation and Sex in Maros Regency, December 2018 dan December 2019
JabatanOccupation
2018
Laki-lakiMale
PerempuanFemale
JumlahTotal
(1) (2) (3) (4)
Fungsional TertentuSpecific Functional 902 2 112 3 014
Fungsional UmumStaf General Functional 1 480 1 455 2 935
Struktural/Structural 472 331 803
Eselon V/5th Echelon ... ... ...
Eselon IV/4th Echelon 325 285 610
Eselon III/3rd Echelon 121 44 165
Eselon II/2nd Echelon 26 2 28
Eselon I/1st Echelon ... ... ...
Jumlah/Total 2 854 3 898 6 752
2.3 SUMBER DAYA MANUSIA HUMAN RESOURCES

17Kabupaten Maros Dalam Angka 2020
PEMERINTAHAN
Catatan/Note: ...Sumber/Source: Badan Kepegawaian, Pendidikan, dan Pelatihan Daerah Kabupaten Maros / Regional Civil Service Agency, Education,
and Training of Maros Regency
JabatanOccupation
2019
Laki-lakiMale
PerempuanFemale
JumlahTotal
(1) (5) (6) (7)
Fungsional TertentuSpecific Functional 868 2 065 2 933
Fungsional UmumStaf General Functional 1 437 1 484 2 921
Struktural/Structural 466 331 797
Eselon V/5th Echelon ... ... ...
Eselon IV/4th Echelon 325 279 604
Eselon III/3rd Echelon 118 51 169
Eselon II/2nd Echelon 23 1 24
Eselon I/1st Echelon - - -
Jumlah/Total 2 771 3 880 6 651
Lanjutan Tabel/Continued Table 2.3.1

18 Maros Regency in Figures 2020
GOVERNMENT
TabelTable 2.3.2 Jumlah Pegawai Negeri Sipil Menurut Tingkat Pendidikan
dan Jenis Kelamin di Kabupaten Maros, Desember 2018 dan Desember 2019
Number of Civil Servants by Educational Level and Sex in Maros Regency, December 2018 and December 2019
Tingkat PendidikanEducational Level
2018
Laki-lakiMale
PerempuanFemale
JumlahTotal
(1) (2) (3) (4)
Sampai dengan SDUp to Primary School
47 3 50
SMP/Sederajat General Vocational Junior High School
74 36 110
SMA/SederajatGeneral/Vocational Senior High School
894 745 1 639
Diploma I, II/Akta I, IIDiploma I, II/Akta I, II
59 192 251
Diploma III/Akta III/Sarjana MudaDiploma III/Akta III/Bachelor
69 323 392
Tingkat Sarjana/Doktor/Ph.DUniversity Graduates
1 711 2 599 4 310
Jumlah/Total 2 854 3 898 6 752
19Kabupaten Maros Dalam Angka 2020
PEMERINTAHAN
Catatan/Note: ...Sumber/Source: Badan Kepegawaian, Pendidikan, dan Pelatihan Daerah Kabupaten Maros / Regional Civil Service Agency, Education,
and Training of Maros Regency
Tingkat PendidikanEducational Level
2019
Laki-lakiMale
PerempuanFemale
JumlahTotal
(1) (2) (3) (4)
Sampai dengan SDUp to Primary School
44 3 47
SMP/Sederajat General Vocational Junior High School
55 20 75
SMA/SederajatGeneral/Vocational Senior High School
858 689 1547
Diploma I, II/Akta I, IIDiploma I, II/Akta I, II
58 194 252
Diploma III/Akta III/Sarjana MudaDiploma III/Akta III/Bachelor
80 342 422
Tingkat Sarjana/Doktor/Ph.DUniversity Graduates
1676 2632 4308
Jumlah/Total 2 771 3 880 6 651
Lanjutan Tabel/Continued Table 2.3.2
20 Maros Regency in Figures 2020
GOVERNMENT
TabelTable 2.3.3 Jumlah Pegawai Negeri Sipil Menurut Tingkat
Kepangkatan dan Jenis Kelamin di Kabupaten Maros, Desember 2018 dan Desember 2019
Number of Civil Servants by Hierarchy and Sex in Maros Regency, December 2018 and December 2019
Pangkat/Golongan/RuangHierarchy
2018
Laki-lakiMale
PerempuanFemale
JumlahTotal
(1) (2) (3) (4)
1. I/A (Juru Muda) 7 1 8
2. I/B (Juru Muda Tingkat I) 23 1 24
3. I/C (Juru) 57 35 92
4. I/D (Juru Tingkat I) 11 1 12
Golongan I/Range I 98 38 136
5. II/A (Pengatur Muda) 271 343 614
6. II/B (Pengatur Muda Tingkat I) 159 122 281
7. II/C (Pengatur) 412 349 761
8. II/D (Pengatur Tingkat I) 62 60 122
Golongan II/Range II 904 874 1 778
9. III/A (Penata Muda) 280 434 714
10. III/B (Penata Muda Tingkat I) 225 449 674
11. III/C (Penata) 328 624 952
12. III/D (Penata Tingkat I) 336 470 806
Golongan III/Range III 1 169 1 977 3 146
13. IV/A (Pembina) 301 397 698
14. IV/B (Pembina Tingkat I) 350 595 945
15. IV/C (Pembina Utama Muda) 30 15 45
16. IV/D (Pembina Utama Madya) 2 2 4
17. IV/E (Pembina Utama) 0 0 0
Golongan IV/Range IV 683 1 009 1 692
Jumlah/Total 2 854 3 898 6 752

21Kabupaten Maros Dalam Angka 2020
PEMERINTAHAN
Catatan/Note: ...Sumber/Source: .Badan Kepegawaian, Pendidikan, dan Pelatihan Daerah Kabupaten Maros / Regional Civil Service Agency, Education,
and Training of Maros Regency
Pangkat/Golongan/RuangHierarchy
2019
Laki-lakiMale
PerempuanFemale
JumlahTotal
(1) (5) (6) (7)
1. I/A (Juru Muda) 1 - 1
2. I/B (Juru Muda Tingkat I) 29 2 31
3. I/C (Juru) 21 5 26
4. I/D (Juru Tingkat I) 21 9 30
Golongan I/Range I 72 16 88
5. II/A (Pengatur Muda) 74 42 116
6. II/B (Pengatur Muda Tingkat I) 333 362 695
7. II/C (Pengatur) 293 312 605
8. II/D (Pengatur Tingkat I) 136 106 242
Golongan II/Range II 836 822 1658
9. III/A (Penata Muda) 254 365 619
10. III/B (Penata Muda Tingkat I) 305 604 909
11. III/C (Penata) 316 574 890
12. III/D (Penata Tingkat I) 323 495 818
Golongan III/Range III 1 198 2 038 3 236
13. IV/A (Pembina) 293 371 664
14. IV/B (Pembina Tingkat I) 344 621 965
15. IV/C (Pembina Utama Muda) 27 11 38
16. IV/D (Pembina Utama Madya) 1 1 2
17. IV/E (Pembina Utama) - - -
Golongan IV/Range IV 665 1004 1669
Jumlah/Total 2 771 3 880 6 651
Lanjutan Tabel/Continued Table 2.3.3

22 Maros Regency in Figures 2020
GOVERNMENT
2.4 KEUANGAN PEMERINTAH GOVERNMENT FINANCE
TabelTable 2.4.1 Realisasi Pendapatan Pemerintah Kabupaten Maros
Menurut Jenis Pendapatan (ribu rupiah), 2016–2019 Actual Maros Regency Government Revenues by Kind of
Revenues (thousand rupiahs), 2016–2019
Jenis Pendapatan/Kind of Revenues 2016 2017(1) (2) (3)
1. Pendapatan Asli Daerah (PAD)/Regional Revenue 165 023 869 194 999 054
1.1 Pajak Daerah/Regional Tax 70 683 640 102 810 769
1.2 Retribusi Daerah/Regional Retribution 55 681 807 17 844 885
1.3 Hasil Perusahaan Milik Daerah dan Pengelolaan Kekayaan Daerah yang Dipisahkan/Regional-Owned Company Revenue and Separated Management of Regional Wealth
10 314 224 11 528 460
1.4 Lain-lain PAD yang Sah/Other Regional Revenue 28 344 197 62 814 939
2. Dana Perimbangan/Balance Funds 1067 130 874 903 546 699
2.1 Bagi Hasil Pajak/Tax Sharing Revenue 23 149 680 18 428 199
2.2 Bagi Hasil Bukan Pajak/Sumber Daya Alam/Non-Tax Sharing Revenue/Natural Resources
4 400 802 3 564 068
2.3 Dana Alokasi Umum/General Allocation Fund 704 125 166 691 755 951
2.4 Dana Alokasi Khusus/Special Allocation Fund 335 455 226 189 798 481
3. Lain-lain Pendapatan yang Sah/Other Revenue 141 948 375 201 241 721
3.1 Pendapatan Hibah/Grant 23 049 973 61 718 389
3.2 Dana Darurat/Emergency Fund - -
3.3 Dana Bagi Hasil Pajak dari Provinsi dan Pemerintah Daerah Lainnya/Tax Sharing Revenue from Provincial and Other Regional Governments
59 652 859 59 827 621
3.4 Dana Penyesuaian dan Otonomi Daerah/Regional Adjustment and Autonomy Fund
6 568 247 7 500 000
3.5 Bantuan Keuangan dari Provinsi atau Pemerintah Daerah Lainnya/Financial Assistance from Provincial or Other Regional Governments
- 5 121 898
3.6 Lainnya/Others 52 677 296 -
Jumlah/Total 1 374 103 118 1 299 787 474

23Kabupaten Maros Dalam Angka 2020
PEMERINTAHAN
Catatan/Note: ...Sumber/Source: Survei Statistik Keuangan Daerah/Financial Statistics of Provincial Government Survey
Lanjutan Tabel/Continued Table 2.4.1
Jenis Pendapatan/Kind of Revenues 2018 2019(1) (4) (5)
1. Pendapatan Asli Daerah (PAD)/Regional Revenue 219 844 780 203 706 048
1.1 Pajak Daerah/Regional Tax 117 385 116 151 995 623
1.2 Retribusi Daerah/Regional Retribution 21 050 164 21 916 667
1.3 Hasil Perusahaan Milik Daerah dan Pengelolaan Kekayaan Daerah yang Dipisahkan/Regional-Owned Company Revenue and Separated Management of Regional Wealth
11 522 540 13 257 063
1.4 Lain-lain PAD yang Sah/Other Regional Revenue 69 886 960 16 536 695
2. Dana Perimbangan/Balance Funds 988 704 969 966 759 310
2.1 Bagi Hasil Pajak/Tax Sharing Revenue 20 964 916 17 143 656
2.2 Bagi Hasil Bukan Pajak/Sumber Daya Alam/Non-Tax Sharing Revenue/Natural Resources
4 435 814 4 896 863
2.3 Dana Alokasi Umum/General Allocation Fund 697 947 111 733 366 187
2.4 Dana Alokasi Khusus/Special Allocation Fund 265 357 128 211 352 684
3. Lain-lain Pendapatan yang Sah/Other Revenue 212 179 943 170 532 308
3.1 Pendapatan Hibah/Grant 43 302 277 -
3.2 Dana Darurat/Emergency Fund - ...
3.3 Dana Bagi Hasil Pajak dari Provinsi dan Pemerintah Daerah Lainnya/Tax Sharing Revenue from Provincial and Other Regional Governments
52 429 397 53 736 108
3.4 Dana Penyesuaian dan Otonomi Daerah/Regional Adjustment and Autonomy Fund
109 833 395 109 490 811
3.5 Bantuan Keuangan dari Provinsi atau Pemerintah Daerah Lainnya/Financial Assistance from Provincial or Other Regional Governments
6 614 874 7 305 389
3.6 Lainnya/Others - ...
Jumlah/Total 1 420 729 692 1 340 997 745

24 Maros Regency in Figures 2020
GOVERNMENT
TabelTable 2.4.2 Realisasi Belanja Pemerintah Kabupaten Maros Menurut
Jenis Belanja (ribu rupiah), 2016–2019 Actual Maros Regency Government Expenditures by Kind of
Expenditures (thousand rupiahs), 2016–2019
Jenis PendapatanKind of Revenues 2016 2017
(1) (2) (3)
1. Belanja Tidak Langsung/Indirect Expenditures 702 073 678 650 203 907
1.1 Belanja Pegawai/Personnel Expenditures 588 796 480 520 313 858
1.2 Belanja Bunga/Interest Expenditures - -
1.3 Belanja Subsidi/Subsidies Expenditures - -
1.4 Belanja Hibah/Grant Expenditures 7 847 034 7 161 000
1.5 Belanja Bantuan Sosial/Social Aid Expenditures - 6 570 000
1.6 Belanja Bagi Hasil/Sharing Fund Expenditure - -
1.7 Belanja Bantuan Keuangan/Financial Aids Expenditures
104 765 042 115 965 050
1.8 Belanja Tidak Terduga/Unpredicted Expenditures 665 122 203 000
2. Belanja Langsung/Direct Expenditures 637 139 148 624 945 511
2.1 Belanja Pegawai/Personnel Expenditures 17 392 280 17 946 654
2.2 Belanja Barang dan Jasa/Goods and Services Expenditures
197 306 616 247 826 482
2.3 Belanja Modal/Capital Expenditure 422 440 251 359 172 376
Jumlah/Total 1 339 212 825 1 275 619 842

25Kabupaten Maros Dalam Angka 2020
PEMERINTAHAN
Catatan/Note: ...Sumber/Source: Survei Statistik Keuangan Daerah/Financial Statistics of Provincial Government Survey
Lanjutan Tabel/Continued Table 2.4.2
Jenis PendapatanKind of Revenues 2018 2019
(1) (4) (5)
1. Belanja Tidak Langsung/Indirect Expenditures 665 249 462 745 520 281
1.1 Belanja Pegawai/Personnel Expenditures 526 210 829 570 663 604
1.2 Belanja Bunga/Interest Expenditures - ...
1.3 Belanja Subsidi/Subsidies Expenditures - ...
1.4 Belanja Hibah/Grant Expenditures 9 571 560 8 081 119
1.5 Belanja Bantuan Sosial/Social Aid Expenditures 2 040 000 2 467 500
1.6 Belanja Bagi Hasil/Sharing Fund Expenditure - ...
1.7 Belanja Bantuan Keuangan/Financial Aids Expenditures
126 718 623 163 685 858
1.8 Belanja Tidak Terduga/Unpredicted Expenditures 708 450 622 200
2. Belanja Langsung/Direct Expenditures 715 018 274 551 124 785
2.1 Belanja Pegawai/Personnel Expenditures 28 294 963 6 974 900
2.2 Belanja Barang dan Jasa/Goods and Services Expenditures
274 910 616 192 768 154
2.3 Belanja Modal/Capital Expenditure 411 812 694 351 381 730
Jumlah/Total 1 380 267 736 1 296 645 066

3. Penduduk dan Ketenagakerjaan/Population and Employment ................3. PENDUDUK DAN KETENAGAKERJAAN/POPULATION AND
EMPLOYMENT
THANKS FOR THE MEMORIES!
TAHUN2015
339.300ORANG
TAHUN2019
353.121ORANG
JUMLAH PENDUDUK
PENDUDUK DAN KETENAGAKERJAANPOPULATION AND EMPLOYMENT
03

29Kabupaten Maros Dalam Angka 2020
PENDUDUK DAN KETENAGAKERJAAN
PENJELASAN TEKNIS TECHNICAL NOTES
1. Sumber utama data kependudukan adalah sensus penduduk yang dilaksanakan setiap sepuluh tahun sekali. Sensus penduduk telah dilaksanakan sebanyak enam kali sejak Indonesia merdeka, yaitu tahun 1961, 1971, 1980, 1990, 2000, dan 2010.
2. Di dalam sensus penduduk, pencacahan dilakukan terhadap seluruh penduduk yang berdomisili di wilayah teritorial Indonesia termasuk warga negara asing kecuali anggota korps diplomatik negara sahabat beserta keluarganya. Metode pengumpulan data dalam sensus dilakukan dengan wawancara antara petugas sensus dengan responden dan juga melalui e-census. Pencatatan penduduk menggunakan konsep usual residence, yaitu konsep di mana penduduk biasa bertempat tinggal. Bagi penduduk yang bertempat tinggal tetap dicacah di mana mereka biasa tinggal, sedangkan untuk penduduk yang tidak bertempat tinggal tetap dicacah di tempat di mana mereka ditemukan petugas sensus pada malam ‘Hari Sensus’. Termasuk penduduk yang tidak bertempat tinggal tetap adalah tuna wisma, awak kapal berbendera Indonesia, penghuni perahu/rumah apung, masyarakat terpencil/terasing,
1. The main source of demographic data is population census, which is conducted every ten years. Population Census has been conducted six times since Indonesia’s independence: 1961, 1971, 1980, 1990, 2000, and 2010
2. The population census enumerates all residents who domicile in the entire territory of Indonesia including foreign citizens except the diplomatic corps members and their families. The method of data collection in a population census involves interviewing respondents and conducting e-census. Enumeration of the population uses the concept of “usual residence”, which is the concept of “places where people usually live”. De jure was applied to the permanent residents, while de facto was applied to non-permanent residents. The permanent residents were enumerated in place where they normally live, the non-permanent residents were enumerated where they were found by the enumerators, on the night of ‘Census Date’. The non permanent residents include homeless people, ship crew, boat people, remote area community, and internally displaced persons. Those who had permanent residence and had been travelling away from their home for six months or more were not enumerated in their permanent
30 Maros Regency in Figures 2020
POPULATION AND EMPLOYMENT
dan pengungsi. Bagi mereka yang mempunyai tempat tinggal tetap dan sedang bepergian ke luar wilayah lebih dari enam bulan, tidak dicacah di tempat tinggalnya, tetapi dicacah di tempat tujuannya. Untuk tahun yang tidak dilaksanakan sensus penduduk, data kependudukan diperoleh dari hasil proyeksi penduduk. Proyeksi penduduk merupakan suatu perhitungan ilmiah yang didasarkan pada asumsi dari komponen-komponen perubahan penduduk, yaitu kelahiran, kematian, dan migrasi. Proyeksi penduduk Indonesia 2010–2035 menggunakan data dasar penduduk hasil SP2010.
3. Penduduk Indonesia adalah semua orang yang berdomisili di wilayah teritorial Indonesia selama 6 bulan atau lebih dan atau mereka yang berdomisili kurang dari 6 bulan tetapi bertujuan menetap.
4. Laju pertumbuhan penduduk adalah angka yang menunjukkan persentase pertambahan penduduk dalam jangka waktu tertentu.
5. Kepadatan penduduk adalah rasio banyaknya penduduk per kilometer persegi.
6. Rasio jenis kelamin adalah perbandingan antara penduduk laki-laki dan penduduk perempuan pada suatu wilayah dan waktu tertentu. Biasanya
place, but in the place where they were during the census. For the periods where the population census is not conducted, population projection is done to estimate population during those years. The population projection is an estimate based on the demographic components, such as birth, death, and migration. Indonesia’s 2010–2035 population projection used the 2010 Population Census as the base population.
3. The population of Indonesia are all residents of the entire territory of Indonesia who have stayed for six months or longer, and those who intended to stay more than six months even though their length of stay is less than six months.
4. The growth rate of population is the number that show percentage of population growth within a specified period.
5. Population density is ratio of population per square kilometer.
6. Sex ratio is the ratio of males population to females population in a given area and time, usually expressed as the number of males for every 100 females.
7. Population distribution is the pattern of population distribution in an area, either by geographic boundaries or by government administrative boundaries.
8. Population compotition isthe pattern of population distribution by its characteristics, example: population by age group,

31Kabupaten Maros Dalam Angka 2020
PENDUDUK DAN KETENAGAKERJAAN
dinyatakan dengan banyaknya penduduk laki-laki untuk 100 penduduk perempuan.
7. Distribusi penduduk adalah pola persebaran penduduk di suatu wilayah, baik berdasarkan batas-batas geografis maupun berdasarkan batas-batas administrasi pemerintahan.
8. Komposisi penduduk adalah pola persebaran penduduk menurut karakteristiknya, contoh: penduduk menurut kelompok umur, penduduk menurut jenis kelamin
9. Rumah tangga adalah seseorang atau sekelompok orang yang mendiami sebagian atau seluruh bangunan fisik/sensus dan biasanya tinggal bersama serta pengelolaan makan dari satu dapur. Yang dimaksud makan dari satu dapur adalah jika pengurusan kebutuhan sehari-harinya dikelola bersama-sama menjadi satu.
10. Anggota rumah tangga adalah semua orang yang biasanya bertempat tinggal di suatu rumah tangga, baik yang berada di rumah pada waktu pencacahan maupun yang sementara tidak ada.
11. Rata-rata anggota rumah tangga adalah angka yang menunjukkan rata-rata jumlah anggota rumah tangga per rumah tangga.
12. Penduduk usia kerja adalah penduduk yang berumur 15 tahun ke atas.
population by sex9. Household is an individual or group
of people living in a physical/census building unit or part of it and usually commit on a common provision for food and other essentials of living. Common provision for food means one organising daily needs for all of household members.
10. Household member are those who usually lives in a household regardless of their location at the time of enumeration.
11. Average household size is the average number of household members per household.
12. Working age population is persons of 15 years and over.
13. Labor force or economically active are persons of 15 years and over, who in the previous week were working, temporarily absent from work but having jobs, and unemployment.
14. Working is economic activity conducted by a person and intended to earn income by doing work or helping to do work at least one hour continuously during the reference week (including unpaid family worker/s for any economic activity).
15. Total working hours is the total hours spent by an employee to perform all jobs (excluding the time used for other activities which are not classified as work).
16. Industry is field of a person’s activity or establishment. The classification of industries follows the Indonesia
32 Maros Regency in Figures 2020
POPULATION AND EMPLOYMENT
13. Angkatan kerja adalah penduduk usia kerja (15 tahun ke atas) yang bekerja, punya pekerjaan namun sementara tidak bekerja, dan pengangguran.
14. Bekerja adalah kegiatan ekonomi yang dilakukan oleh seseorang dengan maksud memperoleh atau membantu memperoleh pendapatan atau keuntungan dan lamanya bekerja paling sedikit 1 jam secara terus menerus dalam seminggu yang lalu (termasuk pekerja keluarga tanpa upah yang membantu dalam suatu usaha/kegiatan ekonomi).
15. Jumlah jam kerja seluruhnya adalah jumlah jam kerja yang digunakan untuk bekerja (tidak termasuk jam kerja istirahat resmi dan jam kerja yang digunakan untuk hal-hal di luar pekerjaan).
16. Lapangan usaha adalah bidang kegiatan dari pekerjaan/tempat bekerja di mana seseorang bekerja. Klasifikasi lapangan usaha mengikuti Klasifikasi Baku Lapangan Usaha Indonesia (KBLI) dalam 1 digit.
17. Status pekerjaan adalah kedudukan seseorang dalam unit usaha/kegiatan dalam melakukan pekerjaan.
18. Berusaha sendiri tanpa dibantu orang lain adalah bekerja atau berusaha dengan menanggung risiko secara ekonomis, yaitu dengan tidak kembalinya ongkos produksi yang telah dikeluarkan dalam rangka usahanya tersebut,
Standard Industrial Classification (KBLI) in one digit.
17. Employment status is the status of a person at his place of work or establishment where he was employed.
18. Own-account worker is a person who works at his own risk without assisted by paid per mount worker or unpaid worker include technical job or skill job.
19. Employer assisted by temporary workers/unpaid worker is a person who works at his own risk and assisted by temporary worker/unpaid worker.
20. Employer assisted by permanent workers/paid workers is a person who does his business at her/his own risk at least one assisted by paid permanent worker.
21. Employee is a person who work permanently for other people or institution/office/ company and gains some money/cash or goods as wage/salary. Labor who have no permanent employer is not categorized as a laborer/ worker/employee but casual worker. A laborers in general is considered to have a permanent employer if he has the same employer during the past month, particularly for building construction sector is 3 months. If the employer is an institution, more than 1 (one) employer is allowed.
22. Casual employee is a person who does not work permanently for other people/employer/ institution(more
33Kabupaten Maros Dalam Angka 2020
PENDUDUK DAN KETENAGAKERJAAN
serta tidak menggunakan pekerja dibayar maupun pekerja tak dibayar, termasuk yang sifat pekerjaannya memerlukan teknologi atau keahlian khusus.
19. Berusaha dibantu buruh tidak tetap/buruh tidak dibayar adalah bekerja atau berusaha atas risiko sendiri, dan menggunakan buruh/pekerja tak dibayar dan atau buruh/pekerja tidak tetap.
20. Berusaha dibantu buruh tetap/buruh dibayar adalah berusaha atas risiko sendiri dan mempekerjakan paling sedikit satu orang buruh/pekerja tetap yang dibayar.
21. B u r u h / k a r y a w a n / p e g a w a i adalah seseorang yang bekerja pada orang lain atau instansi/kantor/perusahaan secara tetap dengan menerima upah/gaji baik berupa uang maupun barang. Buruh yang tidak mempunyai majikan tetap, tidak digolongkan sebagai buruh/karyawan, tetapi sebagai pekerja bebas. Seseorang dianggap memiliki majikan tetap jika memiliki 1 (satu) majikan (orang/rumah tangga) yang sama dalam sebulan terakhir, khusus pada sektor bangunan batasannya tiga bulan. Apabila majikannya instansi/lembaga, boleh lebih dari satu.
22. Pekerja bebas adalah seseorang yang bekerja pada orang lain/majikan/institusi yang tidak tetap (lebih dari 1 majikan dalam sebulan terakhir) di usaha
than 1 employer during the last 1 month) in agricultural sector, either home industry or not home industry, or in non-agricultural sector based on remuneration paid with money or goods, and based on daily or contact payment system.
23. Unpaid worker is a person who intended to work without pa,y either with money or good, in an establishment run by other members of the family, relative or neighbour.
42 Maros Regency in Figures 2020
POPULATION AND EMPLOYMENT
pertanian baik berupa usaha rumah tangga maupun bukan usaha rumah tangga, ataupun di nonpertanian atas dasar balas jasa dengan menerima upah atau imbalan baik berupa uang maupun barang, dan baik dengan sistem pembayaran harian maupun borongan
23. 25. Pekerja tak dibayar adalah seseorang yang bekerja membantu usaha untuk memperoleh penghasilan/keuntungan yang dilakukan oleh salah seorang anggota rumah tangga atau bukan anggota rumah tangga tanpa mendapat upah/gaji baik berupa uang maupun barang.
43Kabupaten Maros Dalam Angka 2020
PENDUDUK DAN KETENAGAKERJAAN
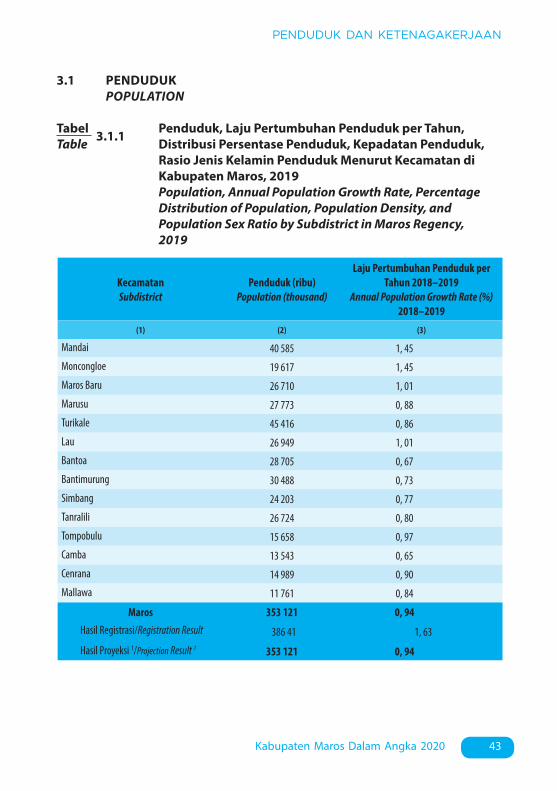
TabelTable 3.1.1 Penduduk, Laju Pertumbuhan Penduduk per Tahun,
Distribusi Persentase Penduduk, Kepadatan Penduduk, Rasio Jenis Kelamin Penduduk Menurut Kecamatan di Kabupaten Maros, 2019
Population, Annual Population Growth Rate, Percentage Distribution of Population, Population Density, and Population Sex Ratio by Subdistrict in Maros Regency, 2019
KecamatanSubdistrict
Penduduk (ribu)Population (thousand)
Laju Pertumbuhan Penduduk per Tahun 2018–2019
Annual Population Growth Rate (%) 2018–2019
(1) (2) (3)
Mandai 40 585 1, 45Moncongloe 19 617 1, 45Maros Baru 26 710 1, 01Marusu 27 773 0, 88Turikale 45 416 0, 86Lau 26 949 1, 01Bantoa 28 705 0, 67Bantimurung 30 488 0, 73Simbang 24 203 0, 77Tanralili 26 724 0, 80Tompobulu 15 658 0, 97Camba 13 543 0, 65Cenrana 14 989 0, 90Mallawa 11 761 0, 84
Maros 353 121 0, 94Hasil Registrasi/Registration Result 386 41 1, 63
Hasil Proyeksi 1/Projection Result 1 353 121 0, 94
3.1 PENDUDUK POPULATION
44 Maros Regency in Figures 2020
POPULATION AND EMPLOYMENT
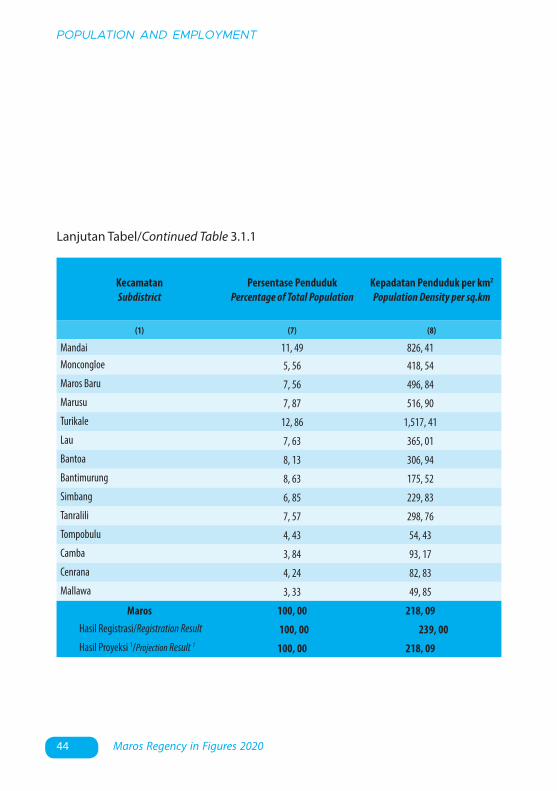
KecamatanSubdistrict
Persentase PendudukPercentage of Total Population
Kepadatan Penduduk per km2
Population Density per sq.km
(1) (7) (8)
Mandai 11, 49 826, 41Moncongloe 5, 56 418, 54Maros Baru 7, 56 496, 84Marusu 7, 87 516, 90Turikale 12, 86 1,517, 41Lau 7, 63 365, 01Bantoa 8, 13 306, 94Bantimurung 8, 63 175, 52Simbang 6, 85 229, 83Tanralili 7, 57 298, 76Tompobulu 4, 43 54, 43Camba 3, 84 93, 17Cenrana 4, 24 82, 83Mallawa 3, 33 49, 85
Maros 100, 00 218, 09Hasil Registrasi/Registration Result 100, 00 239, 00Hasil Proyeksi 1/Projection Result 1 100, 00 218, 09
Lanjutan Tabel/Continued Table 3.1.1

45Kabupaten Maros Dalam Angka 2020
PENDUDUK DAN KETENAGAKERJAAN
KecamatanSubdistrict
Rasio Jenis KelaminPopulation Sex Ratio
(1) (11)
Mandai 92, 68
Moncongloe 92, 34
Maros Baru 95, 99
Marusu 98, 61
Turikale 93, 87
Lau 95, 76
Bantoa 97, 43
Bantimurung 95, 17
Simbang 93, 83
Tanralili 104, 08
Tompobulu 97, 10
Camba 96, 82
Cenrana 96, 81
Mallawa 93, 47
Maros 95, 82
Hasil Registrasi/Registration Result 101, 15
Hasil Proyeksi 1/Projection Result 1 95, 82
Lanjutan Tabel/Continued Table 3.1.1
Catatan/Note: 1 Data dari Hasil Proyeksi Penduduk Indonesia 2010–2035 (Pertengahan tahun/Juni)/Data from the result of Indonesia Population Projection 2010–2035 (mid year/June)
Sumber/Source: Dinas Kependudukan dan Pencatatan Sipil Kabupaten Maros/Population and Civil Registration Agency Maros
46 Maros Regency in Figures 2020
POPULATION AND EMPLOYMENT
3.2 KETENAGAKERJAAN EMPLOYMENT
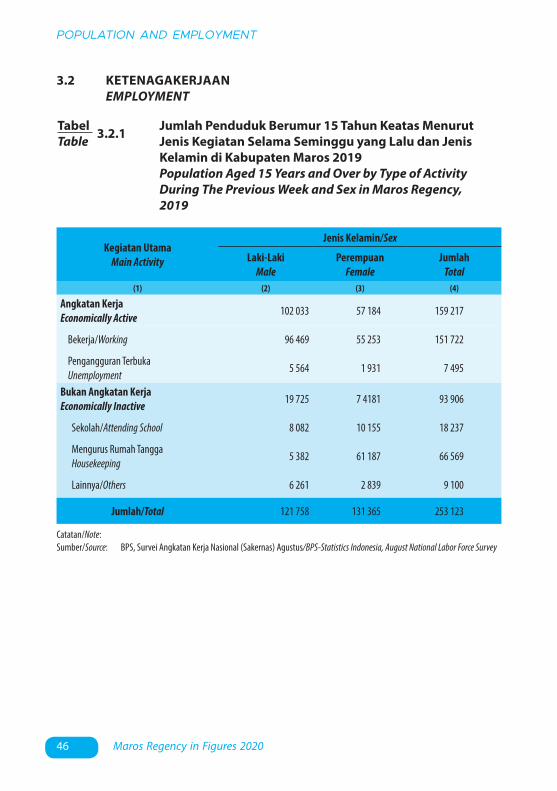
TabelTable 3.2.1 Jumlah Penduduk Berumur 15 Tahun Keatas Menurut
Jenis Kegiatan Selama Seminggu yang Lalu dan Jenis Kelamin di Kabupaten Maros 2019
Population Aged 15 Years and Over by Type of Activity During The Previous Week and Sex in Maros Regency, 2019
Catatan/Note:Sumber/Source: BPS, Survei Angkatan Kerja Nasional (Sakernas) Agustus/BPS-Statistics Indonesia, August National Labor Force Survey
Kegiatan UtamaMain Activity
Jenis Kelamin/Sex
Laki-LakiMale
PerempuanFemale
JumlahTotal
(1) (2) (3) (4)
Angkatan KerjaEconomically Active 102 033 57 184 159 217
Bekerja/Working 96 469 55 253 151 722
Pengangguran TerbukaUnemployment
5 564 1 931 7 495
Bukan Angkatan KerjaEconomically Inactive 19 725 7 4181 93 906
Sekolah/Attending School 8 082 10 155 18 237
Mengurus Rumah TanggaHousekeeping
5 382 61 187 66 569
Lainnya/Others 6 261 2 839 9 100
Jumlah/Total 121 758 131 365 253 123
47Kabupaten Maros Dalam Angka 2020
PENDUDUK DAN KETENAGAKERJAAN
TabelTable 3.2.2 Penduduk Berumur 15 Tahun ke Atas Menurut Pendidikan
Tertinggi yang Ditamatkan dan Jenis Kegiatan Selama Seminggu yang Lalu di Kabupaten Maros, 2019
Population 15 Years of Age and Over by Educational Attainment and Type of Activity During the Previous Week in Maros Regency, 2019
Pendidikan Tertinggi yangDitamatkan 1
Educational Attainment 1
Angkatan Kerja/Economically ActivePersentase Bekerjaterhadap Angkatan
KerjaPercentage of
Working to EconomicallyActive
BekerjaWorking
Pengangguran 2
Unemployment 2
JumlahAngkatan Kerja
Total ofEconomically
Active
(1) (2) (3) (4) (5)
0 62 600 1 397 63 997 9,.82
1 21 811 1 068 22 879 95,33
2 49 050 4 394 53 444 91,78
3 18 261 636 18 897 96,63
Jumlah/Total 151 722 74 95 1592 17 95,29

48 Maros Regency in Figures 2020
POPULATION AND EMPLOYMENT
Lanjutan Tabel/Continued Table 3.2.2
Pendidikan Tertinggi yangDitamatkan 1
Educational Attainment 1
Bukan Angkatan KerjaNot Economically Active
JumlahTotal
Persentase Angkatan Kerja
terhadap Penduduk Usia Kerja
Percentage of EconomicallyActive to Working Age
Population
(1) (6) (7) (8)
0 44 819 108 816 58,81
1 22 937 45 816 49,94
2 23 319 76 763 69,62
3 2 831 21 728 86,97
Jumlah/Total 93 906 253 123 62,90
Catatan/Note: 1 0. ≤ Sekolah Dasar (SD)/≤ Primary School 1. Sekolah Menengah Pertama/Junior High School 2. Sekolah Menengah Atas/Senior High School 3. Perguruan Tinggi/Collage 2 1. Mencari pekerjaan/Looking for work 2. Mempersiapkan usaha/Establishing a new business/firm 3. Merasa tidak mungkin mendapat pekerjaan/Hopeless of job 4. Sudah punya pekerjaan tetapi belum mulai bekerja/Have a job in future startSumber/Source: BPS, Survei Angkatan Kerja Nasional (Sakernas) Agustus/BPS-Statistics Indonesia, August National Labor Force Survey

49Kabupaten Maros Dalam Angka 2020
PENDUDUK DAN KETENAGAKERJAAN
TabelTable 3.2.3 Penduduk Berumur 15 Tahun Ke Atas yang Bekerja
Selama Seminggu yang Lalu Menurut Status Pekerjaan Utama dan Jenis Kelamin di Kabupaten Maros, 2019
Population 15 Years of Age and Over who Worked During The Previous Week by Main Employment Status and Sex in Maros Regency, 2019
Catatan/Note: ...Sumber/Source: BPS, Survei Angkatan Kerja Nasional (Sakernas) Agustus/BPS-Statistics Indonesia, August National Labor Force Survey
Status Pekerjaan UtamaMain Employment Status
Laki-LakiMale
PerempuanFemale
JumlahTotal
(1) (2) (3) (4)
Berusaha sendiriOwn account worker
16 902 8 127 25 029
Berusaha dibantu buruh tidak tetap/buruh tidak dibayar Employer assisted by temporary worker/unpaid worker
18 023 11 214 29 237
Berusaha dibantu buruh tetap/buruh dibayarEmployer assisted by permanent worker/paid worker
3 814 1 729 5 543
Buruh/Karyawan/Pegawai/Employee 44 966 19 857 64 823
Pekerja bebasCasual worker
1 292 109 1 401
Pekerja keluarga/tak dibayar Family worker/unpaid worker
6 158 1 912 8 070
Jumlah/Total 5 314 12 305 17 619

50 Maros Regency in Figures 2020
POPULATION AND EMPLOYMENT
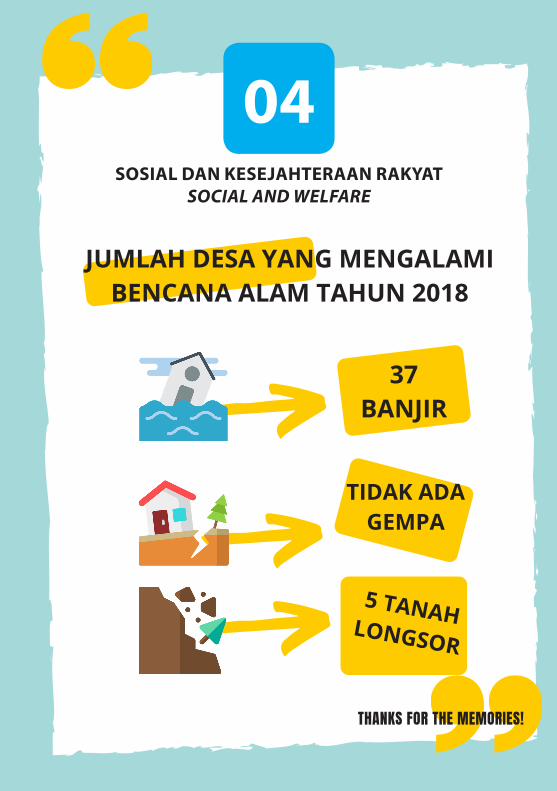
4. Sosial dan Kesejahteraan Rakyat/Social and Welfare ...................................4. SOSIAL DAN KESEJAHTERAAN RAKYAT/SOCIAL AND WELFARE
JUMLAH DESA YANG MENGALAMIBENCANA ALAM TAHUN 2018
THANKS FOR THE MEMORIES!
37BANJIR
TIDAK ADAGEMPA
5 TANAHLONGSOR
SOSIAL DAN KESEJAHTERAAN RAKYATSOCIAL AND WELFARE
04

53Kabupaten Maros Dalam Angka 2020
SOSIAL DAN KESEJAHTERAAN RAKYAT
PENJELASAN TEKNIS TECHNICAL NOTES
1. Tidak/belum pernah sekolah adalah mereka yang tidak pernah atau belum pernah terdaftar dan tidak pernah atau belum pernah aktif mengikuti pendidikan di suatu jenjang pendidikan formal. Termasuk juga yang tamat/belum tamat taman kanak-kanak tetapi tidak melanjutkan ke sekolah dasar.
2. Masih bersekolah adalah mereka yang terdaftar dan aktif mengikuti pendidikan formal dan nonformal (Paket A, B, atau C), baik pendidikan dasar, menengah maupun pendidikan tinggi. Bagi mahasiswa yang sedang cuti dianggap masih bersekolah.
3. Tidak bersekolah lagi adalah mereka yang pernah terdaftar dan aktif mengikuti pendidikan di suatu jenjang pendidikan formal dan nonformal (Paket A, B, atau C), tetapi pada saat pencacahan tidak lagi terdaftar dan tidak aktif mengikuti pendidikan.
4. Tamat sekolah adalah menyelesaikan pelajaran yang ditandai dengan lulus ujian akhir pada kelas atau tingkat terakhir suatu jenjang pendidikan di sekolah negeri maupun swasta dengan mendapatkan tanda tamat belajar/ijazah. Seseorang yang belum mengikuti pelajaran pada kelas tertinggi tetapi telah mengikuti ujian akhir dan lulus dianggap tamat sekolah.
1. 1. Not/never attending school is someone who has never attended or never been registered in a formal education, such as primary, secondary, and tertiary education. Those who just completed kindergarten are considered as never attended school.
2. Attending school is someone who is currently attending primary, secondary, or tertiary education, including package A, package B, or package C. College student who postpones his/her study is considered as attending school.
3. Not attending school anymore is someone who had enrolled and participated in formal and non-formal education in the past including package A, package B, or package C, but currently does not attend school.
4. Completed particular level of education is someone who has completed particular level of education in private or public school and accepting graduation certificate. Someone who has never attended the highest grade but passed the final exam is considered as completed particular level of education.
5. Able to read and write is the ability to read and write at least a simple sentence in any letter of alphabets.
6. The Education System in Indonesia consists of 1) a formal education, 2) non-formal education, and
54 Maros Regency in Figures 2020
SOCIAL AND WELFARE
5. Dapat membaca dan menulis artinya dapat membaca dan menulis kata-kata/kalimat sederhana dengan suatu aksara tertentu.
6. Jalur Pendidikan di Indonesia terdiri atas 1) pendidikan formal, 2) pendidikan nonformal, dan 3) pendidikan informal yang ketiganya dapat saling melengkapi dan memperkaya (Undang-Undang No. 20 Tahun 2013 tentang Sistem Pendidikan Nasional).
7. Jenjang Pendidikan Formal terdiri atas pendidikan dasar, pendidikan menengah, dan pendidikan tinggi. Jenis pendidikan yang diajarkan mencakup pendidikan umum, kejuruan, akademik, profesi, vokasi, keagamaan, dan khusus. a. Pendidikan Dasar berbentuk Sekolah Dasar (SD) dan Madrasah Ibtidaiyah (MI) atau bentuk lain yang sederajat serta Sekolah Menengah Pertama (SMP) dan Madrasah Tsanawiyah (MTs), atau bentuk lain yang sederajat. b. Pendidikan Menengah berbentuk Sekolah Menengah Atas (SMA), Madrasah Aliyah (MA), Sekolah Menengah Kejuruan (SMK), dan Madrasah Aliyah Kejuruan (MAK), atau bentuk lain yang sederajat. c. Pendidikan Tinggi merupakan jenjang pendidikan setelah pendidikan menengah yang mencakup program pendidikan diploma, sarjana, magister,
3) informal education that all three can be complementary and enriching (Law No. 20 Year 2013 about The National Education System).
7. The Formal Education Level consists of primary education, secondary education, and high education. The kind of education that taught consists of general education, vocational, academic, professional, religious, and specific education. a. The Primary Education consists of Elementary School and Islamic Elementary School or other equivalent forms and Junior High School and MTs, or other equivalent forms. b. The Secondary Education consists of the senior high school, MA, Vocational School, and Vocational Madrasah Aliyah, or other equivalent forms. c. The High Education consists of the education level after the secondary education that consists of diplomas, bachelor, master, specialist, and doctoral degrees that are held by the college. The colleges can be academy, polytechnic, high school, institute, or university.
8. Hospital is a place for health check, usually controlled/supervised by doctors/medical personnel to serve the ill patients to get outpatient or inpatient treatment services.
9. Maternity Hospital is a specialized hospital for childbirth, has specialist inspection service to pregnancy, childbirth, hospitalization and
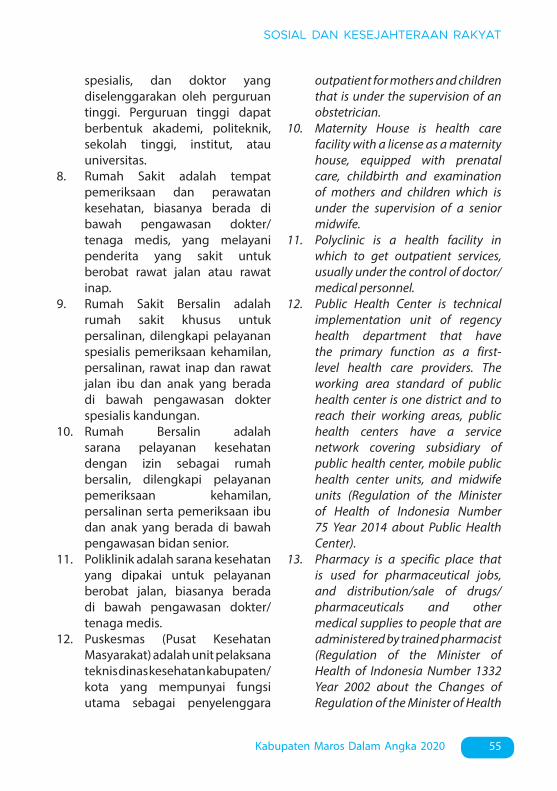
55Kabupaten Maros Dalam Angka 2020
SOSIAL DAN KESEJAHTERAAN RAKYAT
spesialis, dan doktor yang diselenggarakan oleh perguruan tinggi. Perguruan tinggi dapat berbentuk akademi, politeknik, sekolah tinggi, institut, atau universitas.
8. Rumah Sakit adalah tempat pemeriksaan dan perawatan kesehatan, biasanya berada di bawah pengawasan dokter/tenaga medis, yang melayani penderita yang sakit untuk berobat rawat jalan atau rawat inap.
9. Rumah Sakit Bersalin adalah rumah sakit khusus untuk persalinan, dilengkapi pelayanan spesialis pemeriksaan kehamilan, persalinan, rawat inap dan rawat jalan ibu dan anak yang berada di bawah pengawasan dokter spesialis kandungan.
10. Rumah Bersalin adalah sarana pelayanan kesehatan dengan izin sebagai rumah bersalin, dilengkapi pelayanan pemeriksaan kehamilan, persalinan serta pemeriksaan ibu dan anak yang berada di bawah pengawasan bidan senior.
11. Poliklinik adalah sarana kesehatan yang dipakai untuk pelayanan berobat jalan, biasanya berada di bawah pengawasan dokter/tenaga medis.
12. Puskesmas (Pusat Kesehatan Masyarakat) adalah unit pelaksana teknis dinas kesehatan kabupaten/kota yang mempunyai fungsi utama sebagai penyelenggara
outpatient for mothers and children that is under the supervision of an obstetrician.
10. Maternity House is health care facility with a license as a maternity house, equipped with prenatal care, childbirth and examination of mothers and children which is under the supervision of a senior midwife.
11. Polyclinic is a health facility in which to get outpatient services, usually under the control of doctor/medical personnel.
12. Public Health Center is technical implementation unit of regency health department that have the primary function as a first-level health care providers. The working area standard of public health center is one district and to reach their working areas, public health centers have a service network covering subsidiary of public health center, mobile public health center units, and midwife units (Regulation of the Minister of Health of Indonesia Number 75 Year 2014 about Public Health Center).
13. Pharmacy is a specific place that is used for pharmaceutical jobs, and distribution/sale of drugs/pharmaceuticals and other medical supplies to people that are administered by trained pharmacist (Regulation of the Minister of Health of Indonesia Number 1332 Year 2002 about the Changes of Regulation of the Minister of Health
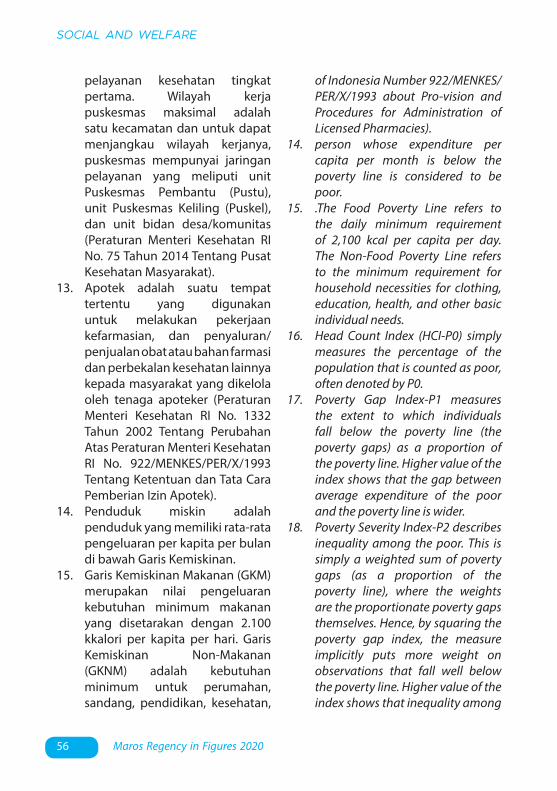
56 Maros Regency in Figures 2020
SOCIAL AND WELFARE
pelayanan kesehatan tingkat pertama. Wilayah kerja puskesmas maksimal adalah satu kecamatan dan untuk dapat menjangkau wilayah kerjanya, puskesmas mempunyai jaringan pelayanan yang meliputi unit Puskesmas Pembantu (Pustu), unit Puskesmas Keliling (Puskel), dan unit bidan desa/komunitas (Peraturan Menteri Kesehatan RI No. 75 Tahun 2014 Tentang Pusat Kesehatan Masyarakat).
13. Apotek adalah suatu tempat tertentu yang digunakan untuk melakukan pekerjaan kefarmasian, dan penyaluran/penjualan obat atau bahan farmasi dan perbekalan kesehatan lainnya kepada masyarakat yang dikelola oleh tenaga apoteker (Peraturan Menteri Kesehatan RI No. 1332 Tahun 2002 Tentang Perubahan Atas Peraturan Menteri Kesehatan RI No. 922/MENKES/PER/X/1993 Tentang Ketentuan dan Tata Cara Pemberian Izin Apotek).
14. Penduduk miskin adalah penduduk yang memiliki rata-rata pengeluaran per kapita per bulan di bawah Garis Kemiskinan.
15. Garis Kemiskinan Makanan (GKM) merupakan nilai pengeluaran kebutuhan minimum makanan yang disetarakan dengan 2.100 kkalori per kapita per hari. Garis Kemiskinan Non-Makanan (GKNM) adalah kebutuhan minimum untuk perumahan, sandang, pendidikan, kesehatan,
of Indonesia Number 922/MENKES/PER/X/1993 about Pro-vision and Procedures for Administration of Licensed Pharmacies).
14. person whose expenditure per capita per month is below the poverty line is considered to be poor.
15. .The Food Poverty Line refers to the daily minimum requirement of 2,100 kcal per capita per day. The Non-Food Poverty Line refers to the minimum requirement for household necessities for clothing, education, health, and other basic individual needs.
16. Head Count Index (HCI-P0) simply measures the percentage of the population that is counted as poor, often denoted by P0.
17. Poverty Gap Index-P1 measures the extent to which individuals fall below the poverty line (the poverty gaps) as a proportion of the poverty line. Higher value of the index shows that the gap between average expenditure of the poor and the poverty line is wider.
18. Poverty Severity Index-P2 describes inequality among the poor. This is simply a weighted sum of poverty gaps (as a proportion of the poverty line), where the weights are the proportionate poverty gaps themselves. Hence, by squaring the poverty gap index, the measure implicitly puts more weight on observations that fall well below the poverty line. Higher value of the index shows that inequality among
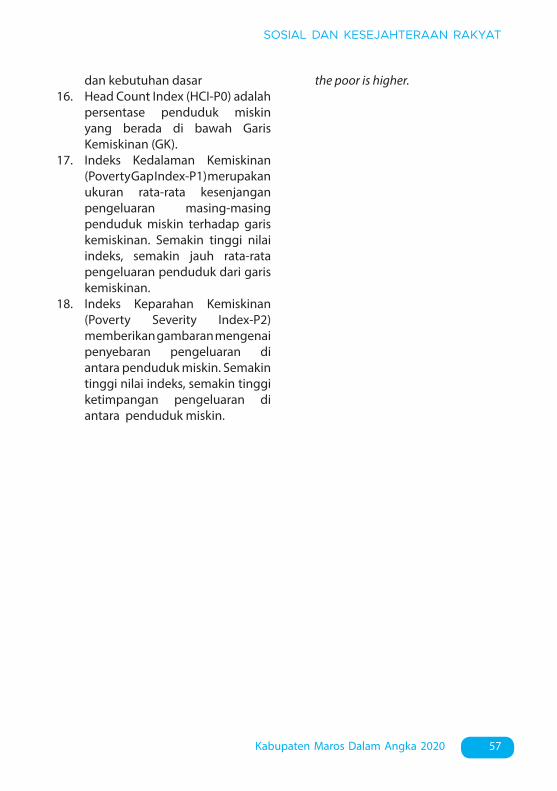
57Kabupaten Maros Dalam Angka 2020
SOSIAL DAN KESEJAHTERAAN RAKYAT
dan kebutuhan dasar16. Head Count Index (HCI-P0) adalah
persentase penduduk miskin yang berada di bawah Garis Kemiskinan (GK).
17. Indeks Kedalaman Kemiskinan (Poverty Gap Index-P1) merupakan ukuran rata-rata kesenjangan pengeluaran masing-masing penduduk miskin terhadap garis kemiskinan. Semakin tinggi nilai indeks, semakin jauh rata-rata pengeluaran penduduk dari garis kemiskinan.
18. Indeks Keparahan Kemiskinan (Poverty Severity Index-P2) memberikan gambaran mengenai penyebaran pengeluaran di antara penduduk miskin. Semakin tinggi nilai indeks, semakin tinggi ketimpangan pengeluaran di antara penduduk miskin.
the poor is higher.
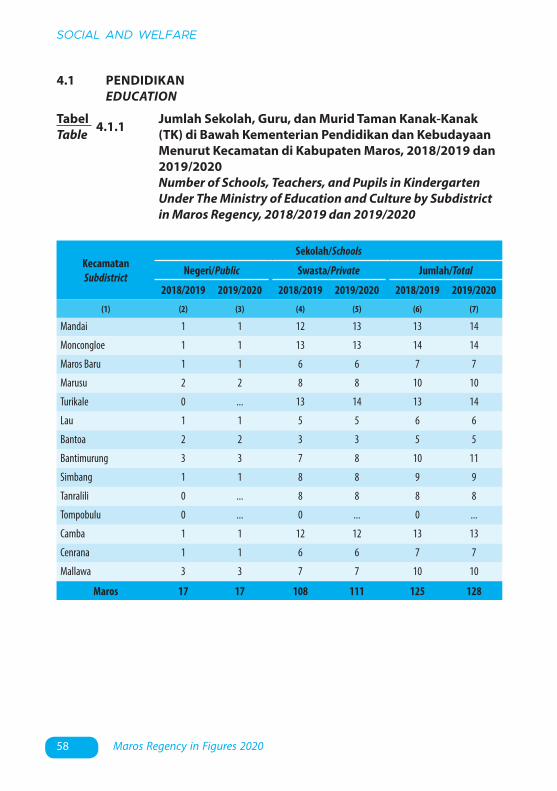
58 Maros Regency in Figures 2020
SOCIAL AND WELFARE
TabelTable 4.1.1 Jumlah Sekolah, Guru, dan Murid Taman Kanak-Kanak
(TK) di Bawah Kementerian Pendidikan dan Kebudayaan Menurut Kecamatan di Kabupaten Maros, 2018/2019 dan 2019/2020
Number of Schools, Teachers, and Pupils in Kindergarten Under The Ministry of Education and Culture by Subdistrict in Maros Regency, 2018/2019 dan 2019/2020
4.1 PENDIDIKAN EDUCATION
KecamatanSubdistrict
Sekolah/Schools
Negeri/Public Swasta/Private Jumlah/Total
2018/2019 2019/2020 2018/2019 2019/2020 2018/2019 2019/2020
(1) (2) (3) (4) (5) (6) (7)
Mandai 1 1 12 13 13 14
Moncongloe 1 1 13 13 14 14
Maros Baru 1 1 6 6 7 7
Marusu 2 2 8 8 10 10
Turikale 0 ... 13 14 13 14
Lau 1 1 5 5 6 6
Bantoa 2 2 3 3 5 5
Bantimurung 3 3 7 8 10 11
Simbang 1 1 8 8 9 9
Tanralili 0 ... 8 8 8 8
Tompobulu 0 ... 0 ... 0 ...
Camba 1 1 12 12 13 13
Cenrana 1 1 6 6 7 7
Mallawa 3 3 7 7 10 10
Maros 17 17 108 111 125 128
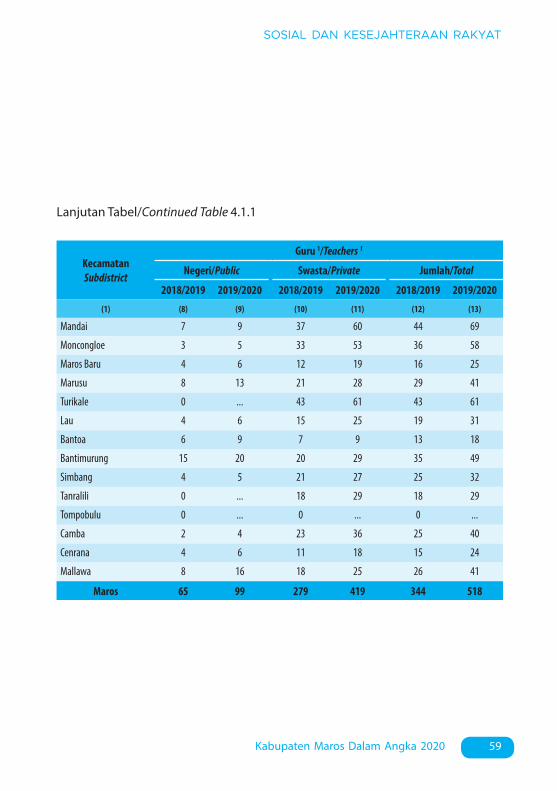
59Kabupaten Maros Dalam Angka 2020
SOSIAL DAN KESEJAHTERAAN RAKYAT
Lanjutan Tabel/Continued Table 4.1.1
KecamatanSubdistrict
Guru 1/Teachers 1
Negeri/Public Swasta/Private Jumlah/Total
2018/2019 2019/2020 2018/2019 2019/2020 2018/2019 2019/2020
(1) (8) (9) (10) (11) (12) (13)
Mandai 7 9 37 60 44 69
Moncongloe 3 5 33 53 36 58
Maros Baru 4 6 12 19 16 25
Marusu 8 13 21 28 29 41
Turikale 0 ... 43 61 43 61
Lau 4 6 15 25 19 31
Bantoa 6 9 7 9 13 18
Bantimurung 15 20 20 29 35 49
Simbang 4 5 21 27 25 32
Tanralili 0 ... 18 29 18 29
Tompobulu 0 ... 0 ... 0 ...
Camba 2 4 23 36 25 40
Cenrana 4 6 11 18 15 24
Mallawa 8 16 18 25 26 41
Maros 65 99 279 419 344 518
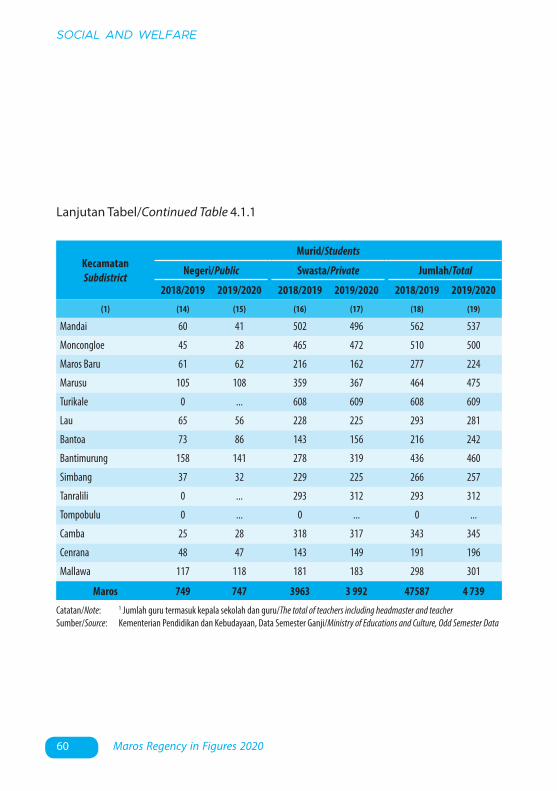
60 Maros Regency in Figures 2020
SOCIAL AND WELFARE
Lanjutan Tabel/Continued Table 4.1.1
Catatan/Note: 1 Jumlah guru termasuk kepala sekolah dan guru/The total of teachers including headmaster and teacherSumber/Source: Kementerian Pendidikan dan Kebudayaan, Data Semester Ganji/Ministry of Educations and Culture, Odd Semester Data
KecamatanSubdistrict
Murid/Students
Negeri/Public Swasta/Private Jumlah/Total
2018/2019 2019/2020 2018/2019 2019/2020 2018/2019 2019/2020
(1) (14) (15) (16) (17) (18) (19)
Mandai 60 41 502 496 562 537
Moncongloe 45 28 465 472 510 500
Maros Baru 61 62 216 162 277 224
Marusu 105 108 359 367 464 475
Turikale 0 ... 608 609 608 609
Lau 65 56 228 225 293 281
Bantoa 73 86 143 156 216 242
Bantimurung 158 141 278 319 436 460
Simbang 37 32 229 225 266 257
Tanralili 0 ... 293 312 293 312
Tompobulu 0 ... 0 ... 0 ...
Camba 25 28 318 317 343 345
Cenrana 48 47 143 149 191 196
Mallawa 117 118 181 183 298 301
Maros 749 747 3963 3 992 47587 4 739

61Kabupaten Maros Dalam Angka 2020
SOSIAL DAN KESEJAHTERAAN RAKYAT
TabelTable 4.1.2 Jumlah Sekolah, Guru, dan Murid Raudatul Athfal (RA)
di Bawah Kementerian Agama Menurut Kecamatan di Kabupaten Maros, 2018/2019 dan 2019/2020
Number of Schools, Teachers, and Pupils in Raudatul Athfal (RA) Under The Ministry of Religious Affairs by Subdistrict in Maros Regency, 2018/2019 dan 2019/2020
Catatan/Note: ...Sumber/Source: Kementerian Agama, Data Semester Ganjil/Ministry of Religious Affairs, Odd Semester Data
KecamatanSubdistrict
Sekolah/Schools Guru/Teachers Murid/Pupils
2018/2019 2019/2020 2018/2019 2019/2020 2018/2019 2019/2020
(1) (2) (3) (4) (5) (6) (7)
Mandai ... 5 ... 20 ... 271
Moncongloe ... 1 ... 5 ... 33
Maros Baru ... 1 ... 2 ... 69
Marusu ... 1 ... 4 ... 65
Turikale ... 7 ... 26 ... 313
Lau ... 4 ... 10 ... 132
Bantoa ... 1 ... 5 ... 47
Bantimurung ... 2 ... 6 ... 55
Simbang ... 3 ... 9 ... 108
Tanralili ... 4 ... 16 ... 109
Tompobulu ... 1 ... 3 ... -
Camba ... - ... - ... -
Cenrana ... - ... - ... -
Mallawa ... - ... - ... -
Maros ... 30 ... 106 ... 1202
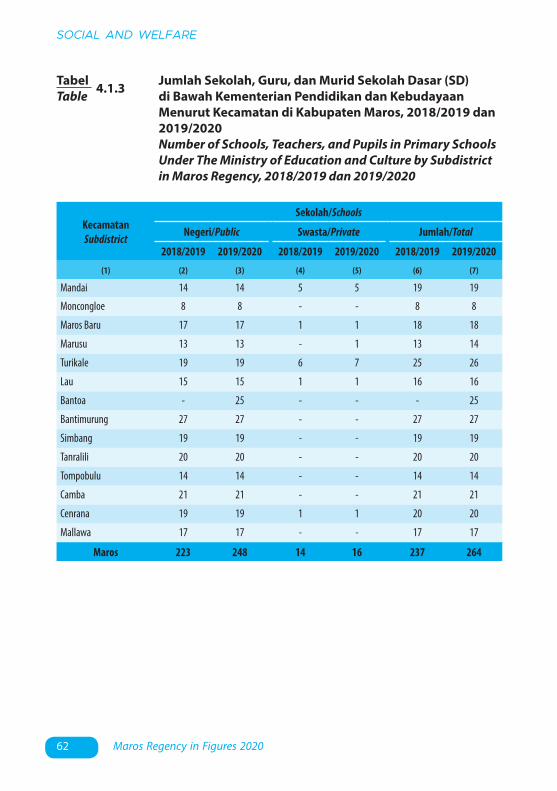
62 Maros Regency in Figures 2020
SOCIAL AND WELFARE
4.1.3 Jumlah Sekolah, Guru, dan Murid Sekolah Dasar (SD) di Bawah Kementerian Pendidikan dan Kebudayaan Menurut Kecamatan di Kabupaten Maros, 2018/2019 dan 2019/2020
Number of Schools, Teachers, and Pupils in Primary Schools Under The Ministry of Education and Culture by Subdistrict in Maros Regency, 2018/2019 dan 2019/2020
TabelTable
KecamatanSubdistrict
Sekolah/Schools
Negeri/Public Swasta/Private Jumlah/Total
2018/2019 2019/2020 2018/2019 2019/2020 2018/2019 2019/2020
(1) (2) (3) (4) (5) (6) (7)
Mandai 14 14 5 5 19 19
Moncongloe 8 8 - - 8 8
Maros Baru 17 17 1 1 18 18
Marusu 13 13 - 1 13 14
Turikale 19 19 6 7 25 26
Lau 15 15 1 1 16 16
Bantoa - 25 - - - 25
Bantimurung 27 27 - - 27 27
Simbang 19 19 - - 19 19
Tanralili 20 20 - - 20 20
Tompobulu 14 14 - - 14 14
Camba 21 21 - - 21 21
Cenrana 19 19 1 1 20 20
Mallawa 17 17 - - 17 17
Maros 223 248 14 16 237 264

63Kabupaten Maros Dalam Angka 2020
SOSIAL DAN KESEJAHTERAAN RAKYAT
Lanjutan Tabel/Continued Table 4.1.3
KecamatanSubdistrict
Guru 1/Teachers 1
Negeri/Public Swasta/Private Jumlah/Total
2018/2019 2019/2020 2018/2019 2019/2020 2018/2019 2019/2020
(1) (8) (9) (10) (11) (12) (13)
Mandai 183 199 64 71 247 270
Moncongloe 85 100 - - 85 100
Maros Baru 145 161 3 5 148 166
Marusu 155 161 - 6 155 167
Turikale 216 231 80 95 296 326
Lau 140 155 18 24 158 179
Bantoa - 202 - - - 202
Bantimurung 241 266 - - 241 266
Simbang 148 173 - - 148 173
Tanralili 168 188 - - 168 188
Tompobulu 104 112 - - 104 112
Camba 160 171 - - 160 171
Cenrana 131 138 7 10 138 148
Mallawa 121 125 - - 121 125
Maros 1 997 2 382 172 211 2 169 2 593
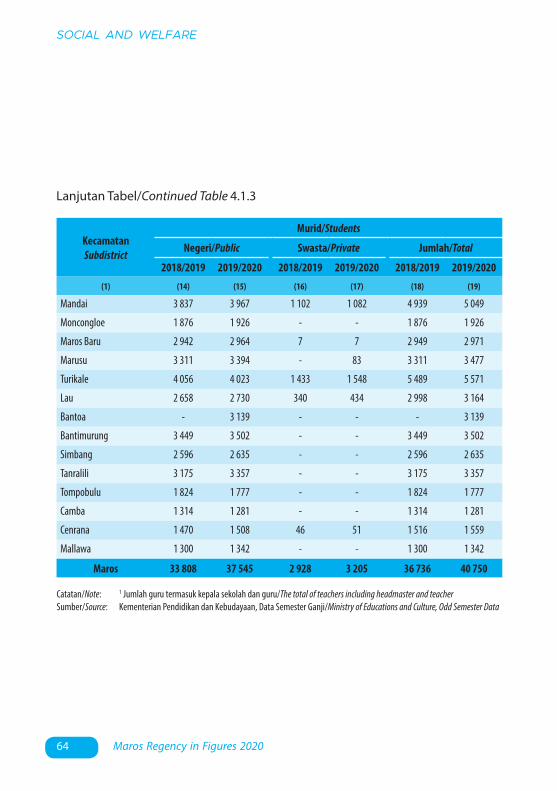
64 Maros Regency in Figures 2020
SOCIAL AND WELFARE
Lanjutan Tabel/Continued Table 4.1.3
Catatan/Note: 1 Jumlah guru termasuk kepala sekolah dan guru/The total of teachers including headmaster and teacherSumber/Source: Kementerian Pendidikan dan Kebudayaan, Data Semester Ganji/Ministry of Educations and Culture, Odd Semester Data
KecamatanSubdistrict
Murid/Students
Negeri/Public Swasta/Private Jumlah/Total
2018/2019 2019/2020 2018/2019 2019/2020 2018/2019 2019/2020
(1) (14) (15) (16) (17) (18) (19)
Mandai 3 837 3 967 1 102 1 082 4 939 5 049
Moncongloe 1 876 1 926 - - 1 876 1 926
Maros Baru 2 942 2 964 7 7 2 949 2 971
Marusu 3 311 3 394 - 83 3 311 3 477
Turikale 4 056 4 023 1 433 1 548 5 489 5 571
Lau 2 658 2 730 340 434 2 998 3 164
Bantoa - 3 139 - - - 3 139
Bantimurung 3 449 3 502 - - 3 449 3 502
Simbang 2 596 2 635 - - 2 596 2 635
Tanralili 3 175 3 357 - - 3 175 3 357
Tompobulu 1 824 1 777 - - 1 824 1 777
Camba 1 314 1 281 - - 1 314 1 281
Cenrana 1 470 1 508 46 51 1 516 1 559
Mallawa 1 300 1 342 - - 1 300 1 342
Maros 33 808 37 545 2 928 3 205 36 736 40 750
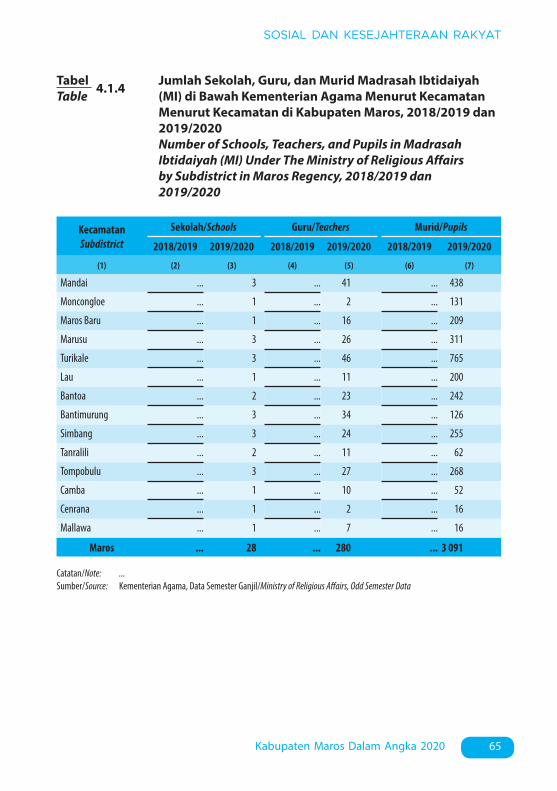
65Kabupaten Maros Dalam Angka 2020
SOSIAL DAN KESEJAHTERAAN RAKYAT
4.1.4 Jumlah Sekolah, Guru, dan Murid Madrasah Ibtidaiyah (MI) di Bawah Kementerian Agama Menurut Kecamatan Menurut Kecamatan di Kabupaten Maros, 2018/2019 dan 2019/2020
Number of Schools, Teachers, and Pupils in Madrasah Ibtidaiyah (MI) Under The Ministry of Religious Affairs by Subdistrict in Maros Regency, 2018/2019 dan 2019/2020
TabelTable
KecamatanSubdistrict
Sekolah/Schools Guru/Teachers Murid/Pupils
2018/2019 2019/2020 2018/2019 2019/2020 2018/2019 2019/2020
(1) (2) (3) (4) (5) (6) (7)
Mandai ... 3 ... 41 ... 438
Moncongloe ... 1 ... 2 ... 131
Maros Baru ... 1 ... 16 ... 209
Marusu ... 3 ... 26 ... 311
Turikale ... 3 ... 46 ... 765
Lau ... 1 ... 11 ... 200
Bantoa ... 2 ... 23 ... 242
Bantimurung ... 3 ... 34 ... 126
Simbang ... 3 ... 24 ... 255
Tanralili ... 2 ... 11 ... 62
Tompobulu ... 3 ... 27 ... 268
Camba ... 1 ... 10 ... 52
Cenrana ... 1 ... 2 ... 16
Mallawa ... 1 ... 7 ... 16
Maros ... 28 ... 280 ... 3 091
Catatan/Note: ...Sumber/Source: Kementerian Agama, Data Semester Ganjil/Ministry of Religious Affairs, Odd Semester Data
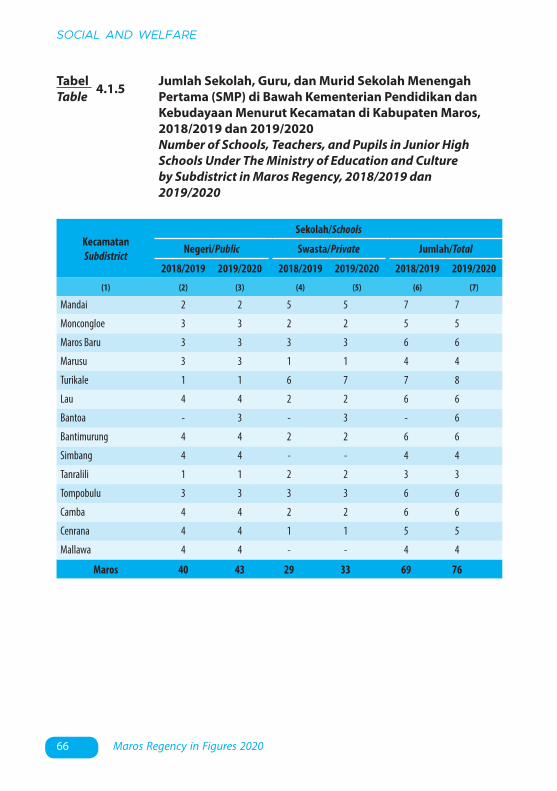
66 Maros Regency in Figures 2020
SOCIAL AND WELFARE
TabelTable 4.1.5 Jumlah Sekolah, Guru, dan Murid Sekolah Menengah
Pertama (SMP) di Bawah Kementerian Pendidikan dan Kebudayaan Menurut Kecamatan di Kabupaten Maros, 2018/2019 dan 2019/2020
Number of Schools, Teachers, and Pupils in Junior High Schools Under The Ministry of Education and Culture by Subdistrict in Maros Regency, 2018/2019 dan 2019/2020
KecamatanSubdistrict
Sekolah/Schools
Negeri/Public Swasta/Private Jumlah/Total
2018/2019 2019/2020 2018/2019 2019/2020 2018/2019 2019/2020
(1) (2) (3) (4) (5) (6) (7)
Mandai 2 2 5 5 7 7
Moncongloe 3 3 2 2 5 5
Maros Baru 3 3 3 3 6 6
Marusu 3 3 1 1 4 4
Turikale 1 1 6 7 7 8
Lau 4 4 2 2 6 6
Bantoa - 3 - 3 - 6
Bantimurung 4 4 2 2 6 6
Simbang 4 4 - - 4 4
Tanralili 1 1 2 2 3 3
Tompobulu 3 3 3 3 6 6
Camba 4 4 2 2 6 6
Cenrana 4 4 1 1 5 5
Mallawa 4 4 - - 4 4
Maros 40 43 29 33 69 76
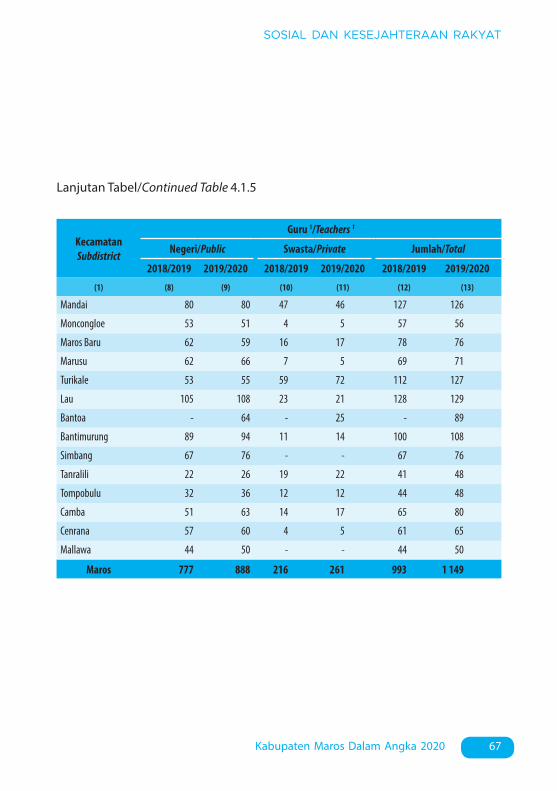
67Kabupaten Maros Dalam Angka 2020
SOSIAL DAN KESEJAHTERAAN RAKYAT
Lanjutan Tabel/Continued Table 4.1.5
KecamatanSubdistrict
Guru 1/Teachers 1
Negeri/Public Swasta/Private Jumlah/Total
2018/2019 2019/2020 2018/2019 2019/2020 2018/2019 2019/2020
(1) (8) (9) (10) (11) (12) (13)
Mandai 80 80 47 46 127 126
Moncongloe 53 51 4 5 57 56
Maros Baru 62 59 16 17 78 76
Marusu 62 66 7 5 69 71
Turikale 53 55 59 72 112 127
Lau 105 108 23 21 128 129
Bantoa - 64 - 25 - 89
Bantimurung 89 94 11 14 100 108
Simbang 67 76 - - 67 76
Tanralili 22 26 19 22 41 48
Tompobulu 32 36 12 12 44 48
Camba 51 63 14 17 65 80
Cenrana 57 60 4 5 61 65
Mallawa 44 50 - - 44 50
Maros 777 888 216 261 993 1 149

68 Maros Regency in Figures 2020
SOCIAL AND WELFARE
Lanjutan Tabel/Continued Table 4.1.5
Catatan/Note: 1 Jumlah guru termasuk kepala sekolah dan guru/The total of teachers including headmaster and teacherSumber/Source: Kementerian Pendidikan dan Kebudayaan, Data Semester Ganji/Ministry of Educations and Culture, Odd Semester Data
KecamatanSubdistrict
Murid/Students
Negeri/Public Swasta/Private Jumlah/Total
2018/2019 2019/2020 2018/2019 2019/2020 2018/2019 2019/2020
(1) (14) (15) (16) (17) (18) (19)
Mandai 1 415 1 406 702 714 2 117 2 120
Moncongloe 608 648 46 68 654 716
Maros Baru 816 819 152 152 968 971
Marusu 971 1 013 126 118 1 097 1 131
Turikale 939 928 907 1 035 1 846 1 963
Lau 1 499 1 468 287 339 1 786 1 807
Bantoa - 674 - 133 - 807
Bantimurung 1 575 1 539 88 92 1 663 1 631
Simbang 985 1 030 - - 985 1 030
Tanralili 420 438 365 352 785 790
Tompobulu 505 569 104 90 609 659
Camba 531 518 183 266 714 784
Cenrana 602 563 40 34 642 597
Mallawa 519 514 - - 519 514
Maros 11 385 12 127 3 000 3 393 14 385 15 520

69Kabupaten Maros Dalam Angka 2020
SOSIAL DAN KESEJAHTERAAN RAKYAT
TabelTable 4.1.6 Jumlah Sekolah, Guru, dan Murid Madrasah Tsanawiyah
(MTs) di Bawah Kementerian Agama Menurut Kecamatan di Kabupaten Maros, 2018/2019 dan 2019/2020
Number of Schools, Teachers, and Pupils in Madrasah Tsanawiyah (MTs) Under The Ministry of Religious Affairs by Subdistrict in Maros , 2018/2019 dan 2019/2020
KecamatanSubdistrict
Sekolah/Schools Guru/Teachers Murid/Pupils
2018/2019 2019/2020 2018/2019 2019/2020 2018/2019 2019/2020
(1) (2) (3) (4) (5) (6) (7)
Mandai ... 3 ... 37 ... 372
Moncongloe ... 2 ... 21 ... 144
Maros Baru ... 3 ... 44 ... 403
Marusu ... 4 ... 31 ... 231
Turikale ... 5 ... 81 ... 743
Lau ... 5 ... 96 ... 971
Bantoa ... 2 ... 24 ... 358
Bantimurung ... 5 ... 55 ... 328
Simbang ... 4 ... 34 ... 586
Tanralili ... 3 ... 40 ... 384
Tompobulu ... 6 ... 34 ... 365
Camba ... 2 ... 23 ... 120
Cenrana ... 1 ... 12 ... 102
Mallawa ... 1 ... 5 ... 29
Maros ... 46 ... 537 ... 5 136
Catatan/Note: ...Sumber/Source: Kementerian Agama, Data Semester Ganjil/Ministry of Religious Affairs, Odd Semester Data
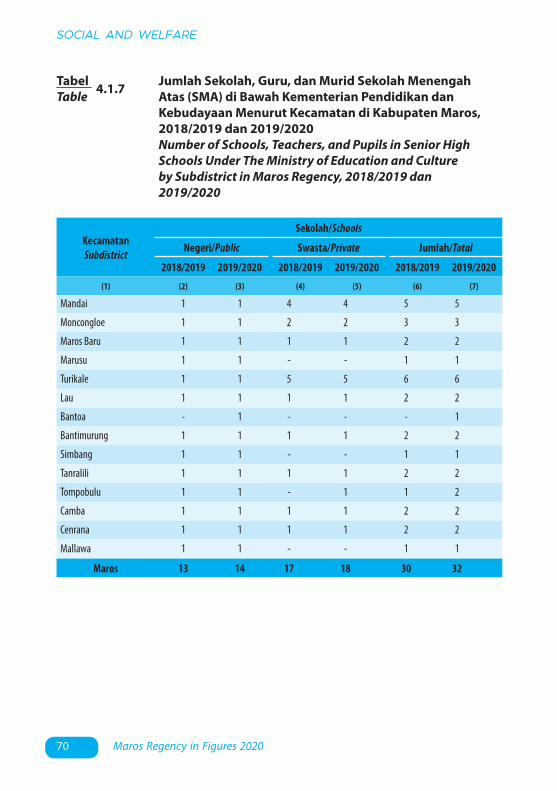
70 Maros Regency in Figures 2020
SOCIAL AND WELFARE
TabelTable 4.1.7 Jumlah Sekolah, Guru, dan Murid Sekolah Menengah
Atas (SMA) di Bawah Kementerian Pendidikan dan Kebudayaan Menurut Kecamatan di Kabupaten Maros, 2018/2019 dan 2019/2020
Number of Schools, Teachers, and Pupils in Senior High Schools Under The Ministry of Education and Culture by Subdistrict in Maros Regency, 2018/2019 dan 2019/2020
KecamatanSubdistrict
Sekolah/Schools
Negeri/Public Swasta/Private Jumlah/Total
2018/2019 2019/2020 2018/2019 2019/2020 2018/2019 2019/2020
(1) (2) (3) (4) (5) (6) (7)
Mandai 1 1 4 4 5 5
Moncongloe 1 1 2 2 3 3
Maros Baru 1 1 1 1 2 2
Marusu 1 1 - - 1 1
Turikale 1 1 5 5 6 6
Lau 1 1 1 1 2 2
Bantoa - 1 - - - 1
Bantimurung 1 1 1 1 2 2
Simbang 1 1 - - 1 1
Tanralili 1 1 1 1 2 2
Tompobulu 1 1 - 1 1 2
Camba 1 1 1 1 2 2
Cenrana 1 1 1 1 2 2
Mallawa 1 1 - - 1 1
Maros 13 14 17 18 30 32
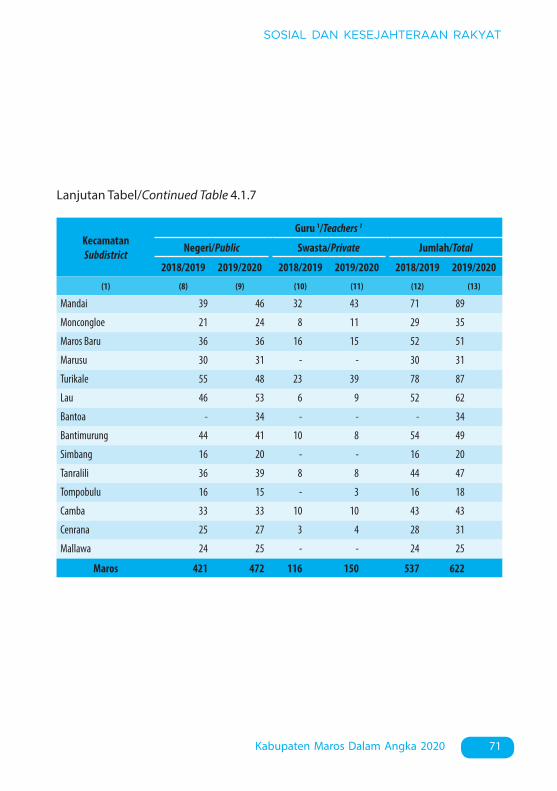
71Kabupaten Maros Dalam Angka 2020
SOSIAL DAN KESEJAHTERAAN RAKYAT
Lanjutan Tabel/Continued Table 4.1.7
KecamatanSubdistrict
Guru 1/Teachers 1
Negeri/Public Swasta/Private Jumlah/Total
2018/2019 2019/2020 2018/2019 2019/2020 2018/2019 2019/2020
(1) (8) (9) (10) (11) (12) (13)
Mandai 39 46 32 43 71 89
Moncongloe 21 24 8 11 29 35
Maros Baru 36 36 16 15 52 51
Marusu 30 31 - - 30 31
Turikale 55 48 23 39 78 87
Lau 46 53 6 9 52 62
Bantoa - 34 - - - 34
Bantimurung 44 41 10 8 54 49
Simbang 16 20 - - 16 20
Tanralili 36 39 8 8 44 47
Tompobulu 16 15 - 3 16 18
Camba 33 33 10 10 43 43
Cenrana 25 27 3 4 28 31
Mallawa 24 25 - - 24 25
Maros 421 472 116 150 537 622
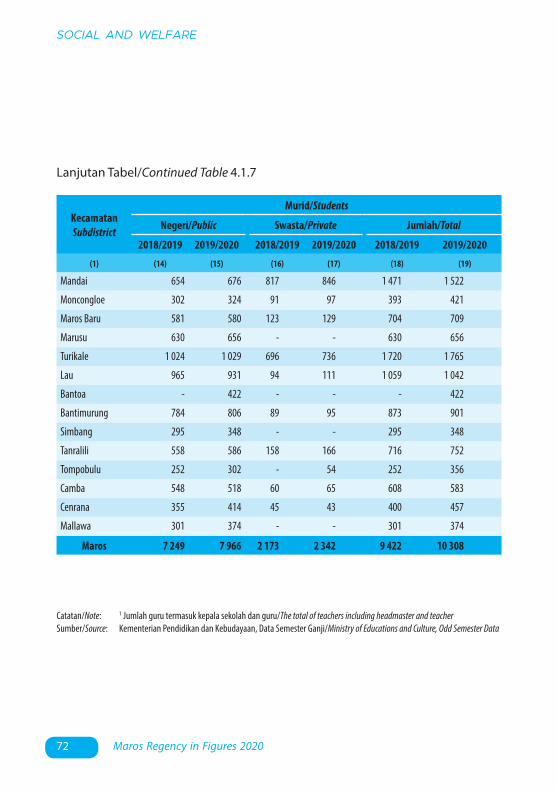
72 Maros Regency in Figures 2020
SOCIAL AND WELFARE
Lanjutan Tabel/Continued Table 4.1.7
Catatan/Note: 1 Jumlah guru termasuk kepala sekolah dan guru/The total of teachers including headmaster and teacherSumber/Source: Kementerian Pendidikan dan Kebudayaan, Data Semester Ganji/Ministry of Educations and Culture, Odd Semester Data
KecamatanSubdistrict
Murid/Students
Negeri/Public Swasta/Private Jumlah/Total
2018/2019 2019/2020 2018/2019 2019/2020 2018/2019 2019/2020
(1) (14) (15) (16) (17) (18) (19)
Mandai 654 676 817 846 1 471 1 522
Moncongloe 302 324 91 97 393 421
Maros Baru 581 580 123 129 704 709
Marusu 630 656 - - 630 656
Turikale 1 024 1 029 696 736 1 720 1 765
Lau 965 931 94 111 1 059 1 042
Bantoa - 422 - - - 422
Bantimurung 784 806 89 95 873 901
Simbang 295 348 - - 295 348
Tanralili 558 586 158 166 716 752
Tompobulu 252 302 - 54 252 356
Camba 548 518 60 65 608 583
Cenrana 355 414 45 43 400 457
Mallawa 301 374 - - 301 374
Maros 7 249 7 966 2 173 2 342 9 422 10 308

73Kabupaten Maros Dalam Angka 2020
SOSIAL DAN KESEJAHTERAAN RAKYAT
TabelTable 4.1.8 Jumlah Sekolah, Guru, dan Murid Sekolah Menengah
Kejuruan (SMK) di Bawah Kementerian Pendidikan dan Kebudayaan Menurut Kecamatan di Kabupaten Maros, 2018/2019 dan 2019/2020
Number of Schools, Teachers, and Pupils in Vocational High Schools Under The Ministry of Education and Culture by Subdistrict in Maros Regencyy, 2018/2019 dan 2019/2020
KecamatanSubdistrict
Sekolah/Schools Guru/Teachers Murid/Pupils
2018/2019 2019/2020 2018/2019 2019/2020 2018/2019 2019/2020
(1) (2) (3) (4) (5) (6) (7)
Mandai 3 3 24 24 194 152
Moncongloe 1 1 16 15 197 228
Maros Baru 1 1 7 7 51 55
Marusu 1 1 11 12 58 67
Turikale 3 4 28 29 506 476
Lau 2 2 73 85 1 366 1 470
Bantoa - - - - - -
Bantimurung 2 2 16 14 83 84
Simbang 1 1 32 31 649 695
Tanralili 2 2 24 22 283 282
Tompobulu 1 1 9 9 69 67
Camba - - - - - -
Cenrana 1 1 4 4 24 6
Mallawa - - - - - -
Maros 18 19 244 252 3 480 3 582
Catatan/Note: ...Sumber/Source: Kementerian Agama, Data Semester Ganjil/Ministry of Religious Affairs, Odd Semester Data
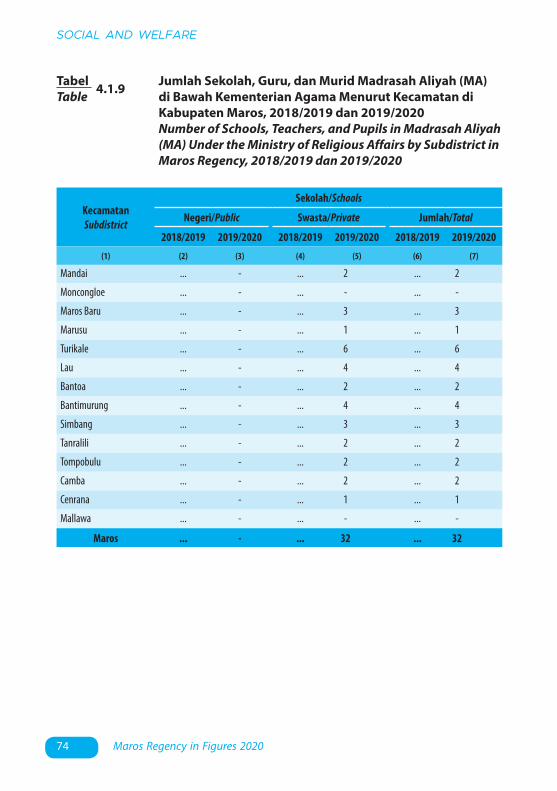
74 Maros Regency in Figures 2020
SOCIAL AND WELFARE
TabelTable 4.1.9 Jumlah Sekolah, Guru, dan Murid Madrasah Aliyah (MA)
di Bawah Kementerian Agama Menurut Kecamatan di Kabupaten Maros, 2018/2019 dan 2019/2020
Number of Schools, Teachers, and Pupils in Madrasah Aliyah (MA) Under the Ministry of Religious Affairs by Subdistrict in Maros Regency, 2018/2019 dan 2019/2020
KecamatanSubdistrict
Sekolah/Schools
Negeri/Public Swasta/Private Jumlah/Total
2018/2019 2019/2020 2018/2019 2019/2020 2018/2019 2019/2020
(1) (2) (3) (4) (5) (6) (7)
Mandai ... - ... 2 ... 2
Moncongloe ... - ... - ... -
Maros Baru ... - ... 3 ... 3
Marusu ... - ... 1 ... 1
Turikale ... - ... 6 ... 6
Lau ... - ... 4 ... 4
Bantoa ... - ... 2 ... 2
Bantimurung ... - ... 4 ... 4
Simbang ... - ... 3 ... 3
Tanralili ... - ... 2 ... 2
Tompobulu ... - ... 2 ... 2
Camba ... - ... 2 ... 2
Cenrana ... - ... 1 ... 1
Mallawa ... - ... - ... -
Maros ... - ... 32 ... 32

75Kabupaten Maros Dalam Angka 2020
SOSIAL DAN KESEJAHTERAAN RAKYAT
Lanjutan Tabel/Continued Table 4.1.9
KecamatanSubdistrict
Guru 1/Teachers 1
Negeri/Public Swasta/Private Jumlah/Total
2018/2019 2019/2020 2018/2019 2019/2020 2018/2019 2019/2020
(1) (8) (9) (10) (11) (12) (13)
Mandai ... - ... 34 ... 34
Moncongloe ... - ... - ... -
Maros Baru ... - ... 22 ... 22
Marusu ... - ... 13 ... 13
Turikale ... - ... 67 ... 67
Lau ... - ... 66 ... 66
Bantoa ... - ... 33 ... 33
Bantimurung ... - ... 38 ... 38
Simbang ... - ... 26 ... 26
Tanralili ... - ... 18 ... 18
Tompobulu ... - ... 16 ... 16
Camba ... - ... 20 ... 20
Cenrana ... - ... 19 ... 19
Mallawa ... - ... - ... -
Maros ... - ... 372 ... 372

76 Maros Regency in Figures 2020
SOCIAL AND WELFARE
Lanjutan Tabel/Continued Table 4.1.9
Catatan/Note: ...Sumber/Source: Kementerian Agama, Data Semester Ganjil/Ministry of Religious Affairs, Odd Semester Data
KecamatanSubdistrict
Murid/Students
Negeri/Public Swasta/Private Jumlah/Total
2018/2019 2019/2020 2018/2019 2019/2020 2018/2019 2019/2020
(1) (14) (15) (16) (17) (18) (19)
Mandai ... - ... 329 ... 329
Moncongloe ... - ... - ... -
Maros Baru ... - ... 275 ... 275
Marusu ... - ... 181 ... 181
Turikale ... - ... 600 ... 600
Lau ... - ... 594 ... 594
Bantoa ... - ... 609 ... 609
Bantimurung ... - ... 327 ... 327
Simbang ... - ... 377 ... 377
Tanralili ... - ... 181 ... 181
Tompobulu ... - ... 246 ... 246
Camba ... - ... 161 ... 161
Cenrana ... - ... 75 ... 75
Mallawa ... - ... - ... -
Maros ... - ... 3 955 ... 3 955
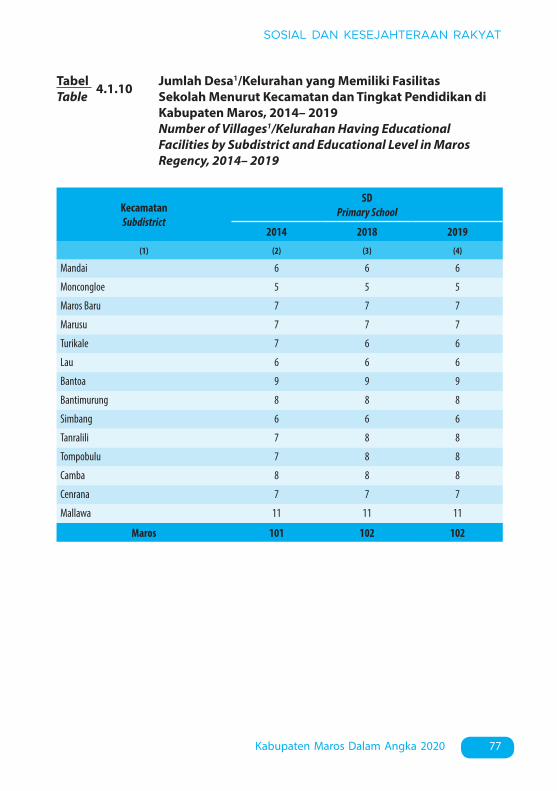
77Kabupaten Maros Dalam Angka 2020
SOSIAL DAN KESEJAHTERAAN RAKYAT
TabelTable 4.1.10 Jumlah Desa1/Kelurahan yang Memiliki Fasilitas
Sekolah Menurut Kecamatan dan Tingkat Pendidikan di Kabupaten Maros, 2014– 2019
Number of Villages1/Kelurahan Having Educational Facilities by Subdistrict and Educational Level in Maros Regency, 2014– 2019
KecamatanSubdistrict
SDPrimary School
2014 2018 2019
(1) (2) (3) (4)
Mandai 6 6 6
Moncongloe 5 5 5
Maros Baru 7 7 7
Marusu 7 7 7
Turikale 7 6 6
Lau 6 6 6
Bantoa 9 9 9
Bantimurung 8 8 8
Simbang 6 6 6
Tanralili 7 8 8
Tompobulu 7 8 8
Camba 8 8 8
Cenrana 7 7 7
Mallawa 11 11 11
Maros 101 102 102

78 Maros Regency in Figures 2020
SOCIAL AND WELFARE
KecamatanSubdistrict
SMPJunior High School
2014 2018 2019
(1) (5) (6) (7)
Mandai 3 3 4
Moncongloe 4 4 4
Maros Baru 4 5 5
Marusu 5 5 5
Turikale 6 6 6
Lau 5 5 5
Bantoa 5 6 7
Bantimurung 5 5 6
Simbang 5 5 5
Tanralili 3 4 3
Tompobulu 5 7 7
Camba 5 5 6
Cenrana 6 6 5
Mallawa 5 4 4
Maros 66 70 72
Lanjutan Tabel/Continued Table 4.1.10

79Kabupaten Maros Dalam Angka 2020
SOSIAL DAN KESEJAHTERAAN RAKYAT
KecamatanSubdistrict
SMASenior High School
2014 2018 2019
(1) (8) (9) (10)
Mandai 3 3 3
Moncongloe 2 2 2
Maros Baru 3 3 3
Marusu 2 2 2
Turikale 5 6 6
Lau 3 3 3
Bantoa 3 4 4
Bantimurung 2 4 4
Simbang 4 4 4
Tanralili 3 4 2
Tompobulu 3 4 3
Camba 2 2 3
Cenrana 3 3 2
Mallawa 1 1 1
Maros 39 45 42
Lanjutan Tabel/Continued Table 4.1.10

80 Maros Regency in Figures 2020
SOCIAL AND WELFARE
KecamatanSubdistrict
SMKVocational School
2014 2018 2019
(1) (11) (12) (13)
Mandai 1 2 1
Moncongloe 1 1 1
Maros Baru 1 1 1
Marusu 1 1 1
Turikale 3 2 3
Lau 1 1 1
Bantoa 0 0 1
Bantimurung 0 1 1
Simbang 1 1 1
Tanralili 0 2 2
Tompobulu 0 2 1
Camba 0 0 –
Cenrana 2 1 1
Mallawa 0 0 –
Maros 11 15 15
Lanjutan Tabel/Continued Table 4.1.10

81Kabupaten Maros Dalam Angka 2020
SOSIAL DAN KESEJAHTERAAN RAKYAT
KecamatanSubdistrict
Perguruan TinggiUniversity
2014 2018 2019
(1) (14) (15) (16)
Mandai 1 0 –
Moncongloe 0 1 1
Maros Baru 0 0 –
Marusu 1 0 –
Turikale 4 4 3
Lau 1 1 1
Bantoa 0 0 –
Bantimurung 0 0 –
Simbang 0 0 –
Tanralili 0 0 –
Tompobulu 0 0 –
Camba 0 0 –
Cenrana 0 0 1
Mallawa 0 0 –
Maros 7 6 6
Lanjutan Tabel/Continued Table 4.1.10
Catatan/Note: 1 Desa pada tabel ini termasuk Unit Permukiman Transmigrasi (UPT) yang masih dibina oleh kementerian terkait dan nagari di Provinsi Sumatera Barat/Villages in this table include Transmigration Settlement Unit which is still fostered by the relevant ministries and the nagari in the Province of Sumatera Barat
Sumber/Source: BPS, Pendataan Potensi Desa (Podes)/ BPS-Statistics Indonesia, Village Potential Data Collection

82 Maros Regency in Figures 2020
SOCIAL AND WELFARE
TabelTable 4.1.11 Angka Partisipasi Murni (APM) dan Angka Partisipasi
Kasar (APK) Menurut Jenjang Pendidikan di Kabupaten Maros, 2018 dan 2019
Net Participation Rates and Gross Participation Rates by Educational Level Maros Regency, 2018 and 2019
Jenjang PendidikanEducational Level
Angka Partisipasi Murni (APM)Net Participation Rates
Angka Partisipasi Kasar (APK)Gross Participation Rates
2018 2019 2018 2019
(1) (2) (3) (4) (5)
SD/MI Elementary School
... 100 ... 111,20
SMP/MTs Junior High School
... 79,74 ... 74,06
SMA/SMK/MA Senior High School
... 64,28 ... 87,87
Catatan/Note: ...Sumber/Source: BPS, Survei Sosial Ekonomi Nasional (Susenas)/BPS-Statistics Indonesia, National Socioeconomic Survey
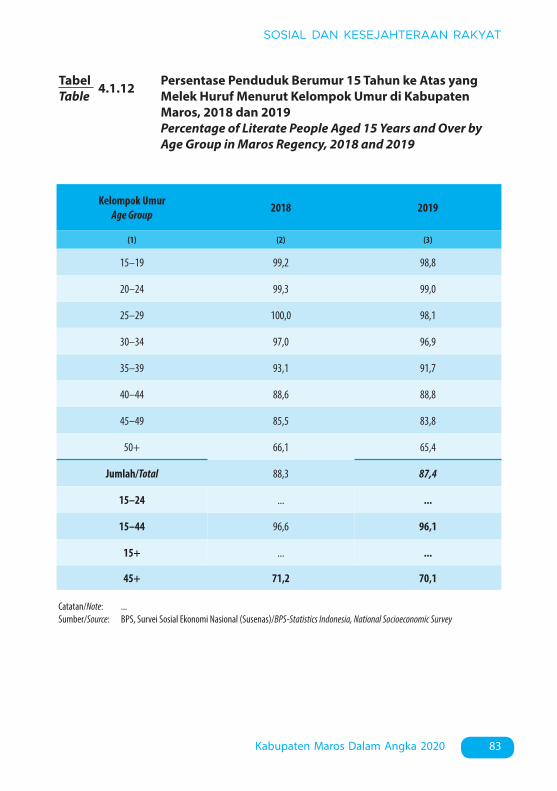
83Kabupaten Maros Dalam Angka 2020
SOSIAL DAN KESEJAHTERAAN RAKYAT
TabelTable 4.1.12 Persentase Penduduk Berumur 15 Tahun ke Atas yang
Melek Huruf Menurut Kelompok Umur di Kabupaten Maros, 2018 dan 2019
Percentage of Literate People Aged 15 Years and Over by Age Group in Maros Regency, 2018 and 2019
Kelompok UmurAge Group 2018 2019
(1) (2) (3)
15–19 99,2 98,8
20–24 99,3 99,0
25–29 100,0 98,1
30–34 97,0 96,9
35–39 93,1 91,7
40–44 88,6 88,8
45–49 85,5 83,8
50+ 66,1 65,4
Jumlah/Total 88,3 87,4
15–24 ... ...
15–44 96,6 96,1
15+ ... ...
45+ 71,2 70,1
Catatan/Note: ...Sumber/Source: BPS, Survei Sosial Ekonomi Nasional (Susenas)/BPS-Statistics Indonesia, National Socioeconomic Survey

84 Maros Regency in Figures 2020
SOCIAL AND WELFARE
KecamatanSubdistrict
Rumah SakitHospital
2014 2018 2019
(1) (2) (3) (4)
Mandai 1 1 1
Moncongloe 0 0 –
Maros Baru 0 0 –
Marusu 0 0 –
Turikale 1 1 1
Lau 0 0 –
Bantoa 0 0 –
Bantimurung 0 0 –
Simbang 0 0 –
Tanralili 0 0 –
Tompobulu 0 0 –
Camba 0 0 –
Cenrana 0 0 –
Mallawa 0 0 –
Maros 2 2 2
TabelTable 4.2.1 Jumlah Desa1/Kelurahan Yang Memiliki Sarana Kesehatan
Menurut Kecamatan di Kabupaten Maros, 2014–2019 Number of Villages1/Kelurahan Having Health Facilities by
Subdistrict in Maros Regency, 2014–2019
4.2 KESEHATAN HEALTH

85Kabupaten Maros Dalam Angka 2020
SOSIAL DAN KESEJAHTERAAN RAKYAT
KecamatanSubdistrict
Rumah Sakit BersalinMaternity Hospital
2014 2018 2019
(1) (5) (6) (7)
Mandai – – –
Moncongloe – – –
Maros Baru – – –
Marusu – – –
Turikale – – –
Lau – – –
Bantoa – – –
Bantimurung – – –
Simbang – – –
Tanralili – – –
Tompobulu – – –
Camba – – –
Cenrana – – –
Mallawa – – –
Maros – – –
Lanjutan Tabel/Continued Table 4.2.1
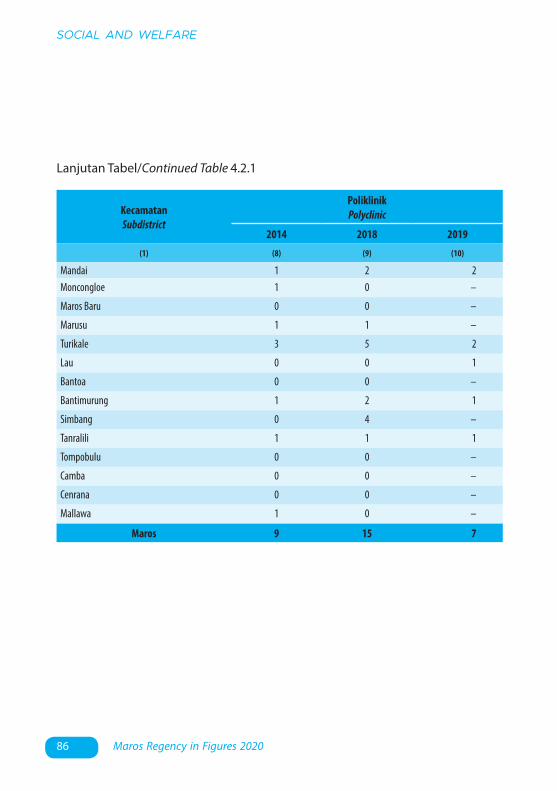
86 Maros Regency in Figures 2020
SOCIAL AND WELFARE
KecamatanSubdistrict
PoliklinikPolyclinic
2014 2018 2019
(1) (8) (9) (10)
Mandai 1 2 2 Moncongloe 1 0 –
Maros Baru 0 0 –
Marusu 1 1 –
Turikale 3 5 2
Lau 0 0 1
Bantoa 0 0 –
Bantimurung 1 2 1
Simbang 0 4 –
Tanralili 1 1 1
Tompobulu 0 0 –
Camba 0 0 –
Cenrana 0 0 –
Mallawa 1 0 –
Maros 9 15 7
Lanjutan Tabel/Continued Table 4.2.1
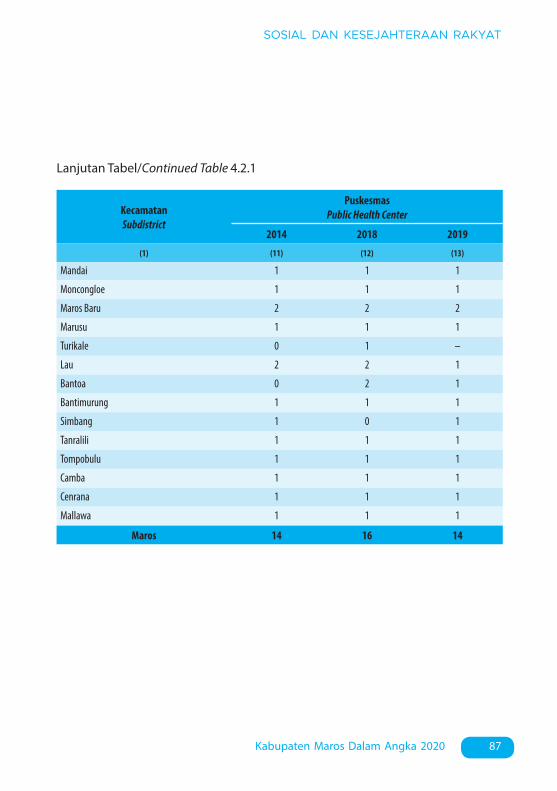
87Kabupaten Maros Dalam Angka 2020
SOSIAL DAN KESEJAHTERAAN RAKYAT
KecamatanSubdistrict
PuskesmasPublic Health Center
2014 2018 2019
(1) (11) (12) (13)
Mandai 1 1 1
Moncongloe 1 1 1
Maros Baru 2 2 2
Marusu 1 1 1
Turikale 0 1 –
Lau 2 2 1
Bantoa 0 2 1
Bantimurung 1 1 1
Simbang 1 0 1
Tanralili 1 1 1
Tompobulu 1 1 1
Camba 1 1 1
Cenrana 1 1 1
Mallawa 1 1 1
Maros 14 16 14
Lanjutan Tabel/Continued Table 4.2.1
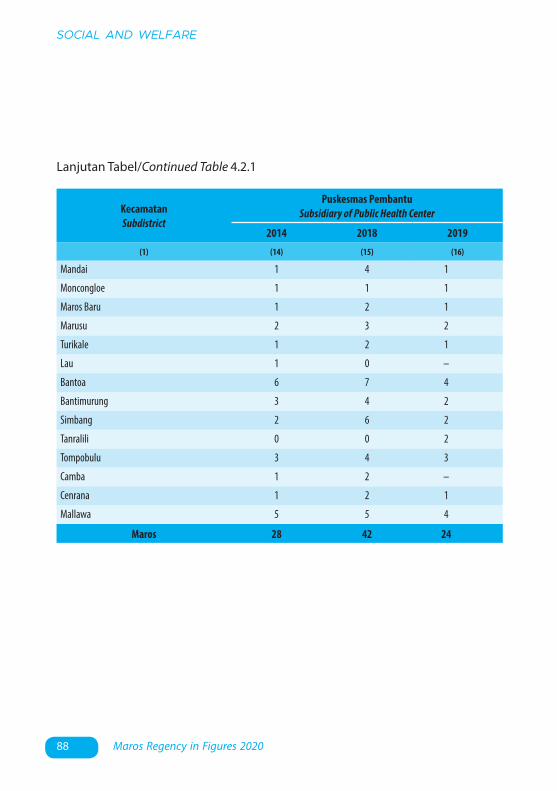
88 Maros Regency in Figures 2020
SOCIAL AND WELFARE
KecamatanSubdistrict
Puskesmas PembantuSubsidiary of Public Health Center
2014 2018 2019
(1) (14) (15) (16)
Mandai 1 4 1
Moncongloe 1 1 1
Maros Baru 1 2 1
Marusu 2 3 2
Turikale 1 2 1
Lau 1 0 –
Bantoa 6 7 4
Bantimurung 3 4 2
Simbang 2 6 2
Tanralili 0 0 2
Tompobulu 3 4 3
Camba 1 2 –
Cenrana 1 2 1
Mallawa 5 5 4
Maros 28 42 24
Lanjutan Tabel/Continued Table 4.2.1
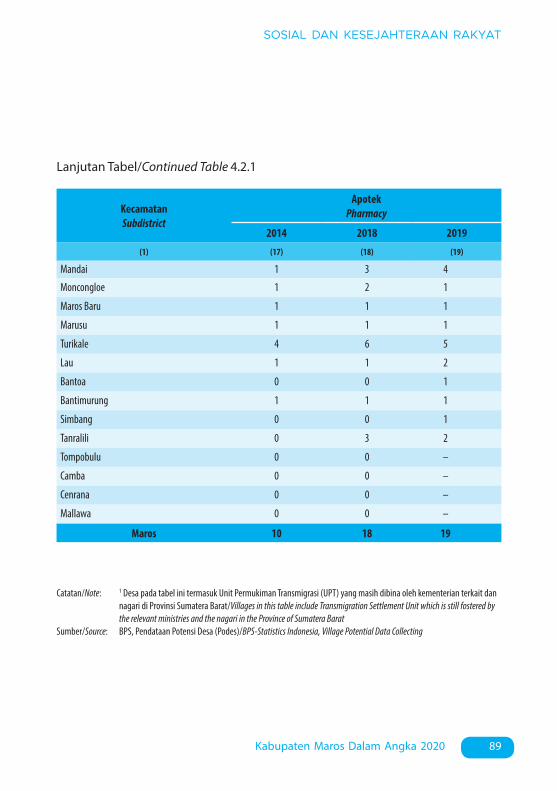
89Kabupaten Maros Dalam Angka 2020
SOSIAL DAN KESEJAHTERAAN RAKYAT
KecamatanSubdistrict
ApotekPharmacy
2014 2018 2019
(1) (17) (18) (19)
Mandai 1 3 4
Moncongloe 1 2 1
Maros Baru 1 1 1
Marusu 1 1 1
Turikale 4 6 5
Lau 1 1 2
Bantoa 0 0 1
Bantimurung 1 1 1
Simbang 0 0 1
Tanralili 0 3 2
Tompobulu 0 0 –
Camba 0 0 –
Cenrana 0 0 –
Mallawa 0 0 –
Maros 10 18 19
Lanjutan Tabel/Continued Table 4.2.1
Catatan/Note: 1 Desa pada tabel ini termasuk Unit Permukiman Transmigrasi (UPT) yang masih dibina oleh kementerian terkait dan nagari di Provinsi Sumatera Barat/Villages in this table include Transmigration Settlement Unit which is still fostered by the relevant ministries and the nagari in the Province of Sumatera Barat
Sumber/Source: BPS, Pendataan Potensi Desa (Podes)/BPS-Statistics Indonesia, Village Potential Data Collecting
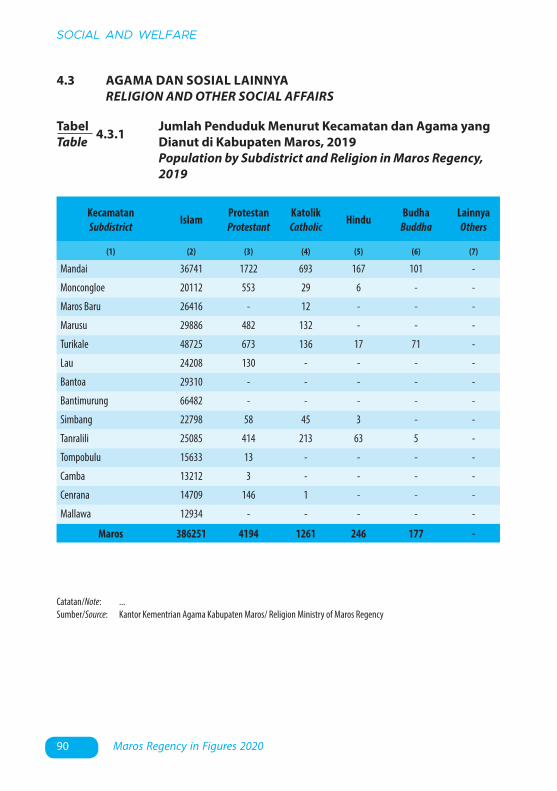
90 Maros Regency in Figures 2020
SOCIAL AND WELFARE
Catatan/Note: ...Sumber/Source: Kantor Kementrian Agama Kabupaten Maros/ Religion Ministry of Maros Regency
KecamatanSubdistrict Islam Protestan
ProtestantKatolik Catholic Hindu Budha
BuddhaLainnya Others
(1) (2) (3) (4) (5) (6) (7)
Mandai 36741 1722 693 167 101 -
Moncongloe 20112 553 29 6 - -
Maros Baru 26416 - 12 - - -
Marusu 29886 482 132 - - -
Turikale 48725 673 136 17 71 -
Lau 24208 130 - - - -
Bantoa 29310 - - - - -
Bantimurung 66482 - - - - -
Simbang 22798 58 45 3 - -
Tanralili 25085 414 213 63 5 -
Tompobulu 15633 13 - - - -
Camba 13212 3 - - - -
Cenrana 14709 146 1 - - -
Mallawa 12934 - - - - -
Maros 386251 4194 1261 246 177 -
TabelTable 4.3.1 Jumlah Penduduk Menurut Kecamatan dan Agama yang
Dianut di Kabupaten Maros, 2019 Population by Subdistrict and Religion in Maros Regency,
2019
4.3 AGAMA DAN SOSIAL LAINNYA RELIGION AND OTHER SOCIAL AFFAIRS

91Kabupaten Maros Dalam Angka 2020
SOSIAL DAN KESEJAHTERAAN RAKYAT
Catatan/Note: ...Sumber/Source: Kantor Kementrian Agama Kabupaten Maros/ Religion Ministry of Maros Regency
KecamatanSubdistrict
MasjidMosque
MusholaPray
Room
GerejaProtestanProtestant
Church
GerejaKatholikCatholicChurch
PuraTemple Vihara
(1) (2) (3) (4) (5) (6) (7)
Mandai 69 9 1 1 - -
Moncongloe 43 8 1 1 - -
Maros Baru 43 9 - - - -
Marusu 37 6 1 1 - -
Turikale 60 18 1 1 - -
Lau 44 8 - - - -
Bantoa 49 8 - - - -
Bantimurung 69 7 - - - -
Simbang 54 5 - 1 - -
Tanralili 58 7 2 - - -
Tompobulu 47 4 1 - - -
Camba 53 3 - - - -
Cenrana 47 3 1 - - -
Mallawa 42 5 - - - -
Maros 715 100 8 5 1 -
TabelTable 4.3.2 Jumlah Tempat Peribadatan Menurut Kecamatan di
Kabupaten Maros, 2019 Number of Places of Worship by Subdistrict in Maros
Regency, 2019

92 Maros Regency in Figures 2020
SOCIAL AND WELFARE
KecamatanSubdistrict
Banjir/Flood
2011 2014 2018
(1) (2) (3) (4)
Mandai 0 1 1
Moncongloe 0 1 0
Maros Baru 7 7 7
Marusu 3 3 5
Turikale 1 7 6
Lau 3 6 4
Bantoa 3 6 3
Bantimurung 7 6 3
Simbang 4 6 4
Tanralili 0 1 0
Tompobulu 1 1 1
Camba 6 5 1
Cenrana 2 4 2
Mallawa 1 4 0
Maros 38 58 37
TabelTable 4.3.3 Jumlah Desa1/Kelurahan yang Mengalami Bencana Alam2
Menurut Kecamatan di Kabupaten Maros, 2011–2018 Number of Villages1/Kelurahan that Had Natural Disaster2
by Subdistrict in Maros Regency, 2011–2018
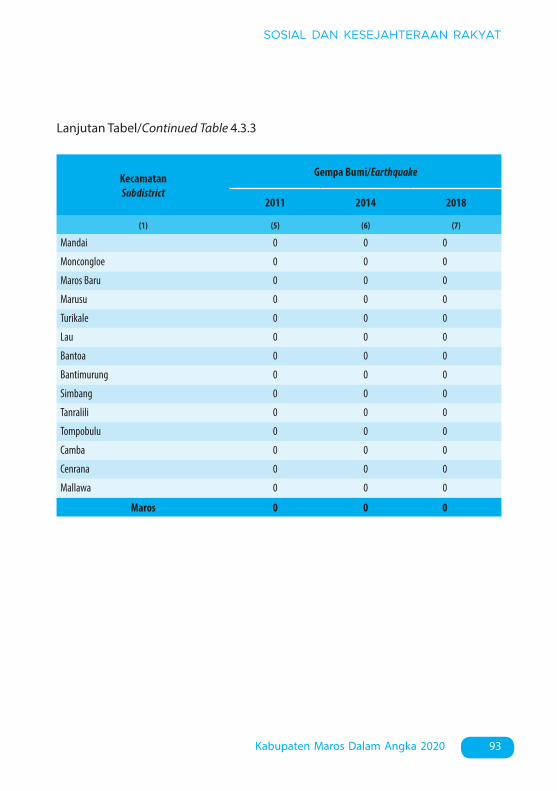
93Kabupaten Maros Dalam Angka 2020
SOSIAL DAN KESEJAHTERAAN RAKYAT
KecamatanSubdistrict
Gempa Bumi/Earthquake
2011 2014 2018
(1) (5) (6) (7)
Mandai 0 0 0
Moncongloe 0 0 0
Maros Baru 0 0 0
Marusu 0 0 0
Turikale 0 0 0
Lau 0 0 0
Bantoa 0 0 0
Bantimurung 0 0 0
Simbang 0 0 0
Tanralili 0 0 0
Tompobulu 0 0 0
Camba 0 0 0
Cenrana 0 0 0
Mallawa 0 0 0
Maros 0 0 0
Lanjutan Tabel/Continued Table 4.3.3
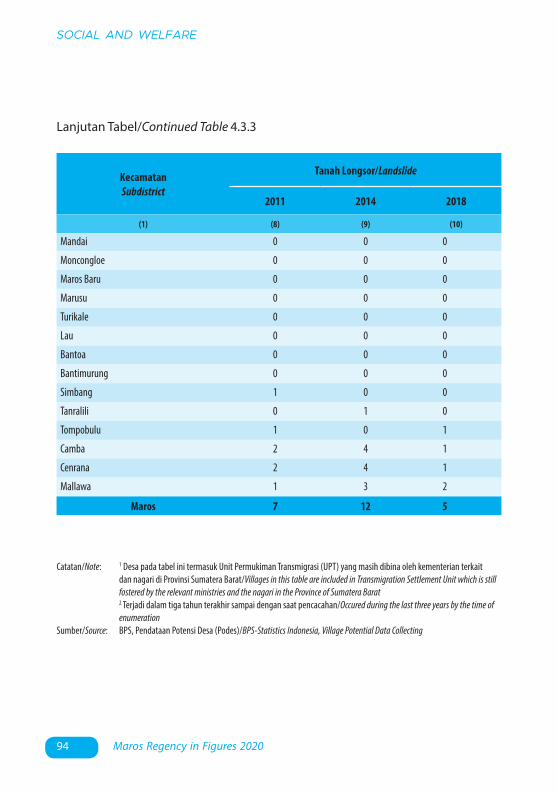
94 Maros Regency in Figures 2020
SOCIAL AND WELFARE
KecamatanSubdistrict
Tanah Longsor/Landslide
2011 2014 2018
(1) (8) (9) (10)
Mandai 0 0 0
Moncongloe 0 0 0
Maros Baru 0 0 0
Marusu 0 0 0
Turikale 0 0 0
Lau 0 0 0
Bantoa 0 0 0
Bantimurung 0 0 0
Simbang 1 0 0
Tanralili 0 1 0
Tompobulu 1 0 1
Camba 2 4 1
Cenrana 2 4 1
Mallawa 1 3 2
Maros 7 12 5
Catatan/Note: 1 Desa pada tabel ini termasuk Unit Permukiman Transmigrasi (UPT) yang masih dibina oleh kementerian terkait dan nagari di Provinsi Sumatera Barat/Villages in this table are included in Transmigration Settlement Unit which is still fostered by the relevant ministries and the nagari in the Province of Sumatera Barat
2 Terjadi dalam tiga tahun terakhir sampai dengan saat pencacahan/Occured during the last three years by the time of enumeration
Sumber/Source: BPS, Pendataan Potensi Desa (Podes)/BPS-Statistics Indonesia, Village Potential Data Collecting
Lanjutan Tabel/Continued Table 4.3.3
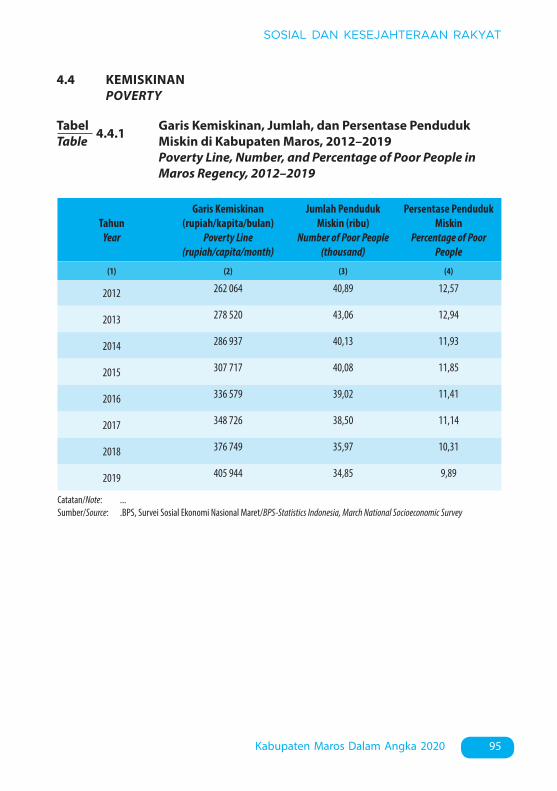
95Kabupaten Maros Dalam Angka 2020
SOSIAL DAN KESEJAHTERAAN RAKYAT
TabelTable 4.4.1 Garis Kemiskinan, Jumlah, dan Persentase Penduduk
Miskin di Kabupaten Maros, 2012–2019 Poverty Line, Number, and Percentage of Poor People in
Maros Regency, 2012–2019
4.4 KEMISKINAN POVERTY
TahunYear
Garis Kemiskinan(rupiah/kapita/bulan)
Poverty Line(rupiah/capita/month)
Jumlah PendudukMiskin (ribu)
Number of Poor People(thousand)
Persentase Penduduk Miskin
Percentage of Poor People
(1) (2) (3) (4)
2012 262 064 40,89 12,57
2013 278 520 43,06 12,94
2014 286 937 40,13 11,93
2015 307 717 40,08 11,85
2016 336 579 39,02 11,41
2017 348 726 38,50 11,14
2018 376 749 35,97 10,31
2019 405 944 34,85 9,89
Catatan/Note: ...Sumber/Source: .BPS, Survei Sosial Ekonomi Nasional Maret/BPS-Statistics Indonesia, March National Socioeconomic Survey
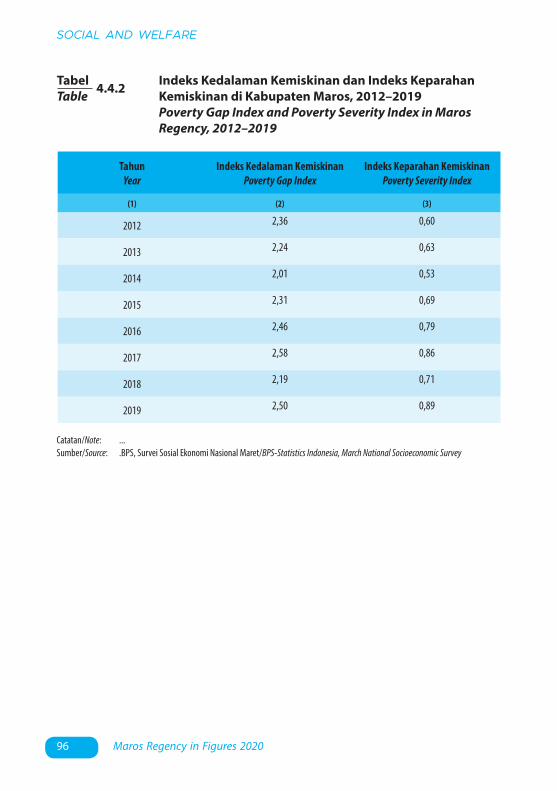
96 Maros Regency in Figures 2020
SOCIAL AND WELFARE
TabelTable 4.4.2 Indeks Kedalaman Kemiskinan dan Indeks Keparahan
Kemiskinan di Kabupaten Maros, 2012–2019 Poverty Gap Index and Poverty Severity Index in Maros
Regency, 2012–2019
TahunYear
Indeks Kedalaman KemiskinanPoverty Gap Index
Indeks Keparahan KemiskinanPoverty Severity Index
(1) (2) (3)
2012 2,36 0,60
2013 2,24 0,63
2014 2,01 0,53
2015 2,31 0,69
2016 2,46 0,79
2017 2,58 0,86
2018 2,19 0,71
2019 2,50 0,89
Catatan/Note: ...Sumber/Source: .BPS, Survei Sosial Ekonomi Nasional Maret/BPS-Statistics Indonesia, March National Socioeconomic Survey

5. Pertanian, Kehutanan, Peternakan, dan Perikanan/Agriculture, Forestry, Livestock, and Fishery ..............................................................................
5. PERTANIAN, KEHUTANAN, PETERNAKAN, DAN PERIKANAN/AGRICULTURE, FORESTRY, LIVESTOCK, AND FISHERY
THANKS FOR THE MEMORIES!
Mangga adalah buahterbanyak yang dihasilkan
Kab Maros pada tahun 2019yaitu
7.612 ton
PERTANIAN, KEHUTANAN, PETERNAKAN, DAN PERIKANAN
AGRICULTURE, FORESTRY, LIVESTOCK,AND FISHERY
05

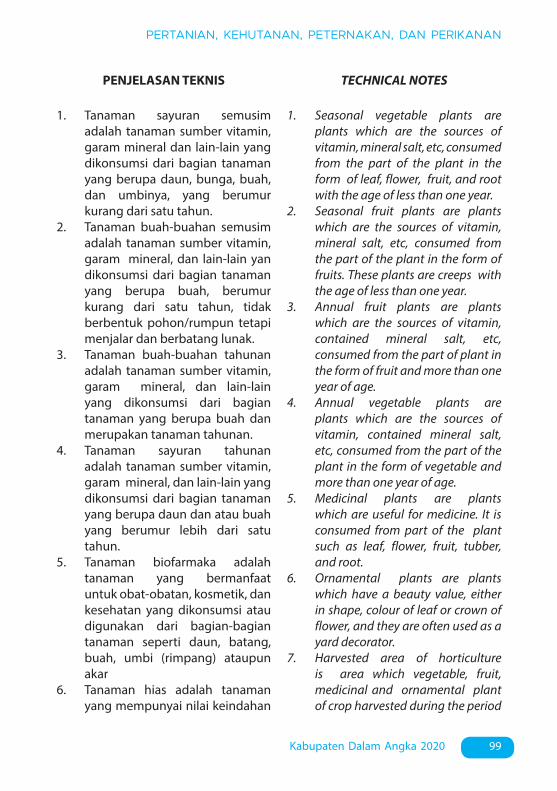
99Kabupaten Dalam Angka 2020
PERTANIAN, KEHUTANAN, PETERNAKAN, DAN PERIKANAN
PENJELASAN TEKNIS TECHNICAL NOTES
1. Tanaman sayuran semusim adalah tanaman sumber vitamin, garam mineral dan lain-lain yang dikonsumsi dari bagian tanaman yang berupa daun, bunga, buah, dan umbinya, yang berumur kurang dari satu tahun.
2. Tanaman buah-buahan semusim adalah tanaman sumber vitamin, garam mineral, dan lain-lain yan dikonsumsi dari bagian tanaman yang berupa buah, berumur kurang dari satu tahun, tidak berbentuk pohon/rumpun tetapi menjalar dan berbatang lunak.
3. Tanaman buah-buahan tahunan adalah tanaman sumber vitamin, garam mineral, dan lain-lain yang dikonsumsi dari bagian tanaman yang berupa buah dan merupakan tanaman tahunan.
4. Tanaman sayuran tahunan adalah tanaman sumber vitamin, garam mineral, dan lain-lain yang dikonsumsi dari bagian tanaman yang berupa daun dan atau buah yang berumur lebih dari satu tahun.
5. Tanaman biofarmaka adalah tanaman yang bermanfaat untuk obat-obatan, kosmetik, dan kesehatan yang dikonsumsi atau digunakan dari bagian-bagian tanaman seperti daun, batang, buah, umbi (rimpang) ataupun akar
6. Tanaman hias adalah tanaman yang mempunyai nilai keindahan
1. Seasonal vegetable plants are plants which are the sources of vitamin, mineral salt, etc, consumed from the part of the plant in the form of leaf, flower, fruit, and root with the age of less than one year.
2. Seasonal fruit plants are plants which are the sources of vitamin, mineral salt, etc, consumed from the part of the plant in the form of fruits. These plants are creeps with the age of less than one year.
3. Annual fruit plants are plants which are the sources of vitamin, contained mineral salt, etc, consumed from the part of plant in the form of fruit and more than one year of age.
4. Annual vegetable plants are plants which are the sources of vitamin, contained mineral salt, etc, consumed from the part of the plant in the form of vegetable and more than one year of age.
5. Medicinal plants are plants which are useful for medicine. It is consumed from part of the plant such as leaf, flower, fruit, tubber, and root.
6. Ornamental plants are plants which have a beauty value, either in shape, colour of leaf or crown of flower, and they are often used as a yard decorator.
7. Harvested area of horticulture is area which vegetable, fruit, medicinal and ornamental plant of crop harvested during the period

100 Maros Regency in Figures 2020
AGRICULTURE, FORESTRY, LIVESTOCK, AND FISHERY
baik bentuk, warna daun, tajuk maupun bunganya, sering digunakan untuk penghias pekarangan dan lain sebagainya.
7. Luas panen tanaman hortikultura adalah luas tanaman sayuran, buah-buahan, biofarmaka, dan tanaman hias yang diambil hasilnya/dipanen pada periode pelaporan.
8. Luas panen untuk tanaman sayuran adalah luas tanaman yang dipanen sekaligus/habis/dibongkar dan luas tanaman yang dipanen berkali-kali (lebih dari satu kali)/belum habis. Tanaman yang dipanen sekaligus/ habis/dibongkar adalah tanaman yang sehabis panen langsung dibongkar/dicabut, terdiri dari bawang merah, bawang putih, bawang daun, kentang, kol/kubis, kembang kol,Tanaman yang dipanen berkali-kali (lebih dari satu kali)/belum habis adalah tanaman yang pemanenannya lebih dari satu kali dan biasanya dibongkar apabila panenan terakhir sudah tidak memadai lagi, terdiri dari: kacang panjang, cabe besar, cabe rawit, jamur, tomat, terung, buncis, ketimun, labu siam, kangkung, bayam, melon, semangka, dan blewah.
9. Produksi hortikultura adalah hasil menurut bentuk produk dari setiap tanaman sayuran, buah-buahan, biofarmaka dan tanaman hias yang diambil berdasarkan luas yang dipanen/tanaman
of report.8. Harvested area of vegetables is
area of entirely plant harvested/demolished and plant harvested several times/ undemolished.Entirely plants harvested/ demolished are plants usually harvested once and demolished to be substituted by other plants, consisting of: shallots, garlic, leeks, potato, cabbage, cauli flower, mustard green, carrots, chinese radish, and red kidney beans.Plants harvested several times/ undemolished are plants usually harvested more than once and demolished in the case that the last harvest was economically not profitable. They consist of : yard long beans, chili, small chili, mushroom, tomatoes, egg plant, frech beans, cucumber, pumpkin/chajota, swamp cabbage, spinach, melon, watermelon, and blewah
9. Horticulture production is the standard production quantity form of vegetable, fruit, medicinal and ornamental plant based on harvested area/the number of production plants reported monthly/quarterly.
101Kabupaten Dalam Angka 2020
PERTANIAN, KEHUTANAN, PETERNAKAN, DAN PERIKANAN
yang menghasilkan pada bulan/triwulan laporan.
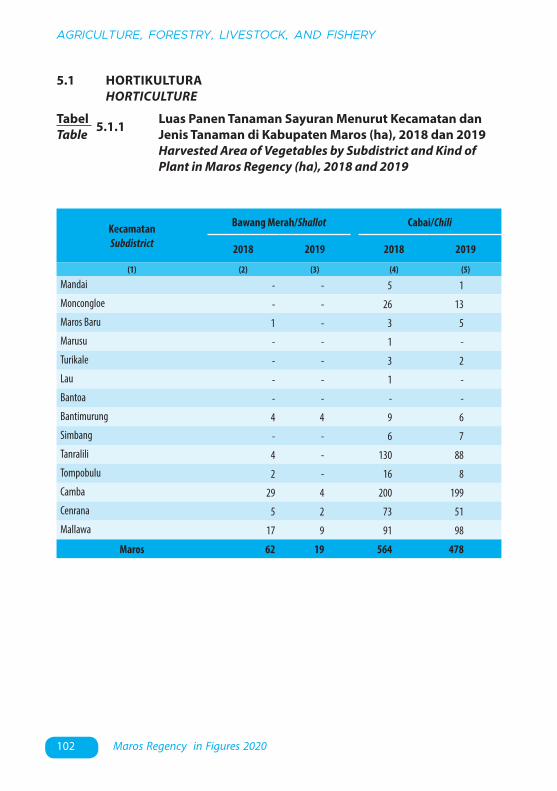
102 Maros Regency in Figures 2020
AGRICULTURE, FORESTRY, LIVESTOCK, AND FISHERY
TabelTable 5.1.1 Luas Panen Tanaman Sayuran Menurut Kecamatan dan
Jenis Tanaman di Kabupaten Maros (ha), 2018 dan 2019 Harvested Area of Vegetables by Subdistrict and Kind of
Plant in Maros Regency (ha), 2018 and 2019
5.1 HORTIKULTURA HORTICULTURE
KecamatanSubdistrict
Bawang Merah/Shallot Cabai/Chili
2018 2019 2018 2019
(1) (2) (3) (4) (5)
Mandai - - 5 1Moncongloe - - 26 13Maros Baru 1 - 3 5Marusu - - 1 -Turikale - - 3 2Lau - - 1 -Bantoa - - - -Bantimurung 4 4 9 6Simbang - - 6 7Tanralili 4 - 130 88Tompobulu 2 - 16 8Camba 29 4 200 199Cenrana 5 2 73 51Mallawa 17 9 91 98
Maros 62 19 564 478

103Kabupaten Dalam Angka 2020
PERTANIAN, KEHUTANAN, PETERNAKAN, DAN PERIKANAN
KecamatanSubdistrict
Kentang/Potato Kubis/Cabbage
2018 2019 2018 2019
(1) (6) (7) (8) (9)
Mandai - - - -Moncongloe - - - -Maros Baru - - - -Marusu - - - -Turikale - - - -Lau - - - -Bantoa - - - -Bantimurung - - - -Simbang - - - -Tanralili - - - -Tompobulu - - - -Camba - - - -Cenrana - - - -Mallawa - - - -
Maros - - - -
Lanjutan Tabel/Continued Table 5.1.1
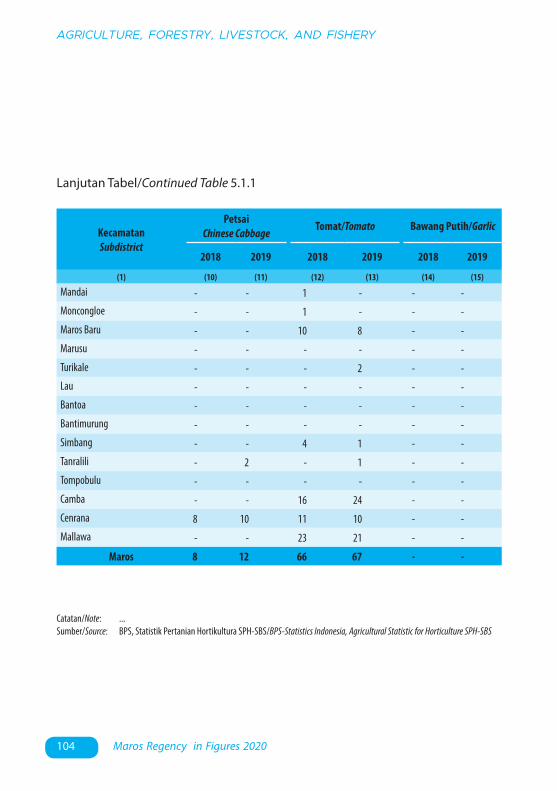
104 Maros Regency in Figures 2020
AGRICULTURE, FORESTRY, LIVESTOCK, AND FISHERY
Catatan/Note: ...Sumber/Source: BPS, Statistik Pertanian Hortikultura SPH-SBS/BPS-Statistics Indonesia, Agricultural Statistic for Horticulture SPH-SBS
KecamatanSubdistrict
PetsaiChinese Cabbage Tomat/Tomato Bawang Putih/Garlic
2018 2019 2018 2019 2018 2019
(1) (10) (11) (12) (13) (14) (15)
Mandai - - 1 - - -Moncongloe - - 1 - - -Maros Baru - - 10 8 - -Marusu - - - - - -Turikale - - - 2 - -Lau - - - - - -Bantoa - - - - - -Bantimurung - - - - - -Simbang - - 4 1 - -Tanralili - 2 - 1 - -Tompobulu - - - - - -Camba - - 16 24 - -Cenrana 8 10 11 10 - -Mallawa - - 23 21 - -
Maros 8 12 66 67 - -
Lanjutan Tabel/Continued Table 5.1.1
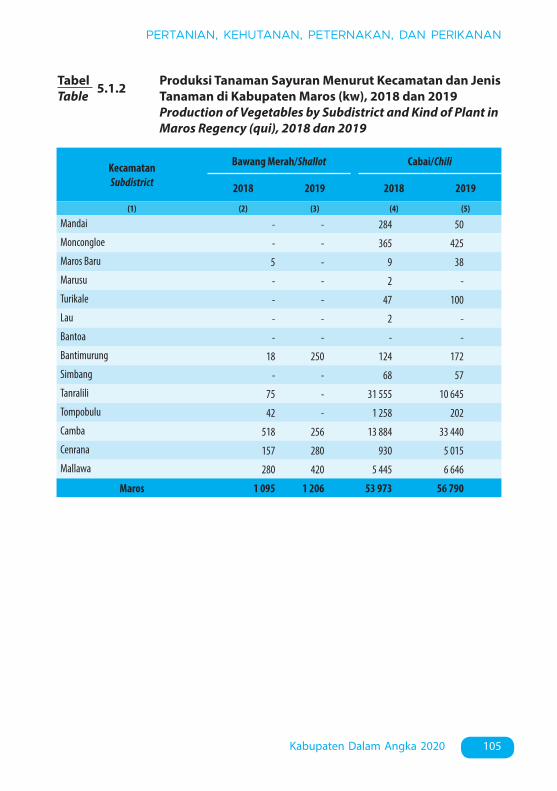
105Kabupaten Dalam Angka 2020
PERTANIAN, KEHUTANAN, PETERNAKAN, DAN PERIKANAN
TabelTable 5.1.2 Produksi Tanaman Sayuran Menurut Kecamatan dan Jenis
Tanaman di Kabupaten Maros (kw), 2018 dan 2019 Production of Vegetables by Subdistrict and Kind of Plant in
Maros Regency (qui), 2018 dan 2019
KecamatanSubdistrict
Bawang Merah/Shallot Cabai/Chili
2018 2019 2018 2019
(1) (2) (3) (4) (5)
Mandai - - 284 50Moncongloe - - 365 425Maros Baru 5 - 9 38Marusu - - 2 -Turikale - - 47 100Lau - - 2 -Bantoa - - - -Bantimurung 18 250 124 172Simbang - - 68 57Tanralili 75 - 31 555 10 645Tompobulu 42 - 1 258 202Camba 518 256 13 884 33 440Cenrana 157 280 930 5 015Mallawa 280 420 5 445 6 646
Maros 1 095 1 206 53 973 56 790
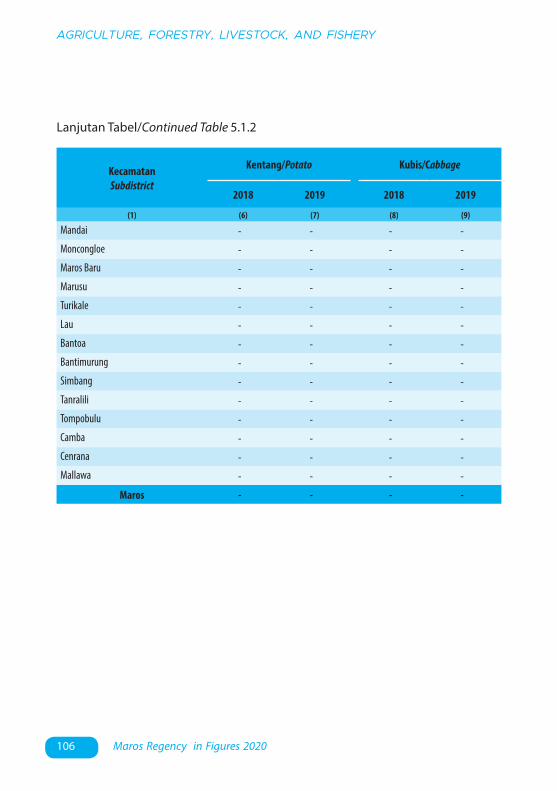
106 Maros Regency in Figures 2020
AGRICULTURE, FORESTRY, LIVESTOCK, AND FISHERY
KecamatanSubdistrict
Kentang/Potato Kubis/Cabbage
2018 2019 2018 2019
(1) (6) (7) (8) (9)
Mandai - - - -Moncongloe - - - -Maros Baru - - - -Marusu - - - -Turikale - - - -Lau - - - -Bantoa - - - -Bantimurung - - - -Simbang - - - -Tanralili - - - -Tompobulu - - - -Camba - - - -Cenrana - - - -Mallawa - - - -
Maros - - - -
Lanjutan Tabel/Continued Table 5.1.2
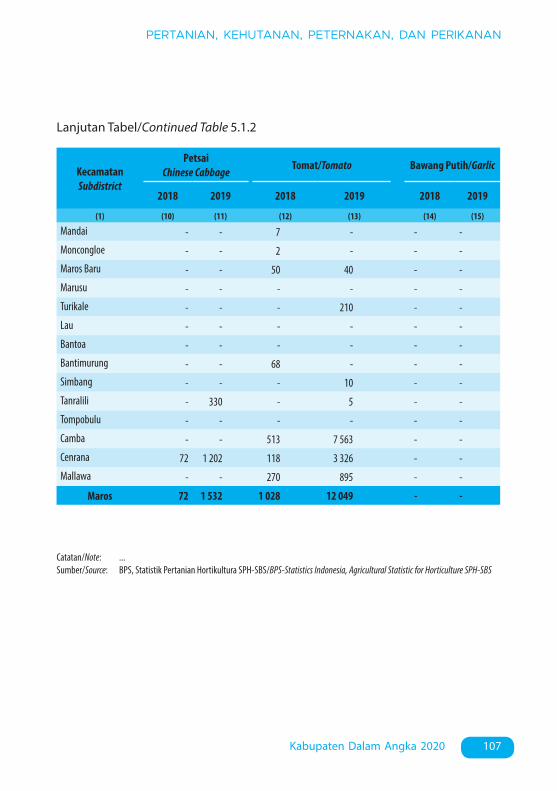
107Kabupaten Dalam Angka 2020
PERTANIAN, KEHUTANAN, PETERNAKAN, DAN PERIKANAN
Catatan/Note: ...Sumber/Source: BPS, Statistik Pertanian Hortikultura SPH-SBS/BPS-Statistics Indonesia, Agricultural Statistic for Horticulture SPH-SBS
KecamatanSubdistrict
PetsaiChinese Cabbage Tomat/Tomato Bawang Putih/Garlic
2018 2019 2018 2019 2018 2019
(1) (10) (11) (12) (13) (14) (15)
Mandai - - 7 - - -Moncongloe - - 2 - - -Maros Baru - - 50 40 - -Marusu - - - - - -Turikale - - - 210 - -Lau - - - - - -Bantoa - - - - - -Bantimurung - - 68 - - -Simbang - - - 10 - -Tanralili - 330 - 5 - -Tompobulu - - - - - -Camba - - 513 7 563 - -Cenrana 72 1 202 118 3 326 - -Mallawa - - 270 895 - -
Maros 72 1 532 1 028 12 049 - -
Lanjutan Tabel/Continued Table 5.1.2

108 Maros Regency in Figures 2020
AGRICULTURE, FORESTRY, LIVESTOCK, AND FISHERY
Jenis TanamanKind of Plants 2016 2017 2018 2019
(1) (2) (3) (4) (5)
Bawang Merah 27 90 62 19
Petsai/Sawi 19 11 8 12
Kacang merah 3 3 0 0
Kacang Panjang 123 117 96 90
Cabai Besar 711 457 325 302
Cabai Rawit 179 496 239 176
Jamur*) 0 33 37 58
Tomat 139 88 66 67
Terung 95 68 60 47
Buncis 18 22 20 25
Ketimun 88 60 65 63
Labu Siam 40 35 24 31
Kangkung 69 67 90 78
Bayam 57 36 30 31
Melon 2 0 0 3
Semangka 62 45 107 202
TabelTable 5.1.3 Luas Panen Tanaman Sayuran dan Buah-buahan Semusim
Menurut Jenis Tanaman di Kabupaten Maros (ha), 2016–2019
Harvested Area of Seasonal Vegetables and Fruits by Kind of Plant in Maros Regency (ha), 2016–2019
Catatan/Note: ...Sumber/Source: BPS, Statistik Pertanian Hortikultura SPH-SBS/BPS-Statistics Indonesia, Agricultural Statistic for Horticulture SPH-SBS
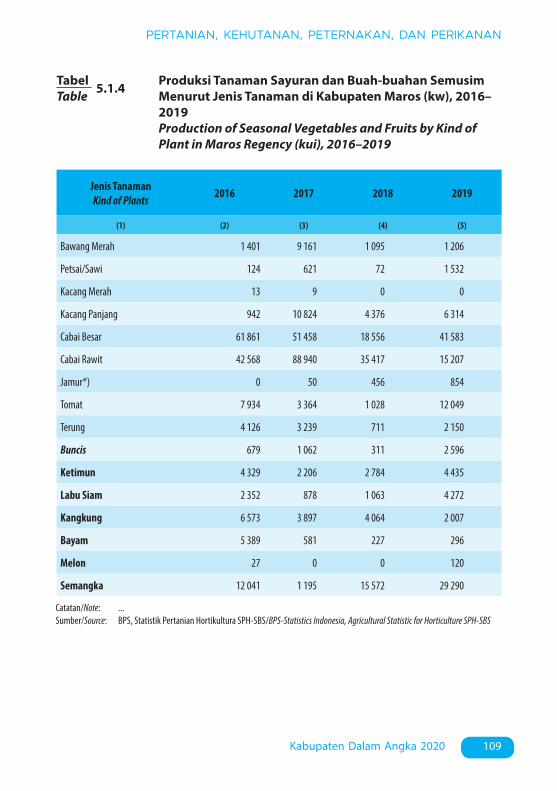
109Kabupaten Dalam Angka 2020
PERTANIAN, KEHUTANAN, PETERNAKAN, DAN PERIKANAN
Jenis TanamanKind of Plants 2016 2017 2018 2019
(1) (2) (3) (4) (5)
Bawang Merah 1 401 9 161 1 095 1 206
Petsai/Sawi 124 621 72 1 532
Kacang Merah 13 9 0 0
Kacang Panjang 942 10 824 4 376 6 314
Cabai Besar 61 861 51 458 18 556 41 583
Cabai Rawit 42 568 88 940 35 417 15 207
Jamur*) 0 50 456 854
Tomat 7 934 3 364 1 028 12 049
Terung 4 126 3 239 711 2 150
Buncis 679 1 062 311 2 596
Ketimun 4 329 2 206 2 784 4 435
Labu Siam 2 352 878 1 063 4 272
Kangkung 6 573 3 897 4 064 2 007
Bayam 5 389 581 227 296
Melon 27 0 0 120
Semangka 12 041 1 195 15 572 29 290
TabelTable 5.1.4 Produksi Tanaman Sayuran dan Buah-buahan Semusim
Menurut Jenis Tanaman di Kabupaten Maros (kw), 2016–2019
Production of Seasonal Vegetables and Fruits by Kind of Plant in Maros Regency (kui), 2016–2019
Catatan/Note: ...Sumber/Source: BPS, Statistik Pertanian Hortikultura SPH-SBS/BPS-Statistics Indonesia, Agricultural Statistic for Horticulture SPH-SBS

110 Maros Regency in Figures 2020
AGRICULTURE, FORESTRY, LIVESTOCK, AND FISHERY
TabelTable 5.1.5 Luas Panen Tanaman Biofarmaka Menurut Kecamatan
dan Jenis Tanaman di Kabupaten Maros (m2), 2018 dan 2019 Harvested Area of Medicinal Plants by Subdistrict and Kind
of Plant in Maros Regency(m2), 2018 and 2019
KecamatanSubdistrict
Jahe/Ginger Laos/Lengkuas/Galanga
2018 2019 2018 2019
(1) (2) (3) (4) (5)
Mandai 3 800 800 - 4 200Moncongloe 65 60 1 800 1 450Maros Baru 390 250 370 300Marusu - - - -Turikale 80 5 80 4Lau 43 42 55 52Bantoa - - - -Bantimurung - - 1 2Simbang 5 502 2 000 100 023 100 000Tanralili - - 16 30Tompobulu 1 - 3 3 000Camba 910 000 1 210 000 30 000 45 000Cenrana 120 000 250 000 25 000 25 000Mallawa 142 000 741 500 197 000 58 000
Maros 1 181 881 2 204 657 354 348 237 038
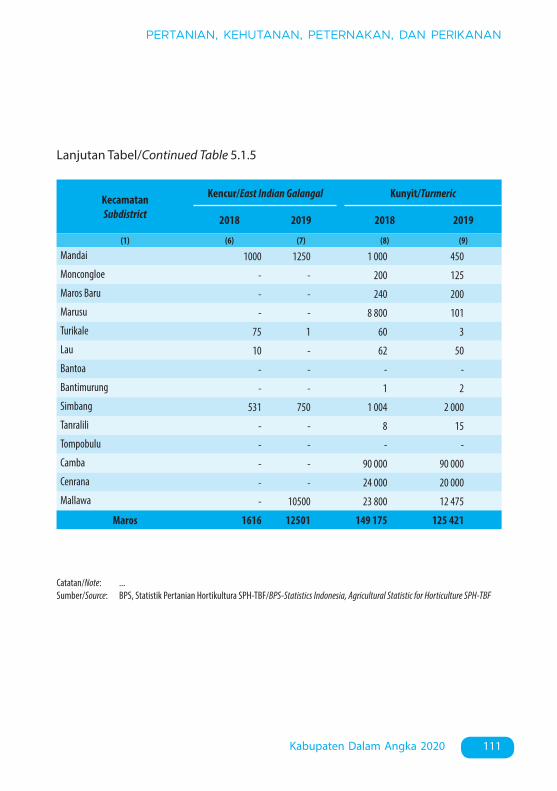
111Kabupaten Dalam Angka 2020
PERTANIAN, KEHUTANAN, PETERNAKAN, DAN PERIKANAN
KecamatanSubdistrict
Kencur/East Indian Galangal Kunyit/Turmeric
2018 2019 2018 2019
(1) (6) (7) (8) (9)
Mandai 1000 1250 1 000 450Moncongloe - - 200 125Maros Baru - - 240 200Marusu - - 8 800 101Turikale 75 1 60 3Lau 10 - 62 50Bantoa - - - -Bantimurung - - 1 2Simbang 531 750 1 004 2 000Tanralili - - 8 15Tompobulu - - - -Camba - - 90 000 90 000Cenrana - - 24 000 20 000Mallawa - 10500 23 800 12 475
Maros 1616 12501 149 175 125 421
Lanjutan Tabel/Continued Table 5.1.5
Catatan/Note: ...Sumber/Source: BPS, Statistik Pertanian Hortikultura SPH-TBF/BPS-Statistics Indonesia, Agricultural Statistic for Horticulture SPH-TBF

112 Maros Regency in Figures 2020
AGRICULTURE, FORESTRY, LIVESTOCK, AND FISHERY
TabelTable 5.1.6 Produksi Tanaman Biofarmaka Menurut Kecamatan dan
Jenis Tanaman di Kabupaten Maros (kg), 2018 and 2019 Production of Medicinal Plants by Subdistrict and Kind of
Plant in Maros Regency (kg), 2018 and 2019
KecamatanSubdistrict
Jahe/Ginger Laos/Lengkuas/Galanga
2018 2019 2018 2019
(1) (2) (3) (4) (5)
Mandai 4 960 1 600 - 11 900Moncongloe 134 92 2 475 1 996Maros Baru 390 60 370 108Marusu 0 - - -Turikale 160 30 80 27Lau 93 158 99 188Bantoa - - - -Bantimurung - - 6 6Simbang 11 004 1 500 51 097 500 000Tanralili - - 76 140Tompobulu 1 - 8 3 000Camba 1 800 000 5 718 000 216 000 220 750Cenrana 340 800 2 199 000 49 000 328 750Mallawa 698 000 1 789 840 826 320 362 240
Maros 2 855 542 9 710 280 1 145 531 1 429 105

113Kabupaten Dalam Angka 2020
PERTANIAN, KEHUTANAN, PETERNAKAN, DAN PERIKANAN
KecamatanSubdistrict
Kencur/East Indian Galangal Kunyit/Turmeric
2018 2019 2018 2019
(1) (6) (7) (8) (9)
Mandai 1 803 1 758 1 451 900Moncongloe - - 274 585Maros Baru - - 240 86Marusu - - 12 940 216Turikale 150 3 150 5Lau 12 - 146 169Bantoa - - - -Bantimurung - - 5 5Simbang 1 344 875 2 510 6 000Tanralili - - 10 16Tompobulu - - - -Camba - - 355 200 336 000Cenrana - - 40 320 137 000Mallawa - 42 790 130 200 48 211
Maros 3 309 45 426 543 446 529 193
Lanjutan Tabel/Continued Table 5.1.6
Catatan/Note: ...Sumber/Source: BPS, Statistik Pertanian Hortikultura SPH-TBF/BPS-Statistics Indonesia, Agricultural Statistic for Horticulture SPH-TBF
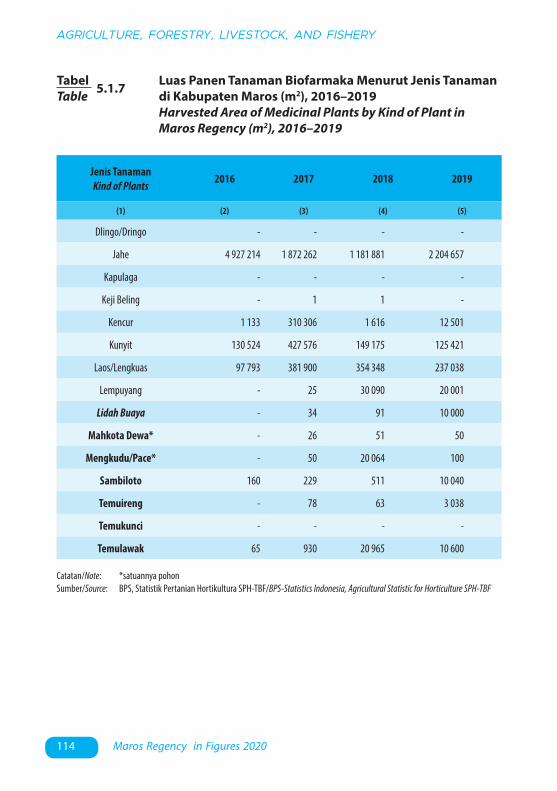
114 Maros Regency in Figures 2020
AGRICULTURE, FORESTRY, LIVESTOCK, AND FISHERY
Jenis TanamanKind of Plants 2016 2017 2018 2019
(1) (2) (3) (4) (5)
Dlingo/Dringo - - - -
Jahe 4 927 214 1 872 262 1 181 881 2 204 657
Kapulaga - - - -
Keji Beling - 1 1 -
Kencur 1 133 310 306 1 616 12 501
Kunyit 130 524 427 576 149 175 125 421
Laos/Lengkuas 97 793 381 900 354 348 237 038
Lempuyang - 25 30 090 20 001
Lidah Buaya - 34 91 10 000
Mahkota Dewa* - 26 51 50
Mengkudu/Pace* - 50 20 064 100
Sambiloto 160 229 511 10 040
Temuireng - 78 63 3 038
Temukunci - - - -
Temulawak 65 930 20 965 10 600
TabelTable 5.1.7 Luas Panen Tanaman Biofarmaka Menurut Jenis Tanaman
di Kabupaten Maros (m2), 2016–2019 Harvested Area of Medicinal Plants by Kind of Plant in
Maros Regency (m2), 2016–2019
Catatan/Note: *satuannya pohonSumber/Source: BPS, Statistik Pertanian Hortikultura SPH-TBF/BPS-Statistics Indonesia, Agricultural Statistic for Horticulture SPH-TBF
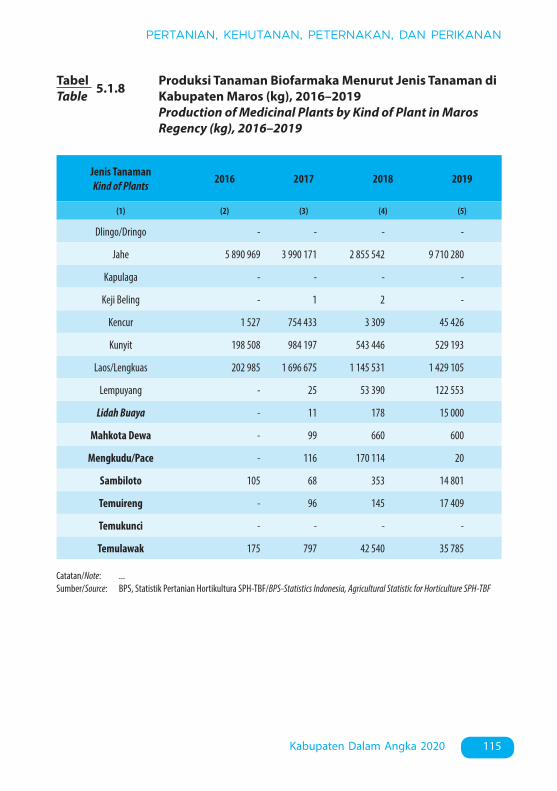
115Kabupaten Dalam Angka 2020
PERTANIAN, KEHUTANAN, PETERNAKAN, DAN PERIKANAN
Jenis TanamanKind of Plants 2016 2017 2018 2019
(1) (2) (3) (4) (5)
Dlingo/Dringo - - - -
Jahe 5 890 969 3 990 171 2 855 542 9 710 280
Kapulaga - - - -
Keji Beling - 1 2 -
Kencur 1 527 754 433 3 309 45 426
Kunyit 198 508 984 197 543 446 529 193
Laos/Lengkuas 202 985 1 696 675 1 145 531 1 429 105
Lempuyang - 25 53 390 122 553
Lidah Buaya - 11 178 15 000
Mahkota Dewa - 99 660 600
Mengkudu/Pace - 116 170 114 20
Sambiloto 105 68 353 14 801
Temuireng - 96 145 17 409
Temukunci - - - -
Temulawak 175 797 42 540 35 785
TabelTable 5.1.8 Produksi Tanaman Biofarmaka Menurut Jenis Tanaman di
Kabupaten Maros (kg), 2016–2019 Production of Medicinal Plants by Kind of Plant in Maros
Regency (kg), 2016–2019
Catatan/Note: ...Sumber/Source: BPS, Statistik Pertanian Hortikultura SPH-TBF/BPS-Statistics Indonesia, Agricultural Statistic for Horticulture SPH-TBF

116 Maros Regency in Figures 2020
AGRICULTURE, FORESTRY, LIVESTOCK, AND FISHERY
TabelTable 5.1.9 Luas Panen Tanaman Hias Menurut Kecamatan dan Jenis
Tanaman di Kabupaten Maros (m2), 2018 and 2019 Harvested Area of Ornamental Plants by Subdistrict and
Kind of Plant in Maros Regency (m2), 2018 and 2019
KecamatanSubdistrict
Anggrek/Orchid Krisan/Chrysantemum
2018 2019 2018 2019
(1) (2) (3) (4) (5)
Mandai - 180 - -Moncongloe - - - -Maros Baru - - - -Marusu - - - -Turikale - - - -Lau 47 - - -Bantoa - 31 - -Bantimurung - - - -Simbang - - - -Tanralili - - - -Tompobulu - - - -Camba 705 - - -Cenrana - - - -Mallawa - - - -
Maros 752 211 -- -
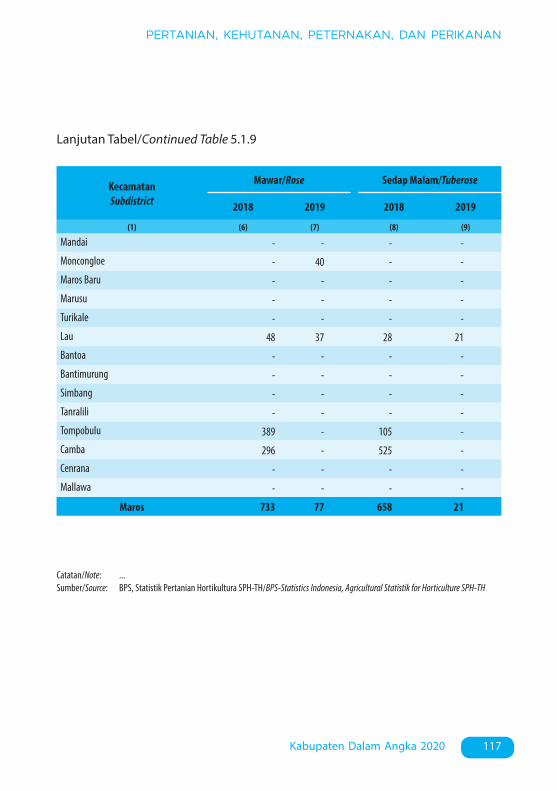
117Kabupaten Dalam Angka 2020
PERTANIAN, KEHUTANAN, PETERNAKAN, DAN PERIKANAN
KecamatanSubdistrict
Mawar/Rose Sedap Malam/Tuberose
2018 2019 2018 2019
(1) (6) (7) (8) (9)
Mandai - - - -Moncongloe - 40 - -Maros Baru - - - -Marusu - - - -Turikale - - - -Lau 48 37 28 21Bantoa - - - -Bantimurung - - - -Simbang - - - -Tanralili - - - -Tompobulu 389 - 105 -Camba 296 - 525 -Cenrana - - - -Mallawa - - - -
Maros 733 77 658 21
Lanjutan Tabel/Continued Table 5.1.9
Catatan/Note: ...Sumber/Source: BPS, Statistik Pertanian Hortikultura SPH-TH/BPS-Statistics Indonesia, Agricultural Statistik for Horticulture SPH-TH

118 Maros Regency in Figures 2020
AGRICULTURE, FORESTRY, LIVESTOCK, AND FISHERY
TabelTable 5.1.10 Produksi Tanaman Hias Menurut Kecamatan dan Jenis
Tanaman di Kabupaten Maros (tangkai), 2018 and 2019 Production of Ornamental Plants by Subdistrict and Kind of
Plant in Maros Regency (stalks), 2018 and 2019
KecamatanSubdistrict
Anggrek/Orchid Krisan/Chrysantemum
2018 2019 2018 2019
(1) (2) (3) (4) (5)
Mandai - - - -Moncongloe - 180 - -Maros Baru - - - -Marusu - - - -Turikale - - - -Lau 248 65 - -Bantoa - - - -Bantimurung - - - -Simbang - - - -Tanralili - - - -Tompobulu - - - -Camba 11 985 - - -Cenrana - - - -Mallawa - - - -
Maros 12 233 245 -- -

119Kabupaten Dalam Angka 2020
PERTANIAN, KEHUTANAN, PETERNAKAN, DAN PERIKANAN
KecamatanSubdistrict
Mawar/Rose Sedap Malam/Tuberose
2018 2019 2018 2019
(1) (6) (7) (8) (9)
Mandai - - - -Moncongloe - 40 - -Maros Baru - - - -Marusu - - - -Turikale - - - -Lau 204 125 49 41Bantoa - - - -Bantimurung - - - -Simbang - - - -Tanralili - - - -Tompobulu 2 106 - 542 -Camba 4 774 - 1 050 -Cenrana - - - -Mallawa - - - -
Maros 7 084 165 1 641 41
Lanjutan Tabel/Continued Table 5.1.10
Catatan/Note: ...Sumber/Source: BPS, Statistik Pertanian Hortikultura SPH-TH/BPS-Statistics Indonesia, Agricultural Statistik for Horticulture SPH-TH

120 Maros Regency in Figures 2020
AGRICULTURE, FORESTRY, LIVESTOCK, AND FISHERY
Jenis TanamanKind of Plants 2016 2017 2018 2019
(1) (2) (3) (4) (5)
Adenium (Kamboja Jepang) 940 3 017 1 379 493
Aglaonema - - 160 -
Anggrek 35 366 752 211
Anthurium Bunga 175 297 848 55
Anthurium Daun - - - 10
Cordyline - - 600 20
Diffenbachia 285 495 637 -
Dracaena 1 030 56 036 37 818 -
Euphorbia 1 000 1 200 1 585 10
Gerbera (Herbras) 155 375 116 -
Gladiol 435 980 545 37
Heliconia (Pisang-Pisangan) 2 040 2 201 2 880 250
Ixora (Soka) 80 20 750 1 000
Mawar 40 2 497 733 77
Melati - 51 1 337 450
Monstera 3 230 3 660 1 793 25
Pakis 1 255 925 765 95
Palem* 36 085 24 538 3 099 825
Phylodendron 200 328 608 -
Sansevieria (Pedang-Pedangan) 1 420 3 130 3 107 263
TabelTable 5.1.11 Luas Panen Tanaman Hias Menurut Jenis Tanaman di
Kabupaten Maros (m2), 2016–2019 Harvested Area of Ornamental Plants by Kind of Plant in
Maros Regency (m2), 2016–2019
Catatan/Note: ...Sumber/Source: BPS, Statistik Pertanian Hortikultura SPH-TH/BPS-Statistics Indonesia, Agricultural Statistik for Horticulture SPH-TH

121Kabupaten Dalam Angka 2020
PERTANIAN, KEHUTANAN, PETERNAKAN, DAN PERIKANAN
Jenis TanamanKind of Plants 2016 2017 2018 2019
(1) (2) (3) (4) (5)
Adenium (Kamboja Jepang) 2 420 11 936 2 285 586
Aglaonema - - 320 -
Anggrek 148 86 12 233 245
Anthurium Bunga 342 333 8 942 195
Anthurium Daun - - - 10
Cordyline - - 900 20
Diffenbachia 720 985 1 842 -
Dracaena 4 795 107 047 527 664 -
Euphorbia 1 200 4 800 3 225 10
Gerbera (Herbras) 480 684 820 -
Gladiol 3 322 2 631 12 007 573
Heliconia (Pisang-Pisangan) 3 495 8 211 38 180 250
Ixora (Soka) 87 12 26 250 1 600
Mawar 75 3 956 7 084 165
Melati* - 1 1 808 1 200
Monstera 5 534 9 483 2 657 25
Pakis 2 305 1 265 1 550 170
Palem 87 585 33 396 6 106 1 990
Phylodendron 515 349 2 258 -
Sansevieria (Pedang-Pedangan) 2 215 9 601 14 912 469
TabelTable 5.1.12 Produksi Tanaman Hias Menurut Jenis Tanaman di
Kabupaten Maros (tangkai), 2016–2019 Production of Ornamental Plants by Kind of Plant n Maros
Regency (stalks), 2016–2019
Catatan/Note: ...Sumber/Source: BPS, Statistik Pertanian Hortikultura SPH-TH/BPS-Statistics Indonesia, Agricultural Statistik for Horticulture SPH-TH

122 Maros Regency in Figures 2020
AGRICULTURE, FORESTRY, LIVESTOCK, AND FISHERY
TabelTable 5.1.13 Produksi Buah-buahan Menurut Kecamatan dan Jenis
Tanaman di Kabupaten Maros(kw), 2018 and 2019 Production of Fruits by Subdistrict and Kind of Plant in
Maros Regency (qui), 2018 and 2019
KecamatanSubdistrict
Mangga/Mango Durian/Durian
2018 2019 2018 2019
(1) (2) (3) (4) (5)
Mandai 52 ,5 107 ,2 - -Moncongloe - 266 ,9 - -Maros Baru 1 - - -Marusu 14 ,4 2 ,8 - -Turikale 71 ,1 10 ,2 - -Lau 40 ,8 9 ,6 - -Bantoa - - - -Bantimurung 240 - - -Simbang 313 ,8 299 ,5 7 ,2 -Tanralili - - - -Tompobulu 6 ,2 3326 ,7 - -Camba 571 920 ,7 63 ,6 329 ,2Cenrana 86 ,4 575 ,3 2 32 ,2Mallawa 1 080 ,7 2 093 ,3 78 ,6 33
Maros 2 477 ,9 7 612 ,2 151 ,4 394 ,4
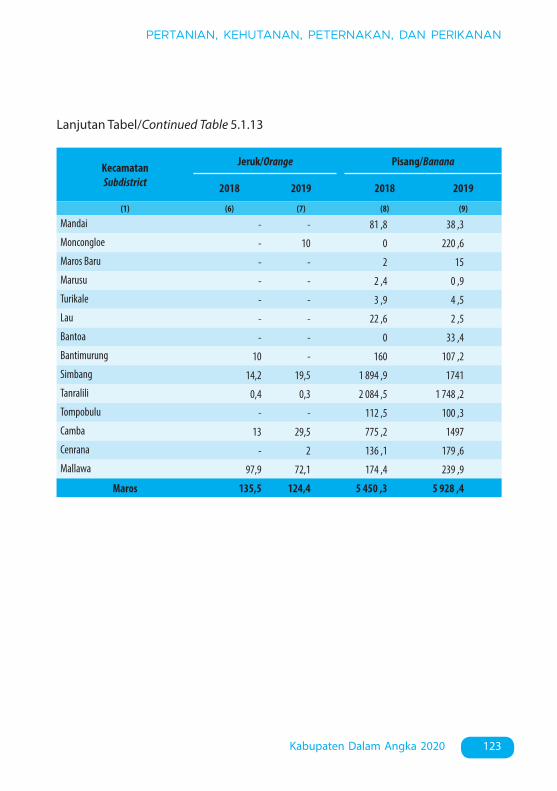
123Kabupaten Dalam Angka 2020
PERTANIAN, KEHUTANAN, PETERNAKAN, DAN PERIKANAN
KecamatanSubdistrict
Jeruk/Orange Pisang/Banana
2018 2019 2018 2019
(1) (6) (7) (8) (9)
Mandai - - 81 ,8 38 ,3Moncongloe - 10 0 220 ,6Maros Baru - - 2 15Marusu - - 2 ,4 0 ,9Turikale - - 3 ,9 4 ,5Lau - - 22 ,6 2 ,5Bantoa - - 0 33 ,4Bantimurung 10 - 160 107 ,2Simbang 14,2 19,5 1 894 ,9 1741Tanralili 0,4 0,3 2 084 ,5 1 748 ,2Tompobulu - - 112 ,5 100 ,3Camba 13 29,5 775 ,2 1497Cenrana - 2 136 ,1 179 ,6Mallawa 97,9 72,1 174 ,4 239 ,9
Maros 135,5 124,4 5 450 ,3 5 928 ,4
Lanjutan Tabel/Continued Table 5.1.13
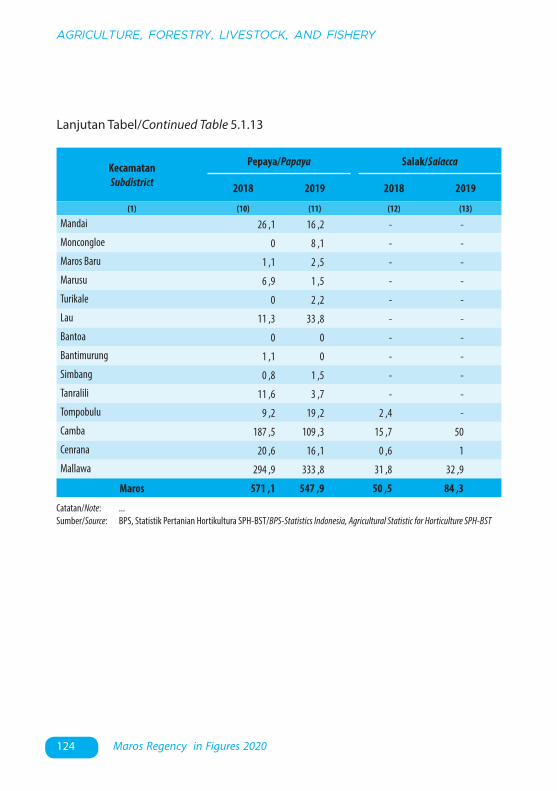
124 Maros Regency in Figures 2020
AGRICULTURE, FORESTRY, LIVESTOCK, AND FISHERY
KecamatanSubdistrict
Pepaya/Papaya Salak/Salacca
2018 2019 2018 2019
(1) (10) (11) (12) (13)
Mandai 26 ,1 16 ,2 - -Moncongloe 0 8 ,1 - -Maros Baru 1 ,1 2 ,5 - -Marusu 6 ,9 1 ,5 - -Turikale 0 2 ,2 - -Lau 11 ,3 33 ,8 - -Bantoa 0 0 - -Bantimurung 1 ,1 0 - -Simbang 0 ,8 1 ,5 - -Tanralili 11 ,6 3 ,7 - -Tompobulu 9 ,2 19 ,2 2 ,4 -Camba 187 ,5 109 ,3 15 ,7 50Cenrana 20 ,6 16 ,1 0 ,6 1Mallawa 294 ,9 333 ,8 31 ,8 32 ,9
Maros 571 ,1 547 ,9 50 ,5 84 ,3
Lanjutan Tabel/Continued Table 5.1.13
Catatan/Note: ...Sumber/Source: BPS, Statistik Pertanian Hortikultura SPH-BST/BPS-Statistics Indonesia, Agricultural Statistic for Horticulture SPH-BST

125Kabupaten Dalam Angka 2020
PERTANIAN, KEHUTANAN, PETERNAKAN, DAN PERIKANAN
Jenis TanamanKind of Plants 2016 2017 2018 2019
(1) (2) (3) (4) (5)
Alpukat 502 ,6 366 ,7 186 129 ,2
Durian 3 308 ,7 328 ,9 151 ,4 394 ,4
Jambu Air 420 ,4 337 ,5 55 ,8 79 ,1
Jambu Biji 2 062 ,4 1 148 ,2 387 ,7 290 ,3
Jengkol 0 0 0 0
Jeruk Besar 4 793 ,3 1 706 ,4 1 408 ,7 2 503 ,6
Jeruk Siam/Keprok 839 451 ,5 135 ,5 124 ,4
Mangga 13 556 ,1 12 311 ,8 2 477 ,9 7 612 ,2
Manggis 76 ,9 5 ,6 59 ,6 18 ,3
Markisa/Konyal 1 421 ,7 1 167 ,2 299 118 ,7
Melinjo 224 ,5 2 20 ,9 40 ,7
Nangka/Cempedak 3 005 ,4 1 429 ,1 544 ,4 480 ,7
Nenas 134 250 ,2 47 ,9 31 ,9
Pepaya 1 536 ,5 1 987 ,5 571 ,1 547 ,9
Petai 350 ,1 2 ,5 108 ,4 124 ,7
Pisang 12 639 ,6 12 506 ,6 5 450 ,3 5 928 ,4
Rambutan 3 660 ,5 510 ,1 489 ,2 1716 ,7
Salak 247 ,5 58 ,9 50 ,5 84 ,3
Sawo 0 ,9 10 ,1 0 ,1 1 ,9
Sirsak 1 164 ,3 657 ,9 261 ,1 263 ,1
Sukun 1240 348 ,5 382 ,3 482 ,2
TabelTable 5.1.14 Produksi Buah–Buahan dan Sayuran Tahunan Menurut
Jenis Tanaman (kw) di Kabupaten Maros, 2016–2019 Production of Annual Fruits and Vegetables by Kind of Plant
in Maros Regency (qui), 2016–2019
Catatan/Note: ...Sumber/Source: BPS, Statistik Pertanian Hortikultura SPH-BST/BPS-Statistics Indonesia, Agricultural Statistic for Horticulture SPH-BST
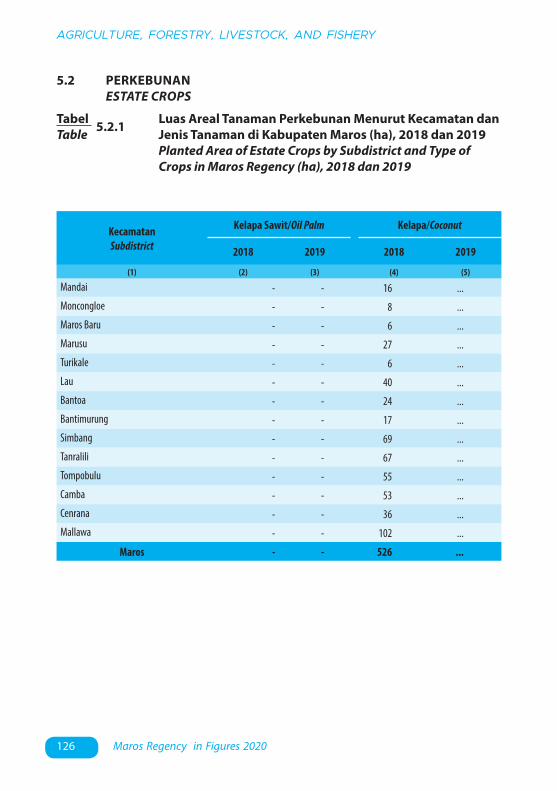
126 Maros Regency in Figures 2020
AGRICULTURE, FORESTRY, LIVESTOCK, AND FISHERY
TabelTable 5.2.1 Luas Areal Tanaman Perkebunan Menurut Kecamatan dan
Jenis Tanaman di Kabupaten Maros (ha), 2018 dan 2019 Planted Area of Estate Crops by Subdistrict and Type of
Crops in Maros Regency (ha), 2018 dan 2019
5.2 PERKEBUNAN ESTATE CROPS
KecamatanSubdistrict
Kelapa Sawit/Oil Palm Kelapa/Coconut
2018 2019 2018 2019
(1) (2) (3) (4) (5)
Mandai - - 16 ...Moncongloe - - 8 ...Maros Baru - - 6 ...Marusu - - 27 ...Turikale - - 6 ...Lau - - 40 ...Bantoa - - 24 ...Bantimurung - - 17 ...Simbang - - 69 ...Tanralili - - 67 ...Tompobulu - - 55 ...Camba - - 53 ...Cenrana - - 36 ...Mallawa - - 102 ...
Maros - - 526 ...
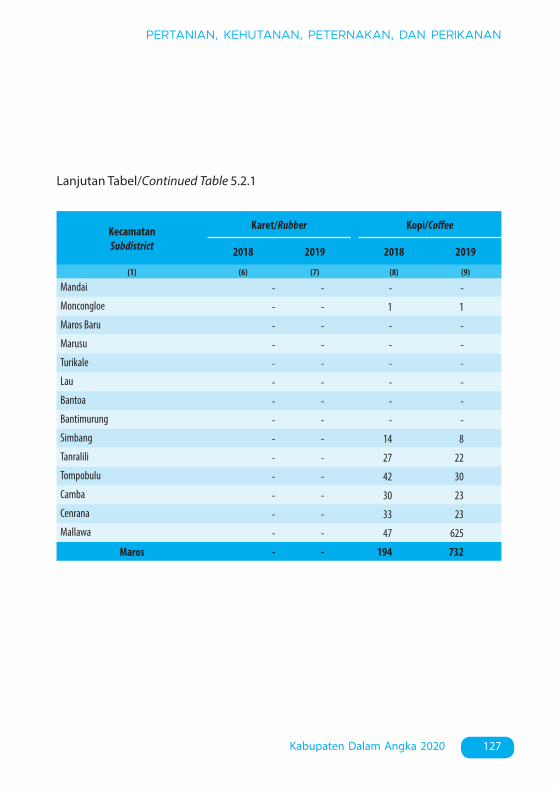
127Kabupaten Dalam Angka 2020
PERTANIAN, KEHUTANAN, PETERNAKAN, DAN PERIKANAN
KecamatanSubdistrict
Karet/Rubber Kopi/Coffee
2018 2019 2018 2019
(1) (6) (7) (8) (9)
Mandai - - - -Moncongloe - - 1 1Maros Baru - - - -Marusu - - - -Turikale - - - -Lau - - - -Bantoa - - - -Bantimurung - - - -Simbang - - 14 8Tanralili - - 27 22Tompobulu - - 42 30Camba - - 30 23Cenrana - - 33 23Mallawa - - 47 625
Maros - - 194 732
Lanjutan Tabel/Continued Table 5.2.1
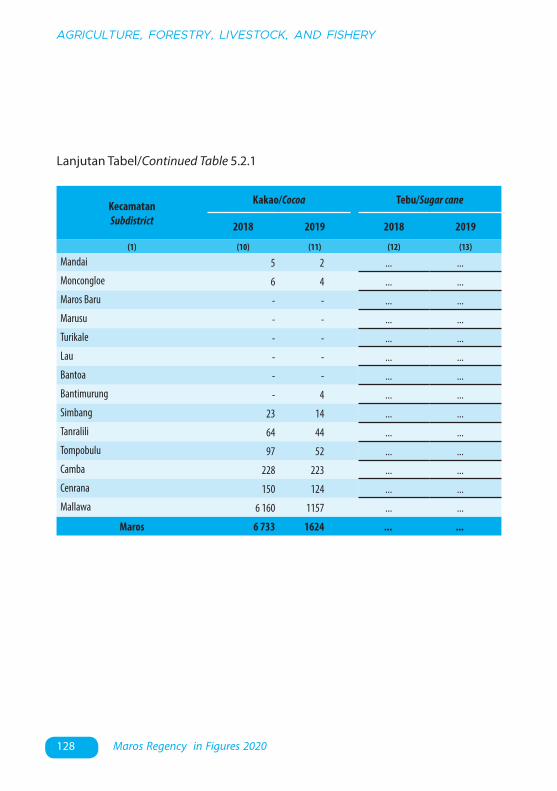
128 Maros Regency in Figures 2020
AGRICULTURE, FORESTRY, LIVESTOCK, AND FISHERY
KecamatanSubdistrict
Kakao/Cocoa Tebu/Sugar cane
2018 2019 2018 2019
(1) (10) (11) (12) (13)
Mandai 5 2 ... ...Moncongloe 6 4 ... ...Maros Baru - - ... ...Marusu - - ... ...Turikale - - ... ...Lau - - ... ...Bantoa - - ... ...Bantimurung - 4 ... ...Simbang 23 14 ... ...Tanralili 64 44 ... ...Tompobulu 97 52 ... ...Camba 228 223 ... ...Cenrana 150 124 ... ...Mallawa 6 160 1157 ... ...
Maros 6 733 1624 ... ...
Lanjutan Tabel/Continued Table 5.2.1
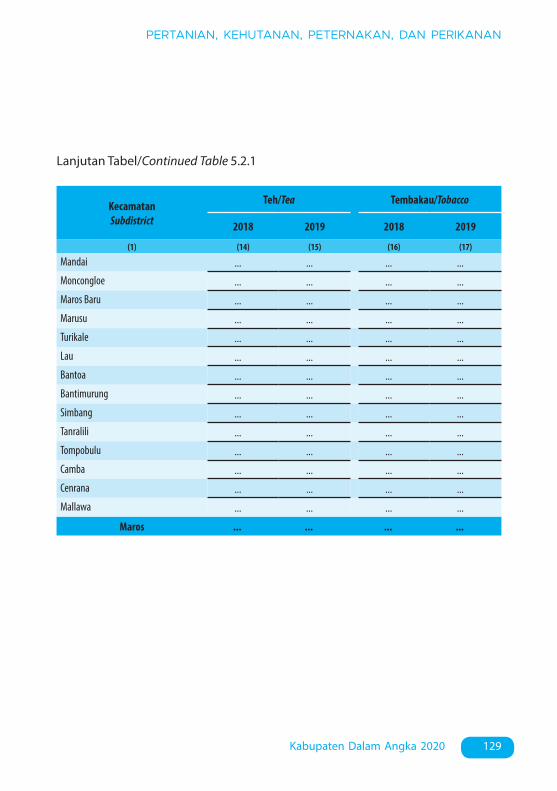
129Kabupaten Dalam Angka 2020
PERTANIAN, KEHUTANAN, PETERNAKAN, DAN PERIKANAN
KecamatanSubdistrict
Teh/Tea Tembakau/Tobacco
2018 2019 2018 2019
(1) (14) (15) (16) (17)
Mandai ... ... ... ...Moncongloe ... ... ... ...Maros Baru ... ... ... ...Marusu ... ... ... ...Turikale ... ... ... ...Lau ... ... ... ...Bantoa ... ... ... ...Bantimurung ... ... ... ...Simbang ... ... ... ...Tanralili ... ... ... ...Tompobulu ... ... ... ...Camba ... ... ... ...Cenrana ... ... ... ...Mallawa ... ... ... ...
Maros ... ... ... ...
Lanjutan Tabel/Continued Table 5.2.1
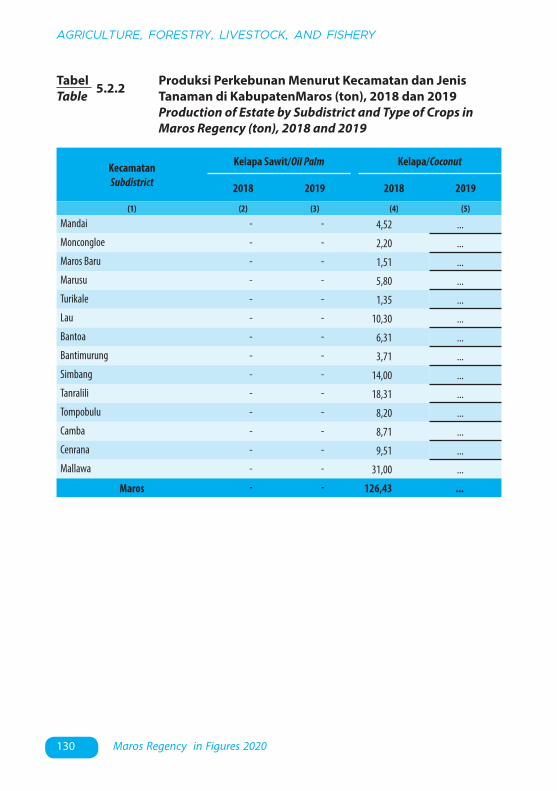
130 Maros Regency in Figures 2020
AGRICULTURE, FORESTRY, LIVESTOCK, AND FISHERY
TabelTable 5.2.2 Produksi Perkebunan Menurut Kecamatan dan Jenis
Tanaman di KabupatenMaros (ton), 2018 dan 2019 Production of Estate by Subdistrict and Type of Crops in
Maros Regency (ton), 2018 and 2019
KecamatanSubdistrict
Kelapa Sawit/Oil Palm Kelapa/Coconut
2018 2019 2018 2019
(1) (2) (3) (4) (5)
Mandai - - 4,52 ...Moncongloe - - 2,20 ...Maros Baru - - 1,51 ...Marusu - - 5,80 ...Turikale - - 1,35 ...Lau - - 10,30 ...Bantoa - - 6,31 ...Bantimurung - - 3,71 ...Simbang - - 14,00 ...Tanralili - - 18,31 ...Tompobulu - - 8,20 ...Camba - - 8,71 ...Cenrana - - 9,51 ...Mallawa - - 31,00 ...
Maros - - 126,43 ...

131Kabupaten Dalam Angka 2020
PERTANIAN, KEHUTANAN, PETERNAKAN, DAN PERIKANAN
KecamatanSubdistrict
Karet/Rubber Kopi/Coffee
2018 2019 2018 2019
(1) (6) (7) (8) (9)
Mandai - - - ...Moncongloe - - 0,30 ...Maros Baru - - - ...Marusu - - - ...Turikale - - - ...Lau - - - ...Bantoa - - - ...Bantimurung - - - ...Simbang - - 4,20 ...Tanralili - - 5,00 ...Tompobulu - - 9,01 ...Camba - - 7,20 ...Cenrana - - 11,00 ...Mallawa - - 14,00 ...
Maros - - 50,71 ...
Lanjutan Tabel/Continued Table 5.2.2
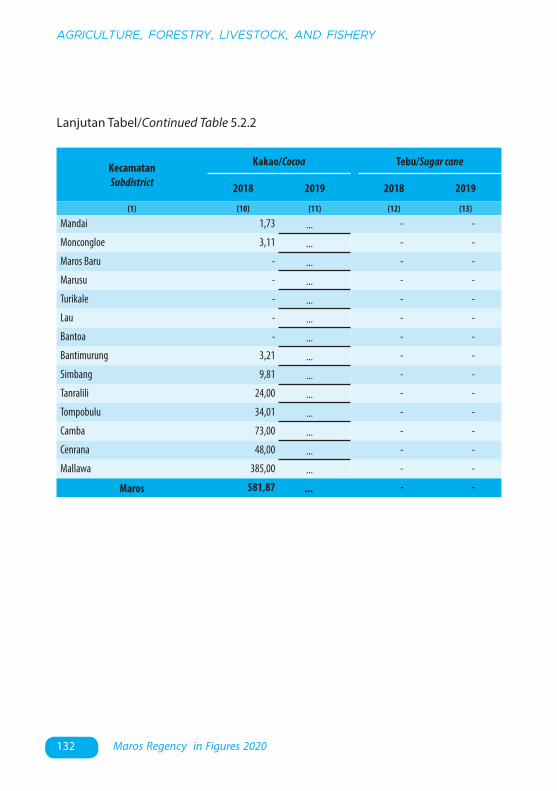
132 Maros Regency in Figures 2020
AGRICULTURE, FORESTRY, LIVESTOCK, AND FISHERY
KecamatanSubdistrict
Kakao/Cocoa Tebu/Sugar cane
2018 2019 2018 2019
(1) (10) (11) (12) (13)
Mandai 1,73 ... - -
Moncongloe 3,11 ... - -
Maros Baru - ... - -
Marusu - ... - -
Turikale - ... - -
Lau - ... - -
Bantoa - ... - -
Bantimurung 3,21 ... - -
Simbang 9,81 ... - -
Tanralili 24,00 ... - -
Tompobulu 34,01 ... - -
Camba 73,00 ... - -
Cenrana 48,00 ... - -
Mallawa 385,00 ... - -
Maros 581,87 ... - -
Lanjutan Tabel/Continued Table 5.2.2
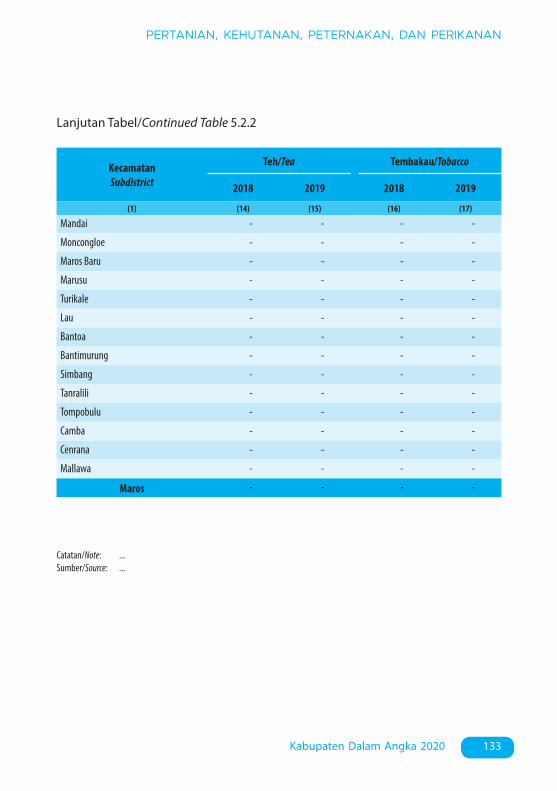
133Kabupaten Dalam Angka 2020
PERTANIAN, KEHUTANAN, PETERNAKAN, DAN PERIKANAN
KecamatanSubdistrict
Teh/Tea Tembakau/Tobacco
2018 2019 2018 2019
(1) (14) (15) (16) (17)
Mandai - - - -
Moncongloe - - - -
Maros Baru - - - -
Marusu - - - -
Turikale - - - -
Lau - - - -
Bantoa - - - -
Bantimurung - - - -
Simbang - - - -
Tanralili - - - -
Tompobulu - - - -
Camba - - - -
Cenrana - - - -
Mallawa - - - -
Maros - - - -
Lanjutan Tabel/Continued Table 5.2.2
Catatan/Note: ...Sumber/Source: ...

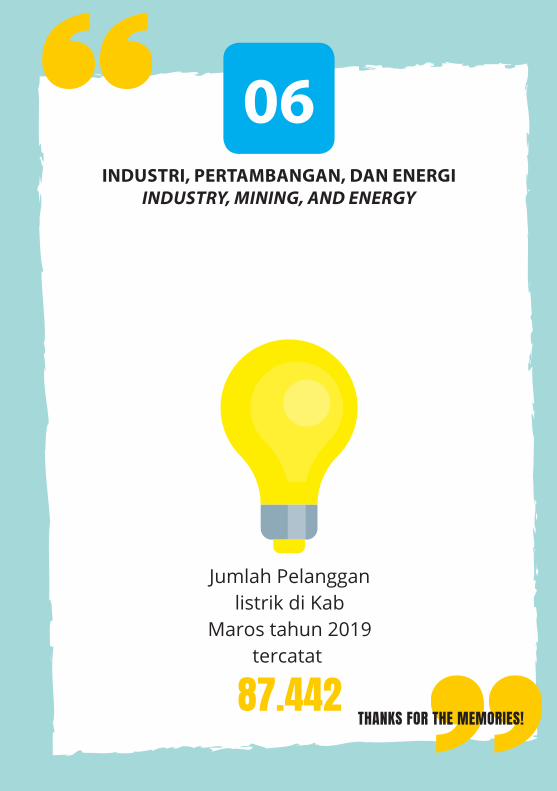
6. Industri, Pertambangan, dan Energi/Industry, Mining, and Energy ........
6. INDUSTRI, PERTAMBANGAN, DAN ENERGI/INDUSTRY, MINING, AND ENERGY
THANKS FOR THE MEMORIES!
Jumlah Pelangganlistrik di Kab
Maros tahun 2019tercatat
87.442
INDUSTRI, PERTAMBANGAN, DAN ENERGIINDUSTRY, MINING, AND ENERGY
06


137Kabupaten Maros Dalam Angka 2020
INDUSTRI, PERTAMBANGAN, DAN ENERGI
PENJELASAN TEKNIS TECHNICAL NOTES
1. Daya listrik didefinisikan sebagai laju hantaran energi listrik dalam rangkaian listrik. Satuan SI daya listrik adalah watt yang menyatakan banyaknya tenaga listrik yang mengalir per satuan waktu (joule/detik).
2. Pelanggan adalah individu atau kelompok, baik rumah tangga, perusahaan atau institusi non profit yang membeli air bersih dari perusahaan air bersih.
3. Air disalurkan adalah volume air bersih dari perusahaan air bersih.
1. Electric power is defined as the rate of conductance of electrical energy in electrical circuits. The SI unit of electric power is watts which represents the amount of electric power flowing per unit time (joules / sec).
2. Distributed water is the volume of water supply from water supply establishment.
3. Distributed water is the volume of water supply from water supply establishment.
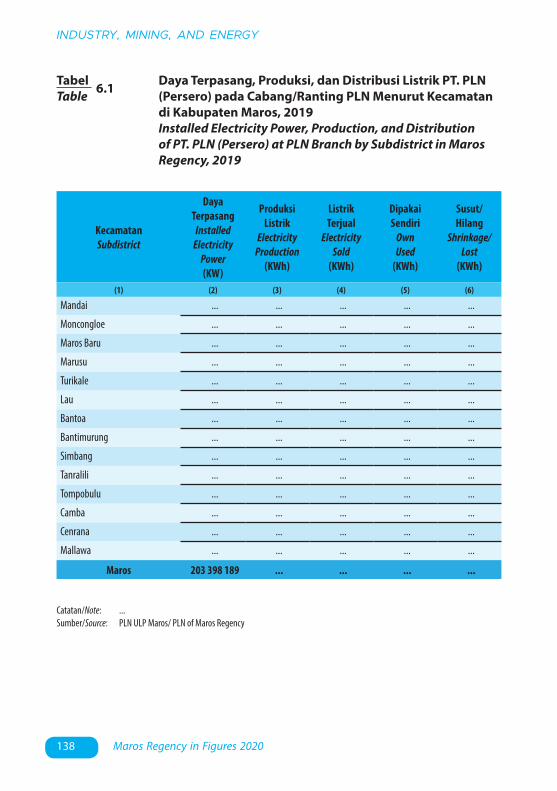
138 Maros Regency in Figures 2020
INDUSTRY, MINING, AND ENERGY
TabelTable 6.1 Daya Terpasang, Produksi, dan Distribusi Listrik PT. PLN
(Persero) pada Cabang/Ranting PLN Menurut Kecamatan di Kabupaten Maros, 2019
Installed Electricity Power, Production, and Distribution of PT. PLN (Persero) at PLN Branch by Subdistrict in Maros Regency, 2019
KecamatanSubdistrict
DayaTerpasang
InstalledElectricity
Power(KW)
ProduksiListrik
ElectricityProduction
(KWh)
ListrikTerjual
ElectricitySold
(KWh)
DipakaiSendiri
OwnUsed
(KWh)
Susut/Hilang
Shrinkage/Lost
(KWh)
(1) (2) (3) (4) (5) (6)
Mandai ... ... ... ... ...
Moncongloe ... ... ... ... ...
Maros Baru ... ... ... ... ...
Marusu ... ... ... ... ...
Turikale ... ... ... ... ...
Lau ... ... ... ... ...
Bantoa ... ... ... ... ...
Bantimurung ... ... ... ... ...
Simbang ... ... ... ... ...
Tanralili ... ... ... ... ...
Tompobulu ... ... ... ... ...
Camba ... ... ... ... ...
Cenrana ... ... ... ... ...
Mallawa ... ... ... ... ...
Maros 203 398 189 ... ... ... ...
Catatan/Note: ...Sumber/Source: PLN ULP Maros/ PLN of Maros Regency
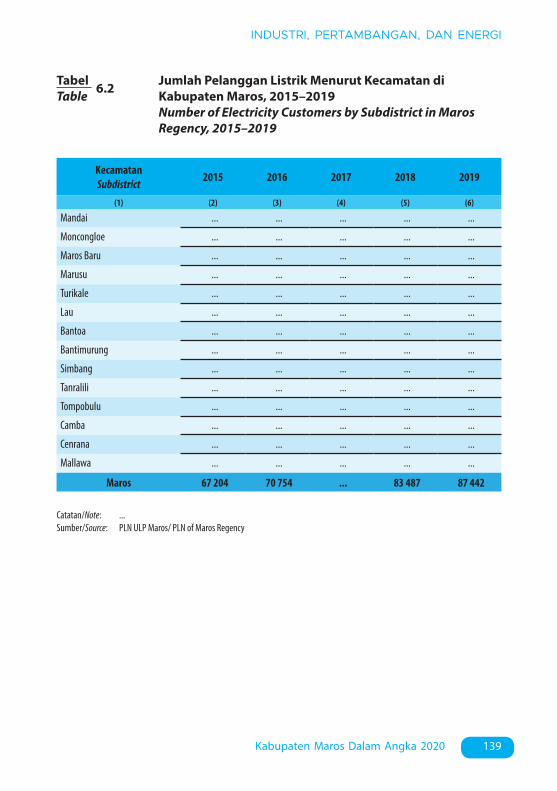
139Kabupaten Maros Dalam Angka 2020
INDUSTRI, PERTAMBANGAN, DAN ENERGI
TabelTable 6.2 Jumlah Pelanggan Listrik Menurut Kecamatan di
Kabupaten Maros, 2015–2019 Number of Electricity Customers by Subdistrict in Maros
Regency, 2015–2019
KecamatanSubdistrict 2015 2016 2017 2018 2019
(1) (2) (3) (4) (5) (6)
Mandai ... ... ... ... ...
Moncongloe ... ... ... ... ...
Maros Baru ... ... ... ... ...
Marusu ... ... ... ... ...
Turikale ... ... ... ... ...
Lau ... ... ... ... ...
Bantoa ... ... ... ... ...
Bantimurung ... ... ... ... ...
Simbang ... ... ... ... ...
Tanralili ... ... ... ... ...
Tompobulu ... ... ... ... ...
Camba ... ... ... ... ...
Cenrana ... ... ... ... ...
Mallawa ... ... ... ... ...
Maros 67 204 70 754 ... 83 487 87 442
Catatan/Note: ...Sumber/Source: PLN ULP Maros/ PLN of Maros Regency
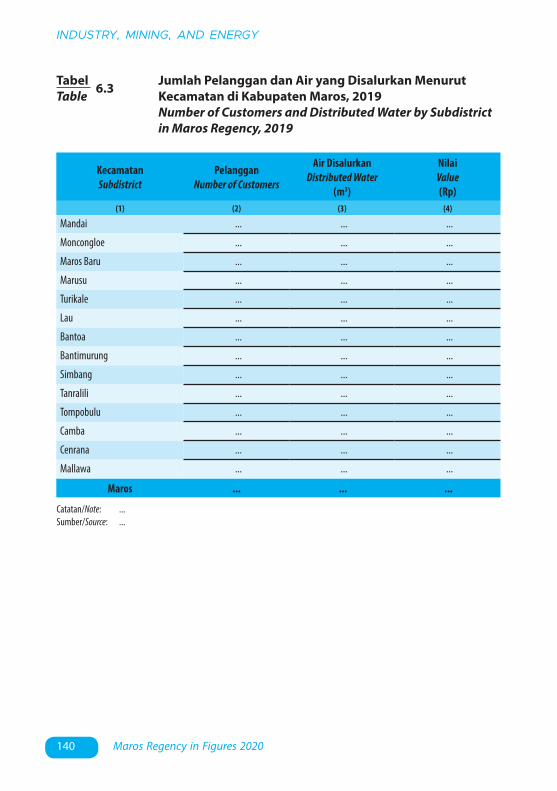
140 Maros Regency in Figures 2020
INDUSTRY, MINING, AND ENERGY
TabelTable 6.3 Jumlah Pelanggan dan Air yang Disalurkan Menurut
Kecamatan di Kabupaten Maros, 2019 Number of Customers and Distributed Water by Subdistrict
in Maros Regency, 2019
KecamatanSubdistrict
PelangganNumber of Customers
Air DisalurkanDistributed Water
(m3)
NilaiValue(Rp)
(1) (2) (3) (4)
Mandai ... ... ...
Moncongloe ... ... ...
Maros Baru ... ... ...
Marusu ... ... ...
Turikale ... ... ...
Lau ... ... ...
Bantoa ... ... ...
Bantimurung ... ... ...
Simbang ... ... ...
Tanralili ... ... ...
Tompobulu ... ... ...
Camba ... ... ...
Cenrana ... ... ...
Mallawa ... ... ...
Maros ... ... ...
Catatan/Note: ...Sumber/Source: ...

7. Pariwisata/Tourism ...................................................................................................
7. PARIWISATA/TOURISM
JUMLAH RUMAH MAKAN/RESTORAN
THANKS FOR THE MEMORIES!
Tahun 201897
Tahun 2019134
PARIWISATATOURISM
07

143Kabupaten Maros Dalam Angka 2020
PARIWISATA
PENJELASAN TEKNIS TECHNICAL NOTES
1. Rumah makan atau restoran adalah istilah umum untuk menyebut usaha gastronomi yang menyajikan hidangan kepada masyarakat dan menyediakan tempat untuk menikmati hidangan tersebut serta menetapkan tarif tertentu untuk makanan dan pelayanannya.
1. A restaurant or restaurant is a general term to refer to a gastronomic business that serves food to the community and provides a place to enjoy the food as well as set certain rates for food and service.
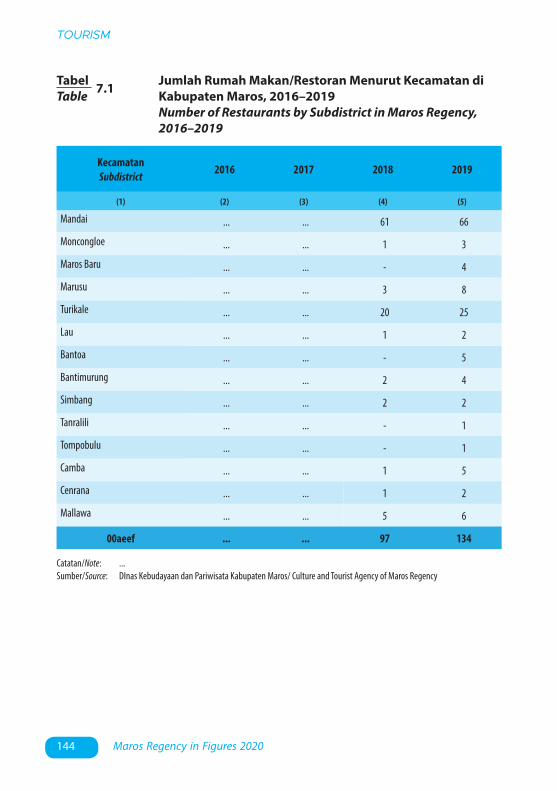
144 Maros Regency in Figures 2020
TOURISM
TabelTable 7.1 Jumlah Rumah Makan/Restoran Menurut Kecamatan di
Kabupaten Maros, 2016–2019 Number of Restaurants by Subdistrict in Maros Regency,
2016–2019
Catatan/Note: ...Sumber/Source: DInas Kebudayaan dan Pariwisata Kabupaten Maros/ Culture and Tourist Agency of Maros Regency
KecamatanSubdistrict 2016 2017 2018 2019
(1) (2) (3) (4) (5)
Mandai ... ... 61 66
Moncongloe ... ... 1 3
Maros Baru ... ... - 4
Marusu ... ... 3 8
Turikale ... ... 20 25
Lau ... ... 1 2
Bantoa ... ... - 5
Bantimurung ... ... 2 4
Simbang ... ... 2 2
Tanralili ... ... - 1
Tompobulu ... ... - 1
Camba ... ... 1 5
Cenrana ... ... 1 2
Mallawa ... ... 5 6
00aeef ... ... 97 134
8. Transportasi dan Komunikasi/Transportation and Communication ........
8. TRANSPORTASI DAN KOMUNIKASI/TRANSPORTATION AND COMMUNICATION
THANKS FOR THE MEMORIES!
Panjang Jalan di Kab. Maros adalah
1.032,13 KM
TRANSPORTASI DAN KOMUNIKASITRANSPORTATION AND COMMUNICATION
08

147Kabupaten Maros Dalam Angka 2020
TRANSPORTASI DAN KOMUNIKASI
PENJELASAN TEKNIS TECHNICAL NOTES
1. Jalan adalah prasarana transportasi darat yang meliputi segala bagian area darat, termasuk bangunan pelengkap dan perlengkapannya yang diperuntukkan bagi lalu lintas, yang berada pada permukaan tanah, di atas permukaan tanah, di bawah permukaan tanah dan/atau air, serta di atas permukaan air, kecuali jalan kereta api, jalan lori, dan jalan kabel.
2. Kantor pos adalah fasilitas fisik tidak bergerak untuk melayani penerimaan, pengumpulan, penyortiran, transmisi, dan pengantaran surat dan paket pos.
1. Road is a land transportation infrastructure that covers all parts of the land area, including complementary buildings and equipment intended for traffic, which are on the surface of the land, above the surface of the land, below the surface of the land and / or water, and above the water surface, except railroad, lorry, and cable road.
2. Post offices are fixed physical facilities that serve the reception, collection, sorting, transmission, and delivery of letters and postal packages.
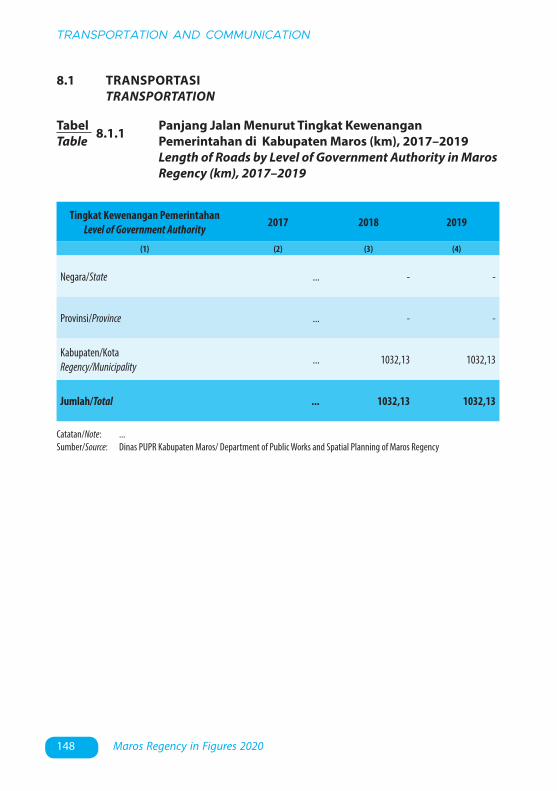
148 Maros Regency in Figures 2020
TRANSPORTATION AND COMMUNICATION
TabelTable 8.1.1 Panjang Jalan Menurut Tingkat Kewenangan
Pemerintahan di Kabupaten Maros (km), 2017–2019 Length of Roads by Level of Government Authority in Maros
Regency (km), 2017–2019
8.1 TRANSPORTASI TRANSPORTATION
Catatan/Note: ...Sumber/Source: Dinas PUPR Kabupaten Maros/ Department of Public Works and Spatial Planning of Maros Regency
Tingkat Kewenangan PemerintahanLevel of Government Authority 2017 2018 2019
(1) (2) (3) (4)
Negara/State ... - -
Provinsi/Province ... - -
Kabupaten/KotaRegency/Municipality
... 1032,13 1032,13
Jumlah/Total ... 1032,13 1032,13
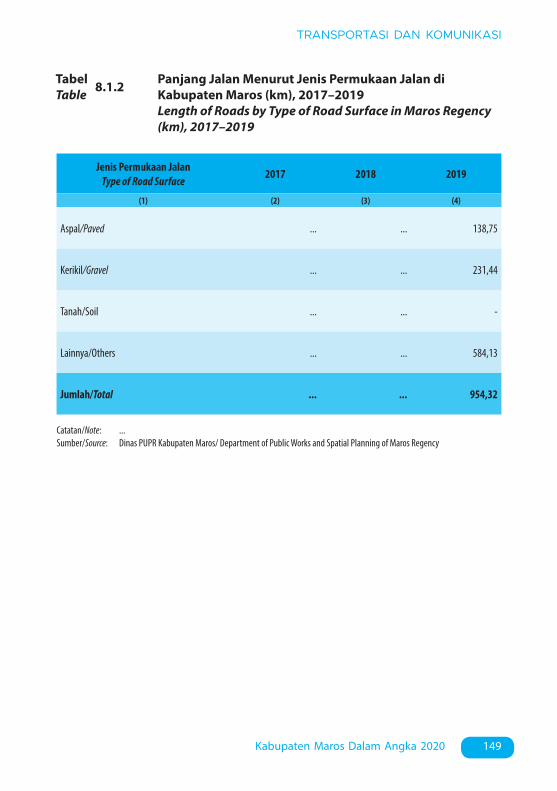
149Kabupaten Maros Dalam Angka 2020
TRANSPORTASI DAN KOMUNIKASI
TabelTable 8.1.2 Panjang Jalan Menurut Jenis Permukaan Jalan di
Kabupaten Maros (km), 2017–2019 Length of Roads by Type of Road Surface in Maros Regency
(km), 2017–2019
Catatan/Note: ...Sumber/Source: Dinas PUPR Kabupaten Maros/ Department of Public Works and Spatial Planning of Maros Regency
Jenis Permukaan JalanType of Road Surface 2017 2018 2019
(1) (2) (3) (4)
Aspal/Paved ... ... 138,75
Kerikil/Gravel ... ... 231,44
Tanah/Soil ... ... -
Lainnya/Others ... ... 584,13
Jumlah/Total ... ... 954,32

150 Maros Regency in Figures 2020
TRANSPORTATION AND COMMUNICATION
TabelTable 8.1.3 Panjang Jalan Menurut Kondisi Jalan di KabupatenMaros
(km), 2017–2019 Length of Roads by Condition of Roads in Maros Regency
(km), 2017–2019
Catatan/Note: ...Sumber/Source: Dinas PUPR Kabupaten Maros/ Department of Public Works and Spatial Planning of Maros Regency
Kondisi JalanCondition of Roads 2017 2018 2019
(1) (2) (3) (4)
Baik/Good ... ... 355.98
Sedang/Moderate ... ... 314.09
Rusak/Damage ... ... 186.13
Rusak Berat/Severely Damage ... ... 175.93
Jumlah/Total ... ... 1032,13

151Kabupaten Maros Dalam Angka 2020
TRANSPORTASI DAN KOMUNIKASI
TabelTable 8.2.1 Jumlah Kantor Pos Pembantu Menurut Kecamatan di
Kabupaten Maros, 2016–2019 Number of Post Offices Subsidiaries by Subdistrict in Maros
Regency, 2016–2019
8.2 KOMUNIKASI COMMUNICATION
KecamatanSubdistrict 2016 2017 2018 2019
(1) (2) (3) (4) (5)
Mandai 1 1 1 ...
Moncongloe - - - ...
Maros Baru 1 1 1 ...
Marusu - - - ...
Turikale 2 2 2 ...
Lau - - - ...
Bontoa - - - ...
Bantimurung 1 1 1 ...
Simbang - - - ...
Tanralili - - - ...
Tompobulu - - - ...
Camba 1 1 1 ...
Cenrana - - - ...
Mallawa - - - ...
Maros 6 6 6 ...
Catatan/Note: ...Sumber/Source: Kantor Pos Kabupaten Maros/ Post Office of Maros
152 Maros Regency in Figures 2020
TRANSPORTATION AND COMMUNICATION

9. Perbankan,Koperasi, dan Harga-harga/Banking,Cooperative, dan Prices
9. PERBANKAN, KOPERASI, DAN HARGA-HARGA/BANKING, COOPERATIVE, AND PRICES
THANKS FOR THE MEMORIES!
Banyak koperasi aktif di Kab.Maros Tahun 2018
139
PERBANKAN, KOPERASI, DAN HARGA-HARGABANKING, COOPERATIVE, AND PRICES
09


155Kabupaten Maros Dalam Angka 2020
PERBANKAN, KOPERASI, DAN HARGA-HARGA
PENJELASAN TEKNIS TECHNICAL NOTES
1. Koperasi adalah badan usaha yang beranggotakan orang seorang atau badan hokum koperasi dengan melandaskan kegiatannya berdasarkan prinsip koperasi sekaligus sebagai gerakan ekonomi rakyat yang berdasar atas asas kekeluargaan.
2. Jenis Koperasi antara lain; a.Koperasi Unit Desa (KUD) b.KPR c.Koperasi Karyawan (KOPKAR) d.Koperasi Pegawai Negeri (KPN) e.Koperasi Tani f.Koperasi Serba Usaha (KSU) g.Koperasi Simpan Pinjam (KSP) h.Koperasi Pesantren (Kopontren) i.Koperasi TNI/Polri
1. 6.Cooperative is an establishment that its members are people or establishments with legal status of cooperative and its activities based on people economic movement.
2. These are Types of Cooperative; a.Koperasi Unit Desa (KUD) b.KPR c.Koperasi Karyawan (KOPKAR) d.Koperasi Pegawai Negeri (KPN) e.Koperasi Tani f.Koperasi Serba Usaha (KSU) g.Koperasi Simpan Pinjam (KSP) h.Koperasi Pesantren (Kopontren) i.Koperasi TNI/Polri

156 Maros Regency in Figures 2020
BANKING, COOPERATIVE, AND PRICES
TabelTable 9.1 Jumlah Koperasi Aktif Menurut Kecamatan di Kabupaten
Maros, 2016–2019 Number of Active Cooperative by Subdistrict in Maros
Regency, 2016–2019
Catatan/Note: ...Sumber/Source: Dinas Koperasi, UKM dan Perdagangan Kabupaten Maros/ Cooperation, UKM, and Trade Office of Maros Regency
KecamatanSubdistrict 2016 2017 2018 2019
(1) (2) (3) (4) (5)
Mandai 49 49 23 ...
Moncongloe 6 6 2 ...
Maros Baru 23 23 7 ...
Marusu 18 18 6 ...
Turikale 117 117 53 ...
Lau 33 33 10 ...
Bontoa 16 16 4 ...
Bantimurung 25 25 9 ...
Simbang 8 8 2 ...
Tanralili 16 16 6 ...
Tompobulu 16 16 6 ...
Camba 12 12 4 ...
Cenrana 9 9 4 ...
Mallawa 5 5 3 ...
Maros 353 353 139 ...
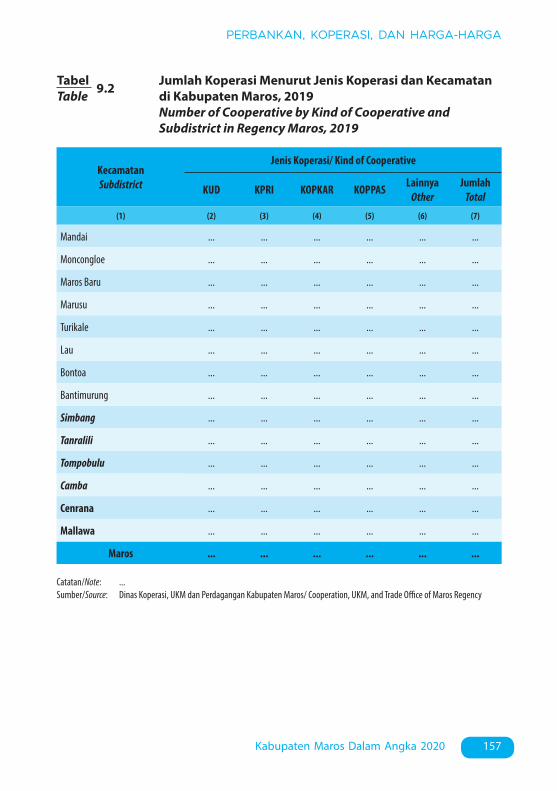
157Kabupaten Maros Dalam Angka 2020
PERBANKAN, KOPERASI, DAN HARGA-HARGA
TabelTable 9.2 Jumlah Koperasi Menurut Jenis Koperasi dan Kecamatan
di Kabupaten Maros, 2019 Number of Cooperative by Kind of Cooperative and
Subdistrict in Regency Maros, 2019
Catatan/Note: ...Sumber/Source: Dinas Koperasi, UKM dan Perdagangan Kabupaten Maros/ Cooperation, UKM, and Trade Office of Maros Regency
KecamatanSubdistrict
Jenis Koperasi/ Kind of Cooperative
KUD KPRI KOPKAR KOPPAS LainnyaOther
JumlahTotal
(1) (2) (3) (4) (5) (6) (7)
Mandai ... ... ... ... ... ...
Moncongloe ... ... ... ... ... ...
Maros Baru ... ... ... ... ... ...
Marusu ... ... ... ... ... ...
Turikale ... ... ... ... ... ...
Lau ... ... ... ... ... ...
Bontoa ... ... ... ... ... ...
Bantimurung ... ... ... ... ... ...
Simbang ... ... ... ... ... ...
Tanralili ... ... ... ... ... ...
Tompobulu ... ... ... ... ... ...
Camba ... ... ... ... ... ...
Cenrana ... ... ... ... ... ...
Mallawa ... ... ... ... ... ...
Maros ... ... ... ... ... ...
158 Maros Regency in Figures 2020
BANKING, COOPERATIVE, AND PRICES

10. Pengeluaran Penduduk/Population Expenditure ...........................................
10. PENGELUARAN PENDUDUK/POPULATION EXPENDITURE
THANKS FOR THE MEMORIES!
Pengeluaran konsumsi untukmakanan penduduk Kab. Maros lebih
kecil dibandingkan pengeluaranbukan makananan yaitu
45,4% untuk makananan, dan54,6% untuk bukan makanan
PENGELUARAN PENDUDUKPOPULATION EXPENDITURE
10

161Kabupaten Maros Dalam Angka 2020
PENGELUARAN PENDUDUK
PENJELASAN TEKNIS TECHNICAL NOTES
1. Pengeluaran rata-rata per kapita adalah biaya yang dikeluarkan untuk konsumsi semua anggota rumah tangga selama sebulan baik yang berasal dari pembelian, pemberian maupun produksi sendiri dibagi dengan banyaknya anggota rumah tangga dalam rumah tangga tersebut.
2. Data konsumsi/pengeluaran yang dikumpulkan pada Susenas dibagi menjadi dua kelompok yaitu konsumsi makanan dan bukan makanan.
3. Konsumsi/pengeluaran makanan dirinci menjadi 215 jenis komoditi, masing-masing dikumpulkan data kuantitas dan nilainya.
4. Untuk konsumsi bukan makanan pada umumnya yang dikumpul hanya data nilainya, kecuali untuk beberapa jenis pengeluaran tertentu, seperti penggunaan listrik, air, gas, dan bahan bakar minyak (BBM) yang juga dikumpulkan kuantitasnya.
1. Per capita Average Expenditure is the cost spent for all household members consumption during the month, whether from purchasing, giving or own production, divided by the number of household members in the household.
2. The data of consumption/ expenditure collected in Susenas are divided into two groups, namely food and non-food consumption.
3. Consumption/ expenditure on food covers 215 commodities, both quantity data and value are collected.
4. For consumption of non-food, the data collected in general ore only their values, axcept for certain types of expenditure, such as electricity, water, gas, and fuel, which are also collected for their quantity data.
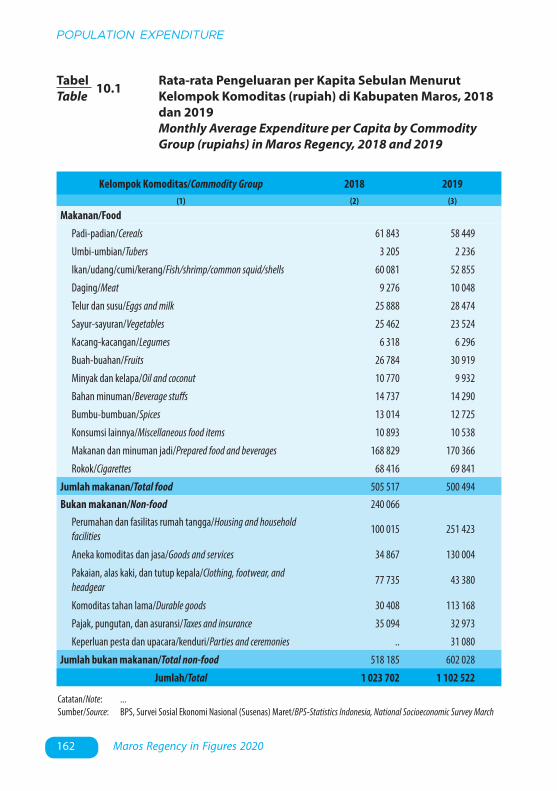
162 Maros Regency in Figures 2020
POPULATION EXPENDITURE
TabelTable 10.1 Rata-rata Pengeluaran per Kapita Sebulan Menurut
Kelompok Komoditas (rupiah) di Kabupaten Maros, 2018 dan 2019
Monthly Average Expenditure per Capita by Commodity Group (rupiahs) in Maros Regency, 2018 and 2019
Kelompok Komoditas/Commodity Group 2018 2019(1) (2) (3)
Makanan/Food
Padi-padian/Cereals 61 843 58 449
Umbi-umbian/Tubers 3 205 2 236
Ikan/udang/cumi/kerang/Fish/shrimp/common squid/shells 60 081 52 855
Daging/Meat 9 276 10 048
Telur dan susu/Eggs and milk 25 888 28 474
Sayur-sayuran/Vegetables 25 462 23 524
Kacang-kacangan/Legumes 6 318 6 296
Buah-buahan/Fruits 26 784 30 919
Minyak dan kelapa/Oil and coconut 10 770 9 932
Bahan minuman/Beverage stuffs 14 737 14 290
Bumbu-bumbuan/Spices 13 014 12 725
Konsumsi lainnya/Miscellaneous food items 10 893 10 538
Makanan dan minuman jadi/Prepared food and beverages 168 829 170 366
Rokok/Cigarettes 68 416 69 841
Jumlah makanan/Total food 505 517 500 494Bukan makanan/Non-food 240 066
Perumahan dan fasilitas rumah tangga/Housing and household facilities
100 015 251 423
Aneka komoditas dan jasa/Goods and services 34 867 130 004
Pakaian, alas kaki, dan tutup kepala/Clothing, footwear, and headgear
77 735 43 380
Komoditas tahan lama/Durable goods 30 408 113 168
Pajak, pungutan, dan asuransi/Taxes and insurance 35 094 32 973
Keperluan pesta dan upacara/kenduri/Parties and ceremonies .. 31 080
Jumlah bukan makanan/Total non-food 518 185 602 028
Jumlah/Total 1 023 702 1 102 522
Catatan/Note: ...Sumber/Source: BPS, Survei Sosial Ekonomi Nasional (Susenas) Maret/BPS-Statistics Indonesia, National Socioeconomic Survey March

163Kabupaten Maros Dalam Angka 2020
PENGELUARAN PENDUDUK
TabelTable 10.2 Persentase Pengeluaran per Kapita Sebulan Menurut
Kelompok Komoditas di Kabupaten Maros, 2018 dan 2019 Percentage of Monthly Expenditure per Capita by
Commodity Group in Maros Regency, 2018 and 2019
Kelompok Komoditas/Commodity Group 2018 2019(1) (2) (3)
Makanan/Food
Padi-padian/Cereals 12,23 11,68
Umbi-umbian/Tubers 0,63 0,45
Ikan/udang/cumi/kerang/Fish/shrimp/common squid/shells 11,89 10,56
Daging/Meat 1,83 2,01
Telur dan susu/Eggs and milk 5,12 5,69
Sayur-sayuran/Vegetables 5,04 4,70
Kacang-kacangan/Legumes 1,25 1,26
Buah-buahan/Fruits 5,30 6,18
Minyak dan kelapa/Oil and coconut 2,13 1,98
Bahan minuman/Beverage stuffs 2,92 2,86
Bumbu-bumbuan/Spices 2,57 2.,54
Konsumsi lainnya/Miscellaneous food items 2,15 2,11
Makanan dan minuman jadi/Prepared food and beverages 33,40 34,04
Rokok/Cigarettes 13,53 13,95
Jumlah makanan/Total food 49,38 45,40
Bukan makanan/Non-food
Perumahan dan fasilitas rumah tangga/Housing and household facilities
46,33 41,76
Aneka komoditas dan jasa/Goods and services 19,30 21,59
Pakaian, alas kaki, dan tutup kepala/Clothing, footwear, and headgear
6,73 7,21
Komoditas tahan lama/Durable goods 15,00 18,80
Pajak, pungutan, dan asuransi/Taxes and insurance 5,87 5,48
Keperluan pesta dan upacara/kenduri/Parties and ceremonies 6,77 5,16
Jumlah bukan makanan/Total non-food 50,62 54,60
Jumlah/Total 100 100
Catatan/Note: ...Sumber/Source: BPS, Survei Sosial Ekonomi Nasional (Susenas) Maret/BPS-Statistics Indonesia, National Socioeconomic Survey March

164 Maros Regency in Figures 2020
POPULATION EXPENDITURE
Golongan PengeluaranSpending Group
(Rp)2018 2019
(1) (2) (3)
< 150 000 0,03 0,40
150 000–199 999 0,47 0,51
200 000–299 999 3,36 5,30
300 000–499 999 18,31 17,25
500 000–749 999 19,15 20,69
750 000–999 999 17,84 16,03
1 000 000–1 499 999 25,35 19,03
> 1 500 000 15,49 20,78
Jumlah/Total 100,00 100,00
TabelTable 10.3 Persentase Penduduk Menurut Golongan Pengeluaran
Per Kapita Sebulan di Kabupaten Maros, 2018 dan 2019 Percentage of Population by Per Capita Spending Group a
Month in Maros Regency, 2018 and 2019
Catatan/Note: ...Sumber/Source: BPS, Survei Sosial Ekonomi Nasional (Susenas) Maret/BPS-Statistics Indonesia, National Socioeconomic Survey March

11. Perdagangan/Trade ..................................................................................................
11. PERDAGANGAN/TRADE
THANKS FOR THE MEMORIES!
Terdapat
21 Pasar di Kab Maros
PERDAGANGANTRADE
11


167Kabupaten Maros Dalam Angka 2020
PERDAGANGAN
PENJELASAN TEKNIS TECHNICAL NOTES
1. Pasar adalah tempat bertemunya pembeli dan penjual untuk melakukan transaksi jual beli barang atau jasa.
2. Toko adalah tempat tertutup yang di dalamnya terjadi kegiatan perdagangan dengan jenis benda atau barang yang khusus
3. Kios adalah toko kecil yang fungsinya sama dengan took, namun memiliki ukuran lebihc.kecil.
4. Warung adalah usaha kecil milik keluarga yang berbentuk kedai, kios, toko kecil, atau restoran sederhana
1. Market is a meeting place for buyers and sellers to make buying and selling goods or services.
2. Shop is covered in it occurs trade activities with types of objects or special items
3. Newsstand is a small shop that functions the same as the stores, but has a smaller size.
4. Warung is a small family owned business in the form of shops , stalls , small shops , or a simple restaurant

168 Maros Regency in Figures 2020
TRADE
TabelTable 11.1 Jumlah Sarana Perdagangan Menurut Jenisnya di
Kabupaten Maros 2016–2019 Number of Trading Facilities by Type of Facility in Maros
Regency, 2016–2019
Catatan/Note: ...Sumber/Source: Dinas Koperasi, UKM dan Perdagangan Kabupaten Maros/ Cooperation, UKM, and Trade Office of Maros Regency
Jenis Sarana PerdaganganType of Trading Facilities 2016 2017 2018 2019
(1) (2) (3) (4) (5)
Pasar/Market 20 43 21 ...
Toko/Store 33 145 - ...
Kios - - - ...
Warung - - - ...
Jumlah/Total 53 188 21 ...
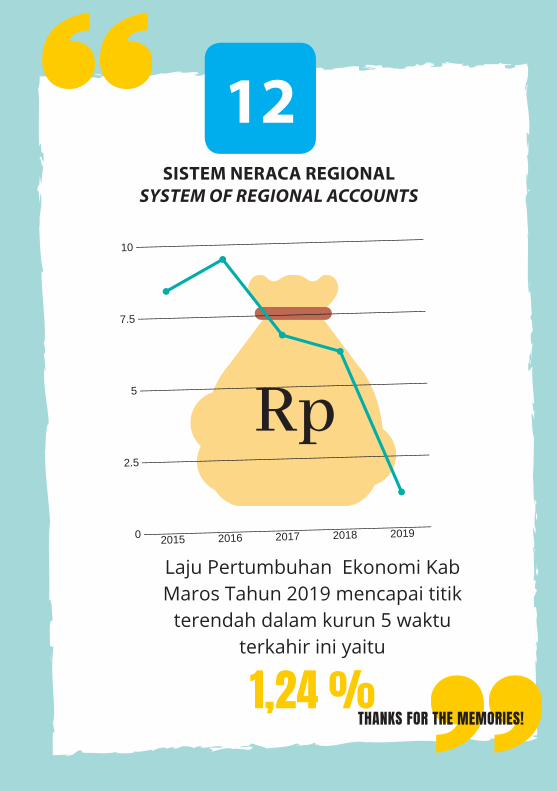
12. Sistem Neraca Regional/System of Regional Accounts .................................
12. SISTEM NERACA REGIONAL/SYSTEM OF REGIONAL ACCOUNTS
2015 2016 2017 2018 2019
10
7.5
5
2.5
0
THANKS FOR THE MEMORIES!
Laju Pertumbuhan Ekonomi KabMaros Tahun 2019 mencapai titik
terendah dalam kurun 5 waktuterkahir ini yaitu
1,24 %
Rp
SISTEM NERACA REGIONALSYSTEM OF REGIONAL ACCOUNTS
12

171Kabupaten Maros Dalam Angka 2020
SISTEM NERACA REGIONAL
PENJELASAN TEKNIS TECHNICAL NOTES
1. Penghitungan statistik neraca nasional mengikuti buku petunjuk yang diterbitkan oleh Perserikatan Bangsa Bangsa (PBB) dikenal sebagai Sistem Neraca Nasional (SNN). SNN adalah rekomendasi internasional tentang bagaimana menyusun ukuran aktivitas ekonomi yang sesuai dengan standar neraca baku yang didasarkan pada prinsip-prinsip ekonomi. Rekomendasi yang dimaksud dinyatakan dalam sekumpulan konsep, definisi, klasifikasi, dan aturan neraca yang disepakati secara internasional dalam mengukur indikator tertentu seperti Produk Domestik Bruto (PDB). Salah satu bentuk adaptasi pencatatan statistik nasional adalah melakukan perubahan tahun dasar PDB Indonesia dari tahun 2000 ke 2010. Perubahan tahun dasar PDB dilakukan seiring dengan mengadopsi rekomendasi PBB yang tertuang dalam Sistem Neraca Nasional 2008 (SNA 2008).
2. Produk Domestik Bruto pada tingkat nasional serta Produk Domestik Regional Bruto (PDRB) pada tingkat regional (provinsi) menggambarkan kemampuan suatu wilayah untuk menciptakan nilai tambah pada suatu waktu tertentu. Untuk menyusun PDB maupun PDRB digunakan 2
1. The method used to estimate national accounts statistics is based on the standard guidelines formed by United Nation known as System of National Accounts (SNA). SNA is the internationally agreed standard set of recommendations on how to compile measures of economic activity in accordance with strict accounting conventions based on economic principles. The recommendations are expressed in term of a set of concepts, definitions, classifications and accounting rules that comprise the internationally agreed standard for measuring indicators such as Gross Domestic Product (GDP). One of the improvement in the national statistical system is to rebase GDP form base year 2000 to 2010 in order to capture current economic condition. It is in line with the United Nations (UN) recommendation on 2008 SNA.
2. The basic measure of the value added arising from economic activity is known as Gross Domestic Product at the national level and Gross Regional Domestic Product (GRDP) at the regionallevelprovinces/regencies/municipalities). To compile these statistics, two approaches have been used, i.e. “production approach” and “expenditure approach”. The first approach is to measure value added produced by
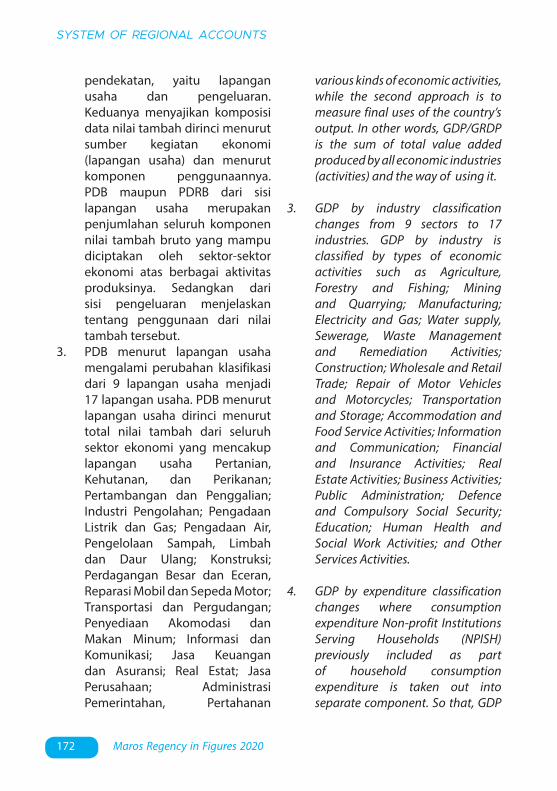
172 Maros Regency in Figures 2020
SYSTEM OF REGIONAL ACCOUNTS
pendekatan, yaitu lapangan usaha dan pengeluaran. Keduanya menyajikan komposisi data nilai tambah dirinci menurut sumber kegiatan ekonomi (lapangan usaha) dan menurut komponen penggunaannya. PDB maupun PDRB dari sisi lapangan usaha merupakan penjumlahan seluruh komponen nilai tambah bruto yang mampu diciptakan oleh sektor-sektor ekonomi atas berbagai aktivitas produksinya. Sedangkan dari sisi pengeluaran menjelaskan tentang penggunaan dari nilai tambah tersebut.
3. PDB menurut lapangan usaha mengalami perubahan klasifikasi dari 9 lapangan usaha menjadi 17 lapangan usaha. PDB menurut lapangan usaha dirinci menurut total nilai tambah dari seluruh sektor ekonomi yang mencakup lapangan usaha Pertanian, Kehutanan, dan Perikanan; Pertambangan dan Penggalian; Industri Pengolahan; Pengadaan Listrik dan Gas; Pengadaan Air, Pengelolaan Sampah, Limbah dan Daur Ulang; Konstruksi; Perdagangan Besar dan Eceran, Reparasi Mobil dan Sepeda Motor; Transportasi dan Pergudangan; Penyediaan Akomodasi dan Makan Minum; Informasi dan Komunikasi; Jasa Keuangan dan Asuransi; Real Estat; Jasa Perusahaan; Administrasi Pemerintahan, Pertahanan
various kinds of economic activities, while the second approach is to measure final uses of the country’s output. In other words, GDP/GRDP is the sum of total value added produced by all economic industries (activities) and the way of using it.
3. GDP by industry classification changes from 9 sectors to 17 industries. GDP by industry is classified by types of economic activities such as Agriculture, Forestry and Fishing; Mining and Quarrying; Manufacturing; Electricity and Gas; Water supply, Sewerage, Waste Management and Remediation Activities; Construction; Wholesale and Retail Trade; Repair of Motor Vehicles and Motorcycles; Transportation and Storage; Accommodation and Food Service Activities; Information and Communication; Financial and Insurance Activities; Real Estate Activities; Business Activities; Public Administration; Defence and Compulsory Social Security; Education; Human Health and Social Work Activities; and Other Services Activities.
4. GDP by expenditure classification changes where consumption expenditure Non-profit Institutions Serving Households (NPISH) previously included as part of household consumption expenditure is taken out into separate component. So that, GDP

173Kabupaten Maros Dalam Angka 2020
SISTEM NERACA REGIONAL
dan Jaminan Sosial Wajib; Jasa Pendidikan; Jasa Kesehatan dan Kegiatan Sosial; dan Jasa lainnya.
4. PDB menurut pengeluaran mengalami perubahan klasifikasi dimana pengeluaran konsumsi Lembaga Non Profit yang Melayani Rumah Tangga (LNPRT) yang sebelumnya termasuk bagian dari pengeluaran konsumsi rumah tangga menjadi komponen terpisah. Sehinga klasifikasi PDB menurut pengeluaran dirinci menjadi 7 komponen yaitu komponen pengeluaran konsumsi rumah tangga, pengeluaran konsumsi LNPRT, pengeluaran konsumsi pemerintah, pembentukan modal tetap bruto, perubahan inventori, ekspor barang dan jasa, dan impor barang dan jasa.
5. Pengeluaran konsumsi rumah tangga mencakup berbagai pengeluaran konsumsi akhir rumah tangga atas barang dan jasa untuk memenuhi kebutuhan individu ataupun kelompok secara langsung. Pengeluaran rumah tangga di sini mencakup makanan dan minuman selain restoran; pakaian, alas kaki dan jasa perawatannya; perumahan dan perlengkapan rumah tangga; kesehatan dan pendidikan; transportasi dan komunikasi; restoran dan hotel serta lainnya.
6. Pengeluaran Konsumsi Pemerintah terdiri dari Pengeluaran Konsumsi Individu
by type of expenditures is classified into: household consumption expenditure, NPISH consumption expenditure, government consumption expenditure, gross fixed capital formation, changes in inventories, exports of goods and services, and imports of goods and services.
5. Household consumption expenditures consist of expenditures incurred by households, which are used for both individual or collective needs. Household consumptions are classified into food and beverages other than restaurants; clothing, footwear, and related maintenance services; housing and household equipment; health and education; transport and communication; restaurants and hotels; and others.
6. Government consumption expenditure consists of Individual Consumption Expenditure and Collective Consumption Expenditure. Individual goods and services are private goods and services, which the characteristics of private goods is a) Scarcity, that there is a scarcity/limited in number; b) Excludable consumption, the consumption of goods can be limited only to those who meet certain requirements (usually the price); c) Rivalrous competition, ie consumption by the consumer will reduce or eliminate the chance of another party to do so. Examples of goods and services produced
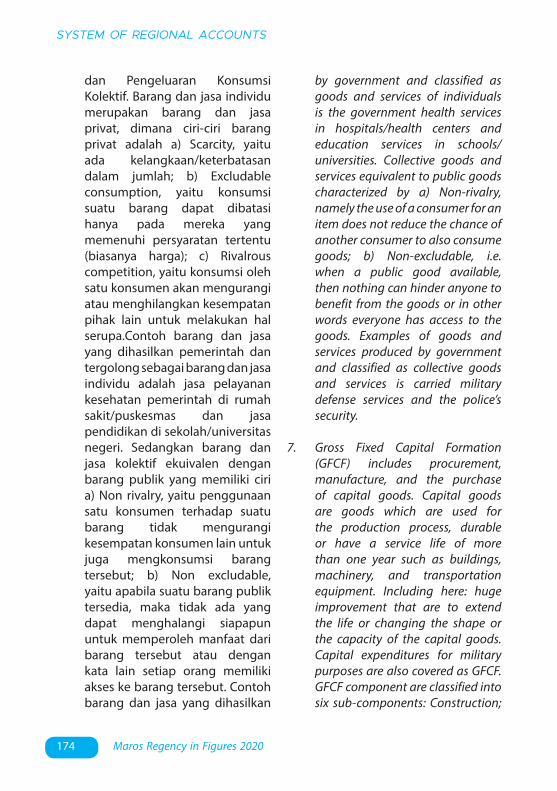
174 Maros Regency in Figures 2020
SYSTEM OF REGIONAL ACCOUNTS
dan Pengeluaran Konsumsi Kolektif. Barang dan jasa individu merupakan barang dan jasa privat, dimana ciri-ciri barang privat adalah a) Scarcity, yaitu ada kelangkaan/keterbatasan dalam jumlah; b) Excludable consumption, yaitu konsumsi suatu barang dapat dibatasi hanya pada mereka yang memenuhi persyaratan tertentu (biasanya harga); c) Rivalrous competition, yaitu konsumsi oleh satu konsumen akan mengurangi atau menghilangkan kesempatan pihak lain untuk melakukan hal serupa.Contoh barang dan jasa yang dihasilkan pemerintah dan tergolong sebagai barang dan jasa individu adalah jasa pelayanan kesehatan pemerintah di rumah sakit/puskesmas dan jasa pendidikan di sekolah/universitas negeri. Sedangkan barang dan jasa kolektif ekuivalen dengan barang publik yang memiliki ciri a) Non rivalry, yaitu penggunaan satu konsumen terhadap suatu barang tidak mengurangi kesempatan konsumen lain untuk juga mengkonsumsi barang tersebut; b) Non excludable, yaitu apabila suatu barang publik tersedia, maka tidak ada yang dapat menghalangi siapapun untuk memperoleh manfaat dari barang tersebut atau dengan kata lain setiap orang memiliki akses ke barang tersebut. Contoh barang dan jasa yang dihasilkan
by government and classified as goods and services of individuals is the government health services in hospitals/health centers and education services in schools/universities. Collective goods and services equivalent to public goods characterized by a) Non-rivalry, namely the use of a consumer for an item does not reduce the chance of another consumer to also consume goods; b) Non-excludable, i.e. when a public good available, then nothing can hinder anyone to benefit from the goods or in other words everyone has access to the goods. Examples of goods and services produced by government and classified as collective goods and services is carried military defense services and the police’s security.
7. Gross Fixed Capital Formation (GFCF) includes procurement, manufacture, and the purchase of capital goods. Capital goods are goods which are used for the production process, durable or have a service life of more than one year such as buildings, machinery, and transportation equipment. Including here: huge improvement that are to extend the life or changing the shape or the capacity of the capital goods. Capital expenditures for military purposes are also covered as GFCF. GFCF component are classified into six sub-components: Construction;
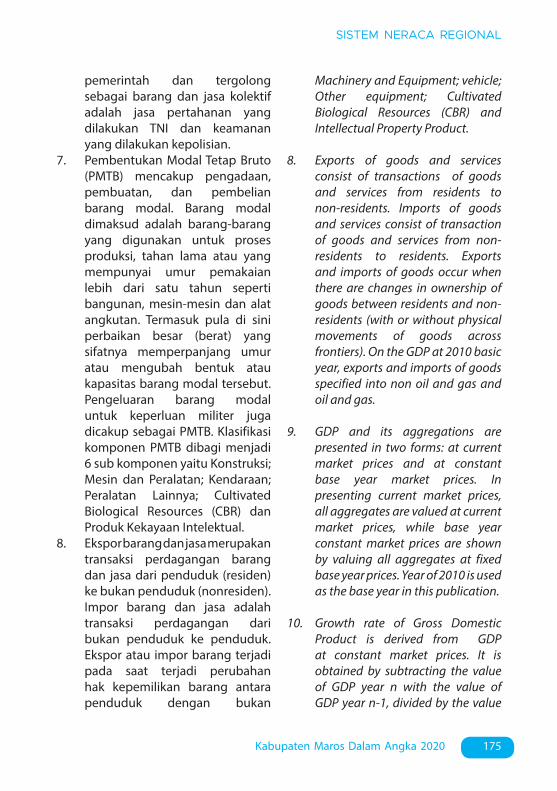
175Kabupaten Maros Dalam Angka 2020
SISTEM NERACA REGIONAL
pemerintah dan tergolong sebagai barang dan jasa kolektif adalah jasa pertahanan yang dilakukan TNI dan keamanan yang dilakukan kepolisian.
7. Pembentukan Modal Tetap Bruto (PMTB) mencakup pengadaan, pembuatan, dan pembelian barang modal. Barang modal dimaksud adalah barang-barang yang digunakan untuk proses produksi, tahan lama atau yang mempunyai umur pemakaian lebih dari satu tahun seperti bangunan, mesin-mesin dan alat angkutan. Termasuk pula di sini perbaikan besar (berat) yang sifatnya memperpanjang umur atau mengubah bentuk atau kapasitas barang modal tersebut. Pengeluaran barang modal untuk keperluan militer juga dicakup sebagai PMTB. Klasifikasi komponen PMTB dibagi menjadi 6 sub komponen yaitu Konstruksi; Mesin dan Peralatan; Kendaraan; Peralatan Lainnya; Cultivated Biological Resources (CBR) dan Produk Kekayaan Intelektual.
8. Ekspor barang dan jasa merupakan transaksi perdagangan barang dan jasa dari penduduk (residen) ke bukan penduduk (nonresiden). Impor barang dan jasa adalah transaksi perdagangan dari bukan penduduk ke penduduk. Ekspor atau impor barang terjadi pada saat terjadi perubahan hak kepemilikan barang antara penduduk dengan bukan
Machinery and Equipment; vehicle; Other equipment; Cultivated Biological Resources (CBR) and Intellectual Property Product.
8. Exports of goods and services consist of transactions of goods and services from residents to non-residents. Imports of goods and services consist of transaction of goods and services from non-residents to residents. Exports and imports of goods occur when there are changes in ownership of goods between residents and non-residents (with or without physical movements of goods across frontiers). On the GDP at 2010 basic year, exports and imports of goods specified into non oil and gas and oil and gas.
9. GDP and its aggregations are presented in two forms: at current market prices and at constant base year market prices. In presenting current market prices, all aggregates are valued at current market prices, while base year constant market prices are shown by valuing all aggregates at fixed base year prices. Year of 2010 is used as the base year in this publication.
10. Growth rate of Gross Domestic Product is derived from GDP at constant market prices. It is obtained by subtracting the value of GDP year n with the value of GDP year n-1, divided by the value

176 Maros Regency in Figures 2020
SYSTEM OF REGIONAL ACCOUNTS
penduduk (dengan atau tanpa perpindahan fisik barang tersebut). Pada PDB dengan tahun dasar 2010, ekspor dan impor barang dirinci menjadi nonmigas dan migas.
9. Produk Domestik Bruto maupun agregat turunannya disajikan dalam 2 (dua) versi penilaian, yaitu atas dasar “harga berlaku” dan atas dasar “harga konstan”. Disebut sebagai harga berlaku karena seluruh agregat dinilai dengan menggunakan harga pada tahun berjalan, sedangkan harga konstan penilaiannya didasarkan kepada harga satu tahun dasar tertentu, dalam publikasi ini digunakan harga tahun 2010.
10. Laju pertumbuhan Produk Domestik Bruto diperoleh dari perhitungan PDB atas dasar harga konstan. Diperoleh dengan cara mengurangi nilai PDB pada tahun ke-n terhadap nilai pada tahun ke n-1 (tahun sebelumnya), dibagi dengan nilai pada tahun ke n-1, dikalikan dengan 100 persen. Laju pertumbuhan menunjukkan perkembangan agregat pendapatan dari satu waktu tertentu terhadap waktu sebelumnya.
of GDP year n-1 then multiplied by 100 percent. The growth rate of GDP explains the income growth during the given period.
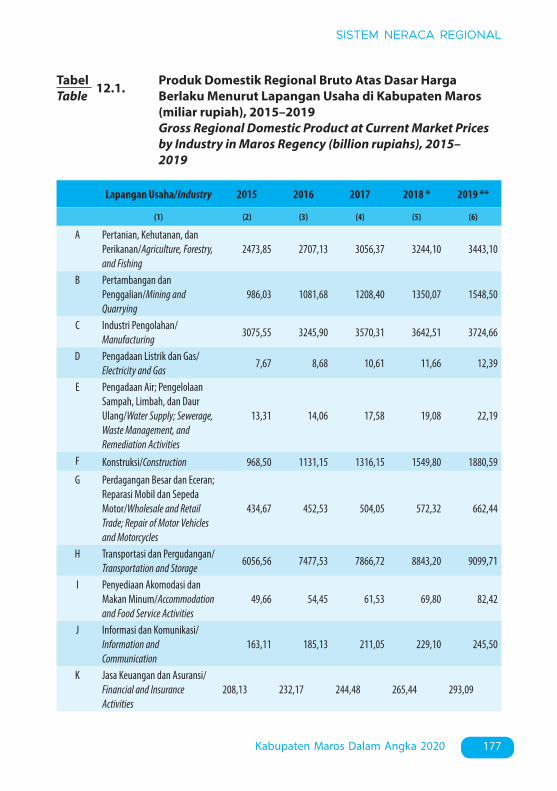
177Kabupaten Maros Dalam Angka 2020
SISTEM NERACA REGIONAL
TabelTable 12.1. Produk Domestik Regional Bruto Atas Dasar Harga
Berlaku Menurut Lapangan Usaha di Kabupaten Maros (miliar rupiah), 2015–2019
Gross Regional Domestic Product at Current Market Prices by Industry in Maros Regency (billion rupiahs), 2015–2019
Lapangan Usaha/Industry 2015 2016 2017 2018 * 2019 **
(1) (2) (3) (4) (5) (6)
A Pertanian, Kehutanan, dan Perikanan/Agriculture, Forestry, and Fishing
2473,85 2707,13 3056,37 3244,10 3443,10
B Pertambangan dan Penggalian/Mining and Quarrying
986,03 1081,68 1208,40 1350,07 1548,50
C Industri Pengolahan/Manufacturing
3075,55 3245,90 3570,31 3642,51 3724,66
D Pengadaan Listrik dan Gas/Electricity and Gas
7,67 8,68 10,61 11,66 12,39
E Pengadaan Air; Pengelolaan Sampah, Limbah, dan Daur Ulang/Water Supply; Sewerage, Waste Management, and Remediation Activities
13,31 14,06 17,58 19,08 22,19
F Konstruksi/Construction 968,50 1131,15 1316,15 1549,80 1880,59 G Perdagangan Besar dan Eceran;
Reparasi Mobil dan Sepeda Motor/Wholesale and Retail Trade; Repair of Motor Vehicles and Motorcycles
434,67 452,53 504,05 572,32 662,44
H Transportasi dan Pergudangan/Transportation and Storage
6056,56 7477,53 7866,72 8843,20 9099,71
I Penyediaan Akomodasi dan Makan Minum/Accommodation and Food Service Activities
49,66 54,45 61,53 69,80 82,42
J Informasi dan Komunikasi/Information and Communication
163,11 185,13 211,05 229,10 245,50
K Jasa Keuangan dan Asuransi/Financial and Insurance Activities
208,13 232,17 244,48 265,44 293,09
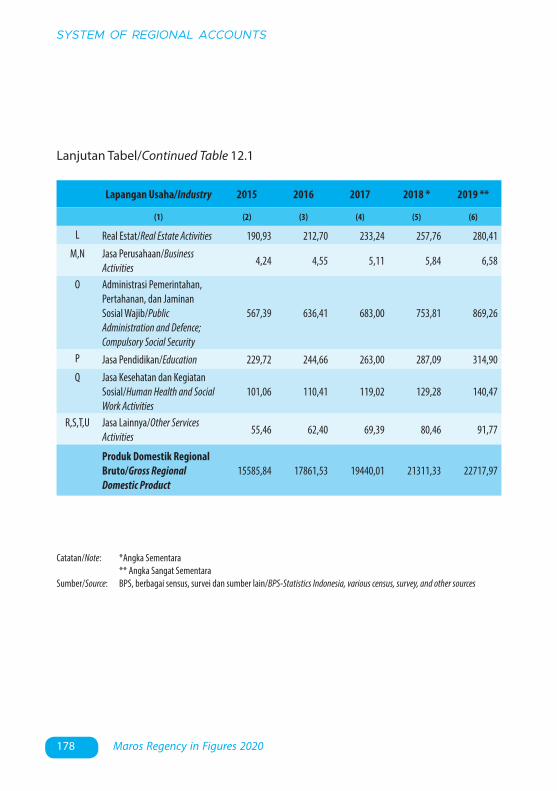
178 Maros Regency in Figures 2020
SYSTEM OF REGIONAL ACCOUNTS
Lapangan Usaha/Industry 2015 2016 2017 2018 * 2019 **
(1) (2) (3) (4) (5) (6)
L Real Estat/Real Estate Activities 190,93 212,70 233,24 257,76 280,41 M,N Jasa Perusahaan/Business
Activities4,24 4,55 5,11 5,84 6,58
O Administrasi Pemerintahan, Pertahanan, dan Jaminan Sosial Wajib/Public Administration and Defence; Compulsory Social Security
567,39 636,41 683,00 753,81 869,26
P Jasa Pendidikan/Education 229,72 244,66 263,00 287,09 314,90 Q Jasa Kesehatan dan Kegiatan
Sosial/Human Health and Social Work Activities
101,06 110,41 119,02 129,28 140,47
R,S,T,U Jasa Lainnya/Other Services Activities
55,46 62,40 69,39 80,46 91,77
Produk Domestik Regional Bruto/Gross Regional Domestic Product
15585,84 17861,53 19440,01 21311,33 22717,97
Lanjutan Tabel/Continued Table 12.1
Catatan/Note: *Angka Sementara ** Angka Sangat SementaraSumber/Source: BPS, berbagai sensus, survei dan sumber lain/BPS-Statistics Indonesia, various census, survey, and other sources

179Kabupaten Maros Dalam Angka 2020
SISTEM NERACA REGIONAL
TabelTable 12.2 Produk Domestik Regional Bruto Atas Dasar Harga
Konstan 2010 Menurut Lapangan Usaha di Kabupaten/Maros (miliar rupiah), 2015–2019
Gross Regional Domestic Product at 2010 Constant Market Prices by Industry in Maros Regency (billion rupiahs), 2015–2019
Lapangan Usaha/Industry 2015 2016 2017 2018 * 2019 **
(1) (2) (3) (4) (5) (6)
A Pertanian, Kehutanan, dan Perikanan/Agriculture, Forestry, and Fishing
1888,85 2051,83 2203,48 2312,48 2434,72
B Pertambangan dan Penggalian/Mining and Quarrying
828,87 955,85 1142,05 1253,53 1419,90
C Industri Pengolahan/Manufacturing
2572,16 2653,47 2733,88 2747,09 2787,67
D Pengadaan Listrik dan Gas/Electricity and Gas
8,97 10,04 10,65 11,23 11,93
E Pengadaan Air; Pengelolaan Sampah, Limbah, dan Daur Ulang/Water Supply; Sewerage, Waste Management, and Remediation Activities
10,87 10,98 12,17 13,08 15,20
F Konstruksi/Construction 627,45 677,32 737,51 807,44 950,69 G Perdagangan Besar dan Eceran;
Reparasi Mobil dan Sepeda Motor/Wholesale and Retail Trade; Repair of Motor Vehicles and Motorcycles
371,95 395,40 415,44 451,11 508,10
H Transportasi dan Pergudangan/Transportation and Storage
3407,38 3917,73 4175,99 4541,58 4040,99
I Penyediaan Akomodasi dan Makan Minum/Accommodation and Food Service Activities
37,14 39,63 41,56 46,55 53,22
J Informasi dan Komunikasi/Information and Communication
153,27 160,21 168,70 179,84 190,75
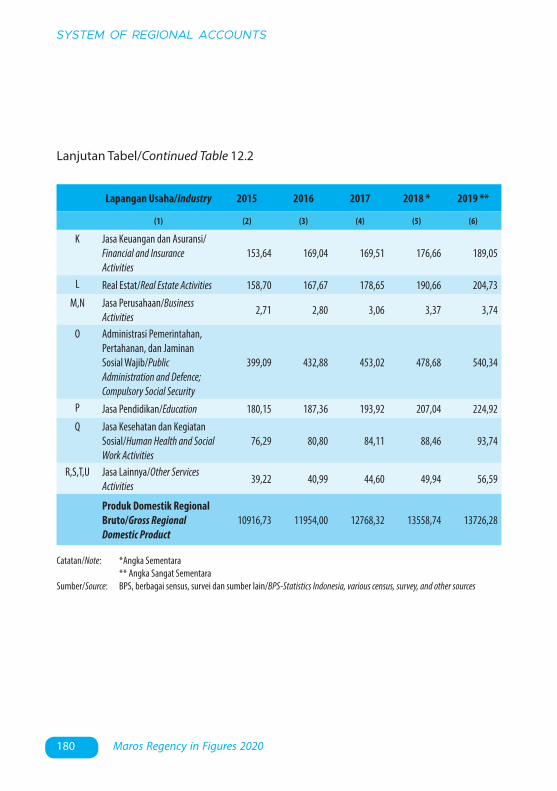
180 Maros Regency in Figures 2020
SYSTEM OF REGIONAL ACCOUNTS
Lanjutan Tabel/Continued Table 12.2
Lapangan Usaha/Industry 2015 2016 2017 2018 * 2019 **
(1) (2) (3) (4) (5) (6)
K Jasa Keuangan dan Asuransi/Financial and Insurance Activities
153,64 169,04 169,51 176,66 189,05
L Real Estat/Real Estate Activities 158,70 167,67 178,65 190,66 204,73 M,N Jasa Perusahaan/Business
Activities2,71 2,80 3,06 3,37 3,74
O Administrasi Pemerintahan, Pertahanan, dan Jaminan Sosial Wajib/Public Administration and Defence; Compulsory Social Security
399,09 432,88 453,02 478,68 540,34
P Jasa Pendidikan/Education 180,15 187,36 193,92 207,04 224,92 Q Jasa Kesehatan dan Kegiatan
Sosial/Human Health and Social Work Activities
76,29 80,80 84,11 88,46 93,74
R,S,T,U Jasa Lainnya/Other Services Activities
39,22 40,99 44,60 49,94 56,59
Produk Domestik Regional Bruto/Gross Regional Domestic Product
10916,73 11954,00 12768,32 13558,74 13726,28
Catatan/Note: *Angka Sementara ** Angka Sangat SementaraSumber/Source: BPS, berbagai sensus, survei dan sumber lain/BPS-Statistics Indonesia, various census, survey, and other sources

181Kabupaten Maros Dalam Angka 2020
SISTEM NERACA REGIONAL
TabelTable 12.3 Distribusi Persentase Produk Domestik Regional Bruto
Atas Dasar Harga Berlaku Menurut Lapangan Usaha di Kabupaten Maros, 2015–2019
Percentage Distribution of Gross Regional Domestic Product at Current Market Prices by Industry in Maros Regency, 2015–2019
Lapangan Usaha/Industry 2015 2016 2017 2018 * 2019 *
(1) (2) (3) (4) (5) (6)
A Pertanian, Kehutanan, dan Perikanan/Agriculture, Forestry, and Fishing
15,87 15,16 15,72 15,22 15,16
B Pertambangan dan Penggalian/Mining and Quarrying
6,33 6,06 6,22 6,33 6,82
C Industri Pengolahan/Manufacturing
19,73 18,17 18,37 17,09 16,4
D Pengadaan Listrik dan Gas/Electricity and Gas
0,05 0,05 0,05 0,05 0,05
E Pengadaan Air; Pengelolaan Sampah, Limbah, dan Daur Ulang/Water Supply; Sewerage, Waste Management, and Remediation Activities
0,09 0,08 0,09 0,09 0,1
F Konstruksi/Construction 6,21 6,33 6,77 7,27 8,28G Perdagangan Besar dan Eceran;
Reparasi Mobil dan Sepeda Motor/Wholesale and Retail Trade; Repair of Motor Vehicles and Motorcycles
2,79 2,53 2,59 2,69 2,92
H Transportasi dan Pergudangan/Transportation and Storage
38,86 41,86 40,47 41,5 40,06
I Penyediaan Akomodasi dan Makan Minum/Accommodation and Food Service Activities
0,32 0,3 0,32 0,33 0,36
J Informasi dan Komunikasi/Information and Communication
1,05 1,04 1,09 1,07 1,08
K Jasa Keuangan dan Asuransi/Financial and Insurance Activities
1,34 1,3 1,26 1,25 1,29
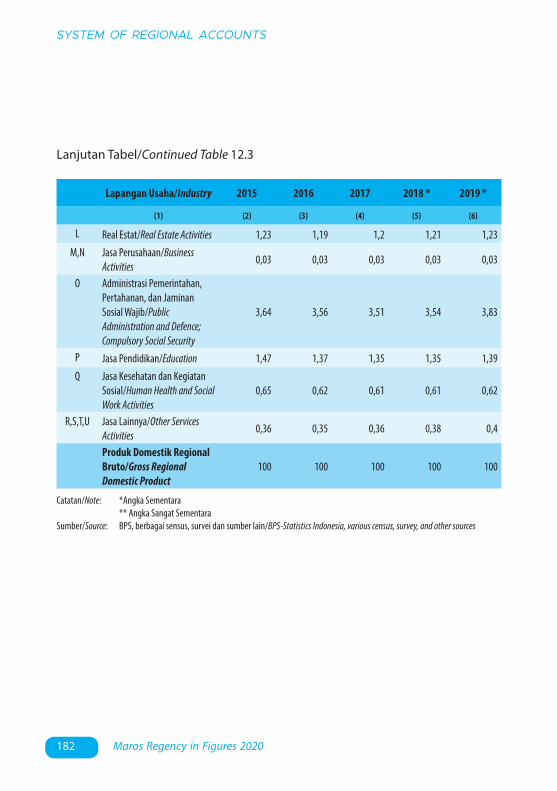
182 Maros Regency in Figures 2020
SYSTEM OF REGIONAL ACCOUNTS
Lanjutan Tabel/Continued Table 12.3
Lapangan Usaha/Industry 2015 2016 2017 2018 * 2019 *
(1) (2) (3) (4) (5) (6)
L Real Estat/Real Estate Activities 1,23 1,19 1,2 1,21 1,23M,N Jasa Perusahaan/Business
Activities0,03 0,03 0,03 0,03 0,03
O Administrasi Pemerintahan, Pertahanan, dan Jaminan Sosial Wajib/Public Administration and Defence; Compulsory Social Security
3,64 3,56 3,51 3,54 3,83
P Jasa Pendidikan/Education 1,47 1,37 1,35 1,35 1,39Q Jasa Kesehatan dan Kegiatan
Sosial/Human Health and Social Work Activities
0,65 0,62 0,61 0,61 0,62
R,S,T,U Jasa Lainnya/Other Services Activities
0,36 0,35 0,36 0,38 0,4
Produk Domestik Regional Bruto/Gross Regional Domestic Product
100 100 100 100 100
Catatan/Note: *Angka Sementara ** Angka Sangat SementaraSumber/Source: BPS, berbagai sensus, survei dan sumber lain/BPS-Statistics Indonesia, various census, survey, and other sources
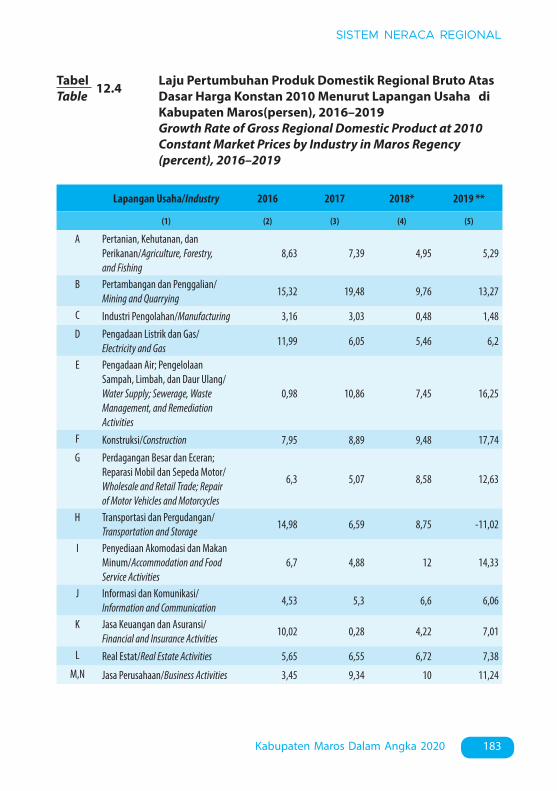
183Kabupaten Maros Dalam Angka 2020
SISTEM NERACA REGIONAL
TabelTable 12.4 Laju Pertumbuhan Produk Domestik Regional Bruto Atas
Dasar Harga Konstan 2010 Menurut Lapangan Usaha di Kabupaten Maros(persen), 2016–2019
Growth Rate of Gross Regional Domestic Product at 2010 Constant Market Prices by Industry in Maros Regency (percent), 2016–2019
Lapangan Usaha/Industry 2016 2017 2018* 2019 **
(1) (2) (3) (4) (5)
A Pertanian, Kehutanan, dan Perikanan/Agriculture, Forestry, and Fishing
8,63 7,39 4,95 5,29
B Pertambangan dan Penggalian/Mining and Quarrying
15,32 19,48 9,76 13,27
C Industri Pengolahan/Manufacturing 3,16 3,03 0,48 1,48D Pengadaan Listrik dan Gas/
Electricity and Gas11,99 6,05 5,46 6,2
E Pengadaan Air; Pengelolaan Sampah, Limbah, dan Daur Ulang/Water Supply; Sewerage, Waste Management, and Remediation Activities
0,98 10,86 7,45 16,25
F Konstruksi/Construction 7,95 8,89 9,48 17,74G Perdagangan Besar dan Eceran;
Reparasi Mobil dan Sepeda Motor/Wholesale and Retail Trade; Repair of Motor Vehicles and Motorcycles
6,3 5,07 8,58 12,63
H Transportasi dan Pergudangan/Transportation and Storage
14,98 6,59 8,75 -11,02
I Penyediaan Akomodasi dan Makan Minum/Accommodation and Food Service Activities
6,7 4,88 12 14,33
J Informasi dan Komunikasi/Information and Communication
4,53 5,3 6,6 6,06
K Jasa Keuangan dan Asuransi/Financial and Insurance Activities
10,02 0,28 4,22 7,01
L Real Estat/Real Estate Activities 5,65 6,55 6,72 7,38M,N Jasa Perusahaan/Business Activities 3,45 9,34 10 11,24

184 Maros Regency in Figures 2020
SYSTEM OF REGIONAL ACCOUNTS
Lanjutan Tabel/Continued Table 12.4
Lapangan Usaha/Industry 2016 2017 2018* 2019 **
(1) (2) (3) (4) (5)
O Administrasi Pemerintahan, Pertahanan, dan Jaminan Sosial Wajib/Public Administration and Defence; Compulsory Social Security
8,47 4,65 5,66 12,88
P Jasa Pendidikan/Education 4 3,5 6,76 8,64Q Jasa Kesehatan dan Kegiatan
Sosial/Human Health and Social Work Activities
5,91 4,1 5,18 5,97
R,S,T,U Jasa Lainnya/Other Services Activities
4,5 8,82 11,96 13,32
Produk Domestik Regional Bruto/Gross Regional Domestic Product
9,5 6,81 6,19 1,24
Catatan/Note: *Angka Sementara ** Angka Sangat SementaraSumber/Source: BPS, berbagai sensus, survei dan sumber lain/BPS-Statistics Indonesia, various census, survey, and other sources
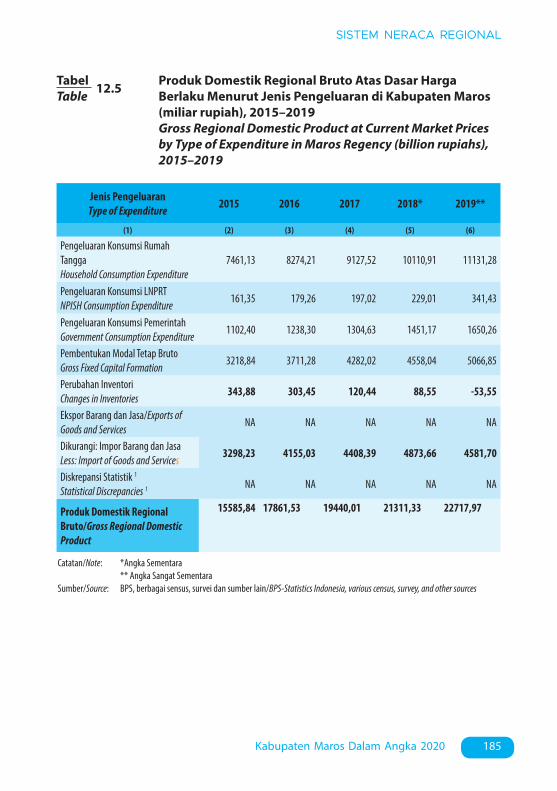
185Kabupaten Maros Dalam Angka 2020
SISTEM NERACA REGIONAL
TabelTable 12.5 Produk Domestik Regional Bruto Atas Dasar Harga
Berlaku Menurut Jenis Pengeluaran di Kabupaten Maros (miliar rupiah), 2015–2019
Gross Regional Domestic Product at Current Market Prices by Type of Expenditure in Maros Regency (billion rupiahs), 2015–2019
Jenis PengeluaranType of Expenditure 2015 2016 2017 2018* 2019**
(1) (2) (3) (4) (5) (6)
Pengeluaran Konsumsi Rumah TanggaHousehold Consumption Expenditure
7461,13 8274,21 9127,52 10110,91 11131,28
Pengeluaran Konsumsi LNPRTNPISH Consumption Expenditure
161,35 179,26 197,02 229,01 341,43
Pengeluaran Konsumsi PemerintahGovernment Consumption Expenditure
1102,40 1238,30 1304,63 1451,17 1650,26
Pembentukan Modal Tetap BrutoGross Fixed Capital Formation
3218,84 3711,28 4282,02 4558,04 5066,85
Perubahan InventoriChanges in Inventories
343,88 303,45 120,44 88,55 -53,55
Ekspor Barang dan Jasa/Exports of Goods and Services
NA NA NA NA NA
Dikurangi: Impor Barang dan JasaLess: Import of Goods and Services
3298,23 4155,03 4408,39 4873,66 4581,70
Diskrepansi Statistik 1
Statistical Discrepancies 1 NA NA NA NA NA
Produk Domestik Regional Bruto/Gross Regional Domestic Product
15585,84 17861,53 19440,01 21311,33 22717,97
Catatan/Note: *Angka Sementara ** Angka Sangat SementaraSumber/Source: BPS, berbagai sensus, survei dan sumber lain/BPS-Statistics Indonesia, various census, survey, and other sources
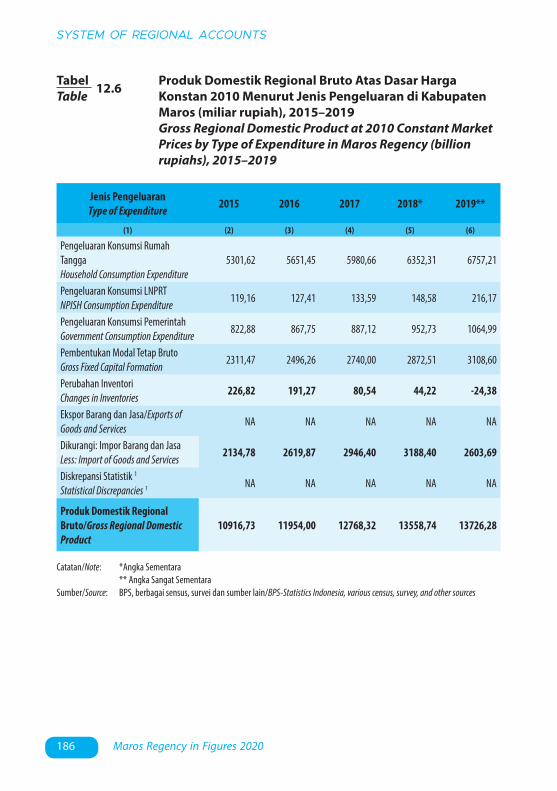
186 Maros Regency in Figures 2020
SYSTEM OF REGIONAL ACCOUNTS
Jenis PengeluaranType of Expenditure 2015 2016 2017 2018* 2019**
(1) (2) (3) (4) (5) (6)
Pengeluaran Konsumsi Rumah TanggaHousehold Consumption Expenditure
5301,62 5651,45 5980,66 6352,31 6757,21
Pengeluaran Konsumsi LNPRTNPISH Consumption Expenditure
119,16 127,41 133,59 148,58 216,17
Pengeluaran Konsumsi PemerintahGovernment Consumption Expenditure
822,88 867,75 887,12 952,73 1064,99
Pembentukan Modal Tetap BrutoGross Fixed Capital Formation
2311,47 2496,26 2740,00 2872,51 3108,60
Perubahan InventoriChanges in Inventories
226,82 191,27 80,54 44,22 -24,38
Ekspor Barang dan Jasa/Exports of Goods and Services
NA NA NA NA NA
Dikurangi: Impor Barang dan JasaLess: Import of Goods and Services
2134,78 2619,87 2946,40 3188,40 2603,69
Diskrepansi Statistik 1
Statistical Discrepancies 1 NA NA NA NA NA
Produk Domestik Regional Bruto/Gross Regional Domestic Product
10916,73 11954,00 12768,32 13558,74 13726,28
Catatan/Note: *Angka Sementara ** Angka Sangat SementaraSumber/Source: BPS, berbagai sensus, survei dan sumber lain/BPS-Statistics Indonesia, various census, survey, and other sources
TabelTable 12.6 Produk Domestik Regional Bruto Atas Dasar Harga
Konstan 2010 Menurut Jenis Pengeluaran di Kabupaten Maros (miliar rupiah), 2015–2019
Gross Regional Domestic Product at 2010 Constant Market Prices by Type of Expenditure in Maros Regency (billion rupiahs), 2015–2019

13. Perbandingan Antar Kabupaten/Kota/Regency/Municipal Comparison
13. PERBANDINGAN ANTAR KABUPATEN/KOTA/ REGENCY/MUNICIPAL COMPARISON
THANKS FOR THE MEMORIES!
Jumlah penduduk miskin Kab Maros (34,85ribu)lebih kecil dibandingkan dengan Kab Gowa
(57,99 ribu) dan Kota Makasar(65,12 ribu),Tetapi laju pertumbuhan ekonominya lebih
kecil dibandingkan keduanya
PERBANDINGAN ANTAR KABUPATEN/KOTA REGENCY/MUNICIPAL COMPARISON
13


189Kabupaten Maros Dalam Angka 2020
PERBANDINGAN ANTAR KABUPATEN/KOTA
TabelTable 13.1 Jumlah Penduduk Menurut Kabupaten/Kota di Provinsi
Sulawesi Selatan(ribu), 2015–2019 Population by Regency/Municipality in South Sulawesi
Province (thousand), 2015–2019
Kabupaten/KotaRegency/Municipality 2015 2016 2017 2018 2019
(1) (2) (3) (4) (5) (6)
Selayar 130 199 131 605 133 003 134 280 135 624
Bulukumba 410 485 413 229 415 713 418 326 420 603
bantaeng 183 386 184 517 185 581 186 612 187 626
Jeneponto 355 599 357 807 359 787 361 793 363 792
Takalar 286 906 289 978 292 983 295 892 298 688
Gowa 722 702 735 493 748 200 760 607 772 684
Sinjai 238 099 239 689 241 208 242 672 244 125
Maros 339 300 342 890 346 383 349 822 353 121
Pangkajene dan Kepulauan 323 597 326 700 329 791 332 674 335 514
Barru 171 217 171 906 172 767 173 623 174 323
Bone 742 912 746 973 751 026 754 894 758 589
Soppeng 226 116 226 305 226 466 226 770 226 991
Wajo 393 218 394 495 395 583 396 810 397 814
Sidenreng Rappang 289 787 292 985 296 125 299 123 301 972
Pinrang 366 789 369 595 372 230 374 583 377 119
Enrekang 199 998 201 614 203 320 204 827 206 387
Luwu 350 218 353 277 356 305 359 209 362 027
Tana Toraja 228 984 230 195 231 519 232 821 234 002
Luwu Utara 302 687 305 372 308 001 310 470 312 883
Luwu Timur 275 595 281 822 287 874 293 822 299 673
Toraja Utara 225 516 226 988 228 414 229 798 231 214
Makassar 1 449 401 1 469 601 1 489 011 1 508 154 1 526 677
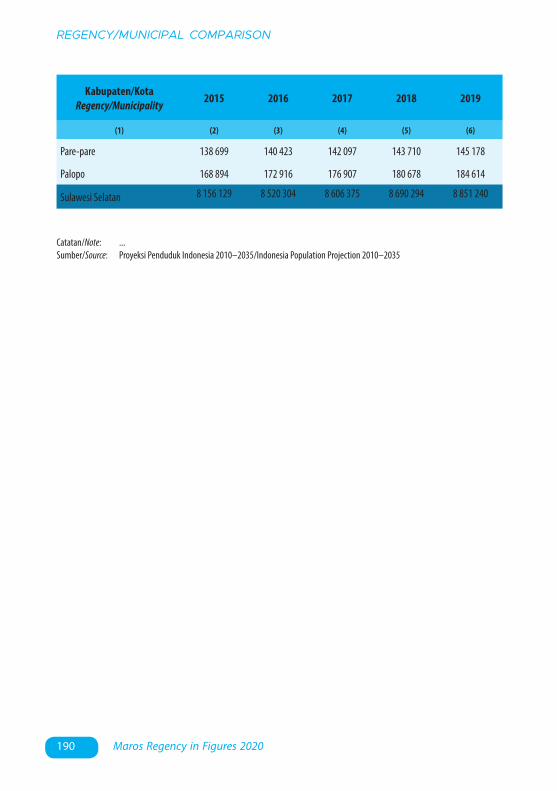
190 Maros Regency in Figures 2020
REGENCY/MUNICIPAL COMPARISON
Catatan/Note: ...Sumber/Source: Proyeksi Penduduk Indonesia 2010–2035/Indonesia Population Projection 2010–2035
Kabupaten/KotaRegency/Municipality 2015 2016 2017 2018 2019
(1) (2) (3) (4) (5) (6)
Pare-pare 138 699 140 423 142 097 143 710 145 178
Palopo 168 894 172 916 176 907 180 678 184 614
Sulawesi Selatan 8 156 129 8 520 304 8 606 375 8 690 294 8 851 240
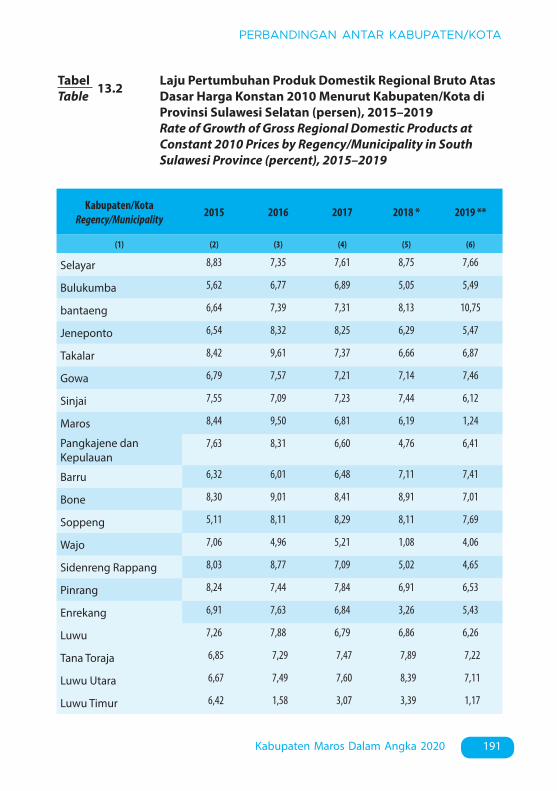
191Kabupaten Maros Dalam Angka 2020
PERBANDINGAN ANTAR KABUPATEN/KOTA
TabelTable 13.2 Laju Pertumbuhan Produk Domestik Regional Bruto Atas
Dasar Harga Konstan 2010 Menurut Kabupaten/Kota di Provinsi Sulawesi Selatan (persen), 2015–2019
Rate of Growth of Gross Regional Domestic Products at Constant 2010 Prices by Regency/Municipality in South Sulawesi Province (percent), 2015–2019
Kabupaten/KotaRegency/Municipality 2015 2016 2017 2018 * 2019 **
(1) (2) (3) (4) (5) (6)
Selayar 8,83 7,35 7,61 8,75 7,66
Bulukumba 5,62 6,77 6,89 5,05 5,49
bantaeng 6,64 7,39 7,31 8,13 10,75
Jeneponto 6,54 8,32 8,25 6,29 5,47
Takalar 8,42 9,61 7,37 6,66 6,87
Gowa 6,79 7,57 7,21 7,14 7,46
Sinjai 7,55 7,09 7,23 7,44 6,12
Maros 8,44 9,50 6,81 6,19 1,24
Pangkajene dan Kepulauan
7,63 8,31 6,60 4,76 6,41
Barru 6,32 6,01 6,48 7,11 7,41
Bone 8,30 9,01 8,41 8,91 7,01
Soppeng 5,11 8,11 8,29 8,11 7,69
Wajo 7,06 4,96 5,21 1,08 4,06
Sidenreng Rappang 8,03 8,77 7,09 5,02 4,65
Pinrang 8,24 7,44 7,84 6,91 6,53
Enrekang 6,91 7,63 6,84 3,26 5,43
Luwu 7,26 7,88 6,79 6,86 6,26
Tana Toraja 6,85 7,29 7,47 7,89 7,22
Luwu Utara 6,67 7,49 7,60 8,39 7,11
Luwu Timur 6,42 1,58 3,07 3,39 1,17

192 Maros Regency in Figures 2020
REGENCY/MUNICIPAL COMPARISON
Catatan/Note: * Angka Sementara **: Angka Sangat SementaraSumber/Source: Badan Pusat Statistik, yang diolah dari berbagai sumber / Indonesia Statistics, based on various sources
Kabupaten/KotaRegency/Municipality 2015 2016 2017 2018 * 2019 **
(1) (2) (3) (4) (5) (6)
Toraja Utara 7,76 8,01 8,22 8,07 7,56
Makassar 7,55 8,03 8,20 8,42 8,79
Pare-pare 6,30 6,87 6,97 5,58 6,65
Palopo 6,47 6,95 7,17 7,52 6,75
Sulawesi Selatan 7,19 7,42 7,21 7,06 6,92

193Kabupaten Maros Dalam Angka 2020
PERBANDINGAN ANTAR KABUPATEN/KOTA
TabelTable 13.3 Jumlah Penduduk Miskin Menurut Kabupaten/Kota di
Provinsi Sulawesi Selatan (ribu), 2015–2019 Number of Poor Population by Regency/Municipality in
South Sulawesi Province (thousand), 2015–2019
Kabupaten/KotaRegency/Municipality 2015 2016 2017 2018 2019
(1) (2) (3) (4) (5) (6)
Selayar 16,9 17,21 17,61 17,59 17,36
Bulukumba 33,36 33,25 33,1 31,25 30,49
bantaeng 17,55 17,53 17,91 17,2 16,91
Jeneponto 53,87 55,32 55,34 55,95 54,05
Takalar 27,12 27,05 26,99 26,57 25,93
Gowa 59,47 61,52 62,77 59,34 57,99
Sinjai 21,99 22,51 22,25 22,48 22,27
Maros 40,08 39,02 38,5 35,97 34,85
Pangkajene dan Kepulauan
53,85 52,86 53,38 50,12 47,07
Barru 16,1 16,24 16,76 15,68 14,92
Bone 75,01 75,09 77,13 79,57 76,25
Soppeng 18,88 19,12 18,76 17 16,45
Wajo 30,08 29,46 29,19 29,73 27,48
Sidenreng Rappang 16,03 15,92 15,72 15,41 14,44
Pinrang 30,51 31,28 31,43 32,94 31,85
Enrekang 27,6 26,98 26,71 22,53 25,40
Luwu 48,64 50,58 49,8 47,91 46,18
Tana Toraja 28,59 28,42 29,18 29,65 28,87
Luwu Utara 41,89 43,75 44,04 42,43 42,48
Luwu Timur 19,67 21,08 21,94 21,15 20,83
Toraja Utara 34,37 33,02 32,85 30,68 28,64
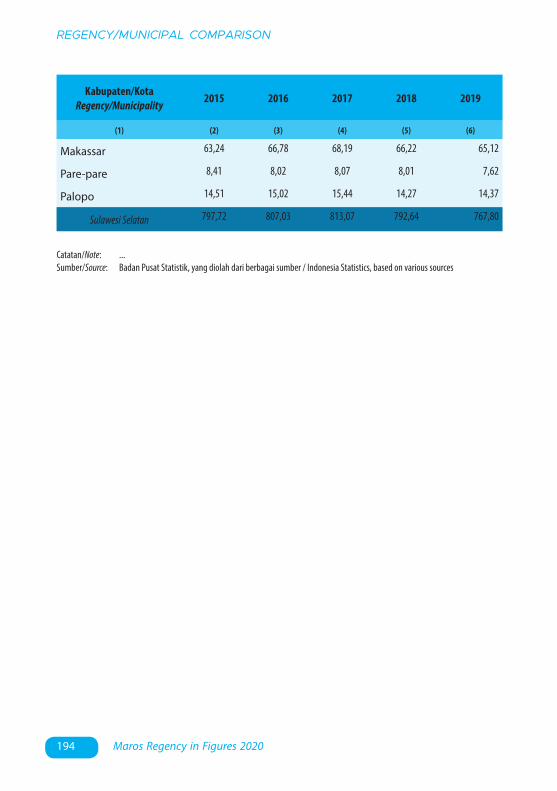
194 Maros Regency in Figures 2020
REGENCY/MUNICIPAL COMPARISON
Catatan/Note: ...Sumber/Source: Badan Pusat Statistik, yang diolah dari berbagai sumber / Indonesia Statistics, based on various sources
Kabupaten/KotaRegency/Municipality 2015 2016 2017 2018 2019
(1) (2) (3) (4) (5) (6)
Makassar 63,24 66,78 68,19 66,22 65,12
Pare-pare 8,41 8,02 8,07 8,01 7,62
Palopo 14,51 15,02 15,44 14,27 14,37
Sulawesi Selatan 797,72 807,03 813,07 792,64 767,80
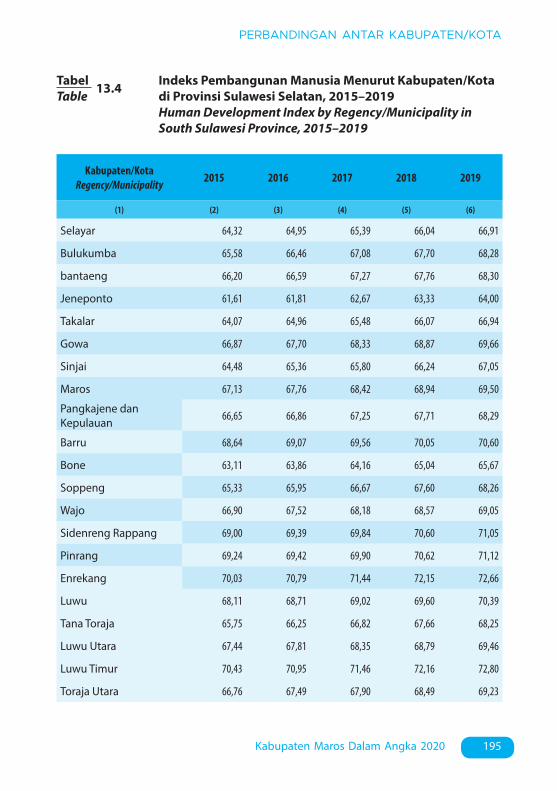
195Kabupaten Maros Dalam Angka 2020
PERBANDINGAN ANTAR KABUPATEN/KOTA
TabelTable 13.4 Indeks Pembangunan Manusia Menurut Kabupaten/Kota
di Provinsi Sulawesi Selatan, 2015–2019 Human Development Index by Regency/Municipality in
South Sulawesi Province, 2015–2019
Kabupaten/KotaRegency/Municipality 2015 2016 2017 2018 2019
(1) (2) (3) (4) (5) (6)
Selayar 64,32 64,95 65,39 66,04 66,91
Bulukumba 65,58 66,46 67,08 67,70 68,28
bantaeng 66,20 66,59 67,27 67,76 68,30
Jeneponto 61,61 61,81 62,67 63,33 64,00
Takalar 64,07 64,96 65,48 66,07 66,94
Gowa 66,87 67,70 68,33 68,87 69,66
Sinjai 64,48 65,36 65,80 66,24 67,05
Maros 67,13 67,76 68,42 68,94 69,50
Pangkajene dan Kepulauan 66,65 66,86 67,25 67,71 68,29
Barru 68,64 69,07 69,56 70,05 70,60
Bone 63,11 63,86 64,16 65,04 65,67
Soppeng 65,33 65,95 66,67 67,60 68,26
Wajo 66,90 67,52 68,18 68,57 69,05
Sidenreng Rappang 69,00 69,39 69,84 70,60 71,05
Pinrang 69,24 69,42 69,90 70,62 71,12
Enrekang 70,03 70,79 71,44 72,15 72,66
Luwu 68,11 68,71 69,02 69,60 70,39
Tana Toraja 65,75 66,25 66,82 67,66 68,25
Luwu Utara 67,44 67,81 68,35 68,79 69,46
Luwu Timur 70,43 70,95 71,46 72,16 72,80
Toraja Utara 66,76 67,49 67,90 68,49 69,23
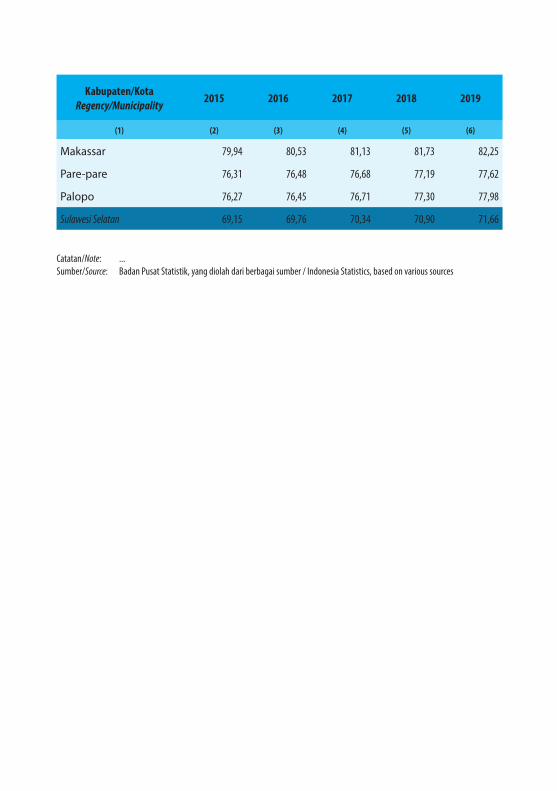
Catatan/Note: ...Sumber/Source: Badan Pusat Statistik, yang diolah dari berbagai sumber / Indonesia Statistics, based on various sources
Kabupaten/KotaRegency/Municipality 2015 2016 2017 2018 2019
(1) (2) (3) (4) (5) (6)
Makassar 79,94 80,53 81,13 81,73 82,25
Pare-pare 76,31 76,48 76,68 77,19 77,62
Palopo 76,27 76,45 76,71 77,30 77,98
Sulawesi Selatan 69,15 69,76 70,34 70,90 71,66


BADAN PUSAT STATISTIKKABUPATEN MAROSBPS-STATISTICS OF MAROS REGENCY
Jl. Jendral Sudirman Km.27Telp.: (0411) 38735505 Fax.: (0411) 38735505Homepage: http://maroskab.bps.go.id, E-mail: [email protected]