DESIGNING BATTERY MANAGEMENT SYSTEM FOR AN …
76
FINAL PROJECT - TI141501 DESIGNING BATTERY MANAGEMENT SYSTEM FOR AN ELECTRIC VEHICLE NINDA LASTRI YULIA NRP 02411340000162 Supervisor Ratna Sari Dewi, S.T., M.T., Ph.D NIP. 19800 1132 0081 2 2002 INDUSTRIAL ENGINEERING DEPARTMENT Faculty of Industrial Technology Institut Teknologi Sepuluh Nopember Surabaya, 2018
Transcript of DESIGNING BATTERY MANAGEMENT SYSTEM FOR AN …
FINAL PROJECT - TI141501
DESIGNING BATTERY MANAGEMENT
SYSTEM FOR AN ELECTRIC VEHICLE
NINDA LASTRI YULIA
NRP 02411340000162
Supervisor
Ratna Sari Dewi, S.T., M.T., Ph.D
NIP. 19800 1132 0081 2 2002
INDUSTRIAL ENGINEERING DEPARTMENT
Faculty of Industrial Technology
Institut Teknologi Sepuluh Nopember
Surabaya, 2018

TUGAS AKHIR - TI141501
DESAIN TAMPILAN DINAMIS BATTERY
MANAGEMENT SYSTEM PADA MOBIL LISTRIK
NINDA LASTRI YULIA
NRP 02411340000162
Pembimbing
Ratna Sari Dewi, S.T., M.T., Ph.D
NIP. 19800 1132 0081 2 2002
DEPARTEMEN TEKNIK INDUSTRI
Fakultas Teknologi Sepuluh Nopember
Institut Teknologi Sepuluh Nopember
Surabaya, 2018

APPROVAL SHEET
DESIGNING DYNAMIC VISUALIZATION OF BATTERY
MANAGEMENT SYSTEM FOR AN ELECTRIC VEIDCLE
FINAL PROJECT
Submitted to Acquire the Requirement of Bachelor Degree:
Industrial Engineering Department
Faculty of Industrial Technology
lnstitut Teknologi Sepuluh Nopember
Surabaya
Author
NINDA LASTRI YULIA
NRP. 02411340000162
Approved by Final Project Supervisor
Ratna Sari Dewi, S.T., M.T., Ph.D
NIP. 19800 1132 0081 2 2002
Surabaya, January 2018
i
DESIGNING DYNAMIC VISUALIZATION OF
BATTERY MANAGEMENT SYSTEM FOR AN
ELECTRIC VEHICLE
Nama Mahasiswa : Ninda Lastri Yulia
NRP : 02411340000162
Pembimbing : Ratna Sari Dewi, S.T., M.T., Ph.D.
ABSTRAK
Visualisasi dinamis harus memiliki interface. Penggunaan interface pada visualisasi
dinamis dapat menimbulkan beban kognitif ekstra yang dapat mengalihkan perhatian seseorang
dalam memahami dan mempelajari visualisasi dinamis. Oleh karena itu, perancangan visualisasi
dinamis yang efektif harus dikaji melalui penelitian mengenai desain interface.
Salah satu teknologi yang menerapkan visualisasi dinamis adalah kendaraan listrik.
Visualisasi dinamis ini diimplementasikan pada Battery Management System (BMS) yang
terintegrasi pada panel dashboard kendaraan listrik. BMS menjaga performa baterai di dalam Safe
Operating Area (SOA). Baterai yang tidak beroperasi di dalam SOA akan menyebabkan kerusakan
fisik hingga memicu ledakan. Padahal, baterai menjadi salah satu komponen yang berperan penting
bagi kendaraan listrik. Tugas akhir ini membahas tentang konsep user interface dan user experience
untuk merancang visualisasi dinamis tampilan BMS yang terpasang pada panel dashboard. Studi
literatur mengenai tampilan BMS pada berbagai merek kendaraan listrik dilakukan guna mengetahui
preferensi tampilan BMS saat ini. Kemudian, kuesioner pair-comparison dibuat untuk mengetahui
preferensi responden terhadap alternatif tampilan visualisasi dinamis parameter fungsi yang terdapat
dalam BMS. Expert’s judgement juga diterapkan untuk memberikan penilaian terhadap hasil skor
preferensi pair-comparison responden.
Hasil kuesioner pair-comparison alternatif tampilan kapasitas baterai (state of charge)
terbukti konsisten, dibuktikan dengan nilai konsistensi oleh Amman dan Greenberg. Sementara pada
kuesioner pair-comparison alternatif tampilan tegangan baterai, terdapat data 1 (satu) responden
yang dikeluarkan dari penelitian karena konsistensi yang rendah.
Hasil penelitian menunjukkan skor preferensi tertinggi responden jatuh pada digital dengan
pembacaan cek (check reading) untuk visualisasi dinamis kapasitas baterai, dan analog-setengah
lingkaran dengan check reading untuk visualisasi dinamis tegangan baterai. Di sisi lain, Expert’s
Judgment menyatakan bahwa tampilan analog-setengah lingkaran dengan check reading untuk
kapasitas baterai dan tampilan digital dengan check reading untuk tegangan baterai merupakan
tampilan yang diutamakan untuk mendesain visualisasi dinamis kedua fungsi tersebut. Faktor desain
yang paling berpengaruh untuk tampilan dinamis BMS adalah ketersediaan check reading (dalam
bentuk warna) dan gaya desain.
Kata kunci: visualisasi dinamis, safety operating area, battery management
system, pair comparison, interface

ii
This page is intentionally left blank
iii
DESIGNING DYNAMIC VISUALIZATION OF
BATTERY MANAGEMENT SYSTEM FOR AN
ELECTRIC VEHICLE
Name : Ninda Lastri Yulia
Student ID : 02411340000162
Supervisor : Ratna Sari Dewi, S.T., M.T., Ph.D.
ABSTRACT
Dynamic visualization must have an interface. An interface with dynamic visualization can
resulted in extraneous cognitive load that can take the viewer’s attention away from the task of
understanding and learning from the dynamic visualization. The design of effective dynamic
visualizations must be explained by the research on interface design.
One of technologies that implement dynamic visualization is electric vehicle (EV). The
dynamic visualization is implemented on the integrated battery management system (BMS)
interface. BMS keeps the battery performance within safe operating area (SOA). When it is not
operated inside the SOA, it may lead to physical damage due to overheating, or even an explosion.
The battery plays important role as the ‘life’ of an electric vehicle.
This final project discussed about the concept of user interface and user experience to
design a dynamic display for BMS display installed in dashboard panel. A literature study of BMS
display on various existing brands of EV was conducted to know BMS display preference. Expert’s
judgement was also applied to give judgement towards respondent’s preference score result.
Research resulted that the pair-comparison questionnaire of dynamic display alternatives
for battery state of charge were consistent, proven by the consistency level by Amman and
Greenberg, while the pair-comparison questionnaire of dynamic display alternatives for battery
voltage screened-out data from 1 (one) respondent due to low consistency.
The experiment showed respondent’s highest preference scores of dynamic visualizations
for battery state of charge is digital with check reading and analog-semicircular with check reading
for dynamic visualization of battery voltage. Expert's judgment stated that analogue semi-circular
with check reading is the most preferred display for battery state of charge and digital display with
check reading for battery voltage. The most influential design factors for BMS dynamic display are
the check reading availability (in form of color) and design style.
Key words: dynamic visualization, battery management system, pair comparison, safe operating
area, interface

iv
This page is intentionally left blank
v
PREFACE
All praises to Allah God Almighty that has been giving His blessing to the
author. By His mercy and His blessing, author could finish the final project report
entitled “Designing Dynamic Visualization of Battery Management System for
an Electric Vehicle” on time that this book had been published. This final project
was made as a completion of the undergraduate education in Industrial Engineering
Department at Institut Teknologi Sepuluh Nopember, Surabaya.
Grateful acknowledgement is here made to some parties who have assisted
author in this research. Those parties are as follow:
1. Ratna Sari Dewi, S.T., M.T., Ph.D. as the supervisor of this research. Her
knowledge, advise and generous affection helped the author.
2. Stefanus Eko Wiranto, S.T., M.T. (Financial Manager of PUI SKO ITS),
Indra Sidharta S.T., M.Sc. (Director of R&D PUI SKO ITS), and Agus
Mukhlisin S.T., M.T. (Engineer of Battery Pack BMS and Controller of PUI
SKO ITS), and other respondents as the interviewee who helped giving a
valuable data for this research.
3. Dr. Adithya Sudiarno, S.T., M.T. and Anny Maryani., S.T., M.T. as the
reviewer of this research. Their critical point of view and constructive
comments complemented to this research.
4. Nurhadi Siswanto, S.T., MSIE., Ph.D. as the Head of Industrial Engineering
Department, Yudha Andrian Saputra, ST., MBA as the Secretary of
Industrial Engineering Department, and Dr. Adithya Sudiarno, S.T., M.T.
as the Coordinator of Final Project in Industrial Engineering Department.
5. Author’s beloved family and friends who never stop giving support,
motivation, facilities, and inspiration to the author.
Surabaya, January 20th, 2018
Ninda Lastri Yulia

vi
This page is intentionally left blank
vii
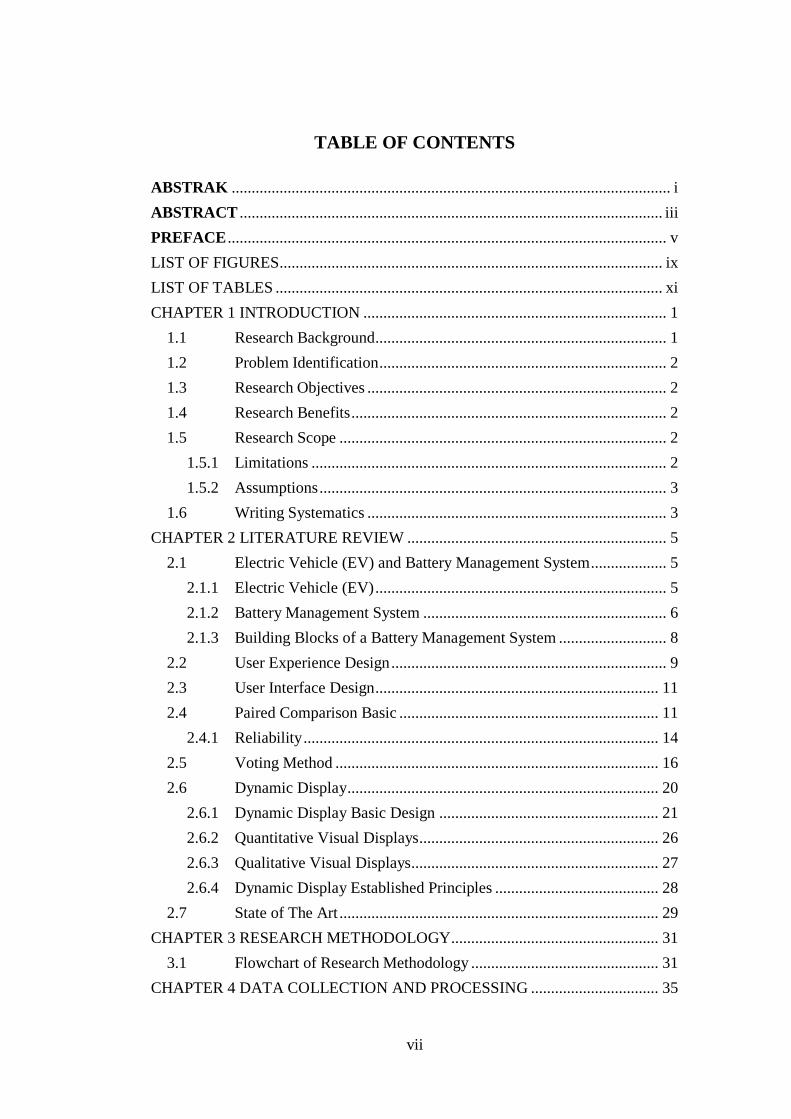
TABLE OF CONTENTS
ABSTRAK .............................................................................................................. i
ABSTRACT .......................................................................................................... iii
PREFACE .............................................................................................................. v
LIST OF FIGURES................................................................................................ ix
LIST OF TABLES ................................................................................................. xi
CHAPTER 1 INTRODUCTION ............................................................................ 1
1.1 Research Background ......................................................................... 1
1.2 Problem Identification ........................................................................ 2
1.3 Research Objectives ........................................................................... 2
1.4 Research Benefits ............................................................................... 2
1.5 Research Scope .................................................................................. 2
1.5.1 Limitations ......................................................................................... 2
1.5.2 Assumptions ....................................................................................... 3
1.6 Writing Systematics ........................................................................... 3
CHAPTER 2 LITERATURE REVIEW ................................................................. 5
2.1 Electric Vehicle (EV) and Battery Management System ................... 5
2.1.1 Electric Vehicle (EV) ......................................................................... 5
2.1.2 Battery Management System ............................................................. 6
2.1.3 Building Blocks of a Battery Management System ........................... 8
2.2 User Experience Design ..................................................................... 9
2.3 User Interface Design ....................................................................... 11
2.4 Paired Comparison Basic ................................................................. 11
2.4.1 Reliability ......................................................................................... 14
2.5 Voting Method ................................................................................. 16
2.6 Dynamic Display .............................................................................. 20
2.6.1 Dynamic Display Basic Design ....................................................... 21
2.6.2 Quantitative Visual Displays............................................................ 26
2.6.3 Qualitative Visual Displays.............................................................. 27
2.6.4 Dynamic Display Established Principles ......................................... 28
2.7 State of The Art ................................................................................ 29
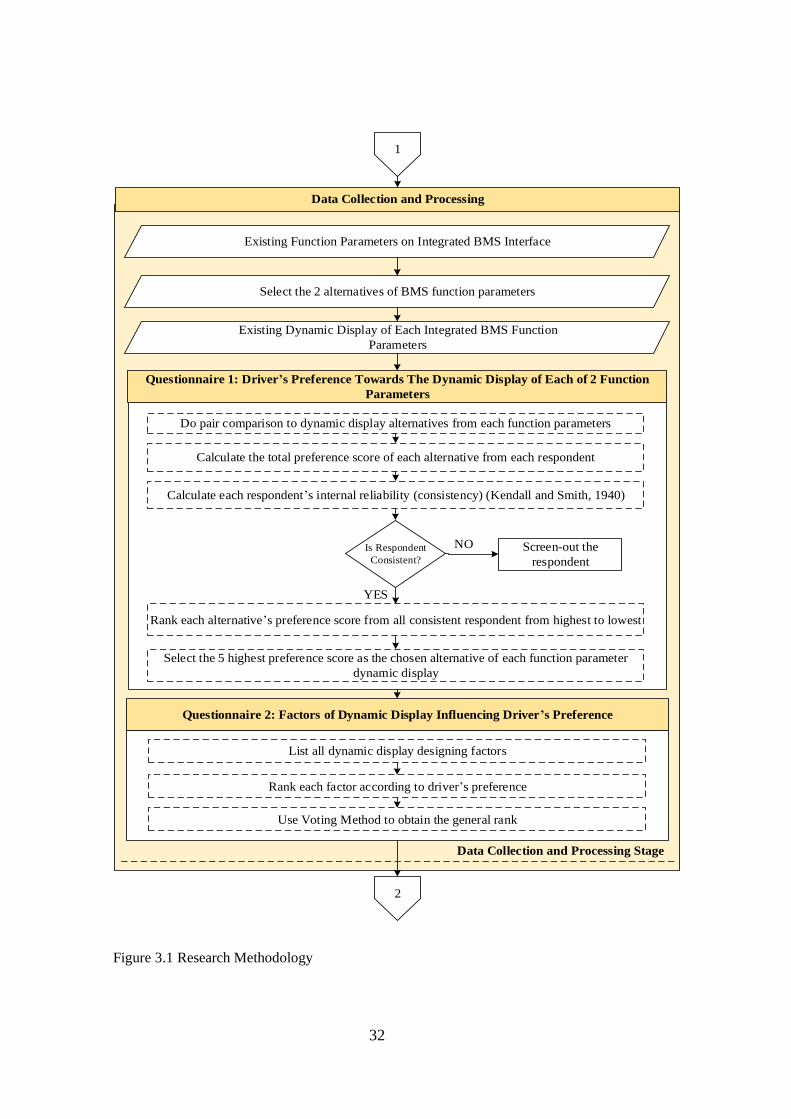
CHAPTER 3 RESEARCH METHODOLOGY.................................................... 31
3.1 Flowchart of Research Methodology ............................................... 31
CHAPTER 4 DATA COLLECTION AND PROCESSING ................................ 35
viii
4.1 Existing Functions Parameters and Dynamic Display of Battery
Management System......................................................................... 35
4.2 Dynamic Display Alternatives of Integrated Battery Management
System .............................................................................................. 36
4.3 Questionnaire of Dynamic Display Alternatives Pair Comparison .. 37
CHAPTER 5 DATA ANALYSIS AND INTERPRETATION ............................ 41
5.1 Function Parameters in Existing BMS Display ................................ 41
5.2 Battery State of Charge Dynamic Display ....................................... 41
5.3 Battery Voltage Dynamic Display .................................................... 42
5.4 Expert’s Judgement Analysis ........................................................... 42
CHAPTER 6 CONCLUSION AND SUGGESTION ........................................... 43
6.1 Conclusion ........................................................................................ 43
6.2 Suggestion ........................................................................................ 43
REFERENCES ...................................................................................................... xv
APPENDIX I ........................................................................................................ xix
APPENDIX IV ................................................................................................... xxiii
ix
LIST OF FIGURES
Figure 2.1 Electric Vehicle Components ................................................................ 6
Figure 2.2 User Experience Honeycomb .............................................................. 10
Figure 2.3 User Experience Design Diagram ....................................................... 11
Figure 2.4 A perfectly consistent individual choice matrix for 10 items .............. 13
Figure 2.5 An individual choice matrix with three circular triads ........................ 14
Figure 2.6 An individual choice matrix with three circular triads ........................ 14
Figure 2.7 Illustration of Several Basic Concepts in The Design of Quantitative
Displays ............................................................................................... 27
Figure 2.8 Average Type for Qualitative and Quantitative Readings with Three
Types of Scales ................................................................................... 28
Figure 3.1 Research Methodology ........................................................................ 31

x
This page is intentionally left blank
xi
LIST OF TABLES
Table 2.1 Example of Voting Result ..................................................................... 18
Table 2.2 Rank of Votes........................................................................................ 19
Table 2.3 Rank of Votes........................................................................................ 19
Table 4.1 Existing BMS Display on EV Brands and From BMS Developer ....... 36
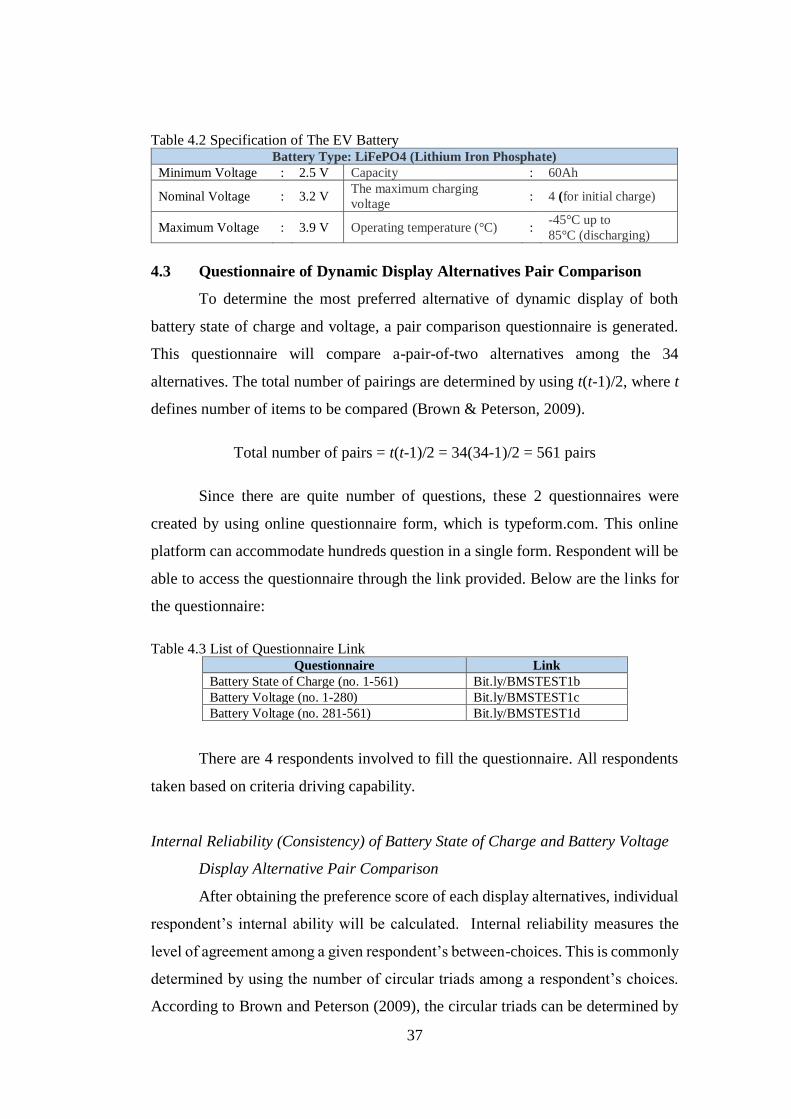
Table 4.2 Specification of The EV Battery ........................................................... 37
Table 4.3 List of Questionnaire Link .................................................................... 37
Table 4.4 Expert's Profile ..................................................................................... 38
Table 5.1 The Highest 5 Preference Score for Alternatives of Battery SOC
Dynamic Display .................................................................................. 41
Table 5.2 The Highest 5 Preference Score for Battery Voltage Dynamic Display42

xii
This page is intentionally left blank
1
CHAPTER 1
INTRODUCTION
This chapter will be described some points that are fundamental for this
research. Research background, objectives, benefits, assumptions and limitations
are described.
1.1 Research Background
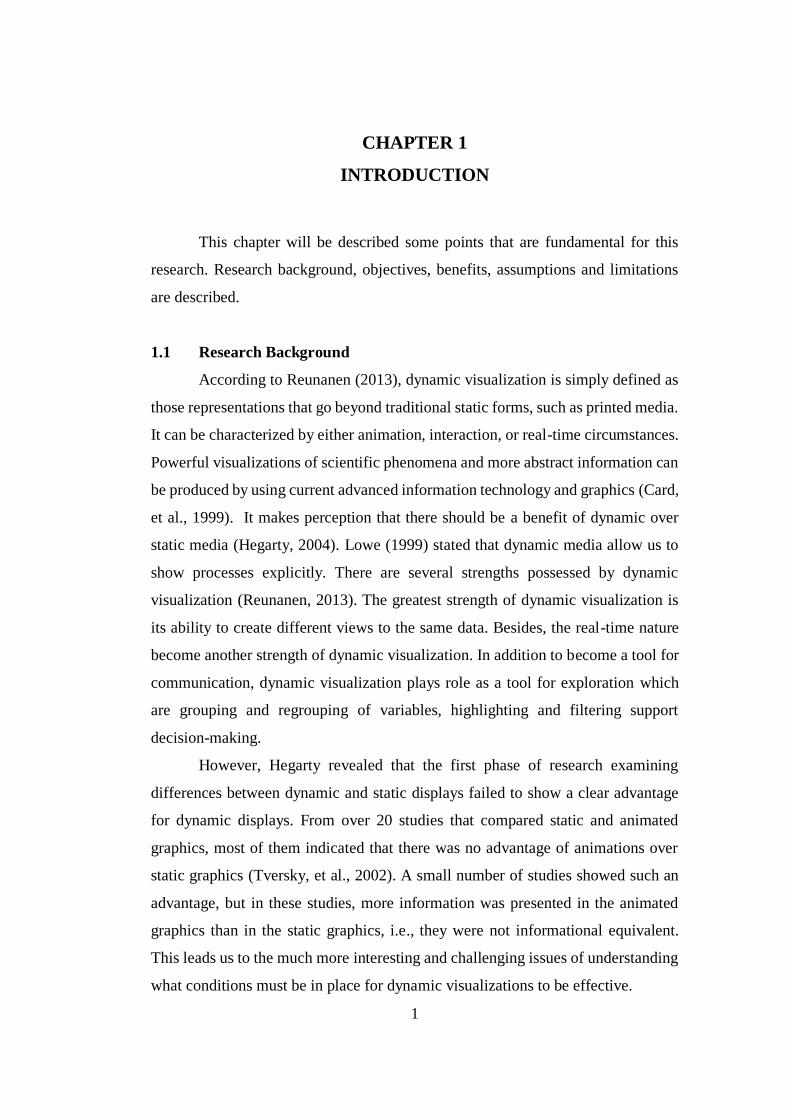
According to Reunanen (2013), dynamic visualization is simply defined as
those representations that go beyond traditional static forms, such as printed media.
It can be characterized by either animation, interaction, or real-time circumstances.
Powerful visualizations of scientific phenomena and more abstract information can
be produced by using current advanced information technology and graphics (Card,
et al., 1999). It makes perception that there should be a benefit of dynamic over
static media (Hegarty, 2004). Lowe (1999) stated that dynamic media allow us to
show processes explicitly. There are several strengths possessed by dynamic
visualization (Reunanen, 2013). The greatest strength of dynamic visualization is
its ability to create different views to the same data. Besides, the real-time nature
become another strength of dynamic visualization. In addition to become a tool for
communication, dynamic visualization plays role as a tool for exploration which
are grouping and regrouping of variables, highlighting and filtering support
decision-making.
However, Hegarty revealed that the first phase of research examining
differences between dynamic and static displays failed to show a clear advantage
for dynamic displays. From over 20 studies that compared static and animated
graphics, most of them indicated that there was no advantage of animations over
static graphics (Tversky, et al., 2002). A small number of studies showed such an
advantage, but in these studies, more information was presented in the animated
graphics than in the static graphics, i.e., they were not informational equivalent.
This leads us to the much more interesting and challenging issues of understanding
what conditions must be in place for dynamic visualizations to be effective.
2
1.2 Problem Identification
Problems to be discussed in this research is the preferred display of battery
management system for EV drivers in the future and what dynamic factors affecting
it, and generating a design alternative for Integrated BMS display.
1.3 Research Objectives
The research objectives of final project are:
1. Identifying dominant function parameters of BMS that must
appear in a BMS interface of an EV.
2. Identifying dynamic display of BMS function parameters for an
EV.
3. Getting expert’s judgement regarding display alternative for BMS
function parameters.
1.4 Research Benefits
The research benefits of final project are:
1. Provide data of BMS interface preferences in an EV.
2. Help EV manufacturers in the near future to determine
functions/indicators that must be included in BMS interface.
3. Help EV manufacturers in the near future to design BMS interface
considering the concept of user interface and user experience.
1.5 Research Scope
This subchapter discusses the limitations and assumptions used in final
project.
1.5.1 Limitations
Limitations of this final project are:
1. This research only focuses on the design process of dynamic display
alternatives of two function parameters of an integrated BMS, without
installing and integrating it to both the whole integrated BMS display
and to EV dashboard.
2. The usability of Integrated BMS dynamic display alternatives are not
3
measured.
1.5.2 Assumptions
Assumptions used in this final project are:
1. According to voting theory in Pacuit (2016), the voters’ opinions
are described by linear rankings of the set of candidates.
2. The result for alternatives of dynamic display of both battery state
of charge and voltage is ranked linearly.
3. The circular triad (inconsistency) of respondent’s preference score
are randomly generated.
1.6 Writing Systematics
The writing systematic that is used in this final project consists of:
CHAPTER 1: INTRODUCTION
This chapter explains the research background, problem identification,
research objectives, research benefits, research scopes and writing systematic of
final project.
CHAPTER 2: LITERATURE REVIEW
This chapter discusses the theoretical and conceptual literatures used as the
framework of thinking in final project.
CHAPTER 3: RESEARCH METHODOLOGY
This chapter contains overview and description of systematic processes to
compose this final project.
CHAPTER 4: DATA COLLECTION AND PROCESSING
This chapter explains how data are collected and how it is processed to
gather certain information. Data processing used approaches to obtain the research
objectives. The result of data processing will be analyzed in the next chapter.
CHAPTER 5: DATA ANALYSIS AND INTERPRETATION
This chapter contains the analysis and interpretation of data that has been
processed in chapter 4.
CHAPTER 6: CONCLUSION AND SUGGESTION
This chapter contains the result of research that refers to data process and
analysis so that the research objectives can be obtained. In addition, this chapter

4
contains suggestions to improve the further research.
5
CHAPTER 2
LITERATURE REVIEW
This chapter explains about the theories that are related and used in
supporting this research.
2.1 Electric Vehicle (EV) and Battery Management System
This subchapter will explain about electric vehicle, battery management
system, user experience design, user interface design, pair comparison basic, and
dynamic display.
2.1.1 Electric Vehicle (EV)
Electric vehicle has the basic meaning of all vehicles driven by electrical
energy source. Aside from the other definitions available, in this research electric
vehicle is a system with the power source of battery which is charged by activating
one or more of the automobile’s electric motors (Udaeta, et al., 2015)
According to Volkswagen Group of America, Inc. (2013), the electric drive
system generally consists of:
• High-voltage battery with control unit for battery regulation and
charger
• Electric motor/generator with electronic control (power electronics)
and cooling system
• Transmission including the differential
• Brake system
• High-voltage air conditioning for vehicle interior climate control
6
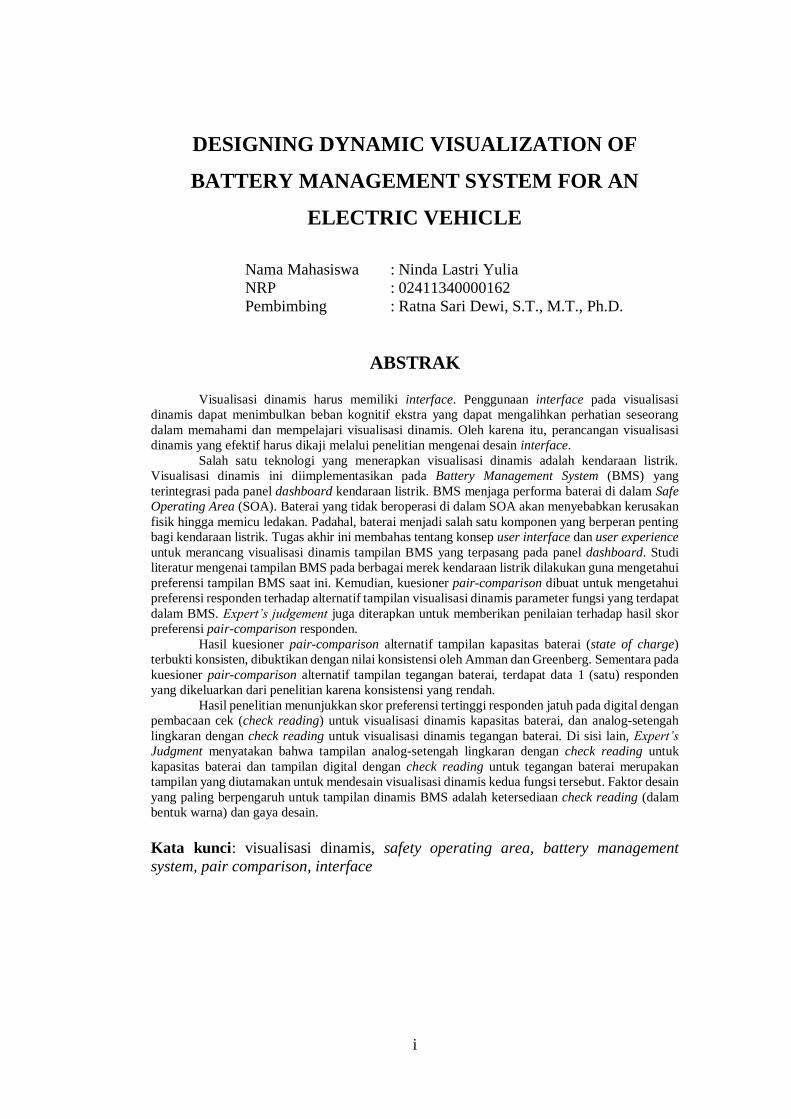
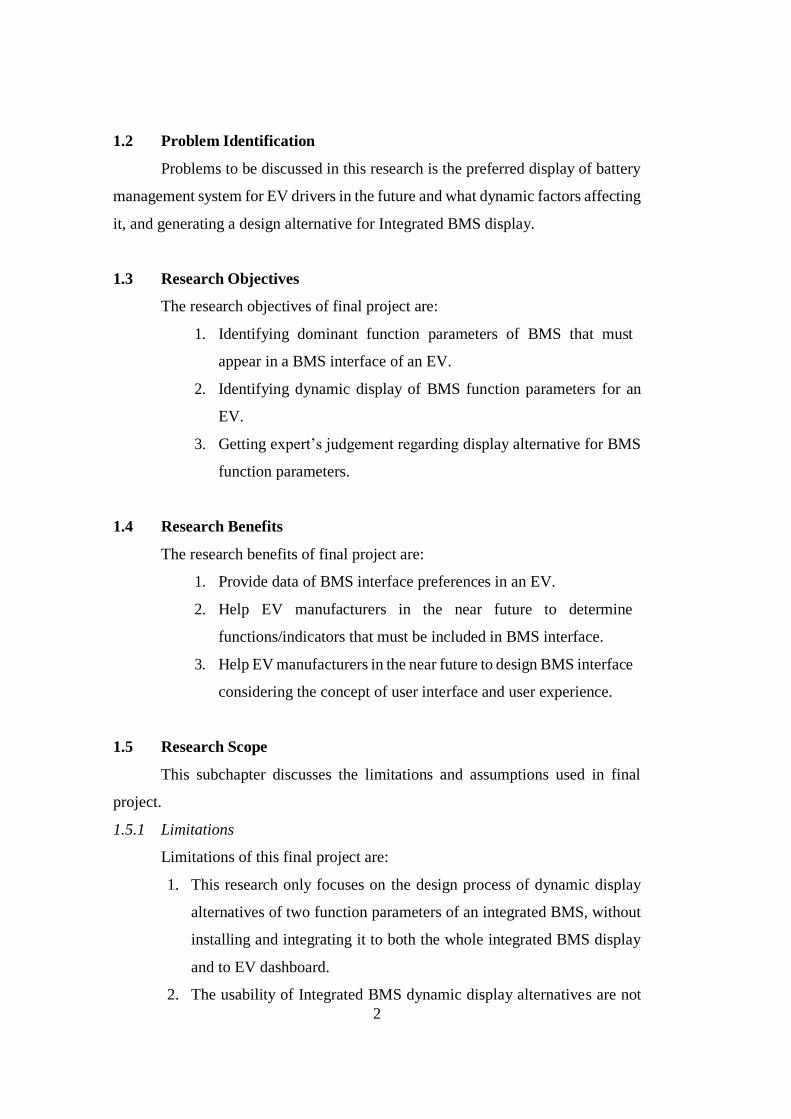
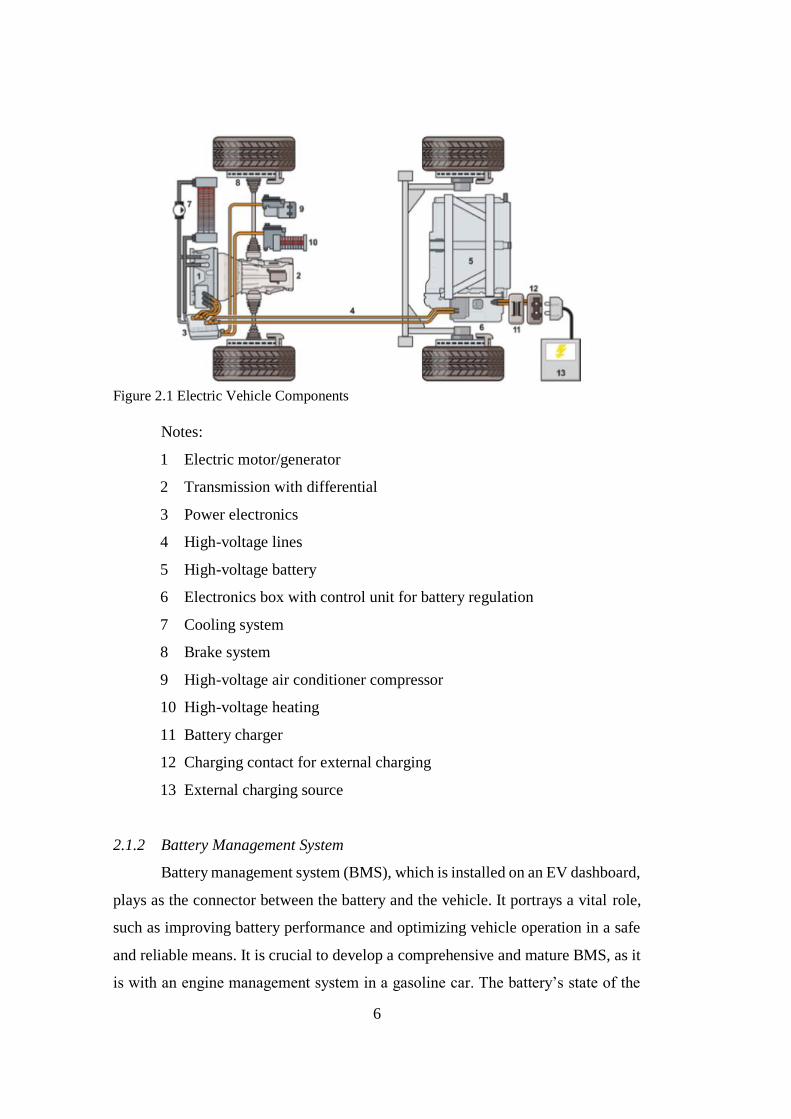
Figure 2.1 Electric Vehicle Components
Notes:
1 Electric motor/generator
2 Transmission with differential
3 Power electronics
4 High-voltage lines
5 High-voltage battery
6 Electronics box with control unit for battery regulation
7 Cooling system
8 Brake system
9 High-voltage air conditioner compressor
10 High-voltage heating
11 Battery charger
12 Charging contact for external charging
13 External charging source
2.1.2 Battery Management System
Battery management system (BMS), which is installed on an EV dashboard,
plays as the connector between the battery and the vehicle. It portrays a vital role,
such as improving battery performance and optimizing vehicle operation in a safe
and reliable means. It is crucial to develop a comprehensive and mature BMS, as it
is with an engine management system in a gasoline car. The battery’s state of the
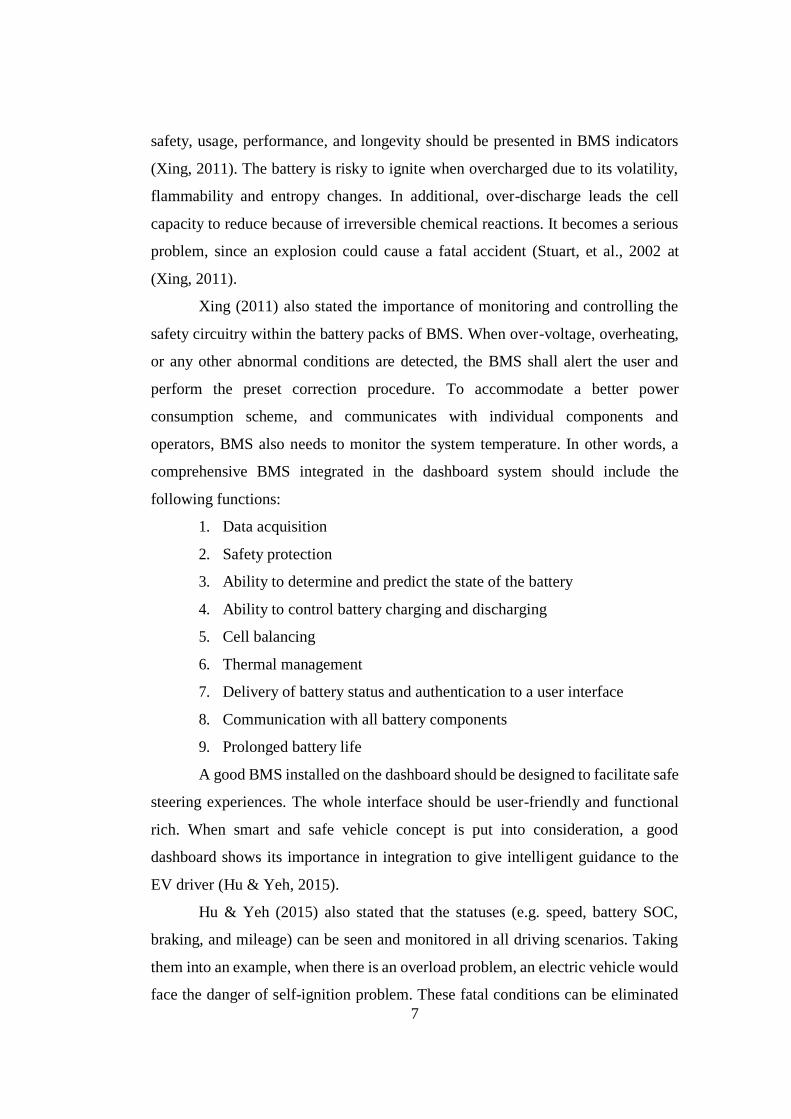
7
safety, usage, performance, and longevity should be presented in BMS indicators
(Xing, 2011). The battery is risky to ignite when overcharged due to its volatility,
flammability and entropy changes. In additional, over-discharge leads the cell
capacity to reduce because of irreversible chemical reactions. It becomes a serious
problem, since an explosion could cause a fatal accident (Stuart, et al., 2002 at
(Xing, 2011).
Xing (2011) also stated the importance of monitoring and controlling the
safety circuitry within the battery packs of BMS. When over-voltage, overheating,
or any other abnormal conditions are detected, the BMS shall alert the user and
perform the preset correction procedure. To accommodate a better power
consumption scheme, and communicates with individual components and
operators, BMS also needs to monitor the system temperature. In other words, a
comprehensive BMS integrated in the dashboard system should include the
following functions:
1. Data acquisition
2. Safety protection
3. Ability to determine and predict the state of the battery
4. Ability to control battery charging and discharging
5. Cell balancing
6. Thermal management
7. Delivery of battery status and authentication to a user interface
8. Communication with all battery components
9. Prolonged battery life
A good BMS installed on the dashboard should be designed to facilitate safe
steering experiences. The whole interface should be user-friendly and functional
rich. When smart and safe vehicle concept is put into consideration, a good
dashboard shows its importance in integration to give intelligent guidance to the
EV driver (Hu & Yeh, 2015).
Hu & Yeh (2015) also stated that the statuses (e.g. speed, battery SOC,
braking, and mileage) can be seen and monitored in all driving scenarios. Taking
them into an example, when there is an overload problem, an electric vehicle would
face the danger of self-ignition problem. These fatal conditions can be eliminated
8
by a guard of smart interface. The presented system can assist the driver to keep the
energy efficiency, steering stability, and others under a proper design. Additionally,
a graphical view is utilized to present the safety related information for an easy and
quick comprehension. Next, a simplified operation procedure can be used so the
driver can concentrate more on steering. The smart system can perform
customization, which cannot be found on commercial dashboard.
The smart system is an intelligent, multipurpose, and user-friendly
information revealing system, which not only display the vehicle’s status such as
speed, temperature, mileage, and functions but also show the current safety
evaluations of steering. For electric vehicle, the management of battery packs’ state
of charge (SOC) is also an urgent issue. Therefore, such monitoring system is
necessary to overcome the safety issue.
2.1.3 Building Blocks of a Battery Management System
A typical battery management system consists of several functional blocks,
such as cutoff cut-off field-effect transmitters (FETs), a fuel gauge monitor, cell
voltage monitor, cell voltage balance, real time clock (RTC), and temperature
monitors (Intersil Corporation, 2015). Below are the explanations of each building
block:
a. Cutoff FETs and FET Driver: A FET driver functional block is
functioned as the connection and isolation of the battery pack
between the load and charger. The behavior of the FET driver is
determined by the measurements from battery cell voltages, current
measurements and real-time detection circuitry.
b. Fuel Gauge / Current Measurements: The fuel gauge functional
block keeps track of the charge entering and exiting the battery
pack. Charge is the product of current and time.
c. Cell Voltage and Maximizing Battery Lifetime: Monitoring the
cell voltage of each cell within a battery pack is essential in
determining its overall health. All cells have an operating voltage
window that charging, and discharging should occur to ensure
proper operation and battery life. If an application is using a battery
9
with a lithium chemistry, the operating voltage typically ranges
between 2.5V-4.2V. The voltage range is chemistry dependent.
Operating the battery outside the voltage range significantly
reduces the lifetime of the cell and can render the cell useless.
d. Temperature Monitoring: Today’s batteries deliver a lot of
current while maintaining a constant voltage, which can lead to a
runaway condition that causes the battery to catch fire. The
chemicals used to construct a battery are highly volatile, and a
battery impaled with the right object can result in the battery
catching fire. Temperature measurements are not just used for
safety conditions, they can also be used to determine if it’s
desirable to charge or discharge a battery. Temperature sensors
monitor each cell for energy storage system (ESS) applications or
a grouping of cells for smaller and more portable applications.
Thermistors powered by an internal ADC voltage reference are
commonly used to monitor each circuit’s temperature. The internal
voltage reference is used to reduce inaccuracies of the temperature
reading versus environmental temperature changes.
2.2 User Experience Design
User experience covers all facets of the end-user's interaction with the
company, its services, and its products (Norman & Nielsen, 2016). User experience
design is a study from various fields, such as computer science, cognitive science,
ergonomics, art and graphic design, psychology, communications, anthropology,
and others (Manca, 2015).
Furthermore, Manca wrote that the basis of user experience design is based
on a comprehension of the needs, values, abilities, and limitations of a user. A user-
experience designer is required to manage the expectations of company while
taking care the user’s needs. This requires considering business and product goals,
as well as the developers’ objectives.
Peter Morville (2004) defines the factors influencing user experience in
developing an interface by using User Experience Honeycomb.
10
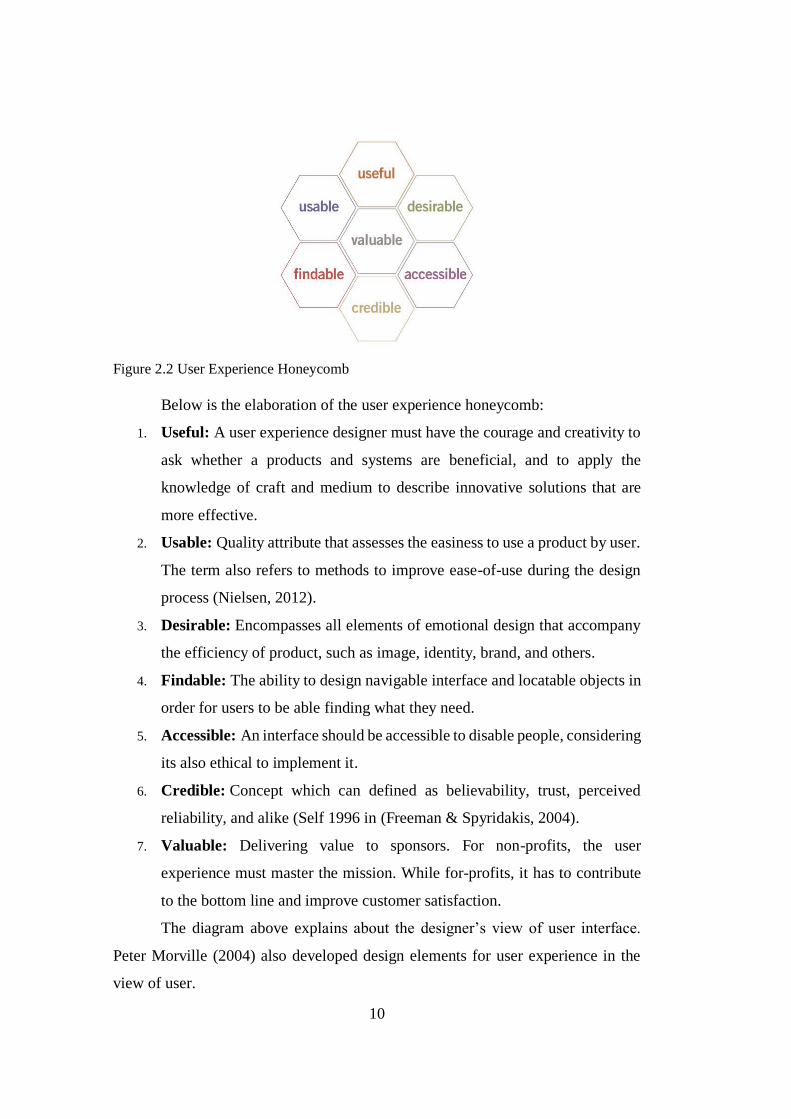
Figure 2.2 User Experience Honeycomb
Below is the elaboration of the user experience honeycomb:
1. Useful: A user experience designer must have the courage and creativity to
ask whether a products and systems are beneficial, and to apply the
knowledge of craft and medium to describe innovative solutions that are
more effective.
2. Usable: Quality attribute that assesses the easiness to use a product by user.
The term also refers to methods to improve ease-of-use during the design
process (Nielsen, 2012).
3. Desirable: Encompasses all elements of emotional design that accompany
the efficiency of product, such as image, identity, brand, and others.
4. Findable: The ability to design navigable interface and locatable objects in
order for users to be able finding what they need.
5. Accessible: An interface should be accessible to disable people, considering
its also ethical to implement it.
6. Credible: Concept which can defined as believability, trust, perceived
reliability, and alike (Self 1996 in (Freeman & Spyridakis, 2004).
7. Valuable: Delivering value to sponsors. For non-profits, the user
experience must master the mission. While for-profits, it has to contribute
to the bottom line and improve customer satisfaction.
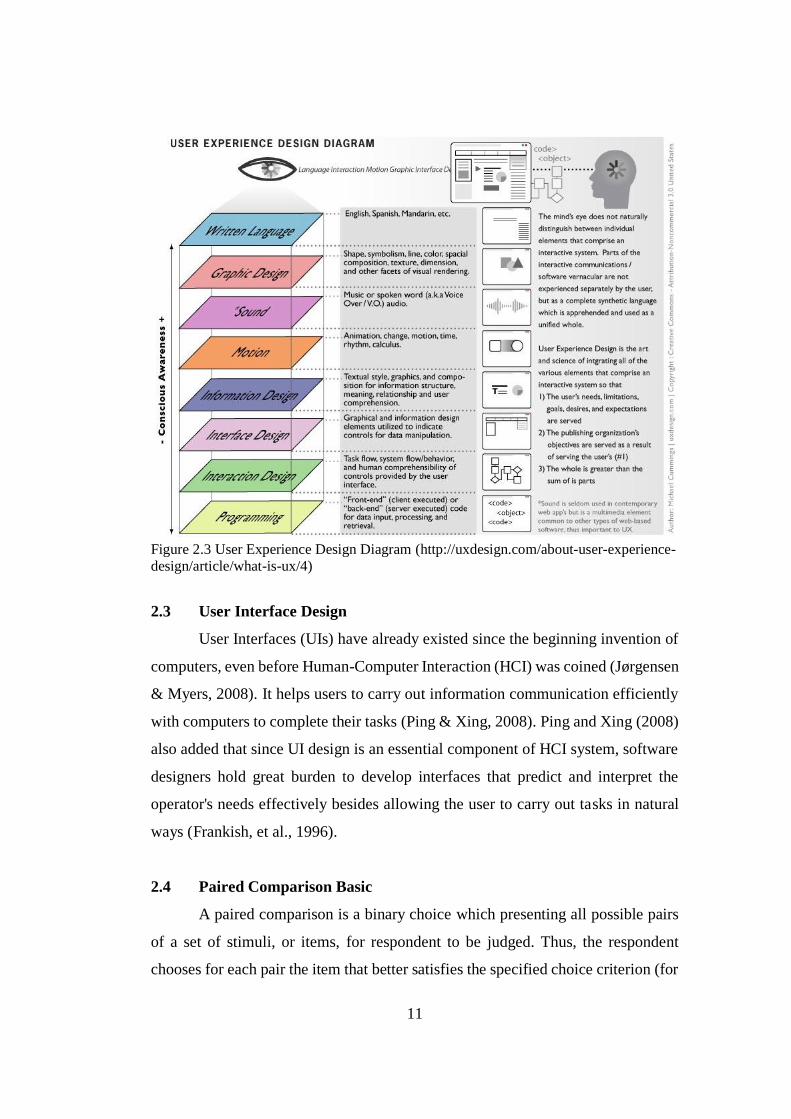
The diagram above explains about the designer’s view of user interface.
Peter Morville (2004) also developed design elements for user experience in the
view of user.
11
Figure 2.3 User Experience Design Diagram (http://uxdesign.com/about-user-experience-
design/article/what-is-ux/4)
2.3 User Interface Design
User Interfaces (UIs) have already existed since the beginning invention of
computers, even before Human-Computer Interaction (HCI) was coined (Jørgensen
& Myers, 2008). It helps users to carry out information communication efficiently
with computers to complete their tasks (Ping & Xing, 2008). Ping and Xing (2008)
also added that since UI design is an essential component of HCI system, software
designers hold great burden to develop interfaces that predict and interpret the
operator's needs effectively besides allowing the user to carry out tasks in natural
ways (Frankish, et al., 1996).
2.4 Paired Comparison Basic
A paired comparison is a binary choice which presenting all possible pairs
of a set of stimuli, or items, for respondent to be judged. Thus, the respondent
chooses for each pair the item that better satisfies the specified choice criterion (for
12
example, more preferred, more serious, more beautiful). With paired comparisons,
respondents choose the item in each pair with the greater magnitude on the choice
dimension they were guided to use. The simplest approach is to present all possible
pairs of the items to each respondent. With t items, there will be total t(t – 1)/2 pairs
(Brown & Peterson, 2009).
Champ, et al., (2003) stated that a preference score, which is the number of
times the respondent preferred the item to other items in the set, will be resulted
from each respondent for each item in the full set of choices. Preference scores are
the simplest form of scale values for the items. These scores are easily calculated
by creating a t by t matrix and entering a 1 in each cell where the column item was
preferred to the row item, or a 0 otherwise.
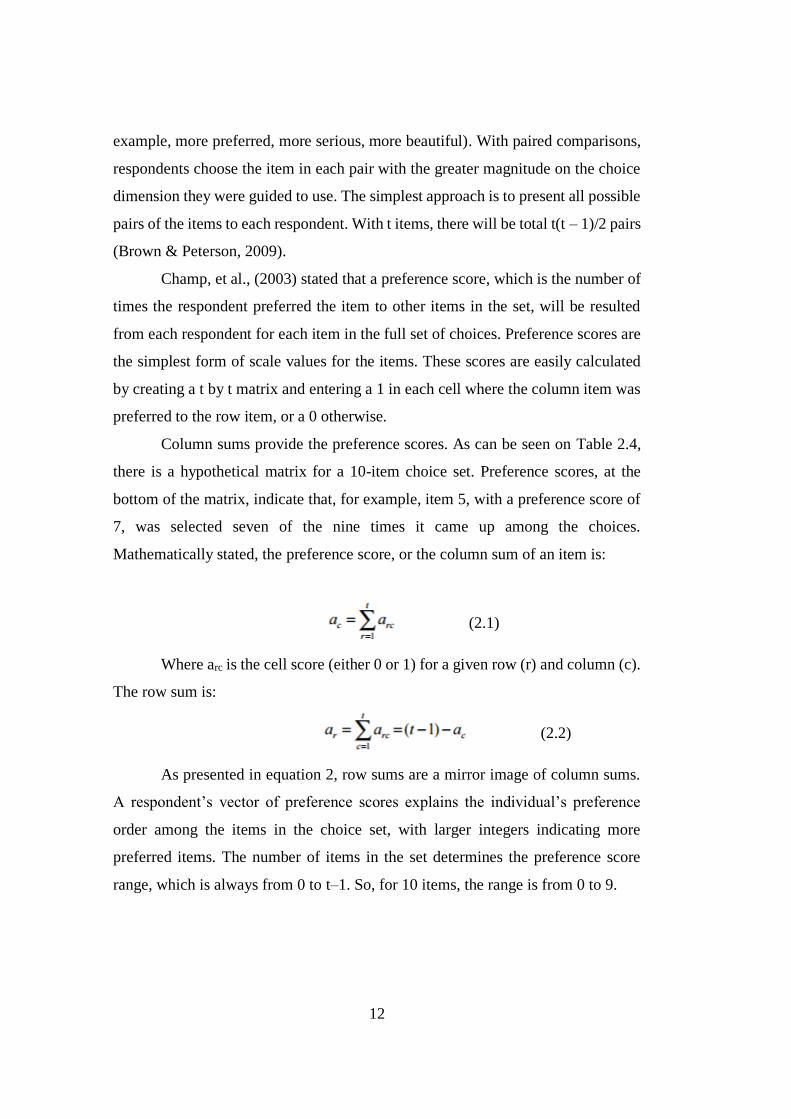
Column sums provide the preference scores. As can be seen on Table 2.4,
there is a hypothetical matrix for a 10-item choice set. Preference scores, at the
bottom of the matrix, indicate that, for example, item 5, with a preference score of
7, was selected seven of the nine times it came up among the choices.
Mathematically stated, the preference score, or the column sum of an item is:
(2.1)
Where arc is the cell score (either 0 or 1) for a given row (r) and column (c).
The row sum is:
(2.2)
As presented in equation 2, row sums are a mirror image of column sums.
A respondent’s vector of preference scores explains the individual’s preference
order among the items in the choice set, with larger integers indicating more
preferred items. The number of items in the set determines the preference score
range, which is always from 0 to t–1. So, for 10 items, the range is from 0 to 9.
13
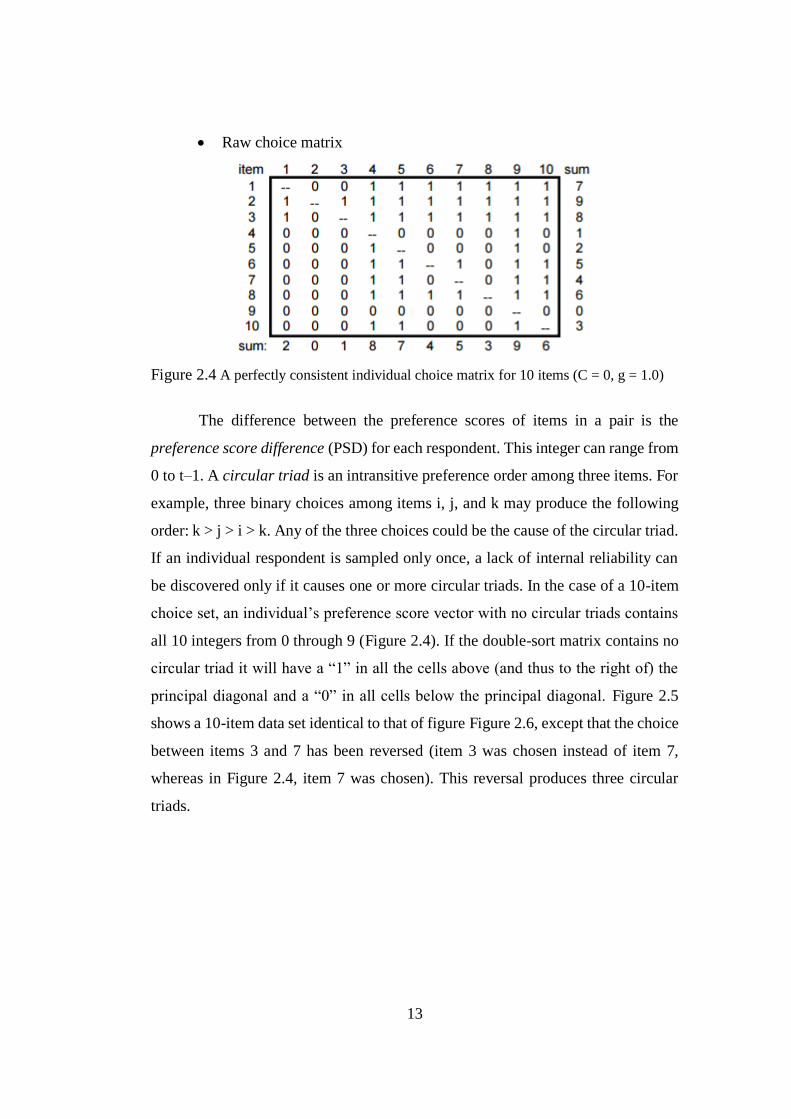
• Raw choice matrix
Figure 2.4 A perfectly consistent individual choice matrix for 10 items (C = 0, g = 1.0)
The difference between the preference scores of items in a pair is the
preference score difference (PSD) for each respondent. This integer can range from
0 to t–1. A circular triad is an intransitive preference order among three items. For
example, three binary choices among items i, j, and k may produce the following
order: k > j > i > k. Any of the three choices could be the cause of the circular triad.
If an individual respondent is sampled only once, a lack of internal reliability can
be discovered only if it causes one or more circular triads. In the case of a 10-item
choice set, an individual’s preference score vector with no circular triads contains
all 10 integers from 0 through 9 (Figure 2.4). If the double-sort matrix contains no
circular triad it will have a “1” in all the cells above (and thus to the right of) the
principal diagonal and a “0” in all cells below the principal diagonal. Figure 2.5
shows a 10-item data set identical to that of figure Figure 2.6, except that the choice
between items 3 and 7 has been reversed (item 3 was chosen instead of item 7,
whereas in Figure 2.4, item 7 was chosen). This reversal produces three circular
triads.
14
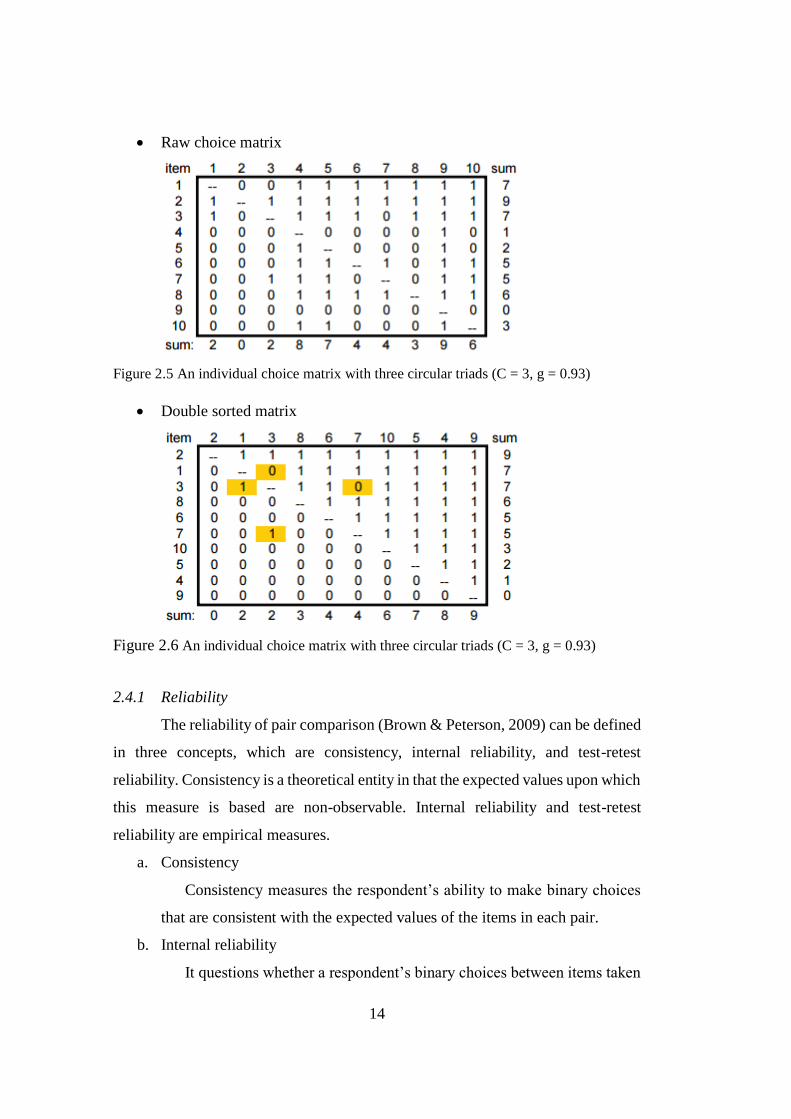
• Raw choice matrix
Figure 2.5 An individual choice matrix with three circular triads (C = 3, g = 0.93)
• Double sorted matrix
Figure 2.6 An individual choice matrix with three circular triads (C = 3, g = 0.93)
2.4.1 Reliability
The reliability of pair comparison (Brown & Peterson, 2009) can be defined
in three concepts, which are consistency, internal reliability, and test-retest
reliability. Consistency is a theoretical entity in that the expected values upon which
this measure is based are non-observable. Internal reliability and test-retest
reliability are empirical measures.
a. Consistency
Consistency measures the respondent’s ability to make binary choices
that are consistent with the expected values of the items in each pair.
b. Internal reliability
It questions whether a respondent’s binary choices between items taken
15
in pairs from a set of items are in agreement with each other, that is, whether
they produce intransitivity as manifest by circular triads. Internal reliability
refers to the level of agreement among a given respondent’s choices and is
thus a between-choice measure. A common measure of internal reliability
is based on the number of circular triads among a respondent’s choices. The
causes of circular triads in a paired comparison experiment include:
1. Respondent inability to consistently discriminate between similar
items
2. Dominance of different attributes in different pairs (for multi
attribute pair-comparison only)
3. Order effect
4. Respondent carelessness (a mistake in indicating a choice),
incompetence (lack of understanding of the task), or intentional
misrepresentation of preferences.
For the purpose of this final project, it is assumed that all observed
circular triads are randomly generated. Kendall and Smith (1940) in Brown
and Peterson (2009), defined the way to find the coefficient of internal
reliability, which are:
1. Calculate the number of circular triads in an individual’s responses
from the preference scores with formula:
𝐶 : number of circular triads from an individual’s responses
𝑡 : number of items in the set
𝑎𝑖 : preference score of item i
𝑏 : average preference score, 𝑡−1
2
2. Calculate maximum possible number of circular triads
16
𝐶𝑚𝑎𝑥 : maximum number of possible circular triads
𝑡 : number of items in the set
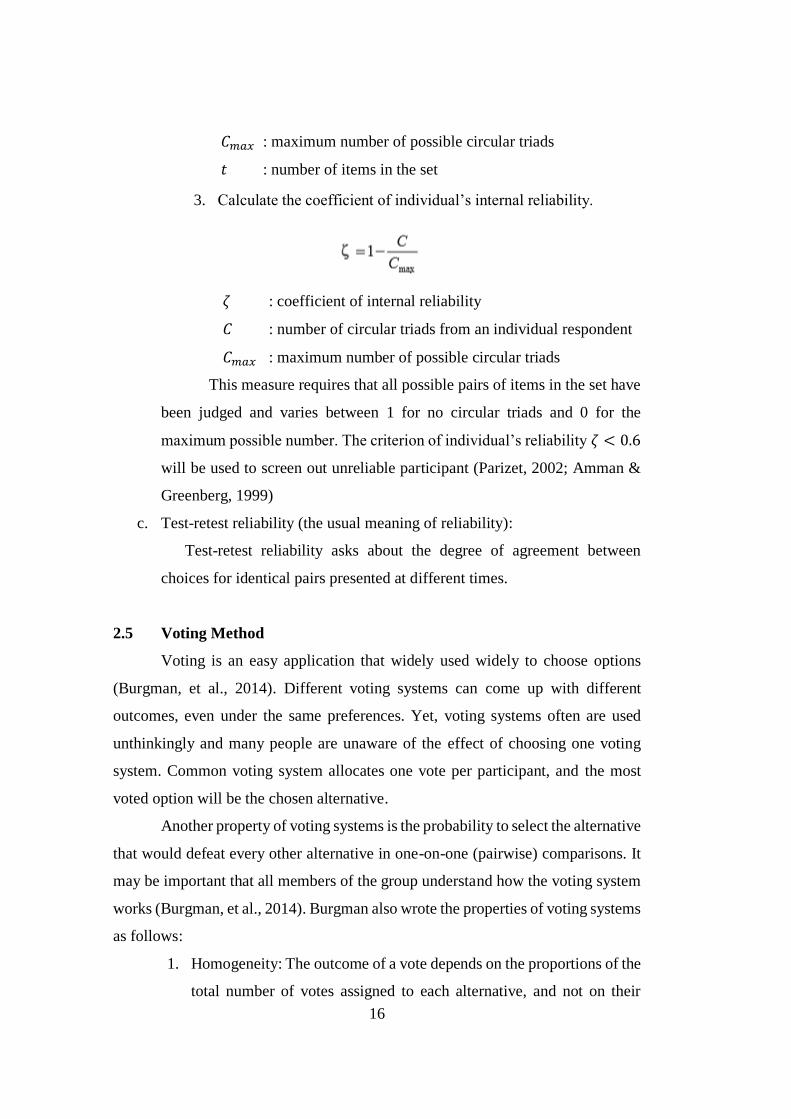
3. Calculate the coefficient of individual’s internal reliability.
𝜁 : coefficient of internal reliability
𝐶 : number of circular triads from an individual respondent
𝐶𝑚𝑎𝑥 : maximum number of possible circular triads
This measure requires that all possible pairs of items in the set have
been judged and varies between 1 for no circular triads and 0 for the
maximum possible number. The criterion of individual’s reliability 𝜁 < 0.6
will be used to screen out unreliable participant (Parizet, 2002; Amman &
Greenberg, 1999)
c. Test-retest reliability (the usual meaning of reliability):
Test-retest reliability asks about the degree of agreement between
choices for identical pairs presented at different times.
2.5 Voting Method
Voting is an easy application that widely used widely to choose options
(Burgman, et al., 2014). Different voting systems can come up with different
outcomes, even under the same preferences. Yet, voting systems often are used
unthinkingly and many people are unaware of the effect of choosing one voting
system. Common voting system allocates one vote per participant, and the most
voted option will be the chosen alternative.
Another property of voting systems is the probability to select the alternative
that would defeat every other alternative in one-on-one (pairwise) comparisons. It
may be important that all members of the group understand how the voting system
works (Burgman, et al., 2014). Burgman also wrote the properties of voting systems
as follows:
1. Homogeneity: The outcome of a vote depends on the proportions of the
total number of votes assigned to each alternative, and not on their
17
absolute counts.
2. Monotonicity: A winning alternative cannot become a loser by
increasing its number of votes for, and a losing alternative cannot
become a winner when its number of votes decreases.
3. Anonymity: Voters are treated the same in the sense. If any 2
individuals trade their votes, the outcome would be the same.
4. Decisiveness: The voting system delivers an unambiguous winner or a
winning set, if more than one alternative is desired.
5. Consistency: If a group is divided into subgroups and each subgroup
selects the same alternative, then the entire group also selects that
alternative.
6. Invulnerability to the no-show paradox: It is not possible for a group of
voters to obtain their first-ranked choice by abstaining if voting would
lead to the selection of some other option.
Below is the example of the application of voting method (Pacuit, 2016).
• There is a group of 21 people, or voters, who need to make a decision
about which of four options, should be elected.
• Let A, B, C and D denote the four different candidates.
• Decide how to represent the voters' opinions about the set of
candidates. Here the voting theory assume that the voters' opinions are
described by linear rankings of the set of alternatives (describing the
voters' ordinal preference orderings).
• For this example, assume that each of the voters has one of four
possible rankings of the alternatives. The information about the
rankings of each voter is given in the following table.
18
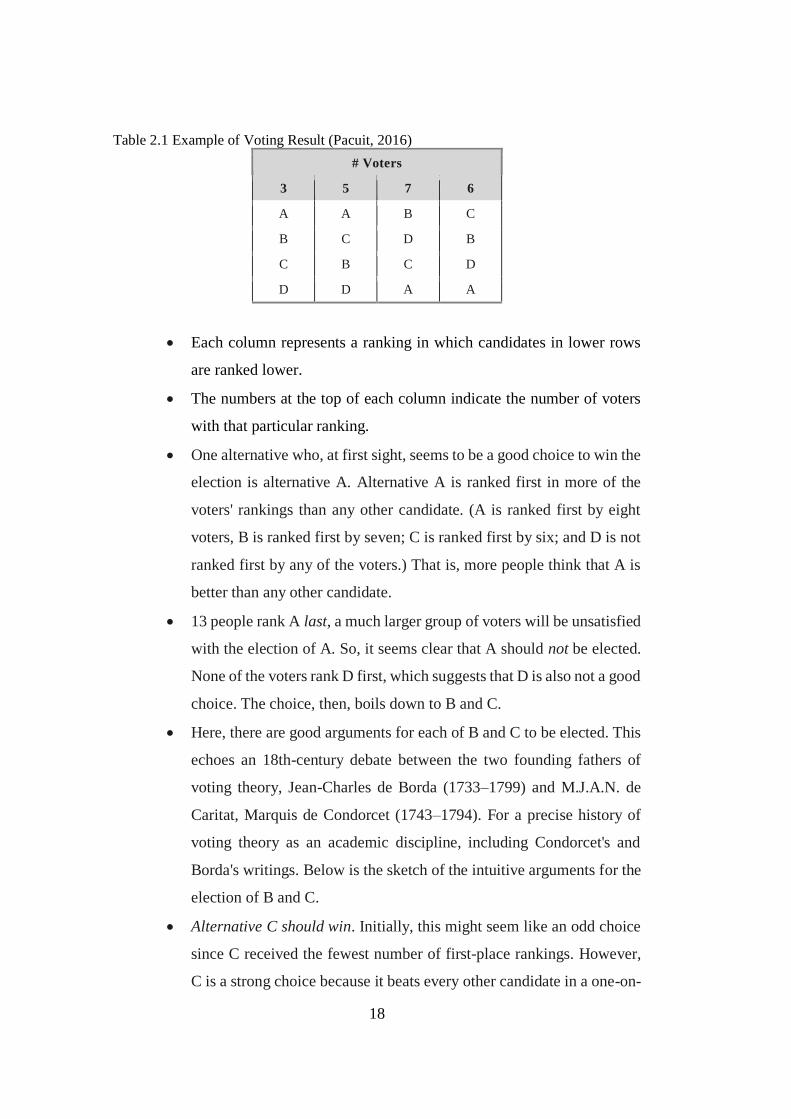
Table 2.1 Example of Voting Result (Pacuit, 2016)
# Voters
3 5 7 6
A A B C
B C D B
C B C D
D D A A
• Each column represents a ranking in which candidates in lower rows
are ranked lower.
• The numbers at the top of each column indicate the number of voters
with that particular ranking.
• One alternative who, at first sight, seems to be a good choice to win the
election is alternative A. Alternative A is ranked first in more of the
voters' rankings than any other candidate. (A is ranked first by eight
voters, B is ranked first by seven; C is ranked first by six; and D is not
ranked first by any of the voters.) That is, more people think that A is
better than any other candidate.
• 13 people rank A last, a much larger group of voters will be unsatisfied
with the election of A. So, it seems clear that A should not be elected.
None of the voters rank D first, which suggests that D is also not a good
choice. The choice, then, boils down to B and C.
• Here, there are good arguments for each of B and C to be elected. This
echoes an 18th-century debate between the two founding fathers of
voting theory, Jean-Charles de Borda (1733–1799) and M.J.A.N. de
Caritat, Marquis de Condorcet (1743–1794). For a precise history of
voting theory as an academic discipline, including Condorcet's and
Borda's writings. Below is the sketch of the intuitive arguments for the
election of B and C.
• Alternative C should win. Initially, this might seem like an odd choice
since C received the fewest number of first-place rankings. However,
C is a strong choice because it beats every other candidate in a one-on-
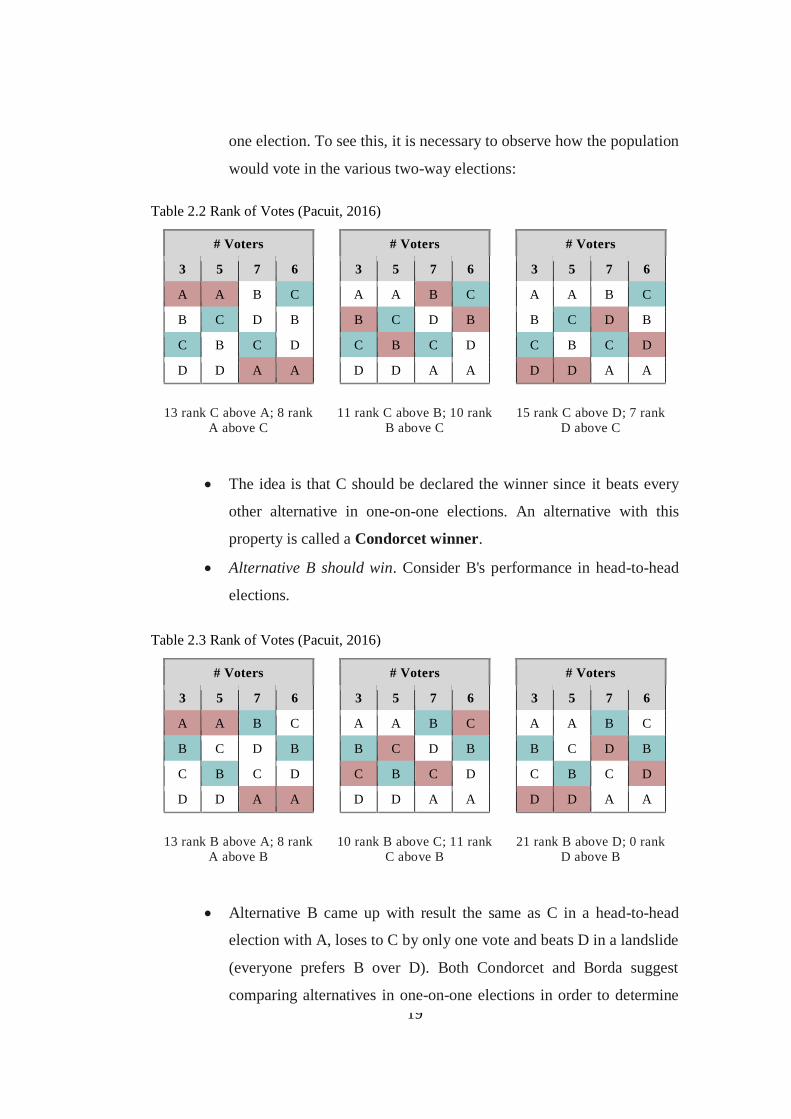
19
one election. To see this, it is necessary to observe how the population
would vote in the various two-way elections:
Table 2.2 Rank of Votes (Pacuit, 2016)
# Voters
3 5 7 6
A A B C
B C D B
C B C D
D D A A
# Voters
3 5 7 6
A A B C
B C D B
C B C D
D D A A
# Voters
3 5 7 6
A A B C
B C D B
C B C D
D D A A
13 rank C above A; 8 rank
A above C
11 rank C above B; 10 rank
B above C
15 rank C above D; 7 rank
D above C
• The idea is that C should be declared the winner since it beats every
other alternative in one-on-one elections. An alternative with this
property is called a Condorcet winner.
• Alternative B should win. Consider B's performance in head-to-head
elections.
Table 2.3 Rank of Votes (Pacuit, 2016)
# Voters
3 5 7 6
A A B C
B C D B
C B C D
D D A A
# Voters
3 5 7 6
A A B C
B C D B
C B C D
D D A A
# Voters
3 5 7 6
A A B C
B C D B
C B C D
D D A A
13 rank B above A; 8 rank
A above B
10 rank B above C; 11 rank
C above B
21 rank B above D; 0 rank
D above B
• Alternative B came up with result the same as C in a head-to-head
election with A, loses to C by only one vote and beats D in a landslide
(everyone prefers B over D). Both Condorcet and Borda suggest
comparing alternatives in one-on-one elections in order to determine
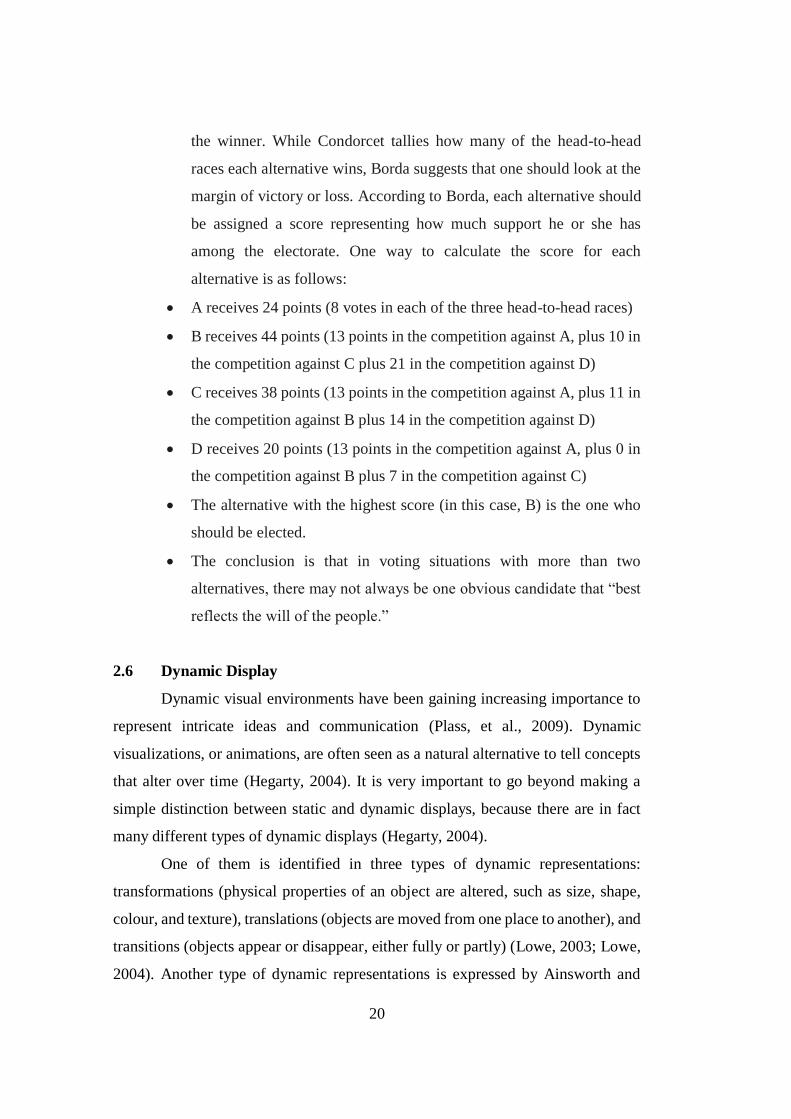
20
the winner. While Condorcet tallies how many of the head-to-head
races each alternative wins, Borda suggests that one should look at the
margin of victory or loss. According to Borda, each alternative should
be assigned a score representing how much support he or she has
among the electorate. One way to calculate the score for each
alternative is as follows:
• A receives 24 points (8 votes in each of the three head-to-head races)
• B receives 44 points (13 points in the competition against A, plus 10 in
the competition against C plus 21 in the competition against D)
• C receives 38 points (13 points in the competition against A, plus 11 in
the competition against B plus 14 in the competition against D)
• D receives 20 points (13 points in the competition against A, plus 0 in
the competition against B plus 7 in the competition against C)
• The alternative with the highest score (in this case, B) is the one who
should be elected.
• The conclusion is that in voting situations with more than two
alternatives, there may not always be one obvious candidate that “best
reflects the will of the people.”
2.6 Dynamic Display
Dynamic visual environments have been gaining increasing importance to
represent intricate ideas and communication (Plass, et al., 2009). Dynamic
visualizations, or animations, are often seen as a natural alternative to tell concepts
that alter over time (Hegarty, 2004). It is very important to go beyond making a
simple distinction between static and dynamic displays, because there are in fact
many different types of dynamic displays (Hegarty, 2004).
One of them is identified in three types of dynamic representations:
transformations (physical properties of an object are altered, such as size, shape,
colour, and texture), translations (objects are moved from one place to another), and
transitions (objects appear or disappear, either fully or partly) (Lowe, 2003; Lowe,
2004). Another type of dynamic representations is expressed by Ainsworth and
21
VanLabeke (2004). They stated these types are time-persistent (explain the relation
between at least one variable), time-implicit (present a range of values with no
specific time frame), and time-singular (displaying one or more variables at a single
point in time). These different categorizations all share the notion that dynamic
visualizations display the process of change over time, whether time is explicitly
expressed or not.
Hegarty (2004) wrote that a realistic animation of a visible phenomenon is
one of dynamic display type. This dynamic display type is presenting processes
visible in real world, such as world machine in motion animation. On top of that,
dynamic display can ‘‘envision’’ invisible entities that are spatially distributed, for
example changes in pressure or temperature on a weather map (Lowe, 2004).
Dynamic displays are also able to portray abstract information, such as statistical
concepts, changes in population over time, or computer algorithms.
2.6.1 Dynamic Display Basic Design
According to Sanders & McCormick (1992), the basic design of dynamic
display consists of several designs described below.
a. Quantitative readings: The display is used to read a precise numeric
value. For example, a quantitative reading would precede a
response such as "The pressure is 125 psi."
b. Qualitative readings: The display is used to read an approximate
value or to discern a trend, rate of change, or change in direction.
For example, a qualitative reading would result in a response such
as "The pressure is rising."
c. Check readings: The display is used to determine if parameters are
within some "normal" bounds or that several parameters are equal.
For example, check reading would elicit a response such as "All
pressures are normal."
d. Situation awareness: The display (a representation of some
physical space) is used to perceive and attach meaning to elements
in a volume of time.
Green (1988) listed the recommendations for the design of automotive
22
displays, in particular gauges to help designers develop displays that are easy to
use.
• Display Type
Rule 1. The display that is easiest to use depends on the task for which it is
intended. In general, when an exact number is required, a numeric
display should be provided. When the primary task is-check reading,
a moving pointer display is best.
a. Recommendation 1: For motor vehicles a numeric display is
preferred for the speedometer.
b. Recommendation 2: The engine and fuel gauges should be moving
pointer displays.
• Display Format
Rule 2. When a group of moving pointer displays are to be check read, they
should be arranged so their pointers are aligned when they all show
normal values.
a. Comment: There is considerable discussion in the literature as to
which position is best. The key is consistency, with alignment at 9
or 12 o'clock being most common for circular displays. For arc
meters and horizontal and vertical scales, alignment of pointers is
straightforward.
b. Recommendation 3: When more than one engine gauge is on the
instrument panel, they should be close to each other and arranged
so their pointers are aligned when all show normal values. They
should not be grouped with the fuel gauge.
Rule 3. For quantitative reading, the ranking of moving pointer displays from
best to worst is: circular, arc, horizontal, vertical.
a. Comment: This rule is based on laboratory data in which visual
search is not required. It assumes that reading time is strongly
influenced by how far the pointer tip is from the fixation point.
Rule 4. For check reading, the differences between moving pointer displays
23
are small with vertical displays tending to be more difficult to read.
a. Comment: Both quantitative and check reading performance are
markedly affected by the compatibility of the pointer motion and
the associated response. So, for example, a design that required
users to move a switch up when the pointer moves down would
be a poor.
• Scale Marks
Rule 5. Scale marking considerations are less important than the
choice of the proper display and the alignment of pointers for check
reading.
Rule 6. For zero-based numbers, scales should be marked with values greater
than 1 and numbered in even multiples of 10 (0, 10, ... or 0, 100, ...,
etc.) when an exact number is desired. Easy to use displays are ones
which minimize the number of mental operations a viewer is required
to complete to interpret them. Nondecimal schemes (0, 2.5,. .., or 0,
1.7, 3.4, ..., etc.) are much more difficult for people to understand.
a. Recommendation 4: Moving pointer speedometers for production
vehicles should be numbered in increments of 10, not 20 mph. It
is not clear, however, if numbers should be associated with fives
or tens. Numbering the tens is compatible with how people
process numbers but incompatible with the way speed limits are
posted (35 mph, 55 mph, etc.). Research to address this question
should be conducted.
b. Comment: Recommendation 1 takes precedence over
Recommendation 4. Numeric speedometers are preferred over
moving pointer speedometers.
c. Comment: Many automotive engine displays are not zero-based for
normal operation. For example, engine temperature displays (which
are usually check read) almost never show values between 0 and
140 degrees when the engine is running. The same is true for
24
electrical system voltage, which is invariably 13.5 volts, plus or
minus 2.5 volts. Therefore, this rule does not apply to these
displays.
d. Recommendation 5: If labelled with numbers, other engine gauges
(oil pressure, oil level, electrical system current) should have the
zero-point labelled and numbered with 1's or 10 ' s as appropriate.
Rule 7. Scale marks should be provided down to the level to which a display
must be read. If a speedometer is to be read to the nearest mph, then
marks showing the units should be provided. If it is read to the nearest
5 mph, then only marks at that level should be provided. It is not clear
how accurately speedometers are read. That issue should be
investigated experimentally.
Rule 8. Scale marks should not appear at non-integer points on a scale unless
the values being displayed are not integers. According to this rule, tick
marks on a speedometer in 2.5 mph increments (i.e., halfway between
5 and 10) are ill advised. Non-integer markings add to the mental
effort required to read a display and make it more difficult to read.
e. Recommendation 6: Provided normal is clearly shown (e.g.,
range marks labelled with "ok"), it does not matter how engine
gauges are labelled. Numbers, words, abbreviations, and symbols
are equally informative, and any of them can be used.
Rule 9. For displays that are check read, how a scale is marked once the
normal range is shown tends not to be important.
f. Recommendation 6: Provided normal is clearly shown (e.g.,
range marks labelled with "ok"), it does not matter how engine
gauges are labelled. Numbers, words, abbreviations, and symbols
are equally informative, and any of them can be used.
Rule 10. For qualitative readings two anchors may be sufficient if the measured
dimension is well understood by viewers.
g. Recommendation 7: It does not matter much how a fuel gauge is
labelled. Drivers understand most of the common labels (E - F)
and even some of the uncommon (0/4 - 4/4) labels nearly as well.
25
Rule 11. Dials should have breaks between 0 and the maximum. It is not clear
how big they should be.
Rule 12. Marked intervals should be at least 1/2 inch apart. (Marked intervals
are those points on the scale that have numbers, shown next to them,
e.g., 0, 10, 20, etc.). Some have argued for intervals of an inch or more.
Rule 13. Scale marks should be separated by at least 1/10 inch.
Rule 14. Scale marks (and pointers) should be at least .03 inches wide. Should
wider marks be used, they should always be considerably less than the
gap between marks to avoid figure ground reversal problems.
Rule 15. It doesn't matter if scale numbers are on the inside or outside of a dial
or on the same or different side of the scale as the pointer.
Rule 16. Nonstandard marking schemes (staircase tick marks, using log scales
to linearize data) offer minor, if any, performance benefits.
Rule 17. Zone markings ("ok," "normal," etc.) should be provided on displays
which are check read. They make displays much easier to check read.
Labelling them with words or color bands is about equally effective.
h. Recommendation 7: Every engine gauge should have zone
markings.
Rule 18. Normal zones should be colored green. Danger zones should be
colored red. There is debate as to whether other zones should be white
or yellow.
• Pointers
Rule 19. For electronic displays where multiple segments are used to
represent a pointer, only a single segment should be illuminated. (A
cursor design is easier to understand than a fill design.)
a. Comment: This rule has been experimentally verified for engine
displays but not for speedometers. Of the rules listed for pointer
design, this one is likely to have a major influence on
performance and is an exception to Rule 4.
Rule 20. The gap between pointer tips and the associated tick marks should be
between 0 and 1/4 inch for accurate quantitative or qualitative reading.
26
For check reading of multiple aligned displays, longer pointers should
be provided.
b. Recommendation 8: For speedometers and fuel gauges, the gap
should be 1/4 inch or less.
c. Recommendation 9: When multiple gauges for engine functions
(temperature, oil pressure, etc.) are provided, longer pointers
should be provided.
Rule 21. The pointer width near the tip should be about equal to minor mark
width.
Rule 22. If scale marks are all one color, the pointer should be a different color
that contrasts well with the marks and the background.
d. Comment: If the tick marks are multiple colors, this rule may not
hold. This should be investigated experimentally.
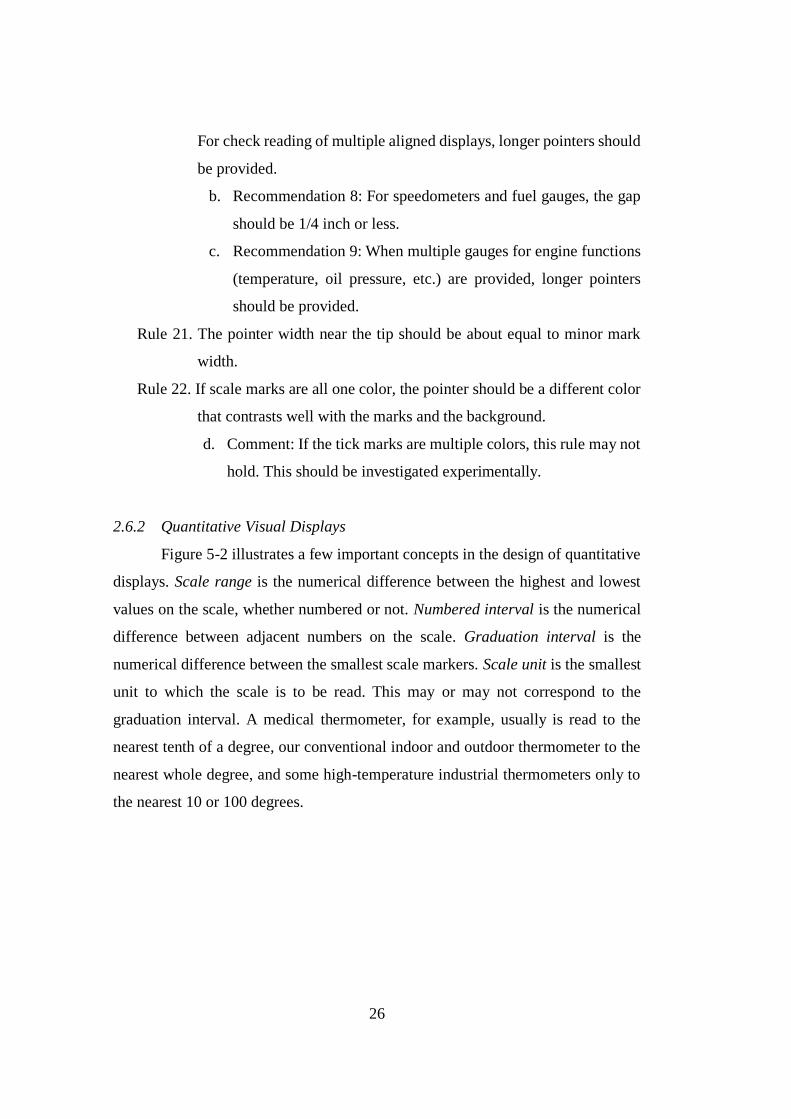
2.6.2 Quantitative Visual Displays
Figure 5-2 illustrates a few important concepts in the design of quantitative
displays. Scale range is the numerical difference between the highest and lowest
values on the scale, whether numbered or not. Numbered interval is the numerical
difference between adjacent numbers on the scale. Graduation interval is the
numerical difference between the smallest scale markers. Scale unit is the smallest
unit to which the scale is to be read. This may or may not correspond to the
graduation interval. A medical thermometer, for example, usually is read to the
nearest tenth of a degree, our conventional indoor and outdoor thermometer to the
nearest whole degree, and some high-temperature industrial thermometers only to
the nearest 10 or 100 degrees.
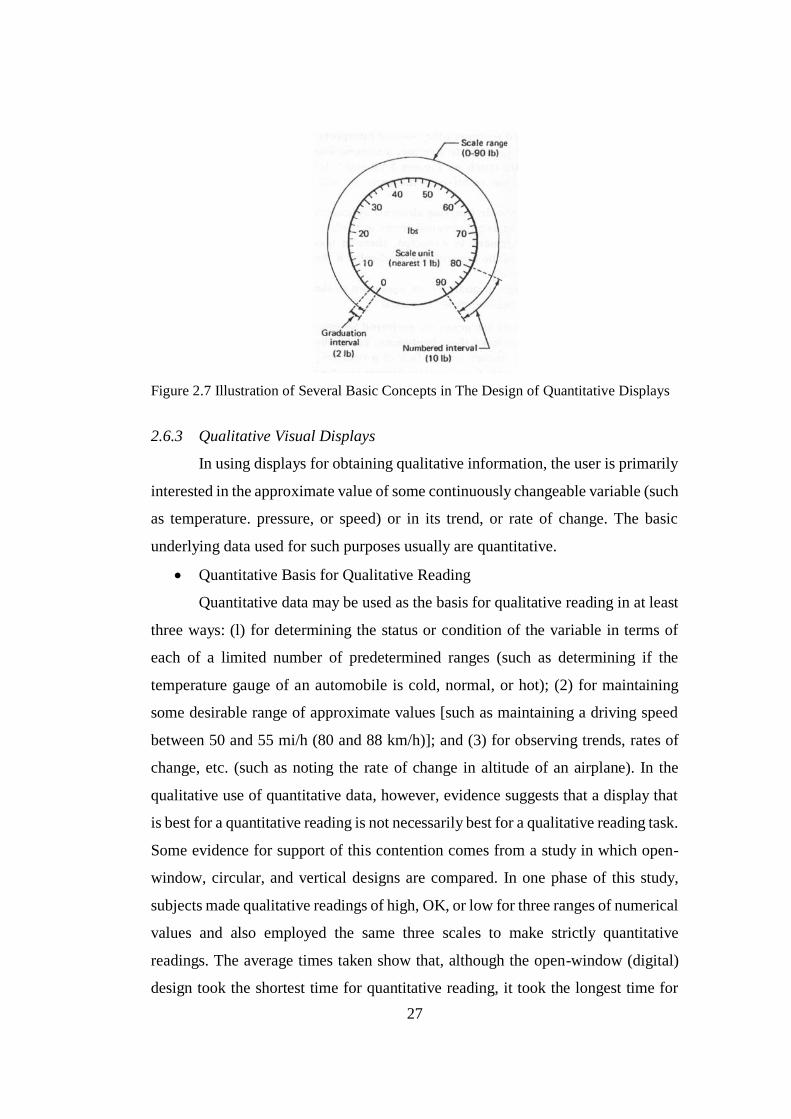
27
Figure 2.7 Illustration of Several Basic Concepts in The Design of Quantitative Displays
2.6.3 Qualitative Visual Displays
In using displays for obtaining qualitative information, the user is primarily
interested in the approximate value of some continuously changeable variable (such
as temperature. pressure, or speed) or in its trend, or rate of change. The basic
underlying data used for such purposes usually are quantitative.
• Quantitative Basis for Qualitative Reading
Quantitative data may be used as the basis for qualitative reading in at least
three ways: (l) for determining the status or condition of the variable in terms of
each of a limited number of predetermined ranges (such as determining if the
temperature gauge of an automobile is cold, normal, or hot); (2) for maintaining
some desirable range of approximate values [such as maintaining a driving speed
between 50 and 55 mi/h (80 and 88 km/h)]; and (3) for observing trends, rates of
change, etc. (such as noting the rate of change in altitude of an airplane). In the
qualitative use of quantitative data, however, evidence suggests that a display that
is best for a quantitative reading is not necessarily best for a qualitative reading task.
Some evidence for support of this contention comes from a study in which open-
window, circular, and vertical designs are compared. In one phase of this study,
subjects made qualitative readings of high, OK, or low for three ranges of numerical
values and also employed the same three scales to make strictly quantitative
readings. The average times taken show that, although the open-window (digital)
design took the shortest time for quantitative reading, it took the longest time for
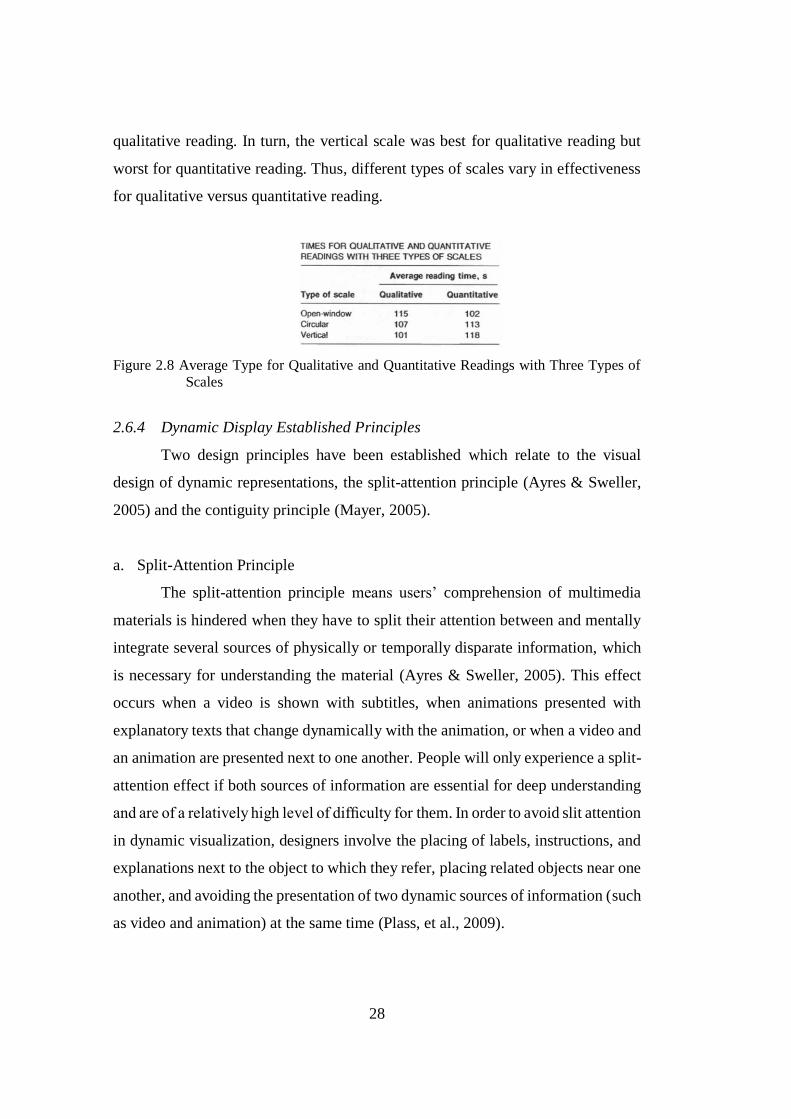
28
qualitative reading. In turn, the vertical scale was best for qualitative reading but
worst for quantitative reading. Thus, different types of scales vary in effectiveness
for qualitative versus quantitative reading.
Figure 2.8 Average Type for Qualitative and Quantitative Readings with Three Types of
Scales
2.6.4 Dynamic Display Established Principles
Two design principles have been established which relate to the visual
design of dynamic representations, the split-attention principle (Ayres & Sweller,
2005) and the contiguity principle (Mayer, 2005).
a. Split-Attention Principle
The split-attention principle means users’ comprehension of multimedia
materials is hindered when they have to split their attention between and mentally
integrate several sources of physically or temporally disparate information, which
is necessary for understanding the material (Ayres & Sweller, 2005). This effect
occurs when a video is shown with subtitles, when animations presented with
explanatory texts that change dynamically with the animation, or when a video and
an animation are presented next to one another. People will only experience a split-
attention effect if both sources of information are essential for deep understanding
and are of a relatively high level of difficulty for them. In order to avoid slit attention
in dynamic visualization, designers involve the placing of labels, instructions, and
explanations next to the object to which they refer, placing related objects near one
another, and avoiding the presentation of two dynamic sources of information (such
as video and animation) at the same time (Plass, et al., 2009).
29
b. Spatial and Temporal Contiguity Principle
This principle describes how to provide related sources of information close to
one another, rather than separated, improves learning by reducing extraneous visual
search tasks (Plass, et al., 2009). Examples for this effect are narrations shown after
the corresponding visual information was shown (temporal contiguity), or labels
that are not integrated with the corresponding visualizations (spatial contiguity).
Designers can avoid comprehension problems due to spatial contiguity by locating
related objects next to another rather than far from each other, and problems due to
temporal contiguity by presenting related information at the same time rather in
succession.
c. Representation type of information
The consideration of the type of representation a designer will choose for key
information is critical. The key information of a dynamic visualization design will
be enhanced when it is represented in iconic (pictorial) form rather than only in
symbolic (textual) form (Plass, et al., 2009). These are applied for materials that
induce high cognitive load, and for someone who has low prior knowledge in the
subject matter informed (Lee, et al., 2006; Plass, et al., 2009).
d. Color Coding
Color coding principle states that color used to highlight important features and
attributes for instructional information of visual displays results in enhanced
understanding. It emphasizes key design features and create connections between
various sources of information along the media. It also may facilitate reductions in
working memory and search requirement in simulations (Plass, et al., 2009).
2.7 State of The Art
A research conducted by Kim, et al. (2011) about designing dashboard
display for driver. It describes how to design dashboard display so that it is able to
support drivers, their information needs, and their cognitive capabilities.
Furthermore, the study also what display design features that are critically linked to
issues of divided attention and driving performance.

30
When designing a dashboard display, the following factors should be
considered (Kim, et al., 2011).
a. Low clutter. Simple, low clutter designs should be used for the whole
dashboard. Ample “white space” is needed, particularly between
individual features of the dashboard.
b. Contrast of size. Reserve maximum contrast of size for the center
panel, especially for the speedometer, since this feature is what
drivers reference most often when driving.
c. Color. Use color for elements plus background fills, rather than for
elements only. The contrast of size had more of an effect than color
in increasing the performance of a design. Designs with color and
fill performed about the same as designs with no color.
31
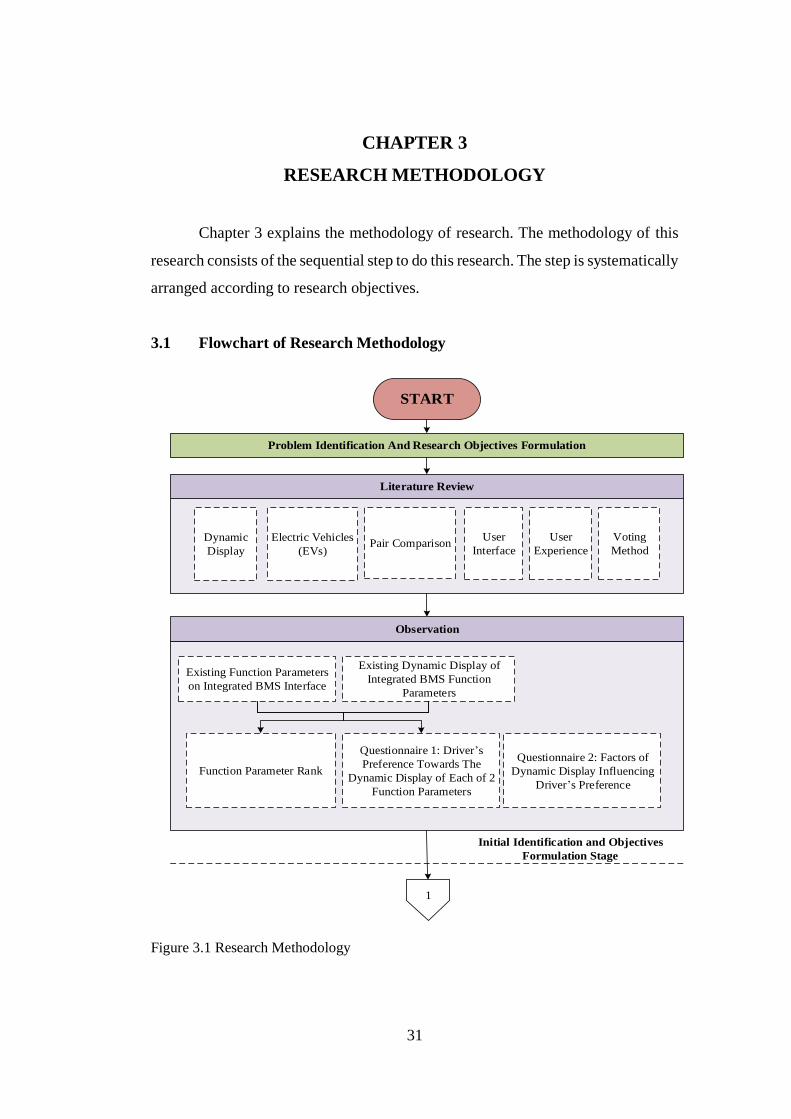
CHAPTER 3
RESEARCH METHODOLOGY
Chapter 3 explains the methodology of research. The methodology of this
research consists of the sequential step to do this research. The step is systematically
arranged according to research objectives.
3.1 Flowchart of Research Methodology
Observation
START
Problem Identification And Research Objectives Formulation
Electric Vehicles
(EVs)
User
Interface
User
Experience
Existing Function Parameters
on Integrated BMS Interface
Existing Dynamic Display of
Integrated BMS Function
Parameters
Function Parameter Rank
Questionnaire 1: Driver s
Preference Towards The
Dynamic Display of Each of 2
Function Parameters
Questionnaire 2: Factors of
Dynamic Display Influencing
Driver s Preference
Dynamic
Display
1
Initial Identification and Objectives
Formulation Stage
Literature Review
Pair ComparisonVoting
Method
Figure 3.1 Research Methodology
32
1
Questionnaire 1: Driver s Preference Towards The Dynamic Display of Each of 2 Function
Parameters
Do pair comparison to dynamic display alternatives from each function parameters
Rank each alternative s preference score from all consistent respondent from highest to lowest
Calculate the total preference score of each alternative from each respondent
Select the 5 highest preference score as the chosen alternative of each function parameter
dynamic display
Questionnaire 2: Factors of Dynamic Display Influencing Driver s Preference
List all dynamic display designing factors
Rank each factor according to driver s preference
Use Voting Method to obtain the general rank
2
Data Collection and Processing Stage
Existing Function Parameters on Integrated BMS Interface
Existing Dynamic Display of Each Integrated BMS Function
Parameters
Data Collection and Processing
Select the 2 alternatives of BMS function parameters
Calculate each respondent s internal reliability (consistency) (Kendall and Smith, 1940)
Is Respondent
Consistent?
Screen-out the
respondent
YES
NO
Figure 3.1 Research Methodology
33
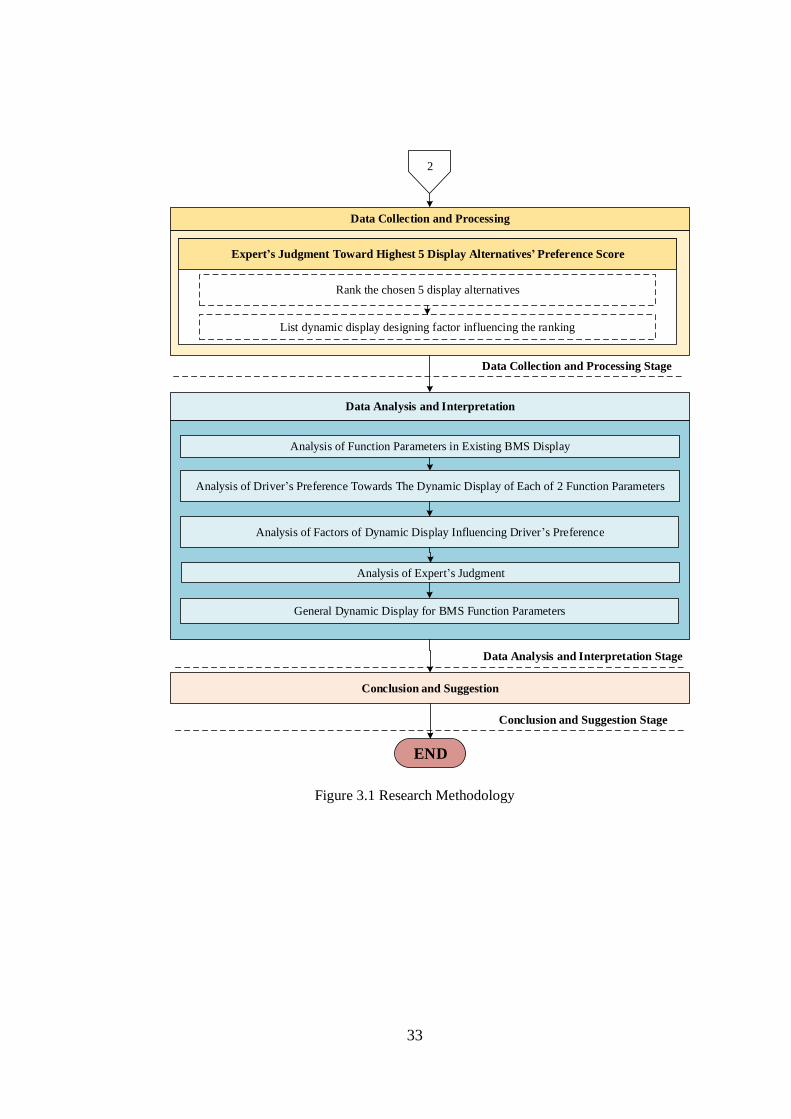
2
Data Collection and Processing Stage
Analysis of Function Parameters in Existing BMS Display
Analysis of Driver s Preference Towards The Dynamic Display of Each of 2 Function Parameters
Analysis of Factors of Dynamic Display Influencing Driver s Preference
Analysis of Expert s Judgment
Data Analysis and Interpretation Stage
Conclusion and Suggestion
END
Conclusion and Suggestion Stage
Data Collection and Processing
Data Analysis and Interpretation
Expert s Judgment Toward Highest 5 Display Alternatives Preference Score
Rank the chosen 5 display alternatives
List dynamic display designing factor influencing the ranking
General Dynamic Display for BMS Function Parameters
Figure 3.1 Research Methodology

34
This page is intentionally left blank
35
CHAPTER 4
DATA COLLECTION AND PROCESSING
This chapter provides about data collection and processing. The initial data
needed are priority functions that must be included to the integrated BMS. After
determining them, the alternatives of each function’s dynamic display will be
determined. The display alternatives were generated by combining one
characteristic of dynamic display from common fuel-vehicle dashboard display.
There are total 34 display alternatives for each function parameter.
4.1 Existing Functions Parameters and Dynamic Display of Battery
Management System
EV is not a new thing in automotive industry. Therefore, different dynamic
displays of integrated BMS are already available on several EV brands and BMS
developer, such as BMW, KIA, Ford, etc. Below are the figures of existing dynamic
display of integrated BMS from various resources.
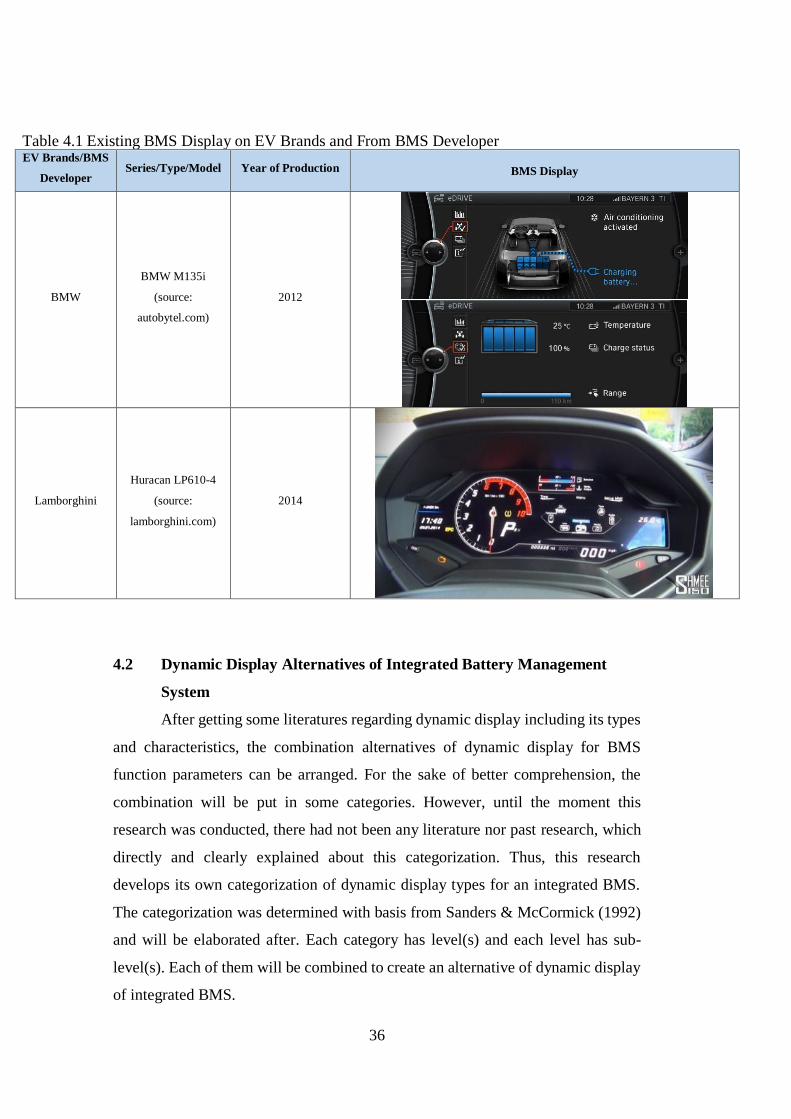
36
Table 4.1 Existing BMS Display on EV Brands and From BMS Developer
EV Brands/BMS
Developer Series/Type/Model Year of Production BMS Display
BMW
BMW M135i
(source:
autobytel.com)
2012
Lamborghini
Huracan LP610-4
(source:
lamborghini.com)
2014
4.2 Dynamic Display Alternatives of Integrated Battery Management
System
After getting some literatures regarding dynamic display including its types
and characteristics, the combination alternatives of dynamic display for BMS
function parameters can be arranged. For the sake of better comprehension, the
combination will be put in some categories. However, until the moment this
research was conducted, there had not been any literature nor past research, which
directly and clearly explained about this categorization. Thus, this research
develops its own categorization of dynamic display types for an integrated BMS.
The categorization was determined with basis from Sanders & McCormick (1992)
and will be elaborated after. Each category has level(s) and each level has sub-
level(s). Each of them will be combined to create an alternative of dynamic display
of integrated BMS.
37
Table 4.2 Specification of The EV Battery Battery Type: LiFePO4 (Lithium Iron Phosphate)
Minimum Voltage : 2.5 V Capacity : 60Ah
Nominal Voltage : 3.2 V The maximum charging
voltage : 4 (for initial charge)
Maximum Voltage : 3.9 V Operating temperature (°C) : -45°C up to
85°C (discharging)
4.3 Questionnaire of Dynamic Display Alternatives Pair Comparison
To determine the most preferred alternative of dynamic display of both
battery state of charge and voltage, a pair comparison questionnaire is generated.
This questionnaire will compare a-pair-of-two alternatives among the 34
alternatives. The total number of pairings are determined by using t(t-1)/2, where t
defines number of items to be compared (Brown & Peterson, 2009).
Total number of pairs = t(t-1)/2 = 34(34-1)/2 = 561 pairs
Since there are quite number of questions, these 2 questionnaires were
created by using online questionnaire form, which is typeform.com. This online
platform can accommodate hundreds question in a single form. Respondent will be
able to access the questionnaire through the link provided. Below are the links for
the questionnaire:
Table 4.3 List of Questionnaire Link Questionnaire Link
Battery State of Charge (no. 1-561) Bit.ly/BMSTEST1b
Battery Voltage (no. 1-280) Bit.ly/BMSTEST1c
Battery Voltage (no. 281-561) Bit.ly/BMSTEST1d
There are 4 respondents involved to fill the questionnaire. All respondents
taken based on criteria driving capability.
Internal Reliability (Consistency) of Battery State of Charge and Battery Voltage
Display Alternative Pair Comparison
After obtaining the preference score of each display alternatives, individual
respondent’s internal ability will be calculated. Internal reliability measures the
level of agreement among a given respondent’s between-choices. This is commonly
determined by using the number of circular triads among a respondent’s choices.
According to Brown and Peterson (2009), the circular triads can be determined by
38
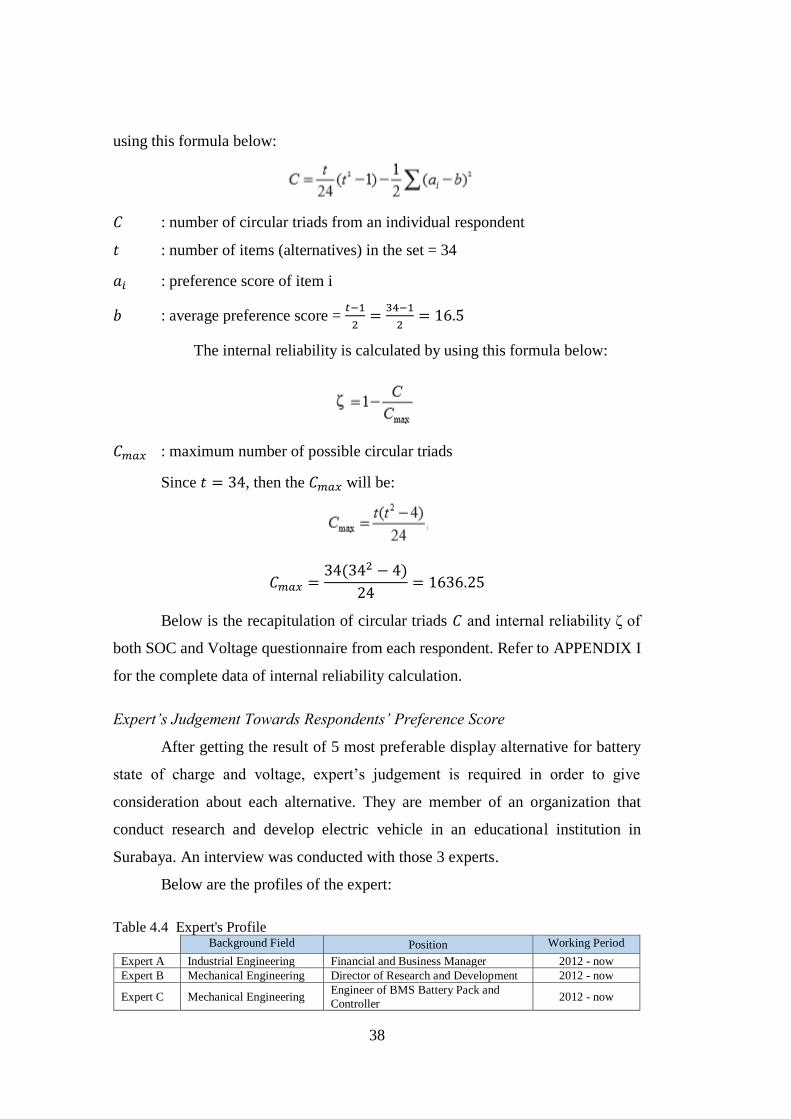
using this formula below:
𝐶 : number of circular triads from an individual respondent
𝑡 : number of items (alternatives) in the set = 34
𝑎𝑖 : preference score of item i
𝑏 : average preference score = 𝑡−1
2=
34−1
2= 16.5
The internal reliability is calculated by using this formula below:
𝐶𝑚𝑎𝑥 : maximum number of possible circular triads
Since 𝑡 = 34, then the 𝐶𝑚𝑎𝑥 will be:
𝐶𝑚𝑎𝑥 =34(342 − 4)
24= 1636.25
Below is the recapitulation of circular triads 𝐶 and internal reliability ζ of
both SOC and Voltage questionnaire from each respondent. Refer to APPENDIX I
for the complete data of internal reliability calculation.
Expert’s Judgement Towards Respondents’ Preference Score
After getting the result of 5 most preferable display alternative for battery
state of charge and voltage, expert’s judgement is required in order to give
consideration about each alternative. They are member of an organization that
conduct research and develop electric vehicle in an educational institution in
Surabaya. An interview was conducted with those 3 experts.
Below are the profiles of the expert:
Table 4.4 Expert's Profile Background Field Position Working Period
Expert A Industrial Engineering Financial and Business Manager 2012 - now
Expert B Mechanical Engineering Director of Research and Development 2012 - now
Expert C Mechanical Engineering Engineer of BMS Battery Pack and
Controller 2012 - now

39
The interview resulted that all 3 experts have the same order of preference
of display alternative of battery of charge. However, each of them has different
consideration of each display alternative despite having similar preference. Below
is the rank order from the 3 experts towards 5 most preferred display alternatives.

40
This page is intentionally left blank
41
CHAPTER 5
DATA ANALYSIS AND INTERPRETATION
This chapter provides information about analysis and interpretation of data
gathered in Chapter 4. It will explain about the results of the most preferred dynamic
display for battery SOC, voltage, and the general result of the findings. This chapter
also gives detail about the design factor influencing respondents in selecting the
preferred alternative of dynamic display.
5.1 Function Parameters in Existing BMS Display
From the literature review, it is known that the most available function
parameters on the various existing integrated BMS display are battery SOC,
temperature, voltage, speedometer, current, range remaining, battery capacity, and
energy consumption. This indicates that these function parameters become the most
crucial parameter in order to monitor the condition of EV battery. These function
parameters need information input from the battery, so they can process it to get an
output. Since these function parameters are crucial, it will be difficult for EV driver
to understand his battery performance right away. Eventually, this will lead to early
damage without the driver being aware.
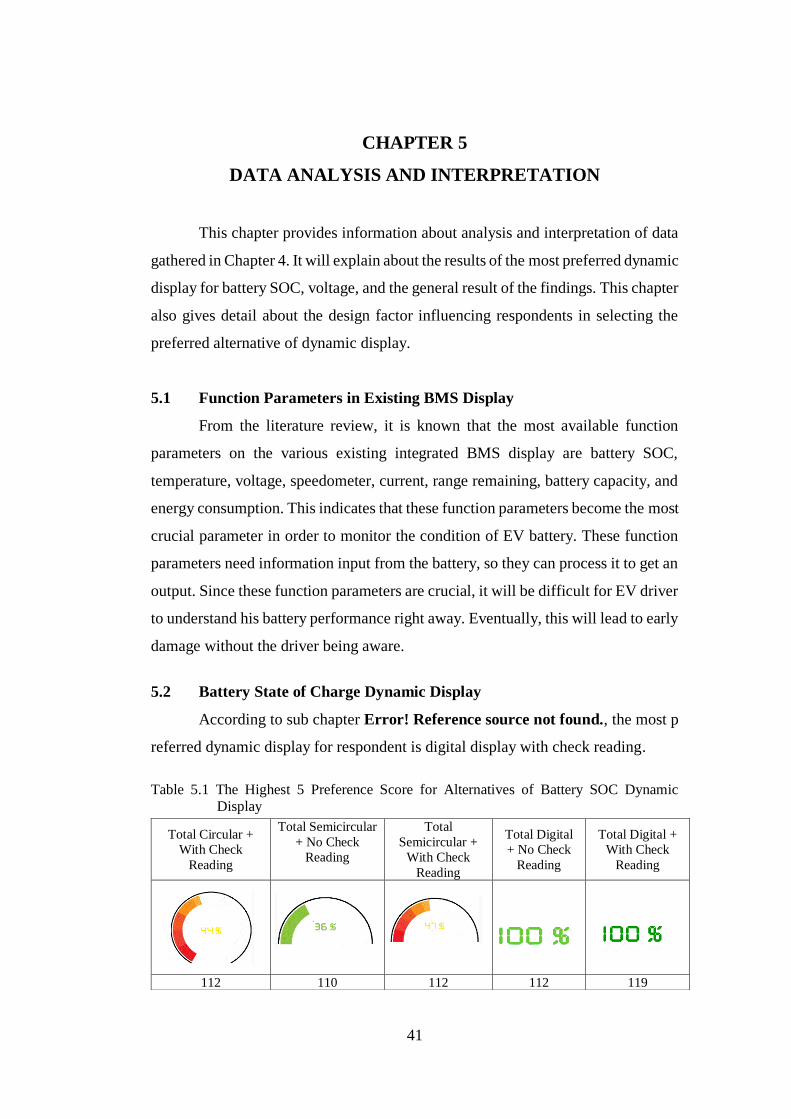
5.2 Battery State of Charge Dynamic Display
According to sub chapter Error! Reference source not found., the most p
referred dynamic display for respondent is digital display with check reading.
Table 5.1 The Highest 5 Preference Score for Alternatives of Battery SOC Dynamic
Display
Total Circular +
With Check
Reading
Total Semicircular
+ No Check
Reading
Total
Semicircular +
With Check
Reading
Total Digital
+ No Check
Reading
Total Digital +
With Check
Reading
112 110 112 112 119
42
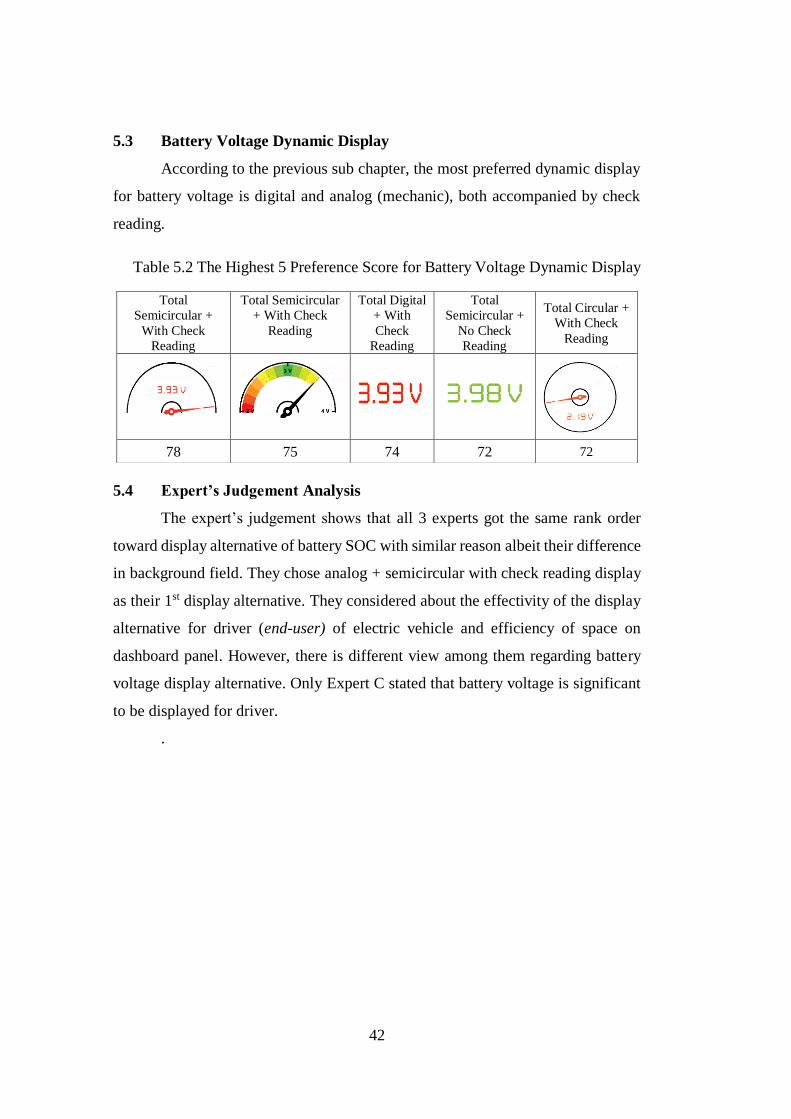
5.3 Battery Voltage Dynamic Display
According to the previous sub chapter, the most preferred dynamic display
for battery voltage is digital and analog (mechanic), both accompanied by check
reading.
Table 5.2 The Highest 5 Preference Score for Battery Voltage Dynamic Display
5.4 Expert’s Judgement Analysis
The expert’s judgement shows that all 3 experts got the same rank order
toward display alternative of battery SOC with similar reason albeit their difference
in background field. They chose analog + semicircular with check reading display
as their 1st display alternative. They considered about the effectivity of the display
alternative for driver (end-user) of electric vehicle and efficiency of space on
dashboard panel. However, there is different view among them regarding battery
voltage display alternative. Only Expert C stated that battery voltage is significant
to be displayed for driver.
.
Total
Semicircular +
With Check
Reading
Total Semicircular
+ With Check
Reading
Total Digital
+ With
Check
Reading
Total
Semicircular +
No Check
Reading
Total Circular +
With Check
Reading
78 75 74 72 72
43
CHAPTER 6
CONCLUSION AND SUGGESTION
This chapter gives information about the conclusions regarding the research
process that has been conducted. Several suggestions will also be given as a
reference for improvement of future researches that is related to this research.
6.1 Conclusion
Based on previous chapters of data processing and analysis, there are several
conclusions that can be provided by considering the objectives stated in the
beginning of this research. Those conclusions are:
1. Most available function parameters on the various existing integrated
BMS display are battery SOC, temperature, voltage, speedometer,
current, range remaining, battery capacity, and energy consumption.
This final project only took battery state of charge and voltage into the
experiment.
2. Expert’s The most preferred dynamic display for battery SOC is digital
with check reading (119 times selected) by respondent. The consistency
of their preference score ranges from 0.75 - 0.99.
3. The most preferred dynamic display for battery voltage is digital-
mechanic semicircular with check reading (78 times selected).
6.2 Suggestion
Suggestions that could be given for future researches related to the topic of
dynamic display for an integrated BMS are:
1. Further observation about the dynamic display for other BMS functions
parameters.
2. Communicate with various party in order to gather information about
electric vehicle, such as electric vehicle community.

44
This page is intentionally left blank
xv
REFERENCES
Amman, S. & Greenberg, J., 1999. Subjective evaluation and objective quantification of
automobile strut noise. Noise Control Engineering Journal, 47(1), pp. 17-27.
Ayres, P. & Sweller, J., 2005. The Split-Attention Principle in Multimedia Learning. In: R. E.
Mayer, ed. The Cambridge Handbook of Multimedia Learning. New York: Cambridge
University Press, pp. 135-146.
Brown, T. C. & Peterson, G. L., 2009. An Enquiry Into the Method of Paired Comparison:
Reliability, Scaling, and Thurstone’s Law of Comparative Judgment, Fort Collins, CO:
Rocky Mountain Research Station.
Burgman, M. A. et al., 2014. Voting Systems for Environmental Decisions. Conservation
Biology, 28(2), p. 322–332.
Card, S., Mackinlay, J. D. & Shneiderman, B., 1999. Readings in Information Visualization:
Using Vision to Think. San Fransisco, CA: Morgan Kaufmann Publishers Inc.
Frankish, C., Morgan, P. & Hull, R., 1996. Recognition Accuracy and Usability of Pen-Based
Interfaces. IEE Savoy Place, Volume 126, pp. 7/1- 7/6.
Freeman, K. S. & Spyridakis, J. H., 2004. An Examination of Factors That Affect the
Credibility of Online Health Information. Technical Communication, 51(2), pp. 239-263.
Hegarty, M., 2004. Dynamic visualizations and learning: getting to the difficult questions.
Learning and Instruction, Volume 14, p. 343–351.
Hu, J. & Yeh, C., 2015. System Design and Implementation of Smart Dashboard for Electric
Vehicles. Mathematical Problems in Engineering, pp. 1-6.
Intersil Corporation, 2015. Battery Management System Tutorial. [Online]
Available at: https://www.intersil.com/content/dam/Intersil/whitepapers/battery-
management/battery-management-system-tutorial.pdf
[Accessed 22 October 2017].
Jørgensen , A. H. & Myers, B. A., 2008. User Interface History. Proceeding CHI '08
Extended Abstracts on Human Factors in Computing Systems, pp. 2415-2418.
Kim, S. J., Dey, A. K., Lee, J. & Forlizzi, J., 2011. Usability of Car Dashboard Displays for
Elder Drivers. Proceedings of the SIGCHI Conference on Human Factors in Computing
Systems, pp. 493-502.
Lee, H., Plass, J. L. & Homer, B. D., 2006. Optimizing Cognitive Load For Learning From
Computer-Based Science Simulations. Journal of Educational Psychology, Volume 98,
p. 902–913.
xvi
Lowe, R., 2003. Animation and learning: selective processing of information in dynamic
graphics. Learning and Instruction, Volume 13, pp. 157-176.
Lowe, R., 2004. Interrogation of a dynamic visualization during learning. Learning and
Instruction, Volume 14, p. 257–274.
Manca, K. G., 2015. Design, Programming, and User-Experience. Honors Scholar Theses,
Issue 423.
Mayer, R., 2005. The Cambridge Handbook of Multimedia Learning. Cambridge: Cambridge
University Press.
Nielsen, J., 2012. Usability 101: Introduction to Usability. [Online]
Available at: https://www.nngroup.com/articles/usability-101-introduction-to-usability/
[Accessed 10 February 2017].
Norman, D. & Nielsen, J., 2016. Nielsen Norman Group - The Definition of User Experience
(UX). [Online]
Available at: https://www.nngroup.com/articles/definition-user-experience/
[Accessed 10 February 2017].
Pacuit, E., 2016. The Stanford Encyclopedia of Philosophy : Voting Methods. [Online]
Available at: https://plato.stanford.edu/archives/win2016/entries/voting-methods/
[Accessed 10 April 2017].
Parizet, E., 2002. Paired Comparison Listening Tests and Circular Error Rates. Acta Acustica
united with Acustica, Volume 88, pp. 594-598.
Ping, Z. & Xing, F., 2008. Analysis of Cognitive Behavior in Software Interactive Interface.
Computer-Aided Industrial Design and Conceptual Design, CAID/CD 9th International
Conference, pp. 113-116.
Plass, J. L., Homer, B. D. & Haywa, E. O., 2009. Design factors for educationally effective
animations and simulations. New York, Springer.
Reunanen, M., 2013. Dynamic Visualization and Time. [Online]
Available at: http://www.kameli.net/marq/wp-content/uploads/2013/02/dynamic-
english.pdf
[Accessed 13 04 2017].
Tversky, B., Morrison, J. B. & Betrancourt, M., 2002. Animation: Can It Facilitate?.
International Journal of Human-Computer Studies, 57(4), pp. 247-262.
Udaeta, M., Chaud, C., Gimenes, A. & Galvao, L., 2015. Electric Vehicles Analysis Inside
Electric Mobility Looking for Energy Efficient and Sustainable Metropolis. Open
Journal of Energy Efficiency, Volume 4, pp. 1-14.

xvii
Xing, Y. M. E. T. K. a. P. M., 2011. Battery Management Systems in Electric and Hybrid
Vehicles. Energies, 4(12), pp. 1840-1857.

xviii
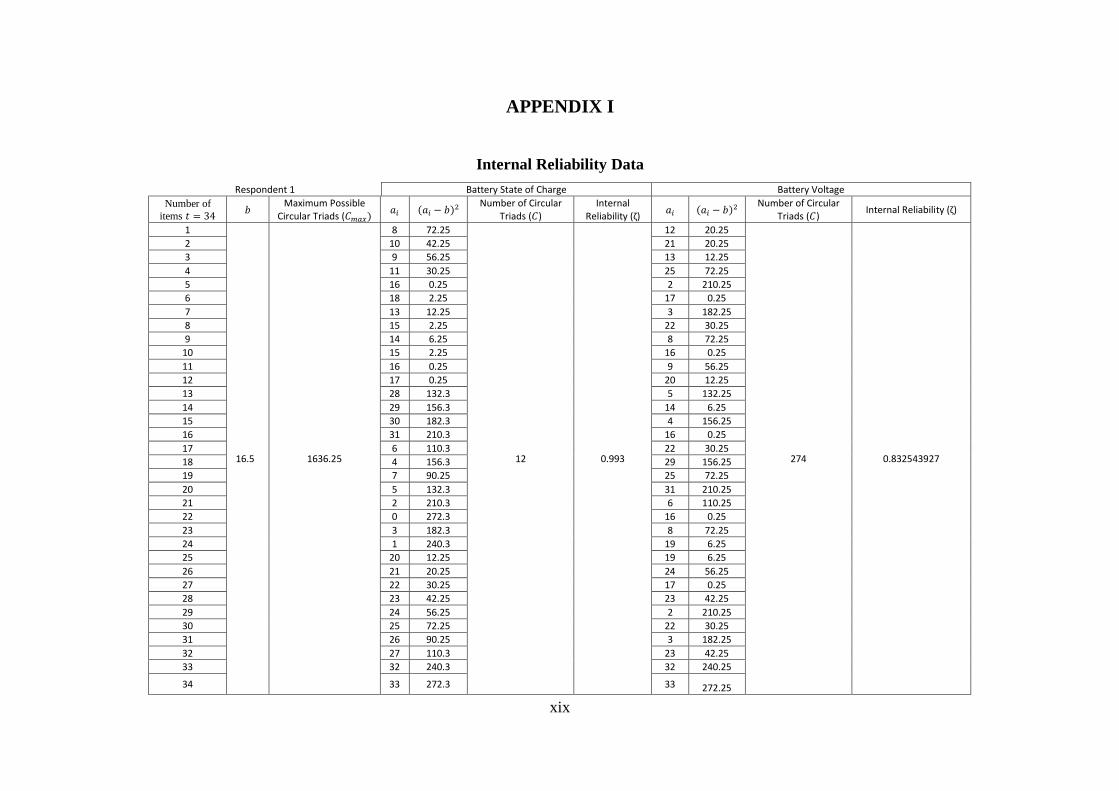
xix
APPENDIX I
Internal Reliability Data
Respondent 1 Battery State of Charge Battery Voltage
Number of
items 𝑡 = 34 𝑏
Maximum Possible Circular Triads (𝐶𝑚𝑎𝑥)
𝑎𝑖 (𝑎𝑖 − 𝑏)2 Number of Circular
Triads (𝐶) Internal
Reliability (ζ) 𝑎𝑖 (𝑎𝑖 − 𝑏)2
Number of Circular Triads (𝐶)
Internal Reliability (ζ)
1
16.5 1636.25
8 72.25
12 0.993
12 20.25
274 0.832543927
2 10 42.25 21 20.25
3 9 56.25 13 12.25
4 11 30.25 25 72.25
5 16 0.25 2 210.25
6 18 2.25 17 0.25
7 13 12.25 3 182.25
8 15 2.25 22 30.25
9 14 6.25 8 72.25
10 15 2.25 16 0.25
11 16 0.25 9 56.25
12 17 0.25 20 12.25
13 28 132.3 5 132.25
14 29 156.3 14 6.25
15 30 182.3 4 156.25
16 31 210.3 16 0.25
17 6 110.3 22 30.25
18 4 156.3 29 156.25
19 7 90.25 25 72.25
20 5 132.3 31 210.25
21 2 210.3 6 110.25
22 0 272.3 16 0.25
23 3 182.3 8 72.25
24 1 240.3 19 6.25
25 20 12.25 19 6.25
26 21 20.25 24 56.25
27 22 30.25 17 0.25
28 23 42.25 23 42.25
29 24 56.25 2 210.25
30 25 72.25 22 30.25
31 26 90.25 3 182.25
32 27 110.3 23 42.25
33 32 240.3 32 240.25
34 33 272.3 33 272.25
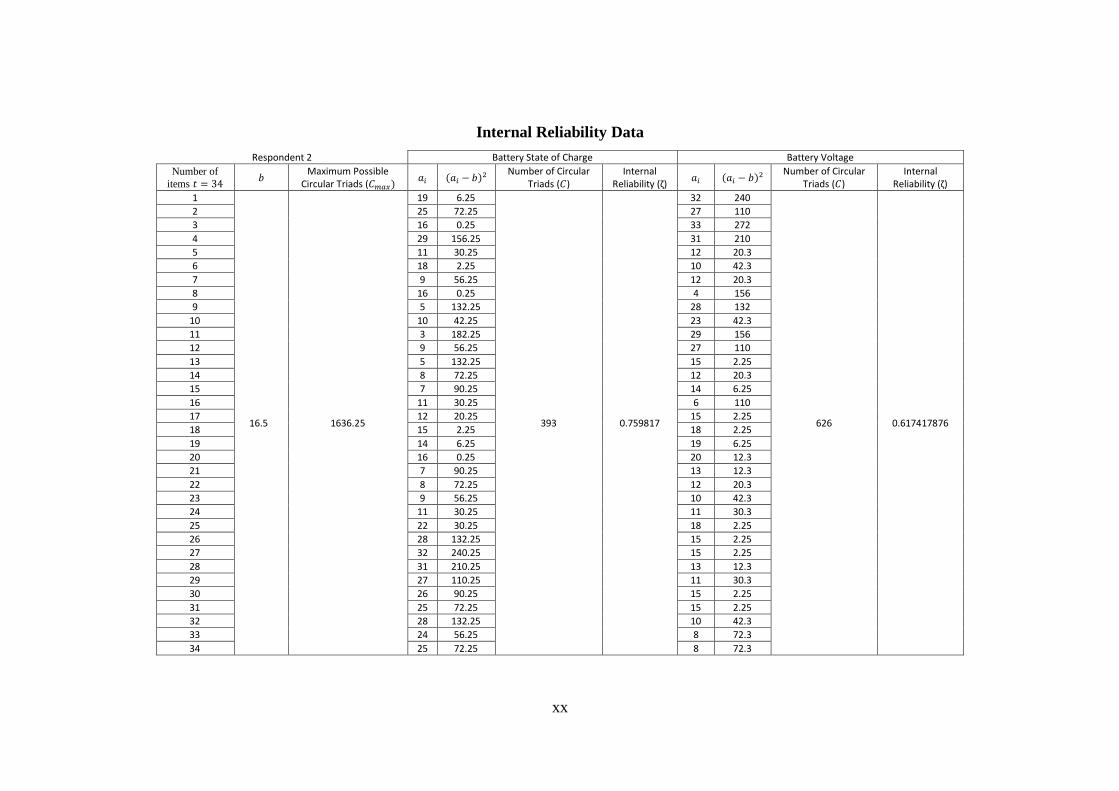
xx
Internal Reliability Data
Respondent 2 Battery State of Charge Battery Voltage
Number of
items 𝑡 = 34 𝑏
Maximum Possible Circular Triads (𝐶𝑚𝑎𝑥)
𝑎𝑖 (𝑎𝑖 − 𝑏)2 Number of Circular
Triads (𝐶) Internal
Reliability (ζ) 𝑎𝑖 (𝑎𝑖 − 𝑏)2
Number of Circular Triads (𝐶)
Internal Reliability (ζ)
1
16.5 1636.25
19 6.25
393 0.759817
32 240
626 0.617417876
2 25 72.25 27 110
3 16 0.25 33 272
4 29 156.25 31 210
5 11 30.25 12 20.3
6 18 2.25 10 42.3
7 9 56.25 12 20.3
8 16 0.25 4 156
9 5 132.25 28 132
10 10 42.25 23 42.3
11 3 182.25 29 156
12 9 56.25 27 110
13 5 132.25 15 2.25
14 8 72.25 12 20.3
15 7 90.25 14 6.25
16 11 30.25 6 110
17 12 20.25 15 2.25
18 15 2.25 18 2.25
19 14 6.25 19 6.25
20 16 0.25 20 12.3
21 7 90.25 13 12.3
22 8 72.25 12 20.3
23 9 56.25 10 42.3
24 11 30.25 11 30.3
25 22 30.25 18 2.25
26 28 132.25 15 2.25
27 32 240.25 15 2.25
28 31 210.25 13 12.3
29 27 110.25 11 30.3
30 26 90.25 15 2.25
31 25 72.25 15 2.25
32 28 132.25 10 42.3
33 24 56.25 8 72.3
34 25 72.25 8 72.3
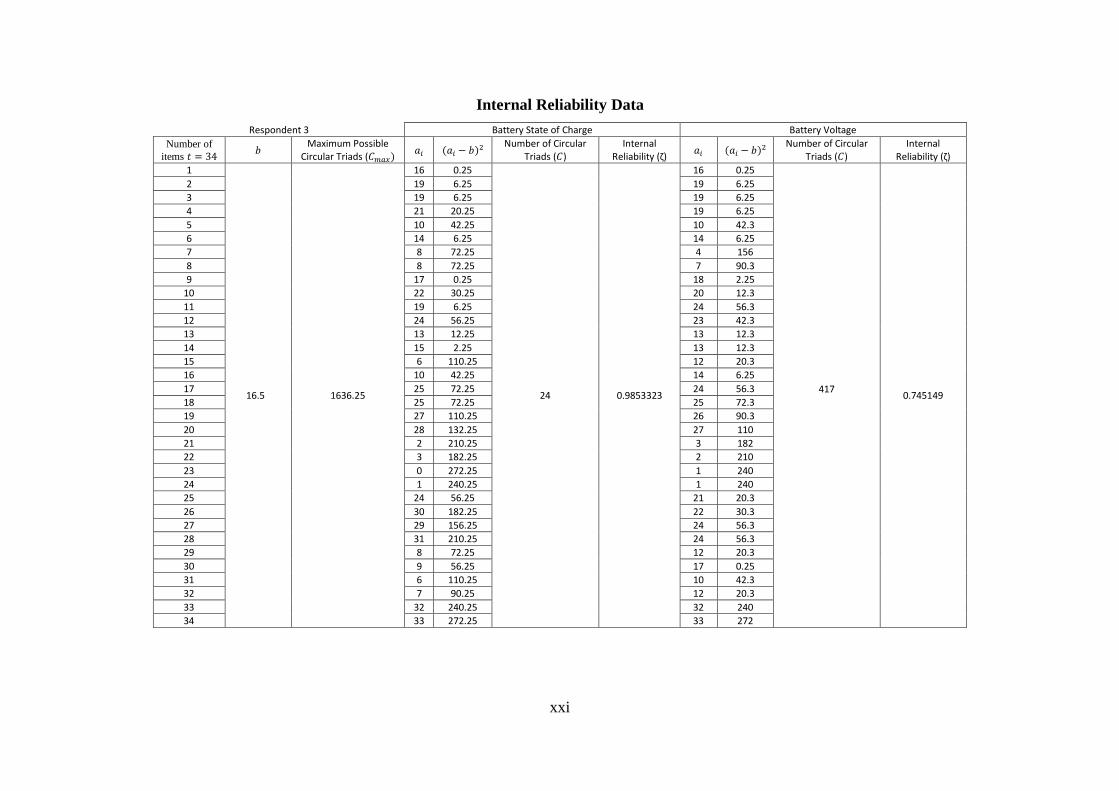
xxi
Internal Reliability Data
Respondent 3 Battery State of Charge Battery Voltage
Number of
items 𝑡 = 34 𝑏
Maximum Possible Circular Triads (𝐶𝑚𝑎𝑥)
𝑎𝑖 (𝑎𝑖 − 𝑏)2 Number of Circular
Triads (𝐶) Internal
Reliability (ζ) 𝑎𝑖 (𝑎𝑖 − 𝑏)2
Number of Circular Triads (𝐶)
Internal Reliability (ζ)
1
16.5 1636.25
16 0.25
24 0.9853323
16 0.25
417
0.745149
2 19 6.25 19 6.25
3 19 6.25 19 6.25
4 21 20.25 19 6.25
5 10 42.25 10 42.3
6 14 6.25 14 6.25
7 8 72.25 4 156
8 8 72.25 7 90.3
9 17 0.25 18 2.25
10 22 30.25 20 12.3
11 19 6.25 24 56.3
12 24 56.25 23 42.3
13 13 12.25 13 12.3
14 15 2.25 13 12.3
15 6 110.25 12 20.3
16 10 42.25 14 6.25
17 25 72.25 24 56.3
18 25 72.25 25 72.3
19 27 110.25 26 90.3
20 28 132.25 27 110
21 2 210.25 3 182
22 3 182.25 2 210
23 0 272.25 1 240
24 1 240.25 1 240
25 24 56.25 21 20.3
26 30 182.25 22 30.3
27 29 156.25 24 56.3
28 31 210.25 24 56.3
29 8 72.25 12 20.3
30 9 56.25 17 0.25
31 6 110.25 10 42.3
32 7 90.25 12 20.3
33 32 240.25 32 240
34 33 272.25 33 272
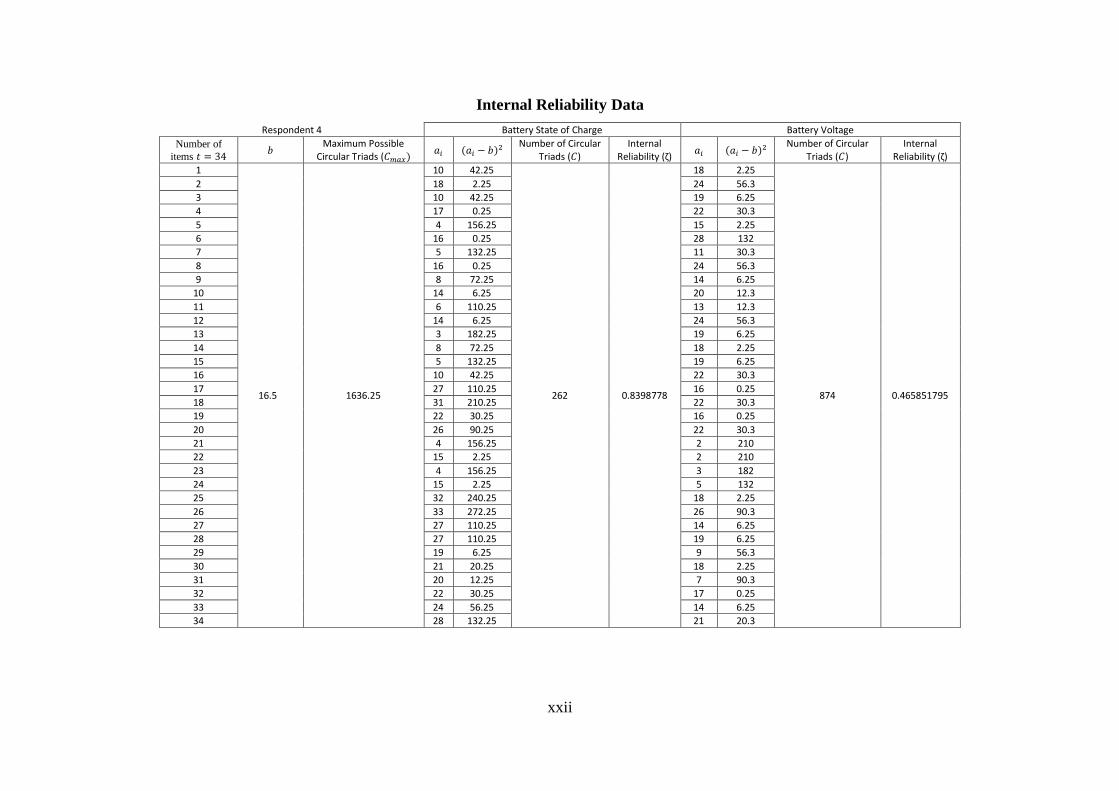
xxii
Internal Reliability Data
Respondent 4 Battery State of Charge Battery Voltage
Number of
items 𝑡 = 34 𝑏
Maximum Possible Circular Triads (𝐶𝑚𝑎𝑥)
𝑎𝑖 (𝑎𝑖 − 𝑏)2 Number of Circular
Triads (𝐶) Internal
Reliability (ζ) 𝑎𝑖 (𝑎𝑖 − 𝑏)2
Number of Circular Triads (𝐶)
Internal Reliability (ζ)
1
16.5 1636.25
10 42.25
262 0.8398778
18 2.25
874 0.465851795
2 18 2.25 24 56.3
3 10 42.25 19 6.25
4 17 0.25 22 30.3
5 4 156.25 15 2.25
6 16 0.25 28 132
7 5 132.25 11 30.3
8 16 0.25 24 56.3
9 8 72.25 14 6.25
10 14 6.25 20 12.3
11 6 110.25 13 12.3
12 14 6.25 24 56.3
13 3 182.25 19 6.25
14 8 72.25 18 2.25
15 5 132.25 19 6.25
16 10 42.25 22 30.3
17 27 110.25 16 0.25
18 31 210.25 22 30.3
19 22 30.25 16 0.25
20 26 90.25 22 30.3
21 4 156.25 2 210
22 15 2.25 2 210
23 4 156.25 3 182
24 15 2.25 5 132
25 32 240.25 18 2.25
26 33 272.25 26 90.3
27 27 110.25 14 6.25
28 27 110.25 19 6.25
29 19 6.25 9 56.3
30 21 20.25 18 2.25
31 20 12.25 7 90.3
32 22 30.25 17 0.25
33 24 56.25 14 6.25
34 28 132.25 21 20.3
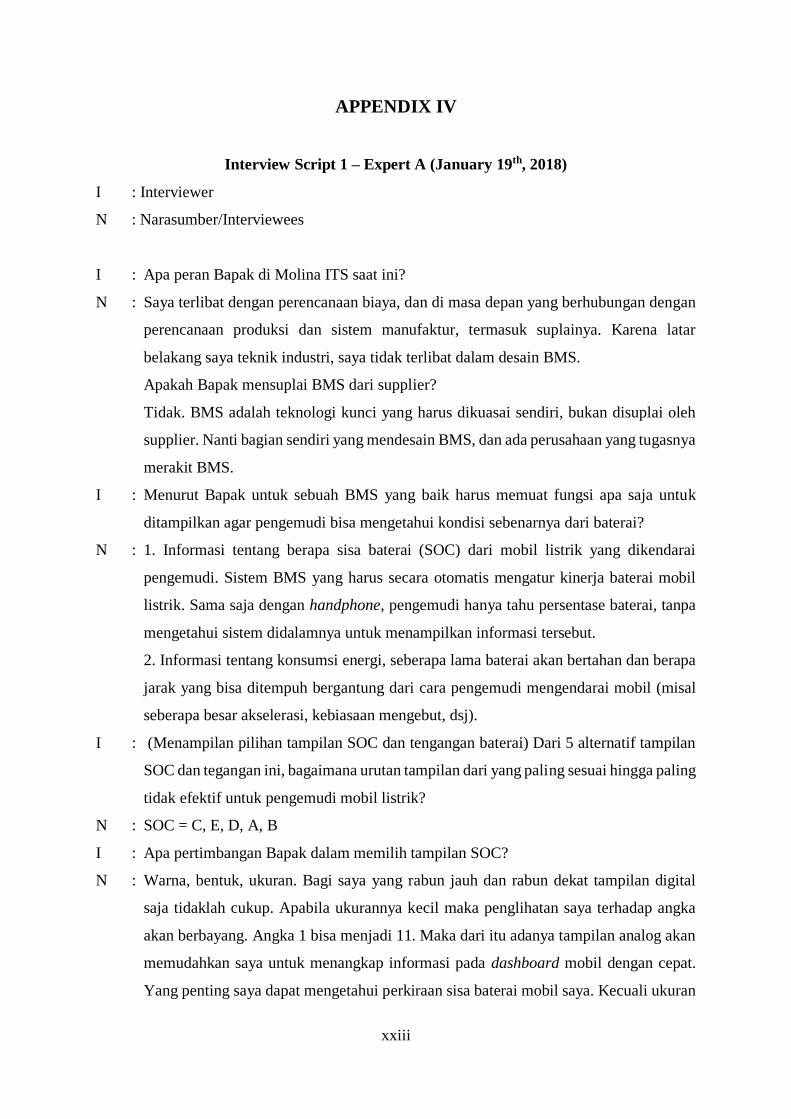
xxiii
APPENDIX IV
Interview Script 1 – Expert A (January 19th, 2018)
I : Interviewer
N : Narasumber/Interviewees
I : Apa peran Bapak di Molina ITS saat ini?
N : Saya terlibat dengan perencanaan biaya, dan di masa depan yang berhubungan dengan
perencanaan produksi dan sistem manufaktur, termasuk suplainya. Karena latar
belakang saya teknik industri, saya tidak terlibat dalam desain BMS.
Apakah Bapak mensuplai BMS dari supplier?
Tidak. BMS adalah teknologi kunci yang harus dikuasai sendiri, bukan disuplai oleh
supplier. Nanti bagian sendiri yang mendesain BMS, dan ada perusahaan yang tugasnya
merakit BMS.
I : Menurut Bapak untuk sebuah BMS yang baik harus memuat fungsi apa saja untuk
ditampilkan agar pengemudi bisa mengetahui kondisi sebenarnya dari baterai?
N : 1. Informasi tentang berapa sisa baterai (SOC) dari mobil listrik yang dikendarai
pengemudi. Sistem BMS yang harus secara otomatis mengatur kinerja baterai mobil
listrik. Sama saja dengan handphone, pengemudi hanya tahu persentase baterai, tanpa
mengetahui sistem didalamnya untuk menampilkan informasi tersebut.
2. Informasi tentang konsumsi energi, seberapa lama baterai akan bertahan dan berapa
jarak yang bisa ditempuh bergantung dari cara pengemudi mengendarai mobil (misal
seberapa besar akselerasi, kebiasaan mengebut, dsj).
I : (Menampilan pilihan tampilan SOC dan tengangan baterai) Dari 5 alternatif tampilan
SOC dan tegangan ini, bagaimana urutan tampilan dari yang paling sesuai hingga paling
tidak efektif untuk pengemudi mobil listrik?
N : SOC = C, E, D, A, B
I : Apa pertimbangan Bapak dalam memilih tampilan SOC?
N : Warna, bentuk, ukuran. Bagi saya yang rabun jauh dan rabun dekat tampilan digital
saja tidaklah cukup. Apabila ukurannya kecil maka penglihatan saya terhadap angka
akan berbayang. Angka 1 bisa menjadi 11. Maka dari itu adanya tampilan analog akan
memudahkan saya untuk menangkap informasi pada dashboard mobil dengan cepat.
Yang penting saya dapat mengetahui perkiraan sisa baterai mobil saya. Kecuali ukuran

xxiv
font pada tampilan digital cukup besar, maka saya tidak akan masalah dengan tampilan
digital. Ukuran panel dashboard pun juga penting karena akan menentukan ukuran
fungsi-fungsi yang ditampilkan di dalamnya. Pemilihan warna dan kontras juga penting
agar saya bisa melihat panel dashboard dengan jelas. Informasi dengan background
gelap dan tulisan yang terang membuat saya lebih sulit dalam melihat informasi
(terutama yang berupa tulisan) dengan jelas ketimbang dengan informasi dengan
background terang dan tulisan gelap.
xxv
Interview Script 2 – Expert B (January 19th, 2018)
I : Interviewer
N : Narasumber/Interviewees
I : Saya mencoba membuat desain tampilan BMS yang cocok untuk pengemudi mobil
listrik. Ada beberapa fungsi yang harus ditampilkan untuk pengemudi. Apa saja fungsi-
fungsi yang harus ditampilkan itu?
N : Pengemudi tidak perlu diperlihatkan semua perameter yang ada pada BMS. Untuk
pengemudi (sebagai end-user) hanya ditampilkan kecepatan, SOC, temperature baterai,
konsumsi energi pada panel dashboard. Kalau ingin melihat semua parameter BMS
secara khusus, misal tegangan dan arus setiap sel baterai, pengemudi bisa melihat
aplikasi khusus BMS secara langsung.
I : Mengapa tegangan dan arus baterai tidak perlu ditampilkan?
N : Karena parameter tersebut sudah tercermin pada tampilan SOC. Kalau untuk
pengemudi cukup indikator yang penting saja.
I : Untuk menampilkan parameter-parameter tersebut, aspek-aspek desain apa saja yang
diperhatikan?
N : Kami sebagai orang mekanik tidak terlalu mengerti dengan unsur-unsur desain. Bagi
kami yang penting adalah menapilkan fungsi tersebut agar orang bisa menegrti.
Terakhir kali kami mencoba mendesain BMS kami dibantu oleh orang-orang DKV
(Desain Komunikasi Visual). Setelah itu kami ada perbaikan desain dari segi warna.
Kami masih memerlukan pengetahuan desain dari segi ergonomi dan seninya.
I : (Showing 5 display alternatives of battery SOC) Bisa tolong Bapak urutkan mana
tampilan SOC dan tengangan baterai yang menurut Bapak dari yang paling mudah
hingga sulit dimengerti oleh pemngemudi mobil listrik?
N : SOC = C, D, E, A, B;
I : Apa pertimbangan Bapak ketika memilih tampilan tersebut?
N : Kalau gambar (analog) lebih enak dilihat, apalagi kalau perubahannya cepat. Kalau
angka tidak enak dilihat ketika nilai yang ditunjukkan berubah dengan cepat. Angka
lebih enak dilihat ssebagai informasi tambahan saja. Tapi kalau SOC agak jarang yang
berbentuk setengah lingkaran seperti ini, biasanya berbentuk bar yang menyerupai
baterai.
I : Mengapa Bapak lebih memilih bentuk setengah lingkaran?
N : Karena ada keterbatasan dari panel dashboard itu sendiri. Kalau setengah lingkaran

xxvi
tidak terlalu memakan space panel dashboard. Yang penting ukurannya disesuaikan
untuk
xxvii
Interview Script 3 – Expert C (January 19th, 2018)
I : Interviewer
N : Narasumber/Interviewees (Agus Mukhlisin, S.T., M.T.)
I : Apa peran Bapak dalam perancangan mobil listrik?
N : Saya mencoba mendesain tampilan BMS yang cocok, mudah dipahami pengemudi agar
dalam berkendara pengemudi tidak kesulitan memahami fungsi BMS yang ditampilkan
pada panel dashboard mobil listrik.
I : Menurut Bapak fungsi apa saja yang harus ditampilkan pada panel dashboard mobil
listrik?
N : SOC, kecepatan, tegangan.
I : Mengapa tegangan perlu ditampilkan bagi pengemudi?
N : Perlunya saat terjadi fail tiba-tiba pada pada sistem BMS ketika mengisi daya baterai
mobil listrik. Tampilan tegangan akan memberitahu pengemudi untuk mematikan
charger secara manual.
I : Apa yang Bapak perhatikan ketika mendesain tampilan BMS untuk pengemudi?
N : Harus jelas untuk end-user, mudah dipahami
I : Bagaimana dengan ukuran dan warna? Apakah ada pertimbangan tertentu?
N : Ya pokoknya ditentukan agar orang-orang bisa melihat dan mengerti dengan mudah.
I : (Menunjukkan pilihan tampilan SOC) Mana tampilan SOC yang
N : SOC = C, E, D, A, B
I : Kenapa tidak memilih yang digital?
N : Menurut saya tampilan digital (untuk SOC) kurang menarik, kalau analog sepertinya
lebih bagus.
I : Kenapa lebih memilih tampilan yang C daripada E?
N : Karena memikirkan space yang tersedia pada panel dashboard. Kalau bentuk setengah
lingkaran akan lebih mudah dan lebih bagus ketika ditata ke dalam panel dashboard.
I : (Menunjukkan pilihan tampilan Voltage) Kalau untuk tegangan, menurut Bapak mana
tampilan yang baik untuk pengemudi?
N : Kalau tegangan saya lebih cenderung ke digital (opsi D, lihat 0) saja daripada analog.
I : Kenapa?
N : Agar lebih jelas informasi yang dijelaskan. Lagipula saat di jalan pengemudi tidak perlu
terlalu memperhatikan tegangan. Pengemudi perlu memperhatikan tegangan saat
melakukan pengisian ulang atau penggantian baterai, dimana kondisi mobil listrik

xxviii
dalam keadaan berhenti.
I : Urutannya setelah itu seperti apa?
N : D, A, C, B, E

BIOGRAPHY
Ninda Lastri Yulia was born in Serang, July 23rd, 1995. She
had lived in 4 different places in Indonesia before pursuing her
bachelor’s degree in Institut Teknologi Sepuluh Nopember, Surabaya.
She is a graduate of SD YPS Singkole, Soroako in 2001, SMP YPS
Singkole, Soroako in 2010, and SMA Pribadi Bilingual School
Bandung in 2013.
She enrolled Industrial Engineering Department of Institut
Teknologi Sepuluh Nopember, Surabaya in 2013. During her campus
life, she was active in organizational and committee activities. In her first year she took part as
member of ITS Student Choir organization and Smart and Fun Area committee in ITS EXPO
2014. She was also active being a teacher volunteer for HMTI Mengajar, a weekly social
activity held by Industrial Engineering Student Association. Her sophomore year was occupied
by continuing her membership in ITS Student Choir organization and got a role as coordinator
of Wahana Budaya in ITS EXPO 2015. In the same year, she also took a role as Steering
Committee of HMTI Mengajar and Steering Committee of Industrial Engineering Games (IE
Games) 10th edition. Her college life was also fulfilled by some international exposures. She
joined a volunteering program abroad named “Sawasdee Thailand Project” held by AIESEC
in Thailand for 1.5 months. She was teaching English for elementary school students in rural
area of Nakhon Pathom Province.
Not only volunteering abroad, Ninda also participated as a volunteer in ITS
International Office. She was responsible in Workshop (now Internationalization and
Development) Division. Her role was spreading internationalization vibe throughout the ITS
for both students and academic staff. She took part in arranging student sessions, workshops,
and trainings for students regarding global competencies. In ITS International Office she got a
lot experience and got to enhance her soft skill. Her soft skills have sharpened through her
leadership training, organizational and intercultural experiences.
Last year in university, she was focus on her final project which titled “Designing
Dynamic Visualization of Battery Management System for an Electric Vehicle”. This final
project included in Cognitive Ergonomics field. In the future, she has interest in cognitive
ergonomics, human resources management, and design. She wants to pursue international
career and contribute to the society. In leisure time, she loves singing, drawing, and reading
comic. For any inquiries, she can be reached through email: [email protected]