Comando tstsline para Stata
7
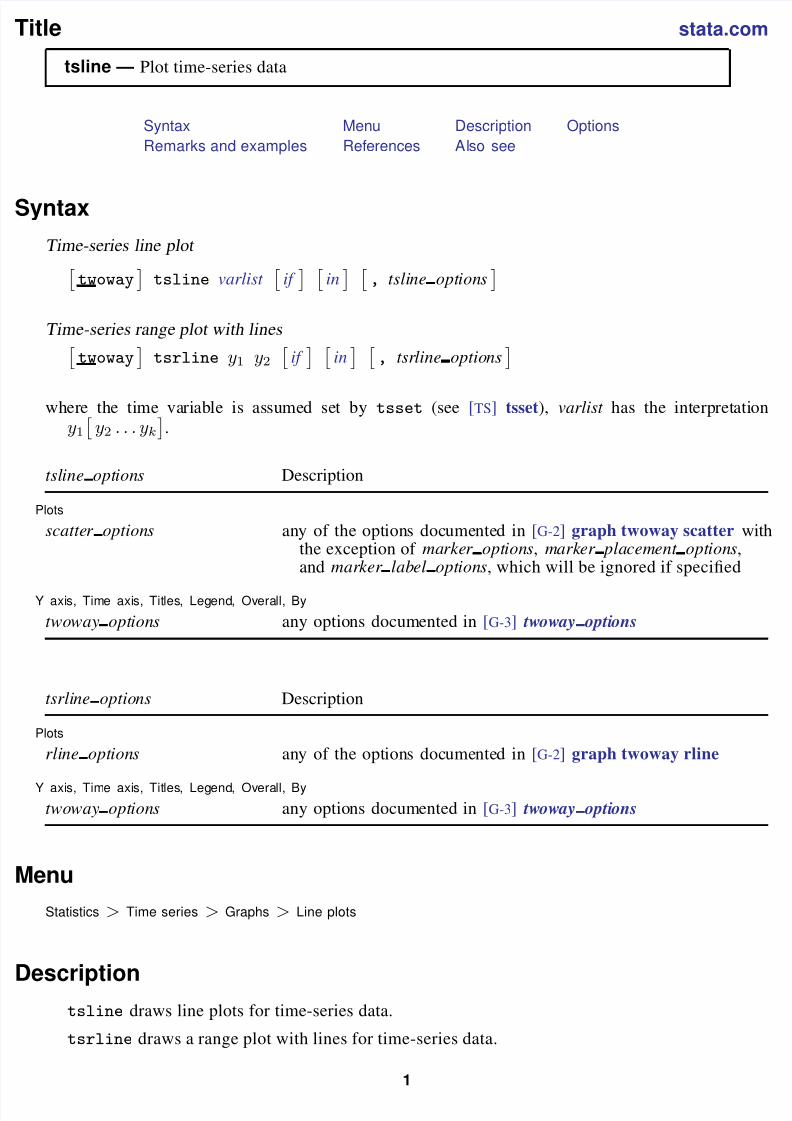
Title stata.com tsline — Plot time-series data Syntax Menu Description Options Remarks and examples References Al so see Syntax Time-series line plot twoway tsline varlist if in , tsli ne opt ions Time-series range plot with lines twoway tsrline y 1 y 2 if in , tsr line optio ns where the ti me va ri able is assume d set by tsset (see [TS] tsset), varlist has the int erpret ati on y 1 y 2 ...y k . tsl ine opt ions Description Plots scatter option s any of the opt ions doc ume nted in [G-2] graph twoway scatter with the exception of marke r opt ions, mark er placement opt ions, and mar ker lab el opt ions, which will be ignored if specified Y axis, Time axis, Titles, Leg end, Ov era ll, By twoway opt ions any optio ns documented in [G-3] tw oway opti ons tsrli ne optio ns Description Plots rli ne option s any of the options doc ume nted in [G-2] graph twoway rline Y axi s, Time axi s, Tit les , Leg end , Ov era ll, By twoway opt ions any optio ns documented in [G-3] tw oway opti ons Menu Statistics > Time series > Graphs > Line plots Description tsline draws line plots for time-series data. tsrline draws a range plot with lines for time-series data. 1
-
Upload
josselyngodoy -
Category
Documents
-
view
230 -
download
0
Transcript of Comando tstsline para Stata
7/23/2019 Comando tstsline para Stata
http://slidepdf.com/reader/full/comando-tstsline-para-stata 1/6
Title stata.com
tsline — Plot time-series data
Syntax Menu Description Options
Remarks and examples References Also see
Syntax
Time-series line plot
twoway
tsline varlist
if
in
, tsline options
Time-series range plot with lines
twoway
tsrline y1 y2
if
in
, tsrline options
where the time variable is assumed set by tsset (see [TS] tsset), varlist has the interpretation
y1y2 . . . yk
.
tsline options Description
Plots
scatter options any of the options documented in [G-2] graph twoway scatter withthe exception of marker options, marker placement options,and marker label options, which will be ignored if specified
Y axis, Time axis, Titles, Legend, Overall, By
twoway options any options documented in [G-3] twoway options
tsrline options Description
Plots
rline options any of the options documented in [G-2] graph twoway rline
Y axis, Time axis, Titles, Legend, Overall, By
twoway options any options documented in [G-3] twoway options
Menu
Statistics > Time series > Graphs > Line plots
Descriptiontsline draws line plots for time-series data.
tsrline draws a range plot with lines for time-series data.
1
7/23/2019 Comando tstsline para Stata
http://slidepdf.com/reader/full/comando-tstsline-para-stata 2/6
2 tsline — Plot time-series data
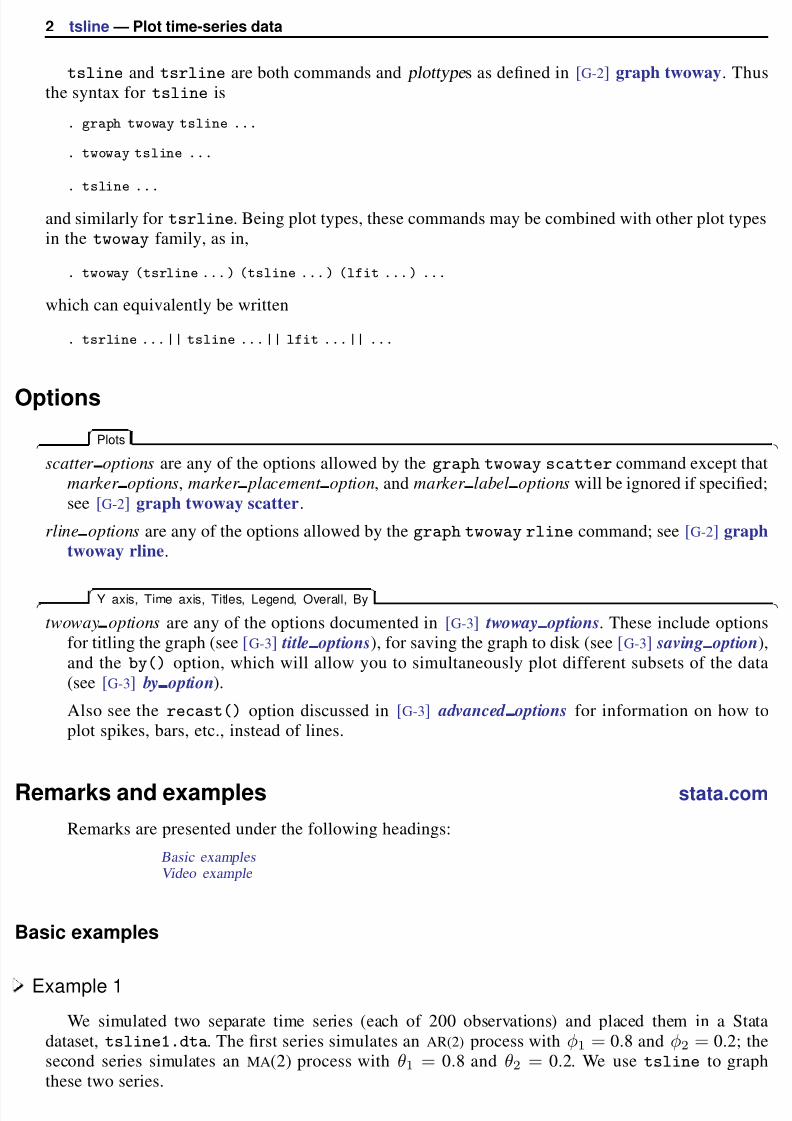
tsline and tsrline are both commands and plottype s as defined in [G-2] graph twoway. Thus
the syntax for tsline is
. graph twoway tsline ...
. twoway tsline ...
. tsline ...
and similarly for tsrline. Being plot types, these commands may be combined with other plot types
in the twoway family, as in,
. twoway (tsrline . . . ) (tsline . . . ) (lfit . . . ) . . .
which can equivalently be written
. tsrline . . . || tsline . . . || lfit . . . || . . .
Options
Plots
scatter options are any of the options allowed by the graph twoway scatter command except that
marker options, marker placement option, and marker label options will be ignored if specified;
see [G-2] graph twoway scatter.
rline options are any of the options allowed by the graph twoway rline command; see [G-2] graph
twoway rline.
Y axis, Time axis, Titles, Legend, Overall, By
twoway options are any of the options documented in [G-3] twoway options. These include options
for titling the graph (see [G-3] title options), for saving the graph to disk (see [G-3] saving option),
and the by() option, which will allow you to simultaneously plot different subsets of the data
(see [G-3] by option).
Also see the recast() option discussed in [G-3] advanced options for information on how to
plot spikes, bars, etc., instead of lines.
Remarks and examples stata.com
Remarks are presented under the following headings:
Basic examplesVideo example
Basic examples
Example 1
We simulated two separate time series (each of 200 observations) and placed them in a Stata
dataset, tsline1.dta. The first series simulates an AR(2) process with φ1 = 0.8 and φ2 = 0.2; the
second series simulates an MA(2) process with θ1 = 0.8 and θ2 = 0.2. We use tsline to graph
these two series.
7/23/2019 Comando tstsline para Stata
http://slidepdf.com/reader/full/comando-tstsline-para-stata 3/6
tsline — Plot time-series data 3
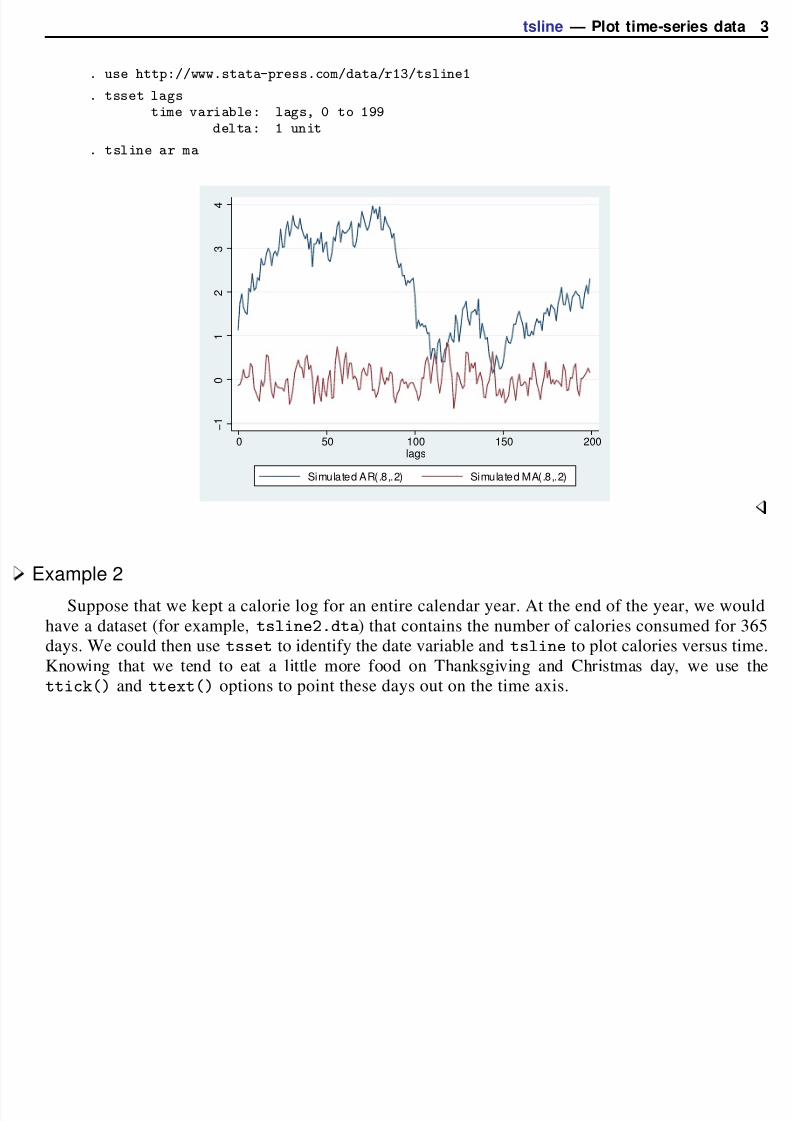
. use http://www.stata-press.com/data/r13/tsline1
. tsset lagstime variable: lags, 0 to 199
delta: 1 unit
. tsline ar ma
− 1
0
1
2
3
4
0 50 100 150 200lags
Simulated AR(.8,.2) Simulated MA(.8,.2)
Example 2
Suppose that we kept a calorie log for an entire calendar year. At the end of the year, we would
have a dataset (for example, tsline2.dta) that contains the number of calories consumed for 365
days. We could then use tsset to identify the date variable and tsline to plot calories versus time.
Knowing that we tend to eat a little more food on Thanksgiving and Christmas day, we use the
ttick() and ttext() options to point these days out on the time axis.

7/23/2019 Comando tstsline para Stata
http://slidepdf.com/reader/full/comando-tstsline-para-stata 4/6
4 tsline — Plot time-series data
. use http://www.stata-press.com/data/r13/tsline2
. tsset daytime variable: day, 01jan2002 to 31dec2002
delta: 1 day
. tsline calories, ttick(28nov2002 25dec2002, tpos(in))> ttext(3470 28nov2002 "thanks" 3470 25dec2002 "x-mas", orient(vert))
t h a n k s
x − m a s
3 4 0 0
3 6 0 0
3 8 0 0
4 0 0 0
4 2 0 0
4 4 0 0
C a l o r i e s c o n s u m e d
01jan2002 01apr2002 01jul2002 01oct2002 01jan2003Date
We were uncertain of the exact values we logged, so we also gave a range for each day. Here is
a plot of the summer months.
. tsrline lcalories ucalories if tin(1may2002,31aug2002) || tsline cal ||> if tin(1may2002,31aug2002), ytitle(Calories)
3 3 0 0
3 4 0 0
3 5 0 0
3 6 0 0
3 7 0 0
3 8 0 0
C
a l o r i e s
01may2002 01jun2002 01jul2002 01aug2002 01sep2002Date
Calorie range Calories consumed
Options associated with the time axis allow dates (and times) to be specified in place of numeric
date (and time) values. For instance, we used
ttick(28nov2002 25dec2002, tpos(in))
to place tick marks at the specified dates. This works similarly for tlabel, tmlabel, and tmtick.
7/23/2019 Comando tstsline para Stata
http://slidepdf.com/reader/full/comando-tstsline-para-stata 5/6
tsline — Plot time-series data 5
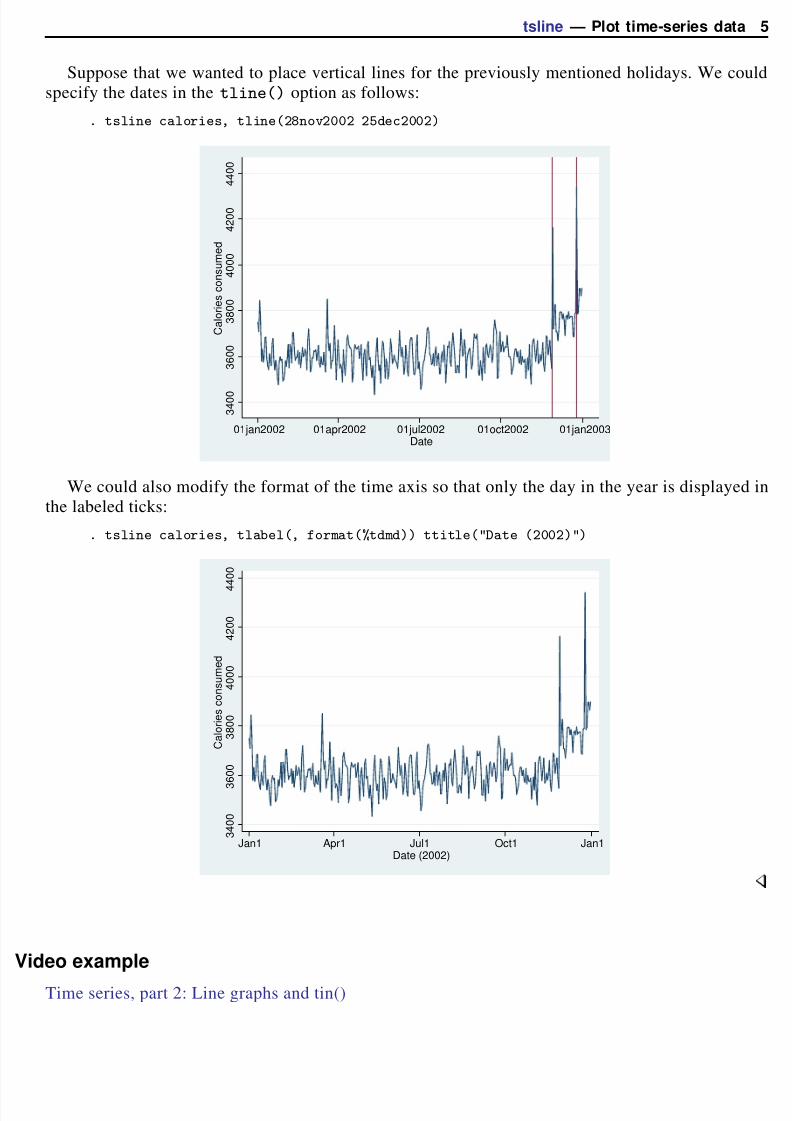
Suppose that we wanted to place vertical lines for the previously mentioned holidays. We could
specify the dates in the tline() option as follows:
. tsline calories, tline(28nov2002 25dec2002)
3 4 0 0
3 6 0 0
3 8 0 0
4 0 0 0
4 2 0 0
4 4 0 0
C a l o r i e s c o n s u m e d
01jan2002 01apr2002 01jul2002 01oct2002 01jan2003Date
We could also modify the format of the time axis so that only the day in the year is displayed in
the labeled ticks:
. tsline calories, tlabel(, format(%tdmd)) ttitle("Date (2002)")
3 4 0 0
3
6 0 0
3 8 0 0
4 0 0 0
4 2 0 0
4
4 0 0
C a l o r i e s c o n s u m e d
Jan1 Apr1 Jul1 Oct1 Jan1Date (2002)
Video example
Time series, part 2: Line graphs and tin()
7/23/2019 Comando tstsline para Stata
http://slidepdf.com/reader/full/comando-tstsline-para-stata 6/6
6 tsline — Plot time-series data
ReferencesCox, N. J. 2009a. Speaking Stata: Graphs for all seasons. Stata Journal 6: 397–419.
. 2009b. Stata tip 76: Separating seasonal time series. Stata Journal 9: 321–326.
. 2012. Speaking Stata: Transforming the time axis. Stata Journal 12: 332–341.
Also see
[TS] tsset — Declare data to be time-series data
[G-2] graph twoway — Twoway graphs
[XT] xtline — Panel-data line plots