BAB 11 PDRB 2007 finish - jabarprov.go.id · INDUSTRI PENGOLAHAN LISTRIK, GAS dan AIR BERSIH...
30
REGIONAL INCOME Jawa Barat Dalam Angka 2007 503 Pertumbuhan ekonomi Indonesia tahun 2006 semakin membaik dibanding tahun 2005. Berdasarkan perhitungan PDRB atas dasar harga harga konstan 2000, laju pertumbuhan ekonomi Jawa Barat pada tahun 2006 sebesar 6,01 persen sedangkan pada tahun 2005 sebesar 5,62 persen. Dari sembilan sektor yang ada pada PDRB, delapan sektor menghasilkan pertumbuhan yang positif. Sektor yang menghasilkan pertumbuhan ekonomi tertinggi adalah sektor Jasa-Jasa, kemudian sektor Pengangkutan dan Komunikasi. Masing-masing 8,51 persen, 8,20 persen dan 7,88 persen. Sementara itu sektor dengan laju pertumbuhan mengalami kenaikan pada tahun ini adalah sektor Perdagangan, sektor Pengangkutan & Komunikasi, dan Jasa-Jasa sementara sektor- sektor yang lain mengalami penurunan. Kontribusi atau peranan nilai PDRB tertinggi dicapai oleh sektor Industri Pengolahan, Perdagangan Hotel dan Restoran dan sektor Pertanian ; masing –masing sebesar 47,76 persen, 20,48 persen dan 11,74 persen. Sedangkan kontribusi paling kecil diberikan oleh sektor Keuangan, Persewaan dan Jasa Perusahaan. Nilai PDRB Jawa Barat tahun 2006 atas dasar harga berlaku sebesar 473 556 757,60 juta rupiah, dan tanpa migas sebesar 448 619 978,44 juta rupiah. Sedangkan nilai PDRB Jawa Barat tahun 2006 atas dasar harga konstan sebesar 257 535 975,14 juta rupiah dan tanpa migas sebesar 248 810 992,86 juta rupiah. For the year 2006, growth of Jawa Barat economy showed a better performance than 2005. The growth rate of gross regional domestic product (GRDP) based on Constant 2000 market prices for Jawa Barat in 2006 was 6.01 percent, while growth rate in 2005 was 5.62 percent. From nine sector of economy, which composes GRDP, eight sectors produced a positive growth. The highest growth was reached by Service, Transport sector and Communication sector . The percentages were 8.51 percent, 8.20 percent and 7.88 percent consecutively. In the mean time, A smaller number of increase Trade, Transport sector and Communication, Service sector, while other sectors decreased. The highest contribution growth rate of GDRP was reached by Manufacturing Industry sector, Trade, Hotel & Restaurant and Agriculture sector. The percentages were 47.76 percent, 20.48 percent, 11.74 percent respectively. Meanwhile, the smallest contribution was reached by Finance, Dwelling and Business service. GRDP of Jawa Barat at current prices in 2006, reached 473 556 757,60 million rupiahs, while the value of non oil GRDP was 448 619 978,44 million rupiahs. Furthermore, GRDP of Jawa Barat at constant prices in 2006, reached 257 535 975,14 million rupiahs, while the value of non oil GRDP was 248 810 992,86 million rupiahs
Transcript of BAB 11 PDRB 2007 finish - jabarprov.go.id · INDUSTRI PENGOLAHAN LISTRIK, GAS dan AIR BERSIH...
REGIONAL INCOME
Jawa Barat Dalam Angka 2007 503
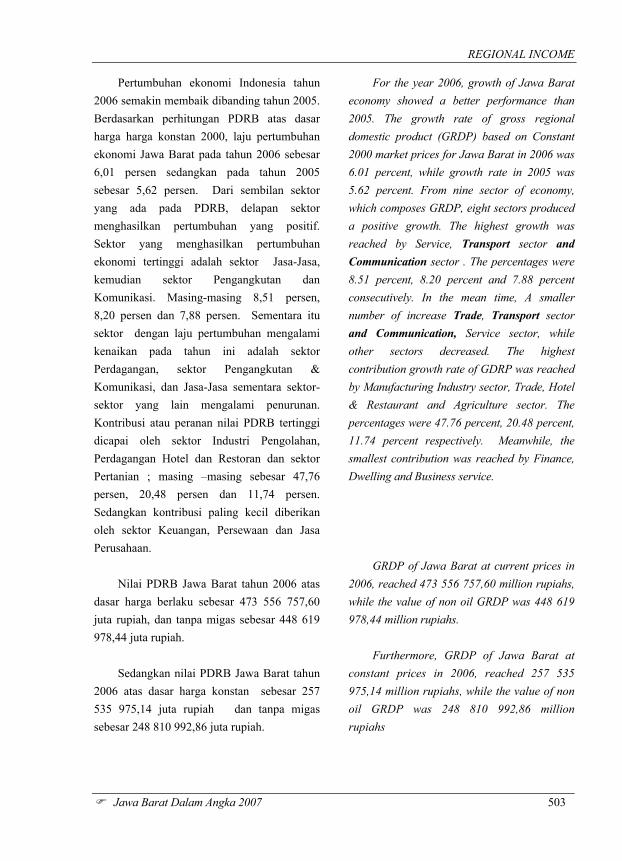
Pertumbuhan ekonomi Indonesia tahun 2006 semakin membaik dibanding tahun 2005. Berdasarkan perhitungan PDRB atas dasar harga harga konstan 2000, laju pertumbuhan ekonomi Jawa Barat pada tahun 2006 sebesar 6,01 persen sedangkan pada tahun 2005 sebesar 5,62 persen. Dari sembilan sektor yang ada pada PDRB, delapan sektor menghasilkan pertumbuhan yang positif. Sektor yang menghasilkan pertumbuhan ekonomi tertinggi adalah sektor Jasa-Jasa, kemudian sektor Pengangkutan dan Komunikasi. Masing-masing 8,51 persen, 8,20 persen dan 7,88 persen. Sementara itu sektor dengan laju pertumbuhan mengalami kenaikan pada tahun ini adalah sektor Perdagangan, sektor Pengangkutan & Komunikasi, dan Jasa-Jasa sementara sektor-sektor yang lain mengalami penurunan. Kontribusi atau peranan nilai PDRB tertinggi dicapai oleh sektor Industri Pengolahan, Perdagangan Hotel dan Restoran dan sektor Pertanian ; masing –masing sebesar 47,76 persen, 20,48 persen dan 11,74 persen. Sedangkan kontribusi paling kecil diberikan oleh sektor Keuangan, Persewaan dan Jasa Perusahaan. Nilai PDRB Jawa Barat tahun 2006 atas dasar harga berlaku sebesar 473 556 757,60 juta rupiah, dan tanpa migas sebesar 448 619 978,44 juta rupiah. Sedangkan nilai PDRB Jawa Barat tahun 2006 atas dasar harga konstan sebesar 257 535 975,14 juta rupiah dan tanpa migas sebesar 248 810 992,86 juta rupiah.
For the year 2006, growth of Jawa Barat economy showed a better performance than 2005. The growth rate of gross regional domestic product (GRDP) based on Constant 2000 market prices for Jawa Barat in 2006 was 6.01 percent, while growth rate in 2005 was 5.62 percent. From nine sector of economy, which composes GRDP, eight sectors produced a positive growth. The highest growth was reached by Service, Transport sector and Communication sector . The percentages were 8.51 percent, 8.20 percent and 7.88 percent consecutively. In the mean time, A smaller number of increase Trade, Transport sector and Communication, Service sector, while other sectors decreased. The highest contribution growth rate of GDRP was reached by Manufacturing Industry sector, Trade, Hotel & Restaurant and Agriculture sector. The percentages were 47.76 percent, 20.48 percent, 11.74 percent respectively. Meanwhile, the smallest contribution was reached by Finance, Dwelling and Business service. GRDP of Jawa Barat at current prices in 2006, reached 473 556 757,60 million rupiahs, while the value of non oil GRDP was 448 619 978,44 million rupiahs. Furthermore, GRDP of Jawa Barat at constant prices in 2006, reached 257 535 975,14 million rupiahs, while the value of non oil GRDP was 248 810 992,86 million rupiahs

PENDAPATAN REGIONAL
504 Jawa Barat Dalam Angka 2007
Untuk PDRB per kapita atas dasar harga berlaku pada tahun 2006 mencapai nilai 11 112 163,01 rupiah, dimana jumlah penduduk pertengahan tahun tersebut sebesar 40 371 976 jiwa. Sementara pada tahun 2005 Nilai PDRB per kapita hanya mencapai 9 374 055,09 rupiah, dengan jumlah penduduk pertengahan tahun 39 547 220 jiwa. Dengan kata lain pada tahun ini mengalami kenaikan sebesar 18,54 persen.
GRDP per capita at current prices in 2006, reached 11 112 163,01 rupiahs with population at Mid-Year 40 371 976 person. GRDP per capita at current prices in 2005 reached 9 374 055,09 rupiahs with population at Mid-Year 39 547 220 person. In other words, there is an increase for 18.54 percent.

REGIONAL INCOME
Jawa Barat Dalam Angka 2007 505
Grafik 11.1/Figure 11.1
Distribusi PDRB Jawa Barat Atas Dasar Harga Berlaku Menurut Lapangan Usaha Dengan Minyak dan Gas Bumi
Distribution of PDRB of Jawa Barat at Current Market by Industrial Origin including Oil and Natural Gas
2006
11%3%
45%3%3%
9%
6%3% 7%
PERTANIAN
PERTAM BANGAN dan PENGGALIAN
INDUSTRI PENGOLAHAN
LISTRIK, GAS dan AIR BERSIH
BANGUNAN/KONSTRUKSI
PERDAGANGAN, HOTEL danRESTORAN/
PENGANGKUTAN danKOM UNIKASI
KEUANGAN, PERSEWAAN dan JASA
JASA – JASA
0
5
10
15
20
25
30
35
40
45
Grafik 11.2/ Figure 11.2Laju Pertumbuhan PDRB Jawa Barat Menurut Lapangan Usaha
Growth Rate of Jawa Barat by Industrial Origin2005 - 2006
2 0 0 5 1 3 . 6 5 2 9 . 8 3 3 2 . 7 1 6 . 1 9 3 5 . 0 5 4 0 . 5 6 2 9 . 4 1 3 . 5 8 1 4 . 1 8
2 0 0 6 1 3 . 4 7 . 4 8 2 3 . 7 9 1 2 . 7 2 5 . 2 9 2 3 . 7 3 4 . 3 7 8 . 1 9 2 1 . 1 4
P E R T A N I
A N
P E R T A M B
A N G A N I N D U ST R I
L I S T R I K ,
G A S d a n
A I R
K O N S T R U
K SI
P E R D A G A
N G A N
P E N G A N G
K U T A N
K E U A N G A
N
J A S A –
J A S A
REGIONAL INCOME
Jawa Barat Dalam Angka 2007 507
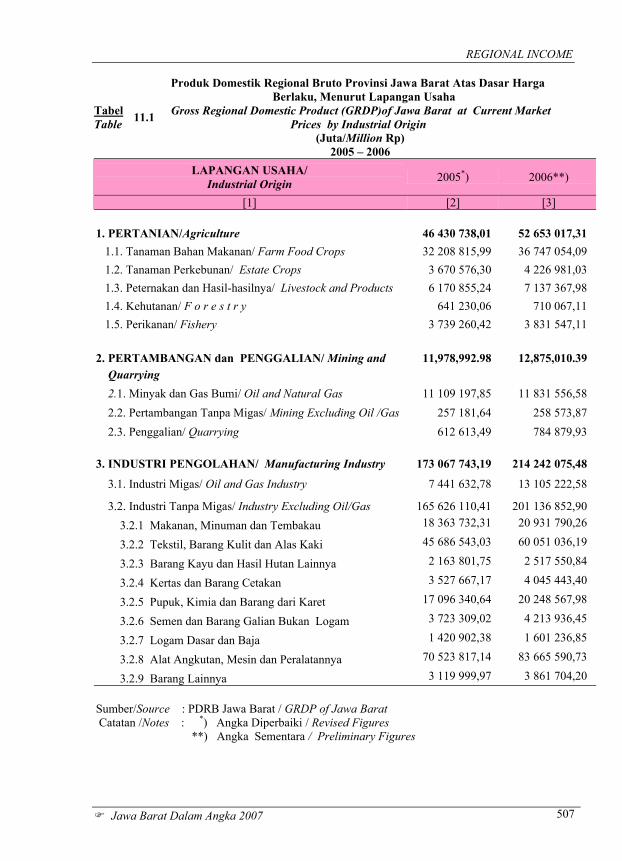
Tabel Table 11.1
Produk Domestik Regional Bruto Provinsi Jawa Barat Atas Dasar Harga Berlaku, Menurut Lapangan Usaha Gross Regional Domestic Product (GRDP)of Jawa Barat at Current Market Prices by Industrial Origin
(Juta/Million Rp) 2005 – 2006
LAPANGAN USAHA/ Industrial Origin 2005*) 2006**)
[1] [2] [3]
1. PERTANIAN/Agriculture 46 430 738,01 52 653 017,31 1.1. Tanaman Bahan Makanan/ Farm Food Crops 32 208 815,99 36 747 054,09 1.2. Tanaman Perkebunan/ Estate Crops 3 670 576,30 4 226 981,03 1.3. Peternakan dan Hasil-hasilnya/ Livestock and Products 6 170 855,24 7 137 367,98 1.4. Kehutanan/ F o r e s t r y 641 230,06 710 067,11 1.5. Perikanan/ Fishery 3 739 260,42 3 831 547,11
2. PERTAMBANGAN dan PENGGALIAN/ Mining and 11,978,992.98 12,875,010.39 Quarrying 2.1. Minyak dan Gas Bumi/ Oil and Natural Gas 11 109 197,85 11 831 556,58 2.2. Pertambangan Tanpa Migas/ Mining Excluding Oil /Gas 257 181,64 258 573,87 2.3. Penggalian/ Quarrying 612 613,49 784 879,93
3. INDUSTRI PENGOLAHAN/ Manufacturing Industry 173 067 743,19 214 242 075,48
3.1. Industri Migas/ Oil and Gas Industry 7 441 632,78 13 105 222,58
3.2. Industri Tanpa Migas/ Industry Excluding Oil/Gas 165 626 110,41 201 136 852,90 3.2.1 Makanan, Minuman dan Tembakau 18 363 732,31 20 931 790,26
3.2.2 Tekstil, Barang Kulit dan Alas Kaki 45 686 543,03 60 051 036,19
3.2.3 Barang Kayu dan Hasil Hutan Lainnya 2 163 801,75 2 517 550,84
3.2.4 Kertas dan Barang Cetakan 3 527 667,17 4 045 443,40
3.2.5 Pupuk, Kimia dan Barang dari Karet 17 096 340,64 20 248 567,98
3.2.6 Semen dan Barang Galian Bukan Logam 3 723 309,02 4 213 936,45
3.2.7 Logam Dasar dan Baja 1 420 902,38 1 601 236,85
3.2.8 Alat Angkutan, Mesin dan Peralatannya 70 523 817,14 83 665 590,73
3.2.9 Barang Lainnya 3 119 999,97 3 861 704,20 Sumber/Source : PDRB Jawa Barat / GRDP of Jawa Barat Catatan /Notes : *) Angka Diperbaiki / Revised Figures **) Angka Sementara / Preliminary Figures

PENDAPATAN REGIONAL
Jawa Barat Dalam Angka 2007 508
Tabel Table 11.1 Lanjutan
[Continued]
LAPANGAN USAHA Industrial Origin 2005 *) 2006**)
[1] [2] [3]
4. LISTRIK, GAS dan AIR BERSIH/ 11 258 763,41 12 689 169,02 Electricity, Gas and Water Supply 4.1. L i s t r i k/ Electricity 10 061 080,85 11 303 475,15 4.2. Gas Kota/ G a s 734 475,37 899 361,15 4.3. Air Bersih/ Water Supply 463 207,20 486 332,72 5. BANGUNAN/KONSTRUKSI / Construction 11 452 923,97 14 348 875,33 6. PERDAGANGAN, HOTEL dan RESTORAN/ 74 280 672,53 91 884 707,67 Trade, Hotel and Retaurant 6.1. Perdagangan Besar dan Eceran/ Wholesale and 62 830 907,55 79 169 692,20 Retail Trade 6.2. H o t e l/ H o t e l 1 633 103,72 1 751 039,33 6.3. R e s t o r a n/Restaurant 9 816 661,26 10 963 976,13 7. PENGANGKUTAN dan KOMUNIKASI/ 20 712 347,68 27 831 310,56 Transport and Communication 7.1 Pengangkutan/ Transport 17 318 269,38 23 813 418,46 7.1.1 Angkutan Rel/ Railway Transport 457 747,79 440 291 29 7.1.2 Angkutan Jalan Raya/ Road Transport 14 870 339,94 21 086 158 36 7.1.3 Angkutan Laut/ Sea Transport 403 671,35 433 315.26 7.1.4 Angkutan Sungai dan Penyeberangan/ River and 1 109,78 1 160,07 Ferry Transport 738 052,72 7.1.5 Angkutan Udara/ Air Transport 595 751,34 738 052,72
7.1.6 Jasa Penunjang Angkutan/ Services Allied to Transport 989 649,17 1 114 440,77 7.2 Komunikasi/ Communication 3 394 078,31 4 017 892,10 Sumber/Source : PDRB Jawa Barat / GRDP of Jawa Barat Catatan /Notes : *) Angka Diperbaiki / Revised Figures **) Angka Sementara / Preliminary Figures

REGIONAL INCOME
Jawa Barat Dalam Angka 2007 509
Tabel Table 11.1 Lanjutan
[Continued]
LAPANGAN USAHA Industrial Origin 2005 *) 2006**)
[1] [2] [3]
8. KEUANGAN, PERSEWAAN dan JASA PERUSAHAAN/ Finance, Dwelling and 11,789,582,84 12,754,933,45
Business Service 8.1. B a n k / Bank 3 480 541,00 3 450 310,00
8.2. Lembaga Keuangan Lainnya/ Other Financial 1 141 053,51 1 789 239.56 Intermediaries
8.3. Sewa Bangunan/ Ownership of Dwellings 5 439 451,66 5 729 484,20
8.4. Jasa Perusahaan/ Business Services 1 728 536,67 1 785 899,69 9. JASA – JASA/ Service 28 296 884,85 34 277 658,39
1. Pemerintahan Umum / Public Services 19 140 668,35 21 890 022,68
2. S w a s t a / Private Services 9 156 216,50 12 387 635,71
9.2.1.Sosial Kemasyarakatan/ Social and 1 728 502,42 1 946 790,00 Community Services
9.2.2. Hiburan dan Rekreasi/ Entertainment and 7 206 699,59 10 190 492,41
Recreation
9.2.3.Perorangan dan Rumah Tangga/ Personal 7 206 699,59 10 190 492,41 and Household
PDRB Dengan Minyak dan Gas Bumi / GRDP Including Oil and Natural Gas 389 268 649,47 473 556 757,60
PDRB Tanpa Minyak dan Gas Bumi / GRDP Excluding Oil and Natural Gas 370 717 818,84 448 619 978.44
Sumber/Source : PDRB Jawa Barat / GRDP of Jawa Barat Catatan /Notes : *) Angka Diperbaiki / Revised Figures **) Angka Sementara / Preliminary Figures
PENDAPATAN REGIONAL
Jawa Barat Dalam Angka 2007 510
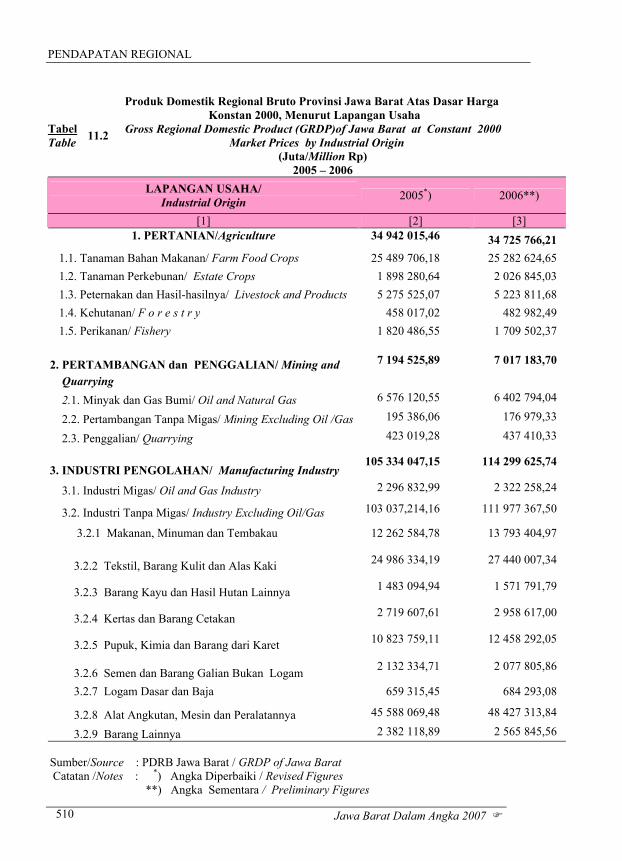
Tabel Table 11.2
Produk Domestik Regional Bruto Provinsi Jawa Barat Atas Dasar Harga Konstan 2000, Menurut Lapangan Usaha Gross Regional Domestic Product (GRDP)of Jawa Barat at Constant 2000 Market Prices by Industrial Origin
(Juta/Million Rp) 2005 – 2006
LAPANGAN USAHA/ Industrial Origin 2005*) 2006**)
[1] [2] [3] 1. PERTANIAN/Agriculture 34 942 015,46 34 725 766,21
1.1. Tanaman Bahan Makanan/ Farm Food Crops 25 489 706,18 25 282 624,65 1.2. Tanaman Perkebunan/ Estate Crops 1 898 280,64 2 026 845,03 1.3. Peternakan dan Hasil-hasilnya/ Livestock and Products 5 275 525,07 5 223 811,68 1.4. Kehutanan/ F o r e s t r y 458 017,02 482 982,49 1.5. Perikanan/ Fishery 1 820 486,55 1 709 502,37
2. PERTAMBANGAN dan PENGGALIAN/ Mining and 7 194 525,89 7 017 183,70
Quarrying
2.1. Minyak dan Gas Bumi/ Oil and Natural Gas 6 576 120,55 6 402 794,04
2.2. Pertambangan Tanpa Migas/ Mining Excluding Oil /Gas 195 386,06 176 979,33
2.3. Penggalian/ Quarrying 423 019,28 437 410,33
3. INDUSTRI PENGOLAHAN/ Manufacturing Industry 105 334 047,15 114 299 625,74
3.1. Industri Migas/ Oil and Gas Industry 2 296 832,99 2 322 258,24
3.2. Industri Tanpa Migas/ Industry Excluding Oil/Gas 103 037,214,16 111 977 367,50
3.2.1 Makanan, Minuman dan Tembakau 12 262 584,78 13 793 404,97
3.2.2 Tekstil, Barang Kulit dan Alas Kaki 24 986 334,19 27 440 007,34
3.2.3 Barang Kayu dan Hasil Hutan Lainnya 1 483 094,94 1 571 791,79
3.2.4 Kertas dan Barang Cetakan 2 719 607,61 2 958 617,00
3.2.5 Pupuk, Kimia dan Barang dari Karet 10 823 759,11 12 458 292,05
3.2.6 Semen dan Barang Galian Bukan Logam 2 132 334,71 2 077 805,86
3.2.7 Logam Dasar dan Baja 659 315,45 684 293,08
3.2.8 Alat Angkutan, Mesin dan Peralatannya 45 588 069,48 48 427 313,84
3.2.9 Barang Lainnya 2 382 118,89 2 565 845,56 Sumber/Source : PDRB Jawa Barat / GRDP of Jawa Barat Catatan /Notes : *) Angka Diperbaiki / Revised Figures **) Angka Sementara / Preliminary Figures

REGIONAL INCOME
Jawa Barat Dalam Angka 2007 511
Tabel Table 11.2 Lanjutan
[Continued]
LAPANGAN USAHA Industrial Origin 2005 *) 2006**)
[1] [2] [3]
4. LISTRIK, GAS dan AIR BERSIH/ 5 649 829,62 5 755 519,24 Electricity, Gas and Water Supply 4.1. L i s t r i k/ Electricity 4 885 982,47 5 020 625,64 4.2. Gas Kota/ G a s 433 556,53 392 726,29 4.3. Air Bersih/ Water Supply 330 290,62 342 167,31 5. BANGUNAN/KONSTRUKSI / Construction 7 780 823,72 8 112 532,09 6. PERDAGANGAN, HOTEL dan RESTORAN/ 47 259 969,72 50 609 675,67 Trade, Hotel and Retaurant 6.1. Perdagangan Besar dan Eceran/ Wholesale and 40 541 875,58 43 598 521,68 Retail Trade 6.2. H o t e l/ H o t e l 1 002 304,98 1 054 314,63 6.3. R e s t o r a n/Restaurant 5 715 789,16 5 956 839,36 7. PENGANGKUTAN dan KOMUNIKASI/ 10 329 164.21 11 143 253.97 Transport and Communication 7.1 Pengangkutan/ Transport 7 318 275,33 7 648 039,96 7.1.1 Angkutan Rel/ Railway Transport 234 123,23 247 645,79 7.1.2 Angkutan Jalan Raya/ Road Transport 5 943 075,46 6 185 077,83 7.1.3 Angkutan Laut/ Sea Transport 223 477,22 221 902,87 7.1.4 Angkutan Sungai dan Penyeberangan/ River and 793,41 805,90 Ferry Transport 7.1.5 Angkutan Udara/ Air Transport 407 344,13 447 721,97
7.1.6 Jasa Penunjang Angkutan/ Services Allied to Transport 509 461,88 544 885,60 7.2 Komunikasi/ Communication 3 010 888,87 3 495 214,01 Sumber/Source : PDRB Jawa Barat / GRDP of Jawa Barat Catatan /Notes : *) Angka Diperbaiki / Revised Figures **) Angka Sementara / Preliminary Figures
PENDAPATAN REGIONAL
Jawa Barat Dalam Angka 2007 512
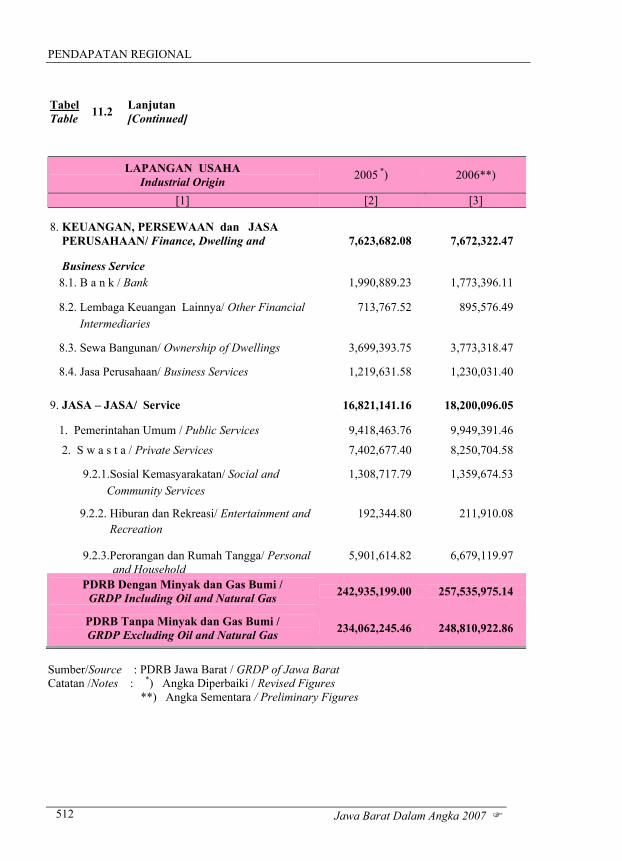
Tabel Table 11.2 Lanjutan
[Continued]
LAPANGAN USAHA Industrial Origin 2005 *) 2006**)
[1] [2] [3]
8. KEUANGAN, PERSEWAAN dan JASA PERUSAHAAN/ Finance, Dwelling and 7,623,682.08 7,672,322.47
Business Service
8.1. B a n k / Bank 1,990,889.23 1,773,396.11
8.2. Lembaga Keuangan Lainnya/ Other Financial 713,767.52 895,576.49 Intermediaries
8.3. Sewa Bangunan/ Ownership of Dwellings 3,699,393.75 3,773,318.47
8.4. Jasa Perusahaan/ Business Services 1,219,631.58 1,230,031.40 9. JASA – JASA/ Service 16,821,141.16 18,200,096.05
1. Pemerintahan Umum / Public Services 9,418,463.76 9,949,391.46
2. S w a s t a / Private Services 7,402,677.40 8,250,704.58
9.2.1.Sosial Kemasyarakatan/ Social and 1,308,717.79 1,359,674.53 Community Services
9.2.2. Hiburan dan Rekreasi/ Entertainment and 192,344.80 211,910.08 Recreation
9.2.3.Perorangan dan Rumah Tangga/ Personal 5,901,614.82 6,679,119.97 and Household
PDRB Dengan Minyak dan Gas Bumi / GRDP Including Oil and Natural Gas 242,935,199.00 257,535,975.14
PDRB Tanpa Minyak dan Gas Bumi / GRDP Excluding Oil and Natural Gas 234,062,245.46 248,810,922.86
Sumber/Source : PDRB Jawa Barat / GRDP of Jawa Barat Catatan /Notes : *) Angka Diperbaiki / Revised Figures **) Angka Sementara / Preliminary Figures

REGIONAL INCOME
Jawa Barat Dalam Angka 2007 513
Tabel Table 11.3
Distribusi Persentase Domestik Regional Bruto Provinsi Jawa Barat Atas Dasar Harga Berlaku, Menurut Lapangan Usaha Percentage Distribution of Gross Regional Domestic Product (GRDP) of Jawa Barat at Current Market Prices by Industrial Origin
(Persen/Percent) 2005 – 2006
LAPANGAN USAHA/ Industrial Origin 2005 *) 2006**)
[1] [2] [3]
1. PERTANIAN/Agriculture 12,52 11,74
1.1. Tanaman Bahan Makanan/ Farm Food Crops 8,69 8,19
1.2. Tanaman Perkebunan/ Estate Crops 0,99 0,94
1.3. Peternakan dan Hasil-hasilnya/ Livestock and Products 1,66 1,59
1.4. Kehutanan/ F o r e s t r y 0,17 0,16 1.5. Perikanan/ Fishery 1,01 0,85
2. PERTAMBANGAN dan PENGGALIAN/ Mining and 3,23 2,87 Quarrying 2.1. Minyak dan Gas Bumi/ Oil and Natural Gas 3,00 2,64
2.2. Pertambangan Tanpa Migas/ Mining Excluding Oil /Gas 0,07 0,06
2.3. Penggalian/ Quarrying 0,17 0,17
3. INDUSTRI PENGOLAHAN/ Manufacturing Industry 46,68 47,76
3.1. Industri Migas/ Oil and Gas Industry 2,01 2,92
3.2. Industri Tanpa Migas/ Industry Excluding Oil/Gas 44,68 44,83
3.2.1 Makanan, Minuman dan Tembakau 4,95 4,67 3.2.2 Tekstil, Barang Kulit dan Alas Kaki 12,32 13,39 3.2.3 Barang Kayu dan Hasil Hutan Lainnya 0,58 0,56 3.2.4 Kertas dan Barang Cetakan 0,95 0,90
3.2.5 Pupuk, Kimia dan Barang dari Karet 4,61 4,51
3.2.6 Semen dan Barang Galian Bukan Logam 1,00 0,94
3.2.7 Logam Dasar dan Baja 0,38 0,36 3.2.8 Alat Angkutan, Mesin dan Peralatannya 19,02 18,65 3.2.9 Barang Lainnya 0,84 0,86 Sumber/Source : PDRB Jawa Barat / GRDP of Jawa Barat Catatan /Notes : *) Angka Diperbaiki / Revised Figures **) Angka Sementara / Preliminary Figures

PENDAPATAN REGIONAL
Jawa Barat Dalam Angka 2007 514
Tabel Table 11.3 Lanjutan
[Continued]
LAPANGAN USAHA Industrial Origin 2005 *) 2006**)
[1] [2] [3]
4. LISTRIK, GAS dan AIR BERSIH/ 3,04 2,83 Electricity, Gas and Water Supply 4.1. L i s t r i k/ Electricity 2,71 2,52 4.2. Gas Kota/ G a s 0,20 0,20 4.3. Air Bersih/ Water Supply 0,12 0,11 5. BANGUNAN/KONSTRUKSI / Construction 3,09 3,20 6. PERDAGANGAN, HOTEL dan RESTORAN/ 20,04 20,48 Trade, Hotel and Retaurant 6.1. Perdagangan Besar dan Eceran/ Wholesale and 16,95 17,65 Retail Trade 6.2. H o t e l/ H o t e l 0,44 0,39 6.3. R e s t o r a n/Restaurant 2,65 2,44 7. PENGANGKUTAN dan KOMUNIKASI/ 5,59 6,20 Transport and Communication 7.1 Pengangkutan/ Transport 4,67 5,31 7.1.1 Angkutan Rel/ Railway Transport 0,12 0,10 7.1.2 Angkutan Jalan Raya/ Road Transport 4,01 4,70 7.1.3 Angkutan Laut/ Sea Transport 0,11 0,10 7.1.4 Angkutan Sungai dan Penyeberangan/ River and - - Ferry Transport 7.1.5 Angkutan Udara/ Air Transport 0,16 0,16
7.1.6 Jasa Penunjang Angkutan/ Services Allied to Transport 0,27 0,25 7.2 Komunikasi/ Communication 0,92 0,90 Sumber/Source : PDRB Jawa Barat / GRDP of Jawa Barat Catatan /Notes : *) Angka Diperbaiki / Revised Figures **) Angka Sementara / Preliminary Figures
REGIONAL INCOME
Jawa Barat Dalam Angka 2007 515
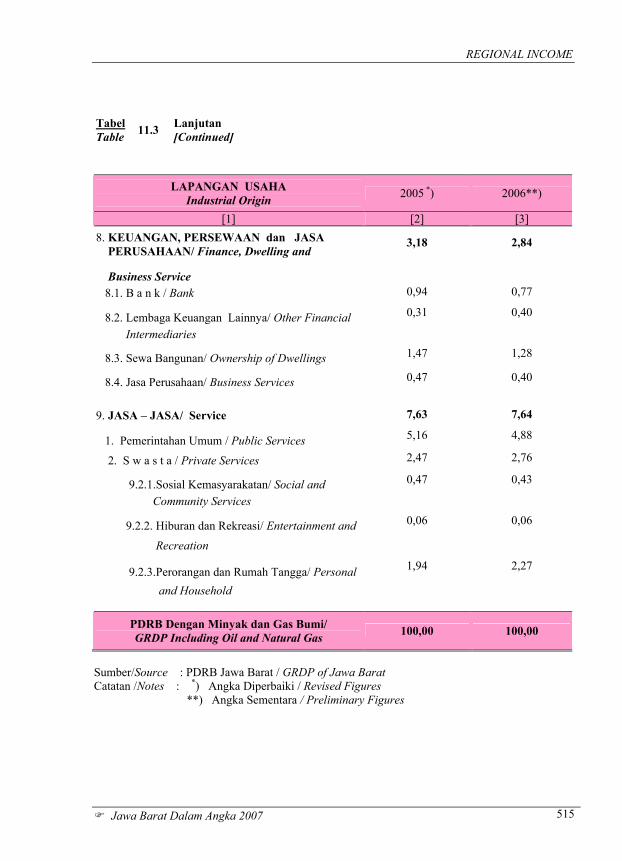
Tabel Table 11.3 Lanjutan
[Continued]
LAPANGAN USAHA Industrial Origin 2005 *) 2006**)
[1] [2] [3] 8. KEUANGAN, PERSEWAAN dan JASA PERUSAHAAN/ Finance, Dwelling and
3,18 2,84
Business Service 8.1. B a n k / Bank 0,94 0,77
8.2. Lembaga Keuangan Lainnya/ Other Financial 0,31 0,40
Intermediaries
8.3. Sewa Bangunan/ Ownership of Dwellings 1,47 1,28
8.4. Jasa Perusahaan/ Business Services 0,47 0,40
9. JASA – JASA/ Service 7,63 7,64
1. Pemerintahan Umum / Public Services 5,16 4,88
2. S w a s t a / Private Services 2,47 2,76
9.2.1.Sosial Kemasyarakatan/ Social and 0,47 0,43
Community Services
9.2.2. Hiburan dan Rekreasi/ Entertainment and 0,06 0,06
Recreation
9.2.3.Perorangan dan Rumah Tangga/ Personal 1,94 2,27
and Household
PDRB Dengan Minyak dan Gas Bumi/ GRDP Including Oil and Natural Gas 100,00 100,00
Sumber/Source : PDRB Jawa Barat / GRDP of Jawa Barat Catatan /Notes : *) Angka Diperbaiki / Revised Figures **) Angka Sementara / Preliminary Figures
PENDAPATAN REGIONAL
Jawa Barat Dalam Angka 2007 516
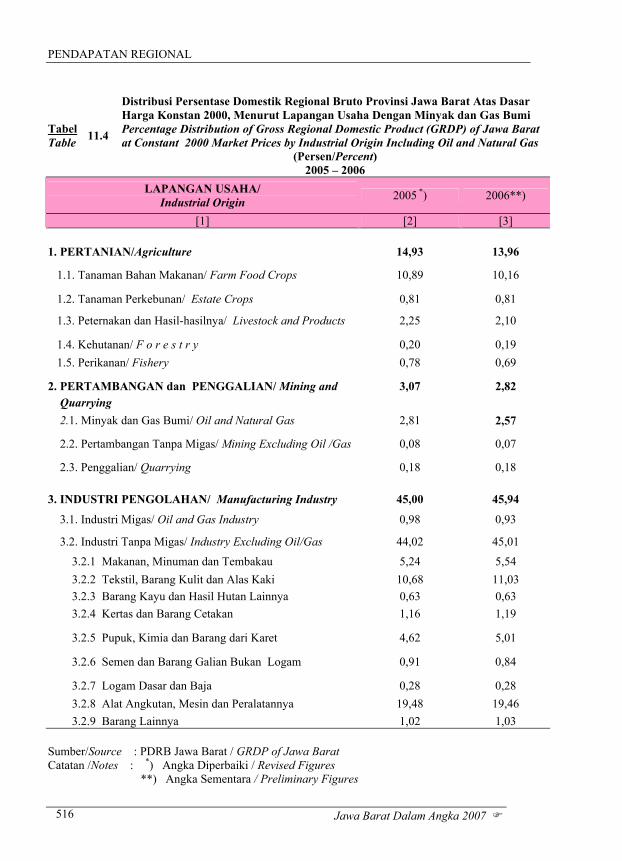
Tabel Table 11.4
Distribusi Persentase Domestik Regional Bruto Provinsi Jawa Barat Atas Dasar Harga Konstan 2000, Menurut Lapangan Usaha Dengan Minyak dan Gas Bumi Percentage Distribution of Gross Regional Domestic Product (GRDP) of Jawa Barat at Constant 2000 Market Prices by Industrial Origin Including Oil and Natural Gas
(Persen/Percent) 2005 – 2006
LAPANGAN USAHA/ Industrial Origin 2005 *) 2006**)
[1] [2] [3]
1. PERTANIAN/Agriculture 14,93 13,96
1.1. Tanaman Bahan Makanan/ Farm Food Crops 10,89 10,16
1.2. Tanaman Perkebunan/ Estate Crops 0,81 0,81
1.3. Peternakan dan Hasil-hasilnya/ Livestock and Products 2,25 2,10
1.4. Kehutanan/ F o r e s t r y 0,20 0,19 1.5. Perikanan/ Fishery 0,78 0,69
2. PERTAMBANGAN dan PENGGALIAN/ Mining and 3,07 2,82 Quarrying 2.1. Minyak dan Gas Bumi/ Oil and Natural Gas 2,81 2,57
2.2. Pertambangan Tanpa Migas/ Mining Excluding Oil /Gas 0,08 0,07
2.3. Penggalian/ Quarrying 0,18 0,18
3. INDUSTRI PENGOLAHAN/ Manufacturing Industry 45,00 45,94
3.1. Industri Migas/ Oil and Gas Industry 0,98 0,93
3.2. Industri Tanpa Migas/ Industry Excluding Oil/Gas 44,02 45,01
3.2.1 Makanan, Minuman dan Tembakau 5,24 5,54 3.2.2 Tekstil, Barang Kulit dan Alas Kaki 10,68 11,03 3.2.3 Barang Kayu dan Hasil Hutan Lainnya 0,63 0,63 3.2.4 Kertas dan Barang Cetakan 1,16 1,19
3.2.5 Pupuk, Kimia dan Barang dari Karet 4,62 5,01
3.2.6 Semen dan Barang Galian Bukan Logam 0,91 0,84
3.2.7 Logam Dasar dan Baja 0,28 0,28 3.2.8 Alat Angkutan, Mesin dan Peralatannya 19,48 19,46 3.2.9 Barang Lainnya 1,02 1,03 Sumber/Source : PDRB Jawa Barat / GRDP of Jawa Barat Catatan /Notes : *) Angka Diperbaiki / Revised Figures **) Angka Sementara / Preliminary Figures
REGIONAL INCOME
Jawa Barat Dalam Angka 2007 517
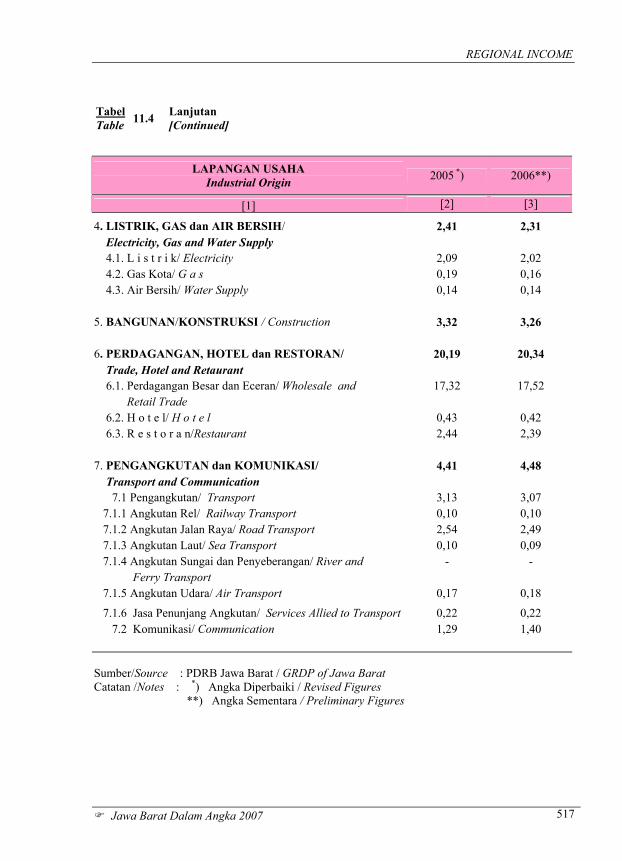
Tabel Table 11.4 Lanjutan
[Continued]
LAPANGAN USAHA Industrial Origin 2005 *) 2006**)
[1] [2] [3]
4. LISTRIK, GAS dan AIR BERSIH/ 2,41 2,31 Electricity, Gas and Water Supply 4.1. L i s t r i k/ Electricity 2,09 2,02 4.2. Gas Kota/ G a s 0,19 0,16 4.3. Air Bersih/ Water Supply 0,14 0,14 5. BANGUNAN/KONSTRUKSI / Construction 3,32 3,26 6. PERDAGANGAN, HOTEL dan RESTORAN/ 20,19 20,34 Trade, Hotel and Retaurant 6.1. Perdagangan Besar dan Eceran/ Wholesale and 17,32 17,52 Retail Trade 6.2. H o t e l/ H o t e l 0,43 0,42 6.3. R e s t o r a n/Restaurant 2,44 2,39 7. PENGANGKUTAN dan KOMUNIKASI/ 4,41 4,48 Transport and Communication 7.1 Pengangkutan/ Transport 3,13 3,07 7.1.1 Angkutan Rel/ Railway Transport 0,10 0,10 7.1.2 Angkutan Jalan Raya/ Road Transport 2,54 2,49 7.1.3 Angkutan Laut/ Sea Transport 0,10 0,09 7.1.4 Angkutan Sungai dan Penyeberangan/ River and - - Ferry Transport 7.1.5 Angkutan Udara/ Air Transport 0,17 0,18
7.1.6 Jasa Penunjang Angkutan/ Services Allied to Transport 0,22 0,22 7.2 Komunikasi/ Communication 1,29 1,40 Sumber/Source : PDRB Jawa Barat / GRDP of Jawa Barat Catatan /Notes : *) Angka Diperbaiki / Revised Figures **) Angka Sementara / Preliminary Figures
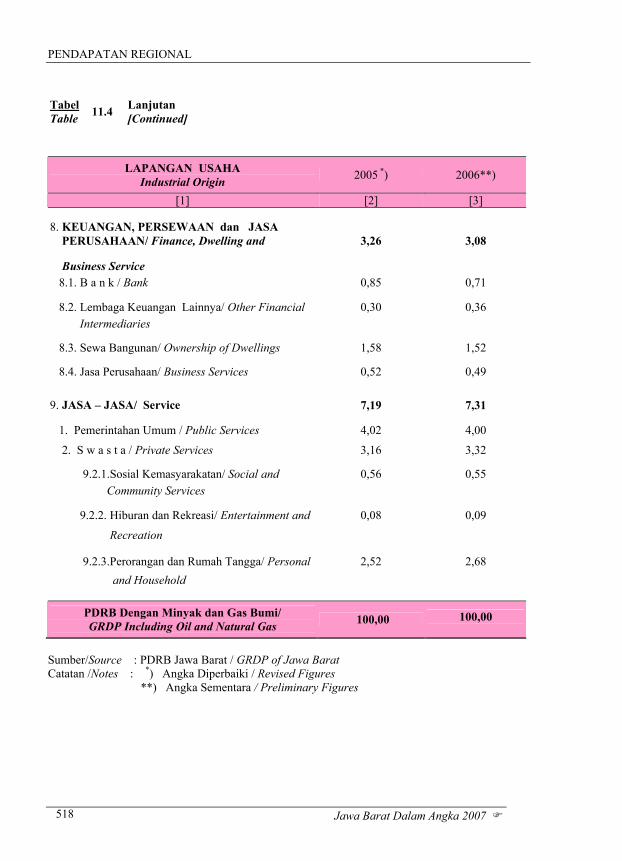
PENDAPATAN REGIONAL
Jawa Barat Dalam Angka 2007 518
Tabel Table 11.4 Lanjutan
[Continued]
LAPANGAN USAHA Industrial Origin 2005 *) 2006**)
[1] [2] [3]
8. KEUANGAN, PERSEWAAN dan JASA PERUSAHAAN/ Finance, Dwelling and 3,26 3,08
Business Service 8.1. B a n k / Bank 0,85 0,71
8.2. Lembaga Keuangan Lainnya/ Other Financial 0,30 0,36 Intermediaries
8.3. Sewa Bangunan/ Ownership of Dwellings 1,58 1,52
8.4. Jasa Perusahaan/ Business Services 0,52 0,49 9. JASA – JASA/ Service 7,19 7,31
1. Pemerintahan Umum / Public Services 4,02 4,00
2. S w a s t a / Private Services 3,16 3,32
9.2.1.Sosial Kemasyarakatan/ Social and 0,56 0,55 Community Services
9.2.2. Hiburan dan Rekreasi/ Entertainment and 0,08 0,09
Recreation
9.2.3.Perorangan dan Rumah Tangga/ Personal 2,52 2,68 and Household
PDRB Dengan Minyak dan Gas Bumi/ GRDP Including Oil and Natural Gas 100,00 100,00
Sumber/Source : PDRB Jawa Barat / GRDP of Jawa Barat Catatan /Notes : *) Angka Diperbaiki / Revised Figures **) Angka Sementara / Preliminary Figures
REGIONAL INCOME
Jawa Barat Dalam Angka 2007 519
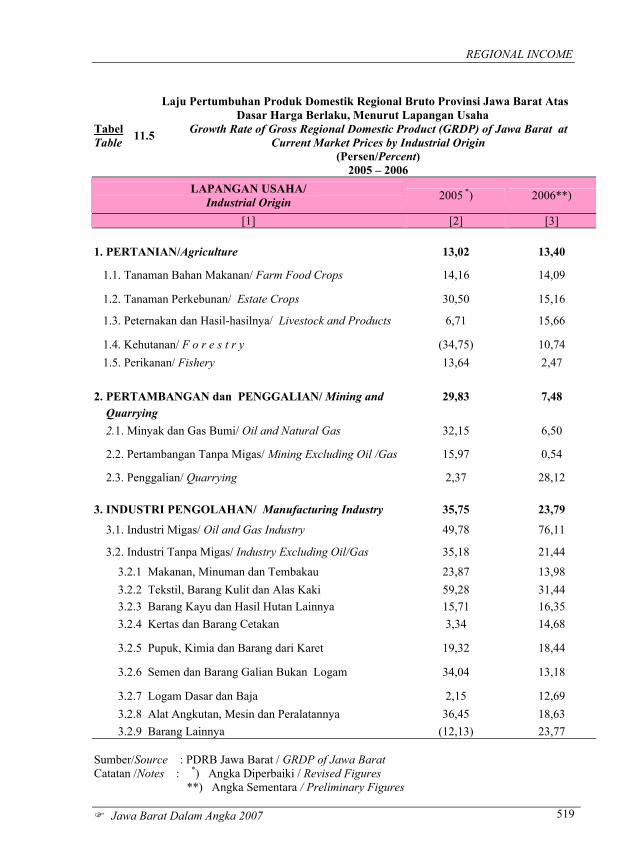
Tabel Table 11.5
Laju Pertumbuhan Produk Domestik Regional Bruto Provinsi Jawa Barat Atas Dasar Harga Berlaku, Menurut Lapangan Usaha
Growth Rate of Gross Regional Domestic Product (GRDP) of Jawa Barat at Current Market Prices by Industrial Origin
(Persen/Percent) 2005 – 2006
LAPANGAN USAHA/ Industrial Origin 2005 *) 2006**)
[1] [2] [3]
1. PERTANIAN/Agriculture 13,02 13,40
1.1. Tanaman Bahan Makanan/ Farm Food Crops 14,16 14,09
1.2. Tanaman Perkebunan/ Estate Crops 30,50 15,16
1.3. Peternakan dan Hasil-hasilnya/ Livestock and Products 6,71 15,66
1.4. Kehutanan/ F o r e s t r y (34,75) 10,74 1.5. Perikanan/ Fishery 13,64 2,47
2. PERTAMBANGAN dan PENGGALIAN/ Mining and 29,83 7,48 Quarrying 2.1. Minyak dan Gas Bumi/ Oil and Natural Gas 32,15 6,50
2.2. Pertambangan Tanpa Migas/ Mining Excluding Oil /Gas 15,97 0,54
2.3. Penggalian/ Quarrying 2,37 28,12
3. INDUSTRI PENGOLAHAN/ Manufacturing Industry 35,75 23,79
3.1. Industri Migas/ Oil and Gas Industry 49,78 76,11
3.2. Industri Tanpa Migas/ Industry Excluding Oil/Gas 35,18 21,44
3.2.1 Makanan, Minuman dan Tembakau 23,87 13,98 3.2.2 Tekstil, Barang Kulit dan Alas Kaki 59,28 31,44 3.2.3 Barang Kayu dan Hasil Hutan Lainnya 15,71 16,35 3.2.4 Kertas dan Barang Cetakan 3,34 14,68
3.2.5 Pupuk, Kimia dan Barang dari Karet 19,32 18,44
3.2.6 Semen dan Barang Galian Bukan Logam 34,04 13,18
3.2.7 Logam Dasar dan Baja 2,15 12,69 3.2.8 Alat Angkutan, Mesin dan Peralatannya 36,45 18,63 3.2.9 Barang Lainnya (12,13) 23,77 Sumber/Source : PDRB Jawa Barat / GRDP of Jawa Barat Catatan /Notes : *) Angka Diperbaiki / Revised Figures **) Angka Sementara / Preliminary Figures
PENDAPATAN REGIONAL
Jawa Barat Dalam Angka 2007 520
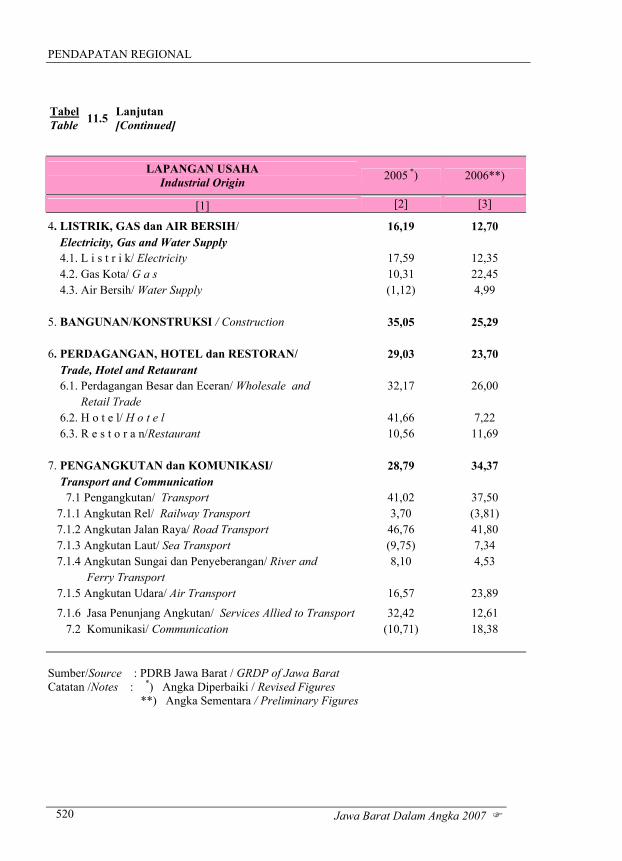
Tabel Table 11.5 Lanjutan
[Continued]
LAPANGAN USAHA Industrial Origin 2005 *) 2006**)
[1] [2] [3]
4. LISTRIK, GAS dan AIR BERSIH/ 16,19 12,70 Electricity, Gas and Water Supply 4.1. L i s t r i k/ Electricity 17,59 12,35 4.2. Gas Kota/ G a s 10,31 22,45 4.3. Air Bersih/ Water Supply (1,12) 4,99 5. BANGUNAN/KONSTRUKSI / Construction 35,05 25,29 6. PERDAGANGAN, HOTEL dan RESTORAN/ 29,03 23,70 Trade, Hotel and Retaurant 6.1. Perdagangan Besar dan Eceran/ Wholesale and 32,17 26,00 Retail Trade 6.2. H o t e l/ H o t e l 41,66 7,22 6.3. R e s t o r a n/Restaurant 10,56 11,69 7. PENGANGKUTAN dan KOMUNIKASI/ 28,79 34,37 Transport and Communication 7.1 Pengangkutan/ Transport 41,02 37,50 7.1.1 Angkutan Rel/ Railway Transport 3,70 (3,81) 7.1.2 Angkutan Jalan Raya/ Road Transport 46,76 41,80 7.1.3 Angkutan Laut/ Sea Transport (9,75) 7,34 7.1.4 Angkutan Sungai dan Penyeberangan/ River and 8,10 4,53 Ferry Transport 7.1.5 Angkutan Udara/ Air Transport 16,57 23,89
7.1.6 Jasa Penunjang Angkutan/ Services Allied to Transport 32,42 12,61 7.2 Komunikasi/ Communication (10,71) 18,38 Sumber/Source : PDRB Jawa Barat / GRDP of Jawa Barat Catatan /Notes : *) Angka Diperbaiki / Revised Figures **) Angka Sementara / Preliminary Figures
REGIONAL INCOME
Jawa Barat Dalam Angka 2007 521
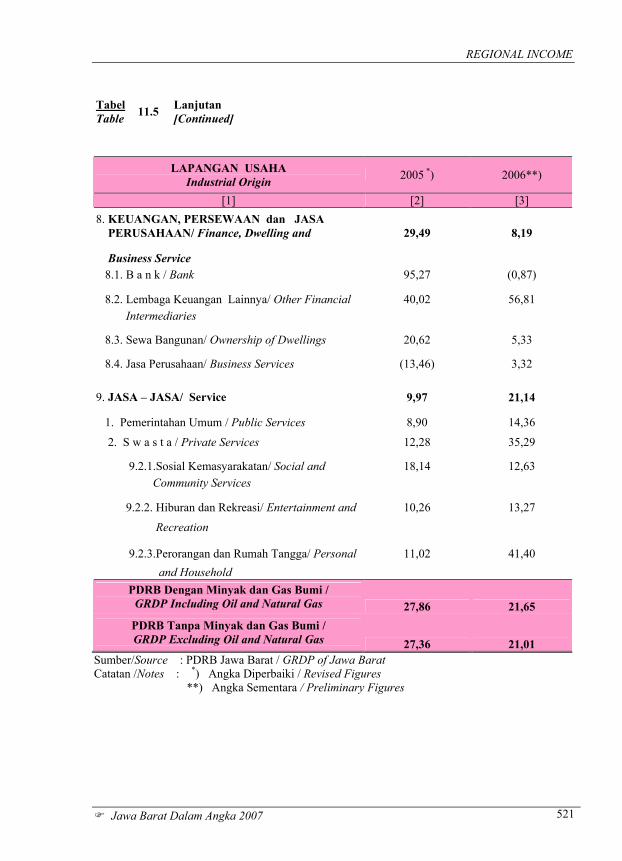
Tabel Table 11.5 Lanjutan
[Continued]
LAPANGAN USAHA Industrial Origin 2005 *) 2006**)
[1] [2] [3] 8. KEUANGAN, PERSEWAAN dan JASA PERUSAHAAN/ Finance, Dwelling and 29,49 8,19
Business Service 8.1. B a n k / Bank 95,27 (0,87)
8.2. Lembaga Keuangan Lainnya/ Other Financial 40,02 56,81 Intermediaries
8.3. Sewa Bangunan/ Ownership of Dwellings 20,62 5,33
8.4. Jasa Perusahaan/ Business Services (13,46) 3,32 9. JASA – JASA/ Service 9,97 21,14
1. Pemerintahan Umum / Public Services 8,90 14,36
2. S w a s t a / Private Services 12,28 35,29
9.2.1.Sosial Kemasyarakatan/ Social and 18,14 12,63 Community Services
9.2.2. Hiburan dan Rekreasi/ Entertainment and 10,26 13,27
Recreation
9.2.3.Perorangan dan Rumah Tangga/ Personal 11,02 41,40 and Household
PDRB Dengan Minyak dan Gas Bumi / GRDP Including Oil and Natural Gas 27,86 21,65
PDRB Tanpa Minyak dan Gas Bumi / GRDP Excluding Oil and Natural Gas 27,36 21,01
Sumber/Source : PDRB Jawa Barat / GRDP of Jawa Barat Catatan /Notes : *) Angka Diperbaiki / Revised Figures **) Angka Sementara / Preliminary Figures
PENDAPATAN REGIONAL
Jawa Barat Dalam Angka 2007 522
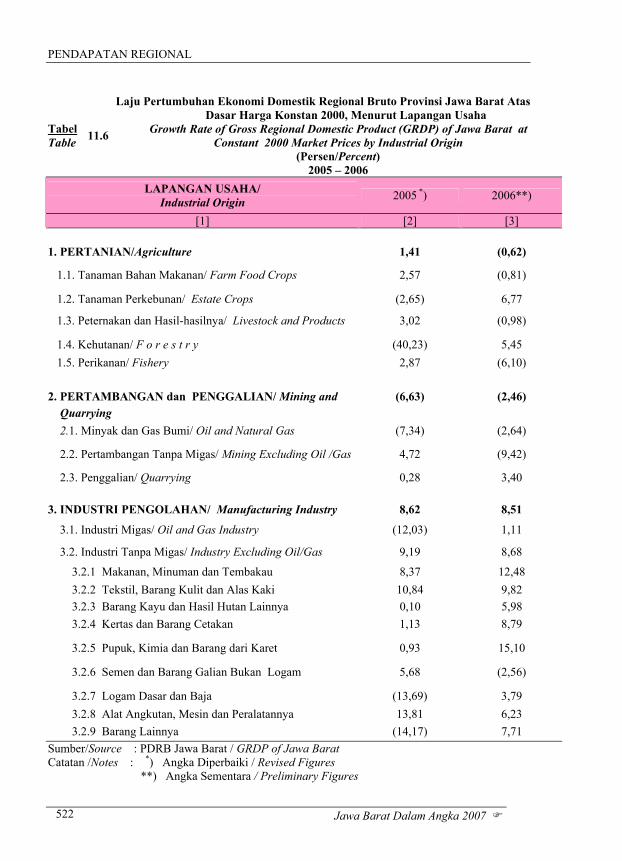
Tabel Table 11.6
Laju Pertumbuhan Ekonomi Domestik Regional Bruto Provinsi Jawa Barat Atas Dasar Harga Konstan 2000, Menurut Lapangan Usaha
Growth Rate of Gross Regional Domestic Product (GRDP) of Jawa Barat at Constant 2000 Market Prices by Industrial Origin
(Persen/Percent) 2005 – 2006
LAPANGAN USAHA/ Industrial Origin 2005 *) 2006**)
[1] [2] [3]
1. PERTANIAN/Agriculture 1,41 (0,62)
1.1. Tanaman Bahan Makanan/ Farm Food Crops 2,57 (0,81)
1.2. Tanaman Perkebunan/ Estate Crops (2,65) 6,77
1.3. Peternakan dan Hasil-hasilnya/ Livestock and Products 3,02 (0,98)
1.4. Kehutanan/ F o r e s t r y (40,23) 5,45 1.5. Perikanan/ Fishery 2,87 (6,10)
2. PERTAMBANGAN dan PENGGALIAN/ Mining and (6,63) (2,46) Quarrying 2.1. Minyak dan Gas Bumi/ Oil and Natural Gas (7,34) (2,64)
2.2. Pertambangan Tanpa Migas/ Mining Excluding Oil /Gas 4,72 (9,42)
2.3. Penggalian/ Quarrying 0,28 3,40
3. INDUSTRI PENGOLAHAN/ Manufacturing Industry 8,62 8,51
3.1. Industri Migas/ Oil and Gas Industry (12,03) 1,11
3.2. Industri Tanpa Migas/ Industry Excluding Oil/Gas 9,19 8,68
3.2.1 Makanan, Minuman dan Tembakau 8,37 12,48 3.2.2 Tekstil, Barang Kulit dan Alas Kaki 10,84 9,82 3.2.3 Barang Kayu dan Hasil Hutan Lainnya 0,10 5,98 3.2.4 Kertas dan Barang Cetakan 1,13 8,79
3.2.5 Pupuk, Kimia dan Barang dari Karet 0,93 15,10
3.2.6 Semen dan Barang Galian Bukan Logam 5,68 (2,56)
3.2.7 Logam Dasar dan Baja (13,69) 3,79 3.2.8 Alat Angkutan, Mesin dan Peralatannya 13,81 6,23 3.2.9 Barang Lainnya (14,17) 7,71 Sumber/Source : PDRB Jawa Barat / GRDP of Jawa Barat Catatan /Notes : *) Angka Diperbaiki / Revised Figures **) Angka Sementara / Preliminary Figures

REGIONAL INCOME
Jawa Barat Dalam Angka 2007 523
Tabel Table 11.6 Lanjutan
[Continued]
LAPANGAN USAHA Industrial Origin 2005 *) 2006**)
[1] [2] [3]
4. LISTRIK, GAS dan AIR BERSIH/ 5,84 1,87 Electricity, Gas and Water Supply 4.1. L i s t r i k/ Electricity 7,16 2,76 4.2. Gas Kota/ G a s (2,16) (9,42) 4.3. Air Bersih/ Water Supply (1,46) 3,60 5. BANGUNAN/KONSTRUKSI / Construction 17,85 4,26 6. PERDAGANGAN, HOTEL dan RESTORAN/ 3,80 7,09 Trade, Hotel and Retaurant 6.1. Perdagangan Besar dan Eceran/ Wholesale and 6,36 7,54 Retail Trade 6.2. H o t e l/ H o t e l 15,47 5,19 6.3. R e s t o r a n/Restaurant (12,65) 4,22 7. PENGANGKUTAN dan KOMUNIKASI/ 0,20 7,88 Transport and Communication 7.1 Pengangkutan/ Transport (0,28) 4,51 7.1.1 Angkutan Rel/ Railway Transport 0,34 5,78 7.1.2 Angkutan Jalan Raya/ Road Transport 2,21 4,07 7.1.3 Angkutan Laut/ Sea Transport (29,17) (0,70) 7.1.4 Angkutan Sungai dan Penyeberangan/ River and 5,91 1,57 Ferry Transport 7.1.5 Angkutan Udara/ Air Transport (14,58) 9,91
7.1.6 Jasa Penunjang Angkutan/ Services Allied to Transport 2,39 6,95 7.2 Komunikasi/ Communication 1,36 16,09 Sumber/Source : PDRB Jawa Barat / GRDP of Jawa Barat Catatan /Notes : *) Angka Diperbaiki / Revised Figures **) Angka Sementara / Preliminary Figures
PENDAPATAN REGIONAL
Jawa Barat Dalam Angka 2007 524
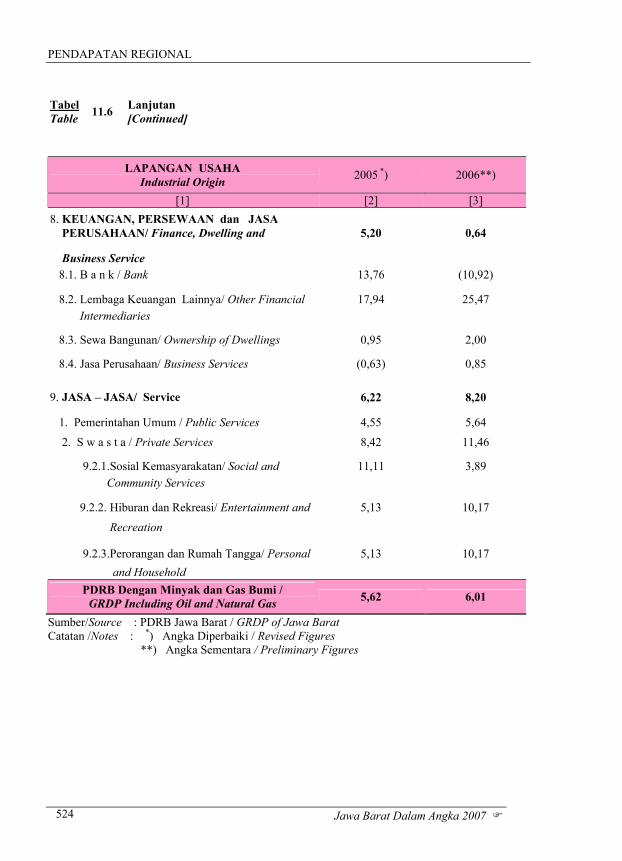
Tabel Table 11.6 Lanjutan
[Continued]
LAPANGAN USAHA Industrial Origin 2005 *) 2006**)
[1] [2] [3] 8. KEUANGAN, PERSEWAAN dan JASA PERUSAHAAN/ Finance, Dwelling and 5,20 0,64
Business Service 8.1. B a n k / Bank 13,76 (10,92)
8.2. Lembaga Keuangan Lainnya/ Other Financial 17,94 25,47 Intermediaries
8.3. Sewa Bangunan/ Ownership of Dwellings 0,95 2,00
8.4. Jasa Perusahaan/ Business Services (0,63) 0,85 9. JASA – JASA/ Service 6,22 8,20
1. Pemerintahan Umum / Public Services 4,55 5,64
2. S w a s t a / Private Services 8,42 11,46
9.2.1.Sosial Kemasyarakatan/ Social and 11,11 3,89 Community Services
9.2.2. Hiburan dan Rekreasi/ Entertainment and 5,13 10,17
Recreation
9.2.3.Perorangan dan Rumah Tangga/ Personal 5,13 10,17 and Household
PDRB Dengan Minyak dan Gas Bumi / GRDP Including Oil and Natural Gas 5,62 6,01
Sumber/Source : PDRB Jawa Barat / GRDP of Jawa Barat Catatan /Notes : *) Angka Diperbaiki / Revised Figures **) Angka Sementara / Preliminary Figures

REGIONAL INCOME
Jawa Barat Dalam Angka 2007 525
Tabel Table 11.7
Indeks Harga Implisit Produk Domestik Regional Bruto Provinsi Jawa Barat Menurut Lapangan Usaha
Growth Rate of Gross Regional Domestic Product (GRDP) of Jawa Barat at Current Market Prices by Industrial Origin
(2000 = 100 ) 2005 – 2006
LAPANGAN USAHA/ Industrial Origin 2005 *) 2006**)
[1] [2] [3]
1. PERTANIAN/Agriculture 132,88 151,63
1.1. Tanaman Bahan Makanan/ Farm Food Crops 126,36 145,35
1.2. Tanaman Perkebunan/ Estate Crops 193,36 208,55
1.3. Peternakan dan Hasil-hasilnya/ Livestock and Products 116,97 136,63
1.4. Kehutanan/ F o r e s t r y 140,00 147,02 1.5. Perikanan/ Fishery 205,40 224,13
2. PERTAMBANGAN dan PENGGALIAN/ Mining and 166,50 183,48 Quarrying 2.1. Minyak dan Gas Bumi/ Oil and Natural Gas 168,93 184,79
2.2. Pertambangan Tanpa Migas/ Mining Excluding Oil /Gas 131,63 146,10
2.3. Penggalian/ Quarrying 144,82 179,44
3. INDUSTRI PENGOLAHAN/ Manufacturing Industry 164,30 187,44
3.1. Industri Migas/ Oil and Gas Industry 324,00 564,33
3.2. Industri Tanpa Migas/ Industry Excluding Oil/Gas 160,74 179,62
3.2.1 Makanan, Minuman dan Tembakau 149,75 151,75 3.2.2 Tekstil, Barang Kulit dan Alas Kaki 182,85 218,84 3.2.3 Barang Kayu dan Hasil Hutan Lainnya 145,90 160,17 3.2.4 Kertas dan Barang Cetakan 129,71 136,73
3.2.5 Pupuk, Kimia dan Barang dari Karet 157,95 162,53
3.2.6 Semen dan Barang Galian Bukan Logam 174,61 202,81
3.2.7 Logam Dasar dan Baja 215,51 234,00 3.2.8 Alat Angkutan, Mesin dan Peralatannya 154,70 172,77 3.2.9 Barang Lainnya 130,98 150,50 Sumber/Source : PDRB Jawa Barat / GRDP of Jawa Barat Catatan /Notes : *) Angka Diperbaiki / Revised Figures **) Angka Sementara / Preliminary Figures
PENDAPATAN REGIONAL
Jawa Barat Dalam Angka 2007 526
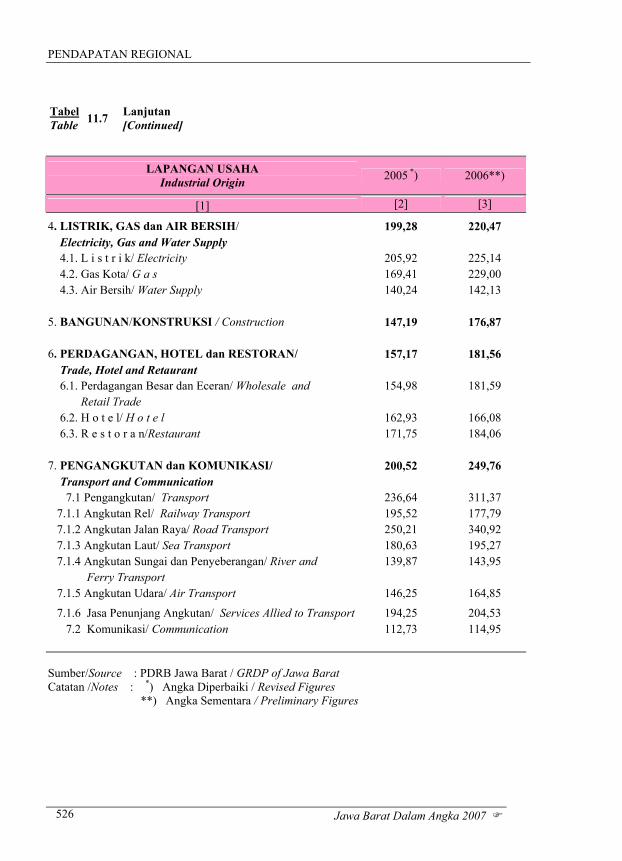
Tabel Table 11.7 Lanjutan
[Continued]
LAPANGAN USAHA Industrial Origin 2005 *) 2006**)
[1] [2] [3]
4. LISTRIK, GAS dan AIR BERSIH/ 199,28 220,47 Electricity, Gas and Water Supply 4.1. L i s t r i k/ Electricity 205,92 225,14 4.2. Gas Kota/ G a s 169,41 229,00 4.3. Air Bersih/ Water Supply 140,24 142,13 5. BANGUNAN/KONSTRUKSI / Construction 147,19 176,87 6. PERDAGANGAN, HOTEL dan RESTORAN/ 157,17 181,56 Trade, Hotel and Retaurant 6.1. Perdagangan Besar dan Eceran/ Wholesale and 154,98 181,59 Retail Trade 6.2. H o t e l/ H o t e l 162,93 166,08 6.3. R e s t o r a n/Restaurant 171,75 184,06 7. PENGANGKUTAN dan KOMUNIKASI/ 200,52 249,76 Transport and Communication 7.1 Pengangkutan/ Transport 236,64 311,37 7.1.1 Angkutan Rel/ Railway Transport 195,52 177,79 7.1.2 Angkutan Jalan Raya/ Road Transport 250,21 340,92 7.1.3 Angkutan Laut/ Sea Transport 180,63 195,27 7.1.4 Angkutan Sungai dan Penyeberangan/ River and 139,87 143,95 Ferry Transport 7.1.5 Angkutan Udara/ Air Transport 146,25 164,85
7.1.6 Jasa Penunjang Angkutan/ Services Allied to Transport 194,25 204,53 7.2 Komunikasi/ Communication 112,73 114,95 Sumber/Source : PDRB Jawa Barat / GRDP of Jawa Barat Catatan /Notes : *) Angka Diperbaiki / Revised Figures **) Angka Sementara / Preliminary Figures
REGIONAL INCOME
Jawa Barat Dalam Angka 2007 527
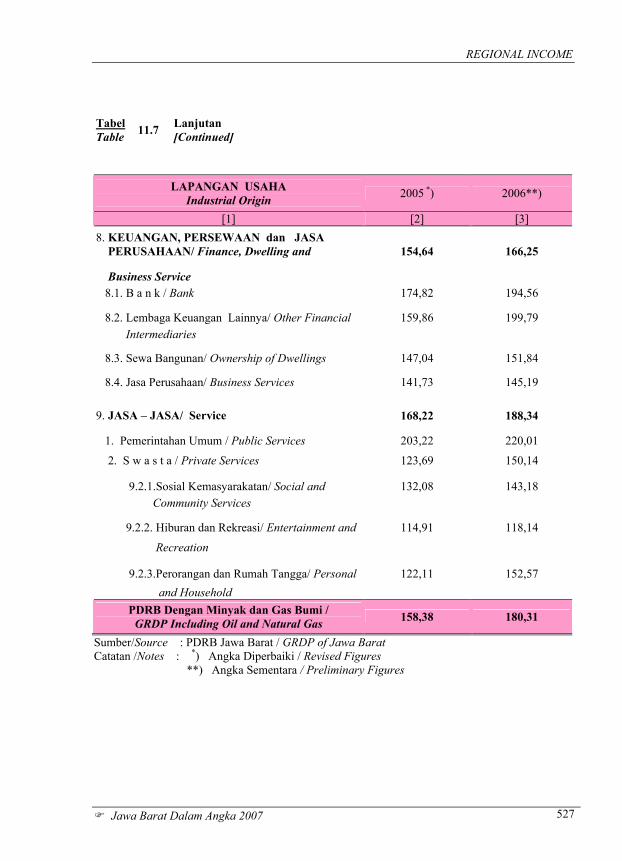
Tabel Table 11.7 Lanjutan
[Continued]
LAPANGAN USAHA Industrial Origin 2005 *) 2006**)
[1] [2] [3] 8. KEUANGAN, PERSEWAAN dan JASA PERUSAHAAN/ Finance, Dwelling and 154,64 166,25
Business Service 8.1. B a n k / Bank 174,82 194,56
8.2. Lembaga Keuangan Lainnya/ Other Financial 159,86 199,79 Intermediaries
8.3. Sewa Bangunan/ Ownership of Dwellings 147,04 151,84
8.4. Jasa Perusahaan/ Business Services 141,73 145,19 9. JASA – JASA/ Service 168,22 188,34
1. Pemerintahan Umum / Public Services 203,22 220,01
2. S w a s t a / Private Services 123,69 150,14
9.2.1.Sosial Kemasyarakatan/ Social and 132,08 143,18 Community Services
9.2.2. Hiburan dan Rekreasi/ Entertainment and 114,91 118,14
Recreation
9.2.3.Perorangan dan Rumah Tangga/ Personal 122,11 152,57 and Household
PDRB Dengan Minyak dan Gas Bumi / GRDP Including Oil and Natural Gas 158,38 180,31
Sumber/Source : PDRB Jawa Barat / GRDP of Jawa Barat Catatan /Notes : *) Angka Diperbaiki / Revised Figures **) Angka Sementara / Preliminary Figures
PENDAPATAN REGIONAL
Jawa Barat Dalam Angka 2007 528
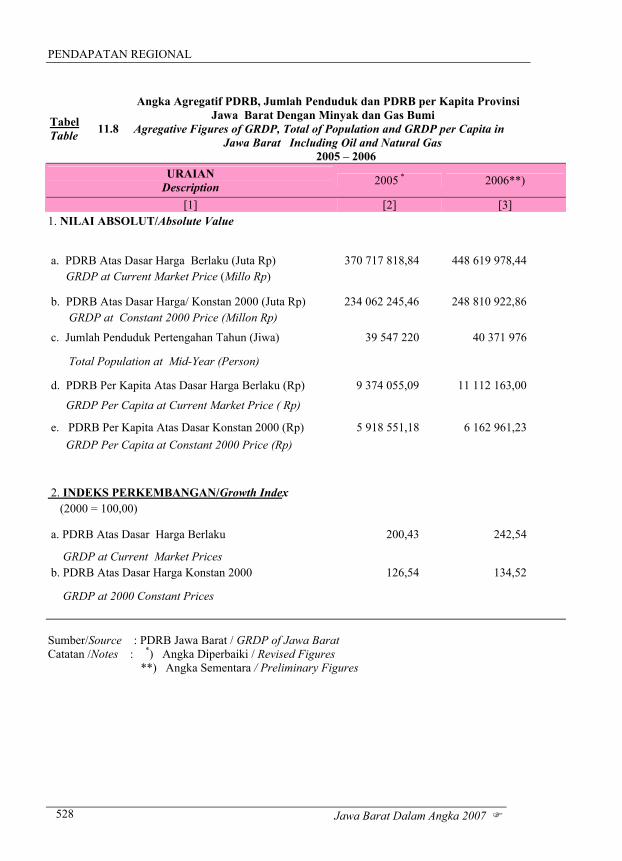
Tabel Table 11.8
Angka Agregatif PDRB, Jumlah Penduduk dan PDRB per Kapita Provinsi Jawa Barat Dengan Minyak dan Gas Bumi Agregative Figures of GRDP, Total of Population and GRDP per Capita in Jawa Barat Including Oil and Natural Gas 2005 – 2006
URAIAN Description 2005 * 2006**)
[1] [2] [3] 1. NILAI ABSOLUT/Absolute Value
a. PDRB Atas Dasar Harga Berlaku (Juta Rp) 370 717 818,84 448 619 978,44 GRDP at Current Market Price (Millo Rp)
b. PDRB Atas Dasar Harga/ Konstan 2000 (Juta Rp) 234 062 245,46 248 810 922,86 GRDP at Constant 2000 Price (Millon Rp)
c. Jumlah Penduduk Pertengahan Tahun (Jiwa) 39 547 220 40 371 976
Total Population at Mid-Year (Person)
d. PDRB Per Kapita Atas Dasar Harga Berlaku (Rp) 9 374 055,09 11 112 163,00
GRDP Per Capita at Current Market Price ( Rp)
e. PDRB Per Kapita Atas Dasar Konstan 2000 (Rp) 5 918 551,18 6 162 961,23 GRDP Per Capita at Constant 2000 Price (Rp)
2. INDEKS PERKEMBANGAN/Growth Index (2000 = 100,00)
a. PDRB Atas Dasar Harga Berlaku 200,43 242,54
GRDP at Current Market Prices b. PDRB Atas Dasar Harga Konstan 2000 126,54 134,52
GRDP at 2000 Constant Prices Sumber/Source : PDRB Jawa Barat / GRDP of Jawa Barat Catatan /Notes : *) Angka Diperbaiki / Revised Figures **) Angka Sementara / Preliminary Figures
REGIONAL INCOME
Jawa Barat Dalam Angka 2007 529
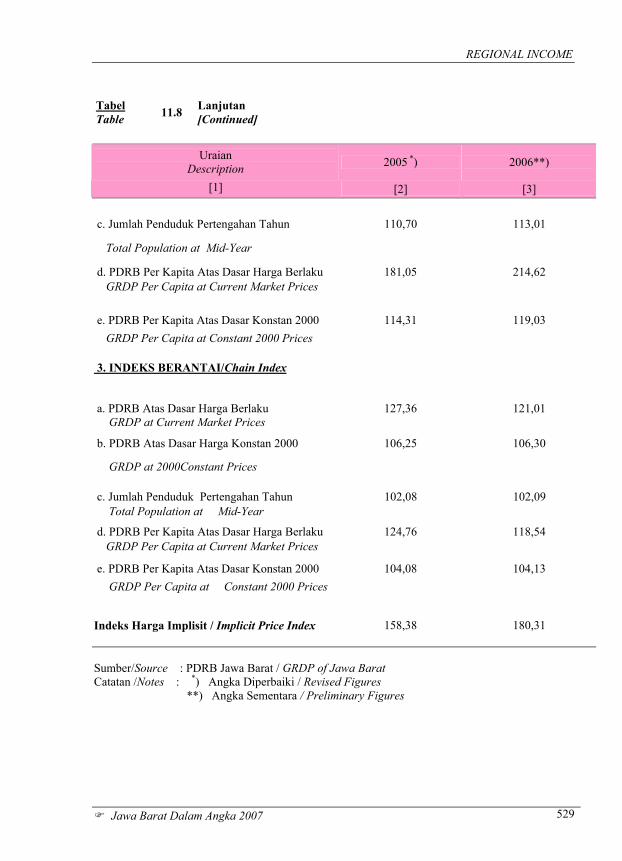
Tabel Table 11.8 Lanjutan
[Continued]
Uraian Description 2005 *) 2006**)
[1] [2] [3]
c. Jumlah Penduduk Pertengahan Tahun 110,70 113,01
Total Population at Mid-Year
d. PDRB Per Kapita Atas Dasar Harga Berlaku 181,05 214,62 GRDP Per Capita at Current Market Prices
e. PDRB Per Kapita Atas Dasar Konstan 2000 114,31 119,03 GRDP Per Capita at Constant 2000 Prices 3. INDEKS BERANTAI/Chain Index
a. PDRB Atas Dasar Harga Berlaku 127,36 121,01 GRDP at Current Market Prices
b. PDRB Atas Dasar Harga Konstan 2000 106,25 106,30
GRDP at 2000Constant Prices
c. Jumlah Penduduk Pertengahan Tahun 102,08 102,09 Total Population at Mid-Year
d. PDRB Per Kapita Atas Dasar Harga Berlaku 124,76 118,54 GRDP Per Capita at Current Market Prices
e. PDRB Per Kapita Atas Dasar Konstan 2000 104,08 104,13 GRDP Per Capita at Constant 2000 Prices
Indeks Harga Implisit / Implicit Price Index 158,38 180,31 Sumber/Source : PDRB Jawa Barat / GRDP of Jawa Barat Catatan /Notes : *) Angka Diperbaiki / Revised Figures **) Angka Sementara / Preliminary Figures
PENDAPATAN REGIONAL
Jawa Barat Dalam Angka 2007 530
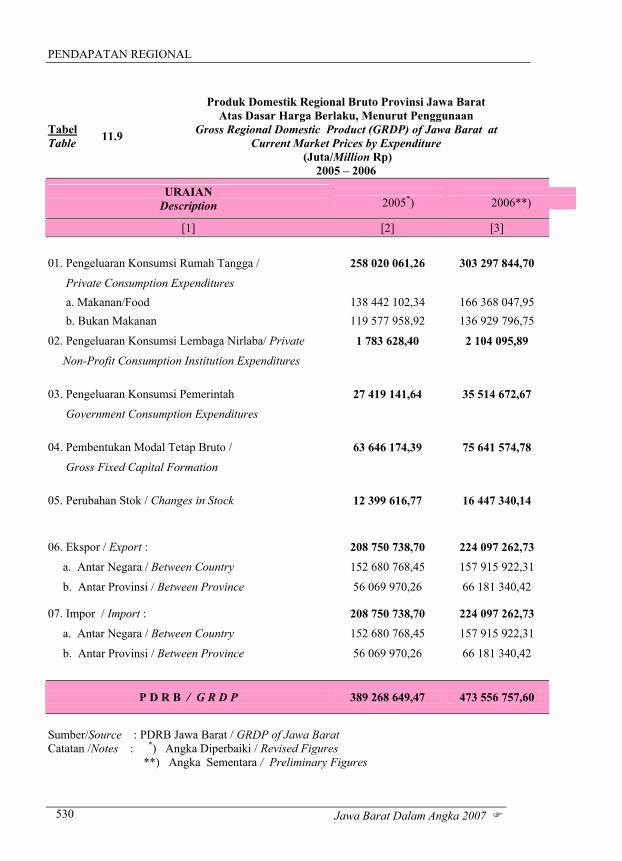
Tabel Table 11.9
Produk Domestik Regional Bruto Provinsi Jawa Barat Atas Dasar Harga Berlaku, Menurut Penggunaan
Gross Regional Domestic Product (GRDP) of Jawa Barat at Current Market Prices by Expenditure
(Juta/Million Rp) 2005 – 2006
URAIAN Description 2005*) 2006**)
[1] [2] [3]
01. Pengeluaran Konsumsi Rumah Tangga / 258 020 061,26 303 297 844,70
Private Consumption Expenditures a. Makanan/Food 138 442 102,34 166 368 047,95 b. Bukan Makanan 119 577 958,92 136 929 796,75
02. Pengeluaran Konsumsi Lembaga Nirlaba/ Private 1 783 628,40 2 104 095,89
Non-Profit Consumption Institution Expenditures 03. Pengeluaran Konsumsi Pemerintah 27 419 141,64 35 514 672,67
Government Consumption Expenditures 04. Pembentukan Modal Tetap Bruto / 63 646 174,39 75 641 574,78
Gross Fixed Capital Formation
05. Perubahan Stok / Changes in Stock 12 399 616,77 16 447 340,14
06. Ekspor / Export : 208 750 738,70 224 097 262,73
a. Antar Negara / Between Country 152 680 768,45 157 915 922,31
b. Antar Provinsi / Between Province 56 069 970,26 66 181 340,42
07. Impor / Import : 208 750 738,70 224 097 262,73
a. Antar Negara / Between Country 152 680 768,45 157 915 922,31
b. Antar Provinsi / Between Province 56 069 970,26 66 181 340,42
P D R B / G R D P 389 268 649,47 473 556 757,60
Sumber/Source : PDRB Jawa Barat / GRDP of Jawa Barat Catatan /Notes : *) Angka Diperbaiki / Revised Figures **) Angka Sementara / Preliminary Figures
REGIONAL INCOME
Jawa Barat Dalam Angka 2007 531
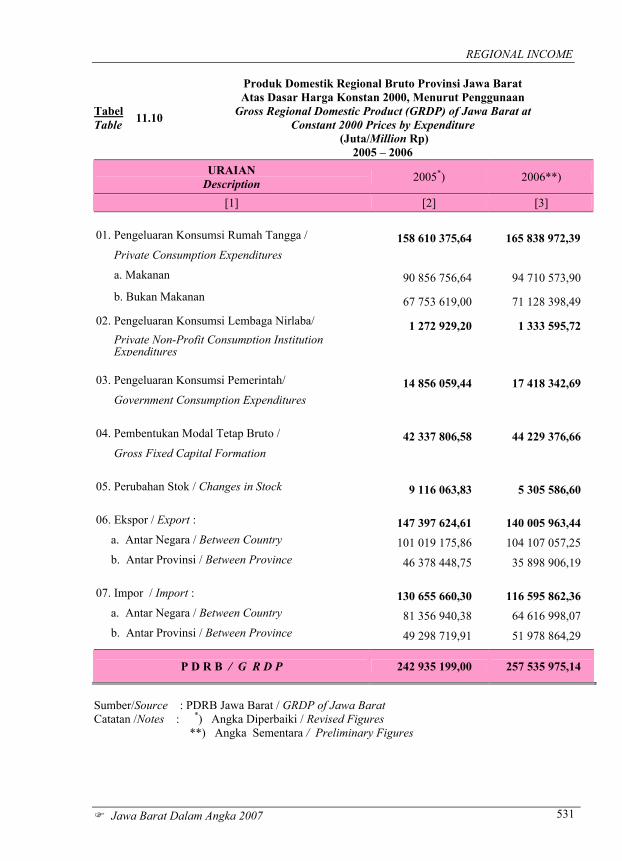
Tabel Table 11.10
Produk Domestik Regional Bruto Provinsi Jawa Barat Atas Dasar Harga Konstan 2000, Menurut Penggunaan
Gross Regional Domestic Product (GRDP) of Jawa Barat at Constant 2000 Prices by Expenditure
(Juta/Million Rp) 2005 – 2006
URAIAN Description 2005*) 2006**)
[1] [2] [3]
01. Pengeluaran Konsumsi Rumah Tangga / 158 610 375,64 165 838 972,39 Private Consumption Expenditures a. Makanan 90 856 756,64 94 710 573,90 b. Bukan Makanan 67 753 619,00 71 128 398,49 02. Pengeluaran Konsumsi Lembaga Nirlaba/ 1 272 929,20 1 333 595,72 Private Non-Profit Consumption Institution Expenditures 03. Pengeluaran Konsumsi Pemerintah/ 14 856 059,44 17 418 342,69 Government Consumption Expenditures 04. Pembentukan Modal Tetap Bruto / 42 337 806,58 44 229 376,66 Gross Fixed Capital Formation
05. Perubahan Stok / Changes in Stock 9 116 063,83 5 305 586,60 06. Ekspor / Export : 147 397 624,61 140 005 963,44 a. Antar Negara / Between Country 101 019 175,86 104 107 057,25 b. Antar Provinsi / Between Province 46 378 448,75 35 898 906,19 07. Impor / Import : 130 655 660,30 116 595 862,36 a. Antar Negara / Between Country 81 356 940,38 64 616 998,07 b. Antar Provinsi / Between Province 49 298 719,91 51 978 864,29
P D R B / G R D P 242 935 199,00 257 535 975,14
Sumber/Source : PDRB Jawa Barat / GRDP of Jawa Barat Catatan /Notes : *) Angka Diperbaiki / Revised Figures **) Angka Sementara / Preliminary Figures
PENDAPATAN REGIONAL
Jawa Barat Dalam Angka 2007 532
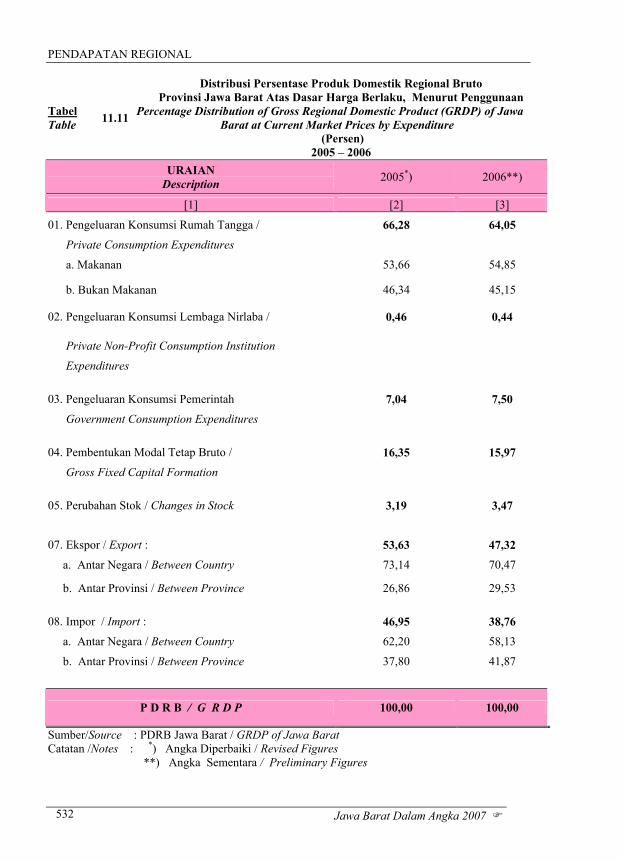
Tabel Table 11.11
Distribusi Persentase Produk Domestik Regional Bruto Provinsi Jawa Barat Atas Dasar Harga Berlaku, Menurut Penggunaan
Percentage Distribution of Gross Regional Domestic Product (GRDP) of Jawa Barat at Current Market Prices by Expenditure
(Persen) 2005 – 2006
URAIAN Description 2005*) 2006**)
[1] [2] [3]
01. Pengeluaran Konsumsi Rumah Tangga / 66,28 64,05
Private Consumption Expenditures
a. Makanan 53,66 54,85
b. Bukan Makanan 46,34 45,15
02. Pengeluaran Konsumsi Lembaga Nirlaba / 0,46 0,44
Private Non-Profit Consumption Institution
Expenditures 03. Pengeluaran Konsumsi Pemerintah 7,04 7,50
Government Consumption Expenditures 04. Pembentukan Modal Tetap Bruto / 16,35 15,97
Gross Fixed Capital Formation
05. Perubahan Stok / Changes in Stock 3,19 3,47
07. Ekspor / Export : 53,63 47,32
a. Antar Negara / Between Country 73,14 70,47
b. Antar Provinsi / Between Province 26,86 29,53 08. Impor / Import : 46,95 38,76
a. Antar Negara / Between Country 62,20 58,13
b. Antar Provinsi / Between Province 37,80 41,87
P D R B / G R D P 100,00 100,00
Sumber/Source : PDRB Jawa Barat / GRDP of Jawa Barat Catatan /Notes : *) Angka Diperbaiki / Revised Figures **) Angka Sementara / Preliminary Figures
REGIONAL INCOME
Jawa Barat Dalam Angka 2007 533
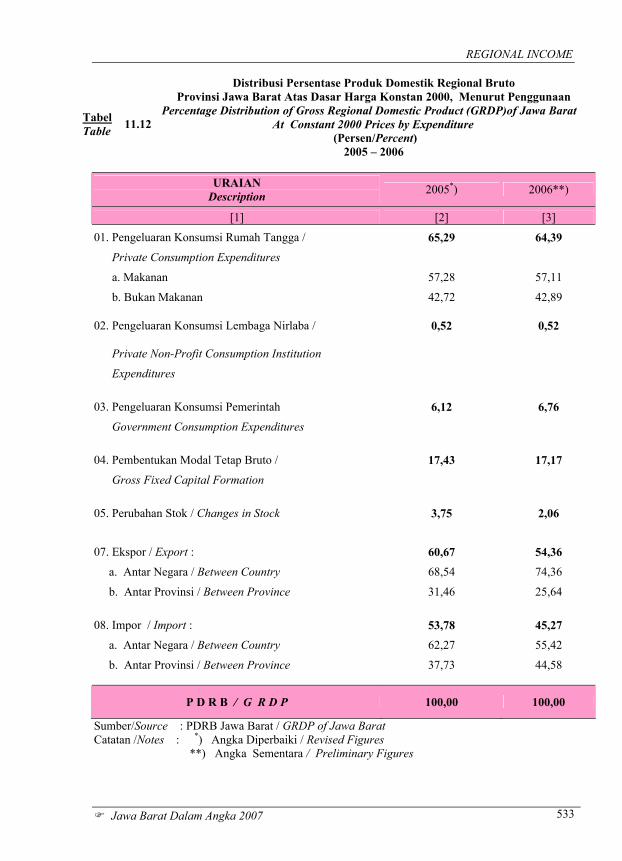
Tabel Table 11.12
Distribusi Persentase Produk Domestik Regional Bruto Provinsi Jawa Barat Atas Dasar Harga Konstan 2000, Menurut Penggunaan
Percentage Distribution of Gross Regional Domestic Product (GRDP)of Jawa Barat At Constant 2000 Prices by Expenditure
(Persen/Percent) 2005 – 2006
URAIAN
Description 2005*) 2006**)
[1] [2] [3]
01. Pengeluaran Konsumsi Rumah Tangga / 65,29 64,39
Private Consumption Expenditures
a. Makanan 57,28 57,11
b. Bukan Makanan 42,72 42,89
02. Pengeluaran Konsumsi Lembaga Nirlaba / 0,52 0,52
Private Non-Profit Consumption Institution
Expenditures 03. Pengeluaran Konsumsi Pemerintah 6,12 6,76
Government Consumption Expenditures 04. Pembentukan Modal Tetap Bruto / 17,43 17,17
Gross Fixed Capital Formation
05. Perubahan Stok / Changes in Stock 3,75 2,06
07. Ekspor / Export : 60,67 54,36
a. Antar Negara / Between Country 68,54 74,36
b. Antar Provinsi / Between Province 31,46 25,64 08. Impor / Import : 53,78 45,27
a. Antar Negara / Between Country 62,27 55,42
b. Antar Provinsi / Between Province 37,73 44,58
P D R B / G R D P 100,00 100,00
Sumber/Source : PDRB Jawa Barat / GRDP of Jawa Barat Catatan /Notes : *) Angka Diperbaiki / Revised Figures **) Angka Sementara / Preliminary Figures