6. DAFTAR PUSTAKA - repository.unika.ac.idrepository.unika.ac.id/1185/7/04.70.0151 L. Yuniar Okki...
22
6. DAFTAR PUSTAKA Almatsier, S. (2002). Prinsip Dasar Ilmu Gizi. PT Gramedia Pustaka Utama. Jakarta. Andarwulan dan Sutrisno.( 1992). Kimia Vitamin. Rajawali Pers. Jakarta. Apandi, M. (1984). Teknologi Buah dan Sayur. Alumni. Bandung. Astawan, M. (2008). Sehat Bersama Tomat. http://health.kompas.com/read/2008/10/12/1612441/Sehat.Bersama.Tomat Batu, A. and A.K. Thompson. 1998. Effect of Modified Atmosphere Packaging on Post Harvest Qualities of Pink Tomatoes. Journal of Agriculture and Forestry 22(1998): 365-372. Bourne, M. C. (2002). Food Texture and Viscocity : Concept and Measurement. Academic Press. London. deMan, J.M. (1997). Principles of Food Chemistry (Terjemahan: Kimia Makanan, diterjemahkan Padmawinata). Penerbit Institut Teknologi Bandung. Bandung Direktorat Gizi Dept. Kes. R.I. 1990. Daftar Komposisi Bahan Makanan. Penerbit Bhratar. Jakarta Fellows, P. (1990). Food Processing Technology Principles and Practise. Ellis Howard Limited. England. Kartasapoetra, A.G. (1994). Teknologi Penanganan Pasca Panen. Bina Aksara, Jakarta. Liu, F.W. 1999. Postharvest Handling in Asia 2 Horticultural Crops. http://www.agnet.org/library.php?func=view&id=20110715234145&type_id=4 Pudjiatmoko dan Atani.T, 2008. Budidaya Tomat. BBPP Lembang. Lembang. Sjaifullah. (1996). Petunjuk Memilih Buah Segar. Penebar Swadaya. Jakarta. Smith, A. F. (1994). The Tomato in America: Early History, Culture, and Cookery. Columbia SC, USA: University of South Carolina Press. ISBN 1-57003-000-6. Sudarmadji, S; B. Haryono dan Suhardi. (1997). Analisa Bahan Makanan dan Pertanian. Liberty. Yogyakarta. Syarief, R. dan A. Irawaty. (1988). Pengetahuan Bahan untuk Industri Pertanian. Mediyatama Sarana Perkasa, Jakarta. Tranggono, Z. Noor, D. Wibowo, M. Gardjito dan M. Astuti. (1989). Kimia, Nutrisi Pangan Pusat Antar Universitas Pangan dan Gizi UGM. Yogyakarta.
Transcript of 6. DAFTAR PUSTAKA - repository.unika.ac.idrepository.unika.ac.id/1185/7/04.70.0151 L. Yuniar Okki...

6. DAFTAR PUSTAKA
Almatsier, S. (2002). Prinsip Dasar Ilmu Gizi. PT Gramedia Pustaka Utama. Jakarta.
Andarwulan dan Sutrisno.( 1992). Kimia Vitamin. Rajawali Pers. Jakarta.
Apandi, M. (1984). Teknologi Buah dan Sayur. Alumni. Bandung.
Astawan, M. (2008). Sehat Bersama Tomat.
http://health.kompas.com/read/2008/10/12/1612441/Sehat.Bersama.Tomat
Batu, A. and A.K. Thompson. 1998. Effect of Modified Atmosphere Packaging on Post
Harvest Qualities of Pink Tomatoes. Journal of Agriculture and
Forestry 22(1998): 365-372.
Bourne, M. C. (2002). Food Texture and Viscocity : Concept and Measurement.
Academic Press. London.
deMan, J.M. (1997). Principles of Food Chemistry (Terjemahan: Kimia Makanan,
diterjemahkan Padmawinata). Penerbit Institut Teknologi Bandung. Bandung
Direktorat Gizi Dept. Kes. R.I. 1990. Daftar Komposisi Bahan Makanan. Penerbit
Bhratar. Jakarta
Fellows, P. (1990). Food Processing Technology Principles and Practise. Ellis Howard
Limited. England.
Kartasapoetra, A.G. (1994). Teknologi Penanganan Pasca Panen. Bina Aksara, Jakarta.
Liu, F.W. 1999. Postharvest Handling in Asia 2 Horticultural Crops.
http://www.agnet.org/library.php?func=view&id=20110715234145&type_id=4
Pudjiatmoko dan Atani.T, 2008. Budidaya Tomat. BBPP Lembang. Lembang.
Sjaifullah. (1996). Petunjuk Memilih Buah Segar. Penebar Swadaya. Jakarta.
Smith, A. F. (1994). The Tomato in America: Early History, Culture, and Cookery.
Columbia SC, USA: University of South Carolina Press. ISBN 1-57003-000-6.
Sudarmadji, S; B. Haryono dan Suhardi. (1997). Analisa Bahan Makanan dan Pertanian.
Liberty. Yogyakarta.
Syarief, R. dan A. Irawaty. (1988). Pengetahuan Bahan untuk Industri Pertanian.
Mediyatama Sarana Perkasa, Jakarta.
Tranggono, Z. Noor, D. Wibowo, M. Gardjito dan M. Astuti. (1989). Kimia, Nutrisi
Pangan Pusat Antar Universitas Pangan dan Gizi UGM. Yogyakarta.

Tranggono dan Sutardi, 1990. Biokimia dan Teknologi Pasca Panen. Pusat Antar
Universitas Pangan Dan Gizi, Gadjah Mada University Press, Yogyakarta.
Wills, R.H.H., T.H. Lee, D. Graham W.B. Mc Glasson and E.G. Hall. (1981).
Postharvest An Introduction The Physiology and Handling of Fruit and
Vegetable. New South Wales Un. Press. Sydney.
Winarno, F. G. , S. Fardiaz, dan D. Fardiaz. (1984). Pengantar Teknologi Pangan.
Gramedia Pustaka Utama, Jakarta.
Winarno, F. G. (1993). Pangan Gizi, Teknologi dan Konsumen. PT Gramedia Pustaka
Utama. Jakarta.
Winarno, F.G., (2004). Kimia Pangan dan Gizi. Gramedia Pustaka Utama, Jakarta.

7. LAMPIRAN
Lampiran 1. Hasil uji regresi eksponensial variabel fisik tomat pada diameter
Model Summary
R R Square
Adjusted R
Square
Std. Error of
the Estimate
.973 .947 .976 .034
The independent variable is hari.
ANOVA
Sum of
Squares df Mean Square F Sig.
Regression .190 1 .190 166.883 .001
Residual .003 3 .001
Total .193 4
The independent variable is hari.
Coefficients
Unstandardized
Coefficients
Standardized
Coefficients
t Sig. B Std. Error Beta
hari -.0027 .003 -.991 -12.918 .001
(Constant) 4.232 .025 169.280 .000
The dependent variable is In(kontrol).
Model Summary
R R Square
Adjusted R
Square
Std. Error of
the Estimate
.888 .790 .788 .035
The independent variable is hari.
ANOVA
Sum of
Squares df Mean Square F Sig.
Regression .190 1 .190 154.745 .001
Residual .003 3 .001
Total .193 4

Model Summary
R R Square
Adjusted R
Square
Std. Error of
the Estimate
.888 .790 .788 .035
The independent variable is hari.
Coefficients
Unstandardized
Coefficients
Standardized
Coefficients
t Sig. B Std. Error Beta
hari -.0016 .003 -.990 -12.440 .001
(Constant) 4.260 .026 163.846 .000
The dependent variable is In(HS20).
Model Summary
R R Square
Adjusted R
Square
Std. Error of
the Estimate
.993 .987 .973 .027
The independent variable is hari.
ANOVA
Sum of
Squares df Mean Square F Sig.
Regression .107 1 .107 147.789 .001
Residual .002 3 .001
Total .109 4
The independent variable is hari.
Coefficients
Unstandardized
Coefficients
Standardized
Coefficients
t Sig. B Std. Error Beta
hari -.0027 .002 -.990 -12.157 .001
(Constant) 4.042 .020 202.100 .000
The dependent variable is In(HS40).

Model Summary
R R Square
Adjusted R
Square
Std. Error of
the Estimate
.946 .896 .876 .040
The independent variable is hari.
ANOVA
Sum of
Squares df Mean Square F Sig.
Regression .062 1 .062 39.469 .008
Residual .005 3 .002
Total .067 4
The independent variable is hari.
Coefficients
Unstandardized
Coefficients
Standardized
Coefficients
t Sig. B Std. Error Beta
hari -.0025 .003 -.964 -6.282 .008
(Constant) 3.952 .031 127.483 .000
The dependent variable is In(HS60).
Model Summary
R R Square
Adjusted R
Square
Std. Error of
the Estimate
.995 .991 .952 .064
The independent variable is hari.
ANOVA
Sum of
Squares df Mean Square F Sig.
Regression .335 1 .335 80.739 .003
Residual .012 3 .012
Total .348 4
The independent variable is hari.

Coefficients
Unstandardized
Coefficients
Standardized
Coefficients
t Sig. B Std. Error Beta
hari -.0042 .005 -.982 -8.985 .003
(Constant) 4.010 .048 83.541 .000
The dependent variable is In(HS80).
Lampiran 2. Hasil uji regresi eksponensial variabel fisik tomat pada berat
Model Summary
R R Square
Adjusted R
Square
Std. Error of
the Estimate
0.996 .993 .993 .002
The independent variable is hari.
ANOVA
Sum of
Squares df Mean Square F Sig.
Regression .019 1 .019 4950.101 .000
Residual .000 3 .001
Total .019 4
The independent variable is hari.
Coefficients
Unstandardized
Coefficients
Standardized
Coefficients
t Sig. B Std. Error Beta
hari -.883 .000 -1.000 -70.357 .000
(Constant) 56.502 .166 340.373 .000
The dependent variable is In(kontrol).
Model Summary
R R Square
Adjusted R
Square
Std. Error of
the Estimate
.980 .961 .991 .005

Model Summary
R R Square
Adjusted R
Square
Std. Error of
the Estimate
.980 .961 .991 .005
The independent variable is hari.
ANOVA
Sum of
Squares df Mean Square F Sig.
Regression .010 1 .010 462.991 .001
Residual .000 3 .000
Total .010 4
The independent variable is hari.
Coefficients
Unstandardized
Coefficients
Standardized
Coefficients
t Sig. B Std. Error Beta
hari -.451 .000 -.997 -21.517 .000
(Constant) 57.060 1.597 35.729 .000
The dependent variable is In(HS20).
Model Summary
R R Square
Adjusted R
Square
Std. Error of
the Estimate
.947 .897 .942 .014
The independent variable is hari.
ANOVA
Sum of
Squares df Mean Square F Sig.
Regression .013 1 .013 65.675 .004
Residual .001 3 .000
Total .014 4
The independent variable is hari.

Coefficients
Unstandardized
Coefficients
Standardized
Coefficients
t Sig. B Std. Error Beta
hari -.131 .001 -.978 -8.104 .001
(Constant) 62.204 3.535 17.596 .000
The dependent variable is In(HS40).
Model Summary
R R Square
Adjusted R
Square
Std. Error of
the Estimate
.886 .785 .997 .004
The independent variable is hari.
ANOVA
Sum of
Squares df Mean Square F Sig.
Regression .018 1 .018 1274.534 .000
Residual .000 3 .000
Total .018 4
The independent variable is hari.
Coefficients
Unstandardized
Coefficients
Standardized
Coefficients
t Sig. B Std. Error Beta
hari -.364 .001 -.986 -10.429 .002
(Constant) 57.630 2.077 27.746 .000
The dependent variable is In(HS60).
Model Summary
R R Square
Adjusted R
Square
Std. Error of
the Estimate
.979 .960 .997 .004
Model Summary
R R Square
Adjusted R
Square
Std. Error of
the Estimate
.979 .960 .997 .004
The independent variable is hari.
ANOVA
Sum of
Squares df Mean Square F Sig.
Regression .018 1 .018 1274.534 .000
Residual .000 3 .000
Total .018 4
The independent variable is hari.
Coefficients
Unstandardized
Coefficients
Standardized
Coefficients
t Sig. B Std. Error Beta
hari -.363 .000 -.999 -35.701 .000
(Constant) 36.712 .325 112.960 .000
The dependent variable is In(HS80).
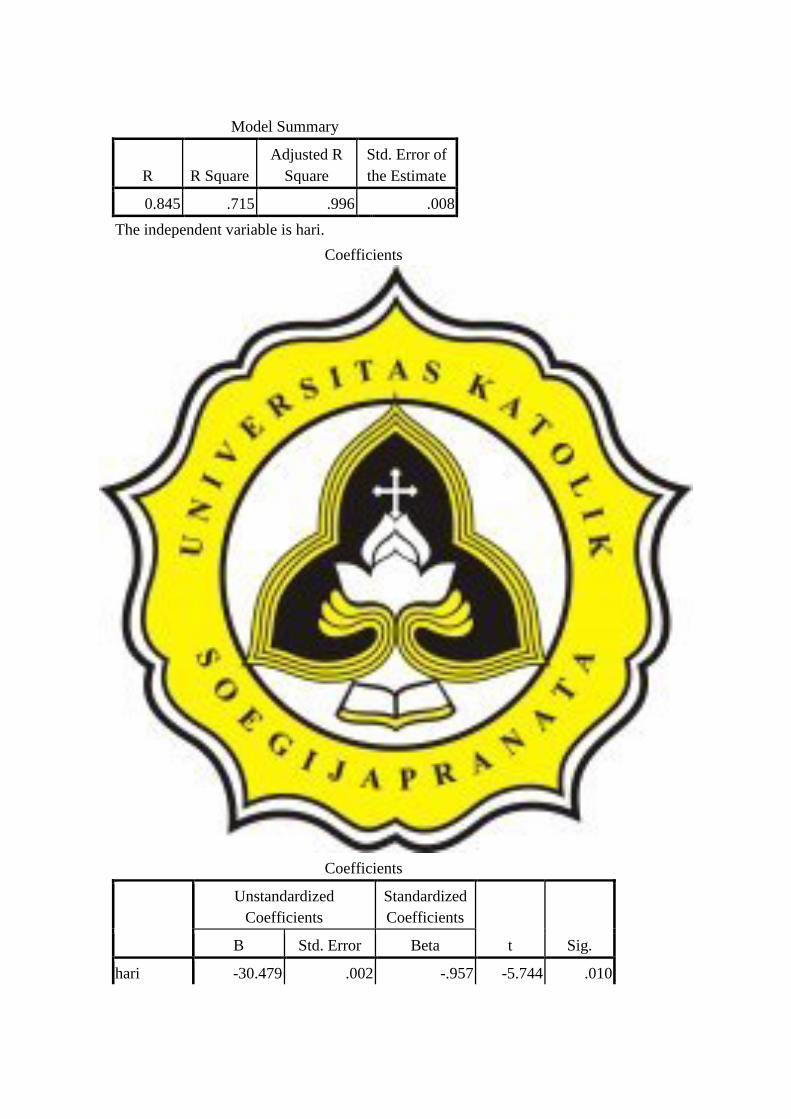
Lampiran 3. Hasil uji regresi eksponensial variabel fisik tomat pada tekstur
Model Summary
R R Square
Adjusted R
Square
Std. Error of
the Estimate
0.845 .715 .996 .008
The independent variable is hari.
ANOVA
Sum of
Squares df Mean Square F Sig.
Regression .056 1 .056 967.300 .000
Residual .000 3 .000
Total .056 4
Model Summary
R R Square
Adjusted R
Square
Std. Error of
the Estimate
0.845 .715 .996 .008
The independent variable is hari.
Coefficients
Unstandardized
Coefficients
Standardized
Coefficients
t Sig. B Std. Error Beta
hari -30.479 .001 -.998 -31.101 .000
(Constant) 2388.444 .207
11538.37
6 .000
The dependent variable is In(kontrol).
Model Summary
R R Square
Adjusted R
Square
Std. Error of
the Estimate
.975 .951 .889 .028
The independent variable is hari.
ANOVA
Sum of
Squares df Mean Square F Sig.
Regression .026 1 .026 32.994 .010
Residual .002 3 .001
Total .029 4
The independent variable is hari.
Coefficients
Unstandardized
Coefficients
Standardized
Coefficients
t Sig. B Std. Error Beta
hari -30.479 .002 -.957 -5.744 .010
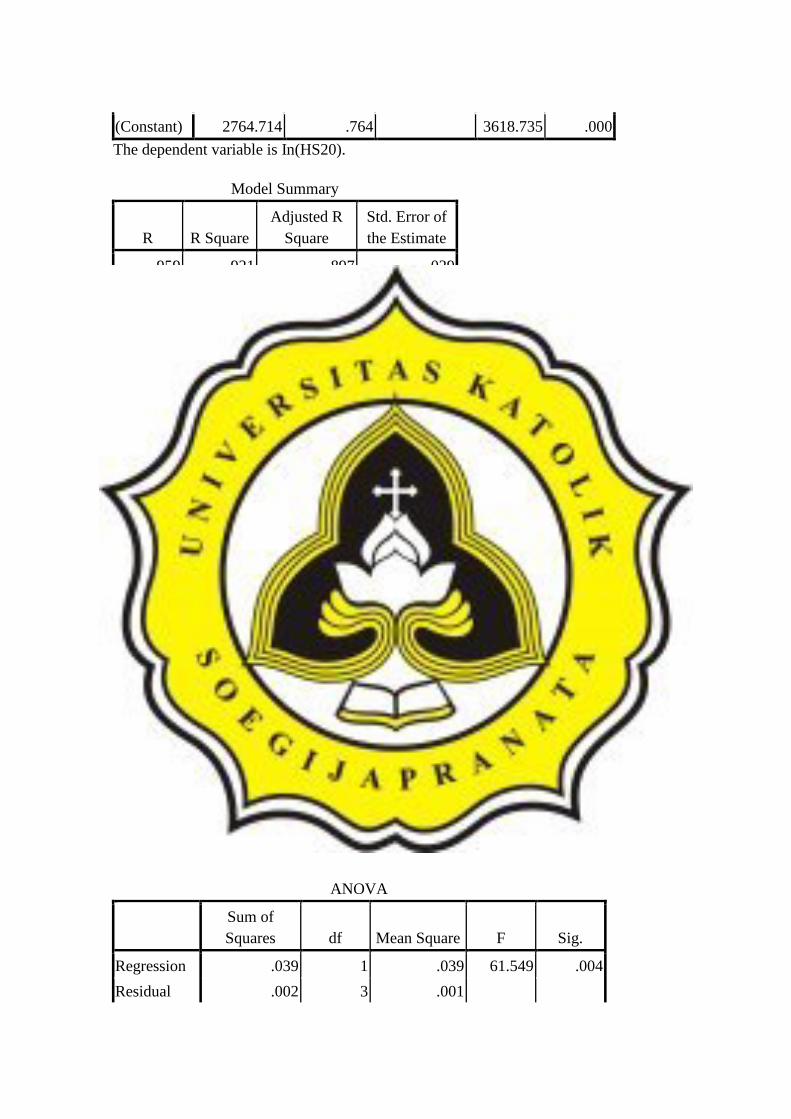
(Constant) 2764.714 .764 3618.735 .000
The dependent variable is In(HS20).
Model Summary
R R Square
Adjusted R
Square
Std. Error of
the Estimate
.959 .921 .897 .029
The independent variable is hari.
ANOVA
Sum of
Squares df Mean Square F Sig.
Regression .030 1 .030 35.931 .009
Residual .002 3 .001
Total .032 4
The independent variable is hari.
Coefficients
Unstandardized
Coefficients
Standardized
Coefficients
t Sig. B Std. Error Beta
hari -20.857 .002 -.961 -5.994 .009
(Constant) 2827.272 .769 3676.556 .000
The dependent variable is In(HS40).
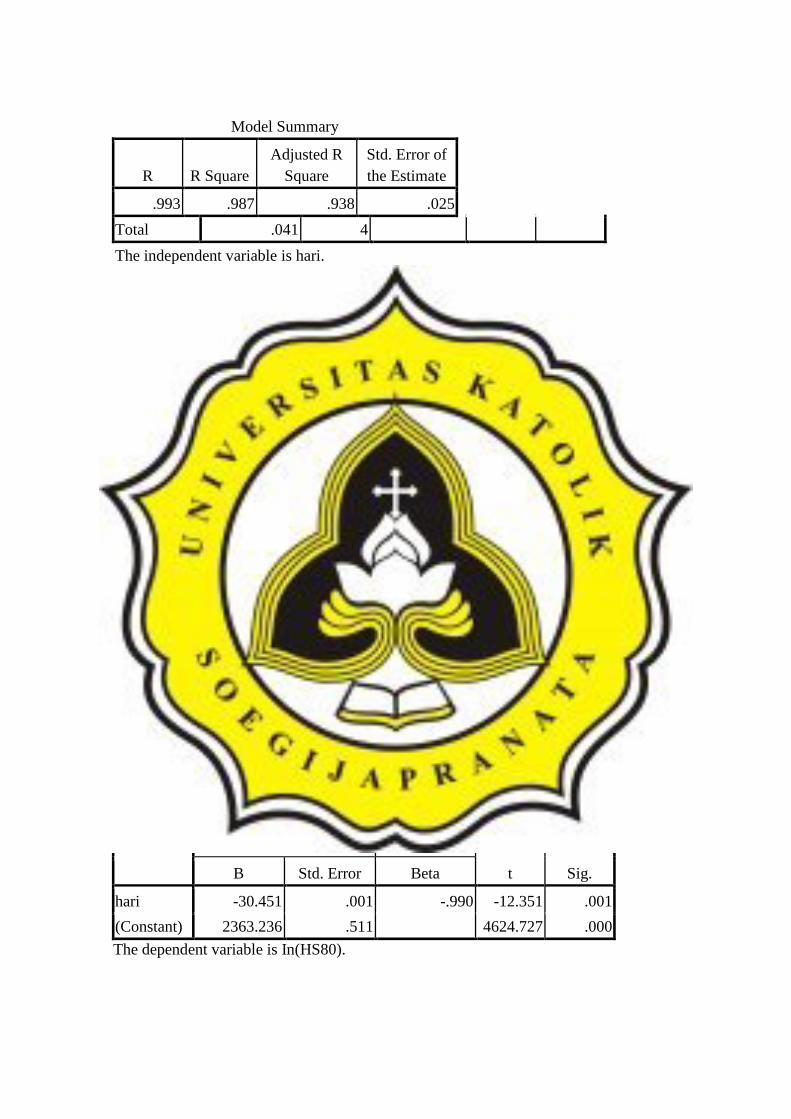
Model Summary
R R Square
Adjusted R
Square
Std. Error of
the Estimate
.993 .987 .938 .025
The independent variable is hari.
ANOVA
Sum of
Squares df Mean Square F Sig.
Regression .039 1 .039 61.549 .004
Residual .002 3 .001
Model Summary
R R Square
Adjusted R
Square
Std. Error of
the Estimate
.993 .987 .938 .025
Total .041 4
The independent variable is hari.
Coefficients
Unstandardized
Coefficients
Standardized
Coefficients
t Sig. B Std. Error Beta
hari -19.731 .002 -.976 -7.845 .004
(Constant) 2438.302 .682 3575.222 .000
The dependent variable is In(HS60).
Model Summary
R R Square
Adjusted R
Square
Std. Error of
the Estimate
.961 .924 .974 .018
The independent variable is hari.
ANOVA
Sum of
Squares df Mean Square F Sig.
Regression .052 1 .052 152.542 .001
Residual .001 3 .000
Total .053 4
The independent variable is hari.
Coefficients
Unstandardized
Coefficients
Standardized
Coefficients
t Sig. B Std. Error Beta
hari -30.451 .001 -.990 -12.351 .001
(Constant) 2363.236 .511 4624.727 .000
The dependent variable is In(HS80).
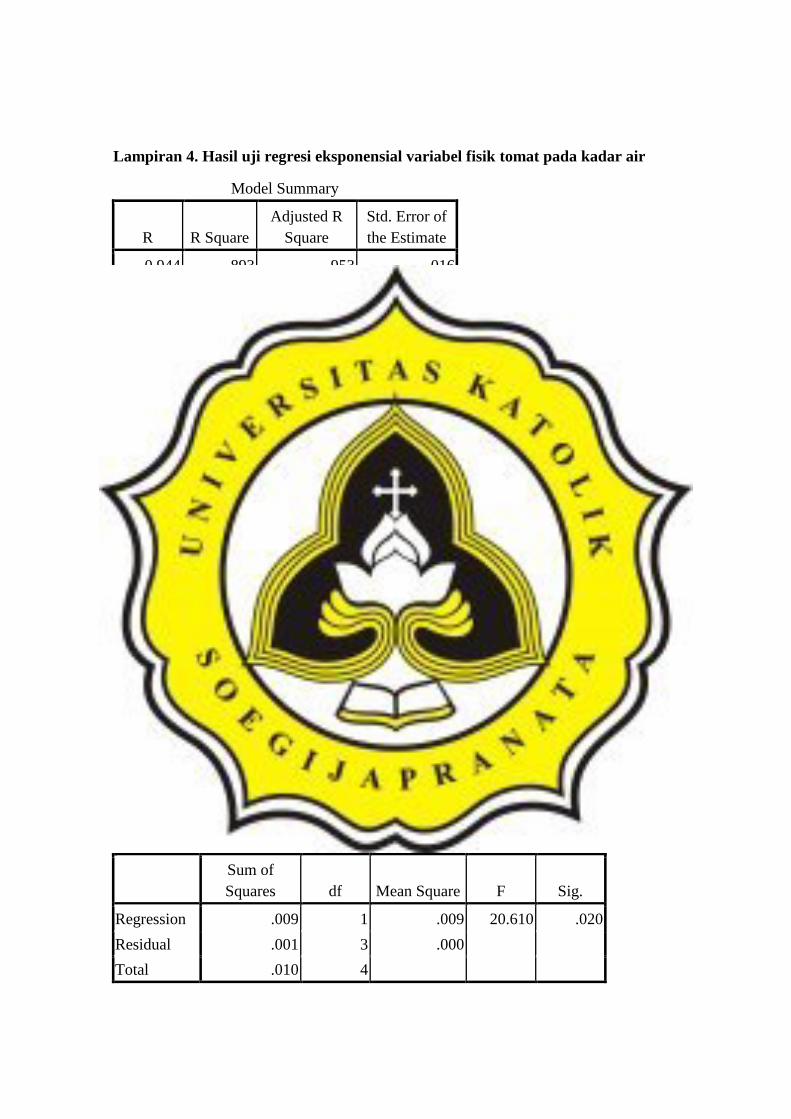
Lampiran 4. Hasil uji regresi eksponensial variabel fisik tomat pada kadar air
Model Summary
R R Square
Adjusted R
Square
Std. Error of
the Estimate
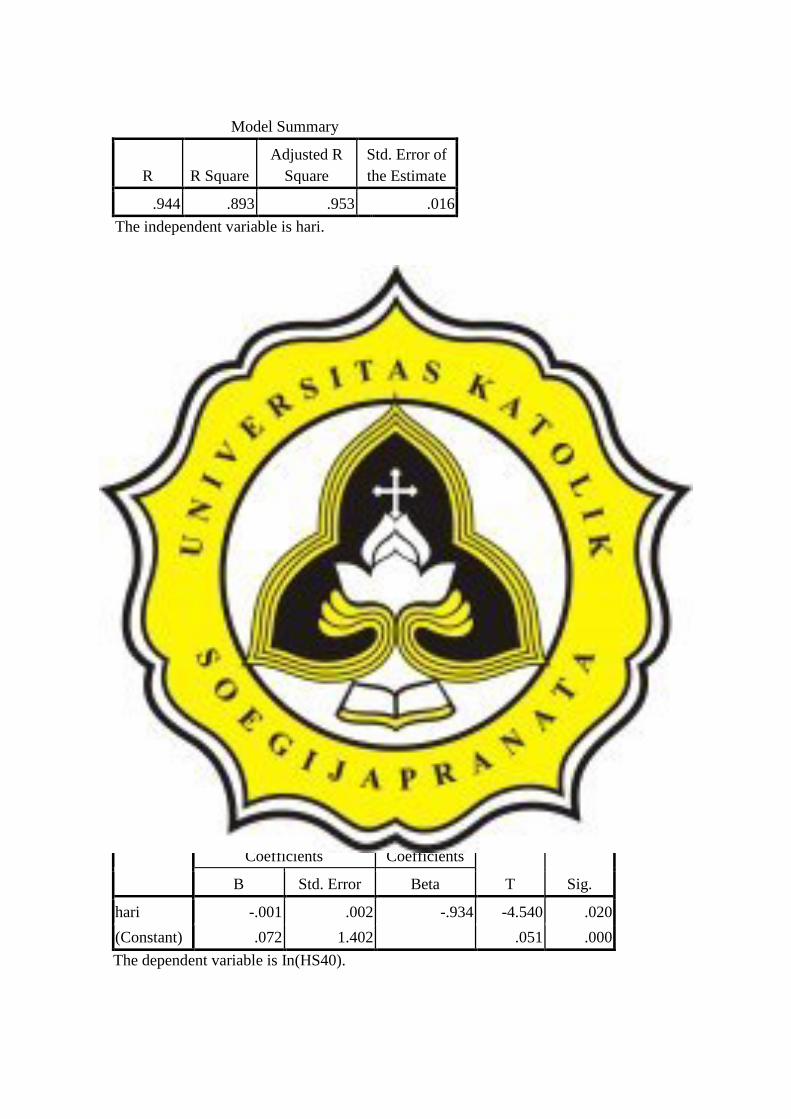
0.944 .893 .953 .016
The independent variable is hari.
ANOVA
Sum of
Squares df Mean Square F Sig.
Regression .022 1 .022 82.961 .003
Residual .001 3 .000
Total .022 4
The independent variable is hari.
Coefficients
Unstandardized
Coefficients
Standardized
Coefficients
T Sig. B Std. Error Beta
hari -.001 .001 -.982 -9.108 .003
(Constant) .068 1.114 .061 .000
The dependent variable is In(kontrol).
Model Summary
R R Square
Adjusted R
Square
Std. Error of
the Estimate
.944 .893 .953 .016
The independent variable is hari.
ANOVA
Sum of
Squares df Mean Square F Sig.
Regression .009 1 .009 20.610 .020
Residual .001 3 .000
Total .010 4
Model Summary
R R Square
Adjusted R
Square
Std. Error of
the Estimate
.944 .893 .953 .016
The independent variable is hari.
Coefficients
Unstandardized
Coefficients
Standardized
Coefficients
t Sig. B Std. Error Beta
hari -.001 .002 -.934 -4.540 .020
(Constant) .072 1.402 .051 .000
The dependent variable is In(HS20).
Model Summary
R R Square
Adjusted R
Square
Std. Error of
the Estimate
.944 .893 .953 .016
The independent variable is hari.
ANOVA
Sum of
Squares df Mean Square F Sig.
Regression .013 1 .013 41.921 .007
Residual .001 3 .000
Total .013 4
The independent variable is hari.
Coefficients
Unstandardized
Coefficients
Standardized
Coefficients
T Sig. B Std. Error Beta
hari -.001 .002 -.934 -4.540 .020
(Constant) .072 1.402 .051 .000
The dependent variable is In(HS40).

Model Summary
R R Square
Adjusted R
Square
Std. Error of
the Estimate
.944 .893 .953 .016
The independent variable is hari.
ANOVA
Sum of
Squares Df Mean Square F Sig.
Regression .017 1 .017 342.154 .000
Residual .000 3 .000
Total .017 4
The independent variable is hari.
Coefficients
Unstandardized
Coefficients
Standardized
Coefficients
t Sig. B Std. Error Beta
hari -.001 .001 -.996 -18.497 .000
(Constant) .082 .479 .171 .000
The dependent variable is In(HS60).
Model Summary
R R Square
Adjusted R
Square
Std. Error of
the Estimate
.944 .893 .953 .016
The independent variable is hari.
ANOVA
Sum of
Squares df Mean Square F Sig.
Regression .020 1 .020 62.630 .004
Residual .001 3 .000
Total .021 4
Model Summary
R R Square
Adjusted R
Square
Std. Error of
the Estimate
.944 .893 .953 .016
The independent variable is hari.
Coefficients
Unstandardized
Coefficients
Standardized
Coefficients
t Sig. B Std. Error Beta
hari -.001 .001 -.977 -7.914 .004
(Constant) .078 1.231 .063 .000
The dependent variable is In(HS80).
Lampiran 5. Hasil uji regresi eksponensial variabel fisik tomat pada pH
Model Summary
R R Square
Adjusted R
Square
Std. Error of
the Estimate
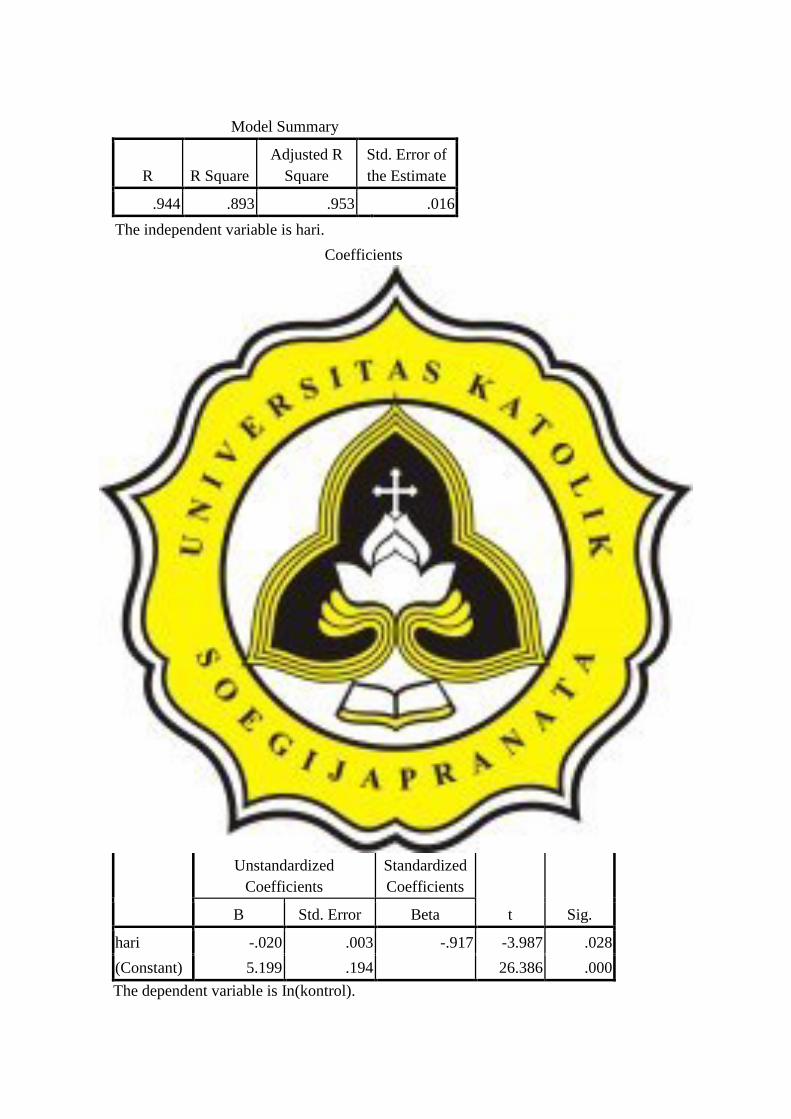
0.989 .979 .788 .041
The independent variable is hari.
ANOVA
Sum of
Squares df Mean Square F Sig.
Regression .027 1 .027 15.894 .028
Residual .005 3 .002
Total .032 4
The independent variable is hari.
Coefficients
Unstandardized
Coefficients
Standardized
Coefficients
t Sig. B Std. Error Beta
hari -.020 .003 -.917 -3.987 .028
(Constant) 5.199 .194 26.386 .000
The dependent variable is In(kontrol).

Model Summary
R R Square
Adjusted R
Square
Std. Error of
the Estimate
.782 .612 .699 .049
The independent variable is hari.
ANOVA
Sum of
Squares df Mean Square F Sig.
Regression .025 1 .025 10.270 .049
Residual .007 3 .002
Total .032 4
The independent variable is hari.
Coefficients
Unstandardized
Coefficients
Standardized
Coefficients
t Sig. B Std. Error Beta
hari -.012 .004 -.880 -3.205 .049
(Constant) 5.278 .220 23.990 .000
The dependent variable is In(HS20).
Model Summary
R R Square
Adjusted R
Square
Std. Error of
the Estimate
.997 .995 .661 .049
The independent variable is hari.
ANOVA
Sum of
Squares Df Mean Square F Sig.
Regression .022 1 .022 8.812 .059
Residual .007 3 .002
Total .029 4
The independent variable is hari.

Coefficients
Unstandardized
Coefficients
Standardized
Coefficients
t Sig. B Std. Error Beta
hari -.006 .004 -.864 -2.969 .059
(Constant) 5.208 .223 23.354 .000
The dependent variable is In(HS40).
Model Summary
R R Square
Adjusted R
Square
Std. Error of
the Estimate
.986 .973 .664 .049
The independent variable is hari.
ANOVA
Sum of
Squares Df Mean Square F Sig.
Regression .021 1 .021 8.897 .058
Residual .007 3 .002
Total .028 4
The independent variable is hari.
Coefficients
Unstandardized
Coefficients
Standardized
Coefficients
t Sig. B Std. Error Beta
hari -.020 .004 -.865 -2.983 .058
(Constant) 5.176 .222 23.315 .000
The dependent variable is In(HS60).
Model Summary
R R Square
Adjusted R
Square
Std. Error of
the Estimate
.964 .930 .636 .055
The independent variable is hari.
ANOVA

Sum of
Squares Df Mean Square F Sig.
Regression .024 1 .024 7.985 .066
Residual .009 3 .003
Total .033 4
The independent variable is hari.
Coefficients
Unstandardized
Coefficients
Standardized
Coefficients
t Sig. B Std. Error Beta
hari -.005 .004 -.853 -2.826 .066
(Constant) 5.254 . 251 20.932 .000
The dependent variable is In(HS80).
Lampiran 6. Hasil uji regresi eksponensial variabel fisik tomat pada vitamin C
Model Summary
R R Square
Adjusted R
Square
Std. Error of
the Estimate
0.830 .690 .769 .120
The independent variable is hari.
ANOVA
Sum of
Squares df Mean Square F Sig.
Regression .205 1 .205 14.350 .032
Residual .043 3 .014
Total .248 4
The independent variable is hari.
Coefficients
Unstandardized
Coefficients
Standardized
Coefficients
t Sig. B Std. Error Beta
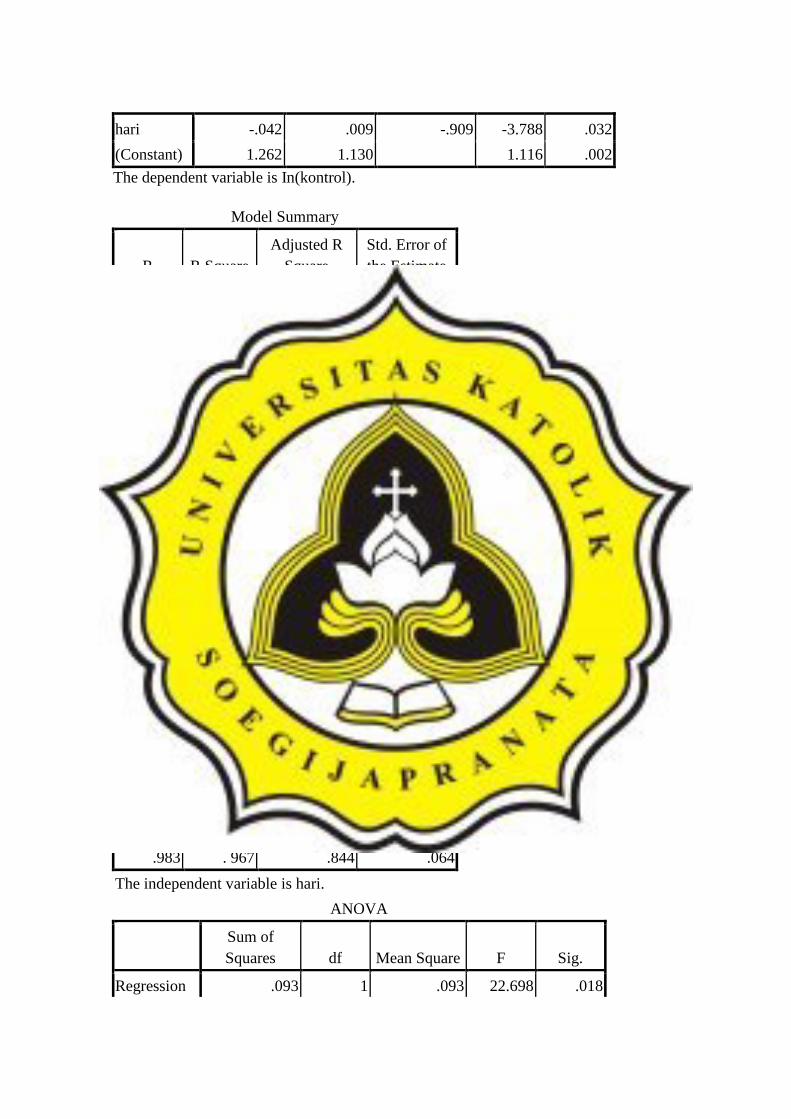
hari -.042 .009 -.909 -3.788 .032
(Constant) 1.262 1.130 1.116 .002
The dependent variable is In(kontrol).
Model Summary
R R Square
Adjusted R
Square
Std. Error of
the Estimate
.987 .976 .808 .062
The independent variable is hari.
ANOVA
Sum of
Squares Df Mean Square F Sig.
Regression .069 1 .069 17.847 .024
Residual .012 3 .004
Total .080 4
The independent variable is hari.
Coefficients
Unstandardized
Coefficients
Standardized
Coefficients
t Sig. B Std. Error Beta
hari -.048 .005 -.925 -4.225 .024
(Constant) 1.348 .533 2.529 .000
The dependent variable is In(HS20).
Model Summary
R R Square
Adjusted R
Square
Std. Error of
the Estimate
.983 . 967 .844 .064
The independent variable is hari.
ANOVA
Sum of
Squares df Mean Square F Sig.
Regression .093 1 .093 22.698 .018
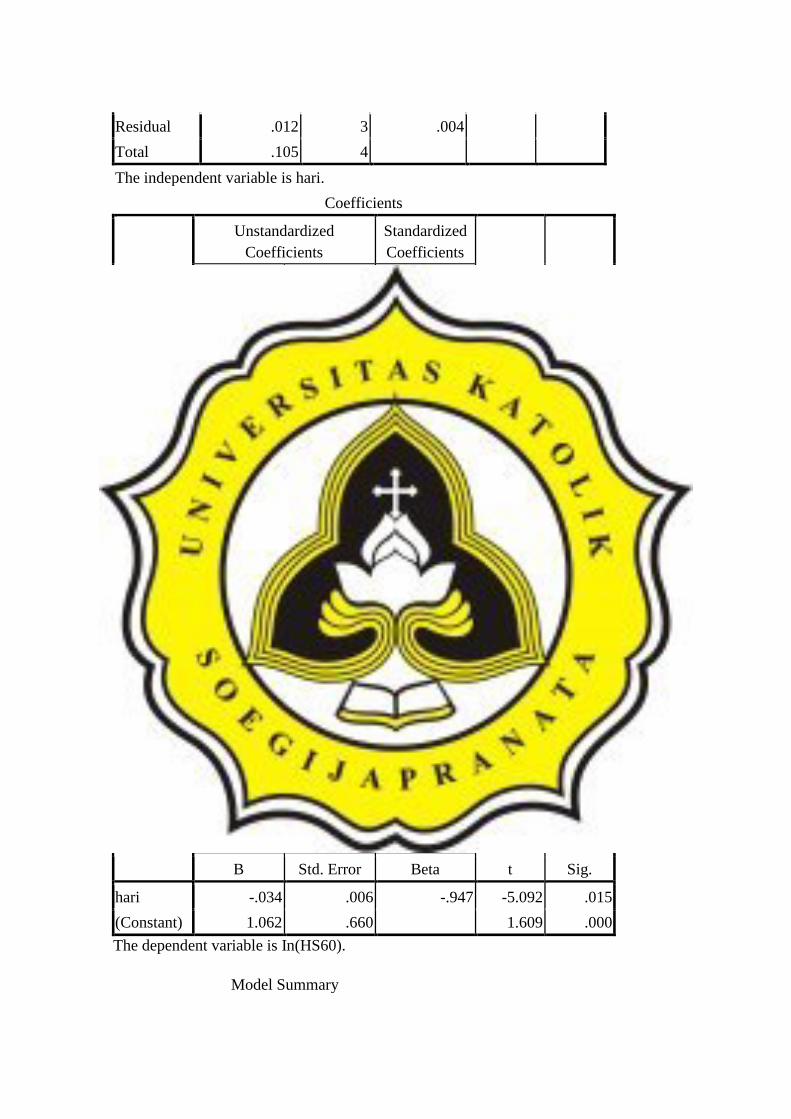
Residual .012 3 .004
Total .105 4
The independent variable is hari.
Coefficients
Unstandardized
Coefficients
Standardized
Coefficients
t Sig. B Std. Error Beta
hari -.031 .005 -.940 -4.764 .018
(Constant) 1.050 .546 1.923 .000
The dependent variable is In(HS40).
Model Summary
R R Square
Adjusted R
Square
Std. Error of
the Estimate
.976 .953 .862 .072
The independent variable is hari.
ANOVA
Sum of
Squares df Mean Square F Sig.
Regression .135 1 .135 25.930 .015
Residual .016 3 .005
Total .150 4
The independent variable is hari.
Coefficients
Unstandardized
Coefficients
Standardized
Coefficients
t Sig. B Std. Error Beta
hari -.034 .006 -.947 -5.092 .015
(Constant) 1.062 .660 1.609 .000
The dependent variable is In(HS60).
Model Summary

R R Square
Adjusted R
Square
Std. Error of
the Estimate
.950 .904 .798 .098
The independent variable is hari.
ANOVA
Sum of
Squares df Mean Square F Sig.
Regression .162 1 .162 16.813 .026
Residual .029 3 .010
Total .191 4
The independent variable is hari.
Coefficients
Unstandardized
Coefficients
Standardized
Coefficients
t Sig. B Std. Error Beta
hari -.038 .008 -.921 -4.100 .026
(Constant) 1.032 .905 1.140 .001
The dependent variable is In(HS80).