24 Mei, 2019 - miraeasset.co.id · SIDO: Sido Muncul (SIDO) berharap ekspor semakin besar di tahun...
18
To subscribe to our Daily Focus, please contact us at [email protected] Mirae Asset Sekuritas Indonesia 24 Mei, 2019 Market Index Last Trade Chg (%) MoM YoY JCI 6,032.7 1.6 -7.9 -0.1 MSCI Indonesia 23.6 2.6 -11.8 -7.8 MSCI EM 984.8 -1.3 -8.0 -12.1 HANG SENG 27,267.1 -1.6 -7.0 -9.9 KOSPI 2,059.6 -0.5 -6.4 -16.5 FTSE 7,231.0 -1 -1.8 -5.0 DJIA 25,490.5 -1.1 -3.1 3.9 NASDAQ 7,628.3 -1.6 -4.3 4.4 Valuation 2018F P/E (x) P/B (x) ROE (%) JCI 14.6 2.2 17.5 Key Rates Last Trade Chg (bps) MoM YoY BI 7-Day RR 6.00 0 25 -100 3yr 7.32 -7 27 22 10yr 7.99 -11 30 41 FX Last Trade Chg (%) MoM YoY USD/IDR 14,480.0 -0.3 3.2 2.2 USD/KRW 1,189.2 -0.3 3.3 10.1 USD/JPY 109.6 -0.7 -2.3 0.3 USD/CNY 6.9 0.1 2.7 8.1 Commodities Last Trade Chg (%) MoM YoY WTI 57.9 -5.7 -12.1 10.5 Gold 1,283.5 0.8 0.6 -1.6 Coal 83.8 -0.3 -1.0 -20.0 Palm Oil 1,974.0 -1.7 -5.1 -19.8 Rubber 147.6 0.5 3.2 5.4 Nickel 11,895.0 -0.7 -4.0 -18.8 Copper 5,926.0 0.0 -8.1 -13.9 Tin 19,325.0 0.0 -2.8 -6.3 JCI Index VS MSCI Emerging Markets Market commentary Hariyanto Wijaya CFA, CPA (Aust), CMT ([email protected]) IHSG ditutup menguat +1,6% di balik euforia pemilihan presiden oleh investor lokal, sementara investor asing tetap membukukan net sell IDR546milyar. Kami perkirakanIHSG akan trade mixed to lower hari ini di balik sentimen negatif dari market AS semalam dan foreign fund outflow yang berkelanjutan. Indeks AS merosot pada Kamis karena investor melepas saham di tengah kekhawatiran akan perang dagang AS-China yang meningkat akan menghambat pertumbuhan ekonomi global. Energi dan teknologi memimpin penurunan. Harga minyak mentah merosot -5,15%, penurunan tertajam sejak awal tahun di balik perlambatan ekonomi global dan membengkaknya persediaan bahan bakar. UNVR: Innovations keep coming Mimi Halimin ([email protected]) Close to 100% dividend payout ratio Untuk tahun buku 2018, Unilever Indonesia (UNVR) memutuskan untuk membagikan total dividen IDR1,185/saham, yang terdiri dari dividen interim IDR410/saham dan dividen final IDR775/saham. Ini berarti dividend payout ratio (DPR) mencapai 99.3%, lebih tinggi dari yang kami perkirakan. Karena laba bersih FY18 termasuk one-off gain (divestasi aset spread; nilai transaksi bersih IDR2.8tr), kami sebelumnya mengasumsikan DPR yang lebih rendah. Berdasarkan harga penutupan 22 Mei, dividend ini menyiratkan dividen yield 1.8% (hanya untuk final dividen) atau 2.8% (total dividen). Aggressive product launches likely to continue Pada 1Q19, UNVR secara agresif meluncurkan produk-produk inovatif, termasuk Nameera Aquatic Botanical. Ada 27 kegiatan launching and re-launching di kuartal tersebut (13 di bisnis F&R, 14 di bisnis HPC), vs hanya enam kegiatan di 1Q18. Kami percaya kegiatan lauching and re-launching UNVR yang agresif ini kemungkinan akan berlanjut di kuartal mendatang di tengah ketatnya persaingan dalam kategori FMCG. Maintain Hold with a lower TP of IDR43,500 Kami mempertahankan perkiraan pendapatan 2019-20 kami untuk UNVR (+4.7% YoY menjadi IDR43.8tr di 2019, +5.0% YoY menjadi IDR45.9tr di 2020). Kami juga mempertahankan estimasi laba bersih FY19 kami, tetapi kami sedikit menyesuaikan perkiraan laba bersih FY20 kami sehubungan dengan penyesuaian terhadap asumsi dividen dan perkiraan bank loan. Dengan demikian, kami memperkirakan laba bersih UNVR 2019-20 masing-masing pada IDR7.2tr (-20.6% YoY) di FY19 dan IDR7.6tr (+4.4% YoY) di FY20. Kami mempertahankan rekomendasi Hold kami di UNVR. Namun, kami menurunkan target harga kami menjadi IDR43,500, sesuai dengan target P/E 45.9x (P/E rata-rata lima tahun) ke EPS 2019F kami. 550 800 1,050 1,300 1,550 4,000 5,000 6,000 7,000 01/1607/1601/1707/1701/1807/1801/19 JCI MSCI EM (pt) (pt)
Transcript of 24 Mei, 2019 - miraeasset.co.id · SIDO: Sido Muncul (SIDO) berharap ekspor semakin besar di tahun...
To subscribe to our Daily Focus, please contact us at [email protected]
Mirae Asset Sekuritas Indonesia
24 Mei, 2019
Market Index
Last Trade Chg (%) MoM YoY
JCI 6,032.7 1.6 -7.9 -0.1
MSCI Indonesia 23.6 2.6 -11.8 -7.8
MSCI EM 984.8 -1.3 -8.0 -12.1
HANG SENG 27,267.1 -1.6 -7.0 -9.9
KOSPI 2,059.6 -0.5 -6.4 -16.5
FTSE 7,231.0 -1 -1.8 -5.0
DJIA 25,490.5 -1.1 -3.1 3.9
NASDAQ 7,628.3 -1.6 -4.3 4.4
Valuation
2018F P/E (x) P/B (x) ROE (%)
JCI 14.6 2.2 17.5
Key Rates
Last Trade Chg (bps) MoM YoY
BI 7-Day RR 6.00 0 25 -100
3yr 7.32 -7 27 22
10yr 7.99 -11 30 41
FX
Last Trade Chg (%) MoM YoY
USD/IDR 14,480.0 -0.3 3.2 2.2
USD/KRW 1,189.2 -0.3 3.3 10.1
USD/JPY 109.6 -0.7 -2.3 0.3
USD/CNY 6.9 0.1 2.7 8.1
Commodities
Last Trade Chg (%) MoM YoY
WTI 57.9 -5.7 -12.1 10.5
Gold 1,283.5 0.8 0.6 -1.6
Coal 83.8 -0.3 -1.0 -20.0
Palm Oil 1,974.0 -1.7 -5.1 -19.8
Rubber 147.6 0.5 3.2 5.4
Nickel 11,895.0 -0.7 -4.0 -18.8
Copper 5,926.0 0.0 -8.1 -13.9
Tin 19,325.0 0.0 -2.8 -6.3
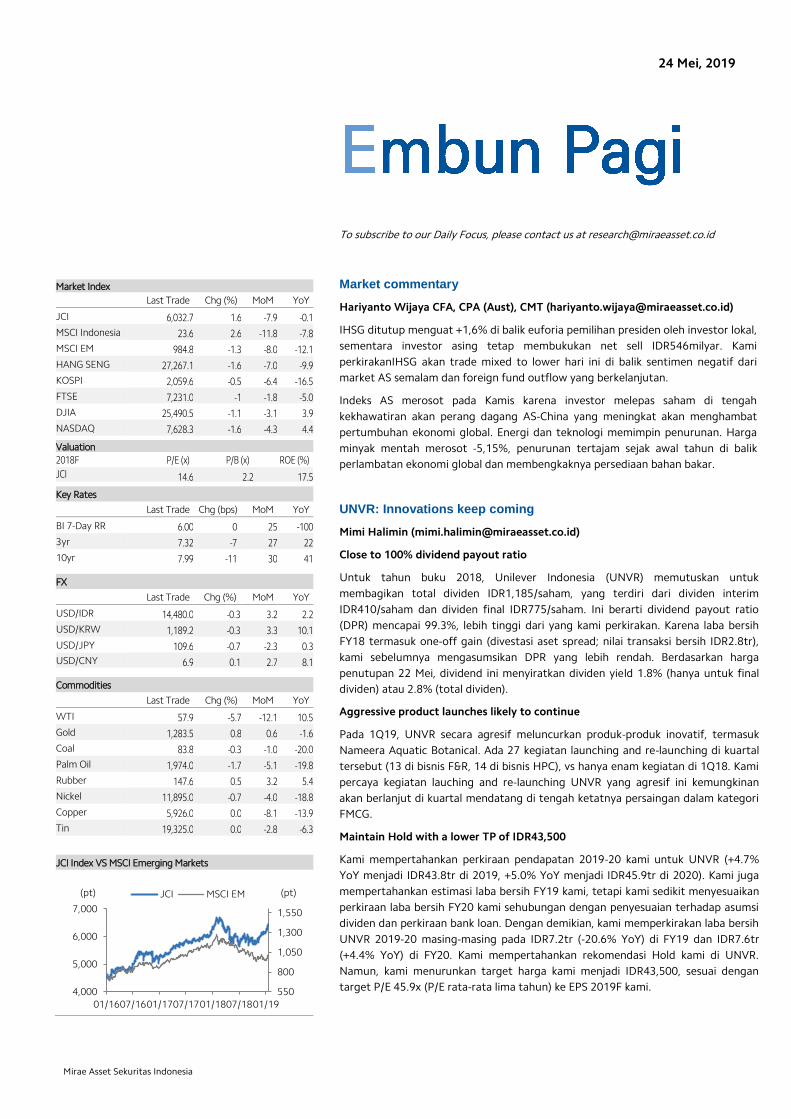
JCI Index VS MSCI Emerging Markets
Market commentary
Hariyanto Wijaya CFA, CPA (Aust), CMT ([email protected])
IHSG ditutup menguat +1,6% di balik euforia pemilihan presiden oleh investor lokal,
sementara investor asing tetap membukukan net sell IDR546milyar. Kami
perkirakanIHSG akan trade mixed to lower hari ini di balik sentimen negatif dari
market AS semalam dan foreign fund outflow yang berkelanjutan.
Indeks AS merosot pada Kamis karena investor melepas saham di tengah
kekhawatiran akan perang dagang AS-China yang meningkat akan menghambat
pertumbuhan ekonomi global. Energi dan teknologi memimpin penurunan. Harga
minyak mentah merosot -5,15%, penurunan tertajam sejak awal tahun di balik
perlambatan ekonomi global dan membengkaknya persediaan bahan bakar.
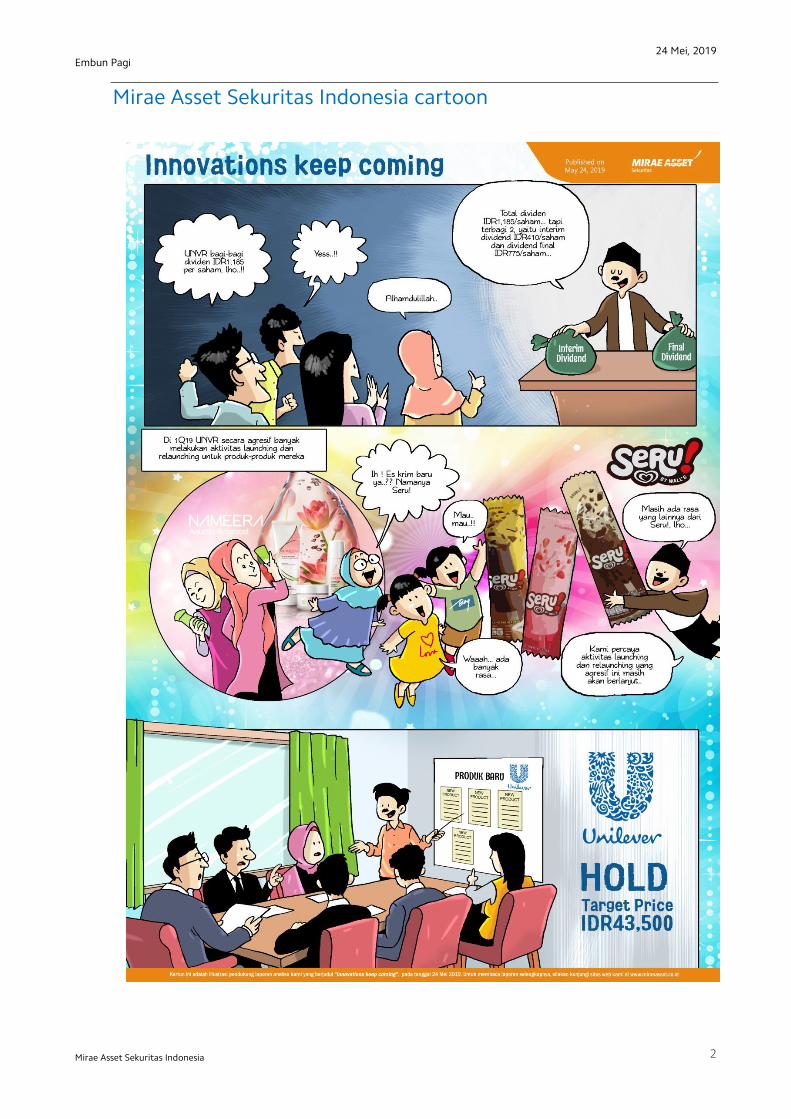
UNVR: Innovations keep coming
Mimi Halimin ([email protected])
Close to 100% dividend payout ratio
Untuk tahun buku 2018, Unilever Indonesia (UNVR) memutuskan untuk
membagikan total dividen IDR1,185/saham, yang terdiri dari dividen interim
IDR410/saham dan dividen final IDR775/saham. Ini berarti dividend payout ratio
(DPR) mencapai 99.3%, lebih tinggi dari yang kami perkirakan. Karena laba bersih
FY18 termasuk one-off gain (divestasi aset spread; nilai transaksi bersih IDR2.8tr),
kami sebelumnya mengasumsikan DPR yang lebih rendah. Berdasarkan harga
penutupan 22 Mei, dividend ini menyiratkan dividen yield 1.8% (hanya untuk final
dividen) atau 2.8% (total dividen).
Aggressive product launches likely to continue
Pada 1Q19, UNVR secara agresif meluncurkan produk-produk inovatif, termasuk
Nameera Aquatic Botanical. Ada 27 kegiatan launching and re-launching di kuartal
tersebut (13 di bisnis F&R, 14 di bisnis HPC), vs hanya enam kegiatan di 1Q18. Kami
percaya kegiatan lauching and re-launching UNVR yang agresif ini kemungkinan
akan berlanjut di kuartal mendatang di tengah ketatnya persaingan dalam kategori
FMCG.
Maintain Hold with a lower TP of IDR43,500
Kami mempertahankan perkiraan pendapatan 2019-20 kami untuk UNVR (+4.7%
YoY menjadi IDR43.8tr di 2019, +5.0% YoY menjadi IDR45.9tr di 2020). Kami juga
mempertahankan estimasi laba bersih FY19 kami, tetapi kami sedikit menyesuaikan
perkiraan laba bersih FY20 kami sehubungan dengan penyesuaian terhadap asumsi
dividen dan perkiraan bank loan. Dengan demikian, kami memperkirakan laba bersih
UNVR 2019-20 masing-masing pada IDR7.2tr (-20.6% YoY) di FY19 dan IDR7.6tr
(+4.4% YoY) di FY20. Kami mempertahankan rekomendasi Hold kami di UNVR.
Namun, kami menurunkan target harga kami menjadi IDR43,500, sesuai dengan
target P/E 45.9x (P/E rata-rata lima tahun) ke EPS 2019F kami. 550
800
1,050
1,300
1,550
4,000
5,000
6,000
7,000
01/1607/1601/1707/1701/1807/1801/19
JCI MSCI EM (pt) (pt)
24 Mei, 2019
2
Embun Pagi
Mirae Asset Sekuritas Indonesia
Mirae Asset Sekuritas Indonesia cartoon

24 Mei, 2019
3
Embun Pagi
Mirae Asset Sekuritas Indonesia
Local flashes
CPIN: Charoen Pokphand (CPIN) pasang target konservatif di tahun ini. PT Charoen
Pokphand Indonesia Tbk (CPIN) mengalokasikan belanja modal sebesar Rp 2,5 triliun. CPIN
akan menggunakan belanja modal ini termasuk untuk pengembangan bisnis perunggasan.
Presiden Direktur CPIN Tjiu Thomas Effendy bilang, pihaknya masih melihat potensi yang
bagus dalam divisi ini. Thomas pun mengatakan memang di kuartal I -2019 ini laba sedikit
turun karena efek Pilpres dan harga ayam yang cenderung naik. Tapi di kuartal kedua ini,
CPIN memprediksi penjualan akan lebih baik karena ada momen Ramadan dan Lebaran.
Meski begitu ia tidak bisa menargetkan berapa yang bisa diraup dari momen besar itu.
(Kontan)
SKYB: Northcliff Citranusa (SKYB) akuisisi dua perusahaan properti guna menutup
kerugian. PT Northcliff Citranusa Indonesia Tbk (SKYB) memutuskan melakukan diversifikasi
usaha untuk menjaga kelangsungan bisnis perseroan pada Rapat Umum Pemegang Saham
(RUPS) yang berlangsung di Equity Tower, Jakarta, Kamis (23/5). Dalam hajatan RUPS,
emiten yang bergerak di bidang telekomunikasi dan IT ini mengakuisisi dua perusahaan
operator properti yakni, PT Taman Suci Abadi, sebuah operator properti perhotelan di Bali
dan PT Griya Boga Selaras, perusahaan operator properti perkantoran di Jakarta. Langkah ini
menelan anggaran sebesar Rp 1,7 miliar yang berasal dari hutang pemegang saham SKYB.
(Kontan)
BBNI: BNI targetkan transaksi remitansi tumbuh 70% selama Ramadan. PT Bank Negara
Indonesia Tbk (BBNI, anggota indeks Kompas100) akan mendapatkan berkah dari
momentum Lebaran tahun ini. Bisnis jasa pengiriman uang antar negara atau remitansi BNI
akan terdongkrak selama Ramadan karena para Tenaga Kerja Indonesia (TKI) akan
mengirimkan tunjangan hari raya buat keluarga mereka. Untuk incoming remittance Lebaran
tahun ini, BNI menargetkan pertumbuhan sekitar 70% dari bulan-bulan biasa. Menurut Rico,
negara-negara yang menjadi penyumbang terbesar remitansi adalah Malaysia, Taiwan, Arab
Saudi, Singapura dan Hong Kong. (Kontan)
SIDO: Sido Muncul (SIDO) berharap ekspor semakin besar di tahun mendatang. Produsen
jamu dan produk herbal, PT Industri Jamu dan Farmasi Sido Muncul Tbk (SIDO, anggota
indeks Kompas100 ini,) terus menggenjot segmen penjualan ekspornya. Meski masih kecil
dari segi porsi, namun potensi penjualan di tingkat global masih sangat menjanjikan. David
Hidayat, Direktur Utama SIDO mengatakan bahwa penjualan segmen ekspor terus
dikembangkan. "Diharapkan target ekspor dalam 2 tahun mendatang yakni 5% dari total
revenue bisa dicapai segera," (Kontan)
ESSA: Hingga Maret 2019, Surya Esa (ESSA) produksi 200.000 mt Amonia. PT Surya Esa
Perkasa Tbk (ESSA) terus mengawal bisnis dalam penjualan elpiji dan amonia. Direktur
Utama ESSA, Garibaldi Thohir menyampaikan tahun ini ESSA masih fokus untuk menjalankan
bisnis penjualan elpiji dan amonia. “Kita akan pastikan dulu segala sesuatunya berjalan
dengan baik,” Hingga kuartal pertama 2019, sambungnya, mereka sudah memproduksi
sebanyak 200.000 metrik ton amonia. Lantaran utilisasi sudah mencapai 116%, kini ESSA
juga sedang menjajaki adanya potensi untuk memabangun pabrik baru. (Kontan)
HELI: Jaya Trishindo (HELI) akan perluas segmentasi pasar. PT Jaya Trishindo Tbk (HELI)
terus berupaya untuk memperluas pasar. Sejauh ini perusahaan melayani sektor disaster
agenncy, contractor, plantation dan mining. Tahun ini, manajemen menargetkan bisa masuk
ke satu sektor lagi. Edwin Widjaja, Direktur Utama HELI menkkelaskan saat ini perusahaan
tengah melakukan penjajakan untuk bisa masuk ke sektor pariwisata. Pasalnya, segmen
pariwisata ini tengah berkembang dengan sangat baik dan berpotensi memberikan
pendapatan yang bagus. (Kontan)
24 Mei, 2019
4
Embun Pagi
Mirae Asset Sekuritas Indonesia
Technical analysis
Tasrul +62-21-515-1140 [email protected]
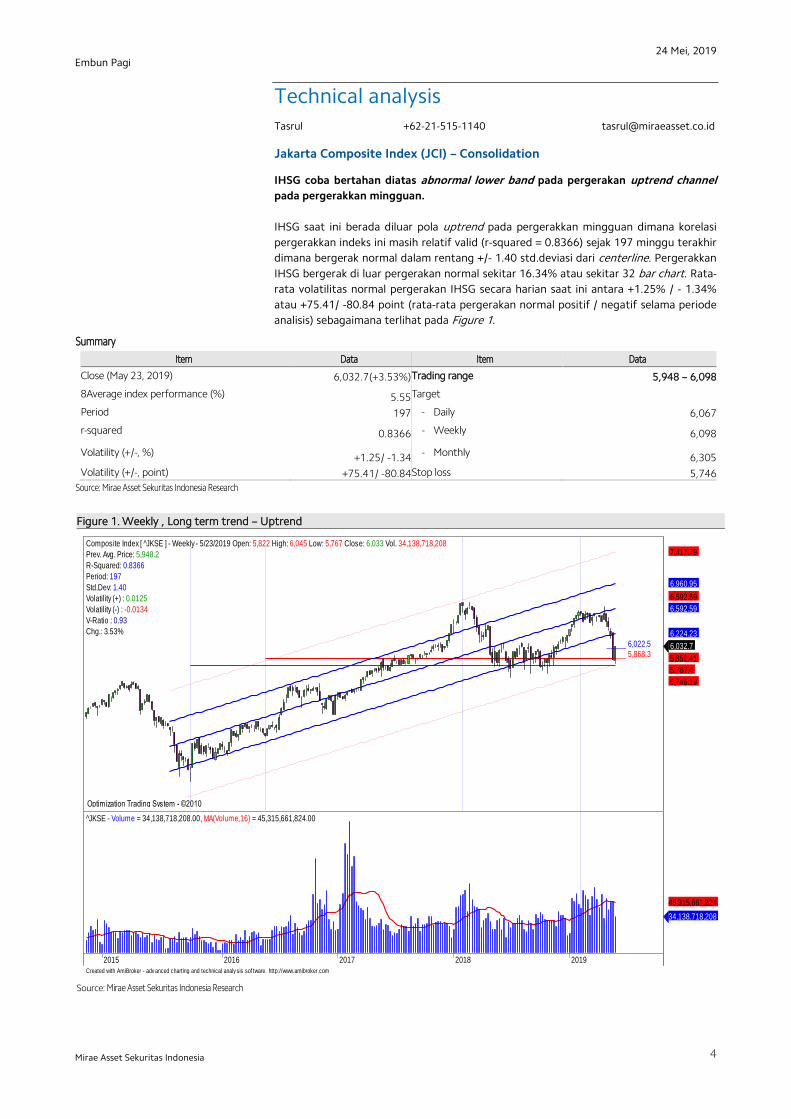
Jakarta Composite Index (JCI) – Consolidation
IHSG coba bertahan diatas abnormal lower band pada pergerakan uptrend channel
pada pergerakkan mingguan.
IHSG saat ini berada diluar pola uptrend pada pergerakkan mingguan dimana korelasi
pergerakkan indeks ini masih relatif valid (r-squared = 0.8366) sejak 197 minggu terakhir
dimana bergerak normal dalam rentang +/- 1.40 std.deviasi dari centerline. Pergerakkan
IHSG bergerak di luar pergerakan normal sekitar 16.34% atau sekitar 32 bar chart. Rata-
rata volatilitas normal pergerakan IHSG secara harian saat ini antara +1.25% / - 1.34%
atau +75.41/ -80.84 point (rata-rata pergerakan normal positif / negatif selama periode
analisis) sebagaimana terlihat pada Figure 1.
Summary
Item Data Item Data
Close (May 23, 2019) 6,032.7(+3.53%) Trading range 5,948 – 6,098
8Average index performance (%) 5.55 Target
Period 197 - Daily 6,067
r-squared 0.8366 - Weekly 6,098
Volatility (+/-, %) +1.25/ -1.34 - Monthly 6,305
Volatility (+/-, point) +75.41/ -80.84 Stop loss 5,746
Source: Mirae Asset Sekuritas Indonesia Research
Figure 1. Weekly , Long term trend – Uptrend
4 - 6,161 Source: Mirae Asset Sekuritas Indonesia Research
Created with AmiBroker - adv anced charting and technical analy sis sof tware. http://www.amibroker.com
_____ 6,022.5_____ 5,868.3
Optimization Trading System - ©2010 Optimization Trading System - ©2010 Optimization Trading System - ©2010 Optimization Trading System - ©2010
Composite Index [ ^JKSE ] - Weekly - 5/23/2019 Open: 5,822 High: 6,045 Low: 5,767 Close: 6,033 Vol. 34,138,718,208
Prev. Avg. Price: 5,948.2
R-Squared: 0.8366
Period: 197
Std.Dev: 1.40
Volatility (+) : 0.0125
Volatility (-) : -0.0134
V-Ratio : 0.93
Chg.: 3.53%
6,032.7
5,851.41
5,767.4
5,746.19
6,224.23
6,592.59
6,592.59
6,960.95
7,417.79
2015 2016 2017 2018 2019
^JKSE - Volume = 34,138,718,208.00, MA(Volume,16) = 45,315,661,824.00
34,138,718,208
45,315,661,824
24 Mei, 2019
5
Embun Pagi
Mirae Asset Sekuritas Indonesia
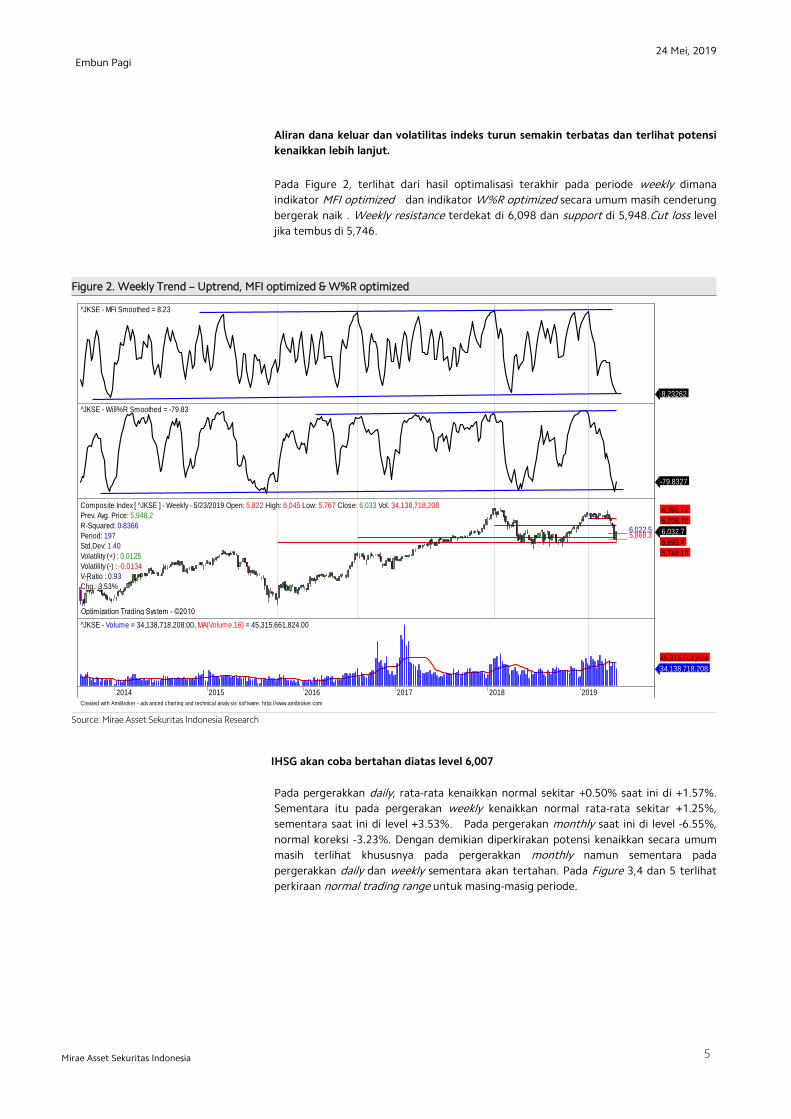
Aliran dana keluar dan volatilitas indeks turun semakin terbatas dan terlihat potensi
kenaikkan lebih lanjut.
Pada Figure 2, terlihat dari hasil optimalisasi terakhir pada periode weekly dimana
indikator MFI optimized dan indikator W%R optimized secara umum masih cenderung
bergerak naik . Weekly resistance terdekat di 6,098 dan support di 5,948.Cut loss level
jika tembus di 5,746.
Figure 2. Weekly Trend – Uptrend, MFI optimized & W%R optimized
A
Source: Mirae Asset Sekuritas Indonesia Research
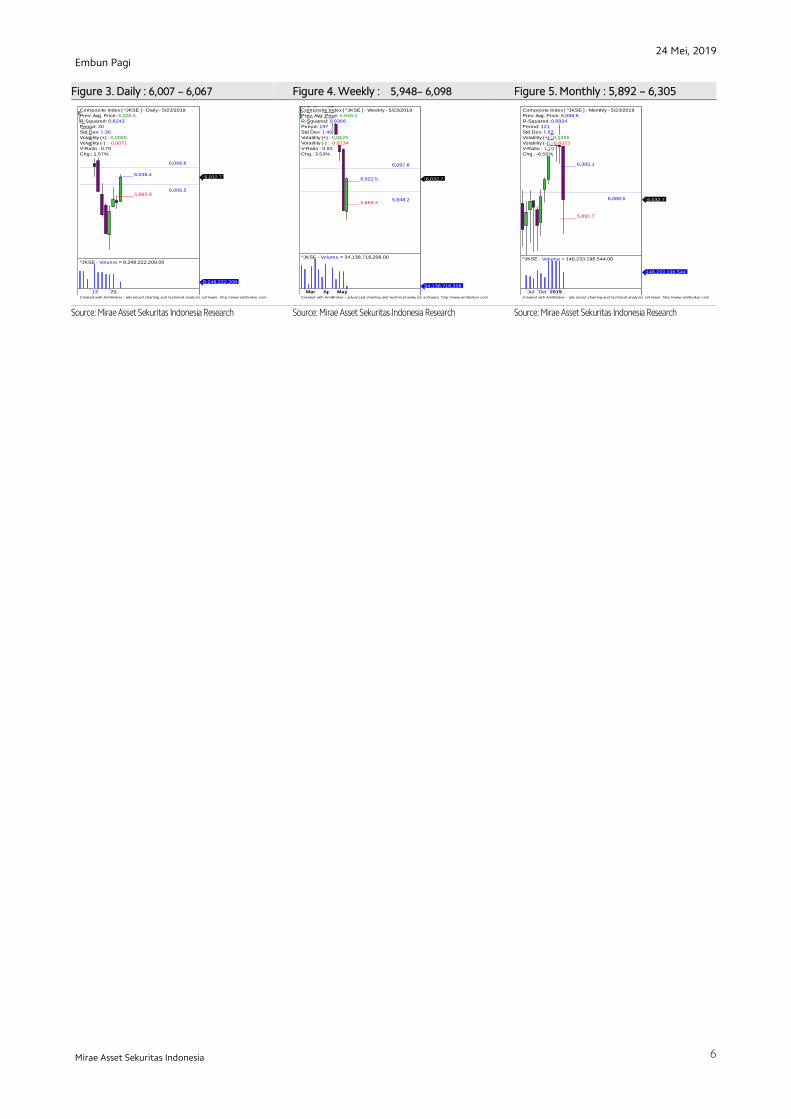
IHSG akan coba bertahan diatas level 6,007
Pada pergerakkan daily, rata-rata kenaikkan normal sekitar +0.50% saat ini di +1.57%.
Sementara itu pada pergerakan weekly kenaikkan normal rata-rata sekitar +1.25%,
sementara saat ini di level +3.53%. Pada pergerakan monthly saat ini di level -6.55%,
normal koreksi -3.23%. Dengan demikian diperkirakan potensi kenaikkan secara umum
masih terlihat khususnya pada pergerakkan monthly namun sementara pada
pergerakkan daily dan weekly sementara akan tertahan. Pada Figure 3,4 dan 5 terlihat
perkiraan normal trading range untuk masing-masig periode.
Created with AmiBroker - adv anced charting and technical analy sis sof tware. http://www.amibroker.com
^JKSE - MFI Smoothed = 8.23
8.23262
^JKSE - Will%R Smoothed = -79.83
-79.8327
_____ 6,022.5_____ 5,868.3
Optimization Trading System - ©2010 Optimization Trading System - ©2010 Optimization Trading System - ©2010 Optimization Trading System - ©2010
Composite Index [ ^JKSE ] - Weekly - 5/23/2019 Open: 5,822 High: 6,045 Low: 5,767 Close: 6,033 Vol. 34,138,718,208
Prev. Avg. Price: 5,948.2
R-Squared: 0.8366
Period: 197
Std.Dev: 1.40
Volatility (+) : 0.0125
Volatility (-) : -0.0134
V-Ratio : 0.93
Chg.: 3.53%
6,032.7
5,893.4
5,746.19
6,206.79
6,391.77
2014 2015 2016 2017 2018 2019
^JKSE - Volume = 34,138,718,208.00, MA(Volume,16) = 45,315,661,824.00
34,138,718,208
45,315,661,824
24 Mei, 2019
6
Embun Pagi
Mirae Asset Sekuritas Indonesia
Figure 3. Daily : 6,007 – 6,067 Figure 4. Weekly : 5,948– 6,098 Figure 5. Monthly : 5,892 – 6,305
x
x x`
Source: Mirae Asset Sekuritas Indonesia Research
Source: Mirae Asset Sekuritas Indonesia Research
Source: Mirae Asset Sekuritas Indonesia Research
Created with AmiBroker - adv anced charting and technical analy sis sof tware. http://www.amibroker.com
_____ 6,036.4
_____ 5,963.86,006.5
6,066.6
Composite Index [ ^JKSE ] - Daily - 5/23/2019
Prev. Avg. Price: 6,006.5
R-Squared: 0.8243
Period: 30
Std.Dev: 1.36
Volatility (+) : 0.0050
Volatility (-) : -0.0071
V-Ratio : 0.70
Chg.: 1.57%
6,032.7
13 20
^JKSE - Volume = 8,248,222,208.00
8,248,222,208
Created with AmiBroker - adv anced charting and technical analy sis sof tware. http://www.amibroker.com
_____ 6,022.5
_____ 5,868.35,948.2
6,097.8
Composite Index [ ^JKSE ] - Weekly - 5/23/2019
Prev. Avg. Price: 5,948.2
R-Squared: 0.8366
Period: 197
Std.Dev: 1.40
Volatility (+) : 0.0125
Volatility (-) : -0.0134
V-Ratio : 0.93
Chg.: 3.53%
6,032.7
Mar Apr May
^JKSE - Volume = 34,138,718,208.00
34,138,718,208
Created with AmiBroker - adv anced charting and technical analy sis sof tware. http://www.amibroker.com
_____ 6,305.1
_____ 5,891.7
6,088.6
Composite Index [ ^JKSE ] - Monthly - 5/23/2019
Prev. Avg. Price: 6,088.6
R-Squared: 0.8934
Period: 121
Std.Dev: 1.62
Volatility (+) : 0.0356
Volatility (-) : -0.0323
V-Ratio : 1.10
Chg.: -6.55%
6,032.7
Jul Oct 2019
^JKSE - Volume = 146,233,196,544.00
146,233,196,544
24 Mei, 2019
7
Embun Pagi
Mirae Asset Sekuritas Indonesia
Stocks on our focus list
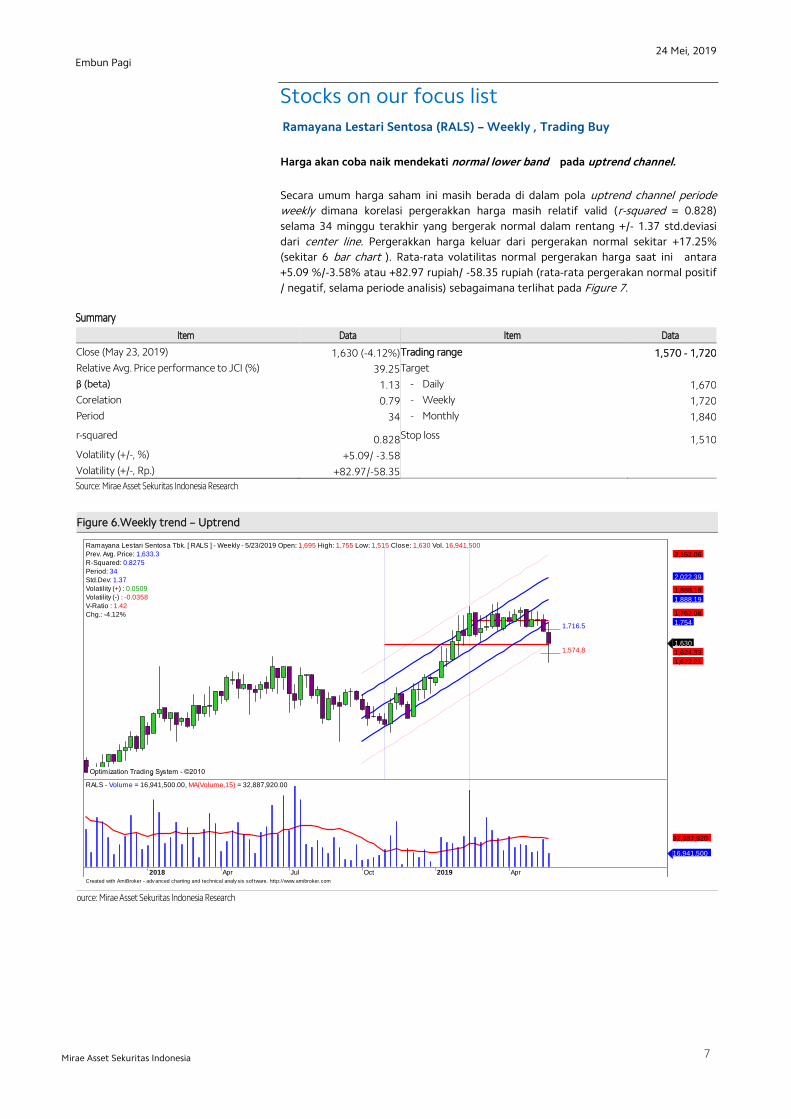
Ramayana Lestari Sentosa (RALS) – Weekly , Trading Buy
Harga akan coba naik mendekati normal lower band pada uptrend channel.
Secara umum harga saham ini masih berada di dalam pola uptrend channel periode
weekly dimana korelasi pergerakkan harga masih relatif valid (r-squared = 0.828)
selama 34 minggu terakhir yang bergerak normal dalam rentang +/- 1.37 std.deviasi
dari center line. Pergerakkan harga keluar dari pergerakan normal sekitar +17.25%
(sekitar 6 bar chart ). Rata-rata volatilitas normal pergerakan harga saat ini antara
+5.09 %/-3.58% atau +82.97 rupiah/ -58.35 rupiah (rata-rata pergerakan normal positif
/ negatif, selama periode analisis) sebagaimana terlihat pada Figure 7.
Summary
Item Data Item Data
Close (May 23, 2019) 1,630 (-4.12%) Trading range 1,570 - 1,720
Relative Avg. Price performance to JCI (%) 39.25 Target
β (beta) 1.13 - Daily 1,670
Corelation 0.79 - Weekly 1,720
Period 34 - Monthly 1,840
r-squared 0.828 Stop loss 1,510
Volatility (+/-, %) +5.09/ -3.58
Volatility (+/-, Rp.) +82.97/-58.35
Source: Mirae Asset Sekuritas Indonesia Research
Figure 6.Weekly trend – Uptrend
ource: Mirae Asset Sekuritas Indonesia Research
Created with AmiBroker - adv anced charting and technical analy sis sof tware. http://www.amibroker.com
_____ 1,716.5
_____ 1,574.8
Optimization Trading System - ©2010 Optimization Trading System - ©2010 Optimization Trading System - ©2010 Optimization Trading System - ©2010
Ramayana Lestari Sentosa Tbk. [ RALS ] - Weekly - 5/23/2019 Open: 1,695 High: 1,755 Low: 1,515 Close: 1,630 Vol. 16,941,500
Prev. Avg. Price: 1,633.3
R-Squared: 0.8275
Period: 34
Std.Dev: 1.37
Volatility (+) : 0.0509
Volatility (-) : -0.0358
V-Ratio : 1.42
Chg.: -4.12%
1,630
1,624.33
1,622.21
1,754
1,762.08
1,888.19
1,888.19
2,022.39
2,152.06
2018 Apr Jul Oct 2019 Apr
RALS - Volume = 16,941,500.00, MA(Volume,15) = 32,887,920.00
16,941,500
32,887,920
24 Mei, 2019
8
Embun Pagi
Mirae Asset Sekuritas Indonesia
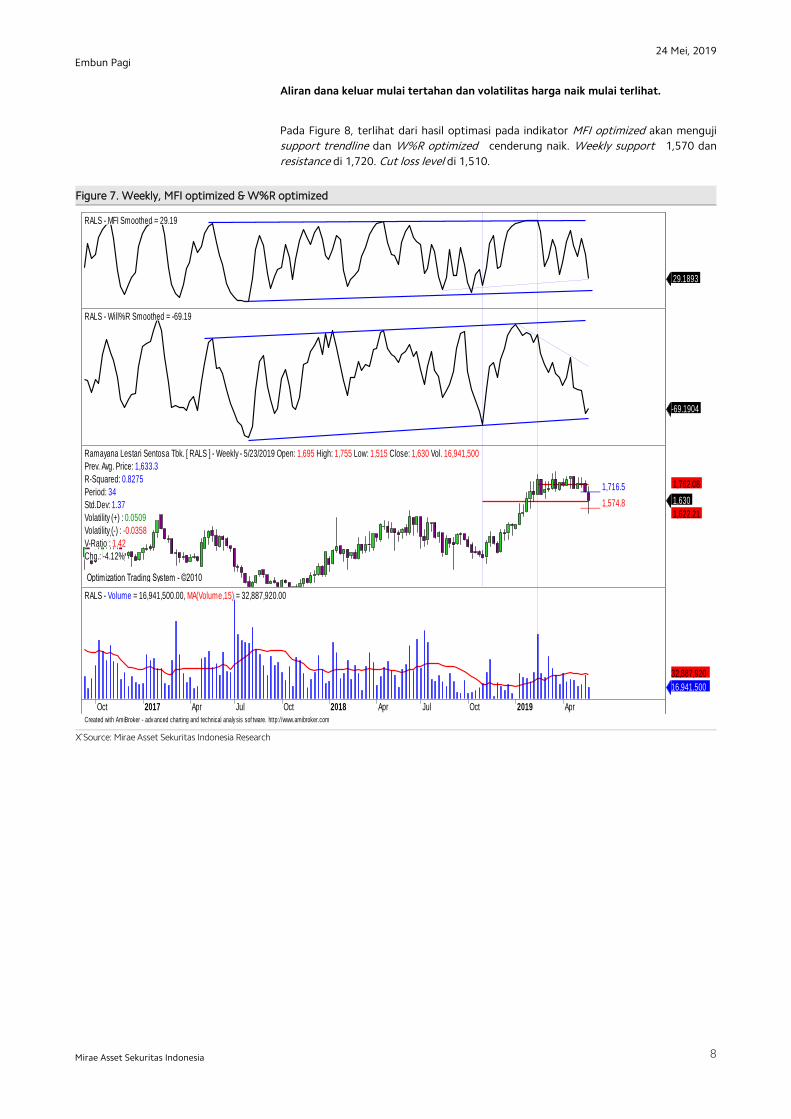
Aliran dana keluar mulai tertahan dan volatilitas harga naik mulai terlihat.
Pada Figure 8, terlihat dari hasil optimasi pada indikator MFI optimized akan menguji
support trendline dan W%R optimized cenderung naik. Weekly support 1,570 dan
resistance di 1,720. Cut loss level di 1,510.
Figure 7. Weekly, MFI optimized & W%R optimized
X`Source: Mirae Asset Sekuritas Indonesia Research
Created with AmiBroker - adv anced charting and technical analy sis sof tware. http://www.amibroker.com
RALS - MFI Smoothed = 29.19
29.1893
RALS - Will%R Smoothed = -69.19
-69.1904
_____ 1,716.5
_____ 1,574.8
Optimization Trading System - ©2010 Optimization Trading System - ©2010
Ramayana Lestari Sentosa Tbk. [ RALS ] - Weekly - 5/23/2019 Open: 1,695 High: 1,755 Low: 1,515 Close: 1,630 Vol. 16,941,500
Prev. Avg. Price: 1,633.3
R-Squared: 0.8275
Period: 34
Std.Dev: 1.37
Volatility (+) : 0.0509
Volatility (-) : -0.0358
V-Ratio : 1.42
Chg.: -4.12%
1,630
1,622.21
1,762.08
Oct 2017 Apr Jul Oct 2018 Apr Jul Oct 2019 Apr
RALS - Volume = 16,941,500.00, MA(Volume,15) = 32,887,920.00
16,941,500
32,887,920
24 Mei, 2019
9
Embun Pagi
Mirae Asset Sekuritas Indonesia
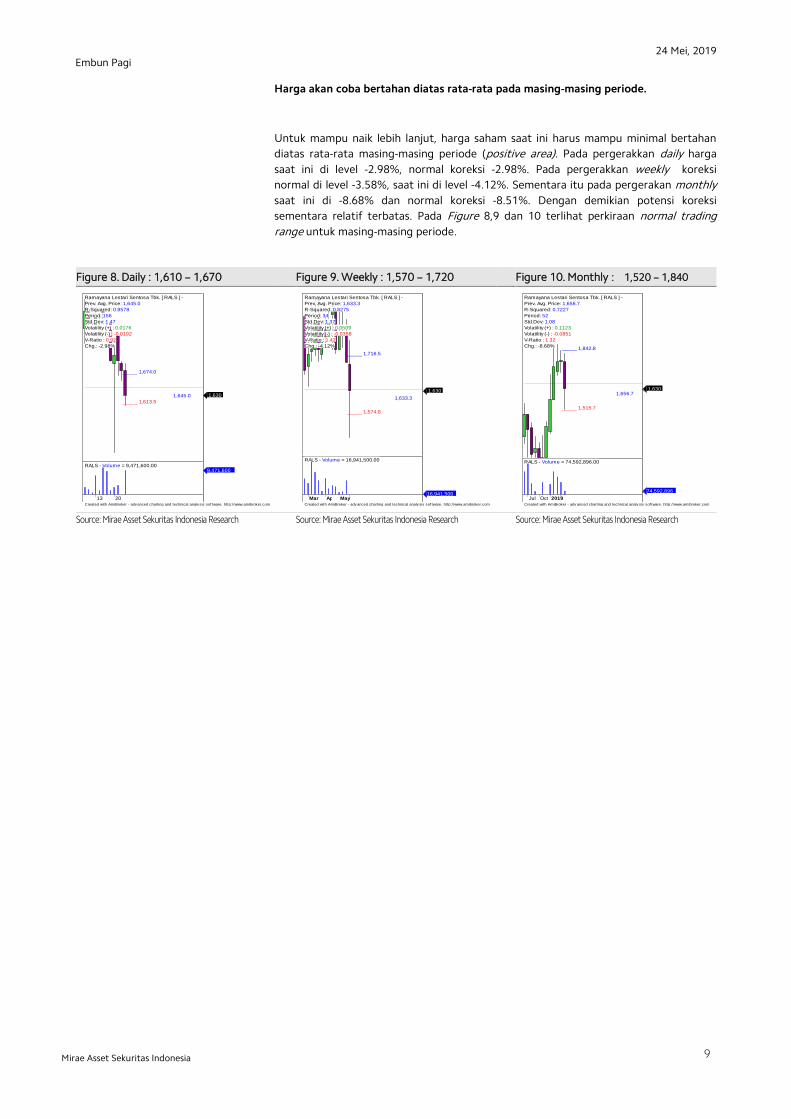
Harga akan coba bertahan diatas rata-rata pada masing-masing periode.
Untuk mampu naik lebih lanjut, harga saham saat ini harus mampu minimal bertahan
diatas rata-rata masing-masing periode (positive area). Pada pergerakkan daily harga
saat ini di level -2.98%, normal koreksi -2.98%. Pada pergerakkan weekly koreksi
normal di level -3.58%, saat ini di level -4.12%. Sementara itu pada pergerakan monthly
saat ini di -8.68% dan normal koreksi -8.51%. Dengan demikian potensi koreksi
sementara relatif terbatas. Pada Figure 8,9 dan 10 terlihat perkiraan normal trading
range untuk masing-masing periode.
Figure 8. Daily : 1,610 – 1,670 Figure 9. Weekly : 1,570 – 1,720 Figure 10. Monthly : 1,520 – 1,840
x`x`
25
Source: Mirae Asset Sekuritas Indonesia Research
Source: Mirae Asset Sekuritas Indonesia Research
Source: Mirae Asset Sekuritas Indonesia Research
Created with AmiBroker - adv anced charting and technical analy sis sof tware. http://www.amibroker.com
_____ 1,674.0
_____ 1,613.5
1,645.0
Ramayana Lestari Sentosa Tbk. [ RALS ] -
Prev. Avg. Price: 1,645.0
R-Squared: 0.8578
Period: 156
Std.Dev: 1.47
Volatility (+) : 0.0176
Volatility (-) : -0.0192
V-Ratio : 0.92
Chg.: -2.98%
1,630
13 20
RALS - Volume = 9,471,600.009,471,600
Created with AmiBroker - adv anced charting and technical analy sis sof tware. http://www.amibroker.com
_____ 1,716.5
_____ 1,574.8
1,633.3
Ramayana Lestari Sentosa Tbk. [ RALS ] -
Prev. Avg. Price: 1,633.3
R-Squared: 0.8275
Period: 34
Std.Dev: 1.37
Volatility (+) : 0.0509
Volatility (-) : -0.0358
V-Ratio : 1.42
Chg.: -4.12%
1,630
Mar Apr May
RALS - Volume = 16,941,500.00
16,941,500
Created with AmiBroker - adv anced charting and technical analy sis sof tware. http://www.amibroker.com
_____ 1,842.8
_____ 1,515.7
1,656.7
Ramayana Lestari Sentosa Tbk. [ RALS ] -
Prev. Avg. Price: 1,656.7
R-Squared: 0.7227
Period: 52
Std.Dev: 1.08
Volatility (+) : 0.1123
Volatility (-) : -0.0851
V-Ratio : 1.32
Chg.: -8.68%
1,630
Jul Oct 2019
RALS - Volume = 74,592,896.00
74,592,896
24 Mei, 2019
10
Embun Pagi
Mirae Asset Sekuritas Indonesia
Pakuwon Jati (PWON) – Weekly , Trading Buy
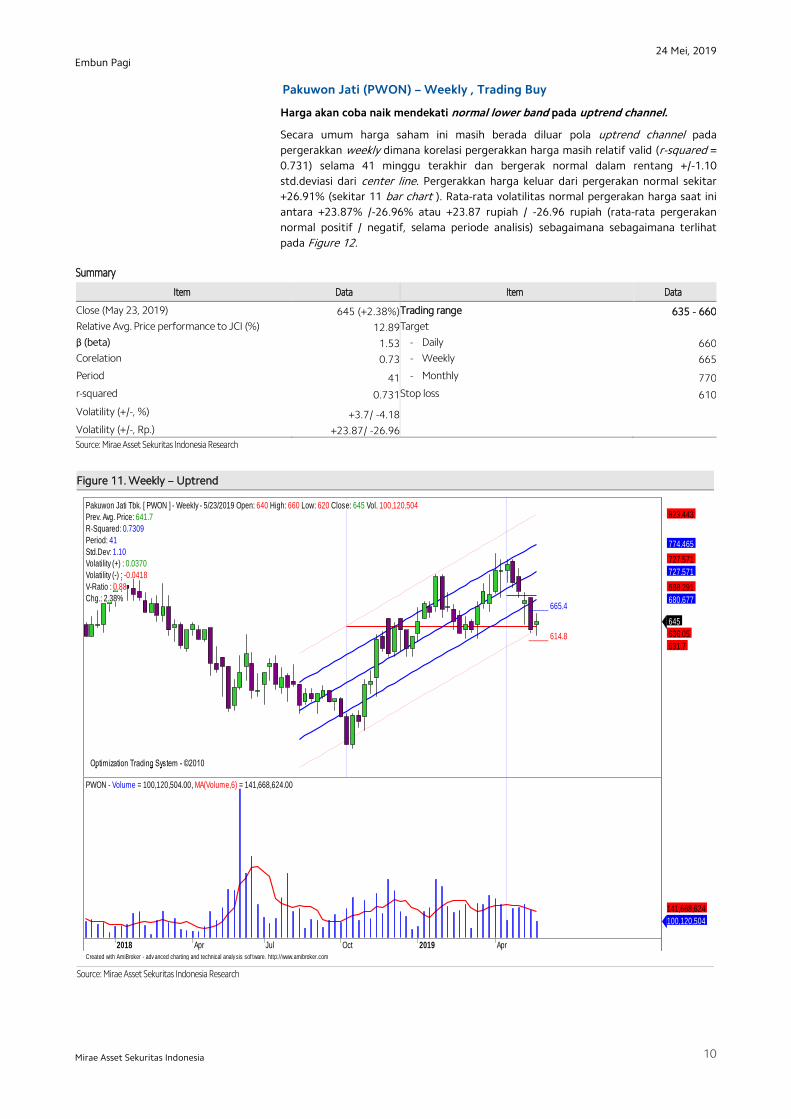
Harga akan coba naik mendekati normal lower band pada uptrend channel.
Secara umum harga saham ini masih berada diluar pola uptrend channel pada
pergerakkan weekly dimana korelasi pergerakkan harga masih relatif valid (r-squared =
0.731) selama 41 minggu terakhir dan bergerak normal dalam rentang +/-1.10
std.deviasi dari center line. Pergerakkan harga keluar dari pergerakan normal sekitar
+26.91% (sekitar 11 bar chart ). Rata-rata volatilitas normal pergerakan harga saat ini
antara +23.87% /-26.96% atau +23.87 rupiah / -26.96 rupiah (rata-rata pergerakan
normal positif / negatif, selama periode analisis) sebagaimana sebagaimana terlihat
pada Figure 12.
Summary
Item Data Item Data
Close (May 23, 2019) 645 (+2.38%) Trading range 635 - 660
Relative Avg. Price performance to JCI (%) 12.89 Target
β (beta) 1.53 - Daily 660
Corelation 0.73 - Weekly 665
Period 41 - Monthly 770
r-squared 0.731 Stop loss 610
Volatility (+/-, %) +3.7/ -4.18
Volatility (+/-, Rp.) +23.87/ -26.96
Source: Mirae Asset Sekuritas Indonesia Research
Figure 11. Weekly – Uptrend
x`
Source: Mirae Asset Sekuritas Indonesia Research
,
Created with AmiBroker - adv anced charting and technical analy sis sof tware. http://www.amibroker.com
_____ 665.4
_____ 614.8
Optimization Trading System - ©2010 Optimization Trading System - ©2010 Optimization Trading System - ©2010 Optimization Trading System - ©2010
Pakuwon Jati Tbk. [ PWON ] - Weekly - 5/23/2019 Open: 640 High: 660 Low: 620 Close: 645 Vol. 100,120,504
Prev. Avg. Price: 641.7
R-Squared: 0.7309
Period: 41
Std.Dev: 1.10
Volatility (+) : 0.0370
Volatility (-) : -0.0418
V-Ratio : 0.88
Chg.: 2.38%
645
636.05
631.7
680.677
688.291
727.571
727.571
774.465
823.443
2018 Apr Jul Oct 2019 Apr
PWON - Volume = 100,120,504.00, MA(Volume,6) = 141,668,624.00
100,120,504
141,668,624
24 Mei, 2019
11
Embun Pagi
Mirae Asset Sekuritas Indonesia
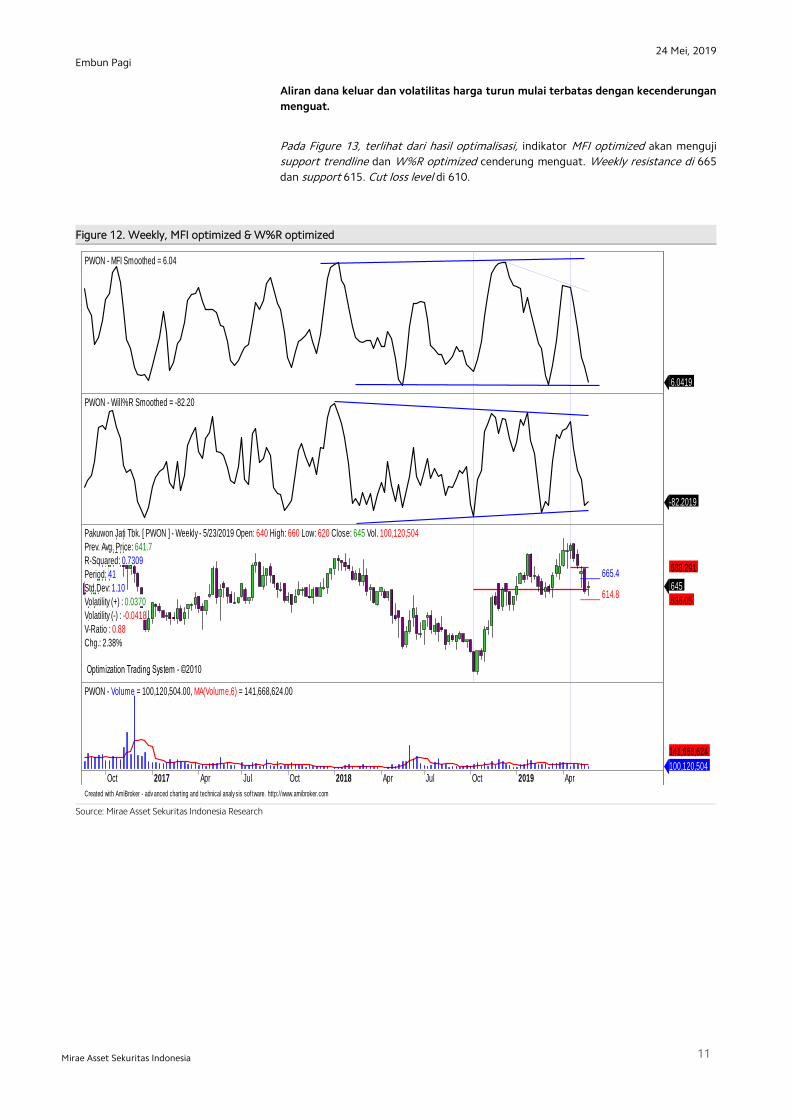
Aliran dana keluar dan volatilitas harga turun mulai terbatas dengan kecenderungan
menguat.
Pada Figure 13, terlihat dari hasil optimalisasi, indikator MFI optimized akan menguji
support trendline dan W%R optimized cenderung menguat. Weekly resistance di 665
dan support 615. Cut loss level di 610.
Figure 12. Weekly, MFI optimized & W%R optimized
,
Source: Mirae Asset Sekuritas Indonesia Research
Created with AmiBroker - adv anced charting and technical analy sis sof tware. http://www.amibroker.com
PWON - MFI Smoothed = 6.04
6.0419
PWON - Will%R Smoothed = -82.20
-82.2019
_____ 665.4
_____ 614.8
Optimization Trading System - ©2010 Optimization Trading System - ©2010
Pakuwon Jati Tbk. [ PWON ] - Weekly - 5/23/2019 Open: 640 High: 660 Low: 620 Close: 645 Vol. 100,120,504
Prev. Avg. Price: 641.7
R-Squared: 0.7309
Period: 41
Std.Dev: 1.10
Volatility (+) : 0.0370
Volatility (-) : -0.0418
V-Ratio : 0.88
Chg.: 2.38%
645
636.05
688.291
Oct 2017 Apr Jul Oct 2018 Apr Jul Oct 2019 Apr
PWON - Volume = 100,120,504.00, MA(Volume,6) = 141,668,624.00
100,120,504
141,668,624
24 Mei, 2019
12
Embun Pagi
Mirae Asset Sekuritas Indonesia
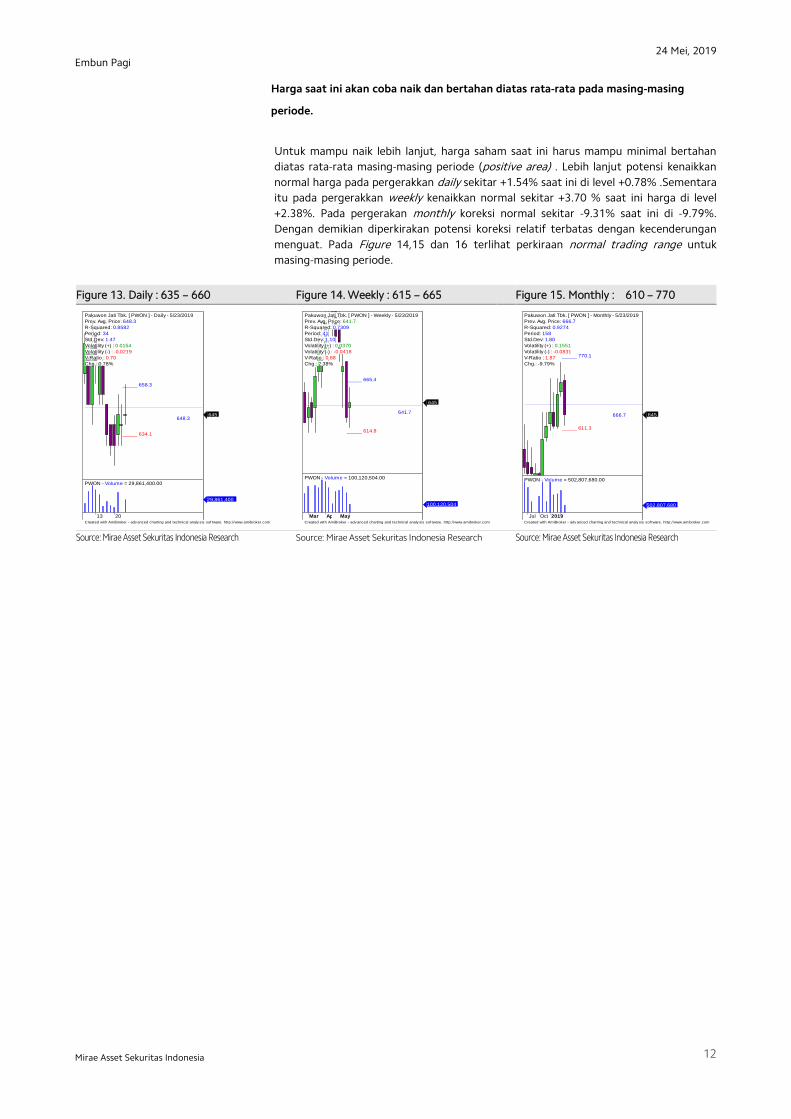
Harga saat ini akan coba naik dan bertahan diatas rata-rata pada masing-masing
periode.
Untuk mampu naik lebih lanjut, harga saham saat ini harus mampu minimal bertahan
diatas rata-rata masing-masing periode (positive area) . Lebih lanjut potensi kenaikkan
normal harga pada pergerakkan daily sekitar +1.54% saat ini di level +0.78% .Sementara
itu pada pergerakkan weekly kenaikkan normal sekitar +3.70 % saat ini harga di level
+2.38%. Pada pergerakan monthly koreksi normal sekitar -9.31% saat ini di -9.79%.
Dengan demikian diperkirakan potensi koreksi relatif terbatas dengan kecenderungan
menguat. Pada Figure 14,15 dan 16 terlihat perkiraan normal trading range untuk
masing-masing periode.
Figure 13. Daily : 635 – 660 Figure 14. Weekly : 615 – 665 Figure 15. Monthly : 610 – 770
, x`
x
Source: Mirae Asset Sekuritas Indonesia Research
Source: Mirae Asset Sekuritas Indonesia Research
Source: Mirae Asset Sekuritas Indonesia Research
Created with AmiBroker - adv anced charting and technical analy sis sof tware. http://www.amibroker.com
_____ 658.3
_____ 634.1
648.3
Pakuwon Jati Tbk. [ PWON ] - Daily - 5/23/2019
Prev. Avg. Price: 648.3
R-Squared: 0.8582
Period: 34
Std.Dev: 1.47
Volatility (+) : 0.0154
Volatility (-) : -0.0219
V-Ratio : 0.70
Chg.: 0.78%
645
13 20
PWON - Volume = 29,861,400.00
29,861,400
Created with AmiBroker - adv anced charting and technical analy sis sof tware. http://www.amibroker.com
_____ 665.4
_____ 614.8
641.7
Pakuwon Jati Tbk. [ PWON ] - Weekly - 5/23/2019
Prev. Avg. Price: 641.7
R-Squared: 0.7309
Period: 41
Std.Dev: 1.10
Volatility (+) : 0.0370
Volatility (-) : -0.0418
V-Ratio : 0.88
Chg.: 2.38%
645
Mar Apr May
PWON - Volume = 100,120,504.00
100,120,504
Created with AmiBroker - adv anced charting and technical analy sis sof tware. http://www.amibroker.com
_____ 770.1
_____ 611.3
666.7
Pakuwon Jati Tbk. [ PWON ] - Monthly - 5/23/2019
Prev. Avg. Price: 666.7
R-Squared: 0.9274
Period: 158
Std.Dev: 1.80
Volatility (+) : 0.1551
Volatility (-) : -0.0831
V-Ratio : 1.87
Chg.: -9.79%
645
Jul Oct 2019
PWON - Volume = 502,807,680.00
502,807,680
24 Mei, 2019
13
Embun Pagi
Mirae Asset Sekuritas Indonesia
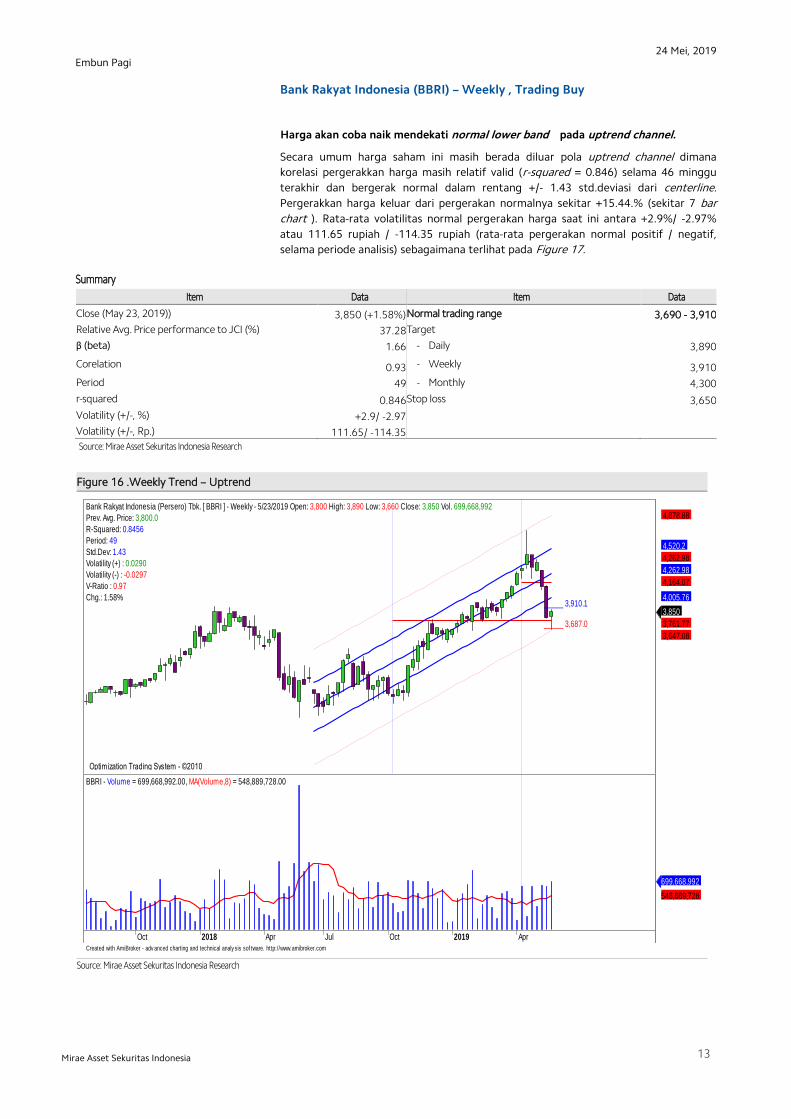
Bank Rakyat Indonesia (BBRI) – Weekly , Trading Buy
Harga akan coba naik mendekati normal lower band pada uptrend channel.
Secara umum harga saham ini masih berada diluar pola uptrend channel dimana
korelasi pergerakkan harga masih relatif valid (r-squared = 0.846) selama 46 minggu
terakhir dan bergerak normal dalam rentang +/- 1.43 std.deviasi dari centerline.
Pergerakkan harga keluar dari pergerakan normalnya sekitar +15.44.% (sekitar 7 bar
chart ). Rata-rata volatilitas normal pergerakan harga saat ini antara +2.9%/ -2.97%
atau 111.65 rupiah / -114.35 rupiah (rata-rata pergerakan normal positif / negatif,
selama periode analisis) sebagaimana terlihat pada Figure 17.
Summary
Item Data Item Data
Close (May 23, 2019)) 3,850 (+1.58%) Normal trading range 3,690 - 3,910
Relative Avg. Price performance to JCI (%) 37.28 Target
β (beta) 1.66 - Daily 3,890
Corelation 0.93 - Weekly 3,910
Period 49 - Monthly 4,300
r-squared 0.846 Stop loss 3,650
Volatility (+/-, %) +2.9/ -2.97
Volatility (+/-, Rp.) 111.65/ -114.35
Source: Mirae Asset Sekuritas Indonesia Research
Figure 16 .Weekly Trend – Uptrend
Source: Mirae Asset Sekuritas Indonesia Research
,
Created with AmiBroker - adv anced charting and technical analy sis sof tware. http://www.amibroker.com
_____ 3,910.1
_____ 3,687.0
Optimization Trading System - ©2010 Optimization Trading System - ©2010 Optimization Trading System - ©2010 Optimization Trading System - ©2010
Bank Rakyat Indonesia (Persero) Tbk. [ BBRI ] - Weekly - 5/23/2019 Open: 3,800 High: 3,890 Low: 3,660 Close: 3,850 Vol. 699,668,992
Prev. Avg. Price: 3,800.0
R-Squared: 0.8456
Period: 49
Std.Dev: 1.43
Volatility (+) : 0.0290
Volatility (-) : -0.0297
V-Ratio : 0.97
Chg.: 1.58%
3,850
3,761.77
3,647.08
4,005.76
4,164.07
4,262.98
4,262.98
4,520.2
4,878.88
Oct 2018 Apr Jul Oct 2019 Apr
BBRI - Volume = 699,668,992.00, MA(Volume,8) = 548,889,728.00
699,668,992
548,889,728
24 Mei, 2019
14
Embun Pagi
Mirae Asset Sekuritas Indonesia
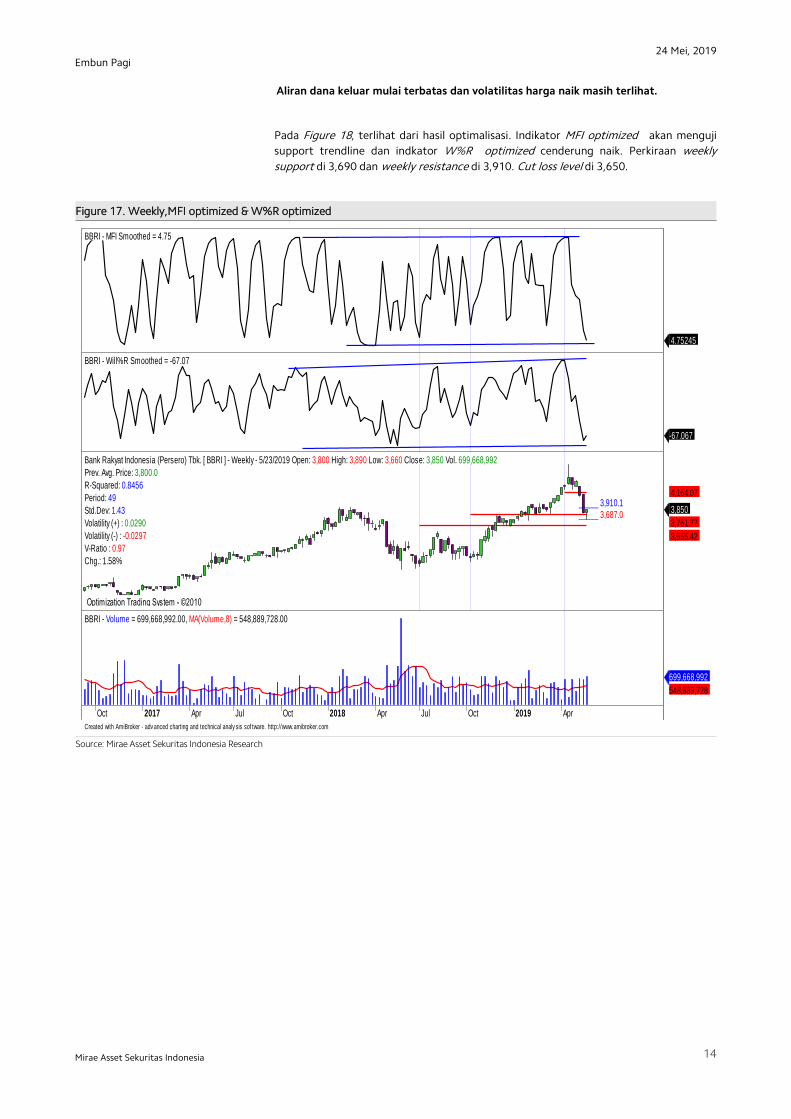
Aliran dana keluar mulai terbatas dan volatilitas harga naik masih terlihat.
Pada Figure 18, terlihat dari hasil optimalisasi. Indikator MFI optimized akan menguji
support trendline dan indkator W%R optimized cenderung naik. Perkiraan weekly
support di 3,690 dan weekly resistance di 3,910. Cut loss level di 3,650.
Figure 17. Weekly,MFI optimized & W%R optimized
Source: Mirae Asset Sekuritas Indonesia Research
Created with AmiBroker - adv anced charting and technical analy sis sof tware. http://www.amibroker.com
BBRI - MFI Smoothed = 4.75
4.75245
BBRI - Will%R Smoothed = -67.07
-67.067
_____ 3,910.1_____ 3,687.0
Optimization Trading System - ©2010 Optimization Trading System - ©2010 Optimization Trading System - ©2010
Bank Rakyat Indonesia (Persero) Tbk. [ BBRI ] - Weekly - 5/23/2019 Open: 3,800 High: 3,890 Low: 3,660 Close: 3,850 Vol. 699,668,992
Prev. Avg. Price: 3,800.0
R-Squared: 0.8456
Period: 49
Std.Dev: 1.43
Volatility (+) : 0.0290
Volatility (-) : -0.0297
V-Ratio : 0.97
Chg.: 1.58%
3,850
3,761.77
3,555.42
4,164.07
Oct 2017 Apr Jul Oct 2018 Apr Jul Oct 2019 Apr
BBRI - Volume = 699,668,992.00, MA(Volume,8) = 548,889,728.00
699,668,992
548,889,728
24 Mei, 2019
15
Embun Pagi
Mirae Asset Sekuritas Indonesia
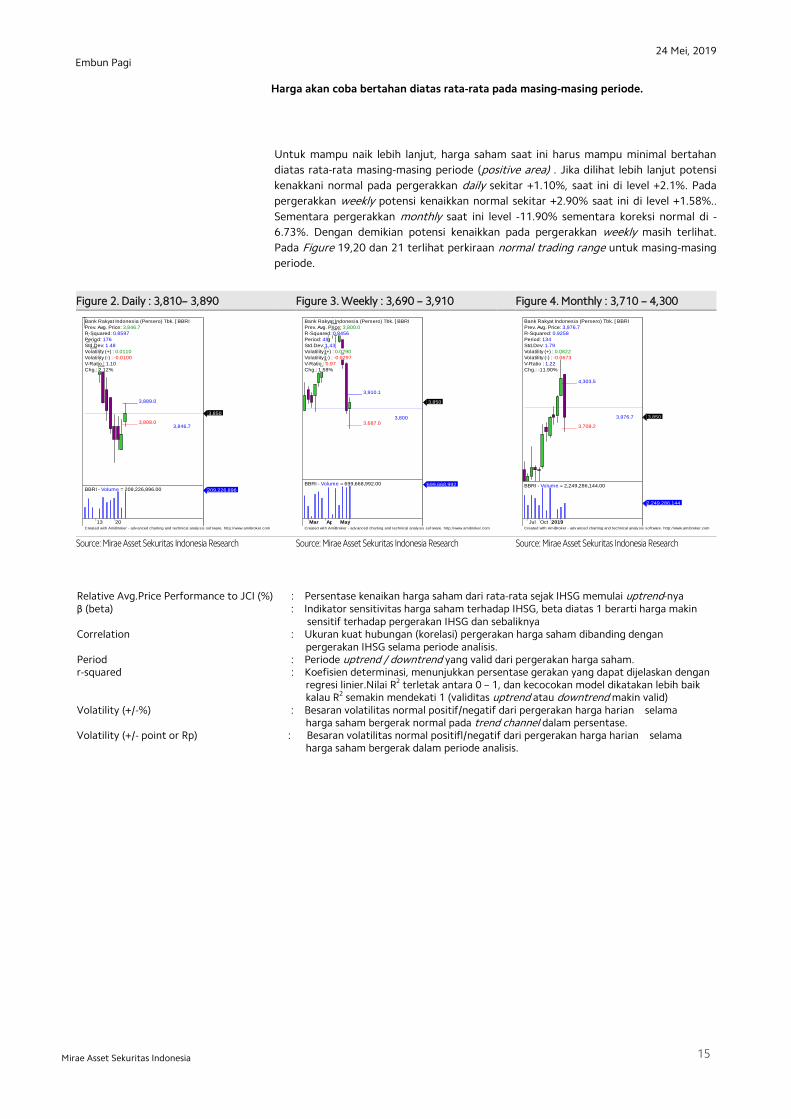
Harga akan coba bertahan diatas rata-rata pada masing-masing periode.
Untuk mampu naik lebih lanjut, harga saham saat ini harus mampu minimal bertahan
diatas rata-rata masing-masing periode (positive area) . Jika dilihat lebih lanjut potensi
kenakkani normal pada pergerakkan daily sekitar +1.10%, saat ini di level +2.1%. Pada
pergerakkan weekly potensi kenaikkan normal sekitar +2.90% saat ini di level +1.58%..
Sementara pergerakkan monthly saat ini level -11.90% sementara koreksi normal di -
6.73%. Dengan demikian potensi kenaikkan pada pergerakkan weekly masih terlihat.
Pada Figure 19,20 dan 21 terlihat perkiraan normal trading range untuk masing-masing
periode.
Figure 2. Daily : 3,810– 3,890 Figure 3. Weekly : 3,690 – 3,910 Figure 4. Monthly : 3,710 – 4,300
,,
x` x,
Source: Mirae Asset Sekuritas Indonesia Research
Source: Mirae Asset Sekuritas Indonesia Research
Source: Mirae Asset Sekuritas Indonesia Research
Relative Avg.Price Performance to JCI (%) : Persentase kenaikan harga saham dari rata-rata sejak IHSG memulai uptrend-nya β (beta) : Indikator sensitivitas harga saham terhadap IHSG, beta diatas 1 berarti harga makin sensitif terhadap pergerakan IHSG dan sebaliknya Correlation : Ukuran kuat hubungan (korelasi) pergerakan harga saham dibanding dengan pergerakan IHSG selama periode analisis. Period : Periode uptrend / downtrend yang valid dari pergerakan harga saham. r-squared : Koefisien determinasi, menunjukkan persentase gerakan yang dapat dijelaskan dengan regresi linier.Nilai R2 terletak antara 0 – 1, dan kecocokan model dikatakan lebih baik kalau R2 semakin mendekati 1 (validitas uptrend atau downtrend makin valid) Volatility (+/-%) : Besaran volatilitas normal positif/negatif dari pergerakan harga harian selama harga saham bergerak normal pada trend channel dalam persentase. Volatility (+/- point or Rp) : Besaran volatilitas normal positifl/negatif dari pergerakan harga harian selama harga saham bergerak dalam periode analisis.
Created with AmiBroker - adv anced charting and technical analy sis sof tware. http://www.amibroker.com
_____ 3,889.0
_____ 3,808.03,846.7
Bank Rakyat Indonesia (Persero) Tbk. [ BBRI
Prev. Avg. Price: 3,846.7
R-Squared: 0.8597
Period: 176
Std.Dev: 1.48
Volatility (+) : 0.0110
Volatility (-) : -0.0100
V-Ratio : 1.10
Chg.: 2.12%
3,850
13 20
BBRI - Volume = 209,226,896.00 209,226,896
Created with AmiBroker - adv anced charting and technical analy sis sof tware. http://www.amibroker.com
_____ 3,910.1
_____ 3,687.03,800
Bank Rakyat Indonesia (Persero) Tbk. [ BBRI
Prev. Avg. Price: 3,800.0
R-Squared: 0.8456
Period: 49
Std.Dev: 1.43
Volatility (+) : 0.0290
Volatility (-) : -0.0297
V-Ratio : 0.97
Chg.: 1.58%
3,850
Mar Apr May
BBRI - Volume = 699,668,992.00 699,668,992
Created with AmiBroker - adv anced charting and technical analy sis sof tware. http://www.amibroker.com
_____ 4,303.5
_____ 3,709.2
3,976.7
Bank Rakyat Indonesia (Persero) Tbk. [ BBRI
Prev. Avg. Price: 3,976.7
R-Squared: 0.9258
Period: 134
Std.Dev: 1.79
Volatility (+) : 0.0822
Volatility (-) : -0.0673
V-Ratio : 1.22
Chg.: -11.90%
3,850
Jul Oct 2019
BBRI - Volume = 2,249,286,144.00
2,249,286,144
24 Mei, 2019
16
Embun Pagi
Mirae Asset Sekuritas Indonesia
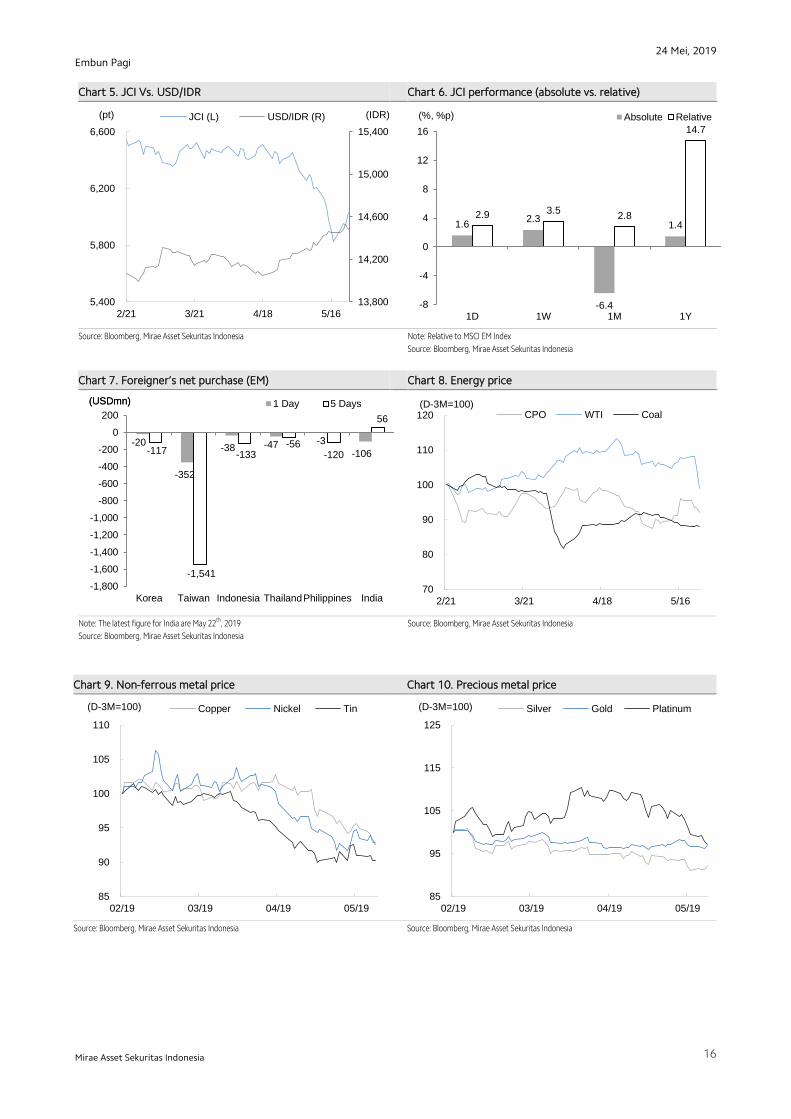
Chart 5. JCI Vs. USD/IDR Chart 6. JCI performance (absolute vs. relative)
Source: Bloomberg, Mirae Asset Sekuritas Indonesia
Note: Relative to MSCI EM Index
Source: Bloomberg, Mirae Asset Sekuritas Indonesia
Chart 7. Foreigner’s net purchase (EM) Chart 8. Energy price
V
Note: The latest figure for India are May 22th, 2019
Source: Bloomberg, Mirae Asset Sekuritas Indonesia
Source: Bloomberg, Mirae Asset Sekuritas Indonesia
Chart 9. Non-ferrous metal price Chart 10. Precious metal price
Source: Bloomberg, Mirae Asset Sekuritas Indonesia Source: Bloomberg, Mirae Asset Sekuritas Indonesia
13,800
14,200
14,600
15,000
15,400
5,400
5,800
6,200
6,600
2/21 3/21 4/18 5/16
(IDR) (pt) JCI (L) USD/IDR (R)
1.6 2.3
-6.4
1.4 2.9 3.5
2.8
14.7
-8
-4
0
4
8
12
16
1D 1W 1M 1Y
Absolute Relative(%, %p)
-20
-352
-38 -47 -3
-106 -117
-1,541
-133 -56
-120
56
-1,800
-1,600
-1,400
-1,200
-1,000
-800
-600
-400
-200
0
200
Korea Taiwan Indonesia ThailandPhilippines India
1 Day 5 Days (USDmn) (USDmn)
80
90
100
110
6/27 7/25 8/22 9/19
CPO WTI Coal(D-3M=100) (D-3M=100)
70
80
90
100
110
120
2/21 3/21 4/18 5/16
CPO WTI Coal(D-3M=100)
85
90
95
100
105
110
02/19 03/19 04/19 05/19
(D-3M=100) Copper Nickel Tin
85
95
105
115
125
02/19 03/19 04/19 05/19
(D-3M=100) Silver Gold Platinum
24 Mei, 2019
17
Embun Pagi
Mirae Asset Sekuritas Indonesia
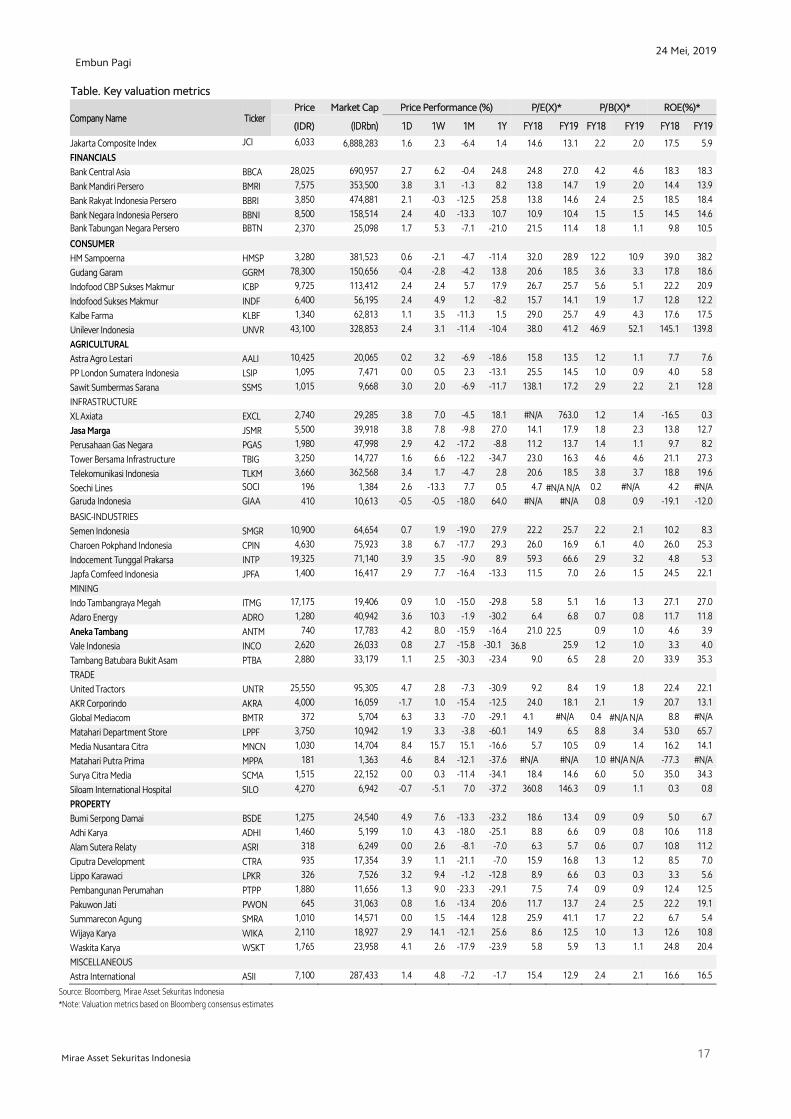
Table. Key valuation metrics
Company Name Ticker Price Market Cap Price Performance (%) P/E(X)* P/B(X)* ROE(%)*
(IDR) (IDRbn) 1D 1W 1M 1Y FY18 FY19 FY18 FY19 FY18 FY19
Jakarta Composite Index JCI 6,033 6,888,283 1.6 2.3 -6.4 1.4 14.6 13.1 2.2 2.0 17.5 5.9
FINANCIALS
Bank Central Asia BBCA 28,025 690,957 2.7 6.2 -0.4 24.8 24.8 27.0 4.2 4.6 18.3 18.3
Bank Mandiri Persero BMRI 7,575 353,500 3.8 3.1 -1.3 8.2 13.8 14.7 1.9 2.0 14.4 13.9
Bank Rakyat Indonesia Persero BBRI 3,850 474,881 2.1 -0.3 -12.5 25.8 13.8 14.6 2.4 2.5 18.5 18.4
Bank Negara Indonesia Persero BBNI 8,500 158,514 2.4 4.0 -13.3 10.7 10.9 10.4 1.5 1.5 14.5 14.6
Bank Tabungan Negara Persero BBTN 2,370 25,098 1.7 5.3 -7.1 -21.0 21.5 11.4 1.8 1.1 9.8 10.5
CONSUMER
HM Sampoerna HMSP 3,280 381,523 0.6 -2.1 -4.7 -11.4 32.0 28.9 12.2 10.9 39.0 38.2
Gudang Garam GGRM 78,300 150,656 -0.4 -2.8 -4.2 13.8 20.6 18.5 3.6 3.3 17.8 18.6
Indofood CBP Sukses Makmur ICBP 9,725 113,412 2.4 2.4 5.7 17.9 26.7 25.7 5.6 5.1 22.2 20.9
Indofood Sukses Makmur INDF 6,400 56,195 2.4 4.9 1.2 -8.2 15.7 14.1 1.9 1.7 12.8 12.2
Kalbe Farma KLBF 1,340 62,813 1.1 3.5 -11.3 1.5 29.0 25.7 4.9 4.3 17.6 17.5
Unilever Indonesia UNVR 43,100 328,853 2.4 3.1 -11.4 -10.4 38.0 41.2 46.9 52.1 145.1 139.8
AGRICULTURAL
Astra Agro Lestari AALI 10,425 20,065 0.2 3.2 -6.9 -18.6 15.8 13.5 1.2 1.1 7.7 7.6
PP London Sumatera Indonesia LSIP 1,095 7,471 0.0 0.5 2.3 -13.1 25.5 14.5 1.0 0.9 4.0 5.8
Sawit Sumbermas Sarana SSMS 1,015 9,668 3.0 2.0 -6.9 -11.7 138.1 17.2 2.9 2.2 2.1 12.8
INFRASTRUCTURE
XL Axiata EXCL 2,740 29,285 3.8 7.0 -4.5 18.1 #N/A N/A
763.0 1.2 1.4 -16.5 0.3
Jasa Marga JSMR 5,500 39,918 3.8 7.8 -9.8 27.0 14.1 17.9 1.8 2.3 13.8 12.7
Perusahaan Gas Negara PGAS 1,980 47,998 2.9 4.2 -17.2 -8.8 11.2 13.7 1.4 1.1 9.7 8.2
Tower Bersama Infrastructure TBIG 3,250 14,727 1.6 6.6 -12.2 -34.7 23.0 16.3 4.6 4.6 21.1 27.3
Telekomunikasi Indonesia TLKM 3,660 362,568 3.4 1.7 -4.7 2.8 20.6 18.5 3.8 3.7 18.8 19.6
Soechi Lines SOCI 196 1,384 2.6 -13.3 7.7 0.5 4.7 #N/A N/A 0.2 #N/A N/A
4.2 #N/A N/A Garuda Indonesia GIAA 410 10,613 -0.5 -0.5 -18.0 64.0 #N/A
N/A #N/A
N/A 0.8 0.9 -19.1 -12.0
BASIC-INDUSTRIES
Semen Indonesia SMGR 10,900 64,654 0.7 1.9 -19.0 27.9 22.2 25.7 2.2 2.1 10.2 8.3
Charoen Pokphand Indonesia CPIN 4,630 75,923 3.8 6.7 -17.7 29.3 26.0 16.9 6.1 4.0 26.0 25.3
Indocement Tunggal Prakarsa INTP 19,325 71,140 3.9 3.5 -9.0 8.9 59.3 66.6 2.9 3.2 4.8 5.3
Japfa Comfeed Indonesia JPFA 1,400 16,417 2.9 7.7 -16.4 -13.3 11.5 7.0 2.6 1.5 24.5 22.1
MINING
Indo Tambangraya Megah ITMG 17,175 19,406 0.9 1.0 -15.0 -29.8 5.8 5.1 1.6 1.3 27.1 27.0
Adaro Energy ADRO 1,280 40,942 3.6 10.3 -1.9 -30.2 6.4 6.8 0.7 0.8 11.7 11.8
Aneka Tambang ANTM 740 17,783 4.2 8.0 -15.9 -16.4 21.0 22.5 0.9 1.0 4.6 3.9
Vale Indonesia INCO 2,620 26,033 0.8 2.7 -15.8 -30.1 36.8 25.9 1.2 1.0 3.3 4.0
Tambang Batubara Bukit Asam PTBA 2,880 33,179 1.1 2.5 -30.3 -23.4 9.0 6.5 2.8 2.0 33.9 35.3
TRADE
United Tractors UNTR 25,550 95,305 4.7 2.8 -7.3 -30.9 9.2 8.4 1.9 1.8 22.4 22.1
AKR Corporindo AKRA 4,000 16,059 -1.7 1.0 -15.4 -12.5 24.0 18.1 2.1 1.9 20.7 13.1
Global Mediacom BMTR 372 5,704 6.3 3.3 -7.0 -29.1 4.1 #N/A N/A
0.4 #N/A N/A 8.8 #N/A N/A Matahari Department Store LPPF 3,750 10,942 1.9 3.3 -3.8 -60.1 14.9 6.5 8.8 3.4 53.0 65.7
Media Nusantara Citra MNCN 1,030 14,704 8.4 15.7 15.1 -16.6 5.7 10.5 0.9 1.4 16.2 14.1
Matahari Putra Prima MPPA 181 1,363 4.6 8.4 -12.1 -37.6 #N/A N/A
#N/A N/A
1.0 #N/A N/A -77.3 #N/A N/A Surya Citra Media SCMA 1,515 22,152 0.0 0.3 -11.4 -34.1 18.4 14.6 6.0 5.0 35.0 34.3
Siloam International Hospital SILO 4,270 6,942 -0.7 -5.1 7.0 -37.2 360.8 146.3 0.9 1.1 0.3 0.8
PROPERTY
Bumi Serpong Damai BSDE 1,275 24,540 4.9 7.6 -13.3 -23.2 18.6 13.4 0.9 0.9 5.0 6.7
Adhi Karya ADHI 1,460 5,199 1.0 4.3 -18.0 -25.1 8.8 6.6 0.9 0.8 10.6 11.8
Alam Sutera Relaty ASRI 318 6,249 0.0 2.6 -8.1 -7.0 6.3 5.7 0.6 0.7 10.8 11.2
Ciputra Development CTRA 935 17,354 3.9 1.1 -21.1 -7.0 15.9 16.8 1.3 1.2 8.5 7.0
Lippo Karawaci LPKR 326 7,526 3.2 9.4 -1.2 -12.8 8.9 6.6 0.3 0.3 3.3 5.6
Pembangunan Perumahan PTPP 1,880 11,656 1.3 9.0 -23.3 -29.1 7.5 7.4 0.9 0.9 12.4 12.5
Pakuwon Jati PWON 645 31,063 0.8 1.6 -13.4 20.6 11.7 13.7 2.4 2.5 22.2 19.1
Summarecon Agung SMRA 1,010 14,571 0.0 1.5 -14.4 12.8 25.9 41.1 1.7 2.2 6.7 5.4
Wijaya Karya WIKA 2,110 18,927 2.9 14.1 -12.1 25.6 8.6 12.5 1.0 1.3 12.6 10.8
Waskita Karya WSKT 1,765 23,958 4.1 2.6 -17.9 -23.9 5.8 5.9 1.3 1.1 24.8 20.4
MISCELLANEOUS
Astra International ASII 7,100 287,433 1.4 4.8 -7.2 -1.7 15.4 12.9 2.4 2.1 16.6 16.5
Source: Bloomberg, Mirae Asset Sekuritas Indonesia
*Note: Valuation metrics based on Bloomberg consensus estimates
24 Mei, 2019
18
Embun Pagi
Mirae Asset Sekuritas Indonesia
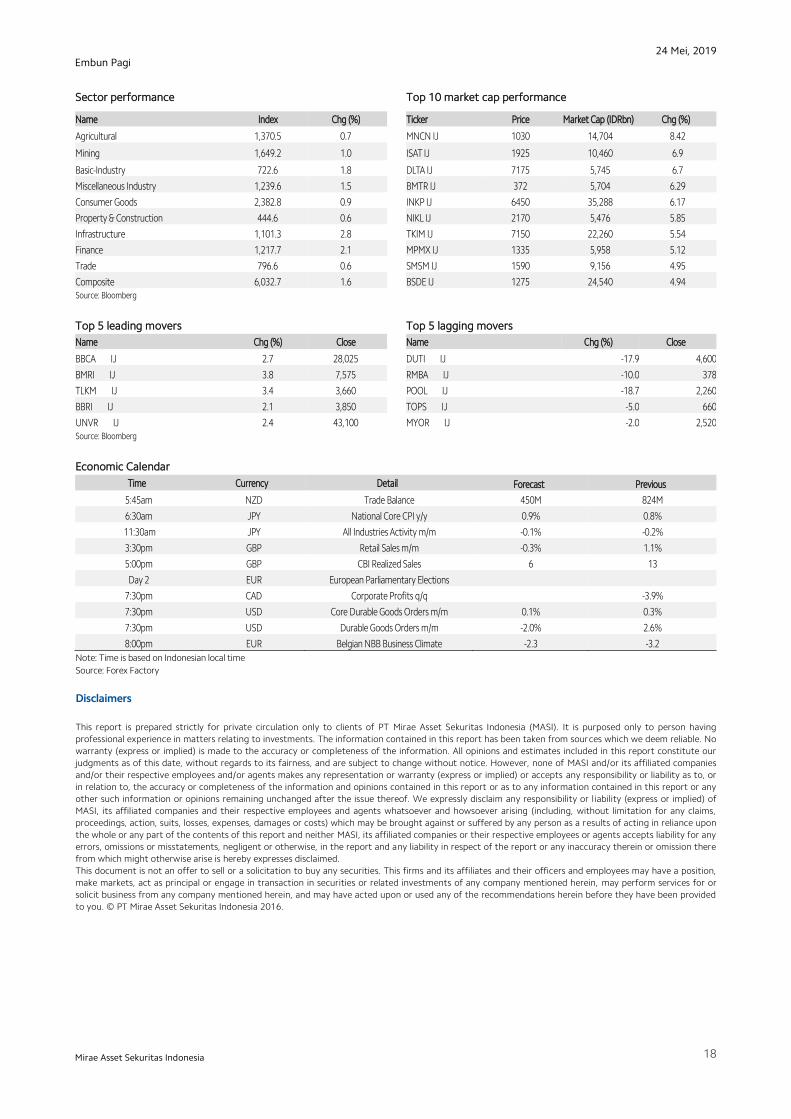
Sector performance Top 10 market cap performance
Name Index Chg (%) Ticker Price Market Cap (IDRbn) Chg (%)
Agricultural 1,370.5 0.7 MNCN IJ 1030 14,704 8.42
Mining 1,649.2 1.0
ISAT IJ 1925 10,460 6.9
Basic-Industry 722.6 1.8 DLTA IJ 7175 5,745 6.7
Miscellaneous Industry 1,239.6 1.5 BMTR IJ 372 5,704 6.29
Consumer Goods 2,382.8 0.9 INKP IJ 6450 35,288 6.17
Property & Construction 444.6 0.6
NIKL IJ 2170 5,476 5.85
Infrastructure 1,101.3 2.8 TKIM IJ 7150 22,260 5.54
Finance 1,217.7 2.1 MPMX IJ 1335 5,958 5.12
Trade 796.6 0.6 SMSM IJ 1590 9,156 4.95
Composite 6,032.7 1.6 BSDE IJ 1275 24,540 4.94 Source: Bloomberg
Top 5 leading movers Top 5 lagging movers
Name Chg (%) Close Name Chg (%) Close
BBCA IJ 2.7 28,025 DUTI IJ -17.9 4,600
BMRI IJ 3.8 7,575 RMBA IJ -10.0 378
TLKM IJ 3.4 3,660 POOL IJ -18.7 2,260
BBRI IJ 2.1 3,850 TOPS IJ -5.0 660
UNVR IJ 2.4 43,100 MYOR IJ -2.0 2,520 Source: Bloomberg
Economic Calendar
Time Currency Detail Forecast Previous
5:45am NZD Trade Balance 450M 824M
6:30am JPY National Core CPI y/y 0.9% 0.8%
11:30am JPY All Industries Activity m/m -0.1% -0.2%
3:30pm GBP Retail Sales m/m -0.3% 1.1%
5:00pm GBP CBI Realized Sales 6 13
Day 2 EUR European Parliamentary Elections
7:30pm CAD Corporate Profits q/q -3.9%
7:30pm USD Core Durable Goods Orders m/m 0.1% 0.3%
7:30pm USD Durable Goods Orders m/m -2.0% 2.6%
8:00pm EUR Belgian NBB Business Climate -2.3 -3.2
Note: Time is based on Indonesian local time
Source: Forex Factory
Disclaimers
This report is prepared strictly for private circulation only to clients of PT Mirae Asset Sekuritas Indonesia (MASI). It is purposed only to person having
professional experience in matters relating to investments. The information contained in this report has been taken from sources which we deem reliable. No
warranty (express or implied) is made to the accuracy or completeness of the information. All opinions and estimates included in this report constitute our
judgments as of this date, without regards to its fairness, and are subject to change without notice. However, none of MASI and/or its affiliated companies
and/or their respective employees and/or agents makes any representation or warranty (express or implied) or accepts any responsibility or liability as to, or
in relation to, the accuracy or completeness of the information and opinions contained in this report or as to any information contained in this report or any
other such information or opinions remaining unchanged after the issue thereof. We expressly disclaim any responsibility or liability (express or implied) of
MASI, its affiliated companies and their respective employees and agents whatsoever and howsoever arising (including, without limitation for any claims,
proceedings, action, suits, losses, expenses, damages or costs) which may be brought against or suffered by any person as a results of acting in reliance upon
the whole or any part of the contents of this report and neither MASI, its affiliated companies or their respective employees or agents accepts liability for any
errors, omissions or misstatements, negligent or otherwise, in the report and any liability in respect of the report or any inaccuracy therein or omission there
from which might otherwise arise is hereby expresses disclaimed.
This document is not an offer to sell or a solicitation to buy any securities. This firms and its affiliates and their officers and employees may have a position,
make markets, act as principal or engage in transaction in securities or related investments of any company mentioned herein, may perform services for or
solicit business from any company mentioned herein, and may have acted upon or used any of the recommendations herein before they have been provided
to you. © PT Mirae Asset Sekuritas Indonesia 2016.