1 Statistik Asuransi Gempa Bumi Indonesia as at June 2011 Statistik As at June 2011.pdf · Dengan...
86
1 Statistik Asuransi Gempa Bumi Indonesia as at June 2011
Transcript of 1 Statistik Asuransi Gempa Bumi Indonesia as at June 2011 Statistik As at June 2011.pdf · Dengan...
1 S t a t i s t i k A s u r a n s i G e m p a B u m i I n d o n e s i a a s a t J u n e 2 0 1 1

i S t a t i s t i k A s u r a n s i G e m p a B u m i I n d o n e s i a a s a t J u n e 2 0 1 1
Sesuai dengan tujuan pendiriannya, MAIPARK memberikan pelayanan bagi industri asuransi Indonesia dalam hal pengetahuan dan statistik mengenai risiko bencana. Inovasi terus kami lakukan untuk menyempurnakan laporan statistik ini, sehingga menjadi lebih akurat, rinci dan komprehensif. Berikut kami sajikan Laporan Statistik Asuransi Gempa Bumi Indonesia per Juni 2011 yang mencakup :
o Inovasi terhadap sistem dan proses pengolahan data statistik.
o Peta Kejadian Gempa Bumi Indonesia. o Peta Exposure Gempa Bumi Indonesia. o Penggolongan tersendiri atas risiko multi
lokasi, dalam laporan profile risiko dan klaim.
o Analisa asuransi gempa terkait kondisi makro ekonomi.
o Current Seismic Analysis. o Laporan dengan dua bahasa (Bahasa
Indonesia – Bahasa Inggris). o Panel navigasi yang akan memudahkan
dalam menelusuri laporan statistik ini. o Tabel, peta dan grafik yang kreatif.
Dengan semangat ”Go Green”, laporan tersebut disajikan dalam bentuk soft copy dan tidak lagi diproduksi dalam bentuk hard copy. Usaha yang kami lakukan dalam menyempurnakan laporan statistik ini tidak akan berarti apa - apa tanpa dukungan dari seluruh perusahaan asuransi. Data yang lengkap dan akurat akan sangat menentukan kualitas dari hasil statistik ini.
In line with the objective of its establishment, MAIPARK provide services for the insurance industry of Indonesia in terms of science and statistics on disaster risk. We keep on doing to make this statistics report to be more accurate, detailed and comprehensive. Herewith we present Indonesian Earthquake of As at June 2011 which include:
o Innovation of the system and statistical data processing.
o Map of Indonesian Earthquake Occurrence.
o Map of Indonesian Earthquake Exposure. o Separate classification of multi-location
risks in and Loss report. o Analysis of earthquake insurance related
to macro economic conditions. o Current . o Bilingual reports (Indonesian - English). o Navigation Panel to ease to trace
the statistical report. o Creative tables, maps and graphs.
With the spirit of "Go Green” the report is presented in soft copy rather than hard copy. Our efforts to continously improve this statistic report are nothing without all insurance companies’ support. Complete and accurate data will greatly determine the quality of these statistical results.
Kata Pengantar Foreword
ii S t a t i s t i k A s u r a n s i G e m p a B u m i I n d o n e s i a a s a t J u n e 2 0 1 1
Kami berharap laporan statistik ini dapat memberikan manfaat tidak hanya bagi perusahaan asuransi yang menangani asuransi gempa bumi, namun juga berguna bagi industri Asuransi Umum di Indonesia.
We hope that this statistic report is useful for both insurance companies having earthquake business and general insurance industry in Indonesia.
Salam Inovasi MAIPARK !!
Frans Y. Sahusilawane President Director

iii S t a t i s t i k A s u r a n s i G e m p a B u m i I n d o n e s i a a s a t J u n e 2 0 1 1
Daftar Isi Kata Pengantar ....................................................... i
Daftar Isi ................................................................ iii Informasi Statistik ................................................ vi
Ikhtisar Kegiatan Asuransi Gempa Bumi Indonesia per Juni 2011 .........................................
A. Pendahuluan ........................................... 1
B. Struktur Pasar ......................................... 1
C. Pertumbuhan Premi Bruto ..................... 2
D. Jumlah Risiko ......................................... 5
E. Kontribusi Asuransi Gempa Bumi Indonesia .................................................... 8
F. Pertumbuhan Klaim Terjadi .................. 15 Exposure Asuransi Gempa Bumi Indonesia ........
Tabel 2.1. Exposure Per Cresta Zone ........ 21
Tabel 2.2. Exposure Per Okupasi ............... 23
Tabel 2.3. Exposure Per Interest ............... 25
Tabel 2.4. Exposure Per Provinsi ............... 27
Gross Premium Asuransi Gempa Bumi Indonesia ................................................................
Tabel 3.1. Gross Premium Per Cresta Zone ................................................................... 28
Tabel 3.2. Gross Premium Per Okupasi ..... 30
Tabel 3.3. Gross Premium Per Provinsi ..... 32
Jumlah Risiko Asuransi Gempa Bumi Indonesia
Tabel 4.1. Jumlah Risiko Per Cresta Zone . 33
Tabel 4.2. Jumlah Risiko Per Okupasi ........ 35
Klaim Asuransi Gempa Bumi Indonesia ..............
Tabel 5.1. Klaim Frekwensi Per Okupasi ... 37
Tabel 5.2. Klaim Frekwensi Per Cresta Zone................................................................... 39
Tabel 5.3. Jumlah Klaim Per Okupasi ........ 41
Tabel 5.4. Jumlah Klaim Per Cresta Zone .. 43
Profil Risiko dan Klaim ..........................................
Tabel 6.1. Semua Tahun Underwriting, Semua Okupasi, Semua Cresta Zone ......... 45
Contents Foreword ................................................................ i Contents ................................................................ iii Statistical Information .......................................... vi Summary of Indonesia Earthquake Insurance As at June 2011 ............................................................
A. Introduction ............................................ 1
B. Market Structure .................................... 1
C. Growth of Gross Premium ...................... 2
D. Number of Risk ...................................... 5
E. Indonesian Earthquake Insurance Contribution ............................................... 8
F. Growth of Claim Incurred.. .................... 15 Indonesia Earthquake Insurance Exposure ........
Table 2.1.Exposure By Cresta Zone .......... 21
Table 2.2.Exposure By Occupation ............ 23
Table 2.3.Exposure By Interest .................. 25
Table 2.4.Exposure By Province ................ 27
Indonesian Earthquake Insurance Gross Premium .................................................................
Table 3.1.Gross Premium By Cresta Zone 28
Table 3.2.Gross Premium By Occupation .. 30
Table 3.3.Gross Premium By Province ...... 32 Indonesian Earthquake Insurance Number of Risk .........................................................................
Table 4.1.Number of Risk By Cresta Zone 33
Table 4.2.Number of Risk By Occupation .. 35
Indonesian Earthquake Insurance Claim .............
Table 5.1. Claim Frequency By Occupation .................................................................. 37
Table 5.2. Claim Frequency By Cresta Zone .................................................................. 39
Table 5.3. Claim Amount By Occupation... 41
Table 5.4. Claim Amount By Cresta Zone .. 43
Risk and Loss Profile ............................................
Table 6.1. All Underwriting Year, All Occupation, All Cresta Zone ...................... 45

iv S t a t i s t i k A s u r a n s i G e m p a B u m i I n d o n e s i a a s a t J u n e 2 0 1 1
Tabel 6.2. Tahun Underwriting 2011, Semua Okupasi, Semua Cresta Zone .................... 46
Tabel 6.3. Tahun Underwriting 2010, Semua Okupasi, Semua Cresta Zone .................... 47
Tabel 6.4. Tahun Underwriting 2009, Semua Okupasi, Semua Cresta Zone .................... 48
Tabel 6.5. Tahun Underwriting 2008, Semua Okupasi, Semua Cresta Zone .................... 49
Tabel 6.6. Tahun Underwriting 2007, Semua Okupasi, Semua Cresta Zone .................... 50
Profil Risiko dan Klaim Tahun Underwriting 2011 .........................................................................
Okupasi Agricultural By Cresta Zone ......... 51
Okupasi Commercial By Cresta Zone ....... 52
Okupasi Industrial By Cresta Zone ........... 53
Okupasi Residential By Cresta Zone ......... 54
Profil Risiko dan Klaim Tahun Underwriting 2010 .........................................................................
Okupasi Agricultural By Cresta Zone ........ 55
Okupasi Commercial By Cresta Zone ....... 56
Okupasi Industrial By Cresta Zone ........... 57
Okupasi Residential By Cresta Zone ......... 58
Profil Risiko dan Klaim Tahun Underwriting 2009 .........................................................................
Okupasi Agricultural By Cresta Zone ........ 59
Okupasi Commercial By Cresta Zone ....... 60
Okupasi Industrial By Cresta Zone ........... 61
Okupasi Residential By Cresta Zone ......... 62
Profil Risiko dan Klaim Tahun Underwriting 2008 .........................................................................
Okupasi Agricultural By Cresta Zone ........ 63
Okupasi Commercial By Cresta Zone ....... 64
Okupasi Industrial By Cresta Zone ........... 65
Okupasi Residential By Cresta Zone ......... 66
Profil Risiko dan Klaim Tahun Underwriting 2007 .........................................................................
Okupasi Agricultural By Cresta Zone ........ 67
Okupasi Commercial By Cresta Zone ....... 68
Okupasi Industrial By Cresta Zone ........... 69
Okupasi Residential By Cresta Zone ......... 70
Table 6.2. Underwriting Year 2011, All Occupation, All Cresta Zone ...................... 46
Table 6.3. Underwriting Year 2010, All Occupation, All Cresta Zone ...................... 47
Table 6.4. Underwriting Year 2009, All Occupation, All Cresta Zone ...................... 48
Table 6.5. Underwriting Year 2008, All Occupation, All Cresta Zone ...................... 49
Table 6.6. Underwriting Year 2007, All Occupation, All Cresta Zone ...................... 50
Risk and Loss Profile Underwriting Year 2011 ...
Agricultural Occupation By Cresta Zone .. 51
Commercial Occupation By Cresta Zone . 52
Industrial Occupation By Cresta Zone ..... 53
Residential Occupation By Cresta Zone ... 54
Risk and Loss Profile Underwriting Year 2010 ..
Agricultural Occupation By Cresta Zone 55
Commercial Occupation By Cresta Zone 56
Industrial Occupation By Cresta Zone ..... 57
Residential Occupation By Cresta Zone ... 58
Risk and Loss Profile Underwriting Year 2009 ...
Agricultural Occupation By Cresta Zone . 59
Commercial Occupation By Cresta Zone . 60
Industrial Occupation By Cresta Zone ..... 61 Residential By Cresta Zone ....................... 62
Risk and Loss Profile Underwriting Year 2008 ..
Agricultural Occupation By Cresta Zone . 63
Commercial Occupation By Cresta Zone . 64
Industrial Occupation By Cresta Zone ..... 65
Residential Occupation By Cresta Zone ... 66
Risk and Loss Profile Underwriting Year 2007 ..
Agricultural Occupation By Cresta Zone 67
Commercial Occupation By Cresta Zone . 68
Industrial Occupation By Cresta Zone ..... 69
Residential Occupation By Cresta Zone ... 70

v S t a t i s t i k A s u r a n s i G e m p a B u m i I n d o n e s i a a s a t J u n e 2 0 1 1
Daftar Istilah ...................................................... Lampiran
1. Tarif Asuransi Gempa Bumi Indonesia
2. Skala First Loss ........................................
3. Tabel Jangka Waktu Pertanggungan kurang dari satu tahun ..........................
4. Tabel Indemnitas ..................................
Glossaries ......................................................
Attachments
1. Indonesian Earthquake Insurance Tariff ................................................................
2. First Loss Scale ........................................
3. Short Period Table less than one year period ....................................................
4. Indemnity Table ....................................
vi S t a t i s t i k A s u r a n s i G e m p a B u m i I n d o n e s i a a s a t J u n e 2 0 1 1
1. Statistik dibuat berdasarkan Underwriting Year yang tercatat sampai dengan posisi 30 Juni 2011.
2. Sesi Limit 2.1. Limit Sesi didasarkan atas setiap
risiko. 2.2. Yang dimaksud dengan setiap
risiko (anyone risk) adalah akumulasi (aggregate) jumlah harga pertanggungan seluruh risiko pada lokasi yang sama untuk masing-masing perusahaan asuransi. Definisi setiap risiko atau setiap lokasi ditentukan oleh perusahaan asuransi atau penerbit polis sesuai dengan interpretasi perusahaan asuransi dalam underwriting polis kebakaran.
2.3. Besarnya Limit Sesi atas setiap risiko (any one risk) untuk gabungan kerugian fisik dan gangguan usaha adalah sebagai berikut : 2.3.1. Untuk daerah Jawa Barat,
Banten dan DKI : 5% (lima persen) dari jumlah seluruh pertanggungan (total sum insured) maksimum USD 2,500,000.00 (dua juta lima ratus ribu Dollar Amerika) atas setiap risiko, setiap perusahaan asuransi atau penerbit polis.
2.3.2 Untuk daerah Indonesia lainnya 25% (dua puluh lima persen) dari jumlah seluruh pertanggungan (total sum insured) maksimum USD 2,500,000.00 (dua juta lima ratus ribu Dollar
1. Statistics are prepared
on Underwriting Year basis, recorded as at June 30 2011.
2. Cession Limit
2.1. Cession Limit is based on any one risk.
2.2. Anyone risk is the accumulation of (aggregate) total sum insured of all risks at the same location for each insurance company. The definition of anyone risk or any location is specified by the insurer or policy issuer in accordance with the interpretation of insurance companies in underwriting fire policy.
2.3. Cession Limit of any one risk for the combined material and business interruption damage are as follows: 2.3.1 For West Java, Banten and
DKI : 5% (five percent) of the total sum insured, a maximum of USD 2,500,000.00 (two million five hundred thousand U.S. Dollars) for any one risk, each insurance company or policy issuer
2.3.2 Other area within Indonesia are 25% (twenty five percent) of total sum insured, maximum of USD 2,500,000.00 (two million five hundred thousand U.S. Dollars) for any one risk, each insurance company or policy issuer.
Informasi Statistik Statistics Information
vii S t a t i s t i k A s u r a n s i G e m p a B u m i I n d o n e s i a a s a t J u n e 2 0 1 1
Amerika) atas setiap risiko setiap perusahaan asuransi atau penerbit polis.
2.4 Dalam hal penutupan secara First Loss Basis / Sub-limit, jumlah yang disesikan sebagaimana diatur dalam butir 2.3. diatas, dikalikan persentase First Loss Basis / Sub-limit Basis.
2.5 Bilamana risiko ditutup secara ko-asuransi, jumlah maksimum sesi dari semua Anggota ko-asuransi adalah sesuai dengan ketentuan yang diatur dalam 2.3. diatas. Sesi masing-masing perusahaan adalah proporsional sebanding sahamnya dalam ko-asuransi.
Dalam hal terdapat penutupan lain selain polis ko-asuransi tersebut pada obyek pertanggungan yang sama, perusahaan asuransi tetap dapat mensesikan risiko dimaksud, dengan catatan jumlah seluruh sesi perusahaan asuransi bersangkutan tidak melebihi ketentuan yang diatur pada butir 2.3.
3. Tarif Premi
3.1. Penutupan dengan menggunakan Full Value Basis mengaplikasikan Tarif Premi Standar Gempa Bumi Indonesia (lampiran 1)
3.2. Penutupan dengan First Loss / Sub Limit Basis mengaplikasikan standar First Loss Scale (lampiran 2)
3.3. Perhitungan premi untuk penutupan kurang dari 12 (dua belas) bulan diberlakukan skala premi jangka pendek (lampiran 3)
3.4. Untuk perhitungan premi Business Interruption diberlakukan Indemnity Period Scale (lampiran 4)
2.4 In term of first loss basis / sub limit policies, the amount cession are stipulated in item 2.3 above, then multiplied by the percentage of First Loss Basis / Sub-limit Basis.
2.5 For coinsurance policies, maximum cession from all members of coinsurance is stipulated in item 2.3 above. Each ceding company cedes proportionally depending on its share. In the even there are other policies on the same risk beside that coinsurance policy, insurer still can cede such risks subject to the maximum limit set out in item 2.3
3. Premium Tariff
3.1. For the coverage of Full Value Basis, Indonesian earthquake rate standard is applied (attachment 1).
3.2. The coverage First Loss / Sub Limit Basis uses standard First Loss Scale (attachment 2).
3.3. Premium calculation for short
period coverage is based on Short Period Scale (attachment 3).
3.4. Premium calculation for business
interruption is based on Indemnity Period Scale (attachment 4)

viii S t a t i s t i k A s u r a n s i G e m p a B u m i I n d o n e s i a a s a t J u n e 2 0 1 1
4. Obyek Pertanggungan 4.1. Obyek pertanggungan yang dapat
disesikan adalah obyek pertanggungan asuransi kebakaran berupa :
4.1.1. Kerusakan Fisik : • Bangunan • Pondasi • Penggalian dan
Sejenisnya • Persediaan Barang • Lain-lain
4.1.2 Gangguan Usaha : • Keuntungan Bruto • Upah • Kenaikan Biaya
Operasional • Lain-lain
4.2 Penutupan sebagaimana dimaksud pada butir 4.1. adalah yang ditutup secara langsung (direct business) termasuk ko-asuransi. Penutupan tidak langsung (indirect business/Reasuransi) tidak dapat disesikan.
5. Pelaporan Bordero. Pelaporan bordero dilakukan setiap
bulannya untuk semua risiko yang ditutup pada bulan yang bersangkutan dan sudah harus diterima selambat-lambatnya pada akhir bulan berikutnya.
6. Untuk kasus “Multi Location Risk” yang
mengalami kesulitan dalam memberikan detail harga pertanggungan perlokasi maka dengan persetujuan AAUI pensesian risiko dan perhitungan premi dilakukan pada zona-zona tertentu.
7. Untuk menggambarkan premi dan harga
pertanggungan yang sebenarnya dalam penutupan asuransi gempa bumi berdasarkan ko-asuransi, diharapkan agar seluruh anggota ko-asuransi mensesikan risiko gempa bumi tersebut.
4. Insured Objects 4.1. Insured objects that can be ceded
are insured objects in fire policy. such as :
4.1.1. Material damage : • Buildings • Foundations • Excavation and the like • Stocks • Others
4.1.2. Business Interruption
• Gross Profit • Wages • Increase in cost of
working • Others
4.2. Insured objects referred in item 4.1 are objects from direct business insurance, including coinsurance. Indirect businesses cannot be ceded.
5. Bordereaux Report.
Bordereaux reports is submitted on a monthly basis for all risk underwritten in the month concerned and should be received by the end of the following month.
6. In the case of Multi Location Risks with
no details of sum insured provided per location, the risk cession and its premium calculation specified zones after approved by AAUI.
7. In order to get overall pictures of each
earthquake insurance covers, it is strongly hoped that all coinsurance members could cede the earthquake cession.

1 S t a t i s t i k A s u r a n s i G e m p a B u m i I n d o n e s i a a s a t J u n e 2 0 1 1
A. Pendahuluan.
Berdasarkan laporan Badan Pusat Statistik tentang Pertumbuhan Ekonomi Indonesia Triwulan II-2011, pertumbuhan ekonomi Indonesia yang diukur berdasarkan kenaikan Pendapatan Domestik Bruto (PDB) pada semester I-2011 meningkat 6,5% dibandingkan semester I-2010. Besaran PDB atas dasar harga berlaku pada triwulan II-2011 mencapai Rp. 1.811,1 Triliun. Ada tiga sektor yang mendominasi tingkat pertumbuhan tertinggi (perbandingan triwulanan dari tahun lalu) yaitu sektor Perdagangan, Hotel dan Restoran sebesar 4,8 %, Sektor Konstruksi sebesar 4,2 % dan Sektor Listrik, Gas dan Air Bersih sebesar 4,0%. Tampak bahwa sektor yang menduduki 2 (dua) peringkat teratas mencerminkan pertumbuhan di Sektor Riil secara keseluruhan, yang tentunya diharapkan akan berdampak positif terhadap pertumbuhan di bidang asuransi. B. Struktur Pasar
Berdasarkan data yang berhasil kami kumpulkan Per 30 Juni 2011, terdapat 84 perusahaan asuransi umum dan perusahaan reasuransi umum yang memiliki izin beroperasi di Indonesia. Dari 84 perusahaan tersebut, 18 perusahaan adalah perusahaan asuransi patungan, 4 perusahaan adalah perusahaan
A. Introduction
Based on the quarter II- 2011’s report on
Indonesian economic growth issued by Statistic
Central Agency, Indonesia’s economic growth
being measured by the increase of GDP at
semester I-2011 have increased by 6.5%
compared to the same period last year. The
GDP amount based on the current prices
reached Rp. 1,811.1 trillions. There are three
sectors dominating the highest increment
(quarter-to-quarter), i.e. Trade, Hotel and
Restaurant Sector at 4.8%. It is followed by
Construction sector at 4.2% and the last
Electricity, Gas and Water sector at 4.0%.
Especially for the first two highest sectors, it
may reflect the growth of Real Sector overall. It
is hoped that this will give positive impacts
towards the growth on insurance sector.
B. Market Structure
Based on the current that we collected per
30 June 2011, there are 84 general insurers
and general reinsurers in Indonesia having
operating licenses in Indonesia. Out of those 84
companies, 18 are joint-venture insurance
companies, 4 are general reinsurance
Ikhtisar Kegiatan Usaha Asuransi Gempa Bumi Indonesia per Juni Tahun 2011 Summary of Indonesian Earthquake Insurance Business Activities in June 2011

2 S t a t i s t i k A s u r a n s i G e m p a B u m i I n d o n e s i a a s a t J u n e 2 0 1 1
reasuransi dan 62 sisanya merupakan perusahaan asuransi swasta nasional.
Sebagai perusahaan asuransi umum satu-satunya di Indonesia yang mengkhususkan diri pada risiko-risiko khusus seperti gempa bumi, MAIPARK terus menerus melakukan perbaikan dan pengembangan seperti dalam sistem pengolahan data dan pembuatan laporan statistik yang terdiri dari pensesian wajib dan pensesian tidak wajib. Diharapkan dengan semakin meningkatnya kualitas laporan statistik maka industri asuransi dapat menarik manfaat akan keberadaan MAIPARK melalui output yang dihasilkan, seperti laporan geologi terkait usaha asuransi, suku premi asuransi gempa bumi maupun laporan statistik ini sendiri.
C. Pertumbuhan Premi Bruto Per 30 Juni 2011, pendapatan premi bruto untuk tahun underwriting 2007 adalah sebesar Rp. 1.858,2 miliar. Premi bruto untuk tahun underwriting 2008 tercatat Rp 1.919,7 miliar, sedangkan untuk tahun underwriting 2009 adalah Rp. 1.946,7 miliar. Dan untuk tahun underwriting 2010 dan 2011 pendapatan asuransi gempa bumi adalah Rp. 2.103,9 miliar dan Rp. 452,9 miliar. Dikarenakan pencatatan ini dilakukan pada pertengahan tahun maka angka-angka yang tersaji di atas masih kecil, terutama untuk tahun underwriting yang masih muda seperti tahun underwriting 2010 dan tahun underwriting 2011. Namun demikian,
companies and the remaining 62 are national
private insurance companies.
As the only one general insurance focusing
on special risks such as earthquake, MAIPARK
keeps on developing and enhancing the
existing system, including the process of
making statistic report comprising of
compulsory and non-compulsory cessions. It is
hoped that the development on the quality of
statistic report, the industry could take benefits
from the existence of MAIPARK through its
outputs, ranging from geological reports related
to insurance business, earthquake insurance
rates and also the statistic report itself.
C. Gross Premium Growth
Per 30 June 2011, the gross premium
income of underwriting year 2007 was Rp.
1,858.2 billion. At the same period in the first
semester 2011, the gross premium income for
underwriting year 2008 was Rp 1,919.7 billion.
For underwriting year 2009, it was Rp 1,946.7
billion. Finally, for underwriting year 2010 and
2011, they are Rp. 2,103.9 billion and Rp.
452.9 billion. Since these have not developed
yet in the first year, those figures were still little,
and would certainly increase until the end of
2011, especially for the figures of underwriting
year 2010 and certainly underwriting year 2011.

3 S t a t i s t i k A s u r a n s i G e m p a B u m i I n d o n e s i a a s a t J u n e 2 0 1 1
angka tersebut dipastikan bergerak naik hingga pencatatan di akhir tahun 2011.
Dari catatan statistik selama tahun underwriting 2007 – tahun underwriting 2011, okupasi industrial selalu memiliki rasio pendapatan premi bruto terbesar dibanding 3 (tiga) okupasi lainnya, yaitu selalu di atas 55%. Kemudian diikuti oleh okupasi komersial, okupasi residensial dan okupasi agrikultural.
Hal ini logis dilihat dari perkembangan bisnis keempat okupasi tersebut. Okupasi Industrial yang didominasi oleh pabrik, manufaktur dan sejenisnya memiliki nilai pertanggungan yang pada umumnya besar sehingga pendapatan premi yang diperoleh juga besar. Sebagai contoh adalah pada tahun underwriting 2007, Unit Pengolahan IV Cilacap Pertamina sebagai pemasok 34% kebutuhan BBM nasional atau 60% kebutuhan BBM di pulau Jawa, memiliki pertanggungan tertinggi yaitu sebesar Rp. 46,4 Triliun. Mengingat laporan statistik ini memuat informasi selama 5 tahun terakhir (UY 2007 – UY 2011), maka data tersebut masih tercatat dalam laporan. Okupasi komersial yang didominasi gedung bertingkat, gedung perkantoran, ruko (rumah toko) dan rukan (rumah kantor) walaupun memiliki tarip premi yang sama dengan okupasi industrial, namun memiliki nilai pertanggungan yang relatif kecil dibanding okupasi industrial sehingga total premi yang diperoleh pun lebih kecil dari okupasi lndustrial.
On our statistic report from underwriting year
2007 to underwriting year 2011, Industrial
occupation is always the biggest contribution
comparing to the remaining three occupations.
It always has percentage higher than 55%.
Then, it is followed by commercial occupation,
residential occupation and agricultural
occupation.
Having seen the development of those four
occupations, this is logical. Industrial
occupation which is dominated by business
such as factories, manufacturers etc usually
have big sum insured resulting big premium.
For example, in Underwriting Year 2007,
Refinery Unit IV Cilacap Pertamina as the main
provider of 34% Fuel Oil for national needs or
60% Fuel Oil in Java Island has the biggest
sum insured at Rp. 46.4 trillion. Since this
statistic report contains the latest 5 year
information (UY 2007 – UY 2011), therefore
such data still appears in this report.
Commercial occupation being dominated
by high-rise buildings, office buildings, shop-
houses and office-houses, having the same
premium rate with industrial occupation, have
relatively smaller sum insured compared to
industrial occupation. In total, the premium will
consequently be smaller than industrial
occupation.
4 S t a t i s t i k A s u r a n s i G e m p a B u m i I n d o n e s i a a s a t J u n e 2 0 1 1
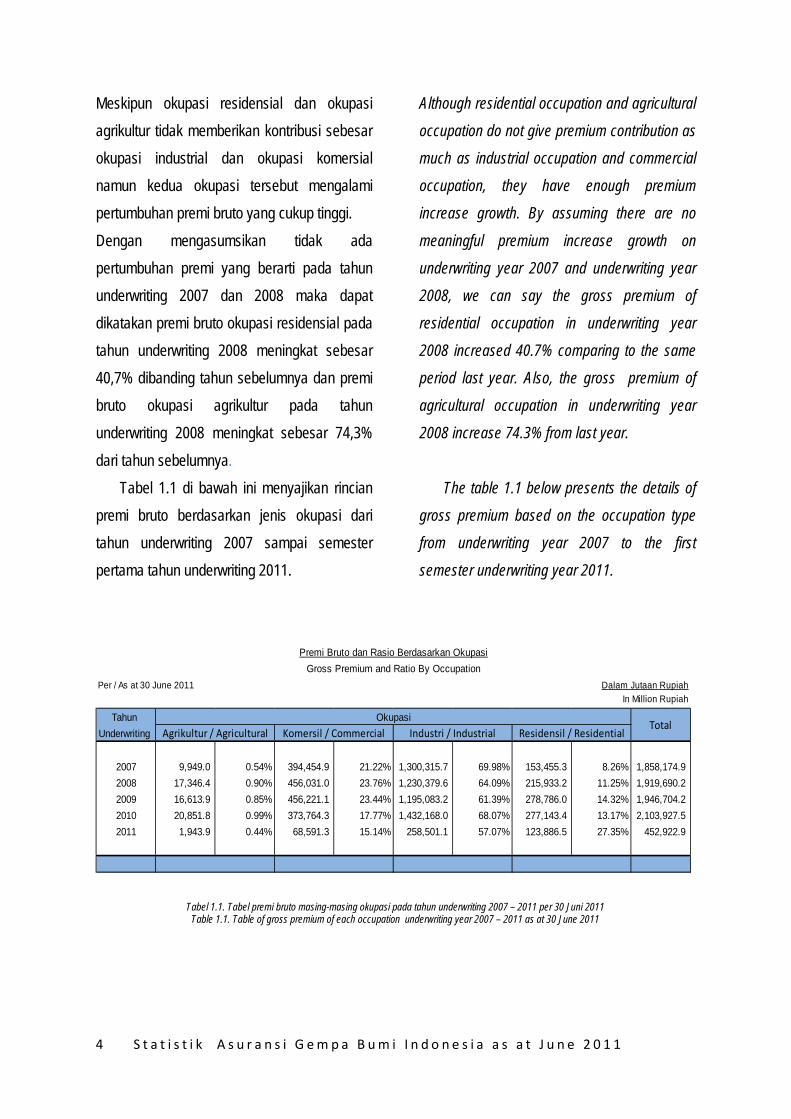
Meskipun okupasi residensial dan okupasi agrikultur tidak memberikan kontribusi sebesar okupasi industrial dan okupasi komersial namun kedua okupasi tersebut mengalami pertumbuhan premi bruto yang cukup tinggi. Dengan mengasumsikan tidak ada pertumbuhan premi yang berarti pada tahun underwriting 2007 dan 2008 maka dapat dikatakan premi bruto okupasi residensial pada tahun underwriting 2008 meningkat sebesar 40,7% dibanding tahun sebelumnya dan premi bruto okupasi agrikultur pada tahun underwriting 2008 meningkat sebesar 74,3% dari tahun sebelumnya.
Tabel 1.1 di bawah ini menyajikan rincian premi bruto berdasarkan jenis okupasi dari tahun underwriting 2007 sampai semester pertama tahun underwriting 2011.
Although residential occupation and agricultural
occupation do not give premium contribution as
much as industrial occupation and commercial
occupation, they have enough premium
increase growth. By assuming there are no
meaningful premium increase growth on
underwriting year 2007 and underwriting year
2008, we can say the gross premium of
residential occupation in underwriting year
2008 increased 40.7% comparing to the same
period last year. Also, the gross premium of
agricultural occupation in underwriting year
2008 increase 74.3% from last year.
The table 1.1 below presents the details of
gross premium based on the occupation type
from underwriting year 2007 to the first
semester underwriting year 2011.
Tabel 1.1. Tabel premi bruto masing-masing okupasi pada tahun underwriting 2007 – 2011 per 30 Juni 2011 Table 1.1. Table of gross premium of each occupation underwriting year 2007 – 2011 as at 30 June 2011
Per / As at 30 June 2011 Dalam Jutaan RupiahIn Million Rupiah
Tahun Underwriting
2007 9,949.0 0.54% 394,454.9 21.22% 1,300,315.7 69.98% 153,455.3 8.26% 1,858,174.92008 17,346.4 0.90% 456,031.0 23.76% 1,230,379.6 64.09% 215,933.2 11.25% 1,919,690.22009 16,613.9 0.85% 456,221.1 23.44% 1,195,083.2 61.39% 278,786.0 14.32% 1,946,704.22010 20,851.8 0.99% 373,764.3 17.77% 1,432,168.0 68.07% 277,143.4 13.17% 2,103,927.52011 1,943.9 0.44% 68,591.3 15.14% 258,501.1 57.07% 123,886.5 27.35% 452,922.9
Premi Bruto dan Rasio Berdasarkan OkupasiGross Premium and Ratio By Occupation
OkupasiAgrikultur / Agricultural Komersil / Commercial Industri / Industrial Residensil / Residential
Total
5 S t a t i s t i k A s u r a n s i G e m p a B u m i I n d o n e s i a a s a t J u n e 2 0 1 1
D. Jumlah Risiko
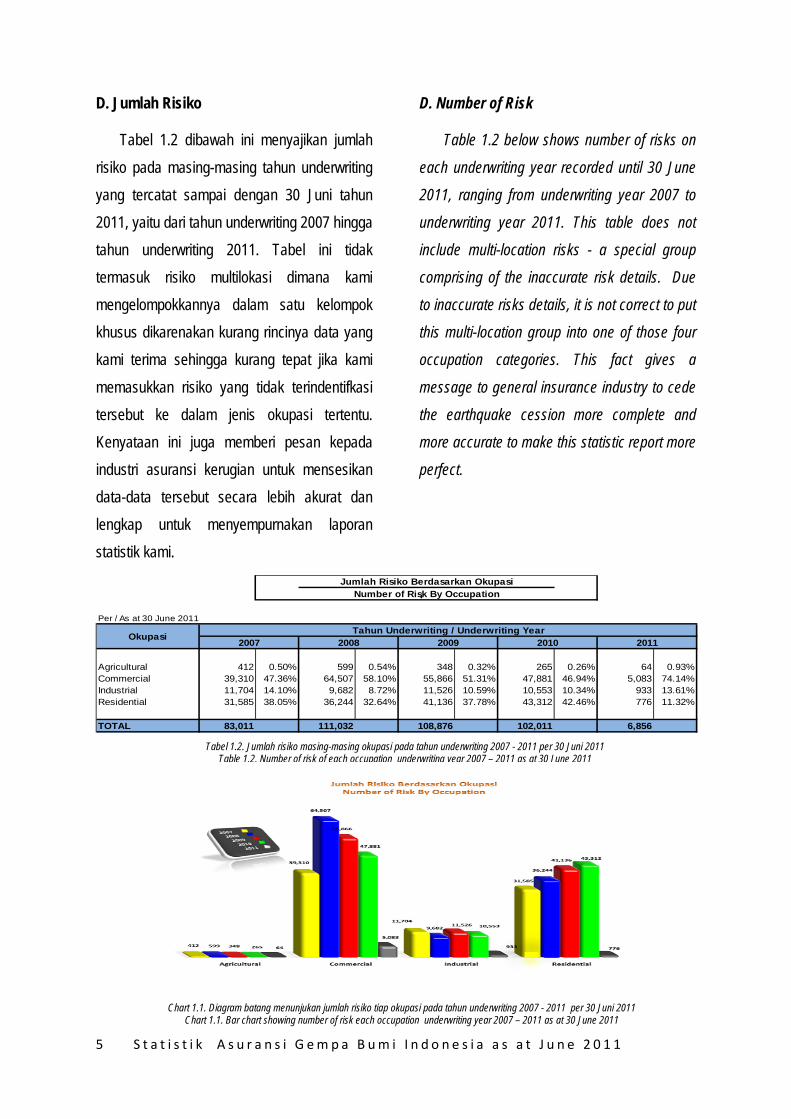
Tabel 1.2 dibawah ini menyajikan jumlah risiko pada masing-masing tahun underwriting yang tercatat sampai dengan 30 Juni tahun 2011, yaitu dari tahun underwriting 2007 hingga tahun underwriting 2011. Tabel ini tidak termasuk risiko multilokasi dimana kami mengelompokkannya dalam satu kelompok khusus dikarenakan kurang rincinya data yang kami terima sehingga kurang tepat jika kami memasukkan risiko yang tidak terindentifkasi tersebut ke dalam jenis okupasi tertentu. Kenyataan ini juga memberi pesan kepada industri asuransi kerugian untuk mensesikan data-data tersebut secara lebih akurat dan lengkap untuk menyempurnakan laporan statistik kami.
D. Number of Risk
Table 1.2 below shows number of risks on
each underwriting year recorded until 30 June
2011, ranging from underwriting year 2007 to
underwriting year 2011. This table does not
include multi-location risks - a special group
comprising of the inaccurate risk details. Due
to inaccurate risks details, it is not correct to put
this multi-location group into one of those four
occupation categories. This fact gives a
message to general insurance industry to cede
the earthquake cession more complete and
more accurate to make this statistic report more
perfect.
.
Tabel 1.2. Jumlah risiko masing-masing okupasi pada tahun underwriting 2007 - 2011 per 30 Juni 2011 Table 1.2. Number of risk of each occupation underwriting year 2007 – 2011 as at 30 June 2011
Chart 1.1. Diagram batang menunjukan jumlah risiko tiap okupasi pada tahun underwriting 2007 - 2011 per 30 Juni 2011 Chart 1.1. Bar chart showing number of risk each occupation underwriting year 2007 – 2011 as at 30 June 2011
Per / As at 30 June 2011
Agricultural 412 0.50% 599 0.54% 348 0.32% 265 0.26% 64 0.93%Commercial 39,310 47.36% 64,507 58.10% 55,866 51.31% 47,881 46.94% 5,083 74.14%Industrial 11,704 14.10% 9,682 8.72% 11,526 10.59% 10,553 10.34% 933 13.61%Residential 31,585 38.05% 36,244 32.64% 41,136 37.78% 43,312 42.46% 776 11.32%
TOTAL 83,011 111,032 108,876 102,011 6,856
Jumlah Risiko Berdasarkan OkupasiNumber of Risk By Occupation
Okupasi Tahun Underwriting / Underwriting Year2007 2008 2009 2010 2011

6 S t a t i s t i k A s u r a n s i G e m p a B u m i I n d o n e s i a a s a t J u n e 2 0 1 1
Berbeda dengan kontribusi premi bruto terbesar yang ada pada okupasi industrial, maka jumlah risiko terbesar untuk setiap tahun underwriting, dalam hal ini dari tahun underwriting 2007 sampai tahun underwriting 2011, ada pada okupasi komersial. Kemudian diikuti oleh okupasi residensial, okupasi industrial dan terakhir okupasi agrikultural.
Besarnya jumlah risiko pada okupasi komersial adalah selain banyaknya gedung bertingkat tinggi, bank dan perusahaan yang memiliki cabang di beberapa wilayah Indonesia juga karena rumah toko (shop houses) masuk dalam kategori okupasi komersial. Rumah toko memiliki kisaran nilai pertanggungan sekitar Rp. 500 juta hingga Rp. 1 mililar atau lebih. Dari segi nilai pertanggungan, rumah toko tidak berbeda jauh dengan nilai pertanggungan pada rumah biasa, namun dari segi kuantitas banyaknya rumah toko (shop houses) secara langsung menyumbang kontribusi jumlah risiko yang besar pada okupasi komersial. Begitupun pada okupasi residensial, jumlah risiko yang tercatat cukup besar namun masih dibawah jumlah risiko komersial. Sementara itu, okupasi industrial sebagai penyumbang kontribusi premi bruto tertinggi hanya menempati urutan ketiga dalam jumlah risiko. Hal ini dikarenakan lokasi dari okupasi industrial yang hanya berada pada titik-titik tertentu dan tidak tersebar di berbagai wilayah Indonesia, contohnya, Unit Pengolahan Pertamina. Terakhir, okupasi agrikultural memiliki jumlah risiko yang paling rendah dibandingkan okupasi
Different from industrial occupation that has
given biggest premium contribution so far, the
commercial occupation contributes the highest
number of risks from underwriting year 2007 to
underwriting year 2011. Then, it is followed with
residential occupation, industrial occupation
and the last agricultural occupation.
In addition to the high number of high-rise
buildings, banks and companies having
branches in other area in Indonesia, the shop-
houses also contribute to the number of risks
on commercial occupation. Shop-houses have
sum insured range from Rp 500 million to Rp 1
trillion or more. From the sum insured side,
shop-houses are not far much different than
ordinary dwelling-houses. However; from the
quantity side, the large quantity of shop-houses
directly contribute to the number of commercial
occupation. Also, the residential occupation has
large number of risks but still below the number
of risks of commercial occupation. Meanwhile,
industrial occupation as the biggest premium
contributor only ranks third in terms of number
of risks. The reason is the industrial occupation
only locates on specific locations and not
located widespread all over Indonesia such as
Refinery Unit Pertamina. Lastly, agricultural
occupation has the least number of risks
compared to other occupations because
agricultural occupation is rarely insured with
earthquake cover.
7 S t a t i s t i k A s u r a n s i G e m p a B u m i I n d o n e s i a a s a t J u n e 2 0 1 1
lainnya karena sedikitnya okupasi ini yang memiliki penutupan asuransi gempa bumi.
Sebagai sentuhan terakhir analisa pada jumlah risiko, idealnya jumlah risiko terbesar ada pada okupasi residensial yang diwakili rumah tinggal. Namun kenyataannya okupasi ini menempati peringkat kedua. Hal ini diakibatkan selain sedikitnya rumah tinggal yang memiliki asuransi gempa bumi, juga jikapun terdapat rumah yang memiliki asuransi gempa bumi, maka pertanggungan gempa bumi tersebut berada pada paket asuransi rumah tinggal (house owners
insurance package) yang tidak dimasukkan dalam risiko asuransi gempa bumi yang disesikan ke MAIPARK.
As the final touch on the analyze of number
of risks, ideally the number of risk lies on
residential occupation being represented by
dwelling houses. On the contrary, this
occupation ranks number two. The possible
reasons are there are little number of dwelling
houses having earthquake risks covers and if
they have, they have homeowners’ insurance
package which are not included in earthquake
insurance risks being ceded to MAIPARK.

8 S t a t i s t i k A s u r a n s i G e m p a B u m i I n d o n e s i a a s a t J u n e 2 0 1 1
E. Kontribusi Asuransi Gempa Bumi
Berdasarkan data dari Badan Pusat Statistik dan Biro Perasuransian Indonesia Bapepam LK tahun 2010, pertumbuhan ekonomi Indonesia juga tercermin dalam pertumbuhan industri asuransi, baik itu asuransi jiwa maupun asuransi kerugian.
Dalam laporan yang dikeluarkan oleh Biro Perasuransian Indonesia - Bapepam LK, yaitu dalam buku Perasuransian Indonesia 2010, tercatat penerimaan premi bruto asuransi di tahun 2010 meningkat sebesar 17,5 % dari tahun sebelumnya, yaitu dari Rp 106,4 triliun menjadi Rp.125,1 triliun. Sedangkan insurance
density tahun 2010 tercatat sebesar Rp.526.584 untuk jumlah penduduk Indonesia sebanyak 237,6 juta jiwa di tahun 2010. Ini berarti rata-rata penduduk Indonesia menghabiskan Rp. 526.584 untuk membayar premi asuransi. Sedangkan kontribusi premi bruto sektor asuransi terhadap Produk Domestik Bruto sebesar 1,95% pada tahun yang sama. Hal ini berarti terjadi peningkatan dari rasio tahun sebelumnya, yaitu sebesar 1,90%. Tabel 1.3 dibawah ini menjelaskan hal tersebut dari tahun 2006 hingga tahun 2010.
.
E. Earthquake Insurance Contribution
Based on the data from Central Agency Of
Statistic and Indonesian Insurance Bureau –
Capital Market Investment Agency year 2010,
Indonesian economic development is reflected
on the insurance industry growth, either life
insurance or general insurance.
In the Insurance Directory 2010 report
issued by Indonesian Insurance Bureau of
Capital Market Investment Agency, the gross
premium income of 2010 increased 17.5 %
from Rp. 106.4 trillions to become Rp. 125.1
trillions. The insurance density in 2010
recorded Rp. 526,584 for Indonesia population
that reached 237.6 millions people. It also
means, each Indonesian resident spent Rp.
526,584 to buy insurance product. On the other
hand, gross premium income contribution
toward Gross Premium Products reached
1.95% in the same year. This ratio increases
from the last year’s ratio at 1.90%. Table 1.3
below shows such increment from year 2006 to
year 2010.

9 S t a t i s t i k A s u r a n s i G e m p a B u m i I n d o n e s i a a s a t J u n e 2 0 1 1
Dengan memperhatikan penyebaran asuransi gempa bumi berdasarkan provinsi maka selama tahun underwriting 2007 – tahun underwriting 2010, rata-rata rasio premi bruto tertinggi berada pada provinsi DKI Jakarta (20,75%), Jawa Barat (18,93%), Jawa Timur (14,35%) dan Banten (11,03%). DKI Jakarta memiliki kontribusi premi asuransi gempa bumi tertinggi selama tahun underwriting tersebut karena selain sebagai pusat pemerintahan dan pusat bisnis yang bernilai ekonomi tinggi, masyarakat yang tinggal di ibukota negara Indonesia ini relatif lebih memiliki kemampuan finansial serta edukasi yang cukup baik tentang asuransi.
Namun demikian jika dilihat dari kontribusi asuransi gempa bumi terhadap pendapatan domestik regional bruto atau penetrasi asuransi per provinsi ternyata rata-rata rasio penetrasi asuransi gempa bumi tertinggi selama tahun
By looking at the spread of earthquake
insurance by province during underwriting year
2007 – underwriting year 2010, the highest
average growth on gross premium is in DKI
Jakarta (20.75%), Jawa Barat (18.93%), Jawa
Timur (14.35%) dan Banten (11.03%). DKI
Jakarta gives the highest earthquake premium
contribution during those underwriting years
since DKI Jakarta is the capital city and the
central business having the highest economic
values. The people living in this capital city
relatively have good financial and insurance
educational background.
However, if we look at the earthquake
insurance premium contribution towards
regional GDP or insurance penetration per
province, the highest earthquake insurance
penetration ratio during underwriting year 2007
– underwriting year 2010 is in Banten Province
Tabel 1.3 Tabel Premi Bruto dan Produk Domestik Bruto 2006 - 2010 Table 1.3 Gross Premiums and Gross Domestic Products 2006 – 2010 Table
Dalam Milyar RupiahIn Billion Rupiah
Tahun Rasio/RatioYear a/b
2006 1.672007 1.972008 1.822009 1.902010 1.95
1) Premi Bruto (termasuk Premi Program Jaminan Hari Tua (JHT)) = Premi Pos Langsung + Premi Reasuransi diterima dari Luar Negeri Gross Premium (include Premium of Pension Benefits (JHT)) = Direct Premium + Reinsurance Premium Inward from Abroad2) Sumber : Biro Pusat Statistik (BPS) berdasarkan Harga yang Berlaku Source : Central Of Statistic Bureau (BPS) using Current Market Prices
Produk Domestik BrutoGross Domestic Produk 2)
Jumlah/Total
6,422,918.0
%
20.4018.3025.3013.4014.40
Pertumbuhan/Growth
b
3,339,216.8 3,950,893.2 4,951,356.7 5,613,442.0
17.5
Jumlah/Totala
Premi BrutoGross Premiums 1)
55,605.3 77,831.6 90,311.7
106,445.9 125,116.4
Pertumbuhan/Growth
%
15.540.016.017.9

10 S t a t i s t i k A s u r a n s i G e m p a B u m i I n d o n e s i a a s a t J u n e 2 0 1 1
underwiting 2007 – tahun underwriting 2010 terletak pada provinsi Banten yaitu sebesar 0,15% kemudian diikuti oleh Gorontalo sebesar 0,12%, Provinsi DKI Jakarta sebesar 0,06% dan Provinsi Jawa Barat sebesar 0,06%.
Alasan mengapa penetrasi asuransi gempa bumi tertinggi ada pada Provinsi Banten karena selain memiliki rata-rata rasio premi bruto yang cukup tinggi yaitu 11,03% , produk domestik regional bruto Provinsi Banten relatif lebih kecil dibandingkan DKI Jakarta dan Jawa Barat. Industri baja, listrik, kimia dan pupuk memberikan kontribusi terhadap pendapatan premi bruto di provinsi ini. Yang cukup menarik adalah provinsi Gorontalo sebagai peringkat tertinggi kedua rata-rata rasio penetrasi asuransi gempa bumi. Walaupun secara rata-rata rasio premi bruto masih kecil, namun jumlah premi bruto Provinsi Gorontalo di tahun 2009 mencapai Rp. 16.025,2 juta meningkat 2.649 % dari tahun sebelumnya Rp. 582,9 juta. Begitupun di tahun 2010, premi bruto di Provinsi ini tercatat sebesar Rp. 17.409,67 juta. Kehadiran sektor perkebunan dan pupuk memberikan kontribusi yang sangat besar terhadap pendapatan premi bruto asuransi gempa bumi pada provinsi ini. Selain itu, produk domestik regional bruto Provinsi Gorontalo relatif lebih kecil dibandingkan DKI Jakarta serta Jawa Barat, sehingga penetrasi asuransi gempa bumi provinsi ini menjadi tinggi.
at 0.15% then Gorontalo Province at 0.12%,
DKI Province at 0.06% and West Java Province
at 0.06%.
The reason why the highest earthquake
insurance penetration ratio lies on Banten
Province is because Banten Province has an
average significant gross premium growth ratio
at 11.03% and the regional GDP of Banten is
relatively small compared to DKI Jakarta and
West Java. Steel manufacturer, Electricity,
Chemistry and Fertilizer gives contribution
towards gross premium income for this
province. The most interesting thing is
Gorontalo province ranks the second highest
earthquake insurance gross premium.
Although the average gross premium ratio is
still small, the gross premium income of
Gorontalo Province reached Rp. 16,025.2
million in 2009. It increased 2,649% from the
previous year at Rp. 582.9 million. In 2010, the
gross premium of this province recorded Rp
17,409.67 million. The existence of plantation
sector and fertilizer gives significant
contribution towards gross premium income for
this province. Moreover, the GDP of Gorontalo
is relatively small comparing to DKI Jakarta and
West Java and it makes the insurance
penetration ratio for this province becomes
high.

11 S t a t i s t i k A s u r a n s i G e m p a B u m i I n d o n e s i a a s a t J u n e 2 0 1 1
Sebagai catatan, sesuai dengan yang dilaporkan Badan Pusat Statistik (BPS) maka tabel Produk Domestik Regional Bruto yang ditampilkan hanya sampai tahun 2010, sehingga pembahasan dan analisa untuk penetrasi asuransi gempa bumi tahun 2011 akan dilakukan pada laporan semester berikutnya.
Tabel 1.4 dibawah ini menyajikan kontribusi pendapatan premi asuransi gempa bumi yang dibagi berdasarkan provinsi, catatan per tanggal 30 Juni 2011.
As a supplementary note, the GDP
Regional shown is only for the period until 2010
as being reported by Statistic Central Agency.
Therefore the presentation and analyze for
earthquake insurance penetration for 2011 will
be presented in the report next semester.
This following table 1.4 shows earthquake
insurance contribution by province, as at June
30, 2011.
Tabel 1.4 Premi Bruto Asuransi Gempa Bumi Berdasarkan Provinsi 2007 – 2011
Table 1.4 Earthquake Gross Premiums by Province 2007 - 2011
Dalam Jutaan RupiahIn Million Rupiah
2007 % 2008 % 2009 % 2010 % 2011 %
1. Nanggroe Aceh Darussalam 28,766.10 1.5% 6,056.94 0.3% 18,823.43 1.0% 56,476.14 2.7% 57.54 0.0%2. Sumatera Utara 67,024.43 3.6% 62,159.08 3.2% 79,619.17 4.1% 117,390.13 5.6% 22,169.14 4.9%3. Sumatera Barat 10,460.74 0.6% 20,362.62 1.1% 17,576.09 0.9% 41,270.02 2.0% 6,231.51 1.4%4. Riau 73,686.77 4.0% 94,150.39 4.9% 44,559.52 2.3% 94,625.28 4.5% 6,612.75 1.5%5. Jambi 4,161.64 0.2% 5,079.95 0.3% 33,240.67 1.7% 3,987.52 0.2% 253.06 0.1%6. Sumatera Selatan 51,863.11 2.8% 34,390.65 1.8% 37,785.54 1.9% 31,430.67 1.5% 3,449.55 0.8%7. Bengkulu 2,371.38 0.1% 6,065.30 0.3% 5,566.64 0.3% 5,524.20 0.3% 808.52 0.2%8. Lampung 20,307.59 1.1% 35,398.58 1.8% 30,693.42 1.6% 30,699.54 1.5% 9,203.48 2.0%9. Kepulauan Bangka Belitung 473.82 0.0% 3,308.46 0.2% 4,248.69 0.2% 3,203.27 0.2% 224.64 0.0%10. Kepulauan Riau 16,466.74 0.9% 17,790.88 0.9% 17,165.29 0.9% 16,270.10 0.8% 3,383.94 0.7%11. DKI Jakarta 366,667.61 19.7% 422,229.71 22.0% 446,256.16 22.9% 386,149.84 18.4% 110,453.44 24.4%12. Jawa Barat 342,953.86 18.5% 335,091.75 17.5% 385,968.35 19.8% 418,980.57 19.9% 78,725.68 17.4%13. Jawa Tengah 146,422.95 7.9% 127,092.83 6.6% 94,932.96 4.9% 107,000.11 5.1% 13,473.78 3.0%14. DI. Yogyakarta 6,742.19 0.4% 12,570.39 0.7% 15,006.08 0.8% 15,166.51 0.7% 8,912.75 2.0%15. Jawa Timur 260,796.85 14.0% 304,918.63 15.9% 284,784.55 14.6% 270,954.83 12.9% 74,078.14 16.4%16. Banten 173,734.44 9.3% 193,894.47 10.1% 215,414.22 11.1% 286,165.13 13.6% 61,656.54 13.6%17. Bali 33,147.17 1.8% 47,348.44 2.5% 53,148.99 2.7% 49,406.59 2.3% 10,008.56 2.2%18. Kalimantan Barat 1,812.98 0.1% 3,243.69 0.2% 4,204.39 0.2% 3,403.95 0.2% 311.06 0.1%19. Kalimantan Tengah 2,776.69 0.1% 3,603.39 0.2% 5,420.12 0.3% 4,796.22 0.2% 2,550.85 0.6%20. Kalimantan Selatan 25,172.71 1.4% 45,826.94 2.4% 24,331.56 1.2% 11,580.16 0.6% 4,103.62 0.9%21. Kalimantan Timur 134,804.71 7.3% 57,297.32 3.0% 53,905.95 2.8% 69,792.99 3.3% 6,187.39 1.4%22. Sulawesi Utara 5,212.40 0.3% 5,963.57 0.3% 10,929.62 0.6% 10,691.00 0.5% 3,831.76 0.8%23. Sulawesi Tengah 1,572.83 0.1% 1,838.98 0.1% 1,536.27 0.1% 1,619.98 0.1% 50.96 0.0%24. Sulawesi Selatan 23,375.82 1.3% 24,170.27 1.3% 25,690.99 1.3% 17,730.37 0.8% 2,286.95 0.5%25. Sulawesi Tenggara 34,445.67 1.9% 36,382.59 1.9% 8,814.04 0.5% 9,645.87 0.5% 18.98 0.0%26. Gorontalo 574.73 0.0% 582.96 0.0% 16,025.17 0.8% 17,409.67 0.8% 23,065.15 5.1%27. Sulawesi Barat 86.01 0.0% 117.89 0.0% 651.12 0.0% 507.72 0.0% 0.00 0.0%28. Nusa Tenggara Barat 3,813.83 0.2% 2,905.63 0.2% 2,712.02 0.1% 13,726.21 0.7% 310.01 0.1%29. Nusa Tenggara Timur 530.99 0.0% 738.08 0.0% 899.32 0.0% 1,146.29 0.1% 170.03 0.0%30. Maluku 534.01 0.0% 513.23 0.0% 877.95 0.0% 1,562.24 0.1% 166.12 0.0%31. Maluku Utara 706.34 0.0% 733.66 0.0% 579.35 0.0% 529.01 0.0% 3.83 0.0%32. Papua Barat 1,168.85 0.1% 1,387.40 0.1% 1,615.79 0.1% 1,844.02 0.1% 4.84 0.0%33. Papua 15,538.94 0.8% 6,475.53 0.3% 3,720.75 0.2% 3,241.36 0.2% 158.29 0.0%
TOTAL 1,858,174.90 100.0% 1,919,690.17 100.0% 1,946,704.18 100.0% 2,103,927.51 100.0% 452,922.87 100.0%
Provinsi / Province
PREMI BRUTO ASURANSI GEMPA BUMI
Premi Bruto Asuransi Gempa Bumi Berdasarkan Provinsi 2007 - 2011
Earthquake Gross Premium By Province 2007 - 2011
EARTHQUAKE INSURANCE GROSS PREMIUM*) As at 30 June 2011
Underwriting Year

12 S t a t i s t i k A s u r a n s i G e m p a B u m i I n d o n e s i a a s a t J u n e 2 0 1 1
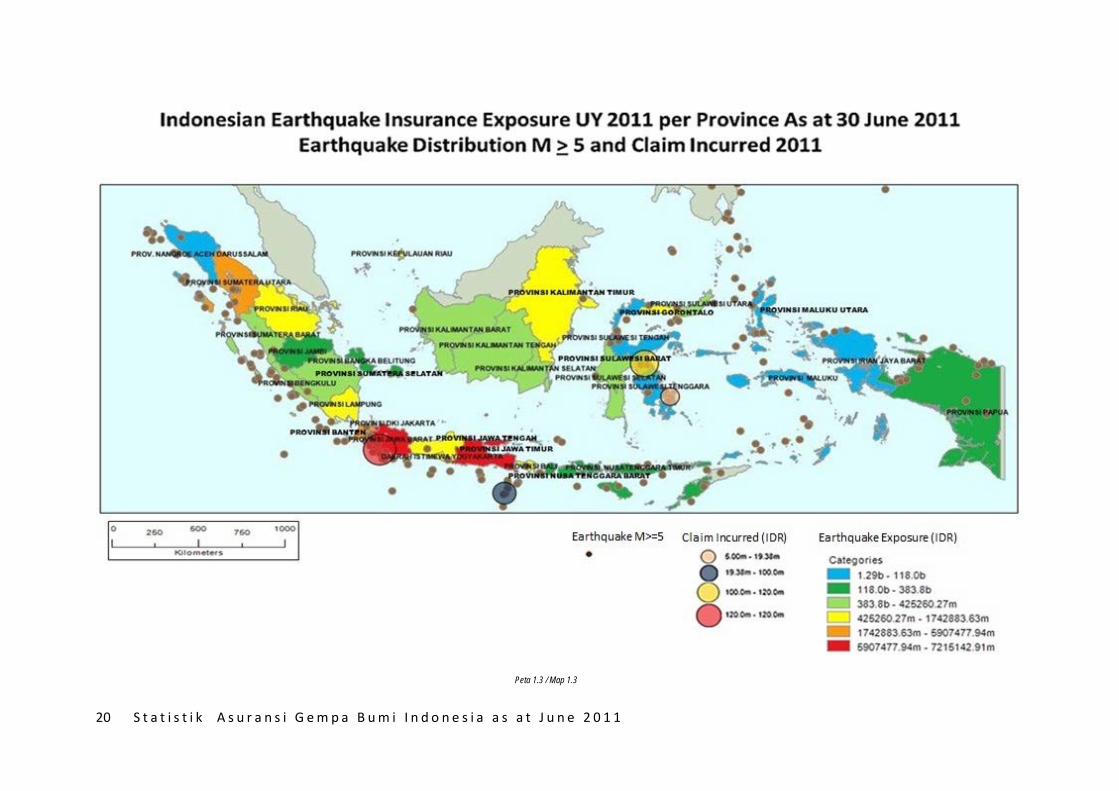
Tabel 1.5 dibawah ini menyajikan penetrasi asuransi gempa bumi per provinsi dan peta 1.1 menunjukkan distribusi eksposur asuransi gempa bumi di Indonesia untuk tahun underwriting 2011 berdasarkan provinsi, catatan per tanggal 30 Juni 2011
This following table 1.5 shows earthquake
insurance penetration per province, and map
1.1 shows Indonesia earthquake exposure
distribution per province for underwriting year
2011 as at June 30, 2011
.
Tabel 1.5 / Table 1.5
2007 2008 2009 **) 2010 ***) 2007 2008 2009 2010
1 Nanggroe Aceh Darussalam 71,093,359 73,547,551 71,694,545 77,505,598 0.04% 0.01% 0.03% 0.07%2 Sumatera Utara 181,819,737 213,931,697 236,353,616 275,700,207 0.04% 0.03% 0.03% 0.04%3 Sumatera Barat 59,799,045 70,954,515 76,752,938 87,221,253 0.02% 0.03% 0.02% 0.05%4 Riau 210,002,560 276,400,130 297,173,028 342,691,449 0.04% 0.03% 0.01% 0.03%5 Jambi 32,076,677 41,056,484 44,127,006 53,816,693 0.01% 0.01% 0.08% 0.01%6 Sumatera Selatan 109,895,707 133,664,987 137,331,848 157,772,133 0.05% 0.03% 0.03% 0.02%7 Bengkulu 12,874,344 14,915,887 15,920,849 18,036,964 0.02% 0.04% 0.03% 0.03%8 Lampung 60,921,966 73,719,259 87,842,780 107,277,262 0.03% 0.05% 0.03% 0.03%9 Kepulauan Bangka Belitung 17,895,017 21,421,340 22,982,018 25,705,626 0.00% 0.02% 0.02% 0.01%
10 Kepulauan Riau 51,826,272 58,574,996 63,892,937 71,614,514 0.03% 0.03% 0.03% 0.02%11 DKI Jakarta 566,449,360 677,044,743 757,696,594 862,158,911 0.06% 0.06% 0.06% 0.04%12 Jawa Barat 526,220,225 633,283,483 689,841,314 770,660,480 0.07% 0.05% 0.06% 0.05%13 Jawa Tengah 312,428,807 367,135,955 397,903,944 444,396,468 0.05% 0.03% 0.02% 0.02%14 DI. Yogyakarta 32,916,736 38,101,685 41,407,050 45,591,853 0.02% 0.03% 0.04% 0.03%15 Jawa Timur 534,919,333 621,391,675 686,847,558 778,455,772 0.05% 0.05% 0.04% 0.03%16 Banten 107,499,652 139,861,487 151,979,884 170,525,382 0.16% 0.14% 0.14% 0.17%17 Bali 42,336,424 51,916,170 60,292,239 66,690,598 0.08% 0.09% 0.09% 0.07%18 Kalimantan Barat 42,478,601 49,132,966 54,234,104 60,475,252 0.00% 0.01% 0.01% 0.01%19 Kalimantan Tengah 27,931,950 32,760,168 37,114,186 42,567,205 0.01% 0.01% 0.01% 0.01%20 Kalimantan Selatan 39,438,767 45,843,794 51,460,176 58,541,819 0.06% 0.10% 0.05% 0.02%21 Kalimantan Timur 222,628,921 314,813,521 284,966,501 321,090,818 0.06% 0.02% 0.02% 0.02%22 Sulawesi Utara 24,081,133 28,697,756 33,033,610 36,834,793 0.02% 0.02% 0.03% 0.03%23 Sulawesi Tengah 22,757,593 28,727,505 32,395,370 36,856,443 0.01% 0.01% 0.00% 0.00%24 Sulawesi Selatan 69,271,925 85,143,191 99,954,590 117,830,270 0.03% 0.03% 0.03% 0.02%25 Sulawesi Tenggara 17,953,074 26,052,666 30,103,527 33,269,481 0.19% 0.14% 0.03% 0.03%26 Gorontalo 4,760,695 5,906,736 7,069,054 8,056,515 0.01% 0.01% 0.23% 0.22%27 Sulawesi Barat 6,192,786 8,296,606 9,403,379 10,986,625 0.00% 0.00% 0.01% 0.00%28 Nusa Tenggara Barat 33,522,225 35,188,290 42,410,915 49,362,706 0.01% 0.01% 0.01% 0.03%29 Nusa Tenggara Timur 19,136,982 21,655,695 24,178,965 27,710,331 0.00% 0.00% 0.00% 0.00%30 Maluku 5,698,799 6,269,958 7,069,642 8,084,807 0.01% 0.01% 0.01% 0.02%31 Maluku Utara 3,160,042 3,862,243 4,690,568 5,387,444 0.02% 0.02% 0.01% 0.01%32 Papua Barat 10,367,279 13,975,127 17,214,138 22,527,365 0.01% 0.01% 0.01% 0.01%33 Papua 55,380,453 61,516,238 77,728,565 89,451,249 0.03% 0.01% 0.00% 0.00%
TOTAL 3,535,736,449 4,274,764,504 4,653,067,434 5,284,854,287
Catatan :**) Angka Sementara, Sumber BPS/Estimate figures. Source : BPS***) Angka Sangat Sementara, Sumber BPS/Rough Estimate figures. Source : BPS
Penetrasi Asuransi Gempa Bumi Berdasarkan Provinsi 2007 - 2010Earthquake Insurance Penetration By Province 2007 - 2010
Provinsi / Province
Produk Domestik Regional Bruto Atas Dasar Harga Berlaku Penetrasi Asuransi Gempa BumiGross Domestic Regional Bruto at Current Price Earthquake Insurance Penetration
Dalam Jutaan Rupiah / In Million Rupiah*) Biro Pusat Statistik *) As at 30 June 2011

13 S t a t i s t i k A s u r a n s i G e m p a B u m i I n d o n e s i a a s a t J u n e 2 0 1 1
Peta 1.1 / Map 1.1

14 S t a t i s t i k A s u r a n s i G e m p a B u m i I n d o n e s i a a s a t J u n e 2 0 1 1
Asuransi gempa bumi merupakan bagian dari asuransi bangunan (property). Mengingat sejarah penutupan asuransi gempa bumi itu sendiri, asuransi gempa bumi merupakan perluasan jaminan (ekstension) atas polis asuransi bangunan. Sejak tahun 2007, asuransi gempa bumi dapat ditutup terpisah dengan menggunakan polis standar-nya, yaitu, Polis Standar Asuransi Gempa Bumi Indonesia (PSAGBI).
Dalam keseharian praktik bisnis asuransi properti dimana asuransi gempa bumi merupakan perluasan jaminan (ekstension) atas polis asuransi properti, suku premi yang dikenakan sangat kecil. Bahkan bisa dikatakan bahwa suku premi properti tersebut adalah premi gempa bumi saja karena suku premi selain risiko asuransi gempa bumi yang sangat kecil. Untuk kedepannya, pihak regulator harus melakukan upaya penguatan regulasi sehingga suku premi untuk selain risiko gempa bumi kembali pada tingkat yang memadai.
Earthquake insurance is part of property
insurance. Looking back at the history of the
earthquake insurance itself, earthquake
insurance is an extension cover of property
insurance. Since 2007, earthquake insurance
could be insured separately through Indonesian
earthquake insurance policy (called PSAGBI in
Bahasa Indonesia).
In day-to-day business practice in property
insurance where earthquake risks are part of
risk extension, the premium rate applied for
earthquake risks is very small. We could even
say the property premium rate is only
earthquake premium rate. In the future, the
insurance regulator should do necessary
actions to make regulation enforcement so that
premium rate other than earthquake would be
back to the adequate level.
15 S t a t i s t i k A s u r a n s i G e m p a B u m i I n d o n e s i a a s a t J u n e 2 0 1 1
F. Pertumbuhan Incurred Claim
Yang dimaksud dengan “Incurred claim” adalah klaim dibayar ditambah dengan klaim yang masih dalam proses penyelesaian.
Pembayaran klaim MAIPARK atas Gempa bumi Pariaman (7,9 SR) yang terjadi tanggal 30 September 2009 masih ada walaupun tidak sebesar pembayaran klaim periode sebelumnya. Seperti yang kami pernah sampaikan dalam laporan statistik kami sebelumnya, klaim gempa Pariaman yang terbesar yang dialami MAIPARK sejak MAIPARK didirikan. Berdasarkan data dari Badan Perencanaan Pembangunan Nasional yang termuat dalam Ringkasan Eksekutif Rencana Aksi Rehabilitasi dan Rekonstruksi Wilayah Pasca bencana Gempa Bumi di Provinsi Sumatera Barat 2009 - 2011, gempa Pariaman yang mengguncang wilayah Sumatera Barat dan sekitarnya pada tanggal 30 September 2009 menimbulkan kerugian ekonomi sekitar Rp. 20,86 triliun. Akibat Gempa Pariaman ini juga dan Gempa Padang yang terjadi pada tahun 2009, kerugian asuransi yang timbul di Kota Padang (Cresta Zona 2.1) sebesar Rp. 4,7 triliun .
Gempa-gempa yang terjadi di semester pertama 2011 tidak berskala besar sehingga kerugian ekonomi maupun kerugian asuransi yang ditimbulkannya pun tidak besar.
F. Incurred Claim Growth
What is meant by “incurred claim” is the
claim paid plus outstanding claims which are
still in process of settlement.
MAIPARK claim settlement of Pariaman
earthquake (7.9 SR) occurring on 30
September 2009 still existed although it was
not as big as the claim settlement in the
previous years. As we once presented in our
previous statistic report, Pariaman earthquake
claim is the biggest earthquake claim
happening in MAIPARK since the
establishment of MAIPARK. Based on the data
from National Development Planning Agency
as shown on the executive summary on
Reconstruction and Rehabilitation Action
Planning on Post-Disaster Area in West
Sumatera 2009 - 2011, Pariaman earthquake
that shook West Sumatra and surrounding area
on 30 September 2009 resulted economic loss
around Rp. 20.86 trillion. Due to Pariaman
earthquake and Padang earthquake occurring
in 2009, the insured loss in Padang city (Cresta
Zone 2.1) was around Rp. 4.7 trillion.
The earthquake occurred during first
semester 2011 had little scale so that economic
loss and the insured loss were little.

16 S t a t i s t i k A s u r a n s i G e m p a B u m i I n d o n e s i a a s a t J u n e 2 0 1 1
Dari tabel 1.6. di atas, frekwensi klaim gempa bumi paling banyak terjadi pada tahun underwriting 2009 dan didominasi okupasi komersial sebanyak 1.465 frekwensi klaim gempa bumi. Hal ini dikarenakan Gempa Pariaman/Padang yang mengguncang Sumatera Barat dan Gempa Tasikmalaya yang terjadi di tahun 2009. Kedua gempa tersebut menimbulkan kerusakan dahsyat pada sentra-sentra komersil. Dalam lampiran data klaim tahun underwriting 2009 pada laporan ini, tercatat 2.036 laporan klaim yang masuk akibat gempa Pariaman/Padang yang menimbulkan kerugian di Padang dan 305 laporan klaim yang masuk akibat gempa Tasikmalaya di Jawa Barat
From table 1.6 above, the highest
earthquake claim frequency occurred in
underwriting year 2009 and it was dominated
by commercial occupation at 1.465 earthquake
claim frequency. This is because of
Pariaman/Padang earthquake that shook West
Sumatra and Tasikmalaya earthquake that
occurred in 2009. Those two quakes resulted
destructive damages to commercial areas. In
the attached claim data for underwriting year
2009, there are 2.036 claim events reported
due to Pariaman/Padang earthquake and there
are 305 claim events reported to us due to
Tasikmalaya earthquake.
Tabel 1.6 Frekwensi Klaim Berdasarkan Okupasi per 30 Juni 2011 Table 1.6 Claim Frequency by Occupation as at June 2011
Per / As at 30 Jun 2011
Agricultural 2 7 87 0 0Commercial 236 917 1,465 25 0Industrial 28 35 36 2 0Residential 104 283 903 6 0
TOTAL 370 1,242 2,491 33 0
Frekwensi Klaim Berdasarkan Okupasi - 30 Juni 2011Claim Frequency as at June 2011
Okupasi Tahun Underwriting / Underwriting Year2007 2008 2009 2010 2011
17 S t a t i s t i k A s u r a n s i G e m p a B u m i I n d o n e s i a a s a t J u n e 2 0 1 1
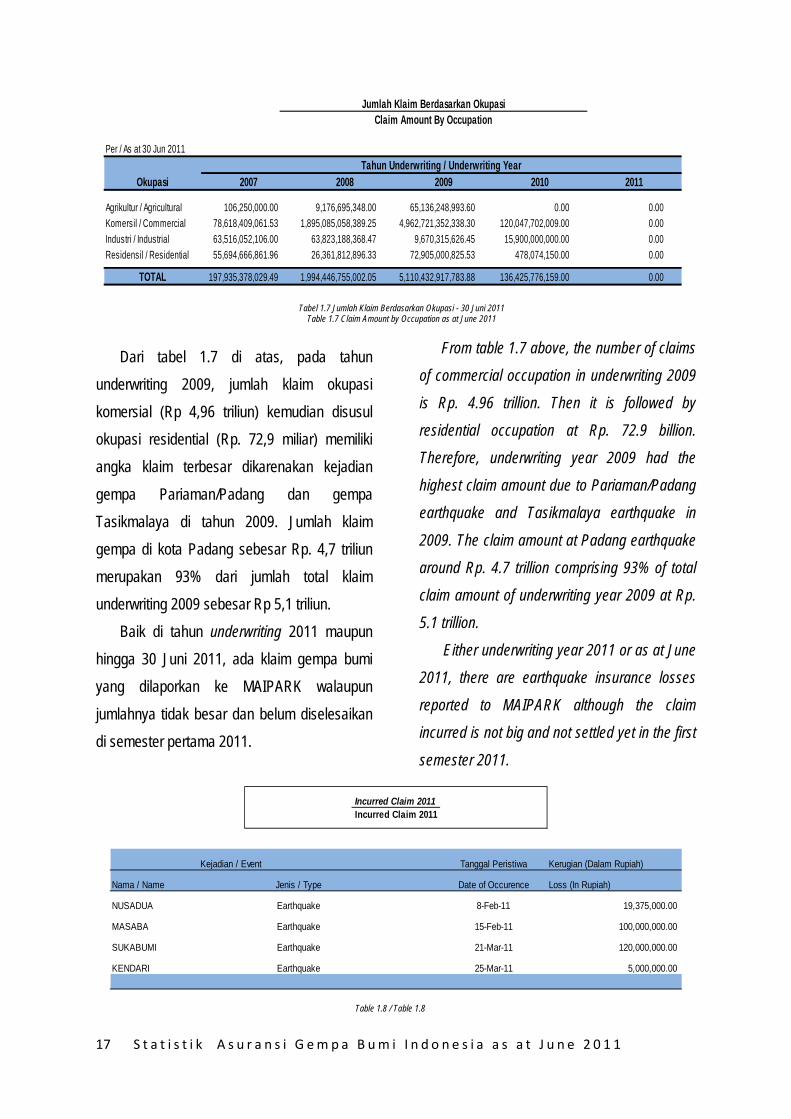
Dari tabel 1.7 di atas, pada tahun
underwriting 2009, jumlah klaim okupasi komersial (Rp 4,96 triliun) kemudian disusul okupasi residential (Rp. 72,9 miliar) memiliki angka klaim terbesar dikarenakan kejadian gempa Pariaman/Padang dan gempa Tasikmalaya di tahun 2009. Jumlah klaim gempa di kota Padang sebesar Rp. 4,7 triliun merupakan 93% dari jumlah total klaim underwriting 2009 sebesar Rp 5,1 triliun.
Baik di tahun underwriting 2011 maupun hingga 30 Juni 2011, ada klaim gempa bumi yang dilaporkan ke MAIPARK walaupun jumlahnya tidak besar dan belum diselesaikan di semester pertama 2011.
From table 1.7 above, the number of claims
of commercial occupation in underwriting 2009
is Rp. 4.96 trillion. Then it is followed by
residential occupation at Rp. 72.9 billion.
Therefore, underwriting year 2009 had the
highest claim amount due to Pariaman/Padang
earthquake and Tasikmalaya earthquake in
2009. The claim amount at Padang earthquake
around Rp. 4.7 trillion comprising 93% of total
claim amount of underwriting year 2009 at Rp.
5.1 trillion.
Either underwriting year 2011 or as at June
2011, there are earthquake insurance losses
reported to MAIPARK although the claim
incurred is not big and not settled yet in the first
semester 2011.
Tabel 1.7 Jumlah Klaim Berdasarkan Okupasi - 30 Juni 2011 Table 1.7 Claim Amount by Occupation as at June 2011
Table 1.8 / Table 1.8
Per / As at 30 Jun 2011
Agrikultur / Agricultural 106,250,000.00 9,176,695,348.00 65,136,248,993.60 0.00 0.00Komersil / Commercial 78,618,409,061.53 1,895,085,058,389.25 4,962,721,352,338.30 120,047,702,009.00 0.00Industri / Industrial 63,516,052,106.00 63,823,188,368.47 9,670,315,626.45 15,900,000,000.00 0.00Residensil / Residential 55,694,666,861.96 26,361,812,896.33 72,905,000,825.53 478,074,150.00 0.00
TOTAL 197,935,378,029.49 1,994,446,755,002.05 5,110,432,917,783.88 136,425,776,159.00 0.00
Jumlah Klaim Berdasarkan OkupasiClaim Amount By Occupation
OkupasiTahun Underwriting / Underwriting Year
2007 2008 2009 2010 2011
Incurred Claim 2011Incurred Claim 2011
Tanggal Peristiwa Kerugian (Dalam Rupiah)
Nama / Name Jenis / Type Date of Occurence Loss (In Rupiah)
NUSADUA Earthquake 8-Feb-11 19,375,000.00
MASABA Earthquake 15-Feb-11 100,000,000.00
SUKABUMI Earthquake 21-Mar-11 120,000,000.00
KENDARI Earthquake 25-Mar-11 5,000,000.00
Kejadian / Event
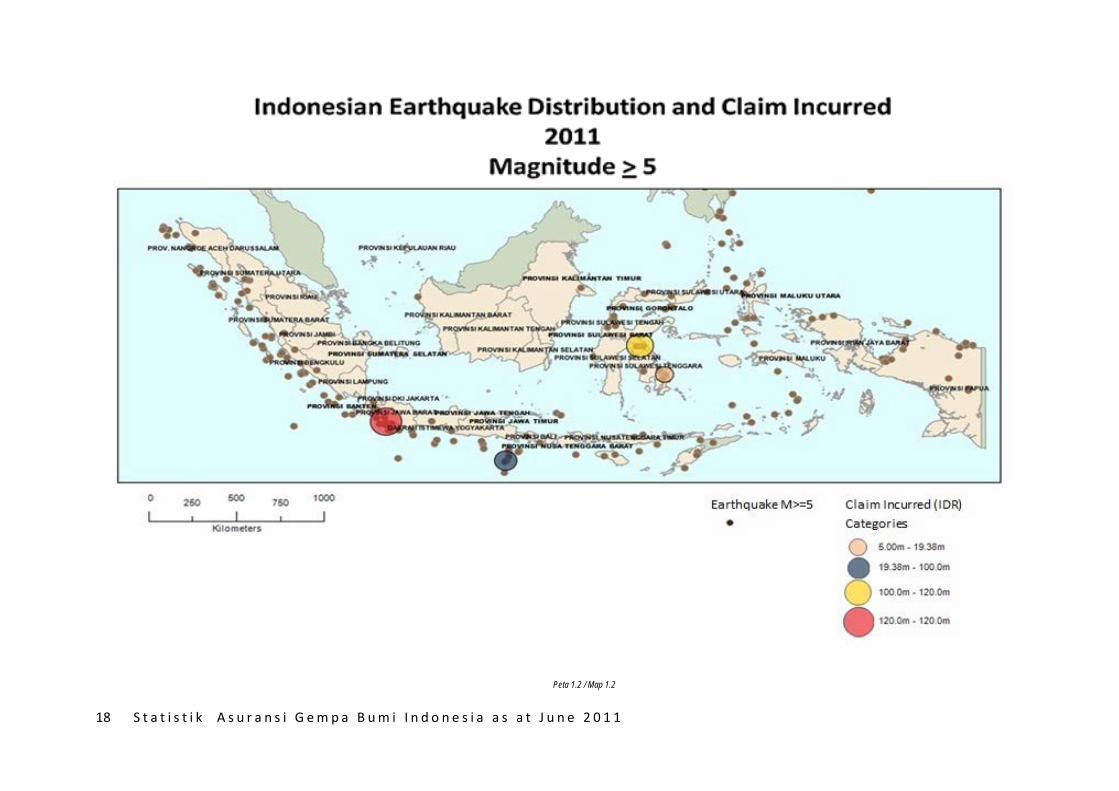
18 S t a t i s t i k A s u r a n s i G e m p a B u m i I n d o n e s i a a s a t J u n e 2 0 1 1
Peta 1.2 / Map 1.2
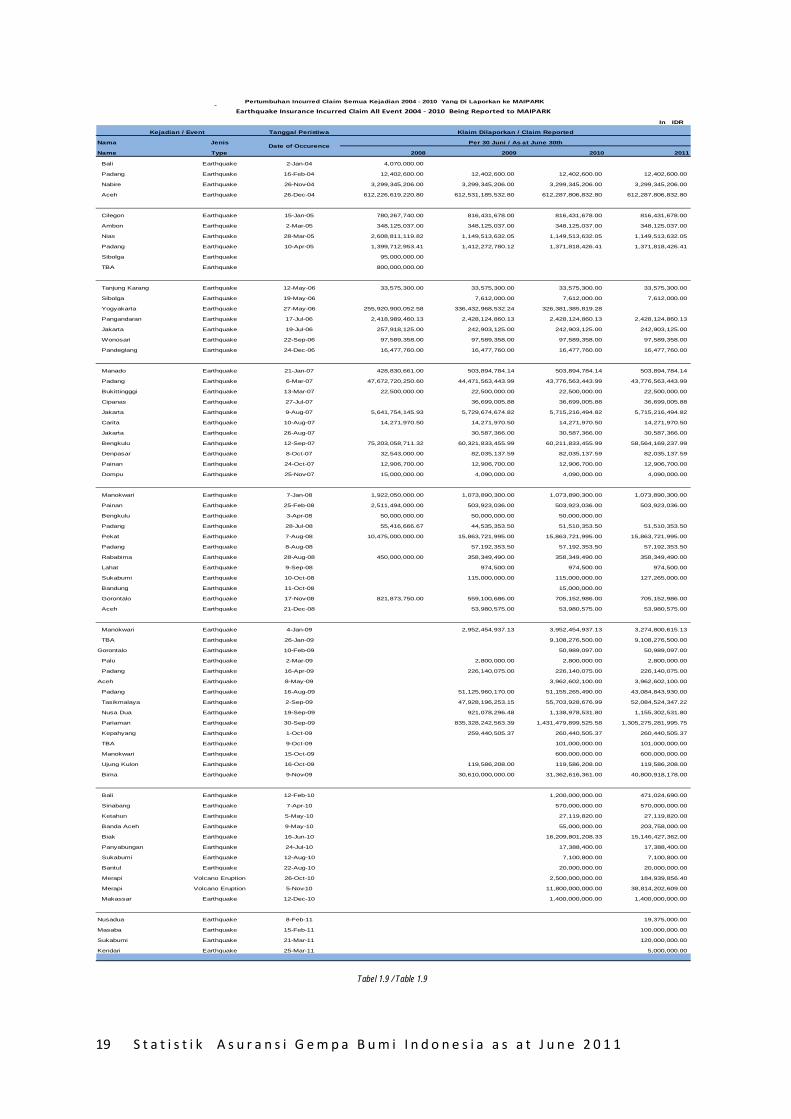
19 S t a t i s t i k A s u r a n s i G e m p a B u m i I n d o n e s i a a s a t J u n e 2 0 1 1
Tabel 1.9 / Table 1.9
In IDR
Tanggal Peristiwa
Nama Jenis
Name Type 2008 2009 2010 2011
Bali Earthquake 2-Jan-04 4,070,000.00
Padang Earthquake 16-Feb-04 12,402,600.00 12,402,600.00 12,402,600.00 12,402,600.00
Nabire Earthquake 26-Nov-04 3,299,345,206.00 3,299,345,206.00 3,299,345,206.00 3,299,345,206.00
Aceh Earthquake 26-Dec-04 612,226,619,220.80 612,531,185,532.80 612,287,806,832.80 612,287,806,832.80
Cilegon Earthquake 15-Jan-05 780,267,740.00 816,431,678.00 816,431,678.00 816,431,678.00
Ambon Earthquake 2-Mar-05 348,125,037.00 348,125,037.00 348,125,037.00 348,125,037.00
Nias Earthquake 28-Mar-05 2,608,811,119.82 1,149,513,632.05 1,149,513,632.05 1,149,513,632.05
Padang Earthquake 10-Apr-05 1,399,712,953.41 1,412,272,780.12 1,371,818,426.41 1,371,818,426.41
Sibolga Earthquake 95,000,000.00
TBA Earthquake 800,000,000.00
Tanjung Karang Earthquake 12-May-06 33,575,300.00 33,575,300.00 33,575,300.00 33,575,300.00
Sibolga Earthquake 19-May-06 7,612,000.00 7,612,000.00 7,612,000.00
Yogyakarta Earthquake 27-May-06 255,920,900,052.58 336,432,968,532.24 326,381,385,819.28
Pangandaran Earthquake 17-Jul-06 2,418,989,460.13 2,428,124,860.13 2,428,124,860.13 2,428,124,860.13
Jakarta Earthquake 19-Jul-06 257,918,125.00 242,903,125.00 242,903,125.00 242,903,125.00
Wonosari Earthquake 22-Sep-06 97,589,358.00 97,589,358.00 97,589,358.00 97,589,358.00
Pandeglang Earthquake 24-Dec-06 16,477,760.00 16,477,760.00 16,477,760.00 16,477,760.00
Manado Earthquake 21-Jan-07 428,830,661.00 503,894,784.14 503,894,784.14 503,894,784.14
Padang Earthquake 6-Mar-07 47,672,720,250.60 44,471,563,443.99 43,776,563,443.99 43,776,563,443.99
Bukittingggi Earthquake 13-Mar-07 22,500,000.00 22,500,000.00 22,500,000.00 22,500,000.00
Cipanas Earthquake 27-Jul-07 36,699,005.88 36,699,005.88 36,699,005.88
Jakarta Earthquake 9-Aug-07 5,641,754,145.93 5,729,674,674.82 5,715,216,494.82 5,715,216,494.82
Carita Earthquake 10-Aug-07 14,271,970.50 14,271,970.50 14,271,970.50 14,271,970.50
Jakarta Earthquake 26-Aug-07 30,587,366.00 30,587,366.00 30,587,366.00
Bengkulu Earthquake 12-Sep-07 75,203,058,711.32 60,321,833,455.99 60,211,833,455.99 58,564,169,237.99
Denpasar Earthquake 8-Oct-07 32,543,000.00 82,035,137.59 82,035,137.59 82,035,137.59
Painan Earthquake 24-Oct-07 12,906,700.00 12,906,700.00 12,906,700.00 12,906,700.00
Dompu Earthquake 25-Nov-07 15,000,000.00 4,090,000.00 4,090,000.00 4,090,000.00
Manokwari Earthquake 7-Jan-08 1,922,050,000.00 1,073,890,300.00 1,073,890,300.00 1,073,890,300.00
Painan Earthquake 25-Feb-08 2,511,494,000.00 503,923,036.00 503,923,036.00 503,923,036.00
Bengkulu Earthquake 3-Apr-08 50,000,000.00 50,000,000.00 50,000,000.00
Padang Earthquake 28-Jul-08 55,416,666.67 44,535,353.50 51,510,353.50 51,510,353.50
Pekat Earthquake 7-Aug-08 10,475,000,000.00 15,863,721,995.00 15,863,721,995.00 15,863,721,995.00
Padang Earthquake 8-Aug-08 57,192,353.50 57,192,353.50 57,192,353.50
Rababima Earthquake 28-Aug-08 450,000,000.00 358,349,490.00 358,349,490.00 358,349,490.00
Lahat Earthquake 9-Sep-08 974,500.00 974,500.00 974,500.00
Sukabumi Earthquake 10-Oct-08 115,000,000.00 115,000,000.00 127,265,000.00
Bandung Earthquake 11-Oct-08 15,000,000.00
Gorontalo Earthquake 17-Nov-08 821,873,750.00 559,100,686.00 705,152,986.00 705,152,986.00
Aceh Earthquake 21-Dec-08 53,980,575.00 53,980,575.00 53,980,575.00
Manokwari Earthquake 4-Jan-09 2,952,454,937.13 3,952,454,937.13 3,274,800,615.13
TBA Earthquake 26-Jan-09 9,108,276,500.00 9,108,276,500.00
Gorontalo Earthquake 10-Feb-09 50,989,097.00 50,989,097.00
Palu Earthquake 2-Mar-09 2,800,000.00 2,800,000.00 2,800,000.00
Padang Earthquake 16-Apr-09 226,140,075.00 226,140,075.00 226,140,075.00
Aceh Earthquake 8-May-09 3,962,602,100.00 3,962,602,100.00
Padang Earthquake 16-Aug-09 51,125,960,170.00 51,155,265,490.00 43,084,843,930.00
Tasikmalaya Earthquake 2-Sep-09 47,928,196,253.15 55,703,928,676.99 52,084,524,347.22
Nusa Dua Earthquake 19-Sep-09 921,078,296.48 1,138,978,531.80 1,155,302,531.80
Pariaman Earthquake 30-Sep-09 835,328,242,563.39 1,431,479,899,525.58 1,305,275,281,995.75
Kepahyang Earthquake 1-Oct-09 259,440,505.37 260,440,505.37 260,440,505.37
TBA Earthquake 9-Oct-09 101,000,000.00 101,000,000.00
Manokwari Earthquake 15-Oct-09 600,000,000.00 600,000,000.00
Ujung Kulon Earthquake 16-Oct-09 119,586,208.00 119,586,208.00 119,586,208.00
Bima Earthquake 9-Nov-09 30,610,000,000.00 31,362,616,361.00 40,800,918,178.00
Bali Earthquake 12-Feb-10 1,200,000,000.00 471,024,690.00
Sinabang Earthquake 7-Apr-10 570,000,000.00 570,000,000.00
Ketahun Earthquake 5-May-10 27,119,820.00 27,119,820.00
Banda Aceh Earthquake 9-May-10 55,000,000.00 203,758,000.00
Biak Earthquake 16-Jun-10 16,209,801,208.33 15,146,427,362.00
Panyabungan Earthquake 24-Jul-10 17,388,400.00 17,388,400.00
Sukabumi Earthquake 12-Aug-10 7,100,800.00 7,100,800.00
Bantul Earthquake 22-Aug-10 20,000,000.00 20,000,000.00
Merapi Volcano Eruption 26-Oct-10 2,500,000,000.00 184,939,856.40
Merapi Volcano Eruption 5-Nov-10 11,800,000,000.00 38,814,202,609.00
Makassar Earthquake 12-Dec-10 1,400,000,000.00 1,400,000,000.00
Nusadua Earthquake 8-Feb-11 19,375,000.00
Masaba Earthquake 15-Feb-11 100,000,000.00
Sukabumi Earthquake 21-Mar-11 120,000,000.00
Kendari Earthquake 25-Mar-11 5,000,000.00
Pertumbuhan Incurred Claim Semua Kejadian 2004 - 2010 Yang Di Laporkan ke MAIPARK
Earthquake Insurance Incurred Claim All Event 2004 - 2010 Being Reported to MAIPARK
Kejadian / Event
Date of Occurence Per 30 Juni / As at June 30th
Klaim Dilaporkan / Claim Reported
20 S t a t i s t i k A s u r a n s i G e m p a B u m i I n d o n e s i a a s a t J u n e 2 0 1 1
Peta 1.3 / Map 1.3

21 S t a t i s t i k A s u r a n s i G e m p a B u m i I n d o n e s i a a s a t J u n e 2 0 1 1
Table 2.1 In IDR
Amount in % Amount in % Amount in % Amount in % Amount in %
Banda Aceh 1.1 21,828,919,019,442.10 1,205,731,497,432.43 6,924,258,479,097.51 2,223,727,077,646.95 27,210,808,306.45
Medan 1.2 41,516,233,737,503.50 40,858,957,831,798.50 46,850,542,514,630.70 61,531,393,985,875.50 12,095,855,115,431.20
Others 1.3 18,993,885,138,409.10 14,486,663,077,876.80 32,347,994,975,374.80 70,098,045,547,897.20 5,339,030,679,287.73
North Sumatera 1 82,339,037,895,354.70 5.3% 56,551,352,407,107.80 3.8% 86,122,795,969,103.00 5.2% 133,853,166,611,420.00 8.2% 17,462,096,603,025.40 5.2%
Padang 2.1 4,580,654,017,559.37 11,697,776,135,958.70 8,347,796,772,700.78 16,666,714,426,828.80 2,918,230,663,571.09
Palembang 2.2 29,780,837,136,881.10 9,223,514,294,514.88 16,229,149,770,492.10 12,924,038,397,771.70 2,783,080,755,462.70
Others 2.3 131,310,882,482,927.00 154,919,763,110,022.00 149,500,019,131,855.00 150,837,680,263,369.00 20,376,382,593,425.00
South Sumatera 2 165,672,373,637,367.00 10.7% 175,841,053,540,496.00 11.8% 174,076,965,675,048.00 10.5% 180,428,433,087,970.00 11.1% 26,077,694,012,458.80 7.7%
DKI Jakarta 3.1 284,382,817,091,736.00 311,616,877,383,052.00 351,874,033,472,510.00 279,828,341,847,666.00 72,151,742,912,546.80
Bandung 3.2 37,511,631,181,055.20 37,453,857,491,968.70 8,114,953,844,255.80 5,721,844,371,157.25 1,307,268,677,742.33
Others 3.3 400,504,991,260,274.00 385,687,550,052,818.00 515,215,922,256,196.00 513,560,128,944,599.00 101,878,934,851,372.00
DKI & West Java 3 722,399,439,533,065.00 46.8% 734,758,284,927,839.00 49.2% 875,204,909,572,962.00 52.7% 799,110,315,163,422.00 49.2% 175,337,946,441,661.00 51.7%
Semarang 4.1 28,811,124,508,854.90 23,815,838,610,738.80 1,727,271,968,989.53 1,236,966,927,346.54 502,193,306,419.75
Yogyakarta 4.2 6,168,656,211,092.21 9,732,173,160,860.02 10,355,458,363,394.10 9,640,681,299,607.30 5,663,469,604,387.83
Others 4.3 90,445,829,862,508.80 62,123,559,470,220.40 84,564,036,406,316.80 86,933,725,241,910.90 11,286,839,088,539.60
DIY & Central Java 4 125,425,610,582,456.00 8.1% 95,671,571,241,819.20 6.4% 96,646,766,738,700.40 5.8% 97,811,373,468,864.70 6.0% 17,452,501,999,347.20 5.1%
Surabaya 5.1 40,975,898,701,599.50 56,079,805,386,220.70 64,521,889,567,819.80 52,577,716,101,426.00 17,038,721,943,639.70
Others 5.2 172,363,743,127,646.00 184,827,611,726,942.00 181,110,463,385,118.00 189,773,238,631,195.00 46,859,910,893,990.30
East Java 5 213,339,641,829,245.00 13.8% 240,907,417,113,163.00 16.1% 245,632,352,952,938.00 14.8% 242,350,954,732,621.00 14.9% 63,898,632,837,630.00 18.8%
Kalimantan 6 136,998,337,101,562.00 8.9% 89,043,988,898,002.80 6.0% 81,635,563,745,679.50 4.9% 72,773,148,469,103.20 4.5% 14,523,206,242,270.10 4.3%
Ujung Pandang 7.1 13,958,006,460,858.50 12,016,990,050,478.70 14,479,113,450,141.80 9,391,264,138,492.19 1,628,120,557,373.86
Others 7.2 40,390,528,057,778.20 43,571,328,754,993.40 36,186,416,109,114.30 36,564,092,318,245.90 14,407,318,195,846.10
Sulawesi 7 54,348,534,518,636.70 3.5% 55,588,318,805,472.10 3.7% 50,665,529,559,256.20 3.0% 45,955,356,456,738.10 2.8% 16,035,438,753,220.00 4.7%
Other Islands 8 43,594,929,542,552.80 2.8% 45,695,519,542,194.30 3.1% 51,805,337,493,847.10 3.1% 52,053,994,257,998.60 3.2% 8,209,915,085,203.43 2.4%1,544,117,904,640,240.00 100.0% 1,494,057,506,476,090.00 100.0% 1,661,790,221,707,530.00 100.0% 1,624,336,742,248,140.00 100.0% 338,997,431,974,816.00 100.0%
U/Y 2011CRESTA ZONE
NATIONAL AGGREGATE EXPOSUREAs At 30 June 2011
U/Y 2010
T O T A L
U/Y 2009U/Y 2007 U/Y 2008

22 S t a t i s t i k A s u r a n s i G e m p a B u m i I n d o n e s i a a s a t J u n e 2 0 1 1
23 S t a t i s t i k A s u r a n s i G e m p a B u m i I n d o n e s i a a s a t J u n e 2 0 1 1
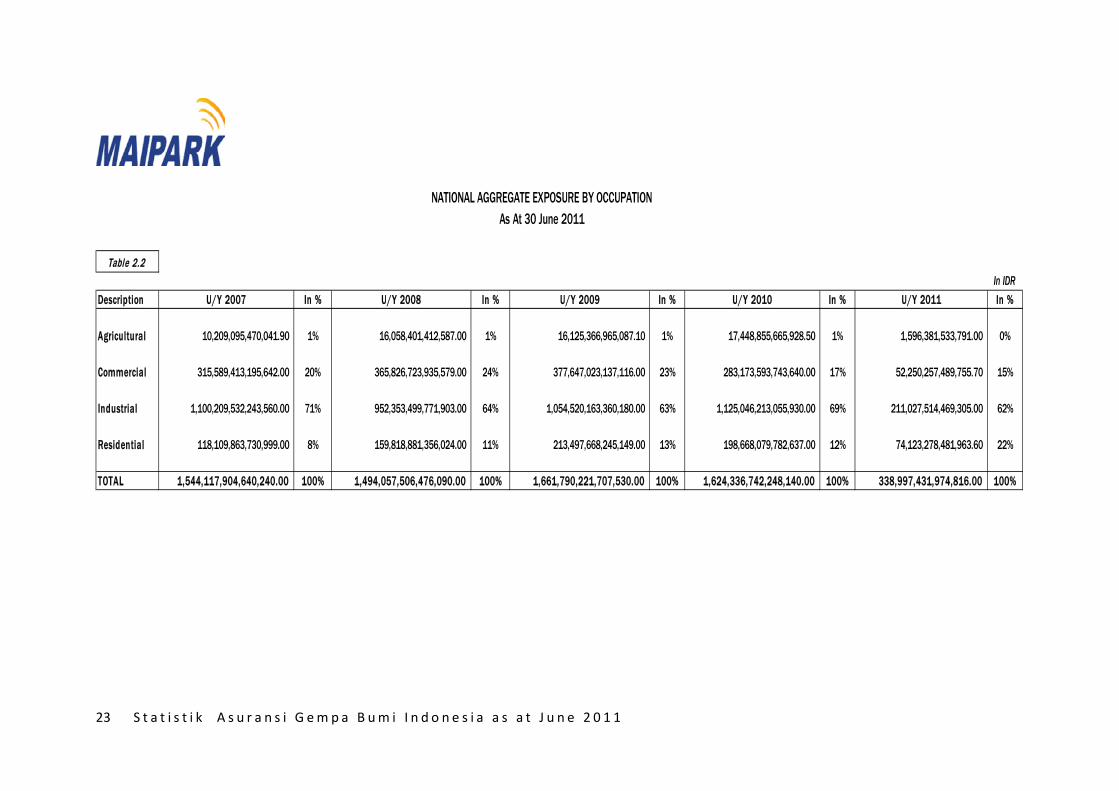
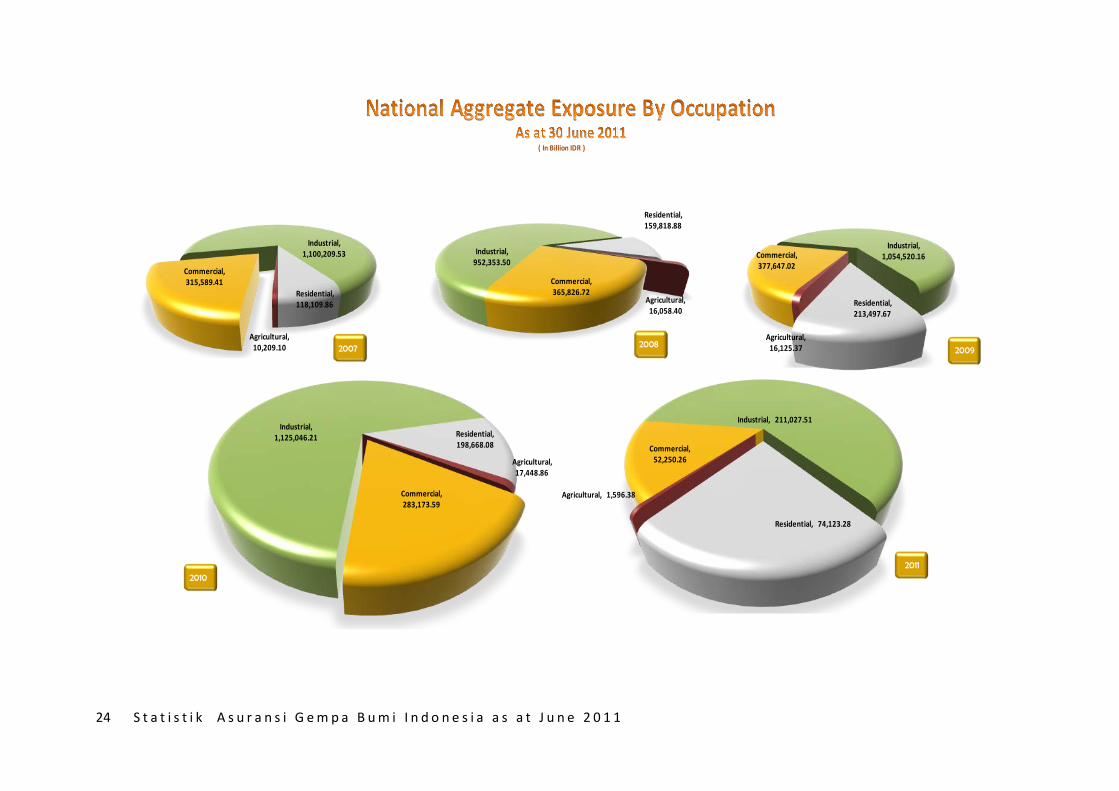
Table 2.2In IDR
Description U/Y 2007 In % U/Y 2008 In % U/Y 2009 In % U/Y 2010 In % U/Y 2011 In %
Agricultural 10,209,095,470,041.90 1% 16,058,401,412,587.00 1% 16,125,366,965,087.10 1% 17,448,855,665,928.50 1% 1,596,381,533,791.00 0%
Commercial 315,589,413,195,642.00 20% 365,826,723,935,579.00 24% 377,647,023,137,116.00 23% 283,173,593,743,640.00 17% 52,250,257,489,755.70 15%
Industrial 1,100,209,532,243,560.00 71% 952,353,499,771,903.00 64% 1,054,520,163,360,180.00 63% 1,125,046,213,055,930.00 69% 211,027,514,469,305.00 62%
Residential 118,109,863,730,999.00 8% 159,818,881,356,024.00 11% 213,497,668,245,149.00 13% 198,668,079,782,637.00 12% 74,123,278,481,963.60 22%
TOTAL 1,544,117,904,640,240.00 100% 1,494,057,506,476,090.00 100% 1,661,790,221,707,530.00 100% 1,624,336,742,248,140.00 100% 338,997,431,974,816.00 100%
NATIONAL AGGREGATE EXPOSURE BY OCCUPATIONAs At 30 June 2011
24 S t a t i s t i k A s u r a n s i G e m p a B u m i I n d o n e s i a a s a t J u n e 2 0 1 1
( In Billion IDR )
Agricultural, 16,125.37
Commercial, 377,647.02
Industrial, 1,054,520.16
Residential, 213,497.67
Agricultural, 10,209.10
Commercial, 315,589.41
Industrial, 1,100,209.53
Residential, 118,109.86 Agricultural,
16,058.40
Commercial, 365,826.72
Industrial, 952,353.50
Residential, 159,818.88
Agricultural, 17,448.86
Commercial, 283,173.59
Industrial, 1,125,046.21 Residential,
198,668.08
Agricultural, 1,596.38
Commercial, 52,250.26
Industrial, 211,027.51
Residential, 74,123.28
2010
2007
2011
20092008
2010

25 S t a t i s t i k A s u r a n s i G e m p a B u m i I n d o n e s i a a s a t J u n e 2 0 1 1
Table 2.3
In IDRDescription U/Y 2007 U/Y 2008 U/Y 2009 U/Y 2010 U/Y 2011
Building 751,122,036,630,788.00 614,420,317,242,123.00 786,595,661,960,960.00 635,539,297,110,387.00 143,294,516,449,519.00
Machinery 284,186,570,633,678.00 261,443,341,797,475.00 300,552,290,388,743.00 393,556,851,709,160.00 69,842,985,494,929.30
Stock 135,225,784,638,258.00 166,930,975,284,298.00 187,250,792,222,874.00 179,285,439,708,796.00 48,199,739,032,588.00
Others 257,674,110,532,548.00 307,487,972,759,943.00 225,571,099,490,855.00 59,573,856,801,147.50 48,828,934,380,773.30
SUB TOTAL 1,428,208,502,435,270.00 1,350,282,607,083,840.00 1,499,969,844,063,430.00 1,267,955,445,329,490.00 310,166,175,357,810.00
Business Interruption 115,909,402,204,968.00 143,774,899,392,257.00 161,820,377,644,101.00 356,381,296,918,648.00 28,831,256,617,005.70
T O T A L 1,544,117,904,640,240.00 1,494,057,506,476,100.00 1,661,790,221,707,530.00 1,624,336,742,248,140.00 338,997,431,974,816.00
NATIONAL AGGREGATE EXPOSURE BY INTERESTAs At 30 June 2011

26 S t a t i s t i k A s u r a n s i G e m p a B u m i I n d o n e s i a a s a t J u n e 2 0 1 1

27 S t a t i s t i k A s u r a n s i G e m p a B u m i I n d o n e s i a a s a t J u n e 2 0 1 1
Table 2.4
Amount In % Amount In % Amount In % Amount In % Amount In %
1. Nanggroe Aceh Darussa lam 25,067,367,416,830.60 1.6% 4,590,861,640,127.33 0.3% 17,268,455,465,374.70 1.0% 44,006,793,284,809.20 2.7% 33,812,974,034.63 0.0%
2. Sumatera Utara 57,289,841,109,672.10 3.7% 52,015,578,709,241.00 3.5% 68,809,582,211,573.30 4.1% 89,956,843,326,610.30 5.5% 17,428,283,628,990.70 5.1%
3. Sumatera Barat 9,163,032,608,118.17 0.6% 16,917,254,683,674.30 1.1% 13,831,194,901,338.30 0.8% 22,997,075,404,961.30 1.4% 3,171,158,609,005.09 0.9%
4. Riau 70,158,629,492,365.20 4.5% 73,659,431,412,750.70 4.9% 43,767,215,310,884.10 2.6% 72,280,330,539,413.60 4.4% 6,778,515,110,408.35 2.0%
5. Jambi 3,735,210,611,775.51 0.2% 4,572,843,791,665.44 0.3% 30,897,720,749,038.60 1.9% 4,063,369,060,430.75 0.3% 257,583,834,968.00 0.1%
6. Sumatera Selatan 47,003,016,581,794.40 3.0% 29,079,012,464,650.50 1.9% 32,998,889,469,812.40 2.0% 30,147,221,867,523.00 1.9% 3,236,559,427,145.75 1.0%
7. Bengkulu 2,102,098,128,826.85 0.1% 2,901,062,800,341.90 0.2% 3,150,057,858,654.51 0.2% 2,828,360,745,166.03 0.2% 383,798,354,195.57 0.1%
8. Lampung 17,739,400,366,466.50 1.1% 30,263,819,786,107.20 2.0% 28,162,402,507,437.80 1.7% 24,026,139,788,165.80 1.5% 7,730,662,753,523.62 2.3%
9. Kepulauan Bangka Bel i tung 386,365,035,378.09 0.0% 2,446,036,420,440.76 0.2% 4,009,740,654,129.36 0.2% 3,789,366,435,641.50 0.2% 266,755,651,224.87 0.1%
10. Kepulauan Riau 15,729,301,767,762.40 1.0% 16,322,484,146,765.00 1.1% 17,252,044,223,753.20 1.0% 20,296,569,246,667.90 1.2% 4,252,660,271,987.53 1.3%
11. DKI Jakarta 284,376,466,524,936.00 18.4% 311,637,402,383,052.00 20.9% 351,962,208,844,510.00 21.2% 279,962,450,099,126.00 17.2% 72,151,742,912,546.80 21.3%
12. Jawa Barat 289,199,420,461,702.00 18.7% 267,286,278,100,951.00 17.9% 339,801,644,504,824.00 20.4% 314,254,834,097,754.00 19.3% 59,074,777,938,061.70 17.4%
13. Jawa Tengah 118,808,066,905,684.00 7.7% 84,980,247,150,093.70 5.7% 85,324,985,621,287.00 5.1% 86,747,903,253,370.50 5.3% 11,419,785,672,621.40 3.4%
14. DI. Yogyakarta 6,631,620,011,590.11 0.4% 10,707,043,430,600.80 0.7% 11,573,531,117,413.40 0.7% 11,037,304,261,678.30 0.7% 6,032,716,326,725.83 1.8%
15. Jawa Timur 212,983,331,421,535.00 13.8% 240,579,160,184,466.00 16.1% 245,405,302,952,938.00 14.8% 242,133,250,686,437.00 14.9% 63,898,632,837,630.10 18.8%
16. Banten 148,812,717,922,864.00 9.6% 155,853,162,538,014.00 10.4% 183,489,066,223,628.00 11.0% 205,026,430,966,543.00 12.6% 44,111,425,591,052.30 13.0%
17. Ba l i 26,145,756,703,571.90 1.7% 35,241,761,523,270.90 2.4% 43,245,942,990,438.10 2.6% 36,434,227,179,537.70 2.2% 7,571,977,317,870.72 2.2%
18. Ka l imantan Barat 1,884,679,545,799.60 0.1% 2,923,330,862,315.40 0.2% 4,175,691,533,023.69 0.3% 4,108,712,875,539.13 0.3% 415,655,263,200.00 0.1%
19. Ka l imantan Tengah 2,795,532,471,716.80 0.2% 3,401,530,643,227.69 0.2% 5,091,589,036,485.43 0.3% 6,081,562,657,600.57 0.4% 3,412,716,536,710.00 1.0%
20. Ka l imantan Selatan 21,222,031,952,853.30 1.4% 34,611,196,017,295.70 2.3% 22,623,084,708,794.60 1.4% 11,534,578,171,557.60 0.7% 3,230,449,353,850.82 1.0%
21. Ka l imantan Timur 111,076,709,392,668.00 7.2% 48,034,285,338,725.40 3.2% 49,742,785,263,615.10 3.0% 51,038,069,593,743.70 3.1% 7,464,385,088,509.31 2.2%
22. Sulawes i Utara 4,399,914,647,396.53 0.3% 4,848,373,471,518.56 0.3% 7,517,079,357,951.43 0.5% 6,534,460,637,385.09 0.4% 1,929,648,080,642.90 0.6%
23. Sulawes i Tengah 1,408,003,961,433.30 0.1% 1,499,398,558,378.24 0.1% 1,340,057,999,110.86 0.1% 1,124,530,558,415.03 0.1% 43,311,358,238.96 0.0%
24. Sulawes i Selatan 19,266,246,940,547.90 1.2% 18,243,693,464,676.00 1.2% 22,164,770,037,556.80 1.3% 17,582,382,254,420.90 1.1% 2,475,279,639,855.10 0.7%
25. Sulawes i Tenggara 28,723,401,626,764.90 1.9% 30,379,516,104,008.40 2.0% 8,220,361,805,910.32 0.5% 8,488,985,729,298.54 0.5% 19,253,181,100.00 0.0%
26. Goronta lo 487,995,231,646.13 0.0% 488,861,848,932.02 0.0% 10,841,736,749,993.80 0.7% 11,550,484,849,320.00 0.7% 11,567,946,493,383.00 3.4%
27. Sulawes i Barat 81,682,334,284.00 0.0% 129,320,356,605.00 0.0% 571,493,608,733.00 0.0% 684,513,758,560.84 0.0% 0.00 0.0%
28. Nusa Tenggara Barat 3,113,620,471,884.99 0.2% 2,286,772,122,274.31 0.2% 2,388,156,793,749.31 0.1% 10,012,553,254,016.40 0.6% 226,944,810,832.71 0.1%
29. Nusa Tenggara Timur 471,547,382,594.06 0.0% 625,125,164,716.11 0.0% 757,418,071,907.34 0.0% 757,902,556,258.34 0.0% 118,079,455,000.00 0.0%
30. Maluku 427,577,017,694.67 0.0% 407,522,575,048.87 0.0% 701,740,472,836.88 0.0% 837,024,530,593.67 0.1% 97,212,185,000.00 0.0%
31. Maluku Utara 609,678,938,829.00 0.0% 547,119,371,532.62 0.0% 458,343,647,594.64 0.0% 309,536,090,898.00 0.0% 1,293,000,000.00 0.0%
32. Papua Barat 973,745,512,641.27 0.1% 1,170,068,023,548.17 0.1% 1,295,432,577,033.31 0.1% 1,279,768,785,267.35 0.1% 2,685,000,000.00 0.0%
33. Papua 11,843,894,140,612.90 0.8% 5,407,951,387,079.27 0.4% 2,950,494,436,203.18 0.2% 2,423,205,701,427.20 0.1% 191,723,316,500.00 0.1%
TOTAL 1,544,117,904,640,240.00 100.0% 1,494,057,506,476,090.00 100.0% 1,661,790,221,707,530.00 100.0% 1,624,336,742,248,140.00 100.0% 338,997,431,974,816.00 100.0%
NATIONAL AGGREGATE EXPOSUREAs At 30 June 2011
UY 2007 - 2011
PROVINCEU/Y 2007 U/Y 2008 U/Y 2009 U/Y 2010 U/Y 2011
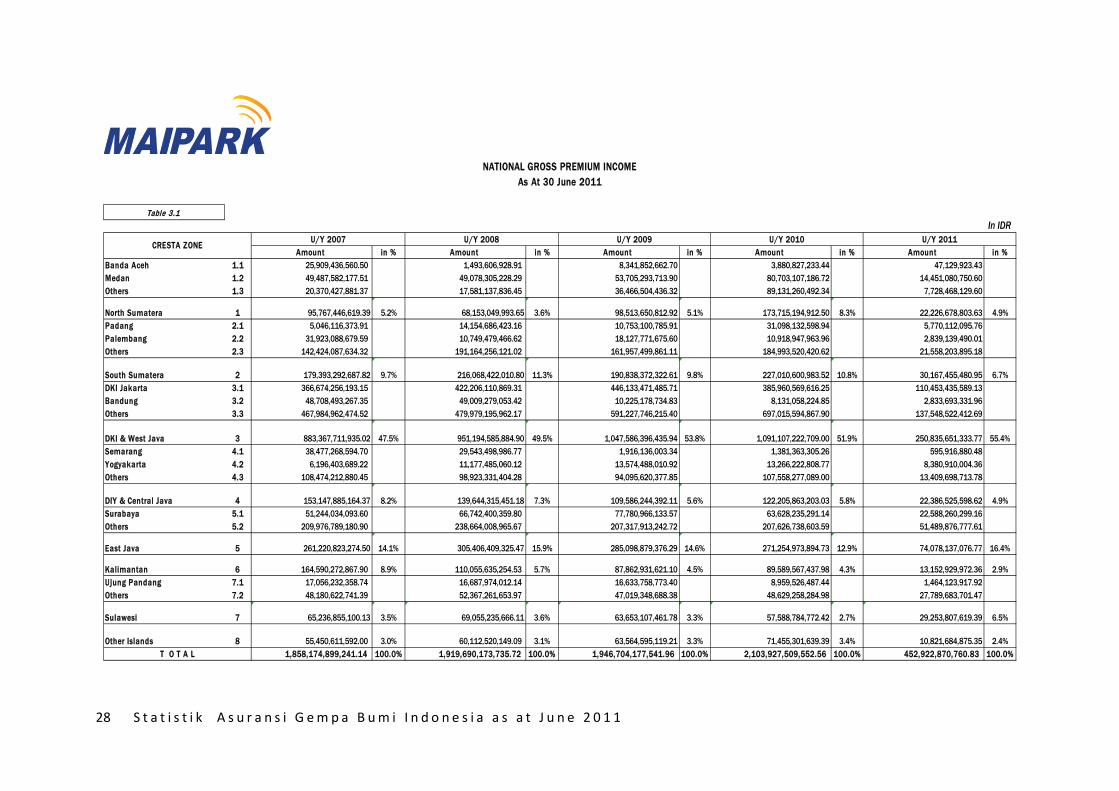
28 S t a t i s t i k A s u r a n s i G e m p a B u m i I n d o n e s i a a s a t J u n e 2 0 1 1
Table 3.1In IDR
Amount in % Amount in % Amount in % Amount in % Amount in %Banda Aceh 1.1 25,909,436,560.50 1,493,606,928.91 8,341,852,662.70 3,880,827,233.44 47,129,923.43Medan 1.2 49,487,582,177.51 49,078,305,228.29 53,705,293,713.90 80,703,107,186.72 14,451,080,750.60Others 1.3 20,370,427,881.37 17,581,137,836.45 36,466,504,436.32 89,131,260,492.34 7,728,468,129.60
North Sumatera 1 95,767,446,619.39 5.2% 68,153,049,993.65 3.6% 98,513,650,812.92 5.1% 173,715,194,912.50 8.3% 22,226,678,803.63 4.9%Padang 2.1 5,046,116,373.91 14,154,686,423.16 10,753,100,785.91 31,098,132,598.94 5,770,112,095.76Palembang 2.2 31,923,088,679.59 10,749,479,466.62 18,127,771,675.60 10,918,947,963.96 2,839,139,490.01Others 2.3 142,424,087,634.32 191,164,256,121.02 161,957,499,861.11 184,993,520,420.62 21,558,203,895.18
South Sumatera 2 179,393,292,687.82 9.7% 216,068,422,010.80 11.3% 190,838,372,322.61 9.8% 227,010,600,983.52 10.8% 30,167,455,480.95 6.7%DKI Jakarta 3.1 366,674,256,193.15 422,206,110,869.31 446,133,471,485.71 385,960,569,616.25 110,453,435,589.13Bandung 3.2 48,708,493,267.35 49,009,279,053.42 10,225,178,734.83 8,131,058,224.85 2,833,693,331.96Others 3.3 467,984,962,474.52 479,979,195,962.17 591,227,746,215.40 697,015,594,867.90 137,548,522,412.69
DKI & West Java 3 883,367,711,935.02 47.5% 951,194,585,884.90 49.5% 1,047,586,396,435.94 53.8% 1,091,107,222,709.00 51.9% 250,835,651,333.77 55.4%Semarang 4.1 38,477,268,594.70 29,543,498,986.77 1,916,136,003.34 1,381,363,305.26 595,916,880.48Yogyakarta 4.2 6,196,403,689.22 11,177,485,060.12 13,574,488,010.92 13,266,222,808.77 8,380,910,004.36Others 4.3 108,474,212,880.45 98,923,331,404.28 94,095,620,377.85 107,558,277,089.00 13,409,698,713.78
DIY & Central Java 4 153,147,885,164.37 8.2% 139,644,315,451.18 7.3% 109,586,244,392.11 5.6% 122,205,863,203.03 5.8% 22,386,525,598.62 4.9%Surabaya 5.1 51,244,034,093.60 66,742,400,359.80 77,780,966,133.57 63,628,235,291.14 22,588,260,299.16Others 5.2 209,976,789,180.90 238,664,008,965.67 207,317,913,242.72 207,626,738,603.59 51,489,876,777.61
East Java 5 261,220,823,274.50 14.1% 305,406,409,325.47 15.9% 285,098,879,376.29 14.6% 271,254,973,894.73 12.9% 74,078,137,076.77 16.4%
Kalimantan 6 164,590,272,867.90 8.9% 110,055,635,254.53 5.7% 87,862,931,621.10 4.5% 89,589,567,437.98 4.3% 13,152,929,972.36 2.9%Ujung Pandang 7.1 17,056,232,358.74 16,687,974,012.14 16,633,758,773.40 8,959,526,487.44 1,464,123,917.92Others 7.2 48,180,622,741.39 52,367,261,653.97 47,019,348,688.38 48,629,258,284.98 27,789,683,701.47
Sulawesi 7 65,236,855,100.13 3.5% 69,055,235,666.11 3.6% 63,653,107,461.78 3.3% 57,588,784,772.42 2.7% 29,253,807,619.39 6.5%
Other Islands 8 55,450,611,592.00 3.0% 60,112,520,149.09 3.1% 63,564,595,119.21 3.3% 71,455,301,639.39 3.4% 10,821,684,875.35 2.4%1,858,174,899,241.14 100.0% 1,919,690,173,735.72 100.0% 1,946,704,177,541.96 100.0% 2,103,927,509,552.56 100.0% 452,922,870,760.83 100.0%T O T A L
CRESTA ZONE U/Y 2011
NATIONAL GROSS PREMIUM INCOMEAs At 30 June 2011
U/Y 2009U/Y 2007 U/Y 2008 U/Y 2010
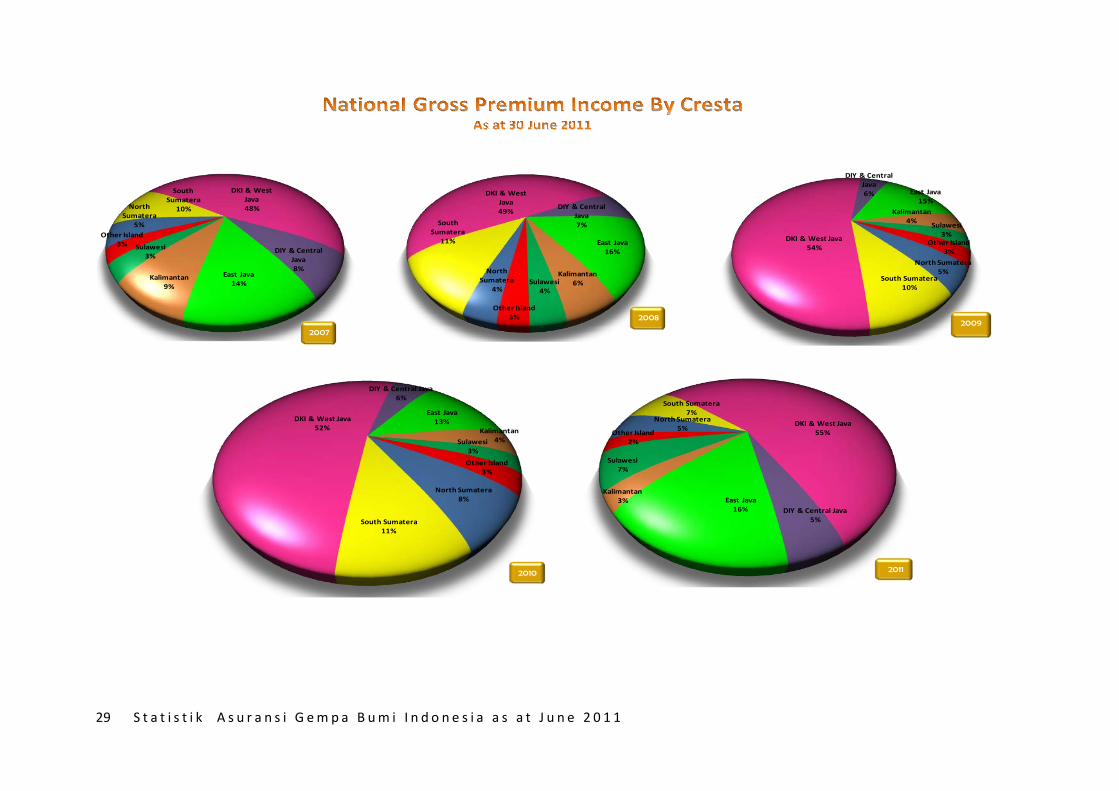
29 S t a t i s t i k A s u r a n s i G e m p a B u m i I n d o n e s i a a s a t J u n e 2 0 1 1
0 0 0 0 0 0 0 0
North Sumatera
5%
South Sumatera
10%
DKI & West Java48%
DIY & Central Java8%
East Java14%
Kalimantan9%
Sulawesi3%
Other Island3%
North Sumatera
4%
South Sumatera
11%
DKI & West Java49%
DIY & Central Java7%
East Java16%
Kalimantan6%Sulawesi
4%
Other Island3%
North Sumatera5%
South Sumatera10%
DKI & West Java54%
DIY & Central Java6% East Java
15%Kalimantan
4% Sulawesi3%
Other Island3%
North Sumatera8%
South Sumatera11%
DKI & West Java52%
DIY & Central Java6%
East Java13%
Kalimantan4%Sulawesi
3%
Other Island3%
North Sumatera5%
South Sumatera7%
DKI & West Java55%
DIY & Central Java5%
East Java16%
Kalimantan3%
Sulawesi7%
Other Island2%
2007
20082009
2010 2011

30 S t a t i s t i k A s u r a n s i G e m p a B u m i I n d o n e s i a a s a t J u n e 2 0 1 1
Table 3.2
In IDRDescription U/Y 2007 In % U/Y 2008 In % U/Y 2009 In % U/Y 2010 In % U/Y 2011 In %
Agricultural 9,948,970,891.16 0.54% 17,346,411,703.56 0.90% 16,613,850,257.69 0.85% 20,851,796,537.19 0.99% 1,943,898,219.32 0.44%
Commercial 394,454,912,555.45 21.22% 456,030,960,661.67 23.76% 456,221,149,200.24 23.44% 373,764,277,171.92 17.77% 68,591,341,489.66 15.14%
Industrial 1,300,315,684,797.20 69.98% 1,230,379,555,214.11 64.09% 1,195,083,222,424.23 61.39% 1,432,168,000,018.00 68.07% 258,501,129,946.52 57.07%
Residential 153,455,330,997.34 8.26% 215,933,246,156.38 11.25% 278,785,955,659.79 14.32% 277,143,435,825.46 13.17% 123,886,501,105.34 27.35%
TOTAL 1,858,174,899,241.15 100.00% 1,919,690,173,735.73 100.00% 1,946,704,177,541.96 100.00% 2,103,927,509,552.57 100.00% 452,922,870,760.83 100.00%
NATIONAL GROSS PREMIUM INCOME BY OCCUPATIONAs At 30 June 2011

31 S t a t i s t i k A s u r a n s i G e m p a B u m i I n d o n e s i a a s a t J u n e 2 0 1 1

32 S t a t i s t i k A s u r a n s i G e m p a B u m i I n d o n e s i a a s a t J u n e 2 0 1 1
Table 3.3
In IDR
Amount In % Amount In % Amount In % Amount In % Amount In %
1. Nanggroe Aceh Darussa lam 28,766,097,919.04 1.5% 6,056,936,730.79 0.3% 18,823,431,275.49 1.0% 56,476,136,116.15 2.7% 57,541,241.06 0.0%
2. Sumatera Utara 67,024,429,511.11 3.6% 62,159,075,415.54 3.2% 79,619,172,123.78 4.1% 117,390,133,762.33 5.6% 22,169,137,562.57 4.9%
3. Sumatera Barat 10,460,738,543.33 0.6% 20,362,619,088.77 1.1% 17,576,087,174.36 0.9% 41,270,021,793.11 2.0% 6,231,505,034.14 1.4%
4. Riau 73,686,771,139.36 4.0% 94,150,392,713.86 4.9% 44,559,524,950.32 2.3% 94,625,284,409.54 4.5% 6,612,750,560.27 1.5%
5. Jambi 4,161,638,769.75 0.2% 5,079,952,502.94 0.3% 33,240,671,414.50 1.7% 3,987,517,020.79 0.2% 253,059,466.74 0.1%
6. Sumatera Selatan 51,863,112,672.45 2.8% 34,390,651,303.47 1.8% 37,785,543,505.47 1.9% 31,430,667,205.15 1.5% 3,449,547,073.84 0.8%
7. Bengkulu 2,371,383,801.24 0.1% 6,065,297,322.45 0.3% 5,566,643,153.26 0.3% 5,524,197,410.24 0.3% 808,524,565.81 0.2%
8. Lampung 20,307,594,917.29 1.1% 35,398,576,955.97 1.8% 30,693,416,396.92 1.6% 30,699,541,454.88 1.5% 9,203,480,761.80 2.0%
9. Kepulauan Bangka Bel i tung 473,816,312.20 0.0% 3,308,462,821.14 0.2% 4,248,691,023.37 0.2% 3,203,268,837.63 0.2% 224,644,857.77 0.0%
10. Kepulauan Riau 16,466,739,094.75 0.9% 17,790,877,599.87 0.9% 17,165,292,507.49 0.9% 16,270,102,852.18 0.8% 3,383,943,160.58 0.7%
11. DKI Jakarta 366,667,611,241.54 19.7% 422,229,714,619.31 22.0% 446,256,161,266.35 22.9% 386,149,844,386.26 18.4% 110,453,435,589.13 24.4%
12. Jawa Barat 342,953,856,064.74 18.5% 335,091,746,344.89 17.5% 385,968,346,026.97 19.8% 418,980,569,993.07 19.9% 78,725,676,270.63 17.4%
13. Jawa Tengah 146,422,945,151.97 7.9% 127,092,825,056.88 6.6% 94,932,964,006.78 4.9% 107,000,105,053.94 5.1% 13,473,779,140.28 3.0%
14. DI. Yogyakarta 6,742,185,162.25 0.4% 12,570,393,936.84 0.7% 15,006,077,260.33 0.8% 15,166,509,218.37 0.7% 8,912,746,458.34 2.0%
15. Jawa Timur 260,796,852,883.04 14.0% 304,918,631,517.45 15.9% 284,784,553,697.69 14.6% 270,954,829,747.47 12.9% 74,078,137,076.77 16.4%
16. Banten 173,734,443,011.58 9.3% 193,894,466,728.70 10.1% 215,414,215,385.21 11.1% 286,165,126,441.67 13.6% 61,656,539,474.02 13.6%
17. Ba l i 33,147,173,488.33 1.8% 47,348,437,340.85 2.5% 53,148,993,050.29 2.7% 49,406,594,831.62 2.3% 10,008,558,980.17 2.2%
18. Ka l imantan Barat 1,812,982,267.31 0.1% 3,243,685,787.01 0.2% 4,204,394,054.87 0.2% 3,403,951,120.88 0.2% 311,063,276.89 0.1%
19. Ka l imantan Tengah 2,776,692,802.98 0.1% 3,603,386,118.69 0.2% 5,420,115,016.34 0.3% 4,796,216,083.82 0.2% 2,550,850,510.83 0.6%
20. Ka l imantan Selatan 25,172,709,081.85 1.4% 45,826,937,951.83 2.4% 24,331,556,573.38 1.2% 11,580,164,542.99 0.6% 4,103,623,967.99 0.9%
21. Ka l imantan Timur 134,804,709,540.17 7.3% 57,297,321,436.32 3.0% 53,905,951,994.44 2.8% 69,792,986,559.30 3.3% 6,187,392,216.65 1.4%
22. Sulawes i Utara 5,212,399,853.20 0.3% 5,963,570,091.38 0.3% 10,929,619,301.58 0.6% 10,691,002,926.79 0.5% 3,831,762,133.22 0.8%
23. Sulawes i Tengah 1,572,832,046.80 0.1% 1,838,976,145.60 0.1% 1,536,271,679.19 0.1% 1,619,979,666.94 0.1% 50,964,472.32 0.0%
24. Sulawes i Selatan 23,375,816,172.37 1.3% 24,170,272,723.62 1.3% 25,690,987,680.28 1.3% 17,730,372,703.12 0.8% 2,286,945,512.33 0.5%
25. Sulawes i Tenggara 34,445,669,496.56 1.9% 36,382,585,394.99 1.9% 8,814,044,145.64 0.5% 9,645,872,004.01 0.5% 18,984,818.04 0.0%
26. Goronta lo 574,726,743.97 0.0% 582,963,731.43 0.0% 16,025,166,557.15 0.8% 17,409,666,138.33 0.8% 23,065,150,683.48 5.1%
27. Sulawes i Barat 86,009,229.22 0.0% 117,894,907.40 0.0% 651,119,633.54 0.0% 507,715,168.23 0.0% 0.0%
28. Nusa Tenggara Barat 3,813,832,383.88 0.2% 2,905,628,813.67 0.2% 2,712,015,198.53 0.1% 13,726,211,769.79 0.7% 310,009,755.65 0.1%
29. Nusa Tenggara Timur 530,989,714.05 0.0% 738,080,946.24 0.0% 899,324,544.39 0.0% 1,146,291,736.67 0.1% 170,033,071.60 0.0%
30. Maluku 534,013,579.40 0.0% 513,227,725.16 0.0% 877,947,475.95 0.0% 1,562,239,032.90 0.1% 166,119,220.14 0.0%
31. Maluku Utara 706,339,836.76 0.0% 733,657,069.38 0.0% 579,346,927.86 0.0% 529,011,635.92 0.0% 3,834,312.52 0.0%
32. Papua Barat 1,168,851,801.70 0.1% 1,387,400,316.70 0.1% 1,615,787,291.11 0.1% 1,844,020,138.41 0.1% 4,836,000.00 0.0%
33. Papua 15,538,935,006.92 0.8% 6,475,526,576.57 0.3% 3,720,745,249.11 0.2% 3,241,357,790.08 0.2% 158,293,535.27 0.0%
TOTAL 1,858,174,899,241.14 100.0% 1,919,690,173,735.72 100.0% 1,946,704,177,541.96 100.0% 2,103,927,509,552.56 100.0% 452,922,870,760.83 100.0%
NATIONAL GROSS PREMIUM INCOME BY PROVINCE
As At 30 June 2011
UY 2007 - 2011
PROVINCEU/Y 2007 U/Y 2008 U/Y 2009 U/Y 2010 U/Y 2011

33 S t a t i s t i k A s u r a n s i G e m p a B u m i I n d o n e s i a a s a t J u n e 2 0 1 1
Table 4.1
U/Y 2007 U/Y 2008 U/Y 2009 U/Y 2010 U/Y 2011
Banda Aceh 1.1 448 576 526 380 31
Medan 1.2 3,010 4,271 4,295 3,472 390
Others 1.3 1,272 2,328 2,418 2,716 154
North Sumatera 1 4,730 7,175 7,239 6,568 575
Padang 2.1 2,767 3,910 3,592 5,378 54
Palembang 2.2 1,118 1,353 1,184 905 178
Others 2.3 5,766 11,395 8,839 9,747 435
South Sumatera 2 9,651 16,658 13,615 16,030 667
DKI Jakarta 3.1 24,659 26,433 28,184 23,094 1,182
Bandung 3.2 3,645 4,379 1,146 1,247 384
Others 3.3 14,700 19,454 24,031 22,745 1,218
DKI & West Java 3 43,004 50,266 53,361 47,086 2,784
Semarang 4.1 1,932 2,282 409 141 344
Yogyakarta 4.2 1,716 1,801 1,885 1,673 213
Others 4.3 3,814 6,539 7,180 6,781 362
DIY & Central Java 4 7,462 10,622 9,474 8,595 919
Surabaya 5.1 3,351 4,147 4,423 4,100 826
Others 5.2 3,760 5,587 5,574 4,982 494
East Java 5 7,111 9,734 9,997 9,082 1,320
Kalimantan 6 2,124 3,817 3,287 3,487 114
Ujung Pandang 7.1 898 1,217 1,178 938 83
Others 7.2 2,217 3,924 2,335 2,811 59
Sulawesi 7 3,115 5,141 3,513 3,749 142
Other Islands 8 5,814 7,619 8,390 7,414 335
83,011 111,032 108,876 102,011 6,856
NUMBER OF RISKAs At 30 June 2011
CRESTA ZONE
T O T A L

34 S t a t i s t i k A s u r a n s i G e m p a B u m i I n d o n e s i a a s a t J u n e 2 0 1 1

35 S t a t i s t i k A s u r a n s i G e m p a B u m i I n d o n e s i a a s a t J u n e 2 0 1 1
Table 4.2
Description U/Y 2007 In % U/Y 2008 In % U/Y 2009 In % U/Y 2010 In % U/Y 2011 In %
Agricultural 412 0.50% 599 0.54% 348 0.32% 265 0.26% 64 0.93%
Commercial 39,310 47.36% 64,507 58.10% 55,866 51.31% 47,881 46.94% 5,083 74.14%
Industrial 11,704 14.10% 9,682 8.72% 11,526 10.59% 10,553 10.34% 933 13.61%
Residential 31,585 38.05% 36,244 32.64% 41,136 37.78% 43,312 42.46% 776 11.32%
TOTAL 83,011 100% 111,032 100% 108,876 100% 102,011 100% 6,856 100%
*) Figure above excluding undefined multi location risks
NUMBER OF RISK BY OCCUPATIONAs At 30 June 2011
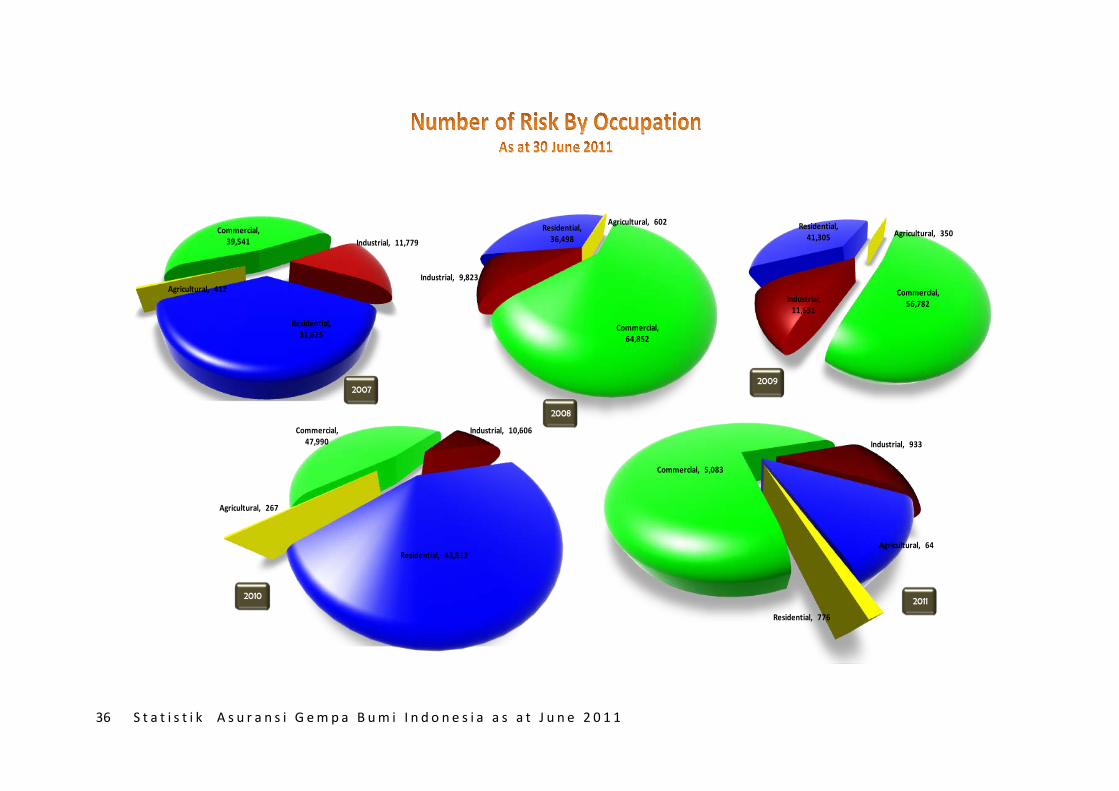
36 S t a t i s t i k A s u r a n s i G e m p a B u m i I n d o n e s i a a s a t J u n e 2 0 1 1
Agricultural, 412
Commercial, 39,541 Industrial, 11,779
Residential, 31,625
Agricultural, 602
Commercial, 64,852
Industrial, 9,823
Residential, 36,498 Agricultural, 350
Commercial, 56,782 Industrial,
11,631
Residential, 41,305
Agricultural, 267
Commercial, 47,990
Industrial, 10,606
Residential, 43,512 Agricultural, 64
Commercial, 5,083
Industrial, 933
Residential, 776
2009
20112010
2007
2008

37 S t a t i s t i k A s u r a n s i G e m p a B u m i I n d o n e s i a a s a t J u n e 2 0 1 1
Table 5.1
Description U/Y 2007 U/Y 2008 U/Y 2009 U/Y 2010 U/Y 2011
Agricultural 2 7 87 0 0
Commercial 236 917 1465 25 0
Industrial 28 35 36 2 0
Residential 104 283 903 6 0
TOTAL 370 1242 2491 33 0
CLAIM FREQUENCY BY OCCUPATIONAs At 30 June 2011

38 S t a t i s t i k A s u r a n s i G e m p a B u m i I n d o n e s i a a s a t J u n e 2 0 1 1

39 S t a t i s t i k A s u r a n s i G e m p a B u m i I n d o n e s i a a s a t J u n e 2 0 1 1
Table 5.2
U/Y 2007 U/Y 2008 U/Y 2009 U/Y 2010 U/Y 2011Banda Aceh 1.1 0 1 1 1 0
Medan 1.2 0 0 0 1 0
Others 1.3 0 1 12 0 0
North Sumatera 1 0 2 13 2 0
Padang 2.1 235 918 2,036 0 0
Palembang 2.2 0 2 0 0 0
Others 2.3 90 76 36 0 0
South Sumatera 2 325 996 2,072 0 0
DKI Jakarta 3.1 18 46 61 0 0
Bandung 3.2 4 38 52 0 0
Others 3.3 11 130 253 1 0
DKI & West Java 3 33 214 366 1 0
Semarang 4.1 0 0 0 0 0
Yogyakarta 4.2 1 0 0 1 0
Others 4.3 0 4 3 18 0
DIY & Central Java 4 1 4 3 19 0
Surabaya 5.1 0 0 0 0 0
Others 5.2 0 0 0 0 0
East Java 5 0 0 0 0 0
Kalimantan 6 0 1 0 0 0
Ujung Pandang 7.1 0 0 0 1 0
Others 7.2 3 6 0 2 0
Sulawesi 7 3 6 0 3 0
Other Islands 8 8 19 37 8 0
370 1,242 2,491 33 0
CLAIM FREQUENCY BY CRESTA ZONEAs At 30 June 2011
CRESTA ZONE
T O T A L
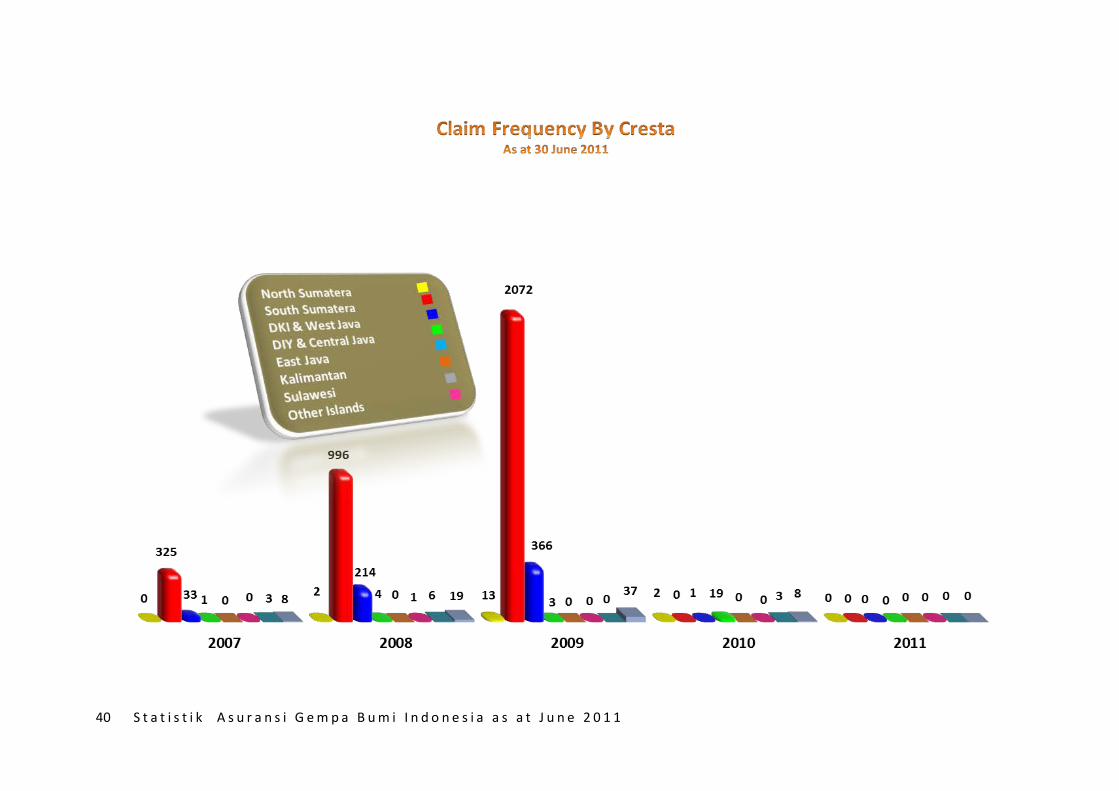
40 S t a t i s t i k A s u r a n s i G e m p a B u m i I n d o n e s i a a s a t J u n e 2 0 1 1

41 S t a t i s t i k A s u r a n s i G e m p a B u m i I n d o n e s i a a s a t J u n e 2 0 1 1
Table 5.3
In IDRDescription U/Y 2007 In % U/Y 2008 In % U/Y 2009 In % U/Y 2010 In % U/Y 2011 In %
Agricultural 106,250,000.00 0.05% 9,176,695,348.00 0.46% 65,136,248,993.60 1.27% - 0.00% 0.00 0.00%
Commercial 78,618,409,061.53 39.72% 1,895,085,058,389.25 95.02% 4,962,721,352,338.30 97.11% 120,047,702,009.00 87.99% 0.00 0.00%
Industrial 63,516,052,106.00 32.09% 63,823,188,368.47 3.20% 9,670,315,626.45 0.19% 15,900,000,000.00 11.65% 0.00 0.00%
Residential 55,694,666,861.96 28.14% 26,361,812,896.33 1.32% 72,905,000,825.53 1.43% 478,074,150.00 0.35% 0.00 0.00%
TOTAL 197,935,378,029.49 100.00% 1,994,446,755,002.05 100.00% 5,110,432,917,783.88 100.00% 136,425,776,159.00 100.00% 0.00 0.00%
CLAIM BY OCCUPATIONAs At 30 June 2011

42 S t a t i s t i k A s u r a n s i G e m p a B u m i I n d o n e s i a a s a t J u n e 2 0 1 1

43 S t a t i s t i k A s u r a n s i G e m p a B u m i I n d o n e s i a a s a t J u n e 2 0 1 1
Table 5 .4 In IDR
Amount in % Amount in % Amount in % Amount in % Amount in %Banda Aceh 1.1 0.00 0.0% 53,980,575.00 0.0% 0.00 0.0% 39,128,000.00 0.0% 0.00 0.0%Medan 1.2 0.00 0.0% 0.00 0.0% 0.00 0.0% 17,388,400.00 0.0% 0.00 0.0%Others 1.3 0.00 0.0% 3,605,967,911.00 0.0% 750,397,339.00 0.0% 0.00 0.0% 0.00 0.0%North Sumatera 1 0.00 0.0% 3,659,948,486.00 0.2% 750,397,339.00 0.0% 56,516,400.00 0.0% 0.00 0.0%Padang 2.1 121,380,862,012.54 61.3% 1,906,310,672,058.89 6.1% 4,767,838,035,815.69 2.4% 0.00 89.0% 0.00 0.0%Palembang 2.2 0.00 0.0% 9,165,151,500.00 0.0% 0.00 0.0% 0.00 0.0% 0.00 0.0%Others 2.3 68,281,665,634.17 34.5% 33,186,514,686.31 3.4% 97,071,878,366.06 1.3% 0.00 50.1% 0.00 0.0%South Sumatera 2 189,662,527,646.71 95.8% 1,948,662,338,245.20 97.7% 4,864,909,914,181.75 95.2% 0.00 0.0% 0.00 0.0%DKI Jakarta 3.1 2,067,026,266.00 1.0% 8,070,318,176.00 0.1% 3,154,793,138.79 0.0% 0.00 1.5% 0.00 0.0%Bandung 3.2 2,729,313,359.78 1.4% 3,187,415,714.31 0.1% 3,264,528,630.15 0.1% 0.00 2.0% 0.00 0.0%Others 3.3 592,744,340.00 0.3% 11,929,303,372.51 0.0% 73,450,357,740.95 0.0% 120,000,000.00 0.4% 0.00 0.0%DKI & West Java 3 5,389,083,965.78 2.7% 23,187,037,262.82 1.2% 79,869,679,509.89 1.6% 120,000,000.00 0.1% 0.00 0.0%Semarang 4.1 0.00 0.0% 0.00 0.0% 0.00 0.0% 0.00 0.0% 0.00 0.0%Yogyakarta 4.2 300,000,000.00 0.2% 0.00 0.0% 0.00 0.0% 12,713,600.00 0.2% 0.00 0.0%Others 4.3 0.00 0.0% 30,800,000.00 0.0% 181,362,006.40 0.0% 119,563,182,609.00 0.0% 0.00 0.0%DIY & Central Java 4 300,000,000.00 0.2% 30,800,000.00 0.0% 181,362,006.40 0.0% 119,575,896,209.00 87.6% 0.00 0.0%Surabaya 5.1 0.00 0.0% 0.00 0.0% 0.00 0.0% 0.00 0.0% 0.00 0.0%Others 5.2 0.00 0.0% 0.0% 0.00 0.0% 0.00 0.0% 0.00 0.0%East Java 5 0.00 0.0% 0.00 0.0% 0.00 0.0% 0.00 0.0% 0.00 0.0%Kalimantan 6 0.00 0.0% 50,174,959.90 0.0% 0.00 0.0% 0.00 0.0% 0.00 0.0%Ujung Pandang 7.1 0.00 0.0% 0.00 0.0% 0.00 0.0% 1,400,000,000.00 0.0% 0.00 0.0%Others 7.2 429,763,147.00 0.2% 685,405,890.00 0.0% 0.00 0.0% 105,000,000.00 0.3% 0.00 0.0%Sulawesi 7 429,763,147.00 0.2% 685,405,890.00 0.0% 0.00 0.0% 1,505,000,000.00 1.1% 0.00 0.0%Other Islands 8 2,154,003,270.00 1.1% 18,171,050,158.13 0.9% 164,721,564,746.85 3.2% 15,168,363,550.00 11.1% 0.00 0.0%
197,935,378,029.49 100.0% 1,994,446,755,002.05 100.0% 5,110,432,917,783.88 100.0% 136,425,776,159.00 100.0% 0.00 0.0%T O T A L
Claim by Cresta ZoneAs At 30 June 2011
CRESTA ZONE U/Y 2007 U/Y 2008 U/Y 2009 U/Y 2010 U/Y 2011
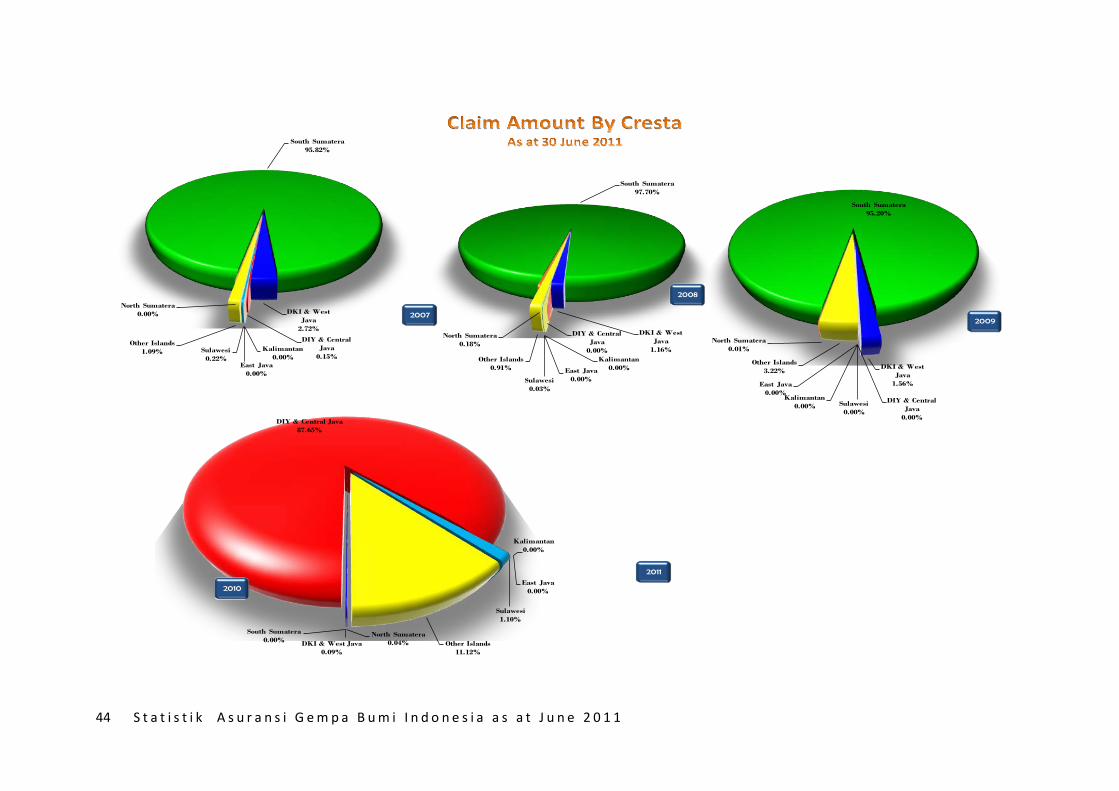
44 S t a t i s t i k A s u r a n s i G e m p a B u m i I n d o n e s i a a s a t J u n e 2 0 1 1
North Sumatera0.00%
South Sumatera95.82%
DKI & West Java
2.72%
DIY & Central Java
0.15%East Java
0.00%
Kalimantan0.00%
Sulawesi0.22%
Other Islands1.09%
North Sumatera0.18%
South Sumatera97.70%
DKI & West Java
1.16%
DIY & Central Java
0.00%
East Java0.00%
Kalimantan0.00%
Sulawesi0.03%
Other Islands0.91%
North Sumatera0.01%
South Sumatera95.20%
DKI & West Java
1.56%
DIY & Central Java
0.00%
East Java0.00%
Kalimantan0.00% Sulawesi
0.00%
Other Islands3.22%
North Sumatera0.04%
South Sumatera0.00% DKI & West Java
0.09%
DIY & Central Java87.65%
East Java0.00%
Kalimantan0.00%
Sulawesi1.10%
Other Islands11.12%
2007
2008
2011
2010
2009

45 S t a t i s t i k A s u r a n s i G e m p a B u m i I n d o n e s i a a s a t J u n e 2 0 1 1
U NDERWRIT ING Y EAR : 2007 - 2011 DAT A PO SIT IO N FRO MPRO VINC E : AllO C C U PAT IO N : All T O
PRO C ESSING DAT E
T able 6.1
B AND (d)/∑(d)
C U M. ∑(f)
B AND (i)/∑(i)
C U M. ∑(j)
B AND (m)/∑(m)
C U M. ∑(n)
B AND (q)/∑(q)
C U M. ∑(r)
B AND (p)/(h)
C U M. (q)/(i)
(a) (b) (c) (d) (e ) (f) (g ) (h) (i ) (j ) (k ) (l) (m) (n ) (o ) (p) (q ) (r) (s) (t) (u)
1 0.00 50.00 36,432 36,432 8.85 8.85 2,067.40 2,067.40 0.02 0.02 109 109 2.63 2.63 8,350.16 8,350.16 0.11 0.11 403.90 403.90
2 50.00 100.00 25,871 62,303 6.28 15.13 3,320.91 5,388.31 0.04 0.07 153 262 3.69 6.31 4,562.47 12,912.63 0.06 0.16 137.39 239.64
3 100.00 200.00 44,103 106,406 10.71 25.84 9,270.68 14,658.99 0.11 0.18 355 617 8.55 14.86 8,640.90 21,553.53 0.11 0.27 93.21 147.03
4 200.00 300.00 32,518 138,924 7.90 33.74 10,185.33 24,844.32 0.12 0.30 450 1,067 10.84 25.70 37,057.43 58,610.96 0.47 0.75 363.83 235.91
5 300.00 500.00 44,756 183,680 10.87 44.61 21,790.46 46,634.78 0.26 0.56 567 1,634 13.66 39.36 48,487.97 107,098.93 0.62 1.36 222.52 229.65
6 500.00 750.00 49,103 232,783 11.92 56.53 38,196.74 84,831.52 0.46 1.02 446 2,080 10.74 50.11 70,932.54 178,031.47 0.90 2.26 185.70 209.86
7 750.00 1,000.00 28,659 261,442 6.96 63.49 31,489.04 116,320.56 0.38 1.40 200 2,280 4.82 54.93 30,039.44 208,070.90 0.38 2.65 95.40 178.88
8 1,000.00 1,500.00 34,690 296,132 8.42 71.91 49,997.34 166,317.90 0.60 2.01 261 2,541 6.29 61.21 48,471.73 256,542.64 0.62 3.26 96.95 154.25
9 1,500.00 2,000.00 17,644 313,776 4.28 76.20 36,574.75 202,892.65 0.44 2.45 147 2,688 3.54 64.76 51,131.44 307,674.07 0.65 3.91 139.80 151.64
10 2,000.00 2,500.00 13,318 327,094 3.23 79.43 35,768.65 238,661.30 0.43 2.88 111 2,799 2.67 67.43 61,280.27 368,954.34 0.78 4.69 171.32 154.59
11 2,500.00 3,000.00 8,411 335,505 2.04 81.48 27,808.70 266,470.00 0.34 3.22 65 2,864 1.57 69.00 38,752.60 407,706.93 0.49 5.19 139.35 153.00
12 3,000.00 4,000.00 12,310 347,815 2.99 84.46 51,194.97 317,664.97 0.62 3.84 143 3,007 3.44 72.44 122,989.46 530,696.39 1.56 6.75 240.24 167.06
13 4,000.00 5,000.00 7,727 355,542 1.88 86.34 41,720.03 359,385.00 0.50 4.34 92 3,099 2.22 74.66 32,181.63 562,878.02 0.41 7.16 77.14 156.62
14 5,000.00 7,500.00 12,773 368,315 3.10 89.44 92,635.80 452,020.80 1.12 5.46 123 3,222 2.96 77.62 59,391.36 622,269.38 0.76 7.91 64.11 137.66
15 7,500.00 10,000.00 6,819 375,134 1.66 91.10 70,193.09 522,213.90 0.85 6.31 158 3,380 3.81 81.43 181,107.47 803,376.85 2.30 10.22 258.01 153.84
16 10,000.00 20,000.00 12,607 387,741 3.06 94.16 208,759.55 730,973.45 2.52 8.83 227 3,607 5.47 86.89 646,091.53 1,449,468.38 8.22 18.44 309.49 198.29
17 20,000.00 50,000.00 10,887 398,628 2.64 96.80 403,506.56 1,134,480.00 4.87 13.70 126 3,733 3.04 89.93 380,424.12 1,829,892.50 4.84 23.28 94.28 161.30
18 50,000.00 100,000.00 5,315 403,943 1.29 98.10 451,263.35 1,585,743.35 5.45 19.15 108 3,841 2.60 92.53 1,433,995.08 3,263,887.57 18.24 41.51 317.77 205.83
19 100,000.00 500,000.00 6,097 410,040 1.48 99.58 1,569,425.04 3,155,168.39 18.95 38.10 195 4,036 4.70 97.23 3,182,721.92 6,446,609.50 40.48 82.00 202.80 204.32
20 500,000.00 UP 1,746 411,786 0.42 100.00 4,094,082.60 7,249,250.99 49.44 87.54 100 4,136 2.41 99.64 992,631.33 7,439,240.83 12.63 94.62 24.25 102.621,032,168.64 8,281,419.63 12.46 100.00 15 4,151 0.36 100.00 422,734.90 7,861,975.73 5.38 100.00 40.96 94.94
*) Multilocation = risiko multi lokasi yang karena kurang lengkapnya data yang kami terima, risiko tersebut tidak dapat kami identifikasi sebagai any one risk
P T . A suransi MA IP A R K Indonesia
RISK & L O SS PRO FIL E
C LAIM FREQ U ENC Y LO SS RAT IO
B AND f F ∑(d)
SU M INSU RED (B AND) (In Million Rp.)
rp
G RO SS PREMIU M (In Million Rp.)
PERC ENT AG E
NU MB ER O F R ISKS
f PERC ENT AG E RP ∑(p)
rp RP ∑(h)
INC U RRED C LAIM (In Million Rp.)
30/06/2011
05/04/2012
01/01/2007
* ) Multilocation
FRO M T OPERC ENT AG EPERC ENT AG E PERC ENT AG E F
∑(l)

46 S t a t i s t i k A s u r a n s i G e m p a B u m i I n d o n e s i a a s a t J u n e 2 0 1 1
UNDERWRITING YEAR : 2011 DATA POSITION FROMPROVINCE : AllOCCUPATION : All TO
PROCESSING DATE
Table 6.2
BAND (d)/∑(d)
CUM. ∑(f)
BAND (i)/∑(i)
CUM. ∑(j)
BAND (m)/∑(m)
CUM. ∑(n)
BAND (q)/∑(q)
CUM. ∑(r)
BAND (p)/(h)
CUM. (q)/(i)
(a) (b) (c) (d) ( e) ( f) ( g) (h) ( i) ( j) ( k) (l) (m) ( n) ( o) (p) ( q) ( r) ( s) (t ) (u)
1 0.00 50.00 136 136 1.98 1.98 42.03 42.03 0.01 0.01 0 0 0.00 0.00 0.00 0.00 0.00 0.00 0.00 0.00
2 50.00 100.00 128 264 1.87 3.85 19.61 61.64 0.00 0.01 0 0 0.00 0.00 0.00 0.00 0.00 0.00 0.00 0.00
3 100.00 200.00 741 1,005 10.81 14.66 195.37 257.01 0.04 0.06 0 0 0.00 0.00 0.00 0.00 0.00 0.00 0.00 0.00
4 200.00 300.00 417 1,422 6.08 20.74 147.67 404.68 0.03 0.09 0 0 0.00 0.00 0.00 0.00 0.00 0.00 0.00 0.00
5 300.00 500.00 1,049 2,471 15.30 36.04 578.85 983.53 0.13 0.22 0 0 0.00 0.00 0.00 0.00 0.00 0.00 0.00 0.00
6 500.00 750.00 1,391 3,862 20.29 56.33 1,081.29 2,064.82 0.24 0.46 0 0 0.00 0.00 0.00 0.00 0.00 0.00 0.00 0.00
7 750.00 1,000.00 469 4,331 6.84 63.17 534.92 2,599.74 0.12 0.57 0 0 0.00 0.00 0.00 0.00 0.00 0.00 0.00 0.00
8 1,000.00 1,500.00 336 4,667 4.90 68.07 524.17 3,123.90 0.12 0.69 0 0 0.00 0.00 0.00 0.00 0.00 0.00 0.00 0.00
9 1,500.00 2,000.00 158 4,825 2.30 70.38 355.90 3,479.80 0.08 0.77 0 0 0.00 0.00 0.00 0.00 0.00 0.00 0.00 0.00
10 2,000.00 2,500.00 94 4,919 1.37 71.75 276.04 3,755.84 0.06 0.83 0 0 0.00 0.00 0.00 0.00 0.00 0.00 0.00 0.00
11 2,500.00 3,000.00 71 4,990 1.04 72.78 253.99 4,009.83 0.06 0.89 0 0 0.00 0.00 0.00 0.00 0.00 0.00 0.00 0.00
12 3,000.00 4,000.00 167 5,157 2.44 75.22 742.94 4,752.77 0.16 1.05 0 0 0.00 0.00 0.00 0.00 0.00 0.00 0.00 0.00
13 4,000.00 5,000.00 165 5,322 2.41 77.63 922.78 5,675.55 0.20 1.25 0 0 0.00 0.00 0.00 0.00 0.00 0.00 0.00 0.00
14 5,000.00 7,500.00 201 5,523 2.93 80.56 1,440.13 7,115.68 0.32 1.57 0 0 0.00 0.00 0.00 0.00 0.00 0.00 0.00 0.00
15 7,500.00 10,000.00 109 5,632 1.59 82.15 1,263.89 8,379.57 0.28 1.85 0 0 0.00 0.00 0.00 0.00 0.00 0.00 0.00 0.00
16 10,000.00 20,000.00 256 5,888 3.73 85.88 4,484.32 12,863.89 0.99 2.84 0 0 0.00 0.00 0.00 0.00 0.00 0.00 0.00 0.00
17 20,000.00 50,000.00 305 6,193 4.45 90.33 11,915.58 24,779.47 2.63 5.47 0 0 0.00 0.00 0.00 0.00 0.00 0.00 0.00 0.00
18 50,000.00 100,000.00 197 6,390 2.87 93.20 17,718.38 42,497.84 3.91 9.38 0 0 0.00 0.00 0.00 0.00 0.00 0.00 0.00 0.00
19 100,000.00 500,000.00 335 6,725 4.89 98.09 91,892.82 134,390.66 20.29 29.67 0 0 0.00 0.00 0.00 0.00 0.00 0.00 0.00 0.00
20 500,000.00 UP 131 6,856 1.91 100.00 318,532.21 452,922.87 70.33 100.00 0 0 0.00 0.00 0.00 0.00 0.00 0.00 0.00 0.00
0.00 452,922.87 0.00 100.00 0 0 0.00 0.00 0.00 0.00 0.00 0.00 0.00 0.00
*) Multilocation = risiko multi lokasi yang karena kurang lengkapnya data yang kami terima, risiko tersebut tidak dapat kami identifikasi sebagai any one risk
30/06/2011
5/04/2012
01/01/2011
* ) Multilocation
FROM TOPERCENTAGEPERCENTAGE PERCENTAGE F
∑(l)PERCENTAGE
NUMBER OF RISKS
f PERCENTAGE RP ∑(p)
rp RP ∑(h)
INCURRED CLAIM (In Million Rp.)
PT. Asuransi MAIPARK Indonesia
RISK & LOSS PROFILE
CLAIM FREQUENCY LOSS RATIO
BAND f F ∑(d)
SUM INSURED (BAND) (In Million Rp.)
rp
GROSS PREMIUM (In Million Rp.)

47 S t a t i s t i k A s u r a n s i G e m p a B u m i I n d o n e s i a a s a t J u n e 2 0 1 1
U NDERWRIT ING Y EAR : 2010 DAT A PO SIT IO N FRO MPRO VINC E : AllO C C U PAT IO N : All T O
PRO C ESSING DAT E
T able 6.3
B AND (d)/∑(d)
C U M. ∑(f)
B AND (i)/∑(i)
C U M. ∑(j)
B AND (m)/∑(m)
C U M. ∑(n)
B AND (q)/∑(q)
C U M. ∑(r)
B AND (p)/(h)
C U M. (q)/(i)
(a) (b) (c) (d) (e ) (f) (g ) (h) (i ) (j ) (k ) (l) (m) (n ) (o ) (p) (q ) (r) (s) (t) (u)
1 0.00 50.00 6,121 6,121 6.00 6.00 439.72 439.72 0.02 0.02 0 0 0.00 0.00 0.00 0.00 0.00 0.00 0.00 0.00
2 50.00 100.00 5,985 12,106 5.87 11.87 777.22 1,216.94 0.04 0.06 1 1 2.94 2.94 0.00 0.00 0.00 0.00 0.00 0.00
3 100.00 200.00 10,492 22,598 10.29 22.15 2,477.97 3,694.91 0.12 0.18 0 1 0.00 2.94 0.00 0.00 0.00 0.00 0.00 0.00
4 200.00 300.00 8,090 30,688 7.93 30.08 2,897.35 6,592.26 0.14 0.31 2 3 5.88 8.82 33.58 33.58 0.02 0.02 1.16 0.51
5 300.00 500.00 11,315 42,003 11.09 41.17 6,138.66 12,730.92 0.29 0.61 4 7 11.76 20.59 113.70 147.28 0.08 0.10 1.85 1.16
6 500.00 750.00 13,305 55,308 13.04 54.22 11,561.99 24,292.91 0.55 1.15 0 7 0.00 20.59 0.00 147.28 0.00 0.10 0.00 0.61
7 750.00 1,000.00 8,881 64,189 8.71 62.92 11,190.16 35,483.07 0.53 1.69 1 8 2.94 23.53 39.13 186.40 0.03 0.12 0.35 0.53
8 1,000.00 1,500.00 9,149 73,338 8.97 71.89 14,732.20 50,215.27 0.70 2.39 0 8 0.00 23.53 0.00 186.40 0.00 0.12 0.00 0.37
9 1,500.00 2,000.00 4,469 77,807 4.38 76.27 10,098.12 60,313.39 0.48 2.87 5 13 14.71 38.24 1,965.74 2,152.14 1.30 1.43 19.47 3.57
10 2,000.00 2,500.00 3,570 81,377 3.50 79.77 10,361.37 70,674.77 0.49 3.36 0 13 0.00 38.24 0.00 2,152.14 0.00 1.43 0.00 3.05
11 2,500.00 3,000.00 2,083 83,460 2.04 81.81 7,491.56 78,166.33 0.36 3.72 0 13 0.00 38.24 0.00 2,152.14 0.00 1.43 0.00 2.75
12 3,000.00 4,000.00 3,185 86,645 3.12 84.94 14,381.82 92,548.14 0.68 4.40 0 13 0.00 38.24 0.00 2,152.14 0.00 1.43 0.00 2.33
13 4,000.00 5,000.00 1,840 88,485 1.80 86.74 10,719.71 103,267.86 0.51 4.91 1 14 2.94 41.18 345.00 2,497.14 0.23 1.65 3.22 2.42
14 5,000.00 7,500.00 3,236 91,721 3.17 89.91 25,619.06 128,886.92 1.22 6.13 1 15 2.94 44.12 0.00 2,497.14 0.00 1.65 0.00 1.94
15 7,500.00 10,000.00 1,517 93,238 1.49 91.40 17,267.70 146,154.62 0.82 6.95 1 16 2.94 47.06 9.35 2,506.49 0.01 1.66 0.05 1.71
16 10,000.00 20,000.00 3,008 96,246 2.95 94.35 54,991.65 201,146.27 2.61 9.56 1 17 2.94 50.00 100.00 2,606.49 0.07 1.73 0.18 1.30
17 20,000.00 50,000.00 2,510 98,756 2.46 96.81 101,436.19 302,582.46 4.82 14.38 0 17 0.00 50.00 0.00 2,606.49 0.00 1.73 0.00 0.86
18 50,000.00 100,000.00 1,285 100,041 1.26 98.07 114,214.74 416,797.20 5.43 19.81 3 20 8.82 58.82 125.30 2,731.80 0.08 1.81 0.11 0.66
19 100,000.00 500,000.00 1,517 101,558 1.49 99.56 406,372.87 823,170.07 19.31 39.13 10 30 29.41 88.24 92,188.98 94,920.78 61.08 62.89 22.69 11.53
20 500,000.00 UP 453 102,011 0.44 100.00 1,128,715.49 1,951,885.56 53.65 92.77 3 33 8.82 97.06 41,505.00 136,425.78 27.50 90.39 3.68 6.99152,041.94 2,103,927.51 7.23 100.00 1 34 2.94 100.00 14,500.00 150,925.78 9.61 100.00 9.54 7.17
*) Multilocation = risiko multi lokasi yang karena kurang lengkapnya data yang kami terima, risiko tersebut tidak dapat kami identifikasi sebagai any one risk
30/06/2011
05/04/2012
01/01/2010
* ) Multilocation
FRO M T OPERC ENT AG EPERC ENT AG E PERC ENT AG E F
∑(l)PERC ENT AG E
NU MB ER O F R ISKS
f PERC ENT AG E RP ∑(p)
rp RP ∑(h)
INC U RRED C LAIM (In Million Rp.)
P T . A suransi MA IP A R K Indonesia
RISK & L O SS PRO FIL E
C LAIM FREQ U ENC Y LO SS RAT IO
B AND f F ∑(d)
SU M INSU RED (B AND) (In Million Rp.)
rp
G RO SS PREMIU M (In Million Rp.)
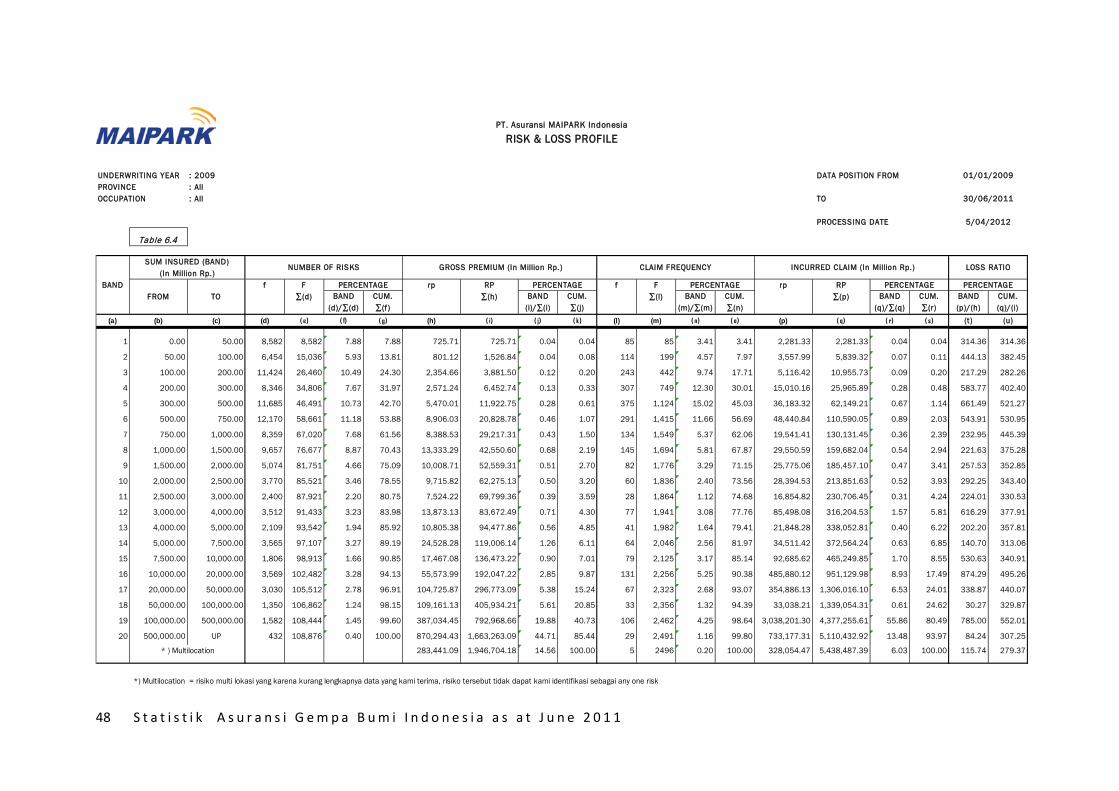
48 S t a t i s t i k A s u r a n s i G e m p a B u m i I n d o n e s i a a s a t J u n e 2 0 1 1
UNDERWRITING YEAR : 2009 DATA POSITION FROMPROVINCE : AllOCCUPATION : All TO
PROCESSING DATE
Table 6.4
BAND (d)/∑(d)
CUM. ∑(f)
BAND (i)/∑(i)
CUM. ∑(j)
BAND (m)/∑(m)
CUM. ∑(n)
BAND (q)/∑(q)
CUM. ∑(r)
BAND (p)/(h)
CUM. (q)/(i)
(a) (b) (c) (d) ( e) ( f) ( g) (h) ( i) ( j) ( k) (l) (m) ( n) ( o) (p) ( q) ( r) ( s) (t ) (u)
1 0.00 50.00 8,582 8,582 7.88 7.88 725.71 725.71 0.04 0.04 85 85 3.41 3.41 2,281.33 2,281.33 0.04 0.04 314.36 314.36
2 50.00 100.00 6,454 15,036 5.93 13.81 801.12 1,526.84 0.04 0.08 114 199 4.57 7.97 3,557.99 5,839.32 0.07 0.11 444.13 382.45
3 100.00 200.00 11,424 26,460 10.49 24.30 2,354.66 3,881.50 0.12 0.20 243 442 9.74 17.71 5,116.42 10,955.73 0.09 0.20 217.29 282.26
4 200.00 300.00 8,346 34,806 7.67 31.97 2,571.24 6,452.74 0.13 0.33 307 749 12.30 30.01 15,010.16 25,965.89 0.28 0.48 583.77 402.40
5 300.00 500.00 11,685 46,491 10.73 42.70 5,470.01 11,922.75 0.28 0.61 375 1,124 15.02 45.03 36,183.32 62,149.21 0.67 1.14 661.49 521.27
6 500.00 750.00 12,170 58,661 11.18 53.88 8,906.03 20,828.78 0.46 1.07 291 1,415 11.66 56.69 48,440.84 110,590.05 0.89 2.03 543.91 530.95
7 750.00 1,000.00 8,359 67,020 7.68 61.56 8,388.53 29,217.31 0.43 1.50 134 1,549 5.37 62.06 19,541.41 130,131.45 0.36 2.39 232.95 445.39
8 1,000.00 1,500.00 9,657 76,677 8.87 70.43 13,333.29 42,550.60 0.68 2.19 145 1,694 5.81 67.87 29,550.59 159,682.04 0.54 2.94 221.63 375.28
9 1,500.00 2,000.00 5,074 81,751 4.66 75.09 10,008.71 52,559.31 0.51 2.70 82 1,776 3.29 71.15 25,775.06 185,457.10 0.47 3.41 257.53 352.85
10 2,000.00 2,500.00 3,770 85,521 3.46 78.55 9,715.82 62,275.13 0.50 3.20 60 1,836 2.40 73.56 28,394.53 213,851.63 0.52 3.93 292.25 343.40
11 2,500.00 3,000.00 2,400 87,921 2.20 80.75 7,524.22 69,799.36 0.39 3.59 28 1,864 1.12 74.68 16,854.82 230,706.45 0.31 4.24 224.01 330.53
12 3,000.00 4,000.00 3,512 91,433 3.23 83.98 13,873.13 83,672.49 0.71 4.30 77 1,941 3.08 77.76 85,498.08 316,204.53 1.57 5.81 616.29 377.91
13 4,000.00 5,000.00 2,109 93,542 1.94 85.92 10,805.38 94,477.86 0.56 4.85 41 1,982 1.64 79.41 21,848.28 338,052.81 0.40 6.22 202.20 357.81
14 5,000.00 7,500.00 3,565 97,107 3.27 89.19 24,528.28 119,006.14 1.26 6.11 64 2,046 2.56 81.97 34,511.42 372,564.24 0.63 6.85 140.70 313.06
15 7,500.00 10,000.00 1,806 98,913 1.66 90.85 17,467.08 136,473.22 0.90 7.01 79 2,125 3.17 85.14 92,685.62 465,249.85 1.70 8.55 530.63 340.91
16 10,000.00 20,000.00 3,569 102,482 3.28 94.13 55,573.99 192,047.22 2.85 9.87 131 2,256 5.25 90.38 485,880.12 951,129.98 8.93 17.49 874.29 495.26
17 20,000.00 50,000.00 3,030 105,512 2.78 96.91 104,725.87 296,773.09 5.38 15.24 67 2,323 2.68 93.07 354,886.13 1,306,016.10 6.53 24.01 338.87 440.07
18 50,000.00 100,000.00 1,350 106,862 1.24 98.15 109,161.13 405,934.21 5.61 20.85 33 2,356 1.32 94.39 33,038.21 1,339,054.31 0.61 24.62 30.27 329.87
19 100,000.00 500,000.00 1,582 108,444 1.45 99.60 387,034.45 792,968.66 19.88 40.73 106 2,462 4.25 98.64 3,038,201.30 4,377,255.61 55.86 80.49 785.00 552.01
20 500,000.00 UP 432 108,876 0.40 100.00 870,294.43 1,663,263.09 44.71 85.44 29 2,491 1.16 99.80 733,177.31 5,110,432.92 13.48 93.97 84.24 307.25
283,441.09 1,946,704.18 14.56 100.00 5 2496 0.20 100.00 328,054.47 5,438,487.39 6.03 100.00 115.74 279.37
*) Multilocation = risiko multi lokasi yang karena kurang lengkapnya data yang kami terima, risiko tersebut tidak dapat kami identifikasi sebagai any one risk
30/06/2011
5/04/2012
01/01/2009
* ) Multilocation
FROM TOPERCENTAGEPERCENTAGE PERCENTAGE F
∑(l)PERCENTAGE
NUMBER OF RISKS
f PERCENTAGE RP ∑(p)
rp RP ∑(h)
INCURRED CLAIM (In Million Rp.)
PT. Asuransi MAIPARK Indonesia
RISK & LOSS PROFILE
CLAIM FREQUENCY LOSS RATIO
BAND f F ∑(d)
SUM INSURED (BAND) (In Million Rp.)
rp
GROSS PREMIUM (In Million Rp.)
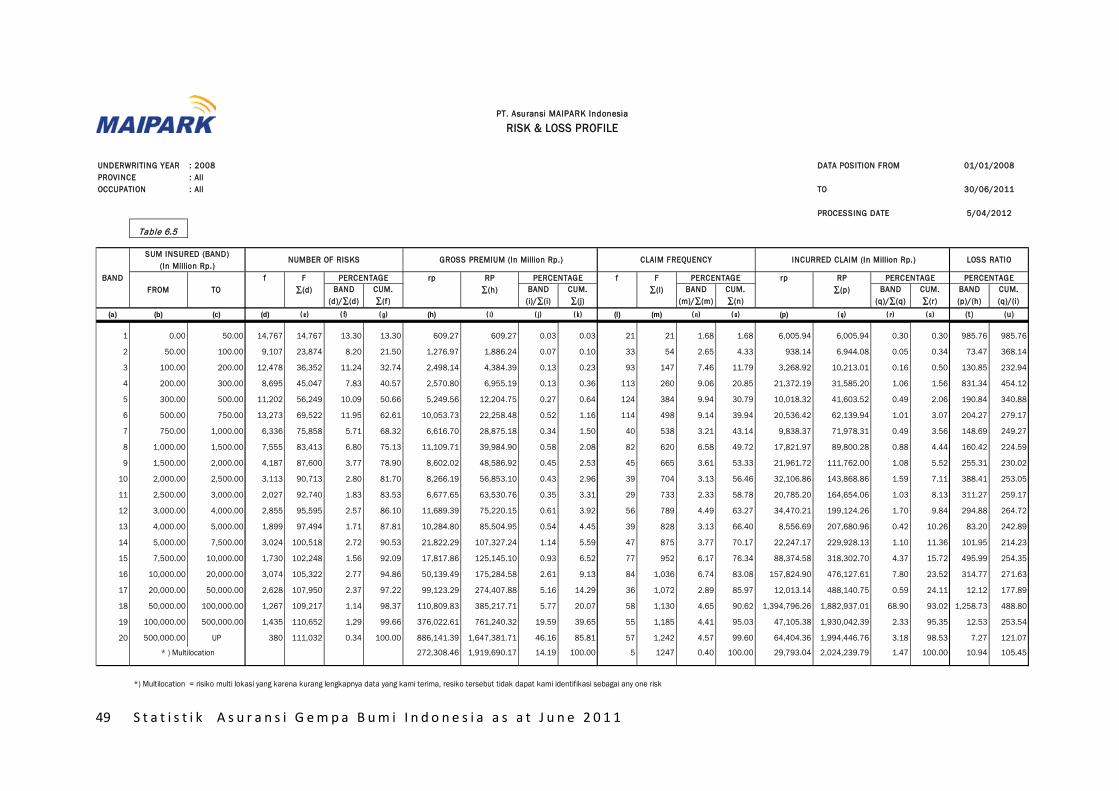
49 S t a t i s t i k A s u r a n s i G e m p a B u m i I n d o n e s i a a s a t J u n e 2 0 1 1
UNDERWRITING YEAR : 2008 DATA POSITION FROMPROVINCE : AllOCCUPATION : All TO
PROCESSING DATE
Table 6.5
BAND (d)/∑(d)
CUM. ∑(f)
BAND (i)/∑(i)
CUM. ∑(j)
BAND (m)/∑(m)
CUM. ∑(n)
BAND (q)/∑(q)
CUM. ∑(r)
BAND (p)/(h)
CUM. (q)/(i)
(a) (b) (c) (d) ( e) ( f) ( g) (h) ( i) ( j) ( k) (l) (m) ( n) ( o) (p) ( q) ( r) ( s) (t ) (u)
1 0.00 50.00 14,767 14,767 13.30 13.30 609.27 609.27 0.03 0.03 21 21 1.68 1.68 6,005.94 6,005.94 0.30 0.30 985.76 985.76
2 50.00 100.00 9,107 23,874 8.20 21.50 1,276.97 1,886.24 0.07 0.10 33 54 2.65 4.33 938.14 6,944.08 0.05 0.34 73.47 368.14
3 100.00 200.00 12,478 36,352 11.24 32.74 2,498.14 4,384.39 0.13 0.23 93 147 7.46 11.79 3,268.92 10,213.01 0.16 0.50 130.85 232.94
4 200.00 300.00 8,695 45,047 7.83 40.57 2,570.80 6,955.19 0.13 0.36 113 260 9.06 20.85 21,372.19 31,585.20 1.06 1.56 831.34 454.12
5 300.00 500.00 11,202 56,249 10.09 50.66 5,249.56 12,204.75 0.27 0.64 124 384 9.94 30.79 10,018.32 41,603.52 0.49 2.06 190.84 340.88
6 500.00 750.00 13,273 69,522 11.95 62.61 10,053.73 22,258.48 0.52 1.16 114 498 9.14 39.94 20,536.42 62,139.94 1.01 3.07 204.27 279.17
7 750.00 1,000.00 6,336 75,858 5.71 68.32 6,616.70 28,875.18 0.34 1.50 40 538 3.21 43.14 9,838.37 71,978.31 0.49 3.56 148.69 249.27
8 1,000.00 1,500.00 7,555 83,413 6.80 75.13 11,109.71 39,984.90 0.58 2.08 82 620 6.58 49.72 17,821.97 89,800.28 0.88 4.44 160.42 224.59
9 1,500.00 2,000.00 4,187 87,600 3.77 78.90 8,602.02 48,586.92 0.45 2.53 45 665 3.61 53.33 21,961.72 111,762.00 1.08 5.52 255.31 230.02
10 2,000.00 2,500.00 3,113 90,713 2.80 81.70 8,266.19 56,853.10 0.43 2.96 39 704 3.13 56.46 32,106.86 143,868.86 1.59 7.11 388.41 253.05
11 2,500.00 3,000.00 2,027 92,740 1.83 83.53 6,677.65 63,530.76 0.35 3.31 29 733 2.33 58.78 20,785.20 164,654.06 1.03 8.13 311.27 259.17
12 3,000.00 4,000.00 2,855 95,595 2.57 86.10 11,689.39 75,220.15 0.61 3.92 56 789 4.49 63.27 34,470.21 199,124.26 1.70 9.84 294.88 264.72
13 4,000.00 5,000.00 1,899 97,494 1.71 87.81 10,284.80 85,504.95 0.54 4.45 39 828 3.13 66.40 8,556.69 207,680.96 0.42 10.26 83.20 242.89
14 5,000.00 7,500.00 3,024 100,518 2.72 90.53 21,822.29 107,327.24 1.14 5.59 47 875 3.77 70.17 22,247.17 229,928.13 1.10 11.36 101.95 214.23
15 7,500.00 10,000.00 1,730 102,248 1.56 92.09 17,817.86 125,145.10 0.93 6.52 77 952 6.17 76.34 88,374.58 318,302.70 4.37 15.72 495.99 254.35
16 10,000.00 20,000.00 3,074 105,322 2.77 94.86 50,139.49 175,284.58 2.61 9.13 84 1,036 6.74 83.08 157,824.90 476,127.61 7.80 23.52 314.77 271.63
17 20,000.00 50,000.00 2,628 107,950 2.37 97.22 99,123.29 274,407.88 5.16 14.29 36 1,072 2.89 85.97 12,013.14 488,140.75 0.59 24.11 12.12 177.89
18 50,000.00 100,000.00 1,267 109,217 1.14 98.37 110,809.83 385,217.71 5.77 20.07 58 1,130 4.65 90.62 1,394,796.26 1,882,937.01 68.90 93.02 1,258.73 488.80
19 100,000.00 500,000.00 1,435 110,652 1.29 99.66 376,022.61 761,240.32 19.59 39.65 55 1,185 4.41 95.03 47,105.38 1,930,042.39 2.33 95.35 12.53 253.54
20 500,000.00 UP 380 111,032 0.34 100.00 886,141.39 1,647,381.71 46.16 85.81 57 1,242 4.57 99.60 64,404.36 1,994,446.76 3.18 98.53 7.27 121.07
272,308.46 1,919,690.17 14.19 100.00 5 1247 0.40 100.00 29,793.04 2,024,239.79 1.47 100.00 10.94 105.45
*) Multilocation = risiko multi lokasi yang karena kurang lengkapnya data yang kami terima, resiko tersebut tidak dapat kami identifikasi sebagai any one risk
PT. Asuransi MAIPARK Indonesia
RISK & LOSS PROFILE
CLAIM FREQUENCY LOSS RATIO
BAND f F ∑(d)
SUM INSURED (BAND) (In Million Rp.)
rp
GROSS PREMIUM (In Million Rp.)
PERCENTAGE
NUMBER OF RISKS
f PERCENTAGE RP ∑(p)
rp RP ∑(h)
INCURRED CLAIM (In Million Rp.)
30/06/2011
5/04/2012
01/01/2008
* ) Multilocation
FROM TOPERCENTAGEPERCENTAGE PERCENTAGE F
∑(l)

50 S t a t i s t i k A s u r a n s i G e m p a B u m i I n d o n e s i a a s a t J u n e 2 0 1 1
UNDERWRITING YEAR : 2007 DATA POSITION FROMPROVINCE : AllOCCUPATION : All TO
PROCESSING DATE
Table 6.6
BAND (d)/∑(d)
CUM. ∑(f)
BAND (i)/∑(i)
CUM. ∑(j)
BAND (m)/∑(m)
CUM. ∑(n)
BAND (q)/∑(q)
CUM. ∑(r)
BAND (p)/(h)
CUM. (q)/(i)
(a) (b) (c) (d) ( e) ( f) ( g) (h) ( i) ( j) ( k) (l) (m) ( n) ( o) (p) ( q) ( r) ( s) (t ) (u)
1 0.00 50.00 6,826 6,826 8.22 8.22 250.67 250.67 0.01 0.01 3 3 0.80 0.80 62.89 62.89 0.03 0.03 25.09 25.09
2 50.00 100.00 4,197 11,023 5.06 13.28 445.98 696.64 0.02 0.04 5 8 1.34 2.14 66.34 129.23 0.03 0.05 14.87 18.55
3 100.00 200.00 8,968 19,991 10.80 24.08 1,744.54 2,441.18 0.09 0.13 19 27 5.08 7.22 255.56 384.79 0.10 0.15 14.65 15.76
4 200.00 300.00 6,970 26,961 8.40 32.48 1,998.28 4,439.46 0.11 0.24 28 55 7.49 14.71 641.50 1,026.29 0.26 0.41 32.10 23.12
5 300.00 500.00 9,505 36,466 11.45 43.93 4,353.37 8,792.83 0.23 0.47 64 119 17.11 31.82 2,172.63 3,198.93 0.87 1.29 49.91 36.38
6 500.00 750.00 8,964 45,430 10.80 54.73 6,593.71 15,386.54 0.35 0.83 41 160 10.96 42.78 1,955.28 5,154.20 0.79 2.08 29.65 33.50
7 750.00 1,000.00 4,614 50,044 5.56 60.29 4,758.72 20,145.26 0.26 1.08 25 185 6.68 49.47 620.53 5,774.73 0.25 2.33 13.04 28.67
8 1,000.00 1,500.00 7,993 58,037 9.63 69.91 10,297.97 30,443.23 0.55 1.64 34 219 9.09 58.56 1,099.17 6,873.91 0.44 2.77 10.67 22.58
9 1,500.00 2,000.00 3,756 61,793 4.52 74.44 7,510.00 37,953.23 0.40 2.04 15 234 4.01 62.57 1,428.92 8,302.83 0.58 3.34 19.03 21.88
10 2,000.00 2,500.00 2,771 64,564 3.34 77.78 7,149.23 45,102.46 0.38 2.43 12 246 3.21 65.78 778.88 9,081.70 0.31 3.66 10.89 20.14
11 2,500.00 3,000.00 1,830 66,394 2.20 79.98 5,861.27 50,963.73 0.32 2.74 8 254 2.14 67.91 1,112.58 10,194.28 0.45 4.11 18.98 20.00
12 3,000.00 4,000.00 2,591 68,985 3.12 83.10 10,507.69 61,471.42 0.57 3.31 10 264 2.67 70.59 3,021.17 13,215.45 1.22 5.32 28.75 21.50
13 4,000.00 5,000.00 1,714 70,699 2.06 85.17 8,987.35 70,458.77 0.48 3.79 11 275 2.94 73.53 1,431.65 14,647.10 0.58 5.90 15.93 20.79
14 5,000.00 7,500.00 2,747 73,446 3.31 88.48 19,226.04 89,684.82 1.03 4.83 11 286 2.94 76.47 2,632.77 17,279.87 1.06 6.96 13.69 19.27
15 7,500.00 10,000.00 1,657 75,103 2.00 90.47 16,376.56 106,061.38 0.88 5.71 1 287 0.27 76.74 37.93 17,317.80 0.02 6.97 0.23 16.33
16 10,000.00 20,000.00 2,700 77,803 3.25 93.73 43,570.10 149,631.49 2.34 8.05 11 298 2.94 79.68 2,286.51 19,604.30 0.92 7.89 5.25 13.10
17 20,000.00 50,000.00 2,414 80,217 2.91 96.63 86,305.62 235,937.11 4.64 12.70 23 321 6.15 85.83 13,524.85 33,129.15 5.45 13.34 15.67 14.04
18 50,000.00 100,000.00 1,216 81,433 1.46 98.10 99,359.27 335,296.38 5.35 18.04 14 335 3.74 89.57 6,035.30 39,164.46 2.43 15.77 6.07 11.68
19 100,000.00 500,000.00 1,228 82,661 1.48 99.58 308,102.30 643,398.68 16.58 34.63 24 359 6.42 95.99 5,226.26 44,390.72 2.10 17.88 1.70 6.90
20 500,000.00 UP 350 83,011 0.42 100.00 890,399.07 1,533,797.75 47.92 82.54 11 370 2.94 98.93 153,544.66 197,935.38 61.83 79.71 17.24 12.90
324,377.15 1,858,174.90 17.46 100.00 4 374 1.07 100.00 50,387.40 248,322.77 20.29 100.00 15.53 13.36
*) Multilocation = risiko multi lokasi yang karena kurang lengkapnya data yang kami terima, risiko tersebut tidak dapat kami identifikasi sebagai any one risk
PT. Asuransi MAIPARK Indonesia
RISK & LOSS PROFILE
CLAIM FREQUENCY LOSS RATIO
BAND f F ∑(d)
SUM INSURED (BAND) (In Million Rp.)
rp
GROSS PREMIUM (In Million Rp.)
PERCENTAGE
NUMBER OF RISKS
f PERCENTAGE RP ∑(p)
rp RP ∑(h)
INCURRED CLAIM (In Million Rp.)
30/06/2011
5/04/2012
01/01/2007
* ) Multilocation
FROM TOPERCENTAGEPERCENTAGE PERCENTAGE F
∑(l)
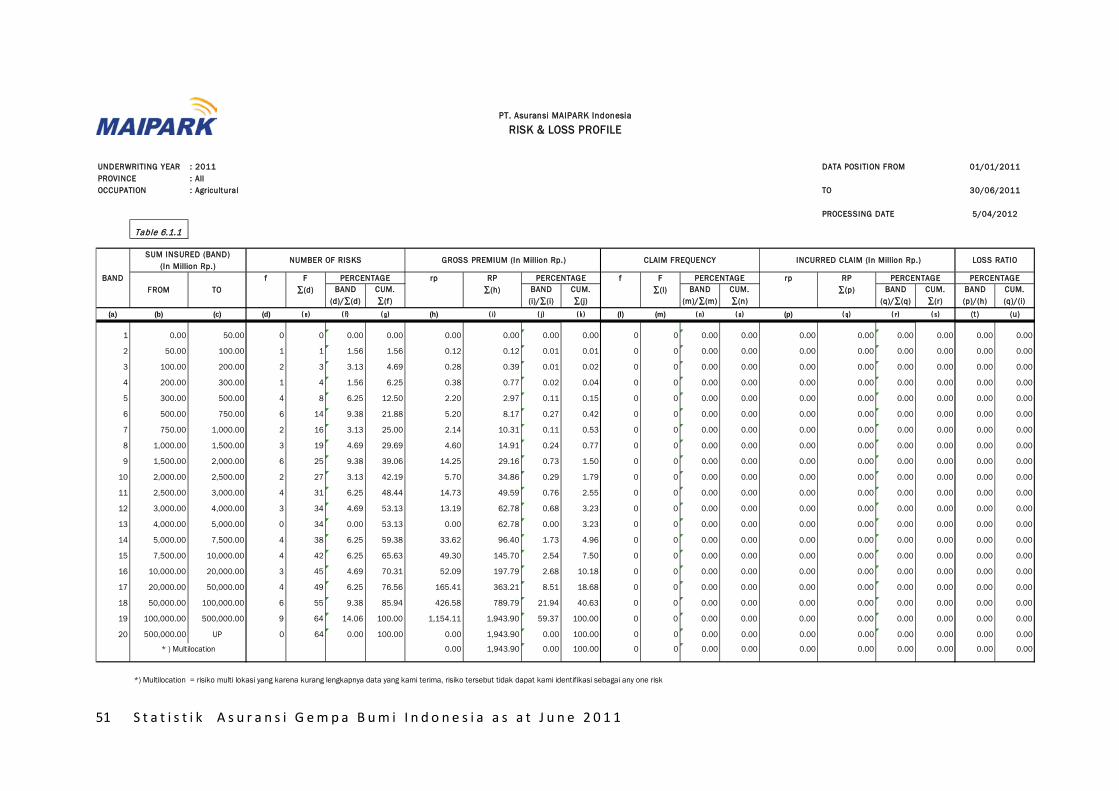
51 S t a t i s t i k A s u r a n s i G e m p a B u m i I n d o n e s i a a s a t J u n e 2 0 1 1
UNDERWRITING YEAR : 2011 DATA POSITION FROMPROVINCE : AllOCCUPATION : Agricultural TO
PROCESSING DATE
Table 6.1.1
BAND (d)/∑(d)
CUM. ∑(f)
BAND (i)/∑(i)
CUM. ∑(j)
BAND (m)/∑(m)
CUM. ∑(n)
BAND (q)/∑(q)
CUM. ∑(r)
BAND (p)/(h)
CUM. (q)/(i)
(a) (b) (c) (d) ( e) ( f) ( g) (h) ( i) ( j) ( k) (l) (m) ( n) ( o) (p) ( q) ( r) ( s) (t ) (u)
1 0.00 50.00 0 0 0.00 0.00 0.00 0.00 0.00 0.00 0 0 0.00 0.00 0.00 0.00 0.00 0.00 0.00 0.00
2 50.00 100.00 1 1 1.56 1.56 0.12 0.12 0.01 0.01 0 0 0.00 0.00 0.00 0.00 0.00 0.00 0.00 0.00
3 100.00 200.00 2 3 3.13 4.69 0.28 0.39 0.01 0.02 0 0 0.00 0.00 0.00 0.00 0.00 0.00 0.00 0.00
4 200.00 300.00 1 4 1.56 6.25 0.38 0.77 0.02 0.04 0 0 0.00 0.00 0.00 0.00 0.00 0.00 0.00 0.00
5 300.00 500.00 4 8 6.25 12.50 2.20 2.97 0.11 0.15 0 0 0.00 0.00 0.00 0.00 0.00 0.00 0.00 0.00
6 500.00 750.00 6 14 9.38 21.88 5.20 8.17 0.27 0.42 0 0 0.00 0.00 0.00 0.00 0.00 0.00 0.00 0.00
7 750.00 1,000.00 2 16 3.13 25.00 2.14 10.31 0.11 0.53 0 0 0.00 0.00 0.00 0.00 0.00 0.00 0.00 0.00
8 1,000.00 1,500.00 3 19 4.69 29.69 4.60 14.91 0.24 0.77 0 0 0.00 0.00 0.00 0.00 0.00 0.00 0.00 0.00
9 1,500.00 2,000.00 6 25 9.38 39.06 14.25 29.16 0.73 1.50 0 0 0.00 0.00 0.00 0.00 0.00 0.00 0.00 0.00
10 2,000.00 2,500.00 2 27 3.13 42.19 5.70 34.86 0.29 1.79 0 0 0.00 0.00 0.00 0.00 0.00 0.00 0.00 0.00
11 2,500.00 3,000.00 4 31 6.25 48.44 14.73 49.59 0.76 2.55 0 0 0.00 0.00 0.00 0.00 0.00 0.00 0.00 0.00
12 3,000.00 4,000.00 3 34 4.69 53.13 13.19 62.78 0.68 3.23 0 0 0.00 0.00 0.00 0.00 0.00 0.00 0.00 0.00
13 4,000.00 5,000.00 0 34 0.00 53.13 0.00 62.78 0.00 3.23 0 0 0.00 0.00 0.00 0.00 0.00 0.00 0.00 0.00
14 5,000.00 7,500.00 4 38 6.25 59.38 33.62 96.40 1.73 4.96 0 0 0.00 0.00 0.00 0.00 0.00 0.00 0.00 0.00
15 7,500.00 10,000.00 4 42 6.25 65.63 49.30 145.70 2.54 7.50 0 0 0.00 0.00 0.00 0.00 0.00 0.00 0.00 0.00
16 10,000.00 20,000.00 3 45 4.69 70.31 52.09 197.79 2.68 10.18 0 0 0.00 0.00 0.00 0.00 0.00 0.00 0.00 0.00
17 20,000.00 50,000.00 4 49 6.25 76.56 165.41 363.21 8.51 18.68 0 0 0.00 0.00 0.00 0.00 0.00 0.00 0.00 0.00
18 50,000.00 100,000.00 6 55 9.38 85.94 426.58 789.79 21.94 40.63 0 0 0.00 0.00 0.00 0.00 0.00 0.00 0.00 0.00
19 100,000.00 500,000.00 9 64 14.06 100.00 1,154.11 1,943.90 59.37 100.00 0 0 0.00 0.00 0.00 0.00 0.00 0.00 0.00 0.00
20 500,000.00 UP 0 64 0.00 100.00 0.00 1,943.90 0.00 100.00 0 0 0.00 0.00 0.00 0.00 0.00 0.00 0.00 0.00
0.00 1,943.90 0.00 100.00 0 0 0.00 0.00 0.00 0.00 0.00 0.00 0.00 0.00
*) Multilocation = risiko multi lokasi yang karena kurang lengkapnya data yang kami terima, risiko tersebut tidak dapat kami identifikasi sebagai any one risk
PT. Asuransi MAIPARK Indonesia
RISK & LOSS PROFILE
CLAIM FREQUENCY LOSS RATIO
BAND f F ∑(d)
SUM INSURED (BAND) (In Million Rp.)
rp
GROSS PREMIUM (In Million Rp.)
PERCENTAGE
NUMBER OF RISKS
f PERCENTAGE RP ∑(p)
rp RP ∑(h)
INCURRED CLAIM (In Million Rp.)
30/06/2011
5/04/2012
01/01/2011
* ) Multilocation
FROM TOPERCENTAGEPERCENTAGE PERCENTAGE F
∑(l)

52 S t a t i s t i k A s u r a n s i G e m p a B u m i I n d o n e s i a a s a t J u n e 2 0 1 1
UNDERWRITING YEAR : 2011 DATA POSITION FROMPROVINCE : AllOCCUPATION : Commercial TO
PROCESSING DATE
Table 6.1.2
BAND (d)/∑(d)
CUM. ∑(f)
BAND (i)/∑(i)
CUM. ∑(j)
BAND (m)/∑(m)
CUM. ∑(n)
BAND (q)/∑(q)
CUM. ∑(r)
BAND (p)/(h)
CUM. (q)/(i)
(a) (b) (c) (d) ( e) ( f) ( g) (h) ( i) ( j) ( k) (l) (m) ( n) ( o) (p) ( q) ( r) ( s) (t ) (u)
1 0.00 50.00 35 35 0.69 0.69 1.82 1.82 0.00 0.00 0 0 0.00 0.00 0.00 0.00 0.00 0.00 0.00 0.00
2 50.00 100.00 45 80 0.89 1.57 7.23 9.06 0.01 0.01 0 0 0.00 0.00 0.00 0.00 0.00 0.00 0.00 0.00
3 100.00 200.00 650 730 12.79 14.36 162.11 171.16 0.24 0.25 0 0 0.00 0.00 0.00 0.00 0.00 0.00 0.00 0.00
4 200.00 300.00 376 1,106 7.40 21.76 132.08 303.24 0.19 0.44 0 0 0.00 0.00 0.00 0.00 0.00 0.00 0.00 0.00
5 300.00 500.00 973 2,079 19.14 40.90 531.47 834.71 0.77 1.22 0 0 0.00 0.00 0.00 0.00 0.00 0.00 0.00 0.00
6 500.00 750.00 1,321 3,400 25.99 66.89 1,026.39 1,861.11 1.50 2.71 0 0 0.00 0.00 0.00 0.00 0.00 0.00 0.00 0.00
7 750.00 1,000.00 428 3,828 8.42 75.31 487.32 2,348.43 0.71 3.42 0 0 0.00 0.00 0.00 0.00 0.00 0.00 0.00 0.00
8 1,000.00 1,500.00 272 4,100 5.35 80.66 426.00 2,774.43 0.62 4.04 0 0 0.00 0.00 0.00 0.00 0.00 0.00 0.00 0.00
9 1,500.00 2,000.00 99 4,199 1.95 82.61 218.68 2,993.11 0.32 4.36 0 0 0.00 0.00 0.00 0.00 0.00 0.00 0.00 0.00
10 2,000.00 2,500.00 55 4,254 1.08 83.69 153.31 3,146.42 0.22 4.59 0 0 0.00 0.00 0.00 0.00 0.00 0.00 0.00 0.00
11 2,500.00 3,000.00 40 4,294 0.79 84.48 139.45 3,285.87 0.20 4.79 0 0 0.00 0.00 0.00 0.00 0.00 0.00 0.00 0.00
12 3,000.00 4,000.00 108 4,402 2.12 86.60 493.93 3,779.80 0.72 5.51 0 0 0.00 0.00 0.00 0.00 0.00 0.00 0.00 0.00
13 4,000.00 5,000.00 124 4,526 2.44 89.04 681.26 4,461.05 0.99 6.50 0 0 0.00 0.00 0.00 0.00 0.00 0.00 0.00 0.00
14 5,000.00 7,500.00 111 4,637 2.18 91.23 772.20 5,233.25 1.13 7.63 0 0 0.00 0.00 0.00 0.00 0.00 0.00 0.00 0.00
15 7,500.00 10,000.00 48 4,685 0.94 92.17 570.27 5,803.52 0.83 8.46 0 0 0.00 0.00 0.00 0.00 0.00 0.00 0.00 0.00
16 10,000.00 20,000.00 110 4,795 2.16 94.33 2,055.13 7,858.65 3.00 11.46 0 0 0.00 0.00 0.00 0.00 0.00 0.00 0.00 0.00
17 20,000.00 50,000.00 110 4,905 2.16 96.50 4,336.13 12,194.78 6.32 17.78 0 0 0.00 0.00 0.00 0.00 0.00 0.00 0.00 0.00
18 50,000.00 100,000.00 69 4,974 1.36 97.86 5,891.30 18,086.08 8.59 26.37 0 0 0.00 0.00 0.00 0.00 0.00 0.00 0.00 0.00
19 100,000.00 500,000.00 86 5,060 1.69 99.55 22,600.28 40,686.36 32.95 59.32 0 0 0.00 0.00 0.00 0.00 0.00 0.00 0.00 0.00
20 500,000.00 UP 23 5,083 0.45 100.00 27,904.98 68,591.34 40.68 100.00 0 0 0.00 0.00 0.00 0.00 0.00 0.00 0.00 0.00
0.00 68,591.34 0.00 100.00 0 0 0.00 0.00 0.00 0.00 0.00 0.00 0.00 0.00
*) Multilocation = risiko multi lokasi yang karena kurang lengkapnya data yang kami terima, risiko tersebut tidak dapat kami identifikasi sebagai any one risk
30/06/2011
5/04/2012
01/01/2011
* ) Multilocation
FROM TOPERCENTAGEPERCENTAGE PERCENTAGE F
∑(l)PERCENTAGE
NUMBER OF RISKS
f PERCENTAGE RP ∑(p)
rp RP ∑(h)
INCURRED CLAIM (In Million Rp.)
PT. Asuransi MAIPARK Indonesia
RISK & LOSS PROFILE
CLAIM FREQUENCY LOSS RATIO
BAND f F ∑(d)
SUM INSURED (BAND) (In Million Rp.)
rp
GROSS PREMIUM (In Million Rp.)

53 S t a t i s t i k A s u r a n s i G e m p a B u m i I n d o n e s i a a s a t J u n e 2 0 1 1
UNDERWRITING YEAR : 2011 DATA POSITION FROMPROVINCE : AllOCCUPATION : Industrial TO
PROCESSING DATE
Table 6.1.3
BAND (d)/∑(d)
CUM. ∑(f)
BAND (i)/∑(i)
CUM. ∑(j)
BAND (m)/∑(m)
CUM. ∑(n)
BAND (q)/∑(q)
CUM. ∑(r)
BAND (p)/(h)
CUM. (q)/(i)
(a) (b) (c) (d) ( e) ( f) ( g) (h) ( i) ( j) ( k) (l) (m) ( n) ( o) (p) ( q) ( r) ( s) (t ) (u)
1 0.00 50.00 1 1 0.11 0.11 35.97 35.97 0.01 0.01 0 0 0.00 0.00 0.00 0.00 0.00 0.00 0.00 0.00
2 50.00 100.00 3 4 0.32 0.43 0.34 36.32 0.00 0.01 0 0 0.00 0.00 0.00 0.00 0.00 0.00 0.00 0.00
3 100.00 200.00 4 8 0.43 0.86 0.74 37.06 0.00 0.01 0 0 0.00 0.00 0.00 0.00 0.00 0.00 0.00 0.00
4 200.00 300.00 6 14 0.64 1.50 1.41 38.47 0.00 0.01 0 0 0.00 0.00 0.00 0.00 0.00 0.00 0.00 0.00
5 300.00 500.00 12 26 1.29 2.79 6.13 44.60 0.00 0.02 0 0 0.00 0.00 0.00 0.00 0.00 0.00 0.00 0.00
6 500.00 750.00 10 36 1.07 3.86 8.44 53.04 0.00 0.02 0 0 0.00 0.00 0.00 0.00 0.00 0.00 0.00 0.00
7 750.00 1,000.00 14 50 1.50 5.36 17.40 70.44 0.01 0.03 0 0 0.00 0.00 0.00 0.00 0.00 0.00 0.00 0.00
8 1,000.00 1,500.00 24 74 2.57 7.93 34.40 104.85 0.01 0.04 0 0 0.00 0.00 0.00 0.00 0.00 0.00 0.00 0.00
9 1,500.00 2,000.00 14 88 1.50 9.43 29.46 134.31 0.01 0.05 0 0 0.00 0.00 0.00 0.00 0.00 0.00 0.00 0.00
10 2,000.00 2,500.00 16 104 1.71 11.15 47.83 182.13 0.02 0.07 0 0 0.00 0.00 0.00 0.00 0.00 0.00 0.00 0.00
11 2,500.00 3,000.00 13 117 1.39 12.54 49.97 232.11 0.02 0.09 0 0 0.00 0.00 0.00 0.00 0.00 0.00 0.00 0.00
12 3,000.00 4,000.00 33 150 3.54 16.08 128.79 360.90 0.05 0.14 0 0 0.00 0.00 0.00 0.00 0.00 0.00 0.00 0.00
13 4,000.00 5,000.00 25 175 2.68 18.76 144.38 505.28 0.06 0.20 0 0 0.00 0.00 0.00 0.00 0.00 0.00 0.00 0.00
14 5,000.00 7,500.00 68 243 7.29 26.05 494.09 999.37 0.19 0.39 0 0 0.00 0.00 0.00 0.00 0.00 0.00 0.00 0.00
15 7,500.00 10,000.00 44 287 4.72 30.76 463.14 1,462.52 0.18 0.57 0 0 0.00 0.00 0.00 0.00 0.00 0.00 0.00 0.00
16 10,000.00 20,000.00 119 406 12.75 43.52 1,976.93 3,439.44 0.76 1.33 0 0 0.00 0.00 0.00 0.00 0.00 0.00 0.00 0.00
17 20,000.00 50,000.00 156 562 16.72 60.24 5,858.91 9,298.35 2.27 3.60 0 0 0.00 0.00 0.00 0.00 0.00 0.00 0.00 0.00
18 50,000.00 100,000.00 101 663 10.83 71.06 9,323.37 18,621.73 3.61 7.20 0 0 0.00 0.00 0.00 0.00 0.00 0.00 0.00 0.00
19 100,000.00 500,000.00 188 851 20.15 91.21 50,945.55 69,567.28 19.71 26.91 0 0 0.00 0.00 0.00 0.00 0.00 0.00 0.00 0.00
20 500,000.00 UP 82 933 8.79 100.00 188,933.85 258,501.13 73.09 100.00 0 0 0.00 0.00 0.00 0.00 0.00 0.00 0.00 0.00
0.00 258,501.13 0.00 100.00 0 0 0.00 0.00 0.00 0.00 0.00 0.00 0.00 0.00
*) Multilocation = risiko multi lokasi yang karena kurang lengkapnya data yang kami terima, risiko tersebut tidak dapat kami identifikasi sebagai any one risk
30/06/2011
5/04/2012
01/01/2011
* ) Multilocation
FROM TOPERCENTAGEPERCENTAGE PERCENTAGE F
∑(l)PERCENTAGE
NUMBER OF RISKS
f PERCENTAGE RP ∑(p)
rp RP ∑(h)
INCURRED CLAIM (In Million Rp.)
PT. Asuransi MAIPARK Indonesia
RISK & LOSS PROFILE
CLAIM FREQUENCY LOSS RATIO
BAND f F ∑(d)
SUM INSURED (BAND) (In Million Rp.)
rp
GROSS PREMIUM (In Million Rp.)

54 S t a t i s t i k A s u r a n s i G e m p a B u m i I n d o n e s i a a s a t J u n e 2 0 1 1
UNDERWRITING YEAR : 2011 DATA POSITION FROMPROVINCE : AllOCCUPATION : Residential TO
PROCESSING DATE
Table 6.1.4
BAND (d)/∑(d)
CUM. ∑(f)
BAND (i)/∑(i)
CUM. ∑(j)
BAND (m)/∑(m)
CUM. ∑(n)
BAND (q)/∑(q)
CUM. ∑(r)
BAND (p)/(h)
CUM. (q)/(i)
(a) (b) (c) (d) ( e) ( f) ( g) (h) ( i) ( j) ( k) (l) (m) ( n) ( o) (p) ( q) ( r) ( s) (t ) (u)
1 0.00 50.00 100 100 12.89 12.89 4.24 4.24 0.00 0.00 0 0 0.00 0.00 0.00 0.00 0.00 0.00 0.00 0.00
2 50.00 100.00 79 179 10.18 23.07 11.92 16.16 0.01 0.01 0 0 0.00 0.00 0.00 0.00 0.00 0.00 0.00 0.00
3 100.00 200.00 85 264 10.95 34.02 32.24 48.39 0.03 0.04 0 0 0.00 0.00 0.00 0.00 0.00 0.00 0.00 0.00
4 200.00 300.00 34 298 4.38 38.40 13.80 62.19 0.01 0.05 0 0 0.00 0.00 0.00 0.00 0.00 0.00 0.00 0.00
5 300.00 500.00 60 358 7.73 46.13 39.05 101.24 0.03 0.08 0 0 0.00 0.00 0.00 0.00 0.00 0.00 0.00 0.00
6 500.00 750.00 54 412 6.96 53.09 41.26 142.50 0.03 0.12 0 0 0.00 0.00 0.00 0.00 0.00 0.00 0.00 0.00
7 750.00 1,000.00 25 437 3.22 56.31 28.06 170.55 0.02 0.14 0 0 0.00 0.00 0.00 0.00 0.00 0.00 0.00 0.00
8 1,000.00 1,500.00 37 474 4.77 61.08 59.16 229.71 0.05 0.19 0 0 0.00 0.00 0.00 0.00 0.00 0.00 0.00 0.00
9 1,500.00 2,000.00 39 513 5.03 66.11 93.51 323.22 0.08 0.26 0 0 0.00 0.00 0.00 0.00 0.00 0.00 0.00 0.00
10 2,000.00 2,500.00 21 534 2.71 68.81 69.21 392.43 0.06 0.32 0 0 0.00 0.00 0.00 0.00 0.00 0.00 0.00 0.00
11 2,500.00 3,000.00 14 548 1.80 70.62 49.84 442.27 0.04 0.36 0 0 0.00 0.00 0.00 0.00 0.00 0.00 0.00 0.00
12 3,000.00 4,000.00 23 571 2.96 73.58 107.03 549.30 0.09 0.44 0 0 0.00 0.00 0.00 0.00 0.00 0.00 0.00 0.00
13 4,000.00 5,000.00 16 587 2.06 75.64 97.14 646.44 0.08 0.52 0 0 0.00 0.00 0.00 0.00 0.00 0.00 0.00 0.00
14 5,000.00 7,500.00 18 605 2.32 77.96 140.22 786.66 0.11 0.63 0 0 0.00 0.00 0.00 0.00 0.00 0.00 0.00 0.00
15 7,500.00 10,000.00 13 618 1.68 79.64 181.18 967.84 0.15 0.78 0 0 0.00 0.00 0.00 0.00 0.00 0.00 0.00 0.00
16 10,000.00 20,000.00 24 642 3.09 82.73 400.16 1,368.01 0.32 1.10 0 0 0.00 0.00 0.00 0.00 0.00 0.00 0.00 0.00
17 20,000.00 50,000.00 35 677 4.51 87.24 1,555.12 2,923.12 1.26 2.36 0 0 0.00 0.00 0.00 0.00 0.00 0.00 0.00 0.00
18 50,000.00 100,000.00 21 698 2.71 89.95 2,077.12 5,000.24 1.68 4.04 0 0 0.00 0.00 0.00 0.00 0.00 0.00 0.00 0.00
19 100,000.00 500,000.00 52 750 6.70 96.65 17,192.88 22,193.12 13.88 17.91 0 0 0.00 0.00 0.00 0.00 0.00 0.00 0.00 0.00
20 500,000.00 UP 26 776 3.35 100.00 101,693.38 123,886.50 82.09 100.00 0 0 0.00 0.00 0.00 0.00 0.00 0.00 0.00 0.00
0.00 123,886.50 0.00 100.00 0 0 0.00 0.00 0.00 0.00 0.00 0.00 0.00 0.00
*) Multilocation = risiko multi lokasi yang karena kurang lengkapnya data yang kami terima, risiko tersebut tidak dapat kami identifikasi sebagai any one risk
30/06/2011
5/04/2012
01/01/2011
* ) Multilocation
FROM TOPERCENTAGEPERCENTAGE PERCENTAGE F
∑(l)PERCENTAGE
NUMBER OF RISKS
f PERCENTAGE RP ∑(p)
rp RP ∑(h)
INCURRED CLAIM (In Million Rp.)
PT. Asuransi MAIPARK Indonesia
RISK & LOSS PROFILE
CLAIM FREQUENCY LOSS RATIO
BAND f F ∑(d)
SUM INSURED (BAND) (In Million Rp.)
rp
GROSS PREMIUM (In Million Rp.)

55 S t a t i s t i k A s u r a n s i G e m p a B u m i I n d o n e s i a a s a t J u n e 2 0 1 1
UNDERWRITING YEAR : 2010 DATA POSITION FROMPROVINCE : AllOCCUPATION : Agricultural TO
PROCESSING DATE
Table 6.2.1
BAND (d)/∑(d)
CUM. ∑(f)
BAND (i)/∑(i)
CUM. ∑(j)
BAND (m)/∑(m)
CUM. ∑(n)
BAND (q)/∑(q)
CUM. ∑(r)
BAND (p)/(h)
CUM. (q)/(i)
(a) (b) (c) (d) ( e) ( f) ( g) (h) ( i) ( j) ( k) (l) (m) ( n) ( o) (p) ( q) ( r) ( s) (t ) (u)
1 0.00 50.00 1 1 0.38 0.38 0.00 0.00 0.00 0.00 0 0 0.00 0.00 0.00 0.00 0.00 0.00 0.00 0.00
2 50.00 100.00 0 1 0.00 0.38 0.00 0.00 0.00 0.00 0 0 0.00 0.00 0.00 0.00 0.00 0.00 0.00 0.00
3 100.00 200.00 8 9 3.02 3.40 1.14 1.14 0.01 0.01 0 0 0.00 0.00 0.00 0.00 0.00 0.00 0.00 0.00
4 200.00 300.00 14 23 5.28 8.68 4.71 5.85 0.02 0.03 0 0 0.00 0.00 0.00 0.00 0.00 0.00 0.00 0.00
5 300.00 500.00 8 31 3.02 11.70 3.57 9.42 0.02 0.05 0 0 0.00 0.00 0.00 0.00 0.00 0.00 0.00 0.00
6 500.00 750.00 4 35 1.51 13.21 2.75 12.18 0.01 0.06 0 0 0.00 0.00 0.00 0.00 0.00 0.00 0.00 0.00
7 750.00 1,000.00 5 40 1.89 15.09 5.33 17.50 0.03 0.08 0 0 0.00 0.00 0.00 0.00 0.00 0.00 0.00 0.00
8 1,000.00 1,500.00 19 59 7.17 22.26 30.88 48.38 0.15 0.23 0 0 0.00 0.00 0.00 0.00 0.00 0.00 0.00 0.00
9 1,500.00 2,000.00 7 66 2.64 24.91 16.10 64.49 0.08 0.31 0 0 0.00 0.00 0.00 0.00 0.00 0.00 0.00 0.00
10 2,000.00 2,500.00 9 75 3.40 28.30 27.95 92.44 0.13 0.44 0 0 0.00 0.00 0.00 0.00 0.00 0.00 0.00 0.00
11 2,500.00 3,000.00 5 80 1.89 30.19 17.07 109.51 0.08 0.53 0 0 0.00 0.00 0.00 0.00 0.00 0.00 0.00 0.00
12 3,000.00 4,000.00 12 92 4.53 34.72 46.98 156.49 0.23 0.75 0 0 0.00 0.00 0.00 0.00 0.00 0.00 0.00 0.00
13 4,000.00 5,000.00 9 101 3.40 38.11 55.88 212.37 0.27 1.02 0 0 0.00 0.00 0.00 0.00 0.00 0.00 0.00 0.00
14 5,000.00 7,500.00 22 123 8.30 46.42 123.47 335.84 0.59 1.61 0 0 0.00 0.00 0.00 0.00 0.00 0.00 0.00 0.00
15 7,500.00 10,000.00 12 135 4.53 50.94 139.35 475.19 0.67 2.28 0 0 0.00 0.00 0.00 0.00 0.00 0.00 0.00 0.00
16 10,000.00 20,000.00 19 154 7.17 58.11 347.36 822.55 1.67 3.94 0 0 0.00 0.00 0.00 0.00 0.00 0.00 0.00 0.00
17 20,000.00 50,000.00 37 191 13.96 72.08 1,393.17 2,215.72 6.68 10.63 0 0 0.00 0.00 0.00 0.00 0.00 0.00 0.00 0.00
18 50,000.00 100,000.00 30 221 11.32 83.40 2,588.30 4,804.02 12.41 23.04 0 0 0.00 0.00 0.00 0.00 0.00 0.00 0.00 0.00
19 100,000.00 500,000.00 39 260 14.72 98.11 7,563.18 12,367.20 36.27 59.31 0 0 0.00 0.00 0.00 0.00 0.00 0.00 0.00 0.00
20 500,000.00 UP 5 265 1.89 100.00 8,477.41 20,844.61 40.66 99.97 0 0 0.00 0.00 0.00 0.00 0.00 0.00 0.00 0.00
7.19 20,851.80 0.03 100.00 0 0 0.00 0.00 0.00 0.00 0.00 0.00 0.00 0.00
*) Multilocation = risiko multi lokasi yang karena kurang lengkapnya data yang kami terima, risiko tersebut tidak dapat kami identifikasi sebagai any one risk
PT. Asuransi MAIPARK Indonesia
RISK & LOSS PROFILE
CLAIM FREQUENCY LOSS RATIO
BAND f F ∑(d)
SUM INSURED (BAND) (In Million Rp.)
rp
GROSS PREMIUM (In Million Rp.)
PERCENTAGE
NUMBER OF RISKS
f PERCENTAGE RP ∑(p)
rp RP ∑(h)
INCURRED CLAIM (In Million Rp.)
30/06/2011
5/04/2012
01/01/2010
* ) Multilocation
FROM TOPERCENTAGEPERCENTAGE PERCENTAGE F
∑(l)

56 S t a t i s t i k A s u r a n s i G e m p a B u m i I n d o n e s i a a s a t J u n e 2 0 1 1
U NDERWRIT ING Y EAR : 2010 DAT A PO SIT IO N FRO MPRO VINC E : AllO C C U PAT IO N : C ommercial T O
PRO C ESSING DAT E
T able 6.2.2
B AND (d)/∑(d)
C U M. ∑(f)
B AND (i)/∑(i)
C U M. ∑(j)
B AND (m)/∑(m)
C U M. ∑(n)
B AND (q)/∑(q)
C U M. ∑(r)
B AND (p)/(h)
C U M. (q)/(i)
(a) (b) (c) (d) (e ) (f) (g ) (h) (i ) (j ) (k ) (l) (m) (n ) (o ) (p) (q ) (r) (s) (t) (u)
1 0.00 50.00 4,008 4,008 8.37 8.37 173.73 173.73 0.05 0.05 0 0 0.00 0.00 0.00 0.00 0.00 0.00 0.00 0.00
2 50.00 100.00 2,357 6,365 4.92 13.29 257.31 431.04 0.07 0.12 1 1 4.00 4.00 0.00 0.00 0.00 0.00 0.00 0.00
3 100.00 200.00 4,685 11,050 9.78 23.08 1,016.76 1,447.81 0.27 0.39 0 1 0.00 4.00 0.00 0.00 0.00 0.00 0.00 0.00
4 200.00 300.00 3,232 14,282 6.75 29.83 1,153.63 2,601.43 0.31 0.70 1 2 4.00 8.00 14.20 14.20 0.01 0.01 1.23 0.55
5 300.00 500.00 4,745 19,027 9.91 39.74 2,618.26 5,219.69 0.70 1.40 0 2 0.00 8.00 0.00 14.20 0.00 0.01 0.00 0.27
6 500.00 750.00 5,729 24,756 11.97 51.70 4,943.00 10,162.70 1.32 2.72 0 2 0.00 8.00 0.00 14.20 0.00 0.01 0.00 0.14
7 750.00 1,000.00 4,699 29,455 9.81 61.52 6,126.68 16,289.38 1.64 4.36 1 3 4.00 12.00 39.13 53.33 0.03 0.04 0.64 0.33
8 1,000.00 1,500.00 4,926 34,381 10.29 71.81 8,014.85 24,304.23 2.14 6.50 0 3 0.00 12.00 0.00 53.33 0.00 0.04 0.00 0.22
9 1,500.00 2,000.00 2,296 36,677 4.80 76.60 5,227.44 29,531.67 1.40 7.90 4 7 16.00 28.00 565.74 619.07 0.47 0.52 10.82 2.10
10 2,000.00 2,500.00 1,918 38,595 4.01 80.61 5,592.80 35,124.48 1.50 9.40 0 7 0.00 28.00 0.00 619.07 0.00 0.52 0.00 1.76
11 2,500.00 3,000.00 1,072 39,667 2.24 82.84 3,872.60 38,997.07 1.04 10.43 0 7 0.00 28.00 0.00 619.07 0.00 0.52 0.00 1.59
12 3,000.00 4,000.00 1,709 41,376 3.57 86.41 7,738.57 46,735.64 2.07 12.50 0 7 0.00 28.00 0.00 619.07 0.00 0.52 0.00 1.32
13 4,000.00 5,000.00 926 42,302 1.93 88.35 5,346.45 52,082.09 1.43 13.93 0 7 0.00 28.00 0.00 619.07 0.00 0.52 0.00 1.19
14 5,000.00 7,500.00 1,691 43,993 3.53 91.88 13,388.52 65,470.61 3.58 17.52 1 8 4.00 32.00 0.00 619.07 0.00 0.52 0.00 0.95
15 7,500.00 10,000.00 679 44,672 1.42 93.30 7,745.86 73,216.48 2.07 19.59 1 9 4.00 36.00 9.35 628.42 0.01 0.52 0.12 0.86
16 10,000.00 20,000.00 1,350 46,022 2.82 96.12 24,883.93 98,100.41 6.66 26.25 1 10 4.00 40.00 100.00 728.42 0.08 0.61 0.40 0.74
17 20,000.00 50,000.00 977 46,999 2.04 98.16 40,267.64 138,368.04 10.77 37.02 0 10 0.00 40.00 0.00 728.42 0.00 0.61 0.00 0.53
18 50,000.00 100,000.00 423 47,422 0.88 99.04 38,615.18 176,983.22 10.33 47.35 3 13 12.00 52.00 125.30 853.72 0.10 0.71 0.32 0.48
19 100,000.00 500,000.00 382 47,804 0.80 99.84 97,681.19 274,664.42 26.13 73.49 10 23 40.00 92.00 92,188.98 93,042.70 76.79 77.50 94.38 33.88
20 500,000.00 UP 77 47,881 0.16 100.00 91,863.99 366,528.40 24.58 98.06 2 25 8.00 100.00 27,005.00 120,047.70 22.50 100.00 29.40 32.757,235.87 373,764.28 1.94 100.00 0 25 0.00 100.00 0.00 120,047.70 0.00 100.00 0.00 32.12
*) Multilocation = risiko multi lokasi yang karena kurang lengkapnya data yang kami terima, risiko tersebut tidak dapat kami identifikasi sebagai any one risk
P T . A suransi MA IP A R K Indonesia
RISK & L O SS PRO FIL E
C LAIM FREQ U ENC Y LO SS RAT IO
B AND f F ∑(d)
SU M INSU RED (B AND) (In Million Rp.)
rp
G RO SS PREMIU M (In Million Rp.)
PERC ENT AG E
NU MB ER O F R ISKS
f PERC ENT AG E RP ∑(p)
rp RP ∑(h)
INC U RRED C LAIM (In Million Rp.)
30/06/2011
05/04/2012
01/01/2010
* ) Multilocation
FRO M T OPERC ENT AG EPERC ENT AG E PERC ENT AG E F
∑(l)
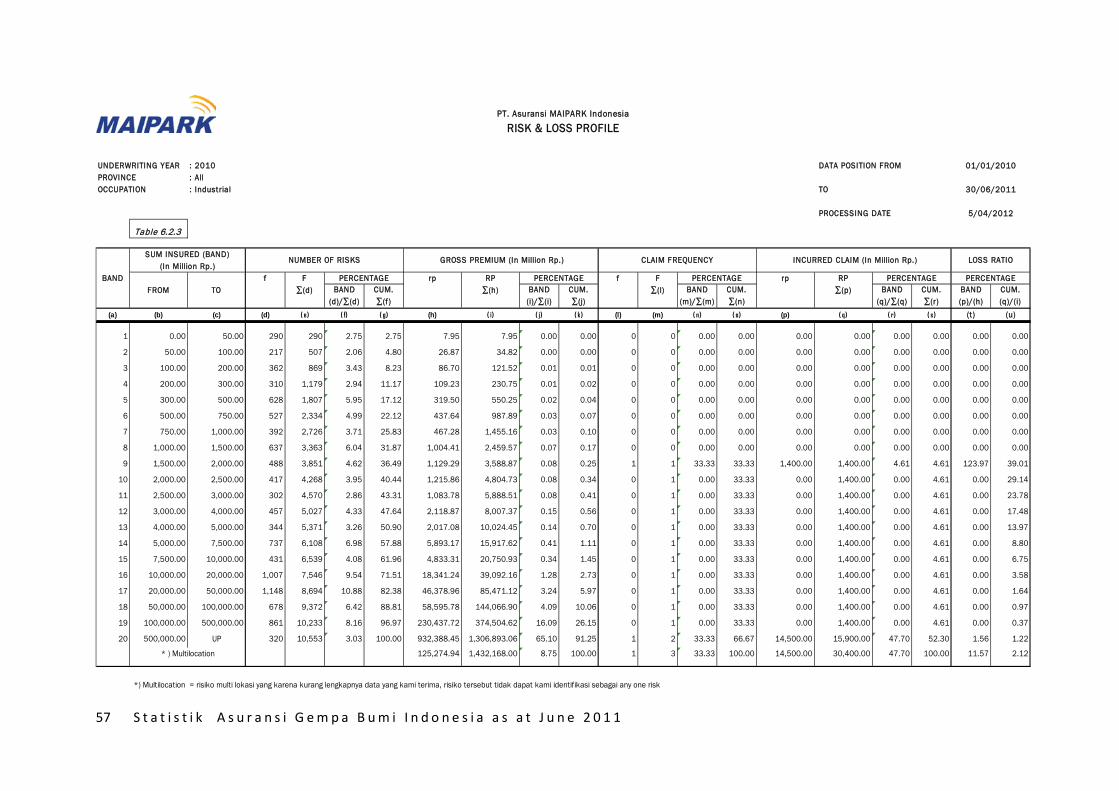
57 S t a t i s t i k A s u r a n s i G e m p a B u m i I n d o n e s i a a s a t J u n e 2 0 1 1
UNDERWRITING YEAR : 2010 DATA POSITION FROMPROVINCE : AllOCCUPATION : Industrial TO
PROCESSING DATE
Table 6.2.3
BAND (d)/∑(d)
CUM. ∑(f)
BAND (i)/∑(i)
CUM. ∑(j)
BAND (m)/∑(m)
CUM. ∑(n)
BAND (q)/∑(q)
CUM. ∑(r)
BAND (p)/(h)
CUM. (q)/(i)
(a) (b) (c) (d) ( e) ( f) ( g) (h) ( i) ( j) ( k) (l) (m) ( n) ( o) (p) ( q) ( r) ( s) (t ) (u)
1 0.00 50.00 290 290 2.75 2.75 7.95 7.95 0.00 0.00 0 0 0.00 0.00 0.00 0.00 0.00 0.00 0.00 0.00
2 50.00 100.00 217 507 2.06 4.80 26.87 34.82 0.00 0.00 0 0 0.00 0.00 0.00 0.00 0.00 0.00 0.00 0.00
3 100.00 200.00 362 869 3.43 8.23 86.70 121.52 0.01 0.01 0 0 0.00 0.00 0.00 0.00 0.00 0.00 0.00 0.00
4 200.00 300.00 310 1,179 2.94 11.17 109.23 230.75 0.01 0.02 0 0 0.00 0.00 0.00 0.00 0.00 0.00 0.00 0.00
5 300.00 500.00 628 1,807 5.95 17.12 319.50 550.25 0.02 0.04 0 0 0.00 0.00 0.00 0.00 0.00 0.00 0.00 0.00
6 500.00 750.00 527 2,334 4.99 22.12 437.64 987.89 0.03 0.07 0 0 0.00 0.00 0.00 0.00 0.00 0.00 0.00 0.00
7 750.00 1,000.00 392 2,726 3.71 25.83 467.28 1,455.16 0.03 0.10 0 0 0.00 0.00 0.00 0.00 0.00 0.00 0.00 0.00
8 1,000.00 1,500.00 637 3,363 6.04 31.87 1,004.41 2,459.57 0.07 0.17 0 0 0.00 0.00 0.00 0.00 0.00 0.00 0.00 0.00
9 1,500.00 2,000.00 488 3,851 4.62 36.49 1,129.29 3,588.87 0.08 0.25 1 1 33.33 33.33 1,400.00 1,400.00 4.61 4.61 123.97 39.01
10 2,000.00 2,500.00 417 4,268 3.95 40.44 1,215.86 4,804.73 0.08 0.34 0 1 0.00 33.33 0.00 1,400.00 0.00 4.61 0.00 29.14
11 2,500.00 3,000.00 302 4,570 2.86 43.31 1,083.78 5,888.51 0.08 0.41 0 1 0.00 33.33 0.00 1,400.00 0.00 4.61 0.00 23.78
12 3,000.00 4,000.00 457 5,027 4.33 47.64 2,118.87 8,007.37 0.15 0.56 0 1 0.00 33.33 0.00 1,400.00 0.00 4.61 0.00 17.48
13 4,000.00 5,000.00 344 5,371 3.26 50.90 2,017.08 10,024.45 0.14 0.70 0 1 0.00 33.33 0.00 1,400.00 0.00 4.61 0.00 13.97
14 5,000.00 7,500.00 737 6,108 6.98 57.88 5,893.17 15,917.62 0.41 1.11 0 1 0.00 33.33 0.00 1,400.00 0.00 4.61 0.00 8.80
15 7,500.00 10,000.00 431 6,539 4.08 61.96 4,833.31 20,750.93 0.34 1.45 0 1 0.00 33.33 0.00 1,400.00 0.00 4.61 0.00 6.75
16 10,000.00 20,000.00 1,007 7,546 9.54 71.51 18,341.24 39,092.16 1.28 2.73 0 1 0.00 33.33 0.00 1,400.00 0.00 4.61 0.00 3.58
17 20,000.00 50,000.00 1,148 8,694 10.88 82.38 46,378.96 85,471.12 3.24 5.97 0 1 0.00 33.33 0.00 1,400.00 0.00 4.61 0.00 1.64
18 50,000.00 100,000.00 678 9,372 6.42 88.81 58,595.78 144,066.90 4.09 10.06 0 1 0.00 33.33 0.00 1,400.00 0.00 4.61 0.00 0.97
19 100,000.00 500,000.00 861 10,233 8.16 96.97 230,437.72 374,504.62 16.09 26.15 0 1 0.00 33.33 0.00 1,400.00 0.00 4.61 0.00 0.37
20 500,000.00 UP 320 10,553 3.03 100.00 932,388.45 1,306,893.06 65.10 91.25 1 2 33.33 66.67 14,500.00 15,900.00 47.70 52.30 1.56 1.22
125,274.94 1,432,168.00 8.75 100.00 1 3 33.33 100.00 14,500.00 30,400.00 47.70 100.00 11.57 2.12
*) Multilocation = risiko multi lokasi yang karena kurang lengkapnya data yang kami terima, risiko tersebut tidak dapat kami identifikasi sebagai any one risk
PT. Asuransi MAIPARK Indonesia
RISK & LOSS PROFILE
CLAIM FREQUENCY LOSS RATIO
BAND f F ∑(d)
SUM INSURED (BAND) (In Million Rp.)
rp
GROSS PREMIUM (In Million Rp.)
PERCENTAGE
NUMBER OF RISKS
f PERCENTAGE RP ∑(p)
rp RP ∑(h)
INCURRED CLAIM (In Million Rp.)
30/06/2011
5/04/2012
01/01/2010
* ) Multilocation
FROM TOPERCENTAGEPERCENTAGE PERCENTAGE F
∑(l)

58 S t a t i s t i k A s u r a n s i G e m p a B u m i I n d o n e s i a a s a t J u n e 2 0 1 1
U NDERWRIT ING Y EAR : 2010 DAT A PO SIT IO N FRO MPRO VINC E : AllO C C U PAT IO N : Residential T O
PRO C ESSING DAT E
T able 6.2.4
B AND (d)/∑(d)
C U M. ∑(f)
B AND (i)/∑(i)
C U M. ∑(j)
B AND (m)/∑(m)
C U M. ∑(n)
B AND (q)/∑(q)
C U M. ∑(r)
B AND (p)/(h)
C U M. (q)/(i)
(a) (b) (c) (d) (e ) (f) (g ) (h) (i ) (j ) (k ) (l) (m) (n ) (o ) (p) (q ) (r) (s) (t) (u)
1 0.00 50.00 1,822 1,822 4.21 4.21 258.04 258.04 0.09 0.09 0 0 0.00 0.00 0.00 0.00 0.00 0.00 0.00 0.00
2 50.00 100.00 3,411 5,233 7.88 12.08 493.04 751.08 0.18 0.27 0 0 0.00 0.00 0.00 0.00 0.00 0.00 0.00 0.00
3 100.00 200.00 5,437 10,670 12.55 24.64 1,373.37 2,124.45 0.50 0.77 0 0 0.00 0.00 0.00 0.00 0.00 0.00 0.00 0.00
4 200.00 300.00 4,534 15,204 10.47 35.10 1,629.78 3,754.23 0.59 1.35 1 1 16.67 16.67 19.38 19.38 4.05 4.05 1.19 0.52
5 300.00 500.00 5,934 21,138 13.70 48.80 3,197.33 6,951.56 1.15 2.51 4 5 66.67 83.33 113.70 133.07 23.78 27.84 3.56 1.91
6 500.00 750.00 7,045 28,183 16.27 65.07 6,178.59 13,130.15 2.23 4.74 0 5 0.00 83.33 0.00 133.07 0.00 27.84 0.00 1.01
7 750.00 1,000.00 3,785 31,968 8.74 73.81 4,590.88 17,721.03 1.66 6.39 0 5 0.00 83.33 0.00 133.07 0.00 27.84 0.00 0.75
8 1,000.00 1,500.00 3,567 35,535 8.24 82.04 5,682.06 23,403.08 2.05 8.44 0 5 0.00 83.33 0.00 133.07 0.00 27.84 0.00 0.57
9 1,500.00 2,000.00 1,678 37,213 3.87 85.92 3,725.28 27,128.36 1.34 9.79 0 5 0.00 83.33 0.00 133.07 0.00 27.84 0.00 0.49
10 2,000.00 2,500.00 1,226 38,439 2.83 88.75 3,524.76 30,653.12 1.27 11.06 0 5 0.00 83.33 0.00 133.07 0.00 27.84 0.00 0.43
11 2,500.00 3,000.00 704 39,143 1.63 90.37 2,518.12 33,171.24 0.91 11.97 0 5 0.00 83.33 0.00 133.07 0.00 27.84 0.00 0.40
12 3,000.00 4,000.00 1,007 40,150 2.32 92.70 4,477.40 37,648.64 1.62 13.58 0 5 0.00 83.33 0.00 133.07 0.00 27.84 0.00 0.35
13 4,000.00 5,000.00 561 40,711 1.30 93.99 3,300.31 40,948.95 1.19 14.78 1 6 16.67 100.00 345.00 478.07 72.16 100.00 10.45 1.17
14 5,000.00 7,500.00 786 41,497 1.81 95.81 6,213.91 47,162.86 2.24 17.02 0 6 0.00 100.00 0.00 478.07 0.00 100.00 0.00 1.01
15 7,500.00 10,000.00 395 41,892 0.91 96.72 4,549.17 51,712.03 1.64 18.66 0 6 0.00 100.00 0.00 478.07 0.00 100.00 0.00 0.92
16 10,000.00 20,000.00 632 42,524 1.46 98.18 11,419.13 63,131.15 4.12 22.78 0 6 0.00 100.00 0.00 478.07 0.00 100.00 0.00 0.76
17 20,000.00 50,000.00 348 42,872 0.80 98.98 13,396.43 76,527.58 4.83 27.61 0 6 0.00 100.00 0.00 478.07 0.00 100.00 0.00 0.62
18 50,000.00 100,000.00 154 43,026 0.36 99.34 14,415.48 90,943.06 5.20 32.81 0 6 0.00 100.00 0.00 478.07 0.00 100.00 0.00 0.53
19 100,000.00 500,000.00 235 43,261 0.54 99.88 70,690.78 161,633.84 25.51 58.32 0 6 0.00 100.00 0.00 478.07 0.00 100.00 0.00 0.30
20 500,000.00 UP 51 43,312 0.12 100.00 95,985.65 257,619.49 34.63 92.96 0 6 0.00 100.00 0.00 478.07 0.00 100.00 0.00 0.1919,523.95 277,143.44 7.04 100.00 0 6 0.00 100.00 0.00 478.07 0.00 100.00 0.00 0.17
*) Multilocation = risiko multi lokasi yang karena kurang lengkapnya data yang kami terima, risiko tersebut tidak dapat kami identifikasi sebagai any one risk
P T . A suransi MA IP A R K Indonesia
RISK & L O SS PRO FIL E
C LAIM FREQ U ENC Y LO SS RAT IO
B AND f F ∑(d)
SU M INSU RED (B AND) (In Million Rp.)
rp
G RO SS PREMIU M (In Million Rp.)
PERC ENT AG E
NU MB ER O F R ISKS
f PERC ENT AG E RP ∑(p)
rp RP ∑(h)
INC U RRED C LAIM (In Million Rp.)
30/06/2011
05/04/2012
01/01/2010
* ) Multilocation
FRO M T OPERC ENT AG EPERC ENT AG E PERC ENT AG E F
∑(l)

59 S t a t i s t i k A s u r a n s i G e m p a B u m i I n d o n e s i a a s a t J u n e 2 0 1 1
U NDERWRIT ING Y EAR : 2009 DAT A PO SIT IO N FRO MPRO VINC E : AllO C C U PAT IO N : Agricultural T O
PRO C ESSING DAT E
T able 6.3.1
B AND (d)/∑(d)
C U M. ∑(f)
B AND (i)/∑(i)
C U M. ∑(j)
B AND (m)/∑(m)
C U M. ∑(n)
B AND (q)/∑(q)
C U M. ∑(r)
B AND (p)/(h)
C U M. (q)/(i)
(a) (b) (c) (d) (e ) (f) (g ) (h) (i ) (j ) (k ) (l) (m) (n ) (o ) (p) (q ) (r) (s) (t) (u)
1 0.00 50.00 4 4 1.15 1.15 0.24 0.24 0.00 0.00 0 0 0.00 0.00 0.00 0.00 0.00 0.00 0.00 0.00
2 50.00 100.00 6 10 1.72 2.87 0.69 0.94 0.00 0.01 0 0 0.00 0.00 0.00 0.00 0.00 0.00 0.00 0.00
3 100.00 200.00 13 23 3.74 6.61 1.47 2.41 0.01 0.01 0 0 0.00 0.00 0.00 0.00 0.00 0.00 0.00 0.00
4 200.00 300.00 7 30 2.01 8.62 0.82 3.23 0.00 0.02 0 0 0.00 0.00 0.00 0.00 0.00 0.00 0.00 0.00
5 300.00 500.00 6 36 1.72 10.34 3.37 6.60 0.02 0.04 0 0 0.00 0.00 0.00 0.00 0.00 0.00 0.00 0.00
6 500.00 750.00 10 46 2.87 13.22 7.20 13.80 0.04 0.08 0 0 0.00 0.00 0.00 0.00 0.00 0.00 0.00 0.00
7 750.00 1,000.00 10 56 2.87 16.09 10.48 24.28 0.06 0.15 0 0 0.00 0.00 0.00 0.00 0.00 0.00 0.00 0.00
8 1,000.00 1,500.00 13 69 3.74 19.83 19.32 43.60 0.12 0.26 0 0 0.00 0.00 0.00 0.00 0.00 0.00 0.00 0.00
9 1,500.00 2,000.00 8 77 2.30 22.13 16.49 60.09 0.10 0.36 0 0 0.00 0.00 0.00 0.00 0.00 0.00 0.00 0.00
10 2,000.00 2,500.00 10 87 2.87 25.00 24.20 84.29 0.15 0.51 0 0 0.00 0.00 0.00 0.00 0.00 0.00 0.00 0.00
11 2,500.00 3,000.00 6 93 1.72 26.72 17.05 101.34 0.10 0.61 0 0 0.00 0.00 0.00 0.00 0.00 0.00 0.00 0.00
12 3,000.00 4,000.00 16 109 4.60 31.32 64.55 165.89 0.39 1.00 6 6 6.90 6.90 317.20 317.20 0.49 0.49 491.42 191.22
13 4,000.00 5,000.00 19 128 5.46 36.78 106.89 272.77 0.64 1.64 0 6 0.00 6.90 0.00 317.20 0.00 0.49 0.00 116.29
14 5,000.00 7,500.00 41 169 11.78 48.56 216.80 489.57 1.30 2.95 3 9 3.45 10.34 130.49 447.69 0.20 0.69 60.19 91.44
15 7,500.00 10,000.00 16 185 4.60 53.16 165.48 655.06 1.00 3.94 30 39 34.48 44.83 9,961.39 10,409.08 15.29 15.98 6,019.59 1,589.03
16 10,000.00 20,000.00 41 226 11.78 64.94 539.72 1,194.77 3.25 7.19 35 74 40.23 85.06 48,787.69 59,196.77 74.90 90.88 9,039.50 4,954.64
17 20,000.00 50,000.00 53 279 15.23 80.17 1,993.18 3,187.95 12.00 19.19 9 83 10.34 95.40 4,506.21 63,702.98 6.92 97.80 226.08 1,998.24
18 50,000.00 100,000.00 27 306 7.76 87.93 2,075.21 5,263.16 12.49 31.68 4 87 4.60 100.00 1,433.27 65,136.25 2.20 100.00 69.07 1,237.59
19 100,000.00 500,000.00 37 343 10.63 98.56 6,949.86 12,213.02 41.83 73.51 0 87 0.00 100.00 0.00 65,136.25 0.00 100.00 0.00 533.33
20 500,000.00 UP 5 348 1.44 100.00 3,405.17 15,618.19 20.50 94.01 0 87 0.00 100.00 0.00 65,136.25 0.00 100.00 0.00 417.05995.66 16,613.85 5.99 100.00 0 87 0.00 100.00 0.00 65,136.25 0.00 100.00 0.00 392.06
*) Multilocation = risiko multi lokasi yang karena kurang lengkapnya data yang kami terima, risiko tersebut tidak dapat kami identifikasi sebagai any one risk
P T . A suransi MA IP A R K Indonesia
RISK & L O SS PRO FIL E
C LAIM FREQ U ENC Y LO SS RAT IO
B AND f F ∑(d)
SU M INSU RED (B AND) (In Million Rp.)
rp
G RO SS PREMIU M (In Million Rp.)
PERC ENT AG E
NU MB ER O F R ISKS
f PERC ENT AG E RP ∑(p)
rp RP ∑(h)
INC U RRED C LAIM (In Million Rp.)
30/06/2011
05/04/2012
01/01/2009
* ) Multilocation
FRO M T OPERC ENT AG EPERC ENT AG E PERC ENT AG E F
∑(l)

60 S t a t i s t i k A s u r a n s i G e m p a B u m i I n d o n e s i a a s a t J u n e 2 0 1 1
UNDERWRITING YEAR : 2009 DATA POSITION FROMPROVINCE : AllOCCUPATION : Commercial TO
PROCESSING DATE
Table 6.3.2
BAND (d)/∑(d)
CUM. ∑(f)
BAND (i)/∑(i)
CUM. ∑(j)
BAND (m)/∑(m)
CUM. ∑(n)
BAND (q)/∑(q)
CUM. ∑(r)
BAND (p)/(h)
CUM. (q)/(i)
(a) (b) (c) (d) ( e) ( f) ( g) (h) ( i) ( j) ( k) (l) (m) ( n) ( o) (p) ( q) ( r) ( s) (t ) (u)
1 0.00 50.00 5,388 5,388 9.64 9.64 171.83 171.83 0.04 0.04 70 70 4.76 4.76 2,078.35 2,078.35 0.04 0.04 1,209.55 1,209.55
2 50.00 100.00 2,986 8,374 5.34 14.99 249.68 421.51 0.05 0.09 53 123 3.61 8.37 2,426.43 4,504.78 0.05 0.09 971.81 1,068.73
3 100.00 200.00 5,355 13,729 9.59 24.57 931.37 1,352.88 0.20 0.30 80 203 5.44 13.81 2,191.40 6,696.18 0.04 0.13 235.29 494.96
4 200.00 300.00 3,533 17,262 6.32 30.90 1,032.83 2,385.71 0.23 0.52 96 299 6.53 20.34 7,013.77 13,709.95 0.13 0.26 679.08 574.67
5 300.00 500.00 5,350 22,612 9.58 40.48 2,559.24 4,944.95 0.56 1.08 180 479 12.24 32.59 21,699.22 35,409.17 0.41 0.67 847.88 716.07
6 500.00 750.00 6,456 29,068 11.56 52.03 4,776.49 9,721.43 1.05 2.13 171 650 11.63 44.22 33,754.02 69,163.20 0.64 1.31 706.67 711.45
7 750.00 1,000.00 5,438 34,506 9.73 61.77 5,372.15 15,093.59 1.18 3.31 95 745 6.46 50.68 14,397.05 83,560.24 0.27 1.58 267.99 553.61
8 1,000.00 1,500.00 5,449 39,955 9.75 71.52 7,416.39 22,509.97 1.63 4.93 102 847 6.94 57.62 22,610.91 106,171.15 0.43 2.01 304.88 471.66
9 1,500.00 2,000.00 2,739 42,694 4.90 76.42 5,345.28 27,855.25 1.17 6.11 57 904 3.88 61.50 18,329.04 124,500.19 0.35 2.35 342.90 446.95
10 2,000.00 2,500.00 2,092 44,786 3.74 80.17 5,352.51 33,207.76 1.17 7.28 54 958 3.67 65.17 26,669.41 151,169.59 0.50 2.86 498.26 455.22
11 2,500.00 3,000.00 1,251 46,037 2.24 82.41 3,862.91 37,070.67 0.85 8.13 17 975 1.16 66.33 9,912.12 161,081.71 0.19 3.04 256.60 434.53
12 3,000.00 4,000.00 1,944 47,981 3.48 85.89 7,559.58 44,630.25 1.66 9.78 65 1,040 4.42 70.75 84,363.69 245,445.40 1.59 4.64 1,115.98 549.95
13 4,000.00 5,000.00 1,122 49,103 2.01 87.89 5,629.03 50,259.28 1.23 11.02 36 1,076 2.45 73.20 19,944.98 265,390.39 0.38 5.02 354.32 528.04
14 5,000.00 7,500.00 1,888 50,991 3.38 91.27 12,753.98 63,013.26 2.80 13.81 57 1,133 3.88 77.07 33,536.02 298,926.41 0.63 5.65 262.95 474.39
15 7,500.00 10,000.00 876 51,867 1.57 92.84 8,234.33 71,247.59 1.80 15.62 46 1,179 3.13 80.20 82,263.90 381,190.31 1.55 7.20 999.04 535.02
16 10,000.00 20,000.00 1,657 53,524 2.97 95.81 25,239.44 96,487.03 5.53 21.15 85 1,264 5.78 85.99 433,364.80 814,555.12 8.19 15.40 1,717.01 844.21
17 20,000.00 50,000.00 1,337 54,861 2.39 98.20 44,111.41 140,598.44 9.67 30.82 57 1,321 3.88 89.86 350,312.84 1,164,867.96 6.62 22.02 794.15 828.51
18 50,000.00 100,000.00 489 55,350 0.88 99.08 38,993.94 179,592.38 8.55 39.37 29 1,350 1.97 91.84 31,604.94 1,196,472.90 0.60 22.61 81.05 666.22
19 100,000.00 500,000.00 433 55,783 0.78 99.85 107,222.17 286,814.55 23.50 62.87 95 1,445 6.46 98.30 3,033,691.15 4,230,164.05 57.34 79.95 2,829.35 1,474.88
20 500,000.00 UP 83 55,866 0.15 100.00 109,306.73 396,121.27 23.96 86.83 20 1,465 1.36 99.66 732,557.31 4,962,721.35 13.85 93.80 670.19 1,252.83
60,099.88 456,221.15 13.17 100.00 5 1470 0.34 100.00 328,054.47 5,290,775.82 6.20 100.00 545.85 1,159.70
*) Multilocation = risiko multi lokasi yang karena kurang lengkapnya data yang kami terima, risiko tersebut tidak dapat kami identifikasi sebagai any one risk
PT. Asuransi MAIPARK Indonesia
RISK & LOSS PROFILE
CLAIM FREQUENCY LOSS RATIO
BAND f F ∑(d)
SUM INSURED (BAND) (In Million Rp.)
rp
GROSS PREMIUM (In Million Rp.)
PERCENTAGE
NUMBER OF RISKS
f PERCENTAGE RP ∑(p)
rp RP ∑(h)
INCURRED CLAIM (In Million Rp.)
30/06/2011
5/04/2012
01/01/2009
* ) Multilocation
FROM TOPERCENTAGEPERCENTAGE PERCENTAGE F
∑(l)

61 S t a t i s t i k A s u r a n s i G e m p a B u m i I n d o n e s i a a s a t J u n e 2 0 1 1
U NDERWRIT ING Y EAR : 2009 DAT A PO SIT IO N FRO MPRO VINC E : AllO C C U PAT IO N : Industrial T O
PRO C ESSING DAT E
T able 6.3.3
B AND (d)/∑(d)
C U M. ∑(f)
B AND (i)/∑(i)
C U M. ∑(j)
B AND (m)/∑(m)
C U M. ∑(n)
B AND (q)/∑(q)
C U M. ∑(r)
B AND (p)/(h)
C U M. (q)/(i)
(a) (b) (c) (d) (e ) (f) (g ) (h) (i ) (j ) (k ) (l) (m) (n ) (o ) (p) (q ) (r) (s) (t) (u)
1 0.00 50.00 415 415 3.60 3.60 70.47 70.47 0.01 0.01 0 0 0.00 0.00 0.00 0.00 0.00 0.00 0.00 0.00
2 50.00 100.00 283 698 2.46 6.06 34.00 104.47 0.00 0.01 0 0 0.00 0.00 0.00 0.00 0.00 0.00 0.00 0.00
3 100.00 200.00 408 1,106 3.54 9.60 64.45 168.92 0.01 0.01 0 0 0.00 0.00 0.00 0.00 0.00 0.00 0.00 0.00
4 200.00 300.00 347 1,453 3.01 12.61 95.79 264.71 0.01 0.02 0 0 0.00 0.00 0.00 0.00 0.00 0.00 0.00 0.00
5 300.00 500.00 613 2,066 5.32 17.92 268.60 533.32 0.02 0.04 3 3 8.33 8.33 218.29 218.29 2.26 2.26 81.27 40.93
6 500.00 750.00 651 2,717 5.65 23.57 459.56 992.88 0.04 0.08 0 3 0.00 8.33 0.00 218.29 0.00 2.26 0.00 21.99
7 750.00 1,000.00 432 3,149 3.75 27.32 439.98 1,432.86 0.04 0.12 0 3 0.00 8.33 0.00 218.29 0.00 2.26 0.00 15.23
8 1,000.00 1,500.00 705 3,854 6.12 33.44 957.48 2,390.34 0.08 0.20 0 3 0.00 8.33 0.00 218.29 0.00 2.26 0.00 9.13
9 1,500.00 2,000.00 526 4,380 4.56 38.00 1,012.95 3,403.29 0.08 0.28 5 8 13.89 22.22 1,921.65 2,139.93 19.87 22.13 189.71 62.88
10 2,000.00 2,500.00 459 4,839 3.98 41.98 1,212.55 4,615.85 0.10 0.39 2 10 5.56 27.78 70.49 2,210.42 0.73 22.86 5.81 47.89
11 2,500.00 3,000.00 370 5,209 3.21 45.19 1,144.97 5,760.82 0.10 0.48 3 13 8.33 36.11 415.90 2,626.32 4.30 27.16 36.32 45.59
12 3,000.00 4,000.00 556 5,765 4.82 50.02 2,190.27 7,951.10 0.18 0.67 2 15 5.56 41.67 441.79 3,068.10 4.57 31.73 20.17 38.59
13 4,000.00 5,000.00 360 6,125 3.12 53.14 1,764.60 9,715.69 0.15 0.81 0 15 0.00 41.67 0.00 3,068.10 0.00 31.73 0.00 31.58
14 5,000.00 7,500.00 731 6,856 6.34 59.48 5,037.16 14,752.86 0.42 1.23 1 16 2.78 44.44 13.78 3,081.89 0.14 31.87 0.27 20.89
15 7,500.00 10,000.00 475 7,331 4.12 63.60 4,654.74 19,407.59 0.39 1.62 2 18 5.56 50.00 410.33 3,492.22 4.24 36.11 8.82 17.99
16 10,000.00 20,000.00 1,146 8,477 9.94 73.55 17,993.67 37,401.26 1.51 3.13 7 25 19.44 69.44 2,008.35 5,500.57 20.77 56.88 11.16 14.71
17 20,000.00 50,000.00 1,215 9,692 10.54 84.09 43,167.18 80,568.44 3.61 6.74 1 26 2.78 72.22 67.08 5,567.65 0.69 57.57 0.16 6.91
18 50,000.00 100,000.00 682 10,374 5.92 90.01 53,971.23 134,539.67 4.52 11.26 0 26 0.00 72.22 0.00 5,567.65 0.00 57.57 0.00 4.14
19 100,000.00 500,000.00 856 11,230 7.43 97.43 200,839.68 335,379.35 16.81 28.06 9 35 25.00 97.22 4,002.67 9,570.32 41.39 98.97 1.99 2.85
20 500,000.00 UP 296 11,526 2.57 100.00 681,652.76 1,017,032.11 57.04 85.10 1 36 2.78 100.00 100.00 9,670.32 1.03 100.00 0.01 0.95178,051.11 1,195,083.22 14.90 100.00 0 36 0.00 100.00 0.00 9,670.32 0.00 100.00 0.00 0.81
*) Multilocation = risiko multi lokasi yang karena kurang lengkapnya data yang kami terima, risiko tersebut tidak dapat kami identifikasi sebagai any one risk
P T . A suransi MA IP A R K Indonesia
RISK & L O SS PRO FIL E
C LAIM FREQ U ENC Y LO SS RAT IO
B AND f F ∑(d)
SU M INSU RED (B AND) (In Million Rp.)
rp
G RO SS PREMIU M (In Million Rp.)
PERC ENT AG E
NU MB ER O F R ISKS
f PERC ENT AG E RP ∑(p)
rp RP ∑(h)
INC U RRED C LAIM (In Million Rp.)
30/06/2011
05/04/2012
01/01/2009
* ) Multilocation
FRO M T OPERC ENT AG EPERC ENT AG E PERC ENT AG E F
∑(l)
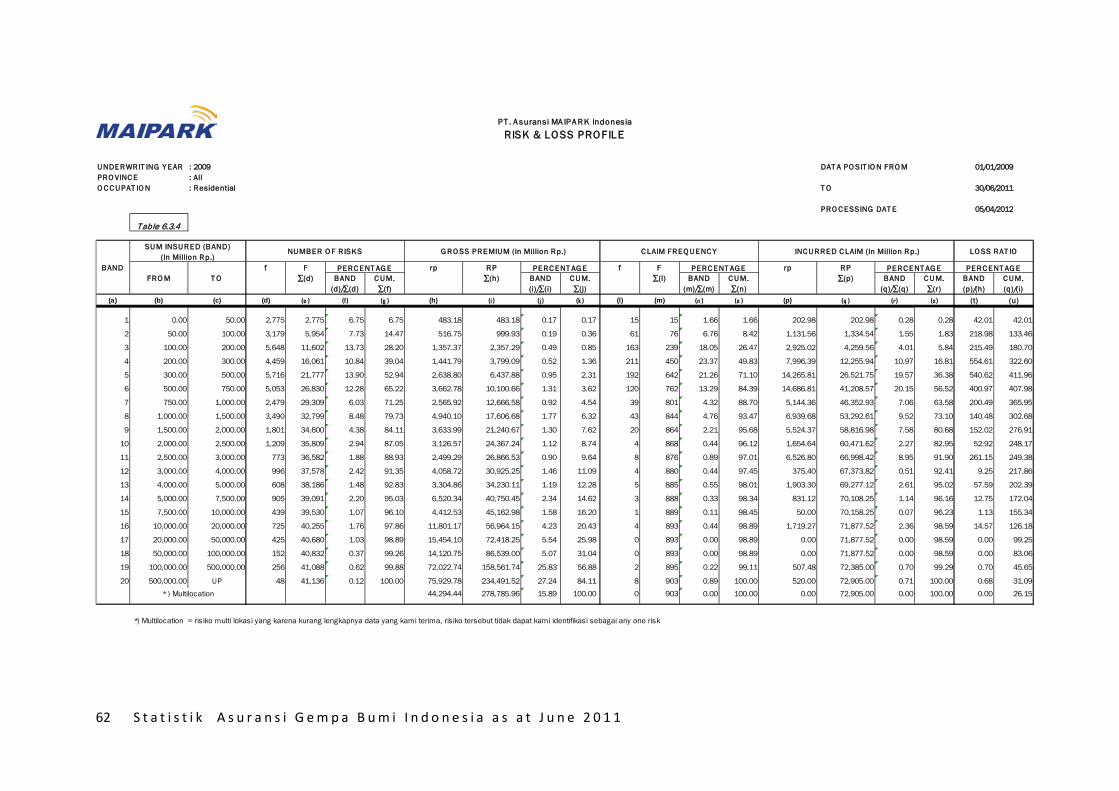
62 S t a t i s t i k A s u r a n s i G e m p a B u m i I n d o n e s i a a s a t J u n e 2 0 1 1
U NDERWRIT ING Y EAR : 2009 DAT A PO SIT IO N FRO MPRO VINC E : AllO C C U PAT IO N : Residential T O
PRO C ESSING DAT E
T able 6.3.4
B AND (d)/∑(d)
C U M. ∑(f)
B AND (i)/∑(i)
C U M. ∑(j)
B AND (m)/∑(m)
C U M. ∑(n)
B AND (q)/∑(q)
C U M. ∑(r)
B AND (p)/(h)
C U M. (q)/(i)
(a) (b) (c) (d) (e ) (f) (g ) (h) (i ) (j ) (k ) (l) (m) (n ) (o ) (p) (q ) (r) (s) (t) (u)
1 0.00 50.00 2,775 2,775 6.75 6.75 483.18 483.18 0.17 0.17 15 15 1.66 1.66 202.98 202.98 0.28 0.28 42.01 42.01
2 50.00 100.00 3,179 5,954 7.73 14.47 516.75 999.93 0.19 0.36 61 76 6.76 8.42 1,131.56 1,334.54 1.55 1.83 218.98 133.46
3 100.00 200.00 5,648 11,602 13.73 28.20 1,357.37 2,357.29 0.49 0.85 163 239 18.05 26.47 2,925.02 4,259.56 4.01 5.84 215.49 180.70
4 200.00 300.00 4,459 16,061 10.84 39.04 1,441.79 3,799.09 0.52 1.36 211 450 23.37 49.83 7,996.39 12,255.94 10.97 16.81 554.61 322.60
5 300.00 500.00 5,716 21,777 13.90 52.94 2,638.80 6,437.88 0.95 2.31 192 642 21.26 71.10 14,265.81 26,521.75 19.57 36.38 540.62 411.96
6 500.00 750.00 5,053 26,830 12.28 65.22 3,662.78 10,100.66 1.31 3.62 120 762 13.29 84.39 14,686.81 41,208.57 20.15 56.52 400.97 407.98
7 750.00 1,000.00 2,479 29,309 6.03 71.25 2,565.92 12,666.58 0.92 4.54 39 801 4.32 88.70 5,144.36 46,352.93 7.06 63.58 200.49 365.95
8 1,000.00 1,500.00 3,490 32,799 8.48 79.73 4,940.10 17,606.68 1.77 6.32 43 844 4.76 93.47 6,939.68 53,292.61 9.52 73.10 140.48 302.68
9 1,500.00 2,000.00 1,801 34,600 4.38 84.11 3,633.99 21,240.67 1.30 7.62 20 864 2.21 95.68 5,524.37 58,816.98 7.58 80.68 152.02 276.91
10 2,000.00 2,500.00 1,209 35,809 2.94 87.05 3,126.57 24,367.24 1.12 8.74 4 868 0.44 96.12 1,654.64 60,471.62 2.27 82.95 52.92 248.17
11 2,500.00 3,000.00 773 36,582 1.88 88.93 2,499.29 26,866.53 0.90 9.64 8 876 0.89 97.01 6,526.80 66,998.42 8.95 91.90 261.15 249.38
12 3,000.00 4,000.00 996 37,578 2.42 91.35 4,058.72 30,925.25 1.46 11.09 4 880 0.44 97.45 375.40 67,373.82 0.51 92.41 9.25 217.86
13 4,000.00 5,000.00 608 38,186 1.48 92.83 3,304.86 34,230.11 1.19 12.28 5 885 0.55 98.01 1,903.30 69,277.12 2.61 95.02 57.59 202.39
14 5,000.00 7,500.00 905 39,091 2.20 95.03 6,520.34 40,750.45 2.34 14.62 3 888 0.33 98.34 831.12 70,108.25 1.14 96.16 12.75 172.04
15 7,500.00 10,000.00 439 39,530 1.07 96.10 4,412.53 45,162.98 1.58 16.20 1 889 0.11 98.45 50.00 70,158.25 0.07 96.23 1.13 155.34
16 10,000.00 20,000.00 725 40,255 1.76 97.86 11,801.17 56,964.15 4.23 20.43 4 893 0.44 98.89 1,719.27 71,877.52 2.36 98.59 14.57 126.18
17 20,000.00 50,000.00 425 40,680 1.03 98.89 15,454.10 72,418.25 5.54 25.98 0 893 0.00 98.89 0.00 71,877.52 0.00 98.59 0.00 99.25
18 50,000.00 100,000.00 152 40,832 0.37 99.26 14,120.75 86,539.00 5.07 31.04 0 893 0.00 98.89 0.00 71,877.52 0.00 98.59 0.00 83.06
19 100,000.00 500,000.00 256 41,088 0.62 99.88 72,022.74 158,561.74 25.83 56.88 2 895 0.22 99.11 507.48 72,385.00 0.70 99.29 0.70 45.65
20 500,000.00 UP 48 41,136 0.12 100.00 75,929.78 234,491.52 27.24 84.11 8 903 0.89 100.00 520.00 72,905.00 0.71 100.00 0.68 31.0944,294.44 278,785.96 15.89 100.00 0 903 0.00 100.00 0.00 72,905.00 0.00 100.00 0.00 26.15
*) Multilocation = risiko multi lokasi yang karena kurang lengkapnya data yang kami terima, risiko tersebut tidak dapat kami identifikasi sebagai any one risk
P T . A suransi MA IP A R K Indonesia
RISK & L O SS PRO FIL E
C LAIM FREQ U ENC Y LO SS RAT IO
B AND f F ∑(d)
SU M INSU RED (B AND) (In Million Rp.)
rp
G RO SS PREMIU M (In Million Rp.)
PERC ENT AG E
NU MB ER O F R ISKS
f PERC ENT AG E RP ∑(p)
rp RP ∑(h)
INC U RRED C LAIM (In Million Rp.)
30/06/2011
05/04/2012
01/01/2009
* ) Multilocation
FRO M T OPERC ENT AG EPERC ENT AG E PERC ENT AG E F
∑(l)

63 S t a t i s t i k A s u r a n s i G e m p a B u m i I n d o n e s i a a s a t J u n e 2 0 1 1
U NDERWRIT ING Y EAR : 2008 DAT A PO SIT IO N FRO MPRO VINC E : AllO C C U PAT IO N : Agricultural T O
PRO C ESSING DAT E
T able 6.4.1
B AND (d)/∑(d)
C U M. ∑(f)
B AND (i)/∑(i)
C U M. ∑(j)
B AND (m)/∑(m)
C U M. ∑(n)
B AND (q)/∑(q)
C U M. ∑(r)
B AND (p)/(h)
C U M. (q)/(i)
(a) (b) (c) (d) (e ) (f) (g ) (h) (i ) (j ) (k ) (l) (m) (n ) (o ) (p) (q ) (r) (s) (t) (u)
1 0.00 50.00 2 2 0.33 0.33 0.12 0.12 0.00 0.00 0 0 0.00 0.00 0.00 0.00 0.00 0.00 0.00 0.00
2 50.00 100.00 5 7 0.83 1.17 0.39 0.50 0.00 0.00 0 0 0.00 0.00 0.00 0.00 0.00 0.00 0.00 0.00
3 100.00 200.00 40 47 6.68 7.85 4.30 4.80 0.02 0.03 0 0 0.00 0.00 0.00 0.00 0.00 0.00 0.00 0.00
4 200.00 300.00 22 69 3.67 11.52 5.05 9.85 0.03 0.06 0 0 0.00 0.00 0.00 0.00 0.00 0.00 0.00 0.00
5 300.00 500.00 21 90 3.51 15.03 8.67 18.52 0.05 0.11 0 0 0.00 0.00 0.00 0.00 0.00 0.00 0.00 0.00
6 500.00 750.00 18 108 3.01 18.03 11.38 29.91 0.07 0.17 0 0 0.00 0.00 0.00 0.00 0.00 0.00 0.00 0.00
7 750.00 1,000.00 13 121 2.17 20.20 12.41 42.32 0.07 0.24 0 0 0.00 0.00 0.00 0.00 0.00 0.00 0.00 0.00
8 1,000.00 1,500.00 26 147 4.34 24.54 37.02 79.34 0.21 0.46 0 0 0.00 0.00 0.00 0.00 0.00 0.00 0.00 0.00
9 1,500.00 2,000.00 16 163 2.67 27.21 31.56 110.90 0.18 0.64 0 0 0.00 0.00 0.00 0.00 0.00 0.00 0.00 0.00
10 2,000.00 2,500.00 20 183 3.34 30.55 51.64 162.55 0.30 0.94 0 0 0.00 0.00 0.00 0.00 0.00 0.00 0.00 0.00
11 2,500.00 3,000.00 16 199 2.67 33.22 46.21 208.75 0.27 1.20 0 0 0.00 0.00 0.00 0.00 0.00 0.00 0.00 0.00
12 3,000.00 4,000.00 19 218 3.17 36.39 69.35 278.10 0.40 1.60 0 0 0.00 0.00 0.00 0.00 0.00 0.00 0.00 0.00
13 4,000.00 5,000.00 20 238 3.34 39.73 96.21 374.32 0.55 2.16 1 1 14.29 14.29 10.00 10.00 0.11 0.11 10.39 2.67
14 5,000.00 7,500.00 54 292 9.02 48.75 356.56 730.88 2.06 4.21 0 1 0.00 14.29 0.00 10.00 0.00 0.11 0.00 1.37
15 7,500.00 10,000.00 38 330 6.34 55.09 316.65 1,047.52 1.83 6.04 2 3 28.57 42.86 787.50 797.50 8.58 8.69 248.70 76.13
16 10,000.00 20,000.00 110 440 18.36 73.46 1,460.22 2,507.74 8.42 14.46 0 3 0.00 42.86 0.00 797.50 0.00 8.69 0.00 31.80
17 20,000.00 50,000.00 82 522 13.69 87.15 2,800.72 5,308.46 16.15 30.60 3 6 42.86 85.71 6,569.15 7,366.65 71.59 80.28 234.55 138.77
18 50,000.00 100,000.00 30 552 5.01 92.15 2,501.29 7,809.75 14.42 45.02 0 6 0.00 85.71 0.00 7,366.65 0.00 80.28 0.00 94.33
19 100,000.00 500,000.00 45 597 7.51 99.67 7,637.73 15,447.49 44.03 89.05 1 7 14.29 100.00 1,810.04 9,176.70 19.72 100.00 23.70 59.41
20 500,000.00 UP 2 599 0.33 100.00 1,873.23 17,320.72 10.80 99.85 0 7 0.00 100.00 0.00 9,176.70 0.00 100.00 0.00 52.9825.69 17,346.41 0.15 100.00 0 7 0.00 100.00 0.00 9,176.70 0.00 100.00 0.00 52.90
*) Multilocation = risiko multi lokasi yang karena kurang lengkapnya data yang kami terima, risiko tersebut tidak dapat kami identifikasi sebagai any one risk
P T . A suransi MA IP A R K Indonesia
RISK & L O SS PRO FIL E
C LAIM FREQ U ENC Y LO SS RAT IO
B AND f F ∑(d)
SU M INSU RED (B AND) (In Million Rp.)
rp
G RO SS PREMIU M (In Million Rp.)
PERC ENT AG E
NU MB ER O F R ISKS
f PERC ENT AG E RP ∑(p)
rp RP ∑(h)
INC U RRED C LAIM (In Million Rp.)
30/06/2011
05/04/2012
01/01/2008
* ) Multilocation
FRO M T OPERC ENT AG EPERC ENT AG E PERC ENT AG E F
∑(l)
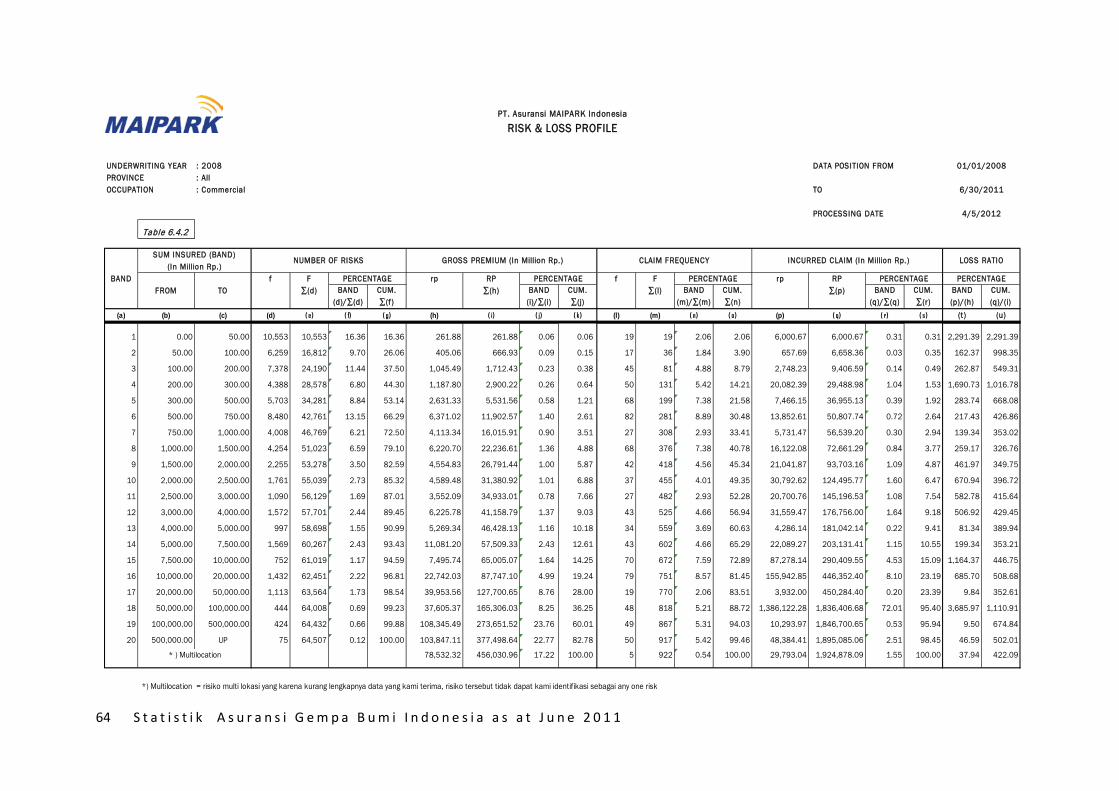
64 S t a t i s t i k A s u r a n s i G e m p a B u m i I n d o n e s i a a s a t J u n e 2 0 1 1
UNDERWRITING YEAR : 2008 DATA POSITION FROMPROVINCE : AllOCCUPATION : Commercial TO
PROCESSING DATE
Table 6.4.2
BAND (d)/∑(d)
CUM. ∑(f)
BAND (i)/∑(i)
CUM. ∑(j)
BAND (m)/∑(m)
CUM. ∑(n)
BAND (q)/∑(q)
CUM. ∑(r)
BAND (p)/(h)
CUM. (q)/(i)
(a) (b) (c) (d) ( e) ( f) ( g) (h) ( i) ( j) ( k) (l) (m) ( n) ( o) (p) ( q) ( r) ( s) (t ) (u)
1 0.00 50.00 10,553 10,553 16.36 16.36 261.88 261.88 0.06 0.06 19 19 2.06 2.06 6,000.67 6,000.67 0.31 0.31 2,291.39 2,291.39
2 50.00 100.00 6,259 16,812 9.70 26.06 405.06 666.93 0.09 0.15 17 36 1.84 3.90 657.69 6,658.36 0.03 0.35 162.37 998.35
3 100.00 200.00 7,378 24,190 11.44 37.50 1,045.49 1,712.43 0.23 0.38 45 81 4.88 8.79 2,748.23 9,406.59 0.14 0.49 262.87 549.31
4 200.00 300.00 4,388 28,578 6.80 44.30 1,187.80 2,900.22 0.26 0.64 50 131 5.42 14.21 20,082.39 29,488.98 1.04 1.53 1,690.73 1,016.78
5 300.00 500.00 5,703 34,281 8.84 53.14 2,631.33 5,531.56 0.58 1.21 68 199 7.38 21.58 7,466.15 36,955.13 0.39 1.92 283.74 668.08
6 500.00 750.00 8,480 42,761 13.15 66.29 6,371.02 11,902.57 1.40 2.61 82 281 8.89 30.48 13,852.61 50,807.74 0.72 2.64 217.43 426.86
7 750.00 1,000.00 4,008 46,769 6.21 72.50 4,113.34 16,015.91 0.90 3.51 27 308 2.93 33.41 5,731.47 56,539.20 0.30 2.94 139.34 353.02
8 1,000.00 1,500.00 4,254 51,023 6.59 79.10 6,220.70 22,236.61 1.36 4.88 68 376 7.38 40.78 16,122.08 72,661.29 0.84 3.77 259.17 326.76
9 1,500.00 2,000.00 2,255 53,278 3.50 82.59 4,554.83 26,791.44 1.00 5.87 42 418 4.56 45.34 21,041.87 93,703.16 1.09 4.87 461.97 349.75
10 2,000.00 2,500.00 1,761 55,039 2.73 85.32 4,589.48 31,380.92 1.01 6.88 37 455 4.01 49.35 30,792.62 124,495.77 1.60 6.47 670.94 396.72
11 2,500.00 3,000.00 1,090 56,129 1.69 87.01 3,552.09 34,933.01 0.78 7.66 27 482 2.93 52.28 20,700.76 145,196.53 1.08 7.54 582.78 415.64
12 3,000.00 4,000.00 1,572 57,701 2.44 89.45 6,225.78 41,158.79 1.37 9.03 43 525 4.66 56.94 31,559.47 176,756.00 1.64 9.18 506.92 429.45
13 4,000.00 5,000.00 997 58,698 1.55 90.99 5,269.34 46,428.13 1.16 10.18 34 559 3.69 60.63 4,286.14 181,042.14 0.22 9.41 81.34 389.94
14 5,000.00 7,500.00 1,569 60,267 2.43 93.43 11,081.20 57,509.33 2.43 12.61 43 602 4.66 65.29 22,089.27 203,131.41 1.15 10.55 199.34 353.21
15 7,500.00 10,000.00 752 61,019 1.17 94.59 7,495.74 65,005.07 1.64 14.25 70 672 7.59 72.89 87,278.14 290,409.55 4.53 15.09 1,164.37 446.75
16 10,000.00 20,000.00 1,432 62,451 2.22 96.81 22,742.03 87,747.10 4.99 19.24 79 751 8.57 81.45 155,942.85 446,352.40 8.10 23.19 685.70 508.68
17 20,000.00 50,000.00 1,113 63,564 1.73 98.54 39,953.56 127,700.65 8.76 28.00 19 770 2.06 83.51 3,932.00 450,284.40 0.20 23.39 9.84 352.61
18 50,000.00 100,000.00 444 64,008 0.69 99.23 37,605.37 165,306.03 8.25 36.25 48 818 5.21 88.72 1,386,122.28 1,836,406.68 72.01 95.40 3,685.97 1,110.91
19 100,000.00 500,000.00 424 64,432 0.66 99.88 108,345.49 273,651.52 23.76 60.01 49 867 5.31 94.03 10,293.97 1,846,700.65 0.53 95.94 9.50 674.84
20 500,000.00 UP 75 64,507 0.12 100.00 103,847.11 377,498.64 22.77 82.78 50 917 5.42 99.46 48,384.41 1,895,085.06 2.51 98.45 46.59 502.01
78,532.32 456,030.96 17.22 100.00 5 922 0.54 100.00 29,793.04 1,924,878.09 1.55 100.00 37.94 422.09
*) Multilocation = risiko multi lokasi yang karena kurang lengkapnya data yang kami terima, risiko tersebut tidak dapat kami identifikasi sebagai any one risk
6/30/2011
4/5/2012
01/01/2008
* ) Multilocation
FROM TOPERCENTAGEPERCENTAGE PERCENTAGE F
∑(l)PERCENTAGE
NUMBER OF RISKS
f PERCENTAGE RP ∑(p)
rp RP ∑(h)
INCURRED CLAIM (In Million Rp.)
PT. Asuransi MAIPARK Indonesia
RISK & LOSS PROFILE
CLAIM FREQUENCY LOSS RATIO
BAND f F ∑(d)
SUM INSURED (BAND) (In Million Rp.)
rp
GROSS PREMIUM (In Million Rp.)
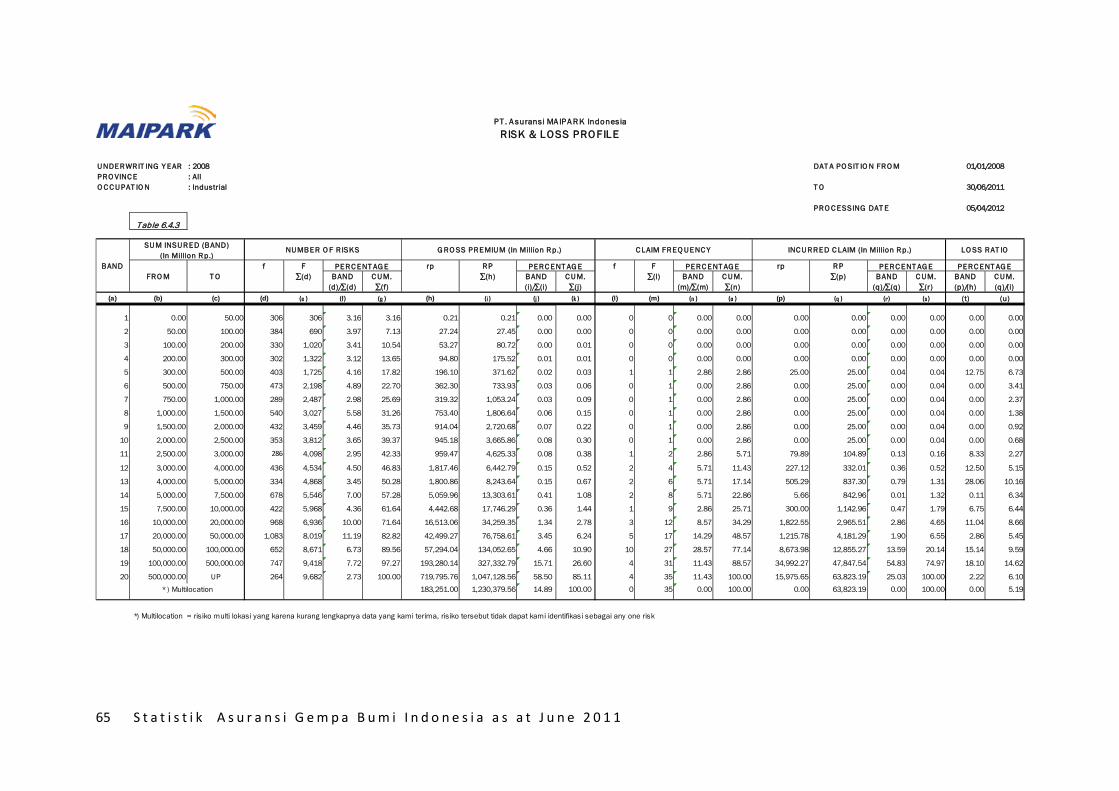
65 S t a t i s t i k A s u r a n s i G e m p a B u m i I n d o n e s i a a s a t J u n e 2 0 1 1
U NDERWRIT ING Y EAR : 2008 DAT A PO SIT IO N FRO MPRO VINC E : AllO C C U PAT IO N : Industrial T O
PRO C ESSING DAT E
T able 6.4.3
B AND (d)/∑(d)
C U M. ∑(f)
B AND (i)/∑(i)
C U M. ∑(j)
B AND (m)/∑(m)
C U M. ∑(n)
B AND (q)/∑(q)
C U M. ∑(r)
B AND (p)/(h)
C U M. (q)/(i)
(a) (b) (c) (d) (e ) (f) (g ) (h) (i ) (j ) (k ) (l) (m) (n ) (o ) (p) (q ) (r) (s) (t) (u)
1 0.00 50.00 306 306 3.16 3.16 0.21 0.21 0.00 0.00 0 0 0.00 0.00 0.00 0.00 0.00 0.00 0.00 0.00
2 50.00 100.00 384 690 3.97 7.13 27.24 27.45 0.00 0.00 0 0 0.00 0.00 0.00 0.00 0.00 0.00 0.00 0.00
3 100.00 200.00 330 1,020 3.41 10.54 53.27 80.72 0.00 0.01 0 0 0.00 0.00 0.00 0.00 0.00 0.00 0.00 0.00
4 200.00 300.00 302 1,322 3.12 13.65 94.80 175.52 0.01 0.01 0 0 0.00 0.00 0.00 0.00 0.00 0.00 0.00 0.00
5 300.00 500.00 403 1,725 4.16 17.82 196.10 371.62 0.02 0.03 1 1 2.86 2.86 25.00 25.00 0.04 0.04 12.75 6.73
6 500.00 750.00 473 2,198 4.89 22.70 362.30 733.93 0.03 0.06 0 1 0.00 2.86 0.00 25.00 0.00 0.04 0.00 3.41
7 750.00 1,000.00 289 2,487 2.98 25.69 319.32 1,053.24 0.03 0.09 0 1 0.00 2.86 0.00 25.00 0.00 0.04 0.00 2.37
8 1,000.00 1,500.00 540 3,027 5.58 31.26 753.40 1,806.64 0.06 0.15 0 1 0.00 2.86 0.00 25.00 0.00 0.04 0.00 1.38
9 1,500.00 2,000.00 432 3,459 4.46 35.73 914.04 2,720.68 0.07 0.22 0 1 0.00 2.86 0.00 25.00 0.00 0.04 0.00 0.92
10 2,000.00 2,500.00 353 3,812 3.65 39.37 945.18 3,665.86 0.08 0.30 0 1 0.00 2.86 0.00 25.00 0.00 0.04 0.00 0.68
11 2,500.00 3,000.00 286 4,098 2.95 42.33 959.47 4,625.33 0.08 0.38 1 2 2.86 5.71 79.89 104.89 0.13 0.16 8.33 2.27
12 3,000.00 4,000.00 436 4,534 4.50 46.83 1,817.46 6,442.79 0.15 0.52 2 4 5.71 11.43 227.12 332.01 0.36 0.52 12.50 5.15
13 4,000.00 5,000.00 334 4,868 3.45 50.28 1,800.86 8,243.64 0.15 0.67 2 6 5.71 17.14 505.29 837.30 0.79 1.31 28.06 10.16
14 5,000.00 7,500.00 678 5,546 7.00 57.28 5,059.96 13,303.61 0.41 1.08 2 8 5.71 22.86 5.66 842.96 0.01 1.32 0.11 6.34
15 7,500.00 10,000.00 422 5,968 4.36 61.64 4,442.68 17,746.29 0.36 1.44 1 9 2.86 25.71 300.00 1,142.96 0.47 1.79 6.75 6.44
16 10,000.00 20,000.00 968 6,936 10.00 71.64 16,513.06 34,259.35 1.34 2.78 3 12 8.57 34.29 1,822.55 2,965.51 2.86 4.65 11.04 8.66
17 20,000.00 50,000.00 1,083 8,019 11.19 82.82 42,499.27 76,758.61 3.45 6.24 5 17 14.29 48.57 1,215.78 4,181.29 1.90 6.55 2.86 5.45
18 50,000.00 100,000.00 652 8,671 6.73 89.56 57,294.04 134,052.65 4.66 10.90 10 27 28.57 77.14 8,673.98 12,855.27 13.59 20.14 15.14 9.59
19 100,000.00 500,000.00 747 9,418 7.72 97.27 193,280.14 327,332.79 15.71 26.60 4 31 11.43 88.57 34,992.27 47,847.54 54.83 74.97 18.10 14.62
20 500,000.00 UP 264 9,682 2.73 100.00 719,795.76 1,047,128.56 58.50 85.11 4 35 11.43 100.00 15,975.65 63,823.19 25.03 100.00 2.22 6.10183,251.00 1,230,379.56 14.89 100.00 0 35 0.00 100.00 0.00 63,823.19 0.00 100.00 0.00 5.19
*) Multilocation = risiko multi lokasi yang karena kurang lengkapnya data yang kami terima, risiko tersebut tidak dapat kami identifikasi sebagai any one risk
30/06/2011
05/04/2012
01/01/2008
* ) Multilocation
FRO M T OPERC ENT AG EPERC ENT AG E PERC ENT AG E F
∑(l)PERC ENT AG E
NU MB ER O F R ISKS
f PERC ENT AG E RP ∑(p)
rp RP ∑(h)
INC U RRED C LAIM (In Million Rp.)
P T . A suransi MA IP A R K Indonesia
RISK & L O SS PRO FIL E
C LAIM FREQ U ENC Y LO SS RAT IO
B AND f F ∑(d)
SU M INSU RED (B AND) (In Million Rp.)
rp
G RO SS PREMIU M (In Million Rp.)

66 S t a t i s t i k A s u r a n s i G e m p a B u m i I n d o n e s i a a s a t J u n e 2 0 1 1
UNDERWRITING YEAR : 2008 DATA POSITION FROMPROVINCE : AllOCCUPATION : Residential TO
PROCESSING DATE
Table 6.4.4
BAND (d)/∑(d)
CUM. ∑(f)
BAND (i)/∑(i)
CUM. ∑(j)
BAND (m)/∑(m)
CUM. ∑(n)
BAND (q)/∑(q)
CUM. ∑(r)
BAND (p)/(h)
CUM. (q)/(i)
(a) (b) (c) (d) ( e) ( f) ( g) (h) ( i) ( j) ( k) (l) (m) ( n) ( o) (p) ( q) ( r) ( s) (t ) (u)
1 0.00 50.00 3,906 3,906 10.78 10.78 347.06 347.06 0.16 0.16 2 2 0.71 0.71 5.27 5.27 0.02 0.02 1.52 1.52
2 50.00 100.00 2,459 6,365 6.78 17.56 844.29 1,191.35 0.39 0.55 16 18 5.65 6.36 280.45 285.73 1.06 1.08 33.22 23.98
3 100.00 200.00 4,730 11,095 13.05 30.61 1,395.09 2,586.44 0.65 1.20 48 66 16.96 23.32 520.69 806.42 1.98 3.06 37.32 31.18
4 200.00 300.00 3,983 15,078 10.99 41.60 1,283.16 3,869.60 0.59 1.79 63 129 22.26 45.58 1,289.80 2,096.22 4.89 7.95 100.52 54.17
5 300.00 500.00 5,075 20,153 14.00 55.60 2,413.45 6,283.05 1.12 2.91 55 184 19.43 65.02 2,527.17 4,623.39 9.59 17.54 104.71 73.59
6 500.00 750.00 4,302 24,455 11.87 67.47 3,309.03 9,592.08 1.53 4.44 32 216 11.31 76.33 6,683.82 11,307.21 25.35 42.89 201.99 117.88
7 750.00 1,000.00 2,026 26,481 5.59 73.06 2,171.63 11,763.71 1.01 5.45 13 229 4.59 80.92 4,106.90 15,414.11 15.58 58.47 189.12 131.03
8 1,000.00 1,500.00 2,735 29,216 7.55 80.61 4,098.60 15,862.31 1.90 7.35 14 243 4.95 85.87 1,699.89 17,114.00 6.45 64.92 41.47 107.89
9 1,500.00 2,000.00 1,484 30,700 4.09 84.70 3,101.59 18,963.90 1.44 8.78 3 246 1.06 86.93 919.85 18,033.84 3.49 68.41 29.66 95.10
10 2,000.00 2,500.00 979 31,679 2.70 87.40 2,679.88 21,643.78 1.24 10.02 2 248 0.71 87.63 1,314.24 19,348.08 4.99 73.39 49.04 89.39
11 2,500.00 3,000.00 635 32,314 1.75 89.16 2,119.89 23,763.67 0.98 11.01 1 249 0.35 87.99 4.55 19,352.63 0.02 73.41 0.21 81.44
12 3,000.00 4,000.00 828 33,142 2.28 91.44 3,576.80 27,340.47 1.66 12.66 11 260 3.89 91.87 2,683.63 22,036.26 10.18 83.59 75.03 80.60
13 4,000.00 5,000.00 548 33,690 1.51 92.95 3,118.40 30,458.86 1.44 14.11 2 262 0.71 92.58 3,755.27 25,791.53 14.25 97.84 120.42 84.68
14 5,000.00 7,500.00 723 34,413 1.99 94.95 5,324.57 35,783.43 2.47 16.57 2 264 0.71 93.29 152.24 25,943.76 0.58 98.41 2.86 72.50
15 7,500.00 10,000.00 518 34,931 1.43 96.38 5,562.78 41,346.21 2.58 19.15 4 268 1.41 94.70 8.94 25,952.70 0.03 98.45 0.16 62.77
16 10,000.00 20,000.00 564 35,495 1.56 97.93 9,424.18 50,770.39 4.36 23.51 2 270 0.71 95.41 59.50 26,012.20 0.23 98.67 0.63 51.23
17 20,000.00 50,000.00 350 35,845 0.97 98.90 13,869.75 64,640.15 6.42 29.94 9 279 3.18 98.59 296.21 26,308.41 1.12 99.80 2.14 40.70
18 50,000.00 100,000.00 141 35,986 0.39 99.29 13,409.13 78,049.27 6.21 36.15 0 279 0.00 98.59 0.00 26,308.41 0.00 99.80 0.00 33.71
19 100,000.00 500,000.00 219 36,205 0.60 99.89 66,759.25 144,808.52 30.92 67.06 1 280 0.35 98.94 9.10 26,317.51 0.03 99.83 0.01 18.17
20 500,000.00 UP 39 36,244 0.11 100.00 60,625.28 205,433.80 28.08 95.14 3 283 1.06 100.00 44.30 26,361.81 0.17 100.00 0.07 12.83
10,499.44 215,933.25 4.86 100.00 0 283 0.00 100.00 0.00 26,361.81 0.00 100.00 0.00 12.21
*) Multilocation = risiko multi lokasi yang karena kurang lengkapnya data yang kami terima, risiko tersebut tidak dapat kami identifikasi sebagai any one risk
PT. Asuransi MAIPARK Indonesia
RISK & LOSS PROFILE
CLAIM FREQUENCY LOSS RATIO
BAND f F ∑(d)
SUM INSURED (BAND) (In Million Rp.)
rp
GROSS PREMIUM (In Million Rp.)
PERCENTAGE
NUMBER OF RISKS
f PERCENTAGE RP ∑(p)
rp RP ∑(h)
INCURRED CLAIM (In Million Rp.)
6/30/2011
4/5/2012
01/01/2008
* ) Multilocation
FROM TOPERCENTAGEPERCENTAGE PERCENTAGE F
∑(l)

67 S t a t i s t i k A s u r a n s i G e m p a B u m i I n d o n e s i a a s a t J u n e 2 0 1 1
U NDERWRIT ING Y EAR : 2007 DAT A PO SIT IO N FRO MPRO VINC E : AllO C C U PAT IO N : Agricultural T O
PRO C ESSING DAT E
T able 6.5.1
B AND (d)/∑(d)
C U M. ∑(f)
B AND (i)/∑(i)
C U M. ∑(j)
B AND (m)/∑(m)
C U M. ∑(n)
B AND (q)/∑(q)
C U M. ∑(r)
B AND (p)/(h)
C U M. (q)/(i)
(a) (b) (c) (d) (e ) (f) (g ) (h) (i ) (j ) (k ) (l) (m) (n ) (o ) (p) (q ) (r) (s) (t) (u)
1 0.00 50.00 1 1 0.24 0.24 0.05 0.05 0.00 0.00 0 0 0.00 0.00 0.00 0.00 0.00 0.00 0.00 0.00
2 50.00 100.00 7 8 1.70 1.94 0.50 0.55 0.01 0.01 0 0 0.00 0.00 0.00 0.00 0.00 0.00 0.00 0.00
3 100.00 200.00 14 22 3.40 5.34 0.98 1.53 0.01 0.02 0 0 0.00 0.00 0.00 0.00 0.00 0.00 0.00 0.00
4 200.00 300.00 10 32 2.43 7.77 1.45 2.98 0.01 0.03 0 0 0.00 0.00 0.00 0.00 0.00 0.00 0.00 0.00
5 300.00 500.00 11 43 2.67 10.44 4.55 7.53 0.05 0.08 0 0 0.00 0.00 0.00 0.00 0.00 0.00 0.00 0.00
6 500.00 750.00 17 60 4.13 14.56 11.80 19.33 0.12 0.19 0 0 0.00 0.00 0.00 0.00 0.00 0.00 0.00 0.00
7 750.00 1,000.00 14 74 3.40 17.96 14.39 33.72 0.14 0.34 0 0 0.00 0.00 0.00 0.00 0.00 0.00 0.00 0.00
8 1,000.00 1,500.00 10 84 2.43 20.39 14.19 47.91 0.14 0.48 1 1 50.00 50.00 6.25 6.25 5.88 5.88 44.03 13.04
9 1,500.00 2,000.00 12 96 2.91 23.30 24.66 72.58 0.25 0.73 0 1 0.00 50.00 0.00 6.25 0.00 5.88 0.00 8.61
10 2,000.00 2,500.00 4 100 0.97 24.27 10.00 82.58 0.10 0.83 0 1 0.00 50.00 0.00 6.25 0.00 5.88 0.00 7.57
11 2,500.00 3,000.00 9 109 2.18 26.46 29.97 112.56 0.30 1.13 0 1 0.00 50.00 0.00 6.25 0.00 5.88 0.00 5.55
12 3,000.00 4,000.00 17 126 4.13 30.58 66.03 178.58 0.66 1.80 0 1 0.00 50.00 0.00 6.25 0.00 5.88 0.00 3.50
13 4,000.00 5,000.00 13 139 3.16 33.74 61.94 240.53 0.62 2.42 0 1 0.00 50.00 0.00 6.25 0.00 5.88 0.00 2.60
14 5,000.00 7,500.00 43 182 10.44 44.17 253.61 494.14 2.55 4.97 0 1 0.00 50.00 0.00 6.25 0.00 5.88 0.00 1.26
15 7,500.00 10,000.00 21 203 5.10 49.27 188.17 682.31 1.89 6.86 0 1 0.00 50.00 0.00 6.25 0.00 5.88 0.00 0.92
16 10,000.00 20,000.00 79 282 19.17 68.45 1,114.34 1,796.66 11.20 18.06 0 1 0.00 50.00 0.00 6.25 0.00 5.88 0.00 0.35
17 20,000.00 50,000.00 62 344 15.05 83.50 1,947.75 3,744.41 19.58 37.64 0 1 0.00 50.00 0.00 6.25 0.00 5.88 0.00 0.17
18 50,000.00 100,000.00 43 387 10.44 93.93 2,306.15 6,050.56 23.18 60.82 0 1 0.00 50.00 0.00 6.25 0.00 5.88 0.00 0.10
19 100,000.00 500,000.00 25 412 6.07 100.00 3,898.41 9,948.97 39.18 100.00 0 1 0.00 50.00 0.00 6.25 0.00 5.88 0.00 0.06
20 500,000.00 UP 0 412 0.00 100.00 0.00 9,948.97 0.00 100.00 1 2 50.00 100.00 100.00 106.25 94.12 100.00 0.00 1.070.00 9,948.97 0.00 100.00 0 2 0.00 100.00 0.00 106.25 0.00 100.00 0.00 1.07
*) Multilocation = risiko multi lokasi yang karena kurang lengkapnya data yang kami terima, risiko tersebut tidak dapat kami identifikasi sebagai any one risk
30/06/2011
05/04/2012
01/01/2007
* ) Multilocation
FRO M T OPERC ENT AG EPERC ENT AG E PERC ENT AG E F
∑(l)PERC ENT AG E
NU MB ER O F R ISKS
f PERC ENT AG E RP ∑(p)
rp RP ∑(h)
INC U RRED C LAIM (In Million Rp.)
P T . A suransi MA IP A R K Indonesia
RISK & L O SS PRO FIL E
C LAIM FREQ U ENC Y LO SS RAT IO
B AND f F ∑(d)
SU M INSU RED (B AND) (In Million Rp.)
rp
G RO SS PREMIU M (In Million Rp.)
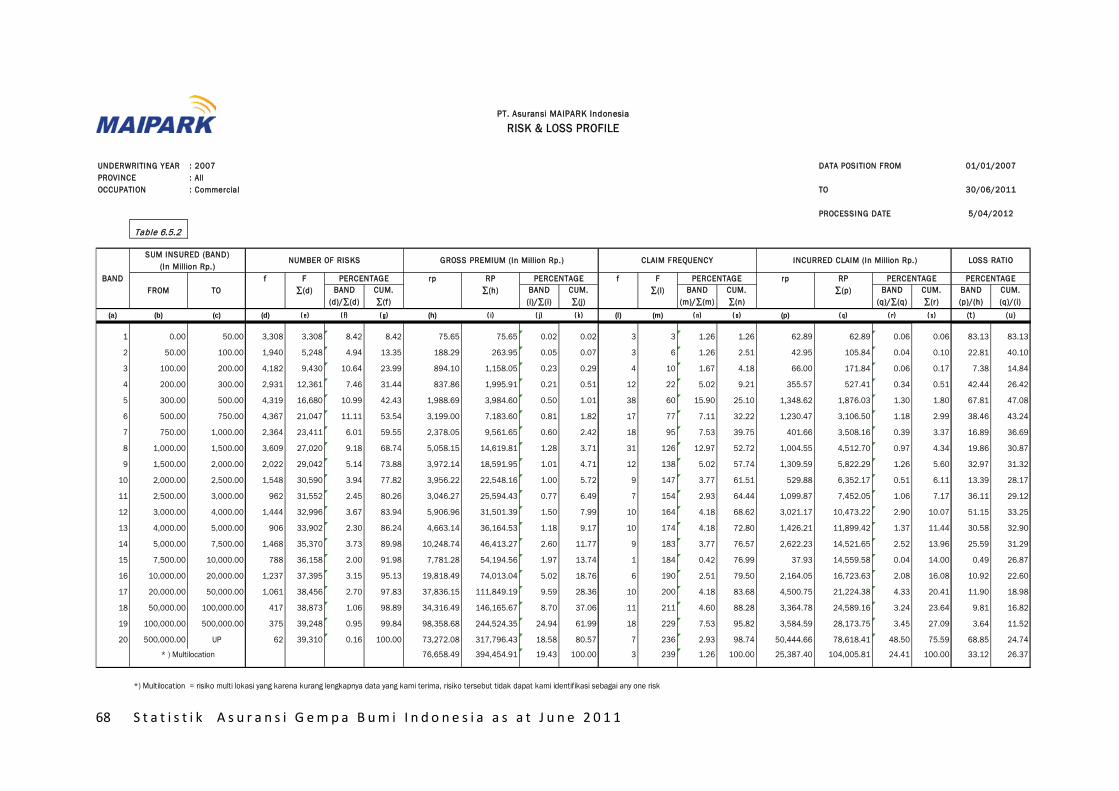
68 S t a t i s t i k A s u r a n s i G e m p a B u m i I n d o n e s i a a s a t J u n e 2 0 1 1
UNDERWRITING YEAR : 2007 DATA POSITION FROMPROVINCE : AllOCCUPATION : Commercial TO
PROCESSING DATE
Table 6.5.2
BAND (d)/∑(d)
CUM. ∑(f)
BAND (i)/∑(i)
CUM. ∑(j)
BAND (m)/∑(m)
CUM. ∑(n)
BAND (q)/∑(q)
CUM. ∑(r)
BAND (p)/(h)
CUM. (q)/(i)
(a) (b) (c) (d) ( e) ( f) ( g) (h) ( i) ( j) ( k) (l) (m) ( n) ( o) (p) ( q) ( r) ( s) (t ) (u)
1 0.00 50.00 3,308 3,308 8.42 8.42 75.65 75.65 0.02 0.02 3 3 1.26 1.26 62.89 62.89 0.06 0.06 83.13 83.13
2 50.00 100.00 1,940 5,248 4.94 13.35 188.29 263.95 0.05 0.07 3 6 1.26 2.51 42.95 105.84 0.04 0.10 22.81 40.10
3 100.00 200.00 4,182 9,430 10.64 23.99 894.10 1,158.05 0.23 0.29 4 10 1.67 4.18 66.00 171.84 0.06 0.17 7.38 14.84
4 200.00 300.00 2,931 12,361 7.46 31.44 837.86 1,995.91 0.21 0.51 12 22 5.02 9.21 355.57 527.41 0.34 0.51 42.44 26.42
5 300.00 500.00 4,319 16,680 10.99 42.43 1,988.69 3,984.60 0.50 1.01 38 60 15.90 25.10 1,348.62 1,876.03 1.30 1.80 67.81 47.08
6 500.00 750.00 4,367 21,047 11.11 53.54 3,199.00 7,183.60 0.81 1.82 17 77 7.11 32.22 1,230.47 3,106.50 1.18 2.99 38.46 43.24
7 750.00 1,000.00 2,364 23,411 6.01 59.55 2,378.05 9,561.65 0.60 2.42 18 95 7.53 39.75 401.66 3,508.16 0.39 3.37 16.89 36.69
8 1,000.00 1,500.00 3,609 27,020 9.18 68.74 5,058.15 14,619.81 1.28 3.71 31 126 12.97 52.72 1,004.55 4,512.70 0.97 4.34 19.86 30.87
9 1,500.00 2,000.00 2,022 29,042 5.14 73.88 3,972.14 18,591.95 1.01 4.71 12 138 5.02 57.74 1,309.59 5,822.29 1.26 5.60 32.97 31.32
10 2,000.00 2,500.00 1,548 30,590 3.94 77.82 3,956.22 22,548.16 1.00 5.72 9 147 3.77 61.51 529.88 6,352.17 0.51 6.11 13.39 28.17
11 2,500.00 3,000.00 962 31,552 2.45 80.26 3,046.27 25,594.43 0.77 6.49 7 154 2.93 64.44 1,099.87 7,452.05 1.06 7.17 36.11 29.12
12 3,000.00 4,000.00 1,444 32,996 3.67 83.94 5,906.96 31,501.39 1.50 7.99 10 164 4.18 68.62 3,021.17 10,473.22 2.90 10.07 51.15 33.25
13 4,000.00 5,000.00 906 33,902 2.30 86.24 4,663.14 36,164.53 1.18 9.17 10 174 4.18 72.80 1,426.21 11,899.42 1.37 11.44 30.58 32.90
14 5,000.00 7,500.00 1,468 35,370 3.73 89.98 10,248.74 46,413.27 2.60 11.77 9 183 3.77 76.57 2,622.23 14,521.65 2.52 13.96 25.59 31.29
15 7,500.00 10,000.00 788 36,158 2.00 91.98 7,781.28 54,194.56 1.97 13.74 1 184 0.42 76.99 37.93 14,559.58 0.04 14.00 0.49 26.87
16 10,000.00 20,000.00 1,237 37,395 3.15 95.13 19,818.49 74,013.04 5.02 18.76 6 190 2.51 79.50 2,164.05 16,723.63 2.08 16.08 10.92 22.60
17 20,000.00 50,000.00 1,061 38,456 2.70 97.83 37,836.15 111,849.19 9.59 28.36 10 200 4.18 83.68 4,500.75 21,224.38 4.33 20.41 11.90 18.98
18 50,000.00 100,000.00 417 38,873 1.06 98.89 34,316.49 146,165.67 8.70 37.06 11 211 4.60 88.28 3,364.78 24,589.16 3.24 23.64 9.81 16.82
19 100,000.00 500,000.00 375 39,248 0.95 99.84 98,358.68 244,524.35 24.94 61.99 18 229 7.53 95.82 3,584.59 28,173.75 3.45 27.09 3.64 11.52
20 500,000.00 UP 62 39,310 0.16 100.00 73,272.08 317,796.43 18.58 80.57 7 236 2.93 98.74 50,444.66 78,618.41 48.50 75.59 68.85 24.74
76,658.49 394,454.91 19.43 100.00 3 239 1.26 100.00 25,387.40 104,005.81 24.41 100.00 33.12 26.37
*) Multilocation = risiko multi lokasi yang karena kurang lengkapnya data yang kami terima, risiko tersebut tidak dapat kami identifikasi sebagai any one risk
30/06/2011
5/04/2012
01/01/2007
* ) Multilocation
FROM TOPERCENTAGEPERCENTAGE PERCENTAGE F
∑(l)PERCENTAGE
NUMBER OF RISKS
f PERCENTAGE RP ∑(p)
rp RP ∑(h)
INCURRED CLAIM (In Million Rp.)
PT. Asuransi MAIPARK Indonesia
RISK & LOSS PROFILE
CLAIM FREQUENCY LOSS RATIO
BAND f F ∑(d)
SUM INSURED (BAND) (In Million Rp.)
rp
GROSS PREMIUM (In Million Rp.)
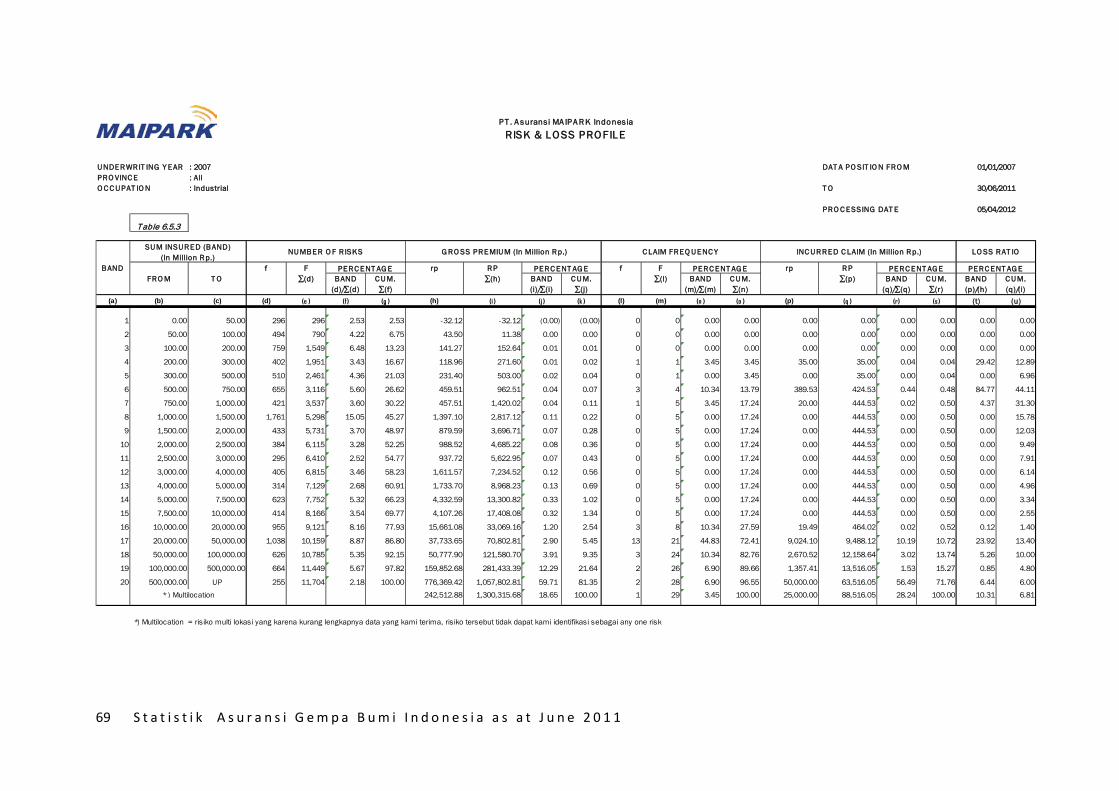
69 S t a t i s t i k A s u r a n s i G e m p a B u m i I n d o n e s i a a s a t J u n e 2 0 1 1
U NDERWRIT ING Y EAR : 2007 DAT A PO SIT IO N FRO MPRO VINC E : AllO C C U PAT IO N : Industrial T O
PRO C ESSING DAT E
T able 6.5.3
B AND (d)/∑(d)
C U M. ∑(f)
B AND (i)/∑(i)
C U M. ∑(j)
B AND (m)/∑(m)
C U M. ∑(n)
B AND (q)/∑(q)
C U M. ∑(r)
B AND (p)/(h)
C U M. (q)/(i)
(a) (b) (c) (d) (e ) (f) (g ) (h) (i ) (j ) (k ) (l) (m) (n ) (o ) (p) (q ) (r) (s) (t) (u)
1 0.00 50.00 296 296 2.53 2.53 -32.12 -32.12 (0.00) (0.00) 0 0 0.00 0.00 0.00 0.00 0.00 0.00 0.00 0.00
2 50.00 100.00 494 790 4.22 6.75 43.50 11.38 0.00 0.00 0 0 0.00 0.00 0.00 0.00 0.00 0.00 0.00 0.00
3 100.00 200.00 759 1,549 6.48 13.23 141.27 152.64 0.01 0.01 0 0 0.00 0.00 0.00 0.00 0.00 0.00 0.00 0.00
4 200.00 300.00 402 1,951 3.43 16.67 118.96 271.60 0.01 0.02 1 1 3.45 3.45 35.00 35.00 0.04 0.04 29.42 12.89
5 300.00 500.00 510 2,461 4.36 21.03 231.40 503.00 0.02 0.04 0 1 0.00 3.45 0.00 35.00 0.00 0.04 0.00 6.96
6 500.00 750.00 655 3,116 5.60 26.62 459.51 962.51 0.04 0.07 3 4 10.34 13.79 389.53 424.53 0.44 0.48 84.77 44.11
7 750.00 1,000.00 421 3,537 3.60 30.22 457.51 1,420.02 0.04 0.11 1 5 3.45 17.24 20.00 444.53 0.02 0.50 4.37 31.30
8 1,000.00 1,500.00 1,761 5,298 15.05 45.27 1,397.10 2,817.12 0.11 0.22 0 5 0.00 17.24 0.00 444.53 0.00 0.50 0.00 15.78
9 1,500.00 2,000.00 433 5,731 3.70 48.97 879.59 3,696.71 0.07 0.28 0 5 0.00 17.24 0.00 444.53 0.00 0.50 0.00 12.03
10 2,000.00 2,500.00 384 6,115 3.28 52.25 988.52 4,685.22 0.08 0.36 0 5 0.00 17.24 0.00 444.53 0.00 0.50 0.00 9.49
11 2,500.00 3,000.00 295 6,410 2.52 54.77 937.72 5,622.95 0.07 0.43 0 5 0.00 17.24 0.00 444.53 0.00 0.50 0.00 7.91
12 3,000.00 4,000.00 405 6,815 3.46 58.23 1,611.57 7,234.52 0.12 0.56 0 5 0.00 17.24 0.00 444.53 0.00 0.50 0.00 6.14
13 4,000.00 5,000.00 314 7,129 2.68 60.91 1,733.70 8,968.23 0.13 0.69 0 5 0.00 17.24 0.00 444.53 0.00 0.50 0.00 4.96
14 5,000.00 7,500.00 623 7,752 5.32 66.23 4,332.59 13,300.82 0.33 1.02 0 5 0.00 17.24 0.00 444.53 0.00 0.50 0.00 3.34
15 7,500.00 10,000.00 414 8,166 3.54 69.77 4,107.26 17,408.08 0.32 1.34 0 5 0.00 17.24 0.00 444.53 0.00 0.50 0.00 2.55
16 10,000.00 20,000.00 955 9,121 8.16 77.93 15,661.08 33,069.16 1.20 2.54 3 8 10.34 27.59 19.49 464.02 0.02 0.52 0.12 1.40
17 20,000.00 50,000.00 1,038 10,159 8.87 86.80 37,733.65 70,802.81 2.90 5.45 13 21 44.83 72.41 9,024.10 9,488.12 10.19 10.72 23.92 13.40
18 50,000.00 100,000.00 626 10,785 5.35 92.15 50,777.90 121,580.70 3.91 9.35 3 24 10.34 82.76 2,670.52 12,158.64 3.02 13.74 5.26 10.00
19 100,000.00 500,000.00 664 11,449 5.67 97.82 159,852.68 281,433.39 12.29 21.64 2 26 6.90 89.66 1,357.41 13,516.05 1.53 15.27 0.85 4.80
20 500,000.00 UP 255 11,704 2.18 100.00 776,369.42 1,057,802.81 59.71 81.35 2 28 6.90 96.55 50,000.00 63,516.05 56.49 71.76 6.44 6.00242,512.88 1,300,315.68 18.65 100.00 1 29 3.45 100.00 25,000.00 88,516.05 28.24 100.00 10.31 6.81
*) Multilocation = risiko multi lokasi yang karena kurang lengkapnya data yang kami terima, risiko tersebut tidak dapat kami identifikasi sebagai any one risk
30/06/2011
05/04/2012
01/01/2007
* ) Multilocation
FRO M T OPERC ENT AG EPERC ENT AG E PERC ENT AG E F
∑(l)PERC ENT AG E
NU MB ER O F R ISKS
f PERC ENT AG E RP ∑(p)
rp RP ∑(h)
INC U RRED C LAIM (In Million Rp.)
P T . A suransi MA IP A R K Indonesia
RISK & L O SS PRO FIL E
C LAIM FREQ U ENC Y LO SS RAT IO
B AND f F ∑(d)
SU M INSU RED (B AND) (In Million Rp.)
rp
G RO SS PREMIU M (In Million Rp.)

70 S t a t i s t i k A s u r a n s i G e m p a B u m i I n d o n e s i a a s a t J u n e 2 0 1 1
U NDERWRIT ING Y EAR : 2007 DAT A PO SIT IO N FRO MPRO VINC E : AllO C C U PAT IO N : Residential T O
PRO C ESSING DAT E
T able 6.5.4
B AND (d)/∑(d)
C U M. ∑(f)
B AND (i)/∑(i)
C U M. ∑(j)
B AND (m)/∑(m)
C U M. ∑(n)
B AND (q)/∑(q)
C U M. ∑(r)
B AND (p)/(h)
C U M. (q)/(i)
(a) (b) (c) (d) (e ) (f) (g ) (h) (i ) (j ) (k ) (l) (m) (n ) (o ) (p) (q ) (r) (s) (t) (u)
1 0.00 50.00 3,221 3,221 10.20 10.20 207.08 207.08 0.13 0.13 0 0 0.00 0.00 0.00 0.00 0.00 0.00 0.00 0.00
2 50.00 100.00 1,756 4,977 5.56 15.76 213.69 420.77 0.14 0.27 2 2 1.92 1.92 23.39 23.39 0.04 0.04 10.95 5.56
3 100.00 200.00 4,013 8,990 12.71 28.46 708.20 1,128.97 0.46 0.74 15 17 14.42 16.35 189.56 212.95 0.34 0.38 26.77 18.86
4 200.00 300.00 3,627 12,617 11.48 39.95 1,040.01 2,168.98 0.68 1.41 15 32 14.42 30.77 250.94 463.89 0.45 0.83 24.13 21.39
5 300.00 500.00 4,665 17,282 14.77 54.72 2,128.72 4,297.70 1.39 2.80 26 58 25.00 55.77 824.01 1,287.90 1.48 2.31 38.71 29.97
6 500.00 750.00 3,925 21,207 12.43 67.14 2,923.40 7,221.10 1.91 4.71 21 79 20.19 75.96 335.27 1,623.17 0.60 2.91 11.47 22.48
7 750.00 1,000.00 1,815 23,022 5.75 72.89 1,908.77 9,129.87 1.24 5.95 6 85 5.77 81.73 198.87 1,822.04 0.36 3.27 10.42 19.96
8 1,000.00 1,500.00 2,613 25,635 8.27 81.16 3,828.52 12,958.40 2.49 8.44 2 87 1.92 83.65 88.38 1,910.42 0.16 3.43 2.31 14.74
9 1,500.00 2,000.00 1,289 26,924 4.08 85.24 2,633.61 15,592.00 1.72 10.16 3 90 2.88 86.54 119.33 2,029.75 0.21 3.64 4.53 13.02
10 2,000.00 2,500.00 835 27,759 2.64 87.89 2,194.49 17,786.49 1.43 11.59 3 93 2.88 89.42 249.00 2,278.75 0.45 4.09 11.35 12.81
11 2,500.00 3,000.00 564 28,323 1.79 89.67 1,847.31 19,633.80 1.20 12.79 1 94 0.96 90.38 12.70 2,291.45 0.02 4.11 0.69 11.67
12 3,000.00 4,000.00 725 29,048 2.30 91.97 2,923.12 22,556.92 1.90 14.70 0 94 0.00 90.38 0.00 2,291.45 0.00 4.11 0.00 10.16
13 4,000.00 5,000.00 481 29,529 1.52 93.49 2,528.57 25,085.49 1.65 16.35 1 95 0.96 91.35 5.45 2,296.90 0.01 4.12 0.22 9.16
14 5,000.00 7,500.00 613 30,142 1.94 95.43 4,391.10 29,476.59 2.86 19.21 2 97 1.92 93.27 10.54 2,307.43 0.02 4.14 0.24 7.83
15 7,500.00 10,000.00 434 30,576 1.37 96.81 4,299.84 33,776.43 2.80 22.01 0 97 0.00 93.27 0.00 2,307.43 0.00 4.14 0.00 6.83
16 10,000.00 20,000.00 429 31,005 1.36 98.16 6,976.19 40,752.63 4.55 26.56 2 99 1.92 95.19 102.97 2,410.40 0.18 4.33 1.48 5.91
17 20,000.00 50,000.00 253 31,258 0.80 98.96 8,788.08 49,540.71 5.73 32.28 0 99 0.00 95.19 0.00 2,410.40 0.00 4.33 0.00 4.87
18 50,000.00 100,000.00 130 31,388 0.41 99.38 11,958.74 61,499.45 7.79 40.08 0 99 0.00 95.19 0.00 2,410.40 0.00 4.33 0.00 3.92
19 100,000.00 500,000.00 164 31,552 0.52 99.90 45,992.52 107,491.97 29.97 70.05 4 103 3.85 99.04 284.26 2,694.67 0.51 4.84 0.62 2.51
20 500,000.00 UP 33 31,585 0.10 100.00 40,757.58 148,249.55 26.56 96.61 1 104 0.96 100.00 53,000.00 55,694.67 95.16 100.00 130.04 37.575,205.78 153,455.33 3.39 100.00 0 104 0.00 100.00 0.00 55,694.67 0.00 100.00 0.00 36.29
*) Multilocation = risiko multi lokasi yang karena kurang lengkapnya data yang kami terima, risiko tersebut tidak dapat kami identifikasi sebagai any one risk
P T . A suransi MA IP A R K Indonesia
RISK & L O SS PRO FIL E
C LAIM FREQ U ENC Y LO SS RAT IO
B AND f F ∑(d)
SU M INSU RED (B AND) (In Million Rp.)
rp
G RO SS PREMIU M (In Million Rp.)
PERC ENT AG E
NU MB ER O F R ISKS
f PERC ENT AG E RP ∑(p)
rp RP ∑(h)
INC U RRED C LAIM (In Million Rp.)
30/06/2011
05/04/2012
01/01/2007
* ) Multilocation
FRO M T OPERC ENT AG EPERC ENT AG E PERC ENT AG E F
∑(l)

GLOSSARIES
1. OCCUPATION :
A - AGRICULTURAL
C - COMMERCIAL
I - INDUSTRIAL
R - RESIDENTIAL
2. ZONES (BASED ON CRESTA) :
1.1 - Banda Aceh
1.2 - Medan
1.3 - Others
1 - North Sumatera
2.1 - Padang
2.2 - Palembang
2.3 - Others
2 - South Sumatera
3.1 - DKI Jakarta
3.2 - Bandung
3.3 - Others
3 - DKI & West java

4.1 - Semarang
4.2 - Yogyakarta
4.3 - Others
4 - DIY & Central Java
5.1 - Surabaya
5.2 - Others
5 - East Java
6 - Kalimantan
7.1 - Ujung Pandang
7.2 - Others
7 - Sulawesi
8 - Other Islands
3. f : Frequencies
F : Accumulations of frequencies
Cum : Cumulative (increasing in amount by one addition after another)
4. Incurred Claim
Outstanding Claims (100%) plus paid/settled claims (100%)
5. Sum Insured The Sum Insured represents 100% Sum Insured

6. Gross Premium Gross Premium represent 100% premium
7. Loss Ratio The percentage ratio of Incurred claims to Gross Premium
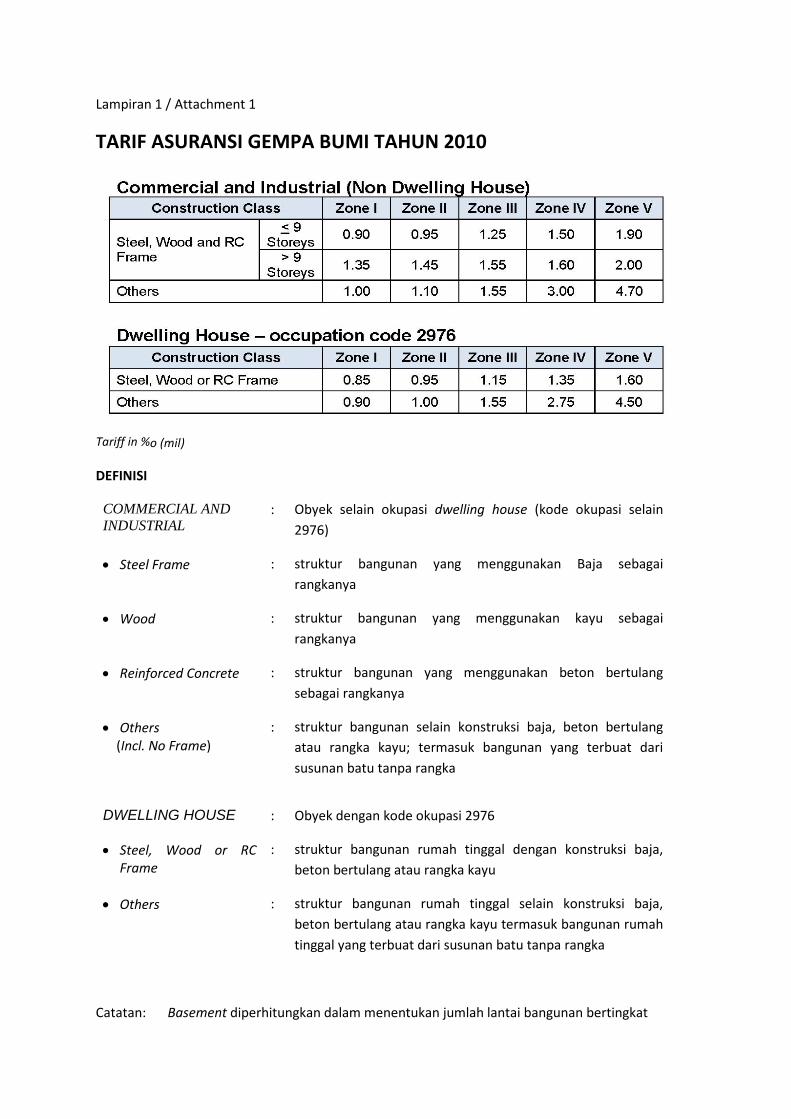
TARIF ASURANSI GEMPA BUMI TAHUN 2010
Tariff in %o (mil)
DEFINISI
COMMERCIAL AND INDUSTRIAL
: Obyek selain okupasi dwelling house (kode okupasi selain 2976)
• Steel Frame : struktur bangunan yang menggunakan Baja sebagai rangkanya
• Wood : struktur bangunan yang menggunakan kayu sebagai rangkanya
• Reinforced Concrete : struktur bangunan yang menggunakan beton bertulang sebagai rangkanya
• Others (Incl. No Frame)
: struktur bangunan selain konstruksi baja, beton bertulang atau rangka kayu; termasuk bangunan yang terbuat dari susunan batu tanpa rangka
DWELLING HOUSE : Obyek dengan kode okupasi 2976
• Steel, Wood or RC Frame
: struktur bangunan rumah tinggal dengan konstruksi baja, beton bertulang atau rangka kayu
• Others : struktur bangunan rumah tinggal selain konstruksi baja, beton bertulang atau rangka kayu termasuk bangunan rumah tinggal yang terbuat dari susunan batu tanpa rangka
Catatan: Basement diperhitungkan dalam menentukan jumlah lantai bangunan bertingkat
Lampiran 1 / Attachment 1

FIRST LOSS SCALE
Lampiran 2 / Attachment 2

TARIP SUKU PREMI KURANG
DARI 12 BULAN
JANGKA WAKTU PROSENTASI
TARIP TAHUNAN
3 hari 5%
10 hari 10%
1 bulan 20%
1.5 bulan 25%
2 bulan 30%
3 bulan 40%
4 bulan 50%
5 bulan 60%
6 bulan 70%
7 bulan 75%
8 bulan 80%
9 bulan 85%
10 bulan 90%
11 bulan 95%
lebih dari 11 bulan dihitung tarip suku premi penuh
Lampiran 3 / Attachment 3

Indemnity Period Scale
1 bulan 20% x 100% rate2 bulan 30% x 100% rate3 bulan 40% x 100% rate4 bulan 50% x 100% rate6 bulan 60% x 100% rate9 bulan 80% x 100% rate
12 bulan 100% x 100% rate15 bulan 96% x 100% rate18 bulan 93% x 100% rate21 bulan 91.5% x 100% rate24 bulan 90% x 100% rate30 bulan 87% x 100% rate36 bulan 85% x 100% rate48 bulan 83% x 100% rate
Indemnity Period
Prosentase besarnya Suku Premi atas Tarif
PRGBI
Lebih dari 48 bulan ditetapkan Komite Teknik dan / atau Managers PRGBI.
Lampiran 4 / Attachment 4