


Bahasa
Halaman
Hukum


Welfare generosity: the importance of administrative efficiency, community values, and genuine
benevolence
By: DAVID C. RIBAR and MARK O. WILHELM
David Ribar and Mark O. Wilhelm. “Welfare Generosity: The Importance of Administrative Efficiency,
Community Values and Genuine Benevolence,” Applied Economics, 28:8 (August 1996), 1045-54.
http://dx.doi.org/10.1080/000368496328173
Made available courtesy of Taylor & Francis: http://www.tandf.co.uk/journals/routledge/00036846.html
***Reprinted with permission. No further reproduction is authorized without written permission from
Taylor & Francis. This version of the document is not the version of record. Figures and/or pictures may
be missing from this format of the document.***
Abstract:
Using 1988-1991 state-level data, a public expenditure model is estimated for benefits paid through the Aid to
Families with Dependent Children (AFDC) programme. The paper investigates whether differences in
programme efficiency, community attitudes, perceptions of the effects of AFDC on recipient behaviour, and
tastes for redistribution explain the variation in public support for welfare across states.
Article:
I. INTRODUCTION
Public disenchantment in the United States with federal antipoverty programmes seems widespread and
enduring. Despite the enactment of comprehensive reform legislation in 1988 and deep social service reductions
by individual states in the early 1990s,1 the popularity of President Clinton’s 1992 campaign pledge to `end
welfare as we know it’ and the 1994 midterm electoral victory by Republicans, who ran on a platform calling
for substantial cuts in welfare spending, suggests that the public’s dissatisfaction has only intensified. Attempt-
ing to explain this dissatisfaction, policy analysts cite the affordability of programmes, frustration over
inefficient programme administration, conflicts between the values embodied in the programmes and those held
by the community, and a sense of public fatigue from contributing funds year after year to a problem that only
appears to get worse.
Economic research on the determinants of public welfare expenditures (e.g. Orr, 1976, 1979; Gramlich,1982;
Hulten et al., 1982; Moffitt, 1984, 1990) has focused almost exclusively on the affordability of programmes,
leaving political scientists to examine other issues, including bureaucratic efficiency (Woodson, 1987) and
dissonant values (Murray, 1984; Mead, 1986; Ellwood, 1988). Moreover, aside from some descriptive analyses
(e.g. Heclo, 1986), hypotheses regarding the public’s underlying preferences for redistribution have received
little attention.2
This paper empirically investigates all of these issues using a 1988-1991 panel of state-level data on
expenditures to the Aid to Families with Dependent Children (AFDC) programme, the largest cash public
assistance programme. Key variables in the analysis, such as the public’s degree of benevolence and depth of
values, are not directly observable. Consequently, the paper relies on several carefully constructed indirect
indicators. For example, the paper uses data on contributions to international relief and development
organizations (IRDOs) as a revealed preference measure of the underlying tastes for redistribution. To measure
values in conflict with those believed to be encouraged by the welfare system, the paper uses regional aggreg-
1 Between 1991 and 1992, five states cut nominal welfare benefits and thirty-two kept benefits fixed in nominal terms. See the Green
Book (Committee on Ways and Means, 1992) and Shapiro et al. (1991) for summaries of recent changes. 2 Exceptions are studies by Plotnick and Winters (1985), Plotnick (1986), Shroder (1992) and Ribar and Wilhelm (1994b) which
incorporated some political and attitudinal controls. The present paper uses a much more detailed set of variables than these earlier
studies.

ates from public opinion surveys. Finally, to measure administrative efficiency, the analysis includes the
percentage of programme costs in each state devoted to administration.
Beyond these problems of measurement, the paper addresses two other important statistical issues. First, it uses
instrumental variable methods to address endogeneity in the cost to the public of making AFDC benefits more
generous. Endogeneity arises because the total cost of welfare is driven by the number of recipients, whose
eligibility and participation decisions depend, in turn, on programme benefits. Second, as with the studies by
Gramlich (1982), Gramlich and Laren (1984), Shroder (1992) and Ribar and Wilhelm (1994b), the paper uses
fixed-effects techniques to control for potential biases associated with relevant but omitted time-invariant state-
specific variables.
The econometric results are found to be very sensitive to the inclusion of fixed effects. Models which account
for cost endogeneity but do not incorporate fixed effects provide strong support for economic and political
hypotheses. Indeed, three variables — the state’s income, its cost of increasing benefits and the percentage of its
caseload that is black — account for nearly three-quarters of the variation in benefits across states and time.
Other variables, including the paper’s measures of benevolence, administrative efficiency and political attitudes,
are also found to be significant with expected signs. A very different picture emerges, however, when fixed
effects are added. The analysis reveals that simple cross-section variation accounts for almost all of the
variation in the paper’s four-year panel. After removal of this cross-section variation, benevolence, as captured
by charitable contributions, is the only variable which remains statistically significant in most regressions.
The rest of the paper is organized as follows. Section II summarizes hypotheses offered to explain the public’s
frustration with welfare and reviews existing empirical evidence. The data and estimation strategy for the
present study are introduced in Section III. Empirical results are reported and discussed in Section IV and
conclusions are drawn in Section V.
II. PREVIOUS RESEARCH
Economic research on welfare generosity has typically proceeded from a public expenditure framework in
which voters are assumed to have preferences over their own consumption and the well-being of people in
poverty (e.g. Hochman and Rodgers, 1969). In determining individually optimal levels of consumption and
public transfers, voters are constrained by their income and the effective price of transfers. Conditional on
assumptions regarding how elections are decided, state welfare policy depends on the desired level of transfers
of a single voter (if a median voter model is used) or weighted group of voters (if more elaborate political
competition models are used). The expenditure model predicts that welfare benefits increase as the incomes of
influential voters rise and the effective price of transfers falls. With few exceptions, empirical research has
supported these predictions and found that welfare benefits are strongly positively related to income and weakly
negatively related to price.3
Although evidence in favour of the expenditure model is strong, the two primary economic variables — income
and price — together account for less than half of the variation in benefits. Accordingly, economists have
extended the model in several directions. Orr (1979), Hulten et al. (1982), Moffitt (1990) and Ribar and
Wilhelm (1994b) investigated the extent to which other forms of public support, such as Food Stamps and
Medicaid, offset states’ expenditures on AFDC. Gramlich and Laren (1984) and Shroder (1992) examined the
effects of low-income migration on welfare generosity. Extensions by Plotnick and Winters (1985) and Plotnick
(1986) incorporated controls for political competition and the strength of pro-welfare special interest groups;
Shroder (1992) and Ribar and Wilhelm (1994b) also incorporated some political and attitudinal variables.4
Although economists have emphasized issues of affordability and political power, political scientists have
offered hypotheses regarding the public’s underlying attitudes and frustration with welfare. Political analysts
3 See Ribar and Wilhelm (1994b) for a detailed summary of the empirical economic research.
4 Other related studies with political modelling include Craig and Inman (1986), Peterson and Rom (1989) and Tweedie (1991).

have attributed much of the pressure for reform to inadequacies in the welfare programmes and the political
institutions which have constrained their evolution. For instance, Murray (1984), Mead (1986) and Ellwood
(1988) emphasized the aspects of welfare that create incentives detrimental to economic self-sufficiency and
traditional notions of the family.5 Woodson (1987) argued that welfare has created an inefficient bureaucracy
which inhibits beneficial reform.
Though it is central to the theories of both economists and political scientists, basic American benevolence has
received little attention from researchers. This may stem from extreme assumptions that benevolence is either a
uniformly strong motivation across Americans or an altogether weak and unimportant motivation.6 Support for
the first view comes from opinion polls such as the General Social Survey (GSS), which indicate that, although
a large majority of the population believe that either the `right amount’ or `too much’ is spent on welfare, a
nearly equal majority feel that `too little’ is spent on assistance to the poor (Heclo, 1986). On the other hand,
there is evidence that calls American generosity into question. Private contributions to social welfare
organizations, totalling no more than 0.2% of GNP (Weber, 1991), do not reveal an exuberant preference for
generosity. Also, compared to the United States, other industrialized countries have more extensive antipoverty
programmes and achieve much lower post-transfer poverty rates (Smeeding, 1992).
Moreover, the view that Americans’ benevolence and values are uniform does not withstand careful scrutiny.
Responses to welfare-oriented questions in the GSS (National Opinion Research Center, 1992) show regional
variation. The existence of geographical variation in private charitable contributions is also well known (see
Wolpert, 1988; Ribar and Wilhelm, 1994a). Plotnick and Winters (1985) examined the relationship between
charitable behavior and public welfare generosity using geographic variation in United Way contributions and
itemized federal income tax deductions. Their results did not indicate that benevolence was an important
determinant of welfare benefits.7
III. ESTIMATION METHODOLOGY AND DATA
The econometric model is a straightforward extension of the expenditure models examined in other studies. In
particular, it specifies AFDC benefits in state i and year t, Bit, as an isoelastic function of income, Yit, and the
effective price of increasing benefits by one dollar, pit. Benefits are also assumed to depend on a vector of other
observed attributes, Zit, and an unobserved component, εit, such that
The vector Zit includes measures of administrative efficiency, benevolence and values.
There are several potential difficulties in estimating Equation 1. First, it is unclear which specific variables
should be used for Bit, Yit and pit. For benefits, researchers have used a number of alternative measures,
including average AFDC benefits per recipient and maximum benefits for a given size family.8 The advantage
of the former measure is that it summarizes information about relevant state policies and recipient
characteristics into a single index; the disadvantage is that it is not a direct policy outcome. This paper uses
average AFDC benefits per recipient as its primary measure of welfare generosity and examines maximum
5 Economic theory is clear about the existence of such disincentive effects. However, the empirical magnitude of these effects (and by
presumption, their practical relevance for undermining political support for welfare) is an open question (see the reviews by Burtless,
1990; Moffitt, 1992). 6 Ellwood (1988) provides an example of how analysts have treated this issue. Though he acknowledged that `stinginess surely plays a
role in attitudes toward welfare’, Ellwood went on to attribute public distaste for welfare primarily to its inconsistency with accepted
values of work, individual responsibility and family. 7 Plotnick and Winters acknowledged there were problems with their preference measures (e.g. the measures were negatively
correlated). Their tax measure may have more closely proxied the income distribution than tastes for redistribution. Their
contributions measure
— gifts to United Way — may have been affected by crowd-out from local social service spending. 8 Some researchers have also examined maximum combined AFDC, Food Stamp and Medicaid benefits.

benefits in some sensitivity analyses. The other two variables — Yit and pit — should correspond to the income
and price for the influential voter or voters. Unfortunately, there is no simple way of identifying these
individuals. Therefore, average total personal income in the state is used as an approximation for Yit. Likewise
for price it is assumed that the costs of the welfare programme are evenly distributed across residents. Thus, the
price to a particular resident of increasing average welfare benefits by one dollar is pit = (1 - sit) Rit/Nit where
sit is the subsidy rate from the federal government, Rit is the number of recipients and Nit is the state’s
population.9
Second, benevolence and values are not directly observable; hence, indirect measures must be constructed. As
with Plotnick and Winters (1985), it is assumed that charitable contributions reveal a preference for giving. But
their methodology is refined by using a measure of giving — aggregate data on contributions drawn directly
from the computerized records of three large IRDOs — that is unlikely to be affected by crowd-out from local
welfare expenditures.10
Data on community attitudes and values come from two sources. An index of
congressional voting records published by Americans for Democratic Action (1988—1991) serves as a proxy
for liberal political attitudes. To measure other attitudes, responses to questions on moral values and welfare
attitudes from the GSS have been aggregated by the nine census divisions.11
Questions fielded in each of the
years 1988—1991 regarding welfare spending, premarital sex and women’s work roles provide region- and
time-varying controls for community values.12
Questions asked in 1983—1987 concerning perceptions of
welfare incentives are used simply as regional controls.13
A third concern is the possibility of simultaneity bias in the price coefficient. Endogeneity arises in the
recipiency component of price because of the direct effects of benefit guarantees and reduction rates on
programme eligibility and the incentive effects of benefits on recipiency and recipiency-related behaviour. To
address this problem, the paper uses two-stage methods to instrument for the price variable.
Fourth, coefficient estimates from Equation 1 may be biased if there are relevant explanatory variables that are
correlated with Yit, pit or Zit but inadvertently omitted from the regression. Gramlich (1982), Gramlich and
Laren (1984), Shroder (1992) and Ribar and Wilhelm (1994b) have demonstrated that these biases may be
substantial. Accordingly, all of the paper’s regressions include annual dummy variables to capture effects of
economy-wide shocks and changes in federal policy.14
The regressions alternately rely on regional dummy
variables or state fixed effects to account for unobserved geographic variation in preferences and institutions.
Table 1 lists definitions, sources and simple descriptive statistics for the variables used in the analysis. All of the
dollar-denominated variables are deflated to 1988 levels using the implicit GNP deflator for personal
consumption expenditures. With the exception of the measures for benevolence and values, all variables come
from standard published sources.
9 For 1988—1991 subsidies for all states followed the Federal Medical Assistance Percentage schedule.
10 The organizations have requested anonymity but can be characterized as follows. The organizations are widely recognized and
strongly associated with international relief and development. Each operates programmes in the tens of millions of dollars and uses a
large majority of its resources for foreign, rather than domestic, assistance (see Ribar and Wilhelm, 1994a, for further analysis and
documentation). 11
The GSS is a repeated cross-section survey that has been fielded in almost every year since 1972. Disaggregation by state would be
preferred; however, the survey is not designed to provide random samples at that level. 12
The spending variable indicates whether people thought `too much’ is spent on welfare. The premarital sex variable indicates
whether people thought premarital sex is `always’ or `almost always’ wrong. Female work attitudes refer to whether people approved
of women working outside the home. 13
The work, fertility and marriage measures indicate whether individuals `agreed’ or `strongly agreed’ with the following statements:
Welfare makes people work less than they would if there wasn’t a welfare system.
Welfare encourages young women to have babies before marriage.
Welfare discourages young women who get pregnant from marrying the father of the child. 14
Economy-wide shocks during this period include the Gulf War and the 1990-1991 recession. Federal public assistance policy also
shifted with the enactment and phased implementation of the Family Support Act of 1988.

IV. RESULTS
Table 2 reports estimates from an initial series of state-level regressions. The regressions all include the
`standard’ variables - income, price and black caseload - used by previous researchers (e.g. Orr, 1976, 1979;
Hulten et al., 1982; Moffitt, 1984) and add measures for charitable contributions, administrative overhead, and
political and social attitudes. The specifications differ in their controls for unobserved geographic factors, with
the first three incorporating regional dummy variables and the next three using state fixed effects. The models
also differ in their treatment of the price variable. In the first OLS and fixed effects (FE) regressions, price is
specified as an exogenous determinant of benefits. The subsequent regressions use two-stage least squares
(2SLS) and fixed effects (2SFE) under alternative identifying assumptions to account for the possible
endogeneity of the price variable.
The results from the first OLS specification indicate that income, price and charitable contributions have
significant positive effects, and that the proportion of black recipients and opinions against premarital sex have
significant negative effects on welfare benefits. The coefficients on administrative expenditures and political
ideology are statistically insignificant. Overall, the analysis variables provide an excellent fit (R2 = 0.831). With
the exception of the price coefficient, the estimates are consistent with expectations. The income and black
caseload results are also consistent with previous findings. Simultaneity bias provides the most likely
explanation for the counter-intuitive price result.15
The next column in Table 2 reports results from a 2SLS regression that uses exclusion restrictions on the state
financing share and lagged recipiency to identify the price effect. This model produces coefficient estimates that
are nearly identical to those of the preceding OLS regression. The similarity of the results reflects the high
degree of longitudinal correlation in recipiency rates. The results further suggest that price endogeneity stems,
at least partly, from correlations between persistent unobserved determinants of recipiency and states’ AFDC
policies. This implies that lagged recipiency may not be a suitable identifying variable for 2SLS.16
To provide an alternative basis for identification, the 2SLS regression in the third column uses restrictions on
the financing share, female unemployment and poverty rate variables. This specification generates very
different results than the previous two regressions. The most dramatic change involves the price coefficient,
which switches sign and becomes significant. Two other variables - administrative expenditures and the ADA
ranking - are also now estimated to be statistically significant with the anticipated signs. Among the remaining
variables, the coefficients on income, charitable contributions and attitudes toward premarital sex maintain their
signs and significance but increase in magnitude. The black caseload coefficient remains significantly negative
but decreases in magnitude.
The next three columns repeat the foregoing analysis but replace the regional dummies with state fixed effects.
The fixed-effects approach has benefits and drawbacks. By purging the sample of all time-invariant geographic
variation, state dummies provide a more complete control than regional dummies for omitted variables bias.
Unfortunately, conditional on the longitudinal variability of the data, removing the cross-section variation may
leave little to test.17
This `mixed blessing’ is apparent in the four-year sample where the combination of state
and time effects accounts for 99.5% of the variation in welfare benefits.
15
The price coefficient conforms with other OLS estimates based on 1980s data but not with estimates based on 1960s and 1970s data.
Ribar and Wilhelm (1994b) presented evidence that the degree of endogeneity bias increased in the later period and attributed this
increase to programmatic changes (e.g. the move to a 100% benefit reduction rate) enacted as part of the Omnibus Reconciliation Act
of 1981. 16
However, exclusion restrictions on lagged recipiency may still be appropriate in a 2SFE model. 17
The fixed effects approach may also exacerbate bias from endogenous and mismeasured variables.

Most of the coefficients decrease in magnitude and lose their significance in the fixed-effects regressions. The
only variable that remains consistently significant is charitable contributions. The coefficient on administrative
expenditures is also significant in one of the regressions. Especially striking is the disappearance of the strong
income and black caseload effects from previous specifications. The difference between the OLS and FE
estimates is not altogether

surprising given the lack of longitudinal variation. The pattern of results suggests that state AFDC policies
respond slowly or only to established trends in economic and attitudinal variables.
To assess the sensitivity of the economic and attitudinal results, Table 3 reports estimates from regressions that
incorporate alternative sets of explanatory variables. All of the models in Table 3 are estimated using 2SLS and
2SFE with exclusion restrictions on the financing share, female unemployment and poverty rate variables. The
first specification replicates the models from the earliest AFDC studies (e.g. Orr, 1976) by dropping all of the
preference controls except for the black caseload variable. The economic and black caseload coefficients are
clearly sensitive to this respecification. Removing the attitudinal variables leads to stronger income and black
caseload estimates, and weaker price estimates.
The second specification checks the sensitivity of the estimation results to the inclusion of the black caseload
variable. Dropping this variable noticeably decreases the fit of the model. Although the income coefficient is
essentially unchanged from the third column of Table 2, the other coefficients all become substantially stronger.
The largest changes include a doubling of the price coefficient and a 50% increase in the charitable
contributions coefficient.
The third specification adds controls for the percentage of the population over age 65, the percentage with a
high school education, the percentage with college and the percentage who are black. Besides capturing the
preferences of various demographic groups, these variables may proxy underlying needs, permanent wealth and
competing resource demands within a state. The added controls are individually and jointly significant.
Although inclusion of demographic controls moves most of the other coefficients toward the previous table’s
2SFE estimates, all but the price coefficient maintain their signs and significance.
The last three regressions in Table 3 repeat these analyses, controlling for state- rather than region-specific
effects. As before, the use of fixed effects substantially reduces the size of most of the coefficients. The
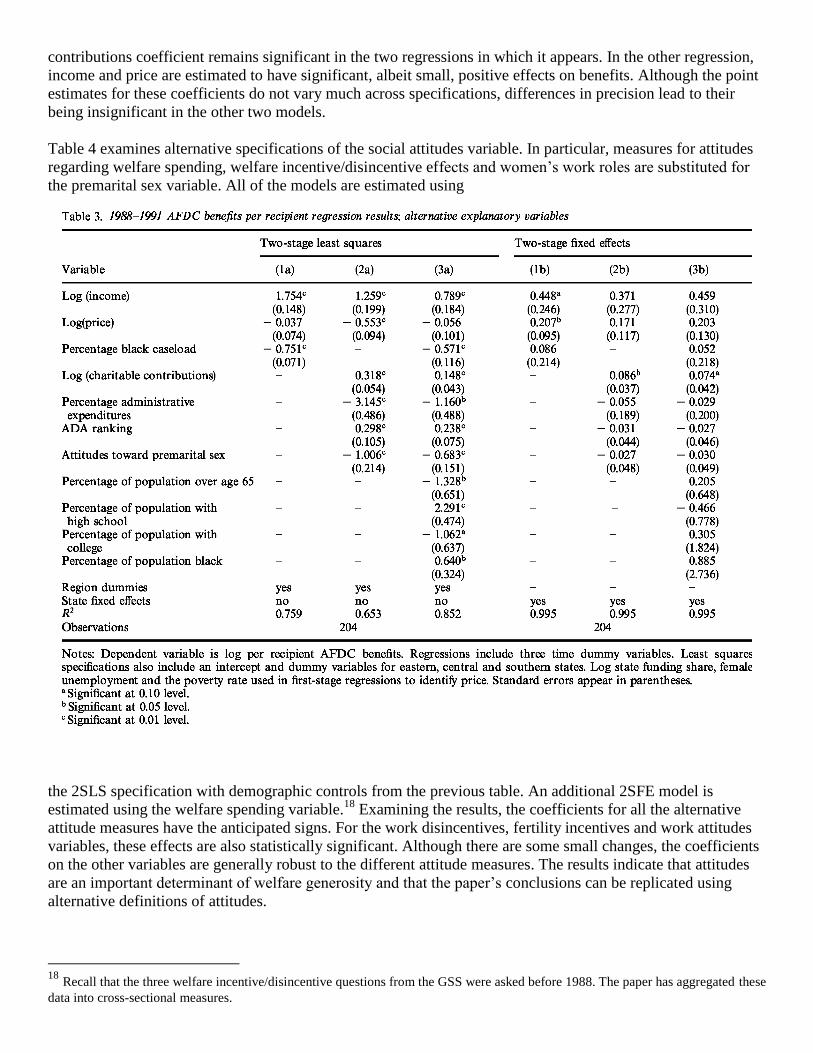
contributions coefficient remains significant in the two regressions in which it appears. In the other regression,
income and price are estimated to have significant, albeit small, positive effects on benefits. Although the point
estimates for these coefficients do not vary much across specifications, differences in precision lead to their
being insignificant in the other two models.
Table 4 examines alternative specifications of the social attitudes variable. In particular, measures for attitudes
regarding welfare spending, welfare incentive/disincentive effects and women’s work roles are substituted for
the premarital sex variable. All of the models are estimated using
the 2SLS specification with demographic controls from the previous table. An additional 2SFE model is
estimated using the welfare spending variable.18
Examining the results, the coefficients for all the alternative
attitude measures have the anticipated signs. For the work disincentives, fertility incentives and work attitudes
variables, these effects are also statistically significant. Although there are some small changes, the coefficients
on the other variables are generally robust to the different attitude measures. The results indicate that attitudes
are an important determinant of welfare generosity and that the paper’s conclusions can be replicated using
alternative definitions of attitudes.
18
Recall that the three welfare incentive/disincentive questions from the GSS were asked before 1988. The paper has aggregated these
data into cross-sectional measures.

Finally, to examine the sensitivity of the results to the choice of dependent variable, Table 5 reports 2SLS esti
mates based on maximum rather than average benefits. The use of maximum benefits has two advantages
relative to average benefits: maximum benefits are a direct policy instrument, and maximum benefits are not
likely to be spuriously negatively correlated with recipiency. Despite the differences in the calculation of the
dependent variables, the 2SLS estimates in Table 5 are virtually the same as the results from the earlier tables.
In the 2SFE regressions, the coefficients on income and price increase in magnitude and become statistically
significant whereas the coefficient on charitable contributions decreases slightly and loses its significance.
Overall, the results indicate that the paper’s 2SLS findings are robust to respecification of the dependent
variable whereas its 2SFE findings are somewhat less so.
V. CONCLUSION
Using 1988-1991 state-level data, an examination was made of the economic and political determinants of
AFDC spending. The economic variables include per capita income and the effective price of AFDC for states.
The analysis also incorporates measures for programme administrative expenses, community attitudes,
benevolence and ethnic composition of the AFDC caseload. Models that use regional dummy variables to
account for unobserved cross-section heterogeneity replicate previous studies’ findings of strong positive
(roughly unit elastic) income effects and modest negative price effects. Estimates from these models also

indicate that benevolence and liberal political attitudes increase, and that largely black caseloads, high
programme overhead and conservative social/welfare attitudes decrease welfare generosity.
With the exception of the coefficient on benevolence, these economic and preference effects disappear when
state- specific fixed effects are introduced into the models. It is unclear whether the difference in results reflects
the effects of omitted time-invariant variables or simply a lack of longitudinal variation in the data. However,
the robustness of the estimates in the regressions with regional controls coupled with the excellent fit of those
regressions suggests that the latter conclusion is more likely.
Although the estimated effects of the charitability, administrative overhead and attitude variables provide
support
for hypotheses offered by political analysts, their interpretation merits some caution. First, contributions to
IRDOs proxy benevolence; they do not directly measure it. Although the empirical results are consistent with an
interpretation of benevolence, they do not preclude other interpretations (e.g. contributions are tax deductible
and may simply be larger in high tax, high service states). Second, administrative expenditures are included in
the empirical specifications without developing a formal model of programme administration. Thus,
administrative expenditures are equated with programme inefficiency without considering the positive effects
they may have on service delivery and programme enforcement.
These caveats aside, the results do have some intriguing implications for current efforts at welfare reform.
Viewed one way, work requirements for welfare recipients and benefit reductions for women who bear children
while on AFDC do not seem particularly generous. However, by increasing public support for AFDC in
conservative states, reform along these lines may lead to higher benefits overall. Similarly, reforms that enhance
programme efficiency, either by streamlining requirements or moving toward unrestricted block grants, may
also increase benefits. Unfortunately, as the black caseload results make clear, a policy of increased state
flexibility might not be universally beneficial.
ACKNOWLEDGEMENTS
The authors acknowledge Tammy Kolbe for expert research assistance, the Graduate Program in Policy
Analysis at Penn State for financial support, and Mark Shroder for helpful comments. They especially thank the
international relief and development organizations which kindly provided state-level data on contributions.
REFERENCES
Americans for Democratic Action (1988-1991) ADA Today, Washington, DC.
Burtless, G. (1990) The economist’s lament: public assistance in America, Journal of Economic Perspectives, 4,
57-78.
Committee on Ways and Means, US House of Representatives (1992) The Green Book: Background Material
and Data on Programs within the Jurisdiction of the Committee on Ways and Means, US, Government Printing
Office, Washington, DC.
Craig, S. and Inman, R.P. (1986) Education welfare and the `new’ federalism: state budgeting in a federalist
public economy, in Studies in State and Local Public Finance, ed. H. Rosen, University of Chicago Press,
Chicago.
Ellwood, D. (1988) Poor Support: Poverty in the American Family, Basic Books, New York.
Gramlich, E. (1982) An econometric examination of the new federalism, Brookings Papers on Economic
Activity, 2: 327-60.
Gramlich, E. and Laren, D. (1984) Migration and income redistribution responsibilities, Journal of Human
Resources, 19, 489-511.
Heclo, H. (1986) The political foundations of antipoverty policy, in Fighting Poverty: What Works and What
Doestn’t, eds S. Danziger and W. Weinberg, Harvard University Press, Cambridge, MA.
Hochman, H. and Rodgers, J. (1969) Pareto optimal redistribution, American Economic Review, 59, 542-57.
Hulten, C., McCallum, J., Durman, E. and Michel, R. (1982) A model of state determination of AFDC benefits,
mimeo, Urban Institute.
Mead, L. (1986) Beyond Entitlement: The Social Obligations of Citizenship, Free Press, New York.
Moffitt, R. (1984) The effects of grants-in-aid on state and local expenditures: the case of AFDC, Journal of
Public Economics, 23,279-305.
Moffitt, R. (1990) Has state redistribution policy grown more conservative? National Tax Journal, 43, 123-42.
Moffitt, R. (1992) Incentive effects of the US welfare system: a review, Journal of Economic Literature, 30, 1-
61.
Murray, C. (1984) Losing Ground: America’s Social Policy, 1950-1980, Basic Books, New York.
National Opinion Research Center (1992) General Social Survey, 1972-91: Cumulative Codebook, University
of Chicago Press, Chicago.
Orr, L. (1976) Income transfers as a public good: an application to AFDC, American Economic Review, 66,
359-71.
Orr, L. (1979) Food stamps for AFDC families: income supplementation or fiscal relief? mimeo, US
Department of Health, Education and Welfare.
Peterson, P. and Rom, M. (1989) American federalism, welfare policy and residential choices, American
Political Science Review, 83, 711-28.
Plotnick, R. (1986) An interest group model of direct income redistribution, Review of Economics and
Statistics, 68, 594-602.

Plotnick, R. and Winters, R. (1985) A politico-economic theory of income redistribution, American Political
Science Review, 79, 458-73.
Ribar, D. and Wilhelm, M. (1994a) Charitable contributions to international relief and development, mimeo,
Pennsylvania State University.
Ribar, D. and Wilhelm, M. (1994b) The effects of costs, resources, interstate and interprogram competition, and
redistributional preferences on AFDC expenditures, mimeo, Pennsylvania State University.
Shapiro, I., Sheft, M., Strawn, J., Summer, L., Greenstein, R. and Gold, S. (1991) The States and the Poor: How
Budget Decisions in 1991 Affected Low Income People, Center on Budget and Policy Priorities, Washington,
DC.
Shroder, M. (1992) A test of the external-effects argument against subnational redistribution, mimeo, US
Department of Housing and Urban Development.
Smeeding, T. (1992) Why the US antipoverty system doesn’t work very well, Challenge, 35(1), 30-35.
Tweedie, J. (1991) Looking to the states: a state-centered model of welfare policymaking, mimeo, State
University of New York, Binghampton.
US Bureau of Labor Statistics (various years) Geographic Profile of Employment and Unemployment, US
Government Printing Office, Washington, DC.
US Bureau of the Census (1990) Current Population Reports, Series P-25, No. 1058, State Population and
Household Estimates: July 1, 1989, US Government Printing Office, Washington, DC.
US Bureau of the Census (1992) Current Population Reports, Series P-60, No. 175, Poverty in the United
States: 1990, US Government Printing Office, Washington, DC.
Weber, N. (ed.) (1990) Giving USA, American Association of Fund- Raising Counsel, New York.
Wolpert, J. (1988) The geography of diversity: metropolitan disparities in donations and support for the
amenities, Annals of the Association of American Geographics, 78, 665-79.
Woodson, R. (1987) The poor and conservatives versus and poverty industry, The Heritage Foundation,
Washington, DC.
.
Top Related
Copyright © 2022 FDOKUMEN

