


Bahasa
Halaman
Hukum

Watershed-scale modeling of the waterquality effects of cropland conversion toshort-rotation woody crops
Karen Updegraff1,*, Prasanna Gowda2 and David J. Mulla2
1South Dakota School of Mines and Technology, Institute of Atmospheric Sciences, 501 E. St. Joseph St.,Rapid City, SD 57701, USA.2University of Minnesota, Department of Soil, Water and Climate, 1991 Upper Buford Circle, St. Paul,MN 55108, USA.*Corresponding author: [email protected]
Accepted 8 January 2004 Research Paper
AbstractThe conversion of cropland to the production of woody biomass, or short-rotation woody crops (SRWCs), has the poten-
tial to provide an economic alternative to Midwestern farmers, while simultaneously offering an environmental dividend
in the form of reduced erosion and nutrient pollution of streams. However, notwithstanding a wealth of plot-scale and
anecdotal data suggestive of these bene®ts, there are few watershed-scale integrated analyses on which to base regional
policy decisions regarding incentives to convert ®elds to SRWCs. This study applied a ®eld-scale runoff, sediment and
nutrient transport model (Agricultural Drainage and Pesticide Transport, ADAPT) to a simulation of 10, 20 and 30%
cropland conversion to SRWCs, grown on a 5-year rotation, in a representative Minnesota River sub-watershed. While
the generation of a highly precise simulation would require extensive calibration of the model, its application with para-
meters previously calibrated to neighboring, similar watersheds provided reasonably robust results that indicated real dif-
ferences resulting from cropland conversion. At the highest conversion level, mean annual runoff was reduced by up to
9%, sediment loads by 28% and nitrogen (N) loads by 15%, although total phosphorus (P) loads increased by 2% rela-
tive to the no-SRWC scenario. However, the relative bene®ts of conversion at the ®eld level were contingent on soil
type, drainage status and the alternative crop. These differences provide useful insights with respect to the targeting of
possible conversion incentives.
Key words: ADAPT, nitrate, sediment, short-rotation woody crops, watershed models
Introduction
Short-rotation woody crop (SRWC) production systems
have been the focus of much recent research, both because
of their commercial potential and because of the perceived
environmental dividend compared to conventional crop-
ping systems. The production of biomass crops has the
potential to provide an economic alternative for farmers
faced with low prices for row crops. Biomass crops and
residues already constitute the most signi®cant proportion
of the US renewable energy supply, and woody biomass
crops may provide a feasible alternative source of ®ber for
an evolving forest products industry. Perennial cropping
systems also tend to perform much better than annual crops
with respect to nutrient sequestration and soil stabilization.
These bene®ts have been cited as justi®cation for some
degree of public investment, in the form of subsidies or
incentives to farmers, to reduce private risk and to
encourage cropland conversion to trees1.
Potential reductions in erosion and agricultural runoff,
with commensurate improvements in surface water
quality, are important considerations in most US crop-
land conservation programs, including the Conservation
Reserve Program (CRP) and the Environmental Quality
Incentives Program (EQIP). Excessive sediment loads
can lead to high water-treatment costs and large
expenditures on culvert, ditch and reservoir maintenance.
The positive economic impact of water-quality improve-
ment on recreational values has been documented
extensively2±5.
# CAB International 2004
Renewable Agriculture and Food Systems: 19(2); 118±127 DOI: 10.1079/RAFS200472
Systematic evaluations of the environmental and social
bene®ts of cropland conversion to SRWCs have been
constrained by the relative novelty of SRWC systems, which
represent a synthesis of farming and forestry. A number of
relevant regional- or national-scale modeling and valuation
exercises have been conducted to assess the water-quality
impacts of the CRP6,7. The information resulting from these
studies has generally been too broad in scope to be useful for
region-speci®c policy development.
Because of the prominence of surface water quality as an
environmental issue in the Minnesota River Basin, which is
heavily agricultural, the sediment and nutrient loading
effects of converting land in row crops to trees are of
immediate concern to policy makers. Field- and plot-scale
studies of trees planted in cropland with and without cover
crops have demonstrated reductions in sediment and
nutrient delivery to streams, ranging from nonsigni®cant
to as much as 64%8,9.
However, there are few watershed-scale integrated
evaluations of this effect. Notable exceptions include a
study by Licht10, who reported a 69% reduction in NO3-N
losses based on a paired-watershed comparison of in-®eld
and riparian tree plantings with conventional crops in Iowa.
In a study comparing conventional corn with agroforestry
(oak, Quercus spp.) and contour grass strips, initial
measurements indicated that the grass strips retained
about 18% more nutrients and sediment than the (widely
spaced) trees11. The data emerging from these studies are as
yet too limited and site-speci®c to serve as a basis for
policy decisions.
The study described in this paper was part of a broader
analysis of the environmental impact of cropland conver-
sion to hybrid poplar (Populus spp.) SRWCs. Its objective
was to provide data that were geographically speci®c but
also generalized enough to be scalable to the river-basin
level, thereby constituting a policy-relevant analysis with
respect to a major farming region of Minnesota. This report
will focus on the watershed-scale modeling of cropland
conversion to SRWCs, and the water-quality predictions
that resulted from it.
Methods
Watershed location
The High Island Creek (HIC) watershed is one of the few
rural sub-watersheds of the Lower Minnesota River in
southern Minnesota (44°N, 94°W). High Island Creek, a
second-order stream, and its major tributary, Buffalo Creek,
are 91 and 25 km long, respectively. The topography of the
watershed is mostly ¯at to gently rolling, but the eastern
portion consists of steep hills and bluffs bordering the
Minnesota River Valley. Nearly 85% of the 62,023-ha
watershed is in row crops (corn, soybeans, small grains and
forage), with an additional 5% in pasture or hay, 5%
forested, 3% urban and 2.5% water or wetland12. An
estimated 49% of the cropland has tile drainage installed13.
The 1998 MN 305(b) Assessment of Stream Water Quality
rated most of HIC as `threatened' or `partially supporting'
with respect to support of aquatic life and various
indicators, including oxygen depletion, turbidity, habitat
alteration and bacteria14. Seven lakes in the HIC watershed
have some type of public access. The two for which lake
water-quality data were available from the Minnesota
Pollution Control Agency (MPCA) were classi®ed as `non-
supporting' with respect to swimming, although all lakes
support some level of ®shing.
Watershed modeling
The ADAPT (Agricultural Drainage and Pesticide
Transport) model15 is a ®eld-scale water-table management
model that was developed by enhancing GLEAMS16, a
root-zone water-quality model, with the subsurface drai-
nage algorithms from DRAINMOD, a subsurface drainage
and deep seepage model17. Its consequent ability to predict
tile drainage contributions to runoff, nutrient and pesticide
loads make it particularly valuable in the midwestern US,
where nearly 30% of agricultural land has been modi®ed by
drainage18. Watershed-scale methodology and water-
routing algorithms were developed by Gowda et al.19.
The model is comprised of hydrology, erosion, nutrient and
pesticide modules. The hydrology component simulates
major surface and subsurface hydrologic processes, includ-
ing snowmelt, in®ltration, surface runoff, evapotranspira-
tion, subsurface drainage, subirrigation and deep seepage.
Model outputs included total runoff and loadings of
sediment, nutrients and pesticides on daily, monthly or
annual timesteps.
Model input. Climatic inputs to the ADAPT model
included daily precipitation, temperature, humidity, wind
velocity and solar radiation data for the simulation period
(1996±2000). The 5-year period was selected to evaluate
the water-quality impacts of a complete rotation of hybrid
poplar, as proposed for a biomass power project near St.
Peter, MN20. Precipitation data were obtained from four
stations dispersed around the watershed. In the model
simulation, a simple median precipitation value was used as
it gave better runoff predictions during initial tests than
simple average or Theissen polygon methods13.
Generalized agricultural management data21±24 were
incorporated into crop data ®les originally developed by
Dalzell13. These included crop rotations for corn, soybeans
and wheat, planting and harvesting dates, tillage and
fertilizer operations. Parameter ®les were also provided
for noncrop land uses, such as pasture, forest and urban
development.
Plant growth parameters for hybrid poplar, such as
seasonal changes in leaf area index (LAI), rooting depth,
biomass accumulation and carbon:nitrogen (C:N) and
nitrogen:phosphorus (N:P) ratios were generalized from
an extensive literature on poplar growth physiology, largely
from the North Central region of the US25±29. Leaf litter
returns to the soil were simulated by adjusting the model's
yield ratio parameter.
Water quality effects of cropland conversion 119
Management parameters for hybrid poplar were based on
local guidelines for farm-scale production of hybrid poplar
in Minnesota30. Model parameters assumed fall tillage
(including an application of glyphosate), with further
tillage and planting the following spring. Weed control
included herbicide applications in the spring of the ®rst
3 years, and mechanical weed control (rotary hoe tillage)
seven times in the ®rst year and twice in the second
and third years. N fertilizer was applied at a rate of
168 kg N ha±1 in the third year. Tillage and fertilizer inputs
for conventional crops and hybrid poplar are compared in
Table 1.
The ADAPT runoff routing module operates on hydro-
logic response units (HRUs), which are hydrologically
unique polygons composed of geographically indexed
overlays of soil type, land use, slope, crop and tillage
information. The HIC watershed includes four STATSGO
(State Soil Geographic Database) soil map units (Table 2),
with average slope ranging from 3 to 17% and in texture
classes from ®ne argillic to sandy. Identical HRUs were
aggregated to form transformed HRUs, or THRUs. It
should be noted that THRUs do not retain the positional
information initially present in the HRUs. This data
arrangement is based on the assumption that the time of
concentration in the study watershed is less than 24 h, the
time-step resolution of the model. This assumption is valid
for the HIC watershed. Geographic information system
(GIS) overlay analysis of land use, tillage, soil and slope
layers for the HIC watershed resulted in 36 THRUs.
Cropland conversion to SRWCs was simulated at rates of
approximately 10, 20 and 30% (4665, 9664 and 14,645 ha)
of the base-case cropland area, respectively. We assumed
that less productive and more erosive (higher slope) HRUs
were the most likely to be taken out of crop production.
Similarly, conventionally tilled HRUs were converted by
preference over HRUs already in conservation tillage, in
order to avoid increasing erosion rates. No pasture, grass or
forested land was converted to SRWCs.
In the absence of information with respect to the spatial
distribution of tile drainage, THRUs were assigned to the
drained or undrained categories with reference to the
STATSGO cropland ratings (see Table 2). For example, all
THRUs of the Lester-Hawick-Terril (LHT) soil group were
assumed undrained, as these soils are coarser and more
sloping than the other soil groups in the watershed. Further,
it was considered most likely that higher-value cropland
(rated `prime') would have drainage installed. No drained
THRUs were converted to SRWCs except at the 30%
conversion level. The ®nal distribution of THRUs for each
simulation was such that 49% of the THRUs were always
classi®ed as `drained', in conformance with the 49%
drainage rate estimated for this watershed. ADAPT
apportions runoff differently if drainage is present.
Therefore the model is run independently for drained and
undrained THRUs, and the results are summed to determine
the watershed response at the outlet.
The simulation was run for 6 years, with the ®rst year
serving to `prime' the model and allow site preparation
impacts to be included. Fall site preparation impacts were
assumed to manifest as sediment delivered during the
second year of the simulation.
Graphic analyses and t-tests for differences between
means were performed in the package R31.
Results and Discussion
Notwithstanding substantial inter-annual variability in
modeled runoff and loading levels, ADAPT consistently
simulated end-of-rotation reductions in sediment and
nitrogen loadingsÐboth at the ®eld-scale and at the
Table 1. Management inputs for major cropping systems
included in the simulation, summed over the 5-year SRWC
rotation. The ®rst `priming' year of the simulation has no
SRWCs and is excluded.
Crop rotation1 Number of
tillage operations
Fertilizer
(kg NO3/NH4 ha±1)
Conventional tillage
Corn 15 644.3
Wheat 15 382.7
Corn/soy/corn 15 424.3
Soy/corn/soy 15 299.8
SRWC2 11 168.0
Reduced tillage
Corn 10 644.3
Wheat 10 382.7
Corn/soy/corn 10 424.3
Soy/corn/soy 10 299.8
SRWC 1 168.0
1 Corn and soybean rotations are simulated separately, as: `corn/
soy/corn' indicates that the rotation begins with corn, while
`soy/corn/soy' indicates that it begins with soybeans.2 SRWC, short-rotation woody crop.
Table 2. Descriptive data for STATSGO soil map units in the High Island Creek watershed.
Abbreviation Series Mean slope Texture range
CNG Canisteo-Nicollet-Glencoe 0.031 Fine loamy±sandy
LCC Lester-Cordova-Canisteo 0.040 Fine argillic±sandy
CMC Chaska-Minneiska-Colo 0.069 Fine silty±coarse loamy
LHT Lester-Hawick-Terril 0.170 Fine loamy±sandy
120 K. Updegraff et al.
watershed scaleÐresulting from conversion of cropland to
SRWCs. This was not true with respect to phosphorus
loading. The magnitude of these reductions grew as
increasing proportions of cropland were converted to
SRWCs (Table 3).
Model validation
Flow predictions were compared with long-term stream
monitoring data collected by the US Geologic Survey
(USGS)32.
Deviations of modeled annual ¯ow values (which
averaged 77.8 million m3) from annual USGS ¯ow
estimates (average 87.4 million m3) ranged from 6 to
292%, with the latter high value occurring in 2000, an
unusually dry year. High Island Creek in its lower reaches
passes over coarse streambed sediments that effectively
result in subsurface ¯ow during dry periods (see docu-
mentation of subsurface ¯ow in the Minnesota River
passing over similar sediments just upstream of its
con¯uence with High Island Creek33). This effect likely
skews the ¯ow-monitoring data. Average deviation from
measured annual ¯ows, excluding 2000, was 13%. ADAPT
underpredicted total annual ¯ows in 1995±1998 and
overpredicted in 1999±2000.
Excluding the subsurface ¯ow issue, the largest deviation
in the annual ¯ow predictions from observed data is partly
due to the lack of spatial variability in modeled precipita-
tion across the watershed. In the Minnesota River Basin,
the intensity of precipitation usually varies from west to
east and a single median precipitation value, based on four
stations scattered over the watershed, may not have
captured extreme events that occurred, for example, in
2000. Monthly observed precipitation values from four
dispersed stations deviated by 69±97%, on average, from
the median value over the 1997±2000 period. An area-
weighted averaging method (such as the Thiessen polygon
approach), might have achieved a better approximation of
watershed-wide rainfall, given the apparent strong pre-
cipitation gradient across the watershed and the nonuniform
distribution of gauge stations. Initial comparisons of
median and Thiessen-weighted average values did not
suggest that the latter method would substantially improve
¯ow predictions, but these comparisons were not made for
all years of the simulation.
Table 3. Percent change in annual runoff and nutrient yield compared to the default (no short-rotation woody crops, SRWC)
cropping con®guration. Negative values indicate a decrease compared to the default. The actual modeled values for the default
simulation are presented for context.
Year Runoff (m3 3 106) Sediment (Mg) Nitrogen (Mg) Phosphorus (Mg)
Default yield and loading values
1996 62 18677 198 122
1997 107 47582 307 326
1998 64 4551 33 55
1999 101 4983 39 46
2000 56 5202 39 33
Mean 78 16199 123 116
Percent change from default
10% Conversion
1996 ±1.5 ±21.8 ±3.9 0.2
1997 ±3.6 ±44.1 ±15.3 ±0.4
1998 6.9 ±19.7 4.3 ±1.9
1999 ±5.9 13.0 ±1.2 21.8
2000 ±13.1 1.7 ±7.4 7.9
Mean ±3.4 ±14.2 ±4.7 5.5
20% Conversion
1996 ±3.6 ±25.5 ±3.3 1.4
1997 ±6.5 ±56.2 ±26.8 ±0.4
1998 18.2 ±19.3 12.3 0.9
1999 ±16.6 ±2.9 ±19.9 29.1
2000 ±29.0 ±13.2 ±25.5 5.2
Mean ±7.5 ±23.4 ±12.6 6.9
30% Conversion
1996 ±5.6 ±26.9 ±8.1 2.7
1997 ±15.1 ±65.1 ±35.4 ±7.6
1998 12.8 ±26.6 3.3 ±10.4
1999 ±8.7 ±4.9 ±22.5 17.4
2000 ±28.4 ±17.8 ±12.4 9.5
Mean ±9.0 ±28.2 ±15.0 2.3
Water quality effects of cropland conversion 121
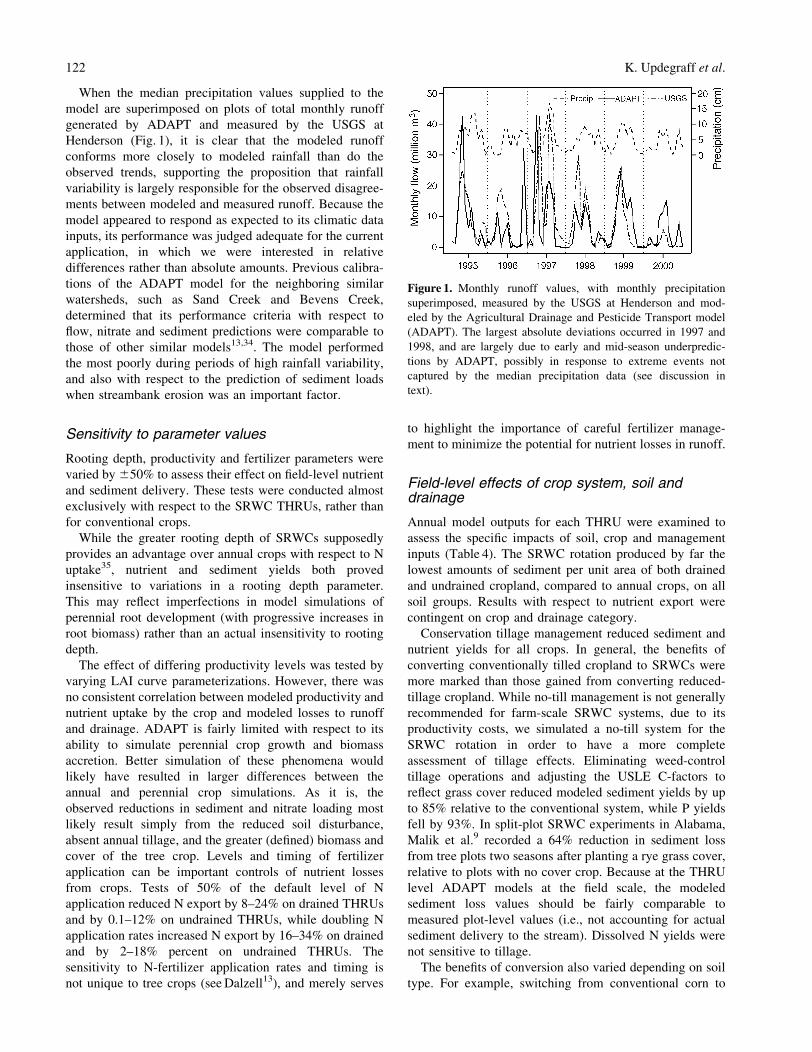
When the median precipitation values supplied to the
model are superimposed on plots of total monthly runoff
generated by ADAPT and measured by the USGS at
Henderson (Fig. 1), it is clear that the modeled runoff
conforms more closely to modeled rainfall than do the
observed trends, supporting the proposition that rainfall
variability is largely responsible for the observed disagree-
ments between modeled and measured runoff. Because the
model appeared to respond as expected to its climatic data
inputs, its performance was judged adequate for the current
application, in which we were interested in relative
differences rather than absolute amounts. Previous calibra-
tions of the ADAPT model for the neighboring similar
watersheds, such as Sand Creek and Bevens Creek,
determined that its performance criteria with respect to
¯ow, nitrate and sediment predictions were comparable to
those of other similar models13,34. The model performed
the most poorly during periods of high rainfall variability,
and also with respect to the prediction of sediment loads
when streambank erosion was an important factor.
Sensitivity to parameter values
Rooting depth, productivity and fertilizer parameters were
varied by 650% to assess their effect on ®eld-level nutrient
and sediment delivery. These tests were conducted almost
exclusively with respect to the SRWC THRUs, rather than
for conventional crops.
While the greater rooting depth of SRWCs supposedly
provides an advantage over annual crops with respect to N
uptake35, nutrient and sediment yields both proved
insensitive to variations in a rooting depth parameter.
This may re¯ect imperfections in model simulations of
perennial root development (with progressive increases in
root biomass) rather than an actual insensitivity to rooting
depth.
The effect of differing productivity levels was tested by
varying LAI curve parameterizations. However, there was
no consistent correlation between modeled productivity and
nutrient uptake by the crop and modeled losses to runoff
and drainage. ADAPT is fairly limited with respect to its
ability to simulate perennial crop growth and biomass
accretion. Better simulation of these phenomena would
likely have resulted in larger differences between the
annual and perennial crop simulations. As it is, the
observed reductions in sediment and nitrate loading most
likely result simply from the reduced soil disturbance,
absent annual tillage, and the greater (de®ned) biomass and
cover of the tree crop. Levels and timing of fertilizer
application can be important controls of nutrient losses
from crops. Tests of 50% of the default level of N
application reduced N export by 8±24% on drained THRUs
and by 0.1±12% on undrained THRUs, while doubling N
application rates increased N export by 16±34% on drained
and by 2±18% percent on undrained THRUs. The
sensitivity to N-fertilizer application rates and timing is
not unique to tree crops (see Dalzell13), and merely serves
to highlight the importance of careful fertilizer manage-
ment to minimize the potential for nutrient losses in runoff.
Field-level effects of crop system, soil anddrainage
Annual model outputs for each THRU were examined to
assess the speci®c impacts of soil, crop and management
inputs (Table 4). The SRWC rotation produced by far the
lowest amounts of sediment per unit area of both drained
and undrained cropland, compared to annual crops, on all
soil groups. Results with respect to nutrient export were
contingent on crop and drainage category.
Conservation tillage management reduced sediment and
nutrient yields for all crops. In general, the bene®ts of
converting conventionally tilled cropland to SRWCs were
more marked than those gained from converting reduced-
tillage cropland. While no-till management is not generally
recommended for farm-scale SRWC systems, due to its
productivity costs, we simulated a no-till system for the
SRWC rotation in order to have a more complete
assessment of tillage effects. Eliminating weed-control
tillage operations and adjusting the USLE C-factors to
re¯ect grass cover reduced modeled sediment yields by up
to 85% relative to the conventional system, while P yields
fell by 93%. In split-plot SRWC experiments in Alabama,
Malik et al.9 recorded a 64% reduction in sediment loss
from tree plots two seasons after planting a rye grass cover,
relative to plots with no cover crop. Because at the THRU
level ADAPT models at the ®eld scale, the modeled
sediment loss values should be fairly comparable to
measured plot-level values (i.e., not accounting for actual
sediment delivery to the stream). Dissolved N yields were
not sensitive to tillage.
The bene®ts of conversion also varied depending on soil
type. For example, switching from conventional corn to
Figure 1. Monthly runoff values, with monthly precipitation
superimposed, measured by the USGS at Henderson and mod-
eled by the Agricultural Drainage and Pesticide Transport model
(ADAPT). The largest absolute deviations occurred in 1997 and
1998, and are largely due to early and mid-season underpredic-
tions by ADAPT, possibly in response to extreme events not
captured by the median precipitation data (see discussion in
text).
122 K. Updegraff et al.
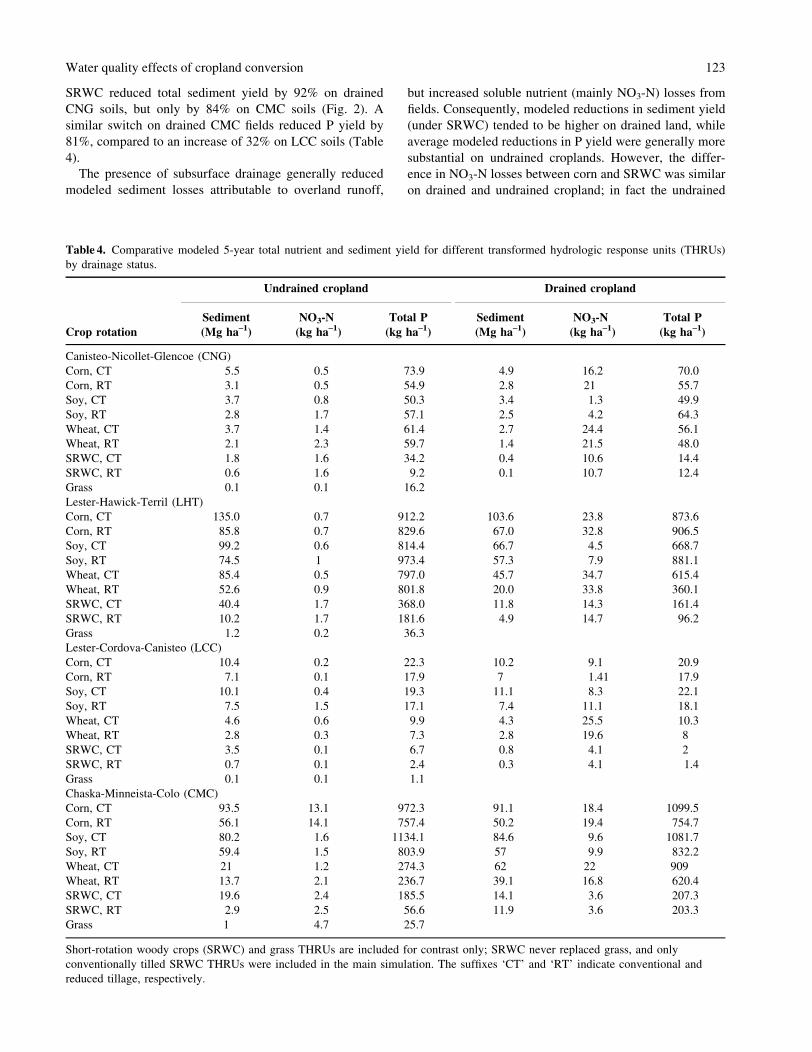
SRWC reduced total sediment yield by 92% on drained
CNG soils, but only by 84% on CMC soils (Fig. 2). A
similar switch on drained CMC ®elds reduced P yield by
81%, compared to an increase of 32% on LCC soils (Table
4).
The presence of subsurface drainage generally reduced
modeled sediment losses attributable to overland runoff,
but increased soluble nutrient (mainly NO3-N) losses from
®elds. Consequently, modeled reductions in sediment yield
(under SRWC) tended to be higher on drained land, while
average modeled reductions in P yield were generally more
substantial on undrained croplands. However, the differ-
ence in NO3-N losses between corn and SRWC was similar
on drained and undrained cropland; in fact the undrained
Table 4. Comparative modeled 5-year total nutrient and sediment yield for different transformed hydrologic response units (THRUs)
by drainage status.
Undrained cropland Drained cropland
Crop rotation
Sediment
(Mg ha±1)
NO3-N
(kg ha±1)
Total P
(kg ha±1)
Sediment
(Mg ha±1)
NO3-N
(kg ha±1)
Total P
(kg ha±1)
Canisteo-Nicollet-Glencoe (CNG)
Corn, CT 5.5 0.5 73.9 4.9 16.2 70.0
Corn, RT 3.1 0.5 54.9 2.8 21 55.7
Soy, CT 3.7 0.8 50.3 3.4 1.3 49.9
Soy, RT 2.8 1.7 57.1 2.5 4.2 64.3
Wheat, CT 3.7 1.4 61.4 2.7 24.4 56.1
Wheat, RT 2.1 2.3 59.7 1.4 21.5 48.0
SRWC, CT 1.8 1.6 34.2 0.4 10.6 14.4
SRWC, RT 0.6 1.6 9.2 0.1 10.7 12.4
Grass 0.1 0.1 16.2
Lester-Hawick-Terril (LHT)
Corn, CT 135.0 0.7 912.2 103.6 23.8 873.6
Corn, RT 85.8 0.7 829.6 67.0 32.8 906.5
Soy, CT 99.2 0.6 814.4 66.7 4.5 668.7
Soy, RT 74.5 1 973.4 57.3 7.9 881.1
Wheat, CT 85.4 0.5 797.0 45.7 34.7 615.4
Wheat, RT 52.6 0.9 801.8 20.0 33.8 360.1
SRWC, CT 40.4 1.7 368.0 11.8 14.3 161.4
SRWC, RT 10.2 1.7 181.6 4.9 14.7 96.2
Grass 1.2 0.2 36.3
Lester-Cordova-Canisteo (LCC)
Corn, CT 10.4 0.2 22.3 10.2 9.1 20.9
Corn, RT 7.1 0.1 17.9 7 1.41 17.9
Soy, CT 10.1 0.4 19.3 11.1 8.3 22.1
Soy, RT 7.5 1.5 17.1 7.4 11.1 18.1
Wheat, CT 4.6 0.6 9.9 4.3 25.5 10.3
Wheat, RT 2.8 0.3 7.3 2.8 19.6 8
SRWC, CT 3.5 0.1 6.7 0.8 4.1 2
SRWC, RT 0.7 0.1 2.4 0.3 4.1 1.4
Grass 0.1 0.1 1.1
Chaska-Minneista-Colo (CMC)
Corn, CT 93.5 13.1 972.3 91.1 18.4 1099.5
Corn, RT 56.1 14.1 757.4 50.2 19.4 754.7
Soy, CT 80.2 1.6 1134.1 84.6 9.6 1081.7
Soy, RT 59.4 1.5 803.9 57 9.9 832.2
Wheat, CT 21 1.2 274.3 62 22 909
Wheat, RT 13.7 2.1 236.7 39.1 16.8 620.4
SRWC, CT 19.6 2.4 185.5 14.1 3.6 207.3
SRWC, RT 2.9 2.5 56.6 11.9 3.6 203.3
Grass 1 4.7 25.7
Short-rotation woody crops (SRWC) and grass THRUs are included for contrast only; SRWC never replaced grass, and only
conventionally tilled SRWC THRUs were included in the main simulation. The suf®xes `CT' and `RT' indicate conventional and
reduced tillage, respectively.
Water quality effects of cropland conversion 123
SRWC THRUs actually exported more dissolved N than
corn or soybeans on some of the soil groups. This may be
due to lower initial uptake rates by the young trees, or an
indirect consequence of litter accumulation, which could
result in higher levels of soluble nutrients being held at the
surface and thus susceptible to runoff removal. In most
cases the ratio of dissolved (as reported in Table 4) to
sediment-associated N was at least a factor of 10 higher for
SRWCs than for other crops; dissolved plus sediment N
export was almost always lower from SRWCs than from
any other crop. The model does not report litter accumula-
tion, and the overwhelming in¯uence of rainfall and spring
runoff patterns on annual variations in nutrient export made
it dif®cult to document a trend of increasing dissolved N
export with stand development; further, such a detailed
analysis of model behavior is beyond the scope of this
paper.
In sum, the largest overall erosion bene®ts were realized
by replacing corn with SRWCs on either drained or
undrained soils, but the picture with respect to nutrients
was more complicated. The largest NO3-N reductions could
be realized by replacing wheat on some drained soils, but
the largest P reductions tended to result from the
replacement of either corn or soybeans, depending on soil
and drainage status. To reduce sediment yields, one would
certainly want to displace conventionally tilled corn.
Watershed-level effects of SRWC conversion
The effects of 10, 20 and 30% cropland conversion to
SRWC on annual runoff, sediment and nutrient delivery at
the watershed outlet are summarized in Table 3. The
largest proportional reductions in sediment and nitrate
yield, which tended to occur in 1997 (a wet year), did not
always correspond to the largest reductions in total runoff,
which occurred in 2000 (a dry year). During some years
sediment and nutrient delivery were actually higher in the
SRWC scenarios than they were in the default; this was
particularly true of P delivery, which tended to increase
following conversion to SRWC. However, under the 20 and
30% conversion scenarios sediment delivery consistently
declined relative to the default. It is notable that the greatest
incremental reductions in sediment delivery were achieved
at the 10 and 20% conversion levels, where the largest
Figure 2. Percent reduction in 5-year modeled sediment yield (Mg ha±1) of short-rotation woody crops (SRWC) relative to other
crop/tillage systems, by soil group and drainage status. The suf®x `T' (e.g., CornT) indicates conventional tillage, while `RT' indi-
cates reduced tillage. The increases in sediment relative to RT wheat on LCC and CMC are probably due to the better ground cover
provided by wheat stubble on these poorly drained soils, which are more sloping than CNG soils and ®ner-textured than LHT soils.
See Table 2 for an explanation of CNG, LCC, CMC and LHT.
124 K. Updegraff et al.
proportion of the most erosive land and crop systems were
moved into SRWC production.
Peak ¯ows (annual maximum ¯ow rates, which ranged
from 50 to 372 m3 s±1 in the default and from 33 to
373 m3 s±1 in the 30% conversion scenario) did not vary
signi®cantly among scenarios (Pt > 0.05), but were highest
in the default scenario during every year except 1995 and
1998. Annualized standard deviations were higher in 4 of
the 6 years in the default scenario, compared to 30%
conversion (range 5±24 versus 4±20 m3 s±1), although the
differences were not signi®cant, based on pairwise t-tests
(Pt > 0.2). The slight moderating effect of conversion to
SRWCs on peak ¯ows, possibly due to their longer growing
season and increasing transpirative capacity, supports the
conclusions of a 2-year study in the Red River Valley36,
that mature hybrid poplar plantations behave hydrologi-
cally more like natural forests than like annual crops. The
potential for hydrograph moderation may be an important
consideration in ¯ood-prone areas.
Similarly, the differences among scenarios in annual
total nutrient and sediment yields were not signi®cant (Pt >
0.05). However, the lack of signi®cance may be due in part
to the very small sample size (4 points per comparison).
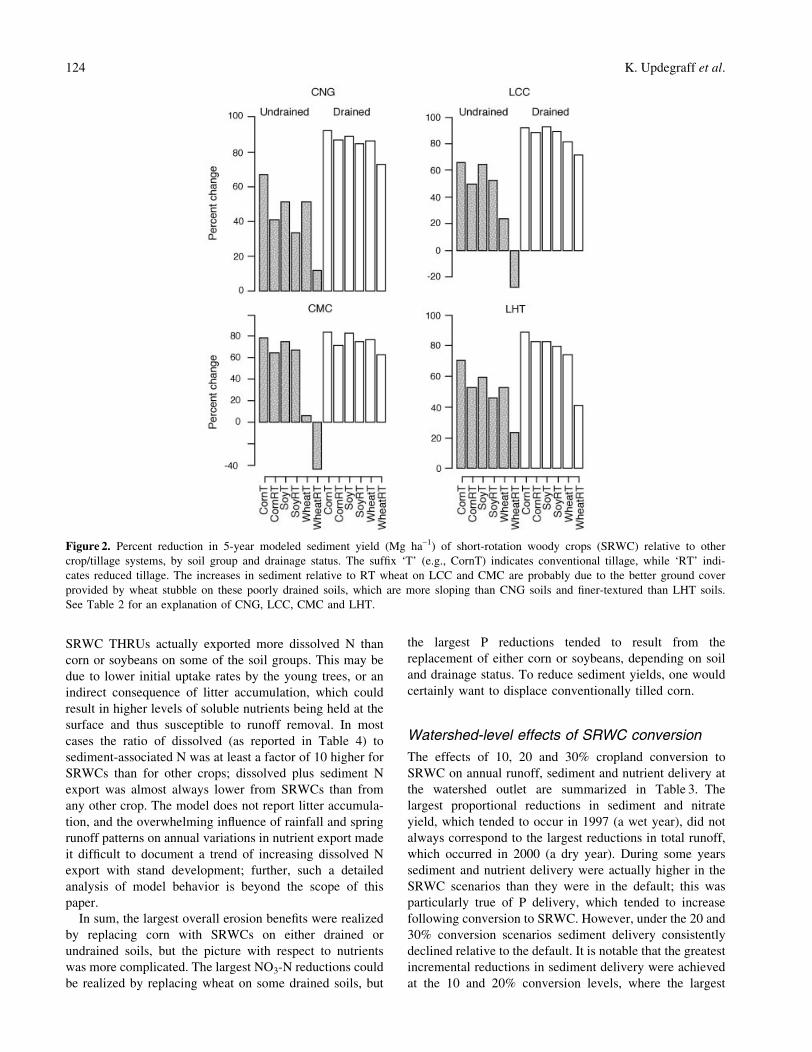
Average modeled reductions in sediment yield over the
entire rotation ranged from 14% for 10% conversion to
28% for 30% conversion. Mean annual NO3-N yields fell
by up to 15% (Fig. 3). By contrast, mean P yields actually
increased by up to 7% following conversion.
Although total P export from SRWC THRUs was
generally lower than from other crops, the ratio of
dissolved to sediment-associated nutrients (see discussion
above) tended to be a factor of 10±100 higher in SRWCs.
Because only about 18% of the sediment exported from a
®eld actually enters the stream, dissolved nutrients
comprise a much higher proportion of the nutrient load
leaving the watershed. Therefore the relative nutrient
contribution of SRWC ®elds to the nutrient load is higher
than from ®elds that export primarily sediment-associated
N and P. This would be especially true at the 30%
conversion level, in which some drained THRUs were
converted to SRWCs. As noted above, the higher relative
concentrations of dissolved P and N may result from leaf
litter decomposition, since the model parameters were
modi®ed to simulate the litter component. Tolbert et al.8
speculated that increased P export following canopy
closure in sweetgum (Liquidambar styraci¯ua L.) plots in
Figure 3. Summary of percent changes in modeled mean annual runoff and loadings (Mg) of sediment, nitrate and phosphorus (P)
relative to the default (no short-rotation woody crops, SRWC) watershed condition. `Percent conversion' refers to the modeled con-
version scenario, as in Table 3.
Water quality effects of cropland conversion 125
Alabama might be attributable to an increase in the
availability of organically bound P in the litter. In sum,
the relatively higher dissolved phosphorus and nitrogen
losses may partially account for the fact that reductions in
sediment yield under SRWCs were much more marked
compared to rowcrop HRUs.
Conclusions
The model results unequivocally indicate reductions in
peak ¯ows, as well as in annual sediment and nitrate
delivery to the Minnesota river, following conversion of
agricultural lands to SRWC production. Conversion of at
least 10% of the cropland could theoretically produce
sediment reductions in excess of the MPCA goal of 10%
reduction in 10-year average sediment discharge rates by
2010 for the Minnesota River37. However, the goal of a
30% reduction in average NO3-N discharge would not be
achieved under any of the conversion scenarios, although
annual reductions as high as 35% were achieved in some
years with 30% cropland conversion. While the comparison
suffers from incomplete data (the MPCA discharge
reductions are relative to 1980±1996 averages, which we
did not model), the results do suggest that more
comprehensive land use and management changes would
have to be implemented to achieve the MPCA goal for this
watershed. Conversion to SRWCs with less intensive
management, and particularly with lower N fertilization
rates, could be more effective in reducing nutrient losses.
The acceleration of dissolved nutrient transport by tile
drainage may also constrain the bene®cial effect of
cropland conversion to SRWC.
On the whole, the model results suggest that while
cropland conversion to SRWCs may be very effective at
reducing sediment delivery to streams, its effect on nutrient
delivery will likely be contingent on overall management
and by the extent to which drainage remains an important
factor in this watershed. Our interpretations of model
results were limited by model shortcomings with respect to
the simulation of perennial cropping systems. The incor-
poration of more sophisticated vegetation and crop
parameterizations, such as those implemented in the
REMM model for riparian zones38 would substantially
improve the usefulness of the model with respect to
perennial crops. An additional, and related, issue is the
limited ability of ADAPT to properly simulate nutrient
movement within and among vegetation compartments,
particularly when a perennial below-ground component is
involved. Finally, the aggregation of THRUs and the limits
of our spatial resolution meant that it was not possible to
specify, for example, riparian planting locations for
SRWCs. The special functions of forested riparian
zones39±41 make the location of SRWC plantings relative
to streams of particular interest, and it would be useful to
explore this.
Notwithstanding these limitations, the modeling results
with respect to relative changes in nutrient and sediment
delivery were suf®ciently consistent and robust to be useful
for policy guidance. The ®eld-level results highlighted the
importance of targeted incentives to optimize the water-
quality bene®ts of cropland conversion to SRWC.
Maximum sediment reduction bene®ts would be derived,
for example, from the conversion of conventionally tilled
corn on undrained, erosive soils. No-till or reduced-tillage
management would further optimize the bene®t of conver-
sion: the no-till simulation produced much greater reduc-
tions in nutrient and sediment export, relative to the
intensively managed SRWC (Table 4).
Policy decisions such as those regarding land-use
incentive programs need to be based on the best informa-
tion available. This project has demonstrated that useful
information can be obtained from existing models and data
when the resources for complete calibration and re-
parameterization of models are not available. At the same
time, it is important to recognize that such information can
serve only as a qualitative guide.
Modeling results suggest that cropland conversion to
SRWCs might be a viable and cost-effective approach to
reducing agricultural sediment and nutrient runoff in the
Minnesota River watershed. Modeled differences in
relative bene®ts depending on soil type and physiography,
as well as on the alternative management system, can
provide guidance for possible targeting of incentives to
farmers in order to optimize the bene®ts of cropland
conversion.
References
1 CRPD 2001. Short rotation woody crops: a role for the State of
Minnesota. Minnesota State University, Center for Rural
Policy and Development, Mankato, Minnesota, USA.
2 Vaughan, W., Russell, C., Gianessi, L., and Nielsen, L. 1982.
Measuring and predicting water quality in recreation related
terms. Journal of Environmental Management 15:363±380.
3 Ribaudo, M., Young, C., and Epp, D. 1984. Recreation
bene®ts from an improvement in water quality at St. Albans
Bay, Vermont (Staff Report AGES 840127). USDA Economic
Research Service, Natural Resource Economics Division.
4 Henry, R., Ley, R., and Welle, P. 1988. The economic value of
water resources: the Lake Bemidji survey. Journal of the
Minnesota Academy of Science 53(3):37±44.
5 Jacobson, P., Close, T., Anderson, C., and Kelly, T. 1999.
Attitudes of Minnesota residents about ®sheries issues.
Investigational Report 478. Minnesota Department of
Natural Resources.
6 Feather, P., Hellerstein, D., and Hansen, L. 1999. Economic
valuation of environmental bene®ts and the targeting of
conservation programs: the case of CRP. Agricultural
Economic Report AER 778. USDA Economic Research
Service, Resource Economics Division.
7 Ribaudo, M. 1989. Water quality bene®ts from the
Conservation Reserve Program (Agricultural Economic
Report AER 606). USDA Economic Research Service.
8 Tolbert, V., Thornton, F., Joslin, J., Beck, B., Bandaranayake,
W., Tyler, D., Pettry, D., Green, T., Malik, R., Bingham, L.,
Houston, A., Shires, M., Dewey, J., and Schoenholtz, S. 1998.
126 K. Updegraff et al.
Soil and water quality aspects of herbaceous and woody
energy crop production: lessons form research-scale compar-
isons with agricultural crops. BioEnergy '98ÐThe Eighth
National Bioenergy Conference: Expanding Bioenergy
Partnerships, 4±8 October 1996, Madison, Wisconsin, USA.
9 Malik, R.K., Green, T.H., Brown, G.F. and Mays, D. 2000.
Use of cover crops in short rotation hardwood plantations to
control erosion. Biomass and Bioenergy 18:479±487.
10 Licht, L. 1994. Ecolotree buffers strategically planted on Iowa
farms for ecological and commercial value. Working Trees:
Farming in the 1990's. Owatonna, Minnesota, USA.
11 Udawata, R., Krstansky, J., Henderson, G., and Garrett, H.
2002. Agroforestry practices, runoff, and nutrient loss: a
paired watershed comparison. Journal of Environmental
Quality 31:1214±1225.
12 High Island Watershed Assessment Project. Available at
website http://cgee.hamline.edu/rivers/MRN/HIWAP/ (veri-
®ed 29 February 2004).
13 Dalzell, B. 2000. Modeling and evaluation of non point source
pollution in the Lower Minnesota River Basin. Master's thesis,
University of Minnesota, St. Paul, Minnesota, USA.
14 MPCA 1999. Minnesota River Basin Assessment of Stream
Water Quality. Based on the 1998 MN 305(b) Report to
Congress of the United States. Minnesota Pollution Control
Agency, St. Paul, Minnesota, USA.
15 Gowda, P. 1996. An integrated spatial-process model to
predict agricultural nonpoint source pollution. PhD thesis,
Ohio State University, Columbus, Ohio, USA.
16 Leonard, R., Knisel, W., and Still, D. 1987. GLEAMS:
groundwater loading effects of agricultural management
systems. Transactions of the American Society of
Agricultural Engineers 30(5):1403±1418.
17 Chung, S., Ward, A., and Shalk, C. 1992. Evaluation of the
hydrologic component of the adapt water table management
model. Transactions of the American Society of Agricultural
Engineers 35(2):571±579.
18 Zucker, L. and Brown, L. 1998. Agricultural drainage ± water
quality impacts and subsurface drainage studies in the
Midwest. Bulletin 871. Ohio State University, Columbus,
Ohio, USA.
19 Gowda, P., Ward, A., White, D., Baker, D., and Lyon, J. 1999.
An approach for using ®eld scale models to predict peak ¯ows
on agricultural watersheds. Journal of the American Water
Resources Association 35(5):1223±1232.
20 Northern States Power Company 1999. NSP signs biomass
contracts with St. Paul Cogeneration, EPS/Beck Power. News
Release, 8 January.
21 Minnesota Agricultural Statistics Service 1994. Minnesota
Agricultural Statistics 1994. Annual Report. MASS, St. Paul,
Minnesota, USA.
22 Minnesota Agricultural Statistics Service 1995. Minnesota
Agricultural Statistics 1995. Annual Report. MASS, St. Paul,
Minnesota, USA.
23 Minnesota Agricultural Statistics Service 1996. Minnesota
Agricultural Statistics 1996. Annual Report. MASS, St. Paul,
Minnesota, USA.
24 Minnesota Agricultural Statistics Service 2000. Minnesota
Agricultural Statistics 2000. Annual Report. MASS, St. Paul,
Minnesota, USA.
25 Isebrands, J., Nelson, N., Dickman, D., and Michael, D. 1983.
Yield physiology of short rotation intensively cultured
poplars. In E.A. Hansen (compiler). Intensive Plantation
Culture: 12 years Research. USDA Forest Service GTR NC±
91. p. 77±93.
26 Zavitkovski, J. 1983. Projected and actual biomass production
of 2- to 10-year-old intensively cultured Populus `tristis #1'.
In E.A. Hansen (compiler). Intensive Plantation Culture: 12
years Research. USDA Forest Service GTR NC±91. p. 72±76.
27 Friend, A., Scarascia-Mugnozza, G., Isebrands, J., and
Heilman, P. 1991. Quanti®cation of two-year-old hybrid
poplar root systems: morphology, biomass and C distribution.
Tree Physiology 8:109±119.
28 DeBell, D., Clendenen, G., Harrington, C., and Zasada, J.
1996. Tree growth and stand development in short-rotation
Populus plantings: 7-year results for two clones at three
spacings. Biomass and Bioenergy 11(4):253±269.
29 Stettler, R., Zsuffa, L., and Wu, R. 1996. The role of
hybridization in the genetic manipulation of Populus. In R.
Stettler, J.H.D. Bradshaw, P. Heilman, and T. Hinckley (eds).
Biology of Populus and its Implications for Management and
Conservation. NRC Research Press, Ottawa, Canada. p. 87±
112.
30 AURI 1997±1998. Short rotation forestry of hybrid poplars.
Ag Innovation News. MN 56716. University of Minnesota,
Agricultural Utilization Research Institute. Crookston,
Minnesota, USA.
31 Ihaka, R. and Gentleman, R. 1996. R: a language for data
analysis and graphics. Journal of Computational and Graphical
Statistics 5(3):299±314.
32 USGS. Available at Web site http://waterdata.usgs.gov/mn/
nwis (veri®ed 29 February 2004).
33 Available at Web site http://www.crh.noaa.gov/ncrfc/
documents/MinnRiver.html (veri®ed 29 February 2004).
34 Dalzell, B., Gowda, P., Mulla, D., and Ward, A. 1999.
Predicting nonpoint source pollution for a small agricultural
watershed in southern Minnesota. 1999 ASAE Annual
International Meeting, Paper No. 99±2215. American
Society of Agricultural Engineers, St. Joseph, Michigan, USA.
35 Licht, L., Schnoor, J., and Nair, D. 1992. Ecolotree buffers for
controlling nonpoint sediment and nitrate. Presented at the
1992 International Winter Meeting of The ASAE. Paper No.
92±2626. American Society of Agricultural Engineers, St.
Joseph, Michigan, USA.
36 Perry, C., Miller, R., and Brooks, K. 2001. Impacts of short-
rotation hybrid poplar plantations on regional water yield.
Forest Ecology and Management 143:143±151.
37 MPCA 2001. Draft Minnesota River Basin Plan. 18 June2001.
Minnesota Pollution Control Agency. Online Document.
Available at http://www.pca.state.mn.us/water/basins/
mnriver/mnbasinplan.pdf (veri®ed 29 February 2004).
38 Altier, L., Lowrance, R., Williams, R., and Inamdar, S. 1998.
The Riparian Ecosystem Management Model: Plant growth
component. Proceedings of the First Federal Interagency
Hydrologic Modeling Conference, Las Vegas, Nevada, USA,
April. p. 1.33±1.40.
39 Todd, R., Fail, J.Jr., Hendrickson, O.Jr, and Asmussn, L. 1984.
Riparian forests as nutrient ®lters in agricultural watersheds.
BioScience 34(6):374±377.
40 Lowrance, R., Leonard, R., and Sheridan, J. 1985. Managing
riparian ecosystems to control nonpoint pollution. Journal of
Soil and Water Conservation 40(1):87±91.
41 Cooper, J., Gilliam, J., Daniels, R., and Robarge, W. 1987.
Riparian areas as ®lters for agricultural sediment. Soil Science
Society of America Journal 51:416±420.
Water quality effects of cropland conversion 127
Top Related
Copyright © 2022 FDOKUMEN

