


Bahasa
Halaman
Hukum

International Journal of Impact Engineering 31 (2005) 307–325
Vertical impact shock response of a cask model on a rigidunyielding surface
R. Rajendran, K. Prem Sai, Saju Joy, K.C. Krishnamurthy, S. Basu*
BARC Facilities, Kalpakkam 603 102, India
Received 7 August 2002; accepted 7 October 2003
Abstract
Vertical impact shock response of a cylindrical cask on a rigid unyielding surface is of importance fornuclear transportation. Impact drop experiments were carried out on a 380 kg cask model for heights vary-ing from 0.52 to 7.5m and acceleration was measured. An approximate analytical model was developed topredict the impact shock and was validated with impact hammers of 2 and 1000 kg for various drop heights.r 2003 Elsevier Ltd. All rights reserved.
Keywords: Impact; Drop test; Cask; Hammer; Acceleration; Strain; Model validation
1. Introduction
The ability of a nuclear package to withstand transportation shock is assessed by subjecting asample package or a scaled model to test or other assessment for the normal conditions oftransport [1]. A free drop to a distance of 9m on a flat, essentially unyielding horizontal surface,striking the surface in a position for which maximum damage is expected is the stipulatedhypothetical accidental condition for which the package has to withstand. The acceleration,velocity and displacement for 9m end drop of a rubber buffer model cask was presented byShappert [2]. Numerical tests were performed by Yagawa et al. [3] to understand the dynamicbehaviour of lead cask under normal impact onto a rigid floor due to accidental fall from a heightof 9m. But the results showed wide variations in the peak acceleration for various computer codesthat were used. McConnell and Soreson [4] demonstrated the applicability of fracture mechanicsbased methodology for ensuring cask integrity. Tests were performed in the side drop orientationat a temperature of �29�C with a circumferential mid-axis flaw into the cask body for each droptest. The safety of a cask against impact accident is controlled by the stiffness of the cask body and
ARTICLE IN PRESS
*Corresponding author. Fax: +91-4114-280282.
E-mail address: dayalan [email protected] (S. Basu).
0734-743X/$ - see front matter r 2003 Elsevier Ltd. All rights reserved.
doi:10.1016/j.ijimpeng.2003.10.036
the impact absorbing characteristics of the impact limiters [5]. Impact limiters were shown to havebrought down the peak acceleration of the cask by around 16 times [4]. Shappart [6] presented asurvey of shock-absorbing materials and procedures for the design of impact limiters. Janberget al. [7] made a comparison of calculated and experimentally derived strain-time histories on themiddle section of a cask with impact limiter for side drop.This paper brings out a detailed experimental programme wherein a cask model is investigated
for its shock response for normal impact. Drop experiments were performed for heights up to 9mto get an insight into the relation between the shock pulse parameters, drop height and the caskmodel. A simple analytical model that estimates the impact acceleration and its duration isdeveloped and validated with impact hammers of 2 and 1000 kg.
2. Design of experiments
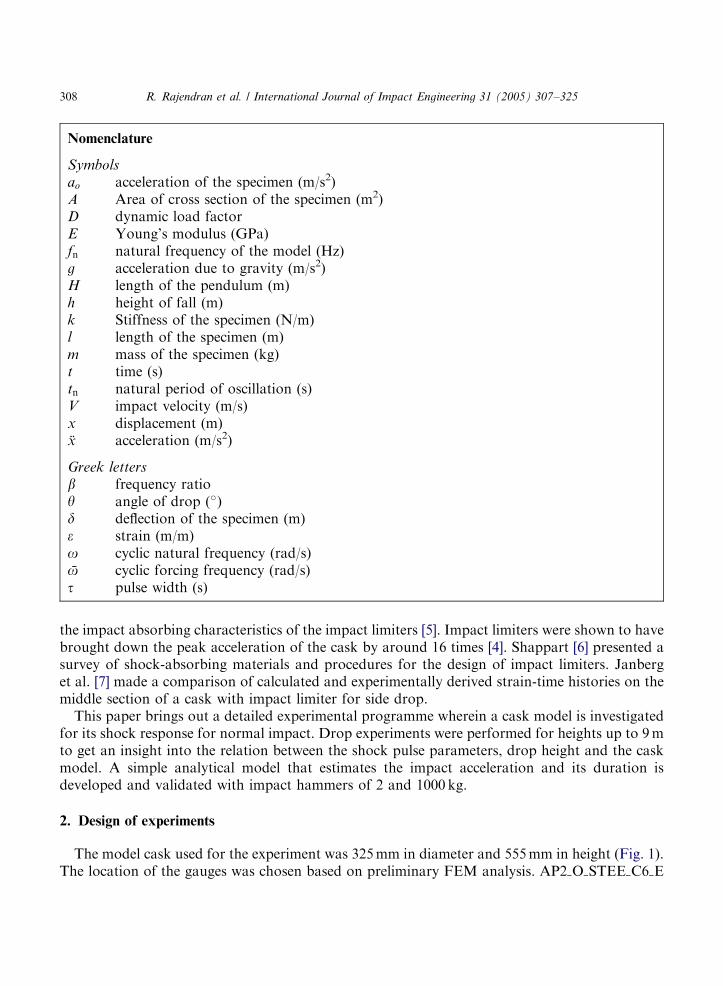
The model cask used for the experiment was 325mm in diameter and 555mm in height (Fig. 1).The location of the gauges was chosen based on preliminary FEM analysis. AP2 O STEE C6 E
ARTICLE IN PRESS
Nomenclature
Symbolsao acceleration of the specimen (m/s2)A Area of cross section of the specimen (m2)D dynamic load factorE Young’s modulus (GPa)fn natural frequency of the model (Hz)g acceleration due to gravity (m/s2)H length of the pendulum (m)h height of fall (m)k Stiffness of the specimen (N/m)l length of the specimen (m)m mass of the specimen (kg)t time (s)tn natural period of oscillation (s)V impact velocity (m/s)x displacement (m).x acceleration (m/s2)
Greek lettersb frequency ratioy angle of drop (�)d deflection of the specimen (m)e strain (m/m)o cyclic natural frequency (rad/s)
%o cyclic forcing frequency (rad/s)t pulse width (s)
R. Rajendran et al. / International Journal of Impact Engineering 31 (2005) 307–325308
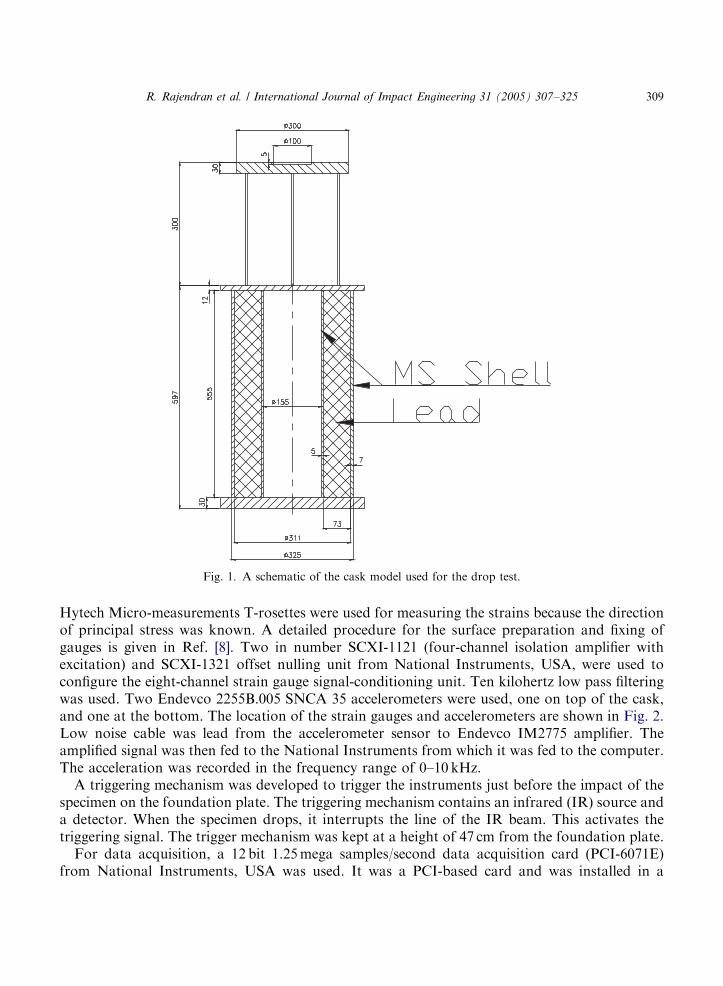
Hytech Micro-measurements T-rosettes were used for measuring the strains because the directionof principal stress was known. A detailed procedure for the surface preparation and fixing ofgauges is given in Ref. [8]. Two in number SCXI-1121 (four-channel isolation amplifier withexcitation) and SCXI-1321 offset nulling unit from National Instruments, USA, were used toconfigure the eight-channel strain gauge signal-conditioning unit. Ten kilohertz low pass filteringwas used. Two Endevco 2255B.005 SNCA 35 accelerometers were used, one on top of the cask,and one at the bottom. The location of the strain gauges and accelerometers are shown in Fig. 2.Low noise cable was lead from the accelerometer sensor to Endevco IM2775 amplifier. Theamplified signal was then fed to the National Instruments from which it was fed to the computer.The acceleration was recorded in the frequency range of 0–10 kHz.A triggering mechanism was developed to trigger the instruments just before the impact of the
specimen on the foundation plate. The triggering mechanism contains an infrared (IR) source anda detector. When the specimen drops, it interrupts the line of the IR beam. This activates thetriggering signal. The trigger mechanism was kept at a height of 47 cm from the foundation plate.For data acquisition, a 12 bit 1.25mega samples/second data acquisition card (PCI-6071E)
from National Instruments, USA was used. It was a PCI-based card and was installed in a
ARTICLE IN PRESS
Fig. 1. A schematic of the cask model used for the drop test.
R. Rajendran et al. / International Journal of Impact Engineering 31 (2005) 307–325 309
Pentium II—266MHz, 64MB RAM computer system. SCXI signal conditioning modules wereconnected inside SCXI-1000 chassis unit and from the chassis unit to the data acquisition card.Software was developed using ‘Lab windows’ in C language. Facility to display the acquired
waveform in graph and to select the required time interval to zoom the acquired waveform wasprovided. A sampling rate of 40 ks/s per channel was used. Ten kilohertz digital low passHamming window type filter was used. A filtering co-efficient of 50 was used. The data acquisitionsystem was capable of acquiring signals for about 1.6 s. Using this data acquisition system 64,000data points per channel were acquired. Facility to save the waveform (data points) was provided.The saved data points were opened in Microsoft Excel to analyse the data at a later time.The foundation of the drop tower was made with reinforced concrete cement (RCC) of
2.5m� 2.5m� 3m over a sand bed. Over the RCC foundation, a 25mm steel plate was groutedwith bolts.In order to ensure that the specimen was adequately shock isolated during the trial drops,
polyurethane packing pads of 50mm thickness were used in 2� 2 configuration over thefoundation of the drop tower. A steel plate of 1mm thickness was kept above these pads. Aschematic arrangement of the specimen and the drop tower is shown in Fig. 3. The pad isolatorskept the stresses developed in the specimen within the elastic range and there was no permanentdeformation. This was required to ensure the following:
(i) The triggering mechanism activated in the right time.(ii) All the accelerometer channels were working and sensing the signals.(iii) All the strain gauge channels were working and sensing the dynamic strains.
ARTICLE IN PRESS
2
13
A2
A1
45˚
3
1,2
Fig. 2. A schematic of the location of strain gauges on the cask specimen. Notes: A1—accelerometer top;
A2—accelerometer bottom; strain gauge nos. 1 and 3 were at 7mm height from bottom cover plate of the cask. Strain
gauge No. 2 was at 91mm height from bottom cover plate of the cask.
R. Rajendran et al. / International Journal of Impact Engineering 31 (2005) 307–325310
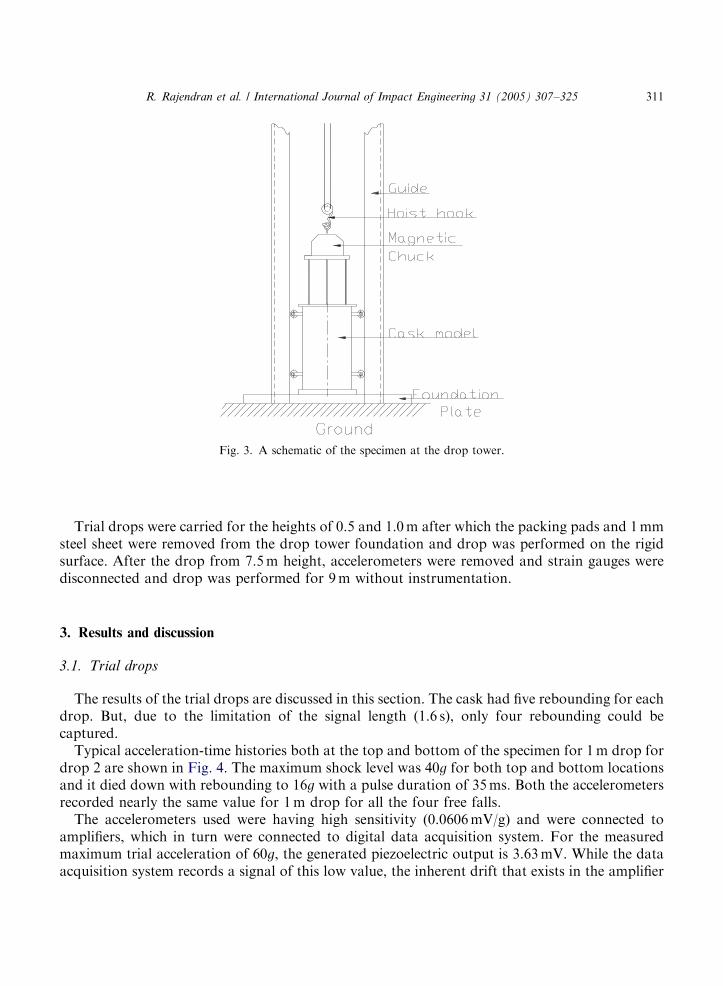
Trial drops were carried for the heights of 0.5 and 1.0m after which the packing pads and 1mmsteel sheet were removed from the drop tower foundation and drop was performed on the rigidsurface. After the drop from 7.5m height, accelerometers were removed and strain gauges weredisconnected and drop was performed for 9m without instrumentation.
3. Results and discussion
3.1. Trial drops
The results of the trial drops are discussed in this section. The cask had five rebounding for eachdrop. But, due to the limitation of the signal length (1.6 s), only four rebounding could becaptured.Typical acceleration-time histories both at the top and bottom of the specimen for 1m drop for
drop 2 are shown in Fig. 4. The maximum shock level was 40g for both top and bottom locationsand it died down with rebounding to 16g with a pulse duration of 35ms. Both the accelerometersrecorded nearly the same value for 1m drop for all the four free falls.The accelerometers used were having high sensitivity (0.0606mV/g) and were connected to
amplifiers, which in turn were connected to digital data acquisition system. For the measuredmaximum trial acceleration of 60g, the generated piezoelectric output is 3.63mV. While the dataacquisition system records a signal of this low value, the inherent drift that exists in the amplifier
ARTICLE IN PRESS
Fig. 3. A schematic of the specimen at the drop tower.
R. Rajendran et al. / International Journal of Impact Engineering 31 (2005) 307–325 311
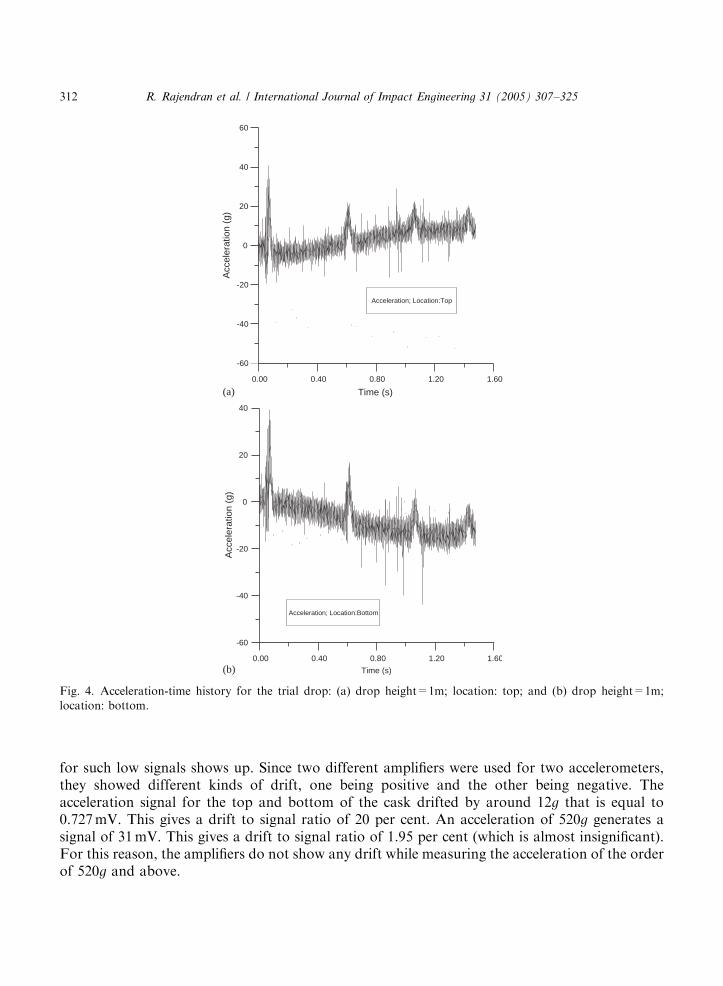
for such low signals shows up. Since two different amplifiers were used for two accelerometers,they showed different kinds of drift, one being positive and the other being negative. Theacceleration signal for the top and bottom of the cask drifted by around 12g that is equal to0.727mV. This gives a drift to signal ratio of 20 per cent. An acceleration of 520g generates asignal of 31mV. This gives a drift to signal ratio of 1.95 per cent (which is almost insignificant).For this reason, the amplifiers do not show any drift while measuring the acceleration of the orderof 520g and above.
ARTICLE IN PRESS
0.00 0.40 0.80 1.20 1.60
Time (s)
-60
-40
-20
0
20
40
60
Acc
eler
atio
n (g
)
Acceleration; Location:Top
0.00 0.40 0.80 1.20 1.60
Time (s)
-60
-40
-20
0
20
40
Acc
eler
atio
n (g
)
Acceleration; Location:Bottom
(a)
(b)
Fig. 4. Acceleration-time history for the trial drop: (a) drop height=1m; location: top; and (b) drop height=1m;
location: bottom.
R. Rajendran et al. / International Journal of Impact Engineering 31 (2005) 307–325312
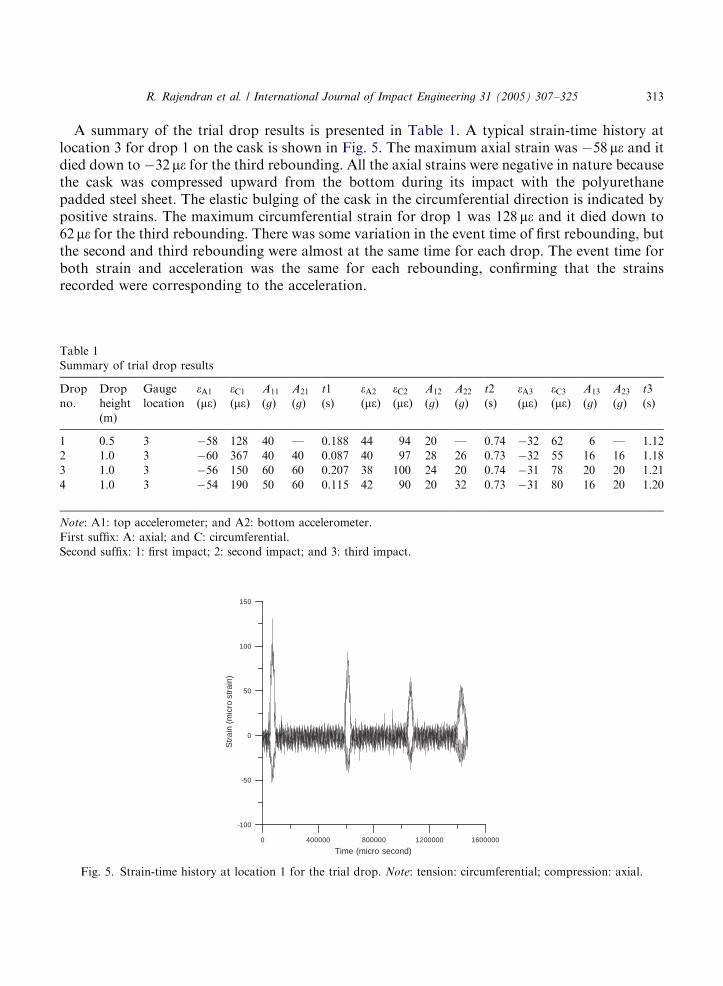
A summary of the trial drop results is presented in Table 1. A typical strain-time history atlocation 3 for drop 1 on the cask is shown in Fig. 5. The maximum axial strain was �58me and itdied down to �32me for the third rebounding. All the axial strains were negative in nature becausethe cask was compressed upward from the bottom during its impact with the polyurethanepadded steel sheet. The elastic bulging of the cask in the circumferential direction is indicated bypositive strains. The maximum circumferential strain for drop 1 was 128me and it died down to62me for the third rebounding. There was some variation in the event time of first rebounding, butthe second and third rebounding were almost at the same time for each drop. The event time forboth strain and acceleration was the same for each rebounding, confirming that the strainsrecorded were corresponding to the acceleration.
ARTICLE IN PRESS
Table 1
Summary of trial drop results
Drop
no.
Drop
height
(m)
Gauge
location
eA1
(me)eC1(me)
A11
(g)
A21
(g)
t1
(s)
eA2
(me)eC2(me)
A12
(g)
A22
(g)
t2
(s)
eA3
(me)eC3(me)
A13
(g)
A23
(g)
t3
(s)
1 0.5 3 �58 128 40 — 0.188 44 94 20 — 0.74 �32 62 6 — 1.12
2 1.0 3 �60 367 40 40 0.087 40 97 28 26 0.73 �32 55 16 16 1.18
3 1.0 3 �56 150 60 60 0.207 38 100 24 20 0.74 �31 78 20 20 1.21
4 1.0 3 �54 190 50 60 0.115 42 90 20 32 0.73 �31 80 16 20 1.20
Note: A1: top accelerometer; and A2: bottom accelerometer.
First suffix: A: axial; and C: circumferential.
Second suffix: 1: first impact; 2: second impact; and 3: third impact.
0 400000 800000 1200000 1600000
Time (micro second)
-100
-50
0
50
100
150
Str
ain
(mic
ro s
trai
n)
Fig. 5. Strain-time history at location 1 for the trial drop. Note: tension: circumferential; compression: axial.
R. Rajendran et al. / International Journal of Impact Engineering 31 (2005) 307–325 313
The drops showed consistent reading and confirmed that all the acceleration and strainchannels were recording. Since the strains developed were very less for the IS2062 steel (typicallythe equivalent static elastic yield strain is 1090 me), it was confirmed that the specimen underwentonly elastic deformation and there was no permanent damage. This is further corroborated by thereturn of the strain peaks to zero value after the shock response.
3.2. Actual drops
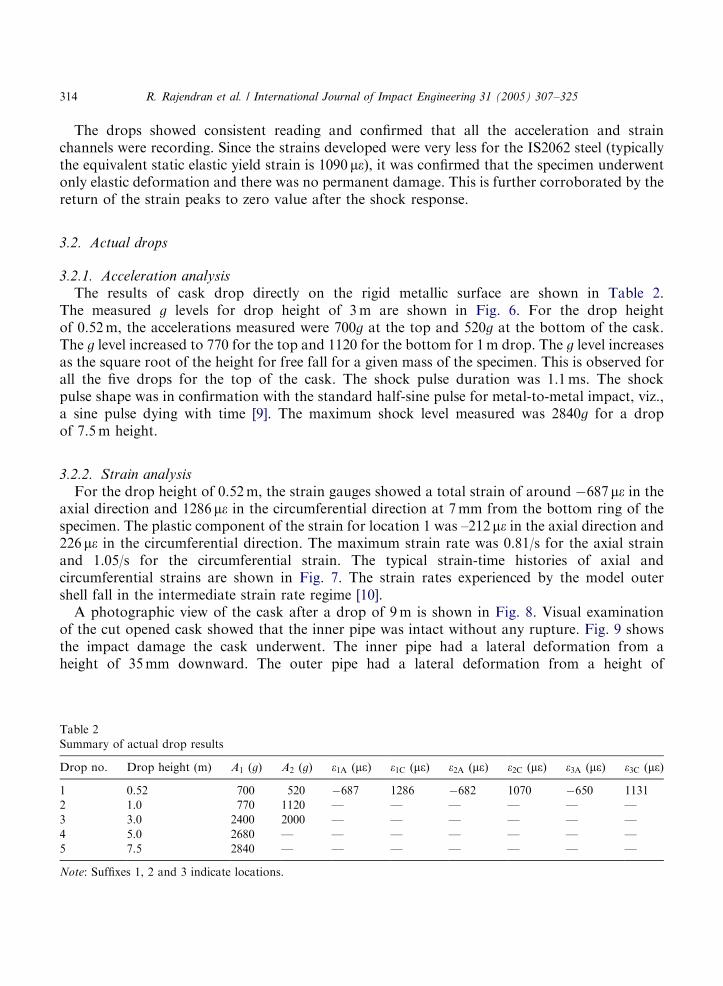
3.2.1. Acceleration analysisThe results of cask drop directly on the rigid metallic surface are shown in Table 2.
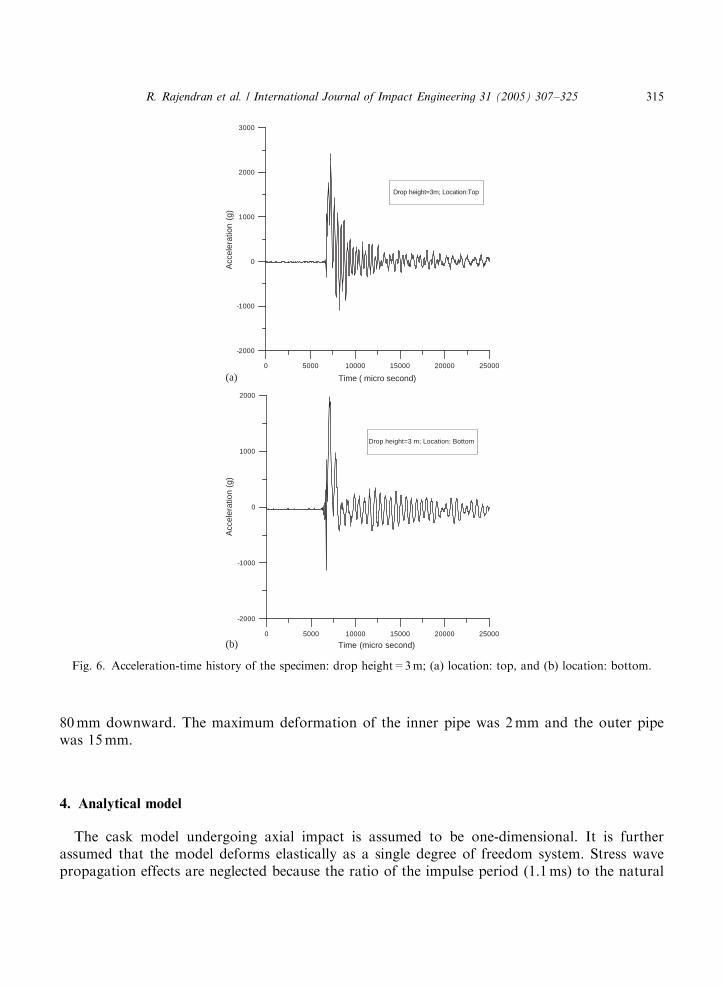
The measured g levels for drop height of 3m are shown in Fig. 6. For the drop heightof 0.52m, the accelerations measured were 700g at the top and 520g at the bottom of the cask.The g level increased to 770 for the top and 1120 for the bottom for 1m drop. The g level increasesas the square root of the height for free fall for a given mass of the specimen. This is observed forall the five drops for the top of the cask. The shock pulse duration was 1.1ms. The shockpulse shape was in confirmation with the standard half-sine pulse for metal-to-metal impact, viz.,a sine pulse dying with time [9]. The maximum shock level measured was 2840g for a dropof 7.5m height.
3.2.2. Strain analysis
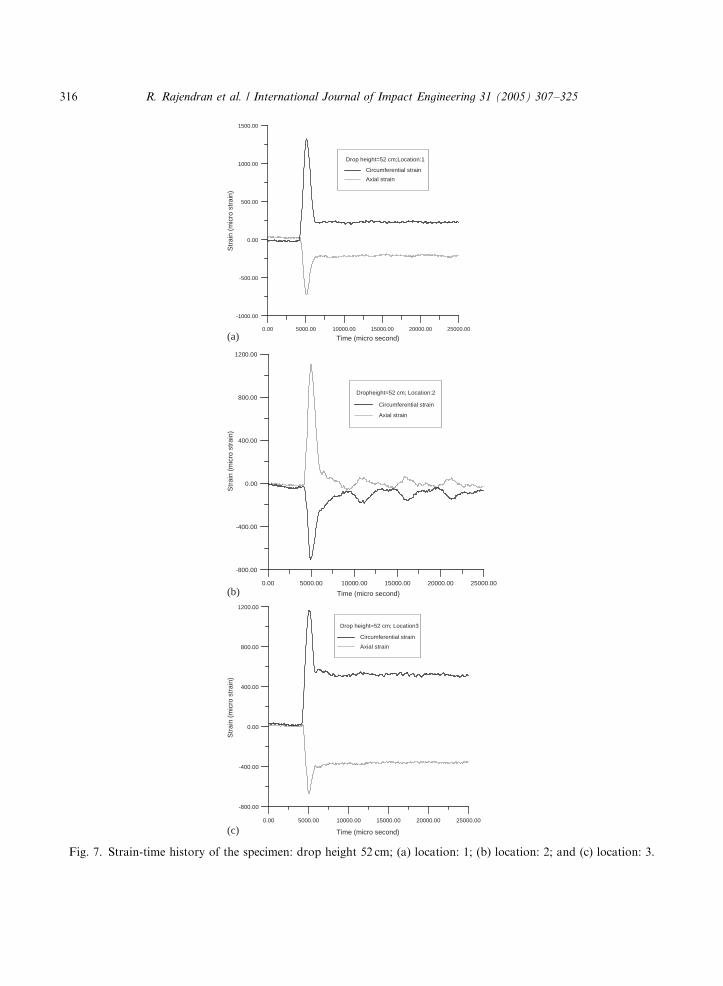
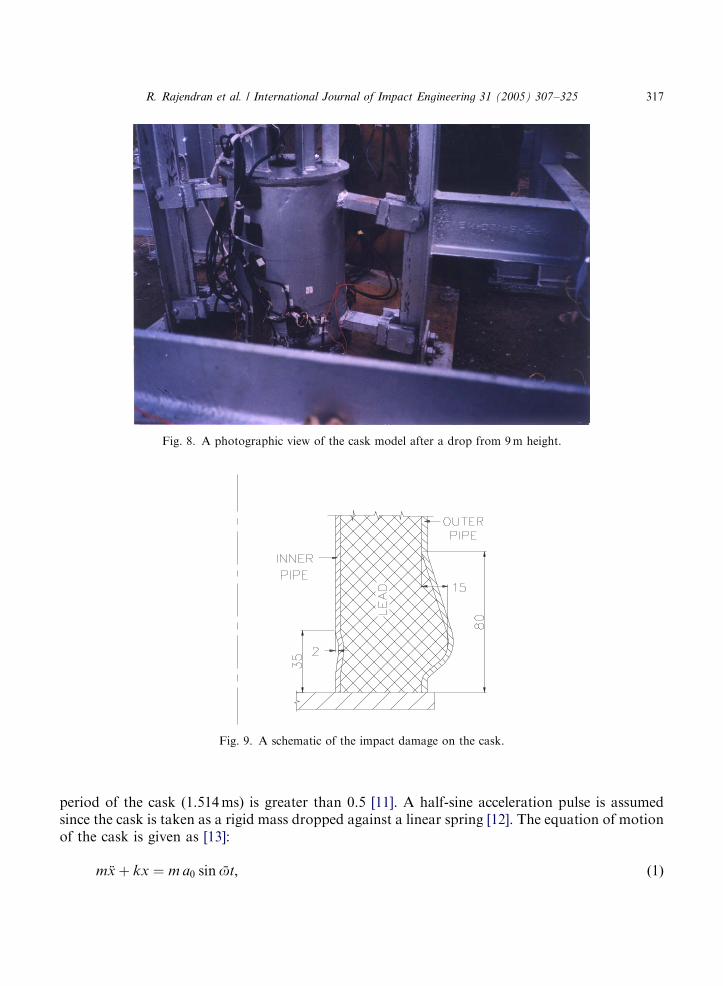
For the drop height of 0.52m, the strain gauges showed a total strain of around �687me in theaxial direction and 1286me in the circumferential direction at 7mm from the bottom ring of thespecimen. The plastic component of the strain for location 1 was –212me in the axial direction and226 me in the circumferential direction. The maximum strain rate was 0.81/s for the axial strainand 1.05/s for the circumferential strain. The typical strain-time histories of axial andcircumferential strains are shown in Fig. 7. The strain rates experienced by the model outershell fall in the intermediate strain rate regime [10].A photographic view of the cask after a drop of 9m is shown in Fig. 8. Visual examination
of the cut opened cask showed that the inner pipe was intact without any rupture. Fig. 9 showsthe impact damage the cask underwent. The inner pipe had a lateral deformation from aheight of 35mm downward. The outer pipe had a lateral deformation from a height of
ARTICLE IN PRESS
Table 2
Summary of actual drop results
Drop no. Drop height (m) A1 (g) A2 (g) e1A (me) e1C (me) e2A (me) e2C (me) e3A (me) e3C (me)
1 0.52 700 520 �687 1286 �682 1070 �650 1131
2 1.0 770 1120 — — — — — —
3 3.0 2400 2000 — — — — — —
4 5.0 2680 — — — — — — —
5 7.5 2840 — — — — — — —
Note: Suffixes 1, 2 and 3 indicate locations.
R. Rajendran et al. / International Journal of Impact Engineering 31 (2005) 307–325314
80mm downward. The maximum deformation of the inner pipe was 2mm and the outer pipewas 15mm.
4. Analytical model
The cask model undergoing axial impact is assumed to be one-dimensional. It is furtherassumed that the model deforms elastically as a single degree of freedom system. Stress wavepropagation effects are neglected because the ratio of the impulse period (1.1ms) to the natural
ARTICLE IN PRESS
0 5000 10000 15000 20000 25000
Time ( micro second)
-2000
-1000
0
1000
2000
3000
Acc
eler
atio
n (g
)
Drop height=3m; Location:Top
0 5000 10000 15000 20000 25000
Time (micro second)
-2000
-1000
0
1000
2000
Acc
eler
atio
n (g
)
Drop height=3 m; Location: Bottom
(b)
(a)
Fig. 6. Acceleration-time history of the specimen: drop height=3m; (a) location: top, and (b) location: bottom.
R. Rajendran et al. / International Journal of Impact Engineering 31 (2005) 307–325 315
ARTICLE IN PRESS
0.00 5000.00 10000.00 15000.00 20000.00 25000.00
-1000.00
-500.00
0.00
500.00
1000.00
1500.00
Drop height=52 cm;Location:1
Circumferential strain
Axial strain
0.00 5000.00 10000.00 15000.00 20000.00 25000.00
-800.00
-400.00
0.00
400.00
800.00
1200.00
Dropheight=52 cm; Location:2
Circumferential strain
Axial strain
0.00 5000.00 10000.00 15000.00 20000.00 25000.00
Time (micro second)
Time (micro second)
Time (micro second)
-800.00
-400.00
0.00
400.00
800.00
1200.00
Str
ain
(mic
ro s
trai
n)S
trai
n (m
icro
str
ain)
Str
ain
(mic
ro s
trai
n)
Drop height=52 cm; Location3
Circumferential strain
Axial strain
(a)
(b)
(c)
Fig. 7. Strain-time history of the specimen: drop height 52 cm; (a) location: 1; (b) location: 2; and (c) location: 3.
R. Rajendran et al. / International Journal of Impact Engineering 31 (2005) 307–325316
period of the cask (1.514ms) is greater than 0.5 [11]. A half-sine acceleration pulse is assumedsince the cask is taken as a rigid mass dropped against a linear spring [12]. The equation of motionof the cask is given as [13]:
m .x þ kx ¼ m a0 sin %ot; ð1Þ
ARTICLE IN PRESS
Fig. 8. A photographic view of the cask model after a drop from 9m height.
Fig. 9. A schematic of the impact damage on the cask.
R. Rajendran et al. / International Journal of Impact Engineering 31 (2005) 307–325 317
where m is the mass, .x is the acceleration, x is the displacement, a0 is the peak acceleration, %o isthe forcing frequency, %o ¼ ðp=tÞ; where t is the impulse period, and t is the time. Solution ofEq. (1) yields the maximum deflection xmax as [14]
xmax ¼Da0
o2; ð2Þ
where D is dynamic load factor and o is the cyclic natural frequency of the system. D is given by
D ¼1
ð1� b2Þðsin %ot � b sinotÞ; ð3Þ
where b is the frequency ratio which is given as b ¼ ð %o=oÞ and o is given as
o ¼
ffiffiffiffik
m
r¼
ffiffiffiffiffiffiffiAE
ml
r; ð4Þ
where A is the area of cross section, l is the length and E is the Young’s modulus which is given as
E ¼E1A1 þ E2A2 þ E3A3
A1 þ A2 þ A3; ð5Þ
where A1 is the area of cross section of the inner pipe, A2 is area of cross section of the lead mass,A3 is the area of cross section of the outer pipe, E1 is the Young’s modulus of the inner pipematerial, E2 is the Young’s modulus of the lead mass, E3 is the Young’s modulus of the outer pipematerial.Equating the potential energy of the cask model dropping from a height h due to acceleration
due to gravity g to its strain energy
mgh ¼ 12
kx2max: ð6Þ
Substituting Eq. (2) into Eq. (6) and solving for a0
a0 ¼VoD
¼2pV
D
� �fn; ð7Þ
where V is the impact velocity, which is given byffiffiffiffiffiffiffiffi2gh
pand fn is the natural frequency.
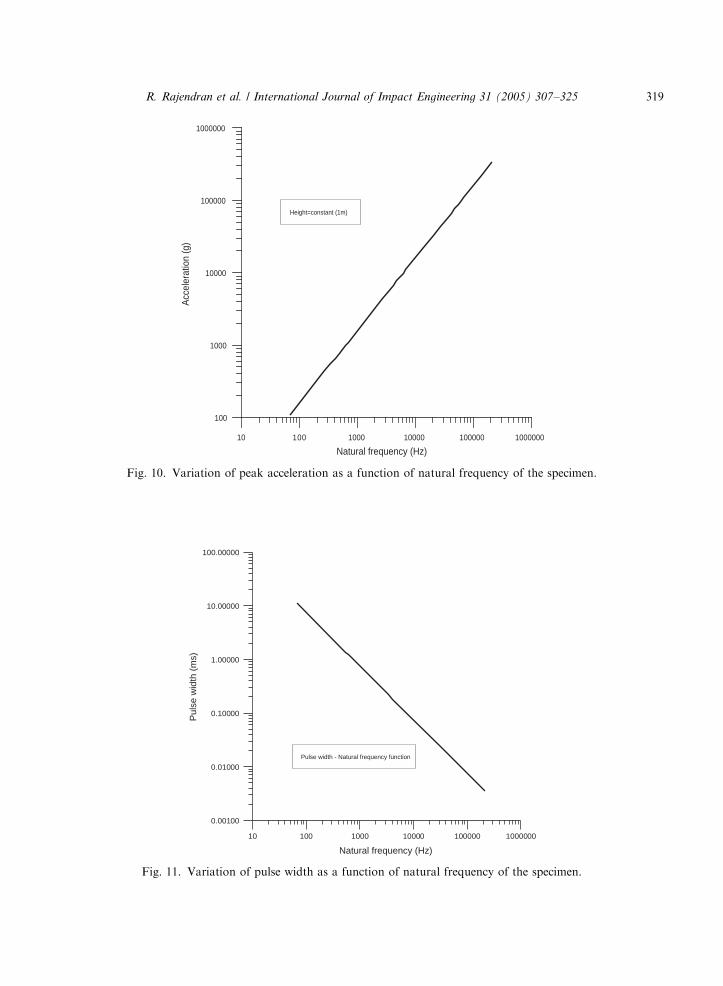
Substitution of the experimental values of peak acceleration into Eq. (7) gives the dynamic loadfactor as 1.77. From Eq. (7), it is observed that the peak acceleration during impact is directlyproportional to the natural frequency of the cask. The variation of peak acceleration as a functionof natural frequency is shown in Fig. 10. Applying Eq. (7), the peak acceleration of the cask for9m drop is 3252g.Further, it is observed from the experimental data that the impulse period t is 3
4the natural
period of oscillation tnð¼ 1=fnÞ of the cask:
t ¼3
4tn ¼
3
4fn: ð8Þ
Substituting Eq. (8) into Eq. (3), D is obtained as 1.77, which is the same as that obtained fromexperimental acceleration. From Eq. (8) and its corroboration with the dynamic load factor forthe half-sine pulse, it is observed that pulse width during impact is inversely proportional to thenatural frequency of the cask. The variation of pulse width as a function of natural frequency isshown in Fig. 11. As an illustration of these concepts, the following example is given.
ARTICLE IN PRESS
R. Rajendran et al. / International Journal of Impact Engineering 31 (2005) 307–325318
ARTICLE IN PRESS
10 100 1000 10000 100000 1000000
Natural frequency (Hz)
100
1000
10000
100000
1000000
Acc
eler
atio
n (g
)
Height=constant (1m)
Fig. 10. Variation of peak acceleration as a function of natural frequency of the specimen.
10 100 1000 10000 100000 1000000
Natural frequency (Hz)
0.00100
0.01000
0.10000
1.00000
10.00000
100.00000
Pul
se w
idth
(m
s)
Pulse width - Natural frequency function
Fig. 11. Variation of pulse width as a function of natural frequency of the specimen.
R. Rajendran et al. / International Journal of Impact Engineering 31 (2005) 307–325 319
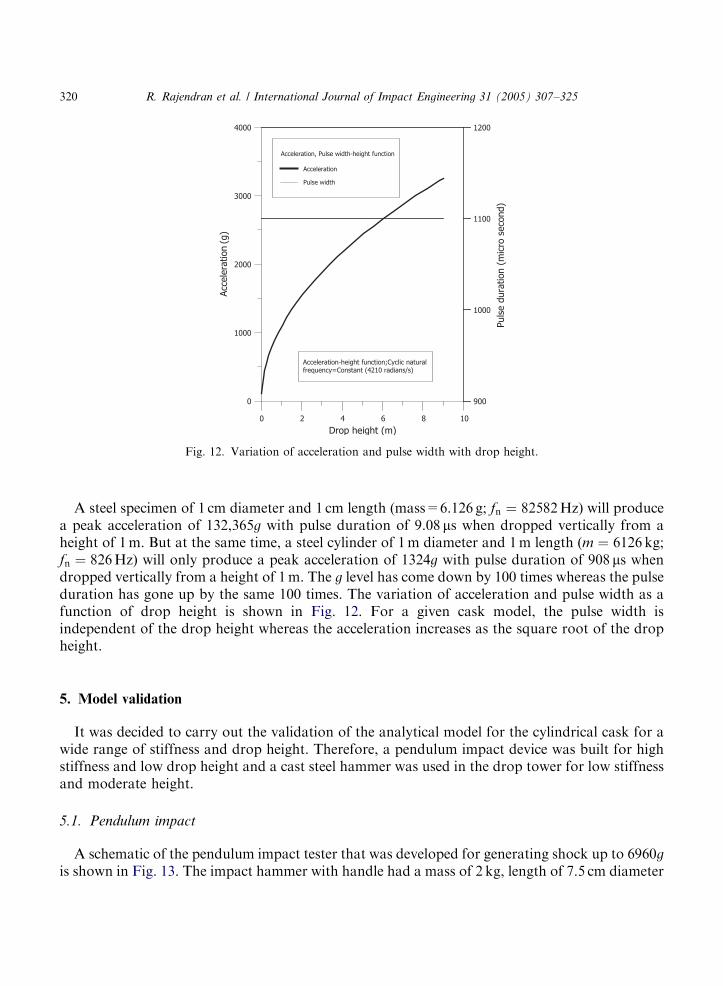
A steel specimen of 1 cm diameter and 1 cm length (mass=6.126 g; fn ¼ 82582Hz) will producea peak acceleration of 132,365g with pulse duration of 9.08ms when dropped vertically from aheight of 1m. But at the same time, a steel cylinder of 1m diameter and 1m length (m ¼ 6126 kg;fn ¼ 826Hz) will only produce a peak acceleration of 1324g with pulse duration of 908 ms whendropped vertically from a height of 1m. The g level has come down by 100 times whereas the pulseduration has gone up by the same 100 times. The variation of acceleration and pulse width as afunction of drop height is shown in Fig. 12. For a given cask model, the pulse width isindependent of the drop height whereas the acceleration increases as the square root of the dropheight.
5. Model validation
It was decided to carry out the validation of the analytical model for the cylindrical cask for awide range of stiffness and drop height. Therefore, a pendulum impact device was built for highstiffness and low drop height and a cast steel hammer was used in the drop tower for low stiffnessand moderate height.
5.1. Pendulum impact
A schematic of the pendulum impact tester that was developed for generating shock up to 6960g
is shown in Fig. 13. The impact hammer with handle had a mass of 2 kg, length of 7.5 cm diameter
ARTICLE IN PRESS
0 4 10
Drop height (m)
0
1000
2000
3000
4000
Acc
ele
ration (g)
Acceleration-height function;Cyclic natural frequency=Constant (4210 radians/s)
900
1000
1100
1200
Puls
e d
ura
tion (
mic
ro s
eco
nd)
Acceleration, Pulse width-height function
Acceleration
Pulse width
2 86
Fig. 12. Variation of acceleration and pulse width with drop height.
R. Rajendran et al. / International Journal of Impact Engineering 31 (2005) 307–325320
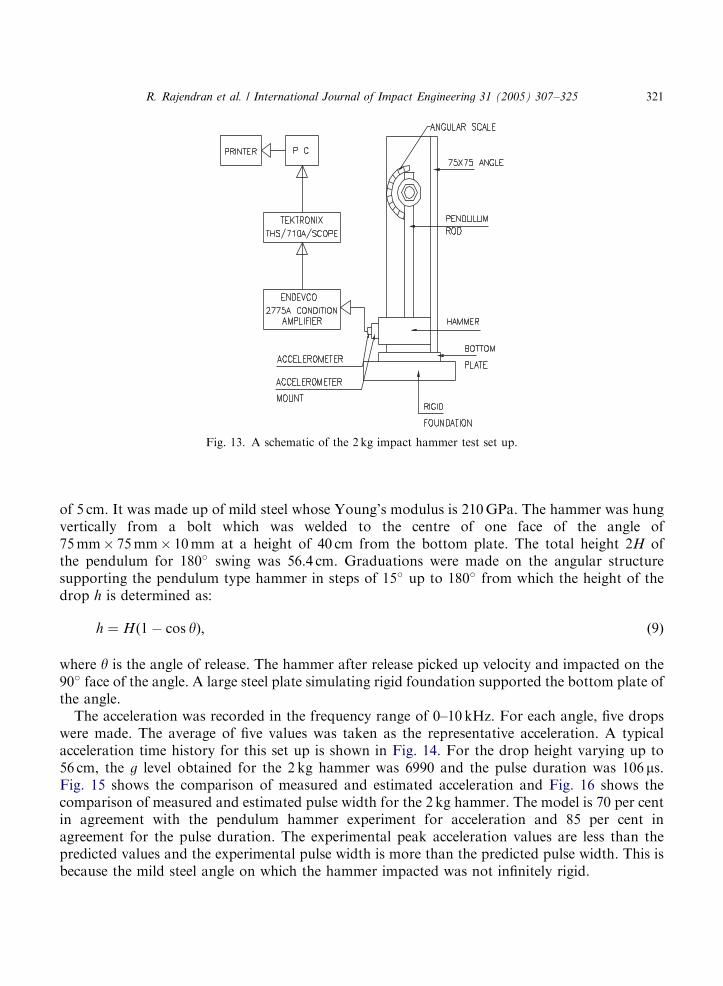
of 5 cm. It was made up of mild steel whose Young’s modulus is 210GPa. The hammer was hungvertically from a bolt which was welded to the centre of one face of the angle of75mm� 75mm� 10mm at a height of 40 cm from the bottom plate. The total height 2H ofthe pendulum for 180� swing was 56.4 cm. Graduations were made on the angular structuresupporting the pendulum type hammer in steps of 15� up to 180� from which the height of thedrop h is determined as:
h ¼ Hð1� cos yÞ; ð9Þ
where y is the angle of release. The hammer after release picked up velocity and impacted on the90� face of the angle. A large steel plate simulating rigid foundation supported the bottom plate ofthe angle.The acceleration was recorded in the frequency range of 0–10 kHz. For each angle, five drops
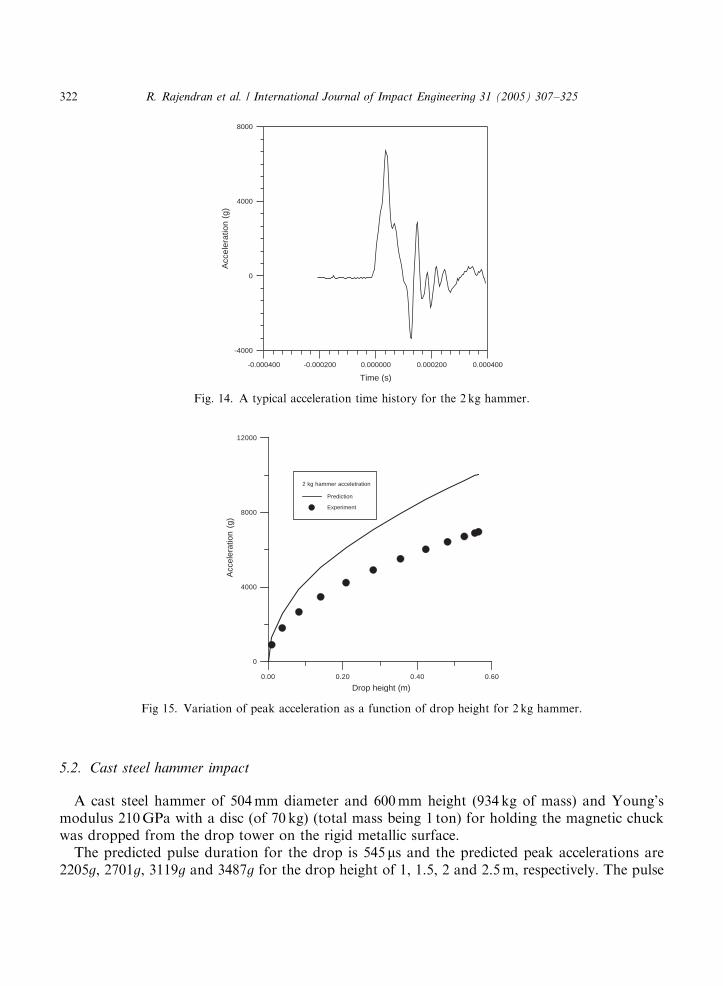
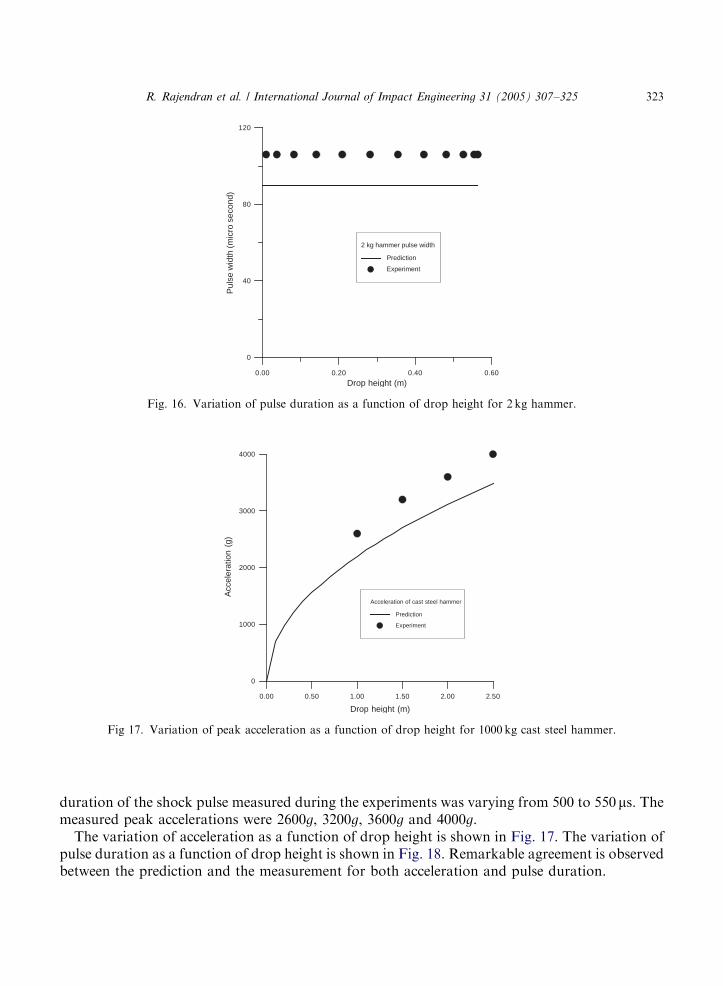
were made. The average of five values was taken as the representative acceleration. A typicalacceleration time history for this set up is shown in Fig. 14. For the drop height varying up to56 cm, the g level obtained for the 2 kg hammer was 6990 and the pulse duration was 106ms.Fig. 15 shows the comparison of measured and estimated acceleration and Fig. 16 shows thecomparison of measured and estimated pulse width for the 2 kg hammer. The model is 70 per centin agreement with the pendulum hammer experiment for acceleration and 85 per cent inagreement for the pulse duration. The experimental peak acceleration values are less than thepredicted values and the experimental pulse width is more than the predicted pulse width. This isbecause the mild steel angle on which the hammer impacted was not infinitely rigid.
ARTICLE IN PRESS
Fig. 13. A schematic of the 2 kg impact hammer test set up.
R. Rajendran et al. / International Journal of Impact Engineering 31 (2005) 307–325 321
5.2. Cast steel hammer impact
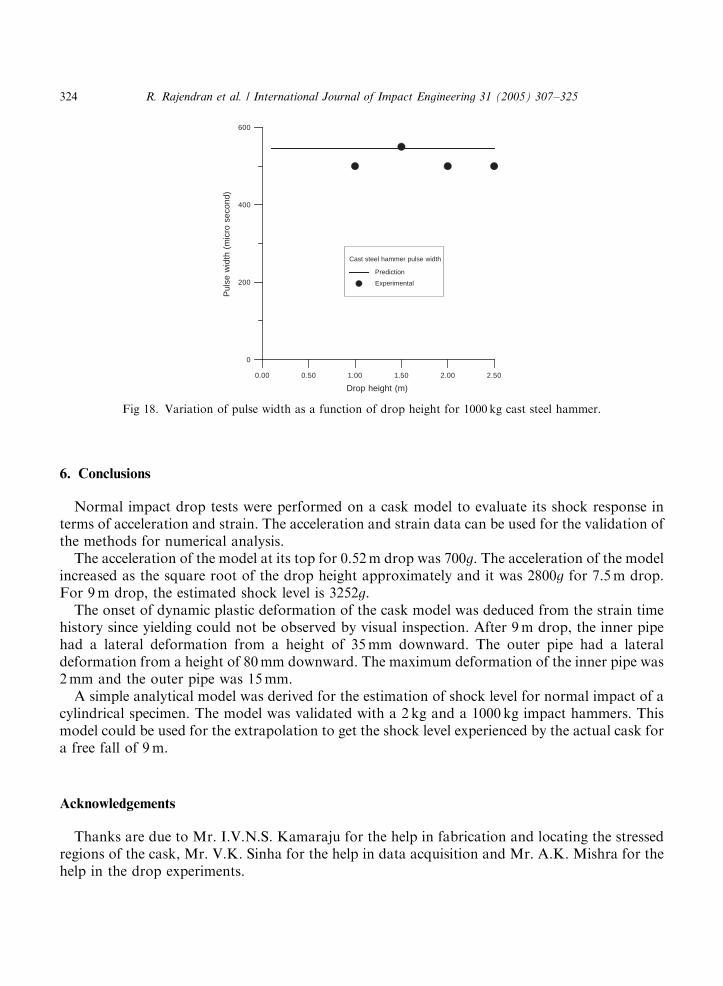
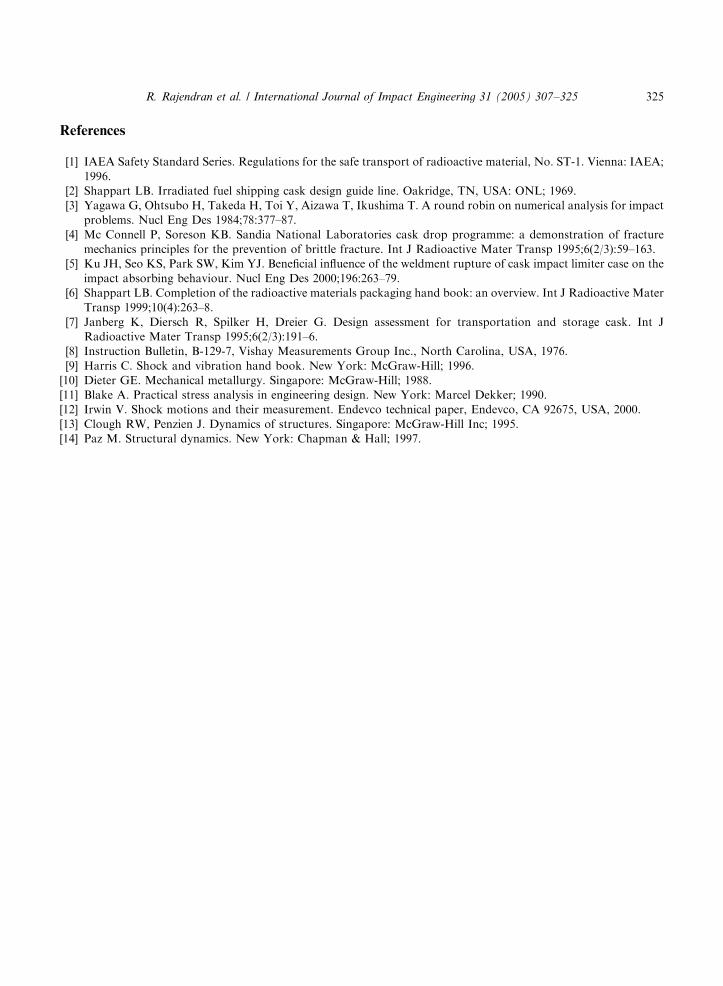
A cast steel hammer of 504mm diameter and 600mm height (934 kg of mass) and Young’smodulus 210GPa with a disc (of 70 kg) (total mass being 1 ton) for holding the magnetic chuckwas dropped from the drop tower on the rigid metallic surface.The predicted pulse duration for the drop is 545ms and the predicted peak accelerations are
2205g, 2701g, 3119g and 3487g for the drop height of 1, 1.5, 2 and 2.5m, respectively. The pulse
ARTICLE IN PRESS
0.00 0.20 0.40 0.60
Drop height (m)
0
4000
8000
12000
Acc
eler
atio
n (g
)
2 kg hammer acceletration
Prediction
Experiment
Fig 15. Variation of peak acceleration as a function of drop height for 2 kg hammer.
-0.000400 -0.000200 0.000000 0.000200 0.000400
Time (s)
-4000
0
4000
8000
Acc
eler
atio
n (g
)
Fig. 14. A typical acceleration time history for the 2 kg hammer.
R. Rajendran et al. / International Journal of Impact Engineering 31 (2005) 307–325322
duration of the shock pulse measured during the experiments was varying from 500 to 550ms. Themeasured peak accelerations were 2600g, 3200g, 3600g and 4000g.The variation of acceleration as a function of drop height is shown in Fig. 17. The variation of
pulse duration as a function of drop height is shown in Fig. 18. Remarkable agreement is observedbetween the prediction and the measurement for both acceleration and pulse duration.
ARTICLE IN PRESS
0.00 0.50 1.00 1.50 2.00 2.50
Drop height (m)
0
1000
2000
3000
4000
Acc
eler
atio
n (g
)
Acceleration of cast steel hammer
Prediction
Experiment
Fig 17. Variation of peak acceleration as a function of drop height for 1000 kg cast steel hammer.
0.00 0.20 0.40 0.60
Drop height (m)
0
40
80
120
Pul
se w
idth
(m
icro
sec
ond)
2 kg hammer pulse width
Prediction
Experiment
Fig. 16. Variation of pulse duration as a function of drop height for 2 kg hammer.
R. Rajendran et al. / International Journal of Impact Engineering 31 (2005) 307–325 323
6. Conclusions
Normal impact drop tests were performed on a cask model to evaluate its shock response interms of acceleration and strain. The acceleration and strain data can be used for the validation ofthe methods for numerical analysis.The acceleration of the model at its top for 0.52m drop was 700g. The acceleration of the model
increased as the square root of the drop height approximately and it was 2800g for 7.5m drop.For 9m drop, the estimated shock level is 3252g.The onset of dynamic plastic deformation of the cask model was deduced from the strain time
history since yielding could not be observed by visual inspection. After 9m drop, the inner pipehad a lateral deformation from a height of 35mm downward. The outer pipe had a lateraldeformation from a height of 80mm downward. The maximum deformation of the inner pipe was2mm and the outer pipe was 15mm.A simple analytical model was derived for the estimation of shock level for normal impact of a
cylindrical specimen. The model was validated with a 2 kg and a 1000 kg impact hammers. Thismodel could be used for the extrapolation to get the shock level experienced by the actual cask fora free fall of 9m.
Acknowledgements
Thanks are due to Mr. I.V.N.S. Kamaraju for the help in fabrication and locating the stressedregions of the cask, Mr. V.K. Sinha for the help in data acquisition and Mr. A.K. Mishra for thehelp in the drop experiments.
ARTICLE IN PRESS
0.00 0.50 1.00 1.50 2.00 2.50
Drop height (m)
0
200
400
600
Pul
se w
idth
(m
icro
sec
ond)
Cast steel hammer pulse width
Prediction
Experimental
Fig 18. Variation of pulse width as a function of drop height for 1000 kg cast steel hammer.
R. Rajendran et al. / International Journal of Impact Engineering 31 (2005) 307–325324
References
[1] IAEA Safety Standard Series. Regulations for the safe transport of radioactive material, No. ST-1. Vienna: IAEA;
1996.
[2] Shappart LB. Irradiated fuel shipping cask design guide line. Oakridge, TN, USA: ONL; 1969.
[3] Yagawa G, Ohtsubo H, Takeda H, Toi Y, Aizawa T, Ikushima T. A round robin on numerical analysis for impact
problems. Nucl Eng Des 1984;78:377–87.
[4] Mc Connell P, Soreson KB. Sandia National Laboratories cask drop programme: a demonstration of fracture
mechanics principles for the prevention of brittle fracture. Int J Radioactive Mater Transp 1995;6(2/3):59–163.
[5] Ku JH, Seo KS, Park SW, Kim YJ. Beneficial influence of the weldment rupture of cask impact limiter case on the
impact absorbing behaviour. Nucl Eng Des 2000;196:263–79.
[6] Shappart LB. Completion of the radioactive materials packaging hand book: an overview. Int J Radioactive Mater
Transp 1999;10(4):263–8.
[7] Janberg K, Diersch R, Spilker H, Dreier G. Design assessment for transportation and storage cask. Int J
Radioactive Mater Transp 1995;6(2/3):191–6.
[8] Instruction Bulletin, B-129-7, Vishay Measurements Group Inc., North Carolina, USA, 1976.
[9] Harris C. Shock and vibration hand book. New York: McGraw-Hill; 1996.
[10] Dieter GE. Mechanical metallurgy. Singapore: McGraw-Hill; 1988.
[11] Blake A. Practical stress analysis in engineering design. New York: Marcel Dekker; 1990.
[12] Irwin V. Shock motions and their measurement. Endevco technical paper, Endevco, CA 92675, USA, 2000.
[13] Clough RW, Penzien J. Dynamics of structures. Singapore: McGraw-Hill Inc; 1995.
[14] Paz M. Structural dynamics. New York: Chapman & Hall; 1997.
ARTICLE IN PRESS
R. Rajendran et al. / International Journal of Impact Engineering 31 (2005) 307–325 325
Top Related
Copyright © 2022 FDOKUMEN

