


Bahasa
Halaman
Hukum


Pre-feasibility Report of the Proposed Product Mix Change Program
Proposed New Additional Products:
DL-Lysine Acetyl Salicylate, 7-Methyl Xanthine and Bentonite
at V.B. Medicare Pvt. Limited
Plot No. 59, 61, 62, 63, 66A and 67 SIPCOT Industrial Area, Phase II
Krishnagiri District, Hosur – 635109
Conducted by
NABET Accredited EIA Consultant Organization
Cholamandalam MS Risk Services Limited Parry House, 4th Floor,
No:2, N.S.C Bose Road, Chennai - 600 001
June, 2016

Pre-feasibility Report of the Proposed Product Mix Change Program,
V.B. Medicare Pvt. Limited Plot No. 59, 61, 62, 63, 66A and 67
SIPCOT Industrial Area, Phase II Krishnagiri District, Hosur – 635109
2
1. INTRODUCTION 7
2. DETAILS OF THE EXISTING FACILITIES 11
2.1 COAL FIRED BOILER 12
2.2 AIR COMPRESSORS 12
2.3 ELECTRICAL ENERGY DEMAND AND CAPTIVE POWER GENERATION 14
2.4 SOLVENT STORAGE AREA 14
2.5 FIRE HYDRANT AND FIRE WATER PUMP SYSTEM 15
2.6 WATER DEMAND IN THE EXISTING FACILITY 15
2.7. WASTEWATER GENERATION, REUSE AND RECYCLING IN THE EXISTING FACILITY 16
2.8 HAZARDOUS WASTE STORAGE AND DISPOSAL 16
3. DETAILS OF THE PROPOSED PRODUCT MIX CHANGE PROGRAM 17
3.1 PRODUCTS PROPOSED TO BE MANUFACTURED 17
3.2 NEED FOR PROJECT 18
A) 7-Methyl Xanthine 18
B) DL – Lysine Acetylsalicylate 19
C) Bentonite 19
3.3 PRODUCTION UNITS 19
3.4 PROCESS DESCRIPTION 20
3.4.1 DL-Lysine Acetyl Salicylate- Process Description 20
3.4.2 Bentonite – Process Description 23
3.4.3 7-Methyl Xanthine – Process Description 25
3.5 WATER REQUIREMENT FOR PROPOSED PRODUCT MIX CHANGE 30
3.6 WASTEWATER GENERATION FROM THE PROPOSED EXPANSION FACILITY 30
3.7 ELECTRICAL ENERGY DEMAND FOR THE PROPOSED PRODUCT MIX CHANGE OPERATIONS 30
3.8 PROJECT COST AND PROJECT SCHEDULES 31
4. CONCLUSION 32

Pre-feasibility Report of the Proposed Product Mix Change Program,
V.B. Medicare Pvt. Limited Plot No. 59, 61, 62, 63, 66A and 67
SIPCOT Industrial Area, Phase II Krishnagiri District, Hosur – 635109
3
List of Figures
Figure 1: Location of the V.B Medicare Private Limited Facility in the SIPCOT Industrial
Area 9
Figure 2: Vicinity Map of the Existing Facility 10
Figure 3: View of Existing Facilities of V.B Medicare Private Limited 11
Figure 4: Layout of the Existing Facility 13
Figure 5: DL-Lysine acetyl salicylate- Typical Material Balance 22
Figure 6: Bentonite- Typical Material Balance 24
Figure 7: 7-Methyl Xanthine – Typical Material Balance 26
List of Tables
Table 1: Summary of the Proposed Product Mix Change and Reduced Production
Capacity 8
Table 2: Details of the Project Proponents 9
Table 3: Details of Solvent Storage Facility 15
Table 4: Summary of the Proposed Product Mix Change and Reduced Production
Capacity 17
Table 5: Features Showing the Current and Proposed Scenario 28

Executive summary M/s V.B Medicare (VBM) is a formulation and food ingredient manufacturing
unit setup in Phase 2, SIPCOT Industrial Area, near Hosur town in Krishnagiri
district, Tamil Nadu. It mainly manufactures bulk ingredient for the
neutraceutical and food market. The unit was acquired from M/s Bio-plus Life
Sciences (P) Limited by VBM in year 2006. The existing facility is spread over
the area of 6 Ha (60000 sq. m) comprising of plant facility of built up area
10876 m2.
The existing facility is consented to produce Glucosamine Hydrochloride of 240
TPA & Trichloro Galacto Pyranosyl Fructos furanoside (TGPF) of 72 TPA with
reference to vide letter F.No. J-11011/65/2013-IAII(I) dated 16th May,2015.
The unit has proposed to reduce the quantity of existing products i.e.,
Trichloro Galacto Pyranosyl Fructo Furanoside (TGPF) from 72 TPA to 61 TPA
and Tocopheryl Polyethylene Glycol Succinate (TPGS) quantity from 72 TPA &
60 TPA. Further unit has proposed to add three products i.e DL-Lysine acetyl
salicylate (6 TPA), 7-Methyl Xanthine (5 TPA) and Bentonite (12 TPA) by
maintaining the same production capacity of 564 TPA which was consented as
per earlier EC vide letter no. J-11011/65/2013, dated 16th May 2015.
However, the water requirement, wastewater generation and Hazardous waste
generation will not be increased from the earlier EC dated 2015.The same is
presented in the table below table:

Pre-feasibility Report of the Proposed Product Mix Change Program,
V.B. Medicare Pvt. Limited Plot No. 59, 61, 62, 63, 66A and 67
SIPCOT Industrial Area, Phase II Krishnagiri District, Hosur – 635109
5
Summary of the Proposed Product Mix Change and Reduced Production
Capacity
Product Name
EC 2008 Scenario
Production (MTPA)
EC 2015 Scenario
Production (MTPA)
Present proposal
2016 Scenario Capacity (MTPA)
Total Production
After Implementation
of proposed product mix
change (MTPA)
Trichloro Galacto Pyranosyl Fructo Furanoside (TGPF)
72 72 --- 61
Glucosamine Hydrochloride (GHC)
240 240 --- 240
Docosahexaenoic acid (DHA) --- 180 --- 180
Tocopheryl (polyethylene glycol Succinate(TPGS)
--- 72 --- 60
DL-Lysine acetyl salicylate --- --- 6 6
7-methyl Xanthine --- --- 5 5
Bentonite --- --- 12 12 Total 312 564 23 564
Details of Utilities Required for Expansion Program Land Requirement
The Proposed facilities will be developed within the existing project site.
Hence no additional land will be procured for the proposed expansion
activity.
The Column depicts there is no change in production quantity
Pre-feasibility Report of the Proposed Product Mix Change Program,
V.B. Medicare Pvt. Limited Plot No. 59, 61, 62, 63, 66A and 67
SIPCOT Industrial Area, Phase II Krishnagiri District, Hosur – 635109
6
Water Requirement
It has been estimated that no additional water would be required for
producing additional three products. At present the existing facility is
consented to draw 443 m3/day of water from SIPCOT authorities and there
will not be any change after the proposed product mix change program. The
same consent letter issued by SIPCOT is attached as Annexure-VI.
Power Requirement
The total electrical demand in the existing facility is about 1000 KVA and the
same is sourced from Tamilnadu State Electrical Grid. The allocated contract
demand for the existing facility is 1900 KVA. Two DG sets of capacity
500KVA and 750KVA are installed at the project site. Due to power shedding
in the region, about 500KVA of the power is being sourced from the captive
diesel generator sets.
Cost of the Project & Schedule The proposed three products will be manufactured within the existing facility
and within the existing reactors. Since, there will be no additional reactors/
equipments will be installed there is no CAPEX involved for the proposed
product mix change program.
The expansion and product mix change operations project will be completed
within 2 months from the date of receipt of environmental clearance and
other requisite permits.

Pre-feasibility Report of the Proposed Product Mix Change Program,
V.B. Medicare Pvt. Limited Plot No. 59, 61, 62, 63, 66A and 67
SIPCOT Industrial Area, Phase II Krishnagiri District, Hosur – 635109
7
1. Introduction
M/s V B Medicare Private Limited is operating its food ingredients
manufacturing unit in Phase 2, SIPCOT Industrial Area, near Hosur town in
Krishnagiri district, Tamil Nadu. The existing facility is developed in an area
of 14.82 Acres (6 Hectares). Location of the existing facility in the State of
Tamilnadu is shown in Figure 1 and vicinity of the industrial area showing
the location of the facility is shown in Figure 2. The existing facility was
accorded environmental clearance by Ministry of Environment and Forests
(MoEF), vide letter no. J-11011/65/2013, dated 16th May 2015 for
manufacturing 72 MTPA of Trichloro Galacto Pyranosyl Fructo Furanoside
(TGPF) and 240 MTPA of Glucosamine Hydrochloride (GHC) (Annexure-VII).
The existing facility is consented to produce Glucosamine Hydrochloride of
240 TPA & Trichloro Galacto Pyranosyl Fructos furanoside (TGPF) of 72 TPA
with reference to vide letter F.No. J-11011/65/2013-IAII (I) dated 16th
May,2015.
The unit has proposed to reduce the production quantity of Trichloro Galacto
Pyranosyl Fructo Furanoside (TGPF) from 72 TPA to 61 TPA and Tocopheryl
Polyethylene Glycol Succinate (TPGS) quantity from 72 TPA & 60
TPA.Further unit has proposed to add three products i.e DL-Lysine acetyl
salicylate (6 TPA), 7-Methyl Xanthine (5 TPA) and Bentonite (12 TPA) by
maintaining the same production capacity of 564 TPA which was consented
as per earlier 2015 EC. However, the water, waste water, steam consumption
and Hazardous waste will not be increased from the earlier EC dated
2015.The same is presented in the table below:

Pre-feasibility Report of the Proposed Product Mix Change Program,
V.B. Medicare Pvt. Limited Plot No. 59, 61, 62, 63, 66A and 67
SIPCOT Industrial Area, Phase II Krishnagiri District, Hosur – 635109
8
Table 1-1: Summary of the Proposed Product Mix Change and Reduced Production Capacity
Product Name
EC 2008 Scenario
Production (MTPA)
EC 2015 Scenario
Production (MTPA)
Present proposal
2016 Scenario Capacity (MTPA)
Total Production
After Implementation
of proposed product mix
change (MTPA)
Trichloro Galacto
Pyranosyl Fructo
Furanoside (TGPF)
72 72 --- 61
Glucosamine
Hydrochloride
(GHC)
240 240 --- 240
Docosahexaenoic
acid (DHA) --- 180 --- 180
Tocopheryl
Polyethylene Glycol
Succinate(TPGS)
--- 72 --- 60
DL-Lysine acetyl
salicylate --- --- 6 6
7-methyl Xanthine --- --- 5 5
Bentonite --- --- 12 12
Total 312 564 23 564
Details of the proponents and board members of the M/s V B Medicare
Private Limited are presented in the following Table 1.2.
The Column depicts there is no change in production quantity

Pre-feasibility Report of the Proposed Product Mix Change Program,
V.B. Medicare Pvt. Limited Plot No. 59, 61, 62, 63, 66A and 67
SIPCOT Industrial Area, Phase II Krishnagiri District, Hosur – 635109
9
Table 1-2: Details of the Project Proponents
Name Role/designation in the Company
Mr. Vasanth Kumar Director Mr. A.V.S. Ganesan Director
Figure 1: Location of the V.B Medicare Private Limited Facility in the SIPCOT Industrial Area
Project Site

Pre-feasibility Report of the Proposed Product Mix Change Program,
V.B. Medicare Pvt. Limited Plot No. 59, 61, 62, 63, 66A and 67
SIPCOT Industrial Area, Phase II Krishnagiri District, Hosur – 635109
10
Figure 2: Vicinity Map of the Existing Facility
Project site coordinates are as follows:
A 12º43’29.3” N 77º52’5.62” E B 12º43’26.82” N 77º52’11.18” E C 12º43’24.71” N 77º52’10.1” E D 12º43’22.04” N 77º52’15.35” E E 12º43’16.69” N 77º52’12.72” E F 12º43’20.42” N 77º52’5.19” E G 12º43’25.05” N 77º52’7.78” E H 12º43’27.08” N 77º52’4.38” E
Existing VB Medicare
facility in SIPCOT
A
B
C
D
E
F
G
H

Pre-feasibility Report of the Proposed Product Mix Change Program,
V.B. Medicare Pvt. Limited Plot No. 59, 61, 62, 63, 66A and 67
SIPCOT Industrial Area, Phase II Krishnagiri District, Hosur – 635109
11
M/s V B Medicare Private Limited has implemented all the required
environmental and safety management programs as per the applicable
standards and regulations in the existing facility. The existing facility is
certified for ISO 9001:2008 quality management standards. A brief overview
of the details of the existing environmental management plans implemented
in the facility is presented in section 2 of this report.
2. Details of the Existing Facilities
The existing facility consists of production blocks and other supporting
facilities to cater to the production needs of the plant. All the production
blocks have been designed as per the applicable building codes and
regulations. Typical photographs of the existing facility are shown in Figure
3.
Total plant area : 6 Hectares (60000 Sq.m) [a] Built up area : 10876 sq.m [b] Solid waste Storage/Disposal area : 126 sq. m [c] Green Belt / Irrigation area : 31000 sq.m (52% of total area) [d] Vacant area : 18000 sq. m
Figure 3: View of Existing Facilities of V.B Medicare Private Limited
View of the Main Entrance of the
Facility View of the Main Production Block

Pre-feasibility Report of the Proposed Product Mix Change Program,
V.B. Medicare Pvt. Limited Plot No. 59, 61, 62, 63, 66A and 67
SIPCOT Industrial Area, Phase II Krishnagiri District, Hosur – 635109
12
Typical layout of the facility is presented in Figure 4. The main plant
facilities are supported by the following supporting and essential facilities:
2.1 Coal Fired Boiler
• Steam generating unit (Boiler) with an installed capacity of 10 T/hr
and an operating throughout of 2 T/hr is in operation. Boiler
operating conditions are as follows: steam temperature - 1500C, steam
pressure - 7 kg/cm2 and operating steam - 3.5 to 4 kg/cm2.
• Indonesian coal is being procured from the local suppliers and is used
as a primary fuel in the boiler. Briquettes are also used as
supplementary fuel in the boiler.
• RO water is being fed to the boiler with TDS around 60 to 80 mg/l
and hardness around 0 to 5 mg/l.
• Cyclone and bag filter are installed to control the particulate matter
emissions from the boiler.
• Coal is stored in covered shed in the existing facility and a dedicated
coal crusher with bag filter system in operation to cater to the coal
requirement of the boiler
• Water sprinkling systems are provided near the coal handling areas
including transfer points.
• There will not be any change / installation of new boiler in the
facility. The existing boiler is adequate for the proposed product
mix change program
2.2 Air Compressors
Two number of 100 CFM capacity (each) reciprocating compressors are
catering to the compressed air requirements in the existing plant.
Compressors are placed in a closed room to ensure that the noise levels are
maintained below the acceptable levels outside the compressor room.

Pre-feasibility Report of the Proposed Product Mix Change
Program, (Proposed Additional new products: DL-Lysine
acetyl salicylate, 7-methyl Xanthine and Bentonite)
V.B. Medicare Pvt. Limited Plot No. 59, 61, 62, 63, 66A and 67
SIPCOT Industrial Area, Phase II Krishnagiri District, Hosur – 635109
13
Figure 4: Layout of the Existing Facility with Proposed Product Mix Change
- Production Area of Proposed Products

Pre-feasibility Report of the Proposed Product Mix Change Program, (Proposed Additional new
products: DL-Lysine acetyl salicylate, 7-methyl Xanthine and Bentonite)
V.B. Medicare Pvt. Limited Plot No. 59, 61, 62, 63, 66A and 67
SIPCOT Industrial Area, Phase II Krishnagiri District, Hosur – 635109
14
2.3 Electrical Energy Demand and Captive Power Generation
The total electrical demand in the existing facility is about 1000 KVA and the
same is sourced from Tamilnadu State Electrical Grid. The allocated contract
demand for the existing facility is 1900 KVA. Two DG sets of capacity 500
KVA and 750 KVA are installed at the project site. Due to power shedding in
the region, about 500 KVA of the power is being sourced from the captive
diesel generator sets. DG set are generally operated for about 10 to 15 hours
per day depending on the availability of grid power supply. DG set enclosures
are designed as per the CPCB guidelines and the noise levels outside the DG
set room were maintained below 70 dBA.
2.4 Solvent Storage Area
Dedicated and isolated solvent storage area is located in the existing facility.
Necessary permits from Petroleum and Explosives Safety Organization
(PESO) has been obtained for storage of solvents at the site with vide letter
no. P/HQ/TN/15/4502(P139267), DATED 4th March 2010. Details of the
storage tanks are presented in Table 2.1. All solvent storage tanks are above
ground and horizontal type tanks with adequately designed dyke sizes. Fire
hydrant lines and foam systems are made available at all the four corners of
the storage area. Water sprinklers are installed as per the good engineering
practices for all the storage tanks.
Pre-feasibility Report of the Proposed Product Mix Change Program, (Proposed Additional new
products: DL-Lysine acetyl salicylate, 7-methyl Xanthine and Bentonite)
V.B. Medicare Pvt. Limited Plot No. 59, 61, 62, 63, 66A and 67
SIPCOT Industrial Area, Phase II Krishnagiri District, Hosur – 635109
15
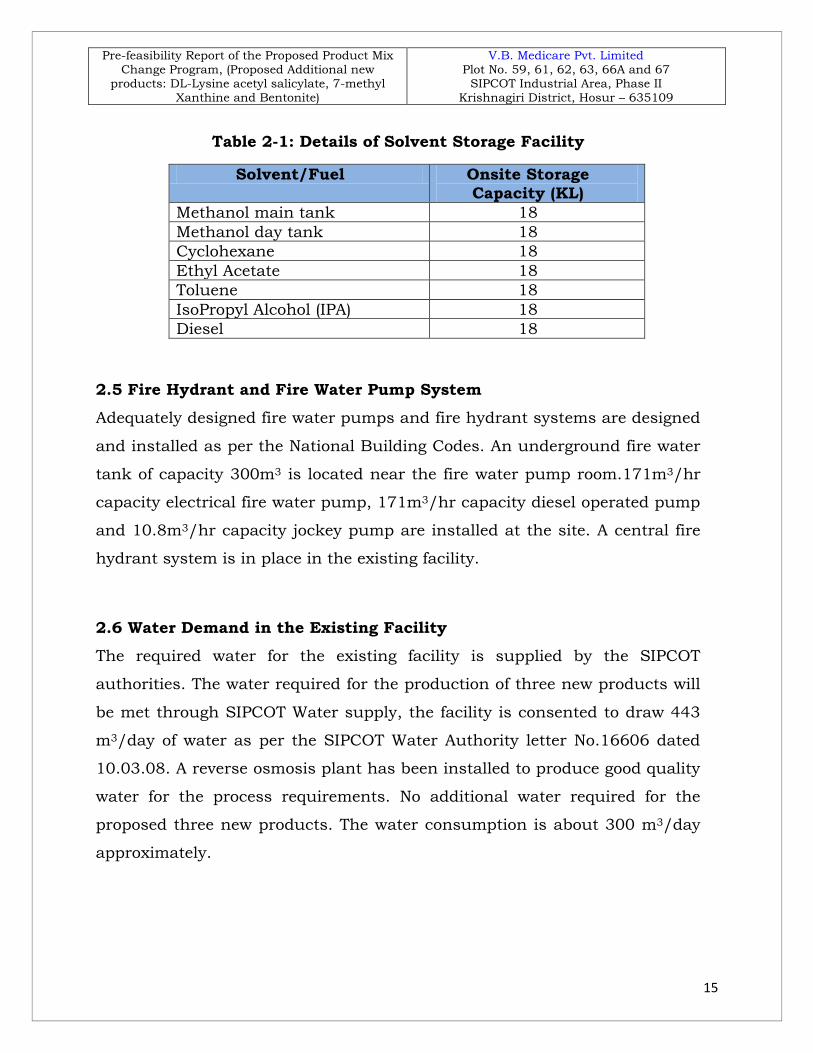
Table 2-1: Details of Solvent Storage Facility
Solvent/Fuel Onsite Storage Capacity (KL)
Methanol main tank 18 Methanol day tank 18 Cyclohexane 18 Ethyl Acetate 18 Toluene 18 IsoPropyl Alcohol (IPA) 18 Diesel 18
2.5 Fire Hydrant and Fire Water Pump System
Adequately designed fire water pumps and fire hydrant systems are designed
and installed as per the National Building Codes. An underground fire water
tank of capacity 300m3 is located near the fire water pump room.171m3/hr
capacity electrical fire water pump, 171m3/hr capacity diesel operated pump
and 10.8m3/hr capacity jockey pump are installed at the site. A central fire
hydrant system is in place in the existing facility.
2.6 Water Demand in the Existing Facility
The required water for the existing facility is supplied by the SIPCOT
authorities. The water required for the production of three new products will
be met through SIPCOT Water supply, the facility is consented to draw 443
m3/day of water as per the SIPCOT Water Authority letter No.16606 dated
10.03.08. A reverse osmosis plant has been installed to produce good quality
water for the process requirements. No additional water required for the
proposed three new products. The water consumption is about 300 m3/day
approximately.

Pre-feasibility Report of the Proposed Product Mix Change Program, (Proposed Additional new
products: DL-Lysine acetyl salicylate, 7-methyl Xanthine and Bentonite)
V.B. Medicare Pvt. Limited Plot No. 59, 61, 62, 63, 66A and 67
SIPCOT Industrial Area, Phase II Krishnagiri District, Hosur – 635109
16
2.7. Wastewater Generation, Reuse and Recycling in the Existing
Facility
The existing facility is consented to generate and treat 30 m3/day of sewage,
169 m3/day of industrial wastewater. About 20m3/day of industrial
wastewater generated from the existing facility and the same is treated in a
dedicated three stage treatment process. ETP consists of collection tank,
Clariflocculator, extended aeration biological treatment plant with secondary
clarifier and dedicated reverse osmosis plant. About 12 m3/day of permeate
is recovered from the plant and reused for utilities and garnering application.
R.O rejects to the tune of 8 m3/day is treated in a three stage multiple effect
evaporator with a dryer.
After expansion the waste water generation will not be increased and remain
125m3/day and there will be no increase after the proposed product mix
change program. So, the existing ETP is adequate to treat the wastewater
after proposed product mix change, further the treated wastewater will be
complied with the prescribed CPCB standards.
A dedicated sewage treatment plant is in operation and the treated sewage is
reused for gardening application. By implementing the above scheme, the
existing facility is able to achieve zero liquid discharge operations.
2.8 Hazardous Waste Storage and Disposal
The facility is consented to dispose about 42 T/year of chemical sludge from
Waste water treatment and 884 T/year of mechanical evaporator Residue as
per the TNPCB vide Authorization No. 3212. After the proposed product mix
change program the facilty is going to generate 704 TPA of which is lesser
thatn the consented value. Necessary membership in the Tamilnadu Waste
Management Limited has been obtained. No additional waste generation due
to addition of three new products.

Pre-feasibility Report of the Proposed Product Mix Change Program, (Proposed Additional new
products: DL-Lysine acetyl salicylate, 7-methyl Xanthine and Bentonite)
V.B. Medicare Pvt. Limited Plot No. 59, 61, 62, 63, 66A and 67
SIPCOT Industrial Area, Phase II Krishnagiri District, Hosur – 635109
17
3. Details of the Proposed Product Mix Change Program
3.1 Products Proposed to be Manufactured
No additional land or infrastructure will be required to produce additional
product and all the new process equipments will be installed within the
existing factory premises. The Chronology of proposed product mix
operations at the existing facility along with proposed product are as follows:
Table 3-1: Summary of the Proposed Product Mix Change and Reduced Production Capacity
Product Name
EC 2008 Scenario Production (MTPA)
EC 2015 Scenario Production (MTPA)
Present proposal
2016 Scenari
o Capacit
y (MTPA)
Total Production
After Implementation of proposed product mix
change (MTPA)
Trichloro Galacto Pyranosyl Fructo Furanoside (TGPF)
72 72 --- 61
Glucosamine Hydrochloride (GHC)
240 240 --- 240
Docosahexaenoic acid (DHA) --- 180 --- 180
Tocopheryl (polyethylene glycol Succinate(TPGS)
--- 72 --- 60
DL-Lysine acetyl salicylate --- --- 6 6
7-methyl Xanthine --- --- 5 5
Bentonite --- --- 12 12 Total 312 564 23 564
The Column depicts there is no change in production quantity

Pre-feasibility Report of the Proposed Product Mix Change Program, (Proposed Additional new
products: DL-Lysine acetyl salicylate, 7-methyl Xanthine and Bentonite)
V.B. Medicare Pvt. Limited Plot No. 59, 61, 62, 63, 66A and 67
SIPCOT Industrial Area, Phase II Krishnagiri District, Hosur – 635109
18
3.2 Need for Project
V.B. Medicare has seen the opportunity in the food ingredients segment of
the industry and hence has proposed to manufacture for the said products.
Omega-3 functional food market is about US $100 million in 2002 and US
$2 billion in 2006 and by 2011 has reached about US $7 billion.
Polyunsaturated fatty acids (DHA) is used as a functional food ingredient in
various food products such as Beverages, Chocolates, Cereals, Ice creams,
Bakery products, yogurt and infant nutrition. Vitamin E Derivatives (TPGS
etc) are used as functional food ingredients and also as emulsifiers in
beverages and as a natural antioxidant.
V.B. Medicare has been looking for new projects / products for the growth of
the company as it is imperative to include new products which have good
potential in the market. Hence to grow as a company and also to exist in the
market with relevant products in the area of Active Ingredients, following
products have been proposed to be manufactured and sold by V.B. Medicare.
A) 7-Methyl Xanthine
This product is a metabolite of Caffeine which is present in Coffee and Tea
leaves. The class of products is Methyl Xanthines. The applications of 7
Methyl Xanthine is as follows
● Increases energy levels & strength
● Increases mental activity and more concentration by muscle
stimulation.
● Increases metabolic rate – Weight loss.
VB Medicare will actively promote 7 MX for treatment of myopia Eye
treatment and Sports Nutrition.

Pre-feasibility Report of the Proposed Product Mix Change Program, (Proposed Additional new
products: DL-Lysine acetyl salicylate, 7-methyl Xanthine and Bentonite)
V.B. Medicare Pvt. Limited Plot No. 59, 61, 62, 63, 66A and 67
SIPCOT Industrial Area, Phase II Krishnagiri District, Hosur – 635109
19
B) DL – Lysine Acetylsalicylate
DL-Lysine Acetylsalicylate is a part of the non-steroidal anti-inflammatory
drugs (NSAIDs) group. It is water soluble and, the compound is also an
analgesic, antipyretic and anti-inflammatory. The main applications of DL-
Lysine Acetyl Salicylate are
● Water soluble, injectable aspirin derivative for inhibiting cancer
● Analgesic; antipyretic; anti-inflammatory.
● Antirheumatic for treating arthritis, neuralgia and myalgia
C) Bentonite
Bentonite is a natural silicate of aluminium and magnesium. Originate from
the meteoric or hydrothermal degradation of feldspars, or other minerals.
They are mostly found in massive rocky masses. Due to their properties,
they exhibit high chemical inertness, high adsorption capacity, high internal
surface area and high cations exchange capacity. Its applications is mainly
in the area of gastrointestinal diseases. Some of the applications are
● Skin ailments
● Pharmaceutic aid
● Antacid
● Astringent agent
● Antidiarrheal agent: Intestinal adsorbent
● Protectant of gastrointestinal mucosa
3.3 Production Units
As discussed in the previous sections, no additional infrastructure would be
required for the manufacture of the proposed products. The following
existing facilities will be used for the manufacture of the proposed products:
• SS Reactors ranging from 500 L – 9.0 KL
• Glass Lined Reactors ranging from 1.0 KL to 8.0 KL

Pre-feasibility Report of the Proposed Product Mix Change Program, (Proposed Additional new
products: DL-Lysine acetyl salicylate, 7-methyl Xanthine and Bentonite)
V.B. Medicare Pvt. Limited Plot No. 59, 61, 62, 63, 66A and 67
SIPCOT Industrial Area, Phase II Krishnagiri District, Hosur – 635109
20
• Continuous Distillation Set up to handle up to 2 KL / hr feed rate
• Filtration systems such as Nutsch Filter, Agitated Nutsch Filter, Leaf
Filter, Sparkler filter, Centrifuges & Bag Filters
• Milling equipments such as Air Jet Mill and Multi mills
• Drying equipments such as Tray Driers, Fluidized Bed Drier
3.4 Process Description
An overview of the manufacturing process and typical material balance
diagrams are presented hereunder.
3.4.1 DL-Lysine Acetyl Salicylate- Process Description
The manufacture of DL-Lysine Acetyl Salicylate involves the following 4
stages.
STAGE-I (Dissolution) Water is first charged into reactor. Then Glycine is charged. Stirred to
dissolve. Then DL-Lysine will be added and stirred. Heat to 400C and
maintain for one hour to dissolve DL-Lysine. Further on dissolution activated
charcoal is added and temperature is maintained for 1.5 hr
STAGE-II (Charcolization) Further on dissolution activated charcoal of 7.2 Kg is added and temperature
is maintained for 1.5 hr. Filtered through hyflo bed followed by 1 micron
filter, then water wash is given. Filtered through hyflo bed followed by 1
micron filter, then water wash is given. pH of 5-6 is maintained for solid
disposal.

Pre-feasibility Report of the Proposed Product Mix Change Program, (Proposed Additional new
products: DL-Lysine acetyl salicylate, 7-methyl Xanthine and Bentonite)
V.B. Medicare Pvt. Limited Plot No. 59, 61, 62, 63, 66A and 67
SIPCOT Industrial Area, Phase II Krishnagiri District, Hosur – 635109
21
STAGE-III (Crystallization) In this stage 234 L of Isopropyl alcohol (IPA) is charged followed by 117.0 Kg
of Asprin. Mass is stirred to form a suspension. The above prepared DL-
Lysine solution is added slowly. The reaction mass is stirred at room
temperature. Then 1650 L of isopropyl alcohol is added and then the
crystallization starts.
STAGE-IV (Filtration) The reaction mass is stirred and external cooling is given to attain 0-50C. The
reaction mass temperature is maintained for temperature of 0-50C overnight.
The separate solid is taken back into the reactor; to this 360 L of pre-chilled
(0-50C) isopropyl alcohol is added and stirred. Then filtered, and dried at 30-
35 0C under vacuum. The solids, final product is unloaded, sieved and
packed. Then the sample is submitted for complete analysis.

Pre-feasibility Report of the Proposed Product Mix Change Program, (Proposed Additional new
products: DL-Lysine acetyl salicylate, 7-methyl Xanthine and Bentonite)
V.B. Medicare Pvt. Limited Plot No. 59, 61, 62, 63, 66A and 67
SIPCOT Industrial Area, Phase II Krishnagiri District, Hosur – 635109
22
Figure 5: DL-Lysine acetyl salicylate- Typical Material Balance
Water (360L)Glycine (4.5kg) Dissolution
DL-Lysine (90 kg)
Heat to 40-45 degC, 60 min
CharcolizationActivatedCharcoal (7.2 kg)
Crystallization
Spent Hyflo + Charcoal(12.5 Kg), pH 5 to 6For Solid disposal
IPA (1884L)Aspirin (117 kg)
Cool to 0 - 5 deg C
Filtration
Wet wt. of Solids 206 kg
Filtration
IPA (360L)
Drying / Milling / Sieving
Product for packing138-144 kg
Wet wt of final product ~180kg
Filtrate (2255 L) for IPA recovery and reuse
Solid Residue (~65 + 5 kg)pH 5 to 7 for disposal
Filtrate (387 L) for IPA recovery and reuse

Pre-feasibility Report of the Proposed Product Mix Change Program, (Proposed Additional new
products: DL-Lysine acetyl salicylate, 7-methyl Xanthine and Bentonite)
V.B. Medicare Pvt. Limited Plot No. 59, 61, 62, 63, 66A and 67
SIPCOT Industrial Area, Phase II Krishnagiri District, Hosur – 635109
23
3.4.2 Bentonite – Process Description
The manufacture of Bentonite involves the 4 stages. The following process
description is given
Crude Bentonite powder of 400 Kg is taken in 1600L of water. Mass is
heated to 60-650C, and is stirred continuously.
In the second stage, to the settled solids, 1600 L of water is added and
heated to 60-650C, and similar to the first stage it is stirred continuously.
In the third stage again 1600 L of water is added and heated to 60-650C, and
similar to the second stage and it is stirred continuously.
The temperature is maintained for 2 hr and it is allowed to attain room
temperature and kept for settling overnight. The supernatant is decanted
and the solids (slurry) are filtered. The solid is crushed and milled. After
crushing and milling the sample is given for analysis and product is packed.

Pre-feasibility Report of the Proposed Product Mix Change Program, (Proposed Additional new
products: DL-Lysine acetyl salicylate, 7-methyl Xanthine and Bentonite)
V.B. Medicare Pvt. Limited Plot No. 59, 61, 62, 63, 66A and 67
SIPCOT Industrial Area, Phase II Krishnagiri District, Hosur – 635109
24
Figure 6: Bentonite- Typical Material Balance
AgitationWater (1600L)
Crude Bentonitepowder (400 kg)
Settling / Decantation
Heat to 60 - 65 degC, 1hr
AgitationWater (1600L)
Heat to 60 - 65 degC, 1hr
Settling / Decantation
AgitationWater (1600L)
Heat to 60 - 65 degC, 1hr
Settling / Decantation
Filtration Filtrate 410 L
Drying at 70-75 degC
Milling / Sieving
Drying at 130 degC
1200L
1440L
1536L
Packing ~ 368 kg

Pre-feasibility Report of the Proposed Product Mix Change Program, (Proposed Additional new
products: DL-Lysine acetyl salicylate, 7-methyl Xanthine and Bentonite)
V.B. Medicare Pvt. Limited Plot No. 59, 61, 62, 63, 66A and 67
SIPCOT Industrial Area, Phase II Krishnagiri District, Hosur – 635109
25
3.4.3 7-Methyl Xanthine – Process Description
The manufacture of 7-Methyl Xanthine involves the following 4 stages.
STAGE-I (Partial Demethylation) Charge POcl3 and the bromine into the reactor. The speed of the stirrer was
adjusted to 38-45 RPM. The temperature was raised to 103-1100C and
maintained for 24 hrs. After completion of 24 hrs, heating was stopped and
the reaction mass was allowed to cool room temperature 25-300C.
STAGE-II (Chlorination to get 2,6- Dichloro 7- Methyl Xanthine) To the above reaction mass add PCl5 and again heated to 104-1100C for 48
hr. Further POCl3 distillation (70-75% POCl3 distilled of initial volume).
Filtered the mass and wash with cyclohexane. The solid residue was washed
with water and filtered. Weigh the solid wet quantity.
STAGE-III (Hydrolysis of 2, 6-dicholoro 7-Methyl Xanthine)
The solid was transfer to glass line reactor and water is charged. Later
hydrocholoric acid was added. Mass temperature raised to 70-750C. After
Complete dissolution of solid, pH of the reaction mixture was adjusted to 0.3
to 0.4 and heating continued upto 950C and maintained at the same
temperature for 48 hrs. The reaction mass cooled to room temperature and it
is neutralized with 30% aqueous NaOH solution to pH 7-7.5. The residue
was washed with 10-200C, chilled water. Weigh the crude product.
STAGE-IV (Purification of 7-Methyl Xanthine)
Take crude 7-Methyl Xanthine and add required water and caustic solution
and heat the reaction mass to 800C for 2 hr. Mass should be clear solution.
If not, continue heating for another 1 hr. Cool the reaction mass to 0-50C for
72 hr and filter the mass. Wash cake with chilled water. Take again the
crude in reactor. Charge water and ethanol with respect to crude. The
reaction mass is heated to 700C for two hrs. Cool the reaction mass to 0-50C

Pre-feasibility Report of the Proposed Product Mix Change Program, (Proposed Additional new
products: DL-Lysine acetyl salicylate, 7-methyl Xanthine and Bentonite)
V.B. Medicare Pvt. Limited Plot No. 59, 61, 62, 63, 66A and 67
SIPCOT Industrial Area, Phase II Krishnagiri District, Hosur – 635109
26
for 24 hrs. Filter the mass, wash twice with chilled water and dry the
product. The product is sent for weighing the for packing.
Figure 7: 7-Methyl Xanthine – Typical Material Balance
ReactionPOCl3(6520kg)
PCl5 (880kg)
Distillation Recovered POCl3 (4896 kg)
Residue / FiltrationCyclohexane (1320 kg) Traces POCl3 and Cyclohexane (1400kg)
RO water (800kg) Aqueous layer (880 kg)
HydrolysisConc. HCl (300kg) pH - NMT 0.5
Cool and Neutralize
95 degC, reaction time 48 hrNaOH solution(532 kg)
Solid wet cake
Filtrate (3200kg)
Water (4000 L)NaOH flakes (190 kg)
Heat to 80-85 degC for 2 hrs
Cool to 0-5 degC for 24hr & filter
Filtration
Solid wet cake ~ 380 kg
Theobromine :400 kg
Cool to 0-5 deg. C
Solid wet cake ~ 470 kgWater (2000L)Retarder (280 L)
Cool to 0 - 5degC for 24hr
HCl (12L)Heat to 70-75 degC for 2hr
Filtrate (2315kg)Solid wet wt. ~ 400 kg
Dry Product for milling 104 kg
Drying at 70-75 degC
Final Product 100 kg
Cool & Filter
103-110degC, reaction time 72 hrs
Filtrate (4100kg)
2904
2744
Volatiles (296kg)Losses (4kg)

Pre-feasibility Report of the Proposed Product Mix Change Program, (Proposed Additional new
products: DL-Lysine acetyl salicylate, 7-methyl Xanthine and Bentonite)
V.B. Medicare Pvt. Limited Plot No. 59, 61, 62, 63, 66A and 67
SIPCOT Industrial Area, Phase II Krishnagiri District, Hosur – 635109
27
The brief description of the details consented for the the year 2008, 2015 &
proposed 2016 scenario is described in Table 3.2 below.
The unit has proposed to reduce the production quantity of Trichloro Galacto
Pyranosyl Fructo Furanoside (TGPF) from 72 TPA to 61 TPA and Tocopheryl
Polyethylene Glycol Succinate (TPGS) quantity from 72 TPA & 60 TPA.
Further unit has proposed to add three products i.e DL-Lysine acetyl
salicylate (6 TPA), 7-Methyl Xanthine (5 TPA) and Bentonite (12 TPA) by
maintaining the same production capacity of 564 TPA which was consented
as per earlier EC vide letter no. J-11011/65/2013, dated 16th May 2015.
However, the water, wastewater, steam consumption and Hazardous waste
will not be increased from the earlier EC dated 2015.The same is presented
in the table below:

Pre-feasibility Report of the Proposed Product Mix Change Program, (Proposed Additional new
products: DL-Lysine acetyl salicylate, 7-methyl Xanthine and Bentonite)
V.B. Medicare Pvt. Limited Plot No. 59, 61, 62, 63, 66A and 67
SIPCOT Industrial Area, Phase II Krishnagiri District, Hosur – 635109
28
Table 3-2: Features Showing the EC 2008 Scenario
Features Showing the EC 2015 Scenario
Product
Annual Produc
tion capacity – TPA
Rated monthl
y produc
tion capacity –Tons
Steam requireme
nt –
Coal consumption for boiler
Water consumpti
on
Wastewater
generation
Total solvent
consumption
Lts/day
Hazardous waste
generation Kg/day T/day T/day m3/day m3/day
EC 2008 scenario GHC 240 20 12 2 36 20 25.6 116 TGPF 72 6 30 5 372 149 950 2100 MEE - - 40 7 - - - - Total 312 26 82 14 408 169 975.6 2216
Product
Annual Produc
tion capacity – TPA
Rated monthl
y produc
tion capacity –Tons
Steam requireme
nt –
Coal consumption for boiler
Water consumpti
on
Wastewater
generation
Total solvent
consumption
Lts/day
Hazardous waste
generation Kg/day T/day T/day m3/day m3/day
EC 2015 scenario GHC 240 20 12 2 36 20 25.6 116 TGPF 72 6 Not
required Not
required 0.2 0.06 Not
required 6
DHA 180 15 34.4 6 259 101 1668 1745 TPGS 72 6 6 1 4 4 200 62 MEE - - 20 3.5 - - - Total 564 47 72.4 12.5 299.2 125.06 1893.6 1929

Pre-feasibility Report of the Proposed Product Mix Change Program, (Proposed Additional new
products: DL-Lysine acetyl salicylate, 7-methyl Xanthine and Bentonite)
V.B. Medicare Pvt. Limited Plot No. 59, 61, 62, 63, 66A and 67
SIPCOT Industrial Area, Phase II Krishnagiri District, Hosur – 635109
29
Features Showing Current proposal (2016 TOR Application)
Product
Annual Produc
tion capacity – TPA
Rated monthl
y produc
tion capacity –Tons
Steam requireme
nt –
Coal consumption for boiler
Water consumpti
on
Wastewater
generation
Total solvent
consumption
Lts/day
Hazardous waste
generation Kg/day
T/day T/day m3/day m3/day
Current proposal (2016 TOR Application) GHC 240 20 12 2 36 20 25.6 116 DHA 180 15 34.4 6 259 101 1668 1745
TGPF 61 5 Not required
Not required 0.2 0.04 Nil 5
TPGS 60 5 4.5 0.72 3 3 166 50 DL-
Lysine acetyl
salicylate
6 0.5 0.2 0.04 0.043 0.012 13 9.13
7-methyl Xanthin
e
5 0.41 0.9 0.17 0.91 1.40 12 3.73
Bentonite 12 1 0.4 0.07 0.45 0.056 Not
required Nil
MEE - - 20 3.5 - - - - Total 564 46.91 72.4 12.5 299.55 125.51 1884.6 1928.87
Pre-feasibility Report of the Proposed Product Mix Change Program, (Proposed Additional new
products: DL-Lysine acetyl salicylate, 7-methyl Xanthine and Bentonite)
V.B. Medicare Pvt. Limited Plot No. 59, 61, 62, 63, 66A and 67
SIPCOT Industrial Area, Phase II Krishnagiri District, Hosur – 635109
30
3.5 Water Requirement for Proposed Product Mix Change
Water required for the proposed product mix change operations will be
sourced from the existing water allocation from the SIPCOT authorities. Total
water demand after product mix change will be in the order of 300 m3/day,
which is well below the consented water consumption level of 443 m3/day.
Therefore the existing water collection and pre-treatment facilities are
adequate to meet the future demands. No additional manpower would be
required for the proposed operations and hence the water demand for
domestic and sanitation activities will remain well within the current
consumption level of 25 to 30 m3/day.
3.6 Wastewater Generation from the Proposed Product Mix Facility
The facility is already implementing the ZLD in the existing facility. ETP-1
treats the low TDS effluent and ETP-2 treats the high TDS effluent. At
present the waste water generation is to the tune of 125m3/day and there
will be no increase after the proposed product mix change program. The
waste generation will not be increased due to proposed product mix
change program. So, the existing ETP is adequate to treat the wastewater
after proposed product mix change, further the treated wastewater will be
complied with the prescribed CPCB standards.
3.7 Electrical Energy Demand for the Proposed Product Mix Change
Operations
No additional Power required for manufacturing of additional the three new
products. It is to be noted that the unit has not initiated the production of
two products which was permitted as per earlier Environmental Clearance
obtained.

Pre-feasibility Report of the Proposed Product Mix Change Program, (Proposed Additional new
products: DL-Lysine acetyl salicylate, 7-methyl Xanthine and Bentonite)
V.B. Medicare Pvt. Limited Plot No. 59, 61, 62, 63, 66A and 67
SIPCOT Industrial Area, Phase II Krishnagiri District, Hosur – 635109
31
3.8 Project Cost and Project Schedules
The proposed three products will be manufactured within the existing facility
and within the existing reactors. Since, there will be no additional reactors/
equipments will be installed there is no CAPEX involved for the proposed
product mix change program.
The expansion and product mix change operations project will be completed
within 2 months from the date of receipt of environmental clearance and
other requisite permits.

Pre-feasibility Report of the Proposed Product Mix Change Program, (Proposed Additional new
products: DL-Lysine acetyl salicylate, 7-methyl Xanthine and Bentonite)
V.B. Medicare Pvt. Limited Plot No. 59, 61, 62, 63, 66A and 67
SIPCOT Industrial Area, Phase II Krishnagiri District, Hosur – 635109
32
4. Conclusions
1. The unit has proposed to reduce the quantity of existing products i.e.,
Trichloro Galacto Pyranosyl Fructo Furanoside (TGPF) from 72 TPA to
61 TPA and Tocopheryl Polyethylene Glycol Succinate (TPGS) quantity
from 72 TPA & 60 TPA.
2. The unit has proposed to add three new products i.e DL-Lysine acetyl
salicylate (6 TPA), 7-Methyl Xanthine (5 TPA) and Bentonite (12 TPA)
by maintaining the same production capacity of 564 TPA which was
consented as per earlier EC vide letter no. J-11011/65/2013, dated
16th May 2015.
3. This project will have beneficial effects in terms of growth and
development of the regional economy.
4. Air Emission control measures like Wet scrubber, Bag filter are
provided in stacks to minimise the environmental impact.
5. No additional land, building or infrastructures including reactors,
equipments will be required for the proposed Product mix program.

Environmental Management Plan VB Medicare, Hosur, Tamil Nadu
1
Environmental Management Plan Report for the Proposed Product Mix Change Program
Proposed Additional New Products
DL-Lysine Acetyl Salicylate, 7-Methyl Xanthine and Bentonite
At
V.B. Medicare Pvt. Limited Plot No. 59, 61, 62, 63, 66A and 67
SIPCOT Industrial Area, Phase II Krishnagiri District, Hosur, Tamil Nadu – 635109
EIA Consultant
NABET Accredited EIA Consultant Organization
Cholamandalam MS Risk Services Limited Parry House, 4th Floor,
No:2, N.S.C Bose Road, Chennai - 600 001
June, 2016
2
Table of Contents 1. EXECUTIVE SUMMARY ..................................................................................................................................... 7
1.2 DETAILS OF UTILITIES REQUIRED FOR PROPOSED PRODUCT MIX CHANGE PROGRAM PROGRAM ............................ 8 1.2.1 Land Requirement ............................................................................................................................................. 8 1.2.2 Water Requirement ........................................................................................................................................... 9 1.2.3 Power Requirement ........................................................................................................................................... 9 1.2.4 Cost of the Project & Schedule ......................................................................................................................... 9
2. INTRODUCTION ................................................................................................................................................. 10
2.1. OVERVIEW ........................................................................................................................................................... 10 2.2. OVERVIEW OF THE EXISTING EC AND OPERATIONS ............................................................................................. 17
3. DETAILS OF THE EXISTING FACILITY AND ENVIRONMENTAL COMPLIANCE............................ 18
3.1. FACILITY LAYOUT AND LAND USE BREAK-UP ..................................................................................................... 18 3.2. MAJOR FACILITIES LOCATED ............................................................................................................................... 19
3.2.1. Diesel Generator Sets ............................................................................................................................ 19 3.2.2. Boiler ...................................................................................................................................................... 20 3.2.3. Process Emissions .................................................................................................................................. 21 3.2.4. Water Requirement and Wastewater Treatment..................................................................................... 21 3.2.5. Effluent Treatment Plant ........................................................................................................................ 22 3.2.5.1. Effluent Treatment Plant -1 .................................................................................................................... 22 3.2.5.2. Effluent Treatment Plant-2 ..................................................................................................................... 24 3.2.6. Sewage Treatment Plant ........................................................................................................................ 25 3.2.7. Noise Levels in the Existing Facility ...................................................................................................... 26 3.2.8. Solid Waste ............................................................................................................................................. 27 3.2.9. Compressors........................................................................................................................................... 27 3.2.10. Solvent Storage ...................................................................................................................................... 27
3.3. ELECTRICAL POWER CONSUMPTION AND SOURCE ............................................................................................... 28 3.4. GREENBELT AND PLANTATION AREA .................................................................................................................. 29 3.5. OCCUPATIONAL HEALTH ..................................................................................................................................... 30 3.6. FIRE FIGHTING SYSTEMS AND SAFETY MEASURES ADOPTED .............................................................................. 30
4. DETAILS OF THE PROPOSED PRODUCTS .................................................................................................. 32
4.1 PROCESS DESCRIPTION OF THE PROPOSED PRODUCT ............................................................................................ 32 4.1.1. Manufacture of DL-Lysine Acetyl Salicylate- Process Description ....................................................... 32 4.1.2. Manufacturing Process of 7-methyl Xanthine ....................................................................................... 35
STAGE I: PARTIAL DEMETHYLATION ........................................................................................................................... 35 STAGE II: CHLORINATION TO GET 2,6 –DICHLORO 7-METHYL XANTHINE .................................................................... 35 STAGE III: HYDROLYSIS OF 2,6 –DICHLORO 7-METHYL XANTHINE ............................................................................. 35
4.1.3. Manufacturing Process of Bentonite ..................................................................................................... 38

3
5. BASELINE ENVIRONMENTAL CONDITION ............................................................................................... 42
5.1 LOCATION OF THE FACILITY AND OVERVIEW OF THE BACKGROUND ENVIRONMENTAL FEATURES ..................... 42 5.2 LAND ENVIRONMENT ........................................................................................................................................... 42
5.2.1. Physiography of Hosur Taluk ................................................................................................................ 42 5.2.2. Drainage Pattern of the District ............................................................................................................ 43 5.2.3. Land use/ Land Cover Study .................................................................................................................. 43
5.3. GEOLOGY AND SOIL QUALITY ............................................................................................................................. 52 5.3.1. Geology .................................................................................................................................................. 52
5.4. SOIL ENVIRONMENT............................................................................................................................................. 54 5.4.1. Soil Quality in Study Area ..................................................................................................................... 55
5.5. WATER ENVIRONMENT ........................................................................................................................................ 56 5.5.1. Hydrogeology of Krishnagiri District .................................................................................................... 56 5.5.2. Groundwater Quality in Study Area ....................................................................................................... 58
5.6. AIR ENVIRONMENT .............................................................................................................................................. 58 5.6.1. Meteorology ........................................................................................................................................... 58 5.6.2. Regional Meteorology – IMD Data ....................................................................................................... 59 5.6.3. Site Specific Meteorological Data .......................................................................................................... 63 5.6.4. Air Quality of Study Area ....................................................................................................................... 64
5.7. NOISE ENVIRONMENT .......................................................................................................................................... 69 5.8. SOCIOECONOMIC PROFILE OF THE STUDY AREA .................................................................................................. 70
5.8.1. Demography ........................................................................................................................................... 70 5.8.2. Economic Indicators .............................................................................................................................. 73 Industries in the Study Area .................................................................................................................................... 76
6. ENVIRONMENT IMPACT PREDICTION ....................................................................................................... 83
6.1. INTRODUCTION .................................................................................................................................................... 83 6.2. IMPACT DURING CONSTRUCTION PHASE .............................................................................................................. 84 6.3. OPERATION PHASE AIR QUALITY IMPACTS .......................................................................................................... 84
6.3.1. Point Source Emissions .......................................................................................................................... 85 6.3.2. Fugitive Emissions ................................................................................................................................. 85
6.4. WATER DEMAND AND WASTEWATER GENERATION ............................................................................................ 85 6.4.1. Solid and Hazardous Waste Generation ................................................................................................ 90 6.4.2. Predicted Impacts on Ecology................................................................................................................ 91
6.5. SUMMARY OF IMPACTS ........................................................................................................................................ 91
6. ENVIRONMENTAL MANAGEMENT PLAN .................................................................................................. 94
6.1. PREAMBLE ........................................................................................................................................................... 94 6.2. ENVIRONMENT MANAGEMENT PLAN DURING OPERATION PHASE ....................................................................... 94
6.2.1. Land Use ................................................................................................................................................ 95 6.2.2. Air Quality Management Plan ............................................................................................................... 95 6.2.3. Noise Management Plan ........................................................................................................................ 96

4
6.2.4. Water and Wastewater Management ..................................................................................................... 96 6.2.5. Storm water Management ...................................................................................................................... 97 6.2.6. Solid and Hazardous Waste Disposal Management .............................................................................. 98 6.2.7. Management of Storage and Handling of Solvents ................................................................................ 98 6.2.8. Development of Green Belt .................................................................................................................... 99 6.2.9. Socio Economic Aspects and CSR Plan ................................................................................................. 99
6.3. ENVIRONMENTAL MONITORING PLAN ............................................................................................................... 100 6.3.1. Data Analysis ....................................................................................................................................... 101
6.4. ENVIRONMENTAL MANAGEMENT CELL ............................................................................................................. 102 6.5. BUDGETARY COST ESTIMATES FOR ENVIRONMENTAL MANAGEMENT .............................................................. 102
7. PROJECT BENEFITS ........................................................................................................................................ 104
8. CONCLUSION .................................................................................................................................................... 105
9. DISCLOSURE OF CONSULTANT .................................................................................................................. 106
9.1. INTRODUCTION .................................................................................................................................................. 106 9.2. CHOLAMANDALAM MS RISK SERVICES LIMITED – EIA CONSULTANT .............................................................. 106
9.2.1. Details of Experts/Consultants Engaged for this EIA Study ................................................................ 106 Other Technical Team Members ........................................................................................................................... 107

5
List of Tables
TABLE 2-1: PRODUCT MIX CHANGE PROGRAM PRODUCTION ACTIVITY ............................................ 11 TABLE 2-2: ENVIRONMENTAL SETTING OF THE SITE..................................................................... 11 TABLE 3-1: LAND USE PATTERN OF THE EXISTING FACILITY .......................................................... 19 TABLE 3-2: STACK EMISSIONS OF DG SETS ............................................................................... 20 TABLE 3-3: STACK EMISSIONS OF BOILER ................................................................................. 21 TABLE 3-4: RAW WASTEWATER QUALITY IN THE EXISTING FACILITY ............................................... 26 TABLE 3-5: TREATED SEWAGE CHARACTERISTICS ....................................................................... 26 TABLE 3-6: NOISE LEVELS WITHIN THE EXISTING FACILITY ........................................................... 26 TABLE 3-7: DETAILS OF SOLVENT STORAGE FACILITY .................................................................. 28 TABLE 4-1: SUMMARY OF THE NEW & EXISTING PRODUCT ............................................................ 41 TABLE 5-1:LAND USE/LAND COVER CLASSIFICATION SYSTEM ...................................................... 44 TABLE 5-2: LEVEL I LAND USE/LAND COVER STATISTICS OF 10 KM RADIUS OF THE STUDY AREA ....... 46 TABLE 5-3: LEVEL II LAND USE/ LAND COVER STATISTICS OF 5 AND 10 KM RADIUS ......................... 50 TABLE 5-4:STATUS OF URBAN AND RURAL DRINKING WATER SUPPLY IN KRISHNAGIRI DISTRICT .......... 56 TABLE 5-5:INDIAN METEOROLOGICAL DEPARTMENT – CLIMATOLOGICAL TABLES 1 ............................ 61 TABLE 5-6:INDIAN METEOROLOGICAL DEPARTMENT – CLIMATOLOGICAL TABLES 2 ............................ 61 TABLE 5-7: NOISE LEVELS WITHIN THE EXISTING FACILITY ........................................................... 69 TABLE 5-8:POPULATION DISTRIBUTION IN THE STUDY AREA ........................................................... 71 TABLE 5-9: WORKERS GROUP DISTRIBUTION IN THE STUDY AREA .................................................. 74 TABLE 5-10:LARGE SCALE INDUSTRIES IN KRISHNAGIRI DISTRICT .................................................. 76 TABLE 5-11:RURAL HOUSEHOLDS UNDER BELOW POVERTY LINE .................................................. 77 TABLE 5-12: PERCENTAGE AVAILED SAFE SANITATION FACILITIES IN THE STUDY AREA ...................... 78 TABLE 5-13: VILLAGE-WISE LITERACY RATE IN THE STUDY AREA.................................................... 80 TABLE 6-1: ADEQUACY OF STP ............................................................................................... 86 TABLE 6-2: ADEQUACY OF ETP-1 ............................................................................................ 89 TABLE 6-3: ADEQUACY OF ETP-2 ............................................................................................ 90 TABLE 6-1: RAINFALL DATA FOR BANGALORE REGION ................................................................. 97 TABLE 6-2: EXISTING ENVIRONMENTAL MONITORING SCHEDULE DURING OPERATION PHASE ............ 100 TABLE 6-3: STANDARD FOR ENVIRONMENTAL MONITORING PLAN ................................................. 101 TABLE 6-4: BUDGET FOR ENVIRONMENTAL MANAGEMENT PLAN .................................................. 103 TABLE 9-1: EXPERTS INVOLVED ............................................................................................ 107

6
List of Figures
FIGURE 2-1: LOCATION OF EXISTING FACILITY ............................................................................ 14 FIGURE 2-2: VICINITY MAP OF THE EXISTING FACILITY ................................................................. 15 FIGURE 2-3: TOP SHEET SHOWING STUDY AREA OF 10 KM FROM THE PROJECT SITE ......................... 16 FIGURE 2-4: VIEW OF EXISTING FACILITIES OF V.B MEDICARE PRIVATE LIMITED ............................. 17 FIGURE 3-1: FLOW DIAGRAM OF ETP-1 .................................................................................... 23 FIGURE 3-2: FLOW DIAGRAM OF ETP-2 .................................................................................... 24 FIGURE 3-3: FLOW DIAGRAM OF STP ....................................................................................... 25 FIGURE 3-4: SOLVENT STORAGE AREA ..................................................................................... 28 FIGURE 3-5: PHOTOGRAPHS OF EXISTING GREENBELT AREA......................................................... 29 FIGURE 3-6: FIRE FIGHTING SYSTEM ........................................................................................ 31 FIGURE 4-1: DL-LYSINE ACETYL SALICYLATE- TYPICAL MATERIAL BALANCE .................................... 34 FIGURE 4-2: 7-METHYL XANTHINE- TYPICAL MATERIAL BALANCE .................................................. 37 FIGURE 4-3: BENTONITE TYPICAL MATERIAL BALANCE ................................................................. 39 FIGURE 5-1: SATELLITE IMAGE OF THE STUDY AREA ................................................................... 48 FIGURE 5-2: LAND USE CLASSIFICATIONS (LEVEL I) OF THE STUDY AREA ........................................ 49 FIGURE 5-3:LAND USE CLASSIFICATION (LEVEL II) OF THE STUDY AREA ......................................... 51 FIGURE 5-4:GEOLOGY MAP OF KRISHNAGIRI DISTRICT ................................................................ 53 FIGURE 5-5:SOIL MAP OF KRISHNAGIRI DISTRICT ....................................................................... 54 FIGURE 5-6:HYDROGEOLOGY MAP OF KRISHNAGIRI DISTRICT ....................................................... 57 FIGURE 5-7: MIXING HEIGHT VARIATION GRAPH ......................................................................... 60 FIGURE 5-8:WIND ROSE DIAGRAM (STUDY PERIOD: NOVEMBER 2013 TO JANUARY 2014) ................ 64 FIGURE 5-9: PM10 TREND OBSERVED DURING APRIL 2012 TO OCTOBER 2012 ................................ 65 FIGURE 5-10: PM2.5 TREND OBSERVED DURING APRIL 2012 TO OCTOBER 2012 ............................. 66 FIGURE 5-11: SO2 TREND OBSERVED DURING APRIL 2012 TO OCTOBER 2012 ............................... 66 FIGURE 5-12: NO2 TREND OBSERVED DURING APRIL 2012 TO OCTOBER 2012 ............................... 67 FIGURE 5-13: CO TREND OBSERVED DURING APRIL 2012 TO OCTOBER 2012 ................................ 67 FIGURE 5-14: BENZENE TREND OBSERVED DURING APRIL 2012 TO OCTOBER 2012 ........................ 68 FIGURE 5-15: BENZENE (A) PYRENE TREND OBSERVED DURING APRIL 2012 TO OCTOBER 2012 ........ 68 FIGURE 5-16: AMMONIA TREND OBSERVED DURING APRIL 2012 TO OCTOBER 2012 ........................ 69 FIGURE 5-17:LITERACY PATTERN IN THE STUDY AREA .................................................................. 80 FIGURE 6-1: LAYOUT SHOWING EFFLUENT GENERATION AND TREATMENT SCHEME AFTER THE PROPOSED
PRODUCT MIX CHANGE PROGRAM ..................................................................................... 88 FIGURE 9-1: NABET CERTIFICATE ........................................................................................ 108

1. Executive summary
M/s V.B Medicare is an existing unit carrying out formulation and food
ingredient manufacturing unit setup in Phase 2, SIPCOT Industrial Area, near
Hosur town in Krishnagiri district, Tamil Nadu. It mainly manufactures bulk
ingredient for the neutraceutical’s and food market. The unit was acquired
from M/s Bio-plus Life Sciences (P) Limited by VBM in year 2006. The
existing facility is spread over the area of 6 Ha (60000 sq. m) comprising of
plant facility of built up area 10876m2.
The existing facility is permitted to produce Glucosamine Hydrochloride of
240 TPA & Trichloro Galacto Pyranosyl Fructo furanoside (TGPF) of 72 TPA
vide Environmental Clearance letter No. J-11011/65/2013-IAII(I) dated 16th
May 2015, MoEF.
Despite EC obtained for production of Docosahexaenoic Acid (DHA) &
Tocopheryl polyethylene glycol Succinate (TPGS), the unit has not initiated
any activity for manufacturing these products due to market condition.
The unit has proposed to reduce the production quantity of Trichloro Galacto
Pyranosyl Fructo Furanoside (TGPF) from 72 TPA to 61 TPA and Tocopheryl
Polyethylene Glycol Succinate (TPGS) quantity from 72 TPA & 60 TPA.
Further unit has proposed to add three new products i.e DL-Lysine acetyl
salicylate (6 TPA), 7-Methyl Xanthine (5 TPA) and Bentonite (12 TPA) by
maintaining the same production capacity of 564 TPA which was consented
as per earlier EC vide letter no. J-11011/65/2013, dated 16th May 2015.
However, the water consumption, wastewater generation, and Hazardous
waste generation will not be increased from the earlier EC dated 2015. The
proposed product activity is presented in Table 1.

EMP for the Proposed Product Mix Change Program at VB Medicare Pvt. Ltd, Hosur.
Page 8
Table 1: Product Mix Change Program Production Activity
Product Name
EC 2008 Scenario
Production (MTPA)
EC 2015 Scenario
Production (MTPA)
Present proposal
2016 Scenario Capacity (MTPA)
Total Production After
Implementation of proposed product
mix change (MTPA)
Trichloro Galacto Pyranosyl Fructo Furanoside (TGPF)
72 72 --- 61
Glucosamine Hydrochloride (GHC) 240 240 --- 240
Docosahexaenoic acid (DHA) --- 180 --- 180
Tocopheryl (polyethylene glycol Succinate(TPGS)
--- 72 --- 60
DL-Lysine acetyl salicylate --- --- 6 6
7-methyl Xanthine --- --- 5 5 Bentonite --- --- 12 12
Total 312 564 23 564
1.2 Details of Utilities Required for Proposed product mix change program
1.2.1 Land Requirement
The Proposed new products will be manufactured within the existing project
site. Hence no additional land will be required.
The Column presents the depicts there is no change in production

1.2.2 Water Requirement Water required for manufacturing of the three new products proposed, will be
met from existing permitted quantity of 443m3/day as mentioned in the
SIPCOT Vide Letter no. 16606 dated 10th March 2008. Hence no additional
water required for the proposed products.
1.2.3 Power Requirement V.B Medicare has power supply agreement with Tamil Nadu Generation and
Distribution Corporation Ltd (TANGEDCO) to supply 1600 KVA. In order to
meet power requirements due to grid supply shut down, one 500 KVA DG set
and one 1500 KVA DG sets are in place at the existing facility. No additional
Power required for manufacturing of the three new products. It is to be noted
that the unit has not initiated the production of two products which was
permitted as per earlier Environmental Clearance obtained.
1.2.4 Cost of the Project & Schedule The proposed three products will be manufactured within the existing facility
and existing reactors and there will be no new reactors/ heavy equipments
will be installed. Hence there is no project cost (CAPEX) is envisaged/
involved. However there will be operational cost (OPEX) involved for raw
materials and solvents.

EMP for the Proposed Product Mix Change Program at VB Medicare Pvt. Ltd, Hosur.
Page 10
2. Introduction
2.1. Overview
M/s. V B Medicare Private Limited (VBM) is operating its formulation unit and
food ingredients manufacturing unit in Phase 2, SIPCOT Industrial Area, near
Hosur town in Krishnagiri district, Tamil Nadu. It manufactures bulk
ingredients for the neutraceutical and food markets. The unit was acquired
from M/s. Bio-plus Life Sciences (P) Limited by VBM in year 2006.
The existing facility is developed in an area of 6 Hectares. Location of the
existing facility in the State of Tamil Nadu is shown in Figure 2.1 and vicinity
of the industrial area showing the location of the facility is shown in Figure
2.2. The study area is covered in the Survey of India Top sheet No. 57 H/10
and 57 H/14. The map of Study area – covering 10 km from the project site is
shown in Figure 2.3. The details of environmental setting of the site are given
in Table 2.2. The photographs showing the existing plant are depicted in
Figure 2.4.
Further the unit has proposed to reduce the production of Trichloro Galacto
Pyranosyl Fructo Furanoside (TGPF) and Tocopheryl (polyethylene glycol
Succinate (TPGS) and proposed to add three new products namely i.e DL-
Lysine Acetyl Salicylate (6 TPA), 7-Methyl Xanthine (5 TPA) and Bentonite (12
TPA). However, there will be no change in the consumption of water, steam
and other utilities. The wastewater and hazardous waste generation will not
be increased and will be maintained as per the earlier 2015 EC scenario. The
proposed product mix change activity is presented in Table 2.1.

EMP for the Proposed Product Mix Change Program at VB Medicare Pvt. Ltd, Hosur.
Page 11
Table 2-1: Product Mix Change Program Production Activity
Product Name
EC 2008 Scenario
Production (MTPA)
EC 2015 Scenario
Production (MTPA)
Present proposal
2016 Scenario Capacity (MTPA)
Total Production After
Implementation of proposed product
mix change (MTPA)
Trichloro Galacto Pyranosyl Fructo Furanoside (TGPF)
72 72 --- 61
Glucosamine Hydrochloride (GHC) 240 240 --- 240
Docosahexaenoic acid (DHA) --- 180 --- 180
Tocopheryl (polyethylene glycol Succinate(TPGS)
--- 72 --- 60
DL-Lysine acetyl salicylate --- --- 6 6
7-methyl Xanthine --- --- 5 5 Bentonite --- --- 12 12
Total 312 564 23 564
Table 2-2: Environmental Setting of the Site
S. No. Particulars Details
1. Project Location Mornapalli village, Hosur Tehsil, Krishnagiri District, Tamil Nadu State
2. Latitude/Longitude From 12º43’29.3” N 77º52’5.62” E to 12º43’16.69” N 77º52’12.72” E
3. Location covered in Toposheet
Toposheet No. 57 H/10 and 57 H/14
4. Climatic Conditions Based on IMD – Bangalore (A) (Annual): Mean Maximum Temperature : 29.4 oC Mean Minimum Temperature : 18.2 oC Maximum Relative Humidity : 82 % Minimum Relative Humidity : 53 % Mean Wind Speed : 9.2 km/hr Predominant wind Direction : E, NE, SE Rainfall : 880.9 mm/year
5. Site elevation above mean sea level
846 m
The Column presents the depicts there is no change in production

EMP for the Proposed Product Mix Change Program at VB Medicare Pvt. Ltd, Hosur.
Page 12
S. No. Particulars Details
6. Land use at the proposed project site
Industrial use zone ( As per Planning Authority)
7. Site topography Plain 8. Nearest roadway NH-7, 0.25 km, Southern side 9. Nearest Railway
Station Hosur R.S, 5.5 km, Western side
10. Nearest Airport Bengaluru International Airport, 55 km, North Western side
11. Nearest village/major town
Nearest Village: Mornapalli, 0.5 km, North West direction Major Towns: Hosur, 4 km North West direction
12. Hills/valleys None within 10 km radius 13. Ecologically
sensitive zone No national parks or wild life sanctuaries within the study area of 10 km.
14. Nearest Reserved/Protected forests
• Sanamavu Reserved Forest – 2.75 km, SE • Reserved Forest near Ramasandiram village –
5 km, NE • Reserved Forest near Ungatti Village – 7.5
km, NE 15. Historical/tourist
places None within 10 km radius of the project site.
16. Nearest Industries List Industries within 10 km Study area:
S.No. Name of Industry Direction Distance,
km 1. Ashok
Leyland Phase II
E 0.7
2. TVS Motor Company Ltd.
W 8.7
3. Gabriel India
N Adjacent
4. South India Tiles Factory
SW 2.7
5. India Pistons
NW Adjacent
6. PM Granites N 0.7 7. Maruthi
Sundew NE 3.3
8. Bi metal Bearing
SE 2.3

EMP for the Proposed Product Mix Change Program at VB Medicare Pvt. Ltd, Hosur.
Page 13
S. No. Particulars Details
Company 9. Venkraft
Paper Mill SE 6
10. Hostia Industrial Estate
S 6.5
11. Avtec SW 9 12. Hosur IT
Park SEZ NW 3.9
13. Ashok Leyland Factory Phase I
NW 9.8
14. SIPCOT Phase I
NW 8.6
15. SIDCO Industrial Estate
NW 9.5
17. Critically Polluted area as per MoEF notification
None within the study area of 10 km
18. Nearest water bodies/ Reservoirs
Ponnaiyar River, 3 km South East direction
19. Seismic zone Zone II as per IS1893 (Part1) : 2002

EMP for the Proposed Product Mix Change Program at VB Medicare Pvt. Ltd, Hosur.
Page 14
Figure 2-1: Location of Existing Facility
Project Site

EMP for the Proposed Product Mix Change Program at VB Medicare Pvt. Ltd, Hosur.
Page 15
Figure 2-2: Vicinity Map of the Existing Facility
Project site coordinates are as follows:
A 12º43’29.3” N 77º52’5.62” E B 12º43’26.82” N 77º52’11.18” E C 12º43’24.71” N 77º52’10.1” E D 12º43’22.04” N 77º52’15.35” E E 12º43’16.69” N 77º52’12.72” E F 12º43’20.42” N 77º52’5.19” E G 12º43’25.05” N 77º52’7.78” E H 12º43’27.08” N 77º52’4.38” E
A
B
C
D
E
F
G
H

EMP for the Proposed Product Mix Change Program at VB Medicare Pvt. Ltd, Hosur, Tamil Nadu
Page 16
Figure 2-3: Top sheet showing Study Area of 10 km from the Project Site

EMP for the Proposed Product Mix Change Program at VB Medicare Pvt. Ltd, Hosur, Tamil Nadu
Page 17
Figure 2-4: View of Existing Facilities of V.B Medicare Private Limited
Photograph showing main entrance facility Photograph showing Main Production Block
2.2. Overview of the existing EC and Operations
The existing facility was accorded Environmental Clearance (F.No. J-
11011/65/2013-IA II (I) Dated 16 May, 2015) for manufacturing 180MTPA of
Docosahexaenoic Acid (DHA) and 72MTPA of Tocopheryl Polyethylene Glycol
Succinate (TPGS). The copy of the Environmental Clearance is enclosed as
Annexure-I.

EMP for the Proposed Product Mix Change Program at VB Medicare Pvt. Ltd, Hosur, Tamil Nadu
Page 18
3. DETAILS OF THE EXISTING FACILITY AND ENVIRONMENTAL COMPLIANCE
This section presents an overview of the existing facilities of V B Medicare
Private Limited, Hosur its environmental compliance aspects and
Environmental Management Program implemented in the existing facility. The
existing plant is located in SIPCOT Phase II, Hosur. The plant is located at an
aerial distance of 0.25 km from NH 7 which connects Bangalore and
Krishnagiri. Its registered office is situated at Sathvahana Nagar, Kukatpally,
Hyderabad – 500 072.
The plant has been consented to produce 240 MTPA Glucosamine
Hydrochloride (GHC), 72 MTPA Trichlora Galacto Pyranosyl Furanoside
(TGPF), 180MTPA of Docosahexaenoic Acid (DHA) and 72MTPA of Tocopheryl
Polyethylene Glycol Succinate (TPGS) vide letter no. J-11011/65/2013-IA II(I),
dated 16th May 2015 by MoEF. Air and water consents renewed valid upto
31.03.2017 by Tamil Nadu Pollution Control Board. Copy of compliance with
EC and consent to operate are presented in Annexure-II.
3.1. Facility Layout and Land use Break-up
The existing VBM facility is spread over an area of 6 Ha (60000 sq. m) out of
which 31,000 m2 (52% of total land) of land was developed under plantation
and green belt. The existing facility consists of three numbers of production
blocks and other supporting facilities to cater to the production needs of the
plant. The typical land use break-up of the existing plant is given in Table
3.1.

EMP for the Proposed Product Mix Change Program at VB Medicare Pvt. Ltd, Hosur, Tamil Nadu
Page 19
Table 3-1: Land use Pattern of the Existing Facility
S. No. Particulars Area (sq. m) 1 Built up area 10876
2 Solid waste storage/Disposal area 126
3 Green belt/ Irrigation area 31000
4 Vacant land 18000 Total 60000
3.2. Major Facilities Located
Details of existing supporting utilities are as follows:
• 1 x 500 KVA and 1 x 1500 KVA standby DG sets
• 10 T/hr Coal Fired Boiler
• Effluent Treatment Plant with tertiary treatment facility along with
three stage Multi Effect Evaporator
• Sewage Treatment Plant
• 2 x 100 CFM reciprocating Compressors
• Covered hazardous waste storage area
• Solvent Storage Area
• Fire Hydrant Systems
3.2.1. Diesel Generator Sets
Two DG sets; 1 x 500 KVA and 1 x 1500 KVA are installed at the facility to
meet the electrical energy requirements during power shut down from the grid
supply. Hence, emissions from the DG set are not envisaged on a continuous
basis. DG sets are operated for around 8 to 10 hours a day. The records
indicate that around 2 to 2.5 units of electricity are generated per liter of
diesel consumed. The DG sets are installed and operated as per CPCB
guidelines. Adequately designed acoustic enclosures are placed for the DG set
as per the CPCB guidelines. The stack height and the emissions are within

EMP for the Proposed Product Mix Change Program at VB Medicare Pvt. Ltd, Hosur, Tamil Nadu
Page 20
permissible limits as per TNPCB norms. The details of stack height and
emissions are presented in Table 3.2. Details enclosed in Annexure-III.
Table 3-2: Stack Emissions of DG sets
Particulars DG set Stack details Stack Height 15 m Stack Temperature 244 ºC Velocity 27.88 m/s Discharge Rate 5567.13 Nm3/hr SPM 48.53 mg/Nm3 SO2 5.33 mg/Nm3 NOx 27.31 mg/Nm3
Source: Test report from TNPCB, Report No.42/AAQS/SM/2012-13
3.2.2. Boiler
10 T/hr capacity coal fired boiler is available at the facility to meet the steam
requirements. Steam requirement for the existing operations is 82 t/day and
coal consumption is 12.5 t/day. As the facility is not producing Trichloro
Galacto Pyranosyl Fructo Furanoside, hence, the steam consumption in the
facility is reduced. Presently boiler is being operated at 2 t/hr at 150ºC and 7
kg/cm2 pressure. Purified water from Reverse Osmosis (RO) plant is being fed
to the boiler with TDS around 60 to 80 mg/l and hardness around 0 to 5
mg/l. The stack of 30 m height is being attached to economizer, cyclone and
bag filter before discharging into the atmosphere. The emission details are presented
in Table 3.3.

EMP for the Proposed Product Mix Change Program at VB Medicare Pvt. Ltd, Hosur, Tamil Nadu
Page 21
Table 3-3: Stack Emissions of Boiler
Particulars Boiler Stack Stack Height 30 m Stack Temperature 99 ºC Velocity 19.66 m/s Discharge Rate 53911.89 Nm3/hr SPM 70.47 mg/Nm3 SO2 5.33 mg/Nm3 NOx 27.31 mg/Nm3
Source: Test report from TNPCB, Report No.42/AAQS/SM/2012-13
3.2.3. Process Emissions
The only point source emission in the existing facility is from GHC plant
which releases HCl fumes. The HCl fumes are treated in wet scrubber before
discharging to the atmosphere. Hence, the impact due to release of emissions
is negligible.
3.2.4. Water Requirement and Wastewater Treatment
The required water for the existing facility is supplied by the SIPCOT
authorities. The facility is consented to draw 443 m3/day of water as per the
Environmental clearance issued by MoEF.
At present the water consumption in the existing facility is 299.2m3/day and
after proposed product mix change program the water consumption will be to
the tune of 299.5 approximately 300m3/day which is very marginal increase.
Process effluent is treated in ETP and sewage generated from the plant is
treated in Sewage Treatment Plant located within the main plant. By
implementing the above scheme, the existing facility is able to achieve zero
liquid discharge operations. The details of ETP and STP are described in
subsequent sections.

EMP for the Proposed Product Mix Change Program at VB Medicare Pvt. Ltd, Hosur, Tamil Nadu
Page 22
3.2.5. Effluent Treatment Plant
There are two ETP’s at the existing facility. ETP-1 treats the low TDS effluent
and ETP-2 treats the high TDS effluent. At present the waste water generation
is to the tune of 125m3/day and there will be no increase after the proposed
product mix change program. So, the existing ETP is adequate to treat the
wastewater after proposed product mix change, further the treated
wastewater will be complied with the prescribed CPCB standards.
3.2.5.1. Effluent Treatment Plant -1
70 m3/day capacity ETP is in operation at the existing facility. It is used for
treatment of lean effluent (TDS<8000 mg/l) generated from the
manufacturing process. Currently about 20 m3/day of effluent is being
generated which is treated in the existing ETP having primary, secondary and
tertiary treatment facilities. Primary sludge is dried in sludge drying bed and
disposed to common hazardous waste treatment, storage and disposal (TSDF)
facility. Treated effluent is used for toilet flushing and gardening. Rejects from
reverse osmosis plant is treated in multi-effect evaporator. The flow diagram
of existing ETP is presented in Figure 3.1.

EMP for the Proposed Product Mix Change Program at VB Medicare Pvt. Ltd, Hosur, Tamil Nadu
Page 23
Figure 3-1: Flow Diagram of ETP-1
Design: 47.6m3/day
All the dimensions are in meters
Oil & Grease Trap 3×2.3×2.05
Collection tank 3.05×2.20×2.30
Reaction tank 5×4.4×2
Primary Settling tank 5.8×3.9×3.5
Anaerobic tank 6×3.9×3.5
Aeration tank 1 6×5.9×3.5
Aeration tank 2 6×1.9×3.9
Treated Effluent tank 3.7×3.7×2
Pressure Sand Filter
Activated Carbon Filter Reverse Osmosis 3000 l/h
RO Permeate tank 4×3.7×1.8
RO Reject tank 3.7×2.3×2.0
Sludge
Sludge
Clarifier 2.3×2.05
Sludge drying beds 6×4×0.9
Sludge drying beds 6×4×0.9
To High TDS Stream Design: 22.4m3/day Current scenario: 8m3/day
RO Reject
Design: 70 m3/day

EMP for the Proposed Product Mix Change Program at VB Medicare Pvt. Ltd, Hosur, Tamil Nadu
Page 24
3.2.5.2. Effluent Treatment Plant-2 An ETP 2 is installed at the existing facility to treat effluents with high TDS (>8000 mg/l). A three stage Multi Effect Evaporator
(MEE) is installed at the facility for treatment of RO rejects which is further dried in Agitated Thin Film Dryer (ATFD). The dried salts
are stored at hazardous waste storage area and disposed to hazardous waste treatment facility. The flow sheet of ETP-2 is presented
in Figure 3.2.
Figure 3-2: Flow Diagram of ETP-2
All the dimensions are in meters
5-6 Kl/hr (Flowrate)
Design: 140 m3/day Currentscenario: 55 m3/day
After expansion:
High TDS Effluent Collection tank
10×4×2.25
High TDS Effluent Settling tank
10×8×1.2
Filter press Sludge pump collection sump
1.6×1.9×1.35
Multiple Effect Evaporator 7.0 Kl/hr
Solid Waste Cooling Tower
Sludge
Sludge
Condensate
Concentrate
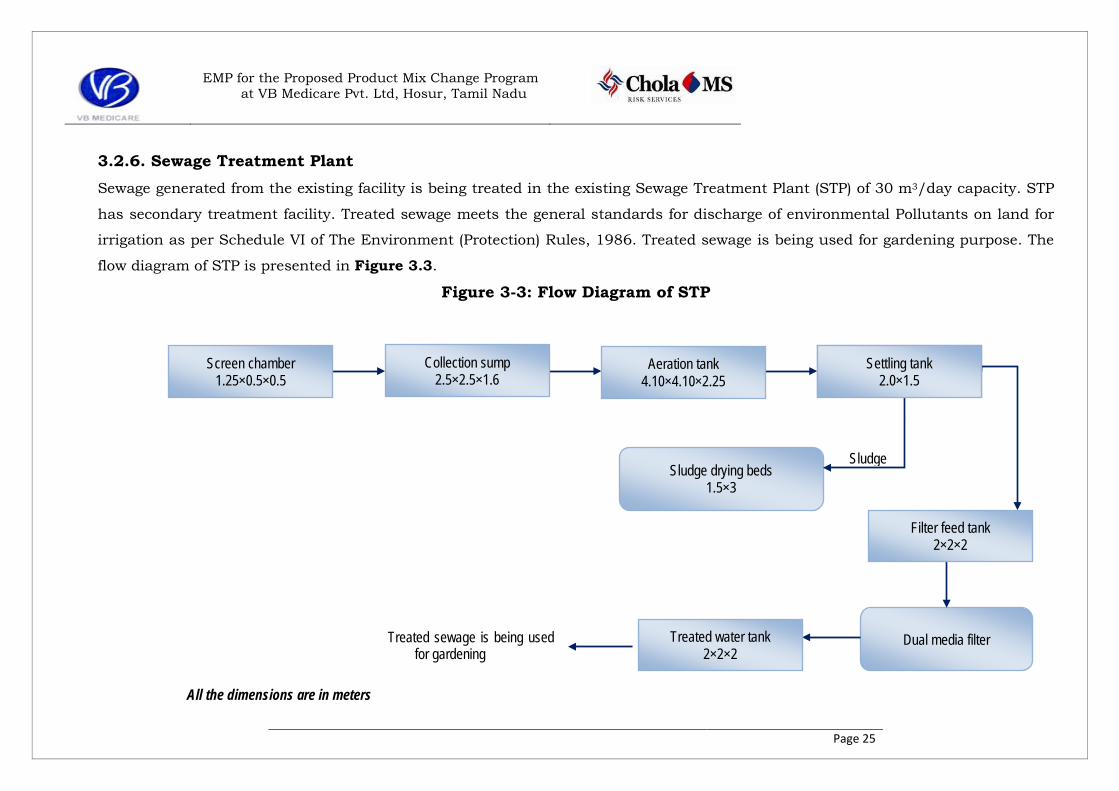
EMP for the Proposed Product Mix Change Program at VB Medicare Pvt. Ltd, Hosur, Tamil Nadu
Page 25
3.2.6. Sewage Treatment Plant Sewage generated from the existing facility is being treated in the existing Sewage Treatment Plant (STP) of 30 m3/day capacity. STP
has secondary treatment facility. Treated sewage meets the general standards for discharge of environmental Pollutants on land for
irrigation as per Schedule VI of The Environment (Protection) Rules, 1986. Treated sewage is being used for gardening purpose. The
flow diagram of STP is presented in Figure 3.3.
Figure 3-3: Flow Diagram of STP
Sludge drying beds 1.5×3
Dual media filter
Screen chamber 1.25×0.5×0.5
Collection sump 2.5×2.5×1.6
Aeration tank 4.10×4.10×2.25
Settling tank 2.0×1.5
Filter feed tank 2×2×2
Treated water tank 2×2×2
Treated sewage is being used for gardening
Sludge
All the dimensions are in meters

EMP for the Proposed Product Mix Change Program at VB Medicare Pvt. Ltd, Hosur, Tamil Nadu
Page 26
Raw effluent and sewage characteristics are presented in Table 3.4.
Table 3-4: Raw Wastewater Quality in the Existing Facility
S.No. Parameters Raw waste
water quality
Treated waste water
quality
TNPCB Discharge Standard
1 pH, mg/l 2.31 7.1 6.5- 2 TDS, mg/l 3562 1020 <2100 3 COD, mg/l 202 156 <250 4 BOD, mg/l 26 14 <100 Note: Rejects from RO and high TDS effluent is sent to MEE
Treated effluent is reused for toilet flushing and gardening. Treated sewage is
used for gardening applications (Table 3.5).
Table 3-5: Treated Sewage Characteristics
S.No. Parameters Test Result
Consented Levels
1 pH 8.03 <10 2 BOD (mg/l) 12 <100 3 TSS (mg/l) 20 <200 Source: Plant Records
3.2.7. Noise Levels in the Existing Facility
Noise levels were also monitored by TNPCB at the facility. The test results
indicate that the noise levels were found to vary from 58.4 dB(A) to 63.3
dB(A). This indicates that he noise levels at the plant boundary were found to
be below the stipulated noise level of 75 dB (A). The results of noise level
monitoring within the facility is presented in Table 3.6.
Table 3-6: Noise Levels within the Existing Facility
S.No. Location Sound Level Leg dB(A)
1 Behind Waste Storage Shed 53.3
2 Near Water Sump 56.4 3 Near Main Gate 56.6 4 Near Gate No. 2 53.8 5 Near Fence 53.5 6 Near Old Admin Building 54.5

EMP for the Proposed Product Mix Change Program at VB Medicare Pvt. Ltd, Hosur, Tamil Nadu
Page 27
S.No. Location Sound Level Leg dB(A)
7 Behind Spent Acid Tank 53 8 Near Scrap Yard 54.1
Leg value is the average energy for the measured period, Source: TNPCB Test
Report dated on 11.01.16
3.2.8. Solid Waste and Hazardous Waste
The facility is consented to generate 42 TPA of chemical sludge and 884 TPA
of Mechanical Evaporator residue located in the zero liquid discharge facility.
At present the hazardous waste generated is 704.6 TPA which less than the
consented quantity. As the production capacities will be reduced after
proposed product mix change program the hazardous waste quantity
generated per year will not get increased. The hazardous waste is being
disposed with Tamil Nadu Waste Management Association (TWMA),
Gummudipoondi, Tamil Nadu.
3.2.9. Compressors
2 x 100 CFM reciprocating compressors are installed at the existing facility.
One compressor is used as standby. Since it is high noise generating
equipment, persons working at the compressor unit are provided with ear
muffs/ ear plugs.
3.2.10. Solvent Storage
Dedicated and isolated solvent storage area properly designed and is located
in the existing facility. Necessary permits from Petroleum and Explosives
Safety Organization (PESO) has been obtained for storage of solvents at the
site with vide letter no. P/HQ/TN/15/4502(P13926), dated 4th March 2010.
Details of the storage tanks are presented in Table 3.7. All solvent storage
tanks are above ground and horizontal type tanks provided with adequately
designed dyke sizes. Fire hydrant lines and foam systems are made available
at all the four corners of the storage area. Water sprinklers are installed as

EMP for the Proposed Product Mix Change Program at VB Medicare Pvt. Ltd, Hosur, Tamil Nadu
Page 28
per the good engineering practices for all the storage tanks. Photograph of
solvent storage area is presented in Figure 3.4.
Table 3-7: Details of Solvent Storage Facility
Solvent/Fuel Nos Onsite Storage Capacity (KL)
Methanol main tank 1 18 Methanol day tank 1 18 Cyclohexane 1 18 Ethyl Acetate 1 18 Toluene 1 18 IsoPropyl Alcohol (IPA) 1 18 Diesel 1 18
Figure 3-4: Solvent Storage Area
3.3. Electrical Power Consumption and Source
VBM has power supply agreement with Tamil Nadu Generation and
Distribution Corporation Ltd (TANGEDCO) to supply 1600 KVA. In order to
meet power requirements due to grid supply shut down, one 500 KVA DG set
and one 750 KVA DG sets are in place at the existing facility. No additional

EMP for the Proposed Product Mix Change Program at VB Medicare Pvt. Ltd, Hosur, Tamil Nadu
Page 29
power required for the proposed product mix change program which was
permitted by earlier Environmental Clearance obtained vide letter F.No. J-
11011/65/2013-IAII(I) dated 16th May 2015, MoEF
3.4. Greenbelt and Plantation Area
Green belt in an area of 31000 m2 which is around 53% of the total plot area
is developed and maintained. Mainly native species are planted. Photographs
of greenbelt are presented in Figure 3.5.
Figure 3-5: Photographs of Existing Greenbelt Area

EMP for the Proposed Product Mix Change Program at VB Medicare Pvt. Ltd, Hosur, Tamil Nadu
Page 30
3.5. Occupational Health
A functional occupation Health Center (OHC) is available at the facility
comprising of a bed, stretcher, and wheel chair along with first aid kit.
Around 30 trained first aid professionals are available. In case of any
emergency, doctor from nearby industrial hospital and also private clinics will
be made available.
3.6. Fire fighting Systems and Safety Measures Adopted
Adequately designed fire water pumps and fire hydrant systems are designed
and installed as per the National Building Codes. An underground fire water
tank of capacity 300m3 is located near the fire water pump room.171m3/hr
capacity electrical fire water pump, 171m3/hr capacity diesel operated pump
and 10.8m3/hr capacity jockey pump are installed at the site. A central fire
hydrant system is in place in the existing facility. Fire fighting system in the
existing operation is given below in Figure 3.6
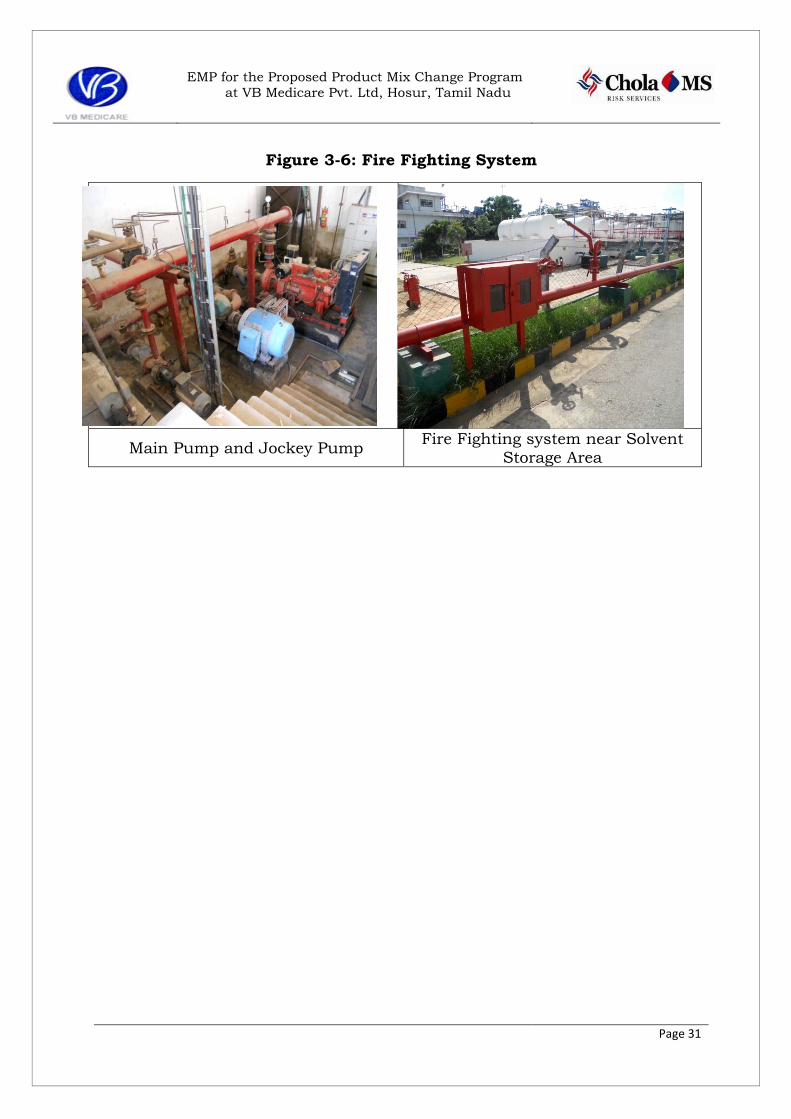
EMP for the Proposed Product Mix Change Program at VB Medicare Pvt. Ltd, Hosur, Tamil Nadu
Page 31
Figure 3-6: Fire Fighting System
Main Pump and Jockey Pump Fire Fighting system near Solvent Storage Area

EMP for the Proposed Product Mix Change Program at VB Medicare Pvt. Ltd, Hosur, Tamil Nadu
Page 32
4. DETAILS OF THE PROPOSED PRODUCTS
It is proposed to manufacture three new additional products namely DL-
Lysine Acetyl Salicylate, Bentonite and 7-Methyl Xanthine. The proposed
product mix change program will take place in the existing premises/reactors
and no additional land, water steam and power are required. Also, all existing
infrastructure and utilities are adequate to meet the present proposal.
4.1 Process description of the Proposed Product
4.1.1. Manufacture of DL-Lysine Acetyl Salicylate- Process Description
The manufacture of DL-Lysine Acetyl Salicylate involves the following 4
stages.
STAGE-I (Dissolution) Water is first charged into reactor. Then Glycine is charged. Stirred to
dissolve. Then DL-Lysine will be added and stirred. Heat to 400C and
maintain for one hour to dissolve DL-Lysine. Further on dissolution activated
charcoal is added and temperature is maintained for 1.5 hr
STAGE-II (Charcolization) Further on dissolution activated charcoal of 7.2 Kg is added and temperature
is maintained for 1.5 hr. Filtered through hyflo bed followed by 1 micron
filter, then water wash is given. Filtered through hyflo bed followed by 1
micron filter, then water wash is given. pH of 5-6 is maintained for solid
disposal.

EMP for the Proposed Product Mix Change Program at VB Medicare Pvt. Ltd, Hosur, Tamil Nadu
Page 33
STAGE-III (Crystallization) In this stage 234 L of Isopropyl alcohol (IPA) is charged followed by 117.0 Kg
of Asprin. Mass is stirred to form a suspension. The above prepared DL-
Lysine solution is added slowly. The reaction mass is stirred at room
temperature. Then 1650 L of isopropyl alchohol is added and then the
crystallization starts.
STAGE-IV (Filtration) The reaction mass is stirred and external cooling is given to attain 0-50C. The
reaction mass temperature is maintained for temperature of 0-50C overnight.
The separate solid is taken back into the reactor; to this 360 L of pre-chilled
(0-50C) isopropyl alcohol is added and stirred. Then filtered, and dried at 30-
35 0C under vacuum. The solids, final product is unloaded, sieved and
packed. Then the sample is submitted for complete analysis. The mass
balance along with block diagram is presented in Figure 4.1

EMP for the Proposed Product Mix Change Program at VB Medicare Pvt. Ltd, Hosur, Tamil Nadu
Page 34
Figure 4-1: DL-Lysine Acetyl Salicylate- Typical Material Balance
Water (360L)Glycine (4.5kg) Dissolution
DL-Lysine (90 kg)
Heat to 40-45 degC, 60 min
CharcolizationActivatedCharcoal (7.2 kg)
Crystallization
Spent Hyflo + Charcoal(12.5 Kg), pH 5 to 6For Solid disposal
IPA (1884L)Aspirin (117 kg)
Cool to 0 - 5 deg C
Filtration
Wet wt. of Solids 206 kg
Filtration
IPA (360L)
Drying / Milling / Sieving
Product for packing138-144 kg
Wet wt of final product ~180kg
Filtrate (2255 L) for IPA recovery and reuse
Solid Residue (~65 + 5 kg)pH 5 to 7 for disposal
Filtrate (387 L) for IPA recovery and reuse

EMP for the Proposed Product Mix Change Program at VB Medicare Pvt. Ltd, Hosur, Tamil Nadu
Page 35
4.1.2. Manufacturing Process of 7-methyl Xanthine
Stage I: Partial DeMethylation
Charge POCl3 and Theobromine into the reactor. The speed of the stirrer was
adjusted to 38-45 RPM. The temperature was raised to 103-110ºC and
maintained for 24 hrs. After completion of 24 hrs, heating was stopped and
the reaction mass was allowed to cool to room temperature 25-30 ºC .
Stage II: Chlorination to get 2,6 –Dichloro 7-Methyl Xanthine
To the above reaction mass add PCl5 and again heated to 104-110ºC for 48
hr. Further POCl3 was distilled under atmospheric pressure. At the end of the
POCl3 distillation (70-75 % POCl3 distilled of initial volume). Filter the mass
and wash with cyclohexane. The solid residue was washed with water and
filtered. Weigh the solid wet quantity.
Stage III: Hydrolysis of 2,6 –Dichloro 7-methyl xanthine
The solid was transfer to glass line reactor and water is charged. Later
hydrochloric acid was added. Mass temperature raised to 70-75 ºC. After
complete dissolution of the solid, pH of the reaction mixture was adjusted to
0.3 to 0.4 and heating continued up to 95 °C and maintained at the same
temperature for 48 hrs. The reaction mass was cooled to room temperature
and it is neutralized with 30% aqueous NaOH solution to pH 7-7.5.The
neutralized (semi solid) reaction mass obtained was cooled to 10-15 ºC and
filtered with filtered. The residue was washed with 10-20 ºC,chilled water.
Weigh the crude product.

EMP for the Proposed Product Mix Change Program at VB Medicare Pvt. Ltd, Hosur, Tamil Nadu
Page 36
Stage IV: Purification of 7-Methylxanthine
Take crude 7-Methyl Xanthine and add required water and caustic solution
and heat the reaction mass to 80 ºC for 2hr and check the dissolution. Mass
should be clear solution. If not, continue heating for another 1 hr. Cool the
reaction mass to 0-5 ºC for 72 hr and filter the mass. Wash the cake with
chilled water. Take again the crude in reactor. Charge water and ethanol with
respect to crude. Heat the reaction mass to 70 deg C for two hrs. Cool the
reaction mass to 0-5 deg C for 24 hrs. Filter the mass, wash twice with chilled
water.dry the product. Weigh and record the weight.

EMP for the Proposed Product Mix Change Program at VB Medicare Pvt. Ltd, Hosur, Tamil Nadu
Page 37
Figure 4-2: 7-Methyl Xanthine- Typical Material Balance
ReactionPOCl3(6520kg)
PCl5 (880kg)
Distillation Recovered POCl3 (4896 kg)
Residue / FiltrationCyclohexane (1320 kg) Traces POCl3 and Cyclohexane (1400kg)
RO water (800kg) Aqueous layer (880 kg)
HydrolysisConc. HCl (300kg) pH - NMT 0.5
Cool and Neutralize
95 degC, reaction time 48 hrNaOH solution(532 kg)
Solid wet cake
Filtrate (3200kg)
Water (4000 L)NaOH flakes (190 kg)
Heat to 80-85 degC for 2 hrs
Cool to 0-5 degC for 24hr & filter
Filtration
Solid wet cake ~ 380 kg
Theobromine :400 kg
Cool to 0-5 deg. C
Solid wet cake ~ 470 kgWater (2000L)Retarder (280 L)
Cool to 0 - 5degC for 24hr
HCl (12L)Heat to 70-75 degC for 2hr
Filtrate (2315kg)Solid wet wt. ~ 400 kg
Dry Product for milling 104 kg
Drying at 70-75 degC
Final Product 100 kg
Cool & Filter
103-110degC, reaction time 72 hrs
Filtrate (4100kg)
2904
2744
Volatiles (296kg)Losses (4kg)

EMP for the Proposed Product Mix Change Program at VB Medicare Pvt. Ltd, Hosur, Tamil Nadu
Page 38
4.1.3. Manufacturing Process of Bentonite The manufacture of Bentonite involves the 4 stages. The following process
description is given below
Stage I
Crude Bentonite powder of 400 Kg is taken in 1600L of water. Mass is heated
to 60-650C, and is stirred continuously.
Stage II
In the second stage, to the settled solids, 1600 L of water is added and heated
to 60-650C, and similar to the first stage it is stirred continuously.
Stage III
In the third stage again 1600 L of water is added and heated to 60-650C, and
similar to the second stage and it is stirred continuously.
Stage IV
The temperature is maintained for 2 hr and it is allowed to attain room
temperature and kept for settling overnight. The supernatant is decanted and
the solids (slurry) are filtered. The solid is crushed and milled. After crushing
and milling the sample is given for analysis and product is packed.

EMP for the Proposed Product Mix Change Program at VB Medicare Pvt. Ltd, Hosur, Tamil Nadu
Page 39
Figure 4-3: Bentonite Typical Material Balance
AgitationWater (1600L)
Crude Bentonitepowder (400 kg)
Settling / Decantation
Heat to 60 - 65 degC, 1hr
AgitationWater (1600L)
Heat to 60 - 65 degC, 1hr
Settling / Decantation
AgitationWater (1600L)
Heat to 60 - 65 degC, 1hr
Settling / Decantation
Filtration Filtrate 410 L
Drying at 70-75 degC
Milling / Sieving
Drying at 130 degC
1200L
1440L
1536L
Packing ~ 368 kg

EMP for the Proposed Product Mix Change Program at VB Medicare Pvt. Ltd, Hosur, Tamil Nadu
Page 40
The unit has proposed to reduce the production quantity of Trichloro Galacto
Pyranosyl Fructo Furanoside (TGPF) from 72 TPA to 61 TPA and Tocopheryl
Polyethylene Glycol Succinate (TPGS) quantity from 72 TPA & 60 TPA.
Further unit has proposed to add three products i.e DL-Lysine acetyl
salicylate (6 TPA), 7-Methyl Xanthine (5 TPA) and Bentonite (12 TPA) by
maintaining the same production capacity of 564 TPA which was consented
as per earlier EC vide letter no. J-11011/65/2013, dated 16th May 2015.
However, the water, wastewater, steam consumption and Hazardous waste
will not be increased from the earlier EC dated 2015.The same is presented in
the Table 4.1.

EMP for the Proposed Product Mix Change Program at VB Medicare Pvt. Ltd, Hosur, Tamil Nadu
Page 41
Table 4-1: Summary of the New & Existing product
Product
Annual Production capacity –
(TPA)
Rated monthly production capacity (Tons)
Steam requirement
Coal consumption
for boiler
Water consumption
Wastewater generation
Total solvent
consumption
(Lts/day)
Hazardous waste
generation (Kg/day)
T/day T/day m3/day m3/day EC 2008 scenario
GHC 240 20 12 2 36 20 25.6 116 TGPF 72 6 30 5 372 149 950 2100 MEE - - 40 7 - - - - Total 312 26 82 14 408 169 975.6 2216
EC 2015 Current scenario GHC 240 20 12 2 36 20 25.6 116 TGPF 72 6 Not required Not required 0.2 0.06 Not
required 6
DHA 180 15 34.4 6 259 101 1668 1745 TPGS 72 6 6 1 4 4 200 62 MEE - - 20 3.5 - - - Total 564 47 72.4 12.5 299.2 125.06 1893.6 1929
Current proposal (2016 TOR Application) GHC 240 20 12 2 36 20 25.6 116 DHA 180 15 34.4 6 259 101 1668 1745 TGPF 61 5 Not required Not required 0.2 0.04 Nil 5 TPGS 60 5 4.5 0.72 3 3 166 50
DL-Lysine acetyl salicylate 6 0.5 0.2 0.04 0.043 0.012 13 9.13
7-methyl Xanthine 5 0.41 0.9 0.17 0.91 1.40 12 3.73
Bentonite 12 1 0.4 0.07 0.45 0.056 Not required Nil
MEE - - 20 3.5 - - - - Total 564 46.91 72.4 12.5 299.55 125.51 1884.6 1928.87

EMP for the Proposed Product Mix Change Program at VB Medicare Pvt. Ltd, Hosur, Tamil Nadu
Page 42
5. BASELINE ENVIRONMENTAL CONDITION
5.1 Location of the Facility and Overview of the Background
Environmental Features
M/s. V B Medicare Private Limited (VBM) is located Phase 2, SIPCOT
Industrial Area, near Hosur town in Krishnagiri district, Tamil Nadu. The
project site coordinates are located at 12°43'19.20"N 77°52'9.49"E and can be
identified as per Survey of India Toposheet No. 57 H/9 and 57 H/13. The
study area of 10 km from proposed project site was defined for primary data
collection as per ToR issued by MoEF and is in line with the EIA guidance
manual for Synthetic Organic Chemicals Industry, August 2010.
The facility is located at about 5.5 km from Hosur city center. The plant is
surrounded by FLEET Guard Industries Pvt. Ltd. on the Northern side,
SIPCOT Lake on the Eastern side, Arnika Industries on the Southern side and
empty plot on the Western side. The facility is easily approachable by NH-7
which connects Varanasi to Kanyakumari via Bangalore Electronics city. The
project site is also well connected by railway (Hosur Railway Station at 5 km)
and Bangalore International Airport at 55 km.
The baseline environmental setting of the study area, includes
micrometeorology, land-use pattern, air quality, water resources and water
quality, geological aspects and soil quality, flora and fauna and socio
economic aspects in the study area.
5.2 Land Environment
5.2.1. Physiography of Hosur Taluk The entire area is a vast stretch of rolling plain. In general, the altitude varies
from more than 900 m in the South-West to less than 750 m on the East.
This region consists of small hill ranges and ridges. There is no perennial

EMP for the Proposed Product Mix Change Program at VB Medicare Pvt. Ltd, Hosur, Tamil Nadu
Page 43
river in Hosur block except the river Chinnar and Dakshina pinakini which
are non perennial rivers. It holds water only during the monsoon seasons.
Tanks found in the study area not much used, due to water contaminated
with domestic and industrial sewage.
5.2.2. Drainage Pattern of the District
Krishnagiri district forms parts of Cauvery and East Coast Minor Rivers
basins. Cauvery River forms the southwestern boundary of the district. Dodda
Halla is the most important tributary of Cauvery draining the rugged terrain
in the northwestern part of the district. Ponnaiyar is the major river draining
the district and is ephemeral in nature. It originates from Nandhi hills in
Karnataka, enters Tamil Nadu west of Bagalur and flows almost in
southeasterly direction till it reaches Manjamedu from where it flows along
the district boundary before entering the district, again near Hanuman
Tirtham. After flowing for a short distance in an easterly direction, it again
follows the district boundary before entering the neighboring Dharmapuri
district. Pambar and Burgur Aru are among the important tributaries of
Ponnaiyar draining part of the district1
5.2.3. Land use/ Land Cover Study
.
Land use land cover study was conducted by remote sensing technique
followed by ground truth verification. Remote sensing satellite imageries were
collected and interpreted for the 10 km radius study area for analyzing the
land use pattern of the study area. Based on the satellite data land use/ land
cover maps have been prepared.
The present land use / land cover maps were prepared based on the
classification system of national standards. For explanation of each of the
land use category the details as given in Table 5.1 were considered.
1 Disrict Ground water Brochure, Krishnagiri district, Tamil Nadu, Central Ground Water Board, South Eastern Coastal Region, March 2009

EMP for the Proposed Product Mix Change Program at VB Medicare Pvt. Ltd, Hosur, Tamil Nadu
Page 44
Table 5-1:Land Use/Land Cover Classification System
S. No. Level-1 Level-2
1 Built-up Land
Town/cities Villages Institution/Industry/Godown etc Plotted Area/Layout
2 Agriculture Land
Crop Land Plantations Fallow
3 Forest Evergreen/Semi evergreen Deciduous Forest Plantation
4 Wastelands Rocky/Stony Waste Land with /without scrubs Saline/sandy & Marshy/swampy
5 Water Bodies River/Stream Lake/Reservoir/Tanks
6 Others
Orchard/Other Plantation Shifting cultivation Salt Pans, Snow covered/Glacial Barren/Vacant Land
5.2.3.1 Data Requirements
IRS Resource Sat-2 on LISS3 with 5m resolution was acquired for 08 March
2012 (haze free and cloud free) and was used for the mapping and
interpretation. Besides, other collateral data as available in the form of maps,
charts, census records, other reports and especially topographical survey of
India maps are used. In addition to this, ground truth survey was also
conducted to verify and confirm the ground features.
5.2.3.2. Methodology
The methodology adopted for preparation of landuse/land cover thematic
maps is as follows:
• Digital interpretation of IRS Resource Sat-2 satellite Digital Data using
ERDAS software programme; and

EMP for the Proposed Product Mix Change Program at VB Medicare Pvt. Ltd, Hosur, Tamil Nadu
Page 45
• Field observations- The methodology adopted for preparation of land use/
land cover thematic map is monoscopic visual interpretation of geocoded
scenes of IRS Resource Sat-2 satellite and field observations are taken. The
various steps involved in the study are preparatory field work, field survey
and post field work.
5.2.3.3. Pre-field Interpretation of Satellite Data
The False Color Composite (FCC) of IRS Resource Sat-2 satellite has been used
for pre-field interpretation work. Taking the help of topo-sheets, geology,
geomorphology and by using the image elements the features are identified and
delineated the boundaries roughly. Each feature is identified on image by their
image elements like tone, texture, colour, shape, size, pattern and association.
A tentative legend in terms of land cover and land use, physiography and
erosion was formulated. The sample areas for field check are selected covering
all the physiographic, land use/land cover feature cum image characteristics.
Ground Truth Collection- Both topo-sheets and imagery were taken for field
verification and a transverse plan using existing road network was made to
cover as many representative sample areas as possible to observe the broad
land use features and to adjust the sample areas according to field conditions.
Detailed field observations and investigations were carried out and noted the
land use features on the imagery.
Post Field Work- The base maps of the study area was prepared, with the help
of Survey of India Topo-sheets. Preliminary interpreted land use and the land
cover features boundaries from IRS Resource Sat-2 False Color Composite
were modified in light of field information and the final thematic details were
transferred onto the base maps. The final interpreted and classified thematic
map was cartographed. The cartographic map was colored with standard

EMP for the Proposed Product Mix Change Program at VB Medicare Pvt. Ltd, Hosur, Tamil Nadu
Page 46
colour coding and detailed description of feature with standard symbols. All the
classes noted and marked by the standard legend on the map.
5.2.3.4. Final Output
The final output would be the land use/land cover map numerals were given
different colour code for each category as shown in map. Area estimation of all
features of land use/land cover categories was noted.
5.2.3.5. General Level I Land Use/Land Cover in Study Area
The following are the main interpreted land use/land cover classes of the study
area and their respective areas are given in ha in Table 5.2 for the year 2012.
The thematic map and land use pattern within 10 km radius based on IRS
Resource Sat-2 LISS3 with 5 m resolution for March 2012 are shown in Figure
5.1 and Figure 5.2 respectively
Table 5-2: Level I Land Use/Land Cover Statistics of 10 km Radius of the Study Area
S. No. Land Use Area (Hectares) Area (%)
1 Built-up Land 3676 11.70
2 Forest 1884 6.00
3 Agricultural land 18384 58.52
4 Waste Land 6100 19.42
5 Water Bodies 1372 4.37
Total 31416 100
* Wastelands
Wasteland includes land with and without shrubs. The wastelands are about
6100 ha, which is about 19.42% of the study area.
* Forest Land

EMP for the Proposed Product Mix Change Program at VB Medicare Pvt. Ltd, Hosur, Tamil Nadu
Page 47
Forest Land includes deciduous, degraded and forest blanks land with and
without shrubs. The forest lands are about 1884 ha, which is about 6 % of
the study area.
* Agricultural Land
The total agricultural land covers plantation, other agricultural area and
fallow land consisting of 18384 ha of total study area 58.52 % of 10 km
radius.
* Water Bodies
The total area of water bodies is about 1372 ha, which is about 4.37 % of the
study area.
* Built-up Land
The built-up land in the study area is about 3676 ha which about 11.70 % of
the study area. It consists of settlements, industrial/institutional areas
buildings.

EMP for the Proposed Product Mix Change Program at VB Medicare Pvt. Ltd, Hosur, Tamil Nadu
Page 48
Figure 5-1: Satellite Image of the Study Area

EMP for the Proposed Product Mix Change Program at VB Medicare Pvt. Ltd, Hosur, Tamil Nadu
Page 49
Figure 5-2: Land Use Classifications (Level I) of the Study Area

EMP for the Proposed Product Mix Change Program at VB Medicare Pvt. Ltd, Hosur, Tamil Nadu
Page 50
5.2.3.6. General Level II Land Use / Land Cover in Study Area
The level-II land use/land cover is further sub divided into meaningful sub-
classes to highlight the dominant land use in the study area. The level-II land
use/land cover statistics and features of the 10 km radius area from the
proposed project site are presented in Table 5.3 and Figure 5.4 respectively.
Table 5-3: Level II Land Use/ Land Cover Statistics of 5 and 10 km Radius
S.No. Land Use Area (Hectares) Area (%)
Built-up Land 1 Settlements 2357 7.50 2 Industry/Institutional Land 1319 4.20
Forest 3 Dense/Open Forest 991 3.16 4 Degraded Scrub 855 2.72 5 Forest Blank 38 0.12
Agricultural land 6 Plantation 847 2.69 7 Agriculture Land 15190 48.35 8 Fallow Land 2347 7.47
Waste Land 9 Land with/without Scrub 5013 15.96 11 Rocky/Stony/Barren Land 478 1.52 12 Quarry/Mining Land 609 1.94
Water Body 13 Stream/River/Tank/Reservoir 1372 4.37
Total 31416 100.00
Observations
The results indicate that the study area mainly comprises of Agricultural land
and Waste land. The forest land is concentrated within 5 km from the project
site and waste land is distributed uniformly across 10 km radius
The land use classification of the study area reveals that the percentage of
Agricultural land is greater than the forest land. Hence, the impact on the
Agricultural land will be higher than that compared to the forest land.

EMP for the Proposed Product Mix Change Program at VB Medicare Pvt. Ltd, Hosur, Tamil Nadu
Page 51
Figure 5-3:Land Use Classification (Level II) of the Study Area

EMP for the Proposed Product Mix Change Program at VB Medicare Pvt. Ltd, Hosur, Tamil Nadu
Page 52
5.3. Geology and Soil Quality 5.3.1. Geology
The prominent geomorphic units identified in the district through
interpretation of satellite imagery are structural hills in the southwestern part
of the district, denudational land forms like buried pediments in the plains
and inselbergs and plateaus represented by conical hills aligned with major
lineaments.
Krishnagiri district forms part of the upland plateau region with many hill
ranges and undulating plains. The western part of the district has hill ranges
of Mysore plateau with a chain of undulating hills and deep valleys extending
in NNE-SSW direction. The plains of the district have an average elevation of
488 m amsl. The plateau region along the western boundary and the
northwestern part of the district has an average elevation of 914 m amsl. The
Guthrayan Durg with an elevation of 1395 m amsl is the highest peak in the
district. Geology map of the Krishnagiri district is given below in Figure 5.4.

EMP for the Proposed Product Mix Change Program at VB Medicare Pvt. Ltd, Hosur, Tamil Nadu
Page 53
Figure 5-4:Geology Map of Krishnagiri District
Project Site

EMP for the Proposed Product Mix Change Program at VB Medicare Pvt. Ltd, Hosur, Tamil Nadu
Page 54
5.4. Soil Environment
The Soil type ranges from fine loamy, loamy, clayey soils are seen in Hosur
Taluk. Red loamy and sandy soils are predominant in Hosur Taluk. Generally
the soil is low in Nitrogen and Phosphate content with no marked variation
between Hosur Taluk. Vast stretches of loam soils and black soils occur in
Krishnagiri district. The soil map of the district is given in Figure 5.5.
Figure 5-5: Soil Map of Krishnagiri District
Source: District Planning Map Series of Dharmapuri District. First Edition, 1988
Project Site

EMP for the Proposed Product Mix Change Program at VB Medicare Pvt. Ltd, Hosur, Tamil Nadu
Page 55
5.4.1. Soil Quality in Study Area
Soil samples were collected from four locations within the study area and
evaluated for its Physico-Chemical characteristics. The soil sample was
collected from 2 feet deep with the help of stainless steel soil-sampling probe.
Various physical and chemical parameters were analyzed as per Indian
Standards.
The analysis shows that the soil in the study area is sandy loam. The bulk
density varies from 1.25 g/cm3 to 1.36 g/cm3 which indicate that the soil is
rich in minerals. Water holding capacity of soil ranges from 50% to 56% and
permeability ranges from 2.2x10⁻⁴ cm/sec to 2.6x10⁻⁴ cm/sec indicating that
the infiltration rates are moderate and hence, recharge of groundwater table
during monsoon would be less and surface run-off would be high. pH ranges
from 7.5 to 7.9 indicating the soil is ideal for plant growth.
Nutrients: Soil quality was tested for nutrients. Nitrogen values range from
10 mg/kg to 13 mg/kg; phosphorus range from 22 mg/kg to 26 mg/kg;
potassium values range from 126 mg/kg to 148 mg/kg indicating that the soil
had medium nutrients. Nutrients can be enriched by addition of fertilizers.
Heavy metals were found to be below detectable limits. Organic carbon ranged
from 0.21% to 0.32% which is very low to sustain vegetation.

EMP for the Proposed Product Mix Change Program at VB Medicare Pvt. Ltd, Hosur, Tamil Nadu
Page 56
5.5. Water Environment
5.5.1. Hydrogeology of Krishnagiri District
Krishnagiri district is underlained by Archaean crystalline formations with
recent alluvial deposits of limited aerial extent and thickness along the
courses of major rivers. The occurrence and movement of ground water are
controlled by various factors such as physiography, climate, geology and
structural features. Weathered and fractured crystalline rocks constitute the
important aquifer systems in the district.
The main source of water in the study area is ground water and the water
requirements of rural and urban areas in the district are met either thorough
surface water sources or through various mini water supply schemes or
integrated water supply schemes utilizing the available ground water
resources. The status of urban and rural drinking water supply in Krishnagiri
district is given in Table 5.4 and the hydrogeology of the district is given in
Figure 5.6.
Table 5-4:Status of Urban and Rural Drinking Water Supply in Krishnagiri District2
S.No
Urban area Beneficiaries Service level
1 Krishnagiri 68215 50 to 90 lpcd
2 Hosur 47999 >90 lpcd Source: District Ground water Brochure, Krishnagiri District, Tamil Nadu, CGWB, SECR,
Chennai, 2008
2 Disrict Ground water Brochure, Krishnagiri district, Tamil Nadu, Central Ground Water Board, South Eastern Coastal Region, March 2009

EMP for the Proposed Product Mix Change Program at VB Medicare Pvt. Ltd, Hosur, Tamil Nadu
Page 57
Figure 5-6:Hydrogeology Map of Krishnagiri District
Legend
Aquifer Age Lithology Ground water conditions
Yield Prospects (Cu.M/D)
Ground water development Stratergies
Consolidated Archaran Granites, Gneisses,
Charnocike
Discontinuous, unconfined to semi confined aquifers, Restricted to weathered Residuum and fractures
< 50 near watershed divides and high grounds 50-200 near third order streams and low ground
Suitable for development through dug wells. Bore wells feasible in fracture zones, best locations being intersection of fractures
Source: Plate II of District Ground water Brochure, Krishnagiri District, Tamil Nadu, CGWB, SECR, Chennai, 2008
Project Site

EMP for the Proposed Product Mix Change Program at VB Medicare Pvt. Ltd, Hosur, Tamil Nadu
Page 58
5.5.2. Groundwater Quality in Study Area
In order to establish the background groundwater quality of the study area,
ground water samples from 6 locations were collected and analyzed. Water
quality was analyzed for physico-chemical and biological parameters by a
MoEF accredited laboratory.
The results indicate that pH ranges from 6.9 to 7.61 which confirm to
desirable quality for drinking as per IS 10500:1992. Hardness ranges from
410 mg/l to 440 mg/l, total dissolved solids range from 670 mg/l to 756
mg/l, chlorides range from 266 mg/l to 284 mg/l which is above desirable
level but within permissible level for drinking purpose as per IS 10500:1992.
Other parameters were below the desirable quality for drinking as per IS
10500:1992. Hence, water shall be treated appropriately and used for
drinking.
5.6. Air Environment
5.6.1. Meteorology According to Koppen classification of climate pattern, the study area falls
under the Tropical wet and dry climate. The year is divided into three
seasons. Winter and summer are long and dry periods with extreme
temperatures. Heat waves may be generated during summer months due to
very high temperature. The region receives both South West and North East
monsoon. Rainy season lasts from June to September.
Long term meteorological data from the “Climatological Normals” published by
Indian Meteorological Department (IMD) was referred. The nearest IMD
observatory for the project site is Bangalore Airport which is considered as
representative observatory for meteorological conditions for the project site.
The station is around aerial distance of 33.5 km in North West direction. The
consolidated 30 years (1971-2000) Climatological data for Bangalore (A)
observatory is presented in the Table 5.5 and Table 5.6. The site specific
data was collected from November 2013 to January 2014.

EMP for the Proposed Product Mix Change Program at VB Medicare Pvt. Ltd, Hosur, Tamil Nadu
Page 59
5.6.2. Regional Meteorology – IMD Data
Ambient Temperature: The period from February to May is marked by
continuous increase in the ambient temperatures. April is the hottest month
of the year with mean daily maximum and minimum temperatures of 34 ºC
and 20.8 ºC respectively. The coolest month is December with mean daily
maximum and minimum temperatures of 26.1 ºC and 15.1 ºC. Night
temperatures in January are relatively lower than that of December. The
study area has moderate climate with winter temperatures rarely drop below
12 ºC and summer temperatures seldom exceed 36 ºC. The summer heat is
moderated by fairly frequent thunderstorms.
Rainfall: The study area receives rainfall from both southwest and northeast
monsoons and the wettest month is September. The average annual rainfall
in the study area was reported to be 880.9 mm over a period of 55.7 days. As
per Climatological Tables, precipitation occurs during the months of May to
October. The maximum number of rainy days was found to occur during
September.
Relative Humidity: Relative humidity ranges from 68% to 87% during day
time and it varies from 28% to 68% during night time.
Wind Speed: The average wind speed of the study area is found to be 9.2
kmph. The wind was to vary between 1-19 kmph for over 289 days and 20–61
kmph for over 55 days and rest of the days it remained calm in a year. Wind
speed is high during June to September. Wind predominantly blows from
East, North East and South West during non-monsoon season. During
monsoon season, wind blows from West and South West direction.
Mixing Height: The Atlas of Mixing Heights published by IMD, New Delhi
indicated that the peak mixing height of 1200 m would occur in the study

EMP for the Proposed Product Mix Change Program at VB Medicare Pvt. Ltd, Hosur, Tamil Nadu
Page 60
area during winter season. Figure 5.7 represents the mixing height variation
graph for winter season.
Figure 5-7: Mixing Height Variation Graph
0 200 400 600 800
1000 1200 1400
1 2 3 4 5 6 7 8 9 10 11 12 13 14 15 16 17 18 19 20 21 22 23 24
Mix
ing
Hei
ght,
m
Hours

EMP for the Proposed Product Mix Change Program at VB Medicare Pvt. Ltd, Hosur, Tamil Nadu
Page 61
Table 5-5:Indian Meteorological Department – Climatological Tables 1
30 Years Data: 1971 to 2000 Station: Bangalore (A)
Month
Temperatures (oC)
Humidity
(%)
Rainfall (mm) Mean
Wind
Speed
(kmph)
Mean Extremes
Monthly
Total
No. of
Rainy
Days
Heaviest
Rainfall in 24 hrs
Date and Year
Highest
Lowest
Highest
Lowest
Jan 27.4 14.2 29.9 10.9 86 42 1.8 0.0 24.2 11,
1967 5.7
Feb 30.1 15.9 32.4 12.4 77 34 7.6 0.4 40.5 20,
1986 6.3
Mar 32.7 18.2 34.9 14.5 68 28 14.0 0.8 63.0 12,
1981 6.6
Apr 34.0 20.8 35.9 17.8 73 35 40.0 2.8 64.4 17,
1971 6.9
May 33.1 20.9 35.7 18.5 76 47 94.4 6.0 93.6 2, 1966 9.8
Jun 29.8 19.8 32.9 18.0 83 63 80.5 5.0 82.5 2, 1973 16.9
Jul 28.6 19.4 31.3 18.1 86 66 102.7 7.4 67.5 22,
1979 16.6
Aug 28.0 19.2 30.3 17.9 88 68 116.6 9.3 103.0 12,
1996 14.7
Sep 28.5 19.3 30.5 17.5 86 65 195.6 9.6 145.4 21,
1980 9.6
Oct 28.0 19.0 30.0 16.6 85 66 152.0 8.7 169.2 7, 1953 6.1
Nov 26.8 17.1 29.1 13.4 84 62 58.4 4.1 103.6 16,
1991 5.1
Dec 26.1 15.1 28.3 11.4 87 56 17.3 1.5 71.3 5, 1993 5.5
Annual Total
/ Mean
29.4 18.2 36.2 10.3 82 53 880.9 55.7 169.2 7, 1953 9.2
Source: Indian Meteorological Department, Pune
Table 5-6:Indian Meteorological Department – Climatological Tables 2
30 Years Data: 1971 to 2000 Station: Bangalore (A)
Month
No. of days with wind speed (kmph)
Percentage no. of days wind from
62 or mor
e 20-61 1-19 0 N NE E SE S SW W NW CALM
Jan 0 0
0 1
27 29
4 1
0 1
15 19
58 60
10 14
3 1
1 1
1 0
0 1
12 3
Feb 0 0
0 2
24 25
4 1
1 2
8 13
35 52
20 20
8 3
8 3
4 1
1 1
15 5
Mar 0 0
0 3
27 27
4 1
1 3
2 15
19 52
17 18
13 2
20 3
11 2
2 2
15 3
Apr 0 0
1 2
27 26
2 2
1 6
2 11
4 38
11 20
14 5
33 4
24 4
5 6
6 6

EMP for the Proposed Product Mix Change Program at VB Medicare Pvt. Ltd, Hosur, Tamil Nadu
Page 62
May 0 0
5 4
25 25
1 2
2 10
1 7
1 11
2 8
4 6
19 13
55 24
13 16
3 5
Jun 0 0
14 15
16 14
0 1
1 2
0 0
0 1
0 1
0 1
25 26
65 57
8 10
1 2
Jul 0 0
14 15
17 16
0 0
0 2
0 0
0 1
0 0
0 1
25 23
69 63
6 9
0 1
Aug 0 0
11 11
19 19
1 1
1 3
0 1
0 0
0 0
0 0
16 18
70 61
11 15
2 2
Sep 0 0
4 3
24 25
2 2
3 6
2 4
3 4
2 4
1 2
12 20
57 36
15 18
5 6
Oct 0 0
1 1
26 27
4 3
3 11
10 17
20 22
7 7
2 2
10 10
29 12
7 9
12 10
Nov 0 0
1 1
26 27
3 2
5 11
33 28
33 37
7 8
1 1
4 2
4 2
2 4
11 7
Dec 0 0
0 1
29 29
2 1
3 3
34 25
48 58
6 8
0 1
1 1
1 0
1 1
6 3
Annual Total/ Mean
0 0
53 60
286 289
26 16
2 5
9 12
19 28
7 9
4 2
14 10
32 22
6 8
7 4
Source: Indian Meteorological Department, Pune

EMP for the Proposed Product Mix Change Program at VB Medicare Pvt. Ltd, Hosur, Tamil Nadu
Page 63
5.6.3. Site Specific Meteorological Data
Meteorological study becomes a crucial part of EIA study. To determine the
prevailing micro-meteorological conditions during the study period, an
automatic weather monitoring station was installed at VBM facility. Micro
meteorological parameters like wind speed, wind direction, rainfall, air
temperature and relative humidity were monitored for a period of 3 months
from November 2013 to January 2013. The wind rose was plotted for data
collected and is presented in Figure 5.8.
Observations:
1. Temperature during the study period was found to vary from 12 ºC to
32 ºC.
2. Relative humidity was found to vary from 18% to 99%.
3. Predominantly, winds were blow from East direction. The average wind
speed is 2.89 m/s. The winds remained calm during 0 % of study
period.

EMP for the Proposed Product Mix Change Program at VB Medicare Pvt. Ltd, Hosur, Tamil Nadu
Page 64
Figure 5-8:Wind Rose Diagram (Study Period: November 2013 to January 2014)
5.6.4. Air Quality of Study Area
Sources of Air Pollution
Following industrial activities are carried out within the study area and are
the major sources of air pollution:
1. National Highway 7 at 0.25 km
2. National Highway 201 at 5.25 km
3. Industries operating in SIPCOT Phase I
4. Industries operating in SIPCOT Phase II
5. Industries operating in SIDCO Industrial Estate
6. Hosur IT Park and SEZ
7. Hostia Industrial Estate

EMP for the Proposed Product Mix Change Program at VB Medicare Pvt. Ltd, Hosur, Tamil Nadu
Page 65
8. Maruthi Sundew
The study area mainly consists of large, medium and small scale industries
located in SIPCOT Phase I & II, SIDCO Industrial Estate and scattered over
private land too. Industries of various kinds such as automobile, chemical,
iron and steel, electronic and electrical, general engineering are located within
the study area.
Project Site Monitoring Observations
The existing facility has appointed a MoEF approved environmental
monitoring agency for conducting ambient air quality monitoring once in a
month at two locations within the plant, namely, Near Acid Plant and near
Main Gate. Monitoring results were collected from April 2012 to October
2012. The trend in the ambient air quality at existing facility is being
discussed below in Figures.
PM10: PM10 values were found to vary from 64 µg/m3 to 86 µg/m3, which is
less than NAAQ standard of 100 µg/m3 for 24 hours. PM10 variation graph
(Figure 5.9) indicates that the PM10 values are found to decrease over a
period of time.
Figure 5-9: PM10 Trend Observed during April 2012 to October 2012
0
20
40
60
80
100
April May June July Aug Sept Oct
PM10
, µg/
m3
Month
PM10
Acid Plant
Main Gate

EMP for the Proposed Product Mix Change Program at VB Medicare Pvt. Ltd, Hosur, Tamil Nadu
Page 66
PM2.5: PM2.5 values were found to vary from 34 µg/m3 to 50 µg/m3, which is
less than NAAQ standard of 60 µg/m3 for 24 hours. PM2.5 variation graph
(Figure 5.10) indicates that the variation in PM2.5 levels is very narrow.
Figure 5-10: PM2.5 Trend Observed during April 2012 to October 2012
SO2: SO2 values were found to vary from 3 µg/m3 to 7.8 µg/m3, which is less
than NAAQ standard of 80 µg/m3 for 24 hours. SO2 variation graph (Figure
5.11) indicates that SO2 levels increased from august to October.
Figure 5-11: SO2 Trend Observed during April 2012 to October 2012
0
10
20
30
40
50
60
April May June July Aug Sept Oct
PM2.
5, µg
/m3
Month
PM2.5
Acid Plant
Main Gate
0
2
4
6
8
10
April May June July Aug Sept Oct
SO2,
µg/m
3
Month
SO2
Acid Plant
Main Gate

EMP for the Proposed Product Mix Change Program at VB Medicare Pvt. Ltd, Hosur, Tamil Nadu
Page 67
NO2: NO2 values were found to vary from 14.6 µg/m3 to 23.6 µg/m3, which is
less than NAAQ standard of 80 µg/m3 for 24 hours. NO2 variation graph
(Figure 5.12) indicates that NO2 levels decreased during monsoon period of
August and September.
Figure 5-12: NO2 Trend Observed during April 2012 to October 2012
CO: CO values were found to vary from 0.42 mg/m3 to 0.49 mg/m3, which is
less than NAAQ standard of 2 mg/m3 for 8 hours monitoring period. CO
variation graph (Figure 5.13) indicates those CO levels increased from April
to October and the variation also being negligible.
Figure 5-13: CO Trend Observed during April 2012 to October 2012
0
5
10
15
20
25
April May June July Aug Sept Oct
NO
2, µg
/m3
Month
NO2
Acid Plant
Main Gate
0
0.1
0.2
0.3
0.4
0.5
0.6
April May June July Aug Sept Oct
CO, m
g/m
3
Month
CO
Acid Plant
Main Gate

EMP for the Proposed Product Mix Change Program at VB Medicare Pvt. Ltd, Hosur, Tamil Nadu
Page 68
Benzene: Benzene values were found to vary from 0.05 µg/m3 to 8 µg/m3.
Values of Benzene were found to exceed NAAQ standard of 6 µg/m3 near Acid
plant during June 2012 (Figure 5.14). This may be attributed to leakage of
solvents from the tank farm.
Figure 5-14: Benzene Trend Observed during April 2012 to October 2012
Benzo (a) pyrene: Values of Benzo (a) pyrene [BaP] were found to vary from
0.09 ng/m3 to 0.28 ng/m3. Values of BaP were found to be well within NAAQ
standard of 1 ng/m3 .
Figure 5-15: Benzene (a) Pyrene Trend Observed during April 2012 to October 2012
0
2
4
6
8
10
April May June July Aug Sept Oct
C 6H 6
, µg/
m3
Month
Benzene
Acid Plant
Main Gate
0
0.05
0.1
0.15
0.2
0.25
0.3
April May June July Aug Sept Oct
BaP,
ng/
m3
Month
Benzo (a) Pyrene
Acid Plant
Main Gate

EMP for the Proposed Product Mix Change Program at VB Medicare Pvt. Ltd, Hosur, Tamil Nadu
Page 69
Ammonia: Values of Ammonia were found to vary from 0.5 µg/m3 to 6.5
µg/m3. Values of Ammonia were found to be well below NAAQ standard of 400
µg/m3.
Figure 5-16: Ammonia Trend Observed during April 2012 to October 2012
5.7. Noise Environment The noise levels within the existing plant are being monitored by TNPCB once
in a year at 8 locations. The report of the same is being reproduced in Table
5.7. The equivalent noise levels were found vary from 55.7 dB(A) near main
gate to 63.3 dB(A) near the fence which is below Ambient Air Quality
Standards for Noise for Industrial Area. Noise Report enclosed as Annexure-
IV.
Table 5-7: Noise Levels within the Existing Facility
S.No. Location Sound Level Leq dB(A)
1 Behind Waste Storage Shed 58.4 2 Near Water Sump 60.0 3 Near Main Gate 55.7 4 Near Gate No. 2 56.4 5 Near Fence 63.3 6 Near Old Admin Building 61.4 7 Behind Spent Acid Tank 61.2 8 Near Scrap Yard 58.4
0 1 2 3 4 5 6 7
April May June July Aug Sept Oct
NH 3
, µg/
m3
Month
NH3
Acid Plant
Main Gate

EMP for the Proposed Product Mix Change Program at VB Medicare Pvt. Ltd, Hosur, Tamil Nadu
Page 70
5.8. Socioeconomic Profile of the Study Area
5.8.1. Demography The population in the study area is read using the 2011 census. The total
households in the study area (identified fifty five villages and five urban
agglomeration) are 91,080 with a total population of 3,71,441. The sex ratio
in the study area was 939 females for 1000 Males. The children population
was about 46,234 in which 23,619 were males and 22,615 were females. The
children sex ratio was 958 which is higher than the rate of general
population. The ratio of urban and rural population in the study area is 62:38
respectively. Socioeconomic status of the area depends on the vulnerable and
weaker section of the society. Vulnerable population generally indicates the
population of Scheduled Caste and Scheduled tribes. Largest Scheduled
Castes found in the districts are Adi Dravida, Arunthathiyar and Kuravan and
largest Scheduled Tribes are Malayali, Irular and Kurumans. The SC
population in study area seems to be 13.06% to the total population. The ST
population is very less when compared with SC population. The percentage of
ST population is 0.35%.

EMP for the Proposed Product Mix Change Program at VB Medicare Pvt. Ltd, Hosur, Tamil Nadu
Page 71
Table 5-8:Population Distribution in the study area
No Villages HH Pop M F_M C<6 MC<6 FC<6 SC ST 1 Achettipalli 697 3066 1562 1504 368 172 196 910 0 2 Dhasapalli 152 894 443 451 127 64 63 1 0 3 Alur 678 3018 1569 1449 338 170 168 178 5 4 Midithepalli 287 1287 667 620 164 96 68 278 31 5 Athimugam 937 4540 2339 2201 572 272 300 334 17 6 Attur 160 667 334 333 68 33 35 172 0 7 Badathepalli 150 735 373 362 78 41 37 114 0 8 Kanimangalam 107 463 232 231 54 24 30 117 0 9 Attur 77 354 187 167 42 22 20 226 0 10 Jeemangalam 266 1148 577 571 136 67 69 388 0 11 Bairamangalam 1207 4932 2569 2363 520 258 262 1213 11 12 Begepalli 963 3835 1969 1866 517 277 240 382 7 13 Govinda Agraharam 979 3875 2122 1753 474 244 230 664 3 14 Bukkasagaram 460 2126 1109 1017 259 128 131 319 0 15 Kembasandiram 184 891 450 441 117 55 62 331 0 16 Viswanathapuram 439 1818 943 875 238 126 112 346 0 17 Chennasandiram 90 365 190 175 30 16 14 132 0 18 Kalasthipuram 159 680 365 315 89 42 47 240 0 19 Chenathur 3458 15826 8925 6901 1938 999 939 1154 110 20 Doripalli 852 3681 1898 1783 398 216 182 596 0 21 Hosappuram 763 3561 1830 1731 392 211 181 773 0 22 Kamandoddi 1450 6524 3394 3130 797 415 382 878 130 23 Addakurukki 581 2504 1288 1216 366 191 175 425 8 24 Subbagiri 158 656 333 323 81 46 35 0 0 25 Eluvapalli 283 1323 688 635 159 85 74 446 0 26 Siddanapalli 153 682 347 335 90 54 36 133 0 27 Peddakullu 109 521 265 256 56 28 28 120 0 28 Karibasanapuram 1 4 2 2 0 0 0 0 0 29 Chinnakullu 71 331 165 166 38 20 18 69 0 30 Kelavarapalli 117 529 274 255 42 15 27 49 0 31 Punugandoddi 187 834 430 404 100 54 46 226 0 32 Koladasapuram 221 857 429 428 90 45 45 390 0 33 Halekotta 707 2990 1535 1455 301 148 153 209 83 34 Thiyarandurgam 919 4143 2136 2007 463 223 240 442 82 35 Nanjapuram 123 649 354 295 77 41 36 160 2 36 Kothagondapalli 1087 4706 2346 2360 552 277 275 1795 11 37 Kundumaranapalli 863 3867 1972 1895 436 199 237 1157 0 38 Thattiganapalli 277 1227 636 591 141 69 72 436 0

EMP for the Proposed Product Mix Change Program at VB Medicare Pvt. Ltd, Hosur, Tamil Nadu
Page 72
No Villages HH Pop M F_M C<6 MC<6 FC<6 SC ST 39 Karupalli 73 332 181 151 27 19 8 41 0 40 Pathamuthali 205 967 499 468 101 51 50 392 0 41 Muthalli 108 444 223 221 46 23 23 130 0 42 Nagondapalli 674 2929 1513 1416 315 157 158 1096 0 43 Nallur 1319 5327 2739 2588 571 292 279 889 41 44 Nandimangalam 591 2602 1314 1288 261 138 123 713 0 45 Onalvadi 1607 6656 3411 3245 759 393 366 1360 0 46 Advanapalli 58 239 123 116 34 16 18 1 0 47 Alnatham 71 327 170 157 28 12 16 77 0 48 Sudugondapalli 87 447 229 218 50 30 20 95 0 49 Palavanapalli 258 1096 540 556 114 58 56 370 0 50 Moranapalli 2174 9160 4855 4305 1301 668 633 1503 13 51 Poonapalli 738 3061 1542 1519 319 170 149 544 9 52 Sanamavu 925 4248 2182 2066 513 270 243 659 183 53 Naligabetta Agraharam 281 1247 616 631 114 55 59 234 0 54 Thorapalli Agraharam 2177 9849 4669 5180 1328 694 634 1178 10 55 Venkatesapuram 650 2873 1484 1389 325 172 153 583 0 56 Zuzuvadi (CT) 8728 32474 17295 15179 4387 2145 2242 3289 156 57 Avalapalli (CT) 4478 17859 9135 8724 2276 1200 1076 1838 90 58 Mookondapalli (CT) 10624 39245 20488 18757 5450 2868 2582 3158 66 59 Hosur (M) 29255 116821 59351 57470 14307 7274 7033 9438 200 60 Mathigiri (TP) 5627 23129 11725 11404 2900 1471 1429 5128 33 Total 91080 371441 191531 179910 46234 23619 22615 48519 1301
Source: Census 2011. HH-Household, POP-Population, M -Male Population, F_M -Female Population,
C<6-Children Population below 6 Years, MC<6- Male Children, FC<6-Female Children, SC-Scheduled
Caste, ST- Scheduled Tribes, M-Municipality, CT- Census Town, TP – Town Panchayat.

EMP for the Proposed Product Mix Change Program at VB Medicare Pvt. Ltd, Hosur, Tamil Nadu
Page 73
5.8.2. Economic Indicators 5.8.2.1. Employment
The total working population in the study area is 1,49,599. The percentage of
working population is about 40.27% as against the state’s level of 45.58%.
74.63% of the working population is main workers and this shows the
improved life style of the people as they are employed for more than 6 months
in the year. In the study area only 24.71% of the total working population is
engaged in agricultural activity. The agricultural workers group is sub-
grouped into Cultivators and Agricultural Labors. In which 52% were
cultivators and 48% were Agricultural Labors. Household Industry relates to
production, processing, servicing, repairing or making and selling of goods.
Other workers are all workers who have been engaged in some economic
activity like employed in industries, fishing activity, wagers, construction
workers, etc., but are not cultivators or agricultural laborers or Household
Industry. The percentage of Household and Other workers group were 2.09%
and 73.18% respectively.

EMP for the Proposed Product Mix Change Program at VB Medicare Pvt. Ltd, Hosur, Tamil Nadu
Page 74
Table 5-9: Workers Group Distribution in the Study Area
S.No Villages Working Population Agricultural Household Other
Total MAIN MGN MCL MAL MGC MGA MHH MGH MOT MGO
1 Achettipalli 1429 1405 24 530 509 11 9 59 0 307 4 2 Addakurukki 1023 682 341 199 272 31 234 1 1 210 75 3 Advanapalli 68 48 20 37 1 2 17 0 0 10 1 4 Alnatham 91 69 22 62 0 0 15 0 0 7 7 5 Alur 1140 673 467 431 88 213 96 5 22 149 136 6 Athimugam 1936 1525 411 485 547 44 208 35 69 458 90 7 Attur 136 136 0 101 17 0 0 0 0 18 0 8 Attur-1 308 307 1 139 160 0 0 0 0 8 1 9 Avalapalli (CT) 6747 6346 401 377 298 37 63 147 34 5524 267 10 Badathepalli 302 285 17 106 100 2 2 4 0 75 13 11 Bairamangalam 2330 1723 607 725 282 98 406 26 2 690 101 12 Begepalli 1505 1364 141 130 73 6 7 10 4 1151 124 13 Bukkasagaram 364 278 86 104 53 18 25 22 0 99 43 14 Chenathur 5288 4714 574 310 166 91 34 75 32 4163 417 15 Chennasandiram 185 23 162 0 0 124 34 0 0 23 4 16 Chinnakullu 195 188 7 169 1 4 1 3 0 15 2 17 Dhasapalli 521 519 2 0 516 0 2 0 0 3 0 18 Doripalli 1140 1056 84 353 243 9 21 16 0 444 54 19 Eluvapalli 870 633 237 533 72 3 228 3 0 25 6 20 Govinda Agraharam 1742 1658 84 135 393 2 9 14 4 1116 69 21 Halekotta 1263 1098 165 493 397 50 46 16 17 192 52 22 Hosappuram 1822 1693 129 427 1118 2 40 29 1 119 86 23 Hosur (M) 43959 39730 4229 212 308 57 62 747 189 38463 3921 24 Jeemangalam 462 441 21 207 23 8 0 15 0 196 13 25 Kalasthipuram 42 36 6 1 6 3 1 2 0 27 2 26 Kamandoddi 3003 2221 782 863 403 209 212 49 20 906 341 27 Kanimangalam 335 156 179 123 23 12 135 5 14 5 18 28 Karibasanapuram 1 1 0 1 0 0 0 0 0 0 0 29 Karupalli 135 132 3 98 15 1 0 3 1 16 1 30 Kelavarapalli 334 329 5 296 7 2 0 5 0 21 3 31 Kembasandiram 257 249 8 202 24 3 3 0 0 23 2 32 Koladasapuram 431 401 30 79 161 5 9 3 0 158 16 33 Kothagondapalli 1977 1887 90 183 566 8 29 23 9 1115 44 34 Kundumaranapalli 1784 1562 222 513 454 10 155 35 9 560 48 35 Mathigiri (TP) 8510 8130 380 227 308 22 20 153 21 7442 317 36 Midithepalli 729 727 2 259 406 2 0 2 0 60 0 37 Mookondapalli (CT) 15857 15104 753 256 300 20 38 279 37 14269 658 38 Moranapalli 4081 3811 270 610 359 16 16 126 12 2716 226

EMP for the Proposed Product Mix Change Program at VB Medicare Pvt. Ltd, Hosur, Tamil Nadu
Page 75
S.No Villages Working Population Agricultural Household Other
Total MAIN MGN MCL MAL MGC MGA MHH MGH MOT MGO
39 Muthalli 156 155 1 100 5 0 0 2 0 48 1 40 Nagondapalli 1310 928 382 203 104 73 141 46 10 575 158
41 Naligabetta Agraharam 711 699 12 294 245 4 4 6 0 154 4
42 Nallur 2140 1993 147 723 222 29 59 12 6 1036 53 43 Nandimangalam 1260 1134 126 497 475 14 58 47 5 115 49 44 Nanjapuram 420 407 13 219 45 3 1 15 0 128 9 45 Onalvadi 2861 2524 337 400 525 23 83 51 6 1548 225 46 Palavanapalli 480 478 2 220 239 1 1 0 0 19 0 47 Pathamuthali 369 366 3 221 85 2 0 7 0 53 1 48 Peddakullu 252 241 11 134 47 0 6 0 0 60 5 49 Poonapalli 1424 890 534 311 188 139 283 25 7 366 105 50 Punugandoddi 435 430 5 175 136 0 1 0 0 119 4 51 Sanamavu 1913 1661 252 924 266 15 106 17 1 454 130 52 Siddanapalli 401 392 9 83 207 0 1 41 2 61 6 53 Subbagiri 208 208 0 174 18 0 0 0 0 16 0 54 Sudugondapalli 329 211 118 202 3 12 96 3 1 3 9 55 Thattiganapalli 612 561 51 385 101 16 14 0 2 75 19 56 Thiyarandurgam 2137 1692 445 598 524 11 319 19 5 551 110 57 Thorapalli Agraharam 3855 3157 698 611 1086 29 330 48 38 1412 301 58 Venkatesapuram 1211 965 246 815 91 5 230 4 0 55 11 59 Viswanathapuram 763 598 165 300 58 4 53 5 1 235 107 60 Zuzuvadi (CT) 14050 12720 1330 197 307 14 92 204 81 12012 1143 Total 149599 133750 5849 17762 13646 1519 4055 2464 663 99878 9612
Total- Total Working Population, MAIN – Main Workers, MGN- Marginal Workers, MCL- Main Cultivators, MAL-Main Agricultural Labors, MGC- Marginal Cultivators, MGA- Marginal Agricultural Labors, MHH- Main Household Industry, MGH- Marginal Household Industry, MOT – Main Other Industry, MGO- Marginal Other Industry.

EMP for the Proposed Product Mix Change Program at VB Medicare Pvt. Ltd, Hosur, Tamil Nadu
Page 76
Industries in the Study Area The census data depicts that the main source of income is from other income
sources only apart from agriculture and household industries. The below
Table 5.10 shows the list of major industrial players situated within the
study area.
Table 5-10: Large Scale Industries in Krishnagiri District
S.No Name Of The Large Scale Industry Manufacturer Location
1 Ashok Leyland Ltd., Motors Hosur 2 TVS Motors Ltd Motors Hosur
3 TITAN Industries Watches and Jewellery Hosur
4 Sundaram Clayton Two Wheeler Parts Hosur
5 Taneja Aerospace and Aviation Ltd., Tools Mfg. Hosur
6 AV Tech Ltd Tools Mfg. Hosur 7 Carborandum Universal Ltd., Tools Mfg. Hosur 8 TTK Prestige Ltd., Cooker Mfg. Hosur 9 India Pistons Ltd., Pistons Hosur 10 Global Calcium Pvt., Ltd., Pharmaceutical Hosur
Source: Brief Industrial Profile of Krishnagiri District- 2012-2013
Households Under Below Poverty Line
Below Poverty Line (BPL) is an economic benchmark of the particular area,
the higher the rates of BPL family’s lower the prosperity of the area. The
present criteria are based on a Baseline survey conducted under the Nirmal
Bharat Abhiyan (NBA), Ministry of Drinking water and Sanitation. According
to “NBA”, the percentage of BPL families in the study area ranges from
18.75% to 88.37%. The average rate(65.71%) of BPL households in 31
Panchayat villages are more than the state average of 17.1 % (NSSO Sample
Survey 2009-10). The Table 5.11 shows the percentage of BPL Households in
the study area.

EMP for the Proposed Product Mix Change Program at VB Medicare Pvt. Ltd, Hosur, Tamil Nadu
Page 77
Table 5-11:Rural Households under Below Poverty Line
S.No Panchayat Village Households* BPL HH
BPL %
1 A.Settipalli 721 551 76.42 2 Alur 764 579 75.79 3 Athimugam 1209 900 74.44 4 Badapalli 971 824 84.86 5 Bagaloor 1918 1397 72.84 6 Bairamangalam 947 284 29.99 7 Begapalli 1582 745 47.09 8 Bukkasagaram 586 463 79.01 9 Chennasandiram 995 839 84.32 10 Chennathur 1261 955 75.73 11 Doripalli 832 568 68.27 12 Hosapuram Settipalli 586 162 27.65 13 Kamandoddi 1321 960 72.67 14 Kanalatti 736 560 76.09 15 Kattunaikanadoddi 902 668 74.06 16 Kelavarapalli 664 519 78.16 17 Koladasapuram 272 51 18.75 18 Kommepalli 898 599 66.70 19 Kondaganapalli 512 196 38.28 20 Kondumaranapalli 850 575 67.65 21 Muthali 1045 767 73.40 22 Nagondapalli 430 380 88.37 23 Nallur 1052 771 73.29 24 Nandhimangalam 1024 863 84.28 25 Onnalvadi 1054 435 41.27 26 Palavanapalli 905 713 78.78 27 Perandapalli 1035 564 54.49 28 Poonapalli 658 246 37.39 29 Sanamavoo 978 718 73.42 30 Thorapalliagraharam 1610 1091 67.76 31 Vengatespuram 760 576 75.79
Source: Nirmal Bharat Abhiyan (NBA), Ministry of Drinking water and Sanitation *As per baseline survey conducted under NBA. HH- Households, BPL- Below Poverty Line
Health Indicators
The District health indicators based on DLHS-3 are as follows. Institutional
Birth Rate in the study area was about 86.9% with respect to state the rate

EMP for the Proposed Product Mix Change Program at VB Medicare Pvt. Ltd, Hosur, Tamil Nadu
Page 78
was 94%. The childhood immunization was to be only 89.7% which is more
than that of state rate of 81.6%. The rate of Infant mortality rate in 2011-12
was about 18.9 per 1000 infants born which was more than the rate of state
(25.5)3
Toilet Facility in study area
. Drinking water and Sanitation is the major concern in relating to
public health. The percentage of people having access to safe drinking water
facility (98.6%) is very good when compared to the state rate (94.7%). The
Sanitation facility in the place seems to be very poor only about 27.7% of the
population in the study area is having access to safe sanitation facilities.
According to District Level Household Survey (DLHS-3), only 27.7% of
district’s population had access to toilet facilities. When the same is compared
with rural facilities the rate was 16.2%. Based on the reports of Total
Sanitation Campaign, the average rate of people availing safe sanitation in the
study area was only 27.3%. Sanitation coverage for BPL (19.3%) families are
worse when compared to APL families (48.8%). The below Table 5.12 depicts
the percentage of population availed safe sanitation facility in the study area.
Table 5-12: Percentage availed Safe Sanitation Facilities in the Study Area
S.No Panchayat Name Toilet Facilities (BPL)
Toilet Faciliti
es (APL)
Toilet Facilitie
s (APL+B
PL)
School Toilet
Anganwadi Toilet
Sanitary Complex
1 A.Settipalli 11.4 80.0 27.6 12.5 25.0 - 2 Alur 11.9 80.0 28.4 6.7 42.9 -
3 Athimugam 14.8 92.9 34.7 14.3 33.3 - 4 Badapalli 6.67 27.9 9.9 15.4 100.0 -
5 Bagaloor 5.37 8.1 6.1 7.7 100.0 - 6 Bairamangalam 6.69 7.2 7.1 30.0 100.0 -
7 Begapalli 31.9 35.7 33.9 - - - 8 Bukkasagaram 9.94 79.7 24.6 12.5 - - 9 Chennasandiram 6.32 39.7 11.6 8.3 100.0 - 10 Chennathur 3.66 8.2 4.8 25.0 100.0 -
3 http://www.krishnagiri.tn.nic.in/documents/stat/2011_2012/vitalstatistics.pdf

EMP for the Proposed Product Mix Change Program at VB Medicare Pvt. Ltd, Hosur, Tamil Nadu
Page 79
S.No Panchayat Name Toilet Facilities (BPL)
Toilet Faciliti
es (APL)
Toilet Facilitie
s (APL+B
PL)
School Toilet
Anganwadi Toilet
Sanitary Complex
11 Doripalli 50.5 61.7 54.1 - - -
12 Hosapuram Settipalli 16.7 11.8 13.1 - - -
13 Kamandoddi 15.1 86.7 34.7 14.3 - - 14 Kanalatti 11.6 80.1 28.0 14.3 50.0 - 15 Kattunaikanadoddi 13 79.9 30.4 0.0 - - 16 Kelavarapalli 10.4 35.9 16.0 7.7 100.0 - 17 Koladasapuram 27.5 60.2 54.0 - - - 18 Kommepalli 65.3 63.5 64.7 - - - 19 Kondaganapalli 4.59 9.5 7.6 26.3 100.0 - 20 Kondumaranapalli 32 30.9 31.6 0.0 - - 21 Muthali 10.8 34.2 17.0 18.2 100.0 - 22 Nagondapalli 46.6 42.0 46.0 - - -
23 Nallur 12.1 30.2 16.9 12.5 100.0 - 24 Nandhimangalam 4.98 31.7 9.2 16.7 100.0 -
25 Onnalvadi 39.1 61.4 52.2 - - - 26 Palavanapalli - 45.3 9.6 10.0 100.0 - 27 Perandapalli 59 66.9 62.6 - - - 28 Poonapalli 45.5 43.2 44.1 - - - 29 Sanamavoo 13.5 80.0 31.2 25.0 100.0 - 30 Thorapalliagraharam - 18.7 6.0 28.6 100.0 - 31 Vengatespuram 11.8 79.9 28.3 37.5 - -
BPL- Population under Below Poverty Line, APL – Population Above Poverty Line, Source: Nirmal Bharat Abhiyan, Ministry of Drinking Water and Sanitation-http://tsc.gov.in
Education Indicators
In the study area about 70.68% of the total populations are literates, which is
more than the national literacy rate of 64.8% and state’s literacy rate of
71.84%. In the district 70.3% of the children (aged 7plus) are literate and
99.3% of the girl children (aged 6 to 11) are going to school4
. The literacy
pattern of rural urban scenario is shown in the Figure 5.17.
4 District Level Household Survey (DLHS -3) 2007-08

EMP for the Proposed Product Mix Change Program at VB Medicare Pvt. Ltd, Hosur, Tamil Nadu
Page 80
Figure 5-17:Literacy Pattern in the study area
Source: Census 2011.
Table 5-13: Village-wise Literacy rate in the study Area
S.No Villages Population >6 Years Literates Literacy
Rate
Male Literat
es
Male Literacy Rate
Female Literate
s
Female Literacy
Rate 1 Achettipalli 2698 1861 69.0 1056 76.0 805 61.5 2 Addakurukki 2138 1298 60.7 758 69.1 540 51.9 3 Advanapalli 205 125 61.0 75 70.1 50 51.0 4 Alnatham 299 176 58.9 118 74.7 58 41.1 5 Alur 2680 1794 66.9 1058 75.6 736 57.5 6 Athimugam 3968 2297 57.9 1317 63.7 980 51.6 7 Attur 312 190 60.9 105 63.6 85 57.8 8 Attur-1 599 427 71.3 238 79.1 189 63.4 9 Avalapalli (CT) 15583 13760 88.3 7262 91.5 6498 85.0 10 Badathepalli 657 365 55.6 201 60.5 164 50.5 11 Bairamangalam 4412 3376 76.5 1940 83.9 1436 68.3 12 Begepalli 3318 2661 80.2 1459 86.2 1202 73.9 13 Bukkasagaram 1867 1213 65.0 742 75.6 471 53.2 14 Chenathur 13888 11190 80.6 6809 85.9 4381 73.5 15 Chennasandiram 335 207 61.8 122 70.1 85 52.8 16 Chinnakullu 293 207 70.6 109 75.2 98 66.2 17 Dhasapalli 767 363 47.3 202 53.3 161 41.5 18 Doripalli 3283 2013 61.3 1165 69.3 848 53.0 19 Eluvapalli 1164 743 63.8 434 72.0 309 55.1
20 Govinda Agraharam 3401 2450 72.0 1491 79.4 959 63.0
21 Halekotta 2689 1831 68.1 1071 77.2 760 58.4 22 Hosappuram 3169 2048 64.6 1166 72.0 882 56.9 23 Hosur (M) 102514 89593 87.4 47353 90.9 42240 83.7
70%
88% 77%
91%
62%
84%
Rural Urban
Literacy
Male Literacy
Female Literacy

EMP for the Proposed Product Mix Change Program at VB Medicare Pvt. Ltd, Hosur, Tamil Nadu
Page 81
S.No Villages Population >6 Years Literates Literacy
Rate
Male Literat
es
Male Literacy Rate
Female Literate
s
Female Literacy
Rate 24 Jeemangalam 1012 746 73.7 408 80.0 338 67.3 25 Kalasthipuram 591 458 77.5 273 84.5 185 69.0 26 Kamandoddi 5727 3601 62.9 2093 70.3 1508 54.9 27 Kanimangalam 409 301 73.6 166 79.8 135 67.2 28 Karibasanapuram 4 3 75.0 1 50.0 2 100.0 29 Karupalli 305 181 59.3 113 69.8 68 47.6 30 Kelavarapalli 487 312 64.1 174 67.2 138 60.5 31 Kembasandiram 774 516 66.7 273 69.1 243 64.1 32 Koladasapuram 767 492 64.1 276 71.9 216 56.4 33 Kothagondapalli 4154 2953 71.1 1614 78.0 1339 64.2 34 Kundumaranapalli 3431 2243 65.4 1342 75.7 901 54.3 35 Mathigiri (TP) 20229 17357 85.8 9165 89.4 8192 82.1 36 Midithepalli 1123 630 56.1 369 64.6 261 47.3
37 Mookondapalli (CT) 33795 30143 89.2 16302 92.5 13841 85.6
38 Moranapalli 7859 5842 74.3 3403 81.3 2439 66.4 39 Muthalli 398 222 55.8 132 66.0 90 45.5 40 Nagondapalli 2614 1918 73.4 1110 81.9 808 64.2
41 Naligabetta Agraharam 1133 929 82.0 506 90.2 423 74.0
42 Nallur 4756 3453 72.6 1952 79.8 1501 65.0 43 Nandimangalam 2341 1406 60.1 797 67.8 609 52.3 44 Nanjapuram 572 360 62.9 221 70.6 139 53.7 45 Onalvadi 5897 4443 75.3 2475 82.0 1968 68.4 46 Palavanapalli 982 637 64.9 349 72.4 288 57.6 47 Pathamuthali 866 473 54.6 275 61.4 198 47.4 48 Peddakullu 465 264 56.8 141 59.5 123 53.9 49 Poonapalli 2742 2000 72.9 1111 81.0 889 64.9 50 Punugandoddi 734 482 65.7 267 71.0 215 60.1 51 Sanamavu 3735 2549 68.2 1487 77.8 1062 58.3 52 Siddanapalli 592 303 51.2 170 58.0 133 44.5 53 Subbagiri 575 360 62.6 194 67.6 166 57.6 54 Sudugondapalli 397 217 54.7 128 64.3 89 44.9 55 Thattiganapalli 1086 701 64.5 397 70.0 304 58.6 56 Thiyarandurgam 3680 2245 61.0 1337 69.9 908 51.4
57 Thorapalli Agraharam 8521 6149 72.2 3014 75.8 3135 69.0
58 Venkatesapuram 2548 1655 65.0 960 73.2 695 56.2 59 Viswanathapuram 1580 1387 87.8 741 90.7 646 84.7 60 Zuzuvadi (CT) 28087 24425 87.0 13852 91.4 10573 81.7

EMP for the Proposed Product Mix Change Program at VB Medicare Pvt. Ltd, Hosur, Tamil Nadu
Page 82
S.No Villages Population >6 Years Literates Literacy
Rate
Male Literat
es
Male Literacy Rate
Female Literate
s
Female Literacy
Rate Total /Average 325207 262544 80.7 143839 85.7 118705 75.5
Source: Census 2011.

EMP for the Proposed Product Mix Change Program at VB Medicare Pvt. Ltd, Hosur, Tamil Nadu
Page 83
6. ENVIRONMENT IMPACT PREDICTION
6.1. Introduction
This section presents, the magnitude of environmental emissions and
discharges and associated environmental impacts due to release of
uncontrolled and controlled emissions and discharges from the proposed
facility.
Industrial activities would cause certain degree of environmental impacts, if
proper environmental management plan is not adopted at the design and
operational phases of the project. The primary objectives of environmental
management plan are: (i) to meet the emission and environmental discharge
standards (ii) to minimize the residual un-acceptable environmental impacts,
if any, even after meeting the environmental standards and (iii) to explore
various alternative environmental risk mitigation plans (engineering and
administrative controls).
As part of the Environmental Management Plan, VBM has already considered
to install various pollution control systems to comply with environmental
regulations and guidelines. However, an attempt was made to assess the
residual environmental impacts associated with the controlled discharges of
emissions and other wastes from the facility during construction and
operational phase. Most likely possible increase in point source criteria
pollutant emissions, wastewater and solid waste discharges and demand for
natural resources such as water, fuel and electrical energy have been
assessed under this EIA study.
This section describes the environmental impact by the proposed project.
Impact assessment describes identification and appraisal of various impacts
due to the proposed project. Generally, the Environmental Impacts can be
categorized as either primary or secondary.
• Primary impacts are those, which are attributed directly by the project,

EMP for the Proposed Product Mix Change Program at VB Medicare Pvt. Ltd, Hosur, Tamil Nadu
Page 84
• Secondary impacts are those, which are indirectly induced and typically
include the associated investment and changed patterns of social and
economic activities by the proposed action.
6.2. Impact during Construction Phase
There impacts during the construction is almost nil as the proposed
expansion will be taking place within the existing reactors no new reactors,
heavy equipment will be installed.
Topography- The topography of the existing plant will not be altered as there
will not be any change in layout as there are only minor modifications in the
existing facility within the building. Thus the impact during the construction
is reversible, for short terms and insignificant.
Air Environment- As most of the operations in this proposed product mix
change program are reaction, dissolution and filtration operations there will
be no point source emissions envisaged. The only point source emission in
the existing facility is from GHC plant which releases HCl fumes. The HCl
fumes are treated in wet scrubber before discharging to the atmosphere.
Hence, the impact due to release of emissions is negligible.
Noise Environment- No excavation and foundation works are envisaged.
Construction activity is limited to building only. Hence, no noise related
impacts are envisaged.
Water Environment- The existing infrastructure is adequate and hence no
discharge will be let outside the premises.
6.3. Operation Phase Air Quality Impacts
Under this environmental impact assessment study, both point source and
fugitive emissions have been considered. Point source emissions include

EMP for the Proposed Product Mix Change Program at VB Medicare Pvt. Ltd, Hosur, Tamil Nadu
Page 85
emissions from stacks connected to process units and combustion
installations. Fugitive emissions include vents from process units, storage
tanks and other irregular sources. Project site specific design information has
been adopted for estimating the point and fugitive emission strengths. Basic
information on the pollution control systems and envisaged treated emission
discharge quantities have been obtained from plant records.
6.3.1. Point Source Emissions
No additional sources of emission will arise since there is no proposal for new
installation of air pollution emitting equipments. Contrarily, due to proposed
product mix change program, the steam requirement is to be remain same at
72.4 t/day the coal consumption 12.5 t/day will not be increased.
6.3.2. Fugitive Emissions
There will be no major impact on the air environment as the proposed
product mix change program involves dissolution, filtration, Crystallization
and decantation. However the exiting emissions will not changed.
6.4. Water Demand and Wastewater Generation
As discussed in the previous sections of this report, the management of VBM
has adopted zero liquid discharge schemes in the plant. The fresh water
consumption is maintained 443m3/day. The facility is consented to draw 443
m3/day of water as per SIPCOT Vide Letter no. 16606 dated 10th March 2008.
The adequacy of the existing STP to handle load after proposed product mix
change program activities is presented in Table 6.1.

EMP for the Proposed Product Mix Change Program at VB Medicare Pvt. Ltd, Hosur, Tamil Nadu
Page 86
Table 6-1: Adequacy of STP
Sewage flow after proposed product mix change: 30 m3/day
S.No. Unit Dimensions Existing Adequacy
Adequacy after Proposed product
mix change program
1 Collection sump
2.5m x 2.5m x 1.6m
Retention time: 40 hrs Remarks: Over sized. Compartment shall be created such that the retention time is 8 hours
Retention Time: 8 hours Remarks: Adequate. Blowers of 0.5 KW shall be provided to avoid septic conditions
2 Aeration Tank
4.1m x 4.1m x 2.25m
Hydraulic retention time: 6.3 Days MLSS: 440 mg/l F/M ratio: 0.15 Sludge recycle ratio: complete recirculation Power required for aeration: 2 KW Power required for mixing: 6 KW Remarks: Oversized. Compartment shall be provided to reduce the volume. MLSS shall be increased for efficient operation of the unit. Blower capacity is not adequate for mixing as only 2.2 KW blower is provided.
Hydraulic Retention Time: 30 Hrs MLSS: 2300 mg/l F/M: 0.15 Sludge recycle ratio: 0.22 Power required for aeration: 10.5 KW Power required for mixing: 6 KW Remarks: Blower capacity is not adequate. 12 KW blower shall be installed in place of 2.2 KW blower.
3 Settling Tank 2m x 1.5m Retention Time:14 hours > 4.5 hours Hydraulic Loading Rate: 3.4
Retention Time: 2.5 hours Hydraulic Loading Rate:17 m3/m2/day

EMP for the Proposed Product Mix Change Program at VB Medicare Pvt. Ltd, Hosur, Tamil Nadu
Page 87
S.No. Unit Dimensions Existing Adequacy
Adequacy after Proposed product
mix change program
m3/m2/day < 17 m3/m2/day Remarks: Insufficient Solids Loading Rate: 3 kg/m2/day < 25 kg/m2/day Remarks: Oversized. Insufficient HLR and SLR.
Solids Loading Rate: 44 kg/m2/day Remarks: Adequate
4 Filter Feed Tank
2m x 2m x 2m
Retention Time: 32 hrs Remarks: Over sized. Compartment shall be created such that the retention time is 8 hours
Retention Time: 6 hrs Remarks: adequate
5 Treated water collection tank
2m x 2m x 2m
Retention Time: 32 hrs Remarks: Over sized. Compartment shall be created such that the retention time is 8 hours
Retention Time: 6 hrs Remarks: adequate
6 Dual media filter
0.6m Φ x 2m
Feed pump capacity: 12 m3/day Filtration duration: 30 mins Remarks: Adequate
Feed pump capacity: 12 m3/day Filtration duration: 2 hrs 30 mins Remarks: Adequate
The STP adequacy indicates that it is oversized for the current flow, whereas
it is adequate to treat additional sewage after proposed proposed product mix
change program. Hence, no major modifications are required other than

EMP for the Proposed Product Mix Change Program at VB Medicare Pvt. Ltd, Hosur, Tamil Nadu
Page 88
installing 0.5 KW blower in collection tank and 12 KW blower in the aeration
tank.
The details of various streams of effluent being generated from the
manufacturing process and treated in two different ETP at the existing facility
is depicted in Figure 6.1.
Figure 6-1: Layout Showing Effluent Generation and Treatment Scheme after the Proposed product Mix Change Program
(All values are in m3/day)
There will be no increase in wastewater generated from the proposed
product mix change program. So, the existing ETP is adequate for
handling the loads. Table 6.2 and Table 6.3 present the adequacy of the
ETP.
DL-Lysine Acetyl Salicyate
7-Methyl Xanthine
Bentonite
ETP-1 & 2
0.012m3/day
0.91m3/day
0.42 m3/day
1.32 m3/day
Wastewater generated from proposed expansion

EMP for the Proposed Product Mix Change Program at VB Medicare Pvt. Ltd, Hosur, Tamil Nadu
Page 89
Table 6-2: Adequacy of ETP-1
S. No. Unit Dimensions Existing Adequacy
Adequacy after Proposed product
mix change program 1 Oil and
Grease Trap 3m x 2.3m x
2.05m Retention Time: 17 hrs
Retention Time: 5.2 hrs Unit is adequate
2 Collection Tank
3.05m x 2.2m x 2.3m
Retention Time: 18.5 hrs Unit is adequate
Retention Time: 5.6 hrs Unit is adequate.
3 Reaction Tank
5m x 4.4m x 2m
Retention Time: 53 hrs
Retention Time: 16 hrs
4 Primary Settling Tank
5.8m x 3.9 m x 3.5m
Retention Time: 95 hrs Surface Loading Rate: 0.88 m3/m2/day
Retention Time: 29 hrs Surface Loading Rate: 3 m3/m2/day Unit is adequate
5 Anaerobic Tank
6m x 3.9m x 3.5m
Retention Time: 98 hrs
Retention Time:30 hrs Unit is adequate
6 Aeration Tank I
6m x 5.9m x 3.5m
Retention Time: 148 hrs
Retention Time: 45 hrs
7 Aeration Tank II
6m x 1.9m x 3.9m
Retention Time: 53 hrs
Retention Time: 16 hrs
8 Clarifier 2.3m x 2.05m
Retention Time: 10 hrs Surface Loading Rate: 5 m3/m2/day
Retention Time: 3 hrs Surface Loading Rate: 15 m3/m2/day Unit is adequate
9 Treated effluent tank
3.7m x 3.7m x 2m
Retention Time:32 hrs
Retention Time: 10 hrs
10 RO Plant 3 m3/hr Working Hours: 15 hours Unit is adequate
Working hours: 22 hours Unit is adequate
11 RO Reject Tank
3.7m x 2.3 m x 2 m
Retention time: 9 hrs Unit is adequate
Retention time: 6 hrs Unit is adequate
12 RO Permeate Tank
4 m x 3.7m x 1.8 m
Retention time: 14 hrs Unit is adequate
Retention time: 9 hrs Unit is adequate

EMP for the Proposed Product Mix Change Program at VB Medicare Pvt. Ltd, Hosur, Tamil Nadu
Page 90
Table 6-3: Adequacy of ETP-2
S.No. Unit Dimensions Existing Adequacy
Adequacy after Proposed product
mix change program 1 High TDS
Effluent Collection Tank
10m x 4m x 2.25m
Retention Time: 17 hrs
Retention Time: 40 hrs Retention time is too long. The unit shall be partitioned to reduce the volume to 30 m3/hr to avoid settling of solids.
2 High TDS Effluent Settling Tank
10m x 8m x 1.2
Retention time: 18 hrs Unit is adequate
Retention time: 41 hrs Unit is adequate
3 MEE 7 m3/hr Working Hours: 18 hours Unit is adequate
Working Hours: 8 hours Unit is adequate
6.4.1. Solid and Hazardous Waste Generation
The solid waste generated from the facility is packing waste and fly ash.
Packing waste is being disposed to recyclers. Due to the operation of 10 T/hr
coal fired boiler, 35 T/day of ash is be generated the same will be disposed to
fly ash brick manufacturers. The quantity of the fly ash remains the same as
the coal consumption will not be increased.
Hazardous waste such as chemical sludge and MEE residue is being
generated from the existing facility and the same will be generated due to
proposed product mix change program mix change program. All the
hazardous waste generated will be collected in drums and stored in the
existing hazardous waste storage shed. The hazardous waste storage shed
has impervious floor with dykes and connected to ETP. The hazardous waste
will be stored based on chemical compatibility chart and disposed to Tamil
Nadu Waste Management Limited (TWML), Gummudipoondi, Chennai. The
details of solid and hazardous waste generation are presented in Table 6.4.

EMP for the Proposed Product Mix Change Program at VB Medicare Pvt. Ltd, Hosur, Tamil Nadu
Page 91
6.4.2.Predicted Impacts on Ecology
Impacts on Flora
• Ecologically sensitive areas like reserve forests are located 5 to 10 km
away from project site.
• No emissions other than boiler are predicted in the plant and no
increase in overall emission is envisaged. Hence; no direct impacts on
ecologically sensitive areas are envisaged.
• Treated wastewater will not be discharged in surface water bodies. The
treated water will be reused for developing the greenbelt hence, no
impacts on aquatic flora is envisaged.
• Greenbelt is already developed for 31000 m2 (52% of total land). This
has helped to enhance the diversity.
Impacts on Fauna
• The mammalian faunal density in this region is very low and no further
impact is expected on fauna.
• No migratory bird routes are identified at SIPCOT.
• Schedule I species of avifauna were not observed around project site.
Impacts due to noise generation and vehicular movement will be
confined to project area and may not disturb fauna in reserve forest.
6.5. Summary of Impacts
The overall summary of the impacts is given below in Table 6.4. The table
below indicates the reduction in steam requirement, coal consumption, water
consumption, wastewater generation and hazardous waste generation in spite
of increase in production capacity and addition of new products. Hence, no
adverse impacts on the environment due to proposed product mix change
program scheme are envisaged.

EMP for the Proposed Product Mix Change Program at VB Medicare Pvt. Ltd, Hosur, Tamil Nadu
Page 92
The unit has proposed to reduce the production quantity of Trichloro Galacto
Pyranosyl Fructo Furanoside (TGPF) from 72 TPA to 61 TPA and Tocopheryl
Polyethylene Glycol Succinate (TPGS) quantity from 72 TPA & 60 TPA.
Further unit has proposed to add three products i.e DL-Lysine acetyl
salicylate (6 TPA), 7-Methyl Xanthine (5 TPA) and Bentonite (12 TPA) by
maintaining the same production capacity of 564 TPA which was consented
as per earlier EC vide letter no. J-11011/65/2013, dated 16th May 2015.
However, the water, wastewater, steam consumption and Hazardous waste
will not be increased from the earlier EC dated 2015.The same is presented in
the Table 6.4

EMP for the Proposed Product Mix Change Program at VB Medicare Pvt. Ltd, Hosur, Tamil Nadu
Page 93
Table: 6.4 Details of the Existing and Proposed Production, Water Consumtion & Hazardous waste generation
Product
Annual Production capacity –
(TPA)
Rated monthly
production capacity (Tons)
Steam requirement
Coal consumption for boiler
Water consumption
Wastewater generation
Total solvent
consumption (Lts/day)
Hazardous waste
generation (Kg/day)
T/day T/day m3/day m3/day EC 2008 scenario
GHC 240 20 12 2 36 20 25.6 116 TGPF 72 6 30 5 372 149 950 2100 MEE - - 40 7 - - - - Total 312 26 82 14 408 169 975.6 2216
EC 2015 Current scenario GHC 240 20 12 2 36 20 25.6 116 TGPF 72 6 Not required Not required 0.2 0.06 Not required 6 DHA 180 15 34.4 6 259 101 1668 1745 TPGS 72 6 6 1 4 4 200 62 MEE - - 20 3.5 - - - Total 564 47 72.4 12.5 299.2 125.06 1893.6 1929
Current proposal (2016 TOR Application) GHC 240 20 12 2 36 20 25.6 116 DHA 180 15 34.4 6 259 101 1668 1745 TGPF 61 5 Not required Not required 0.2 0.04 Nil 5 TPGS 60 5 4.5 0.72 3 3 166 50
DL-Lysine acetyl
salicylate 6 0.5 0.2 0.04 0.043 0.012 13 9.13
7-methyl Xanthine 5 0.41 0.9 0.17 0.91 1.40 12 3.73
Bentonite 12 1 0.4 0.07 0.45 0.056 Not required Nil MEE - - 20 3.5 - - - - Total 564 46.91 72.4 12.5 299.55 125.51 1884.6 1928.87

EMP for the Proposed Product Mix Change Program at VB Medicare Pvt. Ltd, Hosur, Tamil Nadu
Page 94
6. ENVIRONMENTAL MANAGEMENT PLAN
6.1. Preamble
The Environment Management Plan (EMP) is required to ensure sustainable
development in the area of the project site. EMP is aimed at mitigating the
possible adverse impact of a project and for ensuring to maintain the
environmental quality. The EMP converses all aspects of planning,
construction and operation of the project, which are relevant to environment.
The main objective of the EMP is to identify the project specific activities that
would have to be considered for investigation of the significant adverse
impacts and the mitigation measures required. Hence, an all encompassing
plan is envisaged.
Environment Management Plan during Construction Phase
• The proposed product mix change will take place at the existing facility
and no additional land is required. Also, all existing infrastructure and
utilities are adequate. No additional systems will be installed.
• There is no digging and excavation required for the proposed product
mix change program.
• Most of the construction materials like soil, bricks, concrete will be
reused in backfilling, road construction, sub-grade preparation etc.
within the plant area
• Unusable construction waste, such as damaged pipes, from work and
other construction material, must be disposed off to municipal landfill
site.
6.2. Environment Management Plan during Operation Phase
During operation phase, the impacts on various environmental attributes
should be mitigated using appropriate pollution control equipment. The
Environment Management Plan prepared for the proposed product mix

EMP for the Proposed Product Mix Change Program at VB Medicare Pvt. Ltd, Hosur, Tamil Nadu
Page 95
change project aims at minimizing the pollution at source. Operational phase
environmental management plan includes the following:
1. Land use
2. Air quality Management Plan,
3. Noise Management Plan,
4. Water and Wastewater Management,
5. Solid and Hazardous Waste Disposal Management,
6. Management of Storage and Handling of Materials
7. Development of green belt
8. Community Development Plan
6.2.1. Land Use
The proposed project is located within the well-demarcated industrial estate.
The plant is proposed in an existing unit, hence proposed product mix change
program project has no change of usage of the area and no such impact on
land use is expected. About 31,000m2 (52% of total land) of land was
developed under plantation and green belt in the existing facilities. No change
in greenbelt area is envisaged in the proposed product mix change program
project.
6.2.2. Air Quality Management Plan
No new fossil fuel emission sources are added for the proposed product
mix program.
Indonesian coal is being procured from the local suppliers and is used
as a primary fuel in the boiler. Briquettes are also used as
supplementary fuel in the boiler. Similar practices will be performed
after proposed product mix change program.
Since, no additional fuel will be fired, the stack height provided for
existing boiler and DG set is adequate.

EMP for the Proposed Product Mix Change Program at VB Medicare Pvt. Ltd, Hosur, Tamil Nadu
Page 96
Cyclone and bag filter are installed to control the particulate matter
emissions from the boiler. Due to reduction in the consumption of coal
after proposed product mix change program, no additional dust load on
existing bag filers are envisaged.
Coal is stored in covered shed in the existing facility and a dedicated
coal crusher with bag filter system in operation to cater to the coal
requirement of the boiler
Water sprinkling systems are provided near the coal handling areas
including transfer points
Online VOC sensors are placed near solvent storage areas.
The sprinkling of water will be done along the internal roads in the
plant in order to control the dust arising due to the movement of
vehicular traffic;
6.2.3. Noise Management Plan
The existing DG sets are provided with acoustic enclosures and hence
the noise levels is below 85dB (A)
Compressors are located in closed room to avoid noise transmission to
other production areas.
No additional noise generating equipment will be installed under
proposed product mix change program scheme.
Ear plugs/muffs is being provided to workmen working near high noise
generating sources in the existing plant and similar practices will be
continued.
6.2.4. Water and Wastewater Management
The facility treats the effluents generated in dedicated ETP. The overall
effluent load from the plant will remain within the design capacity and
consent capacity. Hence, no additional ETP infrastructure will be required. A
dedicated team is operating the ETP.

EMP for the Proposed Product Mix Change Program at VB Medicare Pvt. Ltd, Hosur, Tamil Nadu
Page 97
6.2.5. Storm water Management
It has been proposed to use the existing rainwater harvesting system to
collect and recharge the groundwater. Based on the long-term monsoon data
published by Indian Meteorological Department for the Bangalore region, it
has been reported that the average annual precipitation occurs to be 880.9
mm out of which around 570 mm occurs during monsoon period (July to
October). The rainfall data for Bangalore region is given in Table 7.1. Based
on the assumption with a runoff coefficient of 0.65, it has been estimated that
about 22200 m3 of rainwater runoff would be generated from the plant site
and the corresponding average daily runoff during the rainy-days would be in
the order of 635 m3/day.
Table 6-1: Rainfall Data for Bangalore Region
Month mm/month Rainy Days
Jan 1.8 0.0
Feb 7.6 0.4
Mar 14.0 0.8
Apr 40.0 2.8
May 94.4 6.0
Jun 80.5 5.0
Jul 102.7 7.4
Aug 116.6 9.3
Sep 195.6 9.6
Oct 152.0 8.7
Nov 58.4 4.1
Dec 17.3 1.5
Total 880.9 55.7
Source: Climatological Normals, 1971- 2000, India Meteorological Department
The storm water in the project area will be collected through existing storm
water drains. It is ensured that the storm water will not be mixed with

EMP for the Proposed Product Mix Change Program at VB Medicare Pvt. Ltd, Hosur, Tamil Nadu
Page 98
process effluents as they have a separate closed conduit system. Rainwater
harvesting system is also provided to recharge the ground water and the rain
water is also collected through the restoration pond with the capacity of 30
m3. The excess storm water will be connected to the SIPCOT main storm
water drain and finally confluence to a nearby lake.
6.2.6. Solid and Hazardous Waste Disposal Management
Spent charcoal and spent silica, generated from the filtration process of
manufacturing stream is the major hazardous waste generated from the
facility. All hazardous wastes are collected and disposed through authorized
hazardous waste disposal facility. Biological sludge from ETP and STP will be
used as manure for plantation. Fly ash from the boiler is sold to the local
Brick Manufactures. Details of the solid and hazardous waste generation and
disposal method are discussed in Section 5.
The facility is consented to dispose about 42 T/year of chemical sludge from
Waste water treatment and 884 T/year of mechanical evaporator Residue as
per the TNPCB vide Authorization No. 3212. About 704 TPA of hazardous
waste will disposed to Tamil Nadu Waste Management Limited, located at
SIPCOT, Gummudipoondi will be disposed after proposed product mix change
program. Necessary membership in the Tamil Nadu Waste Management
Limited has been obtained.
6.2.7. Management of Storage and Handling of Solvents
Dedicated and isolated solvent storage area is located in the existing
facility. Necessary permits from Petroleum and Explosives Safety
Organization (PESO) has been obtained for storage of solvents. No
additional solvent storage tanks will be installed.
Fire hydrant lines and foam systems are made available at all the
four corners of the storage area and then dykes are designed as per
National Building Codes.

EMP for the Proposed Product Mix Change Program at VB Medicare Pvt. Ltd, Hosur, Tamil Nadu
Page 99
Water sprinklers are installed as per the good engineering practices
for all the solvent storage tanks.
A dedicated fire water tank of capacity of 300m3 is located near the
fire water pump room. A central fire hydrant system is in place in
the existing facility.
6.2.8. Development of Green Belt
Over an area of 6 Ha (60000 sq. m), 31,000 m2 (52% of total land) of land was
already developed under plantation and green belt. Hence, further plantation
area is not envisaged and measures shall be taken to sustain the greenbelt
developed.
6.2.9. Socio Economic Aspects and CSR Plan
The project site is located within the SIPCOT area which is designated for the
industries and there is no human settlement adjacent to the project site. The
proposed project is within the existing plant premises and doesn’t displace
any human settlements. Due to the proposed product mix change program,
there are no visible adverse impacts on socio-economy. In respect to the
positive impacts the project will be providing direct and indirect employment
for 50 people within the project during both construction and operation
phase.
6.2.10. CSR Programs
The key CSR plan is discussed hereunder. These areas of development were
arrived based on the existing socioeconomic status and key findings and feed
backs from the primary survey. The CSR budget allotted for the proposed
proposed product mix change program of the project is around Rs.10 lakhs/
year. The same will be continued after proposed product mix change program.

EMP for the Proposed Product Mix Change Program at VB Medicare Pvt. Ltd, Hosur, Tamil Nadu
Page 100
Areas for Development
• Skill Development Programs
Providing Training programs relating to Industrial Jobs to the
eligible candidates
• Health Programs
Awareness Programs on various diseases
Awareness on HIV/AIDs
• Conducting Health Camps
6.3. Environmental Monitoring Plan
To strictly adhere to the commitment made in the EIA report and also to
comply with Tamil Nadu Pollution Control Board norms, the EHS manager
will undertake regular monitoring of emissions, discharges and solid waste
disposal during the operation phase. In addition, regular inspection and audit
to be conducted as per the consent conditions mentioned in Consent to
Operate (CTO) given by Tamil Nadu Pollution Control Board. Environmental
monitoring program is presented in Table 6.2.
Table 6-2: Existing Environmental Monitoring Schedule during Operation Phase
S.No Location Monitoring Frequency
Duration of Sampling
Important Monitoring Parameters
1 Ambient Air Quality Monitoring
a Project site Once in Six
Months
24hr continuously except CO
PM10, PM2.5, SO2, NO2 & CO
2 Stack Monitoring
a Boiler Stack
Online Monitoring connected to SPCB
Every 15 min data communication connected to SPCB.
SO2, NO2, PM, CO, CO2, VOC, Temperature, Flow rate & Velocity of the gas
b DG Set – Stack
Once in a Year
30 min SO2, NO2, SPM, CO, CO2, Temperature, Flow rate & Velocity of the gas
3 Ambient Noise Level

EMP for the Proposed Product Mix Change Program at VB Medicare Pvt. Ltd, Hosur, Tamil Nadu
Page 101
S.No Location Monitoring Frequency
Duration of Sampling
Important Monitoring Parameters
a Near DG set and noise generating equipments
Once in a 6 Months
8 hr continuous with 1 hr interval
Noise level in dB(A)
4 Ground/Drinking Water Quality Monitoring a Ground Water
– at project site
Once in a year
Grab Sampling Parameters specified under IS:10500, 1993
5 Effluent & Sewage Quality Monitoring a ETP & STP
Inlet Once in a
Week Grab Sampling Physical, Chemical &
Biological Parameters specified under IS:2490:1982
b ETP & STP Outlet
6 Soil Quality a At the green
belt area Once in a year
Samples were collected from three different depths viz., 30cm, 60cm, and 100cm below the surface
Parameter for soil quality: pH, texture, electrical conductivity, organic matter, nitrogen, phosphate, sodium, calcium, potassium and Magnesium.
6.3.1. Data Analysis
The monitored data need to be analyzed and compared with the baseline
levels as established in the EIA study and the regulatory standards specified
by different government agencies. The standards against which the different
environment components will be compared are as per Table 6.3.
Table 6-3: Standard for Environmental Monitoring Plan
S.No. Component Applicable Standards
1 Ambient air Quality
National Ambient Air Quality Standards, CPCB
2 Noise quality Ambient Noise Standards, CPCB
3 Ground water quality
IS:10500 Standards, BIS
4 Soil Quality - 5 Treated Effluent IS 2490(1974) – Discharge into

EMP for the Proposed Product Mix Change Program at VB Medicare Pvt. Ltd, Hosur, Tamil Nadu
Page 102
surface water, IS 3306(1974) – Discharge on land, IS 3307(1974)-Discharge for agricultural use
6.4. Environmental Management Cell
The environmental management cell consists of a EHS manager. He reports
directly to the Plant Director. The major duties and responsibilities of EHS
manager is as follows:
• To implement the Environmental Management Plan.
• To ensure regular operation and maintenance of pollution control
devices.
• To assure regulatory compliance with all relevant rules and
regulations.
• To minimize environmental impacts of operations by strict adherence
to the EMP.
• To initiate environmental monitoring as per approved schedule.
• Review and interpretation of monitored results and corrective
measures in case monitored results are above the specified limit.
• Maintain documentation of good environmental practices and
applicable environmental laws as ready reference.
• Maintain environmental related records.
• Coordination with regulatory agencies, external consultants and
monitoring laboratories.
• Maintaining log of public complaints and the action taken.
6.5. Budgetary Cost Estimates for Environmental Management
At present towards the pollution control equipment, implementation of
environmental pollution control measures and environmental management
programs. Break-up of the budget for the proposed environmental management

EMP for the Proposed Product Mix Change Program at VB Medicare Pvt. Ltd, Hosur, Tamil Nadu
Page 103
programs are presented in Table 6.4. The same will
Table 6-4: Budget for Environmental Management Plan
S.No. Resources Capital Cost (Rs. in Lakhs )
Recurring Cost (Rs. In Lakhs )
1 Air & Noise Pollution Control systems 15 3
2 Wastewater Treatment facilities 8 2
3 Process safety & Fire Safety protection systems 6 0.5
4 Environmental Monitoring and Management Programs 8 8
5 Road, Drainage & Rainwater harvesting 2 0.25
Total 39 13.75

EMP for the Proposed Product Mix Change Program at VB Medicare Pvt. Ltd, Hosur, Tamil Nadu
Page 104
7. PROJECT BENEFITS
India ranks 3rd in terms of volume and 14th in terms of value among the drug
manufacturing countries worldwide.
Indian companies have the distinction of developing cost-effective
technologies for manufacturing bulk drugs and intermediates, conforming to
global standards. It is anticipated that the proposed project will provide
benefits during the operational stage.
The major benefit due to the proposed project will be in the sphere of
generating temporary employment for substantial number of personnel. In
addition to the direct employment, the project would generate additional
employment to service organizations for material handling in the plant, etc.
Considering that most of the skilled personnel proposed to be employed for
the proposed project would be from outside the study area and unskilled/
semiskilled personnel shall be from within the study area, the proposed
project would add to the population in the study area which results in
better scope for indirect employment etc., in addition to the workforce
the indirect employment also be generated for about 20 members or even
more.

EMP for the Proposed Product Mix Change Program at VB Medicare Pvt. Ltd, Hosur, Tamil Nadu
Page 105
8. Conclusion
1. The unit has proposed to reduce the quantity of existing products i.e.,
Trichloro Galacto Pyranosyl Fructo Furanoside (TGPF) from 72 TPA to
61 TPA and Tocopheryl Polyethylene Glycol Succinate (TPGS) quantity
from 72 TPA & 60 TPA.
2. The unit has proposed to add three new products i.e DL-Lysine acetyl
salicylate (6 TPA), 7-Methyl Xanthine (5 TPA) and Bentonite (12 TPA) by
maintaining the same production capacity of 564 TPA which was
consented as per earlier EC vide letter no. J-11011/65/2013, dated
16th May 2015.
3. This project will have beneficial effects in terms of growth and
development of the regional economy.
4. Air Emission control measures like Wet scrubber, Bag filter are
provided in stacks to minimise the environmental impact.
5. No additional land, building or infrastructures including reactors,
equipments will be required for the proposed Product mix program.

EMP for the Proposed Product Mix Change Program at VB Medicare Pvt. Ltd, Hosur, Tamil Nadu
Page 106
9. Disclosure of Consultant
9.1. Introduction The Environment Management Plan (EMP) report has been prepared by
carrying out various scientific studies in the year 2014. The studies have been
carried out by M/s Cholamandalam MS Risk Services Limited, Chennai,
India. The profiles of the Consultants are given below
9.2. Cholamandalam MS Risk Services Limited – EIA Consultant
M/s Cholamandalam MS Risk Services Ltd (CMSRSL) is a joint venture
between the Murugappa group, India and Mitsui Sumitomo Insurance Group,
Japan. CMSRSL is an ISO 9001:2008 certified company. CMSRSL offers
safety and environmental consulting services across Indian, Middle East and
East Asian countries. CMSRL consists of six consulting domains such as
environmental engineering and management, process safety, fire safety,
electrical safety, construction safety and logistics risk assessment. CMSRSL is
a NABET accredited EIA consulting organization for undertaking EIA studies
in the following sectors: paper and pulp, thermal power plants, petroleum
refineries, petrochemical complex, chemical fertilizers, synthetic organic
chemical industries, ports and harbours and area development projects.
CMSRSL has offered environmental and safety related consulting services for
more than 5000 clients during last decade.
9.2.1.Details of Experts/Consultants Engaged for this EIA Study
Details of Experts/Consultants Engaged for this EIA/EMP Study is given
below in Table 9.1 and NABET certificate is given in Figure 9.1.

EMP for the Proposed Product Mix Change Program at VB Medicare Pvt. Ltd, Hosur, Tamil Nadu
Page 107
Table 9-1: Experts Involved
S. No. Name Role in the EIA Study 1 Mr V S Bhaskar EIA Coordinator – Pulp & paper industry and
Thermal Power Plants. Functional Area Expert(FAE) - Meteorology, Air Quality Modelling and Prediction Functional Area Expert (FAE) - Water Pollution Prevention, Control & Prediction of Impacts Functional Area Expert (FAE) - Noise / Vibration Functional Area Expert (FAE) – Risk & Hazards Management
Other Technical Team Members
S.No. Name Role in the EIA Study
1. Mr. A.Ravi Team Member- FAE/Associate EC
2. Mr. Ganta Srikanth Team Member-Functional Area Associate
3. Ms Saumya Abraham Team Member-Functional Area Associate

EMP for the Proposed Product Mix Change Program at VB Medicare Pvt. Ltd, Hosur, Tamil Nadu
Page 108
Figure 9-1: NABET Certificate

Annexure-1
Environmental Clearance Copy


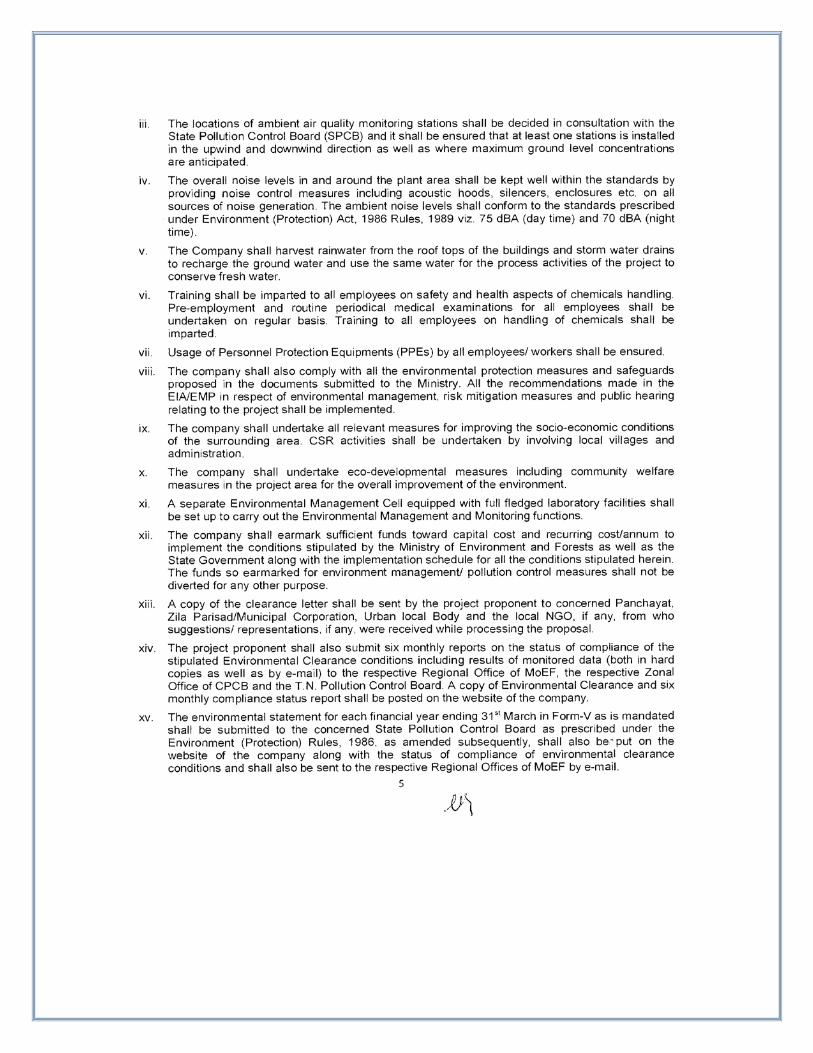


Annexure-2
Consent to Operate Copy


Annexure-3
DG Stack Report


Annexure-4
Ambient Noise level Report

Annexure-5
Treated water Test Report

Copyright © 2022 FDOKUMEN

