


Bahasa
Halaman
Hukum

UNIVERSITY OF CALIFORNIA RIVERSIDE
Vesicular Horizon Distribution, Properties, and Pedogenic Processes in Deserts of the Western United States
A Dissertation submitted in partial satisfaction of the requirements for the degree of
Doctor of Philosophy
in
Soil and Water Sciences
by
Judith Katherine Turk
March 2012 Dissertation Committee: Dr. Robert C. Graham, Chairperson Dr. Christopher Amrhein Dr. Katherine Kendrick

Copyright by Judith Katherine Turk
2012
The Dissertation of Judith Katherine Turk is approved:
____________________________________________________________
____________________________________________________________
____________________________________________________________ Committee Chairperson
University of California, Riverside
iv
ACKNOWLEDGEMENTS
I would like to acknowledge my advisor, Dr. Robert Graham, and committee
members, Dr. Christopher Amrhein and Dr. Katherine Kendrick, for their guidance with
the project. I am greatly indebted to several friends who helped me in the field, including
Shahriar Uddin, Christina Conn, Myles Davis, and Nathan Bailey. I would like to thank
Dr. Brenda Buck and Dr. Patrick Drohan for their helpful reviews of my SSSA paper,
included here as Chapter 2. I am thankful to Myles Davis, Peter Homyak, and Annie
Rossi for many helpful discussions about the work. I’d like to thank Tricia Menchaca for
her help interpreting the lithology of the desert pavements and Nicole Pietrasiak for
sharing her description of the Clark Mountains soil with me, and for including me in her
permit application to work at this site. I would like to thank Woody Smith, who
conducted the ICP analysis of the soil extracts, and Dr. Scott Bradford for allowing me to
use the laser particle-size analyzer at the USDA Salinity Laboratory. Computed
tomography scans were produced by the University of Texas High-Resolution X-Ray
Computed Tomography Facility and funding for the CT scanning was provided by the
National Science Foundation. Other funding for the project was provided by the USDA-
NRCS, and I would especially like to thank Dave Smith, California State Soil Scientist,
for his support of this work.
The text of this dissertation, in part or in full, is a reprint of the material as is
appears in the Soil Science Society of America Journal [“Distribution and properties of
vesicular horizons in the western United States”, Jul.-Aug. 2011]. The co-author (Robert
C. Graham) listed in that publication directed and supervised the research which forms

v
the basis for this dissertation. This article is reprinted with permission from the Soil
Science Society of America.
vi
DEDICATION
This dissertation is dedicated to my husband, Shahriar, I could not have
completed work without his support. I would also like to recognize my friends at UCR
who have made my graduate school experience a fun one, especially the Broadbent crew:
Nathan Bailey, Megs Gendreau, Catherine Gibbons, Tony Ly, and Annie Rossi. Lastly, I
would like to thank my parents, Greg and Kathy Turk who first inspired me to take an
interest in science.
vii
ABSTRACT OF THE DISSERTATION
Vesicular Horizon Distribution, Properties, and Pedogenic Processes in Deserts of the Western United States
by
Judith Katherine Turk
Doctor of Philosophy, Graduate Program in Soil and Water Sciences University of California, Riverside, March 2012
Dr. Robert C. Graham, Chairperson
Vesicular horizons are common surface horizons in arid and semi-arid lands and
are characterized by the prevalence of nearly spherical, non-interconnected vesicular
pores. They regulate surface hydrology in water-limited ecosystems, but are easily
disrupted by human land-use. In order to interpret potential changes to vesicular horizon
distribution and properties in response to land-use and climatic change, we need to know
more about the current distribution of vesicular horizons and how they are formed. The
objectives of this dissertation are to: 1) evaluate the distribution and properties of
vesicular horizons across the western U.S., 2) determine how disturbance and recovery of
vesicular horizons impacts their pore morphology and hydraulic properties, and 3)
determine the influence of microbial respiration and thermal expansion of gases on
vesicular pore formation. The methods used in this research include analysis of soil
databases, examination of vesicular horizon recovery from disturbance in the field,
creation of vesicular pores in the lab, and X-ray computed tomography analysis of soil
viii
pores. Our results show that vesicular horizons cover 156,000 km2 of the western U.S.
and are best expressed in the cold deserts (i.e., Central and Northern Basin and Range)
relative to the warm deserts (i.e., the Sonoran and Mojave Deserts). We observed that
vesicular horizons recover rapidly from disturbance, both in artificially disturbed soils
and in tire tracks, and that the rate of recovery is dependent on the frequency of
precipitation during the recovery period. Disturbance does not severely alter the
hydraulic properties of the vesicular horizon, but leads to a slight reduction in Ksat and
Gardner’s α. In the lab, we found evidence that both biotic and abiotic processes are
involved in vesicular pore formation; however, the role of thermal expansion of gases in
growth of the vesicular pores was not supported. Through this work we have found that
vesicular horizons occur extensively throughout arid and semi-arid regions of the western
U.S. Vesicular horizon formation and recovery from disturbance is dependent on
climatic conditions (e.g., precipitation frequency, soil temperature), biological factors
(e.g., shrub cover, microbial respiration), and their interactions.
ix
TABLE OF CONTENTS
1. INTRODUCTION..........................................................................................................1
References .......................................................................................................................4
2. DISTRIBUTION AND PROPERTIES OF VESICULAR HORIZONS IN THE
WESTERN UNITED STATES .........................................................................................7
Abstract ...........................................................................................................................7
Introduction ....................................................................................................................8
Materials and Methods ................................................................................................17
Analysis of soil databases ...........................................................................................17
Development and application of vesicular horizon index ..........................................18 Analysis of weather records .......................................................................................21
Results and Discussion .................................................................................................24
Distribution and range of properties ...........................................................................24
Vesicular horizon index ..............................................................................................28 VHI relation to ecoregions of the Basin and Range Province ....................................36
VHI relation to other soil properties ...........................................................................41
Summary and Conclusions ..........................................................................................44
References .....................................................................................................................46
3. DISTURBANCE AND RECOVERY OF VESICUALR HORIZON POROSITY
AND HYDRAULIC PROPERTIES UNDER FIELD CONDITION .........................53
Abstract .........................................................................................................................53
Introduction ..................................................................................................................54
Materials and Methods ................................................................................................62
Field methods .............................................................................................................62
Study sites ...................................................................................................................64 Laboratory methods ....................................................................................................71
Data analysis ...............................................................................................................72
Results and Discussion .................................................................................................81
Pore morphology of pre-disturbance vesicular horizons ............................................81
Recovery of vesicular horizons following disturbance ..............................................83
x
Rate of vesicular horizon recovery following disturbance .........................................92
Impacts of pre-existing disturbance on vesicular horizon morphology .....................99
Impacts of disturbance on hydraulic properties........................................................111
Summary and Conclusions ........................................................................................116
References ...................................................................................................................118
4. MECHANISMS OF VESICULAR PORE FORMATION IN DESERT SOILS 126
Abstract .......................................................................................................................126
Introduction ................................................................................................................127
Materials and Methods ..............................................................................................132
Sampling and laboratory characterization ................................................................132
Vesicular pore formation and analysis .....................................................................134 Microbial respiration treatments...............................................................................136
Temperature treatments ............................................................................................138
Statistical analysis ....................................................................................................138
Results and Discussion ...............................................................................................139
Effect of microbial respiration on vesicular pore formation ....................................139
Effect of thermal expansion on vesicular pore formation ........................................144
Summary and Conclusions ........................................................................................152
References ...................................................................................................................153
5. CONCLUSIONS .......................................................................................................160
APPENDIX A. SOIL DESCRIPTIONS .....................................................................164
References ...................................................................................................................195
APPENDIX B. DERIVATION OF VOLUMETRIC LOBATION RATIO
FORMULA (EQ. 3.1) ...................................................................................................196

xi
LIST OF TABLES
Table 2.1. Infiltration rates of vesicular and non-vesicular soils .......................................11
Table 2.2. Influence of drying period on calculation of ΔT and precipitation events .......23
Table 2.3. Chemical properties of vesicular horizons ........................................................29
Table 3.1. Age of tire tracks ...............................................................................................66
Table 3.2. Study sites .........................................................................................................69
Table 3.3. Weather station and climate data ......................................................................70
Table 3.4. Laboratory characterization data of vesicular horizons at each study site .......93
Table 3.5. Estimation of vesicular horizon recovery time .................................................96
Table 4.1. Laboratory characterization data of soil material used to recreate vesicular
pores in the lab .................................................................................................................133
xii
LIST OF FIGURES
Fig. 2.1. Photograph of vesicular horizon ............................................................................9
Fig. 2.2. Global distribution of studies recognizing vesicular horizons ............................10
Fig. 2.3. Processes of vesicular horizon formation ............................................................14
Fig. 2.4. Distribution of vesicular horizons in the western U.S. ........................................20
Fig. 2.5. Laboratory-determined textures of vesicular horizons ........................................27
Fig. 2.6. Evaluation of vesicular pore terms ......................................................................31
Fig. 2.7. Method for calculation of vesicular horizon index ..............................................33
Fig. 2.8. Vesicular horizon index as a function of soil age ................................................34
Fig. 2.9. Vesicular horizon index of soils grouped by ecoregion ......................................37
Fig. 2.10. Climate analysis of ecoregions ..........................................................................39
Fig. 2.11. Vesicular horizon index of soils grouped by temperature regime, soil order, and
texture ................................................................................................................................42
Fig. 3.1. Photographs of pre-existing disturbance features ................................................65
Fig. 3.2. Location of study sites .........................................................................................67
Fig. 3.3. Examples of pore types ........................................................................................75
Fig. 3.4. Characterization of pore types by lobation ratio and orientation ........................77
Fig. 3.5. CT analysis of pre-disturbance vesicular horizons grouped by desert ................82
Fig. 3.6. Photographs of pre- and post-disturbance vesicular horizons .............................84
Fig. 3.7. Vesicular horizon index of pre- and post-disturbance soils ................................85
Fig. 3.8. Slices from CT scans of pre- and post-disturbance soils .....................................87
Fig. 3.9. Vesicular porosity of pre- and post-disturbance soils .........................................88
xiii
Fig. 3.10. Vugh porosity of pre- and post-disturbance soils ..............................................89
Fig. 3.11. Interconnected porosity of pre- and post-disturbance soils ...............................90
Fig. 3.12. Vesicular horizon index of post-disturbance soils relative to precipitation
amount and frequency during the recovery period ............................................................94
Fig. 3.13. Polygonal surface cracks of vesicular horizons within and outside of tire tracks
..........................................................................................................................................100
Fig. 3.14. Slices form CT scans of soils within and outside of tire tracks .......................101
Fig. 3.15. Vesicular porosity of soils within and outside of tire tracks ...........................102
Fig. 3.16. Vugh porosity of soils within and outside of tire tracks ..................................103
Fig. 3.17. Interconnected porosity of soils within and outside of tire tracks ...................104
Fig. 3.18. Slices form CT scans of vesicular horizon buried by coppice dune and adjacent
unburied vesicular horizon ..............................................................................................107
Fig. 3.19. Vesicular porosity of vesicular horizons buried by coppice dunes and adjacent
unburied vesicular horizons .............................................................................................108
Fig. 3.20. Vugh porosity of vesicular horizons buried by coppice dunes and adjacent
unburied vesicular horizons .............................................................................................109
Fig. 3.21. Interconnected porosity of vesicular horizon buried by coppice dunes and
adjacent unburied vesicular horizons ...............................................................................110
Fig. 3.22. Hydraulic properties of pre- and post-disturbance vesicular horizons ............113
Fig. 4.1. Respiration rates of sterile, inoculated, and glucose-amended soils .................140
Fig. 4.2. Bulk density of sterile, inoculated, and glucose-amended soils over repeated
wet/dry cycles ..................................................................................................................142
Fig. 4.3. Slices from CT scans of sterile, inoculated, and glucose-amended soils after 20
wet/dry cycles ..................................................................................................................143
Fig. 4.4. Vesicular porosity of sterile, inoculated, and glucose-amended soils after 20
wet/dry cycles .................................................................................................................145
xiv
Fig. 4.5. Bulk density of soils exposed to varying temperature increases between wetting
and drying over repeated wet/dry cycles .........................................................................147
Fig. 4.6. Slices from CT scans of soils exposed to varying temperature increases between
wetting and drying after 20 wet/dry cycles ......................................................................148
Fig. 4.7. Vesicular porosity of soils exposed to varying temperature increases between
wetting and drying after 20 wet/dry cycles ......................................................................149
Fig. 5.1. Conceptual model of the relationship between climatic and biological conditions
that influence vesicular horizon index .............................................................................163

xv
LIST OF EQUATIONS
Eq. 3.1. Volumetric lobation ratio (LRv) ...........................................................................76
Eq. 3.2. Pore percent of gravel-free volume (V%) .............................................................78
Eq. 3.3. Number density of pores (Np)...............................................................................78
Eq. 3.4. Geometric mean of pore volume ( ̅) ....................................................................79
Eq. 3.5. Wooding’s equation..............................................................................................80
Eq. 3.6. Recovery time for disturbed vesicular horizons ...................................................95
Eq. 4.1. CaCO3 precipitation............................................................................................129
Eq. 4.2. Ideal gas law .......................................................................................................130
Eq. A2.1. Volume of a sphere (Vs) ..................................................................................196
Eq. A2.2. Surface area of a sphere (Ss) ............................................................................196
1. INTRODUCTION
Desert lands cover approximately one-third of the Earth’s land surface (USGS,
1997), including 1.3 million km2 in the western U.S. (USEPA, 2006). Uses of desert land
in the western U.S. include off-highway vehicle areas, grazing, agriculture, urban lands,
roads, utility corridors, and military training grounds (Lovich and Bainbridge, 1999). In
response to societal demands for renewable sources of energy, previously undisturbed
desert lands are increasingly being used for the generation of solar and wind power
(Associated Press, 2010). Climate change models predict that precipitation will decrease
in most arid and semi-arid lands over the next half century, causing increasing water
stress in already water-limited ecosystems (Ragab and Prudhomme, 2002).
The surface layers of desert soils are critical to the regulation of runoff and run-on
patterns that affect the distribution of water in desert landscapes (Abrahams and Parsons,
1991), but are sensitive to disturbance by human land uses (Lovich and Bainbridge,
1999). Vesicular horizons are a common type of surface horizon in desert soils. These
are horizons characterized by the prevalence of non-interconnected, nearly spherical
vesicular pores. Vesicular pores are formed by gas bubbles that get trapped in the soil
during wetting and then become “frozen” in place as the soil dries (Springer 1958; Hugie
and Passey, 1964; Miller, 1971; Evenari et al., 1974). Vesicular horizons are often
formed in a silt-rich layer that results from eolian additions to the soil surface (McFadden
et al., 1998; Anderson et al., 2002).
Infiltration rates are severely restricted in soils with vesicular horizons (Young et
al., 2004), leading to runoff generation during heavy rainfall events (Eckert et al., 1979;
1
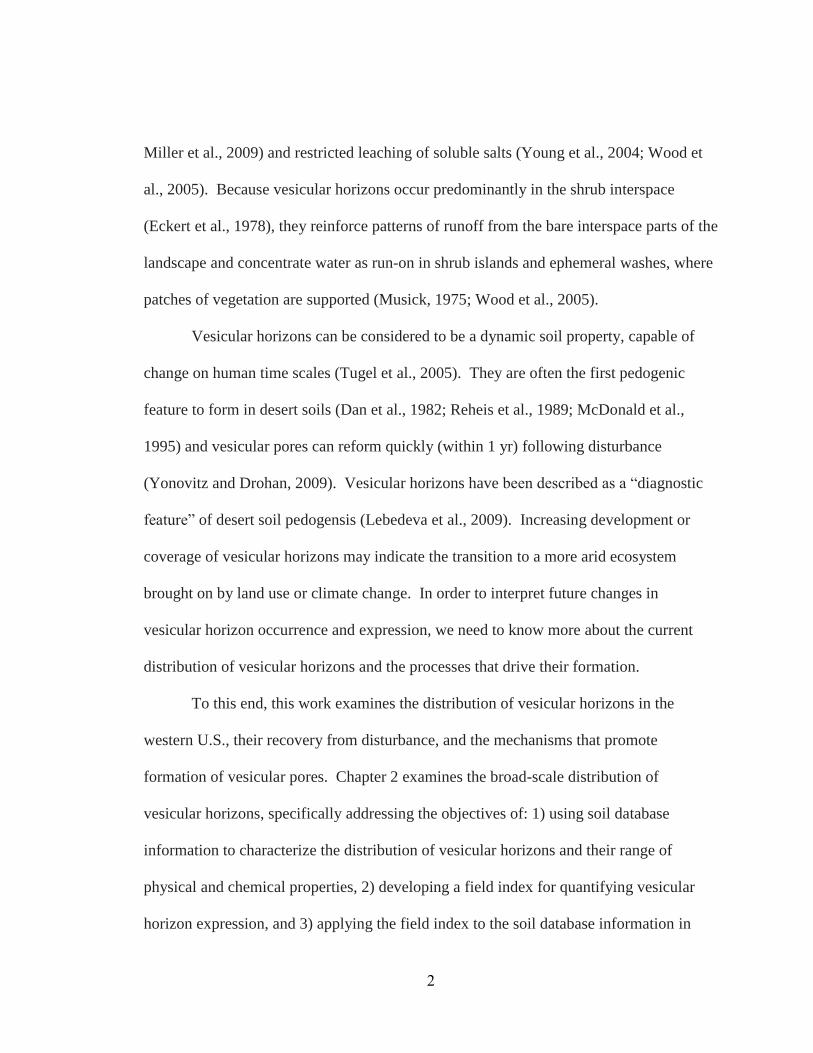
Miller et al., 2009) and restricted leaching of soluble salts (Young et al., 2004; Wood et
al., 2005). Because vesicular horizons occur predominantly in the shrub interspace
(Eckert et al., 1978), they reinforce patterns of runoff from the bare interspace parts of the
landscape and concentrate water as run-on in shrub islands and ephemeral washes, where
patches of vegetation are supported (Musick, 1975; Wood et al., 2005).
Vesicular horizons can be considered to be a dynamic soil property, capable of
change on human time scales (Tugel et al., 2005). They are often the first pedogenic
feature to form in desert soils (Dan et al., 1982; Reheis et al., 1989; McDonald et al.,
1995) and vesicular pores can reform quickly (within 1 yr) following disturbance
(Yonovitz and Drohan, 2009). Vesicular horizons have been described as a “diagnostic
feature” of desert soil pedogensis (Lebedeva et al., 2009). Increasing development or
coverage of vesicular horizons may indicate the transition to a more arid ecosystem
brought on by land use or climate change. In order to interpret future changes in
vesicular horizon occurrence and expression, we need to know more about the current
distribution of vesicular horizons and the processes that drive their formation.
To this end, this work examines the distribution of vesicular horizons in the
western U.S., their recovery from disturbance, and the mechanisms that promote
formation of vesicular pores. Chapter 2 examines the broad-scale distribution of
vesicular horizons, specifically addressing the objectives of: 1) using soil database
information to characterize the distribution of vesicular horizons and their range of
physical and chemical properties, 2) developing a field index for quantifying vesicular
horizon expression, and 3) applying the field index to the soil database information in
2
order to evaluate trends in vesicular horizon expression linked to bioclimatic variability
(i.e., desert ecoregions) and other soil properties (i.e., texture, soil order, and temperature
regime). Chapter 3 examines the impacts of disturbance and recovery on vesicular
horizon pore morphology and hydraulic properties. Specific objectives of Chapter 3 are:
1) to evaluate the recovery of vesicular horizon morphology over one year in artificially
disturbed soils and determine the factors that influence their recovery, 2) to analyze the
impact of disturbance on vesicular horizon morphology and porosity in disturbed
locations (i.e., tire tracks and coppice dunes), and 3) to determine the influence of
disturbance on the hydraulic properties of the vesicular horizons. Chapter 4 examines the
mechanisms that drive vesicular pore formation and growth in soils by recreating
vesicular pores in the lab. Two hypotheses are examined: 1) that CO2 produced by
microbial respiration forms the bubbles that create vesicular pores and 2) that thermal
expansion of gases drives the growth of the vesicular pores.
The three chapters each take a different approach to studying the distribution and
formation processes in vesicular horizons, including database analysis (Chapter 1), field
studies (Chapter 2), and laboratory experiments (Chapter 3). These different approaches
allow us to examine vesicular horizon distribution and development at different scales,
from broad-scale patterns across the entire western U.S. to local disturbance features at
our field sites. Then in the lab, we isolate specific factors that could potentially affect
the production and expansion of gas bubbles in soil and examine their impact on
vesicular pore formation.
3
REFERENCES
Abrahams, A.D., and A.J. Parsons. 1991. Relation between infiltration and stone cover on a semiarid hillslope, southern Arizona. J. Hydrol. 122:49-59.
Anderson, K., S. Wells, and R. Graham. 2002. Pedogenesis of vesicular horizons, Cima
Volcanic Field, Mojave Desert, California. Soil Sci. Soc. Am. J. 66:878-887. Associate Press. 2010. Solar showdown in tortoises’ home [Online]. Available at
<http://www.msnbc.msn.com/id/34659369/ns/us_news-environment/> (accessed 11 Nov 2010). MSNBC.
Dan, J., D.H. Yaalon, R. Moshe, and S. Nissim. 1982. Evolution of reg soils in southern
Israel and Sinai. Geoderma 28:173-202. Eckert, R.E., M.K. Wood, W.H. Blackburn, F.F. Peterson, J.L. Stephens, and M.S.
Meurisse. 1978. Effects of surface-soil morphology on improvement and management of some arid and semiarid rangelands. p. 299-301. In D.N. Hyder (ed.) Proc. of the First Int. Rangeland Congr., Denver, CO. 14-18 Aug. 1978. Society for Range Mangement, Denver, CO.
Eckert, R.E., M.K. Wood, W.H. Blackburn, and F.F. Peterson. 1979. Impacts of off-road
vehicles on infiltration and sediment production of two desert soils. J Range Manage 32:394-397.
Evenari, M., D.H. Yaalon, and Y. Gutterman. 1974. Note on soils with vesicular structure
in deserts. Z. Geomorphol. 18:162-172. Hugie, V.K., and H.B. Passey. 1964. Soil surface patterns of some semiarid soils in
northern Utah, southern Idaho, and northeastern Nevada. Soil Sci. Soc. Am. Proc. 28:786-792.
Lebedeva, M.P., D.L. Golovanov, and S.A. Inozemtsev. 2009. Microfabrics of desert
soils of Mongolia. Euras. Soil Sci. 42:1204-1217. Lovich, J.E., and D. Bainbridge. 1999. Anthropogenic degradation of the southern
California desert ecosystem and prospects for natural recovery and restoration. Environ. Manag. 24:309-326.
McDonald, E.V., L.D. McFadden, and S.G. Wells. 1995. The relative influences of
climate change, desert dust, and lithologic control on soil-geomorphic processes on alluvial fans, Mojave Desert, California: Summary of results p. 35-42, In R. E. Reynolds and J. Reynolds (eds.) Ancient surfaces of the East Mojave Desert : a volume and field trip guide prepared in conjunction with the 1995 Desert
4
Research Symposium. Quarterly of the San Bernardino County Museum Association Ser. 42. San Bernardino County Museum Association, Redlands, CA.
McFadden, L.D., E.V. McDonald, S.G. Wells, K. Anderson, J. Quade, and S.L. Forman.
1998. The vesicular layer and carbonate collars of desert soils and pavements: formation, age and relation to climate change. Geomorphology 24:101-145.
Miller, D.E. 1971. Formation of vesicular structure in soil. Soil Sci. Soc. Am. Proc.
35:635-637. Miller, D.M., D.R. Bedford, D.L. Hughson, E.V. McDonald, S.E. Robinson, and K.M.
Schmidt. 2009. Mapping Mojave Desert ecosystem properties with surficial geology., p. 225-251. In R. H. Webb, et al. (eds.) The Mojave Desert: Ecosystem Processes and Sustainability. University of Nevada Press, Reno, NV.
Musick. 1975. Barrenness of desert pavement in Yuma County, Arizona. J. Arizona
Acad. Sci. 10:24-28. Ragab, R., and C. Prudhomme. 2002. Climate change and water resources management
in arid and semi-arid regions: Prospective and challenges for the 21st century. Biosyst. Eng. 81:3-34.
Reheis, M.C., J.W. Harden, L.D. McFadden, and R.R. Shroba. 1989. Development rates
of late quaternary soils, Silver Lake Playa, California. Soil Sci. Soc. Am. J. 53:1127-1140.
Springer, M.E. 1958. Desert pavement and vesicular layer of some soils of the desert of
the Lahontan Basin, Nevada. Soil Sci. Soc. Am. Proc. 22:63-66. Tugel, A.J., J.E. Herrick, J.R. Brown, M.J. Mausbach, W. Puckett, and K. Hipple. 2005.
Soil change, soil survey, and natural resources decision making: A blueprint for action. Soil Sci. Soc. Am. J. 69:738-747.
USEPA. 2006. Ecological regions of North America [Online]. Available by USEPA
< http://www.epa.gov/wed/pages/ecoregions/na_eco.htm> (verified 9 Mar. 2011). USGS, 1997. Distribution of Non-Polar Arid Lands [Online]. Available by USGS
<http://pubs.usgs.gov/gip/deserts/what/world.html> (verified 25 Jan. 2011). Wood, Y.A., R.C. Graham, and S.G. Wells. 2005. Surface control of desert pavement
pedologic process and landscape function, Cima Volcanic field, Mojave Desert, California. Catena 59:205-230.
5
Yonovitz, M., and P.J. Drohan. 2009. Pore morphology characteristics of vesicular horizons in undisturbed and disturbed arid soils; implications for arid land management. Soil. Use. Manage. 25:293-302.
Young, M.H., E.V. McDonald, T.G. Caldwell, S.G. Benner, and D.G. Meadows. 2004.
Hydraulic properties of a desert soil chronosequence in the Mojave Desert, USA. Vadose Zone J 3:956-963.
6
2. DISTRIBUTION AND PROPERTIES OF VESICULAR HORIZONS IN THE WESTERN UNITED STATES
ABSTRACT
Vesicular horizons are thin (usually <10 cm) surface or near-surface horizons
characterized by the predominance of vesicular porosity. They are widespread in arid
and semi-arid lands, occurring on every continent and covering 156,000 km2 of the
western United States. Vesicular horizons have critical implications for management due
to their role in controlling surface hydrology and dust mobilization. This study evaluates
the distribution and variation in expression of vesicular horizons across the western
United States using the soil databases available from the USDA. A vesicular horizon
index (VHI) that incorporates vesicular horizon thickness and the size and quantity of
vesicular pores was developed using soil descriptions from a published chronosequence
study. The VHI was applied to descriptions from the soil survey databases in order to
evaluate vesicular horizon expression across the western United States. Vesicular
horizons were better expressed (higher VHI) in the Central and Northern Basin and
Range compared to the Mojave and Sonoran Basin and Range. This may be due to
differences in temperature regime or to larger areas of playas in the Central and Northern
Basin and Range that serve as sources of dust that forms the parent material for vesicular
horizons. The median VHI was highest in the Aridisols and Mollisols compared to other
soil orders. No significant relationship was found between VHI and soil textures.
Vesicular horizons are widely distributed in western United States and occur across a
wide range of soil types and soil-forming environments.
7
INTRODUCTION
The vesicular horizon is a surface or near-surface horizon characterized by the
predominance of bubble-like vesicular pores (Fig. 2.1). They are a common feature of
soils in arid and semi-arid lands and play an important role in controlling the surface
hydrology (Young et al., 2004) and dust emissions (Goossens and Buck, 2009) in the
landscapes where they occur. Vesicular horizons are common in extremely arid, arid,
and semi-arid lands around the world (Fig. 2.2), and have been reported in salt flats in a
sub-humid setting as well (Fig. 2.2 reference 3). The expression of vesicular horizons is
heterogeneous on multiple scales. For example, in an alluvial fan or bajada landscape
(Peterson, 1981), the vesicular horizons vary with the age of the geomorphic surface on
which they occur (McDonald, 1994), while within a single geomorphic surface vesicular
horizons are well expressed in the shrub interspace, with limited or no occurrence in the
shrub islands (Eckert et al., 1978; Shafer et al., 2007). Vesicular horizons are associated
with certain types of surface cover, including physical and biological surface crusts, as
well as desert pavement (Eckert et al., 1978).
It has consistently been observed that parts of the landscape with vesicular
horizons have much lower infiltration rates compared to those without vesicular horizons
(Table 2.1). As a result, runnoff and ponding are more common on parts of the landscape
with vesicular horizons (Eckert et al., 1978; Brown and Dunkerley, 1996). The low
infiltration rates can be attributed primarily to the development of the vesicular horizon,
rather than any underlying horizon, since infiltration rates increase dramatically when the
vesicular horizon is removed (Young et al., 2004). Negative correlations have been
8
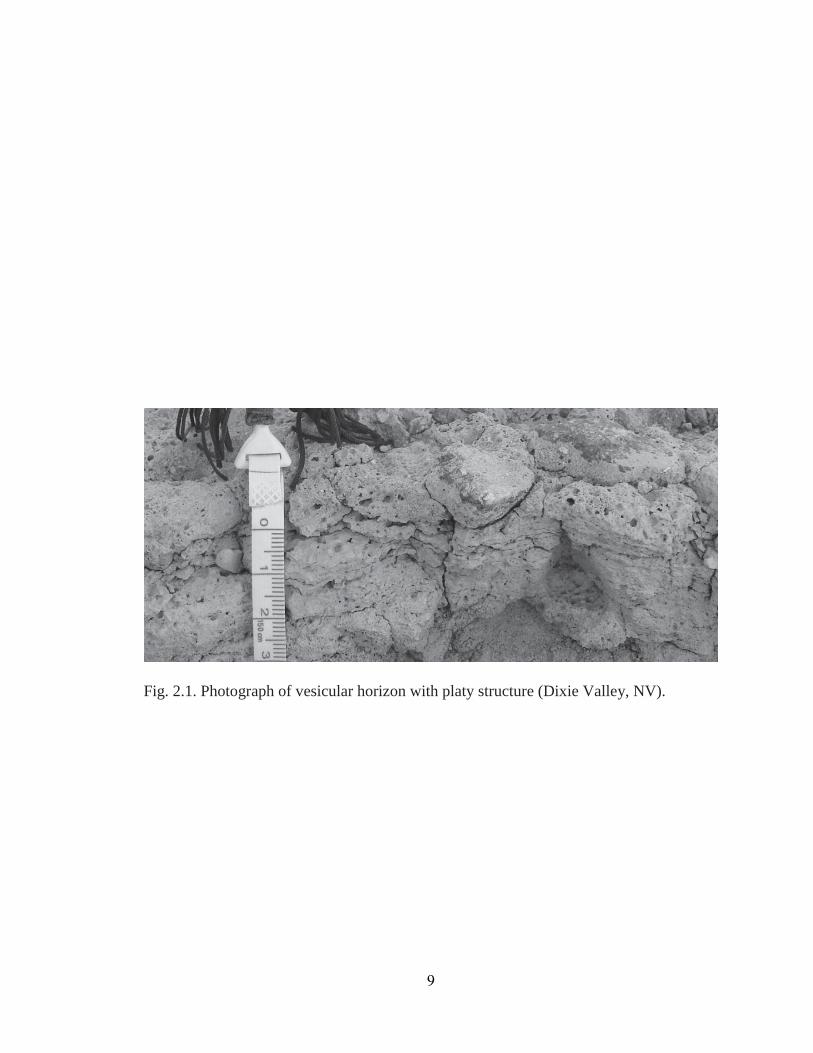
Fig. 2.1. Photograph of vesicular horizon with platy structure (Dixie Valley, NV).
9
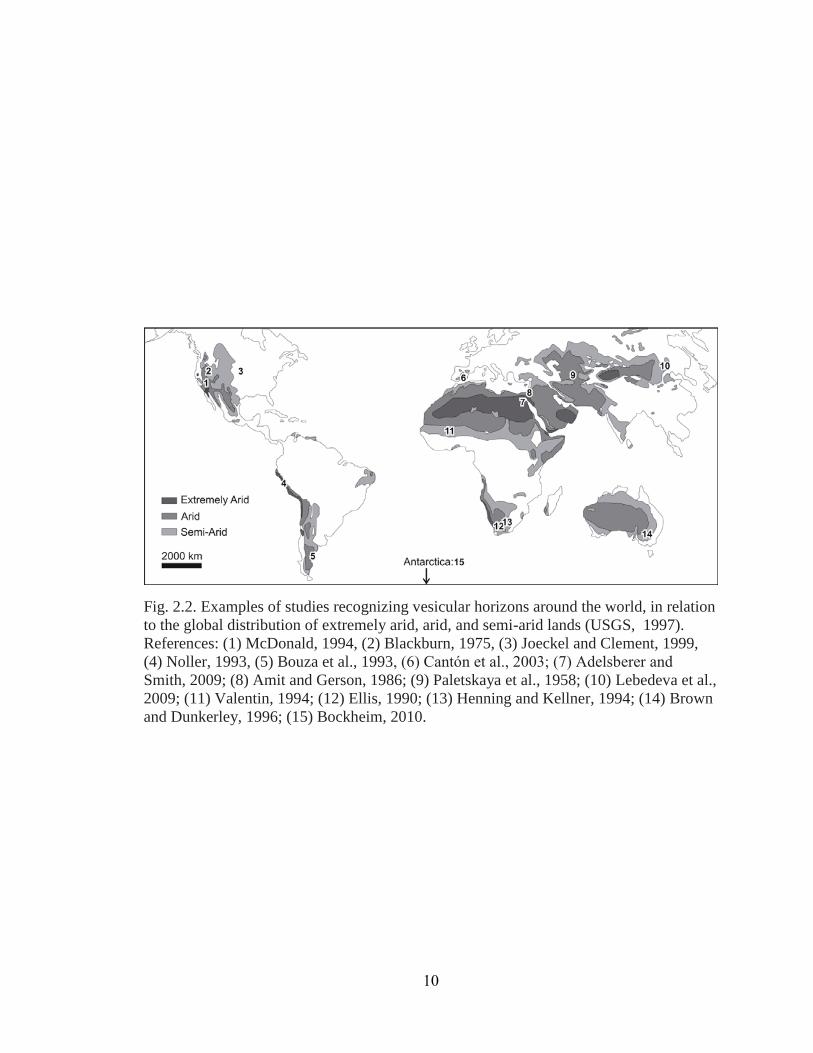
Fig. 2.2. Examples of studies recognizing vesicular horizons around the world, in relation to the global distribution of extremely arid, arid, and semi-arid lands (USGS, 1997). References: (1) McDonald, 1994, (2) Blackburn, 1975, (3) Joeckel and Clement, 1999, (4) Noller, 1993, (5) Bouza et al., 1993, (6) Cantόn et al., 2003; (7) Adelsberer and Smith, 2009; (8) Amit and Gerson, 1986; (9) Paletskaya et al., 1958; (10) Lebedeva et al., 2009; (11) Valentin, 1994; (12) Ellis, 1990; (13) Henning and Kellner, 1994; (14) Brown and Dunkerley, 1996; (15) Bockheim, 2010.
10
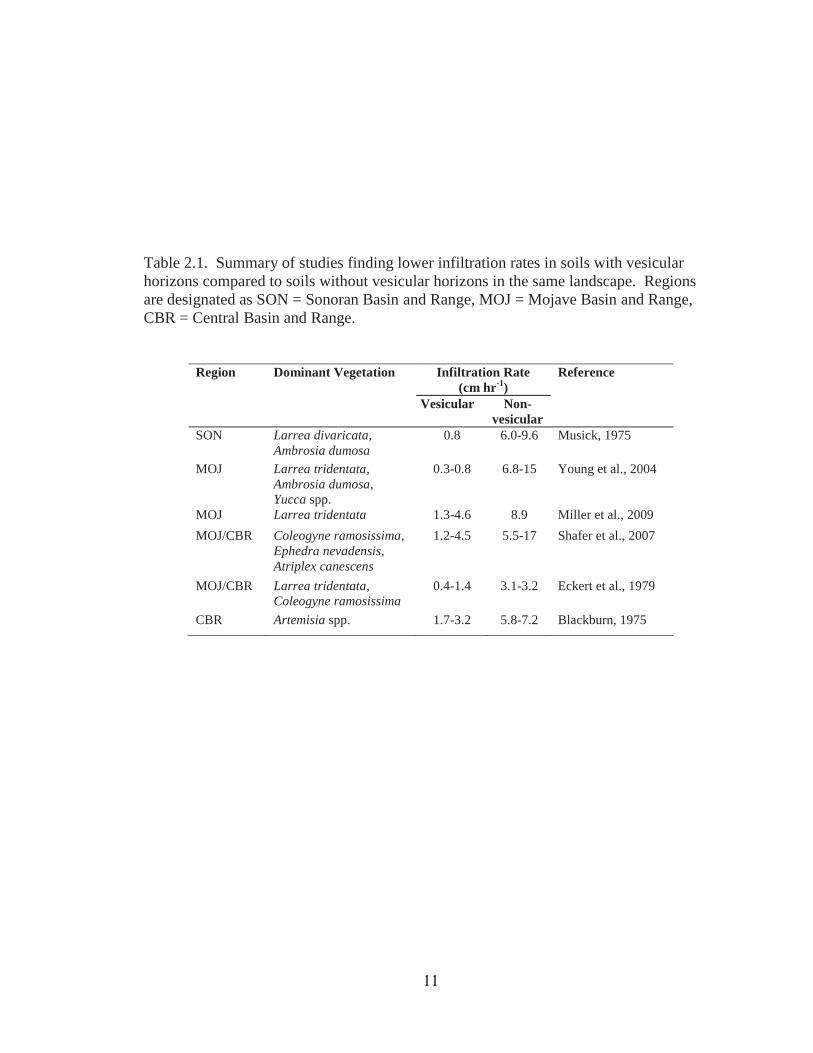
Table 2.1. Summary of studies finding lower infiltration rates in soils with vesicular horizons compared to soils without vesicular horizons in the same landscape. Regions are designated as SON = Sonoran Basin and Range, MOJ = Mojave Basin and Range, CBR = Central Basin and Range.
Region Dominant Vegetation Infiltration Rate (cm hr-1)
Reference
Vesicular Non- vesicular
SON Larrea divaricata, Ambrosia dumosa
0.8 6.0-9.6 Musick, 1975
MOJ Larrea tridentata, Ambrosia dumosa, Yucca spp.
0.3-0.8 6.8-15 Young et al., 2004
MOJ Larrea tridentata 1.3-4.6 8.9 Miller et al., 2009 MOJ/CBR Coleogyne ramosissima,
Ephedra nevadensis, Atriplex canescens
1.2-4.5 5.5-17 Shafer et al., 2007
MOJ/CBR Larrea tridentata, Coleogyne ramosissima
0.4-1.4 3.1-3.2 Eckert et al., 1979
CBR Artemisia spp. 1.7-3.2 5.8-7.2 Blackburn, 1975
11
observed between the abundance of vesicular pores in the surface horizon and infiltration
rates (Blackburn, 1975; Valentin, 1994; Lebedeva et al., 2009), further suggesting that
the vesicular horizon is a critical regulator of infiltration. Soil development in deserts,
including vesicular horizon formation, tends to reduce the plant water supply, leading to
lower shrub densities (McAuliffe, 1994) and more drought-adapted species (Hamerlynck
et al., 2002) on older surfaces. Desert landscapes are characterized by clusters of plants
in “islands of fertility” separated by barren shrub interspaces (Schlesinger et al., 1990).
This pattern is reinforced by stronger expression of vesicular horizons, and resulting in
runoff of water from shrub interspace and concentration of runon in the “islands of
fertility,” where infiltration rates are higher (Shafer et al., 2007). Vesicular horizons are
better expressed under increasingly arid conditions, which may create a positive feedback
that promotes desertification in semi-arid lands by reinforcing hydrologic and ecological
patterns characteristic of desert shrublands (Lebedeva et al., 2009).
Vesicular horizons are often best expressed on geomorphic surfaces that trap dust,
especially surfaces that are mantled by desert pavement, a monolayer of interlocking
clasts that occurs at the surface of many desert soils (Wood et al., 2005). The primary
mechanism of desert pavement formation is through vertical inflation by eolian materials
trapped beneath the surface clasts (McFadden et al., 1987; Wells et al., 1995). This
process causes a smoothing of the original surface topography and the accumulation of an
eolian mantle that favors the formation of vesicular horizons and other pedogenic
features. Relatively weak expression of vesicular horizons has been observed on
landforms with smooth microtopography (e.g., sandy beach ridges) compared to those
12
with initially rough microtopography that favors dust entrapment and desert pavement
formation (e.g., gravelly piedmont and lava flows) (McFadden et al., 1992). The eolian
origin of vesicular horizons has been supported in settings where the suite of minerals
contributed by dust is distinct from the underlying parent material (Well et al., 1985;
Ugolini et al., 2008). The vesicular horizon is often formed predominantly in eolian
parent materials, even when the underlying soil horizons are formed in another parent
material, such as alluvium (McDonald, 1994) or glacial till (Rossi, 2009).
As a consequence of their eolian origins, soils with vesicular horizons are prone to
high dust emission when they are disturbed by human activities, such as off-road driving
(Goossens and Buck, 2009). Dust released from soil disturbance can have adverse effects
on human health (Smith and Lee, 2003) and far-reaching ecological impacts. Desert dust
deposited on alpine snow packs reduces their albedo, thereby increasing their melting rate
and altering the hydrology of major river systems (Painter et al., 2010).
Vesicular horizons occur at or near the soil surface and are commonly thin (<10
cm) (Anderson et al., 2002). The morphological feature that distinguishes vesicular
horizons from other surface horizons is the predominance of isolated, nearly spherical
vesicular pores. Columnar or prismatic structure that parts to platy structure is a
common, but not universal, feature of vesicular horizons. The pedogenic processes that
form vesicular horizons include: 1) the additions of eolian material to the soil surface, 2)
the development of a surface seal in the form of an embedded gravel layer or a physical
or biological crust, and 3) wetting and drying cycles that cause the growth of vesicular
pores and their collapse to form platy structure (Fig. 2.3). The role of wetting and drying
13
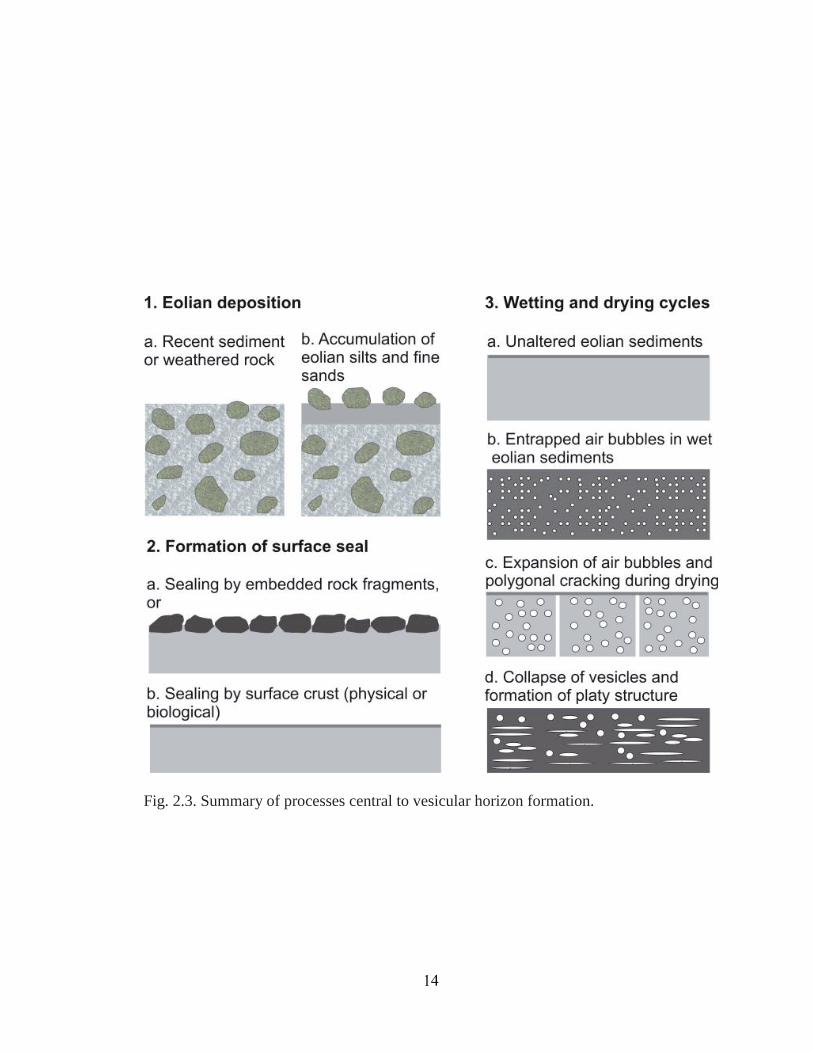
Fig. 2.3. Summary of processes central to vesicular horizon formation.
14
cycles in the formation of vesicular pores has been observed in laboratory studies in
which vesicular pores are regenerated through the wetting and drying of crushed soils
(Springer, 1958, Miller, 1971, Evenari et al., 1974; Figueira and Stoops, 1983). Wetting
and drying cycles also cause polygonal cracking and the formation of prismatic or
columnar structure in the vesicular horizons. The vesicular pores are believed to be
formed by air that is trapped as bubbles during the wetting of an initially dry soil. The
presence of a gravel layer or a physical or biological crust prevents the trapped air from
escaping at the soil surface (Evenari et al., 1974). Vesicular pores are more common
under embedded surface rock fragments compared to non-embedded rock fragments, due
to the more effective surface sealing (Valentin, 1994). The formation of vesicular pores
has been associated with silt-rich soil materials (Miller, 1971). The addition of eolian
materials to the surface of desert soils helps to create conditions for vesicular pore
formation by enriching the soil surface in silt-sized particles. The process of eolian
additions may continue even in well-developed vesicular horizons. This material may be
carried into the vesicular horizon with infiltrating water, resulting in a progressive
thickening of the vesicular horizon and the formation of ped surface features that may
help to stabilize the vesicular pores and platy peds (e.g., argillans and calcite coating)
(Sullivan and Koppi, 1991; Anderson et al., 2002; Lebedeva et al., 2009).
The process of vesicular pore formation can occur rapidly. In the lab, vesicular
pores are observed to form in disturbed soil material collected from vesicular horizons
over four to 25 wetting and drying cycles (Miller, 1971; Figueira and Stoops, 1983). In
the field, vesicular pores were observed to reform in disturbed soils after only four
15
months (Yonovitz and Drohan, 2009). Thin vesicular horizons (<1 cm) have been
observed on very young (<100 yrs) geomorphic surfaces (Gile and Hawley, 1968) and
surfaces subject to active sediment transport (Peterson, 1980). Chronosequence studies
in the Mojave Desert have suggested that vesicular horizons are the first indicators of soil
development (McFadden et al., 1986; McFadden, 1988). The rapid formation of
vesicular pores indicates that they are a dynamic soil property. However, the eolian
surface horizon, containing material that is conducive to vesicular pore formation, may be
considered a stable feature, unless physical disturbance (Goossens and Buck, 2009) or a
change in hydrologic conditions (Wells et al., 1985) causes erosion of the surface
material.
A wealth of pedon descriptions, using a consistent terminology for describing key
features of the vesicular horizon (e.g., the size and quantity of vesicular pores) is
available through the USDA databases of Official Soils Descriptions (OSDs) (Soil
Survey Staff, 2009a) and National Soil Survey Characterization Data (Soil Survey Staff,
2009b). We used these databases to study the distribution and properties of vesicular
horizons across the western United States. Our objectives were to 1) use soil database
information to characterize the distribution of vesicular horizons and their range of
physical and chemical properties, 2) to develop a field index for quantifying vesicular
horizon expression, and 3) to apply the developed field index to the soil database
information, in order to evaluate trends in vesicular horizon expression across different
ecoregions (i.e., warm and cold deserts) and among soils with varying properties (i.e.,
soil temperature regimes, soil orders, and textures). This broad evaluation of vesicular
16
horizon distribution and variability in expression is intended to reveal the extent of this
feature, as well as to examine patterns that may help us unravel the mechanisms involved
in vesicular horizon formation. The vesicular horizon’s near-surface position, its control
of surface hydrology (Young et al., 2004), and its sensitivity to dust mobilization
(Goossens and Buck, 2009), as well as the dynamic nature of vesicular porosity
(Yonovitz and Drohan, 2009) make it an important feature to be recognized in land-use
planning and studies of ecological change in arid and semi-arid lands.
MATERIALS AND METHODS
Analysis of soil databases
Soil series with vesicular horizons were found by searching all OSDs (Soil Survey
Staff, 2009a) in the 11 western states for the term “vesicular” and checking each
description for vesicular pores in a horizon that starts within the upper 10 cm of the soil
surface. Only those descriptions in which the vesicular pores had a higher quantity class
than all other pore types were included in the dataset. These criteria were used to limit
the dataset to those horizons that are similar to vesicular horizons described in the
literature that restrict infiltration rates (Table 2.1) because they are close to the surface
and are dominated by non-interconnected porosity. The area of soil series with vesicular
horizons mapped in the Soil Survey Geographic (SSURGO) dataset was determined
using the Soil Extent Mapping Tool (Soil Survey Staff, 2007). This evaluation represents
a minimum estimate of the area of vesicular horizons, since areas mapped after 2007,
including many soil survey areas in arid and semiarid regions, are not yet entered into the
17
Soil Extent Mapping Tool. The distribution of soils with vesicular horizons was also
evaluated using the State Soil Geographic data set (STATSGO) (USDA-NRCS, 2006),
by selecting all map units in which one or more major components is a soil series with a
vesicular horizon in the OSD. This data set lacks the resolution and accuracy of the
SSURGO data, but offers a complete, broad-scale depiction of vesicular horizon
occurrence in the western United States.
The names of the soil series with vesicular horizons were used to query the
National Soil Survey Characterization Data (Soil Survey Staff, 2009b) for lab data and
National Soil Information System (NASIS) pedon descriptions of soils with vesicular
horizons. Using both OSDs and NASIS pedon descriptions creates potential for
duplication of data points, because some OSDs are also in NASIS. To avoid this
problem, all OSDs that had the same location description as a NASIS pedon descriptions
were removed from our dataset. The location of each pedon description with a vesicular
horizon (type location for the OSDs) was plotted using ArcMap 9.3 (ESRI, 2008).
Locations recorded using the Public Land Survey System were converted to an
approximate latitude and longitude using Graphical Locator (Gustafson, 2003).
Development and application of the vesicular horizon index
The methods for developing a field index for the vesicular horizon were based on
those used by Harden (1982) to evaluate the soil development index (SDI). The index
was evaluated using pedon descriptions from a published chronosequence study in the
Mojave Desert (McDonald, 1994), according to the most recent evaluations of surface
18
age at the site (McDonald, 2008). This chronosequence study, located on a series of
alluvial fan deposits of the Providence Mountains in California, was selected because it
includes a high level of replication (5-15 pedon descriptions per surface age) and a wide
range of surface ages (750-135,000 yrs).
The VHI was then applied to our dataset of pedon descriptions with vesicular
horizons derived from the USDA databases and used to analyze variability in the
vesicular horizon expression across the western United States. The pedon description
locations were overlaid with Level III Ecoregions (USEPA, 2006a) in order to group the
points in a way that reflects spatial variability in climate and biotic factors. The VHI
was compared among soils grouped by ecoregions of the Basin and Range Province,
including the Sonoran Basin and Range (SON), Mojave Basin and Range (MOJ), Central
Basin and Range (CBR), and Northern Basin and Range (NBR) ecoregions. The Basin
and Range Province was selected for analysis because vesicular horizons are frequently
described in this region (see Fig. 2.4a) and the ecoregions represent a gradient of climatic
and biotic influences. The SON and MOJ ecoregions are considered warm deserts, while
the CBR and NBR are considered cold deserts (USEPA, 2006b). The VHI was also used
to compare vesicular horizon expression among different soil orders, soil temperature
regimes, and vesicular horizon textures.
Due to the non-normal distribution of VHI, all statistical tests were performed
using non-parametric analyses, including the Kruskal-Wallis test (Sheskin, 2007) for
comparison among all groups and the Mann-Whitney test (Sheskin, 2007) and
Bonferonni correction (Abdi, 2007) for comparisons between specific groups. All
19
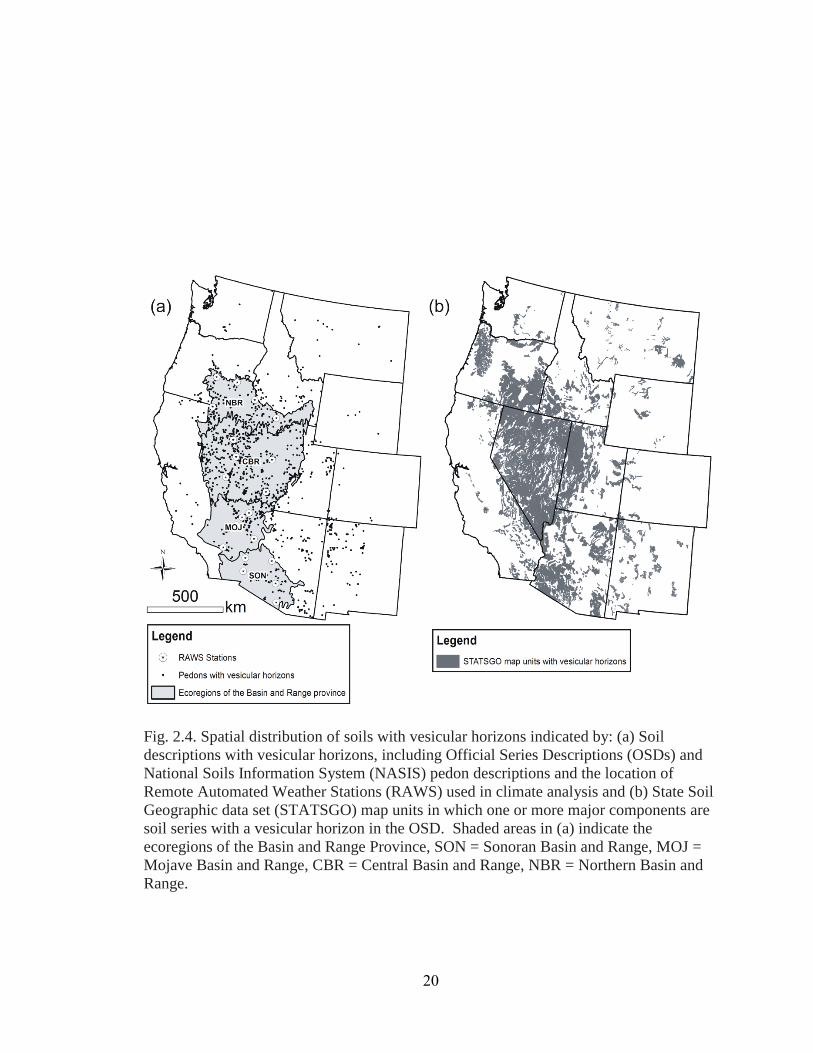
Fig. 2.4. Spatial distribution of soils with vesicular horizons indicated by: (a) Soil descriptions with vesicular horizons, including Official Series Descriptions (OSDs) and National Soils Information System (NASIS) pedon descriptions and the location of Remote Automated Weather Stations (RAWS) used in climate analysis and (b) State Soil Geographic data set (STATSGO) map units in which one or more major components are soil series with a vesicular horizon in the OSD. Shaded areas in (a) indicate the ecoregions of the Basin and Range Province, SON = Sonoran Basin and Range, MOJ = Mojave Basin and Range, CBR = Central Basin and Range, NBR = Northern Basin and Range.
20
nonparametric analyses were performed using MINITAB 15 (Mintab, 2007) and the
Bonferonni correction was calculated by hand.
Analysis of weather records
In order to consider the relationship of VHI to modern climate conditions,
weather records were analyzed at 20 Remote Automated Weather Stations (RAWS)
(Western Regional Climate Center, 2011), including five stations in each of the
ecoregions discussed above (SON, MOJ, CBR, and NBR). The stations were selected
based on proximity to database pedon descriptions with vesicular horizons (Fig. 2.4a).
Two climatic variables were extracted: 1) the average number of precipitation events per
year and 2) the average increase in temperature during the drying period following a
precipitation event (ΔT). These variables are considered the most significant in terms of
understanding the relation of climate to vesicular pore formation. The amount of time
required for the vesicular horizon to dry following a precipitation event, hereafter called
the drying period, is a critical assumption that influences the analysis of both of these
variables. The drying period was used to define the split between successive
precipitation events, under the assumption that the soil will not trap air and form
vesicular pores if it has not dried first, thus introducing more air to be trapped. The ΔT
was defined as the difference between the maximum temperature during the drying
period and the temperature at the time of initial precipitation. Air temperatures were used
for this analysis, rather than soil temperatures, because these data were readily available
and because the vesicular horizons typically occur at the soil surface, where temperature
21
fluctuations are most directly influenced by aboveground weather conditions. Vesicular
pores only form and expand when the soil is wet (Springer, 1958; Miller, 1971; Figueira
and Stoops, 1983), presumably because vesicular horizons have a weak structural
consistence when they are wet (Bouza et al., 1993).
The actual drying period depends on current weather conditions (e.g., air
temperature, relative humidity), the water retention characteristics of the vesicular
horizons, the relationship between water content and consistence of the vesicular horizon,
and drainage conditions of the soil. Our analysis assumed a drying period of one day
during the summer (Jun.-Aug.), five days during the winter (Dec.-Feb.), and three days at
other times of the year. These assumptions were based on casual observations of
vesicular horizon behavior in the field. Thorough verification of these assumptions was
beyond the scope of this study, but we did consider the sensitivity of our analysis to the
assumption of drying period (Table 2.2). Assumption of a longer drying period results in
calculation of fewer precipitation events per year and a greater ΔT. Using a longer
drying period resulted in fewer precipitation events because the drying period was used to
define the separation of successive precipitation events, therefore using a longer drying
period causes more precipitation to be lumped into a single event. The impact of this
assumption was similar at climate stations located in each of the ecoregions and therefore
is not presumed to introduce any bias to our comparison between ecoregions.
Precipitation events of less than five mm were not included in the analysis, as small
events are unlikely to be effective at trapping air and forming vesicular pores. Our
analysis included between five and 10 years of weather records at each RAWS site. The
22
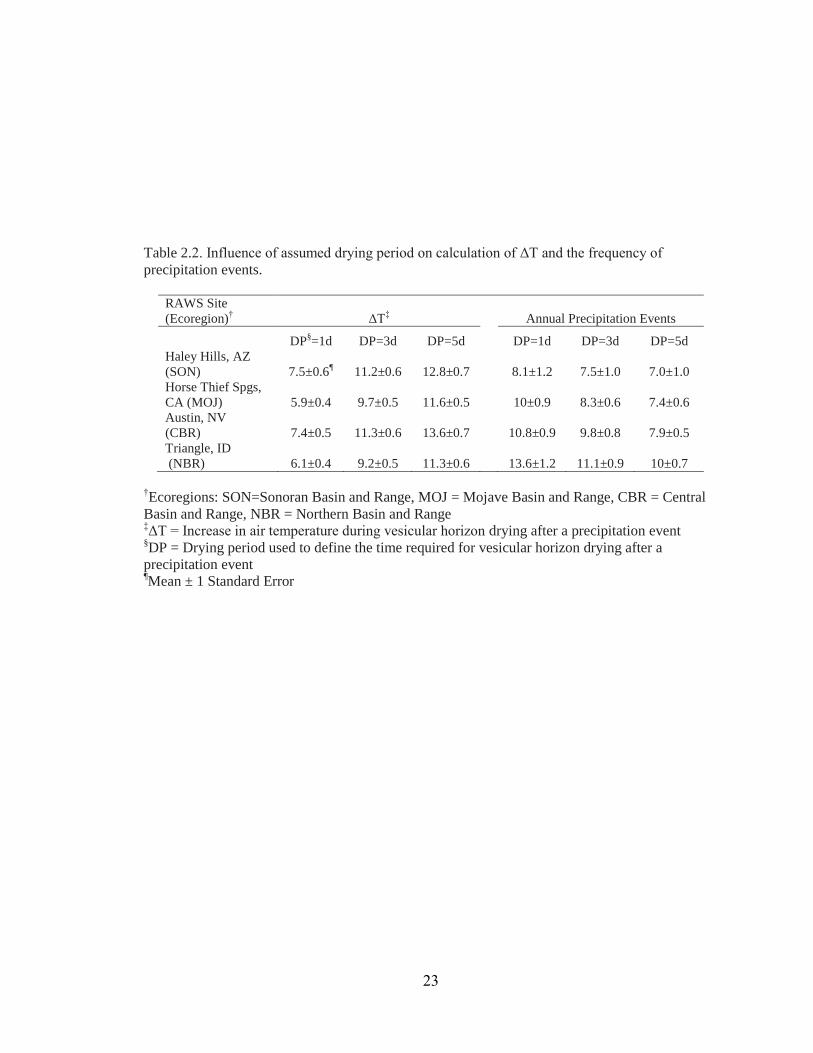
Table 2.2. Influence of assumed drying period on calculation of ΔT and the frequency of precipitation events.
RAWS Site (Ecoregion)† ΔT‡ Annual Precipitation Events
DP§=1d DP=3d DP=5d DP=1d DP=3d DP=5d Haley Hills, AZ (SON) 7.5±0.6¶ 11.2±0.6 12.8±0.7 8.1±1.2 7.5±1.0 7.0±1.0 Horse Thief Spgs, CA (MOJ) 5.9±0.4 9.7±0.5 11.6±0.5 10±0.9 8.3±0.6 7.4±0.6 Austin, NV (CBR) 7.4±0.5 11.3±0.6 13.6±0.7 10.8±0.9 9.8±0.8 7.9±0.5 Triangle, ID (NBR) 6.1±0.4 9.2±0.5 11.3±0.6 13.6±1.2 11.1±0.9 10±0.7
†Ecoregions: SON=Sonoran Basin and Range, MOJ = Mojave Basin and Range, CBR = Central Basin and Range, NBR = Northern Basin and Range ‡ΔT = Increase in air temperature during vesicular horizon drying after a precipitation event §DP = Drying period used to define the time required for vesicular horizon drying after a precipitation event ¶Mean ± 1 Standard Error
23
annual number of precipitation events and ΔT were compared between the ecoregions
according to analysis of variance (ANOVA) and multiple comparisons using Tukey’s test
(Sheskin, 2007). Statistical analysis was performed using MINITAB 15 (Minitab, 2007).
RESULTS AND DISCUSSION
Distribution and range of properties
The analysis of soil databases produced 1092 OSDs and 295 NASIS pedon
descriptions with vesicular horizons. Soils with vesicular horizons occur throughout the
western United States, but have been described most frequently in the Basin and Range
Province, particularly in the NBR and CBR (Fig. 2.4a). This distribution may be biased
by differences in the intensity of sampling across different soil survey areas and the
scarcity of points in areas where soil surveys have not been completed (e.g., the Mojave
Desert region of California). The distribution of soil series with vesicular horizons
derived from the STATSGO dataset (Fig. 2.4b) may provide a better depiction of the
overall distribution of vesicular horizons. These data also show that vesicular horizons
are extensive throughout the western United States, but are especially common in the
Basin and Range Province. The total area of soil series with vesicular horizons mapped
in SSURGO is 156,000 km2 (as of 2007). Based on SSURGO, the vesicular horizons
cover about 5% of the western United States and 21% of the Basin and Range Province.
The distribution of vesicular horizons in the western United States (Fig. 2.4), as
well as the worldwide distribution of research sites where vesicular horizons have been
described (Fig. 2.2), show that they mainly occur in arid and semiarid regions. Vesicular
24
porosity is also better expressed under the more arid conditions across a climatic gradient
in Mongolia (Lebedeva et al., 2009). The soils with vesicular horizons in our dataset
derived from the USDA databases are mostly soils with aridic moisture regimes (72%).
The association of vesicular horizons with arid ecoregions and soils with aridic moisture
regimes can be attributed to a few factors: 1) high rates of dust deposition which create a
surface layer that is conducive to vesicular pore formation (McFadden, 1988; McFadden
et al., 1998), 2) periodic drying and re-wetting of the soil surface, which drives vesicular
pore formation (Springer, 1958; Miller, 1971; Figueira and Stoops, 1983), and 3) low
vegetative cover, which allows surface crusting and air entrapment in the soil (Evenari et
al., 1971).
The vesicular horizons in the soil databases occurred in a range of soil orders
and were present across all temperature regimes. The soils included in the data set are
mostly Aridisols (65%), but also include Mollisols (14%), Entisols (13%), Alfisols (5%),
Inceptisols (3%), and a few Andisols and Vertisols (<1% each). The common occurrence
of vesicular horizons in Aridisols reflects the association of vesicular horizons with arid
environments. The temperature regimes of the soils with vesicular horizons were
hyperthermic (4%), thermic (13%), mesic (64%), frigid (18%), and cryic (1%). Mesic
and frigid temperature regimes were most common because many of the pedons with
vesicular horizons were described in the cold deserts (i.e., CBR and NBR ecoregions)
(Fig. 2.4a).
The most common field-determined texture of the vesicular horizons was loam
(35%), followed by sandy loam (18%), silt loam (15%), fine sandy loam (13%), very fine
25
sandy loam (6%), clay loam (4%), silty clay loam (3%), loamy sand (1%), coarse sandy
loam (1%), and loamy fine sand (1%). Other textures (sand, silty clay, loamy coarse
sand, clay, and coarse sand) each occurred in <1% of the vesicular horizons. Peterson
(1980) observed a similar distribution of textures in the vesicular horizons of the
Panamint Valley, California, which ranged from loamy sand to clay loam, but were most
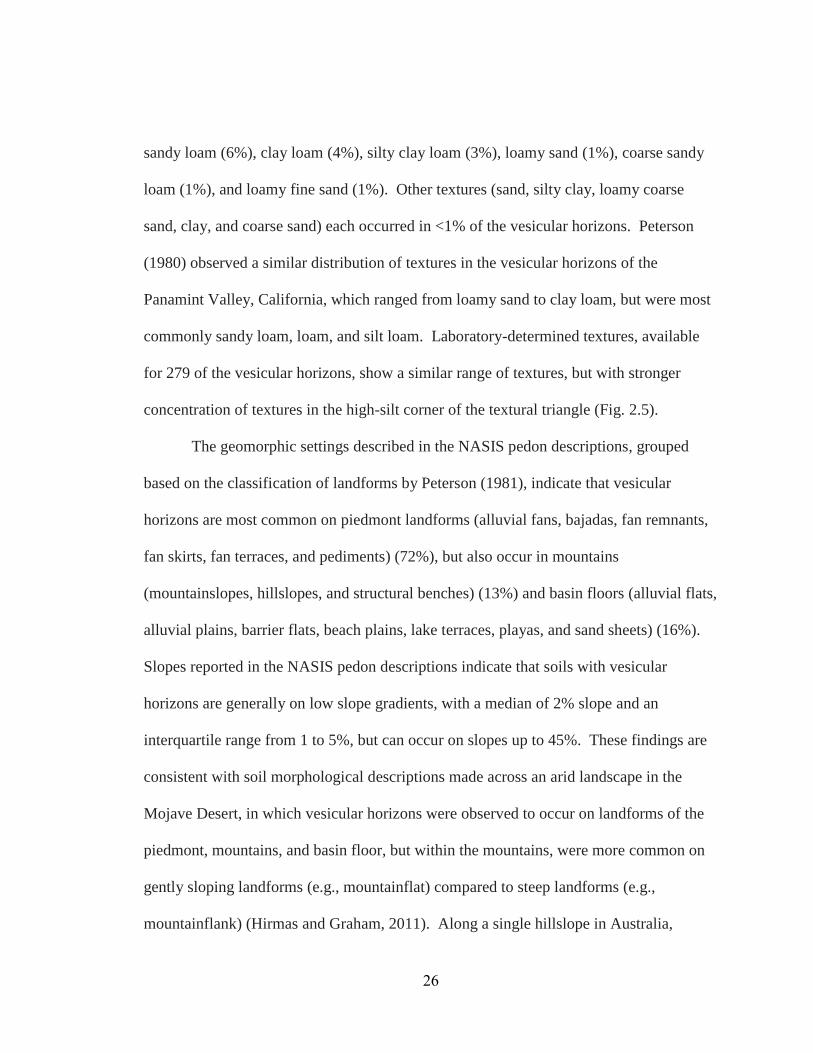
commonly sandy loam, loam, and silt loam. Laboratory-determined textures, available
for 279 of the vesicular horizons, show a similar range of textures, but with stronger
concentration of textures in the high-silt corner of the textural triangle (Fig. 2.5).
The geomorphic settings described in the NASIS pedon descriptions, grouped
based on the classification of landforms by Peterson (1981), indicate that vesicular
horizons are most common on piedmont landforms (alluvial fans, bajadas, fan remnants,
fan skirts, fan terraces, and pediments) (72%), but also occur in mountains
(mountainslopes, hillslopes, and structural benches) (13%) and basin floors (alluvial flats,
alluvial plains, barrier flats, beach plains, lake terraces, playas, and sand sheets) (16%).
Slopes reported in the NASIS pedon descriptions indicate that soils with vesicular
horizons are generally on low slope gradients, with a median of 2% slope and an
interquartile range from 1 to 5%, but can occur on slopes up to 45%. These findings are
consistent with soil morphological descriptions made across an arid landscape in the
Mojave Desert, in which vesicular horizons were observed to occur on landforms of the
piedmont, mountains, and basin floor, but within the mountains, were more common on
gently sloping landforms (e.g., mountainflat) compared to steep landforms (e.g.,
mountainflank) (Hirmas and Graham, 2011). Along a single hillslope in Australia,
26
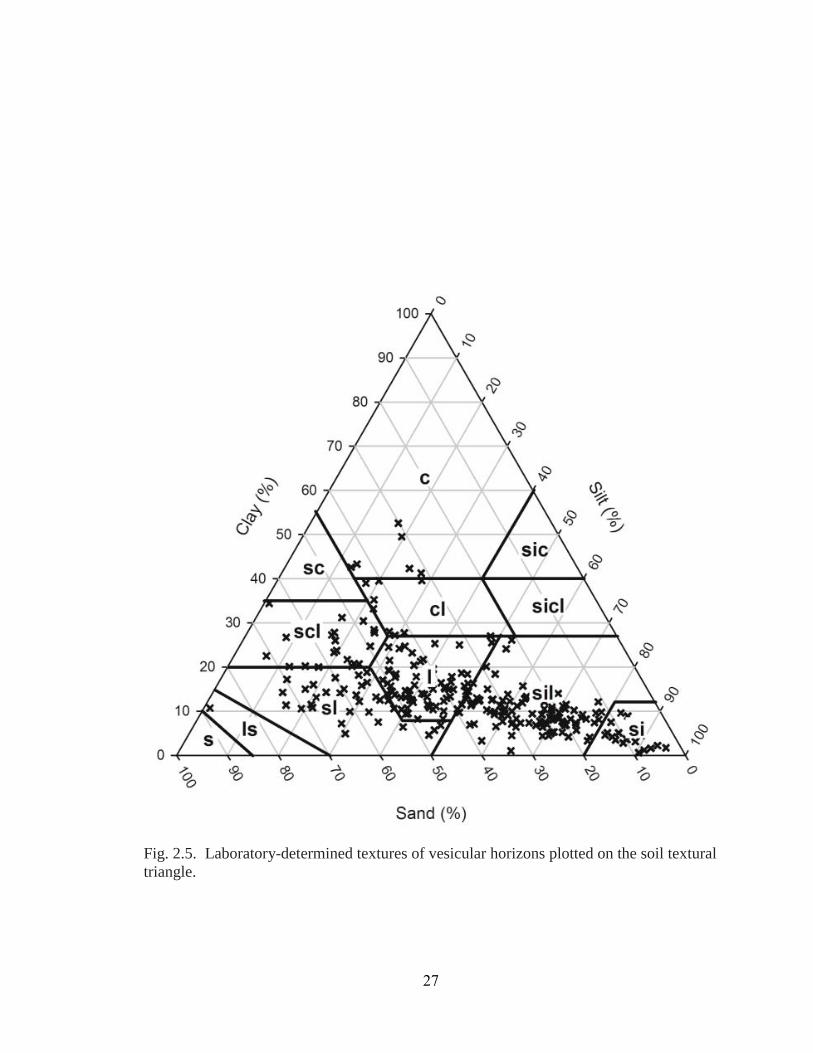
Fig. 2.5. Laboratory-determined textures of vesicular horizons plotted on the soil textural triangle.
27
vesicular horizons were most common on low slope gradients as well (Brown and
Dunkerley, 1996).
Vesicular horizons in the western United States occur across several ecoregions,
which represent different climatic and biological influences, and are formed in various
geomorphic settings, which represent differences in surface age, parent material, and
relief. Thus, it is not surprising that the chemical properties of the vesicular horizon,
including organic C, CaCO3, pH, electrical conductivity, and exchangeable sodium
percentage (ESP), vary widely (Table 2.3). Although some studies have suggested that
low organic C (Wood et al., 1978), high CaCO3 (Evenari et al., 1974), and high
exchangeable Na percentage (Bouza et al., 1993) promote vesicular pore formation, none
of these can be considered an essential prerequisite for vesicular horizon development.
Of the soils analyzed, 68% contained measureable CaCO3 and only 11% were sodic soils
(ESP>15; U.S. Regional Salinity Laboratory, 1954).
Vesicular horizon index
The vesicular horizon index (VHI) was developed as a way to quantify vesicular
horizon expression based on standard information recorded in field descriptions.
Vesicular horizon expression is defined here according to the abundance of vesicular
pores (more pores = better expression), the size of vesicular pores (larger pores = better
expression), and the horizon thickness (thicker horizon = better expression). Previous
studies have used similar rating systems for the purpose of comparing vesicular horizon
expression within their study areas, based on the grade of platy and prismatic structure
28
Table 2.3. Chemical properties of vesicular horizons based on lab data for National Soils Information System pedon descriptions with vesicular horizons.
Inter-quartile Property Median Range Total Range N Organic C (%) 0.7 0.4-1.2 0-5.3 269 Electrical Conductivity (dS m-1) 1.2 0.8-2.3 0.1-218 187 Exchangeable Na (%) 2 1-6 0-96 256 pH 8.0 7.3-8.4 5-10.7 263 CaCO3 (%) 4 0-12 0-49 205
29
and the quantity class of vesicular pores (Blackburn, 1975; McDonald, 1994). Neither of
these rating systems was suitable for application to the soil databases because they are not
inclusive of all combinations of structure and porosity.
In order to develop an index that is inclusive of all possible ranges and
combinations of properties that occur in vesicular horizons, the VHI was modeled after
the soil development index (SDI) (Harden, 1982). In the SDI, the thickness of the soil
horizons is multiplied by terms that quantify individual soil properties. The SDI does not
include a term for vesicular porosity, therefore the first step in developing the VHI was to
determine a suitable method for assigning a numerical value based on the description of
vesicular pores. The standard method for describing vesicular pores includes the
assignment of both a quantity class (Q) and size class (S) (Soil Survey Division Staff,
1993; Schoeneberger et al., 2002). Point values were assigned to Q (few = 10, common
= 20, many = 30) and S (very fine = 10, fine = 20, medium = 30, coarse = 40, very coarse
= 50) using intervals of ten to be consistent with points assignments used in the SDI
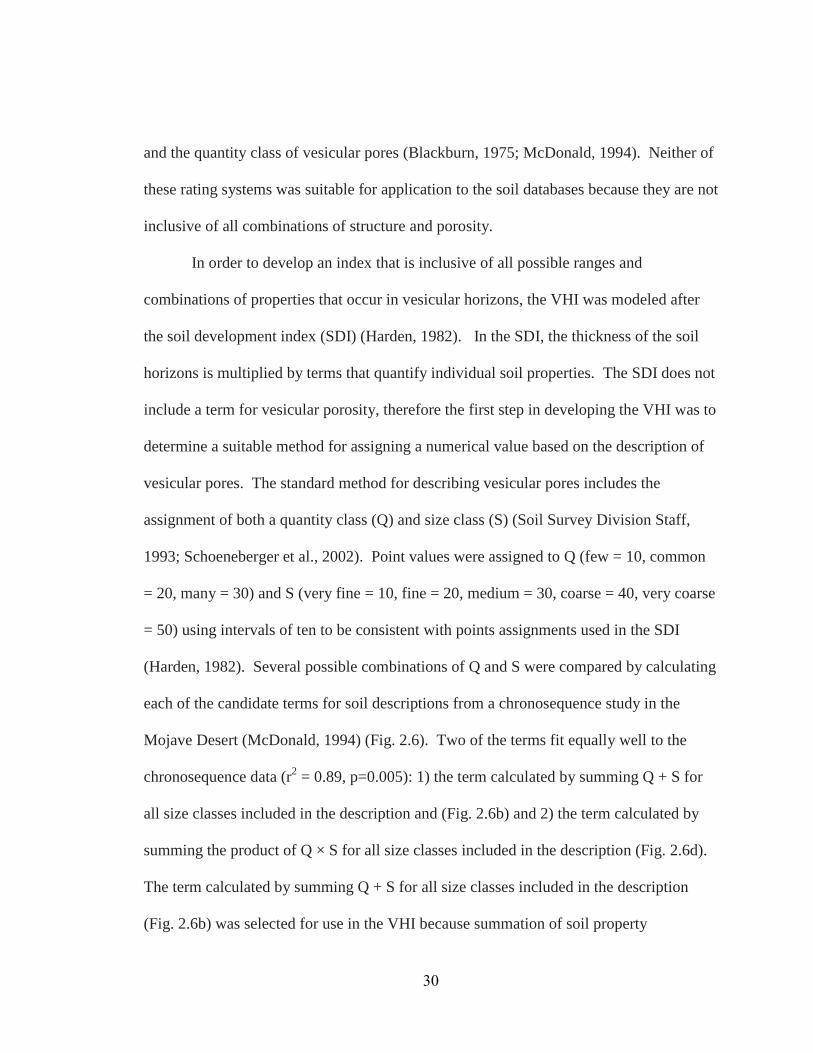
(Harden, 1982). Several possible combinations of Q and S were compared by calculating
each of the candidate terms for soil descriptions from a chronosequence study in the
Mojave Desert (McDonald, 1994) (Fig. 2.6). Two of the terms fit equally well to the
chronosequence data (r2 = 0.89, p=0.005): 1) the term calculated by summing Q + S for
all size classes included in the description and (Fig. 2.6b) and 2) the term calculated by
summing the product of Q × S for all size classes included in the description (Fig. 2.6d).
The term calculated by summing Q + S for all size classes included in the description
(Fig. 2.6b) was selected for use in the VHI because summation of soil property
30
Fig. 2.6. Comparison of terms for the quantification of vesicular pore descriptions, applied to soils of increasing age on a chronosequence of alluvial fans in the Mojave Desert (McDonald, 1994): (a) ΣQ, (b) Σ(Q+S), (c) , (d) Σ(Q×S), where Q = quantity class (few = 10, common = 20, many = 30) and S = size class (very fine = 10, fine = 20, medium = 30, coarse = 40, very coarse = 50). Error bars indicate one standard error.
31
descriptors is more consistent with the calculations applied in the SDI (Harden, 1982).
Following the notation used by Harden (1982), the vesicular pore term is denoted as Xve.
As in the SDI, Xve is then set to a scale from 0 to 1 (Xven) by dividing by the highest value
of the term. The highest value for Xve encountered in the soil databases was 220, this
would represent a vesicular horizon with many very fine, many fine, many medium, and
many coarse vesicular pores. Very coarse vesicular pores are rarely described and
therefore not included in the calculation of the maximum Xve. Finally, VHI is calculated
by multiplying vesicular horizon thickness by Xven. If more than one vesicular horizon is
present in the soil profile, the VHI is calculated for each horizon and then summed. An
outline and example of VHI calculation is provided in Fig. 2.7.
The resulting index shows a strong relationship with the log of surface age
(r2=0.94) for the surfaces under 100,000 yrs old (Fig. 2.8). These data demonstrate that
although vesicular pores may be subject to collapse and reformation on a short time-scale
(Fig. 2.3; Yonovitz and Drohan, 2009) there are also long term trends in vesicular
horizon expression. This may be related to the addition of eolian materials to the
vesicular horizon. Eolian additions cause the vesicular horizon to grow thicker. With
age, the vesicular pores may also become stabilized by calcitans and argillans, which are
formed by the transport of eolian-derived CaCO3 and clay into the vesicular horizon with
infiltrating water (Anderson et al., 2002). The decrease in VHI at the oldest site in the
chronosequence (Fig. 2.8) can be attributed to dissection and erosion of this surface
(Meadows et al., 2008). Although the VHI (which includes horizon thickness) decreases
on the oldest surface, the Xve increases (Fig. 2.6b). This suggests that Xve alone may be a
32
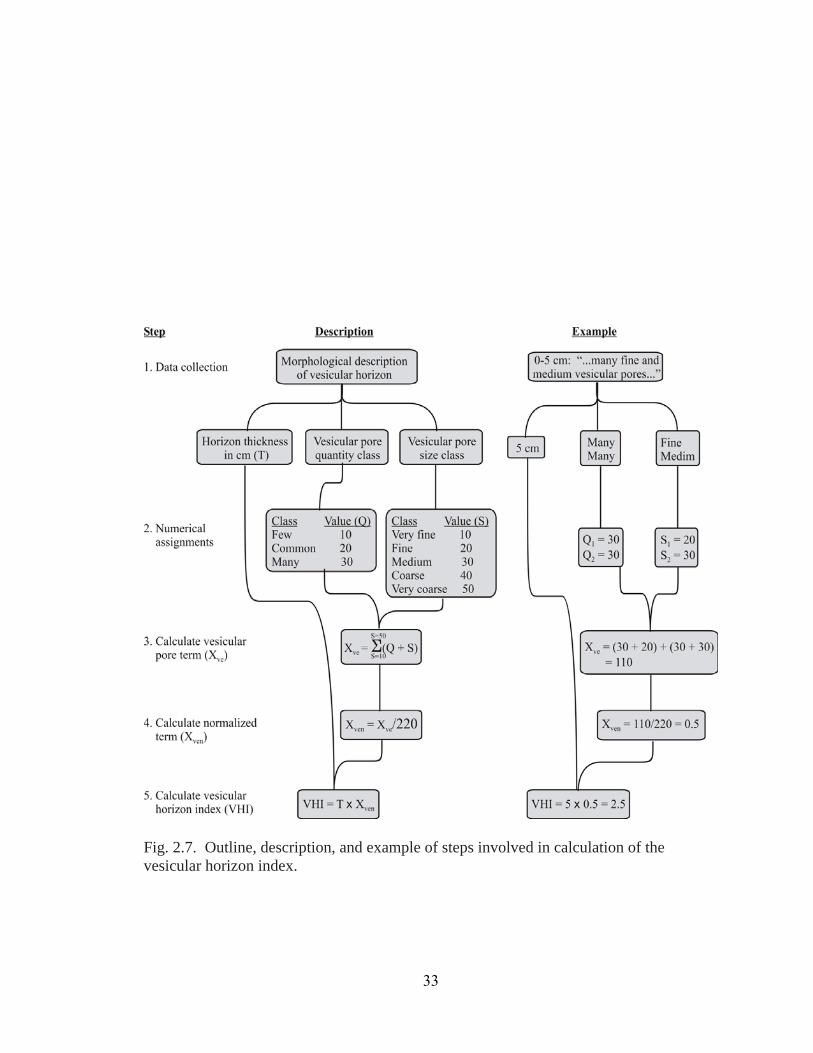
Fig. 2.7. Outline, description, and example of steps involved in calculation of the vesicular horizon index.
33
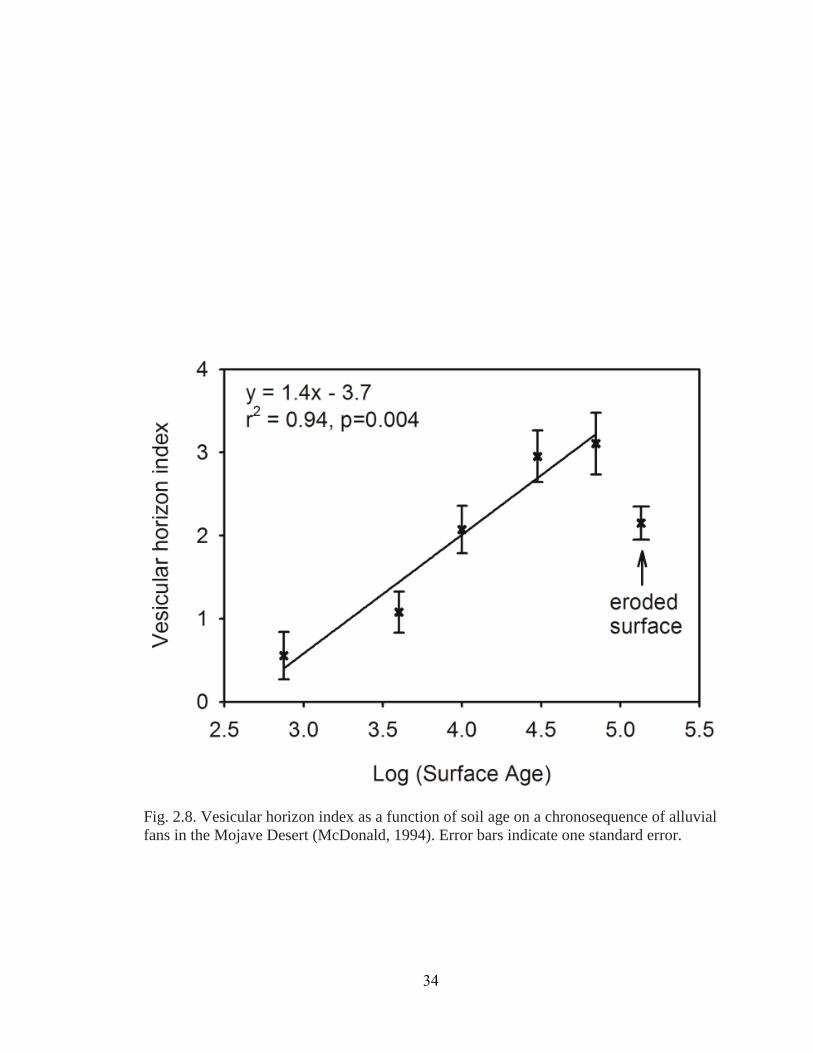
Fig. 2.8. Vesicular horizon index as a function of soil age on a chronosequence of alluvial fans in the Mojave Desert (McDonald, 1994). Error bars indicate one standard error.
34
better indicator of surface age on dissected surfaces where the vesicular horizon has been
partially eroded. However, this would only be true in cases where erosion has been
relatively minor. Severe erosion of well-developed desert soils has been described in
chronosequence studies and attributed to a pedogenic threshold, in which reduced
permeability due to soil development leads to runoff, dissection, and degradation of the
surface (Wells et al., 1985). Under these circumstances the entire vesicular horizon
would be removed and neither Xve nor VHI would be reflective of the soil age.
The VHI is developed here for analyzing trends in vesicular horizon expression
using soil databases, but it may be otherwise useful. The heterogeneity of vesicular
horizons across desert landscapes could be used as an indicator of complex hydrologic
patterns. Previous work has shown the infiltration rate of soils with vesicular horizons is
negatively correlated with the quantity of vesicular pores described in the field
(Blackburn, 1975; Valentin, 1994), as well as with the total porosity calculated from bulk
density (Lebedeva et al., 2009). This suggests that VHI should also be negatively
correlated with infiltration rate, although VHI is slightly different from the vesicular
horizon rating systems used in the correlations described above, because it includes
horizon thickness as well as vesicular porosity. Analysis of chronosequence data in arid
and semi-arid environments may also be aided by use of either the VHI or by including
the Xve term in the calculation of the SDI. Harden (1982) suggested that other terms
could be added as the SDI is applied to chronosequences in various environmental
settings, undergoing different pedogenic processes.
35
VHI relation to ecoregions of the Basin and Range Province
A broad-scale trend across the Basin and Range Province is revealed when soil
descriptions are grouped by Level III Ecoregions (USEPA, 2006a) (Fig. 2.9). The VHI is
higher in the cold deserts (i.e., NBR and CBR) compared to the warm deserts (i.e., MOJ
and SON). Possible regulators of vesicular horizon expression at this broad scale include
paleoclimatic events, modern climatic conditions, and biotic factors.
The drying of pluvial lakes during interpluvial climatic periods exposed fine-
grained sediments to wind erosion, producing vast areas that acted as dust sources.
Episodic dust deposition from these events is an important driver of soil formation
processes in both the warm (McFadden et al., 1986; McFadden, 1988) and cold deserts
(Chadwick and Davis, 1990). The formation of vesicular horizons has been linked to
these periods of abundant dust deposition (McFadden et al., 1998; Anderson et al., 2002).
The distribution of pluvial lakes is one possible explanation for the difference in vesicular
horizon expression between the cold and warm deserts of the Basin and Range Province.
Pleistocene pluvial lakes occupied 27% of the area of cold deserts, but only 5% of the
area of the warm deserts in the United States (extracted from map by Dutch, 1999).
Consequently, sources of the dust that drives vesicular horizon formation are much more
extensive in the cold deserts.
The dynamic nature of vesicular horizons, as observed by some authors (Springer,
1958; Yonovitz and Drohan, 2009), suggests that some destruction and reformation of
vesicular pores is likely to have occurred under modern climatic conditions. Vesicular
porosity has been observed to increase with increasing number of wetting and drying
36
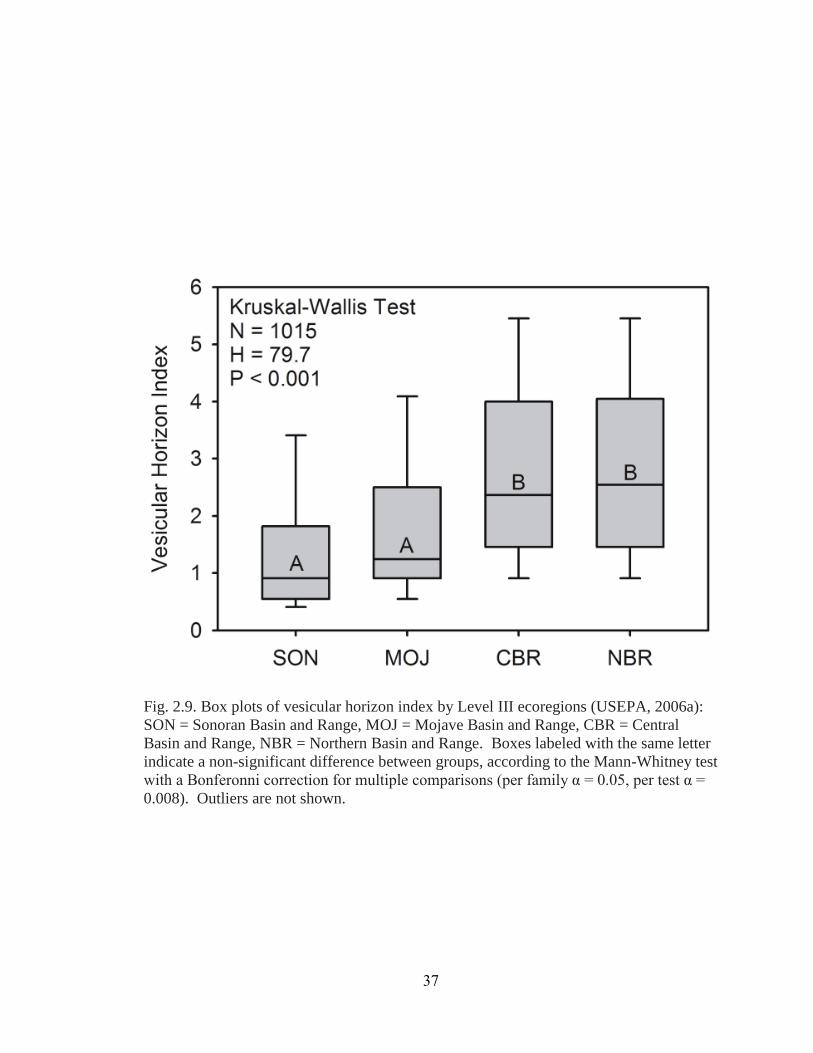
Fig. 2.9. Box plots of vesicular horizon index by Level III ecoregions (USEPA, 2006a): SON = Sonoran Basin and Range, MOJ = Mojave Basin and Range, CBR = Central Basin and Range, NBR = Northern Basin and Range. Boxes labeled with the same letter indicate a non-significant difference between groups, according to the Mann-Whitney test with a Bonferonni correction for multiple comparisons (per family α = 0.05, per test α = 0.008). Outliers are not shown.
37

cycles (Miller; 1971; Figueira and Stoops; 1983) and expansion of vesicular pores is
commonly hypothesized to be driven by thermal expansion (Paletskaya et al., 1958;
Evenari et al., 1974; Bouza et al., 1993; Henning and Kellner, 1994; Brown and
Dunkerley, 1996; McFadden et al., 1998). With these mechanisms in mind, climatic
records were analyzed to derive the annual number of wetting and drying cycles, as well
as the average increase in temperature during drying. The frequency of wetting and
drying cycles was found to increase along the gradient of ecoregions from the SON to the
NBR (Fig. 2.10a), however high variability within each of the ecoregions means that the
difference between the ecoregions was not significant according to ANOVA (p=0.07).
The modern climate may lead to greater vesicular horizon expression in the cold deserts
due to the more frequent precipitation events, which offer more opportunities for
vesicular pore formation and growth, but the high variability of precipitation frequency
clouds the importance of this trend relative to observed differences in VHI between the
ecoregions. Average temperature increase during drying was actually lowest in the NBR
and highest in the CBR, with intermediate expression in the SON and MOJ (Fig. 2.10b);
therefore difference in thermal expansion does not likely explain the trend in vesicular
horizon expression.
Biotic influences on vesicular horizon distribution include past and present
vegetation types, burrowing animals, and biological soil crusts. Vesicular horizons are
usually not observed, or are weakly expressed, in the undercanopy environment because
of the increased activity of burrowing animals (Shafer et al., 2007) and protective canopy
cover that prevent surface sealing required for vesicular horizons formation (Evenari et
38
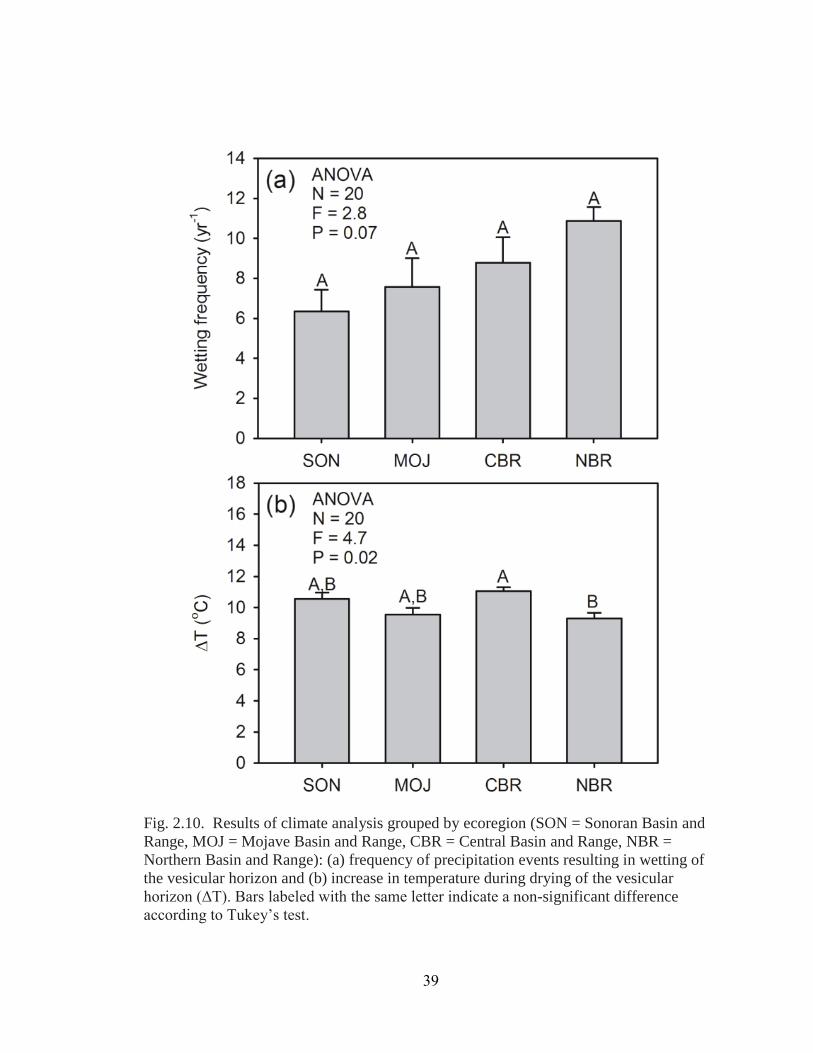
Fig. 2.10. Results of climate analysis grouped by ecoregion (SON = Sonoran Basin and Range, MOJ = Mojave Basin and Range, CBR = Central Basin and Range, NBR = Northern Basin and Range): (a) frequency of precipitation events resulting in wetting of the vesicular horizon and (b) increase in temperature during drying of the vesicular horizon (ΔT). Bars labeled with the same letter indicate a non-significant difference according to Tukey’s test.
39
al., 1974). Bare or clast-covered interspace soils that allow the formation of vesicular
horizons are characteristic of desert scrub communities in both the warm and cold deserts
(Eckert et al., 1978). In the Mojave Desert vesicular horizons occur in three vegetation
communities that occur with increasing elevation: creosote (840 m), blackbush (1400 m),
and pinyon-juniper (1750 m), but do not occur in the higher elevation fir-pine forests
(Amundson et al., 1989). Contrary to our findings, weaker expression of vesicular
horizons was observed in the Great Basin steppe community that occurs at high
elevations in the Mojave Desert (Quade, 2001). In that study, the weak expression of
vesicular horizons in the high elevation zones was attributed to the disruption of desert
pavement by vegetation advances during the last glacial maximum. However,
subsequent studies in the Mojave Desert have suggested that desert pavements recover
rapidly from disruption due to vegetation advances (Valentine and Harrington, 2006;
Pelletier et al., 2007). Considering the rapid formation of vesicular pores under favorable
conditions (Yonovitz and Drohan, 2009), it is also likely that vesicular horizons were
only temporarily affected by past vegetation advances. Vesicular horizons have been
observed to reform in plant scars, which are microtopographic features left by the death
of long-lived perennial vegetation, even though these areas were mixed by burrowing
animals that inhabited the undercanopy environment during the life of the plant
(McAuliffe and McDonald, 2006). Given these considerations, differences in past or
modern vegetation are unlikely to explain differences in vesicular horizon expression
among the deserts of the Basin and Range Province. Vesicular horizons are observed
across a range of plant communities, as long as bare interspace is present, and are
40
unlikely to be significantly impacted by past vegetation advances that may have
decreased or eliminated the bare interspace.
Biological soil crusts are a biotic factor that may have more direct influence on
vesicular horizons. Biological soil crusts have been observed growing directly on
vesicular horizons (Danin et al., 1998; Joeckel and Clement, 1999; Cantόn et al., 2003).
Moss-lichen crust can promote vesicular horizon formation by trapping dust (Williams et
al., 2010). Biological soil crusts of the hot and cold desert display differences in
morphology; having a prominent pinnacled microtopography in the cold deserts and a
smooth microtopography and cryptic appearance in the hot deserts (Belnap et al., 2001).
This difference in microtopography suggests a stronger dust-trapping capacity by the
biological soil crusts in the cold desert, which could impact vesicular horizon formation.
VHI relation to other soil properties
The median VHI was lowest in soils with hyperthermic temperature regimes,
higher in thermic soils, and highest in mesic and frigid soils (Fig. 2.11a). Due to the
smaller number of cryic soils, the median VHI was not significantly different from the
other temperature regimes, except for the hyperthermic soils. The reason for the
relationship between VHI and soil temperature regime cannot be evaluated from the
purely observational data presented here. This relationship is difficult to separate from
that described above between VHI and ecoregions of the Basin and Range Province.
While both relationships suggest that vesicular horizons are better expressed in soils of
colder environments, the relationship may be an artifact of another factor that influences
41
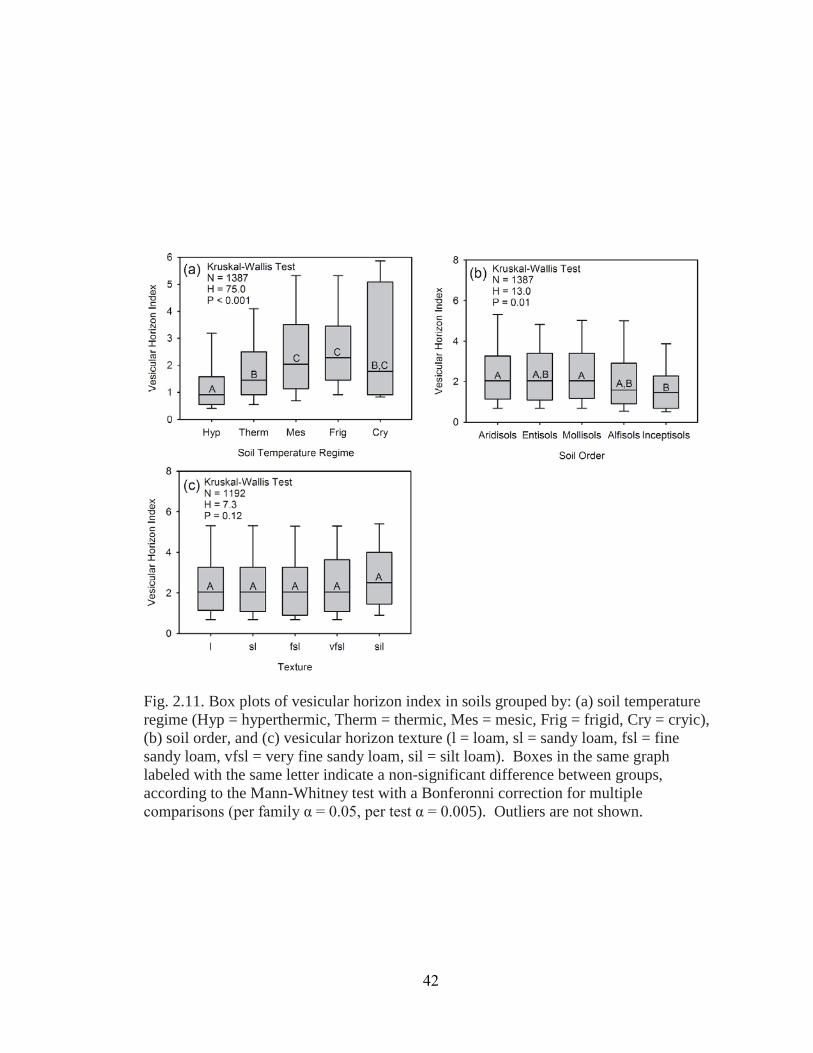
Fig. 2.11. Box plots of vesicular horizon index in soils grouped by: (a) soil temperature regime (Hyp = hyperthermic, Therm = thermic, Mes = mesic, Frig = frigid, Cry = cryic), (b) soil order, and (c) vesicular horizon texture (l = loam, sl = sandy loam, fsl = fine sandy loam, vfsl = very fine sandy loam, sil = silt loam). Boxes in the same graph labeled with the same letter indicate a non-significant difference between groups, according to the Mann-Whitney test with a Bonferonni correction for multiple comparisons (per family α = 0.05, per test α = 0.005). Outliers are not shown.
42
vesicular horizon formation, such as the prevalence of pluvial dry lakes that act as dust
sources in those areas.
Analysis of VHI by soil order shows that VHI is significantly higher in Aridisols
and Mollisols compared to Inceptisols (Fig. 2.11b). The aridic moisture regime of the
Aridisols, and most of the Entisols in the dataset, may explain why soils in these orders
tend to have high VHIs. Vesicular horizons are better expressed in arid soils because of
greater rates of dust deposition (McFadden, 1988; McFadden et al., 1998), exposure to
cyclic wetting and drying (Springer, 1958; Miller, 1971; Evenari et al., 1974; Figueira
and Stoops, 1983), and sparse vegetation cover, which allows more extensive surface
sealing (Evenari et al, 1974). The high VHI of the Mollisols is contrary to the common
perception that vesicular horizons are associated with low organic matter soils
(Blackburn, 1975). The median organic carbon content of Mollisols in our data set is
1.5%, more than double the median organic carbon content for all of the soil orders in the
dataset together (0.7%). The organic carbon content of the Mollisols with vesicular
horizons is apparently not sufficient to stabilize aggregates and prevent formation of
vesicular pores.
The median VHI is not significantly different among any of the most common
vesicular horizon textures (Fig. 2.11c). The median VHI was slightly higher in soils with
silt loam textures, but was not significantly different from the other commonly observed
textures according to the statistical analysis. This result suggests that all of the most
common textures observed in vesicular horizons (loam, sandy loam, fine sandy loam,
very fine sandy loam, and silt loam) are equally conducive to vesicular horizon
43
formation. Previous studies have demonstrated that vesicular porosity can form across a
similar range of soil textures (Peterson; 1980; Yonovitz and Drohan, 2009). Coarser
textures (e.g., sands and loamy sands) and finer textures (e.g., clay loams) are much less
common in vesicular horizons (Fig. 2.6). Thus, coarse-textured parent material may
require substantial alteration, typically through eolian additions, to allow vesicular
horizon formation. On the other hand, extensive weathering and clay accumulation may
lead to textures that are too clay-rich to support vesicular pore formation. This is thought
to occur in some settings where eolian deposition allows the formation of a new vesicular
horizon at the surface, while the buried vesicular horizon becomes increasingly enriched
in clay and is transformed to a B horizon (McFadden, 1988).
SUMMARY AND CONCLUSIONS
Soil databases were used to analyze a large dataset, including 1387 soils with
vesicular horizons, spanning the western half of the United States. We estimate that there
are 156,000 km2 of soils with vesicular horizons in the western United States, mostly
within the arid Basin and Range Province. Vesicular horizons have highly variable
chemical properties (organic C, electrical conductivity, ESP, pH, CaCO3), reflecting the
diversity of soil-forming environments in which they occur. The VHI, calculated from
horizon thickness and size and quantity of vesicular pores, was developed and used to
quantify vesicular horizon expression. Application of the VHI using the soil databases
revealed that the strongest expression of the vesicular horizon occurs in the cold deserts
(i.e., NBR and CBR ecoregions) and in soils with mesic and frigid temperature regimes.
44
The association of strongly-developed vesicular horizons with cold soils may be due to a
confounding factor, such as the large extent of pluvial dry lake beds that act as sources of
dust in the cold deserts of the Basin and Range Province. Only weak associations were
found between soil order and VHI, with the highest VHI occurring in the Aridsols and
Mollisols. There was no significant difference in VHI among vesicular horizons with
different textures (loam, sandy loam, fine sandy loam, very fine sandy loam, and silt
loam). Other textures are rarely observed in the vesicular horizon. The cause of the
trends presented here cannot be evaluated based on the observational methods used in
this study, however, the results suggest hypotheses that may be tested experimentally in
future studies.
45
REFERENCES
Abdi, H. The Bonferroni and Šidák corrections for multiple comparisons. p. 103-106. In N. Salkind and K. Rasmussen (eds). Encyclopedia of Measurement and Statistics. SAGE Publications, Thousand Oaks, CA.
Adelsberger, K.A., and J.R. Smith. 2009. Desert pavement development and landscape
stability on the Eastern Libyan Plateau, Egypt. Geomorphology 107:178-194. Amit, R., and R. Gerson. 1986. The evolution of Holocene reg (gravelly) soils in deserts -
an example from the Dead Sea region. Catena 13:59-79. Amundson, R.G., O.A. Chadwick, J.M. Sowers, and H.E. Doner. 1989. Soil evolution
along an altitudinal transect in the eastern Mojave Desert of Nevada, USA. Geoderma 43:349-371.
Anderson, K., S. Wells, and R. Graham. 2002. Pedogenesis of vesicular horizons, Cima
Volcanic Field, Mojave Desert, California. Soil Sci. Soc. Am. J. 66:878-887. Belnap, J., R. Rosentreter, S. Leonard, J.H. Kaltenecker, J. Williams, and D. Eldridge.
2001. Biological soil crusts: Ecology and management. USDI-BLM Printed Materials Distribution Center, Denver, CO.
Blackburn, W.H. 1975. Factors influencing infiltration and sediment production of
semiarid rangelands in Nevada. Water Resour. Res. 11:929-937. Bockheim, J.G. 2010. Evolution of desert pavements and the vesicular layer in soils of
the Transantarctic Mountains. Geomorphology 118:433-443. Bouza, P., H.F. Delvalle, and P.A. Imbellone. 1993. Micromorphological, physical, and
chemical characteristics of soil crust types of the central Patagonia region, Argentina. Arid Soil Res. and Rehabilitation 7:355-368.
Brown, K.J., and D.L. Dunkerley. 1996. The influence of hillslope gradient, regolith
texture, stone size and stone position on the presence of a vesicular layer and related aspects of hillslope hydrologic processes: A case study from the Australian arid zone. Catena 26:71-84.
Cantόn, Y., A. Solé-Benet, and R. Lázaro. 2003. Soil-geomorphology relations in
gypsiferous materials of the Tabernas Desert (Almeria, SE spain). Geoderma 115:193-222.
Chadwick, O.A., and J.O. Davis. 1990. Soil-forming intervals caused by eolian sediment
pulses in the Lahontan basin, northwestern Nevada. Geology 18:243-246.
46
Danin, A., I. Dor, A. Sandler, and R. Amit. 1998. Desert crust morphology and its
relations to microbiotic succession at Mt. Sedom, Israel. J. Arid. Environ. 38:161-174.
Dutch, S. 1999. Pleistocene glaciers and geography [Online]. Available by University of
Wisconsin - Green Bay. <http://www.uwgb.edu/dutchs/earthsc202notes/ glacgeog.htm> (verified 22 Feb. 2011).
Eckert, R.E., M.K. Wood, W.H. Blackburn, F.F. Peterson, J.L. Stephens, and M.S.
Meurisse. 1978. Effects of surface-soil morphology on improvement and management of some arid and semiarid rangelands, p. 299-301. Proceedings of the First International Rangeland Congress. Society for Range Management, Denver, CO.
Eckert, R.E., M.K. Wood, W.H. Blackburn, and F.F. Peterson. 1979. Impacts of off-road
vehicles on infiltration and sediment production of two desert soils. J. Range Manage. 32:394-397.
Ellis, F. 1990. Note on soils with vesicular structure and other micromorphological
features in Karoo soils., pp. 326-336. 16th Congress of the Soil Science Society of South Africa, Pretoria.
ESRI. 2008. ArcGIS 9.3. Esri, Redlands, CA. Evenari, M., D.H. Yaalon, and Y. Gutterman. 1974. Note on soils with vesicular structure
in deserts. Z. Geomorphol. 18:162-172. Figueira, H., and G. Stoops. 1983. Application of micromorphometric techniques to the
experimental study of vesicular layer formation. Pedologie 33:77-89. Gile, L.H., and J.W. Hawley. 1968. Age and comparative development of desert soils at
Gardner Spring radiocarbon site, New Mexico. Soil Sci. Soc. Am. Proc. 32:709-716.
Goossens, D., and B. Buck. 2009. Dust emission by off-road driving: Experiments on 17
arid soil types, Nevada, USA. Geomorphology 107:118-138. Gustafson, D.L. 2003. Web interface and graphical locator. [Online]. Available by
Montana State University <http://www.esg.montana.edu/gl/trs-data.html> (verified Sept. 14, 2010).
47
Hamerlynck, E.P., J.R. McAuliffe, E.V. McDonald, and S.D. Smith. 2002. Ecological responses of two Mojave Desert shrubs to soil horizon development and soil water dynamics. Ecology 83:768-779.
Harden, J.W. 1982. A quantitative index of soil development from field descriptions:
Examples from a chronosequence in central California. Geoderma 28:1-28. Henning, J.A.G., and K. Kellner. 1994. Degradation of a soil (Aridosol) and vegetation in
the semiarid grasslands of southern Africa. Bot. Bull. Acad. Sin. 35:195-199. Hirmas, D.R., and R.C. Graham. 2011. Pedogenesis and soil-geomorphic relationships in
an arid mountain range, Mojave Desert, California. Soil Sci. Soc. Am. J. 75:192-206.
Joeckel, R.M., and B.A. Clement. 1999. Surface features of the Salt Basin of Lancaster
County, Nebraska. Catena 34:243-275. Lebedeva, M.P., D.L. Golovanov, and S.A. Inozemtsev. 2009. Microfabrics of desert
soils of Mongolia. Euras. Soil Sci. 42:1204-1217. McAuliffe, J.R. 1994. Landscape evolution, soil formation, and ecological patterns and
processes in Sonoran Desert bajadas. Ecological Monogr. 64:111-148. McAuliffe, J.R., and E.V. McDonald. 2006. Holocene environmental change and
vegetation contraction in the Sonoran Desert. Quat. Res. 65:204-215. McDonald, E.V. 1994. The relative influences of climatic change, desert dust, and
lithologic control on soil-geomorphic processes and soil hydrology of calcic soils formed on quaternary alluvial-fan deposits in the Mojave Desert, California. Ph.D. Dissertation, The University of New Mexico, Albuquerque, NM.
McDonald, E.V. 2008. Soil formation in the Mojave Desert: New TCN information
suggests rates of soil formation may exceed previously established rates. GSA-SSSA-ASA-CSA-GCAGS-HGS Joint Annual Meeting, Houston, TX.
McFadden, L.D., S.G. Wells, and J.C. Dohrenwend. 1986. Influences of Quaternary
climatic changes on processes of soil development on desert loess deposits of the Cima Volcanic Field, California. Catena 13:361-389.
McFadden, L.D., S.G. Wells, and M.J. Jercinovich. 1987. Influences of eolian and
pedogenic processes on the origin and evolution of desert pavements. Geology 15:504-508.
48
McFadden, L.D. 1988. Climatic influences on rates and processes of soil development in Quaternary deposits of southern California. Geol. Soc. Am. Spec. Paper 216:153-177.
McFadden, L.D., S.G. Wells, W.J. Brown, and Y. Enzel. 1992. Soil genesis on beach
ridges of pluvial Lake Mojave: Implications for Holocene lacustrine and eolian events in the Mojave Desert, southern California. Catena 19:77-97.
McFadden, L.D., E.V. McDonald, S.G. Wells, K. Anderson, J. Quade, and S.L. Forman.
1998. The vesicular layer and carbonate collars of desert soils and pavements: formation, age and relation to climate change. Geomorphology 24:101-145.
Meadows, D.G., M.H. Young, and E.V. McDonald. 2008. Influence of relative surface
age on hydraulic properties and infiltration on soils associated with desert pavements. Catena 72:169-178.
Miller, D.E. 1971. Formation of vesicular structure in Soil. Soil Sci. Soc. Am. Proc.
35:635-637. Miller, D.M., D.R. Bedford, D.L. Hughson, E.V. McDonald, S.E. Robinson, and K.M.
Schmidt. 2009. Mapping Mojave Desert ecosystem properties with surficial geology. p. 225-251. In R. H. Webb, et al. (eds.) The Mojave Desert: Ecosystem Processes and Sustainability. University of Nevada Press, Reno, NV.
Minitab. 2007. MINITAB 15. Minitab, State College, PA. Musick. 1975. Barrenness of desert pavement in Yuma County, Arizona. J. Arizona
Acad. Sci. 10:24-28. Noller, J.S. 1993. Late Cenozoic stratigraphy and soil geomorphology of the Peruvian
Desert, 3o-18oS: A long-term record of hyperaridity and El Niño. Ph.D. Dissertation, University of Colorado, Boulder.
Painter, T.H., J.S. Deems, J. Belnap, A.F. Hamlet, C.C. Landry, and B. Udall. 2010.
Response of Colorado River runoff to dust radiative forcing in snow. Proc. Natl. Acad. Sci. USA 107:17125-17130.
Paletskaya, L.N., A.P. Lavrov, and S.I. Kogan. 1958. Pore formation in takyr crust. Sov.
Soil Sci. (Engl. Transl.) 3:245-250. Pelletier, J.D., M. Cline, and S.B. DeLong. 2007. Desert pavement dynamics: numerical
modeling and field-based calibration. Earth Surf. Process. Landforms 32:1913-1927.
49
Peterson, F.F. 1980. Holocene desert soil formation under sodium-salt influence in a playa-margin environment. Quat. Res. 13:172-186.
Peterson, F.F. 1981. Landforms of the Basin and Range Province: Defined for soil
survey. Nevada Agric. Experiment Station Tech. Bull. 28. University of Nevada, Reno.
Quade, J. 2001. Desert pavements and associated rock varnish in the Mojave Desert:
How old can they be? Geology 29:855-858. Rossi, A.M. 2009. Soil development and clast weathering on a moraine chronosequence,
eastern Sierra Nevada, California. M.S. Thesis, University of California, Riverside.
Schlesinger, W.H., J.F. Reynolds, G.L. Cunningham, L.F. Huenneke, W.M. Jarrell, R.A.
Virginia, and W.G. Whitford. 1990. Biological feedbacks in global desertification. Science 247:1043-1048.
Schoeneberger, P.J., D.A. Wysocki, E.C. Benham, and W.D. Broderson (eds.) 2002.
Field book for describing and sampling soils, Version 2.0. NRCS National Soil Survey Center, Lincoln, NE.
Shafer, D.S., M.H. Young, S.F. Zitzer, T.G. Caldwell, and E.V. McDonald. 2007.
Impacts of interrelated biotic and abiotic processes during the past 125,000 years of landscape evolution in the Northern Mojave Desert, Nevada, USA. J. Arid Environ. 69:633-657.
Sheskin, D. 2007. Handbook of parametric and nonparametric statistical procedures.
Chapman and Hall, Boca Raton, FL. Smith, J.L., and K. Lee. 2003. Soil as a source of dust and implications for human health.
Adv. Agron. 80:1-32. Soil Survey Division Staff. 1993. Soil Survey Manual. USDA, Washington, DC. Soil Survey Staff. 2007. Soil Extent Mapping Tool [Online]. Available by USDA-NRCS
<http://www.cei.psu.edu/soiltool/semtool.html> (verified 31 August 2010). Soil Survey Staff. 2009a. Official Soil Series Descriptions [Online]. Available by USDA-
NRCS <http://soils.usda.gov/technical/classification/osd/index.html> (verified 24 June 2009).
50
Soil Survey Staff. 2009b. National Soil Survey Characterization Data, Soil Survey Laboratory, National Soil Survey Center [Online]. Available by USDA-NRCS <http://ssldata.nrcs.usda.gov/querypage.asp> (verified 29 June 2009).
Springer, M.E. 1958. Desert pavement and vesicular layer of some soils of the desert of
the Lahontan Basin, Nevada. Soil Sci. Soc. Am. Proc. 22:63-66. Sullivan, L.A., and A.J. Koppi. 1991. Morphology and genesis of silt and clay coatings in
the vesicular layer of a desert loam soil. Aust. J. Soil. Res. 29:579-586. Ugolini, F.C., S. Hillier, G. Certini, and M.J. Wilson. 2008. The contribution of aeolian
material to an Aridisol from southern Jordan as revealed by mineralogical analysis. J. Arid Environ. 72:1431-1447.
USDA-NRCS. 2006. Digital General Soil Map of U.S [Online]. Available by USDA-
NRCS <http://SoilDataMart.nrcs.usda.gov> (verified 7 Nov. 2010). USEPA. 2006a. Omernik’s Level III ecoregions of the continental United States [Online].
Available by National Atlas of the United States <http://nationalatlas.gov/ atlasftp.html> (verified 22 Aug. 2009).
USEPA. 2006b. Ecological regions of North America [Online]. Available by USEPA
< http://www.epa.gov/wed/pages/ecoregions/na_eco.htm> (verified 9 Mar. 2011).
USGS, 1997. Distribution of Non-Polar Arid Lands [Online]. Available by USGS
<http://pubs.usgs.gov/gip/deserts/what/world.html> (verified 25 Jan. 2011). U.S. Regional Salinity Laboratory. 1954. Diagnosis and improvement of saline and alkali
soils. Agricultural Handbook No. 60. USDA, Washington, DC. Valentin, C. 1994. Surface sealing as affected by various rock fragment covers in West-
Africa. Catena 23:87-97. Valentine, G.A., and C.D. Harrington. 2006. Clast size controls and longevity of
Pleistocene desert pavements at Lathrop Wells and Red Cone volcanoes, southern Nevada. Geology 34:533-536.
Wells, S.G., J.C. Dohrenwend, L.D. McFadden, B.D. Turrin, and K.D. Mahrer. 1985.
Late Cenozoic landscape evolution on lava flow surfaces of the Cima volcanic field, Mojave Desert, California. Geol. Soc. Am. Bull. 96:1518-1529.
51
Wells, S.G., L.D. McFadden, J. Poths, and C.T. Olinger. 1995. Cosmogenic 3He surface-exposure dating of stone pavements: Implications for landscape evolution in deserts. Geology 23:613-616.
Western Regional Climate Center. 2011. RAWS USA Climate Archive. Available by
Desert Research Institute < http://www.raws.dri.edu/> (verified 10 Mar. 2011). Williams, A., B. Buck, D. Soukup, and D. Merkler. 2010. Biological soil crusts and the
fertile island effect: Soil-geomorphic insights from the Mojave Desert, USA. ASA-CSSA-SSSA International Annual Meetings, Long Beach, CA.
Wood, M.K., W.H. Blackburn, R.E. Eckert, and F.F. Peterson. 1978. Interrelations of
physical-properties of coppice dune and vesicular dune interspace soils with grass seedling emergence. J. Range Manage. 31:189-192.
Wood, Y.A., R.C. Graham, and S.G. Wells. 2005. Surface control of desert pavement
pedologic process and landscape function, Cima Volcanic field, Mojave Desert, California. Catena 59:205-230.
Yonovitz, M., and P.J. Drohan. 2009. Pore morphology characteristics of vesicular
horizons in undisturbed and disturbed arid soils; implications for arid land management. Soil Use Manage. 25:293-302.
Young, M.H., E.V. McDonald, T.G. Caldwell, S.G. Benner, and D.G. Meadows. 2004.
Hydraulic properties of a desert soil chronosequence in the Mojave Desert, USA. Vadose Zone J. 3:956-963.
52
3. DISTURBANCE AND RECOVERY OF VESICUALR HORIZON POROSITY AND HYDRAULIC PROPERTIES UNDER FIELD CONDITIONS
ABSTRACT
Vesicular horizons are common surficial horizons in desert regions that are
critical to the regulation of infiltration and run-off processes. Their position near the soil
surface makes the vesicular horizon susceptible to disturbance by human activities. This
study was conducted to evaluate the recovery of vesicular horizons from disturbance at
field areas with varied vesicular horizon characteristics and climatic conditions. At 15
field sites located across the Sonoran, Mojave, and central Great Basin deserts, vesicular
horizons were artificially disturbed, and allowed to recover for one year. Morphologic
properties of the vesicular horizons were described before disturbance (pre-disturbance),
and again after the one-year recovery period (post-disturbance), and intact samples were
collected for analysis of the pore shape, size, and quantity using X-ray computed
tomography (CT). Infiltration rates were measured in the pre- and post-disturbance soils
using a tension disk infiltrometer. In addition to the artificially disturbed soils, vesicular
horizon morphology was also examined in tire tracks and coppice dunes. Our results
show that vesicular horizon recovery from disturbance was incomplete after one year.
Vesicles and related pore morphologies (i.e., vughs and interconnected pores) were
smaller in the post-disturbance soils, but similar in quantity (i.e., number of pores per
sample volume). The difference in recovery between the field areas was best explained
by the amount of precipitation received during the recovery period. Based on the
relationship between precipitation and vesicular horizon recovery from disturbance, we
predict that a recovery period of two to 11 years is required for complete recovery of
53
vesicular horizon properties. Vesicular horizons in tire tracks were thinner, but the pore
morphology in the CT scans was similar to that of the undisturbed soils. In the vesicular
horizons buried by coppice dunes, the vesicles, vughs, and interconnected pores were
collapsed, resulting in stronger expression of platy structure and smaller pore volumes.
Infiltration rates generally decreased following disturbance. Average saturated hydraulic
conductivity (Ksat) decreased from 0.42 cm hr-1 before disturbance to 0.27 cm hr-1,
following disturbance and recovery. Likewise, Gardner’s α decreased from 0.11 before
disturbance to 0.08 cm-1 following disturbance and recovery. However, the decrease in
both properties (Ksat and α) were statistically insignificant. Through this study we have
found that: 1) recovery of vesicular horizons from disturbance is dependent on the
amount and frequency of precipitation, 2) vesicular pore morphology is substantially
altered in vesicular horizons that are buried by coppice dunes but show less alteration in
tire tracks, and 3) the disturbance of the vesicular horizon does not severely alter the
hydraulic properties.
INTRODUCTION
Vesicular horizons are a widely occurring feature of soils in arid and semi-arid
lands, with critical implications for the surface hydrology of the water-limited ecosystems
in which they occur. Vesicular horizons occur at or near the soil surface and are
characterized by the predominance of discontinuous, nearly spherical vesicular pores.
They occur on every continent on Earth and cover large areas of land in arid and semi-
arid parts regions (Turk and Graham, 2011). For example, vesicular horizons cover
approximately 156,000 km2 of the western United States (Turk and Graham, 2011) and
54
an estimated 94,000 km2 of the Karoo region of South Africa (Ellis, 1990). Within the
arid Basin and Range province of the western United States, vesicular horizons are best
expressed in the cold deserts of the Central and Northern Basin and Range, compared to
the warm deserts of the Mojave and Sonoran Basin and Range (Turk and Graham, 2011).
In addition to the broad-scale trends that explain their global and regional distribution,
vesicular horizons display a fine-scale heterogeneity. They occur extensively in the inter-
canopy soils between shrubs, but are absent or weakly expressed beneath the shrub
canopy (Wood et al., 1978; Shafer et al., 2007).
Variability of surface properties in arid soils leads to heterogeneous infiltration
rates, which control runoff and run-on patterns (Abrahams and Parsons, 1991). Soils
with vesicular horizons have much lower infiltration rates compared to non-vesicular
soils of shrub islands, ephemeral washes, and young alluvial deposits (Turk and Graham,
2011). With increasing surface age, there is a reduction in infiltration rates of vesicular
soils, which is not observed when the vesicular horizon is removed and infiltration is
measured directly into the underlying horizon (Young et al., 2004) or when infiltration
rates are measured in the non-vesicular soils in the shrub islands (Shafer et al., 2007).
Negative correlations have been observed between the amount of vesicular porosity in the
surface horizon and infiltration rates (Blackburn, 1975; Valentin, 1994; Lebedeva et al.,
2009).
Soil development in desert landscapes generally leads to increased plant water
stress and a shift towards more xerophytic vegetation communities. The development of
fine-textured vesicular and argillic horizons causes water to be held closer to the soil
55
surface, where it is more rapidly lost to evaporation, compared to water stored deeper in
the soil (Noy-Meir, 1973; McAuliffe, 1994; Smith et al., 1995; Hamerlynck et al., 2002;
Shafer et al., 2007). Root restrictive petrocalcic horizons prevent the extraction of water
from greater depths in the soil (McAuliffe, 1994; Smith et al., 1995; Stevenson et al.,
2009). Additionally, restrictive surface layers (i.e., desert pavement and vesicular
horizons) favor runoff over leaching, which limits the plant water supply and leads to
decreased leaching of salts and plant osmotic stress due to high soil salinity (Musick,
1975; Wood et al., 2005). With increasing soil development, vegetation becomes more
restricted to shrub islands and ephemeral washes, where run-on accumulates (Noy-Meir,
1973; Musick, 1975; McAuliffe, 1994).
Because of their rapid formation, vesicular horizons have been called a
“diagnostic feature” of desert pedogenesis and the corresponding shift towards a more
arid ecosystem (Lebedeva et al., 2009). Desert shrub communities are favored by
heterogeneity of soil resources, including water (Schlesinger, 1990). Expansion of
vesicular horizons has been observed in association with degradation of rangelands in
northern Nevada (Eckert et al., 1986a) and southern Africa (Henning and Kellner, 1994).
Vesicular horizons present a challenge to rangeland restoration projects due to poor
seedling establishment (Wood et al., 1978), and the effects of slaking and crusting (Wood
et al., 1982) and polygonal cracking (Eckert et al., 1986b), on the success of typical
seeding methods.
Vesicular horizons are usually one to 10 cm thick (Miller, 1971; Evenari et al., 1974;
Wood et al., 1978; Peterson, 1980; Dan et al., 1982; Van Vliet-Lanoё, 1985; Amundson et al.,
56
1989; McDonald et al., 1995; Joeckel and Clement, 1999; Quade, 2001; Ugolini et al., 2008;
Miller et al., 2009; Yonovitz and Drohan, 2009; Turk and Graham, 2011). The vesicular pores
range from less than one to a few mm in diameter (Evenari et al., 1974; Joeckel and
Clement, 1999; Anderson et al., 2002) and can be equant, oblate, or prolate in shape, with
smooth walls (Brewer, 1976; Sullivan and Koppi, 1991; Stoops, 2003). Vesicular pores
are typically largest in the upper few mm of the vesicular horizon and smaller with
increased depth (Hugie and Passey, 1964; Bouza et al., 1993). Vesicular horizons may be
massive or platy, or they may have a primary structure consisting of columns or prisms
that part to a secondary platy structure (Springer, 1958; Peterson, 1980; McFadden et al.,
1998; Anderson et al., 2002; Caldwell et al., 2006). The platy structure is formed by
fissures interconnecting large vesicles along a horizontal plane, which creates a plane of
weakness that can be ruptured under minimal pressure (Brewer, 1976; Figueira and
Stoops, 1983; Anderson et al., 2002). In cold deserts, freeze-thaw processes may
contribute to the formation of polygonal structure and frost lenses may be a factor in
platy structure formation (Hugie and Passey, 1964). Vesicular horizons occur primarily
in soils with silt loam, loam, and sandy loam textures (Springer, 1958; Peterson, 1980;
Wood et al., 1982; McFadden et al., 1998; Turk and Graham, 2011). Vesicular horizons
may occur in soils with a wide-range of chemical and mineralogical properties. They
have been described in soils with smectitic clays (Ugolini et al., 2008), kaolinitic clays
(Sullivan and Koppi, 1991), and mixed clay mineralogy (Amundson et al., 1989). They
often contain calcium carbonate, but also occur in non-calcareous soils (Bunting, 1977;
Bockheim, 2010; Turk and Graham, 2011). Vesicular horizons are most often non-saline
57
(0.8-2.3 dS m-1), non-sodic (1-6% exchangeable Na), with slight to moderate alkalinity
(pH 7.3-8.4), and low organic carbon content (0.4-1.3%) (Turk and Graham, 2011).
Vesicular pores are formed by the entrapment of air in soil during wetting events
(Hugie and Passey, 1964; Miller, 1971; Figueira and Stoops, 1983; Stoops, 2003).
Bubbles can be observed rising through the vesicular horizon when it is in the fluid,
supersaturated condition (Hugie and Passy, 1964). As the soil dries and hardens, the
bubbles get trapped, forming vesicular pores. Vesicular horizons occur in association
with “sealed” surfaces, which impede the escape of entrapped air. Surfaces that produce
an effective seal include embedded gravels (Evenari et al., 1974; Figueira and Stoops,
1983; Valentin, 1994), physical crusts (Hugie and Passey, 1964; Miller, 1971; Brewer,
1976; Evenari et al., 1974; Hillel, 1998; Cantόn et al., 2003), and biological surface crusts
(Evenari et al., 1974; Issa et al., 1999; Joeckel and Clement, 1999; Cantόn et al., 2003;
Williams et al., 2010). The entrapment of air and formation of vesicular pores is
promoted by the absence of vegetation, silt-rich textures, and structural instability
(Miller, 1971; Brewer, 1976; Ellis, 1990). Vegetation canopy cover reduces surface
sealing through the dissipation of raindrop kinetic energy, and by promoting the activity
of burrowing animals, which disrupt the surface crust (Abrahams and Parsons, 1991).
Vesicular horizons often occur beneath desert pavement, a mosaic of interlocking rock
fragments that occurs at the soil surface (Wood et al., 2002), formed by entrapment of
dust beneath a monolayer of rock fragments (McFadden et al., 1987; Wells et al., 1995).
The desert pavement stabilizes the soil surface, preventing erosion of the silt-rich eolian
layer, in which a vesicular horizon typically forms. In the Mojave Desert, periods of high
58
eolian activity, caused by the drying of pluvial lakes during the Pleistocene-to-Holocene
transition period, have been hypothesized as a cause of widespread vesicular horizon
formation (McFadden et al., 1998; Anderson et al., 2002).
Vesicular pores can be considered a dynamic feature of the soil. Chronosquence
studies show that the vesicular horizon is one of the first pedologic features to form in
desert soils (Dan et al., 1982; Reheis et al., 1989; McDonald et al., 1995). Vesicular
pores can be rapidly formed in the lab by subjecting crushed soil material to repeated
wetting and drying cycles (Springer, 1958; Miller, 1971; Evenari et al., 1974; Figueira
and Stoops, 1983). In the field, vesicular pores can reform in disturbed vesicular
horizons in as little as three to four months (Yonovitz, 2008). Vesicular horizons are
often observed in geomorphic settings characterized by active deposition and erosion.
They have been observed beneath playa crusts that are subject to disintegration, wind
erosion, and burial by water-born sediments (Paletskaya et al., 1958; Evenari et al.,
1974). Vesicular pores have been observed beneath biological and physical surface
crusts in semi-arid badlands, where soil development is generally limited by high erosion
rates (Cantόn et al., 2003). Thin, patchy vesicular horizons (1-5 mm thick) have been
observed on recent alluvial deposits (<100 yr old) (Gile and Hawley, 1968), and 1-cm
thick vesicular horizons have been observed on alluvial surfaces with evidence of active
transport (Peterson, 1980). In Arctic soils, transient vesicular layers are observed, which
form in a thin layer of silt deposited by snowmelt and then erode in response to rainfall
(Bunting, 1977). Vesicular pores have also been observed in sediments resulting from
human modification of the landscape, including sediments infilling irrigation furrows
59
(Miller, 1971; Eckert et al. 1978) and sediments infilling tire tracks (Gile and Hawley,
1968).
In certain geomorphic settings, however, vesicular pores can be a stable feature
that develops with soil age. In particular, surfaces with desert pavement may be stable
for long periods of time. Desert pavement-mantled surfaces exceeding one million yrs
old have been observed in the Negev Desert in Israel (Matmon et al., 2009) and in the dry
valleys of Antarctica (Bockheim, 2010). In a chronosequence of alluvial fan deposits
with desert pavement in the Mojave Desert, the thickness and vesicular porosity of the
vesicular horizon increases with age in soils ranging up to 70,000 yrs old (McDonald et
al., 1995; Turk and Graham, 2011). In vesicular horizons formed in such stable settings,
clay, fine silt, and carbonate coatings lining the vesicular pores may reinforce them
against collapse (Sullivan and Koppi, 1991; McFadden et al., 1998; Anderson et al.,
2002). As many as 12 discrete layers have been observed within these coatings,
suggesting the stability of the pores over successive wetting events (Sullivan and Koppi,
1991). In laboratory studies, the size of the vesicular pores increases with increasing
number of wetting and drying cycles, indicating that the pores develop over successive
wetting events (Miller, 1971; Figueira and Stoops, 1983), rather than being destroyed and
reformed with each wetting event, as some observers have suggested (Springer, 1958;
Hugie and Passey, 1964).
Desert lands in the western United States are subject to many forms of
anthropogenic disturbance, including off-highway vehicle use, grazing, agriculture,
urbanization, roads and utility corridors, and military training exercises (Lovich and
60
Bainbridge, 1999). In addition to existing activities that disturb desert lands, interest in
developing the solar and wind power resources of deserts is bringing increasing human
activity to desert lands. Currently, 73,000 km2 of desert lands are under review for use in
solar power generation (Associated Press, 2010). Disturbance of desert soils leads to the
destruction of surface features that stabilize the soil, including biological surface crusts,
physical crusts, and desert pavements (Lovich and Bainbridge, 1999). Off-highway
vehicle use on vesicular soils leads to increased sediment loss with runoff (Eckert et al.,
1978) and high rates of dust mobilization (Goossens and Buck, 2009). Disturbance of
desert lands by military tracked vehicles leads to increase soil bulk density, increased
penetration resistance, loss of fine particles, and loss of structure and macroporosity
(Caldwell et al., 2006). Track scars on desert pavement are long-lasting features, which
are still visible 60 years after abandonment of training grounds (Gilewitch, 2004).
Vesicular horizons associated with desert pavements are also subject to
disturbance and recovery due to vegetation advances and contractions associated with
climatic change. The most recent climatic transition from the Pleistocene pluvial climate
to the drier Holocene climate is thought to have caused a decrease in vegetation cover
throughout the lower elevations of the Basin and Range province (Harvey et al., 1999).
Based on these past climatic conditions and associated changes in vegetation cover, it has
been argued that desert pavements above 400 m elevation in the Mojave Desert cannot be
older than latest Pleistocene in age (Quade, 2001). Others have found evidence
suggesting that the desert pavements were not disrupted by past vegetation advances
(Valentine and Harrington, 2006) or recovered rapidly following disturbance (Pelletier et
61
al., 2007). Reformation of desert pavement has been observed in plant scars left by past
vegetation contractions, however, associated vesicular horizons are thinner and have a
coarser texture than vesicular horizons beneath the surrounding desert pavement
(McAuliffe and McDonald, 2006).
This study examined the changes in vesicular horizon morphology and hydraulic
properties that occur with disturbance and recovery of the soil surface. Our objectives
were to: 1) evaluate the recovery of vesicular horizon morphology over one year in
artificially disturbed soils and determine the factors that influence their recovery, 2)
analyze the impact of disturbance on vesicular horizon morphology and porosity in
previously disturbed locations (i.e., tire tracks and coppice dunes), and 3) determine the
influence of disturbance on the hydraulic properties of the vesicular horizons.
MATERIALS AND METHODS
Field methods
Field studies were conducted over a two-year period. In the first year, three study
plots were established at each site, all containing vesicular horizons and an overlying
desert pavement layer. The study plots were approximately 0.3 by 0.3 m in size and
located one to 30 m apart from each other, in places where the desert pavement displayed
a similar clast cover and size distribution. In each plot, infiltration rates were measured
using a 20 cm diam. tension disk infiltrometer. The desert pavement layer was carefully
removed and contact sand was placed at the soil surface, so that continuous contact could
be achieved between the tension disk and the soil. Steady-state infiltration rates were
62
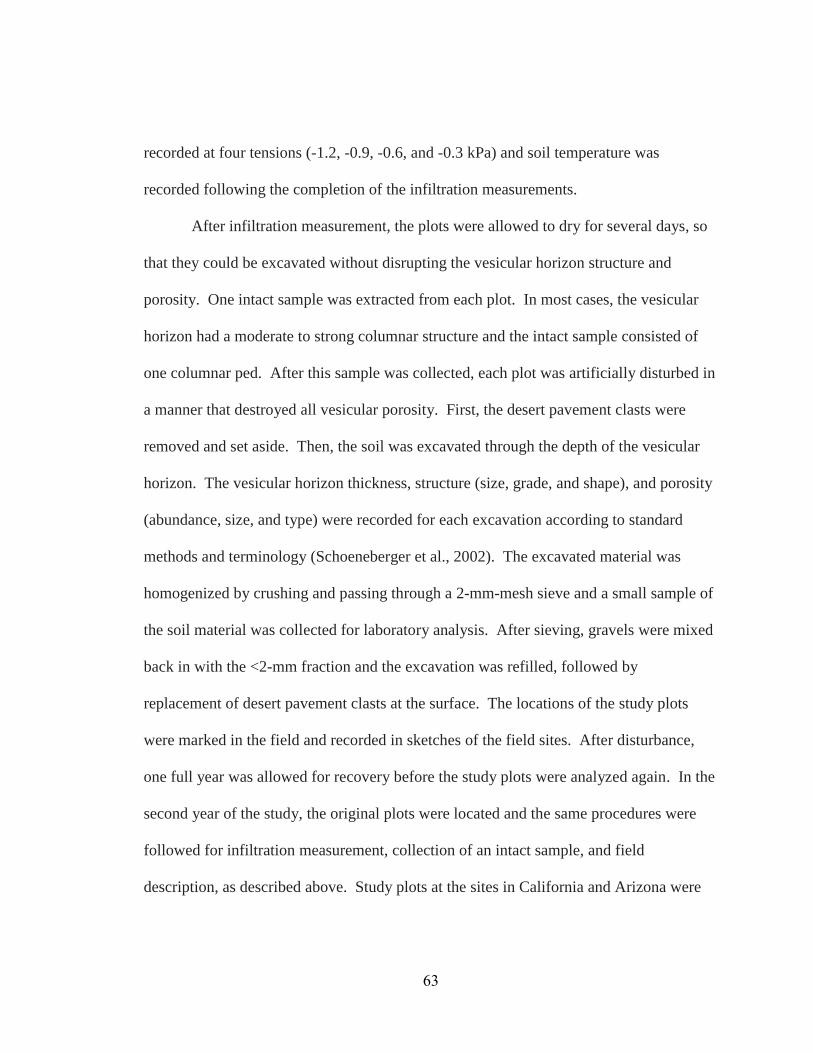
recorded at four tensions (-1.2, -0.9, -0.6, and -0.3 kPa) and soil temperature was
recorded following the completion of the infiltration measurements.
After infiltration measurement, the plots were allowed to dry for several days, so
that they could be excavated without disrupting the vesicular horizon structure and
porosity. One intact sample was extracted from each plot. In most cases, the vesicular
horizon had a moderate to strong columnar structure and the intact sample consisted of
one columnar ped. After this sample was collected, each plot was artificially disturbed in
a manner that destroyed all vesicular porosity. First, the desert pavement clasts were
removed and set aside. Then, the soil was excavated through the depth of the vesicular
horizon. The vesicular horizon thickness, structure (size, grade, and shape), and porosity
(abundance, size, and type) were recorded for each excavation according to standard
methods and terminology (Schoeneberger et al., 2002). The excavated material was
homogenized by crushing and passing through a 2-mm-mesh sieve and a small sample of
the soil material was collected for laboratory analysis. After sieving, gravels were mixed
back in with the <2-mm fraction and the excavation was refilled, followed by
replacement of desert pavement clasts at the surface. The locations of the study plots
were marked in the field and recorded in sketches of the field sites. After disturbance,
one full year was allowed for recovery before the study plots were analyzed again. In the
second year of the study, the original plots were located and the same procedures were
followed for infiltration measurement, collection of an intact sample, and field
description, as described above. Study plots at the sites in California and Arizona were
63
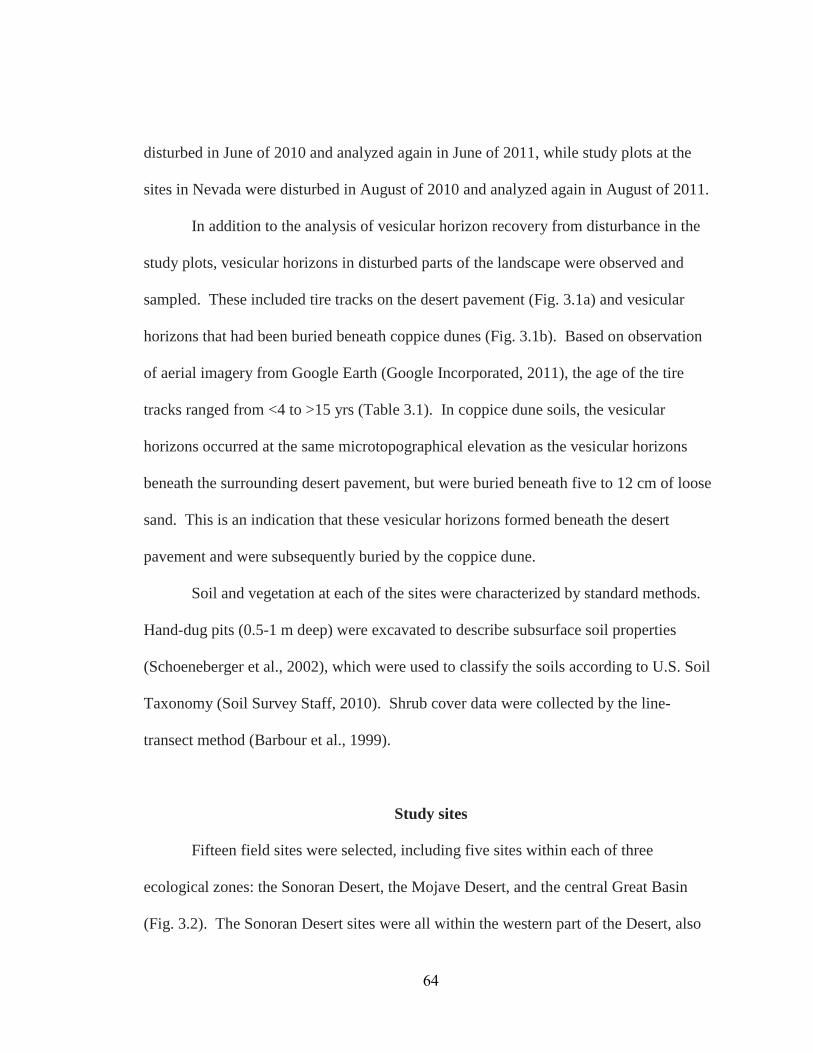
disturbed in June of 2010 and analyzed again in June of 2011, while study plots at the
sites in Nevada were disturbed in August of 2010 and analyzed again in August of 2011.
In addition to the analysis of vesicular horizon recovery from disturbance in the
study plots, vesicular horizons in disturbed parts of the landscape were observed and
sampled. These included tire tracks on the desert pavement (Fig. 3.1a) and vesicular
horizons that had been buried beneath coppice dunes (Fig. 3.1b). Based on observation
of aerial imagery from Google Earth (Google Incorporated, 2011), the age of the tire
tracks ranged from <4 to >15 yrs (Table 3.1). In coppice dune soils, the vesicular
horizons occurred at the same microtopographical elevation as the vesicular horizons
beneath the surrounding desert pavement, but were buried beneath five to 12 cm of loose
sand. This is an indication that these vesicular horizons formed beneath the desert
pavement and were subsequently buried by the coppice dune.
Soil and vegetation at each of the sites were characterized by standard methods.
Hand-dug pits (0.5-1 m deep) were excavated to describe subsurface soil properties
(Schoeneberger et al., 2002), which were used to classify the soils according to U.S. Soil
Taxonomy (Soil Survey Staff, 2010). Shrub cover data were collected by the line-
transect method (Barbour et al., 1999).
Study sites
Fifteen field sites were selected, including five sites within each of three
ecological zones: the Sonoran Desert, the Mojave Desert, and the central Great Basin
(Fig. 3.2). The Sonoran Desert sites were all within the western part of the Desert, also
64
Fig. 3.1. Examples of pre-existing disturbance features sampled during field work: (a) prominent tire tracks on desert pavement and (b) vesicular horizons buried beneath coppice dunes (scale in cm).
65

Table 3.1. Age of tire tracks based on visibility in
aerial imagery† Site Age of tire tracks Evidence yrs S1 >5 Visible in 2006 S2 >6 Visible in 2005 S4 >15 Visible in 1996 S5 <4 Not visible in 2007 M2 <5 Not visible in 2006 M3 >1 Visible in 2010 †Aerial imagery from Google Earth (Google Incorporated, 2011)
66
Fig. 3.2. Location of field sites (S1-S5, M1-M5, and G1-G5) in relation to three ecological zones of the Basin and Range Province (Sonoran, Mojave, and central Great Basin).
67
referred to as the Colorado Desert. All sites were located on alluvial fan surfaces with
desert pavement.
The elevation of the sites ranged from 231 to 457 m in the Sonoran Desert, 574 to
1048 m in the Mojave Desert, and 1426 to 1626 in the central Great Basin (Table 3.2).
The vegetation consisted of creosotebush-bursage scrub communities at the Sonoran and
Mojave Desert sites and saltbush-greasewood scrub communities at the central Great
Basin sites (see Appendix A). The shrub cover at the sites varied between 1.8 and 7.3%
in the Sonoran Desert, 8.3 and 18.8% in the Mojave Desert, and 9.4 to 19.2% in the
central Great Basin (Table 3.2). The lithology of the desert pavements varied among the
sites, and included pavements formed from volcanic, gneissic, limestone, sandstone, and
mixed alluviums (Table 3.2, Appendix A). The soils at the sites were classified as either
Aridisols or Entisols (Table 3.2, Appendix A). The vesicular horizon textures varied
among the sites, but were most often loam or silt loam textures (Table 3.2).
Three sites within each ecological zone had an active weather station nearby
(Table 3.3). Most of the weather stations were at elevations close to the field areas
(within 50 m), with the exception of the Middlegate-Clifford weather station, which was
146 m higher than the G5 field area, and the Mountain Pass 1se weather station, which
was 411 m higher than the M4 field area. For the M4 field area, adjustments for
elevation were made, in order to get a better estimation of mean annual temperature
(MAT) and mean annual precipitation (MAP). To estimate MAT a linear interpolation
was made between the Mountain Pass 1se weather station and a lower elevation weather
station located in Baker, CA (293 m). To account for the effect of elevation on MAP, the
68
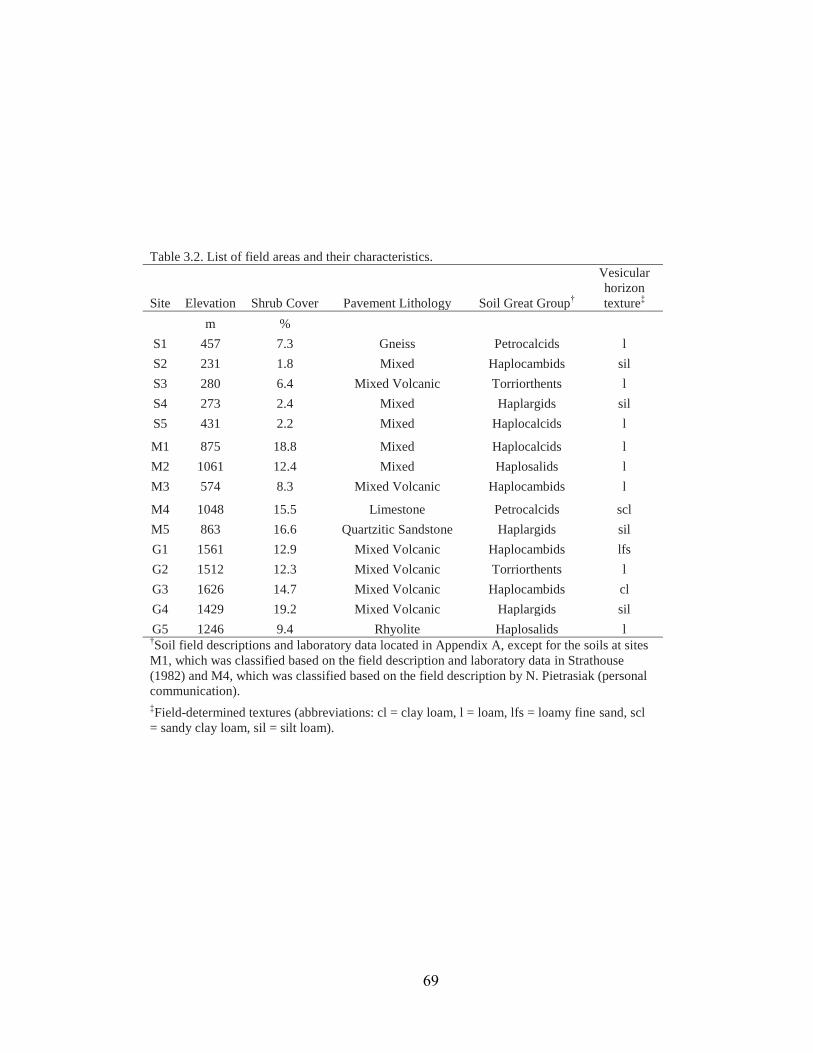
Table 3.2. List of field areas and their characteristics.
Site Elevation Shrub Cover Pavement Lithology Soil Great Group†
Vesicular horizon texture‡
m % S1 457 7.3 Gneiss Petrocalcids l S2 231 1.8 Mixed Haplocambids sil S3 280 6.4 Mixed Volcanic Torriorthents l S4 273 2.4 Mixed Haplargids sil S5 431 2.2 Mixed Haplocalcids l
M1 875 18.8 Mixed Haplocalcids l M2 1061 12.4 Mixed Haplosalids l M3 574 8.3 Mixed Volcanic Haplocambids l
M4 1048 15.5 Limestone Petrocalcids scl M5 863 16.6 Quartzitic Sandstone Haplargids sil G1 1561 12.9 Mixed Volcanic Haplocambids lfs G2 1512 12.3 Mixed Volcanic Torriorthents l G3 1626 14.7 Mixed Volcanic Haplocambids cl G4 1429 19.2 Mixed Volcanic Haplargids sil G5 1246 9.4 Rhyolite Haplosalids l
†Soil field descriptions and laboratory data located in Appendix A, except for the soils at sites M1, which was classified based on the field description and laboratory data in Strathouse (1982) and M4, which was classified based on the field description by N. Pietrasiak (personal communication). ‡Field-determined textures (abbreviations: cl = clay loam, l = loam, lfs = loamy fine sand, scl = sandy clay loam, sil = silt loam).
69
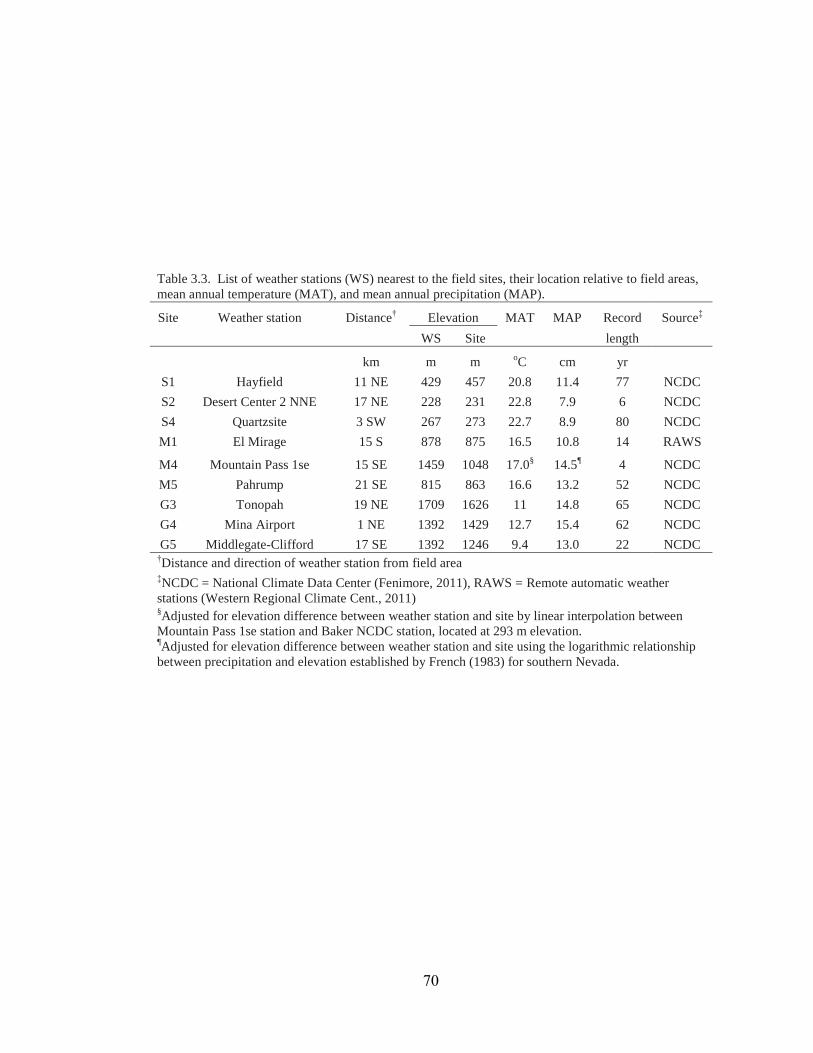
Table 3.3. List of weather stations (WS) nearest to the field sites, their location relative to field areas, mean annual temperature (MAT), and mean annual precipitation (MAP).
Site Weather station Distance† Elevation MAT MAP Record Source‡ WS Site length
km m m oC cm yr S1 Hayfield 11 NE 429 457 20.8 11.4 77 NCDC S2 Desert Center 2 NNE 17 NE 228 231 22.8 7.9 6 NCDC S4 Quartzsite 3 SW 267 273 22.7 8.9 80 NCDC M1 El Mirage 15 S 878 875 16.5 10.8 14 RAWS
M4 Mountain Pass 1se 15 SE 1459 1048 17.0§ 14.5¶ 4 NCDC M5 Pahrump 21 SE 815 863 16.6 13.2 52 NCDC G3 Tonopah 19 NE 1709 1626 11 14.8 65 NCDC G4 Mina Airport 1 NE 1392 1429 12.7 15.4 62 NCDC G5 Middlegate-Clifford 17 SE 1392 1246 9.4 13.0 22 NCDC
†Distance and direction of weather station from field area ‡NCDC = National Climate Data Center (Fenimore, 2011), RAWS = Remote automatic weather stations (Western Regional Climate Cent., 2011) §Adjusted for elevation difference between weather station and site by linear interpolation between Mountain Pass 1se station and Baker NCDC station, located at 293 m elevation. ¶Adjusted for elevation difference between weather station and site using the logarithmic relationship between precipitation and elevation established by French (1983) for southern Nevada.
70
expected difference in precipitation between the weather station and the field area was
calculated according to the logarithmic relationship between elevation and precipitation,
previously established for the southern Nevada region (French, 1983). This difference in
precipitation (3.7 cm) was subtracted from MAP recorded at the Mountain Pass 1se
weather station, in order to represent the lower precipitation expected at lower elevation.
Mean annual temperatures recorded by the weather stations ranged from 20.8 to 22.8oC
in the Sonoran Desert, 16.5 to 17.0oC in the Mojave Desert, and 9.4 to 12.7oC in the
central Great Basin (Table 3.3). Mean annual precipitation ranged from 7.9 to 11.4 mm
in the Sonoran Desert, 10.8 to 14.5 cm in the Mojave Desert, and 13.0 to 15.4 cm in the
central Great Basin (Table 3.3).
Laboratory methods
Bulk samples of the vesicular horizons collected from each of the study plots
were analyzed for particle-size distribution, pH, CaCO3 percentage, electrical
conductivity (EC), and exchangeable Na percentage (ESP). For samples below the
vesicular horizon, CaCO3 was measured if pedogenic carbonates were detected in the
field, and EC and gypsum were measured if soluble salts were visible. Particle-size
distribution was determined by the wet-sieving/laser-diffraction method (Segal et al.,
2009). Soil pH was measured in a 1:1 soil:water suspension (Burt, 2004). Calcium
carbonate was measured by the manometer method (Williams, 1948). Electrical
conductivity was measured in saturation paste extracts (Burt, 2004). Exchangeable
sodium was extracted with ammonium acetate and measured by inductively coupled
71
plasma (ICP) spectroscopy (Thomas, 1982). Cation exchange capacity (CEC) was
determined by Na-saturation followed by ammonium acetate extraction and measurement
of displaced Na by ICP spectroscopy (Bower and Hatcher, 1966). Soluble Na in
saturation paste extracts was measured using a Na-selective electrode and exchangeable
Na measurements were corrected for soluble sodium in the ESP calculation (Burt, 2004).
Gypsum was measured by the acetone precipitation method (Burt, 2004)
Intact samples were analyzed by X-ray computed tomography (CT). One pre-
disturbance and one post-disturbance sample from most of the field sites was CT-
scanned, as well as a total of four samples collected from tire tracks and four samples of
vesicular horizons buried beneath coppice dunes. Pre-and post-disturbance samples from
site S3, and the post-disturbance sample from site S5, were not included in the CT
analysis because the samples were too fragile to ship to the CT scanning facility.
Scanning was performed with an inter-slice spacing of 0.08118 mm, and a resolution of
0.0752 mm per pixel.
Data analysis
Vesicular horizon index.
Vesicular horizon expression, according to the field descriptions, was quantified
using the vesicular horizon index (VHI) (Turk and Graham, 2011). The VHI takes into
account the horizon thickness, as well as vesicular pore size and quantity class. A
vesicular pore term (Xve) is calculated by summing values assigned to the size and
quantity classes. The term is rescaled (0-1) by dividing by 220, which is the maximum
72
observed value of the term. Finally, the rescaled term is multiplied by the horizon
thickness (in cm) to calculate the VHI.
The VHI of pre-disturbance soils was compared with the post-disturbance soils
after one year of recovery. The statistical difference between pre-and post-disturbance
VHI was evaluated using non-parametric analysis because the distribution of VHI is non-
normal (Turk and Graham, 2011). At the field sites with nearby weather stations (Table
3.3), the influence of precipitation on recovery of vesicular horizons was evaluated by
regression of VHI versus precipitation. This analysis was performed with precipitation
expressed as depth, and also as events. Precipitation events were defined as more than
five mm of precipitation occurring over consecutive days, separated by a drying period
that varies by season (Jun.-Aug. = 1 d, Sept.-Nov. and Mar.-May = 3 d, Dec.-Feb. = 5 d)
(Turk and Graham, 2011). The depth of water applied during infiltration measurement
was included in the total precipitation depth during the year of recovery, and was also
counted as one precipitation event. At site M4, the adjustment for elevation used to
calculate MAP (Table 3.3) was also used to estimate the precipitation during the recovery
period. However, no adjustment was made to precipitation expressed as events, since the
relationship with elevation is unknown.
CT analysis
Images generated from the CT scans were analyzed using the Blob3D software
(Ketcham et al., 2005). First the scans were cropped to a cylindrically- shaped volume of
interest (VOI) (Brun et al., 2010). The VOIs were 20 to 40 mm in diam., depending on
73
the sample size, and oriented so that the z-axis corresponded to depth. The VOIs were 15
mm in height and extracted as close to the top surface of the sample as possible. This top
zone of the vesicular horizon was selected for analysis because the vesicular pores were
largest and most numerous near the surface.
Voids were segregated from the sample matrix using a general threshold filter,
which was adjusted until the resulting binary image agreed well with visual segregation
of voids in the grayscale image. Gravels were segregated using a general
threshold/majority filter, to detect homogeneity of voxels within the grayscale value
range of the gravels. Methods for characterization of pore geometry were developed
based on the observation of 838 pores in one CT scan of an undisturbed vesicular horizon
(from site G2). Each of these pores was classified as a vesicle, vugh, or interconnected
pore network based on visual interpretation (Fig. 3.3). Vesicles are smooth, rounded
pores, which are non-interconnected and may be equant, prolate, or oblate in shape
(Brewer, 1976; Stoops, 2003). Vughs are large, irregular voids, which are usually non-
oriented and have a random distribution, when vughs are numerous and highly-irregular,
they may become interconnected (Brewer, 1976). The voids that we distinguished as
interconnected pore networks consisted of interconnected vugh-like pores. Interstitial
pores were not observable at the resolution of the CT scans and therefore were not
included in our analysis. Volume and surface area were recorded for each pore and used
to calculate a volumetric form of the two-dimensional lobation ratio (LR), a term
previously used to characterize pore geometry in thin sections (Beckman, 1962; Figueira
and Stoops, 1983). The two-dimensional LR is the ratio between the calculated perimeter
74
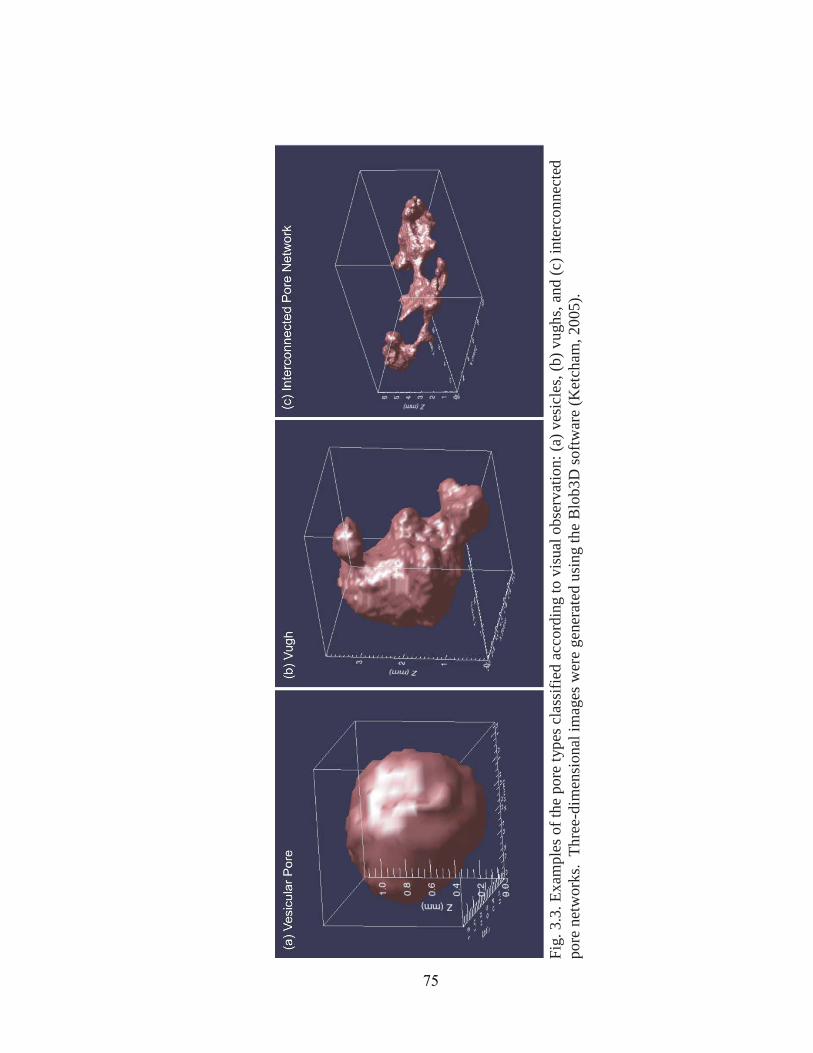
Fig.
3.3
. Exa
mpl
es o
f the
por
e ty
pes c
lass
ified
acc
ordi
ng to
vis
ual o
bser
vatio
n: (a
) ves
icle
s, (b
) vug
hs, a
nd (c
) int
erco
nnec
ted
pore
net
wor
ks.
Thre
e-di
men
sion
al im
ages
wer
e ge
nera
ted
usin
g th
e B
lob3
D so
ftwar
e (K
etch
am, 2
005)
.
75
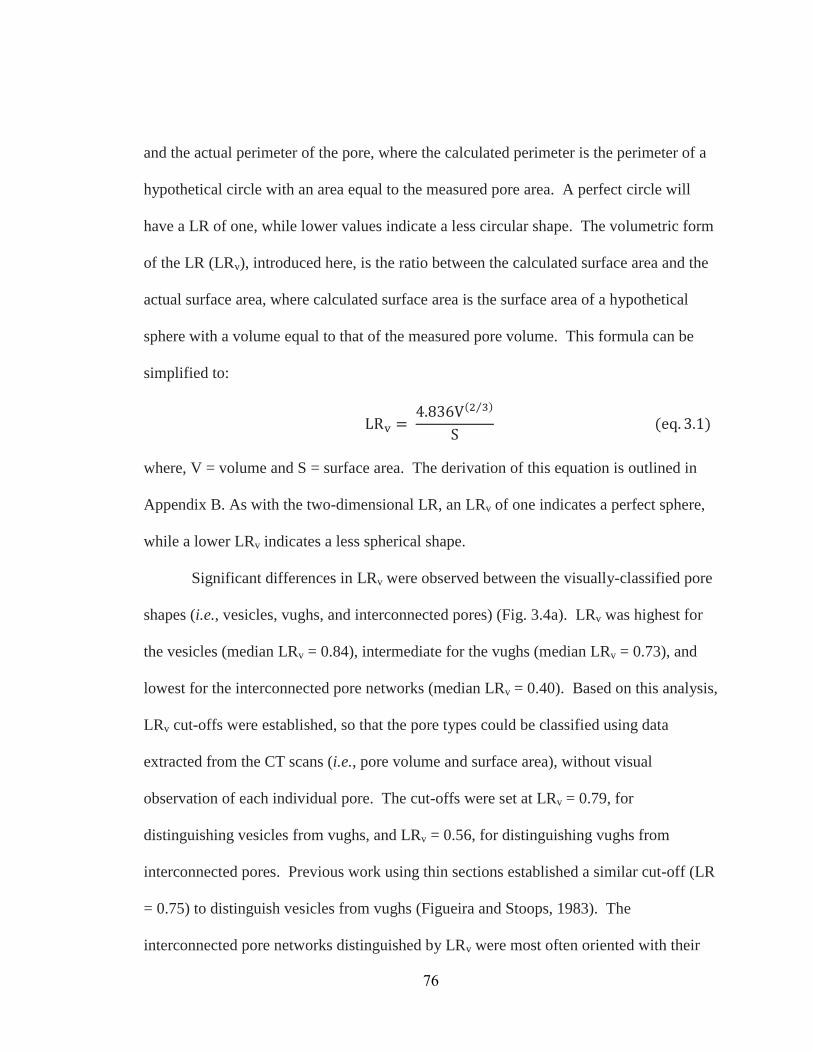
and the actual perimeter of the pore, where the calculated perimeter is the perimeter of a
hypothetical circle with an area equal to the measured pore area. A perfect circle will
have a LR of one, while lower values indicate a less circular shape. The volumetric form
of the LR (LRv), introduced here, is the ratio between the calculated surface area and the
actual surface area, where calculated surface area is the surface area of a hypothetical
sphere with a volume equal to that of the measured pore volume. This formula can be
simplified to:
where, V = volume and S = surface area. The derivation of this equation is outlined in
Appendix B. As with the two-dimensional LR, an LRv of one indicates a perfect sphere,
while a lower LRv indicates a less spherical shape.
Significant differences in LRv were observed between the visually-classified pore
shapes (i.e., vesicles, vughs, and interconnected pores) (Fig. 3.4a). LRv was highest for
the vesicles (median LRv = 0.84), intermediate for the vughs (median LRv = 0.73), and
lowest for the interconnected pore networks (median LRv = 0.40). Based on this analysis,
LRv cut-offs were established, so that the pore types could be classified using data
extracted from the CT scans (i.e., pore volume and surface area), without visual
observation of each individual pore. The cut-offs were set at LRv = 0.79, for
distinguishing vesicles from vughs, and LRv = 0.56, for distinguishing vughs from
interconnected pores. Previous work using thin sections established a similar cut-off (LR
= 0.75) to distinguish vesicles from vughs (Figueira and Stoops, 1983). The
interconnected pore networks distinguished by LRv were most often oriented with their
76
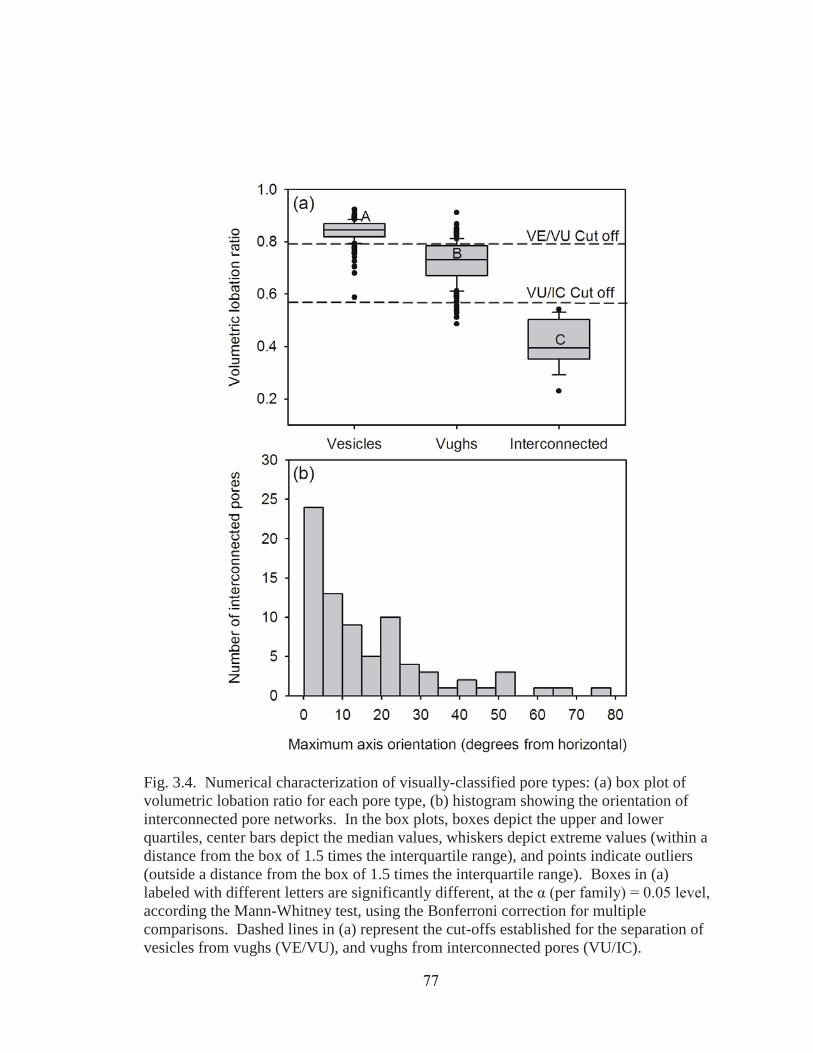
Fig. 3.4. Numerical characterization of visually-classified pore types: (a) box plot of volumetric lobation ratio for each pore type, (b) histogram showing the orientation of interconnected pore networks. In the box plots, boxes depict the upper and lower quartiles, center bars depict the median values, whiskers depict extreme values (within a distance from the box of 1.5 times the interquartile range), and points indicate outliers (outside a distance from the box of 1.5 times the interquartile range). Boxes in (a) labeled with different letters are significantly different, at the α (per family) = 0.05 level, according the Mann-Whitney test, using the Bonferroni correction for multiple comparisons. Dashed lines in (a) represent the cut-offs established for the separation of vesicles from vughs (VE/VU), and vughs from interconnected pores (VU/IC).
77
maximum axis close to the horizontal axis of the sample (Fig. 3.4b). This orientation
suggests that the interconnected pore networks consist of horizontally interconnected
vughs (e.g., Fig. 3.3c). Similar pore networks have been previously observed in vesicular
horizons and linked to the formation of lateral fractures between platy structural units
(Figueira and Stoops, 1983). The LRv is affected by elongation as well as regularity of
the shape, therefore some prolate and oblate pores, which might otherwise be described
as vesicles (Brewer, 1976), will be classified as vughs here. Based on the cut-off at LRv
= 0.79, prolate and oblate pores with aspect ratios exceeding 3:1 will be classified as
vughs, rather than vesicles. This potential misclassification is unlikely to have a major
effect on our results, however, since we focus on the upper part of the vesicular horizons
(0-15 mm), in which the vesicles typically have the most equant shape (Bouza et al.,
1993).
In the remaining samples, data were extracted for all voids with a volume greater
than 0.0028 mm3 (6 voxels). The values extracted for each void included volume,
surface area, and side contact (i.e., whether or not the pores contacted the edge of the
VOI). The LRv was calculated for each void and used to classify the voids as vesicles,
vughs, or interconnected pores. For each pore type, the percentage of gravel-free volume
occupied by pores (V%), number density of pores (Np, in cm-3), and geometric mean of
pore volume ( , in mm3) were calculated using the following equations.
78
In eq. 3.2 and eq. 3.3, p1…n is the set of all pores of the designated class (i.e., vesicles,
vughs, or interconnected pores) within the VOI, n = the number of pores, Vp = the
volume of pore p (in mm3), g1…m is the set of all gravels within the VOI, m = the number
of gravels, Vg = the volume of gravel g (in mm3), r = radius of the VOI (in mm), and h =
height of the VOI (in mm). In eq. 3.4, p01…k is the set of all pores of the designated class
(i.e., vesicles, vughs, or interconnected pores) within the VOI that are not in contact with
the VOI edge (i.e., side contact = 0), k = the number of pores with no side contact, and
Vp0 = the volume of pore p0 (in mm3).
The relationship between pore morphology and desert ecological zones was
analyzed in the pre-disturbance soils, using statistical analysis by one-way ANOVA and
Tukey’s test. The effect of disturbance on vesicular horizons was analyzed by
comparing: 1) porosity of pre-and post-disturbance samples from the study plots, 2)
porosity of tire tracks relative to undisturbed desert pavement, and 3) porosity of
vesicular horizons buried by coppice dunes relative to the unburied vesicular horizons. In
each case, the statistical difference of all measured values (i.e., V%, Np, and ) for each
pore type (i.e., vesicles, vughs, and interconnected pores) were determined using a paired
t-test (paired by field site). Pairs from four study sites were included in the analysis of
tire tracks (S4, S5, M2, and M3) and coppice dunes (G2, G3, G4, and G5). All statistical
analyses were performed in MINITAB 16 (Minitab, 2010).
79
Infiltration
The relationship between steady-state infiltration rates at the four different
tensions was used to calculate saturated hydraulic conductivity (Ksat) and Gardner’s α
(Gardner, 1958), by fitting the data to the Wooding’s equation (Wooding, 1968; Young et
al., 2004):
where q(h) is the steady-state infiltration rate (cm s-1), α is a parameter related to pore-
size distribution (cm-1) (Gardner, 1958), h is the tension (cm), and r is the radius of the
infiltrometer plate. The Ksat data was temperature-corrected to 20oC (Young et al., 2004)
and log-normalized for statistical analyses (Young et al., 2004, Caldwell et al., 2006;
Shafer et al., 2007). The geometric mean of Ksat for the three study plots at each site
before disturbance was compared with the geometric mean of Ksat for the three study
plots measured one year following disturbance, using a paired t-test. Pre- and Post-
disturbance α were compared using the Mann-Whitney test, since these data were not
normally distributed. In a few cases, the infiltration data for a plot did not fit well with
the Wooding’s equation (p > 0.10), in these cases, the data from that study plot were not
used in the calculation of Ksat and α for the site. Non-linear regression analysis, used to
fit the data to the Wooding’s equation was performed by a user-defined regression
equation in SigmaPlot 10 (Systat Software, 2007), and other statistical analyses were
performed in MINITAB 16 (Minitab, 2010).
80
RESULTS AND DISCUSSION
Pore morphology of pre-disturbance vesicular horizons
The results of CT analysis show that the pore morphology of the vesicular horizons varies
between sites grouped by desert, including the Great Basin, Mojave, and Sonoran Deserts (Fig.
3.5). Vesicles and vughs occupy a higher percentage of the sample volume in the Great Basin
vesicular horizons relative to the Mojave Desert samples, and occupy the lowest percentage of
sample volume in the Sonoran Desert (Fig. 3.5a). The number density of vesicles and vughs,
however, is highest in the Sonoran Desert (Fig. 3.5b), which is in agreement with previous studies
showing that smaller vesicular pores occur in greater numbers (Figueira and Stoops, 1983). The
average volumes of vesicles and vughs are larger in the Great Basin than in the Mojave Desert,
and smallest in the Sonoran Desert (Fig. 3.5c,d). Statistical analysis of these results shows that
most of the differences between the deserts are not significant at the α = 0.05 level, but the p-
values range from 0.03 to 0.14, which suggests that the differences would be significant with
slightly larger sample size.
These results are in agreement with previous analysis of vesicular horizon expression
between the deserts of the Basin and Range Province, in which the VHI was applied to quantify
vesicular horizon expression in field descriptions from the NRCS soil databases (Turk and
Graham, 2011). In the previous study the vesicular porosity was quantified based on visual
analysis in the field. Using the soil databases allowed for a very large sample size, including
1387 soil descriptions, but introduces additional variability related to the precision of visual
estimations of porosity made by different observers. In the current study, CT analysis was used
to collect data on the shape, size, and number of pores in the samples. While this approach
allows better quantification and consistency of technique, a much smaller sample size was used,
including only 14 samples. However, even with these different sources of uncertainty, both
81
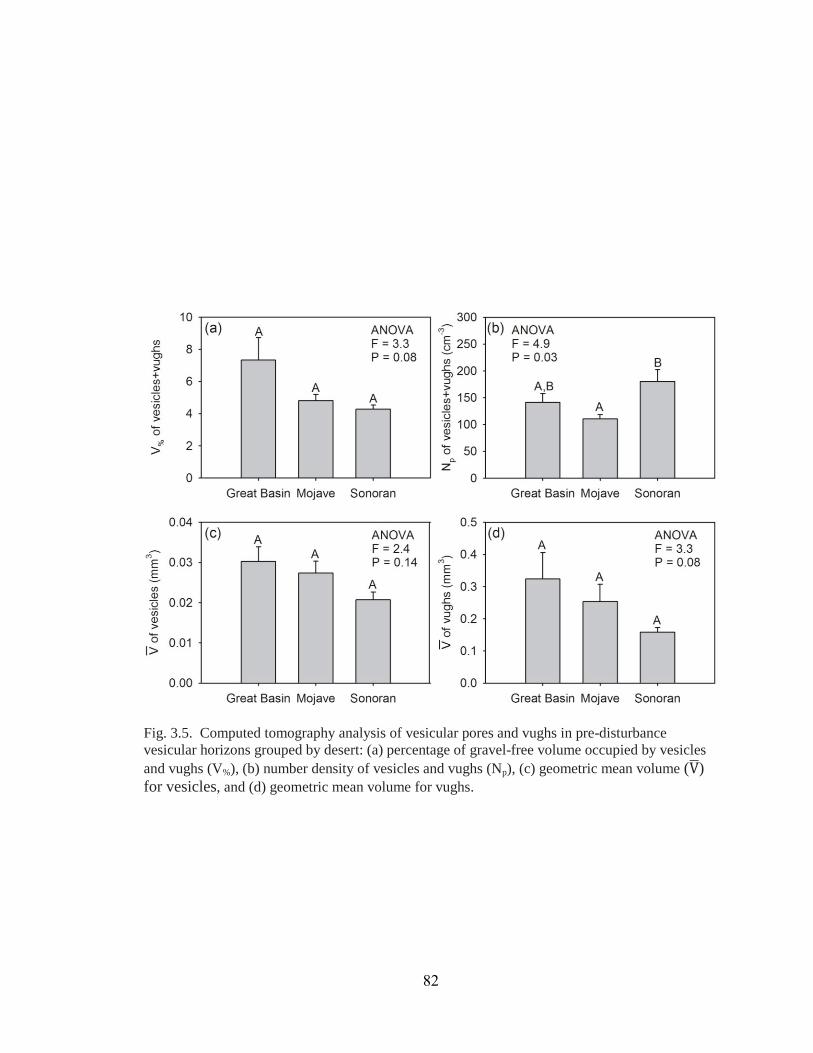
Fig. 3.5. Computed tomography analysis of vesicular pores and vughs in pre-disturbance vesicular horizons grouped by desert: (a) percentage of gravel-free volume occupied by vesicles and vughs (V%), (b) number density of vesicles and vughs (Np), (c) geometric mean volume ( ) for vesicles, and (d) geometric mean volume for vughs.
82
studies show the same general trend, which is better expression of vesicular horizons in the cold
desert (i.e., the Great Basin), relative to the warm deserts (i.e., the Mojave and Sonoran Deserts).
Two possible reasons for this trend were discussed by Turk and Graham (2011): 1) more
extensive sources of eolian dust due to the drying of large pluvial lakes in the Great Basin, and 2)
more frequent precipitation events in the cold deserts relative to the warm deserts.
Recovery of vesicular horizons following disturbance
Vesicular pores formed in all of the study plots within one year following
disturbance. However, the post-disturbance vesicular horizons were weakly developed
compared to the pre-disturbance vesicular horizons (Fig. 3.6). The pre-disturbance
vesicular horizons displayed moderate to strong columnar structure, often parting to
moderate to strong platy structure. In contrast, the vesicular horizons formed following
disturbance had weak prismatic or massive structure. The pre-disturbance vesicular pores
were very fine to medium in size (<1 to 5 mm diam.) and occurred in a layer that was 1 to
8 cm thick; while the reformed vesicular pores were very fine to fine in size (<1 to 2 mm
diam.) and occurred in a thin layer, ranging from 0.3 to 3 cm thick. In pre-disturbance
soils, the vesicular pores were often observed to be largest near the soil surface and the
large pores tended to be more irregular in shape. Vesicular horizon morphology was
quantified according to the VHI and a statistically significant reduction in VHI was
observed in the post-disturbance soils relative to the pre-disturbance soils, according to
the Mann-Whitney test (p < 0.0001) (Fig. 3.7).
A previous study of vesicular horizon disturbance at the Lake Mead National
Recreation Area (LMNRA) also demonstrated the reformation of vesicular pores within
83
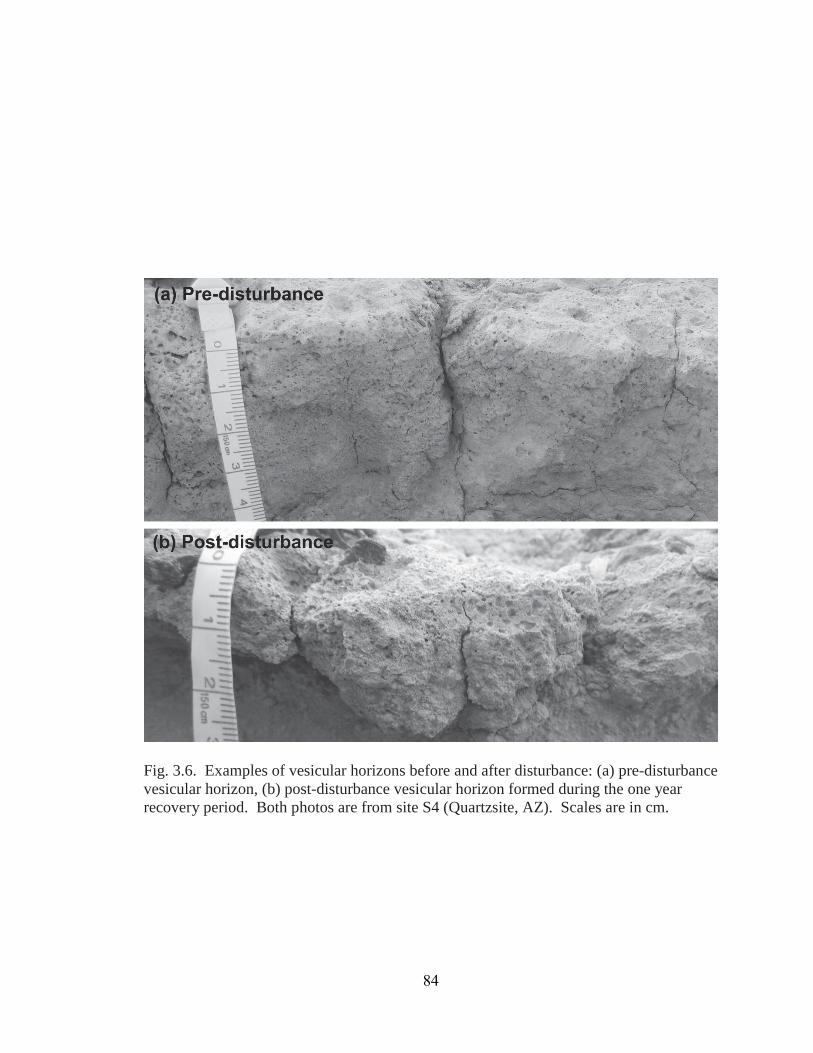
Fig. 3.6. Examples of vesicular horizons before and after disturbance: (a) pre-disturbance vesicular horizon, (b) post-disturbance vesicular horizon formed during the one year recovery period. Both photos are from site S4 (Quartzsite, AZ). Scales are in cm.
84

Fig. 3.7. Box plots of vesicular horizon index for pre-and post-disturbance vesicular horizons. Post-disturbance soils were analyzed following the one-year recovery period. Boxes depict the upper and lower quartiles, center bars depict the median values, whiskers depict extreme values (within a distance from the box of 1.5 times the interquartile range), and points indicate outliers (outside a distance from the box of 1.5 times the interquartile range).
85
one year following disturbance (Yonovitz and Drohan, 2009). In this study, platy
structure was observed to reform following disturbance, which we did not observe in our
study plots. At LMNRA, moderate platy structure was observed in undisturbed soils and
weak platy structure was observed in the vesicular horizons that reformed following
disturbance. The range of vesicular horizon thickness observed following disturbance at
LMNRA (0.3-3 cm) was the same as the range of vesicular horizon thickness observed in
the post-disturbance soils in our study. However, in the study at LMNRA the size of the
vesicular pores was observed to be unaltered by disturbance; in contrast, we found that
the largest pores (2-5 mm) did not reform within a year following disturbance.
The difference between the pre-and post-disturbance vesicular horizons was
observed in more detail using data from the CT scans. The decreased vesicular horizon
thickness and pore size is apparent in slices from pre- and post-disturbance scans (Fig.
3.8). Following disturbance, vesicles, vughs, and interconnected pores in the upper 15
mm occupy less of the sample volume relative to the pre-disturbance soils (Fig. 3.9a,
3.10a, 3.11a). Pores in the post-disturbance soils were similar or greater in number
density relative to the pre-disturbance soils (Fig. 3.9b, 3.10b, 3.11b), but the individual
pores formed following disturbance were smaller in volume (Fig. 3.9c, 3.10c, 3.11c).
The vesicular pores had a greater number density in the post-disturbance soils relative to
the pre-disturbance soils (Fig. 3.9a), although the difference was not significant at the α =
0.05 level (p = 0.08). Analysis of vesicular pore formation in the lab has shown that the
number of vesicular pores declines as the soil undergoes repeated wetting and drying
cycles, due to the merging of the pores as they grow (Figueira and Stoops, 1983). The
86
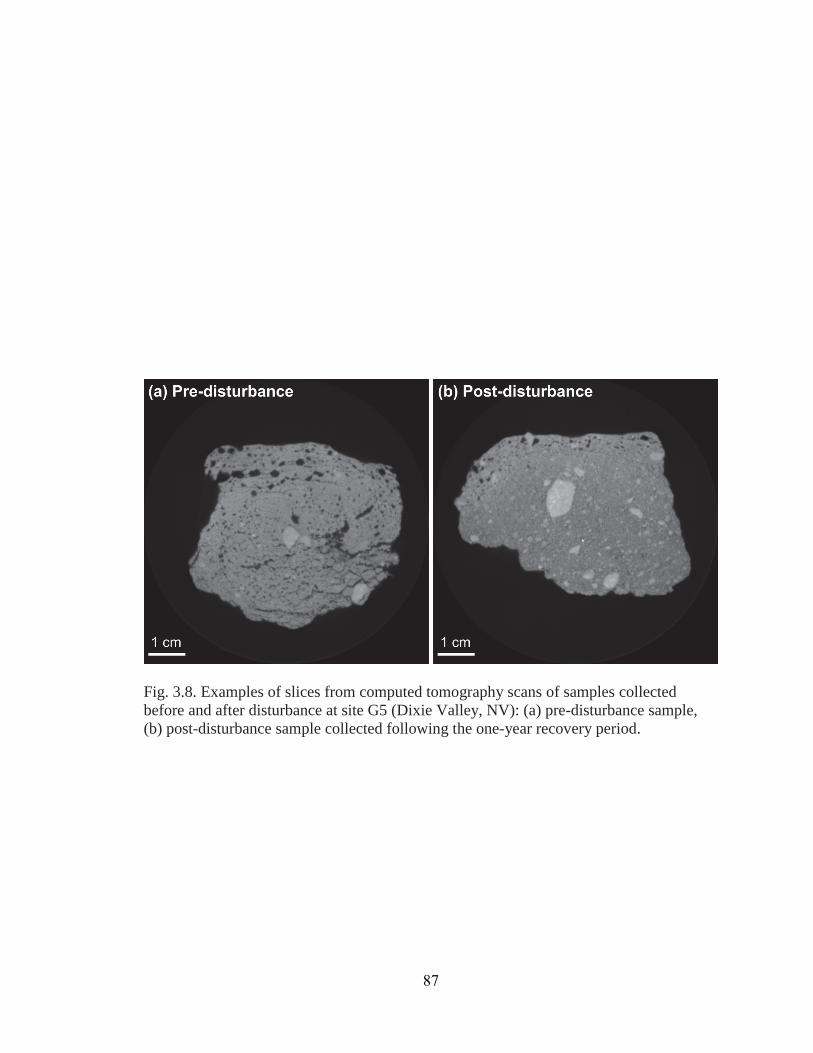
Fig. 3.8. Examples of slices from computed tomography scans of samples collected before and after disturbance at site G5 (Dixie Valley, NV): (a) pre-disturbance sample, (b) post-disturbance sample collected following the one-year recovery period.
87
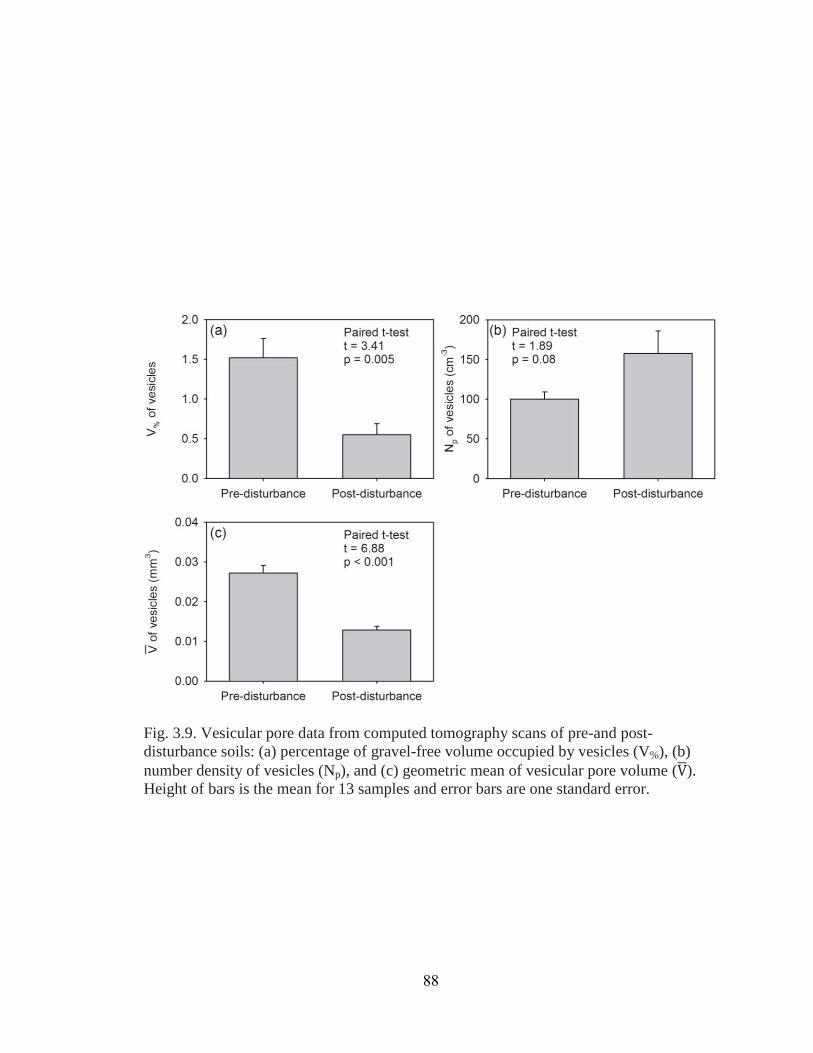
Fig. 3.9. Vesicular pore data from computed tomography scans of pre-and post-disturbance soils: (a) percentage of gravel-free volume occupied by vesicles (V%), (b) number density of vesicles (Np), and (c) geometric mean of vesicular pore volume ( ). Height of bars is the mean for 13 samples and error bars are one standard error.
88
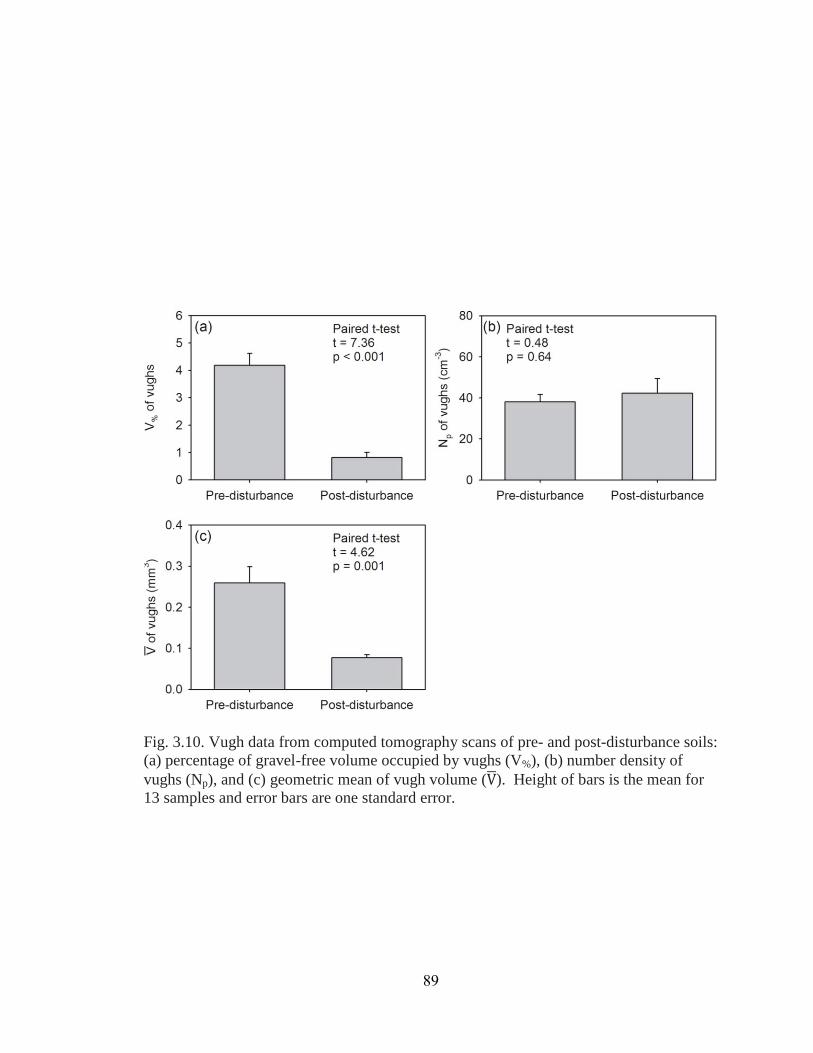
Fig. 3.10. Vugh data from computed tomography scans of pre- and post-disturbance soils: (a) percentage of gravel-free volume occupied by vughs (V%), (b) number density of vughs (Np), and (c) geometric mean of vugh volume ( ). Height of bars is the mean for 13 samples and error bars are one standard error.
89

Fig. 3.11. Interconnected pore data from computed tomography scans of pre- and post-disturbance soils: (a) percentage of gravel-free volume occupied by interconnected pores (V%), (b) number density of interconnected pore networks (Np), and (c) geometric mean of interconnected pore network volume ( ). Height of bars is the mean for 13 samples and error bars are one standard error.
90
greater number of vesicular pores in the post-disturbance soils is indicative of an earlier
stage of pore development. These results differ from the LMNRA study, which showed
no significant difference in the size of vesicles and vughs between the disturbed and
undisturbed vesicular horizons, based on measurements of pore area in thin sections
(Yonovitz and Drohan, 2009).
We observed that vughs were generally larger and less numerous than vesicles,
which agrees with previous characterization of these pore types (Brewer, 1976).
However, the vughs that occur in vesicular horizons are unlikely to have formed by
mechanisms proposed in the literature, which include flocculation of clays, differential
weathering of minerals, faunal activity, and welding of aggregates (Brewer, 1976;
Stoops, 2003). Rather, we suggest that the vughs that occur in the vesicular horizon
develop from pores that were initially vesicular. Their irregular shape appears to result
from growth of vesicular pores through the “capture” of adjacent vesicular pores, adding
lobes to the pore shape. The presence of interconnected pores has been previously
observed in some studies that have analyzed vesicular horizons in thin sections (Figueira
and Stoops, 1983; Sullivan and Koppi, 1991), while other studies have found the vesicles
and vughs to display no interconnection (Yonovitz and Drohan, 2009). Our results show
that interconnected pore networks are common in vesicular soils, and their reformation
following disturbance follows similar trends as the reformation of vesicles and vughs.
91
Rate of vesicular horizon recovery following disturbance
The variation in vesicular horizon recovery from disturbance among the different
field areas may be explained by: 1) the characteristics of the disturbed soil material, or 2)
by external factors, such as weather conditions during the period of recovery. This study
includes vesicular horizons with a wide range of chemical properties (EC: 0.5-20.3 dS m-
1, pH: 7.8-8.9, ESP: 1.5-62.3%, CaCO3: 2.6-22.8%), and particle size distributions (sand:
27-57%, silt: 32-57%, and clay: 10-25%) (Table 3.4). Past studies have suggested that
certain soil characteristics, including ESP (Bouza et al., 1993) and texture (Evenari et al.,
1974), can influence vesicular pore formation. It has been suggested that vesicular
horizons on old geomorphic surfaces may be pre-disposed to recovery from disturbance
due to the accumulation of eolian material throughout the history of these surfaces,
producing a silt-rich texture that is conducive to vesicular pore formation (Yonovitz and
Drohan, 2009). However, in this study, most of the variability in vesicular horizon
recovery could be explained by precipitation patterns during the period of recovery (Fig.
3.12), pointing to a significant role of external factors in determining vesicular horizon
recovery from disturbance.
The VHI of the post-disturbance vesicular horizons showed a linear relationship
(r2 = 0.64, p = 0.009) with the total depth of precipitation during the recovery period (Fig.
3.12a). This relationship was improved by considering precipitation as events, rather
than depth (r2 = 0.88, p = 0.0002). The precipitation events that influence vesicular pore
formation in the field can be considered analogous to the wetting and drying cycles that
drive vesicular pore formation in the lab (Miller, 1971; Figueira and Stoops, 1983). The
92
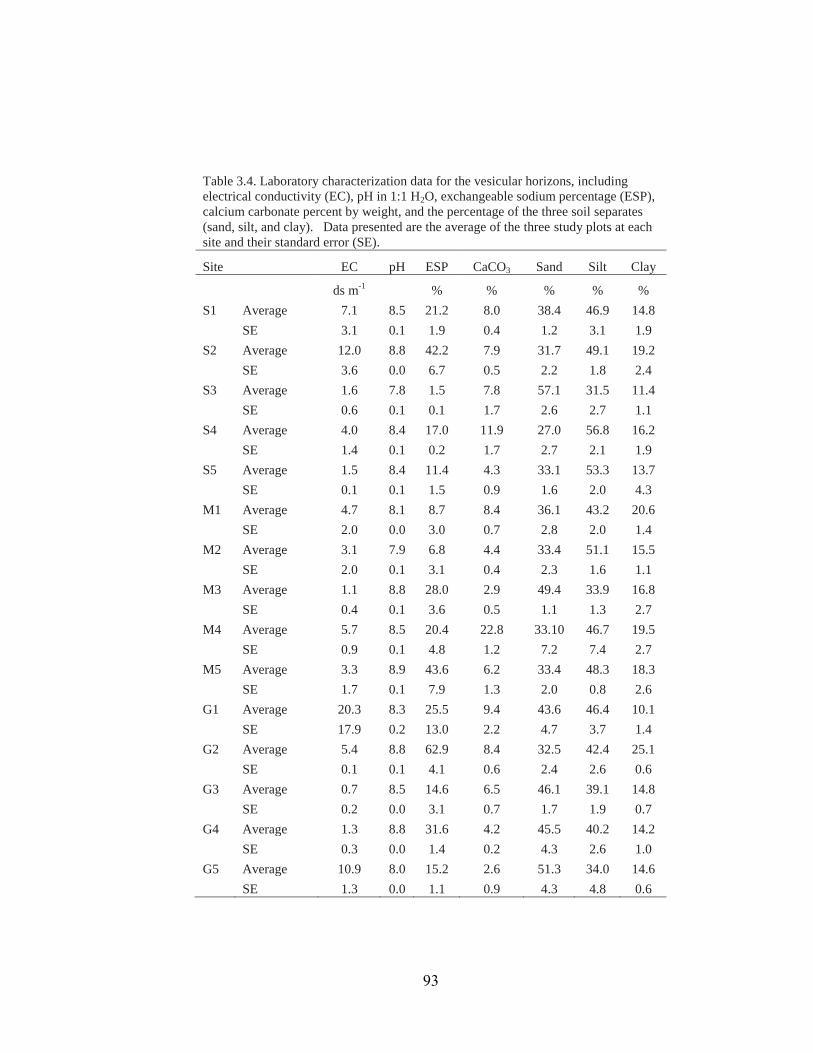
Table 3.4. Laboratory characterization data for the vesicular horizons, including electrical conductivity (EC), pH in 1:1 H2O, exchangeable sodium percentage (ESP), calcium carbonate percent by weight, and the percentage of the three soil separates (sand, silt, and clay). Data presented are the average of the three study plots at each site and their standard error (SE).
Site EC pH ESP CaCO3 Sand Silt Clay
ds m-1 % % % % % S1 Average 7.1 8.5 21.2 8.0 38.4 46.9 14.8
SE 3.1 0.1 1.9 0.4 1.2 3.1 1.9 S2 Average 12.0 8.8 42.2 7.9 31.7 49.1 19.2
SE 3.6 0.0 6.7 0.5 2.2 1.8 2.4 S3 Average 1.6 7.8 1.5 7.8 57.1 31.5 11.4
SE 0.6 0.1 0.1 1.7 2.6 2.7 1.1 S4 Average 4.0 8.4 17.0 11.9 27.0 56.8 16.2
SE 1.4 0.1 0.2 1.7 2.7 2.1 1.9 S5 Average 1.5 8.4 11.4 4.3 33.1 53.3 13.7
SE 0.1 0.1 1.5 0.9 1.6 2.0 4.3 M1 Average 4.7 8.1 8.7 8.4 36.1 43.2 20.6
SE 2.0 0.0 3.0 0.7 2.8 2.0 1.4 M2 Average 3.1 7.9 6.8 4.4 33.4 51.1 15.5
SE 2.0 0.1 3.1 0.4 2.3 1.6 1.1 M3 Average 1.1 8.8 28.0 2.9 49.4 33.9 16.8
SE 0.4 0.1 3.6 0.5 1.1 1.3 2.7 M4 Average 5.7 8.5 20.4 22.8 33.10 46.7 19.5
SE 0.9 0.1 4.8 1.2 7.2 7.4 2.7 M5 Average 3.3 8.9 43.6 6.2 33.4 48.3 18.3
SE 1.7 0.1 7.9 1.3 2.0 0.8 2.6 G1 Average 20.3 8.3 25.5 9.4 43.6 46.4 10.1
SE 17.9 0.2 13.0 2.2 4.7 3.7 1.4 G2 Average 5.4 8.8 62.9 8.4 32.5 42.4 25.1
SE 0.1 0.1 4.1 0.6 2.4 2.6 0.6 G3 Average 0.7 8.5 14.6 6.5 46.1 39.1 14.8
SE 0.2 0.0 3.1 0.7 1.7 1.9 0.7 G4 Average 1.3 8.8 31.6 4.2 45.5 40.2 14.2
SE 0.3 0.0 1.4 0.2 4.3 2.6 1.0 G5 Average 10.9 8.0 15.2 2.6 51.3 34.0 14.6 SE 1.3 0.0 1.1 0.9 4.3 4.8 0.6
93
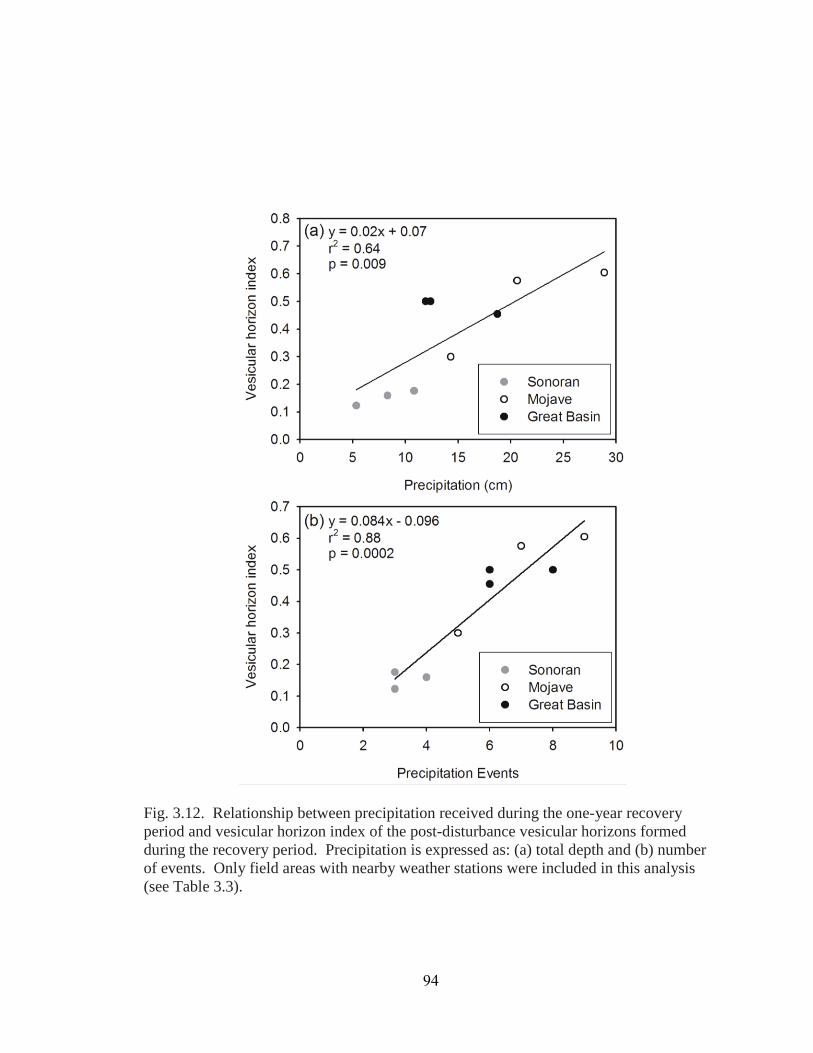
Fig. 3.12. Relationship between precipitation received during the one-year recovery period and vesicular horizon index of the post-disturbance vesicular horizons formed during the recovery period. Precipitation is expressed as: (a) total depth and (b) number of events. Only field areas with nearby weather stations were included in this analysis (see Table 3.3).
94
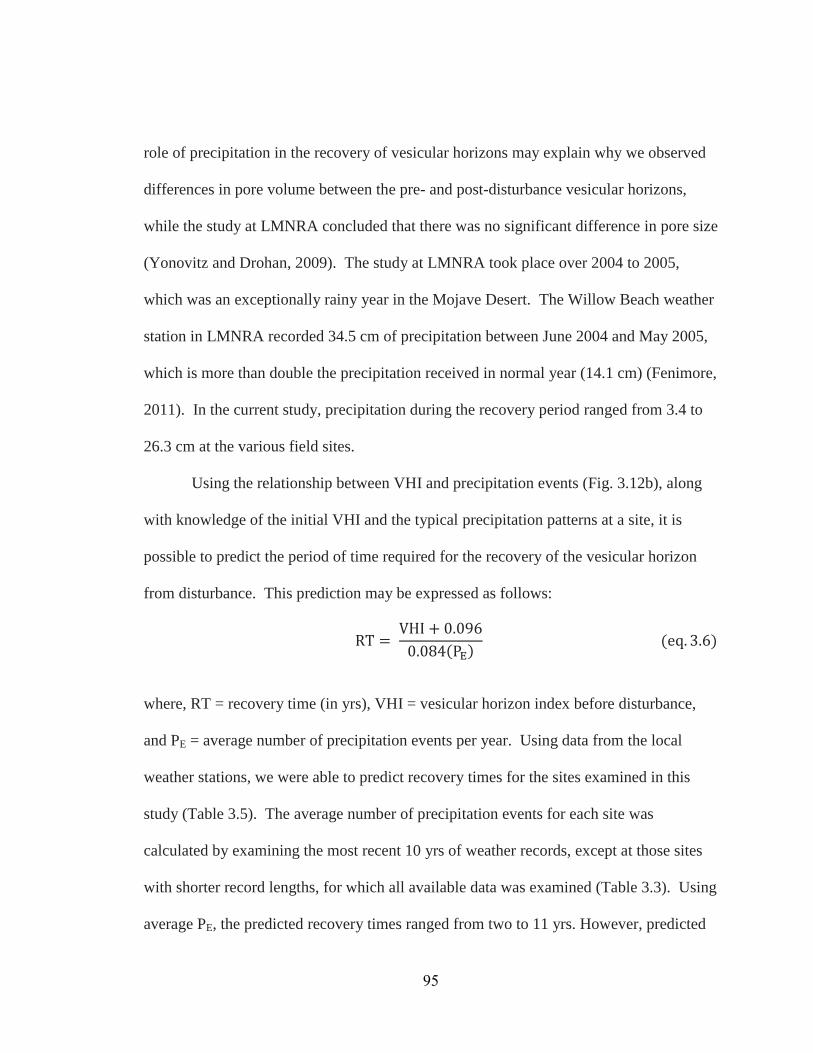
role of precipitation in the recovery of vesicular horizons may explain why we observed
differences in pore volume between the pre- and post-disturbance vesicular horizons,
while the study at LMNRA concluded that there was no significant difference in pore size
(Yonovitz and Drohan, 2009). The study at LMNRA took place over 2004 to 2005,
which was an exceptionally rainy year in the Mojave Desert. The Willow Beach weather
station in LMNRA recorded 34.5 cm of precipitation between June 2004 and May 2005,
which is more than double the precipitation received in normal year (14.1 cm) (Fenimore,
2011). In the current study, precipitation during the recovery period ranged from 3.4 to
26.3 cm at the various field sites.
Using the relationship between VHI and precipitation events (Fig. 3.12b), along
with knowledge of the initial VHI and the typical precipitation patterns at a site, it is
possible to predict the period of time required for the recovery of the vesicular horizon
from disturbance. This prediction may be expressed as follows:
where, RT = recovery time (in yrs), VHI = vesicular horizon index before disturbance,
and PE = average number of precipitation events per year. Using data from the local
weather stations, we were able to predict recovery times for the sites examined in this
study (Table 3.5). The average number of precipitation events for each site was
calculated by examining the most recent 10 yrs of weather records, except at those sites
with shorter record lengths, for which all available data was examined (Table 3.3). Using
average PE, the predicted recovery times ranged from two to 11 yrs. However, predicted
95

Table 3.5. Estimated recovery time (RT) for vesicular horizons by site. Recovery times were calculated according to Eq. 3.6, using initial vesicualr horizon index for the site (VHI), and records of precipitation events (PE) from nearby weather stations. Location and details about weather stations are in Table 3.3.
Site Initial VHI Average PE Min. PE
Max. PE
RT (Average PE)
RT (Min. PE)
RT (Max. PE)
yr-1 yr-1 yr-1 yr S1 3.3 5 1 10 8 40 4 S2 3.1 4 1 6 11 38 6 S4 2.9 6 3 10 6 12 4 M1 2.2 4 1 8 6 27 3 M4 1.7 10 7 16 2 3 1 M5 1.7 6 1 11 4 22 2 G3 2.0 6 2 10 4 12 2 G4 2.8 7 3 10 5 12 4 G5 1.5 7 2 10 3 10 2
96
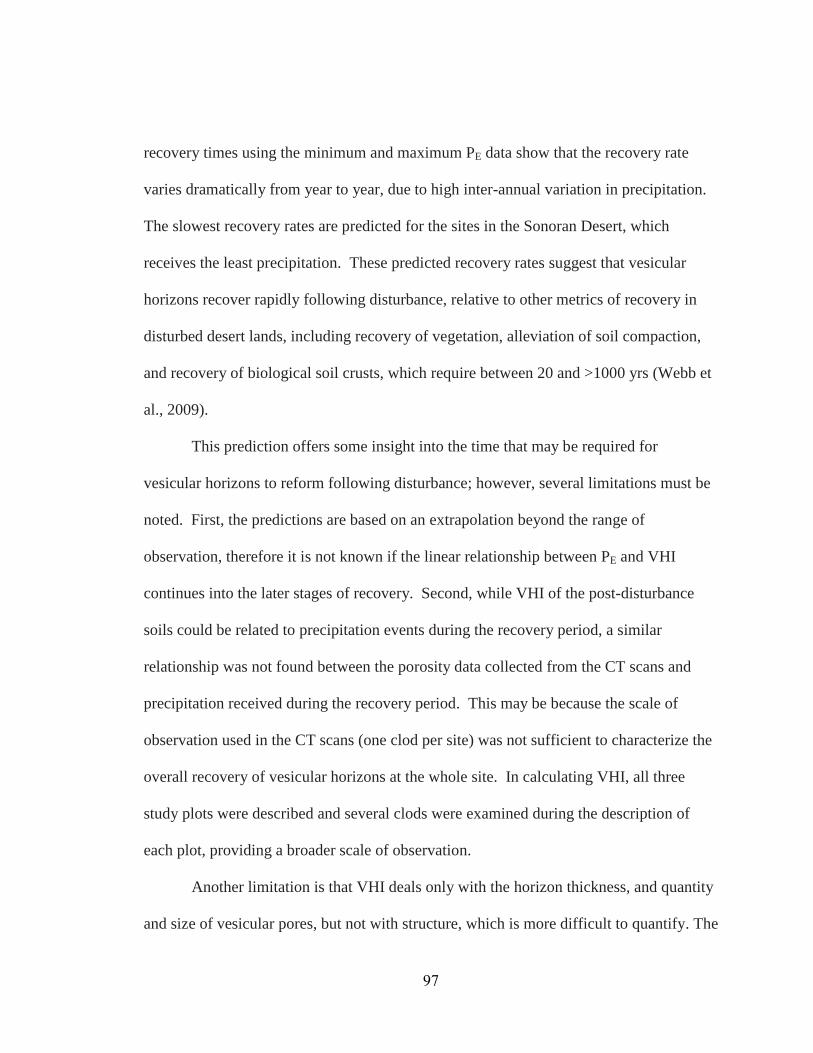
recovery times using the minimum and maximum PE data show that the recovery rate
varies dramatically from year to year, due to high inter-annual variation in precipitation.
The slowest recovery rates are predicted for the sites in the Sonoran Desert, which
receives the least precipitation. These predicted recovery rates suggest that vesicular
horizons recover rapidly following disturbance, relative to other metrics of recovery in
disturbed desert lands, including recovery of vegetation, alleviation of soil compaction,
and recovery of biological soil crusts, which require between 20 and >1000 yrs (Webb et
al., 2009).
This prediction offers some insight into the time that may be required for
vesicular horizons to reform following disturbance; however, several limitations must be
noted. First, the predictions are based on an extrapolation beyond the range of
observation, therefore it is not known if the linear relationship between PE and VHI
continues into the later stages of recovery. Second, while VHI of the post-disturbance
soils could be related to precipitation events during the recovery period, a similar
relationship was not found between the porosity data collected from the CT scans and
precipitation received during the recovery period. This may be because the scale of
observation used in the CT scans (one clod per site) was not sufficient to characterize the
overall recovery of vesicular horizons at the whole site. In calculating VHI, all three
study plots were described and several clods were examined during the description of
each plot, providing a broader scale of observation.
Another limitation is that VHI deals only with the horizon thickness, and quantity
and size of vesicular pores, but not with structure, which is more difficult to quantify. The
97

recovery of vesicular horizon structure is a significant concern because of the role that
interpedal voids play in infiltration (Meadows et al., 2008) and seedling establishment
(Eckert et al., 1986b). In chronosquence studies, platy structure is observed in very
young vesicular horizons (750 yrs), whereas columnar or prismatic structure in the
vesicular horizon is only observed in soils older than 10,000 yrs (McDonald, 1994;
Meadows et al., 2008). The development of these structures in initially coarse-textured
parent material requires modification of texture through eolian input, a process that may
limit the rate of initial structure development. The formation of structure following
disturbance may occur much more rapidly, assuming that the soil texture has not been
severely modified by the disturbance. The relatively rapid formation of vesicular horizon
structure following disturbance is supported by our observations of weak prismatic
structure in some of the reformed vesicular horizons, which had developed in one year
following disturbance. Previous studies have also observed the reformation of polygonal
structure in vesicular soils during one year following trampling by grazing animals
(Eckert et al., 1986b). At our field areas, platy structure was not observed to reform in
the disturbed soils during the one year recovery period; however, the reformation of platy
structure was observed in the disturbed soils at LMNRA (Yonovitz and Drohan, 2009).
Laboratory studies of vesicular pore formation have shown that platy structure is formed
by the growth of fissures between horizontally interconnected vesicular pores (Figueira
and Stoops, 1983), a process that occurs after many (20-30) wetting and drying cycles.
Based on the typical number of rainfall events at the field areas (Table 3.5), this process
is likely to take between two and six years.
98
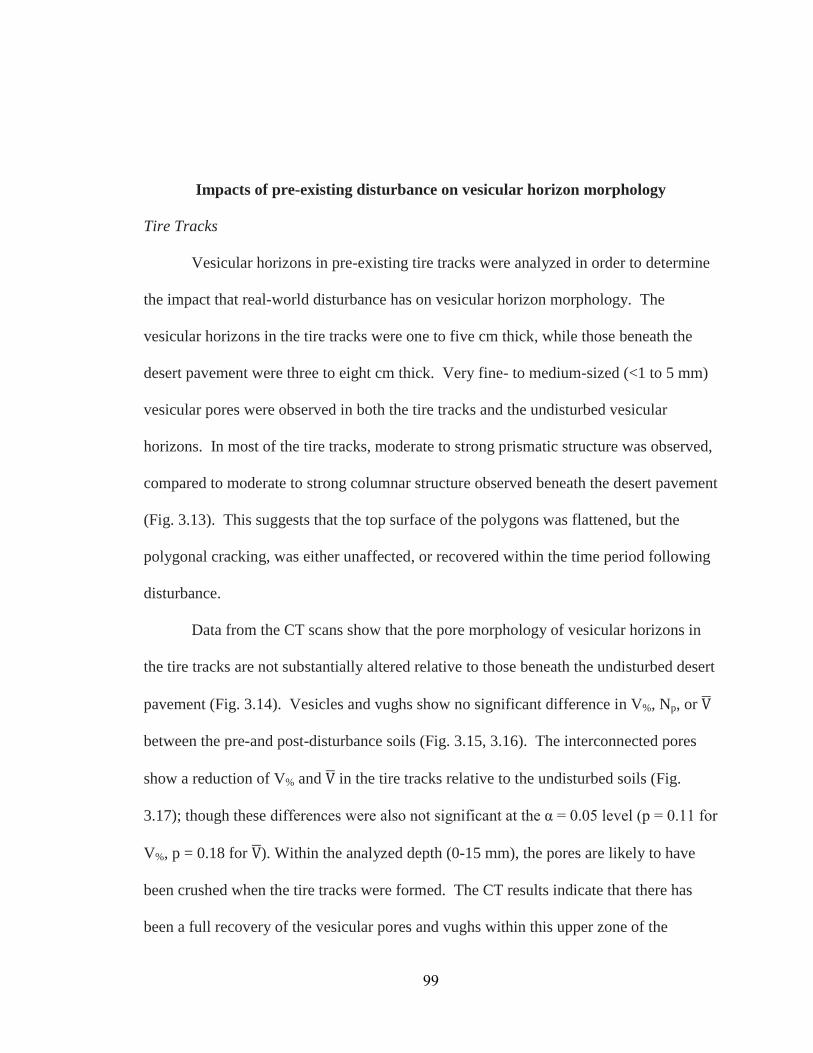
Impacts of pre-existing disturbance on vesicular horizon morphology
Tire Tracks
Vesicular horizons in pre-existing tire tracks were analyzed in order to determine
the impact that real-world disturbance has on vesicular horizon morphology. The
vesicular horizons in the tire tracks were one to five cm thick, while those beneath the
desert pavement were three to eight cm thick. Very fine- to medium-sized (<1 to 5 mm)
vesicular pores were observed in both the tire tracks and the undisturbed vesicular
horizons. In most of the tire tracks, moderate to strong prismatic structure was observed,
compared to moderate to strong columnar structure observed beneath the desert pavement
(Fig. 3.13). This suggests that the top surface of the polygons was flattened, but the
polygonal cracking, was either unaffected, or recovered within the time period following
disturbance.
Data from the CT scans show that the pore morphology of vesicular horizons in
the tire tracks are not substantially altered relative to those beneath the undisturbed desert
pavement (Fig. 3.14). Vesicles and vughs show no significant difference in V%, Np, or
between the pre-and post-disturbance soils (Fig. 3.15, 3.16). The interconnected pores
show a reduction of V% and in the tire tracks relative to the undisturbed soils (Fig.
3.17); though these differences were also not significant at the α = 0.05 level (p = 0.11 for
V%, p = 0.18 for ). Within the analyzed depth (0-15 mm), the pores are likely to have
been crushed when the tire tracks were formed. The CT results indicate that there has
been a full recovery of the vesicular pores and vughs within this upper zone of the
99
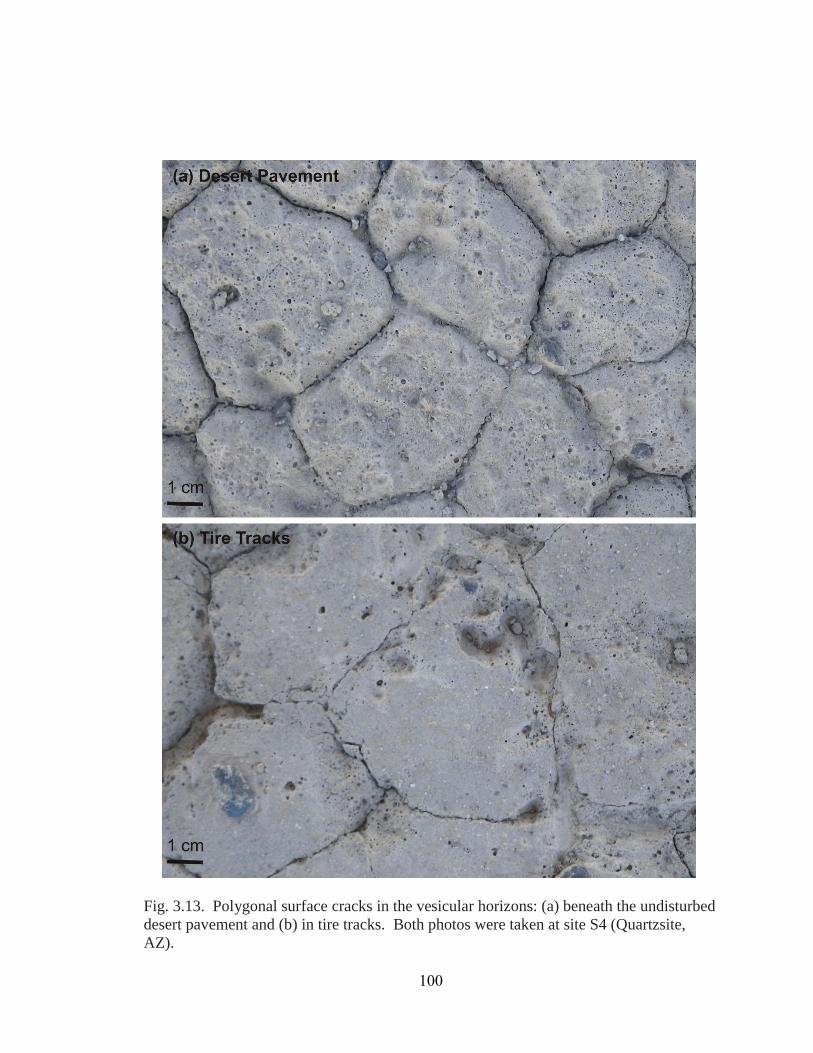
Fig. 3.13. Polygonal surface cracks in the vesicular horizons: (a) beneath the undisturbed desert pavement and (b) in tire tracks. Both photos were taken at site S4 (Quartzsite, AZ).
100
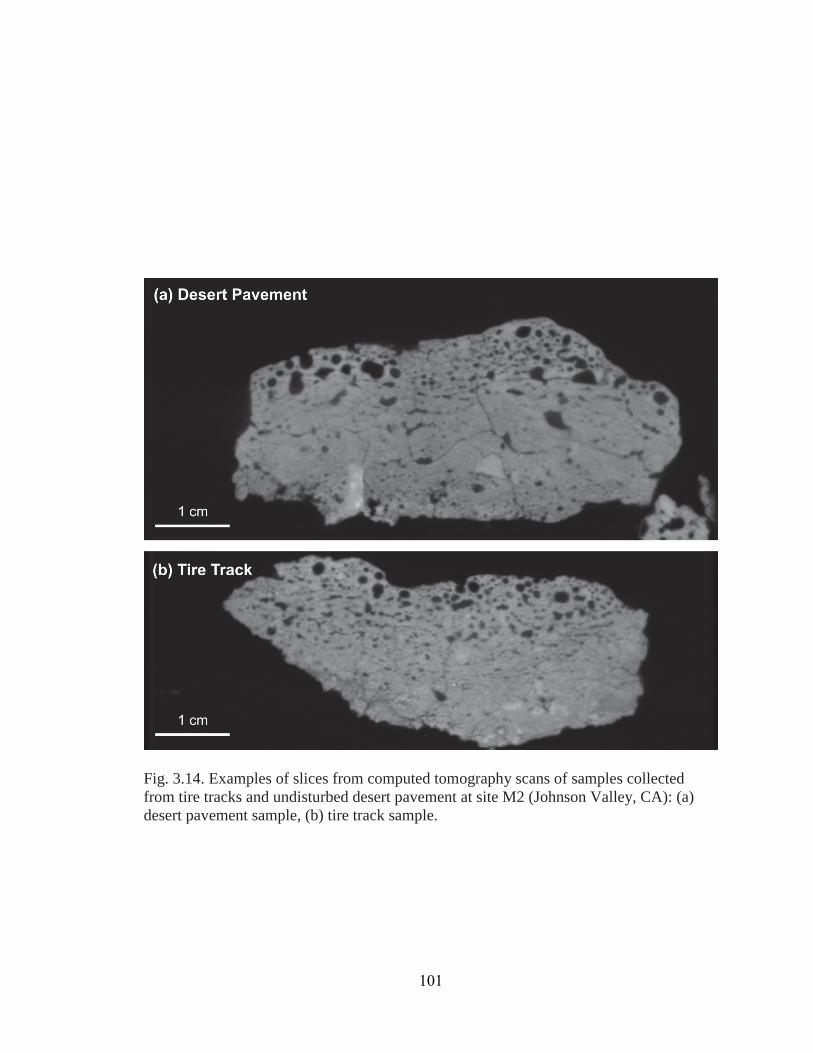
Fig. 3.14. Examples of slices from computed tomography scans of samples collected from tire tracks and undisturbed desert pavement at site M2 (Johnson Valley, CA): (a) desert pavement sample, (b) tire track sample.
101
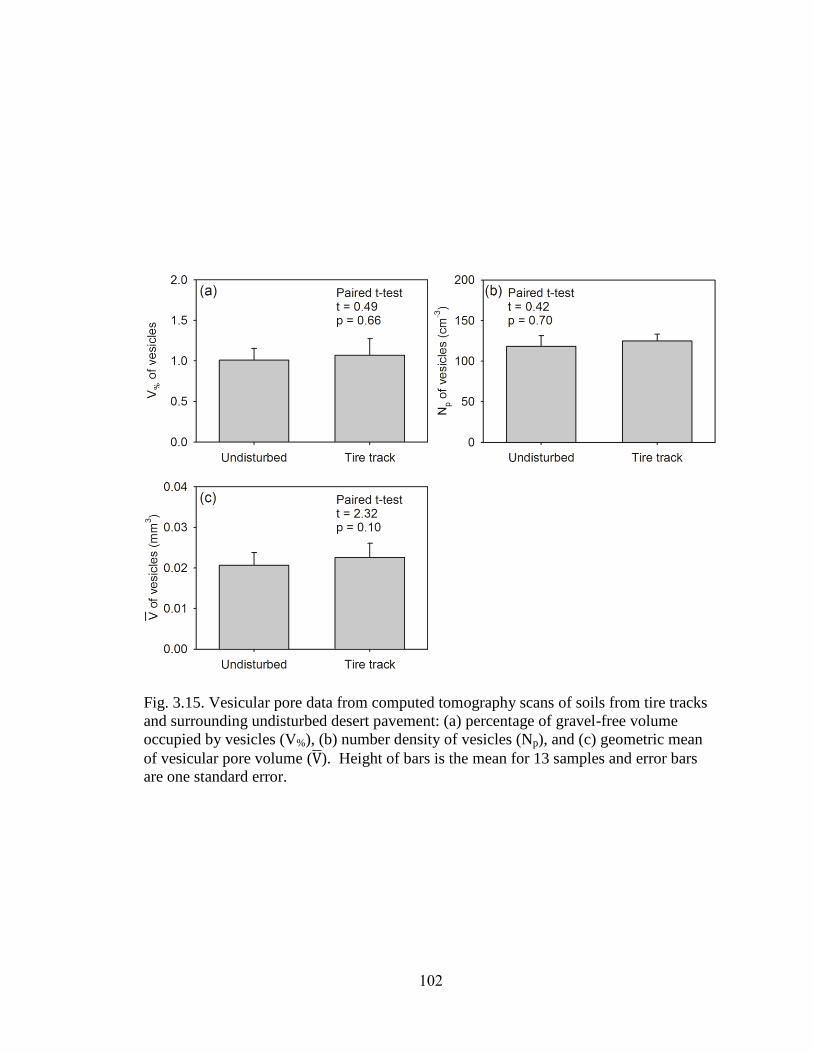
Fig. 3.15. Vesicular pore data from computed tomography scans of soils from tire tracks
and surrounding undisturbed desert pavement: (a) percentage of gravel-free volume
occupied by vesicles (V%), (b) number density of vesicles (Np), and (c) geometric mean
of vesicular pore volume ( ̅). Height of bars is the mean for 13 samples and error bars
are one standard error.
102
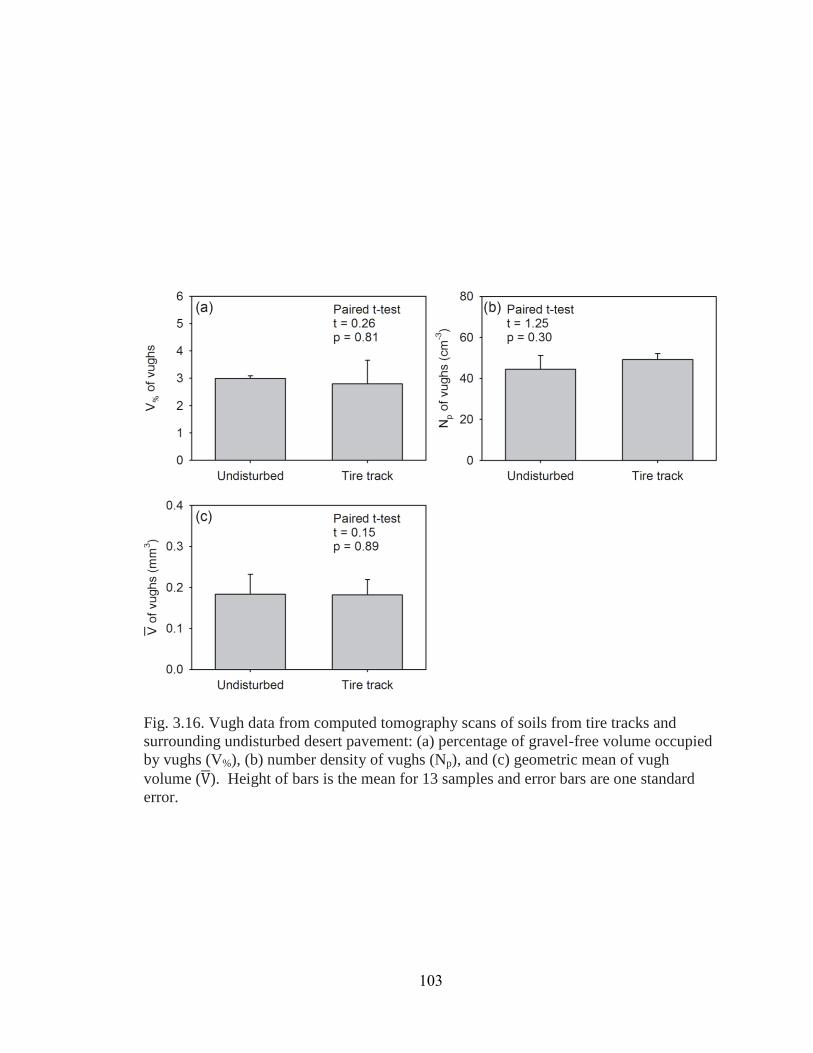
Fig. 3.16. Vugh data from computed tomography scans of soils from tire tracks and surrounding undisturbed desert pavement: (a) percentage of gravel-free volume occupied by vughs (V%), (b) number density of vughs (Np), and (c) geometric mean of vugh volume ( ). Height of bars is the mean for 13 samples and error bars are one standard error.
103
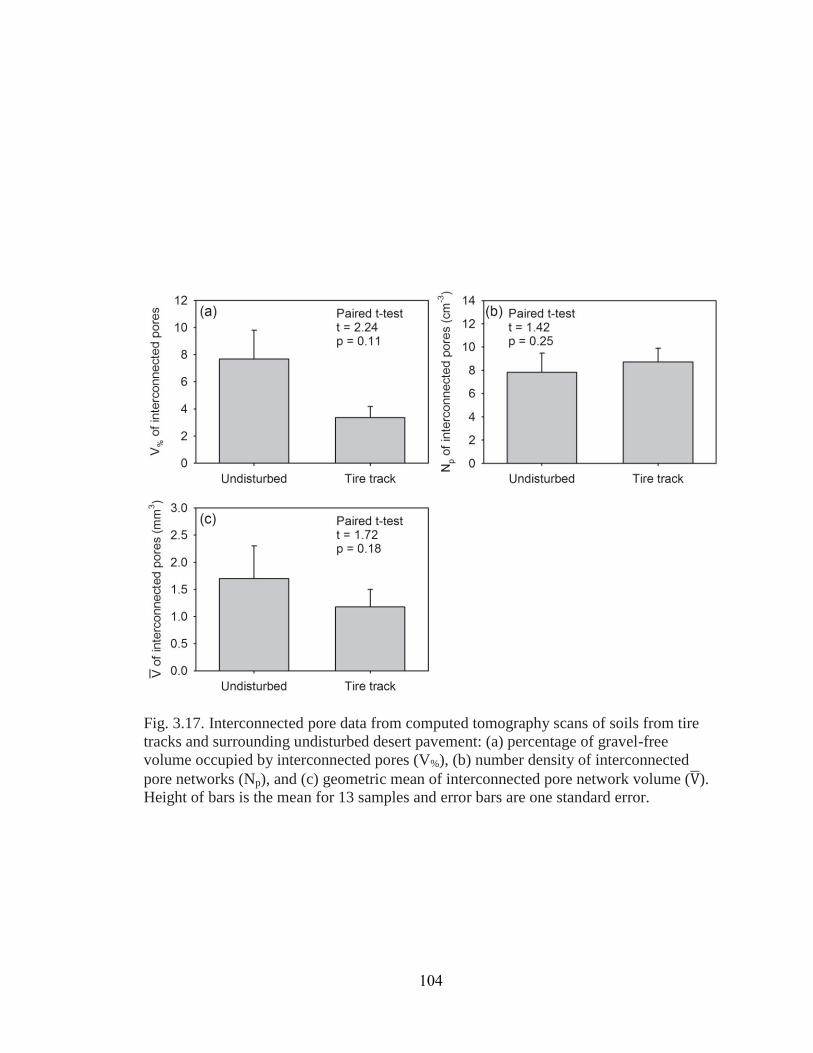
Fig. 3.17. Interconnected pore data from computed tomography scans of soils from tire tracks and surrounding undisturbed desert pavement: (a) percentage of gravel-free volume occupied by interconnected pores (V%), (b) number density of interconnected pore networks (Np), and (c) geometric mean of interconnected pore network volume ( ). Height of bars is the mean for 13 samples and error bars are one standard error.
104
vesicular horizon, and nearly complete recovery of the interconnected pore networks.
However, our field observations indicate that the vesicular horizons were thinner in the
tire tracks, which suggests a slower recovery in the lower part of the vesicular horizon.
Coppice Dunes
Vesicular horizons were sometimes observed beneath coppice dunes at our field
areas (Fig. 3.1b). Vesicular horizons beneath coppice dunes were also observed by
Shafer et al. (2007) in the Mojave Desert. Coppice dunes have sandier textures than soils
in the shrub interspace and are subject to mixing by bioturbation, creating conditions
which typically prevent the formation of vesicular horizons (Eckert et al., 1978;
McFadden et al., 1998). Therefore, the vesicular horizons observed beneath the coppice
dunes are most likely relicts; i.e., they formed in a shrub interspace and were
subsequently buried when a new shrub, and corresponding coppice dune, was established.
These vesicular horizons were examined in order to evaluate changes in vesicular horizon
morphology that occur following shrub establishment.
The vesicular horizons observed beneath coppice dunes were three to six cm
thick, and occurred beneath five to 12 cm of loose sandy material that formed the coppice
dune. The vesicular horizons contained mostly very fine to fine vesicular pores (<1-2
mm diam.) and occasional very fine root channels. The structure was either massive or
platy. Vesicular horizons beneath the adjacent desert pavement were of a similar
thickness (3-7 cm), but contained very fine- to medium-sized vesicular pores (<1-5 mm
diam.), and displayed columnar structure parting to platy structure. Beneath some
105
coppice dunes, a vesicular horizon remnant could be identified based on color, texture,
and position relative to the surrounding desert pavement, but no vesicular pores were
observed.
Examination of CT scans indicates that vesicular horizons undergo a loss of their
characteristic porosity when they become buried beneath a coppice dune. Representative
slices from CT scans of vesicular horizons beneath a coppice dune and a desert pavement
are shown in Fig. 3.18. In these slices, the reduction in vesicular pore size and increase
in planar voids with horizontal orientation is apparent. These observations suggest that
the vesicular pores collapse under the weight of the coppice dune sediments, producing
the planar voids, which separate platy structural units. A similar zone of collapsed
vesicles is sometimes described in the lower part of cumulic vesicular horizons, in these
soils vesicular porosity is prominent in the upper part of the vesicular horizon, while a
platy subcrust, with some remaining vesicles occurs in the lower part of the horizon
(Miller, 1971; Brewer, 1976; McFadden et al., 1998; Joeckel and Clement, 1999;
Lebedeva et al., 2009).
The porosity of the vesicular horizons is notably altered in the buried vesicular
horizons (Figs. 3.19, 3.20, 3.21). None of the differences described here were significant
at the α = 0.05 level, which is most likely due to an insufficient sample size (N = 4).
Vesicles and vughs in the buried vesicular horizons occupy less of the sample volume
compared to the un-buried vesicular horizons (Figs. 3.19a, 3.20a). The vesicles and
vughs were similar in number density between the buried and un-buried soils (Figs.
3.19b, 3.20b), but were smaller in volume (Figs. 3.19c, 3.20c). In contrast to the vesicles
106
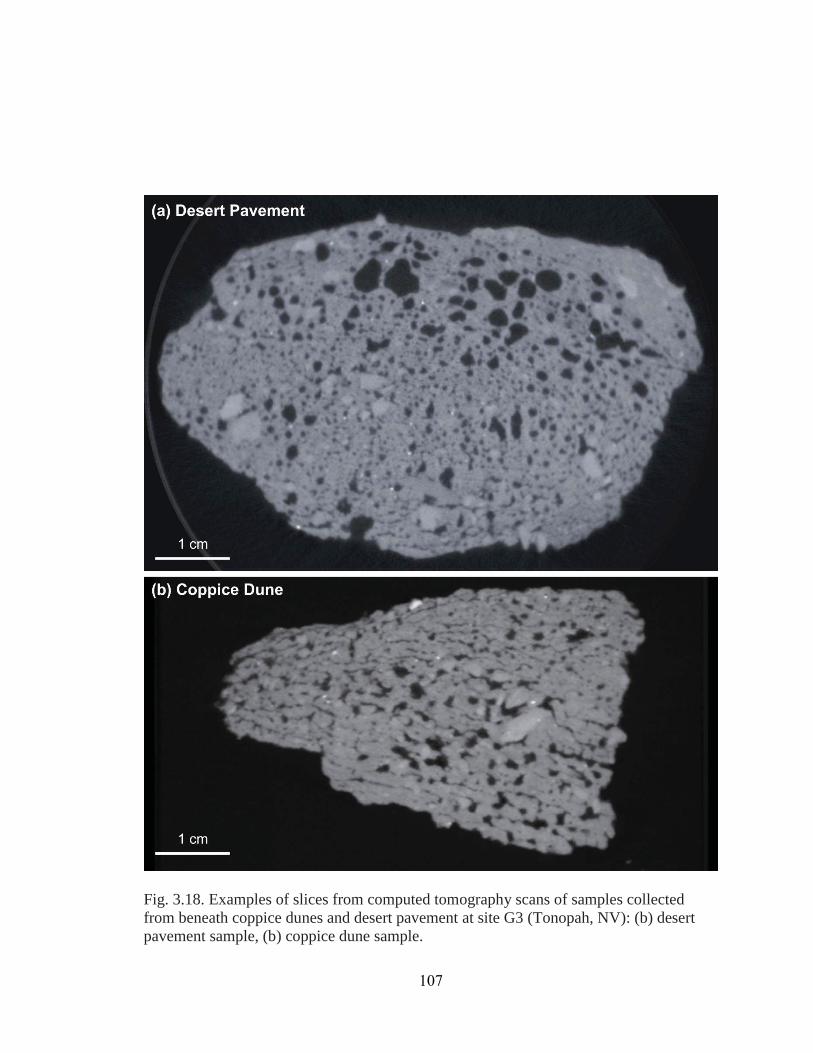
Fig. 3.18. Examples of slices from computed tomography scans of samples collected from beneath coppice dunes and desert pavement at site G3 (Tonopah, NV): (b) desert pavement sample, (b) coppice dune sample.
107
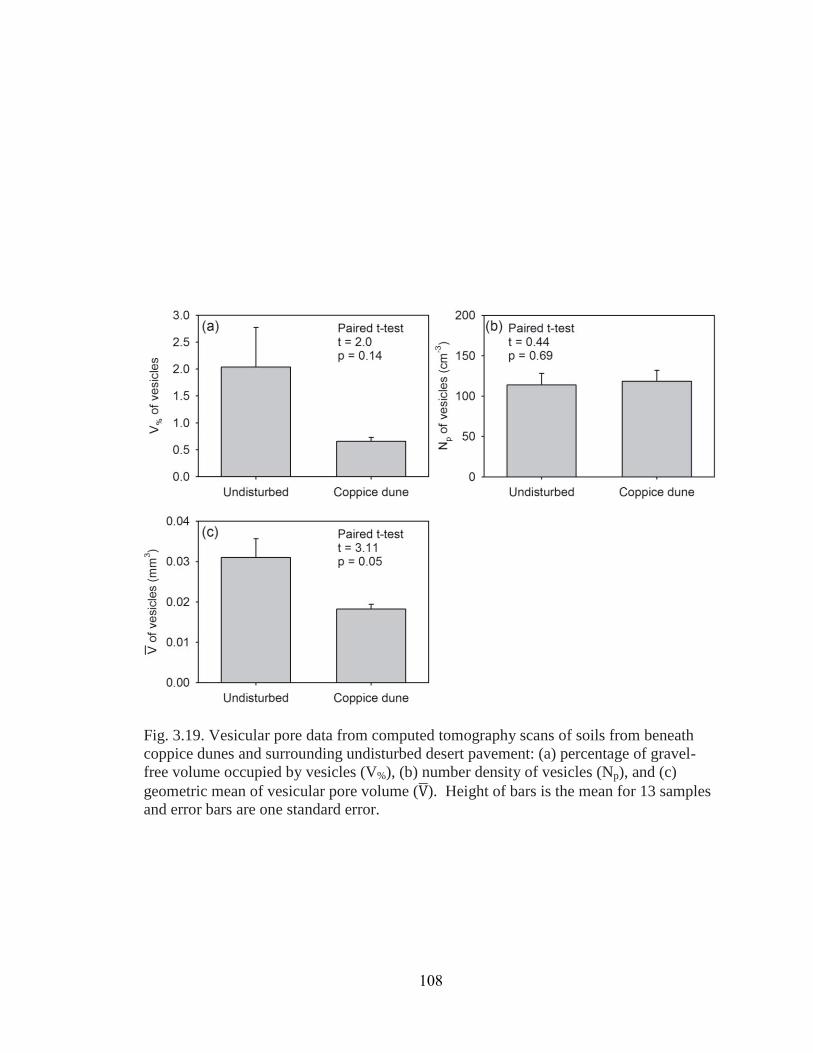
Fig. 3.19. Vesicular pore data from computed tomography scans of soils from beneath coppice dunes and surrounding undisturbed desert pavement: (a) percentage of gravel-free volume occupied by vesicles (V%), (b) number density of vesicles (Np), and (c) geometric mean of vesicular pore volume ( ). Height of bars is the mean for 13 samples and error bars are one standard error.
108
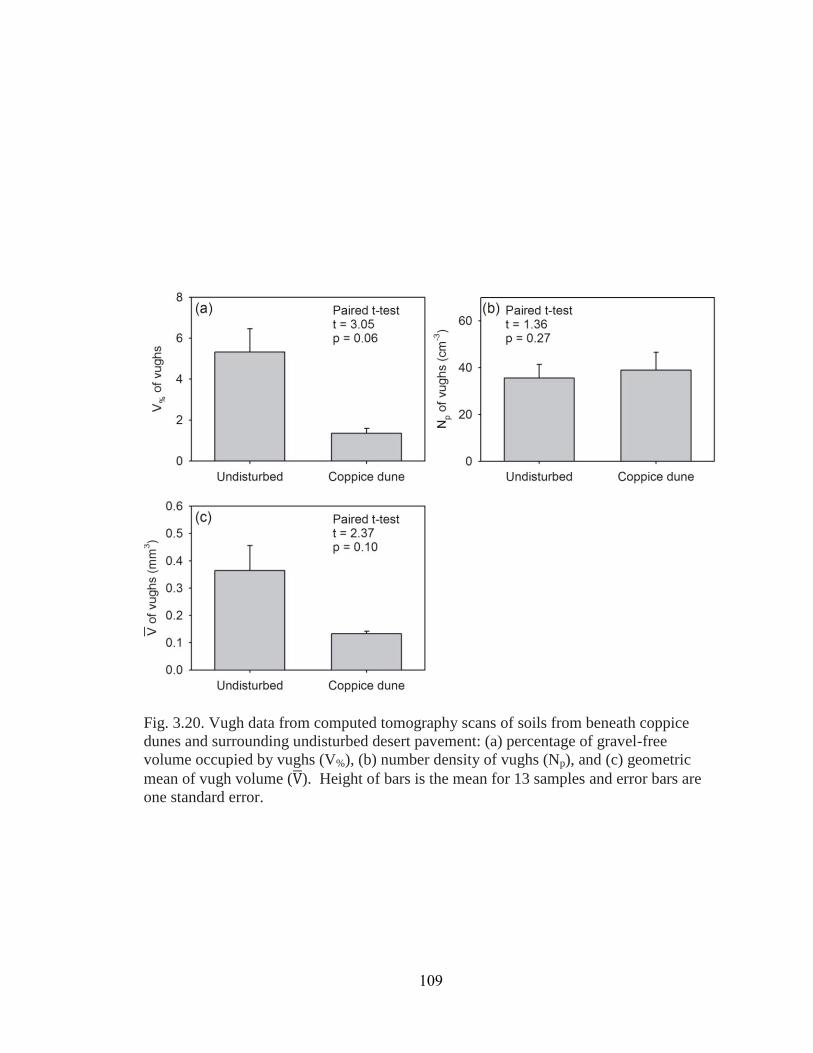
Fig. 3.20. Vugh data from computed tomography scans of soils from beneath coppice dunes and surrounding undisturbed desert pavement: (a) percentage of gravel-free volume occupied by vughs (V%), (b) number density of vughs (Np), and (c) geometric mean of vugh volume ( ). Height of bars is the mean for 13 samples and error bars are one standard error.
109
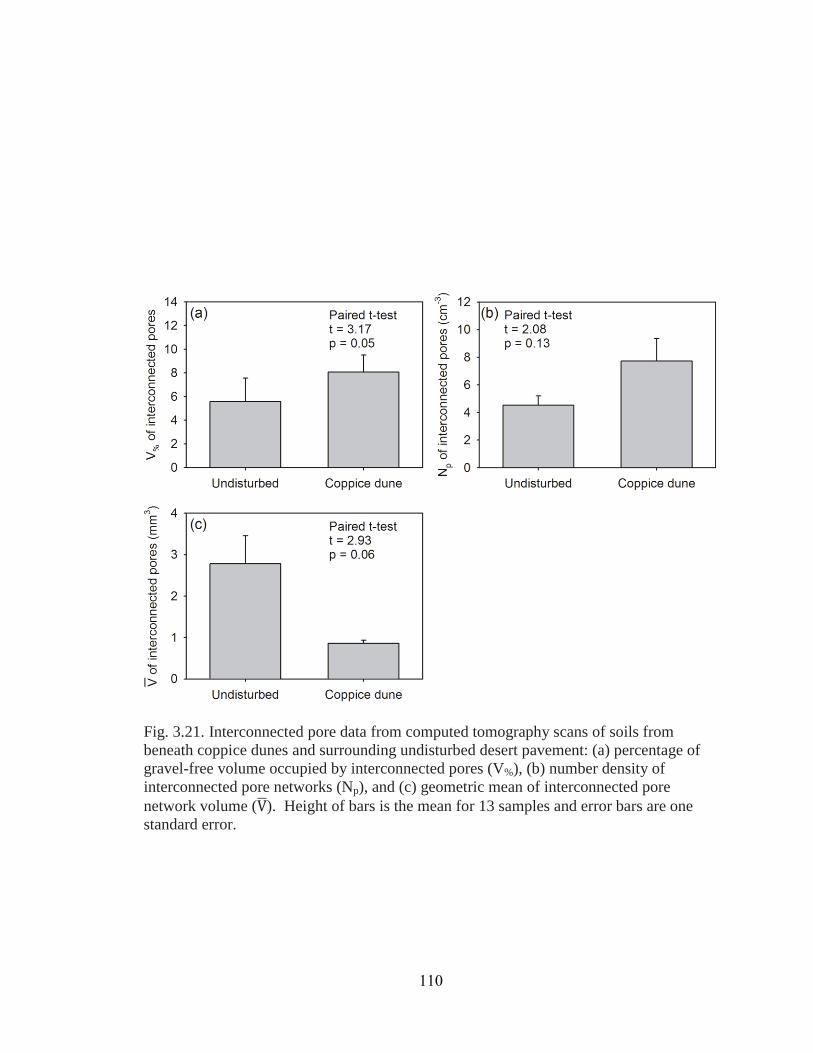
Fig. 3.21. Interconnected pore data from computed tomography scans of soils from beneath coppice dunes and surrounding undisturbed desert pavement: (a) percentage of gravel-free volume occupied by interconnected pores (V%), (b) number density of interconnected pore networks (Np), and (c) geometric mean of interconnected pore network volume ( ). Height of bars is the mean for 13 samples and error bars are one standard error.
110
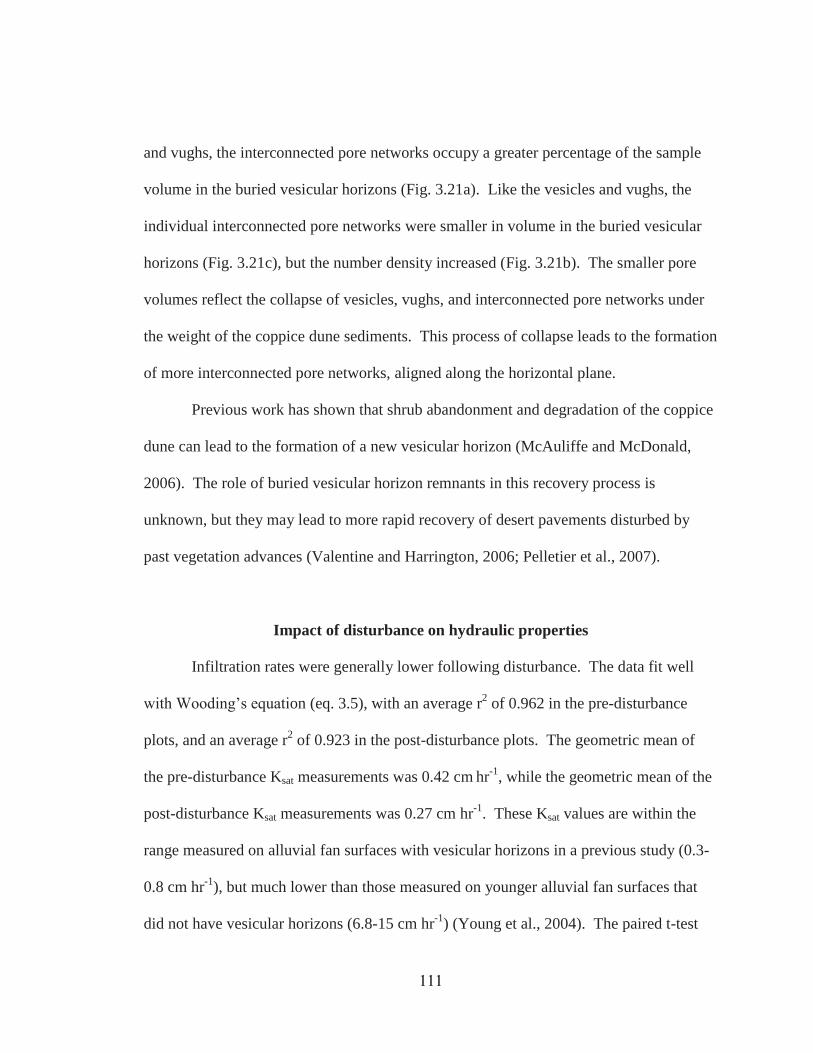
and vughs, the interconnected pore networks occupy a greater percentage of the sample
volume in the buried vesicular horizons (Fig. 3.21a). Like the vesicles and vughs, the
individual interconnected pore networks were smaller in volume in the buried vesicular
horizons (Fig. 3.21c), but the number density increased (Fig. 3.21b). The smaller pore
volumes reflect the collapse of vesicles, vughs, and interconnected pore networks under
the weight of the coppice dune sediments. This process of collapse leads to the formation
of more interconnected pore networks, aligned along the horizontal plane.
Previous work has shown that shrub abandonment and degradation of the coppice
dune can lead to the formation of a new vesicular horizon (McAuliffe and McDonald,
2006). The role of buried vesicular horizon remnants in this recovery process is
unknown, but they may lead to more rapid recovery of desert pavements disturbed by
past vegetation advances (Valentine and Harrington, 2006; Pelletier et al., 2007).
Impact of disturbance on hydraulic properties
Infiltration rates were generally lower following disturbance. The data fit well
with Wooding’s equation (eq. 3.5), with an average r2 of 0.962 in the pre-disturbance
plots, and an average r2 of 0.923 in the post-disturbance plots. The geometric mean of
the pre-disturbance Ksat measurements was 0.42 cm hr-1, while the geometric mean of the
post-disturbance Ksat measurements was 0.27 cm hr-1. These Ksat values are within the
range measured on alluvial fan surfaces with vesicular horizons in a previous study (0.3-
0.8 cm hr-1), but much lower than those measured on younger alluvial fan surfaces that
did not have vesicular horizons (6.8-15 cm hr-1) (Young et al., 2004). The paired t-test
111
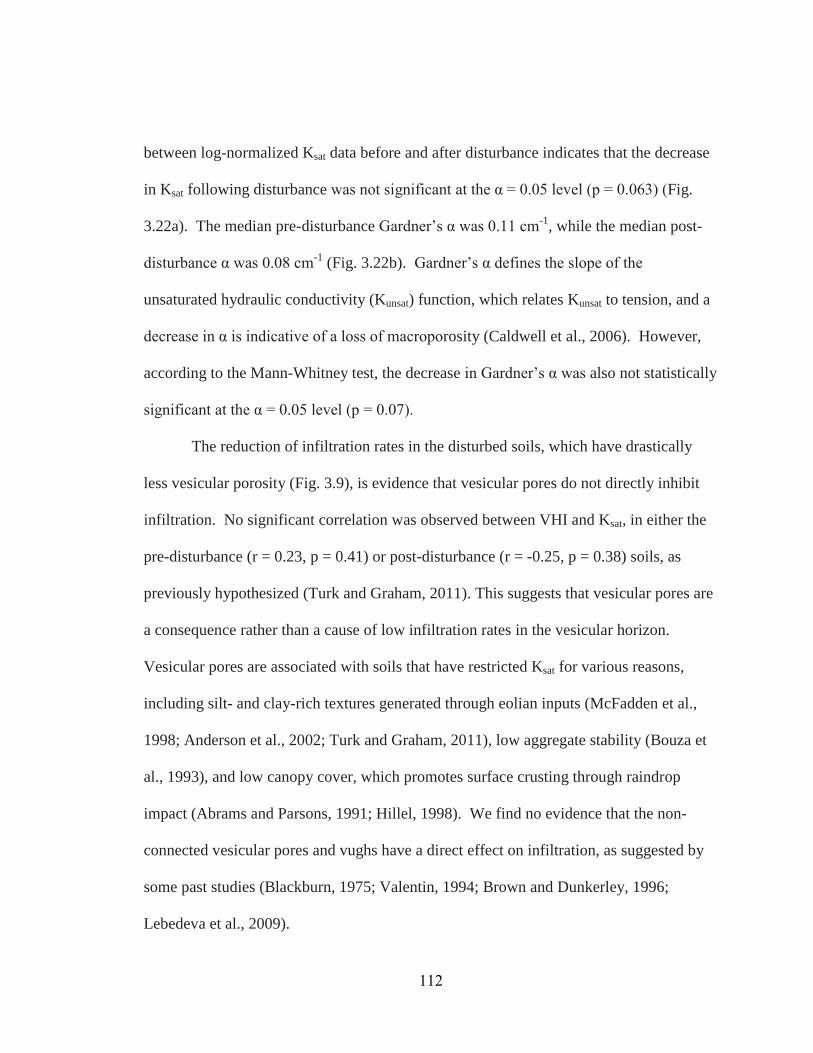
between log-normalized Ksat data before and after disturbance indicates that the decrease
in Ksat following disturbance was not significant at the α = 0.05 level (p = 0.063) (Fig.
3.22a). The median pre-disturbance Gardner’s α was 0.11 cm-1, while the median post-
disturbance α was 0.08 cm-1 (Fig. 3.22b). Gardner’s α defines the slope of the
unsaturated hydraulic conductivity (Kunsat) function, which relates Kunsat to tension, and a
decrease in α is indicative of a loss of macroporosity (Caldwell et al., 2006). However,
according to the Mann-Whitney test, the decrease in Gardner’s α was also not statistically
significant at the α = 0.05 level (p = 0.07).
The reduction of infiltration rates in the disturbed soils, which have drastically
less vesicular porosity (Fig. 3.9), is evidence that vesicular pores do not directly inhibit
infiltration. No significant correlation was observed between VHI and Ksat, in either the
pre-disturbance (r = 0.23, p = 0.41) or post-disturbance (r = -0.25, p = 0.38) soils, as
previously hypothesized (Turk and Graham, 2011). This suggests that vesicular pores are
a consequence rather than a cause of low infiltration rates in the vesicular horizon.
Vesicular pores are associated with soils that have restricted Ksat for various reasons,
including silt- and clay-rich textures generated through eolian inputs (McFadden et al.,
1998; Anderson et al., 2002; Turk and Graham, 2011), low aggregate stability (Bouza et
al., 1993), and low canopy cover, which promotes surface crusting through raindrop
impact (Abrams and Parsons, 1991; Hillel, 1998). We find no evidence that the non-
connected vesicular pores and vughs have a direct effect on infiltration, as suggested by
some past studies (Blackburn, 1975; Valentin, 1994; Brown and Dunkerley, 1996;
Lebedeva et al., 2009).
112
Fig. 3.22. Box plots of the hydraulic properties for pre-and post-disturbance vesicular horizons: (a) the logarithm of saturated hydraulic conductivity (Ksat) and (b) Gardner’s α. Boxes depict the upper and lower quartiles, center bars depict the median values, whiskers depict extreme values (within a distance from the box of 1.5 times the interquartile range), and points indicate outliers (outside a distance from the box of 1.5 times the interquartile range).
113
Similar changes to the hydraulic properties of vesicular soils were shown by
Caldwell et al. (2006), following disturbance by military tracked vehicles. That study
showed that the impact of disturbance on Ksat is dependent on the intensity of
disturbance. Low intensity disturbance (e.g., individual tracks made by one or two
passes), led to an increase in Ksat, which was attributed to disruption of the surface crust.
High intensity disturbance (e.g., repeatedly trafficked areas), led to a decrease in Ksat and
α, reflecting the loss of macroporosity due to compaction. The artificial disturbance
applied in the current study is most similar to the high-intensity disturbance, because it
results in elimination of structure and macroporosity. Thus, the reduction of Ksat and α
that we observed following disturbance is in agreement with the findings of Caldwell et
al. (2006). The decrease in Ksat may be primarily due to the destruction of the columnar
structure, which was either absent or weakly reformed following the recovery period. A
previous study, using dye to indicate the flow path of water moving through vesicular
soils, showed that most infiltration occurs through the cracks between polygonal
structural units (Meadows et al., 2008).
Anthropogenic disturbance that impacts the hydraulic properties of soils are of
critical concern in desert ecosystems. Water is the most limiting resource in desert
ecosystems and soil hydraulic properties partition water between runoff, drainage,
evaporation, and transpiration (Noy-Meir et al., 1973). Vesicular horizons typically have
very low infiltration rates (Turk and Graham, 2011), but we have shown that infiltration
rates can be further reduced through disturbance that results in a loss of macroporosity
and interpedal cracks (Fig. 3.14). This can be expected to increase runoff, resulting in a
114
more patchy pattern of water storage, and potentially increasing erosion of the vesicular
horizon (Eckert et al., 1979).
Based on our observations in this study, it can be predicted that the hydraulic
properties of the vesicular horizons will recover from disturbance as the vesicular horizon
morphology recovers. The observed decrease in Ksat and α were not statistically
significant, indicating that the alteration of hydraulic properties following disturbance
was relatively minor. The loss of infiltration capacity following disturbance can be
attributed to the loss of macroporosity, which we expect to recover over a period of two
to 11 years (Table 3.5). Although the vesicular pores and vughs are isolated pores, which
do not conduct water, interconnected pore networks are formed by fissures between the
isolated pores (Figs. 3.3c and 3.10). Calcitans and argillans that line the surface of
interconnected pores in vesicular soils, suggest that water is transported through these
pores (Sullivan and Koppi, 1991; Anderson et al., 2002). Horizontal fissures between
platy units in the vesicular horizons promote water transport from the exterior to the
interior of polygonal structural units (Anderson et al., 2002). We do not know how much
time is required for the recovery of columnar structure and polygonal cracks that promote
infiltration in vesicular soils (Meadows et al., 2008); however, we did observe weak
prismatic structure in some of the disturbance plots, following only one year of recovery
(Fig. 3.6b). Polygonal cracks were also observed in tire tracks (Fig. 3.13b), which
suggests that preferential flow through polygonal cracks between structural units would
be unaffected in the tire tracks.
115

The results of our study support the conclusion of Caldwell et al. (2006), that
ripping, a practice sometimes used to alleviate compaction for the remediation of
disturbed desert lands, should not be recommended for vesicular soils. This practice
would slow the recovery of structure and porosity that naturally reform following
disturbance in response to repeated wetting and drying by precipitation events.
SUMMARY AND CONCLUSIONS
Vesicular pores were observed to form in disturbed soils during a one-year recovery
period following disturbance. However, in contrast to previous findings (Yonovitz and Drohan,
2009), significant differences were observed between the pre- and post-disturbance soils,
suggesting that more than one year is required for complete recovery of the vesicular horizons.
The post-disturbance vesicular horizons formed during the recovery period were thinner than the
pre-disturbance vesicular horizons (Fig. 3.8) and contained less total volume of vesicles, vughs,
and interconnected pores (Figs. 3.9a, 3.10a, and 3.11a). For all types of pores, the number of
pores that reformed following disturbance was similar to the pre-disturbance soils (Figs. 3.9b,
3.10b, and 3.11b), but the individual pores were smaller in volume (Figs. 3.9c, 3.10c, and 3.11c).
Variation in recovery between field sites was best explained by the number of precipitation events
experienced during the recovery period (Fig. 3.12b). This relationship can be used to predict the
time required for recovery of vesicular horizon properties following disturbance (eq. 3.6, Table
3.5). We predict recovery periods between two and 11 yrs for the field areas considered in the
study; however, longer-term observations are required to verify these predictions.
Previously disturbed vesicular horizons, indicated by tire tracks and coppice dunes, were
observed in order to determine the effects of real-world disturbance on vesicular horizon
properties. Vesicular horizons in the tire tracks were thinner than those beneath the undisturbed
116
desert pavement; however, the pore morphology in the upper part of the horizon (0-15 mm) was
similar to that of the undisturbed vesicular horizons. In the vesicular horizons beneath the
coppice dunes, vesicular pores, vughs, and interconnected pores were smaller in volume. Planer
voids were prominent in the buried vesicular horizons, resulting from the collapse of large pores
along horizontal planes of weakness.
Vesicular horizon disturbance led to a decrease in Ksat and Gardner’s α, however, neither
of these hydraulic properties were significantly changed at the α = 0.05 level (Fig. 3.22). The
decreased infiltration rates in the post-disturbance soils are most likely attributable to the loss of
polygonal cracks, which promote preferential flow through the vesicular horizon (Meadows et al.,
2008).
117
REFERENCES
Abrahams, A.D., and A.J. Parsons. 1991. Relation between infiltration and stone Cover on a semiarid hillslope, southern Arizona. J. Hydrol. 122:49-59.
Amundson, R.G., O.A. Chadwick, J.M. Sowers, and H.E. Doner. 1989. Soil evolution
along an altitudinal transect in the eastern Mojave Desert of Nevada, USA. Geoderma 43:349-371.
Anderson, K., S. Wells, and R. Graham. 2002. Pedogenesis of vesicular horizons, Cima
Volcanic Field, Mojave Desert, California. Soil Sci. Soc. Am. J 66:878-887. Associate Press. 2010. Solar showdown in tortoises’ home. Available at
<http://www.msnbc.msn.com/id/34659369/ns/us_news-environment/> (accessed 11 Nov 2010). MSNBC.
Barbour, M.G., J.H. Burk, W.D. Pitts, F.S. Gilliam, and M.W. Schwartz. 1999. Methods of sampling the plant community. In Barbour et al. Terrestrial plant ecology. Benjamin/Cummings, Menlo Park, CA.
Beckman, W. 1962. Zur Mikromorphometrie von hohlräumen und aggregaten im boden.
(in German) Zeitsh Pflazern, Düng, Bodend 99:129-139. Blackburn, W.H. 1975. Factors influencing infiltration and sediment production of
semiarid rangelands in Nevada. Water Resour. Res. 11:929-937. Bockheim, J.G. 2010. Evolution of desert pavements and the vesicular layer in soils of
the Transantarctic Mountains. Geomorphology 118:433-443. Bouza, P., H.F. Delvalle, and P.A. Imbellone. 1993. Micromorphological, physical, and
chemical characteristics of soil crust types of the central Patagonia region, Argentina. Arid Soil Res. Rehabilitation 7:355-368.
Bower, C.A., and J.T. Hatcher. 1966. Simultaneous determinations of surface area and
cation exchange capacity. Soil Sci. Soc. Am. Proc. 30:525-527. Brewer, R. 1976. Fabric and mineral analysis of soils. Robert E. Krieger, Huntington,
NY. Brown, K.J., and D.L. Dunkerley. 1996. The influence of hillslope gradient, regolith
texture, stone size and stone position on the presence of a vesicular layer and related aspects of hillslope hydrologic processes: A case study from the Australian arid zone. Catena 26:71-84.
118
Brun, F., L. Mancini, P. Kasae, S. Favretto, D. Dreossi, and G. Tromba. 2010. Pore3D: A software library for quantitative analysis of porous media. Nucl. Instrum. Meth. A. 615:326-332.
Bunting, B.T. 1977. The occurrence of vesicular structures in arctic and subarctic soils.
Z. Geomorphol. 21:87-95. Burt, R. (ed.) 2004. Soil Survey Laborator Methods Manual. Soil Suvey Investigations
Report No. 42. USDA, Washington, DC. Caldwell, T.G., E.V. McDonald, and M.H. Young. 2006. Soil disturbance and hydrologic
response at the National Training Center, Ft. Irwin, California. J. Arid Environ. 67:456-472.
Cantόn, Y., A. Solé-Benet, and R. Lázaro. 2003. Soil-geomorphology relations in
gypsiferous materials of the Tabernas Desert (Almeria, SE spain). Geoderma 115:193-222.
Dan, J., D.H. Yaalon, R. Moshe, and S. Nissim. 1982. Evolution of reg soils in southern
Israel and Sinai. Geoderma 28:173-202. Eckert, R.E., M.K. Wood, W.H. Blackburn, F.F. Peterson, J.L. Stephens, and M.S.
Meurisse. 1978. Effects of surface-soil morphology on improvement and management of some arid and semiarid rangelands. p. 299-301. In D.N. Hyder (ed.) Proc. of the First Int. Rangeland Congr., Denver, CO. 14-18 Aug. 1978. Society for Range Mangement, Denver, CO.
Eckert, R.E., F.F. Peterson, and J.T. Belton. 1986a. Relation between ecological-range
condition and proportion of soil-surface types. J. Range Manage. 39:409-414. Eckert, R.E., F.F. Peterson, M.S. Meurisse, and J.L. Stephens. 1986b. Effects of soil-
surface morphology on emergence and survival of seedlings in big sagebrush communities. J. Range Manage. 39:414-420.
Ellis, F. 1990. Note on soils with vesicular structure and other micromorphological
features in Karoo soils. p. 326-336. In Proc. 16th Congress of the Soil Science Society of South Africa, Pretoria, South Africa. July 9-12 1990. Soil Science Society of South Africa, Erasmusrand, South Africa.
Evenari, M., D.H. Yaalon, and Y. Gutterman. 1974. Note on soils with vesicular structure
in deserts. Z. Geomorphol. 18:162-172. Figueira, H., and G. Stoops. 1983. Application of micromorphometric techniques to the
experimental study of vesicular layer formation. Pedologie 33:77-89.
119
Fenimore, C. 2011. NCDC: Locate Weather Observation Station Record. Available at
http://www.ncdc.noaa.gov/oa/climate/stationlocator.html (verified 15 Jan. 2012). Natl. Oceanic and Atmospheric Administration, Natl. Climatic Data Cent., Ashville, NC.
French, R.H. 1983. Precipitation in southern Nevada. J. Hydraul. Eng. 109:1023-1038. Gardner, W.R. 1958. Some steady-state solutions of the unsaturated moisture flow
equation with application to evaporation from a water table. Soil Sci 85:228-232. Gile, L.H., and J.W. Hawley. 1968. Age and comparative development of desert soils at
Gardner Spring radiocarbon site, New Mexico. Soil Sci. Soc. Am. Proc. 32:709-716.
Gilewitch, D.A. 2004. The effect of military operations on desert pavement: a case study
from Butler Pass, AZ (USA). p. 243-258. In D. R. Caldwell et al. (ed.) Studies in military geography and geology. Kluwer Academic Publishers, Alphen aan den Rijn, The Netherlands.
Google Incorporated, 2011. Google Earth 6.1.0.5001. Google Inc., Mountain View, CA. Goossens, D., and B. Buck. 2009. Dust emission by off-road driving: Experiments on 17
arid soil types, Nevada, USA. Geomorphology 107:118-138. Hamerlynck, E.P., J.R. McAuliffe, E.V. McDonald, and S.D. Smith. 2002. Ecological
responses of two Mojave Desert shrubs to soil horizon development and soil water dynamics. Ecology 83:768-779.
Harvey, A.M., P.E. Wigand, and S.G. Wells. 1999. Response of alluvial fan systems to
the late Pleistocene to Holocene climatic transition: contrasts between the margins of pluvial Lakes Lahontan and Mojave, Nevada and California, USA. Catena 36:255-281.
Henning, J.A.G., and K. Kellner. 1994. Degradation of a soil (Aridosol) and vegetation in
the semiarid grasslands of southern Africa. Bot. Bull. Acad. Sin. 35:195-199. Hillel, D. 1998. Environmental Soil Physics Academic Press, San Diego, CA. Hugie, V.K., and H.B. Passey. 1964. Soil surface patterns of some semiarid soils in
northern Utah, southern Idaho, and northeastern Nevada. Soil Sci. Soc. Am. Proc. 28:786-792.
120
Issa, O.M., J. Trichet, C. Defarge, A. Coute, and C. Valentin. 1999. Morphology and microstructure of microbiotic soil crusts on a tiger bush sequence (Niger, Sahel). Catena 37:175-196.
Joeckel, R.M., and B.A. Clement. 1999. Surface features of the Salt Basin of Lancaster
County, Nebraska. Catena 34:243-275. Ketcham, R.A. 2005. Computational methods for quantitative analysis of three-
dimensional feature in geological specimens. Geosphere 1:32-41. Lebedeva, M.P., D.L. Golovanov, and S.A. Inozemtsev. 2009. Microfabrics of desert
soils of Mongolia. Euras. Soil Sci. 42:1204-1217. Lovich, J.E., and D. Bainbridge. 1999. Anthropogenic degradation of the southern
California desert ecosystem and prospects for natural recovery and restoration. Environ. Manag. 24:309-326.
Matmon, A., O. Simhai, R. Amit, I. Haviv, N. Porat, E. McDonald, L. Benedetti, and R.
Finkel. 2009. Desert pavement-coated surfaces in extreme deserts present the longest-lived landforms on Earth. Geol. Soc. Am. Bull. 121:688-697.
McAuliffe, J.R. 1994. Landscape evolution, soil formation, and ecological patterns and
processes in Sonoran Desert bajadas. Ecol. Monogr. 64:111-148. McAuliffe, J.R., and E.V. McDonald. 2006. Holocene environmental change and
vegeation contraction in the Sonoran Desert. Quat Res 65:204-215. McDonald, E.V. 1994. The relative influences of climatic change, desert dust, and
lithologic control on soil-geomorphic processes and soil hydrology of calcic soils formed on quaternary alluvial-fan deposits in the Mojave Desert, California. Ph.D. Dissertation, The University of New Mexico, Albuquerque, NM.
McDonald, E.V., L.D. McFadden, and S.G. Wells. 1995. The relative influences of
climate change, desert dust, and lithologic control on soil-geomorphic processes on alluvial fans, Mojave Desert, California: Summary of results. p. 35-42. In R. E. Reynolds and J. Reynolds (ed.) Ancient surfaces of the East Mojave Desert: a volume and field trip guide prepared in conjunction with the 1995 Desert Research Symposium. Quarterly of the San Bernardino County Museum Association. San Bernardino County Museum Association, Redlands, CA.
McFadden, L.D., E.V. McDonald, S.G. Wells, K. Anderson, J. Quade, and S.L. Forman.
1998. The vesicular layer and carbonate collars of desert soils and pavements: formation, age and relation to climate change. Geomorphology 24:101-145.
121
McFadden, L.D., S.G. Wells, and M.J. Jercinovich. 1987. Influences of eolian and pedogenic processes on the origin and evolution of desert pavements. Geology 15:504-508.
Meadows, D.G., M.H. Young, and E.V. McDonald. 2008. Influence of relative surface
age on hydraulic properties and infiltration on soils associated with desert pavements. Catena 72:169-178.
Miller, D.E. 1971. Formation of vesicular structure in soil. Soil Sci. Soc. Am. Proc.
35:635-637. Miller, D.M., D.R. Bedford, D.L. Hughson, E.V. McDonald, S.E. Robinson, and K.M.
Schmidt. 2009. Mapping Mojave Desert ecosystem properties with surficial geology. p. 225-251. In R. H. Webb et al. (ed.) The Mojave Desert: Ecosystem Processes and Sustainability. University of Nevada Press, Reno, NV.
Minitab. 2010. MINITAB 16. Minitab, State College, PA. Musick. 1975. Barrenness of desert pavement in Yuma County, Arizona. J. Arizona
Acad. Sci. 10:24-28. Noy-Meir, I. 1973. Desert ecosystems: environment and producers. Annu. Rev. Ecol.
Syst. 4:25-51. Paletskaya, L.N., A.P. Lavrov, and S.I. Kogan. 1958. Pore formation in takyr crust. Sov.
Soil Sci. (Engl. Transl.) 3:245-250. Pelletier, J.D., M. Cline, and S.B. DeLong. 2007. Desert pavement dynamics: numerical
modeling and field-based calibration. Earth Surf. Process Landforms 32:1913-1927.
Peterson, F.F. 1980. Holocene desert soil formation under sodium-salt influence in a
playa-margin environment. Quat. Res. 13:172-186. Quade, J. 2001. Desert pavements and associated rock varnish in the Mojave Desert:
How old can they be? Geology 29:855-858. Reheis, M.C., J.W. Harden, L.D. McFadden, and R.R. Shroba. 1989. Development rates
of late quaternary soils, Silver Lake Playa, California. Soil Sci. Soc. Am. J. 53:1127-1140.
Schlesinger, W.H., J.F. Reynolds, G.L. Cunningham, L.F. Huenneke, W.M. Jarrell, R.A.
Virginia, and W.G. Whitford. 1990. Biological feedbacks in global desertification. Science 247:1043-1048.
122
Schoeneberger, P.J., D.A. Wysocki, E.C. Benham, and W.D. Broderson. (eds.) 2002.
Field book for describing and sampling soils, Version 2.0. NRCS National Soil Survey Center, Lincoln, NE.
Segal, E., P.J. Shouse, S.A. Bradford, T.H. Skaggs, and D.L. Corwin. 2009. Measuring
particle size distribution using laser diffraction: implications for predicting soil hydraulic properties. Soil Sci. 174:639-645.
Shafer, D.S., M.H. Young, S.F. Zitzer, T.G. Caldwell, and E.V. McDonald. 2007.
Impacts of interrelated biotic and abiotic processes during the past 125 000 years of landscape evolution in the Northern Mojave Desert, Nevada, USA. J. Arid Environ. 69:633-657.
Smith, S.D., C.A. Herr, K.L. Leary, and J.M. Piorkowski. 1995. Soil-plant water relations
in a Mojave Desert mixed shrub community: a comparison of three geomorphic surfaces. J Arid Environ 29:339-351.
Soil Survey Staff. 2010. Keys to Soil Taxonomy, 11th ed. USDA Natural Resources
Conservation Service, Washington, DC. Springer, M.E. 1958. Desert pavement and vesicular layer of some soils of the desert of
the Lahontan Basin, Nevada. Soil Sci. Soc. Am. Proc. 22:63-66. Stevenson, B.A., E.V. McDonald, and T.G. Caldwell. 2009. Root patterns of Larrea
tridentata in relation to soil morophology in Mojave Desert soils of different ages. p. 225-251, In R. H. Webb et al. (ed.) The Mojave Desert: Ecosystem Processes and Sustainability. University of Nevada Press, Reno, NV.
Stoops, G. 2003. Guidelines for Analysis and Description of Soil and Reolith Thin
Sections Soil Science Society of America, Madison, WI. Strathouse, S.M. 1982. Genesis and mineralogy of soils on an alluvila fan, western
Mojave Desert, California. Ph.D. Dissertation, University of California, Riverside, CA.
Sullivan, L.A., and A.J. Koppi. 1991. Morphology and genesis of silt and clay coatings in
the vesicular layer of a desert loam soil. Aust. J. Soil Res. 29:579-586. Systat Software. 2007. SigmaPlot 10. Systat Software, Chicago, IL. Thomas, G.W. 1982. Exchangeable Cations. p. 159-165. In A. L. Page, (ed.) Methods of
Soil Analysis. Part 2. 2nd ed. Agron. Monogr. 9. ASA and SSSA, Madison, WIl
123
Turk, J.K., and R.C. Graham. 2011. Distribution and properties of vesicular horizons in the western United States. Soil Sci. Soc. Am. J. 75:1449-1461.
Ugolini, F.C., S. Hillier, G. Certini, and M.J. Wilson. 2008. The contribution of aeolian
material to an Aridisol from southern Jordan as revealed by mineralogical analysis. J. Arid Environ. 72:1431-1447.
Valentin, C. 1994. Surface sealing as affected by various rock fragment covers in West-
Africa. Catena 23:87-97. Valentine, G.A., and C.D. Harrington. 2006. Clast size controls and longevity of
Pleistocene desert pavements at Lathrop Wells and Red Cone volcanoes, southern Nevada. Geology 34:533-536.
Van Vliet-Lanoë, B. 1985. Frost effects in soils. In J. Boardman (ed.) Soils and
quaternary landscape evolution. John Wiley and Sons, Chichester, UK. Webb, R.H., J. Belnap, and K.A. Thomas. 2009. Natural recovery from severe
disturbance in the Mojave Desert. p. 343-377, In R. H. Webb et al. (ed.) The Mojave Desert: Ecosystem Processes and Sustainability. University of Nevada Press, Reno, NV.
Wells, S.G., L.D. McFadden, J. Poths, and C.T. Olinger. 1995. Cosmogenic 3He surface-
exposure dating of stone pavements: Implications for landscape evolution in deserts. Geology 23:613-616.
Western Regional Climate Cent. 2011. RAWS USA climate archive. Available at
<http://www.raws.dri.edu/> (accessed 15 Jan. 2012). Desert Research Institute, Reno, NV.
Williams, D.E. 1948. A rapid manometric method for determination of carbonate in soils.
Soil Sci. Soc. Am. Proc. 13:127-129. Williams, A., B. Buck, D. Soukup, and D. Merkler. 2010. Biological soil crusts and the
fertile island effect: Soil-geomophic insights from the Mojave Desert, USA. In Abstracts, ASA-CSSA-SSSA Int. Annu. Meet., Long Beach, CA. 31 Oct.-3 Nov. 2010. ASA-CSSA-SSSA, Madison, WI.
Wood, M.K., W.H. Blackburn, R.E. Eckert, and F.F. Peterson. 1978. Interrelations of
physical-properties of coppice dune and vesicular dune interspace soils with grass seedling emergence. J. Range Manage. 31:189-192.
Wood, M.K., R.E. Eckert, W.H. Blackburn, and F.F. Peterson. 1982. Influence of
crusting soil surfaces on emergence and establishment of crested wheat-grass,
124
squirreltail, thurber needlegrass, and fourwing saltbush. J. Range Manage. 35:282-287.
Wood, Y.A., R.C. Graham, and S.G. Wells. 2002. Surface mosaic map unit development
for a desert pavement surface. J. Arid Environ. 52:305-317. Wood, Y.A., R.C. Graham, and S.G. Wells. 2005. Surface control of desert pavement
pedologic process and landscape function, Cima Volcanic field, Mojave Desert, California. Catena 59:205-230.
Wooding, R.A. 1968. Steady infiltration from a shallow circular pond. Water Resour Res
4:1259-1273. Yonovitz, M., and P.J. Drohan. 2009. Pore morphology characteristics of vesicular
horizons in undisturbed and disturbed arid soils; implications for arid land management. Soil Use Manage. 25:293-302.
Yonovitz, M.L. 2008. Pedogenesis of vesicular horizons in disturbed and undisturbed
soils. M.S. Thesis, University of Nevada, Las Vegas. Young, M.H., E.V. McDonald, T.G. Caldwell, S.G. Benner, and D.G. Meadows. 2004.
Hydraulic properties of a desert soil chronosequence in the Mojave Desert, USA. Vadose Zone J. 3:956-963.
125
4. MECHANISMS OF VESICULAR PORE FORMATION IN DESERT SOILS
ABSTRACT
Vesicular horizons are common surficial horizons in desert soils, which are
critical to the regulation of surface hydrology in desert ecosystems. They are
characterized by the prevalence of bubble-like vesicular pores, but little is known about
how these pores form. In this study, we test two hypotheses about the formation of
vesicular pores: 1) that vesicular pores are formed by CO2 gas bubbles that are produced
through microbial respiration, and 2) that vesicular pore growth is promoted by thermal
expansion of gases. The hypotheses were tested by recreating vesicular pores in the
laboratory through exposure to repeated wetting and drying. In the first experiment,
vesicular pore growth was compared in sterile, innoculated, and glucose-amended soil
material. In the second experiment, the temperature increase between wetting and drying
was varied. The treatment groups included a 33oC temperature increase (7oC to 40oC), a
17oC temperature increase (23oC to 40oC), and a 0oC temperature increase (40oC to
40oC). We found indirect evidence for the role of biological processes in vesicular pore
formation including: 1) increased vesicular pore formation in response to a labile C
source (i.e., glucose), and 2) decreased vesicular pore formation in soils wet at
temperatures near biological zero. However, there was no significant effect of
sterilization on vesicular pore formation, which indicates that there is also an abiotic
mechanism of vesicular pore formation. Vesicular pore formation through thermal
expansion of gases was not supported by our experiments, which showed the greatest
vesicular pore formation when soils were wet and dried at constant temperature. Overall,
126
these experiments indicate that both biotic and abiotic mechanisms are involved in
vesicular pore formation and that thermal expansion of gases does not promote vesicular
pore formation.
INTRODUCTION
Vesicular horizons are a common feature of soils in arid and semi-arid lands.
They are distinguished by the prevalence of non-interconnected, nearly spherical
vesicular pores. Vesicular horizons restrict infiltration rates and thereby regulate the
distribution of water in arid and semi-arid landscapes (Blackburn, 1975; Valentin, 1994;
Brown and Dunkerley, 1996; Young et al., 2004). The redistribution of water in arid
landscapes can lead to large subsurface accumulations of soluble salts (Musick, 1975;
Young et al., 2004; Wood et al., 2005; Graham et al., 2008), and is critical to defining
plant-water relations (Noy-Meir, 1973; Musick, 1975; Smith et al., 1990; McAuliffe,
1994; Hamerlynck et al., 2002; Wood et al., 2005; Miller et al., 2009). Crusting and
polygonal cracking in vesicular horizons affect the response of these soils to seeding
methods used in rangelands restoration (Wood et al., 1978; Wood et al., 1982; Eckert et
al., 1986). Vesicular horizons are a dynamic soil feature, capable of forming in a short
period of time (Yonovitz and Drohan, 2009), and have been considered diagnostic of a
shift towards a more arid ecosystem and desert pedogenesis (Lebedeva et al., 2009).
Vesicular horizons are widespread in deserts of the western United States, where
they cover an estimated 156,000 km2 of the land area (Turk and Graham, 2011).
Vesicular horizons occur in landscapes with sparse vegetation (Brewer, 1976; Amundson
et al., 1989; Ellis, 1990; McFadden et al., 1998; Joeckel and Clement, 1999); and within
127
these landscapes, the vesicular horizons occur in the intercanopy soils, and are not
typically observed beneath the shrub canopy (Eckert et al., 1978; Wood et al., 1978).
Vesicular horizons often occur beneath desert pavement (Peterson, 1980; Amit and
Gerson, 1986; Amundson et al., 1989; Ellis, 1990; Bouza et al., 1993; Anderson et al.,
2002; Valentine and Harrington, 2006; Matmon et al., 2009; Bockheim, 2010), but may
also occur in soils with a physical surface crust (Brewer, 1976; Eckert et al., 1978; Ellis,
1990; Hillel, 1998; Cantόn et al., 2003) or biological surface crust (Issa et al., 1999;
Joeckel and Clement, 1999; Cantόn et al., 2003; Williams et al, 2010). They are
commonly formed in a silt-rich layer that is formed by eolian additions to the soil (Hugie
and Passey, 1964; McFadden et al, 1987; Amundson et al., 1989; Reheis et al., 1992;
McFadden et al., 1998; Anderson et al., 2002).
Vesicular horizons are typically one to 10 cm thick (Miller, 1971; Evenari et al.,
1974; Wood et al., 1978; Peterson, 1980; Dan et al., 1982; Van Vliet-Lanoё, 1985;
Amundson et al., 1989; McDonald et al., 1995; Joeckel and Clement, 1999; Quade, 2001;
Ugolini et al., 2008; Miller et al., 2009; Yonovitz and Drohan, 2009; Turk and Graham,
2011). The vesicular pores occur as non-interconnected pores with smooth walls and an
equant, oblate, or prolate shape (Brewer, 1976; Sullivan and Koppi, 1991; Stoops, 2003).
They typically range in size from less than one to three millimeters in diameter (Evenari
et al., 1974; Peterson, 1980; Joeckel and Clement, 1999). The texture of the vesicular
horizon is most often in the sandy loam, loam, or silt loam textural classes (Peterson,
1980; Wood et al., 1982; Turk and Graham, 2011). Vesicular horizons may be massive
or platy, or they may have a primary structure consisting of columns or prisms that part to
128
a secondary platy structure (Springer, 1958; Peterson, 1980; McFadden et al., 1998;
Anderson, 2002; Caldwell et al., 2006).
Although vesicular horizons are a common and dynamic feature of the arid
landscape, little is known about the mechanisms that drive their formation. Vesicular
pores form through repeated wetting and drying of the soil and they can be recreated in
the laboratory by application of repeated wet/dry cycles (Springer, 1958; Miller, 1971;
Evenari et al., 1974; Figueira and Stoops, 1983). Vesicular pore formation is generally
attributed to gas bubbles that form during soil wetting that become “frozen” in place as
the soil dries (Hugie and Passey, 1964; Brewer, 1976; Stoops, 2003). However, the
mechanisms by which gases become trapped and grow over successive wet/dry cycles
have not been evaluated. Several mechanisms have been proposed, which are
summarized and discussed below.
(1) CaCO3 precipitation. When CaCO3 precipitates, CO2 gas is released:
Ca2+ + 2HCO3
- CaCO3 + H2O + CO2 (eq. 4.1)
This has led some authors to suggest that CaCO3 precipitation is what forms the gas
bubbles that generate vesicular pores (Paletskaya et al., 1958; Evenari et al., 1974;
Lebedeva et al., 2009). However, given the low solubility of CaCO3 in the soil solution
(0.0006 mol L-1) (Turk et al., 2011), it is unlikely that the dissolution and re-precipitation
of CaCO3 during wetting and drying could contribute significantly to the production of
vesicular pores. Furthermore vesicular pores are noted to occur in soils that contain no
129
CaCO3 (Bunting, 1977; Bockheim, 2010, Turk and Graham, 2011), which means that
other mechanisms must contribute to the formation of vesicular pores.
(2) Biological production of gases. The rapid microbial response to precipitation in arid
environments (Austin et al., 2004; Huxman et al., 2004) may play a role in the production
of gas bubbles that form vesicular pores. An early experiment examined the role of O2
bubbles, produced through algal photosynthesis, in vesicular pore formation, but found
no evidence to support this hypothesis (Paletskaya et al., 1958). Another possibility is
that the CO2 released by microbial respiration is responsible for the gas bubbles. Some
authors have discounted this mechanism, due to the low biological activity of soils with
vesicular pores (Paletskaya et al., 1958) and the observation of vesicular pores beneath,
but not within, biological soil crusts (Joeckel and Clement, 1999). However, no further
investigation of this mechanism has been made.
(3) Decrease in pressure. The ideal gas law defines an inverse relationship between
pressure and volume of a gas:
PV = nRT (eq. 4.2)
where, P = pressure, V = volume, n = number of moles of gas, R = gas constant, and T =
temperature. A decrease in pressure could cause vesicular pore formation by reducing
the solubility of gases in the soil solution and promoting expansion of trapped gases.
This mechanism has been invoked to explain the formation of vesicular pores in
cryoturbated soils. In these soils, the formation of vesicular pores was attributed to the
130
reduction in pressure in upward thrust soil masses (Bunting, 1977). In desert soils,
production of vesicular pores has been attributed to a reduction in pressure, due to the
formation of a surface seal (Hillel, 1998). This seal prevents further entry of water or air,
under which condition, drainage of water from the vesicular layer would generate
negative pressure. The formation of bubbles in silt-rich soil material often occurs during
vacuum extraction of saturation pastes, which has been observed by the current author, as
well as others (Bunting, 1977). However, such a dramatic decrease in pressure is
unlikely to occur under field conditions.
(4) Increase in temperature. The ideal gas law (eq. 4.2) defines a positive relationship
between temperature and volume of a gas. Similar to decreasing pressure, increasing
temperature could cause vesicular pore formation by reducing the solubility of gases in
the soil solution and promoting the expansion of trapped gases. Expansion of trapped
gases by solar heating is a commonly cited explanation for the formation of vesicular
pores (Evenari et al., 1974; Henning and Kellner, 1994; Brown and Dunkerley, 1996),
and the thermal gradient at the soil surface is often offered as an explanation for the
occurrence of larger, more equant vesicles in the upper part of the vesicular horizon
(Paletskaya et al., 1958; Hugie and Passey, 1964; Ellis, 1990; Bouza et al., 1993;
McFadden et al., 1998). However, no past study has tested the role of thermal expansion
in the formation of vesicular pores.
131
All of the mechanisms described above may contribute to the formation of
vesicular pores, to varying degrees, in different soil-forming environments. We have
selected two for evaluation in the current study: 1) production of CO2 bubbles by
microbial respiration, and 2) thermal expansion.
MATERIALS AND METHODS
Sampling and laboratory characterization
A bulk sample of soil material was collected from a well-developed vesicular
horizon in the Mojave Desert for use in all of the laboratory experiments on vesicular
pore formation. The sampling location was on the northern end of the Johnson Valley
Off-Highway Vehicle area in San Bernardino County, California (34o35’13.5’’N,
115o38’23.6’’W). The vesicular horizons at this site occurred on alluvial fan remnants,
beneath a desert pavement layer. The soil mapped in this part of the landscape was the
Oldwoman soil series, a loamy-skeletal, mixed, superactive, thermic Typic Calciargid
(Soil Survey Staff, 2012).
Laboratory characterization data of the vesicular horizon are provided in Table
4.1. Electrical conductivity was measured in the saturation paste extract and pH was
measured in 1:1 soil:water suspension (Burt, 2004). Cation exchange capacity was
measure by Na saturation, followed by extraction with ammonium acetate (Bower and
Hatcher, 1966), and measurement of Na by inductively coupled plasma (ICP)
spectroscopy. Exchangeable Na was extracted in 1 N ammonium acetate (Thomas,
1982), and also measured by ICP spectroscopy. Soluble Na was measured in the
132

Table 4.1. Laboratory characterization data of the soil material, including electrical conductivity of the saturation paste extract (ECe), pH in 1:1 H2O, exchangeable sodium percentage (ESP), calcium carbonate percent by weight, and the percentage of the three soil separates (sand, silt, and clay).
ECe pH ESP CaCO3 Sand Silt Clay
ds m-1 % % % % % 2.7 8.75 28.2 3.4 28.2 49.5 22.3
133
saturation paste extract using a sodium-selective electrode. Exchangeable Na was
corrected for soluble sodium in the calculation of exchangeable sodium percentage (Burt,
2004). Calcium carbonate was measured by the manometer method (Williams, 1948) and
particle size distribution was evaluated by the wet sieving/laser diffraction method (Segal
et al., 2009).
Vesicular pore formation and analysis
Vesicular pores were recreated in the laboratory through exposure to repeated
wetting and drying (Springer, 1958; Miller, 1971; Evenari et al., 1974; Figueira and
Stoops, 1983). The methods that we followed are closest to those of Miller (1971). The
soil material was air-dried and sieved to 1 mm. In plastic cups, 350 g of soil was mixed
to a saturation state with 50 mL of deionized water. Parchment-lined aluminum columns,
7.5 cm in diameter and 7.5 cm tall, were placed on ceramic plates, with five columns per
plate. The saturation pastes were transferred to the columns and then dried for five days
in a 40oC oven. After the drying period, the samples were wet again by placing the
ceramic plate in water and allowing the samples to wet by capillary rise for 24 hrs, and
then adding five to 10 mL of water to the top of the columns. Preliminary experiments
using other methods of wetting were unsuccessful at forming vesicular pores. If the dry
soil was wet by capillary rise without initially making a saturation paste, the vesicular
pores did not form because the surface did not form a dispersion crust, which prevents air
from escaping at the soil surface (Evenari et al., 1974). If the soil was wet by flooding in
134
a closed-bottom container, the air trapped in the soil formed a large pocket at the bottom
of the container, rather than vesicular pores within the soil matrix.
Wetting by capillary rise was repeated 19 times, with a five day drying period at
40oC between each wetting. After every five drying periods the samples were removed
from the columns, and bulk density was measured by the three-dimensional laser
scanning method (Rossi et al., 2008). At the end of the experiment, four of the samples
from each treatment group were scanned by X-ray computed tomography (CT), with a
resolution of 0.0752 mm and an inter-slice spacing of 0.08118 mm.
The CT-generated images were analyzed using the Blob3D software (Ketcham et
al., 2005). All pores within a cylindrical volume of interest (60 mm diam., 16.2 mm
height), positioned near the top surface of the sample, were segregated and analyzed.
The pores were segregated using a general threshold filter, which was adjusted until the
binary image produced by the filter showed good agreement with visual segregation of
voids in the grayscale image. The volume and surface area of all voids were extracted
from the scans and used to calculate a volumetric form of the lobation ratio (LR),
previously used for two-dimensional analysis of pore-shape in thin sections (Beckman,
1962; Figueira and Stoops, 1983). The LR is the ratio between the actual perimeter of the
pore and the calculated perimeter, which is the perimeter of a hypothetical circle with an
area equal to the measured area of the pore. The volumetric form of the LR (LRv) is the
ratio between the actual surface area of the pore and the calculated surface area, which is
the surface area of a hypothetical sphere with a volume equal to the measured pore
volume. Pores were identified as vesicular when they had a LRv greater than 0.79, a
135
cutoff determined by previous analysis of visually classified vesicles. For each CT scan,
the percentage of sample volume occupied by vesicular pores (V%), number density of
vesicular pores (Np), and geometric mean of the individual pore volumes ( ) were
calculated, as described in Chapter 3.
Microbial respiration treatments
Three treatment groups were established to determine the influence of microbial
respiration on vesicular pore formation; these were sterile, inoculated, and glucose-
amended inoculated soils. Each treatment was applied to five of the columns in which
vesicular pores were recreated, as described above. Columns in the same treatment group
were placed on the same ceramic plate, to prevent contamination of the sterile columns
and to allow separate application of glucose solution to the glucose-amended soils. For
all three treatment groups, the soils were first sterilized by autoclaving five times, with a
one week period between each autoclaving. All columns and ceramic plates were also
sterilized by autoclaving. For the sterile treatment group, the saturation paste used to fill
the columns was made using sterile deionized water. For the inoculated treatment group,
the sterile deionized water was mixed with unsterilized soil (10 g of soil per 50 mL of
water) and shaken for 10 minutes before making the saturation paste. For the glucose
amended inoculated soils, a sterile glucose solution (6.6 g L-1) was mixed with
unsterilized soil (10 g of soil per 50 mL of glucose solution) and shaken for 10 minutes
before making the saturation paste. The final concentration of glucose in the columns
was one mg per g of soil, which is the concentration of glucose used to maximize
136
respiration rates in the physiological method for microbial biomass determination
(Anderson and Domsch, 1978). The sterilization and re-inoculation of the inoculated and
glucose-amended treatments was intended to control for any side-effects that accompany
autoclaving, such as increased soluble organic carbon concentration (Venterea, 2007).
During drying, the columns were placed in sterilized dishpans that were covered with a
double layer of gauze, to prevent contamination, while allowing the soil to dry. During
wetting, the dishpans were covered with foil and sterile deionized water was used to wet
all of the treatment groups. Every five wetting cycles, the glucose-amended soils were
wet with glucose solution instead of sterilized water, in order to sustain high respiration
rates.
The effectiveness of the treatments was verified by applying the same treatments
to another set of soils, in which respiration rates were measured by the NaOH trap
method (Zibilske, 1994). In addition to the treatments used in the experiment, the
respiration rate of glucose-amended sterile soil was also measured in order to verify that
there was no response to glucose following sterilization. The respiration rate of non-
autoclaved soils was also measured, in order to test their similarity to the soils that were
re-inoculated following sterilization. In addition, a set of repeated respiration
measurements were made for the glucose-amended soils, in which the soils were dried at
40oC between each measurement and then re-wet for the next respiration measurement.
This treatment was applied to test the duration of the glucose response under cyclic
wetting and drying conditions. All respiration measurements were made in replicates of
five.
137
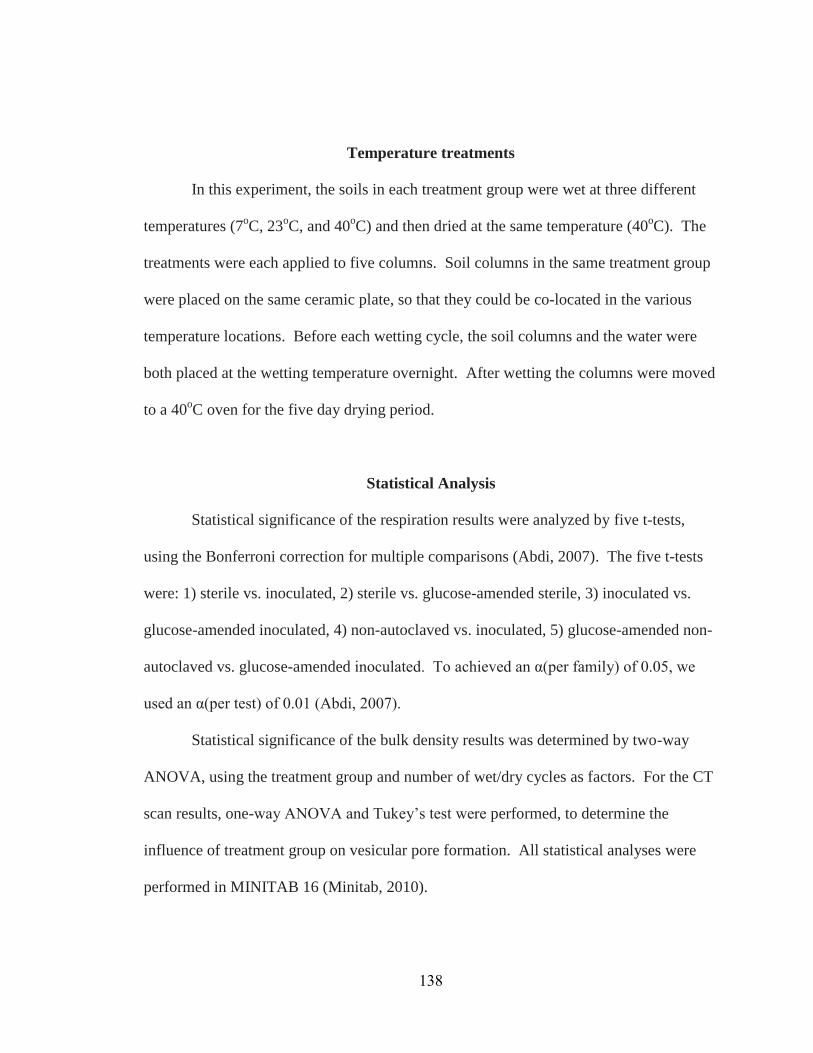
Temperature treatments
In this experiment, the soils in each treatment group were wet at three different
temperatures (7oC, 23oC, and 40oC) and then dried at the same temperature (40oC). The
treatments were each applied to five columns. Soil columns in the same treatment group
were placed on the same ceramic plate, so that they could be co-located in the various
temperature locations. Before each wetting cycle, the soil columns and the water were
both placed at the wetting temperature overnight. After wetting the columns were moved
to a 40oC oven for the five day drying period.
Statistical Analysis
Statistical significance of the respiration results were analyzed by five t-tests,
using the Bonferroni correction for multiple comparisons (Abdi, 2007). The five t-tests
were: 1) sterile vs. inoculated, 2) sterile vs. glucose-amended sterile, 3) inoculated vs.
glucose-amended inoculated, 4) non-autoclaved vs. inoculated, 5) glucose-amended non-
autoclaved vs. glucose-amended inoculated. To achieved an α(per family) of 0.05, we
used an α(per test) of 0.01 (Abdi, 2007).
Statistical significance of the bulk density results was determined by two-way
ANOVA, using the treatment group and number of wet/dry cycles as factors. For the CT
scan results, one-way ANOVA and Tukey’s test were performed, to determine the
influence of treatment group on vesicular pore formation. All statistical analyses were
performed in MINITAB 16 (Minitab, 2010).
138
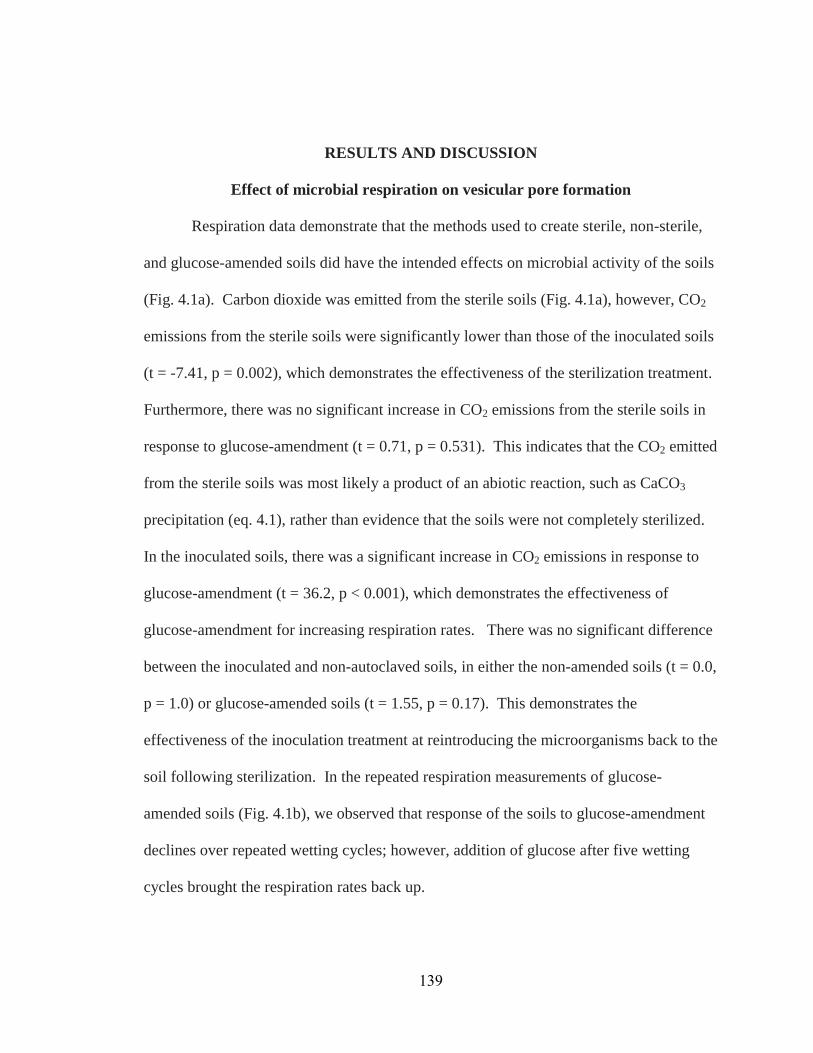
RESULTS AND DISCUSSION
Effect of microbial respiration on vesicular pore formation
Respiration data demonstrate that the methods used to create sterile, non-sterile,
and glucose-amended soils did have the intended effects on microbial activity of the soils
(Fig. 4.1a). Carbon dioxide was emitted from the sterile soils (Fig. 4.1a), however, CO2
emissions from the sterile soils were significantly lower than those of the inoculated soils
(t = -7.41, p = 0.002), which demonstrates the effectiveness of the sterilization treatment.
Furthermore, there was no significant increase in CO2 emissions from the sterile soils in
response to glucose-amendment (t = 0.71, p = 0.531). This indicates that the CO2 emitted
from the sterile soils was most likely a product of an abiotic reaction, such as CaCO3
precipitation (eq. 4.1), rather than evidence that the soils were not completely sterilized.
In the inoculated soils, there was a significant increase in CO2 emissions in response to
glucose-amendment (t = 36.2, p < 0.001), which demonstrates the effectiveness of
glucose-amendment for increasing respiration rates. There was no significant difference
between the inoculated and non-autoclaved soils, in either the non-amended soils (t = 0.0,
p = 1.0) or glucose-amended soils (t = 1.55, p = 0.17). This demonstrates the
effectiveness of the inoculation treatment at reintroducing the microorganisms back to the
soil following sterilization. In the repeated respiration measurements of glucose-
amended soils (Fig. 4.1b), we observed that response of the soils to glucose-amendment
declines over repeated wetting cycles; however, addition of glucose after five wetting
cycles brought the respiration rates back up.
139
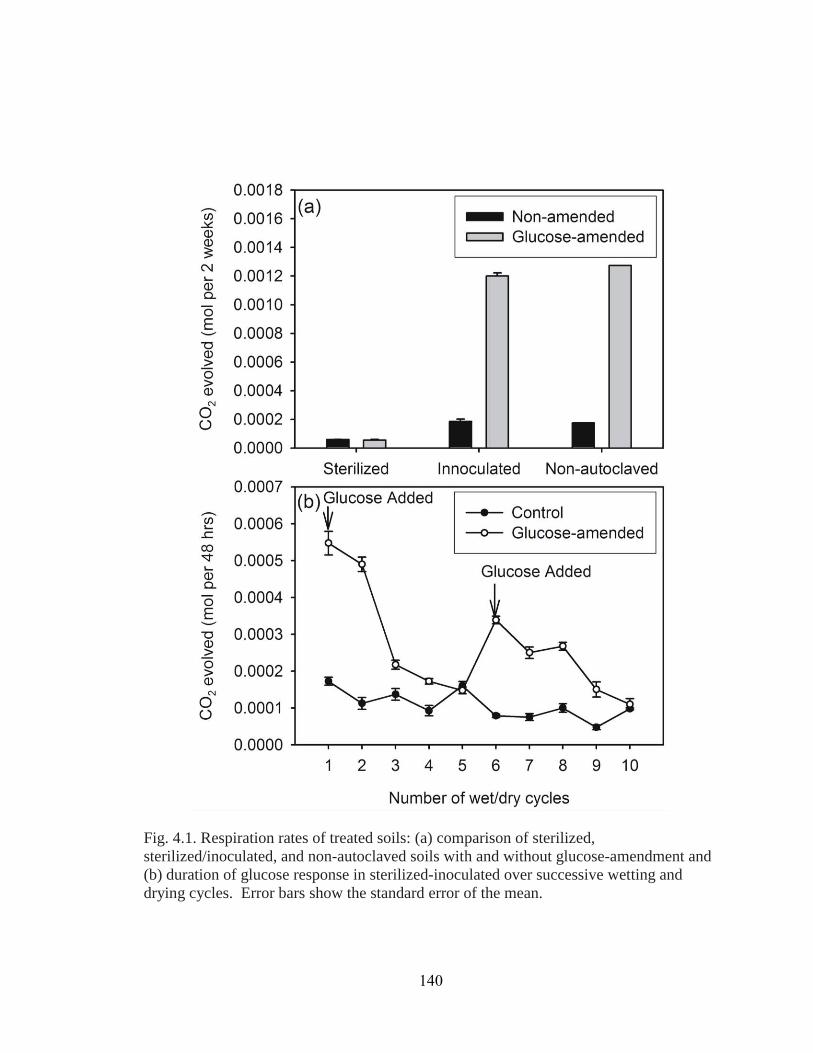
Fig. 4.1. Respiration rates of treated soils: (a) comparison of sterilized, sterilized/inoculated, and non-autoclaved soils with and without glucose-amendment and (b) duration of glucose response in sterilized-inoculated over successive wetting and drying cycles. Error bars show the standard error of the mean.
140
If soil respiration drives the formation of vesicular pores, we expect to see an
inhibition of vesicular pore growth in the sterilized soils and enhanced vesicular pore
formation in the glucose-amended soils. Bulk density can be used as an indication of
total porosity in soils, and if vesicular pores are the predominant pore type, the decline in
bulk density can be used as a measure of vesicular pore growth (Miller, 1971).
Experimental results show that the decline in bulk density was greatest in the sterile soil,
followed by the inoculated soil, and lowest in the glucose-amended soil (Fig. 4.2). There
was a significant effect of treatment (p < 0.001) and number of wet/dry cycles (p < 0.001)
on bulk density, according to the two-way ANOVA test. However, examination of
internal pore structure by CT, shows the growth of both planar voids and vesicles are
affected by the treatments (Fig. 4.3). Planar voids were most abundant in the sterile soils
relative to the nonsterile soils, and were least abundant in the glucose-amended soils.
The growth of these voids had a dominant effect on the bulk density of the soils, which
means that the bulk density was not directly related to the formation of vesicular pores.
The planar voids formed in this study appear to result from shrink-swell processes
(Stoops, 2003), rather than the collapse of interconnected vesicular pores (Brewer, 1976).
The orientation of the planar voids shifts towards vertical near the edges of the sample,
which is an indication the voids are linked to differential rates of drying. If the planar
voids were formed through collapse of vesicular pores we would expect a predominantly
horizontal orientation throughout the sample. Both processes (i.e., shrink-swell and
collapse of vesicular pores), may contribute to the formation of platy structure in the
field. Shrink-swell processes may be particular effective at forming platy structure in
141
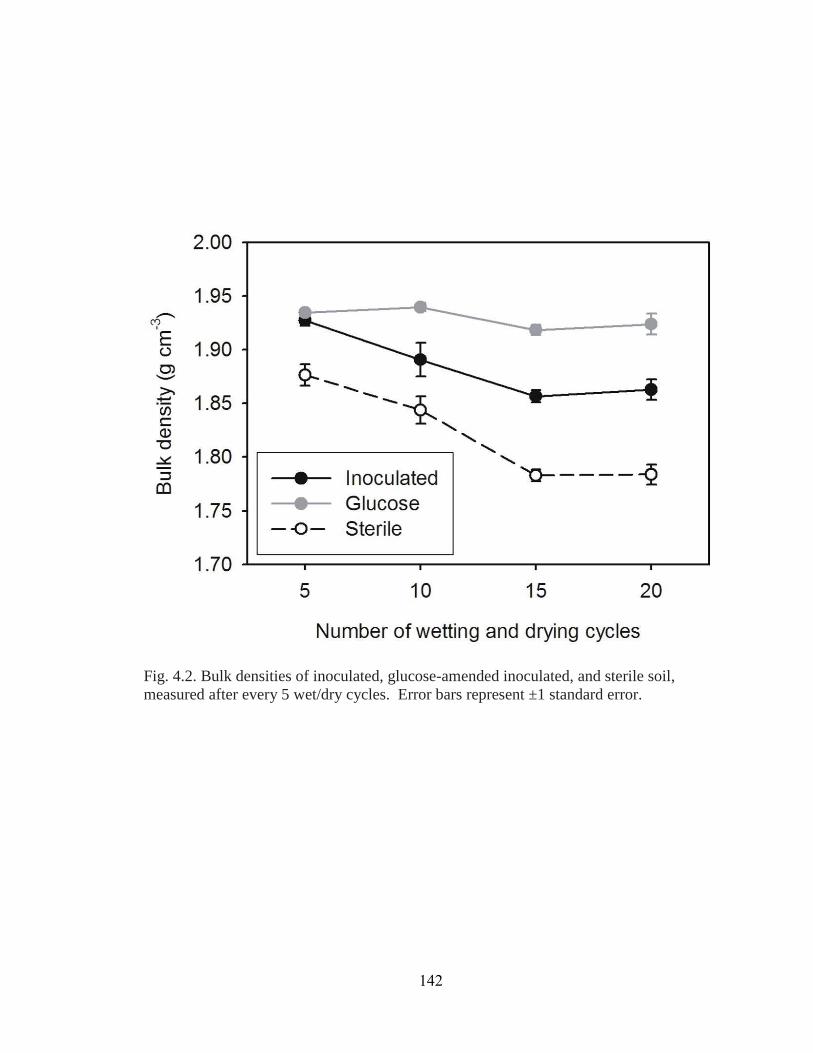
Fig. 4.2. Bulk densities of inoculated, glucose-amended inoculated, and sterile soil, measured after every 5 wet/dry cycles. Error bars represent ±1 standard error.
142
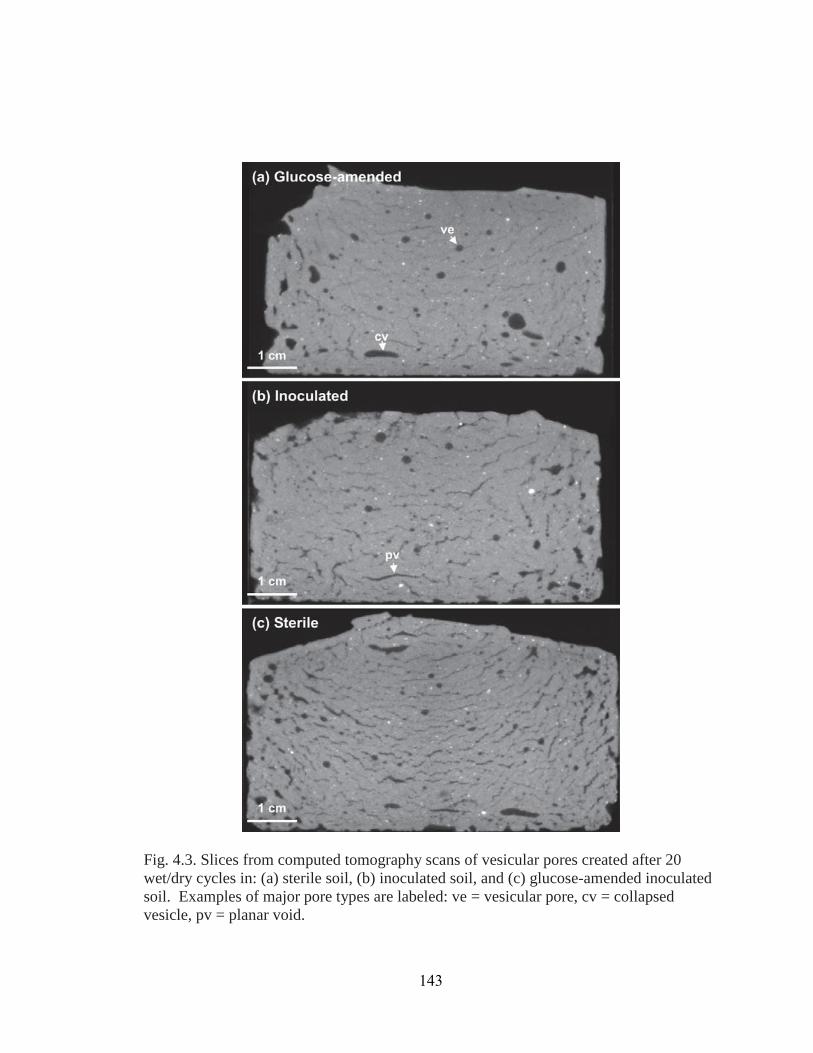
Fig. 4.3. Slices from computed tomography scans of vesicular pores created after 20 wet/dry cycles in: (a) sterile soil, (b) inoculated soil, and (c) glucose-amended inoculated soil. Examples of major pore types are labeled: ve = vesicular pore, cv = collapsed vesicle, pv = planar void.
143
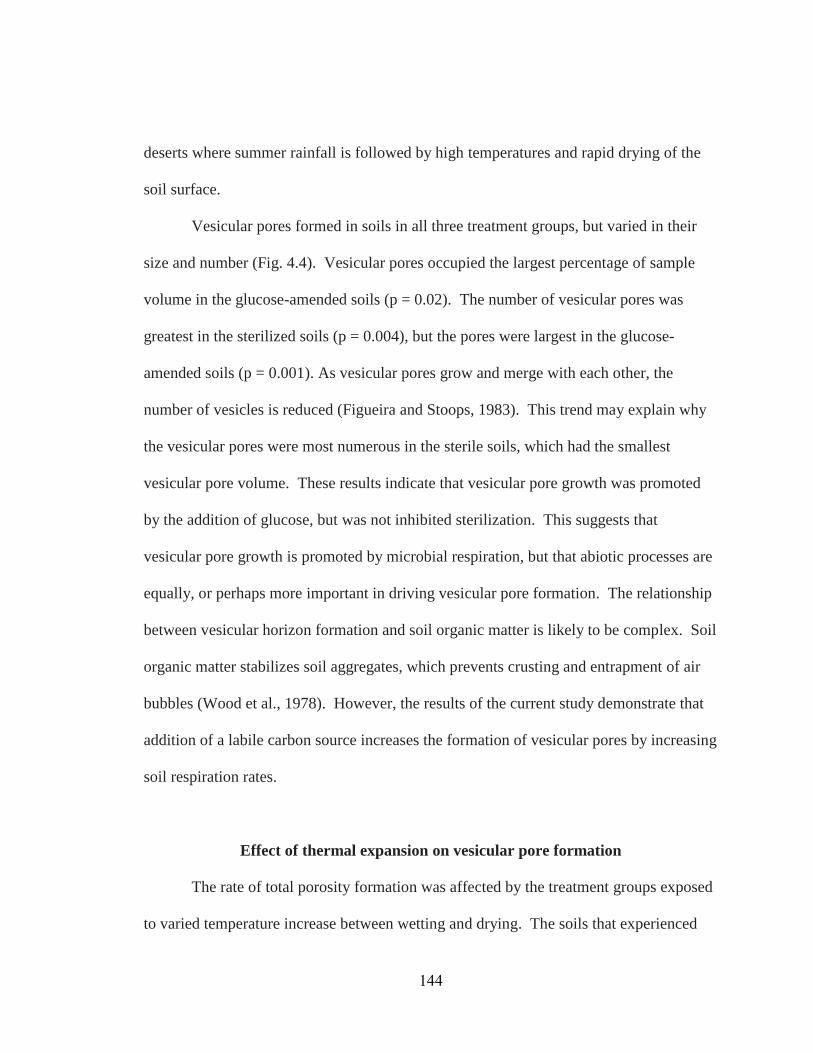
deserts where summer rainfall is followed by high temperatures and rapid drying of the
soil surface.
Vesicular pores formed in soils in all three treatment groups, but varied in their
size and number (Fig. 4.4). Vesicular pores occupied the largest percentage of sample
volume in the glucose-amended soils (p = 0.02). The number of vesicular pores was
greatest in the sterilized soils (p = 0.004), but the pores were largest in the glucose-
amended soils (p = 0.001). As vesicular pores grow and merge with each other, the
number of vesicles is reduced (Figueira and Stoops, 1983). This trend may explain why
the vesicular pores were most numerous in the sterile soils, which had the smallest
vesicular pore volume. These results indicate that vesicular pore growth was promoted
by the addition of glucose, but was not inhibited sterilization. This suggests that
vesicular pore growth is promoted by microbial respiration, but that abiotic processes are
equally, or perhaps more important in driving vesicular pore formation. The relationship
between vesicular horizon formation and soil organic matter is likely to be complex. Soil
organic matter stabilizes soil aggregates, which prevents crusting and entrapment of air
bubbles (Wood et al., 1978). However, the results of the current study demonstrate that
addition of a labile carbon source increases the formation of vesicular pores by increasing
soil respiration rates.
Effect of thermal expansion on vesicular pore formation
The rate of total porosity formation was affected by the treatment groups exposed
to varied temperature increase between wetting and drying. The soils that experienced
144
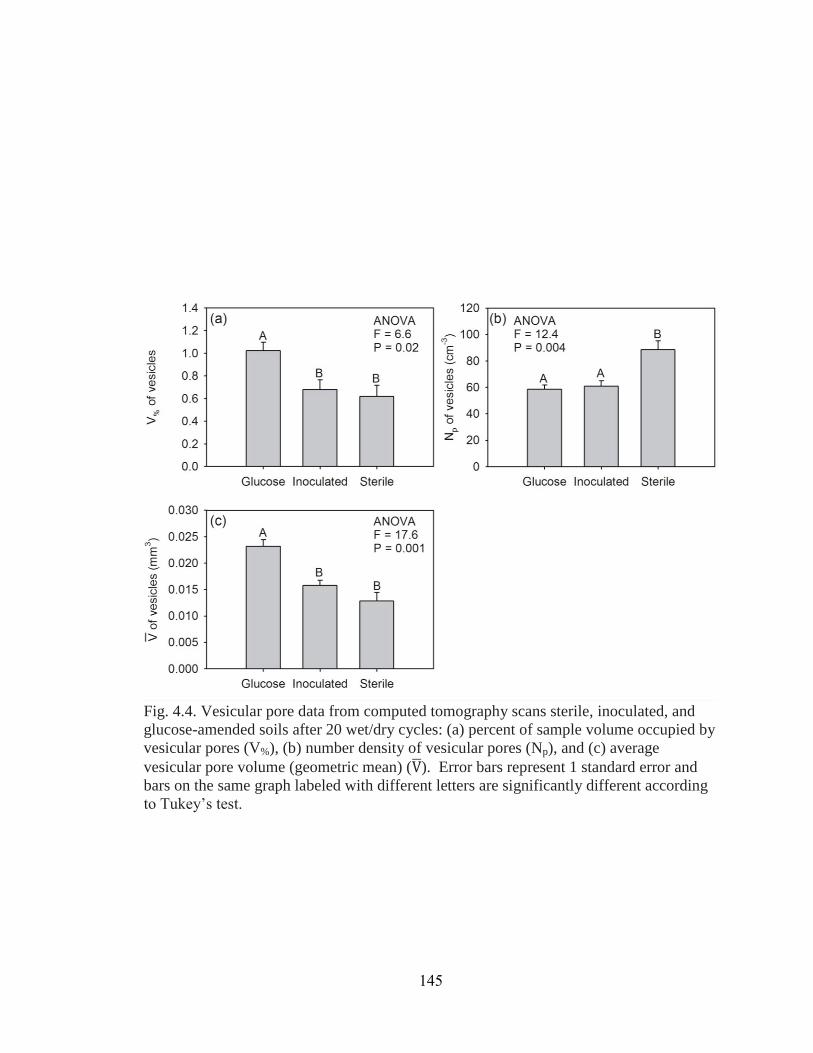
Fig. 4.4. Vesicular pore data from computed tomography scans sterile, inoculated, and glucose-amended soils after 20 wet/dry cycles: (a) percent of sample volume occupied by vesicular pores (V%), (b) number density of vesicular pores (Np), and (c) average vesicular pore volume (geometric mean) ( ). Error bars represent 1 standard error and bars on the same graph labeled with different letters are significantly different according to Tukey’s test.
145
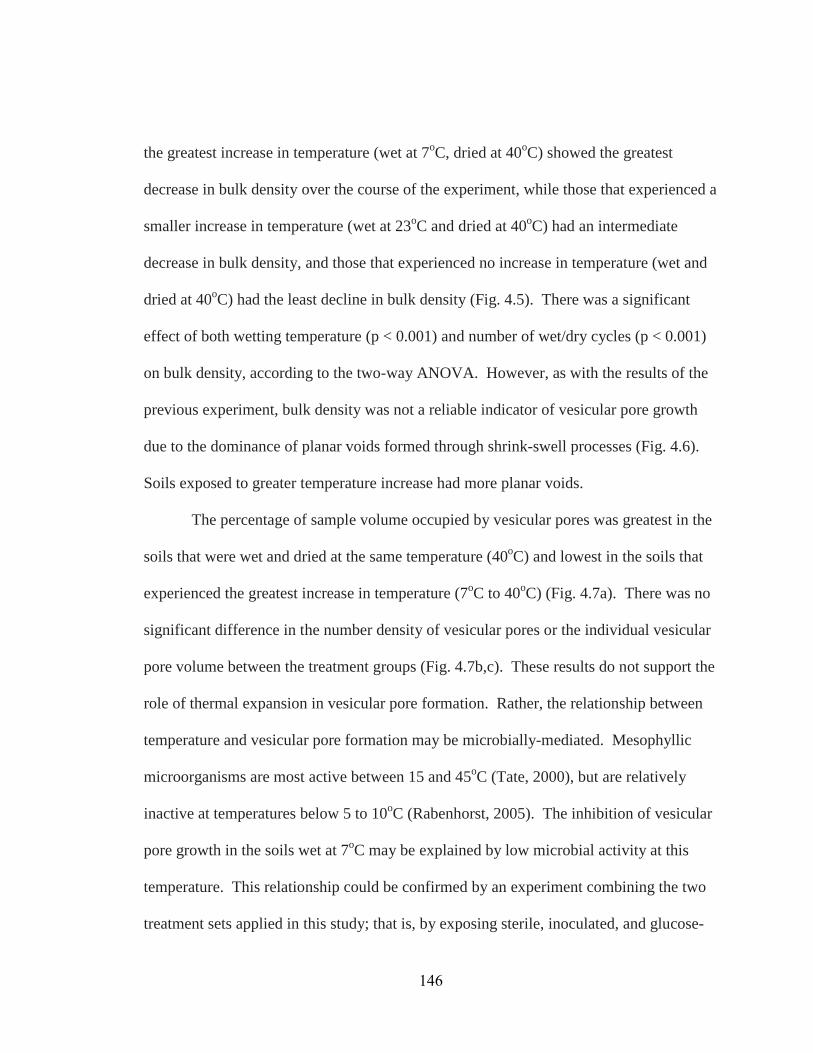
the greatest increase in temperature (wet at 7oC, dried at 40oC) showed the greatest
decrease in bulk density over the course of the experiment, while those that experienced a
smaller increase in temperature (wet at 23oC and dried at 40oC) had an intermediate
decrease in bulk density, and those that experienced no increase in temperature (wet and
dried at 40oC) had the least decline in bulk density (Fig. 4.5). There was a significant
effect of both wetting temperature (p < 0.001) and number of wet/dry cycles (p < 0.001)
on bulk density, according to the two-way ANOVA. However, as with the results of the
previous experiment, bulk density was not a reliable indicator of vesicular pore growth
due to the dominance of planar voids formed through shrink-swell processes (Fig. 4.6).
Soils exposed to greater temperature increase had more planar voids.
The percentage of sample volume occupied by vesicular pores was greatest in the
soils that were wet and dried at the same temperature (40oC) and lowest in the soils that
experienced the greatest increase in temperature (7oC to 40oC) (Fig. 4.7a). There was no
significant difference in the number density of vesicular pores or the individual vesicular
pore volume between the treatment groups (Fig. 4.7b,c). These results do not support the
role of thermal expansion in vesicular pore formation. Rather, the relationship between
temperature and vesicular pore formation may be microbially-mediated. Mesophyllic
microorganisms are most active between 15 and 45oC (Tate, 2000), but are relatively
inactive at temperatures below 5 to 10oC (Rabenhorst, 2005). The inhibition of vesicular
pore growth in the soils wet at 7oC may be explained by low microbial activity at this
temperature. This relationship could be confirmed by an experiment combining the two
treatment sets applied in this study; that is, by exposing sterile, inoculated, and glucose-
146
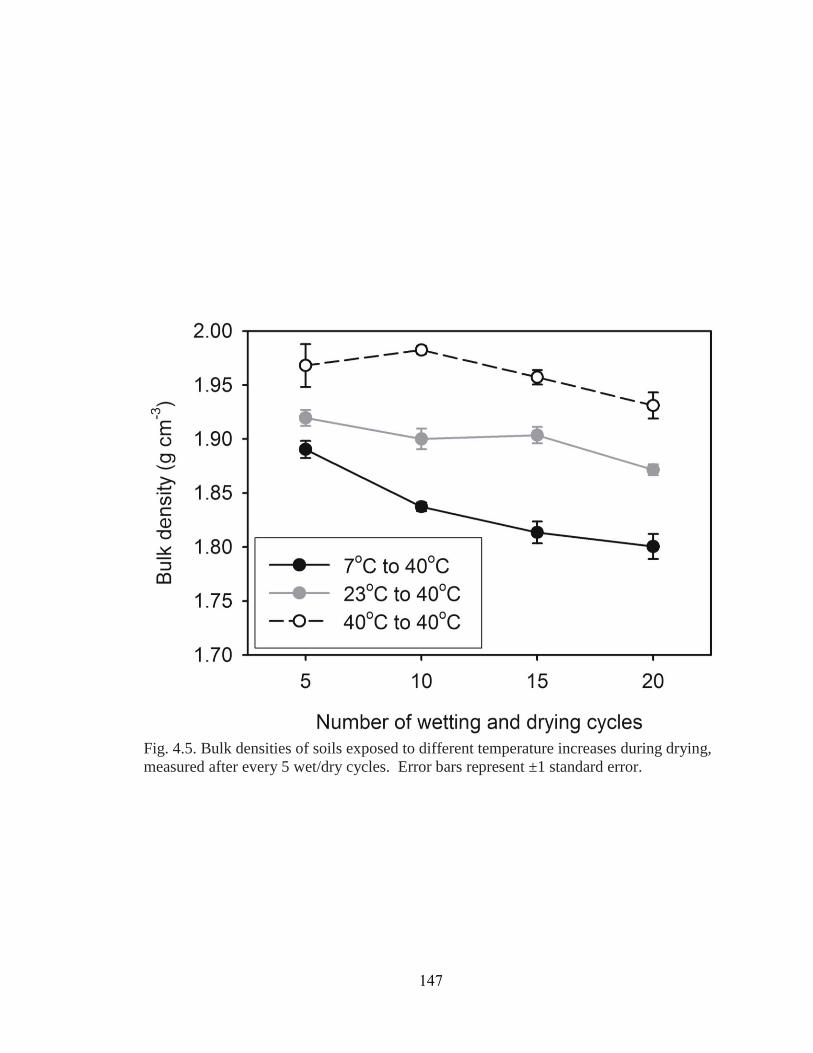
Fig. 4.5. Bulk densities of soils exposed to different temperature increases during drying, measured after every 5 wet/dry cycles. Error bars represent ±1 standard error.
147
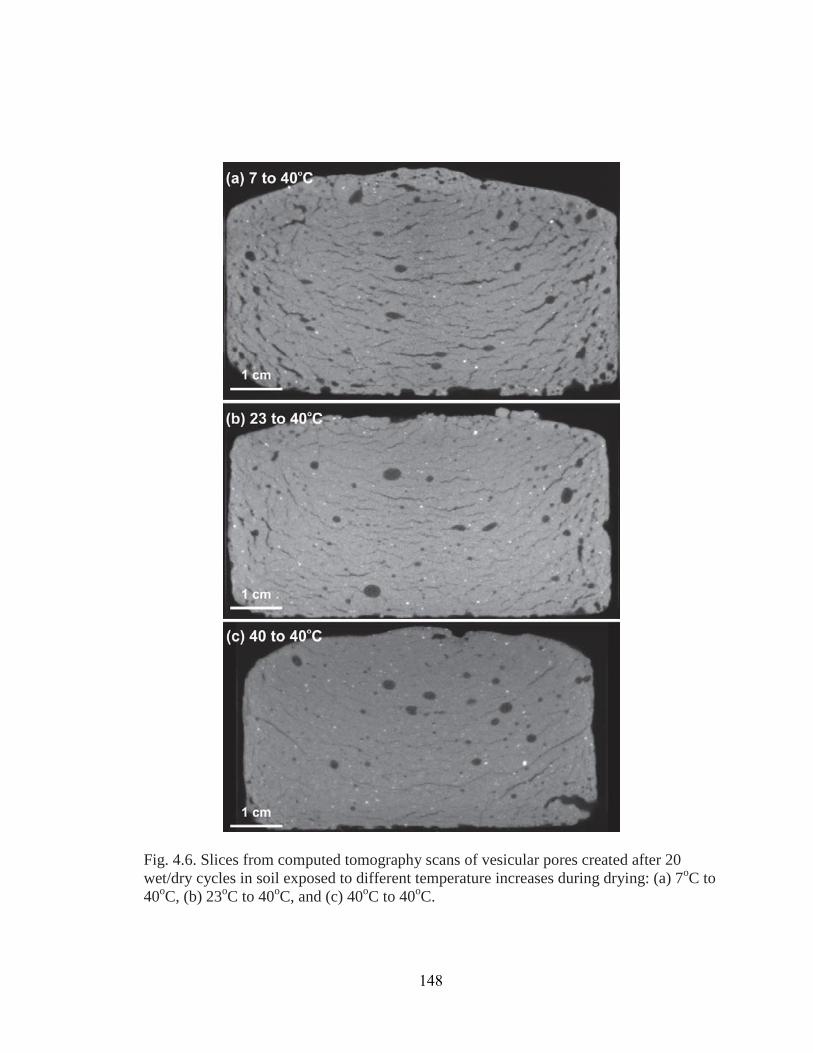
Fig. 4.6. Slices from computed tomography scans of vesicular pores created after 20 wet/dry cycles in soil exposed to different temperature increases during drying: (a) 7oC to 40oC, (b) 23oC to 40oC, and (c) 40oC to 40oC.
148
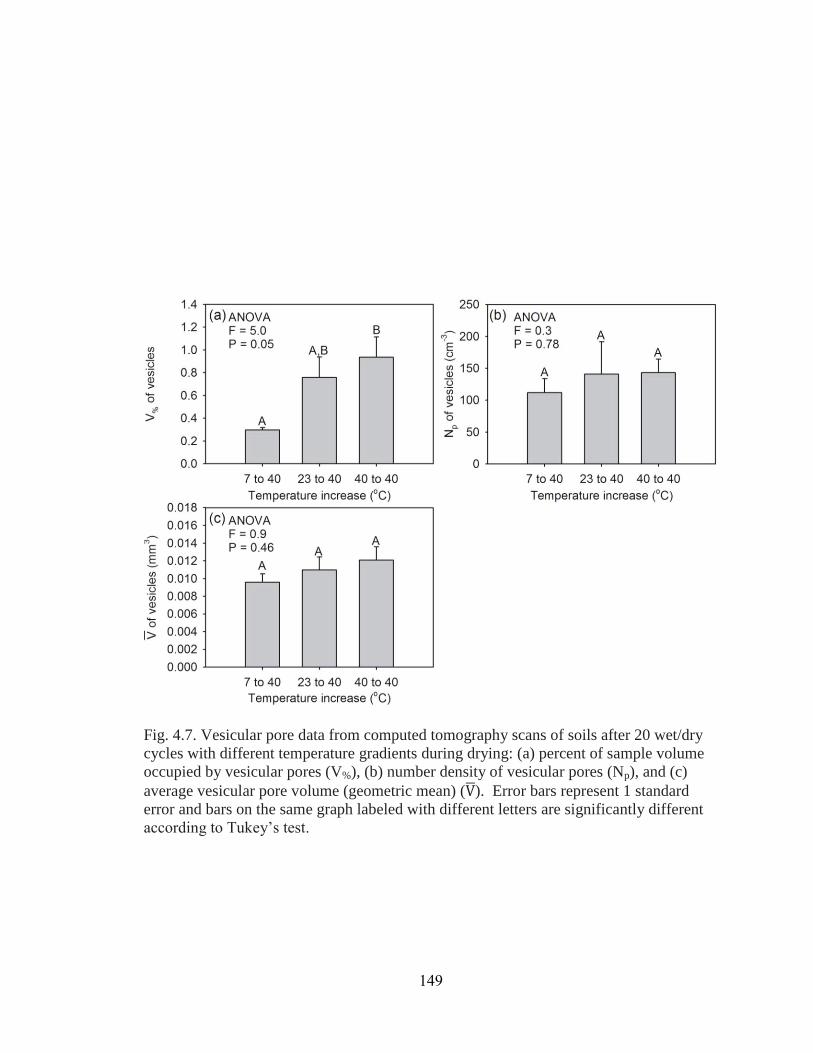
Fig. 4.7. Vesicular pore data from computed tomography scans of soils after 20 wet/dry cycles with different temperature gradients during drying: (a) percent of sample volume occupied by vesicular pores (V%), (b) number density of vesicular pores (Np), and (c) average vesicular pore volume (geometric mean) ( ). Error bars represent 1 standard error and bars on the same graph labeled with different letters are significantly different according to Tukey’s test.
149
amended soils to varied levels of temperature increase between wetting and drying. If the
relationship between temperature and vesicular pore formation is microbially-mediated,
then there would be no effect of temperature on vesicular pore growth in sterilized soils.
Past studies of vesicular pore formation under laboratory conditions have used
various drying temperatures, including room temperature (Miller, 1971; Evenari et al.,
1974), 45oC (Figueira and Stoops, 1983), and 90oC (Springer, 1958). One study
compared vesicular pore formation at room temperature with formation under a heat lamp
(45oC), but the author observed no effect on vesicular pore formation (Miller, 1971).
This is in contrast to the results of the current study, which showed greater vesicular pore
formation in soils that were wet at 40oC, relative to those that were wet at lower
temperatures. The difference in the results of the current study and those of Miller (1971),
may be explained because we controlled for the rate of soil drying, by varying the wetting
temperature and keeping the drying temperature constant. Under these conditions
moisture was maintained during the period when the temperature varied between
treatment groups. In contrast, the heat lamp treatment described by Miller (1971), would
have led to more rapid drying of the soil, thus reducing the period of time during which
the soil was moist enough to support microbial activity.
The abundance of planar voids in our samples may also be influenced by the
drying temperatures. The development of planar voids meant that there was no direct
relationship between vesicular porosity and bulk density in our samples. However, past
studies in which samples were dried at room temperature showed much more limited
development of planar voids and a strong relationship between vesicular pore growth and
150
bulk density (Miller, 1971). We attribute the prevalence of planar voids in the oven-dried
samples to more rapid drying leading to less-uniform shrinkage of the soil mass (Turk et
al., 2011).
The results of this experiment suggest that extremes in temperature due to solar
heating of the soil surface are unlikely to explain the distribution of soil horizons with
vesicular pores (Ellis, 1990; Turk and Graham, 2011) or the depth distribution of
vesicular pores within the vesicular horizons (Paletskaya et al., 1958; Hugie and Passey,
1964; Ellis, 1990; Bouza et al., 1993; McFadden et al., 1998). Other factors, including
surface crusting, frequency of wetting, overburden weight, and frequency of disturbance
are likely to play a more important role in the distribution and expression of vesicular
horizons. Temperature may have an indirect effect on the development of vesicular
pores, through the influence on microbial activity, although further analysis is required to
confirm this relationship.
The first experiment demonstrated that abiotic processes play a dominant role in
vesicular pores formation, since sterilization did not significantly affect formation of
vesicular pores. However, formation of vesicular pores through thermal expansion of
trapped gases was not supported as a possible abiotic mechanism. This means that
another abiotic mechanism of vesicular pore formation must predominate. One
possibility is CaCO3 precipitation (Paletskaya et al., 1958; Evenari et al., 1974; Lebedeva
et al., 2009); however, this is not supported by the results of this experiment, which
showed the very low CO2 emissions from the sterilized soils (Fig. 4.1a). Another
possibility is the abiotic production of N-containing gases (NO, NOy, and NH3), which
151

has been demonstrated to occur in some Mojave Desert soils (McCalley and Sparks,
2009). Future studies should investigate the nature of both the abiotic and biotic
mechanisms of vesicular pore formation.
SUMMARY AND CONCLUSIONS
In this study, we have tested two hypotheses about the formation of vesicular
pores: 1) that biotic processes (i.e., microbial respiration) influence the formation of
vesicular pores and 2) that thermal expansion of gases promotes the formation of
vesicular pores. We found indirect evidence for the role of biological processes in
vesicular pore formation, which include: 1) increased vesicular pore formation caused by
addition of a labile carbon source (i.e., glucose), and 2) decreased vesicular pore
formation at temperatures near biological zero. However, we also found direct evidence
for abiotic production of vesicular pores, through the observation of vesicular pore
formation in sterilized soils. Thermal expansion of gases was the abiotic mechanism of
vesicular pore formation selected for analysis in this study, but was not supported by the
results, which showed the strongest vesicular pore formation in soils that were wet and
dried at uniform temperature. The results of this study support the involvement of both
biotic and abiotic processes in vesicular pore formation; however, the nature of the
abiotic mechanism is still unknown.
152
REFERENCES
Abdi, H. The Bonferroni and Šidák corrections for multiple comparisons. p. 103-106. In N. Salkind and K. Rasmussen (eds). Encyclopedia of Measurement and Statistics. SAGE Publications, Thousand Oaks, CA
Amit, R., and R. Gerson. 1986. The evolution of Holocene reg (gravelly) soils in deserts:
an example from the Dead Sea region. Catena 13:59-79. Amundson, R.G., O.A. Chadwick, J.M. Sowers, and H.E. Doner. 1989. Soil evolution
along an altitudinal transect in the eastern Mojave Desert of Nevada, USA. Geoderma 43:349-371.
Anderson, J.P.E., and K.H. Domsch. 1978. Physiological method for quantitative
measurement of microbial biomass in soils. Soil Biol. Biochem. 10:215-221. Anderson, K., S. Wells, and R. Graham. 2002. Pedogenesis of vesicular horizons, Cima
Volcanic Field, Mojave Desert, California. Soil Sci. Soc. Am. J 66:878-887. Austin, A.T., L. Yahdjian, J.M. Stark, J. Belnap, A. Porporato, U. Norton, D.A. Ravetta,
and S.M. Schaeffer. 2004. Water pulses and biogeochemical cycles in arid and semiarid ecosystems. Oecologia 141:221-235.
Beckman, W. 1962. Zur Mikromorphometrie von hohlräumen und aggregaten im boden.
(in German) Zeitsh Pflazern, Düng, Bodend 99:129-139. Blackburn, W.H. 1975. Factors influencing infiltration and sediment production of
semiarid rangelands in Nevada. Water Resour. Res. 11:929-937. Bockheim, J.G. 2010. Evolution of desert pavements and the vesicular layer in soils of
the Transantarctic Mountains. Geomorphology 118:433-443. Bouza, P., H.F. Delvalle, and P.A. Imbellone. 1993. Micromorphological, physical, and
chemical characteristics of soil crust types of the central Patagonia region, Argentina. Arid Soil Res. Rehabilitation 7:355-368.
Bower, C.A., and J.T. Hatcher. 1966. Simultaneous determinations of surface area and
cation exchange capacity. Soil Sci. Soc. Am. Proc. 30:525-527. Brewer, R. 1976. Fabric and mineral analysis of soils. Robert E. Krieger, Huntington,
NY. Brown, K.J., and D.L. Dunkerley. 1996. The influence of hillslope gradient, regolith
texture, stone size and stone position on the presence of a vesicular layer and
153
related aspects of hillslope hydrologic processes: A case study from the Australian arid zone. Catena 26:71-84.
Bunting, B.T. 1977. The occurrence of vesicular structures in arctic and subarctic soils.
Z. Geomorphol. 21:87-95. Burt, R. (ed.) 2004. Soil Survey Laborator Methods Manual. Soil Suvey Investigations
Report No. 42. USDA, Washington, DC. Caldwell, T.G., E.V. McDonald, and M.H. Young. 2006. Soil disturbance and hydrologic
response at the National Training Center, Ft. Irwin, California. J. Arid Environ. 67:456-472.
Cantόn, Y., A. Solé-Benet, and R. Lázaro. 2003. Soil-geomorphology relations in
gypsiferous materials of the Tabernas Desert (Almeria, SE spain). Geoderma 115:193-222.
Dan, J., D.H. Yaalon, R. Moshe, and S. Nissim. 1982. Evolution of reg soils in southern
Israel and Sinai. Geoderma 28:173-202. Eckert, R.E., F.F. Peterson, M.S. Meurisse, and J.L. Stephens. 1986. Effects of soil-
surface morphology on emergence and survival of seedlings in big sagebrush communities. J. Range Manage. 39:414-420.
Eckert, R.E., M.K. Wood, W.H. Blackburn, F.F. Peterson, J.L. Stephens, and M.S.
Meurisse. 1978. Effects of surface-soil morphology on improvement and management of some arid and semiarid rangelands. p. 299-301. In D.N. Hyder (ed.) Proc. of the First Int. Rangeland Congr., Denver, CO. 14-18 Aug. 1978. Society for Range Mangement, Denver, CO.
Ellis, F. 1990. Note on soils with vesicular structure and other micromorphological
features in Karoo soils. p. 326-336. In Proc. 16th Congress of the Soil Science Society of South Africa, Pretoria, South Africa. July 9-12 1990. Soil Science Society of South Africa, Erasmusrand, South Africa.
Evenari, M., D.H. Yaalon, and Y. Gutterman. 1974. Note on soils with vesicular structure
in deserts. Z. Geomorphol. 18:162-172. Figueira, H., and G. Stoops. 1983. Application of micromorphometric techniques to the
experimental study of vesicular layer formation. Pedologie 33:77-89.
154
Graham, R.C., D.R. Hirmas, Y.A. Wood, and C. Amrhein. 2008. Large near-surface nitrate pools in soils capped by desert pavement in the Mojave Desert, California. Geology 36:259-262.
Hamerlynck, E.P., J.R. McAuliffe, E.V. McDonald, and S.D. Smith. 2002. Ecological
responses of two Mojave Desert shrubs to soil horizon development and soil water dynamics. Ecology 83:768-779.
Henning, J.A.G., and K. Kellner. 1994. Degradation of a soil (Aridosol) and vegetation in
the semiarid grasslands of southern Africa. Bot. Bull. Acad. Sin. 35:195-199. Hillel, D. 1998. Environmental Soil Physics Academic Press, San Diego, CA. Hugie, V.K., and H.B. Passey. 1964. Soil surface patterns of some semiarid soils in
northern Utah, southern Idaho, and northeastern Nevada. Soil Sci. Soc. Am. Proc. 28:786-792.
Huxman, T.E., K.A. Snyder, D. Tissue, A.J. Leffler, K. Ogle, W.T. Pockman, D.R.
Sandquist, D.L. Potts, and S. Schwinning. 2004. Precipitation pulses and carbon fluxes in semiarid and arid ecosystems. Oecologia 141:254-268.
Issa, O.M., J. Trichet, C. Defarge, A. Coute, and C. Valentin. 1999. Morphology and
microstructure of microbiotic soil crusts on a tiger bush sequence (Niger, Sahel). Catena 37:175-196.
Joeckel, R.M., and B.A. Clement. 1999. Surface features of the Salt Basin of Lancaster
County, Nebraska. Catena 34:243-275. Ketcham, R.A. 2005. Computational methods for quantitative analysis of three-
dimensional feature in geological specimens. Geosphere 1:32-41. Lebedeva, M.P., D.L. Golovanov, and S.A. Inozemtsev. 2009. Microfabrics of desert
soils of Mongolia. Euras. Soil Sci. 42:1204-1217. Matmon, A., O. Simhai, R. Amit, I. Haviv, N. Porat, E. McDonald, L. Benedetti, and R.
Finkel. 2009. Desert pavement-coated surfaces in extreme deserts present the longest-lived landforms on Earth. Geol. Soc. Am. Bull. 121:688-697.
McAuliffe, J.R. 1994. Landscape evolution, soil formation, and ecological patterns and
processes in Sonoran Desert bajadas. Ecol. Monogr. 64:111-148. McCalley, C.K., and J.P. Sparks. 2009. Abiotic gas formation drives nitrogen loss from a
desert ecosystem. Science 326:837-840.
155
McDonald, E.V. 1994. The relative influences of climatic change, desert dust, and
lithologic control on soil-geomorphic processes and soil hydrology of calcic soils formed on quaternary alluvial-fan deposits in the Mojave Desert, California. Ph.D. Dissertation, The University of New Mexico, Albuquerque, NM.
McDonald, E.V., L.D. McFadden, and S.G. Wells. 1995. The relative influences of
climate change, desert dust, and lithologic control on soil-geomorphic processes on alluvial fans, Mojave Desert, California: Summary of results. p. 35-42. In R. E. Reynolds and J. Reynolds (ed.) Ancient surfaces of the East Mojave Desert: a volume and field trip guide prepared in conjunction with the 1995 Desert Research Symposium. Quarterly of the San Bernardino County Museum Association. San Bernardino County Museum Association, Redlands, CA.
McFadden, L.D., E.V. McDonald, S.G. Wells, K. Anderson, J. Quade, and S.L. Forman.
1998. The vesicular layer and carbonate collars of desert soils and pavements: formation, age and relation to climate change. Geomorphology 24:101-145.
McFadden, L.D., S.G. Wells, and M.J. Jercinovich. 1987. Influences of eolian and
pedogenic processes on the origin and evolution of desert pavements. Geology 15:504-508.
Miller, D.E. 1971. Formation of vesicular structure in soil. Soil Sci. Soc. Am. Proc.
35:635-637. Miller, D.M., D.R. Bedford, D.L. Hughson, E.V. McDonald, S.E. Robinson, and K.M.
Schmidt. 2009. Mapping Mojave Desert ecosystem properties with surficial geology. p. 225-251. In R. H. Webb et al. (ed.) The Mojave Desert: Ecosystem Processes and Sustainability. University of Nevada Press, Reno, NV.
Minitab. 2010. MINITAB 16. Minitab, State College, PA. Musick. 1975. Barrenness of desert pavement in Yuma County, Arizona. J. Arizona
Acad. Sci. 10:24-28. Noy-Meir, I. 1973. Desert ecosystems: environment and producers. Annu. Rev. Ecol.
Syst. 4:25-51. Paletskaya, L.N., A.P. Lavrov, and S.I. Kogan. 1958. Pore formation in takyr crust. Sov.
Soil Sci. (Engl. Transl.) 3:245-250. . Peterson, F.F. 1980. Holocene desert soil formation under sodium-salt influence in a
playa-margin environment. Quat. Res. 13:172-186.
156
Quade, J. 2001. Desert pavements and associated rock varnish in the Mojave Desert: How old can they be? Geology 29:855-858.
Rabenhorst, M.C. 2005. Biological zero: A soil temperature concept. Wetlands 25: 616-
621. Reheis, M.C., J.M. Sowers, E.M. Taylor, L.D. Mcfadden, and J.W. Harden. 1992.
Morphology and genesis of carbonate soils on the Kyle Canyon fan, Nevada, USA. Geoderma 52:303-342.
Rossi, A.M., D.R. Hirmas, R.C. Graham, and P.D. Sternberg. 2008. Bulk density
determination by automated three-dimensional laser scanning. Soil Sci. Soc. Am. J. 72:1591-1593.
Segal, E., P.J. Shouse, S.A. Bradford, T.H. Skaggs, and D.L. Corwin. 2009. Measuring
particle size distribution using laser diffraction: implications for predicting soil hydraulic properties. Soil Sci. 174:639-645.
Smith, S.D., C.A. Herr, K.L. Leary, and J.M. Piorkowski. 1995. Soil-plant water relations
in a Mojave Desert mixed shrub community: a comparison of three geomorphic surfaces. J Arid Environ 29:339-351.
Soil Survey Staff, 2012. Web Soil Survey. Available at
http://websoilsurvey.nrcs.usda.gov (verified 24 Jan. 2012). USDA-NRCS, Washington, DC.
Springer, M.E. 1958. Desert pavement and vesicular layer of some soils of the desert of
the Lahontan Basin, Nevada. Soil Sci. Soc. Am. Proc. 22:63-66. Stevenson, F.J., R.M. Harrison, R. Wetselaa, and R.A. Leeper. 1970. Nitrosation of soil
organic matter: III. Nature of gases produced by reaction of nitrite with lignins, humic substances, and phenolic constituents under neutral and slightly acidic conditions. Soil Sci. Soc. Am. Proc. 34:430-435.
Stoops, G. 2003. Guidelines for Analysis and Description of Soil and Regolith Thin
Sections. SSSA, Madison, WI. Sullivan, L.A., and A.J. Koppi. 1991. Morphology and genesis of silt and clay coatings in
the vesicular layer of a desert loam soil. Aust. J. Soil Res. 29:579-586. Tate, R.L. III, 2000. Soil Microbiology, 2nd ed. John Wiley and Sons, New York, NY. Thomas, G.W. 1982. Exchangeable Cations. p. 159-165. In A. L. Page, (ed.) Methods of
Soil Analysis. Part 2. 2nd ed. Agron. Monogr. 9. ASA and SSSA, Madison, WIl
157
Turk, J.K., O.A. Chadwick, and R.C. Graham. 2011. Pedogenic processes. p. 30.31-
30.29. In P. M. Huang et al. (ed.) Handbook of Soil Sciences: Properties and Processes. 2nd ed. CRC Press, Boca Raton, FL.
Turk, J.K., and R.C. Graham. 2011. Distribution and properties of vesicular horizons in
the western United States. Soil Sci. Soc. Am. J. 75:1449-1461. Ugolini, F.C., S. Hillier, G. Certini, and M.J. Wilson. 2008. The contribution of aeolian
material to an Aridisol from southern Jordan as revealed by mineralogical analysis. J. Arid Environ. 72:1431-1447.
Valentin, C. 1994. Surface sealing as affected by various rock fragment covers in West-
Africa. Catena 23:87-97. Valentine, G.A., and C.D. Harrington. 2006. Clast size controls and longevity of
Pleistocene desert pavements at Lathrop Wells and Red Cone volcanoes, southern Nevada. Geology 34:533-536.
Van Vliet-Lanoë, B. 1985. Frost effects in soils. In J. Boardman (ed.) Soils and
quaternary landscape evolution. John Wiley and Sons, Chichester, UK. Venterea, R.T. 2007. Nitrite-driven nitrous oxide production under aerobic soil
conditions: kinetics and biochemical controls. Global Change Biol. 13:1798-1809.
Williams, D.E. 1948. A rapid manometric method for determination of carbonate in soils.
Soil Sci. Soc. Am. Proc. 13:127-129. Williams, A., B. Buck, D. Soukup, and D. Merkler. 2010. Biological soil crusts and the
fertile island effect: Soil-geomophic insights from the Mojave Desert, USA. In Abstracts, ASA-CSSA-SSSA Int. Annu. Meet., Long Beach, CA. 31 Oct.-3 Nov. 2010. ASA-CSSA-SSSA, Madison, WI.
Wood, M.K., W.H. Blackburn, R.E. Eckert, and F.F. Peterson. 1978. Interrelations of
physical-properties of coppice dune and vesicular dune interspace soils with grass seedling emergence. J. Range Manage. 31:189-192.
Wood, M.K., R.E. Eckert, W.H. Blackburn, and F.F. Peterson. 1982. Influence of
crusting soil surfaces on emergence and establishment of crested wheat-grass, squirreltail, thurber needlegrass, and fourwing saltbush. J. Range Manage. 35:282-287.
158
Wood, M.K., R.E. Eckert, W.H. Blackburn, and F.F. Peterson. 1982. Influence of crusting soil surfaces on emergence and establishment of crested wheat-grass, squirreltail, thurber needlegrass, and fourwing saltbush. J. Range Manage. 35:282-287.
Wood, Y.A., R.C. Graham, and S.G. Wells. 2005. Surface control of desert pavement
pedologic process and landscape function, Cima Volcanic field, Mojave Desert, California. Catena 59:205-230.
Yonovitz, M., and P.J. Drohan. 2009. Pore morphology characteristics of vesicular
horizons in undisturbed and disturbed arid soils; implications for arid land management. Soil Use Manage. 25:293-302.
Young, M.H., E.V. McDonald, T.G. Caldwell, S.G. Benner, and D.G. Meadows. 2004.
Hydraulic properties of a desert soil chronosequence in the Mojave Desert, USA. Vadose Zone J. 3:956-963.
Zibilske, L.M. 1994. Carbon Mineralization. In R. W. Weaver (ed.) Methods of Soil
Analysis Part 2. Microbiological and Biochemical Properties. ASA and SSSA, Madison, WI.
159
5. CONCLUSIONS
The purpose of this dissertation was to examine the distribution, properties, and
pedogenic processes of vesicular horizons through soil database, field, and laboratory
studies. The soil databases contained 1387 soil series with vesicular horizons, which
were mostly soils classified as Aridisols, Entisols, Mollisols, Alfisols, and Inceptisols.
The most common textures of the vesicular horizons were loam, sandy loam, fine sandy
loam, very fine sandy loam, and silt loam. The soil series with vesicular horizons are
most extensively mapped in the arid Basin and Range Province and cover a total of
156,000 km2 of the western U.S. The strength of vesicular horizon expression can be
quantified according to a field index, referred to as the vesicular horizon index (VHI).
The VHI takes into account the horizon thickness, vesicular pore size class, and vesicular
pore quantity class described in the field. Based on the VHI of vesicular horizons in the
soil databases, vesicular horizons are better expressed in the cold desert regions (i.e.,
central and northern Basin and Range) relative to the warm deserts (i.e., Mojave and
Sonoran Deserts).
In the field we examined recovery of vesicular horizons from disturbance, in
artificially disturbed study plots, and also in pre-existing tire tracks and coppice dunes.
These studies were conducted at 15 field areas, including sites in the Sonoran, Mojave,
and central Great Basin deserts. In the artificially disturbed study plots, we found that
vesicular horizon recovery was incomplete within the one-year study period. We also
found that degree of recovery was dependent on the number of precipitation events that
the site experienced during the recovery period. Using the relationship between
160

precipitation and vesicular horizon recovery, as well as the average number of
precipitation events in a year, we predict recovery periods for the field sites ranging from
two to 11 yrs. In tire tracks, vesicular horizons were recently disturbed (<4 to >15 yrs
ago), but show little difference in pore morphology relative to undisturbed parts of the
landscape. In the coppice dunes, vesicular pores, vughs, and interconnected pores of the
vesicular horizons were reduced in size, and platy structure became more strongly
pronounced, providing evidence for the collapse of pores that had formed in the un-
buried vesicular horizon. Disturbance of the vesicular horizons resulted in only minor
reduction in infiltration rates, indicating that the hydraulic properties of the vesicular
horizon are not severely altered by disturbance.
The lab studies examined the effect of microbial respiration and thermal
expansion of gases on vesicular pore formation. These studies found indirect evidence to
support a biologically-mediated mechanism of vesicular pore growth: 1) increased
vesicular pore growth in response to addition of a labile C source (i.e., glucose), and 2)
decreased vesicular pore growth in soils that were wet at low temperature (7oC) relative
to those that were wet at warmer temperature (40oC). However, sterilization did not
significantly inhibit vesicular pore growth, which suggests that abiotic processes are
equally, or more important in driving the formation of vesicular pores. No evidence was
found to support the role of thermal expansion of gases in the growth of vesicular pores,
which actually formed more readily in the soils that were maintained at a constant
temperature.
161

Together, these findings suggest a complex set of linkages between vesicular
horizon formation and the climatic and biological conditions of the soil, including
frequency of precipitation, soil temperature, shrub cover, and microbial respiration (Fig.
5.1). Human land use and climate change have potential to alter the balance between the
variables that influence vesicular horizon formation, causing expansion or contraction of
vesicular horizon extent in arid and semi-arid landscapes.
162
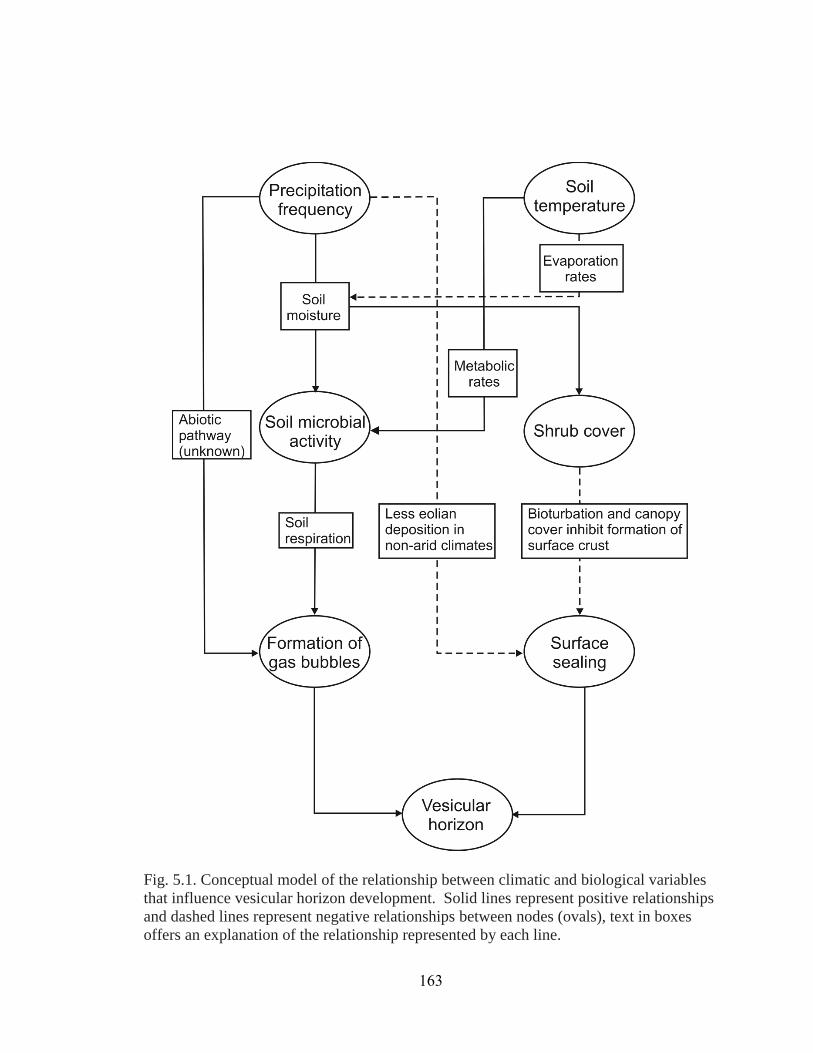
Fig. 5.1. Conceptual model of the relationship between climatic and biological variables that influence vesicular horizon development. Solid lines represent positive relationships and dashed lines represent negative relationships between nodes (ovals), text in boxes offers an explanation of the relationship represented by each line.
163
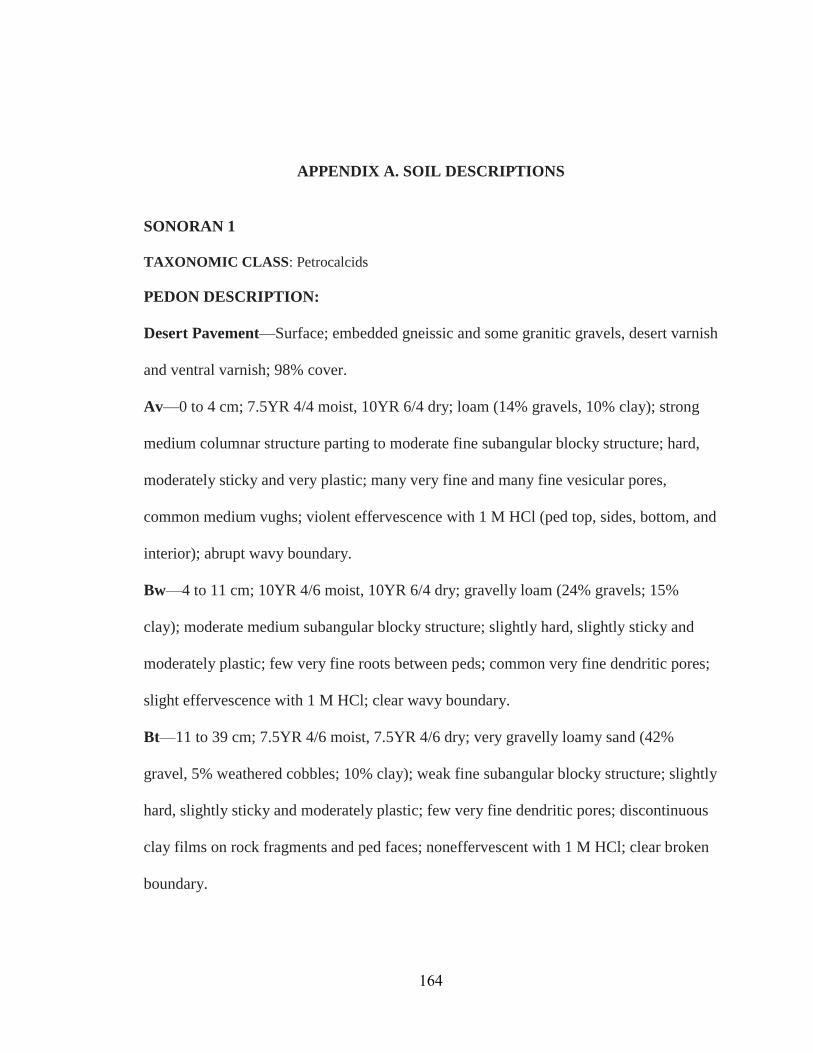
APPENDIX A. SOIL DESCRIPTIONS
SONORAN 1 TAXONOMIC CLASS: Petrocalcids
PEDON DESCRIPTION:
Desert Pavement—Surface; embedded gneissic and some granitic gravels, desert varnish
and ventral varnish; 98% cover.
Av—0 to 4 cm; 7.5YR 4/4 moist, 10YR 6/4 dry; loam (14% gravels, 10% clay); strong
medium columnar structure parting to moderate fine subangular blocky structure; hard,
moderately sticky and very plastic; many very fine and many fine vesicular pores,
common medium vughs; violent effervescence with 1 M HCl (ped top, sides, bottom, and
interior); abrupt wavy boundary.
Bw—4 to 11 cm; 10YR 4/6 moist, 10YR 6/4 dry; gravelly loam (24% gravels; 15%
clay); moderate medium subangular blocky structure; slightly hard, slightly sticky and
moderately plastic; few very fine roots between peds; common very fine dendritic pores;
slight effervescence with 1 M HCl; clear wavy boundary.
Bt—11 to 39 cm; 7.5YR 4/6 moist, 7.5YR 4/6 dry; very gravelly loamy sand (42%
gravel, 5% weathered cobbles; 10% clay); weak fine subangular blocky structure; slightly
hard, slightly sticky and moderately plastic; few very fine dendritic pores; discontinuous
clay films on rock fragments and ped faces; noneffervescent with 1 M HCl; clear broken
boundary.
164
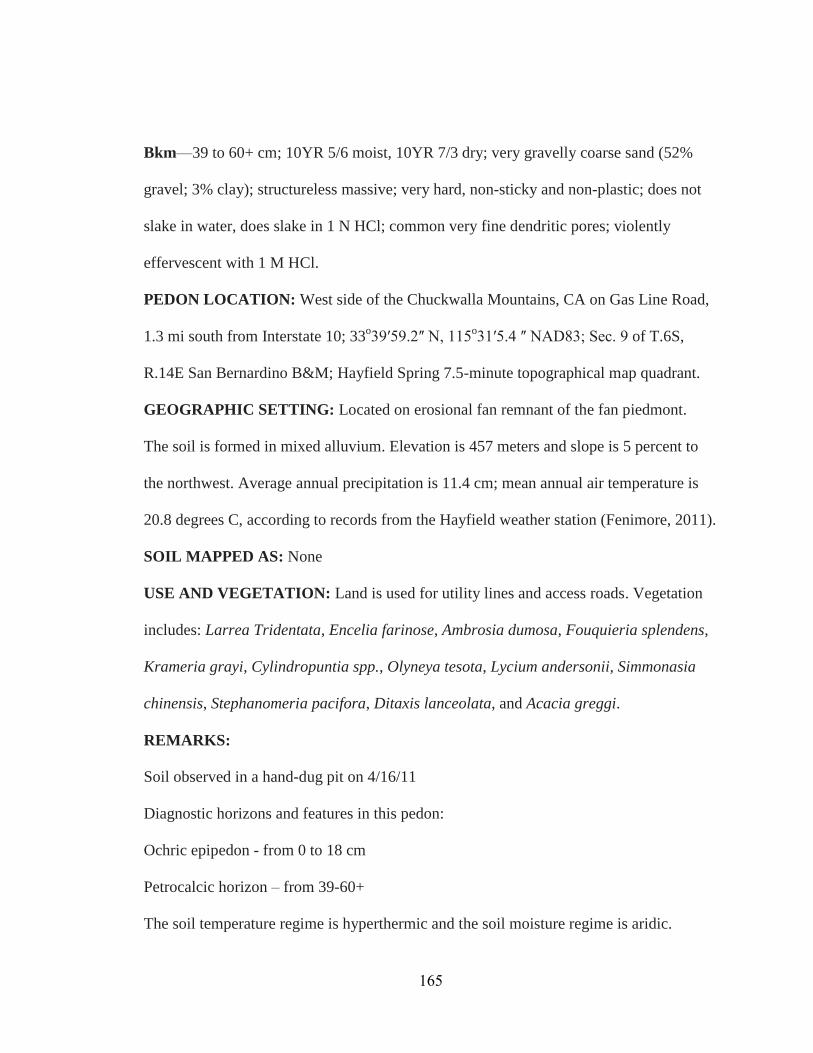
Bkm—39 to 60+ cm; 10YR 5/6 moist, 10YR 7/3 dry; very gravelly coarse sand (52%
gravel; 3% clay); structureless massive; very hard, non-sticky and non-plastic; does not
slake in water, does slake in 1 N HCl; common very fine dendritic pores; violently
effervescent with 1 M HCl.
PEDON LOCATION: West side of the Chuckwalla Mountains, CA on Gas Line Road,
1.3 mi south from Interstate 10; 33o39ʹ59.2ʺ N, 115o31ʹ5.4 ʺ NAD83; Sec. 9 of T.6S,
R.14E San Bernardino B&M; Hayfield Spring 7.5-minute topographical map quadrant.
GEOGRAPHIC SETTING: Located on erosional fan remnant of the fan piedmont.
The soil is formed in mixed alluvium. Elevation is 457 meters and slope is 5 percent to
the northwest. Average annual precipitation is 11.4 cm; mean annual air temperature is
20.8 degrees C, according to records from the Hayfield weather station (Fenimore, 2011).
SOIL MAPPED AS: None
USE AND VEGETATION: Land is used for utility lines and access roads. Vegetation
includes: Larrea Tridentata, Encelia farinose, Ambrosia dumosa, Fouquieria splendens,
Krameria grayi, Cylindropuntia spp., Olyneya tesota, Lycium andersonii, Simmonasia
chinensis, Stephanomeria pacifora, Ditaxis lanceolata, and Acacia greggi.
REMARKS:
Soil observed in a hand-dug pit on 4/16/11
Diagnostic horizons and features in this pedon:
Ochric epipedon - from 0 to 18 cm
Petrocalcic horizon – from 39-60+
The soil temperature regime is hyperthermic and the soil moisture regime is aridic.
165
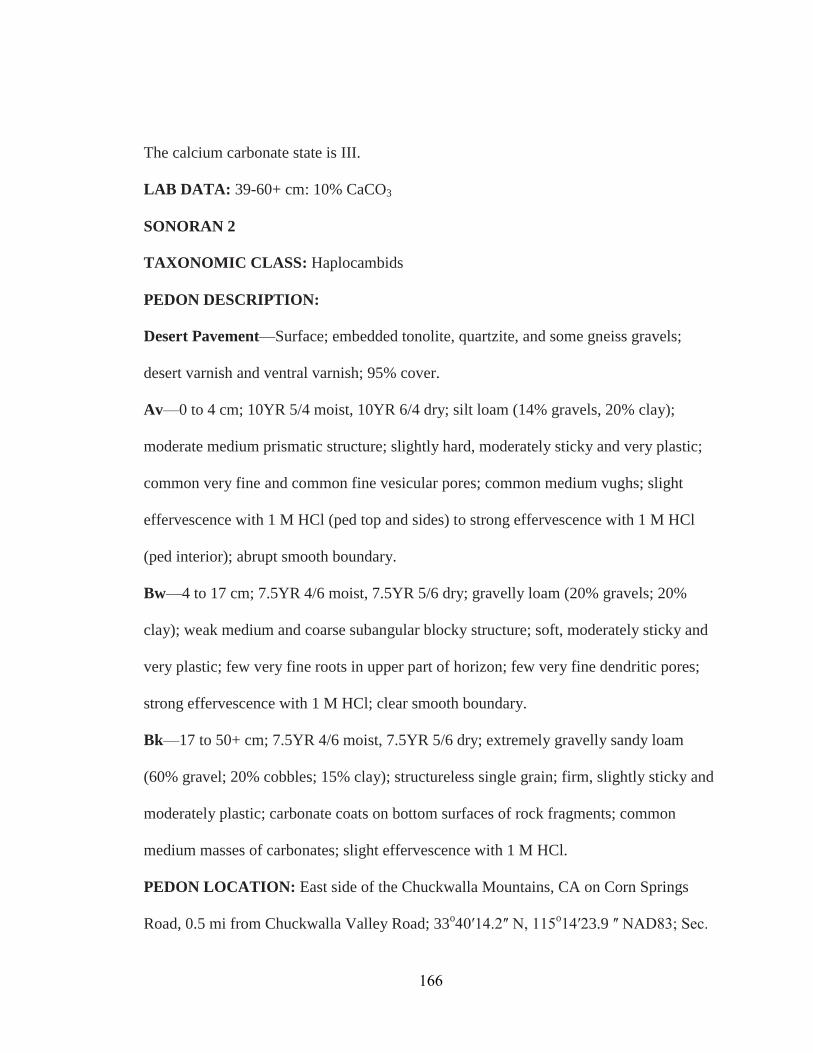
The calcium carbonate state is III.
LAB DATA: 39-60+ cm: 10% CaCO3
SONORAN 2
TAXONOMIC CLASS: Haplocambids
PEDON DESCRIPTION:
Desert Pavement—Surface; embedded tonolite, quartzite, and some gneiss gravels;
desert varnish and ventral varnish; 95% cover.
Av—0 to 4 cm; 10YR 5/4 moist, 10YR 6/4 dry; silt loam (14% gravels, 20% clay);
moderate medium prismatic structure; slightly hard, moderately sticky and very plastic;
common very fine and common fine vesicular pores; common medium vughs; slight
effervescence with 1 M HCl (ped top and sides) to strong effervescence with 1 M HCl
(ped interior); abrupt smooth boundary.
Bw—4 to 17 cm; 7.5YR 4/6 moist, 7.5YR 5/6 dry; gravelly loam (20% gravels; 20%
clay); weak medium and coarse subangular blocky structure; soft, moderately sticky and
very plastic; few very fine roots in upper part of horizon; few very fine dendritic pores;
strong effervescence with 1 M HCl; clear smooth boundary.
Bk—17 to 50+ cm; 7.5YR 4/6 moist, 7.5YR 5/6 dry; extremely gravelly sandy loam
(60% gravel; 20% cobbles; 15% clay); structureless single grain; firm, slightly sticky and
moderately plastic; carbonate coats on bottom surfaces of rock fragments; common
medium masses of carbonates; slight effervescence with 1 M HCl.
PEDON LOCATION: East side of the Chuckwalla Mountains, CA on Corn Springs
Road, 0.5 mi from Chuckwalla Valley Road; 33o40ʹ14.2ʺ N, 115o14ʹ23.9 ʺ NAD83; Sec.
166
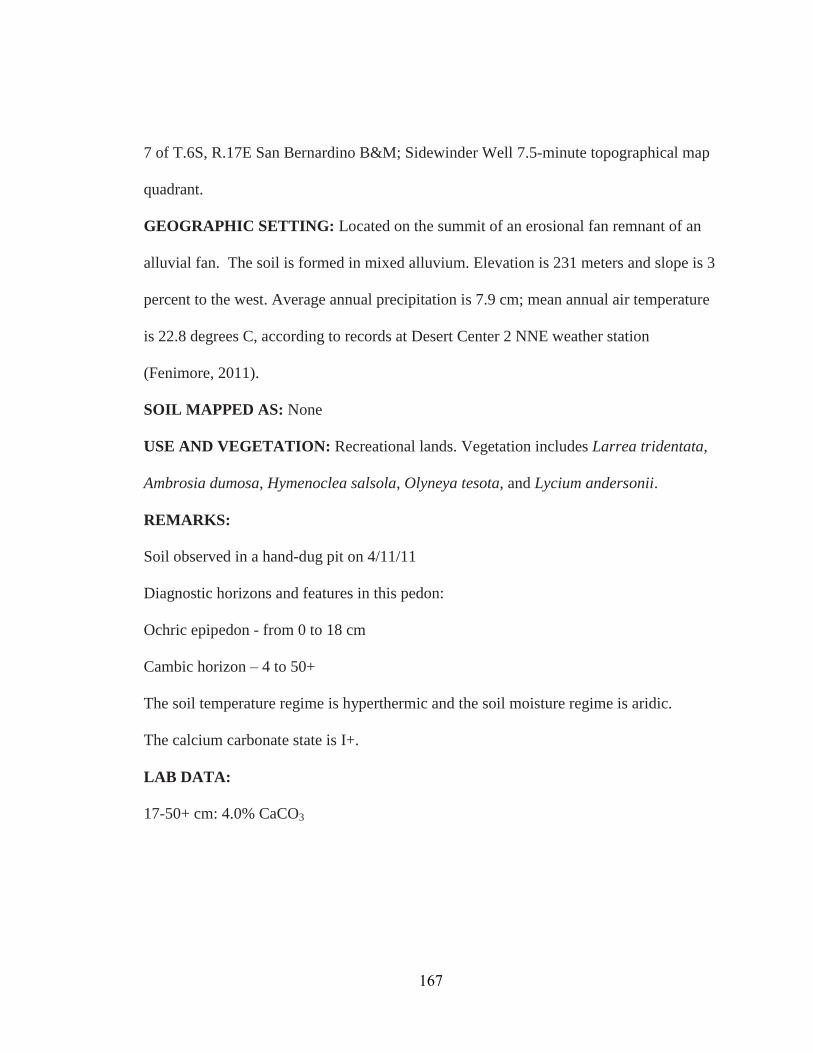
7 of T.6S, R.17E San Bernardino B&M; Sidewinder Well 7.5-minute topographical map
quadrant.
GEOGRAPHIC SETTING: Located on the summit of an erosional fan remnant of an
alluvial fan. The soil is formed in mixed alluvium. Elevation is 231 meters and slope is 3
percent to the west. Average annual precipitation is 7.9 cm; mean annual air temperature
is 22.8 degrees C, according to records at Desert Center 2 NNE weather station
(Fenimore, 2011).
SOIL MAPPED AS: None
USE AND VEGETATION: Recreational lands. Vegetation includes Larrea tridentata,
Ambrosia dumosa, Hymenoclea salsola, Olyneya tesota, and Lycium andersonii.
REMARKS:
Soil observed in a hand-dug pit on 4/11/11
Diagnostic horizons and features in this pedon:
Ochric epipedon - from 0 to 18 cm
Cambic horizon – 4 to 50+
The soil temperature regime is hyperthermic and the soil moisture regime is aridic.
The calcium carbonate state is I+.
LAB DATA:
17-50+ cm: 4.0% CaCO3
167
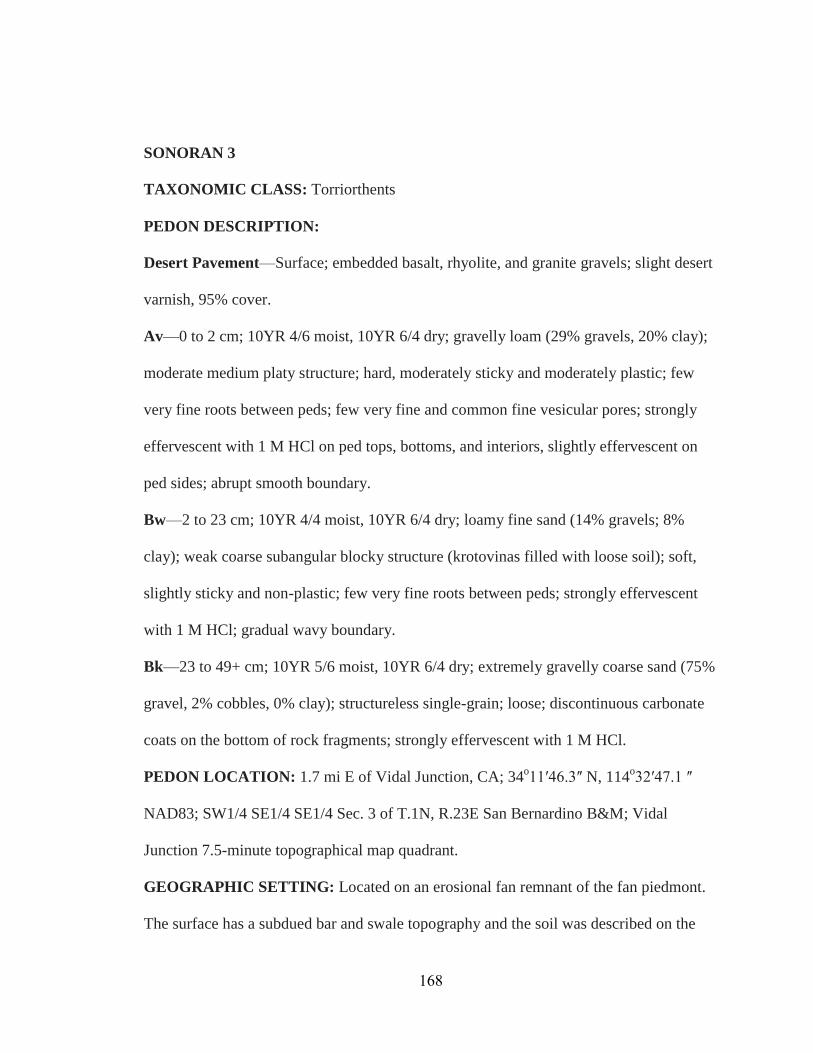
SONORAN 3
TAXONOMIC CLASS: Torriorthents
PEDON DESCRIPTION:
Desert Pavement—Surface; embedded basalt, rhyolite, and granite gravels; slight desert
varnish, 95% cover.
Av—0 to 2 cm; 10YR 4/6 moist, 10YR 6/4 dry; gravelly loam (29% gravels, 20% clay);
moderate medium platy structure; hard, moderately sticky and moderately plastic; few
very fine roots between peds; few very fine and common fine vesicular pores; strongly
effervescent with 1 M HCl on ped tops, bottoms, and interiors, slightly effervescent on
ped sides; abrupt smooth boundary.
Bw—2 to 23 cm; 10YR 4/4 moist, 10YR 6/4 dry; loamy fine sand (14% gravels; 8%
clay); weak coarse subangular blocky structure (krotovinas filled with loose soil); soft,
slightly sticky and non-plastic; few very fine roots between peds; strongly effervescent
with 1 M HCl; gradual wavy boundary.
Bk—23 to 49+ cm; 10YR 5/6 moist, 10YR 6/4 dry; extremely gravelly coarse sand (75%
gravel, 2% cobbles, 0% clay); structureless single-grain; loose; discontinuous carbonate
coats on the bottom of rock fragments; strongly effervescent with 1 M HCl.
PEDON LOCATION: 1.7 mi E of Vidal Junction, CA; 34o11ʹ46.3ʺ N, 114o32ʹ47.1 ʺ
NAD83; SW1/4 SE1/4 SE1/4 Sec. 3 of T.1N, R.23E San Bernardino B&M; Vidal
Junction 7.5-minute topographical map quadrant.
GEOGRAPHIC SETTING: Located on an erosional fan remnant of the fan piedmont.
The surface has a subdued bar and swale topography and the soil was described on the
168
flattened bar position. The soil is formed in mixed alluvium. Elevation is 280 meters and
slope is 2 percent to the south. Average annual precipitation is 15.9 cm; mean annual air
temperature is 23.3 degrees C, according to records at Parker Rsvr weather station
(Fenimore, 2011).
SOIL MAPPED AS: None
USE AND VEGETATION: Recreational land. Vegetation includes: Larrea tridentata,
Ambrosia dumosa, Parkinsonia florida, Encelia farinosa, Krameria grayi, Opuntia spp.,
Hymenoclea salsola, Lycium andersonii, Adenophyllum porophylloides, and
Cylindropuntia spp.
REMARKS:
Soil observed in a hand-dug pit on 4/12/11
Diagnostic horizons and features in this pedon:
Ochric epipedon - from 0 to 18 cm
The soil temperature regime is hyperthermic and the soil moisture regime is aridic.
The calcium carbonate state is I.
LAB DATA:
23-49+ cm: 9.5% CaCO3
169
SONORAN 4
TAXONOMIC CLASS: Haplargids
PEDON DESCRIPTION:
Desert Pavement—Surface; embedded andesite, andesitic breccia, quartzite, and quartz
gravels; strong varnish, 98% cover.
Av—0 to 5 cm; 10YR 4/6 moist, 10YR 6/4 dry; silt loam (0% gravels, 20% clay); strong
medium columnar structure parting to moderate very thick platy structure; hard, slightly
sticky and very plastic; many very fine and common fine vesicular pores in upper 2 cm,
common very fine and common collapsed vesicular pores in lower 3 cm; discontinuous
clay films on ped faces; violently effervescent with 1 M HCl on ped tops and interiors,
slightly effervescent on ped sides, and strongly effervescent on ped bottoms; abrupt
smooth boundary.
Bk—5 to 16 cm; 7.5YR 4/6 moist, 7.5YR 5/6 dry; very gravelly loam (40% gravels; 12%
clay); structureless single-grain; loose, slightly sticky and very plastic; few very fine
roots throughout; carbonate coats on the bottom of rock fragments (1 mm thick), few
medium carbonate masses; slightly effervescent with 1 M HCl; gradual wavy boundary.
Btk—16 to 42+ cm; 7.5YR 4/6 moist, 7.5YR 5/6 dry; extremely gravelly sandy clay
loam (67% gravel, 3% cobbles, 30% clay); structureless single-grain; loose; carbonate
coats on the bottom of rock fragments (2 mm thick), common coarse carbonate nodules,
discontinuous clay films on nodules; strongly effervescent with 1 M HCl.
170
PEDON LOCATION: 2 mi NE of Quartzsite, AZ; 33o41ʹ2.5ʺ N, 114o12ʹ12.6 ʺ NAD83;
SE1/4 SE1/4 Sec. 15 of T.4N, R.19W Gila and Salt River B&M; Quartzsite 7.5-minute
topographical map quadrant.
GEOGRAPHIC SETTING: Located on an erosional fan remnant of the fan piedmont.
The soil is formed in mixed alluvium. Elevation is 273 meters and slope is 2 percent to
the north. Average annual precipitation is 8.9 cm; mean annual air temperature is 22.7
degrees C, according to records at Quarzsite weather station (Fenimore, 2011).
SOIL MAPPED AS: None
USE AND VEGETATION: Recreational land. Vegetation includes: Larrea tridentata,
Krameria grayi, Parkinsonia florida, Olyneya tesota, Adenopyllum porophylloides,
Hymenoclea salsola, Encelia farinosa, Sphaeralcea emoryi, Acacia greggi, Encelia
frutescens, Salazaria mexicana, Ambrosia dumosa, Carnegiea gigantea, Stephanomeria
pauciflora
REMARKS:
Soil observed in a hand-dug pit on 4/14/11
Diagnostic horizons and features in this pedon:
Ochric epipedon - from 0 to 16 cm
Cambic horizon – from 5 to 16 cm
Argillic horizon – from 16 to 42+
The soil temperature regime is hyperthermic and the soil moisture regime is aridic.
The calcium carbonate state is I.
LAB DATA: 6-15 cm: 8.3% CaCO3, 16-42+ cm: 9.9% CaCO3
171
SONORAN 5
TAXONOMIC CLASS: Haplocalcids
PEDON DESCRIPTION:
Desert Pavement—Surface; embedded andesitic and granodiorite gravels; moderate
varnish, 95% cover.
Av—0 to 4 cm; 10YR 4/6 moist, 10YR 6/4 dry; gravelly loam (20% gravels, 22% clay);
moderate coarse columnar structure; hard, moderately sticky and moderately plastic;
common very fine, common fine, and common medium vesicular pores; discontinuous
clay films on bottom of peds; very slightly effervescent with 1 M HCl on ped tops, non-
effervescent on ped sides, and violently effervescent on ped bottoms and interiors; clear
smooth boundary.
Btk—4 to 19 cm; 7.5YR 4/4 moist, 7.5YR 5/4 dry; very gravelly sandy loam (42%
gravels; 8% clay); weak medium and coarse subangular blocky structure; hard, slightly
sticky and non-plastic; few very fine roots throughout; few very fine tubular pores;
patchy carbonate coats on the bottom of rock fragments, discontinuous clay films on the
top of rock fragments; slightly effervescent with 1 M HCl; gradual smooth boundary.
Bk—19 to 50+ cm; 7.5YR 4/6 moist, 7.5YR 4/6 dry; extremely gravelly sandy loam
(75% gravel, 5% clay); structureless single-grain; loose, slightly sticky and very plastic;
continuous carbonate coats on the bottom of rock fragments (2 mm thick); strongly
effervescent with 1 M HCl.
172
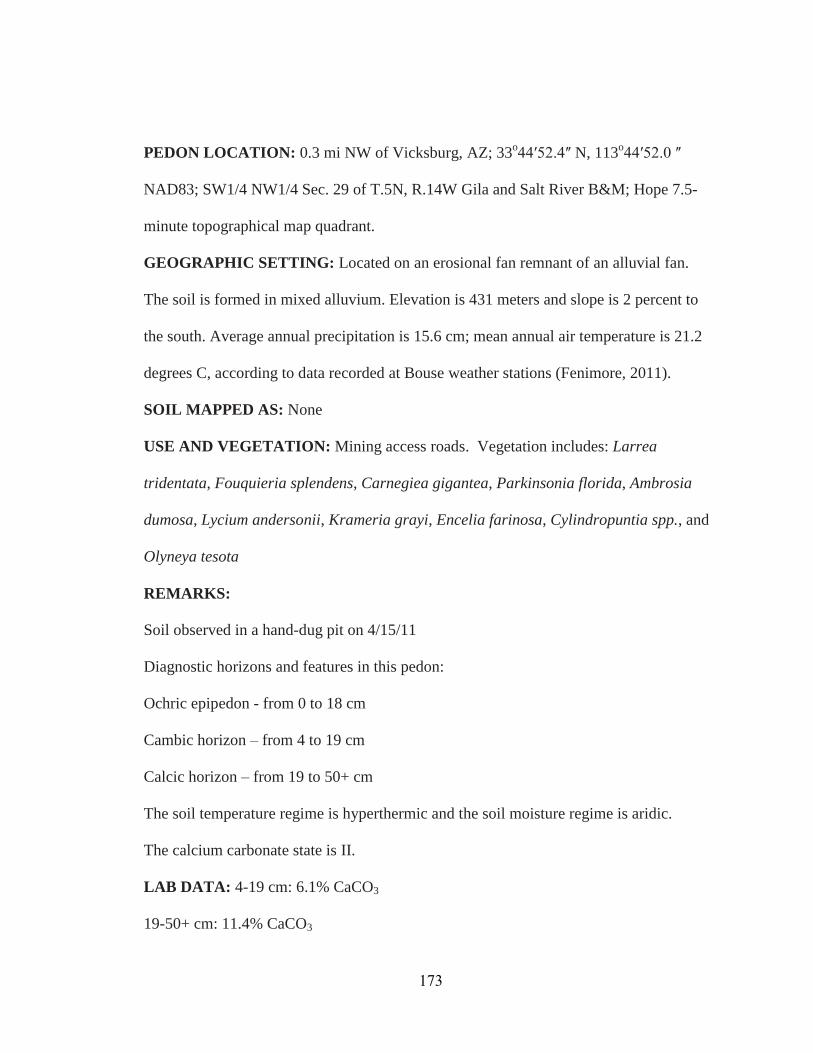
PEDON LOCATION: 0.3 mi NW of Vicksburg, AZ; 33o44ʹ52.4ʺ N, 113o44ʹ52.0 ʺ
NAD83; SW1/4 NW1/4 Sec. 29 of T.5N, R.14W Gila and Salt River B&M; Hope 7.5-
minute topographical map quadrant.
GEOGRAPHIC SETTING: Located on an erosional fan remnant of an alluvial fan.
The soil is formed in mixed alluvium. Elevation is 431 meters and slope is 2 percent to
the south. Average annual precipitation is 15.6 cm; mean annual air temperature is 21.2
degrees C, according to data recorded at Bouse weather stations (Fenimore, 2011).
SOIL MAPPED AS: None
USE AND VEGETATION: Mining access roads. Vegetation includes: Larrea
tridentata, Fouquieria splendens, Carnegiea gigantea, Parkinsonia florida, Ambrosia
dumosa, Lycium andersonii, Krameria grayi, Encelia farinosa, Cylindropuntia spp., and
Olyneya tesota
REMARKS:
Soil observed in a hand-dug pit on 4/15/11
Diagnostic horizons and features in this pedon:
Ochric epipedon - from 0 to 18 cm
Cambic horizon – from 4 to 19 cm
Calcic horizon – from 19 to 50+ cm
The soil temperature regime is hyperthermic and the soil moisture regime is aridic.
The calcium carbonate state is II.
LAB DATA: 4-19 cm: 6.1% CaCO3
19-50+ cm: 11.4% CaCO3
173
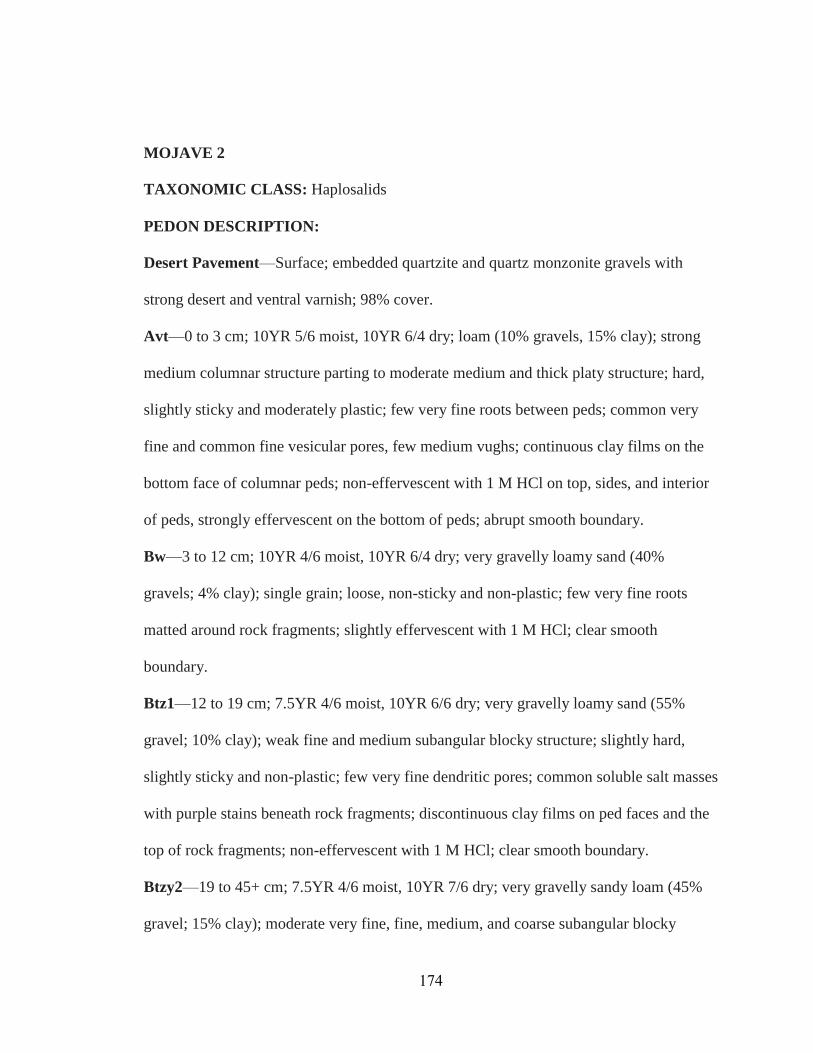
MOJAVE 2
TAXONOMIC CLASS: Haplosalids
PEDON DESCRIPTION:
Desert Pavement—Surface; embedded quartzite and quartz monzonite gravels with
strong desert and ventral varnish; 98% cover.
Avt—0 to 3 cm; 10YR 5/6 moist, 10YR 6/4 dry; loam (10% gravels, 15% clay); strong
medium columnar structure parting to moderate medium and thick platy structure; hard,
slightly sticky and moderately plastic; few very fine roots between peds; common very
fine and common fine vesicular pores, few medium vughs; continuous clay films on the
bottom face of columnar peds; non-effervescent with 1 M HCl on top, sides, and interior
of peds, strongly effervescent on the bottom of peds; abrupt smooth boundary.
Bw—3 to 12 cm; 10YR 4/6 moist, 10YR 6/4 dry; very gravelly loamy sand (40%
gravels; 4% clay); single grain; loose, non-sticky and non-plastic; few very fine roots
matted around rock fragments; slightly effervescent with 1 M HCl; clear smooth
boundary.
Btz1—12 to 19 cm; 7.5YR 4/6 moist, 10YR 6/6 dry; very gravelly loamy sand (55%
gravel; 10% clay); weak fine and medium subangular blocky structure; slightly hard,
slightly sticky and non-plastic; few very fine dendritic pores; common soluble salt masses
with purple stains beneath rock fragments; discontinuous clay films on ped faces and the
top of rock fragments; non-effervescent with 1 M HCl; clear smooth boundary.
Btzy2—19 to 45+ cm; 7.5YR 4/6 moist, 10YR 7/6 dry; very gravelly sandy loam (45%
gravel; 15% clay); moderate very fine, fine, medium, and coarse subangular blocky
174
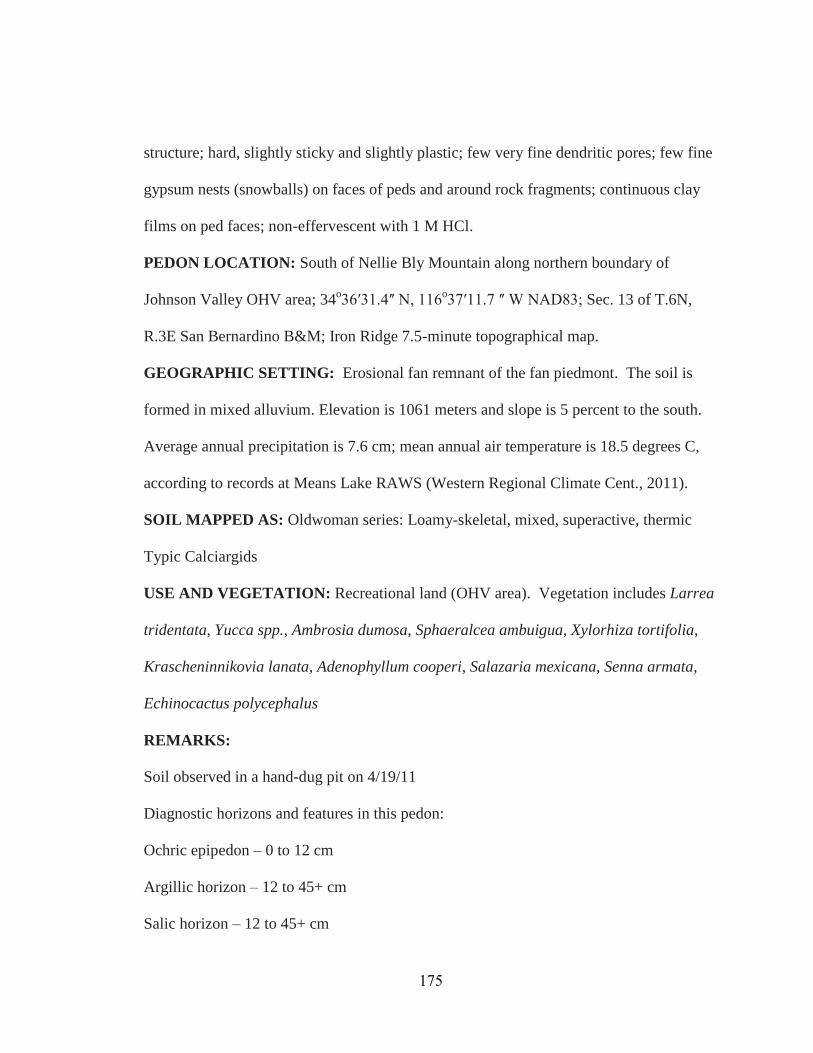
structure; hard, slightly sticky and slightly plastic; few very fine dendritic pores; few fine
gypsum nests (snowballs) on faces of peds and around rock fragments; continuous clay
films on ped faces; non-effervescent with 1 M HCl.
PEDON LOCATION: South of Nellie Bly Mountain along northern boundary of
Johnson Valley OHV area; 34o36ʹ31.4ʺ N, 116o37ʹ11.7 ʺ W NAD83; Sec. 13 of T.6N,
R.3E San Bernardino B&M; Iron Ridge 7.5-minute topographical map.
GEOGRAPHIC SETTING: Erosional fan remnant of the fan piedmont. The soil is
formed in mixed alluvium. Elevation is 1061 meters and slope is 5 percent to the south.
Average annual precipitation is 7.6 cm; mean annual air temperature is 18.5 degrees C,
according to records at Means Lake RAWS (Western Regional Climate Cent., 2011).
SOIL MAPPED AS: Oldwoman series: Loamy-skeletal, mixed, superactive, thermic
Typic Calciargids
USE AND VEGETATION: Recreational land (OHV area). Vegetation includes Larrea
tridentata, Yucca spp., Ambrosia dumosa, Sphaeralcea ambuigua, Xylorhiza tortifolia,
Krascheninnikovia lanata, Adenophyllum cooperi, Salazaria mexicana, Senna armata,
Echinocactus polycephalus
REMARKS:
Soil observed in a hand-dug pit on 4/19/11
Diagnostic horizons and features in this pedon:
Ochric epipedon – 0 to 12 cm
Argillic horizon – 12 to 45+ cm
Salic horizon – 12 to 45+ cm
175

The soil temperature regime is thermic and the soil moisture regime is aridic.
LAB DATA:
12-19 cm: 32.2 dS m-1 ECe, <1% gypsum
19-45 cm: 48.3 dS m-1 ECe, 1% gypsum
176
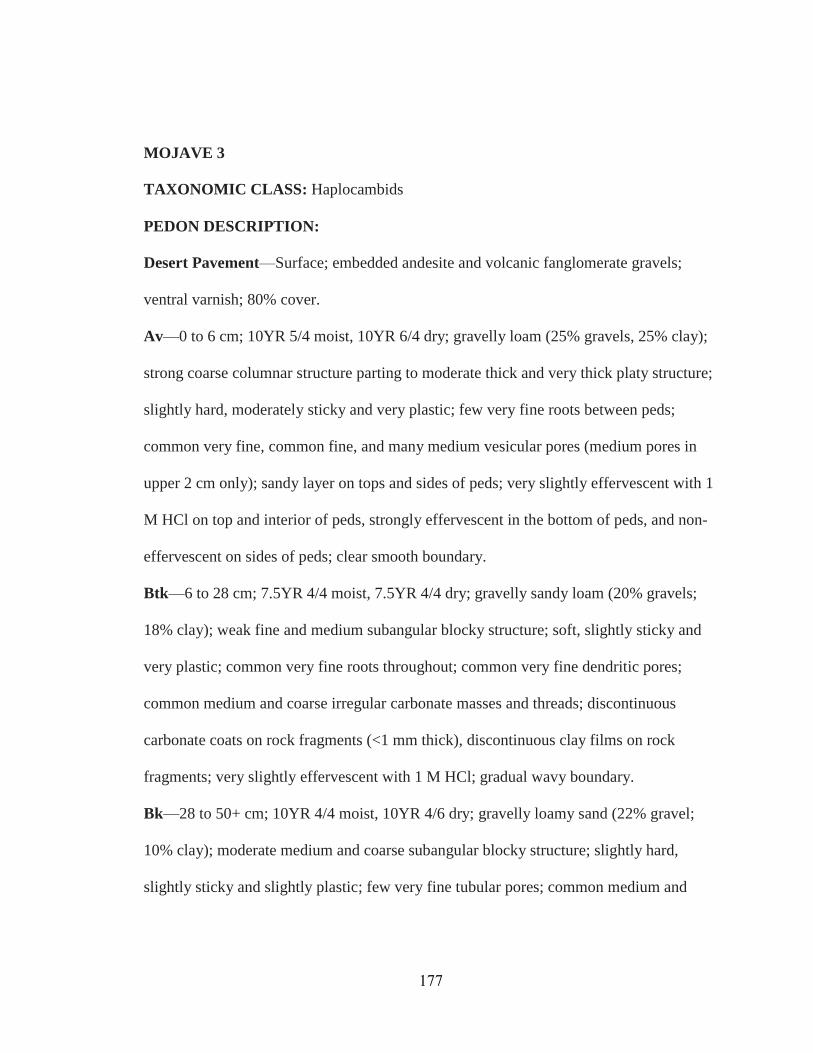
MOJAVE 3
TAXONOMIC CLASS: Haplocambids
PEDON DESCRIPTION:
Desert Pavement—Surface; embedded andesite and volcanic fanglomerate gravels;
ventral varnish; 80% cover.
Av—0 to 6 cm; 10YR 5/4 moist, 10YR 6/4 dry; gravelly loam (25% gravels, 25% clay);
strong coarse columnar structure parting to moderate thick and very thick platy structure;
slightly hard, moderately sticky and very plastic; few very fine roots between peds;
common very fine, common fine, and many medium vesicular pores (medium pores in
upper 2 cm only); sandy layer on tops and sides of peds; very slightly effervescent with 1
M HCl on top and interior of peds, strongly effervescent in the bottom of peds, and non-
effervescent on sides of peds; clear smooth boundary.
Btk—6 to 28 cm; 7.5YR 4/4 moist, 7.5YR 4/4 dry; gravelly sandy loam (20% gravels;
18% clay); weak fine and medium subangular blocky structure; soft, slightly sticky and
very plastic; common very fine roots throughout; common very fine dendritic pores;
common medium and coarse irregular carbonate masses and threads; discontinuous
carbonate coats on rock fragments (<1 mm thick), discontinuous clay films on rock
fragments; very slightly effervescent with 1 M HCl; gradual wavy boundary.
Bk—28 to 50+ cm; 10YR 4/4 moist, 10YR 4/6 dry; gravelly loamy sand (22% gravel;
10% clay); moderate medium and coarse subangular blocky structure; slightly hard,
slightly sticky and slightly plastic; few very fine tubular pores; common medium and
177
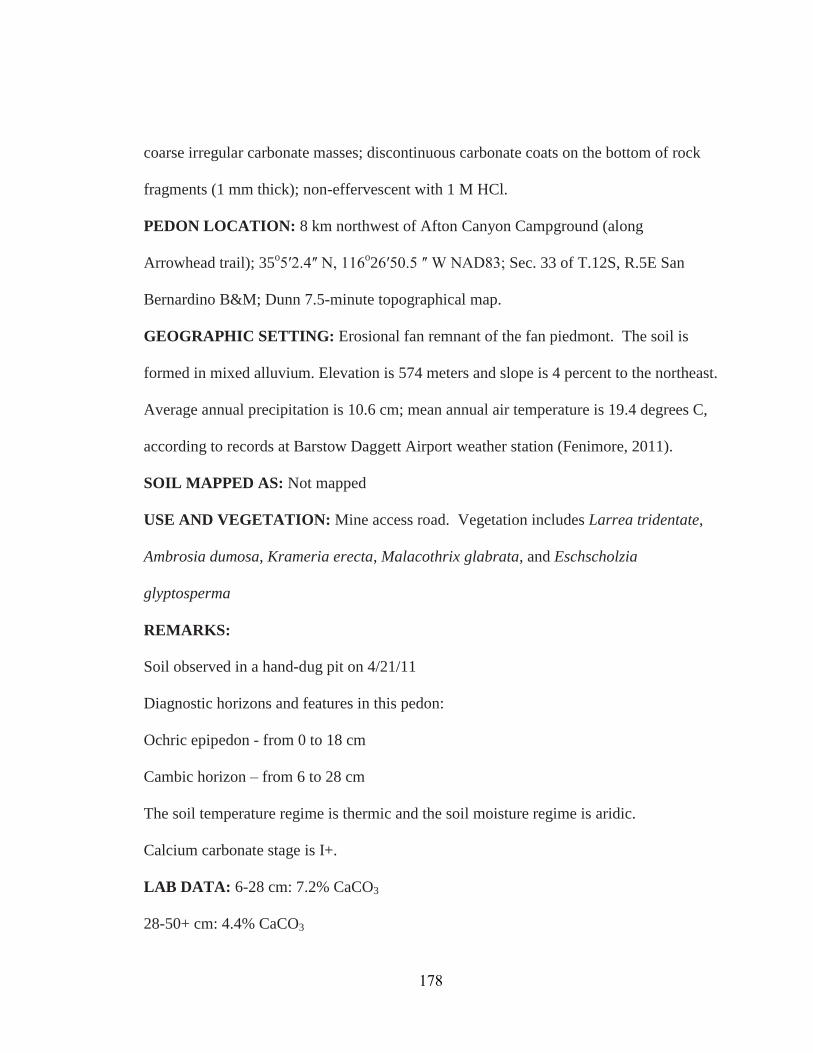
coarse irregular carbonate masses; discontinuous carbonate coats on the bottom of rock
fragments (1 mm thick); non-effervescent with 1 M HCl.
PEDON LOCATION: 8 km northwest of Afton Canyon Campground (along
Arrowhead trail); 35o5ʹ2.4ʺ N, 116o26ʹ50.5 ʺ W NAD83; Sec. 33 of T.12S, R.5E San
Bernardino B&M; Dunn 7.5-minute topographical map.
GEOGRAPHIC SETTING: Erosional fan remnant of the fan piedmont. The soil is
formed in mixed alluvium. Elevation is 574 meters and slope is 4 percent to the northeast.
Average annual precipitation is 10.6 cm; mean annual air temperature is 19.4 degrees C,
according to records at Barstow Daggett Airport weather station (Fenimore, 2011).
SOIL MAPPED AS: Not mapped
USE AND VEGETATION: Mine access road. Vegetation includes Larrea tridentate,
Ambrosia dumosa, Krameria erecta, Malacothrix glabrata, and Eschscholzia
glyptosperma
REMARKS:
Soil observed in a hand-dug pit on 4/21/11
Diagnostic horizons and features in this pedon:
Ochric epipedon - from 0 to 18 cm
Cambic horizon – from 6 to 28 cm
The soil temperature regime is thermic and the soil moisture regime is aridic.
Calcium carbonate stage is I+.
LAB DATA: 6-28 cm: 7.2% CaCO3
28-50+ cm: 4.4% CaCO3
178
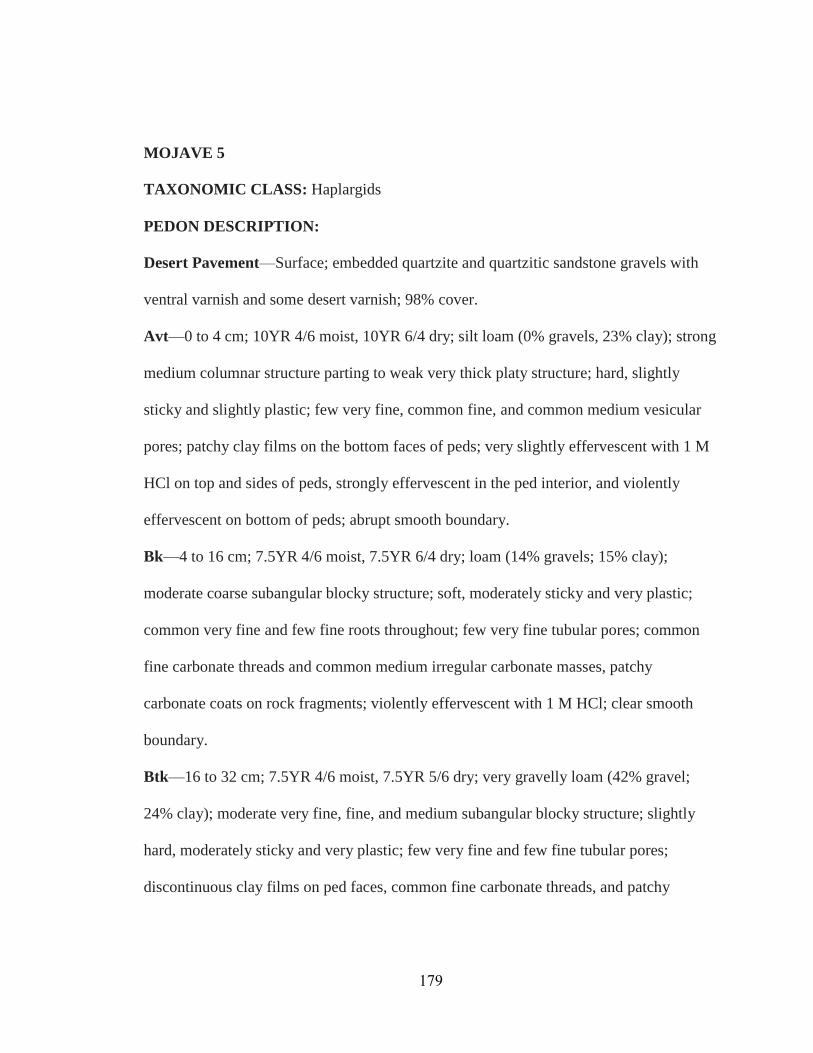
MOJAVE 5
TAXONOMIC CLASS: Haplargids
PEDON DESCRIPTION:
Desert Pavement—Surface; embedded quartzite and quartzitic sandstone gravels with
ventral varnish and some desert varnish; 98% cover.
Avt—0 to 4 cm; 10YR 4/6 moist, 10YR 6/4 dry; silt loam (0% gravels, 23% clay); strong
medium columnar structure parting to weak very thick platy structure; hard, slightly
sticky and slightly plastic; few very fine, common fine, and common medium vesicular
pores; patchy clay films on the bottom faces of peds; very slightly effervescent with 1 M
HCl on top and sides of peds, strongly effervescent in the ped interior, and violently
effervescent on bottom of peds; abrupt smooth boundary.
Bk—4 to 16 cm; 7.5YR 4/6 moist, 7.5YR 6/4 dry; loam (14% gravels; 15% clay);
moderate coarse subangular blocky structure; soft, moderately sticky and very plastic;
common very fine and few fine roots throughout; few very fine tubular pores; common
fine carbonate threads and common medium irregular carbonate masses, patchy
carbonate coats on rock fragments; violently effervescent with 1 M HCl; clear smooth
boundary.
Btk—16 to 32 cm; 7.5YR 4/6 moist, 7.5YR 5/6 dry; very gravelly loam (42% gravel;
24% clay); moderate very fine, fine, and medium subangular blocky structure; slightly
hard, moderately sticky and very plastic; few very fine and few fine tubular pores;
discontinuous clay films on ped faces, common fine carbonate threads, and patchy
179
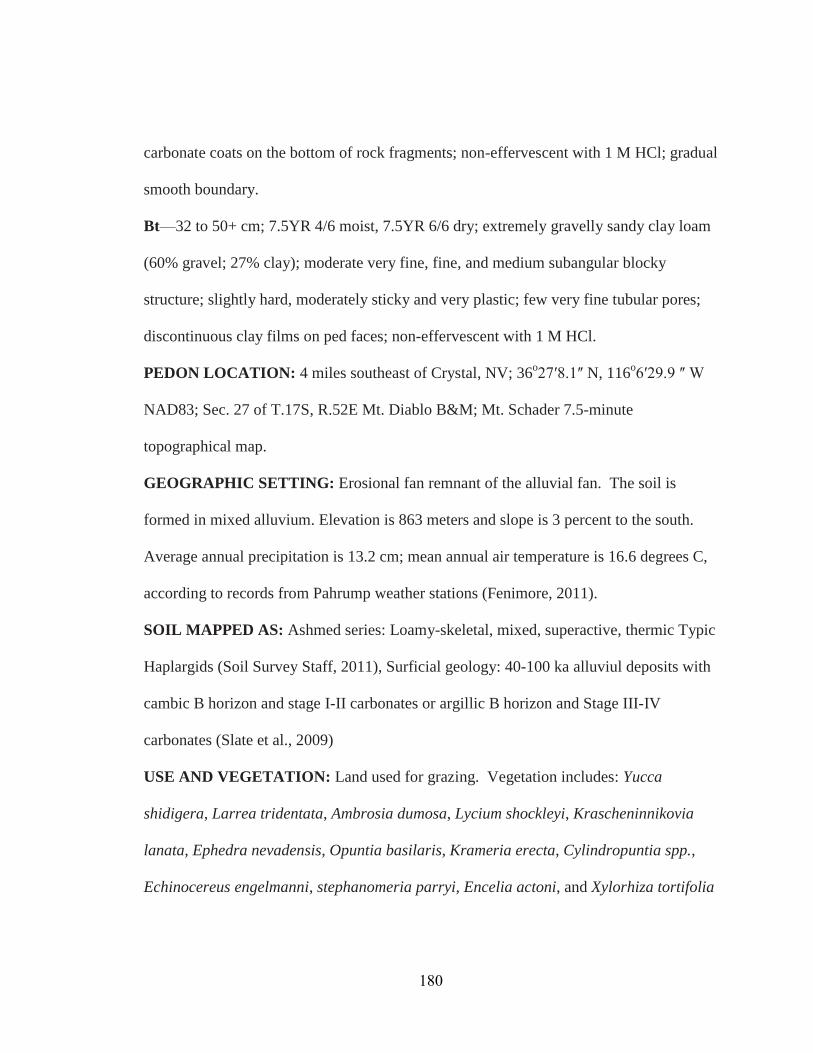
carbonate coats on the bottom of rock fragments; non-effervescent with 1 M HCl; gradual
smooth boundary.
Bt—32 to 50+ cm; 7.5YR 4/6 moist, 7.5YR 6/6 dry; extremely gravelly sandy clay loam
(60% gravel; 27% clay); moderate very fine, fine, and medium subangular blocky
structure; slightly hard, moderately sticky and very plastic; few very fine tubular pores;
discontinuous clay films on ped faces; non-effervescent with 1 M HCl.
PEDON LOCATION: 4 miles southeast of Crystal, NV; 36o27ʹ8.1ʺ N, 116o6ʹ29.9 ʺ W
NAD83; Sec. 27 of T.17S, R.52E Mt. Diablo B&M; Mt. Schader 7.5-minute
topographical map.
GEOGRAPHIC SETTING: Erosional fan remnant of the alluvial fan. The soil is
formed in mixed alluvium. Elevation is 863 meters and slope is 3 percent to the south.
Average annual precipitation is 13.2 cm; mean annual air temperature is 16.6 degrees C,
according to records from Pahrump weather stations (Fenimore, 2011).
SOIL MAPPED AS: Ashmed series: Loamy-skeletal, mixed, superactive, thermic Typic
Haplargids (Soil Survey Staff, 2011), Surficial geology: 40-100 ka alluviul deposits with
cambic B horizon and stage I-II carbonates or argillic B horizon and Stage III-IV
carbonates (Slate et al., 2009)
USE AND VEGETATION: Land used for grazing. Vegetation includes: Yucca
shidigera, Larrea tridentata, Ambrosia dumosa, Lycium shockleyi, Krascheninnikovia
lanata, Ephedra nevadensis, Opuntia basilaris, Krameria erecta, Cylindropuntia spp.,
Echinocereus engelmanni, stephanomeria parryi, Encelia actoni, and Xylorhiza tortifolia
180
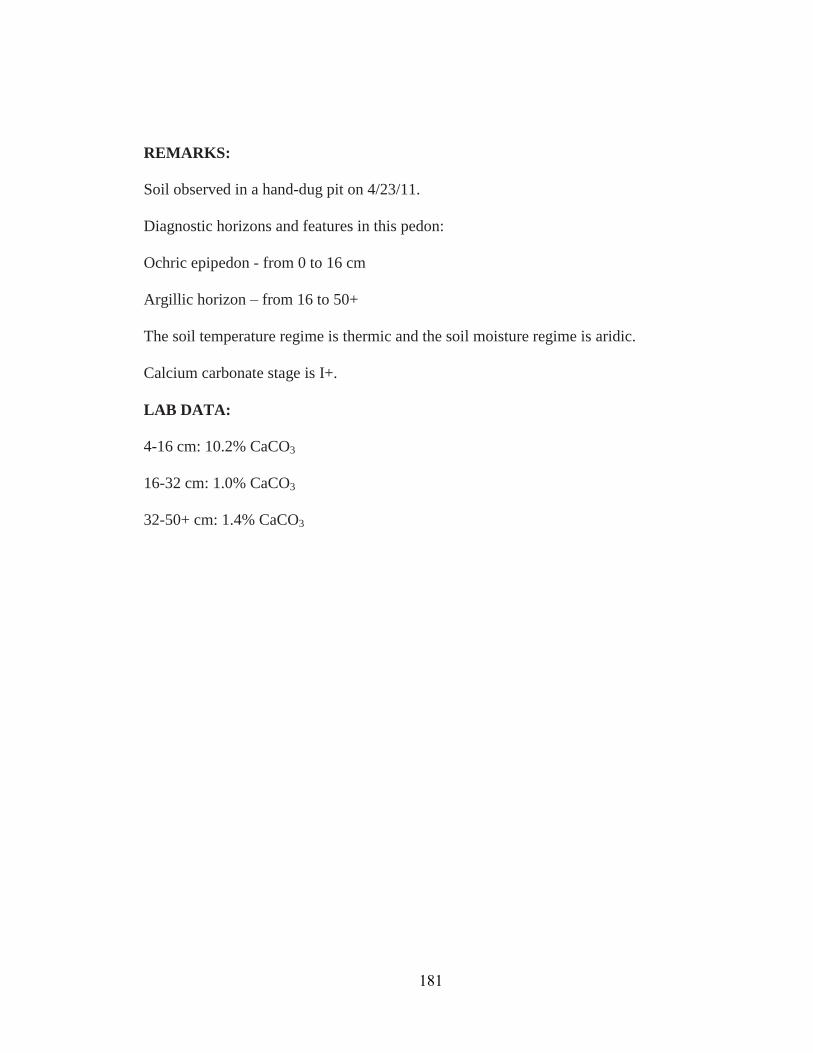
REMARKS:
Soil observed in a hand-dug pit on 4/23/11.
Diagnostic horizons and features in this pedon:
Ochric epipedon - from 0 to 16 cm
Argillic horizon – from 16 to 50+
The soil temperature regime is thermic and the soil moisture regime is aridic.
Calcium carbonate stage is I+.
LAB DATA:
4-16 cm: 10.2% CaCO3
16-32 cm: 1.0% CaCO3
32-50+ cm: 1.4% CaCO3
181
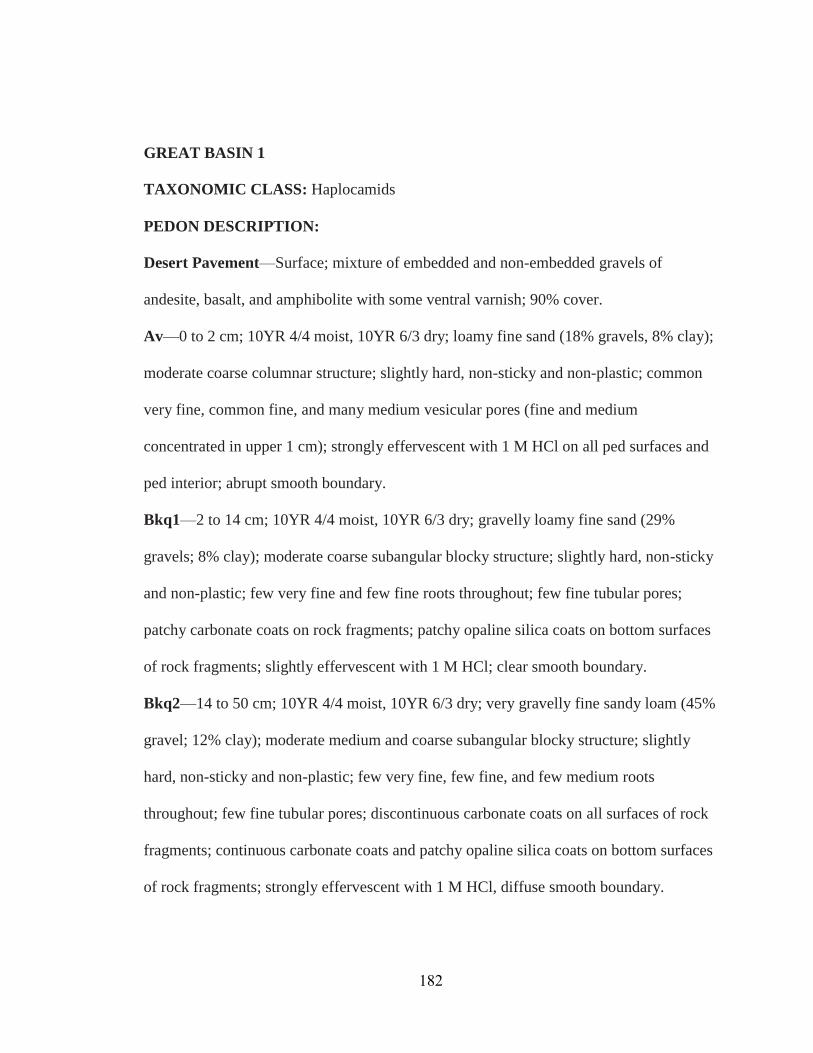
GREAT BASIN 1
TAXONOMIC CLASS: Haplocamids
PEDON DESCRIPTION:
Desert Pavement—Surface; mixture of embedded and non-embedded gravels of
andesite, basalt, and amphibolite with some ventral varnish; 90% cover.
Av—0 to 2 cm; 10YR 4/4 moist, 10YR 6/3 dry; loamy fine sand (18% gravels, 8% clay);
moderate coarse columnar structure; slightly hard, non-sticky and non-plastic; common
very fine, common fine, and many medium vesicular pores (fine and medium
concentrated in upper 1 cm); strongly effervescent with 1 M HCl on all ped surfaces and
ped interior; abrupt smooth boundary.
Bkq1—2 to 14 cm; 10YR 4/4 moist, 10YR 6/3 dry; gravelly loamy fine sand (29%
gravels; 8% clay); moderate coarse subangular blocky structure; slightly hard, non-sticky
and non-plastic; few very fine and few fine roots throughout; few fine tubular pores;
patchy carbonate coats on rock fragments; patchy opaline silica coats on bottom surfaces
of rock fragments; slightly effervescent with 1 M HCl; clear smooth boundary.
Bkq2—14 to 50 cm; 10YR 4/4 moist, 10YR 6/3 dry; very gravelly fine sandy loam (45%
gravel; 12% clay); moderate medium and coarse subangular blocky structure; slightly
hard, non-sticky and non-plastic; few very fine, few fine, and few medium roots
throughout; few fine tubular pores; discontinuous carbonate coats on all surfaces of rock
fragments; continuous carbonate coats and patchy opaline silica coats on bottom surfaces
of rock fragments; strongly effervescent with 1 M HCl, diffuse smooth boundary.
182
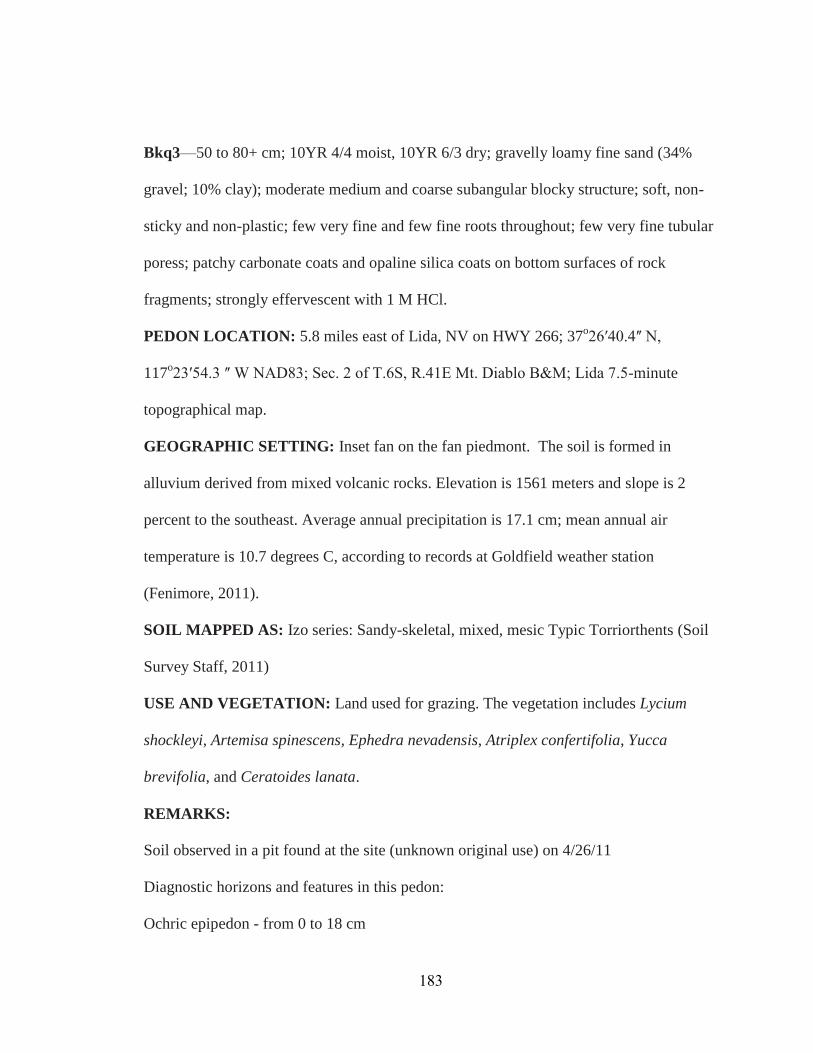
Bkq3—50 to 80+ cm; 10YR 4/4 moist, 10YR 6/3 dry; gravelly loamy fine sand (34%
gravel; 10% clay); moderate medium and coarse subangular blocky structure; soft, non-
sticky and non-plastic; few very fine and few fine roots throughout; few very fine tubular
poress; patchy carbonate coats and opaline silica coats on bottom surfaces of rock
fragments; strongly effervescent with 1 M HCl.
PEDON LOCATION: 5.8 miles east of Lida, NV on HWY 266; 37o26ʹ40.4ʺ N,
117o23ʹ54.3 ʺ W NAD83; Sec. 2 of T.6S, R.41E Mt. Diablo B&M; Lida 7.5-minute
topographical map.
GEOGRAPHIC SETTING: Inset fan on the fan piedmont. The soil is formed in
alluvium derived from mixed volcanic rocks. Elevation is 1561 meters and slope is 2
percent to the southeast. Average annual precipitation is 17.1 cm; mean annual air
temperature is 10.7 degrees C, according to records at Goldfield weather station
(Fenimore, 2011).
SOIL MAPPED AS: Izo series: Sandy-skeletal, mixed, mesic Typic Torriorthents (Soil
Survey Staff, 2011)
USE AND VEGETATION: Land used for grazing. The vegetation includes Lycium
shockleyi, Artemisa spinescens, Ephedra nevadensis, Atriplex confertifolia, Yucca
brevifolia, and Ceratoides lanata.
REMARKS:
Soil observed in a pit found at the site (unknown original use) on 4/26/11
Diagnostic horizons and features in this pedon:
Ochric epipedon - from 0 to 18 cm
183
Cambic horizon – from 14-50 cm
The soil temperature regime is mesic and the soil moisture regime is aridic.
Calcium carbonate stage is I.
LAB DATA:
2-14 cm: 7.6% CaCO3
14-50 cm: 8.0% CaCO3
50-80+ cm: 8.4% CaCO3
184
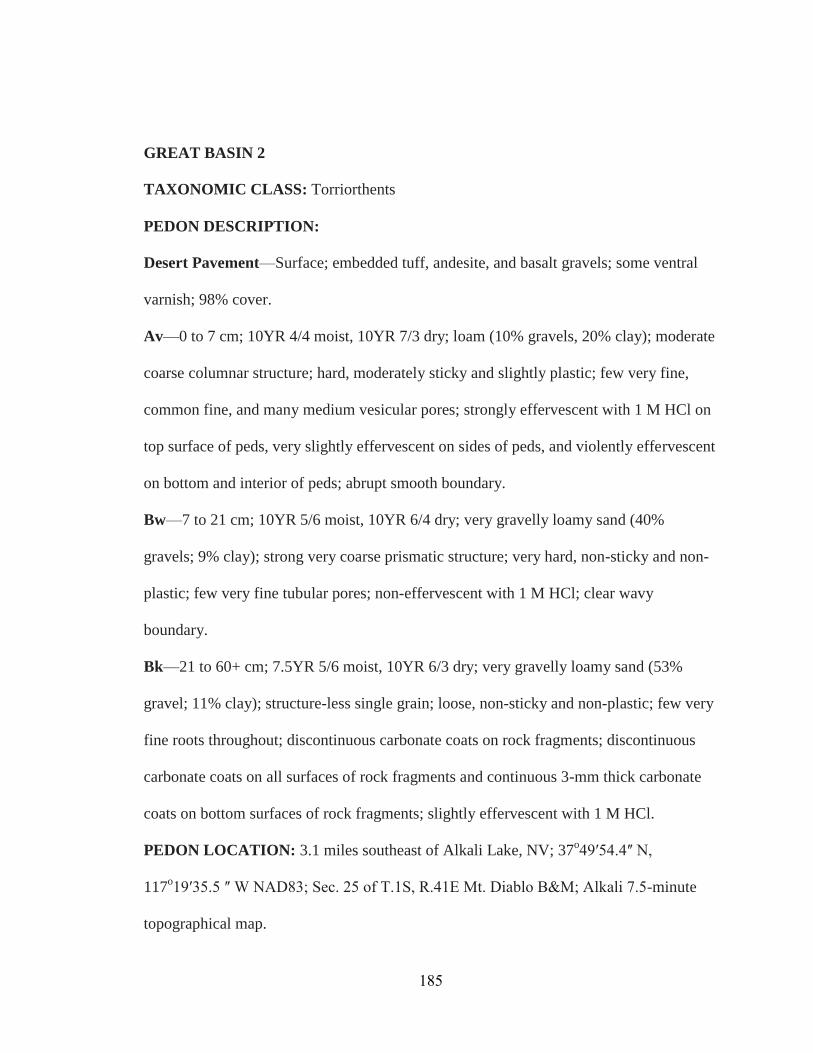
GREAT BASIN 2
TAXONOMIC CLASS: Torriorthents
PEDON DESCRIPTION:
Desert Pavement—Surface; embedded tuff, andesite, and basalt gravels; some ventral
varnish; 98% cover.
Av—0 to 7 cm; 10YR 4/4 moist, 10YR 7/3 dry; loam (10% gravels, 20% clay); moderate
coarse columnar structure; hard, moderately sticky and slightly plastic; few very fine,
common fine, and many medium vesicular pores; strongly effervescent with 1 M HCl on
top surface of peds, very slightly effervescent on sides of peds, and violently effervescent
on bottom and interior of peds; abrupt smooth boundary.
Bw—7 to 21 cm; 10YR 5/6 moist, 10YR 6/4 dry; very gravelly loamy sand (40%
gravels; 9% clay); strong very coarse prismatic structure; very hard, non-sticky and non-
plastic; few very fine tubular pores; non-effervescent with 1 M HCl; clear wavy
boundary.
Bk—21 to 60+ cm; 7.5YR 5/6 moist, 10YR 6/3 dry; very gravelly loamy sand (53%
gravel; 11% clay); structure-less single grain; loose, non-sticky and non-plastic; few very
fine roots throughout; discontinuous carbonate coats on rock fragments; discontinuous
carbonate coats on all surfaces of rock fragments and continuous 3-mm thick carbonate
coats on bottom surfaces of rock fragments; slightly effervescent with 1 M HCl.
PEDON LOCATION: 3.1 miles southeast of Alkali Lake, NV; 37o49ʹ54.4ʺ N,
117o19ʹ35.5 ʺ W NAD83; Sec. 25 of T.1S, R.41E Mt. Diablo B&M; Alkali 7.5-minute
topographical map.
185
GEOGRAPHIC SETTING: Erosional fan remnant of the fan piedmont. The soil is
formed in alluvium derived from mixed volcanic rocks. Elevation is 1512 meters and
slope is 2 percent to the northwest. Average annual precipitation is 14.8 cm; mean annual
air temperature is 11.0 degrees C, according to records at Tonopah weather station
(Fenimore, 2011).
SOIL MAPPED AS: Unsel benchmark series: Fine-loamy, mixed, superactive, mesic
Durinodic Haplargids (Soil Survey Staff, 2011)
USE AND VEGETATION: Land used for grazing. Vegetation includes Sacrobatus
vermiculatus, Lycium shockleyi, Artemisa spinescens, Atriplex confertifolia, Ceratoides
lanata, Sacrobatus baileyi, Ephedra nevadensis, and Tetradymia glabrata.
REMARKS:
Soil observed in a hand-dug pit on 4/26/11
Diagnostic horizons and features in this pedon:
Ochric epipedon - from 0 to 18 cm
The soil temperature regime is mesic and the soil moisture regime is aridic.
Calcium carbonate stage is I.
LAB DATA:
21-60+ cm: 4.4% CaCO3
186
GREAT BASIN 3
TAXONOMIC CLASS: Haplocambids
PEDON DESCRIPTION:
Desert Pavement—Surface; embedded tuff, andesite, and rhyolite gravels; ventral
varnish and desert varnish; 95% cover.
Av—0 to 6 cm; 10YR 6/4 moist, 10YR 7/3 dry; clay loam (3% gravels, 30% clay);
moderate medium columnar structure; hard, slightly sticky and moderately plastic; few
very fine, common fine, and few medium vesicular pores and many medium vughs;
collapsed vesicles in the bottom 2 cm of the horizon; patchy clay films on the bottom
faces of peds; violently effervescent with 1 M HCl on top and sides of peds, strongly
effervescent in the ped interior, and slightly effervescent on bottom of peds; abrupt
smooth boundary.
Bq—6 to 21 cm; 10YR 5/6 moist, 10YR 6/4 dry; gravelly sandy loam (31% gravels; 18%
clay); moderate fine, medium, and coarse subangular blocky structure; slightly hard,
slightly sticky and moderately plastic; few very fine, few fine, and common medium
roots throughout; few very fine tubular pores; few coarse spherical durinodes; slightly
effervescent with 1 M HCl; gradual wavy boundary.
Bk—21 to 58+ cm; 10YR 5/6 moist, 10YR 7/3 dry; very gravelly loamy sand (41%
gravel; 4% clay); weak fine and medium subangular blocky structure; soft, non-sticky
and non-plastic; few very fine and few fine roots throughout; few very fine tubular pores;
few medium spherical carbonate nodules; discontinuous carbonate coats on bottom
surfaces of rock fragments; violently effervescent with 1 M HCl.
187
PEDON LOCATION: 6.8 miles southwest of Tonopah, NV along powerline road;
37o58ʹ32.1ʺ N, 117o16ʹ43.4 ʺ W NAD83; Sec. 32 of T.2N, R.42E Mt. Diablo B&M;
Klondike 7.5-minute topographical map.
GEOGRAPHIC SETTING: Erosional fan remnant of the fan piedmont. The soil is
formed in alluvium derived from mixed volcanic rocks. Elevation is 1626 meters and
slope is 4 percent to the southwest. Average annual precipitation is 14.8 cm; mean annual
air temperature is 11.0 degrees C, according to records form Tonopah weather station
(Fenimore, 2011).
SOIL MAPPED AS: Unsel benchmark series: Fine-loamy, mixed, superactive, mesic
Durinodic Haplargids (Soil Survey Staff, 2011).
USE AND VEGETATION: Land used for grazing. Vegetation includes Ephedra
nevadensis, Artemisa spinescens, Sacrobatus vermiculatus, Lycium shockleyi, Sacrobatus
baileyi.
REMARKS:
Soil observed in a hand-dug pit on 4/24/11
Diagnostic horizons and features in this pedon:
Ochric epipedon - from 0 to 18 cm
Cambic horizon – from 6 to 21 cm
The soil temperature regime is mesic and the soil moisture regime is aridic.
Calcium carbonate stage is II.
LAB DATA:
21-58+ cm: 12.9% CaCO3
188
GREAT BASIN 4
TAXONOMIC CLASS: Haplargids
PEDON DESCRIPTION:
Desert Pavement—Surface; embedded gravels of andesite, tuff, and basalt with desert
varnish and ventral varnish; 98% cover.
Av—0 to 3 cm; 10YR 5/4 moist, 10YR 7/3 dry; silt loam (5% gravels, 20% clay); strong
medium prismatic structure parting to moderate thick platy and weak medium platy
structure; hard, moderately sticky and moderately plastic; common very fine, common
fine, and many medium vesicular pores; many medium vughs; non-effervescent with 1 M
HCl (ped sides) to slightly effervescent with 1 M HCl (ped top and interior); abrupt
smooth boundary.
Avq—3 to 7 cm; 10YR 5/4 moist, 10YR 6/3 dry; silty clay loam (10% gravels; 35%
clay); strong medium prismatic structure parting to moderate thick platy and weak
medium platy structure; very hard, moderately sticky and moderately plastic; common
very fine and few fine vesicular pores; continuous opaline silica coats on ped faces;
strongly effervescent with 1 M HCl (ped bottoms); abrupt smooth boundary.
Bzyq/Bt—7 to 22 cm; 7.5YR 4/4 moist, 10YR 6/4 dry; gravelly fine sandy loam (22%
gravel; 10% clay); moderate very fine, fine, medium, and coarse subangular blocky
structure; slightly hard, slightly sticky and slightly plastic; common very fine and few
fine roots throughout; discontinuous opaline silica coats on ped faces; common coarse
gypsum or soluble salt masses beneath rock fragments; continuous clay films on ped
189
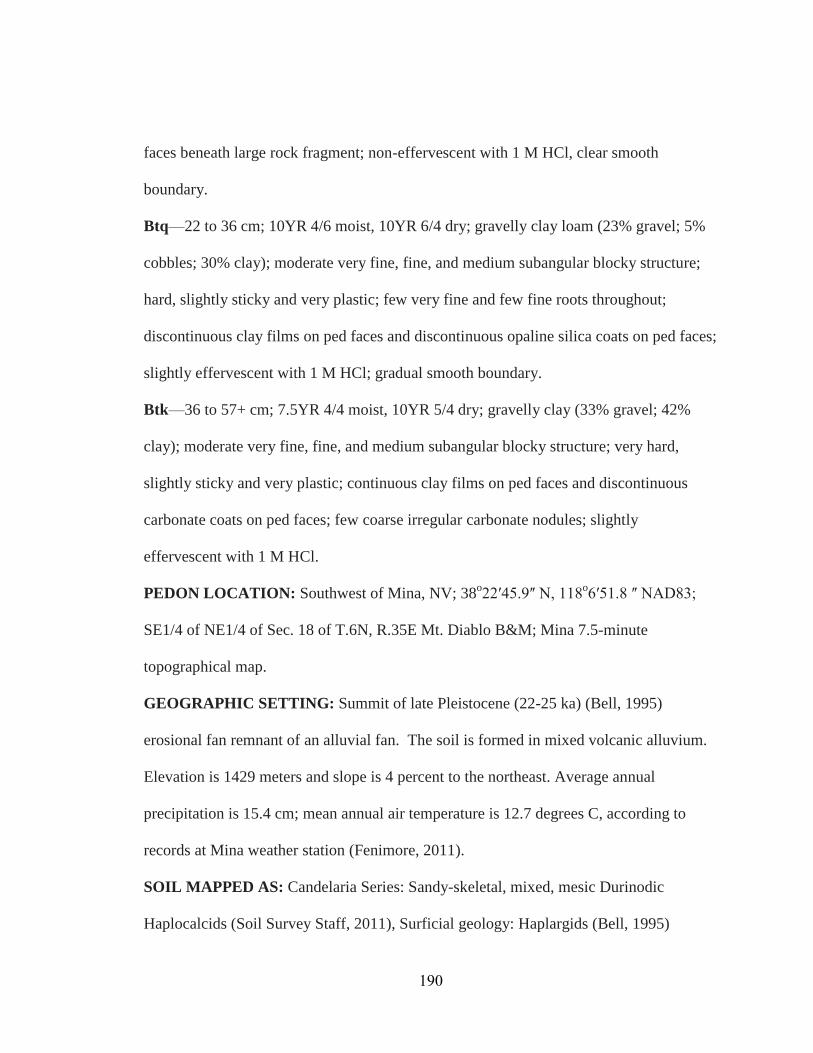
faces beneath large rock fragment; non-effervescent with 1 M HCl, clear smooth
boundary.
Btq—22 to 36 cm; 10YR 4/6 moist, 10YR 6/4 dry; gravelly clay loam (23% gravel; 5%
cobbles; 30% clay); moderate very fine, fine, and medium subangular blocky structure;
hard, slightly sticky and very plastic; few very fine and few fine roots throughout;
discontinuous clay films on ped faces and discontinuous opaline silica coats on ped faces;
slightly effervescent with 1 M HCl; gradual smooth boundary.
Btk—36 to 57+ cm; 7.5YR 4/4 moist, 10YR 5/4 dry; gravelly clay (33% gravel; 42%
clay); moderate very fine, fine, and medium subangular blocky structure; very hard,
slightly sticky and very plastic; continuous clay films on ped faces and discontinuous
carbonate coats on ped faces; few coarse irregular carbonate nodules; slightly
effervescent with 1 M HCl.
PEDON LOCATION: Southwest of Mina, NV; 38o22ʹ45.9ʺ N, 118o6ʹ51.8 ʺ NAD83;
SE1/4 of NE1/4 of Sec. 18 of T.6N, R.35E Mt. Diablo B&M; Mina 7.5-minute
topographical map.
GEOGRAPHIC SETTING: Summit of late Pleistocene (22-25 ka) (Bell, 1995)
erosional fan remnant of an alluvial fan. The soil is formed in mixed volcanic alluvium.
Elevation is 1429 meters and slope is 4 percent to the northeast. Average annual
precipitation is 15.4 cm; mean annual air temperature is 12.7 degrees C, according to
records at Mina weather station (Fenimore, 2011).
SOIL MAPPED AS: Candelaria Series: Sandy-skeletal, mixed, mesic Durinodic
Haplocalcids (Soil Survey Staff, 2011), Surficial geology: Haplargids (Bell, 1995)
190
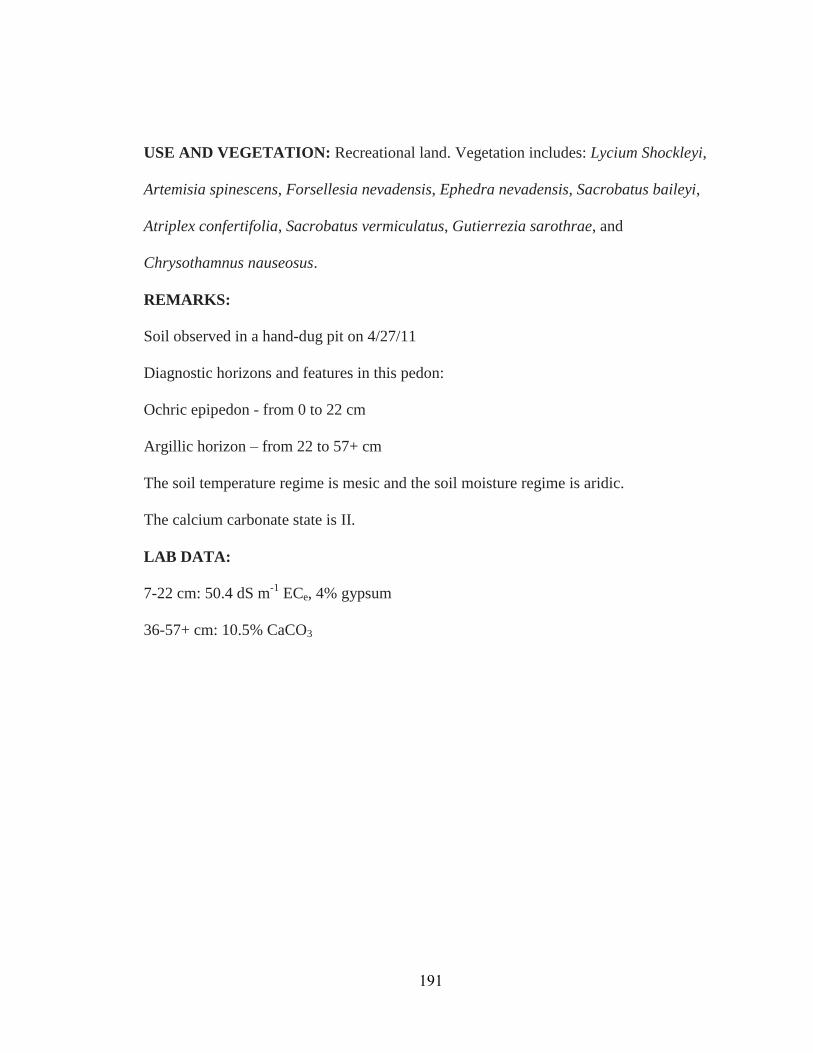
USE AND VEGETATION: Recreational land. Vegetation includes: Lycium Shockleyi,
Artemisia spinescens, Forsellesia nevadensis, Ephedra nevadensis, Sacrobatus baileyi,
Atriplex confertifolia, Sacrobatus vermiculatus, Gutierrezia sarothrae, and
Chrysothamnus nauseosus.
REMARKS:
Soil observed in a hand-dug pit on 4/27/11
Diagnostic horizons and features in this pedon:
Ochric epipedon - from 0 to 22 cm
Argillic horizon – from 22 to 57+ cm
The soil temperature regime is mesic and the soil moisture regime is aridic.
The calcium carbonate state is II.
LAB DATA:
7-22 cm: 50.4 dS m-1 ECe, 4% gypsum
36-57+ cm: 10.5% CaCO3
191
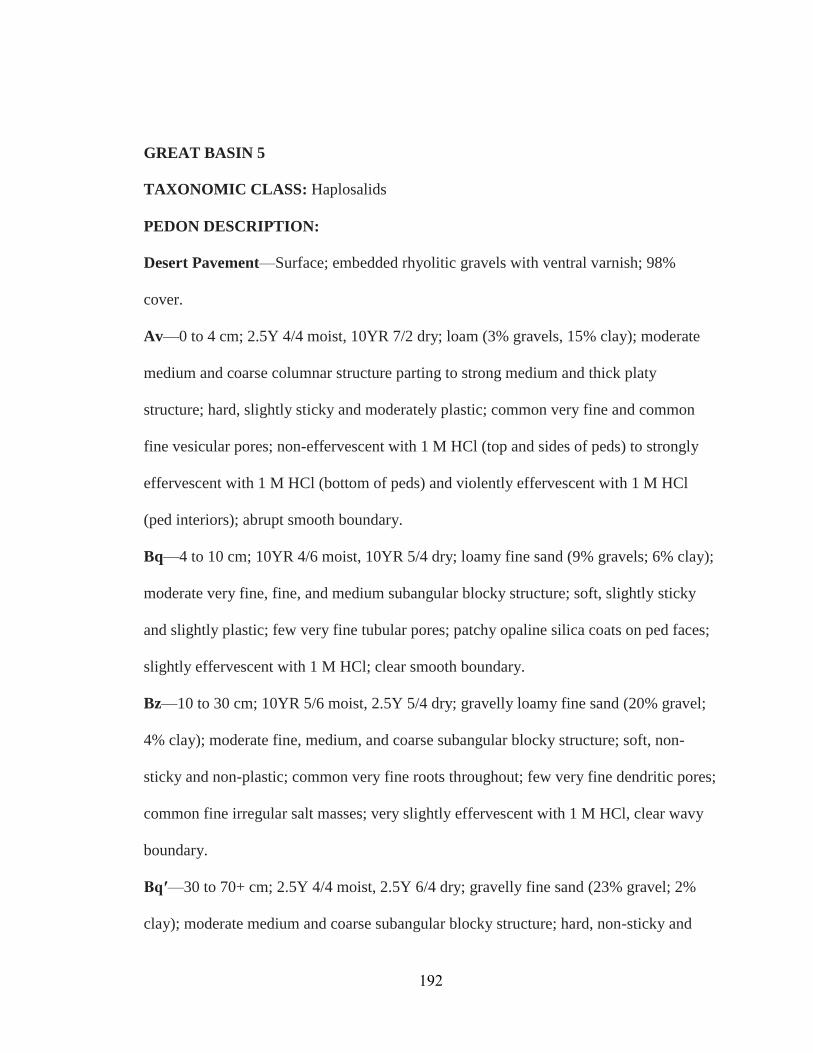
GREAT BASIN 5
TAXONOMIC CLASS: Haplosalids
PEDON DESCRIPTION:
Desert Pavement—Surface; embedded rhyolitic gravels with ventral varnish; 98%
cover.
Av—0 to 4 cm; 2.5Y 4/4 moist, 10YR 7/2 dry; loam (3% gravels, 15% clay); moderate
medium and coarse columnar structure parting to strong medium and thick platy
structure; hard, slightly sticky and moderately plastic; common very fine and common
fine vesicular pores; non-effervescent with 1 M HCl (top and sides of peds) to strongly
effervescent with 1 M HCl (bottom of peds) and violently effervescent with 1 M HCl
(ped interiors); abrupt smooth boundary.
Bq—4 to 10 cm; 10YR 4/6 moist, 10YR 5/4 dry; loamy fine sand (9% gravels; 6% clay);
moderate very fine, fine, and medium subangular blocky structure; soft, slightly sticky
and slightly plastic; few very fine tubular pores; patchy opaline silica coats on ped faces;
slightly effervescent with 1 M HCl; clear smooth boundary.
Bz—10 to 30 cm; 10YR 5/6 moist, 2.5Y 5/4 dry; gravelly loamy fine sand (20% gravel;
4% clay); moderate fine, medium, and coarse subangular blocky structure; soft, non-
sticky and non-plastic; common very fine roots throughout; few very fine dendritic pores;
common fine irregular salt masses; very slightly effervescent with 1 M HCl, clear wavy
boundary.
Bqʹ—30 to 70+ cm; 2.5Y 4/4 moist, 2.5Y 6/4 dry; gravelly fine sand (23% gravel; 2%
clay); moderate medium and coarse subangular blocky structure; hard, non-sticky and
192
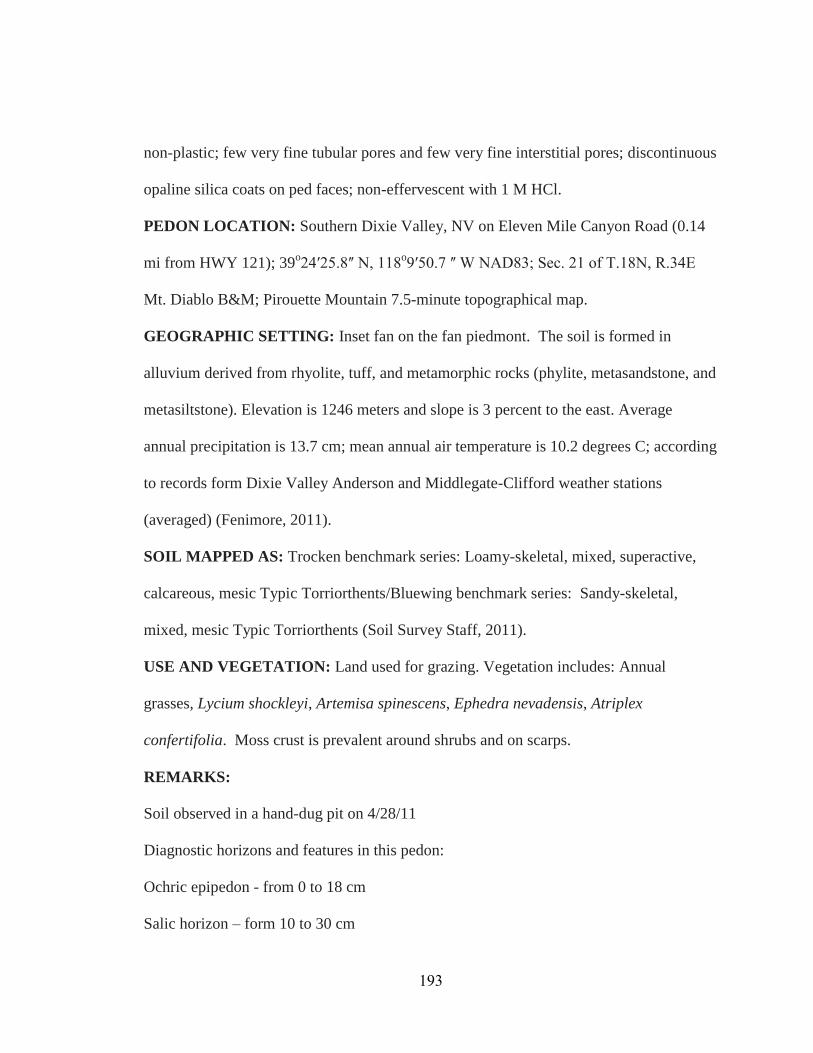
non-plastic; few very fine tubular pores and few very fine interstitial pores; discontinuous
opaline silica coats on ped faces; non-effervescent with 1 M HCl.
PEDON LOCATION: Southern Dixie Valley, NV on Eleven Mile Canyon Road (0.14
mi from HWY 121); 39o24ʹ25.8ʺ N, 118o9ʹ50.7 ʺ W NAD83; Sec. 21 of T.18N, R.34E
Mt. Diablo B&M; Pirouette Mountain 7.5-minute topographical map.
GEOGRAPHIC SETTING: Inset fan on the fan piedmont. The soil is formed in
alluvium derived from rhyolite, tuff, and metamorphic rocks (phylite, metasandstone, and
metasiltstone). Elevation is 1246 meters and slope is 3 percent to the east. Average
annual precipitation is 13.7 cm; mean annual air temperature is 10.2 degrees C; according
to records form Dixie Valley Anderson and Middlegate-Clifford weather stations
(averaged) (Fenimore, 2011).
SOIL MAPPED AS: Trocken benchmark series: Loamy-skeletal, mixed, superactive,
calcareous, mesic Typic Torriorthents/Bluewing benchmark series: Sandy-skeletal,
mixed, mesic Typic Torriorthents (Soil Survey Staff, 2011).
USE AND VEGETATION: Land used for grazing. Vegetation includes: Annual
grasses, Lycium shockleyi, Artemisa spinescens, Ephedra nevadensis, Atriplex
confertifolia. Moss crust is prevalent around shrubs and on scarps.
REMARKS:
Soil observed in a hand-dug pit on 4/28/11
Diagnostic horizons and features in this pedon:
Ochric epipedon - from 0 to 18 cm
Salic horizon – form 10 to 30 cm
193

The soil temperature regime is mesic and the soil moisture regime is aridic.
LAB DATA:
10-30 cm: 79.2 dS m-1 ECe, <1% gypsum
194
REFERENCES
Bell, 1995. Quaternary geologic map of the Mina quadrangle, NV. Nevada Bureau of Mines and Geology, Reno, NV.
Fenimore, C. 2011. NCDC: Locate Weather Observation Station Record. Available at
http://www.ncdc.noaa.gov/oa/climate/stationlocator.html (verified 15 Jan. 2012). Natl. Oceanic and Atmospheric Administration, Natl. Climatic Data Cent., Ashville, NC.
Slate, J.L., M.E. Berry, and C.M. Menges. 2009. Surficial geologic map of the Death
Valley Junction 30' x 60' quadrangle, California and Nevada. USGS, Reston, VA. Soil Survey Staff, 2011. Web Soil Survey. Available at
http://websoilsurvey.nrcs.usda.gov (verified 24 Sept. 2011). USDA-NRCS, Washington, DC.
Western Regional Climate Cent. 2011. RAWS USA climate archive. Available at
<http://www.raws.dri.edu/> (accessed 15 Jan. 2012). Desert Research Institute, Reno, NV.
195

APPENDIX B. DERIVATION OF VOLUMETRIC LOBATION RATIO
FORMULA (EQ. 3.1)
The volumetric lobation ratio (LRv) is defined as the ratio between the surface area of a
sphere, with a volume equal to the measured volume of the pore, and the measured surface area.
The formula can be derived starting with:
(1) The volume of a sphere (Vs):
(2) The surface area of a sphere (Ss):
First, solve both equations for radius (r) and set them equal to each other:
Second, solve for Ss:
Finally, calculate LRv by dividing the Ss, calculated using the measured volume (V), by measured
surface area (S):
196
Copyright © 2022 FDOKUMEN

