


Bahasa
Halaman
Hukum

Accepted Manuscript
Title: Trends in the prescription of antidiabetic medicationsfrom 2009 to 2012 in a ge<!–<query id="Q1">Please checkthe short title that has been created, or suggest an alternative offewer than 80 characters includingspaces.</query>–><!–<RunningTitle>Trends in theprescription of antidiabetic medications from 2009 to 2012 ina ge</RunningTitle>–>neral practice of Southern Italy: Apopulation-based study
Author: Concetta Rafaniello Vincenzo Arcoraci CarmenFerrajolo Liberata Sportiello Maria Giuseppa Sullo FrancescoGiorgianni Gianluca Trifiro Michele Tari Achille P. CaputiFrancesco Rossi Katherine Esposito Dario Giugliano AnnalisaCapuano
PII: S0168-8227(15)00006-6DOI: http://dx.doi.org/doi:10.1016/j.diabres.2014.12.007Reference: DIAB 6245
To appear in: Diabetes Research and Clinical Practice
Received date: 8-5-2014Revised date: 17-10-2014Accepted date: 29-12-2014
Please cite this article as: C. Rafaniello, V. Arcoraci, C. Ferrajolo, L. Sportiello, M.G.Sullo, F. Giorgianni, G. Trifiro, M. Tari, A.P. Caputi, F. Rossi, K. Esposito, D. Giugliano,A. Capuano, Trends in the prescription of antidiabetic medications from 2009 to 2012in a general practice of Southern Italy: A population-based study, Diabetes Researchand Clinical Practice (2015), http://dx.doi.org/10.1016/j.diabres.2014.12.007
This is a PDF file of an unedited manuscript that has been accepted for publication.As a service to our customers we are providing this early version of the manuscript.The manuscript will undergo copyediting, typesetting, and review of the resulting proofbefore it is published in its final form. Please note that during the production processerrors may be discovered which could affect the content, and all legal disclaimers thatapply to the journal pertain.
Page 1 of 15
Accep
ted
Man
uscr
ipt
1
Trends in the prescription of antidiabetic medications from 2009 to 2012 in a general practice 1
of Southern Italy: A population-based study 2
Concetta Rafanielloa, Vincenzo Arcoraci
b, Carmen Ferrajolo
a, Liberata Sportiello
a, Maria Giuseppa 3
Sulloa, Francesco Giorgianni
b, Gianluca Trifirò
b, Michele Tari
c, Achille P. Caputi
b, Francesco 4
Rossia, Katherine Esposito
d, Dario Giugliano
e, Annalisa Capuano
a,*. 5
aRegional Centre of Pharmacosurveillance and Pharmacoepidemiology, Department of 6
Experimental Medicine, Second University of Naples, via de Crecchio 7 - 80138 Naples, Italy 7
bDepartment of Clinical and Experimental Medicine and Pharmacology, Pharmacology Unit, 8
University of Messina, Via Consolare Valeria-Gazzi, 98125 Messina, Italy 9
cCaserta-1 Local Health Service, Caserta, Italy 10
dDepartment of Clinical and Experimental Medicine and Surgery, Second University of Naples, 11
Naples, Italy 12
eDepartment of Medical, Surgical, Neurological, Metabolic Sciences, and Geriatrics, Second 13
University of Naples, Naples, Italy 14
Correspondence: Annalisa Capuano, Regional Centre of Pharmacosurveillance and 15
Pharmacoepidemiology, Department of Experimental Medicine, Second University of Naples, via 16
de Crecchio 7 - 80138 Naples, Italy 17
Tel/FAX +39 081 5667669; email [email protected] 18
Shortened title: Trends in antidiabetic medications 19
2795 words text only; 758 words references; Abstract: 330 words; Figures 2, Tables 3 20
The Authors declare they have no conflict of interest 21
ABSTRACT 22
Objective: To assess the prescribing pattern of antidiabetic drugs (AD) in a general practice of 23
Southern Italy from 2009 to 2012, with focus on behavior prescribing changes. Methods: This 24
retrospective, drug utilization study was conducted using administrative databases of the Local 25
Health Unit of Caserta (Southern Italy) including about 1 million citizens. The standardized 26
prevalence of AD use was calculated within each study year. A sample cohort of 78,789 subjects 27
with at least one prescription of AD was identified during the study period. Results: There was an 28
overall increase of the proportion of the patients treated with monotherapy, which was significant 29
for insulin monotherapy (from 11.2 to 14.6%, p < 0.001). The proportion of patients treated with 30
metformin remained stable (from 68.3% to 67.8%, p = 0.076), while those receiving sulfonylurea 31
dropped from 18.4% to 12.5% (p < 0.001); GLP-1 analogues and DPP-4 inhibitors showed the 32
Page 2 of 15
Accep
ted
Man
uscr
ipt
2
greatest increase (from 1.2% to 6.6%, p < 0.001). In the whole sample of 25,148 new AD users, 1
metformin was the most commonly prescribed drug in monotherapy (41.9%), while insulin ranked 2
second (13.3%). Conclusion: This study shows a rising trend of AD monotherapy, with 3
sulfonylureas and incretins showing the more negative and positive trend, respectively. 4
Keywords: Diabetes mellitus, Medical therapy, Prescribing patterns 5
1. Introduction 6
Diabetes is one of the most chronic diseases worldwide, with about 592 million people being 7
affected by 2035 (1). According to the World Health Organization (WHO), diabetes will represent 8
the 7th leading cause of death in 2030, with an estimated prevalence of 7.8% (2). A steadily 9
increase of diabetes prevalence has also been registered in Italy (3), from 3.9% in 2001 to 5.0% in 10
2012. The two main forms of diabetes are type 1 diabetes, characterized by deficient insulin 11
production, and type 2 diabetes, characterized by a mixture of insulin resistance and insulin 12
deficiency; over 90% of cases are represented by type 2 diabetes (4). The global rising of obesity 13
and sedentary lifestyle represent hard risk factors for type 2 diabetes. Diet, exercise and drugs are 14
the mainstay of diabetes management (5-8). In the last decade, the available pharmacological 15
options have expanded with the introduction of new antidiabetic drugs (ADs), such as the glucagon-16
like peptide-1 (GLP-1) analogues and the dipeptidyl peptidase-4 (DPP-4) inhibitors. The rising of 17
diabetes prevalence and the availability of these new drugs represent the main cause of the 18
increased ADs utilization and related costs worldwide. To date, several studies have analysed the 19
trend in the use of ADs, which indicated an increased trend in consumption of these drugs over 20
time, with sharp differences between and within countries (9-19). In Italy, data on drugs 21
consumption in 2012 showed that drugs in the ATC group A “alimentary tract and metabolism”, 22
which includes ADs, were those with an higher increase in expenditure (+22.5%) and consumption 23
(+7.8%) compared with data of 2011 (20). A picture of ADs prescription data in Italy is only 24
available from some Northern Italian Counties, and is consistent with other worldwide scientific 25
evidence (18,19). Within this scenario, and in light of the recent introduction on the market of new 26
ADs, the aim of this study was to assess the prescribing pattern of ADs in a general practice of 27
Southern Italy, with focus on behaviour prescribing changes. 28
2. Materials and methods 29
This retrospective, drug utilization study was conducted using administrative databases of the Local 30
Health Unit (LHU) of Caserta from Campania region (Southern Italy). The source population 31
Page 3 of 15
Accep
ted
Man
uscr
ipt
3
included about 1 million citizens living in the catchment area of Caserta. The database collects 1
anonymized claims data about: a) drugs routinely dispensed to the patients and reimbursed by the 2
Italian National Health System, prescribed by either general practitioners (GP) or specialists 3
working in both public and private sector; b) drugs directly supplied to patients by LHU (Direct 4
Distribution, DD), or by hospitals through local pharmacies (DPC), both at enrolment and during 5
the follow-up period. Dispensing data contained information about unique patient identifier, 6
patients‟ demographics, branded and generic drug name and related Anatomical Therapeutic 7
Chemical (ATC) classification code, quantity and dispensing date. These databases were linked 8
anonymously using encrypted patient codes according to the Italian law for confidentiality data. No 9
ethical approval is required for using encrypted retrospective information. Since type 1 and type 2 10
diabetes could not be accurately distinguished from the available data, the type of diabetes was not 11
considered in this analysis. 12
2.1 Study population 13
From the source population, we identified all the subjects with at least one AD prescription during 14
the study period January 1st, 2009 –December 31st, 2012. Moreover, according to the inclusion 15
criteria, patients had to be alive, registered in the list of LHU for two years, during which they had 16
to receive drug prescription reimbursed by the Italian National Health System, until the date of AD 17
prescription. No age restriction was applied. The drug exposure under study included all ADs 18
(ATC: A10*). According to their first prescription during the enrolment period, patients were 19
stratified in two main categories :a) monotherapy; and b) polytherapy and each of them into two 20
sub-categories. Patients with a first prescription of only one drug belonging to the biguanides 21
(A10BA), sulfonamides, urea derivatives (A10BB), α-glucosidase inhibitors (A10BF), 22
thiazolidinediones (A10BG), dipeptidyl peptidase-4 inhibitors (A10BH) and others blood glucose 23
lowering drugs (A10BX), were included in the monotherapy AD. Patients with the first prescription 24
of only one of the insulin group (Human: A10AB01, A10AC01, A10AD01 and Analogues: 25
A10AB04, A10AB05, A10AB06, A10AC04, A10AD04, A10AE04, A10AE05 or A10AD05) were 26
included in the insulin monotherapy group. The polytherapy group was distinguished as fixed 27
combination group, that was made up of patients with prescription of drugs in the ATC A10BD 28
(combinations of oral blood glucose-lowering drugs), and no-fixed combination group, composed 29
of subjects with an overlapping period from the first and second prescription of oral AD of at least 30
of 15 days. This definition is consistent with the indications reported in previous studies (21,22). 31
Page 4 of 15
Accep
ted
Man
uscr
ipt
4
2.2 Statistical analysis 1
One-year prevalence of AD treatment was evaluated, for each year, as the ratio between the number 2
of patients who received at least one AD prescription during the observational year and the number 3
of all resident subjects alive in the same period. Yearly incidence of AD treatment was assessed as 4
the number of new AD users per year divided by the number of residents at risk of receiving an AD 5
prescription (i.e. alive residents during the observation year minus prevalent AD user at the end of 6
the previous years). New users were identified as patients receiving at least one AD prescription 7
during the observational year, without any recorded AD prescription in the previous year. Both 8
prevalence and incidence of use were expressed as rates per 1000 inhabitants together with 95% 9
confidence interval (CI). Frequency analyses by age-category over the study period were also 10
conducted. The incidence of AD treatment was also stratified by drug class for each study year. The 11
Cochrane-Armitage test was used to assess the statistical significance of patients‟ characteristics 12
and prescribing patterns from 2010 to 2012. Significance was set at a level of P < 0.05. Statistical 13
analyses were performed using STATA vs 11.1 (STATA Corporation, Texas, USA). 14
15
3. Results 16
A sample cohort of 78,789 subjects with at least one prescription of AD was identified during the 17
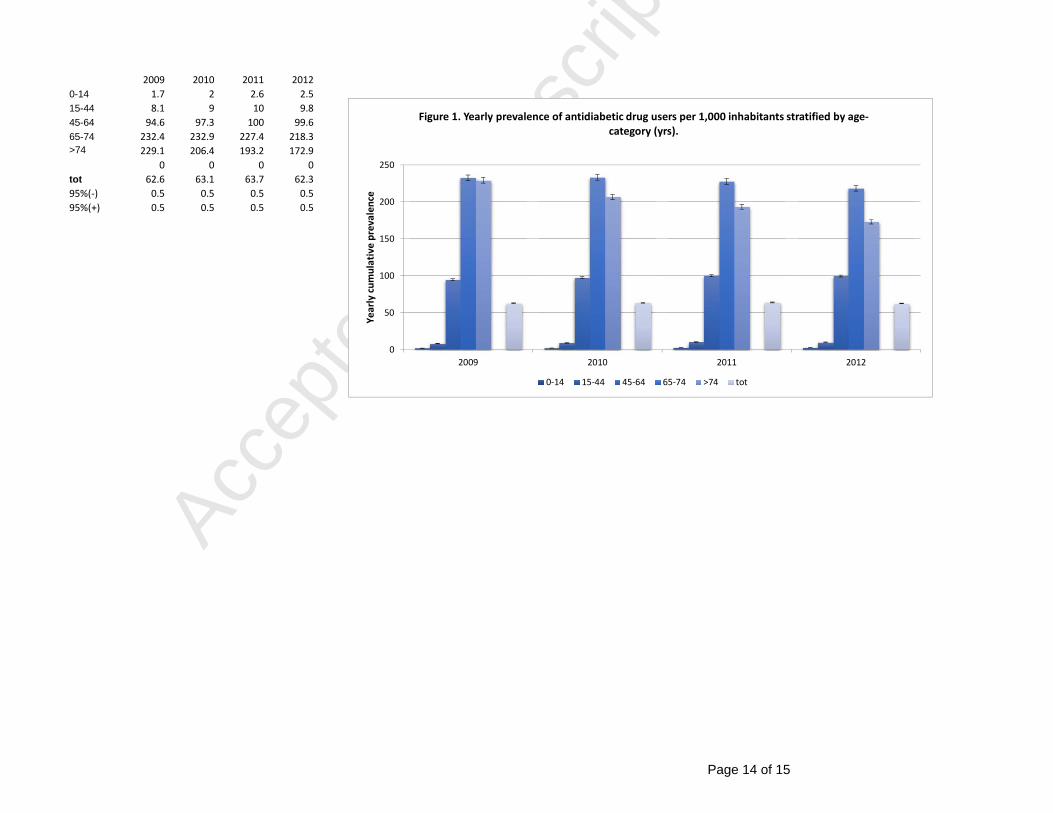
study period. Overall cumulative prevalence of AD use in the Caserta LHU remained stable from 18
62.6 (95% CI: 62.1 to 63.1)/1000 inhabitants in 2009, to 62.3 (95% CI: 61.8- 62.8)/1000 inhabitants 19
in 2012. Prevalence increased with age with a peak in 65-74 years group (Figure 1). Overall 20
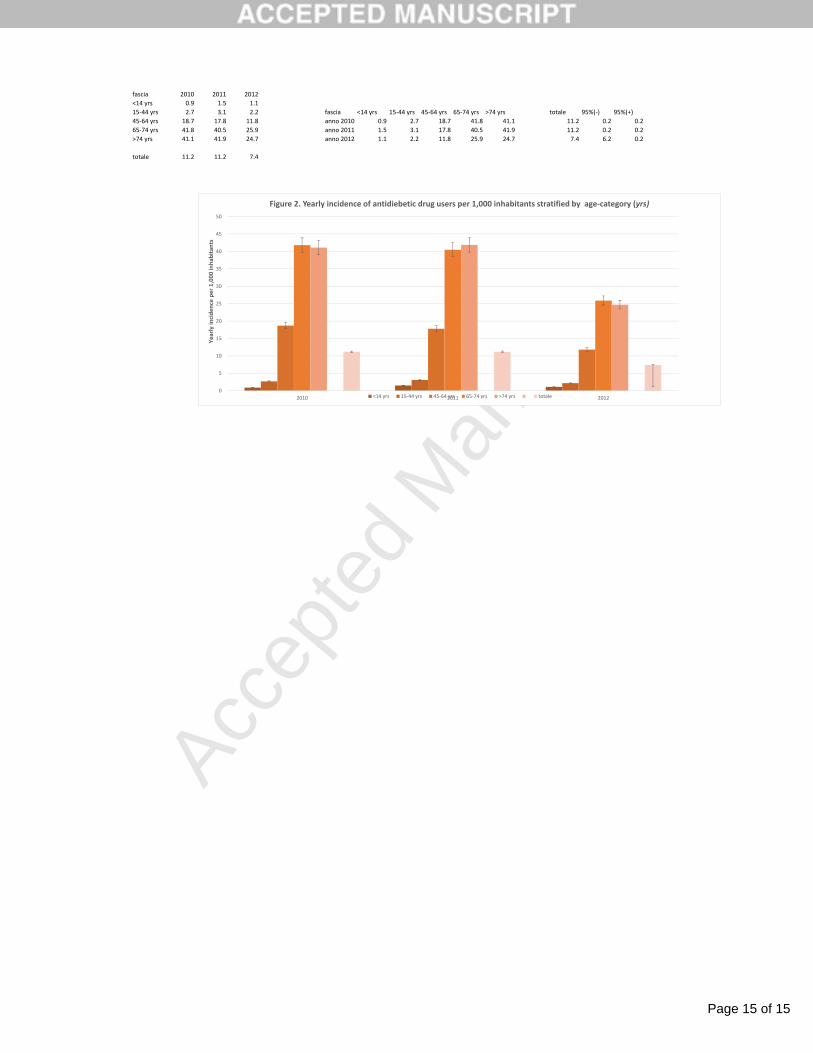
cumulative incidence of antidiabetic drug use per 1000 inhabitants decreased from 11.2 (95% CI 21
11.0-11.4) in 2010, to 7.4 (95%CI 1.2-7.6) in 2012 (Figure 2). When stratified by age category, the 22
peak of incidence was observed in people 65-74 years old both in 2010 and 2012, and in subjects 23
over 74 in 2011. 24
3.1 AD prescription in newly-treated patients 25
From 2010 to 2012, we observed a progressive decrease of the absolute number of new users of 26
ADs over the study years, from 9,852 in the 2010, 9,509 in the 2011, to 6,325 patients in the 2012, 27
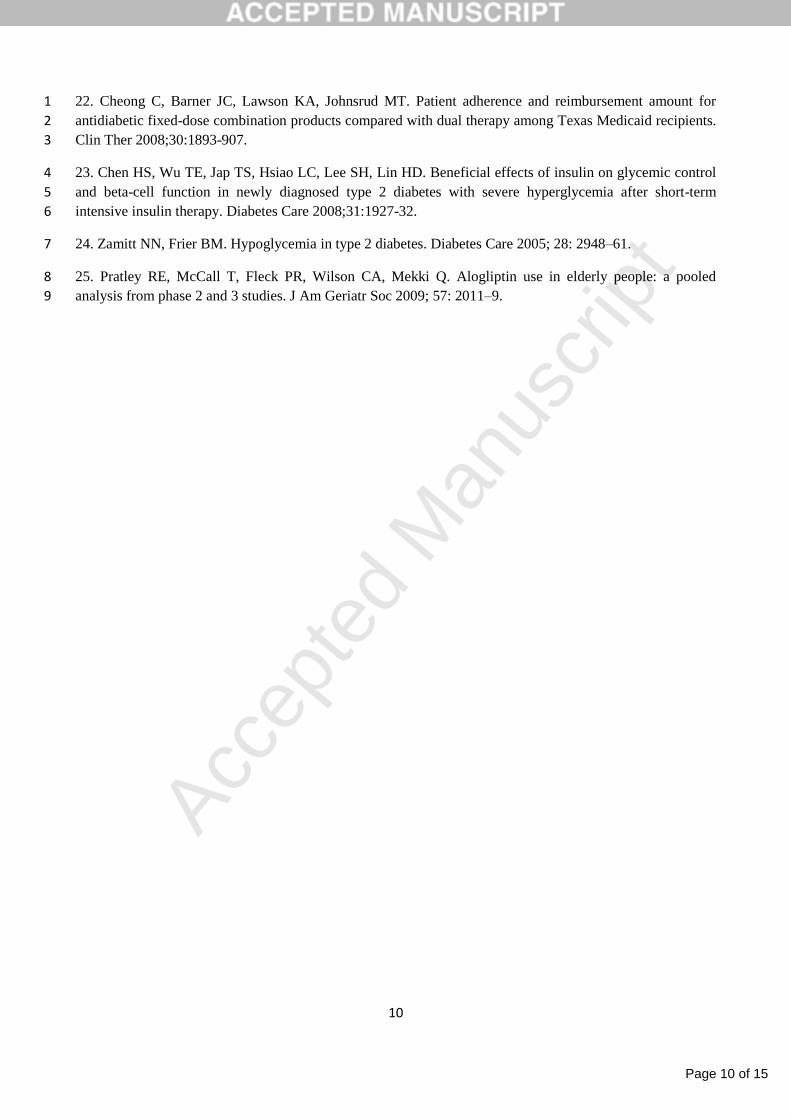
associated with a change in the prescribing pattern of first-line therapy (Table 1). There was an 28
overall increase of the proportion of the patients treated with monotherapy from 2010 to 2012, 29
specifically from 60.1% (N 5,919) to 62.1% (N 3,929) for monotherapy AD (P=0.212), and from 30
11.2% (N 1,104) and 14.6% (N 924) for insulin monotherapy (P<0.001); this was associated with 31
Page 5 of 15
Accep
ted
Man
uscr
ipt
5
an overall decrease of polytherapy, including both fixed and no-fixed combinations (from 19.7% to 1
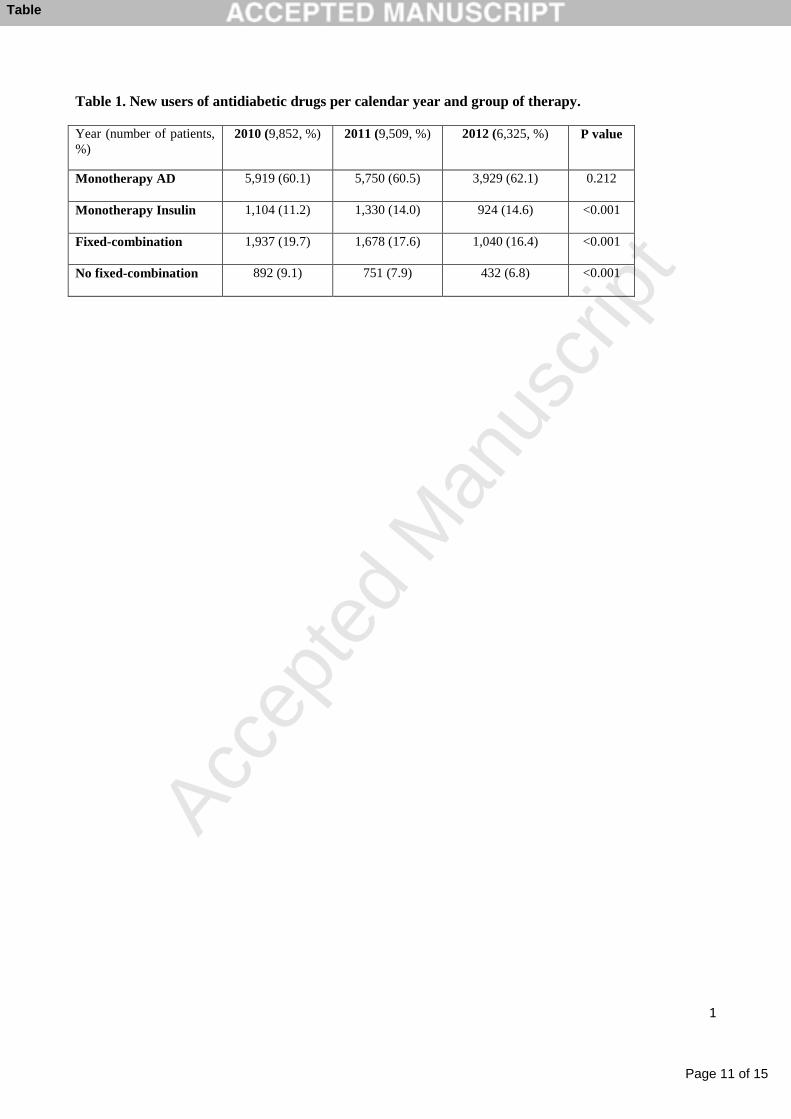
16.4%, and from 9.10% to 6.8%, respectively, P<0.001 for both). As specific drug monotherapy is 2
concerned (Table 2), the proportion of newly treated patients with metformin (the only available 3
biguanide on the Italian market) remained stable across the years of observation (from 68.3% in 4
2010 to 67.8% in 2012, P = 0.951), while the percentage of new patients treated whit a sulfonylurea 5
dropped steadily, from 18.4% in 2010 to 12.5% in 2012 (P < 0.001). While GLP-1 analogues and 6
DPP-4 inhibitors, showed the greatest relative increase during the study period (from 1.2% to 6.6%, 7
P < 0.001), the use of other AD, showed small differences. In particular, a small but statistically 8
significant increase of new acarbose users (from 4.9% in the 2010 to 5.9% in the 2012; P = 0.045) 9
and a not significant increase in new glinides users were detected (from 6.1% in the 2010 to 6.3% in 10
the 2012; P = 0.0881). On the contrary, a small but significant reduction of new pioglitazone users 11
was highlighted, in particular from 1.1% in the 2010 to 0.9 in the 2012. The percentage of patients 12
starting treatment with insulin analogues rose from 84.0% in 2010 to 92.4% in 2012 (P < 0.001), 13
according to a decrease of human insulin use (from 16.0% to 7.6%, P < 0.001). 14
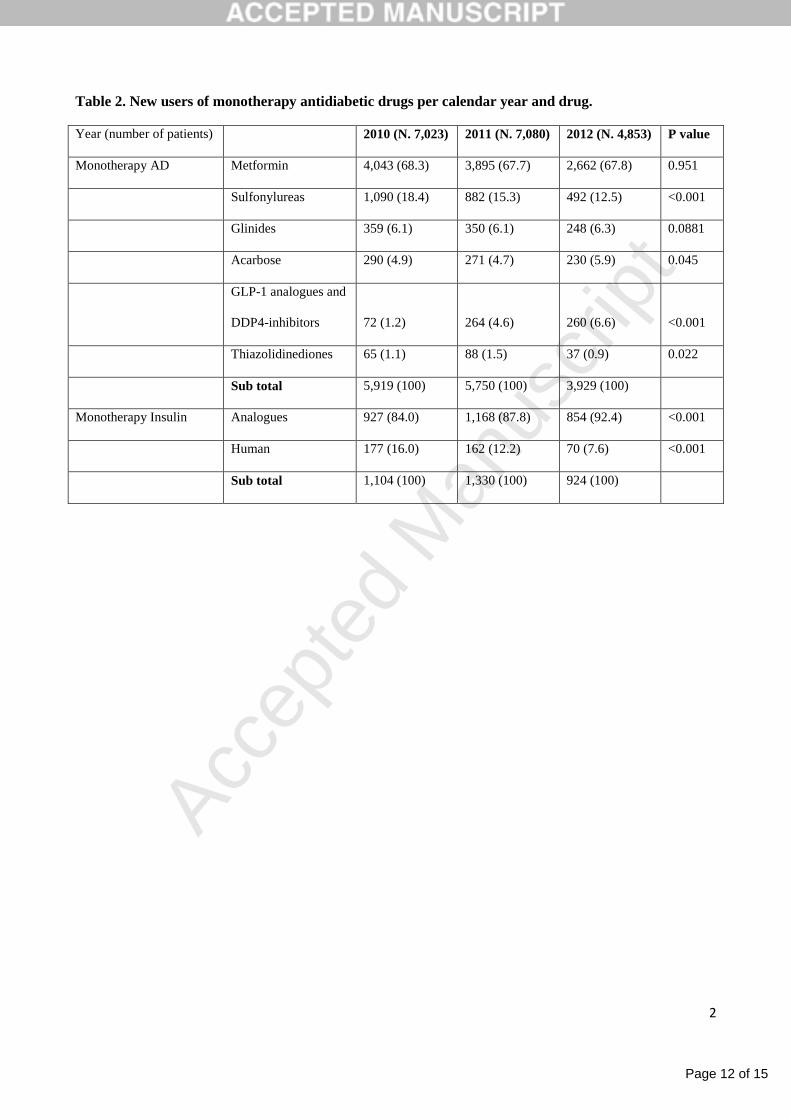
3.2 Demographic characteristics of AD new users 15
Table 3 reports the demographic and clinical characteristics (gender, mean age, and age strata), 16
stratified by drug, for all patients with at least one prescription of AD any time across the study 17
period (N=25,148). Metformin was the most commonly prescribed drug (41.9%), without 18
difference in gender; the mean age of metformin new users was 60.1 ± 15.3 years, with a peak 19
(45.7%) in the age stratum of 45-64 years. Classic insulin secretagogues, including sulfonylureas 20
and glinides, ranked second (9.7%) and third (3.8%), respectively, among monotherapy AD group: 21
the age of sulfonylureas and glinides users was above the mean age of the whole population, and in 22
absolute the mean age of glinides users was the highest (65.6 ± 17.5 years, P = 0.01). A high 23
percentage of patients aged >74 years took glinides (33.4%) or a sulfonylurea (27.4%). Among the 24
other noninsulin drugs, acarbose, incretins (GLP-1 analogues and DPP-4 inhibitors) and 25
pioglitazone ranked fourth, fifth and sixth, respectively, with a total percentage of noninsulin 26
monotherapy prescriptions of 6.3%. The mean age of new incretins users in monotherapy was the 27
lowest (57.1 ± 17.2 years), according to the lowest percentage of patients over 74 (11.8%). Insulin 28
ranked second among the antidiabetic drugs given in monotherapy, with a total of 13.3% new users, 29
the most treated with insulin analogues. The most new human-insulin users were over 74 (35.6%) 30
while new treatments with insulin analogues are mostly prescribed between 45 and 65 years 31
(30.4%). Polytherapy, in terms of both fixed and no fixed combinations, were used by one fourth 32
Page 6 of 15
Accep
ted
Man
uscr
ipt
6
(25.1%) of the whole new users, with most using fixed combination therapy (17.2%): the age peak 1
of polytherapies occurred between 45-64 years for both (fixed and no fixed). 2
4. Discussion 3
This study, based on administrative databases of the Local Health Unit (LHU) of Caserta, showed 4
that the prevalence of patients on AD treatment remained stable across the study period (around 62 5
per 1000 inhabitants in the years 2009-2012 ) with a peak in subjects aged 65-74 years. With regard 6
to the distribution of new users of AD treatment per year, a rising trend of monotherapy (both AD 7
and insulin), and a steady decrease of polytherapy, both fixed and no-fixed combinations were 8
detected. In particular, metformin, as monotherapy treatment, was the oral AD mostly used as 9
starting therapy during the whole study period; sulfonylureas and incretins showed the more 10
negative and positive trend, respectively, across the years. These findings are consistent with the 11
more recent American guidelines, according to metformin as monotherapy intervention represents 12
the first choice at the early stage of the disease (5). In apparent contrast to that reported in other 13
Italian studies (18,19), our results do not show a steady increase in the use of metformin as initial 14
therapy in new users: this likely could reflect the introduction of the regional legislative decree n.51 15
on September 2010, as a measure of regional pharmaceutical expenditure containment, which 16
established a form of patient co-payment for some drugs off-patent, such as metformin. Given the 17
low absolute cost of metformin, this would have result in more diabetic people buying metformin 18
without the prescription of the general practitioner, thus escaping the database. Moreover, another 19
conceivable explanation for our results, different to the other ones reported, could also be the 20
different time frame analysis among the studies. At the same time, the number of patients with 21
diabetes treated with combinations of oral antidiabetic drugs decreased, suggesting that the 22
availability on the market of new classes of drugs, such as incretins, has expanded the possibility of 23
“personalizing” therapy in order to achieve better glucose control. With regard to insulin 24
monotherapy, our analysis revealed also a rising use in new users (from 11.2 in 2010 to 14.6 in 25
2012). These data could reflect either a more severe hyperglycemia or a renal impairment status that 26
represents one of the contraindications of biguanides or sulfonylureas use (18, 23). The present 27
study also assessed associations between patient characteristics and the prescribing pattern of 28
differential antidiabetic drugs. While no gender effect was evident from the analysis of prescribing 29
patterns, age seem to influence the choice of antidiabetic drugs in new users. For instance, glinides 30
and incretins were the drugs associated with the higher and lower mean age at starting therapy, 31
respectively, with a difference of 7.5 years between the groups. Older individuals with type 2 32
Page 7 of 15
Accep
ted
Man
uscr
ipt
7
diabetes are inherently at higher risk of serious complications brought on by hypoglycemia, in part 1
because of the presence of age-related comorbid conditions and also because their symptoms are 2
often misinterpreted and not treated as quickly and effectively as needed (24). Accordingly, the 3
DPP-4 inhibitor alogliptin has been shown to be efficacious and safe, without increased incidence 4
of hypoglycemia or weight gain in post hoc analyses of subpopulations of older patients with type 2 5
diabetes mellitus (aged 65–80 years), as monotherapy and in combination with other antidabetic 6
drugs (25). The theoretical advantages of DPP-4 inhibitors in older patients are not reflected by the 7
prescribing patterns, especially in the age stratum >74 years, where the use of incretins dropped to 8
11.8%, as compared with 33.4% of glinides. In particular, considering insulin secretagogues, 9
patients over 74 represent 29,1% of glinides/sulfonylureas new users, although these drugs are not 10
recommended in older people. The underutilization of DPP-4 inhibitors could reflect physician's 11
caution in prescribing the newer classes of glucose-lowering drugs in the elderly population, 12
although the comforting safety data (25). However, although the new oral antidiabetic drugs appear 13
to have a lower risk of hypoglycemia, making them theoretically attractive for older patients, their 14
efficacy and safety profile need to be further investigated in long-term studies with appropriate 15
comparators on the clinical endpoint. Our results show that the use of metformin as monotherapy is 16
higher in the age-stratum 45-64 years. In agreement with previous data (18), younger patients were 17
more likely to be prescribed metformin, as its use was low in older patients, probably owing to renal 18
contraindications. We also reported an overall decrease of the incidence of new users of antidiabetic 19
drugs, in contrast with national and international data that predicted an increase of the incidence of 20
antidiabetic drugs use. However, the administrative databases of Local Health Unit are not able to 21
capture the potential effect of the policy/economic intervention by the National Health System, 22
especially of those patients with diabetes who decide to bypass prescriptions, owned by co-23
payment, and buy directly low-cost drugs, as metformin and sulfonylureas. This limitation could 24
also explain the difference between the total number of yearly new users and the number of anytime 25
new users (25,686 and 25,148 respectively). Several limitations of our study should be recognized. 26
First of all, it is well known that administrative health database, useful tools in observational drug 27
utilization studies are characterized by several limitations such as the absence of important clinical 28
information which limits interpretation of data. Second, the use of outpatient dispending data does 29
not inform whether antidiabetic medications were actually taken by the patients; although these data 30
are ideal for measuring prescription patterns, non-adherence to treatment is not captured. Third, in 31
the absence of a clinical diagnosis of diabetes (type 1 or type 2), we decided to describe prescribing 32
trends on the overall population with diabetes since differentiation between these main forms of 33
Page 8 of 15
Accep
ted
Man
uscr
ipt
8
diabetes based on patients‟ age and use of insulin are imperfect (10). However, more than 90% is 1
estimated to be type 2 diabetes. On the other hand, this study has also strengths; in particular, the 2
use of linked administrative databases for identifying all patients treated with antidiabetic drugs 3
across 3 consecutive years makes it possible to follow actual changes in drug prescriptions. 4
5. Conclusions 5
The results of our study show that the prevalence of patients on AD treatment remained stable 6
across the study period (2009-2012), with a peak in subjects aged 65-74 years. Moreover, data also 7
show a rising trend of monotherapy, and a steady decrease of polytherapy, both fixed and no-fixed 8
combinations; metformin, as monotherapy treatment, was the oral AD with the higher proportion 9
during the entire study period; sulfonylureas and incretins showed the more negative and positive 10
trend, respectively, across the years. The changes in antidiabetic drugs prescription patterns 11
probably reflect the impact of recent guidelines of diabetes treatment, the introduction of different 12
classes of medications to the marketplace, and the potential effect of the policy/economic 13
intervention by the local National Health System. 14
Conflict of interest 15
The authors declare that they have no conflict of interest with the article. 16
References 17
1. Guariguata L, Whiting DR, Hambleton I, Beagley J, Linnenkamp U, Shaw JE. Global estimates of 18
diabetes prevalence in adults for 2013 and projections for 2035. Diabetes Res Clin Pract 2014. 103 (2): 137-19
149 20
2. Global status report on non communicable diseases 2010. Geneva, World Health Organization, 2011. 21
3. Italian national institute of statistics http://www3.istat.it/dati/catalogo/20121218_00/ 22
4. Definition, diagnosis and classification of diabetes mellitus and its complications. Part 1: Diagnosis and 23
classification of diabetes mellitus. Geneva, World Health Organization, 1999 (WHO/NCD/NCS/99.2) 24
5. American Diabetes Association. Standards of medical care in diabetes-2014. Diabetes Care 2014;37 25
(Suppl 1):S14-S80. 26
6. Morgillo F, Sasso FC, Della Corte CM, Festino L, Manzo A, Martinelli E, et al. Metformin in lung cancer: 27
rationale for a combination therapy. Expert Opin Investig Drugs 2013;33:1401-9. 28
7. Esposito K, Chiodini P, Capuano A, Petrizzo M, Improta MR, Giugliano D. Basal supplementation of 29
insulin lispro protamine suspension versus insulin glargine and detemir for type 2 diabetes: meta-analysis of 30
randomized controlled trials. Diabetes Care 2012;35:2698-705. 31
Page 9 of 15
Accep
ted
Man
uscr
ipt
9
8. Esposito K, Capuano A, Giugliano D. Humalog (lispro) for type 2 diabetes. Expert Opin Biol Ther 1
2012;12:1541-50. 2
9. Kohro T, Yamazaki T, Sato H, Harada K, Ohe K, Komuro I, et al. Trends in antidiabetic prescription 3
patterns in Japan from 2005 to 2011. Int Heart J 2013;54:93-7. 4
10. Cohen FJ, Neslusan CA, Conklin JE, Song X. Recent antihyperglycemic prescribing trends for US 5
privately insured patients with type 2 diabetes. Diabetes Care 2003;26:1847-51. 6
11. Wysowski DK, Armstrong G, Governale L. Rapid increase in the use of oral antidiabetic drugs in the 7
United States, 1990-2001. Diabetes Care. 2003;26(6):1852-1855. 8
12. Alexander GC, Sehgal NL, Moloney RM, Stafford RS. National trends in treatment of type 2 diabetes 9
mellitus, 1994-2007. Arch Intern Med 2008;168:2088-94. 10
13. Mann DM, Woodward M, Ye F, Krousel-Wood M, Muntner P. Trends in medication use among US 11
adults with diabetes mellitus: glycemic control at the expense of controlling cardiovascular risk factors. Arch 12
Intern Med 2009;169:1718-20. 13
14. Walley T, Hughes D, Kendall H. Trends and influences on use of antidiabetic drugs in England, 1992-14
2003. Pharmacoepidemiol Drug Saf 2005;14:769-73. 15
15. Melander A, Folino-Gallo P, Walley T, Schwabe U, Groop PH, Klaukka T, et al. Utilisation of 16
antihyperglycaemic drugs in ten European countries: different developments and different levels. 17
Diabetologia 2006;49:2024-9. 18
16. Lub R, Denig P, van den Berg PB, Hoogenberg K, de Jong-van den Berg LT. The impact of new insights 19
and revised practice guidelines on prescribing drugs in the treatment of Type 2 diabetes mellitus. Br J Clin 20
Pharmacol 2006;62:660-5. 21
17. Filion KB, Joseph L, Boivin JF, Suissa S, Brophy JM. Trends in the prescription of anti-diabetic 22
medications in the United Kingdom: a population-based analysis. Pharmacoepidemiol Drug Saf 23
2009;18:973-6. 24
18. Mazzaglia G, Yurgin N, Boye KS, Trifirò G, Cottrell S, Allen E, et al. Prevalence and antihyperglycemic 25
prescribing trends for patients with type 2 diabetes in Italy: a 4-year retrospective study from national 26
primary care data. Pharmacol Res 2008;57:358-63. 27
19. Baviera M, Monesi L, Marzona I, Avanzini F, Monesi G, Nobili A, et al. Trends in drug prescriptions to 28
diabetic patients from 2000 to 2008 in Italy's Lombardy Region: a large population-based study. Diabetes 29
Res Clin Pract 2011;93:123-30. 30
20. Osservatorio Nazionale sull‟Impiego dei Medicinali - L‟uso dei farmaci in Italia gennaio - settembre 31
2012 (National Monitoring Center for Drug Use. The Use of Drug in Italy. Rome, National Ministry of 32
Health). 33
21. Colombo GL, Rossi E, De Rosa M, Benedetto D, Gaddi AV. Antidiabetic therapy in real practice: 34
indicators for adherence and treatment cost. Patient Prefer Adherence 2012;6:653-61. 35
Page 10 of 15
Accep
ted
Man
uscr
ipt
10
22. Cheong C, Barner JC, Lawson KA, Johnsrud MT. Patient adherence and reimbursement amount for 1
antidiabetic fixed-dose combination products compared with dual therapy among Texas Medicaid recipients. 2
Clin Ther 2008;30:1893-907. 3
23. Chen HS, Wu TE, Jap TS, Hsiao LC, Lee SH, Lin HD. Beneficial effects of insulin on glycemic control 4
and beta-cell function in newly diagnosed type 2 diabetes with severe hyperglycemia after short-term 5
intensive insulin therapy. Diabetes Care 2008;31:1927-32. 6
24. Zamitt NN, Frier BM. Hypoglycemia in type 2 diabetes. Diabetes Care 2005; 28: 2948–61. 7
25. Pratley RE, McCall T, Fleck PR, Wilson CA, Mekki Q. Alogliptin use in elderly people: a pooled 8
analysis from phase 2 and 3 studies. J Am Geriatr Soc 2009; 57: 2011–9. 9
Page 11 of 15
Accep
ted
Man
uscr
ipt
1
Table 1. New users of antidiabetic drugs per calendar year and group of therapy.
Year (number of patients,
%)
2010 (9,852, %) 2011 (9,509, %) 2012 (6,325, %) P value
Monotherapy AD 5,919 (60.1) 5,750 (60.5) 3,929 (62.1) 0.212
Monotherapy Insulin 1,104 (11.2) 1,330 (14.0) 924 (14.6) <0.001
Fixed-combination 1,937 (19.7) 1,678 (17.6) 1,040 (16.4) <0.001
No fixed-combination 892 (9.1) 751 (7.9) 432 (6.8) <0.001
Table
Page 12 of 15
Accep
ted
Man
uscr
ipt
2
Table 2. New users of monotherapy antidiabetic drugs per calendar year and drug.
Year (number of patients) 2010 (N. 7,023) 2011 (N. 7,080) 2012 (N. 4,853) P value
Monotherapy AD Metformin 4,043 (68.3) 3,895 (67.7) 2,662 (67.8) 0.951
Sulfonylureas 1,090 (18.4) 882 (15.3) 492 (12.5) <0.001
Glinides 359 (6.1) 350 (6.1) 248 (6.3) 0.0881
Acarbose 290 (4.9) 271 (4.7) 230 (5.9) 0.045
GLP-1 analogues and
DDP4-inhibitors 72 (1.2) 264 (4.6) 260 (6.6)
<0.001
Thiazolidinediones 65 (1.1) 88 (1.5) 37 (0.9) 0.022
Sub total 5,919 (100) 5,750 (100) 3,929 (100)
Monotherapy Insulin Analogues 927 (84.0) 1,168 (87.8) 854 (92.4) <0.001
Human 177 (16.0) 162 (12.2) 70 (7.6) <0.001
Sub total 1,104 (100) 1,330 (100) 924 (100)
Page 13 of 15
Accep
ted
Man
uscr
ipt
3
Table 3. Distribution of clinical characteristics of new users* of antidiabetic drugs anytime by drug.
Total Monotherapy AD Monotherapy Insulin Polytherapy
Number (%) Metformin Sulfonylureas Glinides Acarbose Incretins Thiazolidine
diones
Human Analogues Fixed
combination
No fixed
combination
25,148 (%) 10,531 (%) 2,434 (%) 952 (%) 789 (%) 595 (%) 189 (%) 405 (%) 2,939 (%) 4,323 (%) 1,991 (%)
Gender (p=0.296)
Female 12,779 (50.8) 5,312 (50.4) 1,249 (51.3) 492 (51.7) 412 (52.2) 294 (49.4) 95 (50.3) 215 (53.1) 1,536 (52.3) 2,212 (51.2) 962 (48.3)
Male 12,369 (49.2) 5,219 (49.6) 1,185 (48.7) 460 (48.3) 377 (47.8) 301 (50.6) 94 (49.7) 190 (46.9) 1,403 (47.7) 2,111 (48.8) 1,029 (51.7)
Mean Age
(±SD)
61.1 (17.1) 60.1 (15.3) 64.1 (16.1) 65.6 (17.5) 63.5 (14.6) 57.1 (17.2) 57.5 (20.0) 64.4 (20.7) 59.6 (20.7) 62.7 (17.9) 59.1 (17.9)
Age group (years) (p<0.001)
≤14 526 (2.1) 106 (1.0) 37 (1.5) 21 (2.2) 8 (1.0) 20 (3.4) 9 (4.8) 19 (4.7) 127 (4.3) 110 (2.5) 69 (3.5)
15-44 2,973 (11.8) 1,298 (12.3) 207 (8.5) 74 (7.8) 60 (7.6) 85 (14.3) 31 (16.4) 34 (8.4) 487 (16.6) 432 (10.0) 265 (13.3)
45-64 10,079 (40.1) 4,816 (45.7) 883 (36.3) 291 (30.6) 297 (37.6) 288 (48.4) 66 (34.9) 115 (28.4) 894 (30.4) 1,589 (36.8) 840 (42.2)
65-74 6,178 (24.6) 2,613 (24.8) 639 (26.3) 248 (26.1) 262 (33.2) 132 (22.2) 54 (28.6) 93 (23.0) 674 (22.9) 1,034 (23.9) 429 (21.5)
>74 5,392 (21.4) 1,698 (16.1) 668 (27.4) 318 (33.4) 162 (20.5) 70 (11.8) 29 (15.3) 144 (35.6) 757 (25.8) 1,158 (26.8) 388 (19.5)
* Patients with at least one prescription of AD any time across the study period were included in the table.
Page 14 of 15
Accep
ted
Man
uscr
ipt
2009 2010 2011 20120-14 1.7 2 2.6 2.515-44 8.1 9 10 9.845-64 94.6 97.3 100 99.665-74 232.4 232.9 227.4 218.3>74 229.1 206.4 193.2 172.9
0 0 0 0tot 62.6 63.1 63.7 62.395%(‐) 0.5 0.5 0.5 0.595%(+) 0.5 0.5 0.5 0.5
0
50
100
150
200
250
2009 2010 2011 2012Ye
arly cum
ulative prevalen
ce
Figure 1. Yearly prevalence of antidiabetic drug users per 1,000 inhabitants stratified by age‐category (yrs).
0‐14 15‐44 45‐64 65‐74 >74 tot
Page 15 of 15
Accep
ted
Man
uscr
ipt
fascia 2010 2011 2012<14 yrs 0.9 1.5 1.115‐44 yrs 2.7 3.1 2.2 fascia <14 yrs 15‐44 yrs 45‐64 yrs 65‐74 yrs >74 yrs totale 95%(‐) 95%(+)45‐64 yrs 18.7 17.8 11.8 anno 2010 0.9 2.7 18.7 41.8 41.1 11.2 0.2 0.265‐74 yrs 41.8 40.5 25.9 anno 2011 1.5 3.1 17.8 40.5 41.9 11.2 0.2 0.2>74 yrs 41.1 41.9 24.7 anno 2012 1.1 2.2 11.8 25.9 24.7 7.4 6.2 0.2
totale 11.2 11.2 7.4
0
5
10
15
20
25
30
35
40
45
50
2010 2011 2012
Yearly in
cide
nce pe
r 1,000
inha
bitants
Figure 2. Yearly incidence of antidiebetic drug users per 1,000 inhabitants stratified by age‐category (yrs)
<14 yrs 15‐44 yrs 45‐64 yrs 65‐74 yrs >74 yrs totale
Top Related
Copyright © 2022 FDOKUMEN

