


Bahasa
Halaman
Hukum

Towards Reusable Measurement Patterns
Mikael Lindvall1, Paolo Donzelli
2,
Sima Agari2, Victor Basili
1,2
[email protected]; [email protected];
[email protected]; [email protected];
1. Fraunhofer Center for Experimental
Software Engineering, Maryland
2. University of Maryland
Abstract
Measurement programs in the software domain have had limited success because the existing measurement
approaches and techniques are not easily adapted to specific organizations, take too long to implement, and
look like they deplete resources from “real work.” Identifying and applying measurement patterns can
address these issues. The identification of measurement patterns increases reusability of measurement
goals, questions, and metrics gathered during past measurement activities, and avoids starting each program
from scratch. This paper describes some of the fundamental concepts of a software measurement
methodology currently under development to assist an organization in defining measurement programs that
are appropriate in its specific business and environmental context. Emphasis is placed on reusability by the
identification of measurement patterns. In the paper we illustrate the work with identifying measurement
patterns by providing an extensive and detailed measurement example that is broken down into
interdependent building blocks and activities.
1 Introduction
Measurement programs in the software domain have had limited success because the existing measurement
approaches and techniques are not easily adapted to specific organizations, take too long to implement, and
deplete resources from “real work.” Measurement programs do not supply sufficient guidance to allow an
organization to:
1. Identify appropriate goals,
2. Connect software goals to existing or available data, and
3. Interpret data so that appropriate business decisions can be made.
Measurement programs need to integrate these steps into a cost-effective methodology and supporting
tools. Since there are many different options, which must be considered, a canned measurement program
that predefines specific measures is not suitable.
This paper describes the preliminary results of a project with the goal of building a sustainable software
measurement methodology that will assist in defining measurement programs that are capable of managing
an organization’s performance in the context of their specific business and environmental factors. The
methodology is based on experience in software measurement from working with customers like the
Department of Defense’s (DoD) Medical Health Systems, NASA Headquarters, and NASA’s Jet
Propulsion Laboratory. This set of activities represents a variety of measurement program needs from
software management to software acquisition, demonstrating the wide range of needs for a software
measurement program. These measurement projects have been successful because they have been
extensively tailored for each specific customer, which means that they have been developed from scratch.
Creating measurement programs from scratch requires a great deal of time and is too costly for most
organizations. It is clear to us that a methodology that supports the definition of a multiplicity of
measurement programs for diverse organizations is needed to successfully apply measurement on a broader
1
scale. A method and supporting tools need to be developed that take advantage of commonalities and help
an organization choose and navigate through the space of options. This requires actual experiences and
specific expertise in quantitative and qualitative research methodologies as well as deep insight in the
domain of software measurement. One major activity of the new measurement methodology is the
identification of commonalities between measurement programs and expressing them in the form of
patterns. We believe a set of measurement patterns will make it easier for organizations to develop their
own measurement programs without having to start from scratch each time. In order to illustrate the work
on identifying patterns, we provide a detailed and extensive case study example in which we systematically
identify all the necessary components and their interdependencies. Once the building blocks are identified,
a general pattern emerges that can be applied in similar situations.
The paper focuses on and discusses the main conceptual aspects underlying the new methodology, namely
the Goal Question Metric (GQM) approach (Section 2), the relationships between the GQM goals (Section
3), and a GQM extension to allow representing and reasoning about measurement patterns (Section 4). In
Section 5 a case study is presented to illustrate the identification of measurement patterns. Finally,
conclusions and an outline of future activities are given in Section 6.
2 GQM
GQM (Basili et al., 1994, van Solingen and Berghout, 1999) is the fundamental building block of the new
methodology. GQM is a mechanism for defining and evaluating a set of operational goals, using
measurement. It represents a systematic approach for tailoring and integrating goals with models of the
software processes, products and quality perspectives of interest, based upon the specific needs of the
project and the software domain of an organization.
The goals are defined in an operational way by refining them into a set of quantifiable questions that are
used to extract the appropriate information from the models. The questions and models define the metrics,
which specify the data that needs to be collected. The models provide a framework for interpretation of the
collected data.
Goals may be defined for any object, for a variety of reasons, with respect to various models of quality,
from various points of view, relative to a particular environment. The goal is defined by filling in a set of
values for various parameters in a template. Template parameters include the study object, the purpose, the
quality focus, the point of view, and the context. The most important attribute is the purpose because it
determines the level of sophistication of the goal. The different purposes are characterize, understand,
evaluate, predict, and improve.
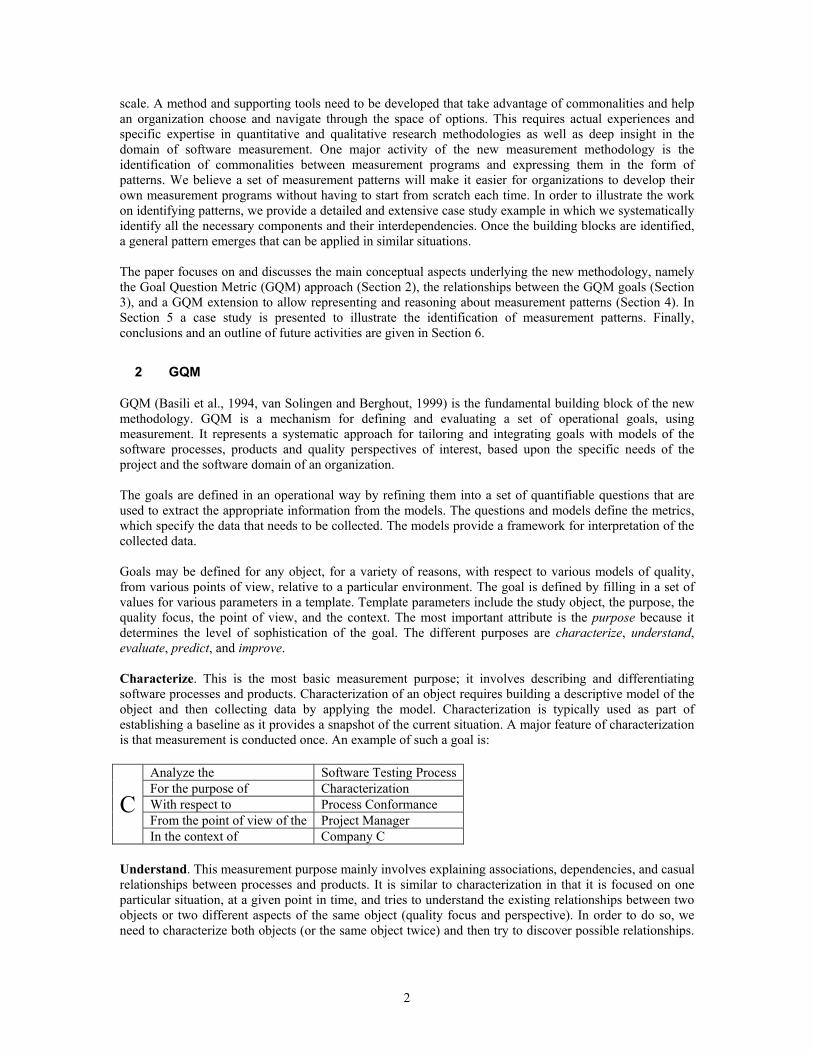
Characterize. This is the most basic measurement purpose; it involves describing and differentiating
software processes and products. Characterization of an object requires building a descriptive model of the
object and then collecting data by applying the model. Characterization is typically used as part of
establishing a baseline as it provides a snapshot of the current situation. A major feature of characterization
is that measurement is conducted once. An example of such a goal is:
Analyze the Software Testing Process
For the purpose of Characterization
With respect to Process Conformance
From the point of view of the Project Manager C
In the context of Company C
Understand. This measurement purpose mainly involves explaining associations, dependencies, and casual
relationships between processes and products. It is similar to characterization in that it is focused on one
particular situation, at a given point in time, and tries to understand the existing relationships between two
objects or two different aspects of the same object (quality focus and perspective). In order to do so, we
need to characterize both objects (or the same object twice) and then try to discover possible relationships.
2
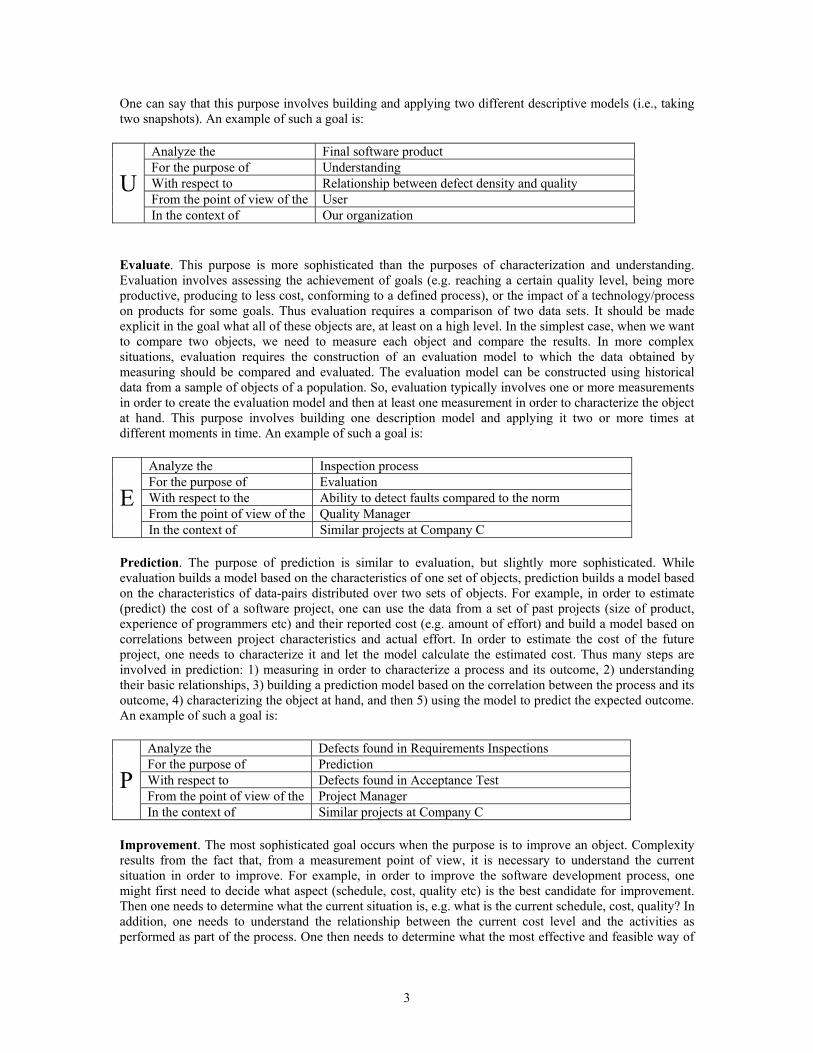
One can say that this purpose involves building and applying two different descriptive models (i.e., taking
two snapshots). An example of such a goal is:
Analyze the Final software product
For the purpose of Understanding
With respect to Relationship between defect density and quality
From the point of view of the User U
In the context of Our organization
Evaluate. This purpose is more sophisticated than the purposes of characterization and understanding.
Evaluation involves assessing the achievement of goals (e.g. reaching a certain quality level, being more
productive, producing to less cost, conforming to a defined process), or the impact of a technology/process
on products for some goals. Thus evaluation requires a comparison of two data sets. It should be made
explicit in the goal what all of these objects are, at least on a high level. In the simplest case, when we want
to compare two objects, we need to measure each object and compare the results. In more complex
situations, evaluation requires the construction of an evaluation model to which the data obtained by
measuring should be compared and evaluated. The evaluation model can be constructed using historical
data from a sample of objects of a population. So, evaluation typically involves one or more measurements
in order to create the evaluation model and then at least one measurement in order to characterize the object
at hand. This purpose involves building one description model and applying it two or more times at
different moments in time. An example of such a goal is:
Analyze the Inspection process
For the purpose of Evaluation
With respect to the Ability to detect faults compared to the norm
From the point of view of the Quality Manager E
In the context of Similar projects at Company C
Prediction. The purpose of prediction is similar to evaluation, but slightly more sophisticated. While
evaluation builds a model based on the characteristics of one set of objects, prediction builds a model based
on the characteristics of data-pairs distributed over two sets of objects. For example, in order to estimate
(predict) the cost of a software project, one can use the data from a set of past projects (size of product,
experience of programmers etc) and their reported cost (e.g. amount of effort) and build a model based on
correlations between project characteristics and actual effort. In order to estimate the cost of the future
project, one needs to characterize it and let the model calculate the estimated cost. Thus many steps are
involved in prediction: 1) measuring in order to characterize a process and its outcome, 2) understanding
their basic relationships, 3) building a prediction model based on the correlation between the process and its
outcome, 4) characterizing the object at hand, and then 5) using the model to predict the expected outcome.
An example of such a goal is:
Analyze the Defects found in Requirements Inspections
For the purpose of Prediction
With respect to Defects found in Acceptance Test
From the point of view of the Project Manager P
In the context of Similar projects at Company C
Improvement. The most sophisticated goal occurs when the purpose is to improve an object. Complexity
results from the fact that, from a measurement point of view, it is necessary to understand the current
situation in order to improve. For example, in order to improve the software development process, one
might first need to decide what aspect (schedule, cost, quality etc) is the best candidate for improvement.
Then one needs to determine what the current situation is, e.g. what is the current schedule, cost, quality? In
addition, one needs to understand the relationship between the current cost level and the activities as
performed as part of the process. One then needs to determine what the most effective and feasible way of
3
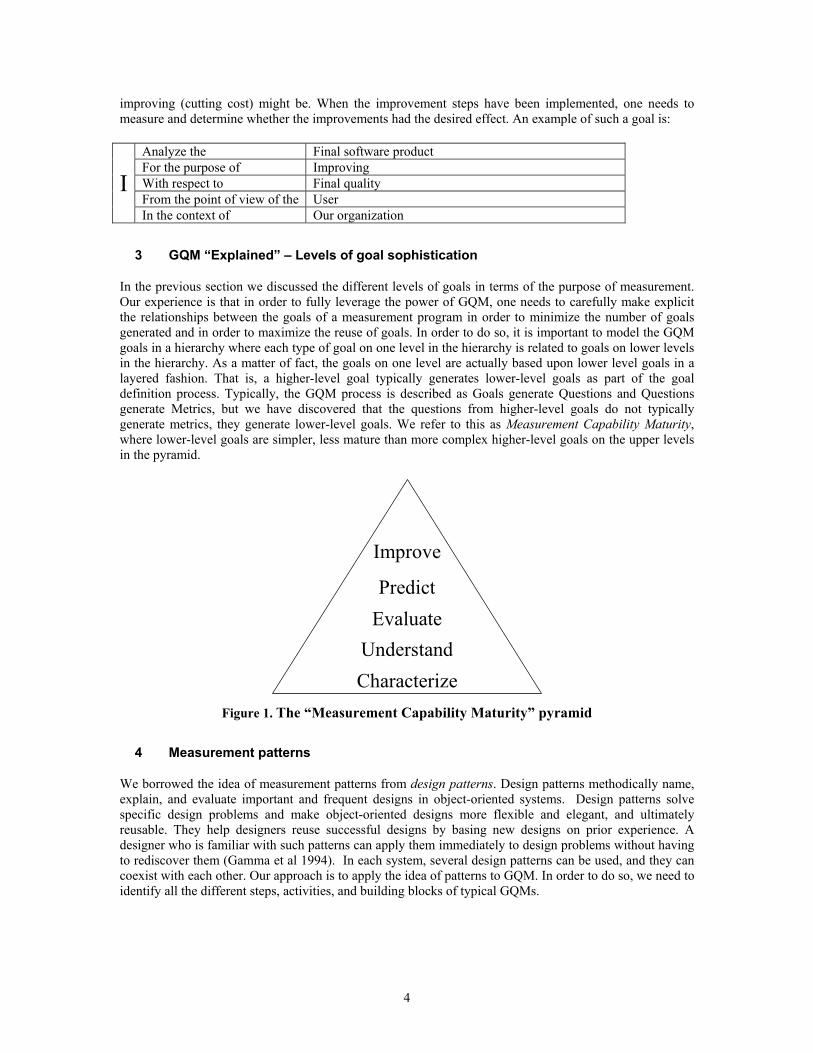
improving (cutting cost) might be. When the improvement steps have been implemented, one needs to
measure and determine whether the improvements had the desired effect. An example of such a goal is:
Analyze the Final software product
For the purpose of Improving
With respect to Final quality
From the point of view of the User I
In the context of Our organization
3 GQM “Explained” – Levels of goal sophistication
In the previous section we discussed the different levels of goals in terms of the purpose of measurement.
Our experience is that in order to fully leverage the power of GQM, one needs to carefully make explicit
the relationships between the goals of a measurement program in order to minimize the number of goals
generated and in order to maximize the reuse of goals. In order to do so, it is important to model the GQM
goals in a hierarchy where each type of goal on one level in the hierarchy is related to goals on lower levels
in the hierarchy. As a matter of fact, the goals on one level are actually based upon lower level goals in a
layered fashion. That is, a higher-level goal typically generates lower-level goals as part of the goal
definition process. Typically, the GQM process is described as Goals generate Questions and Questions
generate Metrics, but we have discovered that the questions from higher-level goals do not typically
generate metrics, they generate lower-level goals. We refer to this as Measurement Capability Maturity,
where lower-level goals are simpler, less mature than more complex higher-level goals on the upper levels
in the pyramid.
Characterize
Evaluate
Improve
Predict
Understand
Figure 1. The “Measurement Capability Maturity” pyramid
4 Measurement patterns
We borrowed the idea of measurement patterns from design patterns. Design patterns methodically name,
explain, and evaluate important and frequent designs in object-oriented systems. Design patterns solve
specific design problems and make object-oriented designs more flexible and elegant, and ultimately
reusable. They help designers reuse successful designs by basing new designs on prior experience. A
designer who is familiar with such patterns can apply them immediately to design problems without having
to rediscover them (Gamma et al 1994). In each system, several design patterns can be used, and they can
coexist with each other. Our approach is to apply the idea of patterns to GQM. In order to do so, we need to
identify all the different steps, activities, and building blocks of typical GQMs.
4
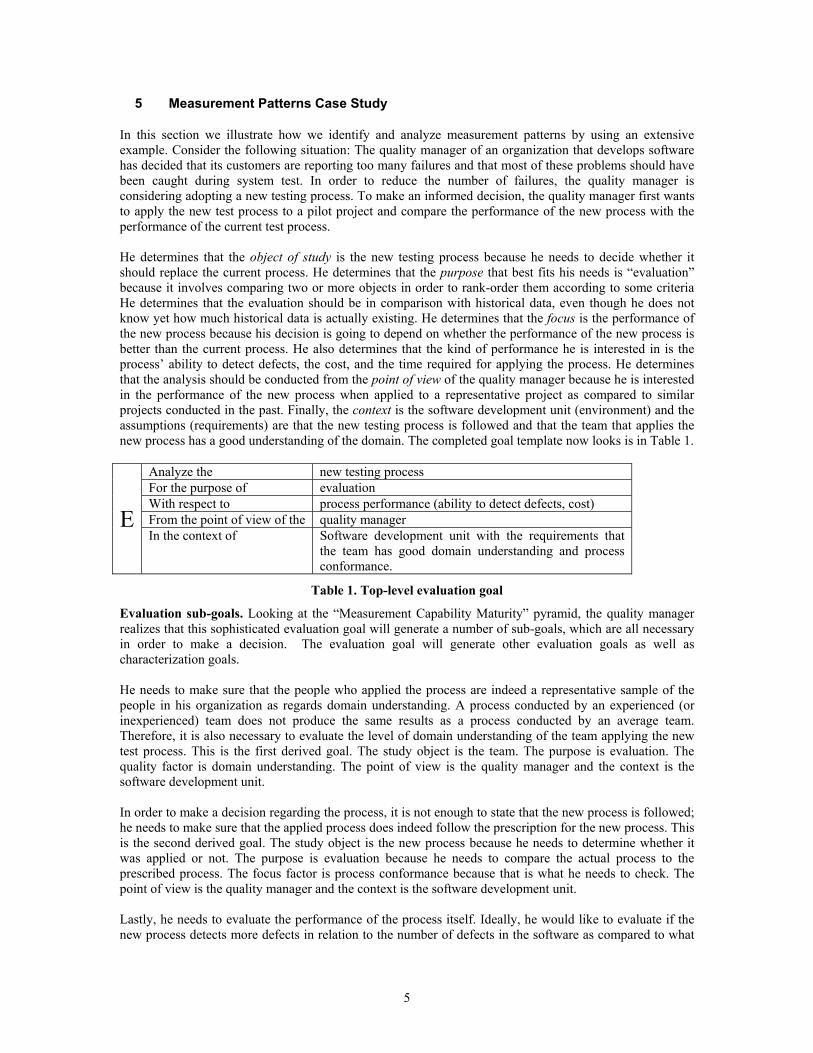
5 Measurement Patterns Case Study
In this section we illustrate how we identify and analyze measurement patterns by using an extensive
example. Consider the following situation: The quality manager of an organization that develops software
has decided that its customers are reporting too many failures and that most of these problems should have
been caught during system test. In order to reduce the number of failures, the quality manager is
considering adopting a new testing process. To make an informed decision, the quality manager first wants
to apply the new test process to a pilot project and compare the performance of the new process with the
performance of the current test process.
He determines that the object of study is the new testing process because he needs to decide whether it
should replace the current process. He determines that the purpose that best fits his needs is “evaluation”
because it involves comparing two or more objects in order to rank-order them according to some criteria
He determines that the evaluation should be in comparison with historical data, even though he does not
know yet how much historical data is actually existing. He determines that the focus is the performance of
the new process because his decision is going to depend on whether the performance of the new process is
better than the current process. He also determines that the kind of performance he is interested in is the
process’ ability to detect defects, the cost, and the time required for applying the process. He determines
that the analysis should be conducted from the point of view of the quality manager because he is interested
in the performance of the new process when applied to a representative project as compared to similar
projects conducted in the past. Finally, the context is the software development unit (environment) and the
assumptions (requirements) are that the new testing process is followed and that the team that applies the
new process has a good understanding of the domain. The completed goal template now looks is in Table 1.
Analyze the new testing process
For the purpose of evaluation
With respect to process performance (ability to detect defects, cost)
From the point of view of the quality manager E In the context of Software development unit with the requirements that
the team has good domain understanding and process
conformance.
Table 1. Top-level evaluation goal
Evaluation sub-goals. Looking at the “Measurement Capability Maturity” pyramid, the quality manager
realizes that this sophisticated evaluation goal will generate a number of sub-goals, which are all necessary
in order to make a decision. The evaluation goal will generate other evaluation goals as well as
characterization goals.
He needs to make sure that the people who applied the process are indeed a representative sample of the
people in his organization as regards domain understanding. A process conducted by an experienced (or
inexperienced) team does not produce the same results as a process conducted by an average team.
Therefore, it is also necessary to evaluate the level of domain understanding of the team applying the new
test process. This is the first derived goal. The study object is the team. The purpose is evaluation. The
quality factor is domain understanding. The point of view is the quality manager and the context is the
software development unit.
In order to make a decision regarding the process, it is not enough to state that the new process is followed;
he needs to make sure that the applied process does indeed follow the prescription for the new process. This
is the second derived goal. The study object is the new process because he needs to determine whether it
was applied or not. The purpose is evaluation because he needs to compare the actual process to the
prescribed process. The focus factor is process conformance because that is what he needs to check. The
point of view is the quality manager and the context is the software development unit.
Lastly, he needs to evaluate the performance of the process itself. Ideally, he would like to evaluate if the
new process detects more defects in relation to the number of defects in the software as compared to what
5
test processes at the company usually captures. The problem is that it impossible to know the total number
of defects so he uses an indirect model: defect slippage.
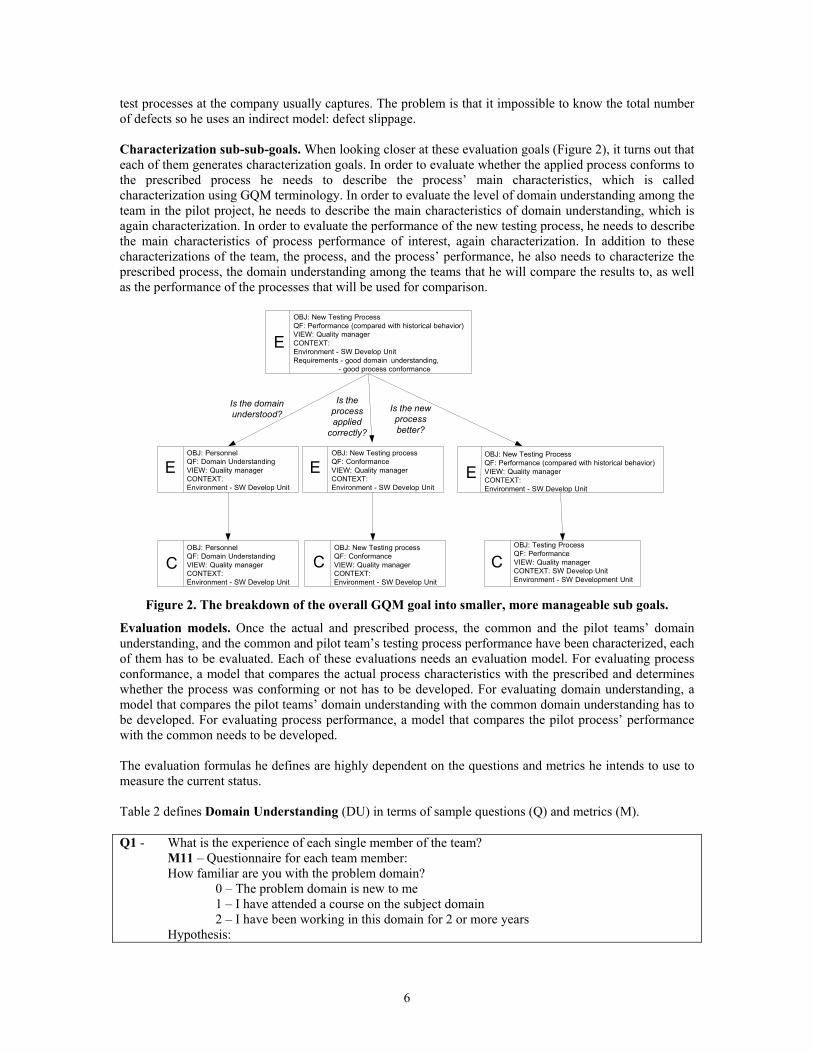
Characterization sub-sub-goals. When looking closer at these evaluation goals (Figure 2), it turns out that
each of them generates characterization goals. In order to evaluate whether the applied process conforms to
the prescribed process he needs to describe the process’ main characteristics, which is called
characterization using GQM terminology. In order to evaluate the level of domain understanding among the
team in the pilot project, he needs to describe the main characteristics of domain understanding, which is
again characterization. In order to evaluate the performance of the new testing process, he needs to describe
the main characteristics of process performance of interest, again characterization. In addition to these
characterizations of the team, the process, and the process’ performance, he also needs to characterize the
prescribed process, the domain understanding among the teams that he will compare the results to, as well
as the performance of the processes that will be used for comparison.
EOBJ: Personnel
QF: Domain Understanding
VIEW: Quality manager
CONTEXT:
Environment - SW Develop Unit
C C
OBJ: Testing Process
QF: Performance
VIEW: Quality manager
CONTEXT: SW Develop Unit
Environment - SW Development Unit
Is the domain
understood?
Is the
process
applied
correctly?
Is the new
process
better?
E
OBJ: New Testing Process
QF: Performance (compared with historical behavior)
VIEW: Quality manager
CONTEXT:
Environment - SW Develop Unit
Requirements - good domain understanding,
- good process conformance
OBJ: Personnel
QF: Domain Understanding
VIEW: Quality manager
CONTEXT:
Environment - SW Develop Unit
C
OBJ: New Testing process
QF: Conformance
VIEW: Quality manager
CONTEXT:
Environment - SW Develop Unit
E
OBJ: New Testing process
QF: Conformance
VIEW: Quality manager
CONTEXT:
Environment - SW Develop Unit
E
OBJ: New Testing Process
QF: Performance (compared with historical behavior)
VIEW: Quality manager
CONTEXT:
Environment - SW Develop Unit
Figure 2. The breakdown of the overall GQM goal into smaller, more manageable sub goals.
Evaluation models. Once the actual and prescribed process, the common and the pilot teams’ domain
understanding, and the common and pilot team’s testing process performance have been characterized, each
of them has to be evaluated. Each of these evaluations needs an evaluation model. For evaluating process
conformance, a model that compares the actual process characteristics with the prescribed and determines
whether the process was conforming or not has to be developed. For evaluating domain understanding, a
model that compares the pilot teams’ domain understanding with the common domain understanding has to
be developed. For evaluating process performance, a model that compares the pilot process’ performance
with the common needs to be developed.
The evaluation formulas he defines are highly dependent on the questions and metrics he intends to use to
measure the current status.
Table 2 defines Domain Understanding (DU) in terms of sample questions (Q) and metrics (M).
Q1 - What is the experience of each single member of the team?
M11 – Questionnaire for each team member:
How familiar are you with the problem domain?
0 – The problem domain is new to me
1 – I have attended a course on the subject domain
2 – I have been working in this domain for 2 or more years
Hypothesis:
6
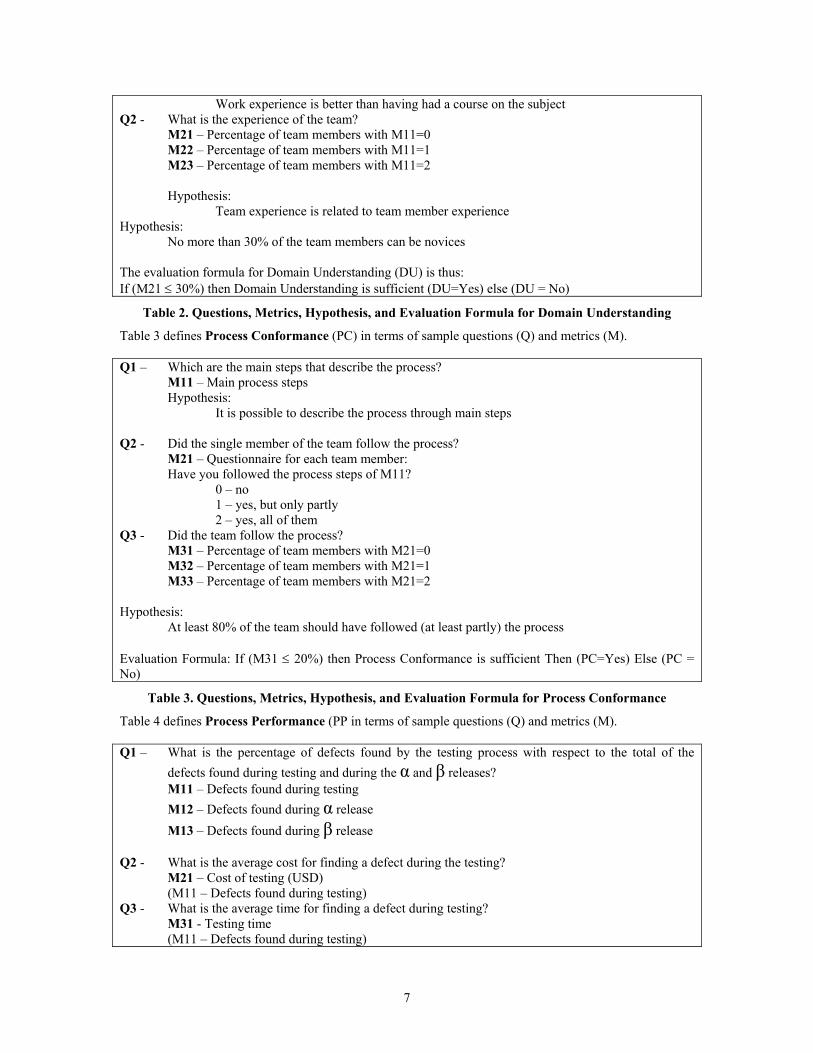
Work experience is better than having had a course on the subject
Q2 - What is the experience of the team?
M21 – Percentage of team members with M11=0
M22 – Percentage of team members with M11=1
M23 – Percentage of team members with M11=2
Hypothesis:
Team experience is related to team member experience
Hypothesis:
No more than 30% of the team members can be novices
The evaluation formula for Domain Understanding (DU) is thus:
If (M21 ≤ 30%) then Domain Understanding is sufficient (DU=Yes) else (DU = No)
Table 2. Questions, Metrics, Hypothesis, and Evaluation Formula for Domain Understanding
Table 3 defines Process Conformance (PC) in terms of sample questions (Q) and metrics (M).
Q1 – Which are the main steps that describe the process?
M11 – Main process steps
Hypothesis:
It is possible to describe the process through main steps
Q2 - Did the single member of the team follow the process?
M21 – Questionnaire for each team member:
Have you followed the process steps of M11?
0 – no
1 – yes, but only partly
2 – yes, all of them
Q3 - Did the team follow the process?
M31 – Percentage of team members with M21=0
M32 – Percentage of team members with M21=1
M33 – Percentage of team members with M21=2
Hypothesis:
At least 80% of the team should have followed (at least partly) the process
Evaluation Formula: If (M31 ≤ 20%) then Process Conformance is sufficient Then (PC=Yes) Else (PC =
No)
Table 3. Questions, Metrics, Hypothesis, and Evaluation Formula for Process Conformance
Table 4 defines Process Performance (PP in terms of sample questions (Q) and metrics (M).
Q1 – What is the percentage of defects found by the testing process with respect to the total of the
defects found during testing and during the α and β releases?
M11 – Defects found during testing
M12 – Defects found during α release
M13 – Defects found during β release
Q2 - What is the average cost for finding a defect during the testing?
M21 – Cost of testing (USD)
(M11 – Defects found during testing)
Q3 - What is the average time for finding a defect during testing?
M31 - Testing time
(M11 – Defects found during testing)
7
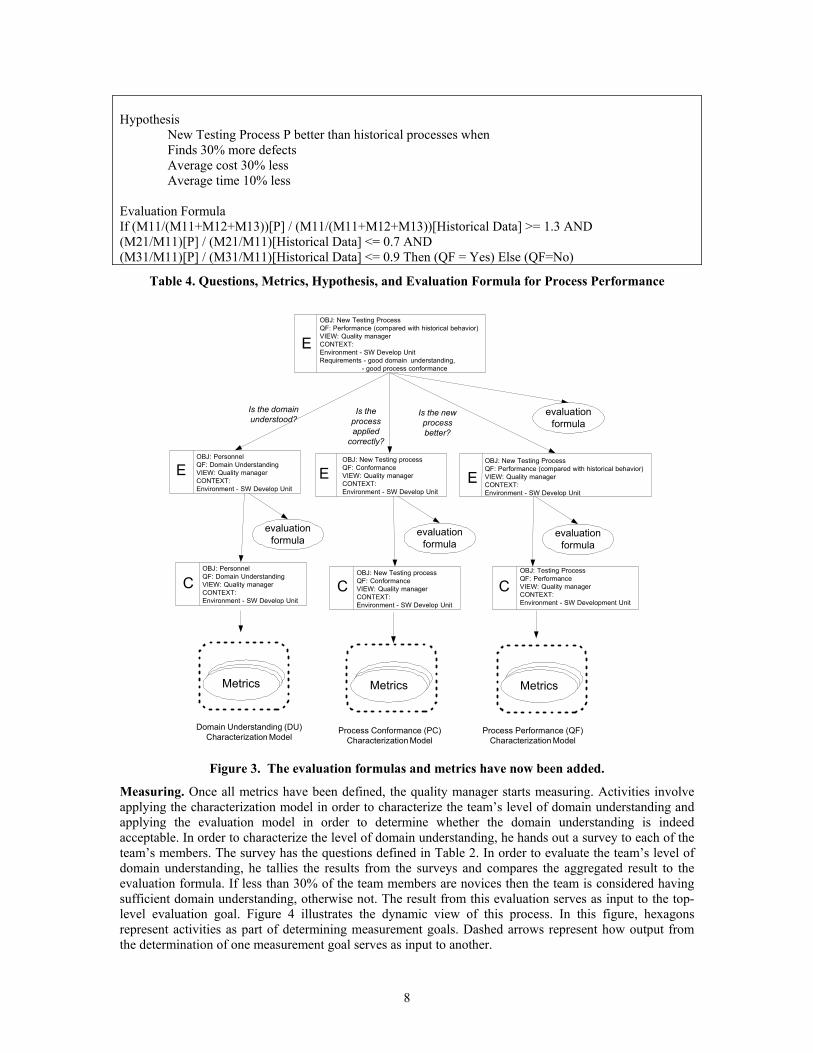
Hypothesis
New Testing Process P better than historical processes when
Finds 30% more defects
Average cost 30% less
Average time 10% less
Evaluation Formula
If (M11/(M11+M12+M13))[P] / (M11/(M11+M12+M13))[Historical Data] >= 1.3 AND
(M21/M11)[P] / (M21/M11)[Historical Data] <= 0.7 AND
(M31/M11)[P] / (M31/M11)[Historical Data] <= 0.9 Then (QF = Yes) Else (QF=No)
Table 4. Questions, Metrics, Hypothesis, and Evaluation Formula for Process Performance
Is the domain
understood?Is the
process
applied
correctly?
evaluation
formula
Is the new
process
better?
evaluation
formulaevaluation
formula
Metrics
Domain Understanding (DU)
Characterization Model
Metrics Metrics
Process Conformance (PC)
Characterization Model
Process Performance (QF)
Characterization Model
evaluation
formula
EOBJ: Personnel
QF: Domain Understanding
VIEW: Quality manager
CONTEXT:
Environment - SW Develop Unit
OBJ: New Testing process
QF: Conformance
VIEW: Quality manager
CONTEXT:
Environment - SW Develop Unit
E E
OBJ: New Testing Process
QF: Performance (compared with historical behavior)
VIEW: Quality manager
CONTEXT:
Environment - SW Develop Unit
C C
OBJ: Testing Process
QF: Performance
VIEW: Quality manager
CONTEXT:
Environment - SW Development Unit
OBJ: Personnel
QF: Domain Understanding
VIEW: Quality manager
CONTEXT:
Environment - SW Develop Unit
COBJ: New Testing process
QF: Conformance
VIEW: Quality manager
CONTEXT:
Environment - SW Develop Unit
E
OBJ: New Testing Process
QF: Performance (compared with historical behavior)
VIEW: Quality manager
CONTEXT:
Environment - SW Develop Unit
Requirements - good domain understanding,
- good process conformance
Figure 3. The evaluation formulas and metrics have now been added.
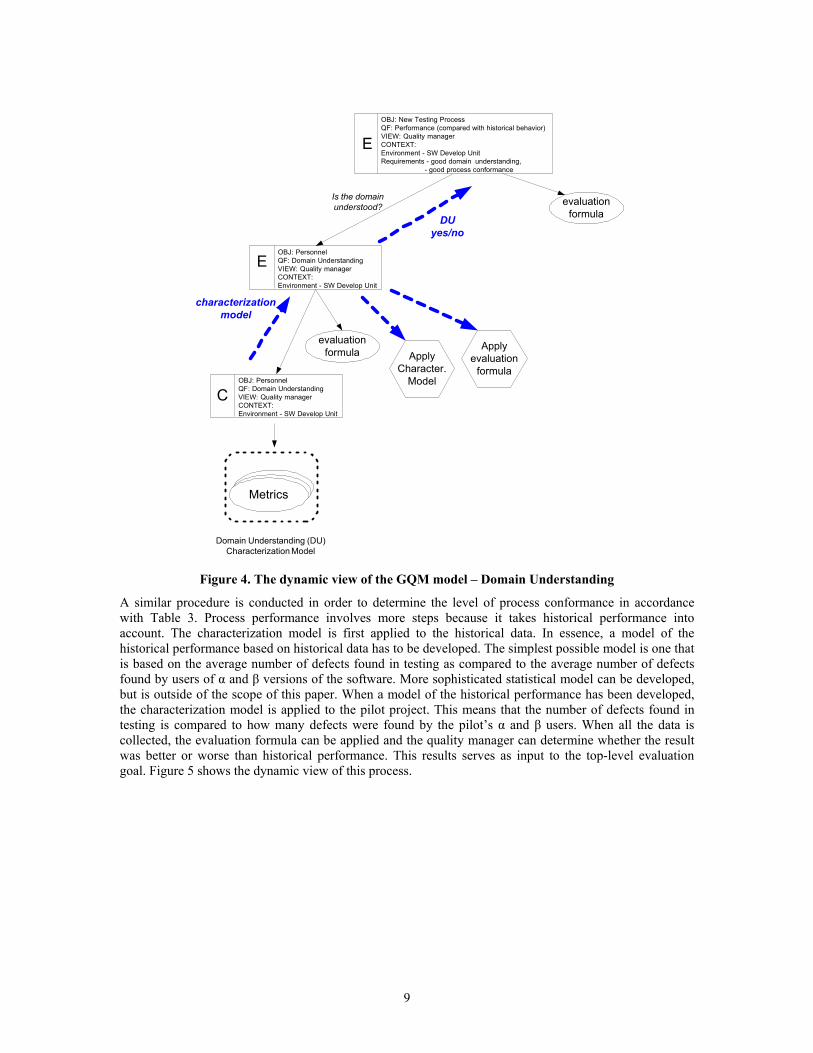
Measuring. Once all metrics have been defined, the quality manager starts measuring. Activities involve
applying the characterization model in order to characterize the team’s level of domain understanding and
applying the evaluation model in order to determine whether the domain understanding is indeed
acceptable. In order to characterize the level of domain understanding, he hands out a survey to each of the
team’s members. The survey has the questions defined in Table 2. In order to evaluate the team’s level of
domain understanding, he tallies the results from the surveys and compares the aggregated result to the
evaluation formula. If less than 30% of the team members are novices then the team is considered having
sufficient domain understanding, otherwise not. The result from this evaluation serves as input to the top-
level evaluation goal. Figure 4 illustrates the dynamic view of this process. In this figure, hexagons
represent activities as part of determining measurement goals. Dashed arrows represent how output from
the determination of one measurement goal serves as input to another.
8
EOBJ: Personnel
QF: Domain Understanding
VIEW: Quality manager
CONTEXT:
Environment - SW Develop Unit
DU
yes/no
characterization
model
Apply
evaluation
formula
evaluation
formula
Metrics
Domain Understanding (DU)
Characterization Model
Apply
Character.
Model
Is the domain
understood?
E
OBJ: New Testing Process
QF: Performance (compared with historical behavior)
VIEW: Quality manager
CONTEXT:
Environment - SW Develop Unit
Requirements - good domain understanding,
- good process conformance
COBJ: Personnel
QF: Domain Understanding
VIEW: Quality manager
CONTEXT:
Environment - SW Develop Unit
evaluation
formula
Figure 4. The dynamic view of the GQM model – Domain Understanding
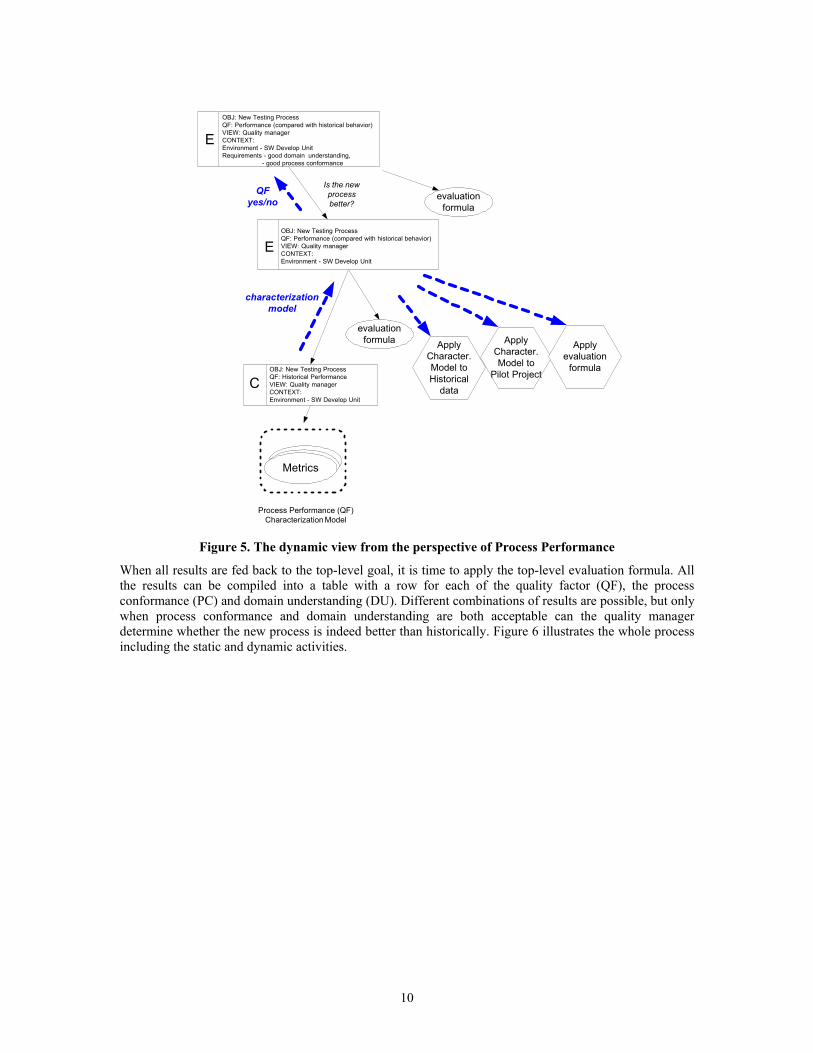
A similar procedure is conducted in order to determine the level of process conformance in accordance
with Table 3. Process performance involves more steps because it takes historical performance into
account. The characterization model is first applied to the historical data. In essence, a model of the
historical performance based on historical data has to be developed. The simplest possible model is one that
is based on the average number of defects found in testing as compared to the average number of defects
found by users of α and β versions of the software. More sophisticated statistical model can be developed,
but is outside of the scope of this paper. When a model of the historical performance has been developed,
the characterization model is applied to the pilot project. This means that the number of defects found in
testing is compared to how many defects were found by the pilot’s α and β users. When all the data is
collected, the evaluation formula can be applied and the quality manager can determine whether the result
was better or worse than historical performance. This results serves as input to the top-level evaluation
goal. Figure 5 shows the dynamic view of this process.
9
COBJ: New Testing Process
QF: Historical Performance
VIEW: Quality manager
CONTEXT:
Environment - SW Develop Unit
evaluation
formula
Metrics
Process Performance (QF)
Characterization Model
Apply
Character.
Model to
Pilot Project
Apply
Character.
Model to
Historical
data
Apply
evaluation
formula
characterization
model
QF
yes/no
Is the new
process
better?
E
OBJ: New Testing Process
QF: Performance (compared with historical behavior)
VIEW: Quality manager
CONTEXT:
Environment - SW Develop Unit
Requirements - good domain understanding,
- good process conformance
E
OBJ: New Testing Process
QF: Performance (compared with historical behavior)
VIEW: Quality manager
CONTEXT:
Environment - SW Develop Unit
evaluation
formula
Figure 5. The dynamic view from the perspective of Process Performance
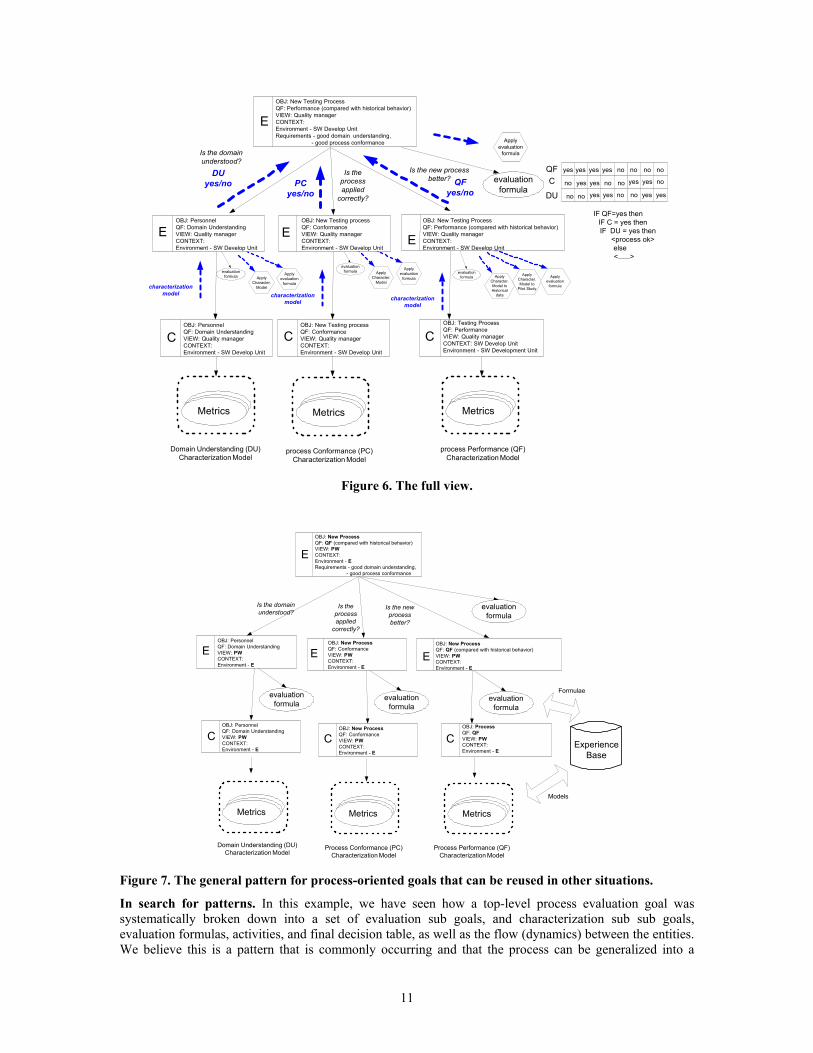
When all results are fed back to the top-level goal, it is time to apply the top-level evaluation formula. All
the results can be compiled into a table with a row for each of the quality factor (QF), the process
conformance (PC) and domain understanding (DU). Different combinations of results are possible, but only
when process conformance and domain understanding are both acceptable can the quality manager
determine whether the new process is indeed better than historically. Figure 6 illustrates the whole process
including the static and dynamic activities.
10
IF QF=yes then
IF C = yes then
IF DU = yes then
<process ok>
else
<......>
Is the new process
better?DU
yes/no PC
yes/no
QF
yes/no
Metrics
Domain Understanding (DU)
Characterization Model
Metrics Metrics
process Conformance (PC)
Characterization Model
process Performance (QF)
Characterization Model
Apply
evaluation
formula
evaluation
formula Apply
Character.
Model
Apply
evaluation
formula
evaluation
formula Apply
Character.
Model
characterization
model characterization
modelcharacterization
model
evaluation
formulaApply
Character.
Model to
Pilot Study
Apply
Character.
Model to
Historical
data
Apply
evaluation
formula
E
OBJ: New Testing Process
QF: Performance (compared with historical behavior)
VIEW: Quality manager
CONTEXT:
Environment - SW Develop Unit
Requirements - good domain understanding,
- good process conformance
EOBJ: Personnel
QF: Domain Understanding
VIEW: Quality manager
CONTEXT:
Environment - SW Develop Unit
OBJ: New Testing process
QF: Conformance
VIEW: Quality manager
CONTEXT:
Environment - SW Develop Unit
EE
OBJ: New Testing Process
QF: Performance (compared with historical behavior)
VIEW: Quality manager
CONTEXT:
Environment - SW Develop Unit
C C
OBJ: Testing Process
QF: Performance
VIEW: Quality manager
CONTEXT: SW Develop Unit
Environment - SW Development Unit
OBJ: Personnel
QF: Domain Understanding
VIEW: Quality manager
CONTEXT:
Environment - SW Develop Unit
COBJ: New Testing process
QF: Conformance
VIEW: Quality manager
CONTEXT:
Environment - SW Develop Unit
Is the domain
understood?
Is the
process
applied
correctly?
C
DU
QF no no no no
no no no no
no nono no
yes yes yes yes
yesyes
yes yes
yes yes
yesyes
evaluation
formula
Apply
evaluation
formula
Figure 6. The full view.
Is the domain
understood?Is the
process
applied
correctly?
evaluation
formula
Is the new
process
better?
evaluation
formulaevaluation
formula
Metrics
Domain Understanding (DU)
Characterization Model
Metrics Metrics
Process Conformance (PC)
Characterization Model
Process Performance (QF)
Characterization Model
evaluation
formula
EOBJ: Personnel
QF: Domain Understanding
VIEW: PW
CONTEXT:
Environment - E
OBJ: New Process
QF: Conformance
VIEW: PW
CONTEXT:
Environment - E
E E
OBJ: New Process
QF: QF (compared with historical behavior)
VIEW: PW
CONTEXT:
Environment - E
C C
OBJ: Process
QF: QF
VIEW: PW
CONTEXT:
Environment - E
OBJ: Personnel
QF: Domain Understanding
VIEW: PW
CONTEXT:
Environment - E
COBJ: New Process
QF: Conformance
VIEW: PW
CONTEXT:
Environment - E
E
OBJ: New Process
QF: QF (compared with historical behavior)
VIEW: PW
CONTEXT:
Environment - E
Requirements - good domain understanding,
- good process conformance
Experience
Base
Models
Formulae
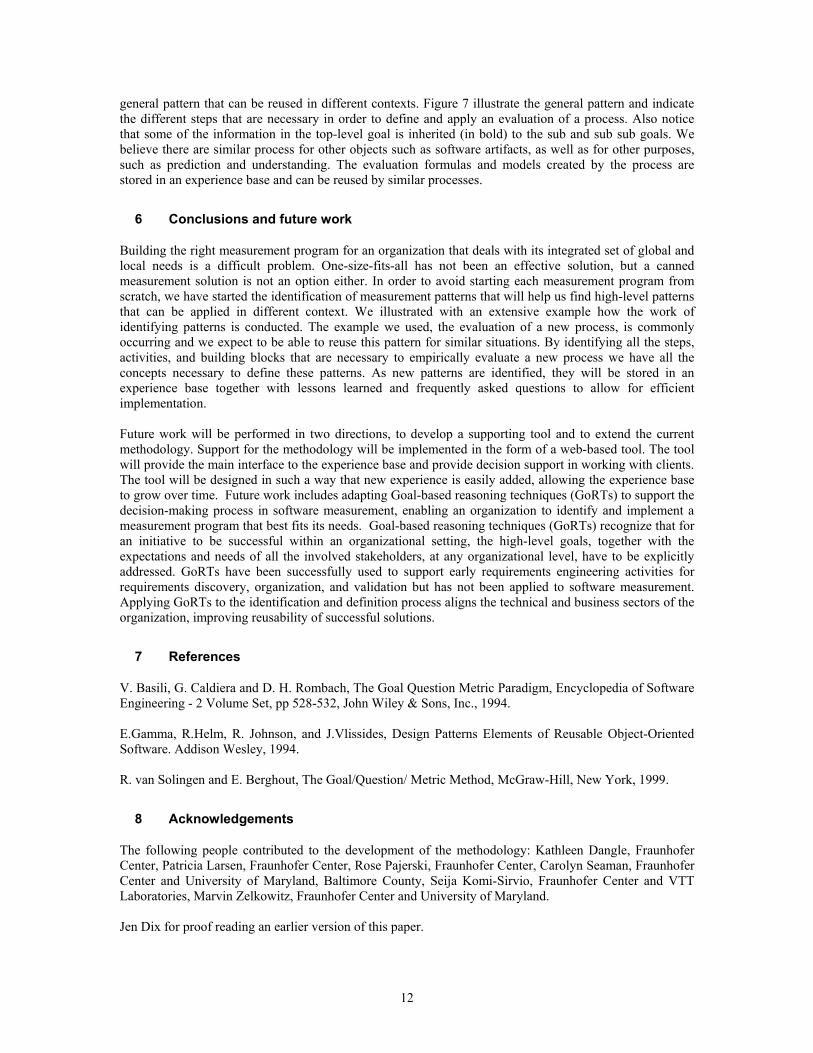
Figure 7. The general pattern for process-oriented goals that can be reused in other situations.
In search for patterns. In this example, we have seen how a top-level process evaluation goal was
systematically broken down into a set of evaluation sub goals, and characterization sub sub goals,
evaluation formulas, activities, and final decision table, as well as the flow (dynamics) between the entities.
We believe this is a pattern that is commonly occurring and that the process can be generalized into a
11
12
general pattern that can be reused in different contexts. Figure 7 illustrate the general pattern and indicate
the different steps that are necessary in order to define and apply an evaluation of a process. Also notice
that some of the information in the top-level goal is inherited (in bold) to the sub and sub sub goals. We
believe there are similar process for other objects such as software artifacts, as well as for other purposes,
such as prediction and understanding. The evaluation formulas and models created by the process are
stored in an experience base and can be reused by similar processes.
6 Conclusions and future work
Building the right measurement program for an organization that deals with its integrated set of global and
local needs is a difficult problem. One-size-fits-all has not been an effective solution, but a canned
measurement solution is not an option either. In order to avoid starting each measurement program from
scratch, we have started the identification of measurement patterns that will help us find high-level patterns
that can be applied in different context. We illustrated with an extensive example how the work of
identifying patterns is conducted. The example we used, the evaluation of a new process, is commonly
occurring and we expect to be able to reuse this pattern for similar situations. By identifying all the steps,
activities, and building blocks that are necessary to empirically evaluate a new process we have all the
concepts necessary to define these patterns. As new patterns are identified, they will be stored in an
experience base together with lessons learned and frequently asked questions to allow for efficient
implementation.
Future work will be performed in two directions, to develop a supporting tool and to extend the current
methodology. Support for the methodology will be implemented in the form of a web-based tool. The tool
will provide the main interface to the experience base and provide decision support in working with clients.
The tool will be designed in such a way that new experience is easily added, allowing the experience base
to grow over time. Future work includes adapting Goal-based reasoning techniques (GoRTs) to support the
decision-making process in software measurement, enabling an organization to identify and implement a
measurement program that best fits its needs. Goal-based reasoning techniques (GoRTs) recognize that for
an initiative to be successful within an organizational setting, the high-level goals, together with the
expectations and needs of all the involved stakeholders, at any organizational level, have to be explicitly
addressed. GoRTs have been successfully used to support early requirements engineering activities for
requirements discovery, organization, and validation but has not been applied to software measurement.
Applying GoRTs to the identification and definition process aligns the technical and business sectors of the
organization, improving reusability of successful solutions.
7 References
V. Basili, G. Caldiera and D. H. Rombach, The Goal Question Metric Paradigm, Encyclopedia of Software
Engineering - 2 Volume Set, pp 528-532, John Wiley & Sons, Inc., 1994.
E.Gamma, R.Helm, R. Johnson, and J.Vlissides, Design Patterns Elements of Reusable Object-Oriented
Software. Addison Wesley, 1994.
R. van Solingen and E. Berghout, The Goal/Question/ Metric Method, McGraw-Hill, New York, 1999.
8 Acknowledgements
The following people contributed to the development of the methodology: Kathleen Dangle, Fraunhofer
Center, Patricia Larsen, Fraunhofer Center, Rose Pajerski, Fraunhofer Center, Carolyn Seaman, Fraunhofer
Center and University of Maryland, Baltimore County, Seija Komi-Sirvio, Fraunhofer Center and VTT
Laboratories, Marvin Zelkowitz, Fraunhofer Center and University of Maryland.
Jen Dix for proof reading an earlier version of this paper.
Top Related
Copyright © 2022 FDOKUMEN

