


Bahasa
Halaman
Hukum


Toward the Value Growth Model of Social Commerce:
Taxonomy, Determinants, and the Effect of Humor on
Prosumer Engagement in Electronic Word-of-Mouth
Inaugural dissertation
submitted to attain the academic degree
doctor rerum politicarum
(Doktor der Wirtschaftswissenschaften)
at the
ESCP Europe Business School Berlin
by
M.Sc. Christian Münnich
born December 13th, 1988 in Berlin, Germany
Berlin
2019
DEDICATION
This dissertation is dedicated to Dr. med. Arno Münnich (†).
DOCTORAL EXAMINATION COMMITTEE
Head: Prof. Dr. Ulrich Pape
Examiner: Prof. Dr. Robert Wilken
Examiner: Jun.-Prof. Dr. Erik Maier
Day of the disputation: November 4th 2019

I
TABLE OF CONTENTS
TABLE OF CONTENTS .................................................................................................................................... I
LIST OF FIGURES ......................................................................................................................................... V
LIST OF TABLES ....................................................................................................................................... VII
LIST OF FORMULAS ................................................................................................................................. VIII
LIST OF ABBREVIATIONS, ACRONYMS AND SYMBOLS ............................................................................... IX
1 INTRODUCTION ................................................................................................................................... 1
1.1 RELEVANCE OF SOCIAL COMMERCE AND EWOM ........................................................................ 1
1.2 THE PARADIGM SHIFT FROM WIN-LOSE TO WIN-WIN EXCHANGES ................................................ 3
1.3 RESEARCH GAPS AND OBJECTIVES ............................................................................................... 8
1.4 RESEARCH APPROACH AND STRUCTURE .................................................................................... 11
2 CONCEPTUAL AND THEORETICAL FOUNDATIONS ............................................................................ 13
2.1 DIGITIZATION – ENABLER AND DRIVER OF E-COMMERCE .......................................................... 13
2.1.1 THE ALL-EMBRACING PHENOMENON ..................................................................................... 13
2.1.2 E-COMMERCE ........................................................................................................................ 15
2.2 SOCIAL MEDIA AND EWOM – THE NEW ‘SOCIAL’ IN COMMERCE ............................................... 18
2.2.1 SOCIAL MEDIA – PLATFORM OF COMMUNICATION AND SELF-PRESENTATION........................ 18
2.2.1.1 DEFINITION AND DISTINCTION OF SOCIAL MEDIA PLATFORMS ...................................... 18
2.2.1.2 SOCIAL MEDIA NETWORKS ........................................................................................... 20
2.2.1.3 SELF-PRESENTATION AND GROUPS ON SOCIAL MEDIA NETWORKS ................................ 22
2.2.1.4 PROSUMER ENGAGEMENT ON SOCIAL MEDIA NETWORKS ............................................. 24
2.2.2 ELECTRONIC WORD-OF-MOUTH – SOCIAL INTERACTION AND COMMERCIAL CONTENT ........ 26
2.2.2.1 DEFINITION AND PROSUMER ROLES .............................................................................. 26
2.2.2.2 WORD-OF-MOUTH VERSUS ELECTRONIC WORD-OF-MOUTH ........................................ 28
2.2.2.3 EWOM TYPES BY LEVEL OF COMMUNICATION AND INTERACTIVITY ........................... 31
2.2.2.4 EWOM TYPES BY MODE OF OCCURRENCE ................................................................... 32
2.3 SOCIAL COMMERCE – RISE OF A NOVEL BUSINESS MODEL ......................................................... 36
2.3.1 DEFINITION, DISTINCTION AND DESIGN ................................................................................. 36
2.3.2 THE VALUE GROWTH MODEL OF SOCIAL COMMERCE ........................................................... 39
2.4 THE UTILITARIAN PARADIGM IN SOCIAL COMMERCE ................................................................ 42
2.5 SUMMARY OF SOCIAL COMMERCE IN LIGHT OF THE UTILITARIAN EXCHANGE PARADIGM ......... 46
3 TAXONOMY AND DETERMINANTS OF ENGAGEMENT ....................................................................... 48
3.1 STATE OF RESEARCH ON PROSUMER EWOM ENGAGEMENT ...................................................... 48
3.1.1 OBJECTIVES AND APPROACH TO THE LITERATURE REVIEW.................................................... 48
3.1.2 OVERVIEW AND EVALUATION OF EXTANT KNOWLEDGE ........................................................ 51
3.1.3 INTERPRETATION AND RESEARCH GAPS ................................................................................ 58
3.2 PROSUMER DECISION MAKING AS SOCIAL EXCHANGE ................................................................ 65
3.2.1 DEVELOPMENT AND PRINCIPLES OF SOCIAL EXCHANGE THEORY ......................................... 65

II
3.2.2 PROSUMER DECISION MAKING BASED ON SOCIAL EXCHANGE THEORY................................. 67
3.3 RESEARCH MODEL OF PROSUMER ENGAGEMENT IN EWOM ...................................................... 72
3.3.1 PROSUMER RESEARCH FRAMEWORK ..................................................................................... 72
3.3.2 DEVELOPMENT OF RESEARCH QUESTIONS AND HYPOTHESES ................................................ 74
3.3.2.1 EWOM INHERENT PROSUMER DECISION-MAKING ATTRIBUTES .................................... 74
3.3.2.2 THE ATTRIBUTE IMPORTANCES, LEVEL PREFERENCES AND INTERACTION EFFECTS ...... 75
3.4 EMPIRICAL EXPLORATION OF PROSUMER ENGAGEMENT DETERMINANTS .................................. 80
3.4.1 RESEARCH DESIGN ................................................................................................................ 80
3.4.1.1 OBJECTIVES .................................................................................................................. 80
3.4.1.2 METHODOLOGY AND PROCEDURE ................................................................................ 81
3.4.2 ANALYSES AND RESULTS ...................................................................................................... 86
3.4.2.1 FIELDING AND SAMPLE ................................................................................................. 86
3.4.2.2 INTERVIEW TRANSCRIPTION ......................................................................................... 87
3.4.2.3 RESULTS OF THE QUALITATIVE CONTENT ANALYSIS.................................................... 88
3.4.2.4 RIGOR AND QUALITY EVALUATION ............................................................................... 91
3.4.2.5 ANALYSIS OF FURTHER QUANTITATIVE ITEMS .............................................................. 92
3.4.2.6 THE EWOM TAXONOMY AND ARCHETYPES ................................................................. 93
3.4.3 SYNTHESIS AND DISCUSSION ................................................................................................. 95
3.5 EMPIRICAL RESEARCH OF UTILITIES, IMPORTANCES AND ENGAGEMENTS .................................. 97
3.5.1 RESEARCH DESIGN ................................................................................................................ 97
3.5.1.1 OBJECTIVES .................................................................................................................. 97
3.5.1.2 VARIABLES, STIMULI AND OPERATIONALIZATIONS ....................................................... 98
3.5.1.3 METHODOLOGY AND STATISTICS ............................................................................... 102
3.5.1.4 SURVEY DESIGN AND TARGET SAMPLE ....................................................................... 113
3.5.2 ANALYSES AND RESULTS .................................................................................................... 116
3.5.2.1 SAMPLE AND CONDUCT OF THE CONJOINT ANALYSIS.................................................. 116
3.5.2.2 ATTRIBUTE IMPORTANCES.......................................................................................... 118
3.5.2.3 PROSUMER PREFERENCES OF ATTRIBUTE LEVELS ....................................................... 120
3.5.2.4 EFFECTS OF SOCIO-DEMOGRAPHIC VARIABLES ........................................................... 128
3.5.2.5 QUALITY EVALUATION OF THE ACBC ....................................................................... 130
3.5.3 POST-STUDY: THE PROSUMERS’ PREFERENCES FOR PRODUCT TYPES .................................. 132
3.5.3.1 CONCEPTUAL FOUNDATIONS AND RESEARCH DESIGN ................................................. 132
3.5.3.2 ANALYSES AND RESULTS ............................................................................................ 133
3.5.4 SYNTHESIS AND DISCUSSION ............................................................................................... 136
4 THE EFFECT OF HUMOR CATEGORIES ON EWOM ENGAGEMENT ................................................ 139
4.1 FOUNDATIONS OF HUMOR ........................................................................................................ 139
4.1.1 INTRODUCTION TO HUMOR .................................................................................................. 139
4.1.2 THE ENHANCED ENJOYMENT MODEL OF HUMOR ................................................................. 142
4.2 STATE OF HUMOR RESEARCH IN LIGHT OF EWOM ENGAGEMENT ............................................ 143
4.2.1 APPROACH TO AND CONDUCT OF LITERATURE REVIEW II .................................................... 143

III
4.2.2 INTERPRETATION AND RESEARCH GAPS .............................................................................. 146
4.3 SELF-DISCREPANCY THEORY AND HUMOR AS SOCIAL EXCHANGE ........................................... 147
4.4 RESEARCH FRAMEWORK AND HYPOTHESES ............................................................................. 150
4.4.1 RESEARCH FRAMEWORK ..................................................................................................... 150
4.4.2 HYPOTHESES DEVELOPMENT ............................................................................................... 152
4.5 EMPIRICAL RESEARCH ON HUMOR CATEGORIES....................................................................... 154
4.5.1 RESEARCH DESIGN .............................................................................................................. 154
4.5.1.1 OBJECTIVES ................................................................................................................ 154
4.5.1.2 VARIABLES, OPERATIONALIZATIONS AND STIMULI ..................................................... 155
4.5.1.3 PRE-STUDY ................................................................................................................. 156
4.5.1.4 METHODOLOGY AND STATISTICS ............................................................................... 158
4.5.1.5 SURVEY DESIGN AND TARGET SAMPLE ....................................................................... 160
4.5.2 ANALYSES AND RESULTS .................................................................................................... 161
4.5.2.1 SAMPLE AND DATA VALIDATION ................................................................................ 161
4.5.2.2 HYPOTHESES TESTING ................................................................................................ 162
4.5.2.3 FINDINGS ON CONTROL VARIABLES ............................................................................ 169
4.5.3 SYNTHESIS AND DISCUSSION ............................................................................................... 169
5 DISCUSSION ..................................................................................................................................... 174
5.1 RESULTS AND THEORETICAL CONTRIBUTIONS ......................................................................... 174
5.1.1 GENERAL SYNTHESIS AND OVERVIEW ................................................................................. 174
5.1.2 THE EWOM TAXONOMY ..................................................................................................... 176
5.1.3 THE ATTRIBUTE IMPORTANCES AND PROSUMER PREFERENCES ........................................... 177
5.1.4 THE EFFECT OF THE HUMOR CATEGORY ON EWOM ENGAGEMENT ..................................... 179
5.2 SUPPLEMENTARY STUDIES ....................................................................................................... 180
5.2.1 COMPLEMENTING CONTEXT FOR THE REFLECTION OF THE MAIN STUDIES ........................... 180
5.2.2 THE EFFECT OF EWOM OFFERS ON THE PRICING EXPERIENCE ............................................. 181
5.2.2.1 CONCEPTUAL FOUNDATIONS ...................................................................................... 181
5.2.2.2 RESEARCH DESIGN ..................................................................................................... 182
5.2.2.3 ANALYSES, RESULTS AND DISCUSSION ....................................................................... 185
5.2.3 THE CONCEPT OF EWOM ENGAGEMENT VALUE .................................................................. 189
5.2.3.1 RESEARCH DESIGN ..................................................................................................... 189
5.2.3.2 CONCEPTUALIZATION ................................................................................................. 191
5.2.3.3 DISCUSSION OF THE SUPPLEMENTARY STUDY............................................................. 203
5.2.4 SYNTHESIS OF SUPPLEMENTARY STUDIES ........................................................................... 204
5.3 MANAGERIAL IMPLICATIONS ................................................................................................... 205
5.3.1 BUSINESS MODELING AND PERFORMANCE MANAGEMENT ................................................... 205
5.3.2 SOCIAL MEDIA MARKETING ................................................................................................. 207
5.3.3 DIGITAL PRICING ................................................................................................................. 210
5.4 LIMITATIONS AND DIRECTIONS FOR FUTURE RESEARCH .......................................................... 211
5.4.1 SCOPE OF THE RESEARCHED CONSTRUCTS AND RELATIONSHIPS.......................................... 211

IV
5.4.2 RESEARCH METHODOLOGY AND RESULTS ........................................................................... 213
5.4.3 AVENUES FOR FUTURE RESEARCH IN SUMMARY ................................................................. 216
6 CONCLUSION ................................................................................................................................... 218
7 REFERENCES ................................................................................................................................... 220
8 APPENDIX ........................................................................................................................................ 243
V
LIST OF FIGURES
Figure 1: The win-lose paradigm in e-commerce ......................................................................................... 5
Figure 2: The win-win paradigm of the Value Growth Model ..................................................................... 7
Figure 3: The structure and contents of the dissertation ............................................................................. 12
Figure 4: E-commerce types defined by the involved market agents and technology ............................... 16
Figure 5: Comparison of social group sizes in offline and online environments ....................................... 23
Figure 6: Professional versus peer influencers on social media networks ................................................. 28
Figure 7: Forms of eWOM by communication and interactivity ............................................................... 32
Figure 8: Examples of incentivized eWOM in social commerce practice ................................................. 35
Figure 9: Social commerce combines e-commerce and social media technology...................................... 38
Figure 10: The Value Growth Model – Toward increased utility and value .............................................. 40
Figure 11: The three theoretical ratios of prosumer costs to business value .............................................. 41
Figure 12: The range of mutually beneficial discounts for eWOM ............................................................ 41
Figure 13: The utility motivated decision making process ......................................................................... 44
Figure 14: The process of creating the literature extract on prosumer engagement ................................... 51
Figure 15: Hauser’s reasoning for rational consideration set heuristics ..................................................... 68
Figure 16: The theoretical framework of prosumer decision making drawing on SET ............................. 71
Figure 17: The research framework for the determinants of prosumer engagement .................................. 73
Figure 18: The process of defining and applying the QCA to the research question ................................. 85
Figure 19: The priming scenario for the respondents ................................................................................. 86
Figure 20: Socio-demographic characteristics of the sample (1st study) .................................................... 87
Figure 21: Kuckartz’ systematic rules for verbatim transcriptions ............................................................ 88
Figure 22: The eWOM taxonomy, immanent attributes and resulting archetypes ..................................... 94
Figure 23: Conjoint interview flows: CBC versus ACBC ....................................................................... 111
Figure 24: Complete interview flow of the second study ......................................................................... 114
Figure 25: Data gathering and validation of the sample (2nd study) ......................................................... 116
Figure 26: Socio-demographic characteristics of the sample (2nd study) ................................................. 117
Figure 27: Digital Nativity scores in the sample ...................................................................................... 118
Figure 28: The importances of the prosumers’ decision attributes ........................................................... 119
Figure 29: eWOM engagements based on positive net utilities without prohibitions .............................. 127
Figure 30: The predictive validity of the model ....................................................................................... 131
Figure 31: Humor perception and outcomes in marketing ....................................................................... 140
Figure 32: The theoretical effect of humor on prosumer eWOM decision making .................................. 150
Figure 33: Research framework about the effect of humor category on eWOM ..................................... 151
Figure 34: Exemplary extract of the pre-study questionnaire including Zhang’s scale............................ 157
Figure 35: Selection of video stimuli to research the effect of humor categories .................................... 158
Figure 36: Data validation for the study on the effect of humor categories ............................................. 162
Figure 37: Cumulated acceptance curves per humor category to share eWOM....................................... 164
Figure 38: The effect of humor category on FreeWOM engagements in the form of liking .................... 168
Figure 39: Design of the fifth empirical study drawing on two online surveys ....................................... 185

VI
Figure 40: Constructs and relationships in the definition of eWOM engagement value .......................... 192
Figure 41: The nomological network of eWOM engagement value ........................................................ 202
Figure 42: High value - low effort eWOM archetypes should be offered to prosumers .......................... 206
Figure 43: Marketing managers can use warm humor for viral marketing campaigns ............................ 209
Figure 44: A comparison between countries of willingness to share personal data ................................. 215
VII
LIST OF TABLES
Table 1: Overview of the value and usage of relevant social media networks ........................................... 21
Table 2: Word-of-Mouth versus electronic Word-of-Mouth...................................................................... 30
Table 3: Augmented literature matrix I - The determinants of prosumer eWOM engagement .................. 57
Table 4: The open-ended questions of the interview guide ........................................................................ 81
Table 5: Final categorization matrix with the determinants of prosumer engagement ............................... 90
Table 6: Viera et al.’s interpretation of ranges of the Kappa statistic ........................................................ 92
Table 7: Complementary quantitative questionnaire items of the first study ............................................. 93
Table 8: Overview of decision making attributes and their definitions ...................................................... 94
Table 9: The investigated hypotheses of the second empirical study ......................................................... 97
Table 10: The utilities of the attribute levels ............................................................................................ 122
Table 11: Socio-demographic main effects on the number of eWOM engagements ............................... 128
Table 12: Augmented literature matrix II - The effect of humor on eWOM engagement ....................... 145
Table 13: The significant effect of the humor category on the WTA level to share ................................ 163
Table 14: The significant effect of the humor category on the WTA level to like ................................... 165
Table 15: Summary of findings on the effect of humor category on eWOM engagement ....................... 171
Table 16: Summary of findings on the effect of humor category on FreeWOM occurrence ................... 172
Table 17: Overview of hypotheses and test results on prosumer experience ........................................... 188
Table 18: Augmented literature matrix III: Constructs and relationships in eWOM engagement value.. 195
Table 19: Overview of limitations and derived avenues for future research ............................................ 217
VIII
LIST OF FORMULAS
Formula 1: The completeness and transitivity of prosumer preferences .................................................... 44
Formula 2: The utility function for single attribute profiles ....................................................................... 45
Formula 3: The utility function for multi-attribute profiles........................................................................ 45
Formula 4: Cohen’s Kappa ........................................................................................................................ 85
Formula 5: Choice probability in discrete choice analyses ...................................................................... 105
Formula 6: Elaboration of the choice probability ..................................................................................... 105
Formula 7: The deterministic utility component ...................................................................................... 105
Formula 8: The multi-nominal logit choice model for three choice options ............................................ 106
Formula 9: The utility function considering heterogeneous prosumer utilities ........................................ 106
Formula 10: The mixed-multi-nominal logit model (lower level model) ................................................ 106
Formula 11: The Bayes theorem of conditional probabilities .................................................................. 107
Formula 12: The multivariate normal distribution (upper level model) ................................................... 108
Formula 13: The ratio which indicates rejection or acceptance of beta estimations ................................ 110

IX
LIST OF ABBREVIATIONS, ACRONYMS AND SYMBOLS
ACA Adaptive Conjoint Analysis
ACBC Adaptive Choice-Based Conjoint Analysis
ANOVA Univariate analysis of variance
B2C Business-to-Consumer
BYO Build your own profile
CBC Choice-Based Conjoint Analysis
CD Ceiling reservation discount
CEO Chief-executive officer
CI Confidence interval
CLV Customer lifetime value
CMO Chief-marketing officer
CRM Customer relationship management
DAU Daily active users (unique)
DAX Deutscher Aktienindex (German Stock Index)
DNAS Digital Nativity Assessment Scale
EBA Eliminate-by-aspect heuristic
EMV Earned-media value
eWOM Electronic Word-of-Mouth
FD Floor reservation discount
GDPR General data protection regulation
HOC Holdout card
Ibid. Ibidem (in the same place)
I.e. Id est
MAU Monthly active users (unique)
MMNL Mixed-multi-nominal logit choice model
MNL Multi-nominal logit choice model
QCA Qualitative Content Analysis
RCT Rational Choice Theory
SET Social Exchange Theory
SLR Systematic literature review
SMN Social media network
UGC User generated content
URL Uniform resource locator
VGM Value Growth Model
WOM Word-of-Mouth
WTA Willingness-to-Accept
WTP Willingness-to-Pay
WTS Willingness-to-Share
x̃ Median
x̅ Arithmetic mean
ZCD Zero-centered differences (rescaling method)
Δ Delta (difference between to values)
ĸ Cohen’s Kappa
χ2 Chi-square
η2 Partial eta-squared
∝ Proportional to
Introduction 1
1 INTRODUCTION
1.1 RELEVANCE OF SOCIAL COMMERCE AND EWOM
“People influence people. Nothing influences people more than a recommendation from
a trusted friend. A trusted referral influences people more than the best broadcast
message. A trusted referral is the Holy Grail of advertising.”1
As so eloquently put by Facebook’s CEO Zuckerberg, such online peer-to-peer
recommendations, or more formally electronic Word-of-Mouth (eWOM), have a strong
impact on consumer behavior.2 Chan et al. attribute the role of an important information
source and basis for purchase decision-making to eWOM.3 See-To et al. also view the
direct impact of eWOM on the consumers’ purchase intentions as being attributable to
the rapid development of social media in the digital world.4 Social media is a focal point
of many peoples’ reality and a popular platform for eWOM communication.5 EWOM
describes much-noticed content about products or services that is easy to find, accessible,
and available for a long period of time.6 Since eWOM therefore wields a major influence
on what customers “know, feel and do”7, it receives a lot of attention from managers and
researchers in the field of digital marketing.8 Decreasing trust in corporations and the
exponential growth of available data on the Internet further promote eWOM as a
dominant decision aid in heuristic consumer decision making.9 So-called social media
“influencers” can often make a living, if not a fortune, by sharing eWOM with their
friends and followers. According to Hopper’s Instagram Rich List 2019, businesses value
the rising marketing format enormously, with international celebrities such as Christiano
Ronaldo (~173 million followers) or Kylie Jenner (~140 million followers) commanding
between €866,000 and €1,101,000 for each picture posted on the social media network
Instagram.10 Based on InfluencerDB’s Media Value, an estimation of the value of posts
1 Zuckerberg, Mark, Webpage of: https://techcrunch.com (2007). 2 Bone, Paula Fitzgerald (1995), p. 213-223. 3 Chan, Yolanda Y.Y./Ngai, E.W.T. (2011), p. 488. 4 See-To, Eric W.K./Ho, Kevin K.W. (2014), 182. 5 Globally, 45% of the population (3.484 billion) are active social media users (Kemp, 2019). 6 Reimer, Thomas/Benkenstein, Martin (2016), p. 323. 7 Yan, Qiang/Wu, Shuang/Wang, Lingli/Wu, Pengfei/Chen, Hejie/Wei, Guohong (2016), p. 63. 8 King, Robert Allen/Racherla, Pradeep/Bush, Victoria D. (2014), p.167-183. 9 Adamic, Lada A./Huberman, Bernardo A. (2002), p. 146 |
Sweeney, Jillian C./Soutar, Geoffrey N./Mazzarol, Tim (2008), p. 344. 10 Hopper, Webpage of: Hopper HQ Ltd. (2019). Applied exchange rate of €1.00 to $1.15 |
Instagram, Webpage of: Statista, Inc. (2019).
Introduction 2
by professional influencers on Instagram, a single post by the top German influencer
Bianca Claßen (@bibisbeautypalace) is worth more than €28,500.11
These extreme values cannot be created by ordinary social media users in absolute terms.
Nevertheless, regular social media users in contrast personally know most of their
network members and thus have a stronger tie to one another, resulting in a higher
perceived message credibility, engagement rates and purchase intentions.12 From the
perspective of marketing managers, the positive effect of eWOM on consumer purchase
decisions also provides social media users with the opportunity for significant value
contributions, potentially even with a greater relative value per friend and follower. Due
to their influence and nation-like size, mainstream social media users are a huge target
group for promoting social media marketing campaigns: the social media network Twitter
reached 330 million, Instagram 1,000 million, and Facebook even exceeded 2,300 million
active users in April 2019.13
Digitization, i.e. the proliferation of internet-based technologies, not only changes the
way people communicate and seek information, but it also shifts a significant share of
consumer demand into online channels.14 Retailers using Internet-based technologies to
sell goods (e-commerce businesses) face higher price transparency and thus higher price
elasticity than brick and mortar businesses.15 This puts pressure on margins, since
consumers are eager to change suppliers if discounts are given.
The combination of eWOM and e-commerce in one business model is called social
commerce, “one of the most challenging research arenas in the coming decade”.16 Social
commerce research is assigned to the social sciences and more specifically to the business
sciences.17 Therefore, the term “social” alludes to the relationships and interactions
between humans, while “commerce” is generally defined as the exchange of goods
between market agents.18 Jointly, social commerce denotes the application of social
media technologies to support interactions and contributions between businesses and
customers.19 For instance, Amazon, the most valuable company in the world in early 2019
11 Sonnenschein, Bernd. InfluencerDB Tech GmbH & Co. KG (2019), p. 1-2 (see Appendix A1). 12 Koo, Dong-Mo (2016), p. 48 | Chu, Shu-Chuan/Kim, Yoojung (2015), p. 65. 13 Statista, Inc., Webpage of: Statista, Inc. (2019). ID: 272014. 14 Milkau, Udo/Bott, Jürgen (2015), p. 322. 15 Ghose, Anindya/Yao, Yuliang (2011), p. 286. 16 Liang, Ting-Peng/Turban, Efraim (2014), p. 5-13. 17 Opp, Karl-Dieter (2014), p. 14. 18 Gabler Wirtschaftslexikon, Webpage of: Springer Fachmedien Wiesbaden GmbH (2018). 19 Liang, Ting-Peng/Turban, Efraim (2014), p. 9-11.
Introduction 3
(currently worth more than a trillion dollars) thrives on a social commerce business
model, since peer-to-peer interactions on the platform are a key component of the
business model depicted in Chapter 2.3.20 Digitization creates a variety of new and highly
relevant research themes, such as the factors that motivate previous solely consuming
customers to engage in eWOM and thus become prosumers.21 This coalescence of
business models and prosumer engagements needs to be investigated under the umbrella
of social commerce research.22
1.2 THE PARADIGM SHIFT FROM WIN-LOSE TO WIN-WIN
EXCHANGES
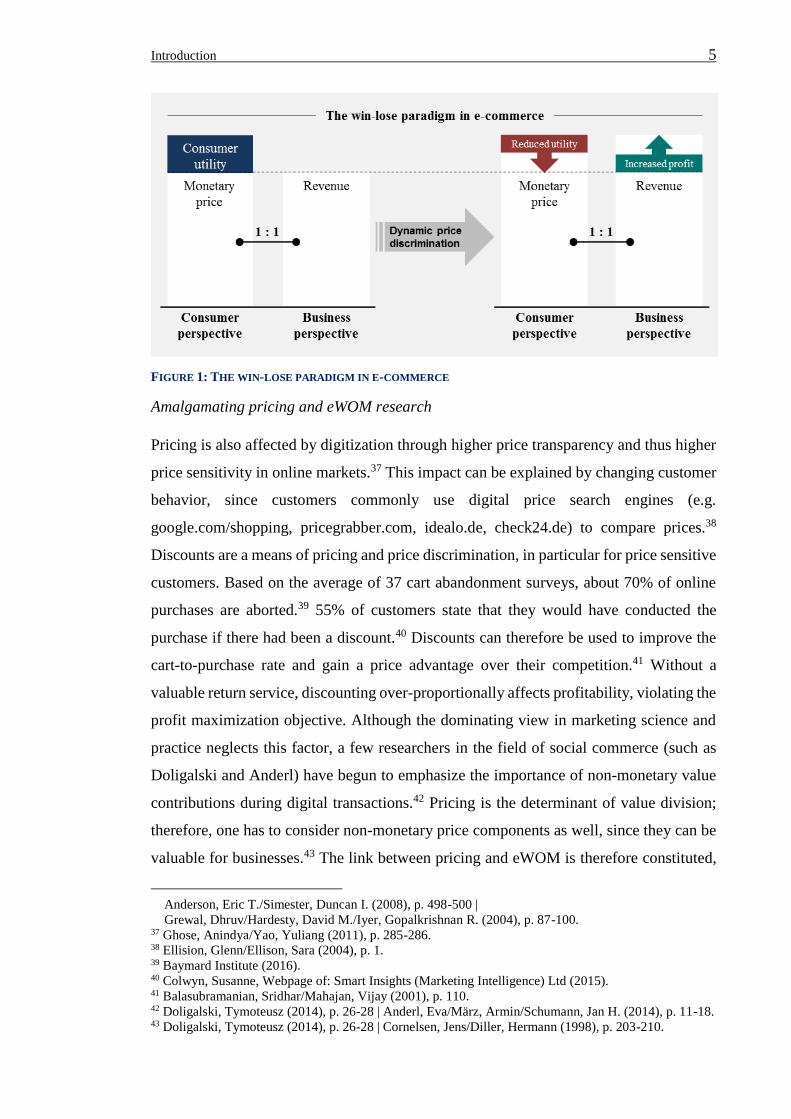
The predominant win-lose paradigm of e-commerce
Commercial transactions between prosumers and for-profit e-commerce businesses are
the research object of this work. In line with the focal axiom of profit maximization
immanent in the paradigm of Utilitarian Exchange, it can be assumed that profit
maximization is the key purpose of commercial enterprises.23 In order to pursue this
overarching objective, the two levers of business revenue and costs need to be optimized.
Starting with costs, marketing and advertising in particular are major cost factors that
amount to more than 10% of revenue when compared to e-commerce retailers such as
Zalando.24 This is a considerable amount, considering the low EBIT margin of about
5%.25 Since the effectiveness of traditional advertising formats is decreasing, new
marketing approaches have to be developed.26 EWOM is such a format, enabled by the
digitization of customer communication and purchase information search on social
networks.27 Trusov et al. found that eWOM is significantly more effective than traditional
marketing formats, such as marketing events or other media appearances, when it comes
to increasing the number of new sign-ups for an online platform that monetizes
advertisement revenues.28 In general, prosumers are assumed to share eWOM because of
motivational factors such as positive self-enhancement, social benefits, concern for other
20 Lin, Xiaolin/Li, Yibai/Wang, Xuequn (2017), p. 191 | Amazon was worth one trillion dollar by market capitalization on September 4th 2018. 21 Liang, Ting-Peng/Turban, Efraim (2014), p. 5. 22 Kannan, P. K./Li, Hongshuang Alice (2017), p. 25-28. 23 Choudhury, Masudul Alam (1994), p. 16 & 88. 24 Zalando SE. Zalando SE (2016), p. 5. 25 Zalando SE. Zalando SE (2016), p. 5. 26 Carl, Walter J. (2016), p. 624-626. 27 Erkan, Ismail/Evans, Chris (2016), p. 47-55. 28 Trusov, M./Bucklin, R. E./Pauwels, K. (2009), p. 90-102.
Introduction 4
customers, helping the company and possibly monetary incentives.29 Discounts are a type
of monetary incentive that could be used to elicit eWOM behavior. This exchange of a
monetary discount for non-monetary eWOM engagement value makes eWOM a potential
non-monetary price component.
Revenue, on the other hand, is shifting more and more toward the Internet. The volume
of revenue generated online is rising globally, and accounts for about $66.5 billion (2019
| business-to-consumer (B2C) only) in Germany alone, with an annual growth rate of
about 10 percent.30 This trend indicates the great and continuously growing importance
of e-commerce businesses, which are defined as vendors that offer goods and services
through online channels by integrating digital technologies into their customer-facing
processes.31 Drawing on this definition, the combined revenue of exclusively e-commerce
businesses and the online revenue of traditionally brick and mortar businesses is predicted
to reach a share of between 20.4 and 27.7 percent of total revenue in Germany by 2020.32
Besides sales volume, the price, as the determinant of value division between customer
and business, is the second factor which determines revenue.33 Traditionally, businesses
try to exploit the maximum Willingness-to-Pay (WTP) in solely monetary terms from
their customers, and consider the transaction value division a zero-sum situation.34 In this
dissertation, this mindset set is referred to as the win-lose paradigm of e-commerce and
has been enforced by advancements in digital technology. It has led to practices such as
dynamic pricing and personalized pricing, which seek to maximize short-term transaction
prices based on situative WTP estimates, resulting in reduced transaction utility (surplus)
for consumers.35 This destructive win-lose paradigm has also led to mistrust and a number
of other negative consumer responses (poorer customer attitudes and business
profitability), which makes these pricing practices a threat for customer utility (net
benefits for the customer), B2C respectively business-to-prosumer relationships and long-
term business profitability (see Figure 1 on the following page).36
29 Yap, Kenneth B./Soetarto, Budi/Sweeney, Jillian C. (2013), p. 67 | Wirtz, Jochen/Chew, Patricia (2002), p. 141-162. 30 IFH Köln/Handelsverband Deutschland, Webpage of: Statista, Inc. (2019). ID: 3979. 31 Rezaeian, Ali/Shokouhyar, Sajjad/Dehghan, Fariba (2016), p. 62-63. 32 Eichholz-Klein, Susanne/Heinze, Julia/Heinick, Hansjürgen/Brylla, Thomas. IFH Köln (2014), p. 1-13. 33 Doligalski, Tymoteusz (2014), p. 27. 34 Bertini, Marco/Gourville, John T. (2012), p. 96-104. 35 Miettinen, Topi/Stenbacka, Rune (2015), p. 67-68 | Liu, Qihong/Shuai, Jie (2013), p. 418. 36 Wu, Chi-Cheng/Liu, Yi-Fen/Chen, Ying-Ju/Wang, Chih-Jen (2012), p. 106-116 | Garbarino, Ellen/Maxwell, Sarah (2010), p. 1066-1072 | Bertini, Marco/Gourville, John T. (2012), p. 97 |
Introduction 5
FIGURE 1: THE WIN-LOSE PARADIGM IN E-COMMERCE
Amalgamating pricing and eWOM research
Pricing is also affected by digitization through higher price transparency and thus higher
price sensitivity in online markets.37 This impact can be explained by changing customer
behavior, since customers commonly use digital price search engines (e.g.
google.com/shopping, pricegrabber.com, idealo.de, check24.de) to compare prices.38
Discounts are a means of pricing and price discrimination, in particular for price sensitive
customers. Based on the average of 37 cart abandonment surveys, about 70% of online
purchases are aborted.39 55% of customers state that they would have conducted the
purchase if there had been a discount.40 Discounts can therefore be used to improve the
cart-to-purchase rate and gain a price advantage over their competition.41 Without a
valuable return service, discounting over-proportionally affects profitability, violating the
profit maximization objective. Although the dominating view in marketing science and
practice neglects this factor, a few researchers in the field of social commerce (such as
Doligalski and Anderl) have begun to emphasize the importance of non-monetary value
contributions during digital transactions.42 Pricing is the determinant of value division;
therefore, one has to consider non-monetary price components as well, since they can be
valuable for businesses.43 The link between pricing and eWOM is therefore constituted,
Anderson, Eric T./Simester, Duncan I. (2008), p. 498-500 | Grewal, Dhruv/Hardesty, David M./Iyer, Gopalkrishnan R. (2004), p. 87-100. 37 Ghose, Anindya/Yao, Yuliang (2011), p. 285-286. 38 Ellision, Glenn/Ellison, Sara (2004), p. 1. 39 Baymard Institute (2016). 40 Colwyn, Susanne, Webpage of: Smart Insights (Marketing Intelligence) Ltd (2015). 41 Balasubramanian, Sridhar/Mahajan, Vijay (2001), p. 110. 42 Doligalski, Tymoteusz (2014), p. 26-28 | Anderl, Eva/März, Armin/Schumann, Jan H. (2014), p. 11-18. 43 Doligalski, Tymoteusz (2014), p. 26-28 | Cornelsen, Jens/Diller, Hermann (1998), p. 203-210.
Introduction 6
because incentivized eWOM can depict a valuable return service and thus be integrated
as a non-monetary price component in exchange for a price discount.
Towards win-win transactions in social commerce through the Value Growth Model
Marketing managers seek to manage eWOM in order to reap a variety of positive effects
which create value for their businesses.44 The price discount could depict an effective
management instrument to motivate prosumer eWOM behavior. Offering a price discount
therefore depicts an option for marketing managers. Especially since computationally and
logic-driven decision support algorithms are being increasingly applied to business
operations, the axiom of choosing the profit maximizing alternative holds great
explanatory power.45 The Rational Choice Theory (RCT) evolved under the paradigm of
Utilitarian Exchange and explains this profit maximizing behavior from the perspective
of businesses in detail. As a consequence, the choice option (1) to receive eWOM value
reduced by the offered price discount needs to be more profitable than the alternative
choice option (2) of not offering the eWOM exchange. In other words, the estimated value
of the prosumers’ eWOM engagement depicts the reservation discount (ceiling discount),
which businesses offer at the maximum.
The Social Exchange Theory (SET) also evolved from the paradigm of Utilitarian
Exchange, but emphasizes the influence of social factors on human decision making and
behavior. The theory therefore provides a robust foundation for explaining prosumer
behavior on social media networks, such as engaging in eWOM.46 Such prosumer eWOM
engagement is of great importance for ensuring competitiveness in increasingly
interactive online environments and is defined as “the customer’s behavioral
manifestation toward a brand or firm, beyond purchase, resulting from motivational
drivers”.47 Common manifestations of prosumer engagement in the view of eWOM are
the sharing and liking of branded content on social media networks. Thus, while eWOM
creates value for businesses, prosumers at first perceive executional and cognitive costs
(demotivators) as being attributed to the eWOM engagement.48 Moreover, and in line
44 Barreda, Albert A./Bilgihan, Anil/Nusair, Khaldoon/Okumus, Fevzi (2015), p. 600-609 | Bone, Paula Fitzgerald (1995), p. 213-223 | Erkan, Ismail/Evans, Chris (2016), p. 47-55 | Kumar, V./Mirchandani, Rohan (2012), p. 55-61. 45 Manzo, Gianluca (2013), p. 377-378. 46 Tong, Yu/Xinwei Wang and Hock-Hai Teo (2007), p. 1 | Xi, Qinwei/Kukla, Matthew (2012), p. 151. 47 van Doorn, Jenny/Lemon, Katherine N./Mittal, Vikas/Nass, Stephan/Pick, Doreén/Pirner,
Peter/Verhoef, Peter C. (2010), p. 253 | Lemon, Katherine N./Verhoef, Peter C. (2016), p. 69-73. 48 Tong, Yu/Xinwei Wang and Hock-Hai Teo (2007), p. 3.
Introduction 7
with the business’ decision making process, prosumers consider the benefits (motivators
like price discount) to be related to the eWOM engagement. The difference between
benefits and costs (subjective utility perception) motivates or demotivates eWOM
engagement behavior.49 Prosumers therefore choose to engage in eWOM if the eWOM
discount offer overcompensates the perceived cognitive costs, as otherwise the
alternative, rejecting the offer, will be chosen. This reservation discount which derives
from prosumer cost perceptions is called the Floor Discount.
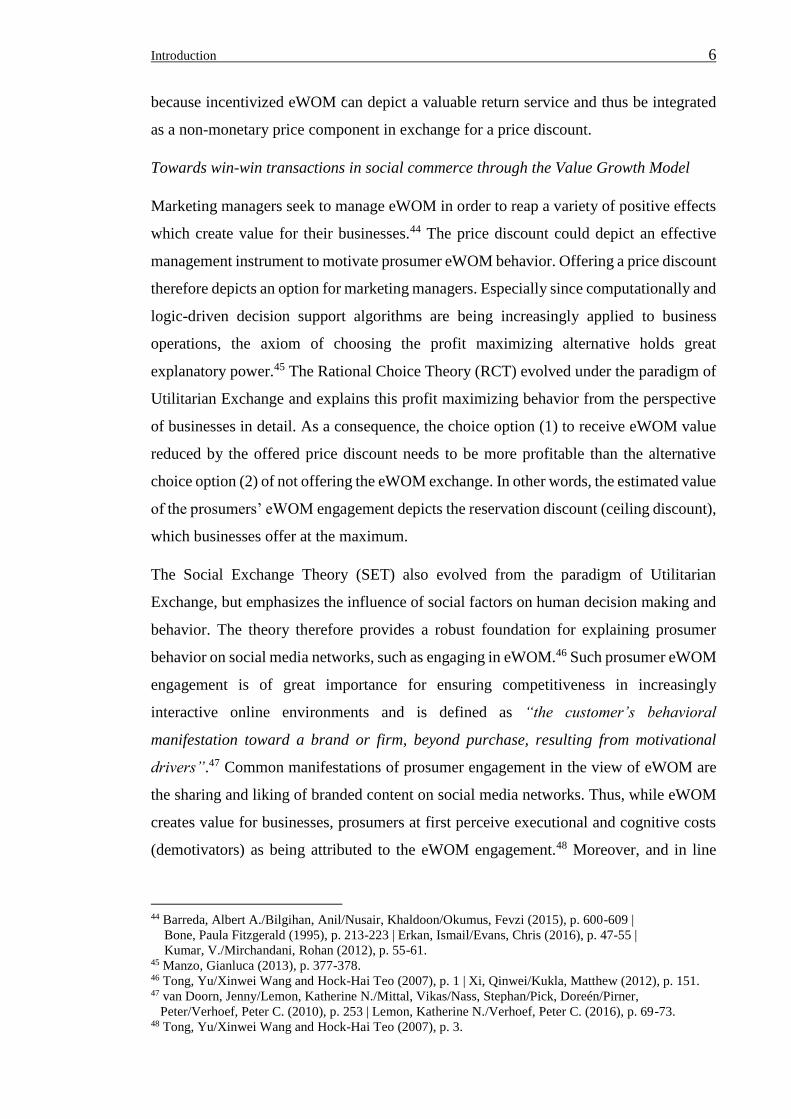
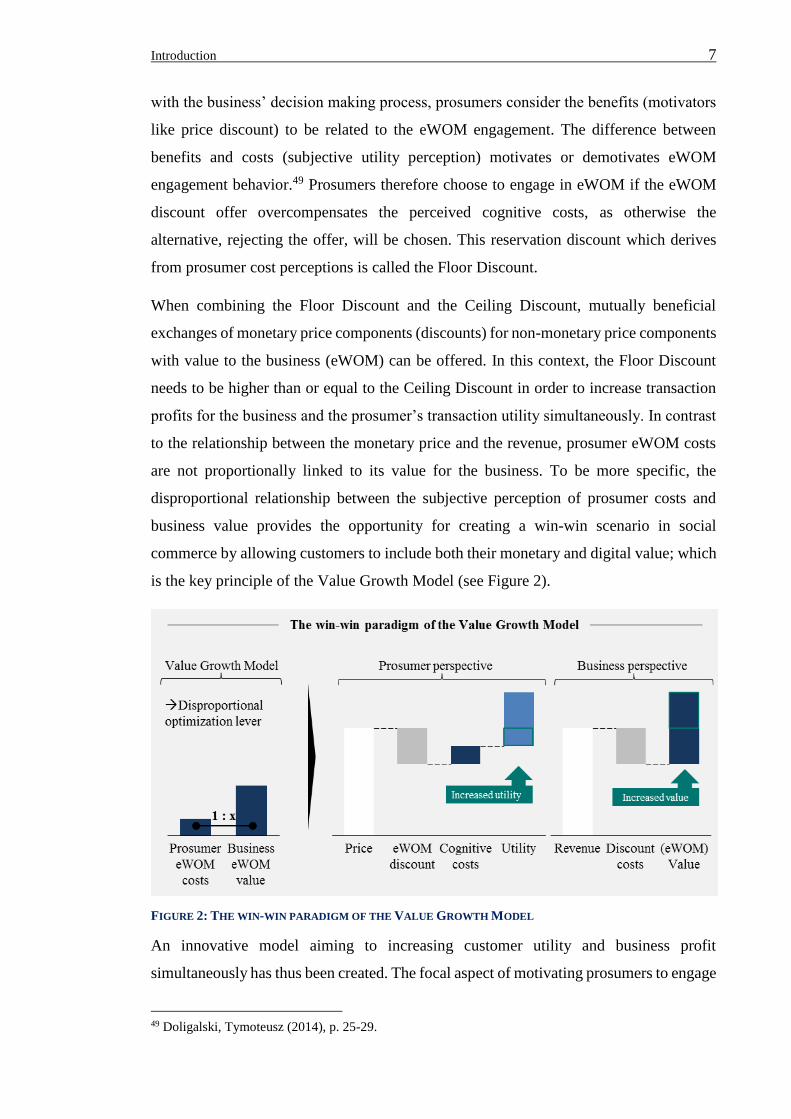
When combining the Floor Discount and the Ceiling Discount, mutually beneficial
exchanges of monetary price components (discounts) for non-monetary price components
with value to the business (eWOM) can be offered. In this context, the Floor Discount
needs to be higher than or equal to the Ceiling Discount in order to increase transaction
profits for the business and the prosumer’s transaction utility simultaneously. In contrast
to the relationship between the monetary price and the revenue, prosumer eWOM costs
are not proportionally linked to its value for the business. To be more specific, the
disproportional relationship between the subjective perception of prosumer costs and
business value provides the opportunity for creating a win-win scenario in social
commerce by allowing customers to include both their monetary and digital value; which
is the key principle of the Value Growth Model (see Figure 2).
FIGURE 2: THE WIN-WIN PARADIGM OF THE VALUE GROWTH MODEL
An innovative model aiming to increasing customer utility and business profit
simultaneously has thus been created. The focal aspect of motivating prosumers to engage
49 Doligalski, Tymoteusz (2014), p. 25-29.
Introduction 8
in the model of creating value for the social commerce business lays in the perceived
cognitive costs, benefits and thus utility of the offer. To research utility motivated
prosumer behavior, a definition of the distinct eWOM attributes is required. This depicts
the basis for a statistical analysis and the robust quantification of prosumer perceptions
as well as preferences, e.g. through applying implicit prosumer research methodologies
like the conjoint analysis.
1.3 RESEARCH GAPS AND OBJECTIVES
The Value Growth Model combines the business and prosumer perspective on eWOM
engagement in social commerce transactions. Extant literature has focused mainly on
customer value creation and measurers for businesses rather than investigating the
prosumer perspective (e.g. eWOM effect on sales and eWOM CLV extensions).50
Therefore, the complex phenomenon of prosumer eWOM engagement, especially on
social media networks, remains characterized by a variety of unanswered research
questions.51 Furthermore, the author’s access to profound prosumer data enables
empirical research based on both qualitative and quantitative methodologies surrounding
this important perspective. Due to the identified opportunities for contribution, given data
access and need to prioritize research questions in view of the broad research field, the
focus of the dissertation is the prosumers’ perspective.
THE FIVE RESEARCH OBJECTIVES REGARDING PROSUMER ENGAGEMENT IN EWOM
In summary, researchers in the fields of social commerce have primarily focused on the
value of eWOM for businesses, while the eWOM inherent determinants of prosumer
utility and thus engagement hitherto remain un-researched. Consequently, the extant
knowledge regarding the determinants of prosumer engagement in eWOM is scarce or
contradictory in many crucial points. Extant papers show limitations due to a combination
of the following three reasons: (1) the unidimensional treatment of multidimensional
constructs like eWOM and humor in eWOM designs, (2) the questionable generalization
of findings from small and homogenous convenience samples (often single university
50 Lemon, Katherine N./Verhoef, Peter C. (2016), p. 69-70 |
Green, Teegan Courtney Clare/Hartley, Nicole (2015), p. 301-307 | Babic, Ana/Sotgiu, Francesca/Valek, Kristine de/Bijmolt, Tammo H. A. (2015), p. 13-16.
51 King, Robert Allen/Racherla, Pradeep/Bush, Victoria D. (2014), p. 169-172 | Gvili, Yaniv/Levy, Shalom (2016), p. 1043-1044.
Introduction 9
samples) and (3) the missing consideration of eWOM on social media networks, due to a
focus on, e.g., emails.
Five overarching research gaps are derived from a systematic literature review and, at this
point, make up the basis of specifying research objectives. Achieving these research
objectives will create advancements in Social Exchange Theory, in the light of prosumer
decision-making processes for engaging in eWOM, which ultimately constitutes the main
contributions of this dissertation.
(1) The attributes which determine the manifold variations of eWOM from the prosumers’
perspective depict a fundamental lacunae in extant literature. The first objective is to
identify the decision-making criteria (attributes) and develop a eWOM taxonomy to
enable subsequent research on the multidimensional phenomenon.
(2) The relative importance of these attributes in the prosumer decision-making process
and their preferences regarding the levels of attributes are unknown. Since these aspects
are vital for understanding and explaining prosumer eWOM engagement, the second
research objective is to investigate eWOM attribute importances and prosumer
preferences for specific levels (attribute manifestations).
(3) The extant literature holds contradictory findings, surprisingly regarding both the
importance of the focal attribute “eWOM discount” and prosumer preference for different
discount levels. Resolving these inadequacies by undertaking in-depth research, using a
research design without the three aforementioned deficits, is the third research objective.
(4) Although socio-demographic characteristics were found to affect prosumer behavior
on social networks, their effect on prosumer engagement in eWOM reveals a research
gap. The investigation of such effects based on Digital Nativity, employment status, and
education makes up the fourth research objective.
(5) Humor is one of the most popular communication techniques in advertising, due to its
positive effect on, for example, customer purchase intentions.52 Moreover, the sharing of
humorous content (like ads) is used by prosumers to curate digital personas, with
corresponding and favorable personality traits. Humorous eWOM might therefore affect
prosumer utility perceptions in the course of engagement decision making. This makes
humor a potentially important feature of eWOM designs. In extant eWOM literature, the
52 Eisend, Martin (2009), p. 197-199.
Introduction 10
effect of the multidimensional humor construct has, so far, been neglected. Closing this
research gap by testing well-theorized hypotheses is the fifth research objective, regarding
the determinants of prosumer engagement in eWOM.
The prosumer perspective in the Value Growth Model thus comprises five overarching
research gaps, which provide the opportunity to answer explicit calls for future research
and create highly relevant contributions to the field of social commerce.
THE SUPPLEMENTARY CONCEPTUALIZATION OF EWOM ENGAGEMENT VALUE FOR BUSINESSES
In times of digitization, businesses need to consider both the monetary and non-monetary
value of their customers in order to understand the advantages of a transaction as well as
the entire prosumer relationship. Therefore, combining the solely monetary customer
lifetime value (CLV) with the non-monetary concepts of “Customer Social Media
Value”53; “Customer Referral Value”54, “Business Reference Value”55 or “Customer
Influence Value”56 allows for a more realistic conception of the actual total benefits which
a prosumer relationship contributes to a business. The manifold lifetime-oriented
indicators support the importance of eWOM as a strategic, non-monetary value
contribution, but often have major conceptual limitations. The value of eWOM is
currently calculated proportionally to the monetary margin metric CLV, which is
problematic for a variety of reasons, such as the calculation of eWOM value from non-
paying customers.57
Moreover, a variety of fragmented findings about the positive effects of eWOM have
been published in recent years that exceed the dimension of monetary margins. However,
a concept for the distinct eWOM engagement value (single engagements) for businesses
that mitigates the aforementioned issues does not currently exist in literature.
Therefore, in a supplementary business-oriented study, MacInnis framework for
conceptual contribution is followed, in order to (1) define the distinct research entity of
eWOM engagement value, (2) summarize extant knowledge through a systematic
literature review and (3) delineate further constructs to rigorously develop the currently
lacking nomological network of eWOM engagement value.
53 Weinberg, Bruce D./Berger, Paul D. (2011), p. 328-344. 54 Kumar, V./Petersen, J. Andrew/Leone, Robert P. (2007), p. 3-10. 55 Kumar, V./Petersen, J. Andrew/Leone, Robert P. (2013), p. 68-86. 56 Ho, Teck-Hua/Li, Shan/Park, So-Eun/Shen, Zuo-Jun Max (2012), p. 236. 57 Weinberg, Bruce D./Berger, Paul D. (2011), p. 339-342.
Introduction 11
1.4 RESEARCH APPROACH AND STRUCTURE
The dissertation is structured in five consecutive parts.
Following the introduction, in the second chapter the key concepts are defined. The Value
Growth Model is developed and presented in greater detail. The Utilitarian Exchange
paradigm is introduced, which represents normative assumptions, provides the
overarching set of decision making theories and is consistently followed in this
dissertation. Ultimately this depicts the basis for explaining novel construct relationships
and thus developing sound research frameworks for the empirical studies.
In the third chapter, the eWOM taxonomy and determinants of eWOM engagement are
researched. For this purpose, a systematic literature review is first conducted, to
synthesize extant knowledge and identify existing research gaps and inadequacies.
Subsequently, the Utilitarian Social Exchange Theory is introduced, in light of prosumer
decision-making in social commerce exchanges. Drawing on the opportunities for
contribution and theoretical foundations, the research framework, including research
questions and hypotheses, is developed. In accordance with the research framework, the
eWOM’s inherent attributes (that determine prosumer engagement) are empirically
explored, in order to develop the first eWOM taxonomy. These attributes are then further
investigated based on two empirical studies for their relative importance, prosumer
preferences for distinct attribute levels, socio-demographic effects on utility perceptions
and attribute level interactions.
The fourth chapter is concerned with the effect of humor as a multidimensional construct
on prosumer engagement in eWOM on social media networks. Using the same structure
as the previous chapter, opportunities for contribution are developed based on a
systematic literature review. Humor theories are then integrated into the prosumers’
utility motivated decision-making process immanent in Social Exchange Theory. Next,
the research framework is developed and successively investigated based on the fourth
empirical study.
Fifth and finally, the theoretical contributions of the empirical main studies about the
prosumer perspective on the Value Growth Model are synthesized. Two supplementary
studies were also conducted, to provide a more profound context for interpreting the
discussed main studies, to complement the prosumer perspective with a conceptual
contribution regarding the business perspective and to create a framework for future
Introduction 12
research opportunities regarding the business perspective on the Value Growth Model.
The manifold managerial implications of the studies are presented, followed by a critical
summary of the research limitations, which also represents the entire avenues for future
research. A conclusion then completes the dissertation.
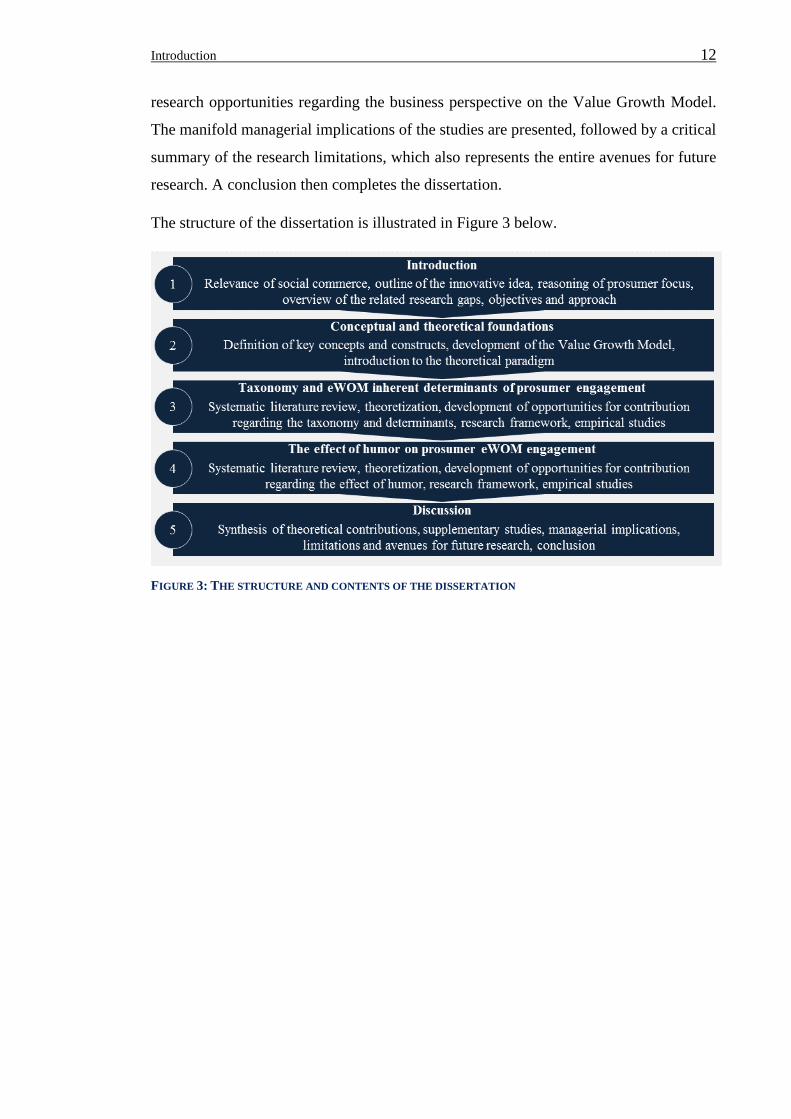
The structure of the dissertation is illustrated in Figure 3 below.
FIGURE 3: THE STRUCTURE AND CONTENTS OF THE DISSERTATION
Conceptual and theoretical foundations 13
2 CONCEPTUAL AND THEORETICAL FOUNDATIONS
2.1 DIGITIZATION – ENABLER AND DRIVER OF E-COMMERCE
2.1.1 THE ALL-EMBRACING PHENOMENON
Digitization is an all-embracing and ubiquitous phenomenon.58 It is defined as the
combination and proliferation of computing devices, the use of Internet-based
technologies and the leverage of data analytics in the interaction between customers and
businesses.59
Digital devices are available in four major categories: desktop PCs, laptops, tablets and
smartphones. In Germany alone, there are 57 million smartphone users, who are 14 years
old and above.60 By age groups, ownership is 41% (65 and older), 88% (50-64), 97% (30-
49) and 95% (14 to 29).61
Furthermore, the extent to which digitization has occurred, becomes manifest in a daily
Internet usage rate of about 87% in the German population.62 To emphasize the
importance of this statistic, one has to look at some other common prosumer behavior for
comparison. For example, less than 79% of Germans (older than 15) watch TV on a daily
basis,63 less than 75% of Germans between the ages of 18 and 70 brush their teeth in the
morning, 64 less than 49% of Germans (older than 14) read a book at least once a month.65
The use of Internet-based technologies not only affects people regarding their interaction
with businesses, but holistically in their everyday lives. Growing up with digital
technologies has even caused a change in the brain structures of people, creating a
different way of processing information, thinking and behaving, when compared to older
generations.66 To account for the development of a new prosumer segment, different
terms have been identified. Prensky introduced the term “digital natives” in 2001, which
is the most commonly-used term in scientific literature today for this generation.67 It
describes people who were born after 1980, who grew up with the aforementioned
58 Phua, Joe/Kim, Jihoon (2018), p. 1524. 59 Milkau, Udo/Bott, Jürgen (2015), p. 322. 60 Bitcom Research, Webpage of: Statista, Inc. (2018). p. 1. 61 Bitcom Research, Webpage of: Statista, Inc. (2017). p. 1. 62 We Are Social/Google, Webpage of: Statista, Inc. (2018). p. 1. 63 European Commission. Statista, Inc. (2018), p. 5. 64 Splendid Research, Webpage of: Statista, Inc. (2016). p. 1. 65 Arbeitsgemeinschaft Verbrauchs- und Medienanalyse (VuMA). Statista, Inc. (2018), p. 1. 66 Teo, Timothy (2013), p. 51. 67 Prensky, Marc (2001), p. 1-6.
Conceptual and theoretical foundations 14
technological innovations and use them as effortlessly, as if they were speaking their
mother tongue.68 Other related names are the (inter-)net generation69, screenagers70, or
Millennials71, which all describe the technology-savvy generation of people born between
1980 and the early 2000s. These terms are used interchangeably.72 Older generations are
named digital immigrants, who were later introduced to the digital technologies and who
do not use the technology as much or as effortlessly.73 Unsurprisingly, digital natives
show lower Internet anxiety scores and higher Internet engagement rates, as well as higher
trust rates for online brands.74 Nevertheless, professional and passionate Internet users
born before 1980 were discovered as well. These naturalized digitals show even higher
online trust dispositions when compared to digital natives, and a high digital self-
efficacy.75 To operationalize the varying degrees of Digital Nativity, Teo developed and
validated the Digital Natives Assessment Scale.76 This scale accounts for prosumer
differences, since age alone depicts an improvable proxy for Digital Nativity.77 The
questionnaire includes four sections and 21 items, ranging from technological usage
during childhood, ability to multitask, reliance on graphical communication, and the need
for instant gratification.78 The different segments of Digital Nativity allow businesses to
adjust their way of doing business according to the varying needs and abilities of their
customers (e.g. more assistance for elderly people using e-commerce apps).
A consequence of the prosumers’ rapid increase in online activity, combined with the
online activity of machines or sensors, is that data traffic on the Internet has been growing
exponentially from 100GB per day in 1992, to 100GB per second in 2002, to an expected
rate of over 100,000 GB per second in 2021.79 This trend is called Big Data, which refers
to the four dimensions of rapid growth in data volume, variety, velocity and value.80 This
volume alludes to the vast quantity of stored bytes, while the variety describes the
68 Prensky, Marc (2001), p. 1. 69 Tapscott, Don (1998), p. 15-35. 70 Kaplan, Andreas M./Haenlein, Michael (2010), p. 61. 71 Howe, Neil/Strauss, William (2000), p. 3-11. 72 Jones, Chris/Ramanau, Ruslan/Cross, Simon/Healing, Graham (2010), p. 723. 73 Hoffmann, Christian Pieter/Lutz, Christoph/Meckel, Miriam (2015), p. 144-154. 74 Joiner, Richard/Gavin, Jeff/Brosnan, Mark/Cromby, John/Gregory, Helen/Guiller, Jane/Maras,
Pam/Moon, Amy (2013), p. 550. 75 Ibid., p. 144-162. 76 Teo, Timothy (2013), p. 51. 77 Akçayır, Murat/Dündar, Hakan/Akçayır, Gökçe (2016), p. 435-437. 78 Teo, Timothy (2013), p. 55. 79 Cisco public, Webpage of: Cisco (2017). p. 5-6. 80 Hashem, Ibrahim Abaker Targio/Yaqoob, Ibrar/Anuar, Nor Badrul/Mokhtar, Salimah/Gani,
Abdullah/Ullah Khan, Samee (2015), p. 98-115.
Conceptual and theoretical foundations 15
different types of data.81 Velocity refers to the accelerating speed of data transfer, whilst
value describes the financial worth of the data.82 Although intangible, data is a primary
source of business model innovation, prosumer value and therefore has created a “Big
Data Gold Rush” in business, as well as several prominent research streams in science.83
Some authors add “veracity” as a fifth dimension, which alludes to the varying quality of
the data.84
2.1.2 E-COMMERCE
All of the properties regarding digitization have contributed to the foundation of digital
marketing as a distinct research stream in science,85 as well as to the growing importance
of e-commerce (also called e-retailing)86, which depicts the digitization of shops to
business models thriving as online marketplaces.87 There are many and more specific
definitions of e-commerce, which are tailored to different perspectives on e-commerce,
such as the value-chain view (e-commerce as a set of value activities), the trading view
(e-commerce as the sole exchange of goods for money through electronic networks) and
the information view.88 The latter extends the trading view by information, as a
communicative antecedent and successor of commercial transactions, exchanged between
(potential) customers and businesses.89 Following on from this view, e-commerce is,
through the course of this dissertation, defined as a digital business model in which online
communication enables the support and realization of the transaction of goods, services
and information via the Internet.90
There are different types of e-commerce that fall under this definition, differing in the
market agents involved and technology used. The agent-based typology differentiates the
same types of constellations between businesses (B), governments (G) and consumers (C)
that can be found in traditional analogous markets.91 An exception that holds tremendous
potential regarding the future of the digitally connected value chains is seen in
81 Hashem, Ibrahim Abaker Targio/Yaqoob, Ibrar/Anuar, Nor Badrul/Mokhtar, Salimah/Gani,
Abdullah/Ullah Khan, Samee (2015), 98-115. 82 Ibid., p. 98-115. 83 Chun, Se-Hak (2018), p. 5474 – 5477. 84 White, Martin (2012), p. 211. 85 Kannan, P. K./Li, Hongshuang Alice (2017), p. 22-45. 86 Srinivasana, Srini S./Andersona, Rolph/Ponnavolu, Kishore (2002), p. 41-50. 87 Tamimi, Nabil/Sebastianelli, Rose (2015), p. 169. 88 Holsapple, Clyde W./Singh, Meenu (2000), p. 151-164. 89 Ibid. 90 Turban, Efraim/King, David R./Lee, Jae Kyu/Liang, Ting-Peng/Turban, Deborrah C. (2015), p. 5. 91 Ibid., p. 10-14.
Conceptual and theoretical foundations 16
transactions involving machines (M). These M2M or B2M e-commerce businesses
directly connect machines to buy or sell goods, services and information.92 Often, e-
commerce businesses have a primary focus of one type; Amazon for instance, focuses on
B2C, eBay on C2C and eWorldTrade on B2B transactions. They all diversify into other
market segments too. In e-commerce literature, Internet commerce is sometimes used
synonymously with e-commerce and includes all types of web-enabled devices, which
allow users to engage in Internet-based transactions. A subcategory of e-commerce is
mobile commerce (m-commerce), which alludes to the usage of smartphones as well as
tablets in online shopping and its effect on e-commerce websites and apps.93 While both
e-commerce and m-commerce revenues are growing quickly and at the expense of brick
and mortar businesses, m-commerce grows even more quickly and outpaces e-commerce
transactions from desktop PCs as well as laptops. The German B2C e-commerce fashion
retailer Zalando reported an m-commerce share of 26.8% in 201394, compared to 70.7%
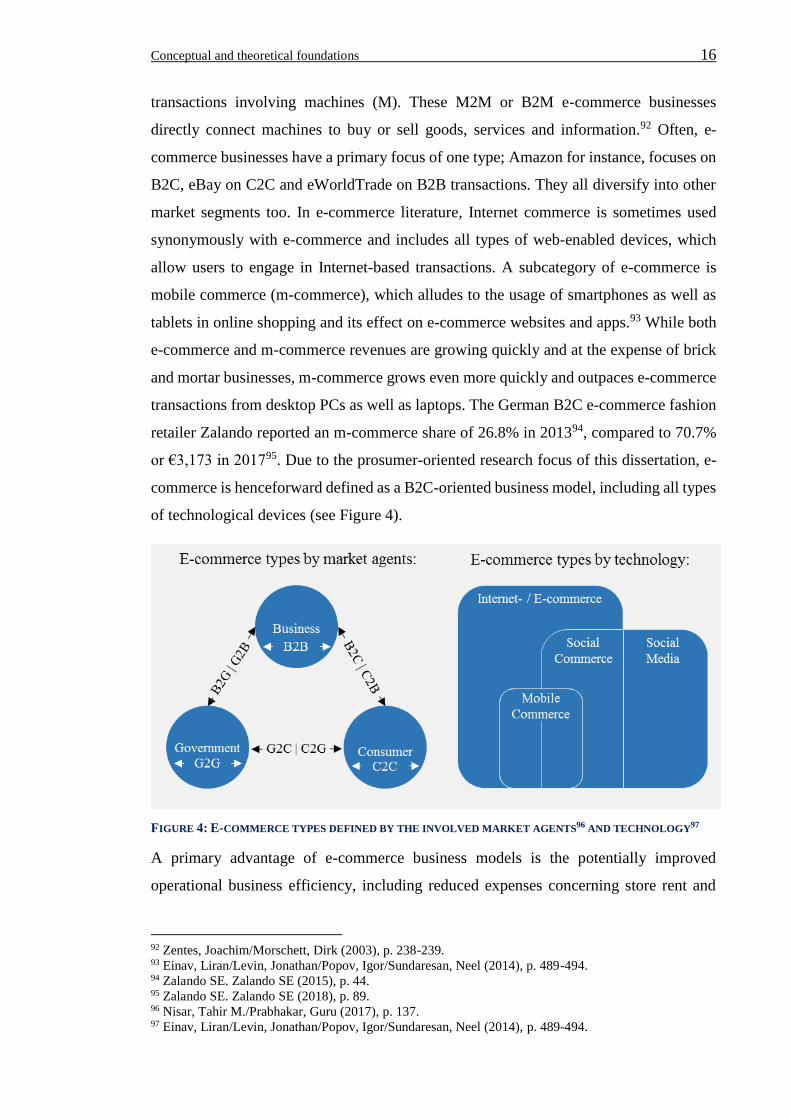
or €3,173 in 201795. Due to the prosumer-oriented research focus of this dissertation, e-
commerce is henceforward defined as a B2C-oriented business model, including all types
of technological devices (see Figure 4).
FIGURE 4: E-COMMERCE TYPES DEFINED BY THE INVOLVED MARKET AGENTS96 AND TECHNOLOGY97
A primary advantage of e-commerce business models is the potentially improved
operational business efficiency, including reduced expenses concerning store rent and
92 Zentes, Joachim/Morschett, Dirk (2003), p. 238-239. 93 Einav, Liran/Levin, Jonathan/Popov, Igor/Sundaresan, Neel (2014), p. 489-494. 94 Zalando SE. Zalando SE (2015), p. 44. 95 Zalando SE. Zalando SE (2018), p. 89. 96 Nisar, Tahir M./Prabhakar, Guru (2017), p. 137. 97 Einav, Liran/Levin, Jonathan/Popov, Igor/Sundaresan, Neel (2014), p. 489-494.
Conceptual and theoretical foundations 17
personnel.98 The resulting e-commerce businesses differ from brick and mortar
businesses in six dimensions. The e-commerce business is always available (time) from
every place with a sufficient Internet connection (location), but not through analogous
and personal contact to sales staff or products (interaction).99 Information about prices,
products, and global suppliers are more transparent (transparency), giving customers
more power to switch between businesses without investing a lot of effort (loyalty).100
Furthermore, the absence of personal interactions with the business and the inability to
examine products increases the perceived risk of e-commerce transactions (risk),101 which
underpins the importance of prosumer trust and relationships for e-commerce brands.102
E-commerce has therefore solved many challenges of brick and mortar business models,
but at the same time created some new challenges of its own:103 e-commerce businesses
are confronted with higher price elasticity resulting from market transparency,104 as well
as the need to create and sustain prosumer trust without personal interactions, to mitigate
higher transaction risk perceptions.
98 Srinivasana, Srini S./Andersona, Rolph/Ponnavolu, Kishore (2002), p. 41. 99 Liang, Ting-Peng/Turban, Efraim (2014), p. 16-18. 100 Huang, Zhao/Benyoucef, Morad (2013), p. 246. 101 Liu, Fei/Xiao, Bo/Lim, Eric T.K./Tan, Chee-Wee (2017), p. 752-755. 102 Nisar, Tahir M./Prabhakar, Guru (2017), p. 137-138. 103 Srinivasana, Srini S./Andersona, Rolph/Ponnavolu, Kishore (2002), p. 41. 104 Ghose, Anindya/Yao, Yuliang (2011), p. 286.
Conceptual and theoretical foundations 18
2.2 SOCIAL MEDIA AND EWOM – THE NEW ‘SOCIAL’ IN
COMMERCE
2.2.1 SOCIAL MEDIA – PLATFORM OF COMMUNICATION AND SELF-
PRESENTATION
2.2.1.1 DEFINITION AND DISTINCTION OF SOCIAL MEDIA PLATFORMS
Back in 2015, when Facebook only had 890 million daily active users (DAU) compared
to 1,470 million in 2018 and 1,562 million in 2019, people were already spending more
than 35,000 accumulated years per day on the social media network.105 In reference to the
large and growing number of daily active social media users, changing customer behavior
becomes apparent. Social media networks such as Facebook and Instagram are
particularly popular and contribute to today’s level of importance of social media in
advertising, higher than traditional formats like television, radio, newspapers and
magazines.106 Today, some even have a profile on a social media network before they are
born. This trend is named ‘Sharenting’, which impacts identity formation as well as the
familiarity, perception and usage of social media networks by people growing up as
digital natives.107
The omnipresent use of social media as an Internet-based information and communication
tool in customers’ everyday lives is a manifestation of the digitization in customer
behavior.108 Based on Bitkom’s social media report, 90% of the German population over
14 years of age use social media (38% of the sample
n = 1.212 cannot imagine life without social media).109 Thus, the last similar innovation
in information creation, storage and distribution, with a similar impact on prosumers,
might have been the invention of letterpress printing. Social media subsumes a broad
range of interactive platforms and depicts a comparably new but dominant
communication landscape.110 There are hundreds of social media websites and apps,
showing development from the unilateral communication of Web 1.0 to the interactive
105 Orosz, Gábor/Tóth-Király, István/Bőthe, Beáta (2016), p. 95 |
Facebook, Inc., Webpage of: Statista, Inc. (2019). 106 Wu, Yen-Chun Jim/Shen, Ju-Peng/Chang, Chan-Lan (2015), p. 1395. 107 Brosch, Anna (2016), p. 225-235. 108 Warner-Søderholm, Gillian/Bertsch, Andy/Sawe, Everlyn/Lee, Dwight/Wolfe, Trina/Meyer,
Josh/Engel, Josh/Fatilua, Uepati Normann (2018), p. 306. 109 Rohleder, Bernahrd. Bitkom (2018), p. 11. 110 Kietzmann, Jan H./Hermkens, Kristopher/McCarthy, Ian P./Silvestre, Bruno S. (2011), p. 241-242.
Conceptual and theoretical foundations 19
Web 2.0 era.111 Social media allows prosumers to easily create and exchange user-
generated content.112
Before the establishment of social media, communication between businesses (senders)
and prosumers (receivers) was predominantly unilateral and controlled by businesses that
had the authority to create the published content in the form of advertisements on the
newspaper, radio and television. Customers being able to play an active role as senders
and receive peer generated content about inter alia commercial experiences led to the
democratization of corporate communication, as Kietzmann et al. put it.113 Social media
therefore resulted in a power shift from businesses to customers, who now have greater
power in deciding where and how they communicate and inform themselves about
brands, products and services.114 In order to account for this hybrid role for customers,
who both consume and produce digital content on social media, the previously-introduced
term “prosumer”115 (also “produser”116) is used in social commerce literature.
Henceforward, the term prosumer is used when specifically referring to consumers of
goods and producers of eWOM in social commerce relationships.
Six different forms of social media platforms are differentiated: blogs (e.g. WordPress),
collaboration projects (e.g. Wikipedia), content communities (e.g. YouTube), virtual
worlds (e.g. Second Life), virtual games (e.g. World of Warcraft), and social media
networks (e.g. LinkedIn).117 Social media networks are extremely popular and indeed
preferred by prosumers when engaging in eWOM.118 Therefore, the focus of this
dissertation is social media networks, as they are the most relevant form for reaching the
postulated research objectives.
111 Hanna, Richard/Rohm, Andrew/Crittenden, Victoria L. (2011), p. 265-266. 112 Kaplan, Andreas M./Haenlein, Michael (2010), p. 61. 113 Kietzmann, Jan H./Hermkens, Kristopher/McCarthy, Ian P./Silvestre, Bruno S. (2011), p. 242. 114 Ibid, p. 265 & p. 241-242. 115 Ritzer, George/Jurgenson, Nathan (2010), p. 13-21. 116 Oeldorf-Hirsch, Anne/Sundar, S. Shyam (2015), p. 241. 117 Kaplan, Andreas M./Haenlein, Michael (2010), p. 62. 118 Killian, Michelle/Fahy, John/O ’Loughlin, Deirdre/Kunz, Werner H. (2018), p. 16.
Conceptual and theoretical foundations 20
2.2.1.2 SOCIAL MEDIA NETWORKS
Social media networks are also called social networking sites.119 They are not only
Internet-based and interactive tools, but display four additional features. Social media
networks offer (1) a self-customized user profile, (2) access to digital content through
search mechanisms, which also protect the prosumers’ digital content from unwanted
retrievals, (3) the ability to create lists of privileged users to show relationships, and (4)
the option to see and monitor these connections created by themselves and others.120
While popular platforms such as WhatsApp and Wikipedia fall under the definition of
social media, they leak at least one property into social media networks. In this regard,
WhatsApp does not offer the possibility to see and monitor network relationships, and
Wikipedia also does not offer the option to create a list of privileged users of friends,
contacts or followers depending on the social media network. About 90% of the German
population over the age of 14 are registered on at least one social media network.121
Facebook is by far the most popular German social media network, ranked by the number
of daily active users, followed by Instagram.122 These networks are primarily used in the
prosumers’ spare time, to engage in entertainment and other non-business related
activities. They are therefore known as hedonic networks, while LinkedIn and Xing, as
further popular social media networks, serve a primarily professional, business-related
function of networking and (self-)marketing.123 They are described as utilitarian
networks.
The massive market penetration and intensity of social media network use also results in
a high level of company value. German software giant SAP SE is currently the most
valuable corporation in DAX, the German stock index, as it is worth €122bn, which is
not even a quarter of the worth of the largest social media network group. Facebook Inc.
reached a worth €522bn only 14 years after its establishment in 2004.124 Traditional
industrial corporations with a notably longer history than the firm have been left behind
by Facebook’s rapid growth. Siemens AG, for instance, as the second most valuable DAX
company, is worth € 99bn (founded in 1847) and thus not even a fifth of Facebook.125 An
119 tom Dieck, M. Claudia/Jung, Timothy Hyungsoo/Kim, Woo Gon/Moon, Yunji (2017), p. 530. 120 Kane, Gerald C./Alavi, Maryam/Labianca, Joe/Borgatti, Stephen P. (2014), p. 279. 121 Rohleder, Bernahrd. Bitkom (2018), p. 2. 122 Ibid., p. 5. 123 Kietzmann, Jan H./Hermkens, Kristopher/McCarthy, Ian P./Silvestre, Bruno S. (2011), p. 242. 124 Retrieved from Deutsche Börse Xetra on July 24th 2018. 125 Retrieved from Deutsche Börse Xetra on July 24th 2018.
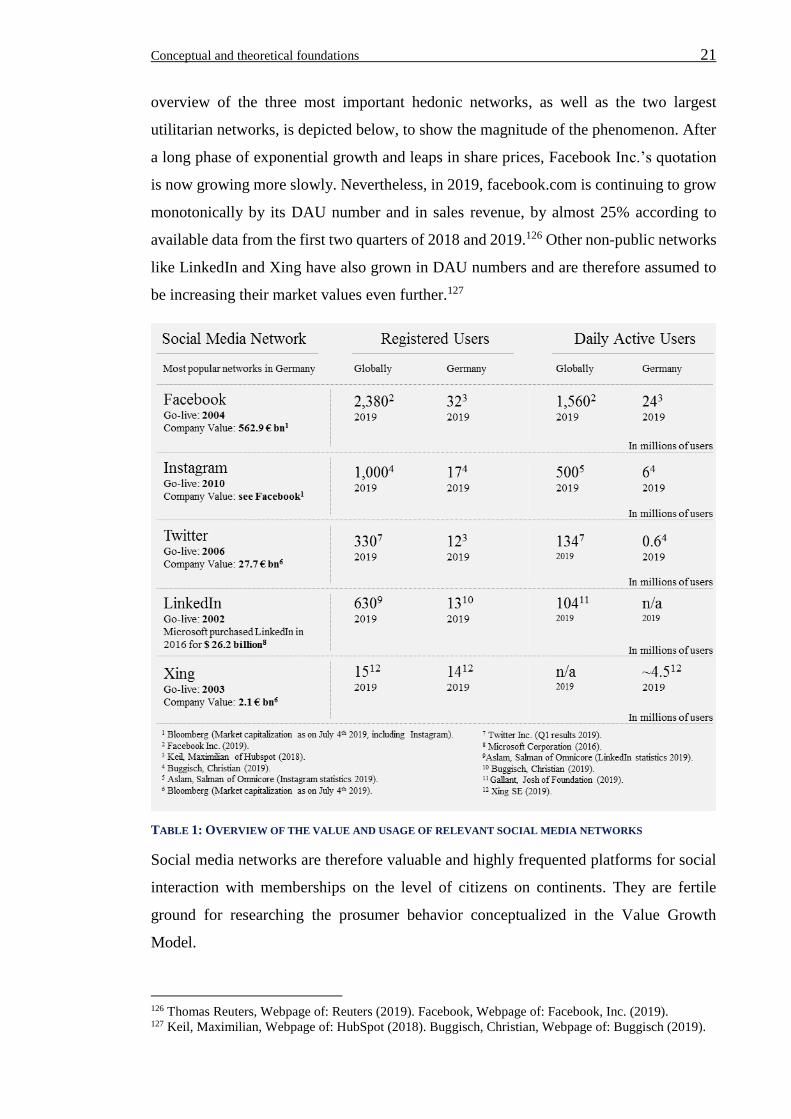
Conceptual and theoretical foundations 21
overview of the three most important hedonic networks, as well as the two largest
utilitarian networks, is depicted below, to show the magnitude of the phenomenon. After
a long phase of exponential growth and leaps in share prices, Facebook Inc.’s quotation
is now growing more slowly. Nevertheless, in 2019, facebook.com is continuing to grow
monotonically by its DAU number and in sales revenue, by almost 25% according to
available data from the first two quarters of 2018 and 2019.126 Other non-public networks
like LinkedIn and Xing have also grown in DAU numbers and are therefore assumed to
be increasing their market values even further.127
TABLE 1: OVERVIEW OF THE VALUE AND USAGE OF RELEVANT SOCIAL MEDIA NETWORKS
Social media networks are therefore valuable and highly frequented platforms for social
interaction with memberships on the level of citizens on continents. They are fertile
ground for researching the prosumer behavior conceptualized in the Value Growth
Model.
126 Thomas Reuters, Webpage of: Reuters (2019). Facebook, Webpage of: Facebook, Inc. (2019). 127 Keil, Maximilian, Webpage of: HubSpot (2018). Buggisch, Christian, Webpage of: Buggisch (2019).
Conceptual and theoretical foundations 22
2.2.1.3 SELF-PRESENTATION AND GROUPS ON SOCIAL MEDIA NETWORKS
The members of social media networks complete their digital personas by publishing
socio-demographic data during registration of their profiles. Subsequently, their personas
are enriched through continuously informing network members about experiences,
emotions, and opinions on their timelines and news feeds.128 As a consequence, their
digital personas are perceived as an expression of the prosumer’s identity, a tool to
cultivate and curate identity.129 This process of revealing personal information can be
conscious or unconscious. Moreover, such online disclosure is in line with Goffman’s
Self-Presentation Theory, driven by the image the users want to create for themselves.130
Drawing on Higgins’ Self-Discrepancy Theory, three types of self-concepts are
differentiated between, which motivate prosumers to curate digital personas with content
they share, as an expression of their identity: the actual, the ideal and the ought-to self.131
Whilst the actual-self depicts what somebody really believes about themselves, the ideal-
self reveals what somebody would like to be and the ought-to-self depicts how someone
feels they should be, from the perspective of their social environment.132 Prosumers
therefore evaluate what kind of content (identity cues) they attribute to their digital
personas according to what fits to their self-concepts. This allows social media networks
users to manage the resultant impressions of their digital persona as a reflection of their
identity.133 Interestingly, Bargh et al. found that the Internet enables people to better
present characteristics of their identities and have them be accepted by peers, compared
to that which occurs in their communication in offline contexts.134
To become part of a prosumer’s network, a friend or follow request is sent, and needs to
be accepted. This mutual acceptance creates a connection and grants privileged access
rights to each other’s content and to direct communication tools. After network
enrollment, mutual user-generated content is displayed in news feeds and direct
messaging is enabled.135 Usually, friends know each other personally and express their
relationship through these connections. A social media network contact is the equivalent
128 Whitty, Monica (2008), p. 1707-1723. 129 Johnson, Benjamin K./Ranzini, Giulia (2018), p. 148-150. 130 Goffman, Erving (1959), p. 264-257 | Chua, Trudy Hui Hui/Chang, Leanne (2016), p. 191 |
Kaplan, Andreas M./Haenlein, Michael (2010), p. 61-62. 131 Whitty, Monica (2008), p. 1708. 132 Ibid., p. 1707-1709. 133 Johnson, Benjamin K./Ranzini, Giulia (2018), p. 148 -156. 134 Bargh, John A./McKenna, Katelyn Y. A./Fitzsimons, Grainne M. (2002), p. 45. 135 Zhang, Wenping/Kang, Lele/Jiang, Qiqi/Pei, Lei (2018), p. 125-129.
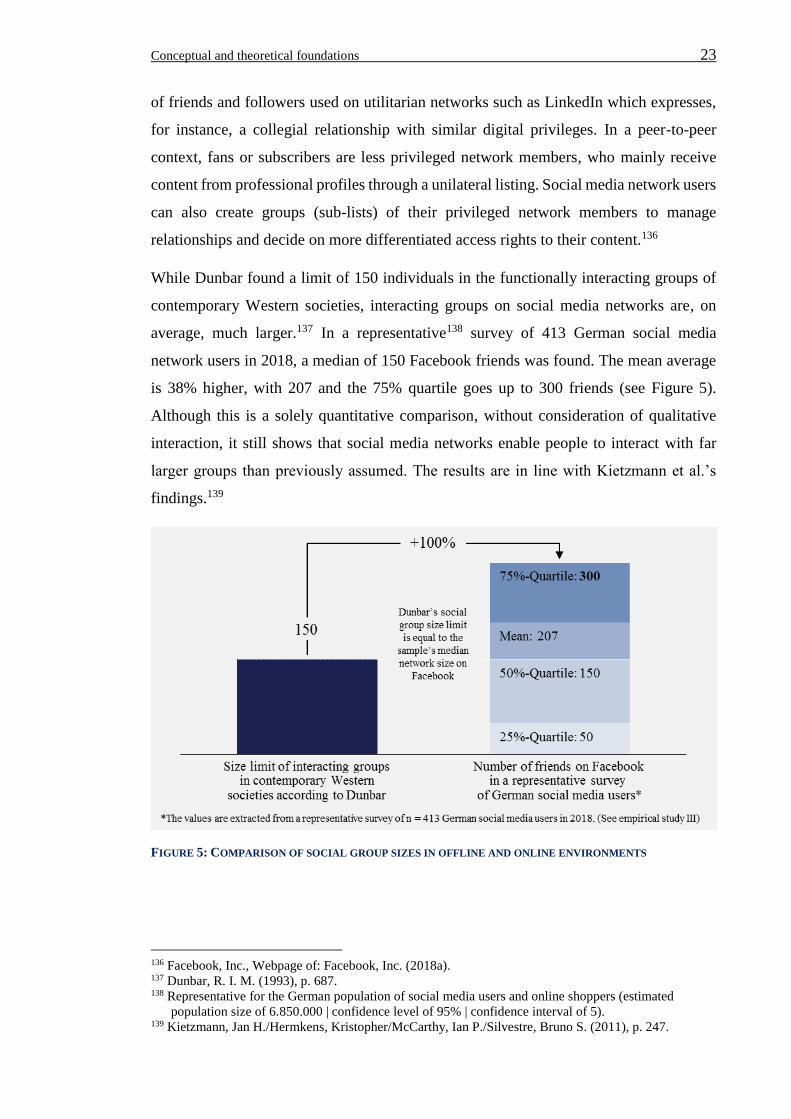
Conceptual and theoretical foundations 23
of friends and followers used on utilitarian networks such as LinkedIn which expresses,
for instance, a collegial relationship with similar digital privileges. In a peer-to-peer
context, fans or subscribers are less privileged network members, who mainly receive
content from professional profiles through a unilateral listing. Social media network users
can also create groups (sub-lists) of their privileged network members to manage
relationships and decide on more differentiated access rights to their content.136
While Dunbar found a limit of 150 individuals in the functionally interacting groups of
contemporary Western societies, interacting groups on social media networks are, on
average, much larger.137 In a representative138 survey of 413 German social media
network users in 2018, a median of 150 Facebook friends was found. The mean average
is 38% higher, with 207 and the 75% quartile goes up to 300 friends (see Figure 5).
Although this is a solely quantitative comparison, without consideration of qualitative
interaction, it still shows that social media networks enable people to interact with far
larger groups than previously assumed. The results are in line with Kietzmann et al.’s
findings.139
FIGURE 5: COMPARISON OF SOCIAL GROUP SIZES IN OFFLINE AND ONLINE ENVIRONMENTS
136 Facebook, Inc., Webpage of: Facebook, Inc. (2018a). 137 Dunbar, R. I. M. (1993), p. 687. 138 Representative for the German population of social media users and online shoppers (estimated population size of 6.850.000 | confidence level of 95% | confidence interval of 5). 139 Kietzmann, Jan H./Hermkens, Kristopher/McCarthy, Ian P./Silvestre, Bruno S. (2011), p. 247.
Conceptual and theoretical foundations 24
The prosumers’ offline network of family, friends and acquaintances naturally shows
large overlaps with the members of their online social media networks.140 Furthermore,
the offline network is complemented rather than supplanted by the online social media
network.141 The latter allows people to stay in touch after, e.g., relocating during different
phases in their life, such as studying in a different city, which underpins the reciprocal
influence of both networks.142
2.2.1.4 PROSUMER ENGAGEMENT ON SOCIAL MEDIA NETWORKS
Social media networks are used for a variety of reasons, such as retrieving information,
entertainment and peer-to-peer communication. Besides content consumption (reading
and watching) and the creation and posting of original content, prosumers can contribute
on social media through a variety of functions that can be clustered into three behavioral
categories of prosumer engagement: reacting (liking), commenting and sharing.143
(1) Reacting is typically a one-click feature related to a specific content post which allows
prosumers to communicate a certain feeling such as enjoyment.144 Facebook introduced
the famous like button (visualized as a “thumbs-up” icon) in 2009.145 On Instagram, this
function is visualized by a heart icon and used about two million times per minute.146
Further, less common reactions are visualized by emoticons, which express love,
amusement, surprise, sadness and anger.147 On Facebook, observers of the content which
has been reacted to, can see, e.g. the ‘like’. Moreover, members of the reacting prosumer’s
network can see this behavior in their newsfeed, as long as it is not pushed out by more
recent or relevant content.148 Oeldorf-Hirsch et al. found that liking is interpreted as an
approval and a personal recommendation of the content by the prosumer to its network.149
It also requires the least amount of engagement and, thus, cognitive effort from the
prosumer.150
140 Sutcliffe, Alistair G./Binder, Jens F./Dunbar, Robin I.M. (2018), p. 227. | Ellison, Nicole B./Steinfield, Charles/Lampe, Cliff (2007), p. 1161-1165. 141 Sutcliffe, Alistair G./Binder, Jens F./Dunbar, Robin I.M. (2018), p. 227-228. 142 Ellison, Nicole B./Steinfield, Charles/Lampe, Cliff (2007), p. 1161-1165. 143 Muntinga, Daniël G./Moorman, Marjolein/Smit, Edith G. (2015), p. 14-16 | Lemon, Katherine N./Verhoef, Peter C. (2016), p. 76 | Kim, Cheonsoo/Yang, Sung-Un (2017), p. 442. 144 Facebook, Inc., Webpage of: Facebook, Inc. (2018b). 145 Eranti, Veikko/Lonkila, Markku (2015), p. 2. 146 Bali, Raghav/Sarkar, Dipanjan/Sharma, Tushar (2017), p. 12. 147 Facebook, Inc., Webpage of: Facebook, Inc. (2018b). 148 Kim, Cheonsoo/Yang, Sung-Un (2017), p. 442-443. 149 Oeldorf-Hirsch, Anne/Sundar, S. Shyam (2015), p. 242. 150 Ibid., p. 442.
Conceptual and theoretical foundations 25
(2) Commenting alludes to attributing written text to posted content. This can include the
tagging of names of other network members, in order to send the tagged member a
notification prompting them to take a look at the content. Comments can also be seen by
observers of the content and are displayed on the news feeds of the prosumer’s network;
however, it requires more cognitive effort to write text than a one-click reaction.151 It is,
therefore, linked to an intermediate amount of cognitive effort.
(3) Sharing can be conducted by re-posting content with or without an additional
comment.152 Shares are attributed to the content and thus can be seen by observers of the
content. Furthermore, they are displayed in the news feeds of both the prosumer and their
network, as well as on the prosumer’s timeline (in the long term).153 For each share,
prosumers can choose between three broadcasting levels:154 public shares are visible to
the entire network, semi-public shares are either shared on a friend’s timeline and visible
to them and all mutual friends or shared to a sub-group of all friends and thus visible to
these network members,155 while shares through private direct messages are only visible
to the selected receiver.156
The effects of reacting and sharing on newsfeeds are dynamic, due to the continuous
development of the underlying algorithms. In general, the weighting of content likes to
comments to shares from the prosumer’s network determines their newsfeed occurrence
at a ratio of 7 : 2 : 1.157 Thus, seven likes promote news feed occurrences as much as two
comments or one share. In January 2018, Facebook implemented an additional news feed
logic, which puts businesses’ social media campaigns under pressure. Facebook’s CEO
Mark Zuckerberg personally talked about the change, stating that the news feed algorithm
had been altered to show less content from “businesses, brands and media” and more
content from “friends and family”.158
151 Oeldorf-Hirsch, Anne/Sundar, S. Shyam (2015), p. 242. 152 Facebook, Inc., Webpage of: Facebook, Inc. (2018a). 153 Kim, Cheonsoo/Yang, Sung-Un (2017), p. 442-443.Phua, Joe/Kim, Jihoon (2018), 154 Oeldorf-Hirsch, Anne/Sundar, S. Shyam (2015), p. 243. 155 Ibid., p. 243. 156 Ibid., 243. 157 Calero (2013) as cited by Kim, Cheonsoo/Yang, Sung-Un (2017), p. 441. 158 Zuckerberg, Mark, Webpage of: Facebook, Inc. (2018).
Conceptual and theoretical foundations 26
2.2.2 ELECTRONIC WORD-OF-MOUTH – SOCIAL INTERACTION AND
COMMERCIAL CONTENT
2.2.2.1 DEFINITION AND PROSUMER ROLES
For retailing, “the importance of eWOM cannot be overstated”159, due to the increasing
popularity of social media networks and prosumer reliance on online information for
purchase decision-making.160 In a broader sense, Henning-Thurau et al. define eWOM as
a statement (positive or negative) which a current or potential customer communicates on
the Internet about a product or brand towards a multitude of people.161 While traditional
advertisement depicts the communication of commercial content by a business (sender)
to a customer (receiver), eWOM (as well as WOM) is something which happens between
customers. This established definition for eWOM is referred to in this dissertation
whenever the term is used. The successful integration of eWOM is a crucial part of the
competitive advantage social commerce businesses have over traditional e-commerce
businesses.162
Prosumers of social media networks can take on three roles regarding the formation of
eWOM: they can seek, give or pass on opinions about a brand or service, creating
eWOM.163 These roles are neither static nor mutually exclusive, due to the dynamic
interactivity of social media networks.164 An initial post requesting opinions of
experiences regarding a potential purchase can quickly result in a large-scale
conversation, including the circulation of opinions. Compared to offline WOM, eWOM
is saved on the websites’ servers and is, thus, available without temporal limitation (e.g.
personal activity threads or posts on social media networks). Moreover, it can be made
available to everyone, not just personally-known contacts in the physical surrounding.165
As a consequence, eWOM has an unprecedented longer and greater reach than offline
WOM. EWOM can also be found efficiently through key word searches or public
questions on social media networks, while peer-knowledge in the analogous world is non-
transparent, and requires more individual communication to finding the needed
information. Since eWOM is therefore the more productive means for customers in need
159 King, Robert Allen/Racherla, Pradeep/Bush, Victoria D. (2014), p. 167. 160 Ibid., p. 167. 161 Hennig-Thurau, Thorsten/Gwinner, Kevin P./Walsh, Gianfranco/Gremler, Dwayne D. (2004), p. 39. 162 Sweeney, Jillian C./Soutar, Geoffrey N./Mazzarol, Tim (2008), p. 344-345. 163 Chu, Shu-Chuan/Kim, Yoojung (2015), p. 50. 164 Ibid., p. 50-51. 165 Gruen, Thomas W./Osmonbekov, Talai/Czaplewski, Andrew J. (2006), p. 452.
Conceptual and theoretical foundations 27
of information, seeking eWOM as the primary decision guidance has become a dominant
decision heuristic for coping with information overflow in the digitized world.166 In this
regard, researchers agree that prosumers consider eWOM to be a trustworthy, credible,
reliable, and valuable source of information.167 Thus, eWOM is a vital decision-making
factor for both offline and online purchases.168
Highly active opinion-givers with a large group of followers are referred to as opinion
leaders, but all social media prosumers are social influencers.169 In this context, building
a large and known or unknown audience has become a lot easier through social media
networks. As a result, a growing and powerful industry of professional influencers has
emerged, but the vast majority of eWOM is still exchanged between mainstream peers.
Celebrity influencers from sports and culture have a strong brand, and have transferred
their global fame to social media platforms such as Instagram to reach follower numbers
in the tens of millions.170 Influencer marketing is so powerful that Kylie Jenner became
the youngest self(ie)-made billionaire ever, at the age of just 21.171 Professional
influencers, on the other hand, have used social media to build a strong brand and fame
to reach follower numbers in the millions.
Compared to these celebrity and professional influencers, the great majority of social
media users do not use the networks professionally. They do not have a professional
brand, but they do have the highest visibility, strongest relationships, greatest credibility,
highest engagement rates172 and, therefore, both the greatest relative eWOM value per
engagement and greatest segment size. Therefore, these peer influencers form the focus
of this dissertation.
The differentiation of these influencer types is illustrated in Figure 6 on the following
page.
166 Yan, Qiang/Wu, Shuang/Wang, Lingli/Wu, Pengfei/Chen, Hejie/Wei, Guohong (2016), p. 64. 167 Kannan, P. K./Li, Hongshuang Alice (2017), p. 27. 168 Chan, Yolanda Y.Y./Ngai, E.W.T. (2011), p. 488. 169 Cho, Youngsang/Hwang, Junseok/Lee, Daeho (2012), p. 97-98. 170 Bakshy, Eytan/Hofman, Jake M./Mason, Winter A./Watts, Duncan J. (2011), p. 65-66. 171 Jacobsen, Nils, Webpage of: Absatzwirtschaft (2019). 172 Hellenkemper, Mona, Webpage of: InfluencerDB Tech GmbH & Co. KG (2017).
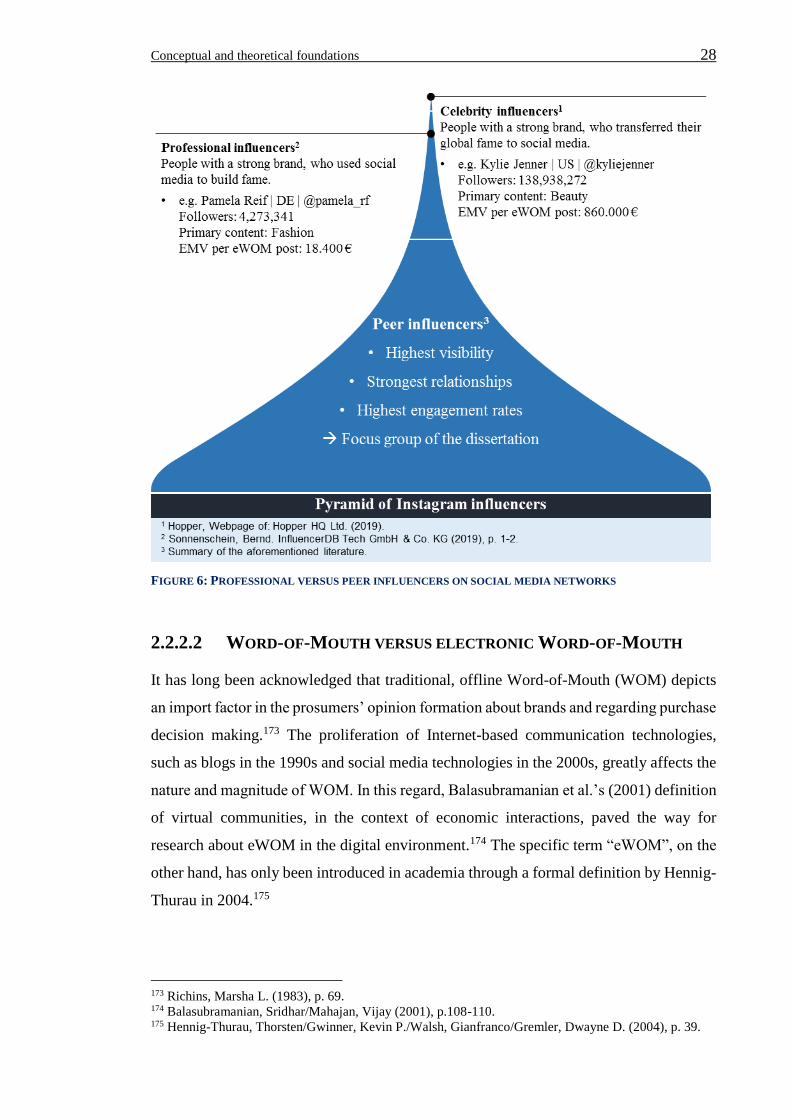
Conceptual and theoretical foundations 28
FIGURE 6: PROFESSIONAL VERSUS PEER INFLUENCERS ON SOCIAL MEDIA NETWORKS
2.2.2.2 WORD-OF-MOUTH VERSUS ELECTRONIC WORD-OF-MOUTH
It has long been acknowledged that traditional, offline Word-of-Mouth (WOM) depicts
an import factor in the prosumers’ opinion formation about brands and regarding purchase
decision making.173 The proliferation of Internet-based communication technologies,
such as blogs in the 1990s and social media technologies in the 2000s, greatly affects the
nature and magnitude of WOM. In this regard, Balasubramanian et al.’s (2001) definition
of virtual communities, in the context of economic interactions, paved the way for
research about eWOM in the digital environment.174 The specific term “eWOM”, on the
other hand, has only been introduced in academia through a formal definition by Hennig-
Thurau in 2004.175
173 Richins, Marsha L. (1983), p. 69. 174 Balasubramanian, Sridhar/Mahajan, Vijay (2001), p.108-110. 175 Hennig-Thurau, Thorsten/Gwinner, Kevin P./Walsh, Gianfranco/Gremler, Dwayne D. (2004), p. 39.
Conceptual and theoretical foundations 29
To outline the differences between WOM and eWOM, five dimensions are defined, an
elaboration of Chu’s three-stage comparison based on mode, scope and speed.176
First, WOM depicts a personal type of communication which occurs offline analogously
and generally through face-to-face communication.177 The message is transferred without
the involvement of digital technologies, i.e., primarily through a spoken language.178 In
contrast, eWOM occurs screen-to-screen, using digital devices as communication tools,
but can subsequently also diffuse into WOM. Written text, icons like emoticons,
visualized ratings, pictures and videos are the primary expressions of eWOM.
Second, WOM is exchanged between individuals of a network, who personally know
each other.179 They are directly addressed and both parties (sender and receiver) can be
identified in the process.180 EWOM, on the other hand, can be exchanged between
individuals that know or do not know each other, e.g., on anonymous forums or open
social network groups.181 EWOM can also be directly communicated towards individuals
or indirectly left on websites, to be found by known or unknown peers anytime in the
future.182
Third, WOM is temporary in nature, and it is only forwarded based on the subjective
memory of the initial receivers or additional verbalization by the sender. Therefore,
WOM is also constrained regarding the geographic spread.183 EWOM is verbatim saved
on website servers for an undefined and not naturally limited amount of time. It is also
available from any geographical location on the Internet.
Fourth, WOM is primarily conducted through one-to-one interactions based on the chance
of matching a WOM seeker with a WOM giver.184 This chance is comparably low, since
there is no transparency about network roles. Therefore, potential spread is slow and the
reach is limited.185 EWOM, in comparison, can occur in any n-to-n constellation, as
specified in the following chapter.186 Since eWOM senders can document experiences
176 Chu, Shu-Chuan (2009), p. 14-17. 177 Nakayama, Makoto/Wan, Yun/Sutcliffe, Norma (2010), p. 2-3. 178 Chu, Shu-Chuan (2009), p. 17. 179 Sweeney, Jillian C./Soutar, Geoffrey N./Mazzarol, Tim (2008), p. 344-345. 180 Chu, Shu-Chuan (2009), p. 16-17. 181 Ibid., p. 27. 182 Gruen, Thomas W./Osmonbekov, Talai/Czaplewski, Andrew J. (2006), p. 452. 183 Chu, Shu-Chuan (2009), p. 16-17. 184 Buttle, Francis A. (1998), p. 242. 185 Chu, Shu-Chuan (2009), p. 16-17. 186 Weisfeld-Spolter, Suri/Sussan, Fiona/Gould, Stephen (2014), p. 262.
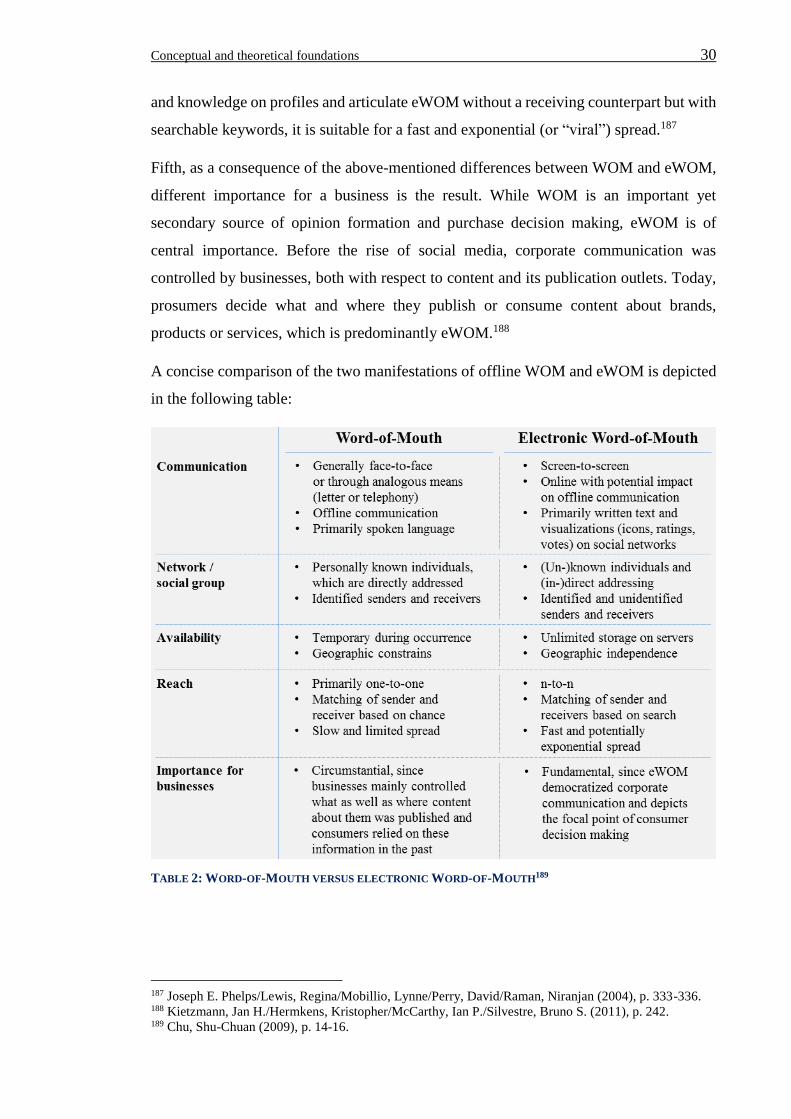
Conceptual and theoretical foundations 30
and knowledge on profiles and articulate eWOM without a receiving counterpart but with
searchable keywords, it is suitable for a fast and exponential (or “viral”) spread.187
Fifth, as a consequence of the above-mentioned differences between WOM and eWOM,
different importance for a business is the result. While WOM is an important yet
secondary source of opinion formation and purchase decision making, eWOM is of
central importance. Before the rise of social media, corporate communication was
controlled by businesses, both with respect to content and its publication outlets. Today,
prosumers decide what and where they publish or consume content about brands,
products or services, which is predominantly eWOM.188
A concise comparison of the two manifestations of offline WOM and eWOM is depicted
in the following table:
TABLE 2: WORD-OF-MOUTH VERSUS ELECTRONIC WORD-OF-MOUTH189
187 Joseph E. Phelps/Lewis, Regina/Mobillio, Lynne/Perry, David/Raman, Niranjan (2004), p. 333-336. 188 Kietzmann, Jan H./Hermkens, Kristopher/McCarthy, Ian P./Silvestre, Bruno S. (2011), p. 242. 189 Chu, Shu-Chuan (2009), p. 14-16.
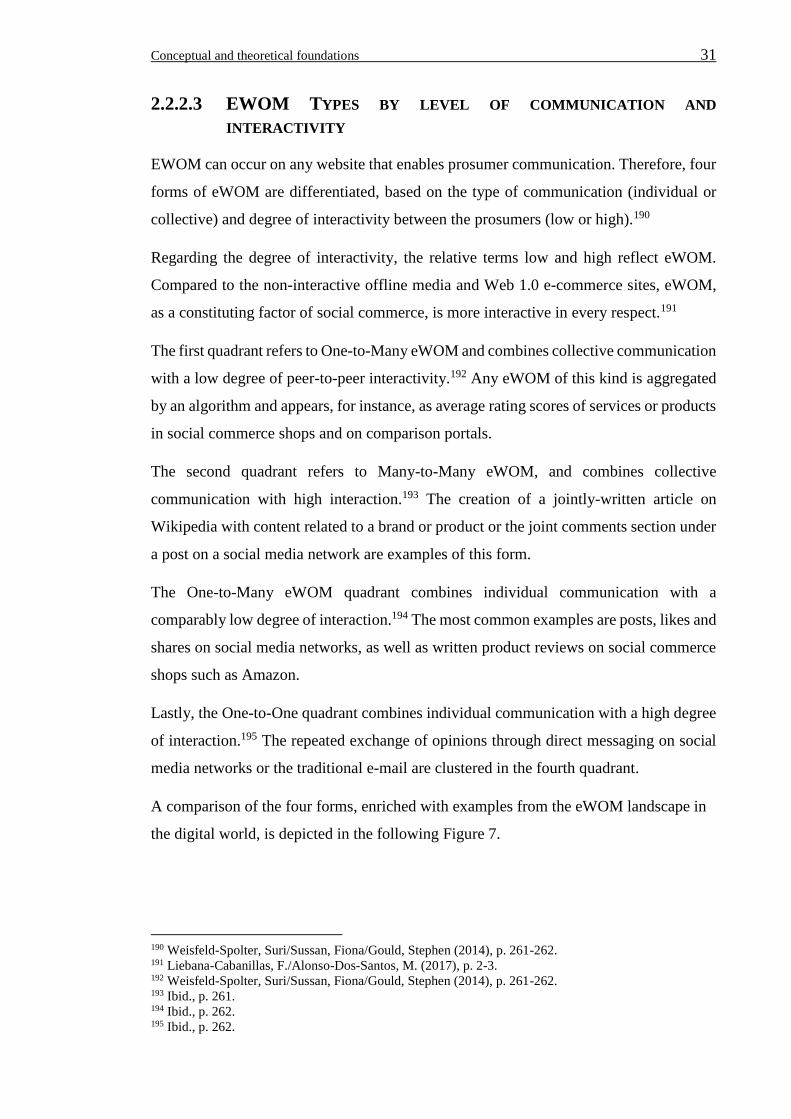
Conceptual and theoretical foundations 31
2.2.2.3 EWOM TYPES BY LEVEL OF COMMUNICATION AND
INTERACTIVITY
EWOM can occur on any website that enables prosumer communication. Therefore, four
forms of eWOM are differentiated, based on the type of communication (individual or
collective) and degree of interactivity between the prosumers (low or high).190
Regarding the degree of interactivity, the relative terms low and high reflect eWOM.
Compared to the non-interactive offline media and Web 1.0 e-commerce sites, eWOM,
as a constituting factor of social commerce, is more interactive in every respect.191
The first quadrant refers to One-to-Many eWOM and combines collective communication
with a low degree of peer-to-peer interactivity.192 Any eWOM of this kind is aggregated
by an algorithm and appears, for instance, as average rating scores of services or products
in social commerce shops and on comparison portals.
The second quadrant refers to Many-to-Many eWOM, and combines collective
communication with high interaction.193 The creation of a jointly-written article on
Wikipedia with content related to a brand or product or the joint comments section under
a post on a social media network are examples of this form.
The One-to-Many eWOM quadrant combines individual communication with a
comparably low degree of interaction.194 The most common examples are posts, likes and
shares on social media networks, as well as written product reviews on social commerce
shops such as Amazon.
Lastly, the One-to-One quadrant combines individual communication with a high degree
of interaction.195 The repeated exchange of opinions through direct messaging on social
media networks or the traditional e-mail are clustered in the fourth quadrant.
A comparison of the four forms, enriched with examples from the eWOM landscape in
the digital world, is depicted in the following Figure 7.
190 Weisfeld-Spolter, Suri/Sussan, Fiona/Gould, Stephen (2014), p. 261-262. 191 Liebana-Cabanillas, F./Alonso-Dos-Santos, M. (2017), p. 2-3. 192 Weisfeld-Spolter, Suri/Sussan, Fiona/Gould, Stephen (2014), p. 261-262. 193 Ibid., p. 261. 194 Ibid., p. 262. 195 Ibid., p. 262.
Conceptual and theoretical foundations 32
FIGURE 7: FORMS OF EWOM BY COMMUNICATION AND INTERACTIVITY196
2.2.2.4 EWOM TYPES BY MODE OF OCCURRENCE
EWOM can emerge organically or through an incentive. Organic eWOM is also called
natural or endogenous eWOM, and refers to the communication of commercial content
between two prosumers without the influence or intervention of a business.197 It is,
therefore, prosumer-initiated and contains content derived from previous experiences or
other thoughts about a brand.198 Incentivized199 eWOM, on the other hand, is also called
196 Weisfeld-Spolter, Suri/Sussan, Fiona/Gould, Stephen (2014), p. 262. 197 Lopez, Manuela/Sicillia, Maria (2016), p. 151-152. 198 Kulmala, Marianne/Mesiranta, Nina/Tuominen, Pekka (2013), p. 21 | Lever, Michael W./Mulvey, Michael S./Elliot, Statia (2017), p. 2. 199 Kim, John/Naylor, Gillian/Sivadas, Eugene/Sugumaran, Vijayan (2015), p. 411.
Conceptual and theoretical foundations 33
exogenous200, inorganic201, seeded,202 or amplified203 eWOM. It involves some kind of
influence from a business, such as a tailored marketing campaign,204 a non-monetary
benefit such as free services, or a monetary benefit such as a price discount.205
In this regard, Henning-Thurau et al. present eight general motives for sharing eWOM.206
They found the following factors:
(1) Platform assistance (eWOM is shared on social media networks to use the most
convenient communication tool and to reach a large audience),
(2) Venting feelings (eWOM is shared to release internal tensions from positive or
negative experiences with a product or service),
(3) Post-purchase advice seeking (eWOM is shared to inquire further information about,
for example, product usage and management).207
(4) Concern for other customers (assuming that helping the community depicts an
objective of every social individual, eWOM is shared to enrich the information base for
virtual community members),
(5) Helping the company (eWOM is shared to reward a company for a good experience
based on altruism, or to increase the likelihood of being able to benefit from the company
in the future),
(6) Social benefits (eWOM is shared to show social group membership and foster
collective customer power over companies),
(7) Extraversion and positive self-enhancement (eWOM is shared due to the intrinsic need
to share thoughts and attribute the experience to oneself),
(8) Economic incentives (eWOM is shared to obtain goods, money, or price discounts)
The first six motives are the primary antecedents of sharing organic eWOM. The seventh
motive can precede both organic and incentivized eWOM. For instance, viral eWOM
campaigns purposefully include content as a teaser for extraversion and positive self-
200 Martínez-López, Francisco J. (2014), p. 152. 201 Kim, John/Naylor, Gillian/Sivadas, Eugene/Sugumaran, Vijayan (2015), p. 412. 202 Petrescu, Maria/O’Leary, Kathleen/Goldring, Deborah/Ben Mrad, Selima (2018), p. 289. 203 Kulmala, Marianne/Mesiranta, Nina/Tuominen, Pekka (2013), p. 21. 204 Joseph E. Phelps/Lewis, Regina/Mobillio, Lynne/Perry, David/Raman, Niranjan (2004), p. 334. 205 Wirtz, Jochen/Chew, Patricia (2002), p. 157. 206 Hennig-Thurau, Thorsten/Gwinner, Kevin P./Walsh, Gianfranco/Gremler, Dwayne D. (2004), p. 50. 207 Ibid., p. 47.
Conceptual and theoretical foundations 34
enhancement. Such emotionally-connecting and often humorous content depicts an
incentive which prosumers seek to attribute to themselves.208 The eighth factor is the
extrinsic monetary reward for motivating prosumer engagement in incentivized eWOM.
Extant literature includes contradictory findings about the effectiveness of financial
rewards in motivating prosumer eWOM engagement. This matter is presented in detail in
the systematic literature review and assessment of the research’s state (Chapter 3.1).
Both organic and incentivized eWOM are powerful factors regarding the formation of
customer (eWOM receiver) purchase behavior.209 Specifically, in the context of
incentivized eWOM, Song and Petrescu et al. confirmed the known positive effects of
organic eWOM in the context of disclosed incentivization, such as increased purchases
of receivers: “When the receivers got a recommendation, they were highly likely to
purchase the recommended product, regardless of the reward scheme”210.211
Interestingly, business also benefits from the positive effect of incentivized eWOM on
the senders, since the senders develop a sense of agency for the content and adapt the
communicated statement, which improves their attitude (the ‘saying is believing’
effect).212
Nevertheless, some academics have expressed doubts about the effect of incentivized
eWOM on receiver attitudes, intentions, and behavior. In this regard, scholars who used
research designs based on convenience samples and self-reported Likert scale measurers
found that incentivized eWOM can have a decreasing effectiveness,213 while studies with
actual market data from social commerce businesses found that firm-created and thus
incentivized eWOM results in positive outcomes, such as increased sales.214 This might
be due to suggestive research questions, unrealistic experimental settings and
unrepresentative samples in the first category of studies. In this regard, Boerman et al.
found that most customers also ignore the label ‘sponsored’, if it is mentioned in a
professional eWOM post.215 Moreover, in another empirical study looking at the
208 Dobele, Angela/Lindgreen, Adam/Beverland, Michael/Vanhamme, Joëlle/van Wijk, Robert (2007), p.
293. 209 Godes, David/Mayzlin, Dina (2009), p. 737 | Kannan, P. K./Li, Hongshuang Alice (2017), p. 27-28. 210 Song, Chanho (2015), p. 84-85. 211 Petrescu, Maria/O’Leary, Kathleen/Goldring, Deborah/Ben Mrad, Selima (2018), p. 294-295. 212 Kim, John/Naylor, Gillian/Sivadas, Eugene/Sugumaran, Vijayan (2015), p. 411. 213 Tercia, Christiana Yosevina/Teichert, Thorsten (2017), p. 54-55 | Pongjit, Chompunuch/Beise-Zee, Rian (2015), p. 726. 214 Petrescu, Maria/O’Leary, Kathleen/Goldring, Deborah/Ben Mrad, Selima (2018), p. 294-295 | Godes, David/Mayzlin, Dina (2009), p. 737. 215 Boerman, Sophie C./Willemsen, Lotte M./van der Aa, Eva P. (2017), p. 90.
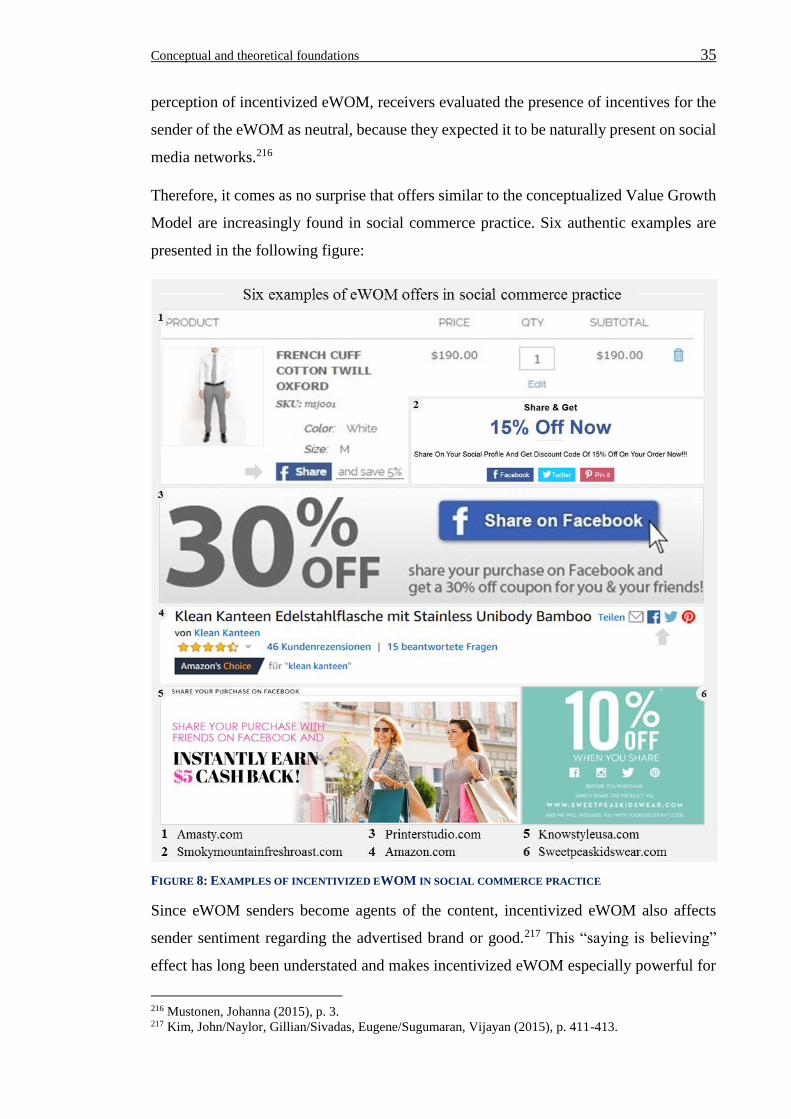
Conceptual and theoretical foundations 35
perception of incentivized eWOM, receivers evaluated the presence of incentives for the
sender of the eWOM as neutral, because they expected it to be naturally present on social
media networks.216
Therefore, it comes as no surprise that offers similar to the conceptualized Value Growth
Model are increasingly found in social commerce practice. Six authentic examples are
presented in the following figure:
FIGURE 8: EXAMPLES OF INCENTIVIZED EWOM IN SOCIAL COMMERCE PRACTICE
Since eWOM senders become agents of the content, incentivized eWOM also affects
sender sentiment regarding the advertised brand or good.217 This “saying is believing”
effect has long been understated and makes incentivized eWOM especially powerful for
216 Mustonen, Johanna (2015), p. 3. 217 Kim, John/Naylor, Gillian/Sivadas, Eugene/Sugumaran, Vijayan (2015), p. 411-413.
Conceptual and theoretical foundations 36
businesses, because brand content is adopted as the sender’s own opinion.218 As
incentivized eWOM is immanent in the Value Growth Model, the focus of the dissertation
lays on this type of eWOM.
2.3 SOCIAL COMMERCE – RISE OF A NOVEL BUSINESS MODEL
2.3.1 DEFINITION, DISTINCTION AND DESIGN
Social commerce businesses are the next stage in the evolution of e-commerce business
models, creating an entirely new customer experience through social participation.219
Social commerce denotes the combination of “commercial and social activities”220 or, as
Dennison et al. put it, the application of eWOM to e-commerce.221 Social commerce can
be implemented either through social media platforms that enable commercial features or
e-commerce businesses that implement social media features.222 Thus, the integration of
such social media technologies to promote brand related community interactions in the
course of commercial activities constitute the term social commerce.223
In this regard, traditional offline businesses are increasingly using social media to
improve their marketing performance.224 The growing popularity of social commerce
using Facebook as the integrated social media network has even resulted in a specific
terminology and research stream, named ‘F-Commerce’.225 In this context, customers
also use the “social sign-in” on Facebook to access an increasing amount of independent
online shops.226 The innovative phenomenon of social commerce has also allowed for the
creation of novel business models like TripAdvisor227 and the improvement of existing e-
commerce business models,228 “turning social interactions into profits and sales”229.
218 Kim, John/Naylor, Gillian/Sivadas, Eugene/Sugumaran, Vijayan (2015), p. 411. 219 Huang, Zhao/Benyoucef, Morad (2013), p. 246 -255 |
Lemon, Katherine N./Verhoef, Peter C. (2016), p. 69. 220 Liang, Ting-Peng/Turban, Efraim (2014), p. 6. 221 Dennison, Gabe/Bourdage-Braun, Stephanie/Chetuparambil, Madhu. IBM (2009), p. 2. 222 Liang, Ting-Peng/Turban, Efraim (2014), p. 6. 223 Liang, Ting-Peng/Turban, Efraim (2014), p. 5-13. 224 Lin, Xiaolin/Li, Yibai/Wang, Xuequn (2017), p. 191. 225 Liebana-Cabanillas, F./Alonso-Dos-Santos, M. (2017), p. 3. 226 Laudon, Kenneth C./Traver, Carol Guercio (2018), p. 25-26. 227 TripAdvisor is a leading platform for travel-related forums and bookings with 600 million reviews and
opinions shared by customers globally. With 7.5 million covered providers (accommodations,
restaurants, airlines etc.) and 455 million unique visitors per month, it is the largest travel site of the
world. (TripAdvisor LLC, 2018) 228 Liebana-Cabanillas, F./Alonso-Dos-Santos, M. (2017), p. 2-3. 229 Li, Chia-Ying/Ku, Yi-Cheng (2018), p. 340.
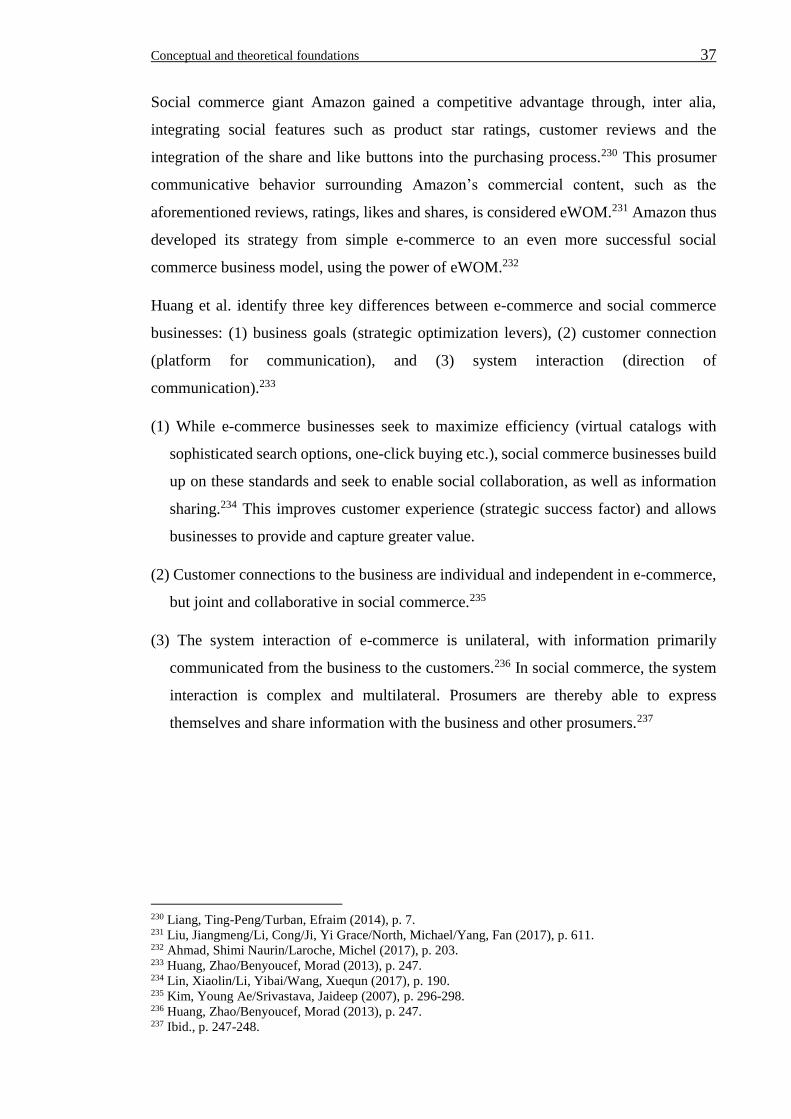
Conceptual and theoretical foundations 37
Social commerce giant Amazon gained a competitive advantage through, inter alia,
integrating social features such as product star ratings, customer reviews and the
integration of the share and like buttons into the purchasing process.230 This prosumer
communicative behavior surrounding Amazon’s commercial content, such as the
aforementioned reviews, ratings, likes and shares, is considered eWOM.231 Amazon thus
developed its strategy from simple e-commerce to an even more successful social
commerce business model, using the power of eWOM.232
Huang et al. identify three key differences between e-commerce and social commerce
businesses: (1) business goals (strategic optimization levers), (2) customer connection
(platform for communication), and (3) system interaction (direction of
communication).233
(1) While e-commerce businesses seek to maximize efficiency (virtual catalogs with
sophisticated search options, one-click buying etc.), social commerce businesses build
up on these standards and seek to enable social collaboration, as well as information
sharing.234 This improves customer experience (strategic success factor) and allows
businesses to provide and capture greater value.
(2) Customer connections to the business are individual and independent in e-commerce,
but joint and collaborative in social commerce.235
(3) The system interaction of e-commerce is unilateral, with information primarily
communicated from the business to the customers.236 In social commerce, the system
interaction is complex and multilateral. Prosumers are thereby able to express
themselves and share information with the business and other prosumers.237
230 Liang, Ting-Peng/Turban, Efraim (2014), p. 7. 231 Liu, Jiangmeng/Li, Cong/Ji, Yi Grace/North, Michael/Yang, Fan (2017), p. 611. 232 Ahmad, Shimi Naurin/Laroche, Michel (2017), p. 203. 233 Huang, Zhao/Benyoucef, Morad (2013), p. 247. 234 Lin, Xiaolin/Li, Yibai/Wang, Xuequn (2017), p. 190. 235 Kim, Young Ae/Srivastava, Jaideep (2007), p. 296-298. 236 Huang, Zhao/Benyoucef, Morad (2013), p. 247. 237 Ibid., p. 247-248.
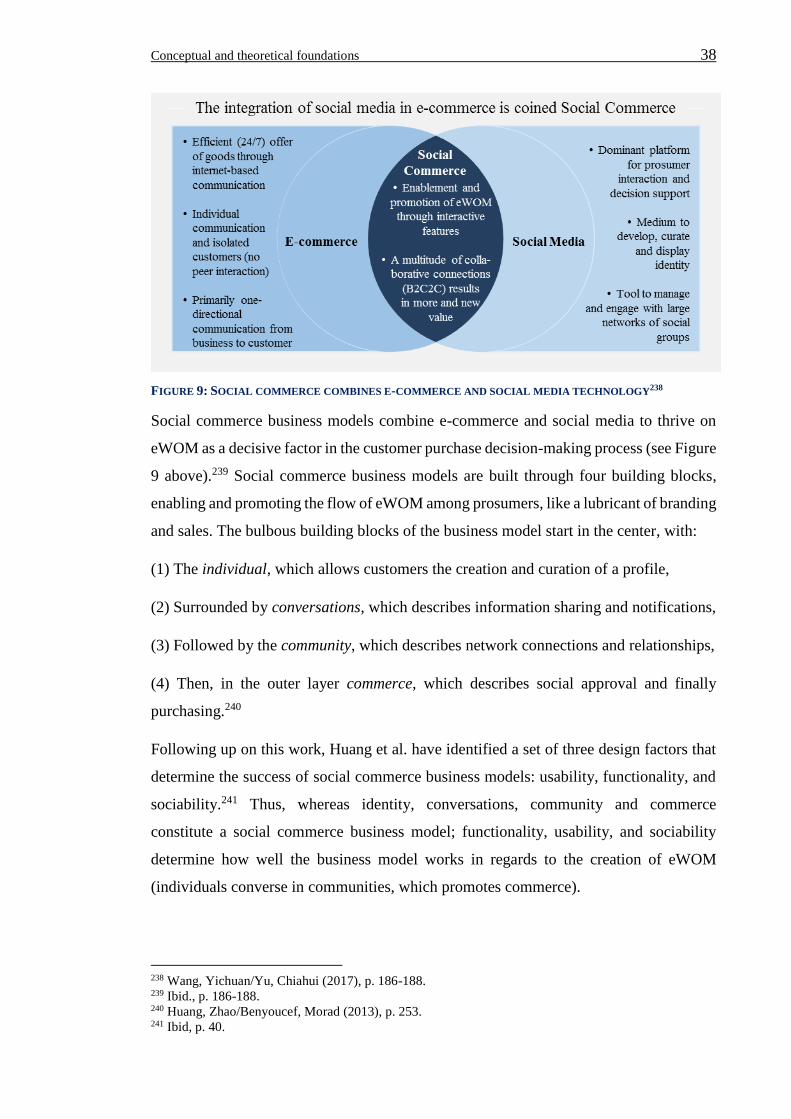
Conceptual and theoretical foundations 38
FIGURE 9: SOCIAL COMMERCE COMBINES E-COMMERCE AND SOCIAL MEDIA TECHNOLOGY238
Social commerce business models combine e-commerce and social media to thrive on
eWOM as a decisive factor in the customer purchase decision-making process (see Figure
9 above).239 Social commerce business models are built through four building blocks,
enabling and promoting the flow of eWOM among prosumers, like a lubricant of branding
and sales. The bulbous building blocks of the business model start in the center, with:
(1) The individual, which allows customers the creation and curation of a profile,
(2) Surrounded by conversations, which describes information sharing and notifications,
(3) Followed by the community, which describes network connections and relationships,
(4) Then, in the outer layer commerce, which describes social approval and finally
purchasing.240
Following up on this work, Huang et al. have identified a set of three design factors that
determine the success of social commerce business models: usability, functionality, and
sociability.241 Thus, whereas identity, conversations, community and commerce
constitute a social commerce business model; functionality, usability, and sociability
determine how well the business model works in regards to the creation of eWOM
(individuals converse in communities, which promotes commerce).
238 Wang, Yichuan/Yu, Chiahui (2017), p. 186-188. 239 Ibid., p. 186-188. 240 Huang, Zhao/Benyoucef, Morad (2013), p. 253. 241 Ibid, p. 40.
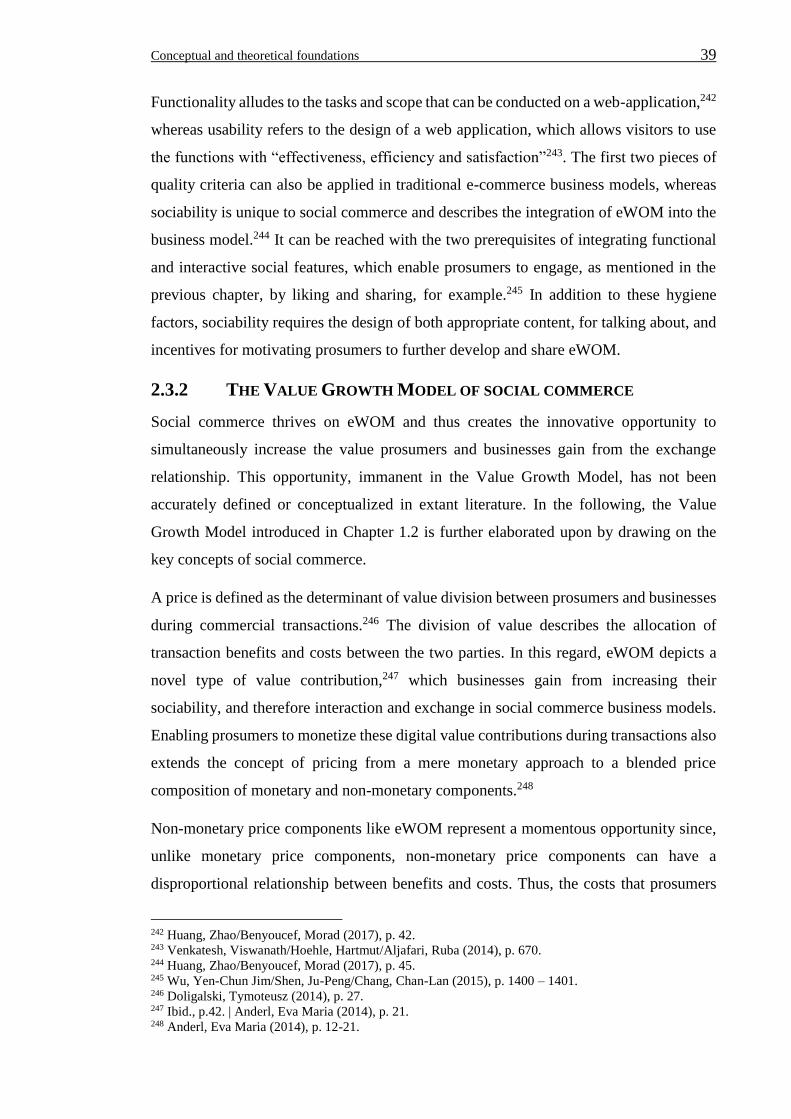
Conceptual and theoretical foundations 39
Functionality alludes to the tasks and scope that can be conducted on a web-application,242
whereas usability refers to the design of a web application, which allows visitors to use
the functions with “effectiveness, efficiency and satisfaction”243. The first two pieces of
quality criteria can also be applied in traditional e-commerce business models, whereas
sociability is unique to social commerce and describes the integration of eWOM into the
business model.244 It can be reached with the two prerequisites of integrating functional
and interactive social features, which enable prosumers to engage, as mentioned in the
previous chapter, by liking and sharing, for example.245 In addition to these hygiene
factors, sociability requires the design of both appropriate content, for talking about, and
incentives for motivating prosumers to further develop and share eWOM.
2.3.2 THE VALUE GROWTH MODEL OF SOCIAL COMMERCE
Social commerce thrives on eWOM and thus creates the innovative opportunity to
simultaneously increase the value prosumers and businesses gain from the exchange
relationship. This opportunity, immanent in the Value Growth Model, has not been
accurately defined or conceptualized in extant literature. In the following, the Value
Growth Model introduced in Chapter 1.2 is further elaborated upon by drawing on the
key concepts of social commerce.
A price is defined as the determinant of value division between prosumers and businesses
during commercial transactions.246 The division of value describes the allocation of
transaction benefits and costs between the two parties. In this regard, eWOM depicts a
novel type of value contribution,247 which businesses gain from increasing their
sociability, and therefore interaction and exchange in social commerce business models.
Enabling prosumers to monetize these digital value contributions during transactions also
extends the concept of pricing from a mere monetary approach to a blended price
composition of monetary and non-monetary components.248
Non-monetary price components like eWOM represent a momentous opportunity since,
unlike monetary price components, non-monetary price components can have a
disproportional relationship between benefits and costs. Thus, the costs that prosumers
242 Huang, Zhao/Benyoucef, Morad (2017), p. 42. 243 Venkatesh, Viswanath/Hoehle, Hartmut/Aljafari, Ruba (2014), p. 670. 244 Huang, Zhao/Benyoucef, Morad (2017), p. 45. 245 Wu, Yen-Chun Jim/Shen, Ju-Peng/Chang, Chan-Lan (2015), p. 1400 – 1401. 246 Doligalski, Tymoteusz (2014), p. 27. 247 Ibid., p.42. | Anderl, Eva Maria (2014), p. 21. 248 Anderl, Eva Maria (2014), p. 12-21.
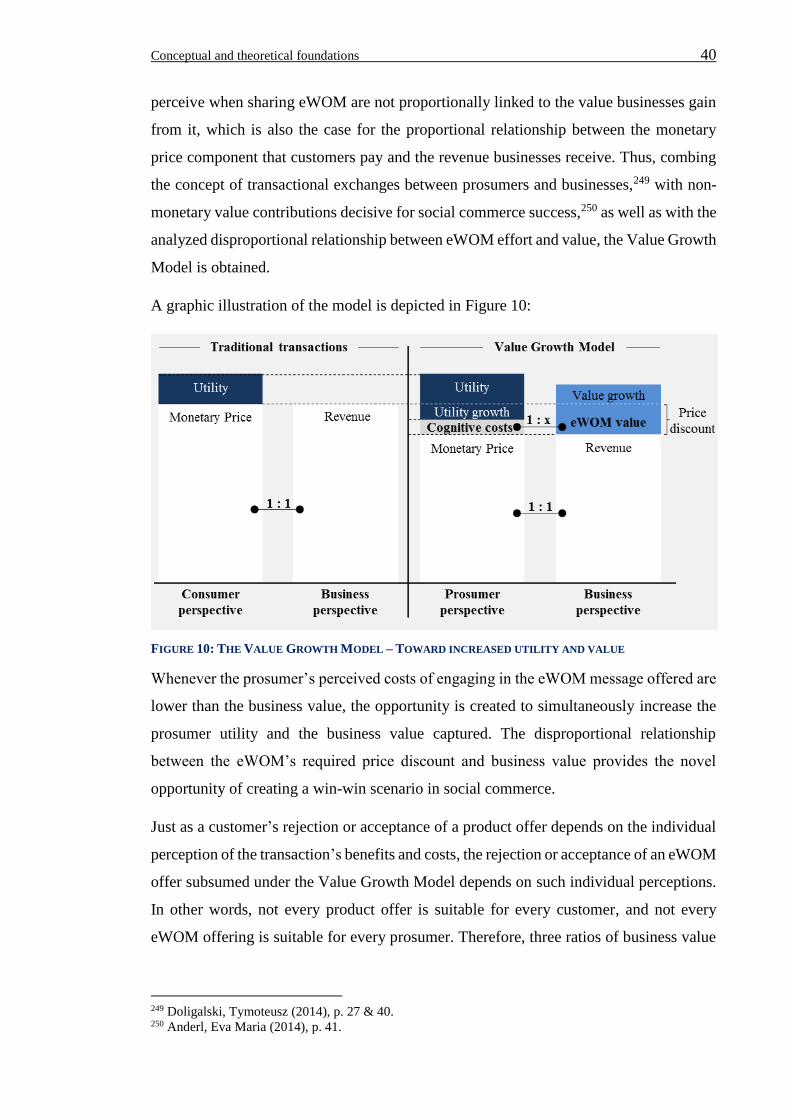
Conceptual and theoretical foundations 40
perceive when sharing eWOM are not proportionally linked to the value businesses gain
from it, which is also the case for the proportional relationship between the monetary
price component that customers pay and the revenue businesses receive. Thus, combing
the concept of transactional exchanges between prosumers and businesses,249 with non-
monetary value contributions decisive for social commerce success,250 as well as with the
analyzed disproportional relationship between eWOM effort and value, the Value Growth
Model is obtained.
A graphic illustration of the model is depicted in Figure 10:
FIGURE 10: THE VALUE GROWTH MODEL – TOWARD INCREASED UTILITY AND VALUE
Whenever the prosumer’s perceived costs of engaging in the eWOM message offered are
lower than the business value, the opportunity is created to simultaneously increase the
prosumer utility and the business value captured. The disproportional relationship
between the eWOM’s required price discount and business value provides the novel
opportunity of creating a win-win scenario in social commerce.
Just as a customer’s rejection or acceptance of a product offer depends on the individual
perception of the transaction’s benefits and costs, the rejection or acceptance of an eWOM
offer subsumed under the Value Growth Model depends on such individual perceptions.
In other words, not every product offer is suitable for every customer, and not every
eWOM offering is suitable for every prosumer. Therefore, three ratios of business value
249 Doligalski, Tymoteusz (2014), p. 27 & 40. 250 Anderl, Eva Maria (2014), p. 41.
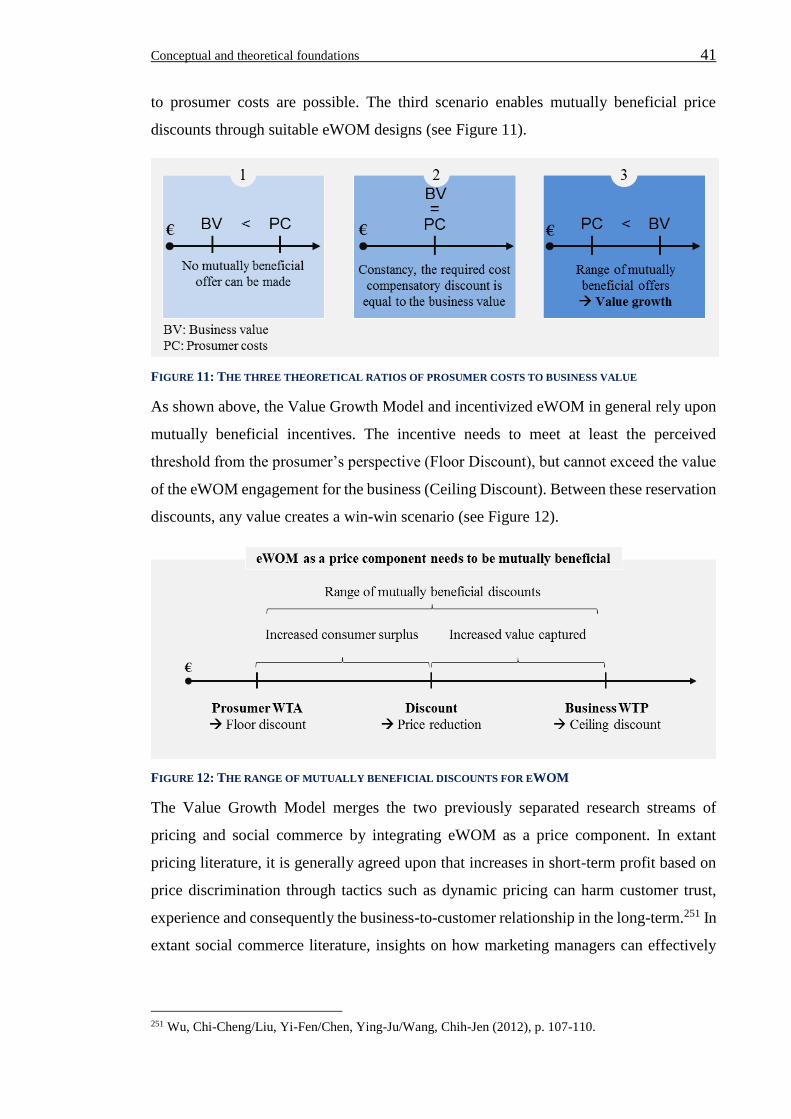
Conceptual and theoretical foundations 41
to prosumer costs are possible. The third scenario enables mutually beneficial price
discounts through suitable eWOM designs (see Figure 11).
FIGURE 11: THE THREE THEORETICAL RATIOS OF PROSUMER COSTS TO BUSINESS VALUE
As shown above, the Value Growth Model and incentivized eWOM in general rely upon
mutually beneficial incentives. The incentive needs to meet at least the perceived
threshold from the prosumer’s perspective (Floor Discount), but cannot exceed the value
of the eWOM engagement for the business (Ceiling Discount). Between these reservation
discounts, any value creates a win-win scenario (see Figure 12).
FIGURE 12: THE RANGE OF MUTUALLY BENEFICIAL DISCOUNTS FOR EWOM
The Value Growth Model merges the two previously separated research streams of
pricing and social commerce by integrating eWOM as a price component. In extant
pricing literature, it is generally agreed upon that increases in short-term profit based on
price discrimination through tactics such as dynamic pricing can harm customer trust,
experience and consequently the business-to-customer relationship in the long-term.251 In
extant social commerce literature, insights on how marketing managers can effectively
251 Wu, Chi-Cheng/Liu, Yi-Fen/Chen, Ying-Ju/Wang, Chih-Jen (2012), p. 107-110.
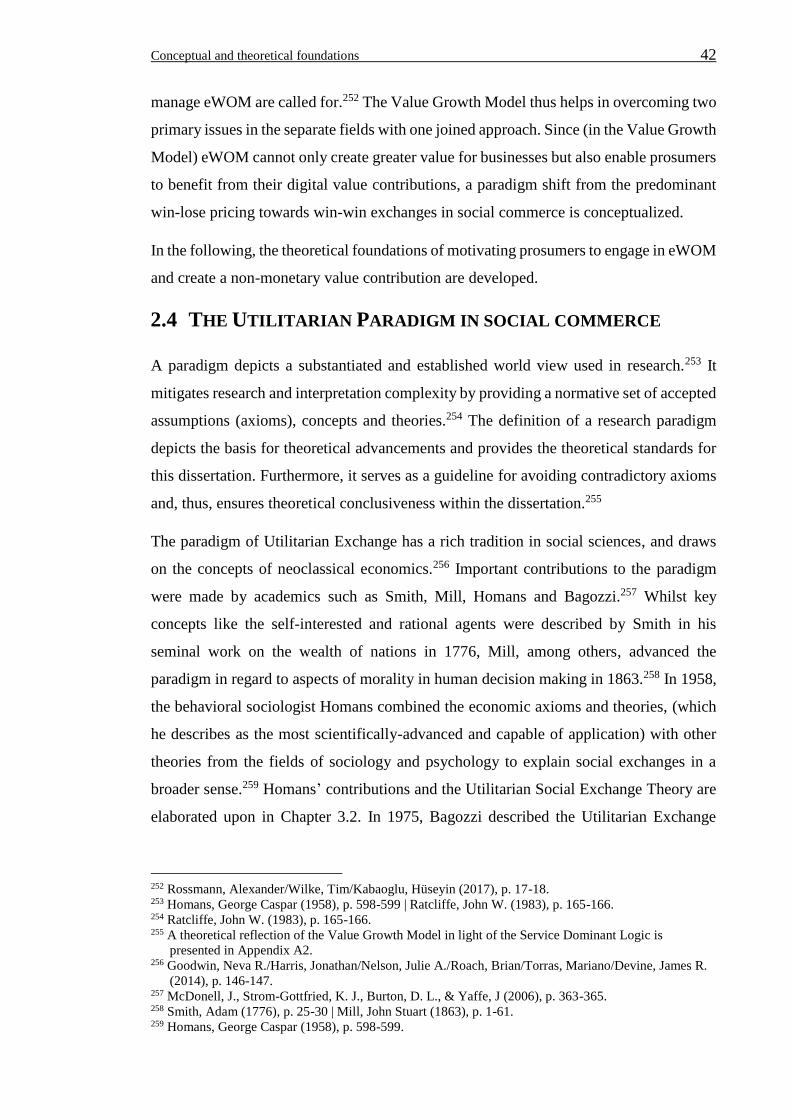
Conceptual and theoretical foundations 42
manage eWOM are called for.252 The Value Growth Model thus helps in overcoming two
primary issues in the separate fields with one joined approach. Since (in the Value Growth
Model) eWOM cannot only create greater value for businesses but also enable prosumers
to benefit from their digital value contributions, a paradigm shift from the predominant
win-lose pricing towards win-win exchanges in social commerce is conceptualized.
In the following, the theoretical foundations of motivating prosumers to engage in eWOM
and create a non-monetary value contribution are developed.
2.4 THE UTILITARIAN PARADIGM IN SOCIAL COMMERCE
A paradigm depicts a substantiated and established world view used in research.253 It
mitigates research and interpretation complexity by providing a normative set of accepted
assumptions (axioms), concepts and theories.254 The definition of a research paradigm
depicts the basis for theoretical advancements and provides the theoretical standards for
this dissertation. Furthermore, it serves as a guideline for avoiding contradictory axioms
and, thus, ensures theoretical conclusiveness within the dissertation.255
The paradigm of Utilitarian Exchange has a rich tradition in social sciences, and draws
on the concepts of neoclassical economics.256 Important contributions to the paradigm
were made by academics such as Smith, Mill, Homans and Bagozzi.257 Whilst key
concepts like the self-interested and rational agents were described by Smith in his
seminal work on the wealth of nations in 1776, Mill, among others, advanced the
paradigm in regard to aspects of morality in human decision making in 1863.258 In 1958,
the behavioral sociologist Homans combined the economic axioms and theories, (which
he describes as the most scientifically-advanced and capable of application) with other
theories from the fields of sociology and psychology to explain social exchanges in a
broader sense.259 Homans’ contributions and the Utilitarian Social Exchange Theory are
elaborated upon in Chapter 3.2. In 1975, Bagozzi described the Utilitarian Exchange
252 Rossmann, Alexander/Wilke, Tim/Kabaoglu, Hüseyin (2017), p. 17-18. 253 Homans, George Caspar (1958), p. 598-599 | Ratcliffe, John W. (1983), p. 165-166. 254 Ratcliffe, John W. (1983), p. 165-166. 255 A theoretical reflection of the Value Growth Model in light of the Service Dominant Logic is
presented in Appendix A2. 256 Goodwin, Neva R./Harris, Jonathan/Nelson, Julie A./Roach, Brian/Torras, Mariano/Devine, James R.
(2014), p. 146-147. 257 McDonell, J., Strom-Gottfried, K. J., Burton, D. L., & Yaffe, J (2006), p. 363-365. 258 Smith, Adam (1776), p. 25-30 | Mill, John Stuart (1863), p. 1-61. 259 Homans, George Caspar (1958), p. 598-599.
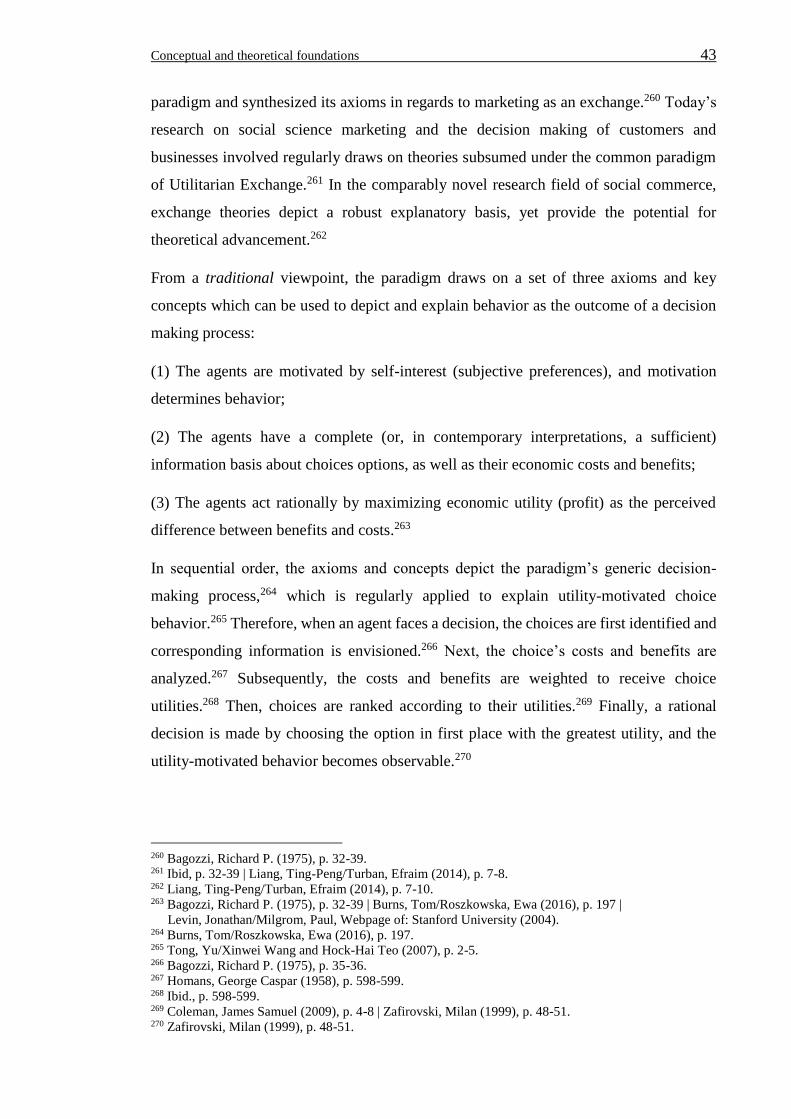
Conceptual and theoretical foundations 43
paradigm and synthesized its axioms in regards to marketing as an exchange.260 Today’s
research on social science marketing and the decision making of customers and
businesses involved regularly draws on theories subsumed under the common paradigm
of Utilitarian Exchange.261 In the comparably novel research field of social commerce,
exchange theories depict a robust explanatory basis, yet provide the potential for
theoretical advancement.262
From a traditional viewpoint, the paradigm draws on a set of three axioms and key
concepts which can be used to depict and explain behavior as the outcome of a decision
making process:
(1) The agents are motivated by self-interest (subjective preferences), and motivation
determines behavior;
(2) The agents have a complete (or, in contemporary interpretations, a sufficient)
information basis about choices options, as well as their economic costs and benefits;
(3) The agents act rationally by maximizing economic utility (profit) as the perceived
difference between benefits and costs.263
In sequential order, the axioms and concepts depict the paradigm’s generic decision-
making process,264 which is regularly applied to explain utility-motivated choice
behavior.265 Therefore, when an agent faces a decision, the choices are first identified and
corresponding information is envisioned.266 Next, the choice’s costs and benefits are
analyzed.267 Subsequently, the costs and benefits are weighted to receive choice
utilities.268 Then, choices are ranked according to their utilities.269 Finally, a rational
decision is made by choosing the option in first place with the greatest utility, and the
utility-motivated behavior becomes observable.270
260 Bagozzi, Richard P. (1975), p. 32-39. 261 Ibid, p. 32-39 | Liang, Ting-Peng/Turban, Efraim (2014), p. 7-8. 262 Liang, Ting-Peng/Turban, Efraim (2014), p. 7-10. 263 Bagozzi, Richard P. (1975), p. 32-39 | Burns, Tom/Roszkowska, Ewa (2016), p. 197 | Levin, Jonathan/Milgrom, Paul, Webpage of: Stanford University (2004). 264 Burns, Tom/Roszkowska, Ewa (2016), p. 197. 265 Tong, Yu/Xinwei Wang and Hock-Hai Teo (2007), p. 2-5. 266 Bagozzi, Richard P. (1975), p. 35-36. 267 Homans, George Caspar (1958), p. 598-599. 268 Ibid., p. 598-599. 269 Coleman, James Samuel (2009), p. 4-8 | Zafirovski, Milan (1999), p. 48-51. 270 Zafirovski, Milan (1999), p. 48-51.
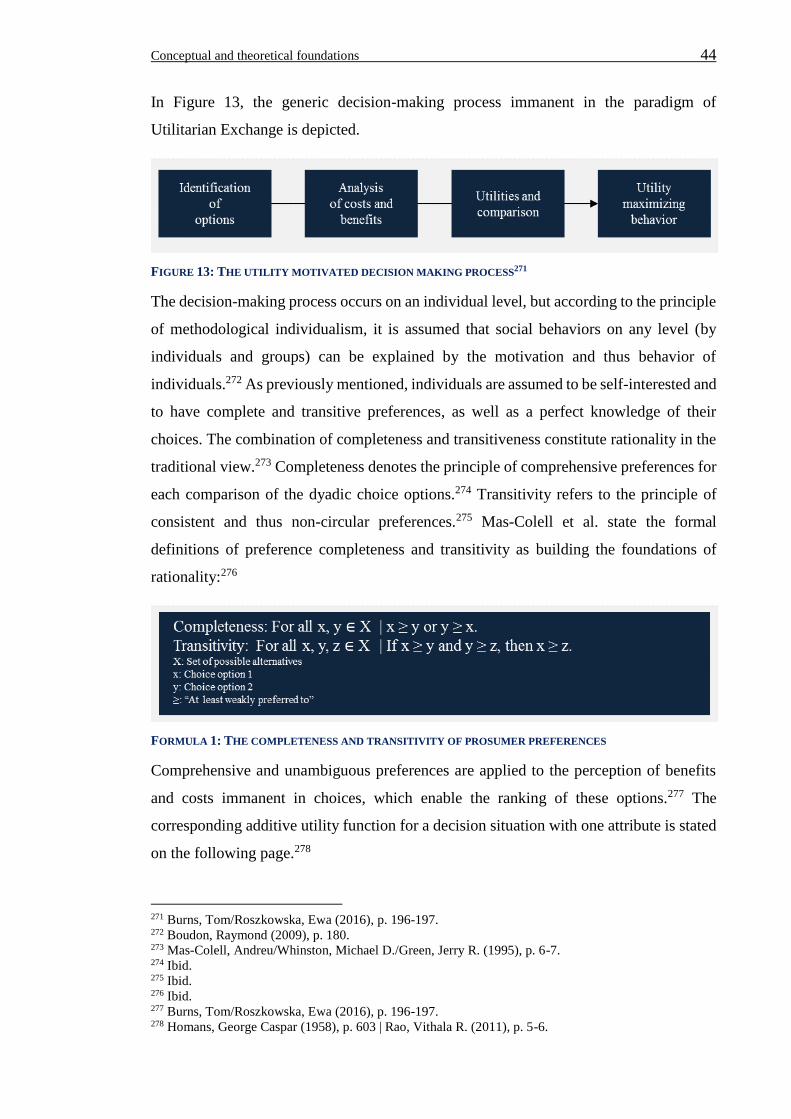
Conceptual and theoretical foundations 44
In Figure 13, the generic decision-making process immanent in the paradigm of
Utilitarian Exchange is depicted.
FIGURE 13: THE UTILITY MOTIVATED DECISION MAKING PROCESS271
The decision-making process occurs on an individual level, but according to the principle
of methodological individualism, it is assumed that social behaviors on any level (by
individuals and groups) can be explained by the motivation and thus behavior of
individuals.272 As previously mentioned, individuals are assumed to be self-interested and
to have complete and transitive preferences, as well as a perfect knowledge of their
choices. The combination of completeness and transitiveness constitute rationality in the
traditional view.273 Completeness denotes the principle of comprehensive preferences for
each comparison of the dyadic choice options.274 Transitivity refers to the principle of
consistent and thus non-circular preferences.275 Mas-Colell et al. state the formal
definitions of preference completeness and transitivity as building the foundations of
rationality:276
FORMULA 1: THE COMPLETENESS AND TRANSITIVITY OF PROSUMER PREFERENCES
Comprehensive and unambiguous preferences are applied to the perception of benefits
and costs immanent in choices, which enable the ranking of these options.277 The
corresponding additive utility function for a decision situation with one attribute is stated
on the following page.278
271 Burns, Tom/Roszkowska, Ewa (2016), p. 196-197. 272 Boudon, Raymond (2009), p. 180. 273 Mas-Colell, Andreu/Whinston, Michael D./Green, Jerry R. (1995), p. 6-7. 274 Ibid. 275 Ibid. 276 Ibid. 277 Burns, Tom/Roszkowska, Ewa (2016), p. 196-197. 278 Homans, George Caspar (1958), p. 603 | Rao, Vithala R. (2011), p. 5-6.
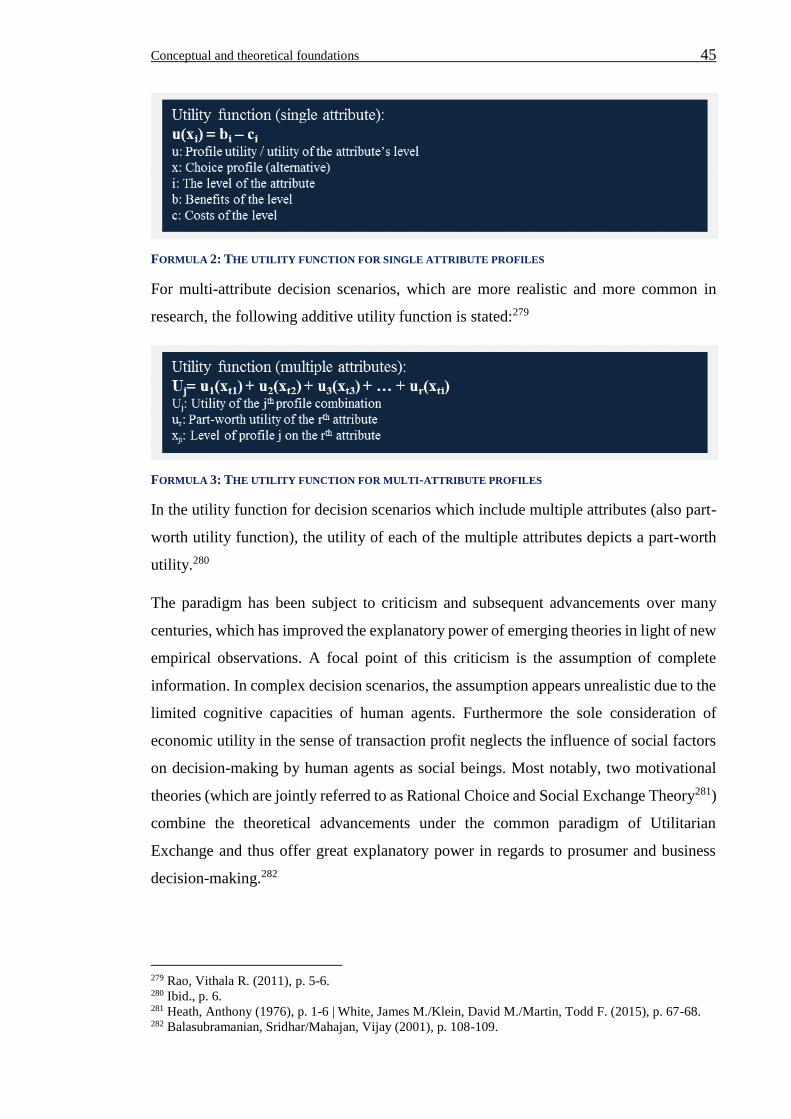
Conceptual and theoretical foundations 45
FORMULA 2: THE UTILITY FUNCTION FOR SINGLE ATTRIBUTE PROFILES
For multi-attribute decision scenarios, which are more realistic and more common in
research, the following additive utility function is stated:279
FORMULA 3: THE UTILITY FUNCTION FOR MULTI-ATTRIBUTE PROFILES
In the utility function for decision scenarios which include multiple attributes (also part-
worth utility function), the utility of each of the multiple attributes depicts a part-worth
utility.280
The paradigm has been subject to criticism and subsequent advancements over many
centuries, which has improved the explanatory power of emerging theories in light of new
empirical observations. A focal point of this criticism is the assumption of complete
information. In complex decision scenarios, the assumption appears unrealistic due to the
limited cognitive capacities of human agents. Furthermore the sole consideration of
economic utility in the sense of transaction profit neglects the influence of social factors
on decision-making by human agents as social beings. Most notably, two motivational
theories (which are jointly referred to as Rational Choice and Social Exchange Theory281)
combine the theoretical advancements under the common paradigm of Utilitarian
Exchange and thus offer great explanatory power in regards to prosumer and business
decision-making.282
279 Rao, Vithala R. (2011), p. 5-6. 280 Ibid., p. 6. 281 Heath, Anthony (1976), p. 1-6 | White, James M./Klein, David M./Martin, Todd F. (2015), p. 67-68. 282 Balasubramanian, Sridhar/Mahajan, Vijay (2001), p. 108-109.
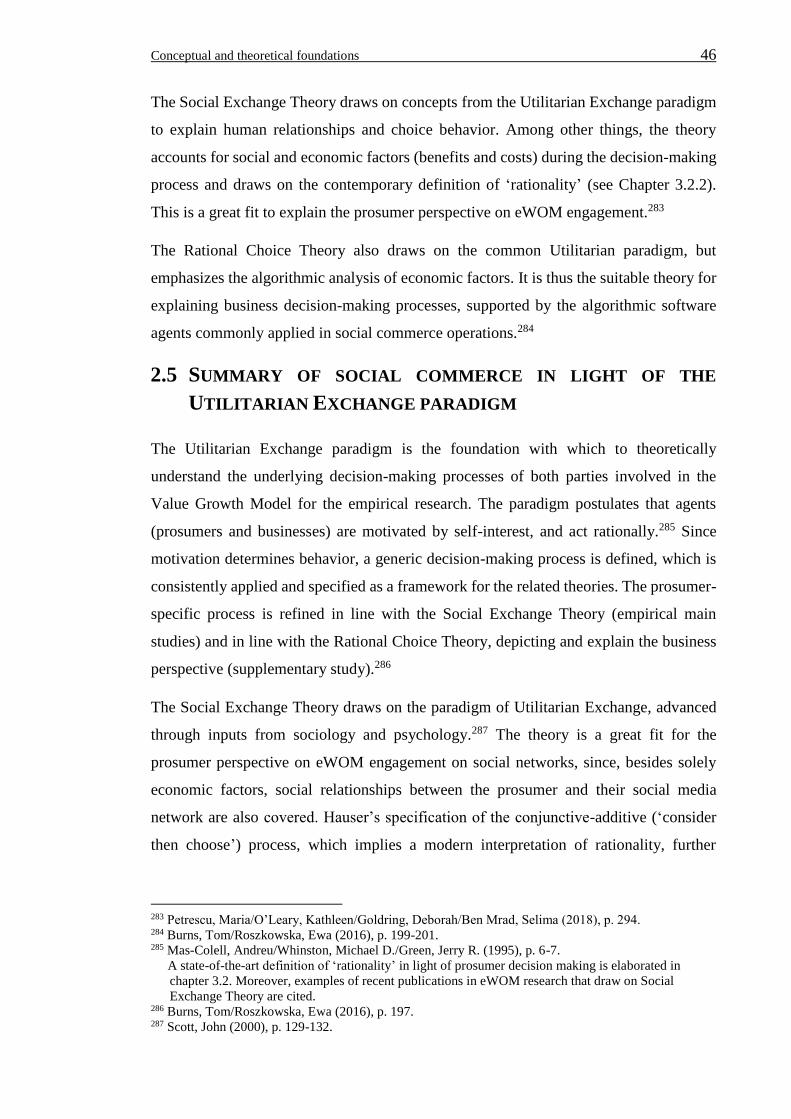
Conceptual and theoretical foundations 46
The Social Exchange Theory draws on concepts from the Utilitarian Exchange paradigm
to explain human relationships and choice behavior. Among other things, the theory
accounts for social and economic factors (benefits and costs) during the decision-making
process and draws on the contemporary definition of ‘rationality’ (see Chapter 3.2.2).
This is a great fit to explain the prosumer perspective on eWOM engagement.283
The Rational Choice Theory also draws on the common Utilitarian paradigm, but
emphasizes the algorithmic analysis of economic factors. It is thus the suitable theory for
explaining business decision-making processes, supported by the algorithmic software
agents commonly applied in social commerce operations.284
2.5 SUMMARY OF SOCIAL COMMERCE IN LIGHT OF THE
UTILITARIAN EXCHANGE PARADIGM
The Utilitarian Exchange paradigm is the foundation with which to theoretically
understand the underlying decision-making processes of both parties involved in the
Value Growth Model for the empirical research. The paradigm postulates that agents
(prosumers and businesses) are motivated by self-interest, and act rationally.285 Since
motivation determines behavior, a generic decision-making process is defined, which is
consistently applied and specified as a framework for the related theories. The prosumer-
specific process is refined in line with the Social Exchange Theory (empirical main
studies) and in line with the Rational Choice Theory, depicting and explain the business
perspective (supplementary study).286
The Social Exchange Theory draws on the paradigm of Utilitarian Exchange, advanced
through inputs from sociology and psychology.287 The theory is a great fit for the
prosumer perspective on eWOM engagement on social networks, since, besides solely
economic factors, social relationships between the prosumer and their social media
network are also covered. Hauser’s specification of the conjunctive-additive (‘consider
then choose’) process, which implies a modern interpretation of rationality, further
283 Petrescu, Maria/O’Leary, Kathleen/Goldring, Deborah/Ben Mrad, Selima (2018), p. 294. 284 Burns, Tom/Roszkowska, Ewa (2016), p. 199-201. 285 Mas-Colell, Andreu/Whinston, Michael D./Green, Jerry R. (1995), p. 6-7.
A state-of-the-art definition of ‘rationality’ in light of prosumer decision making is elaborated in
chapter 3.2. Moreover, examples of recent publications in eWOM research that draw on Social
Exchange Theory are cited. 286 Burns, Tom/Roszkowska, Ewa (2016), p. 197. 287 Scott, John (2000), p. 129-132.
Conceptual and theoretical foundations 47
increases closeness to customer reality.288 The Rational Choice Theory draws on the
consistent paradigm, and emphasizes the once-figurative and now literal algorithmic
profit-maximizing process supported by algorithms in social commerce business.289 Thus,
whilst the Social Exchange Theory is needed to explain social influences on prosumer
decision making regarding eWOM engagement, the Rational Choice Theory explains
why and how algorithmic-supported businesses offer price discounts in return for eWOM.
The theoretical propositions and concepts are presented in the respective studies in greater
detail. Because of the dissertation’s focus on the prosumer perspective in the main studies,
the Social Exchange Theory is elaborated first upon in Chapter (3.2).
288 Hauser, John R. (2014), p. 1688-1899. 289 Burns, Tom/Roszkowska, Ewa (2016), p. 197.
Taxonomy and determinants of engagement 48
3 TAXONOMY AND DETERMINANTS OF ENGAGEMENT
3.1 STATE OF RESEARCH ON PROSUMER EWOM ENGAGEMENT
3.1.1 OBJECTIVES AND APPROACH TO THE LITERATURE REVIEW
Advancements in science require a thorough review and synthesis of extant knowledge.290
In this dissertation, the extant literature is systematically reviewed, regarding the known
determinants of prosumer engagement in eWOM on social media networks. The gaps and
inadequacies in explaining the phenomenon are identified and constitute opportunities for
contributions, thus providing fruitful ground for the subsequent empirical investigations.
The systematic literature review (SLR) is not only a foundation of contributions in
empirical research, but also an established research methodology in itself in the field of
marketing science.291 In order to ensure a rigorous conduct in the review, Cooper’s five
step structure is followed,292 enriched by Randolph’s advancement of the latter293 and
Webster et al.’s structured approach to gathering literature.294 Furthermore, Webster et
al.’s augmented literature matrix, as the visualized outcome of systematic literature
reviews, is adjusted to the content and objectives of this dissertation.295
(1) Problem formulation and key variables
Social commerce depicts a significant improvement in traditional e-commerce business
models, and therefore represents the future of commerce on the web.296 It also offers the
opportunity to apply the Value Growth Model to increase value for businesses and
prosumers in tandem. An in-depth understanding of the factors that determine the
prosumers’ engagement in incentivized eWOM is vital, and the literature review therefore
aims to provide a comprehensive yet concise overview of the decisive factors which
determine whether or not prosumers engage in eWOM, which types of eWOM they
prefer, and how this is manifested in quantitative outcome variables. Extant knowledge
290 Locke, Karen/Golden-Biddle/Karen (1997), p. 1024-1063. 291 See-To, Eric W.K./Ho, Kevin K.W. (2014), p. 184 | Fellnhofer, Katharina (2019), p. 30-31 | Sijoria, Charu/Mukherjee, Srabanti/Datta, Biplab (2018), p. 529. 292 Cooper, Harris M./Patall, Erika A./Lindsay, James J. (2009), p. 349-351. 293 Randolph/Justus (2009), p. 4-5. 294 Webster, Jane/Watson, Richard T. (2002), p. xvi-xvii. 295 Ibid., p. xvii. 296 Liebana-Cabanillas, F./Alonso-Dos-Santos, M. (2017), p. 1-3.
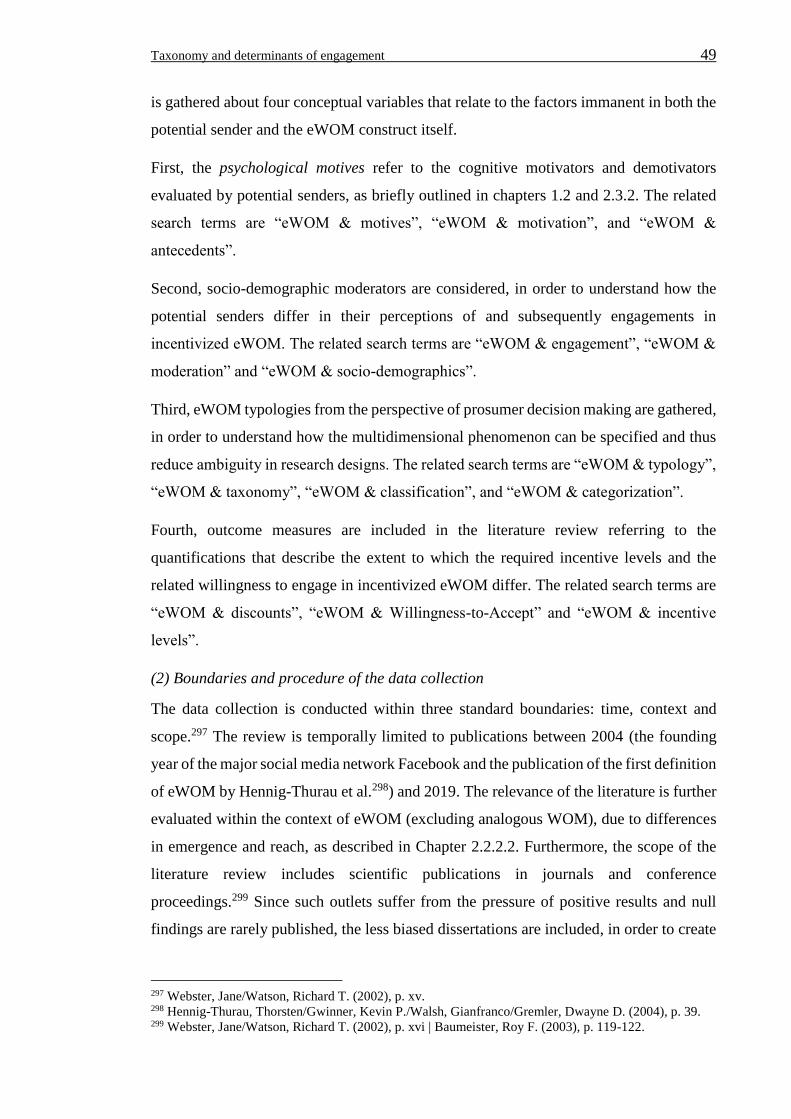
Taxonomy and determinants of engagement 49
is gathered about four conceptual variables that relate to the factors immanent in both the
potential sender and the eWOM construct itself.
First, the psychological motives refer to the cognitive motivators and demotivators
evaluated by potential senders, as briefly outlined in chapters 1.2 and 2.3.2. The related
search terms are “eWOM & motives”, “eWOM & motivation”, and “eWOM &
antecedents”.
Second, socio-demographic moderators are considered, in order to understand how the
potential senders differ in their perceptions of and subsequently engagements in
incentivized eWOM. The related search terms are “eWOM & engagement”, “eWOM &
moderation” and “eWOM & socio-demographics”.
Third, eWOM typologies from the perspective of prosumer decision making are gathered,
in order to understand how the multidimensional phenomenon can be specified and thus
reduce ambiguity in research designs. The related search terms are “eWOM & typology”,
“eWOM & taxonomy”, “eWOM & classification”, and “eWOM & categorization”.
Fourth, outcome measures are included in the literature review referring to the
quantifications that describe the extent to which the required incentive levels and the
related willingness to engage in incentivized eWOM differ. The related search terms are
“eWOM & discounts”, “eWOM & Willingness-to-Accept” and “eWOM & incentive
levels”.
(2) Boundaries and procedure of the data collection
The data collection is conducted within three standard boundaries: time, context and
scope.297 The review is temporally limited to publications between 2004 (the founding
year of the major social media network Facebook and the publication of the first definition
of eWOM by Hennig-Thurau et al.298) and 2019. The relevance of the literature is further
evaluated within the context of eWOM (excluding analogous WOM), due to differences
in emergence and reach, as described in Chapter 2.2.2.2. Furthermore, the scope of the
literature review includes scientific publications in journals and conference
proceedings.299 Since such outlets suffer from the pressure of positive results and null
findings are rarely published, the less biased dissertations are included, in order to create
297 Webster, Jane/Watson, Richard T. (2002), p. xv. 298 Hennig-Thurau, Thorsten/Gwinner, Kevin P./Walsh, Gianfranco/Gremler, Dwayne D. (2004), p. 39. 299 Webster, Jane/Watson, Richard T. (2002), p. xvi | Baumeister, Roy F. (2003), p. 119-122.
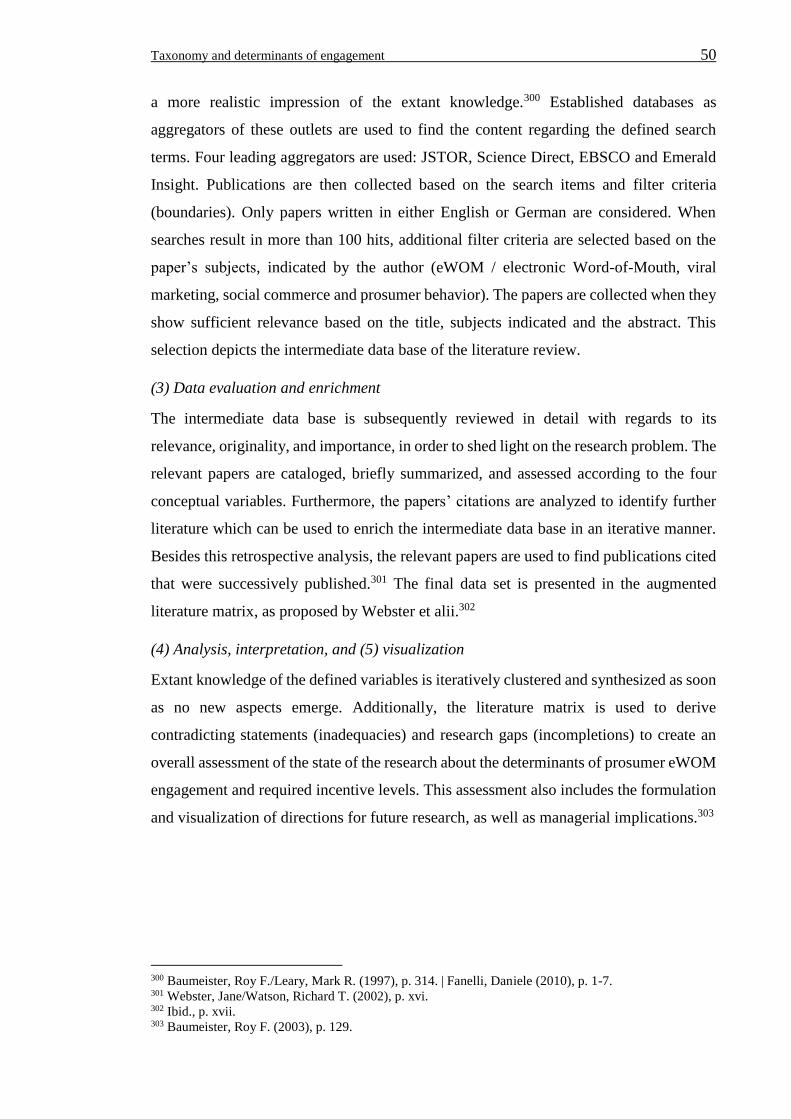
Taxonomy and determinants of engagement 50
a more realistic impression of the extant knowledge.300 Established databases as
aggregators of these outlets are used to find the content regarding the defined search
terms. Four leading aggregators are used: JSTOR, Science Direct, EBSCO and Emerald
Insight. Publications are then collected based on the search items and filter criteria
(boundaries). Only papers written in either English or German are considered. When
searches result in more than 100 hits, additional filter criteria are selected based on the
paper’s subjects, indicated by the author (eWOM / electronic Word-of-Mouth, viral
marketing, social commerce and prosumer behavior). The papers are collected when they
show sufficient relevance based on the title, subjects indicated and the abstract. This
selection depicts the intermediate data base of the literature review.
(3) Data evaluation and enrichment
The intermediate data base is subsequently reviewed in detail with regards to its
relevance, originality, and importance, in order to shed light on the research problem. The
relevant papers are cataloged, briefly summarized, and assessed according to the four
conceptual variables. Furthermore, the papers’ citations are analyzed to identify further
literature which can be used to enrich the intermediate data base in an iterative manner.
Besides this retrospective analysis, the relevant papers are used to find publications cited
that were successively published.301 The final data set is presented in the augmented
literature matrix, as proposed by Webster et alii.302
(4) Analysis, interpretation, and (5) visualization
Extant knowledge of the defined variables is iteratively clustered and synthesized as soon
as no new aspects emerge. Additionally, the literature matrix is used to derive
contradicting statements (inadequacies) and research gaps (incompletions) to create an
overall assessment of the state of the research about the determinants of prosumer eWOM
engagement and required incentive levels. This assessment also includes the formulation
and visualization of directions for future research, as well as managerial implications.303
300 Baumeister, Roy F./Leary, Mark R. (1997), p. 314. | Fanelli, Daniele (2010), p. 1-7. 301 Webster, Jane/Watson, Richard T. (2002), p. xvi. 302 Ibid., p. xvii. 303 Baumeister, Roy F. (2003), p. 129.
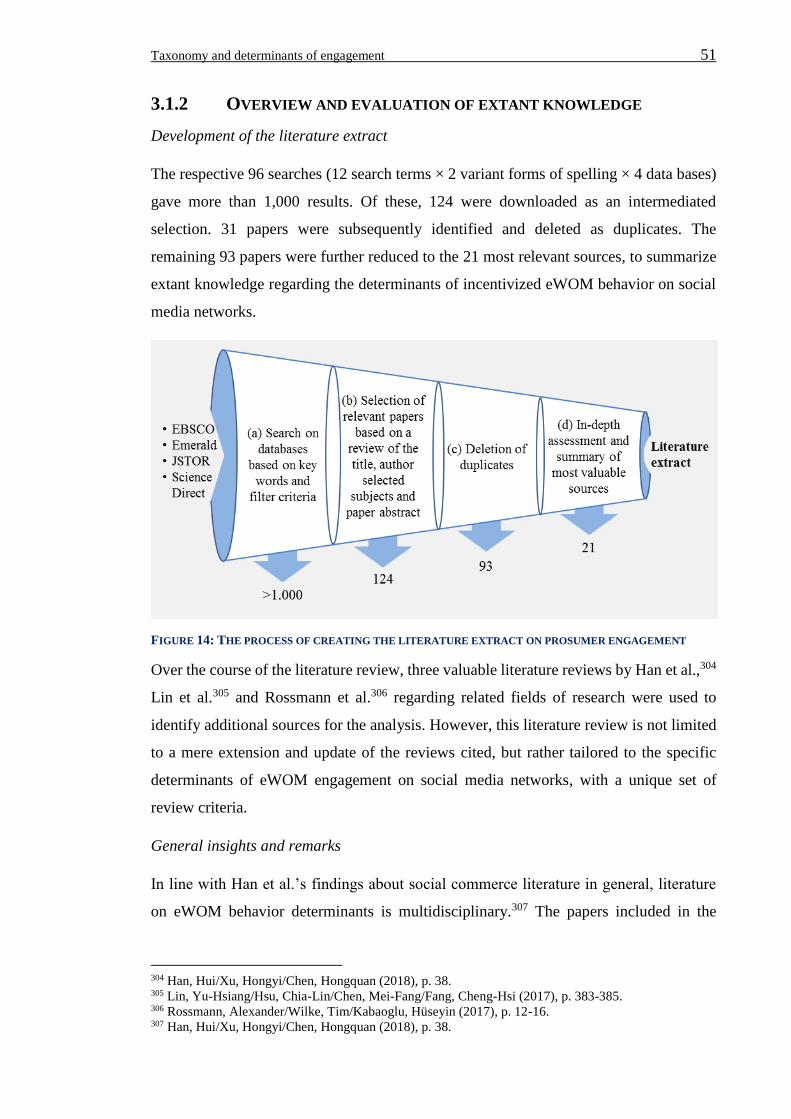
Taxonomy and determinants of engagement 51
3.1.2 OVERVIEW AND EVALUATION OF EXTANT KNOWLEDGE
Development of the literature extract
The respective 96 searches (12 search terms × 2 variant forms of spelling × 4 data bases)
gave more than 1,000 results. Of these, 124 were downloaded as an intermediated
selection. 31 papers were subsequently identified and deleted as duplicates. The
remaining 93 papers were further reduced to the 21 most relevant sources, to summarize
extant knowledge regarding the determinants of incentivized eWOM behavior on social
media networks.
FIGURE 14: THE PROCESS OF CREATING THE LITERATURE EXTRACT ON PROSUMER ENGAGEMENT
Over the course of the literature review, three valuable literature reviews by Han et al.,304
Lin et al.305 and Rossmann et al.306 regarding related fields of research were used to
identify additional sources for the analysis. However, this literature review is not limited
to a mere extension and update of the reviews cited, but rather tailored to the specific
determinants of eWOM engagement on social media networks, with a unique set of
review criteria.
General insights and remarks
In line with Han et al.’s findings about social commerce literature in general, literature
on eWOM behavior determinants is multidisciplinary.307 The papers included in the
304 Han, Hui/Xu, Hongyi/Chen, Hongquan (2018), p. 38. 305 Lin, Yu-Hsiang/Hsu, Chia-Lin/Chen, Mei-Fang/Fang, Cheng-Hsi (2017), p. 383-385. 306 Rossmann, Alexander/Wilke, Tim/Kabaoglu, Hüseyin (2017), p. 12-16. 307 Han, Hui/Xu, Hongyi/Chen, Hongquan (2018), p. 38.
Taxonomy and determinants of engagement 52
literature extract include the disciplines of marketing (e.g. Journal of Marketing Research
and Journal of Marketing), law (e.g. Journal of Legal Studies), IT (e.g. Journal of
Telematics and Informatics) and psychology (e.g. Journal of Computers in Human
Behavior). Therefore, a variety of different perspectives on eWOM behavior with varying
eWOM definitions and differentiations have been published.
Another insight is the mismatch between the dynamic landscape of prosumer
communication platforms and tools in times of digitization, and the slow process of
scientific publications. Gvili et al. submitted a paper about eWOM behavior through
different digital channels such as short message services (SMS) to the Journal of Internet
Research (SMS volume of 22.3 billion) in 2014, it was accepted in 2015 (SMS volume
of 16.6 billion) and was published in 2016 (SMS volume of 12.7 billion).308 In the same
period of time Instagram, a channel which is not even mentioned, documented an
increasing number of global MAU, from 200 million in 2014 to 400 million in 2015 and
600 million in 2016.309 During the reviewing process, the SMS channel lost almost half
of its volume as a potential proxy of importance for eWOM researchers, whilst Instagram
tripled and grew in absolute terms by more than twice of the German population per year.
In addition, many authors (e.g. Ryu et al. (2007), Berger et. al (2011), Liang et al. (2013),
Heimbrach (2016)) use generic eWOM definitions without further specifications about
the nature of the eWOM engagement (e.g. channel, type of engagement, online/offline
etc.). The findings, therefore, draw on extremely different eWOM landscapes and,
therefore, prosumer perceptions of the multidimensional construct. Furthermore, most of
the published research is based on rather small convenience samples of students from one
nationality or one university (low external validity of the data sample), which further
limits the generalizability of the extant knowledge. Although the selected publications
were seminal in their time and are still much worthwhile, it seems questionable if the
findings about ‘eWOM’ are appropriate to explain the determinants of such behavior in
today’s settings without further reflection and consolidation.
In the following, the literature extract is further analyzed and summarized within the
augmented literature matrix to provide a critical overview of the extant knowledge, its
limitations, and allow for the identification of contradictions and research gaps. Besides
the authors and the paper’s publication years, the main topics and key findings are
308 Gvili, Yaniv/Levy, Shalom (2016), p. 1030-1051. | Bundesnetzagentur, Webpage of: Statista, Inc. (2018). 309 Statista, Inc. (2017), p. 1 | MAU: Monthly Active Users (unique).
Taxonomy and determinants of engagement 53
condensed into two bullet points. The first () reflects the main topics, while the second
() depicts the key findings. Furthermore, the consideration of eWOM on social media
networks is coded : yes and : no, to provide an overview of the covered variables
which is reduced in complexity.
The determinants, i.e., factors that affect the prosumers’ eWOM behavior as independent
variables or moderators, are clustered into five categories through an iterative process:
(1) Psychological motives (motivators (benefits), de-motivators (costs)),
(2) Product / brand (effects of the product, service or brand attributes),
(3) eWOM type (all the variables that create different manifestations of the engagement,
such as network, media type etc.),
(4) Socio-demographics (nature and nurture related characteristics of the sender),
(5) Technology / process (the effect of different social commerce platform designs).
Furthermore, the operationalization of eWOM engagement as the dependent variable is
stated where applicable, to understand the research designs comprehensively.
Finally, a summary of the limitations and weaknesses found is formulated.
The augmented literature matrix is depicted in Table 3 on the following pages.
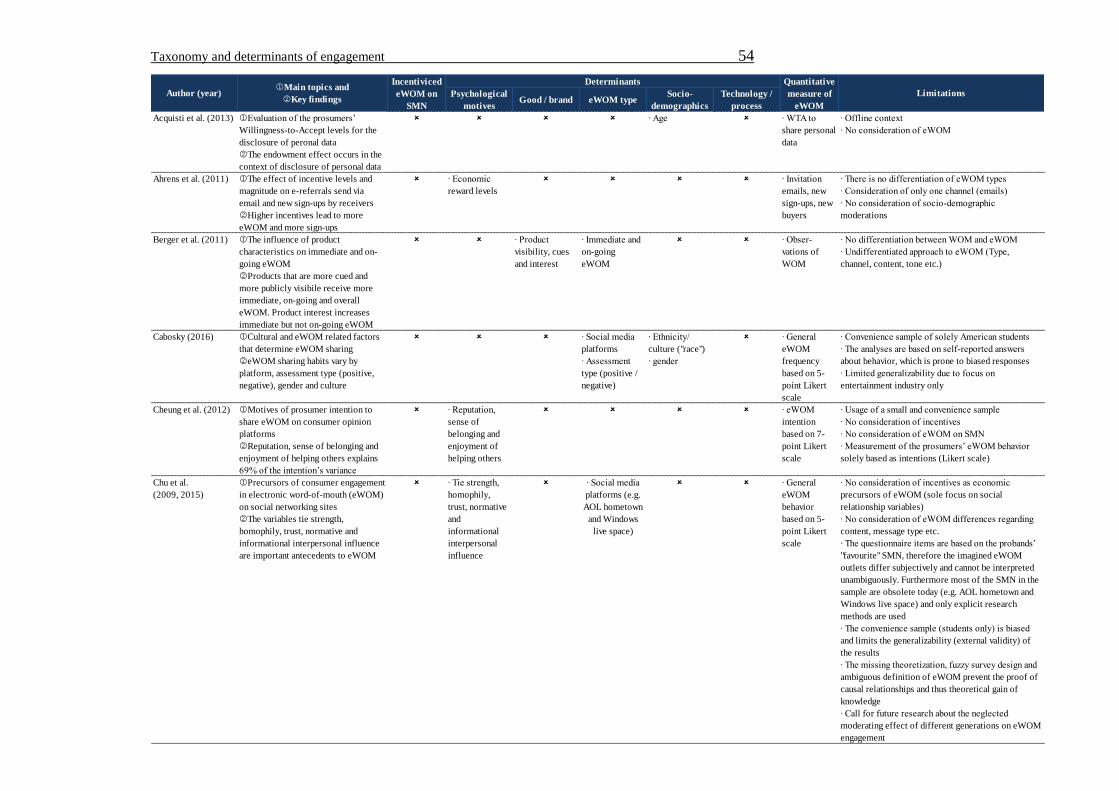
Taxonomy and determinants of engagement 54
Psychological
motivesGood / brand eWOM type
Socio-
demographics
Technology /
process
Acquisti et al. (2013) Evaluation of the prosumers’
Willingness-to-Accept levels for the
disclosure of peronal data
The endowment effect occurs in the
context of disclosure of personal data
∙ Age ∙ WTA to
share personal
data
∙ Offline context
∙ No consideration of eWOM
Ahrens et al. (2011) The effect of incentive levels and
magnitude on e-referrals send via
email and new sign-ups by receivers
Higher incentives lead to more
eWOM and more sign-ups
∙ Economic
reward levels
∙ Invitation
emails, new
sign-ups, new
buyers
∙ There is no differentiation of eWOM types
∙ Consideration of only one channel (emails)
∙ No consideration of socio-demographic
moderations
Berger et al. (2011) The influence of product
characteristics on immediate and on-
going eWOM
Products that are more cued and
more publicly visibile receive more
immediate, on-going and overall
eWOM. Product interest increases
immediate but not on-going eWOM
∙ Product
visibility, cues
and interest
∙ Immediate and
on-going
eWOM
∙ Obser-
vations of
WOM
∙ No differentiation between WOM and eWOM
∙ Undifferentiated approach to eWOM (Type,
channel, content, tone etc.)
Cabosky (2016) Cultural and eWOM related factors
that determine eWOM sharing
eWOM sharing habits vary by
platform, assessment type (positive,
negative), gender and culture
∙ Social media
platforms
∙ Assessment
type (positive /
negative)
∙ Ethnicity/
culture ("race")
∙ gender
∙ General
eWOM
frequency
based on 5-
point Likert
scale
∙ Convenience sample of solely American students
∙ The analyses are based on self-reported answers
about behavior, which is prone to biased responses
∙ Limited generalizability due to focus on
entertainment industry only
Cheung et al. (2012) Motives of prosumer intention to
share eWOM on consumer opinion
platforms
Reputation, sense of belonging and
enjoyment of helping others explains
69% of the intention’s variance
∙ Reputation,
sense of
belonging and
enjoyment of
helping others
∙ eWOM
intention
based on 7-
point Likert
scale
∙ Usage of a small and convenience sample
∙ No consideration of incentives
∙ No consideration of eWOM on SMN
∙ Measurement of the prosumers’ eWOM behavior
solely based as intentions (Likert scale)
Chu et al.
(2009, 2015)
Precursors of consumer engagement
in electronic word-of-mouth (eWOM)
on social networking sites
The variables tie strength,
homophily, trust, normative and
informational interpersonal influence
are important antecedents to eWOM
∙ Tie strength,
homophily,
trust, normative
and
informational
interpersonal
influence
∙ Social media
platforms (e.g.
AOL hometown
and Windows
live space)
∙ General
eWOM
behavior
based on 5-
point Likert
scale
∙ No consideration of incentives as economic
precursors of eWOM (sole focus on social
relationship variables)
∙ No consideration of eWOM differences regarding
content, message type etc.
∙ The questionnaire items are based on the probands’
"favourite" SMN, therefore the imagined eWOM
outlets differ subjectively and cannot be interpreted
unambiguously. Furthermore most of the SMN in the
sample are obsolete today (e.g. AOL hometown and
Windows live space) and only explicit research
methods are used
∙ The convenience sample (students only) is biased
and limits the generalizability (external validity) of
the results
∙ The missing theoretization, fuzzy survey design and
ambiguous definition of eWOM prevent the proof of
causal relationships and thus theoretical gain of
knowledge
∙ Call for future research about the neglected
moderating effect of different generations on eWOM
engagement
Author (year)Main topics and
Key findings
Incentiviced
eWOM on
SMN
Limitations
Quantitative
measure of
eWOM
Determinants
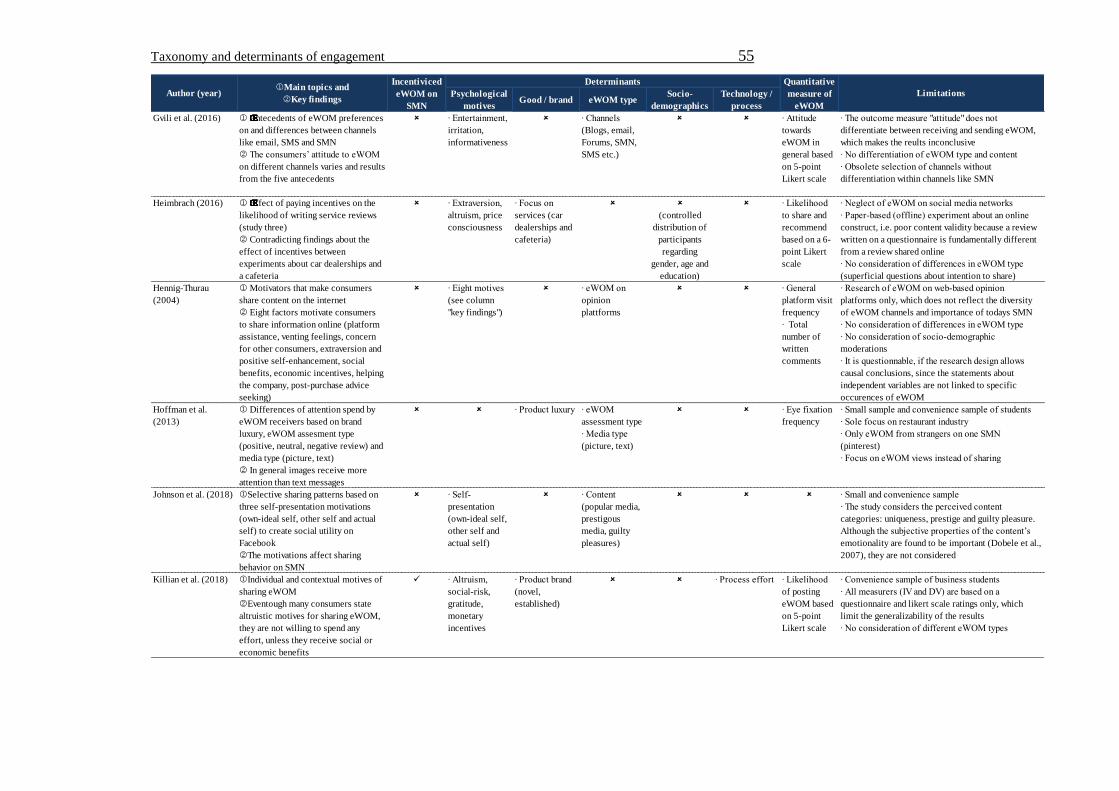
Taxonomy and determinants of engagement 55
Psychological
motivesGood / brand eWOM type
Socio-
demographics
Technology /
process
Gvili et al. (2016) ŒŒŒŒŒŒŒŒŒŒŒAntecedents of eWOM preferences
on and differences between channels
like email, SMS and SMN
The consumers’ attitude to eWOM
on different channels varies and results
from the five antecedents
∙ Entertainment,
irritation,
informativeness
∙ Channels
(Blogs, email,
Forums, SMN,
SMS etc.)
∙ Attitude
towards
eWOM in
general based
on 5-point
Likert scale
∙ The outcome measure "attitude" does not
differentiate between receiving and sending eWOM,
which makes the reults inconclusive
∙ No differentiation of eWOM type and content
∙ Obsolete selection of channels without
differentiation within channels like SMN
Heimbrach (2016) ŒŒŒŒŒŒŒŒŒŒŒEffect of paying incentives on the
likelihood of writing service reviews
(study three)
Contradicting findings about the
effect of incentives between
experiments about car dealerships and
a cafeteria
∙ Extraversion,
altruism, price
consciousness
∙ Focus on
services (car
dealerships and
cafeteria)
(controlled
distribution of
participants
regarding
gender, age and
education)
∙ Likelihood
to share and
recommend
based on a 6-
point Likert
scale
∙ Neglect of eWOM on social media networks
∙ Paper-based (offline) experiment about an online
construct, i.e. poor content validity because a review
written on a questionnaire is fundamentally different
from a review shared online
∙ No consideration of differences in eWOM type
(superficial questions about intention to share)
Hennig-Thurau
(2004)
Motivators that make consumers
share content on the internet
Eight factors motivate consumers
to share information online (platform
assistance, venting feelings, concern
for other consumers, extraversion and
positive self-enhancement, social
benefits, economic incentives, helping
the company, post-purchase advice
seeking)
∙ Eight motives
(see column
"key findings")
∙ eWOM on
opinion
plattforms
∙ General
platform visit
frequency
∙ Total
number of
written
comments
∙ Research of eWOM on web-based opinion
platforms only, which does not reflect the diversity
of eWOM channels and importance of todays SMN
∙ No consideration of differences in eWOM type
∙ No consideration of socio-demographic
moderations
∙ It is questionnable, if the research design allows
causal conclusions, since the statements about
independent variables are not linked to specific
occurences of eWOM
Hoffman et al.
(2013)
Differences of attention spend by
eWOM receivers based on brand
luxury, eWOM assesment type
(positive, neutral, negative review) and
media type (picture, text)
In general images receive more
attention than text messages
∙ Product luxury ∙ eWOM
assessment type
∙ Media type
(picture, text)
∙ Eye fixation
frequency
∙ Small sample and convenience sample of students
∙ Sole focus on restaurant industry
∙ Only eWOM from strangers on one SMN
(pinterest)
∙ Focus on eWOM views instead of sharing
Johnson et al. (2018) Selective sharing patterns based on
three self-presentation motivations
(own-ideal self, other self and actual
self) to create social utility on
The motivations affect sharing
behavior on SMN
∙ Self-
presentation
(own-ideal self,
other self and
actual self)
∙ Content
(popular media,
prestigous
media, guilty
pleasures)
∙ Small and convenience sample
∙ The study considers the perceived content
categories: uniqueness, prestige and guilty pleasure.
Although the subjective properties of the content’s
emotionality are found to be important (Dobele et al.,
2007), they are not considered
Killian et al. (2018) Individual and contextual motives of
sharing eWOM
Eventough many consumers state
altruistic motives for sharing eWOM,
they are not willing to spend any
effort, unless they receive social or
economic benefits
∙ Altruism,
social-risk,
gratitude,
monetary
incentives
∙ Product brand
(novel,
established)
∙ Process effort ∙ Likelihood
of posting
eWOM based
on 5-point
Likert scale
∙ Convenience sample of business students
∙ All measurers (IV and DV) are based on a
questionnaire and likert scale ratings only, which
limit the generalizability of the results
∙ No consideration of different eWOM types
Author (year)Main topics and
Key findings
Incentiviced
eWOM on
SMN
Limitations
Quantitative
measure of
eWOM
Determinants
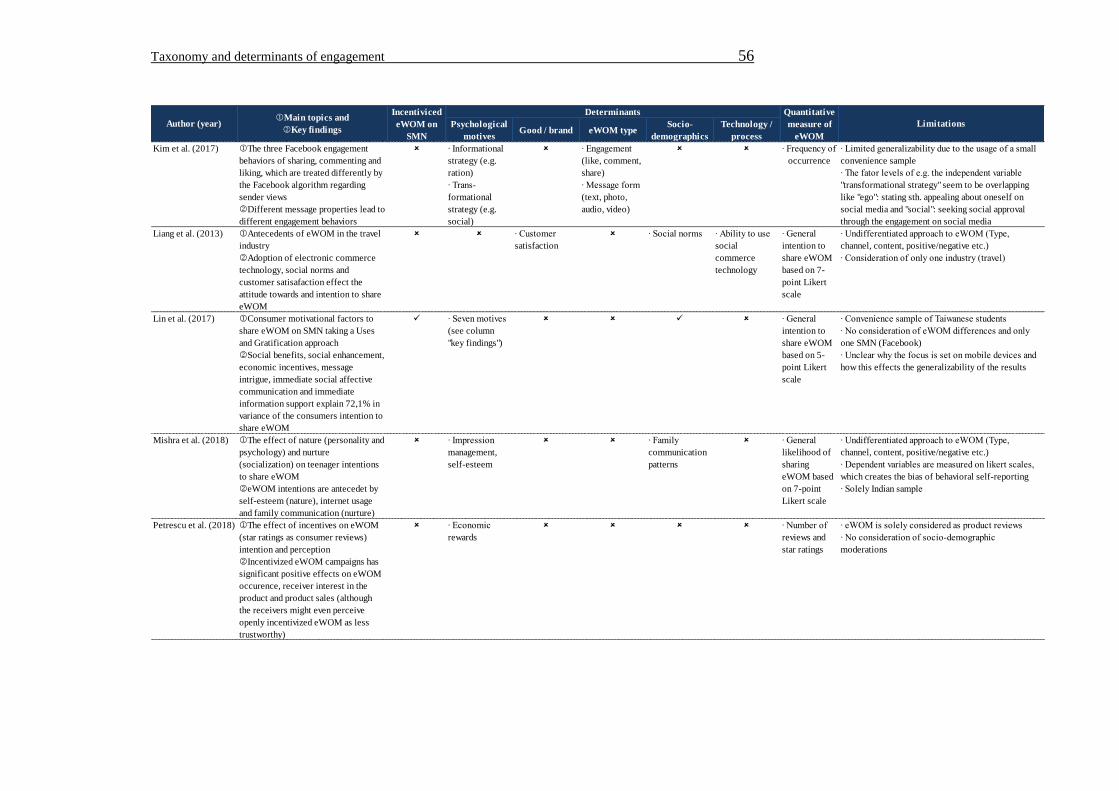
Taxonomy and determinants of engagement 56
Psychological
motivesGood / brand eWOM type
Socio-
demographics
Technology /
process
Kim et al. (2017) The three Facebook engagement
behaviors of sharing, commenting and
liking, which are treated differently by
the Facebook algorithm regarding
sender views
Different message properties lead to
different engagement behaviors
∙ Informational
strategy (e.g.
ration)
∙ Trans-
formational
strategy (e.g.
social)
∙ Engagement
(like, comment,
share)
∙ Message form
(text, photo,
audio, video)
∙ Frequency of
occurrence
∙ Limited generalizability due to the usage of a small
convenience sample
∙ The fator levels of e.g. the independent variable
"transformational strategy" seem to be overlapping
like "ego": stating sth. appealing about oneself on
social media and "social": seeking social approval
through the engagement on social media
Liang et al. (2013) Antecedents of eWOM in the travel
industry
Adoption of electronic commerce
technology, social norms and
customer satisafaction effect the
attitude towards and intention to share
eWOM
∙ Customer
satisfaction
∙ Social norms ∙ Ability to use
social
commerce
technology
∙ General
intention to
share eWOM
based on 7-
point Likert
scale
∙ Undifferentiated approach to eWOM (Type,
channel, content, positive/negative etc.)
∙ Consideration of only one industry (travel)
Lin et al. (2017) Consumer motivational factors to
share eWOM on SMN taking a Uses
and Gratification approach
Social benefits, social enhancement,
economic incentives, message
intrigue, immediate social affective
communication and immediate
information support explain 72,1% in
variance of the consumers intention to
share eWOM
∙ Seven motives
(see column
"key findings")
∙ General
intention to
share eWOM
based on 5-
point Likert
scale
∙ Convenience sample of Taiwanese students
∙ No consideration of eWOM differences and only
one SMN (Facebook)
∙ Unclear why the focus is set on mobile devices and
how this effects the generalizability of the results
Mishra et al. (2018) The effect of nature (personality and
psychology) and nurture
(socialization) on teenager intentions
to share eWOM
eWOM intentions are antecedet by
self-esteem (nature), internet usage
and family communication (nurture)
∙ Impression
management,
self-esteem
∙ Family
communication
patterns
∙ General
likelihood of
sharing
eWOM based
on 7-point
Likert scale
∙ Undifferentiated approach to eWOM (Type,
channel, content, positive/negative etc.)
∙ Dependent variables are measured on likert scales,
which creates the bias of behavioral self-reporting
∙ Solely Indian sample
Petrescu et al. (2018) The effect of incentives on eWOM
(star ratings as consumer reviews)
intention and perception
Incentivized eWOM campaigns has
significant positive effects on eWOM
occurence, receiver interest in the
product and product sales (although
the receivers might even perceive
openly incentivized eWOM as less
trustworthy)
∙ Economic
rewards
∙ Number of
reviews and
star ratings
∙ eWOM is solely considered as product reviews
∙ No consideration of socio-demographic
moderations
Author (year)Main topics and
Key findings
Incentiviced
eWOM on
SMN
Limitations
Quantitative
measure of
eWOM
Determinants
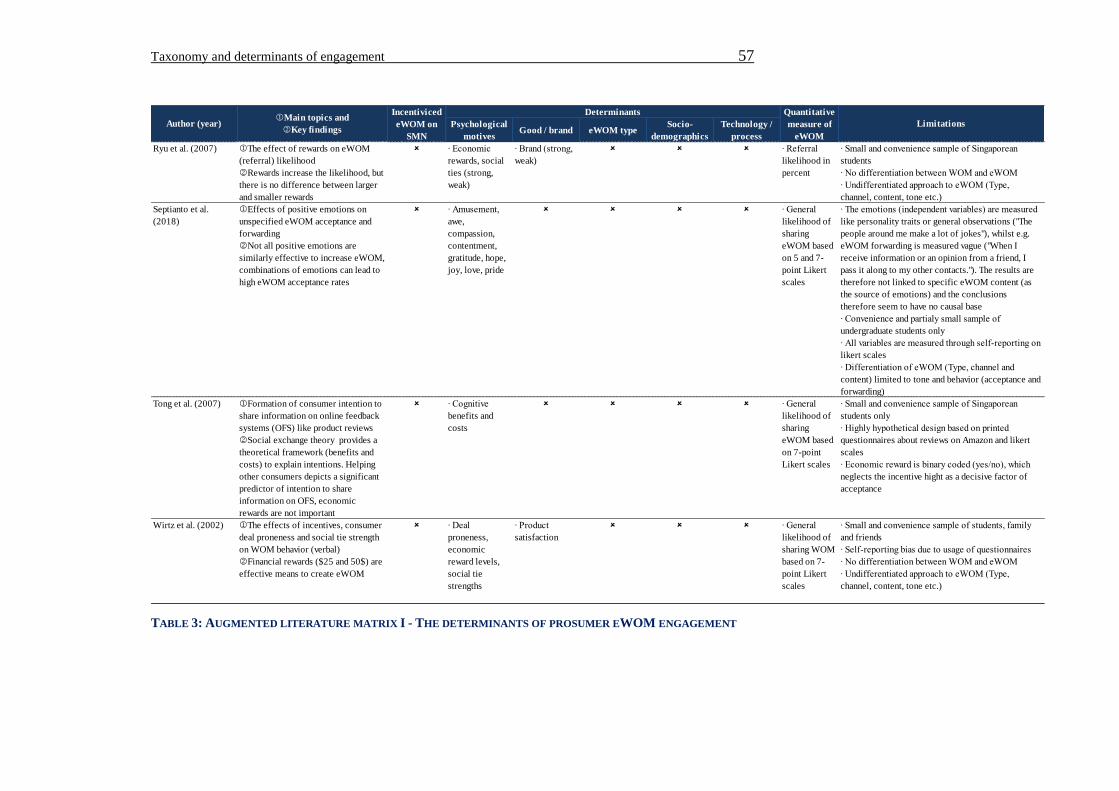
Taxonomy and determinants of engagement 57
TABLE 3: AUGMENTED LITERATURE MATRIX I - THE DETERMINANTS OF PROSUMER EWOM ENGAGEMENT
Psychological
motivesGood / brand eWOM type
Socio-
demographics
Technology /
process
Ryu et al. (2007) The effect of rewards on eWOM
(referral) likelihood
Rewards increase the likelihood, but
there is no difference between larger
and smaller rewards
∙ Economic
rewards, social
ties (strong,
weak)
∙ Brand (strong,
weak)
∙ Referral
likelihood in
percent
∙ Small and convenience sample of Singaporean
students
∙ No differentiation between WOM and eWOM
∙ Undifferentiated approach to eWOM (Type,
channel, content, tone etc.)
Septianto et al.
(2018)
Effects of positive emotions on
unspecified eWOM acceptance and
forwarding
Not all positive emotions are
similarly effective to increase eWOM,
combinations of emotions can lead to
high eWOM acceptance rates
∙ Amusement,
awe,
compassion,
contentment,
gratitude, hope,
joy, love, pride
∙ General
likelihood of
sharing
eWOM based
on 5 and 7-
point Likert
scales
∙ The emotions (independent variables) are measured
like personality traits or general observations ("The
people around me make a lot of jokes"), whilst e.g.
eWOM forwarding is measured vague ("When I
receive information or an opinion from a friend, I
pass it along to my other contacts."). The results are
therefore not linked to specific eWOM content (as
the source of emotions) and the conclusions
therefore seem to have no causal base
∙ Convenience and partialy small sample of
undergraduate students only
∙ All variables are measured through self-reporting on
likert scales
∙ Differentiation of eWOM (Type, channel and
content) limited to tone and behavior (acceptance and
forwarding)
Tong et al. (2007) Formation of consumer intention to
share information on online feedback
systems (OFS) like product reviews
Social exchange theory provides a
theoretical framework (benefits and
costs) to explain intentions. Helping
other consumers depicts a significant
predictor of intention to share
information on OFS, economic
rewards are not important
∙ Cognitive
benefits and
costs
∙ General
likelihood of
sharing
eWOM based
on 7-point
Likert scales
∙ Small and convenience sample of Singaporean
students only
∙ Highly hypothetical design based on printed
questionnaires about reviews on Amazon and likert
scales
∙ Economic reward is binary coded (yes/no), which
neglects the incentive hight as a decisive factor of
acceptance
Wirtz et al. (2002) The effects of incentives, consumer
deal proneness and social tie strength
on WOM behavior (verbal)
Financial rewards ($25 and 50$) are
effective means to create eWOM
∙ Deal
proneness,
economic
reward levels,
social tie
strengths
∙ Product
satisfaction
∙ General
likelihood of
sharing WOM
based on 7-
point Likert
scales
∙ Small and convenience sample of students, family
and friends
∙ Self-reporting bias due to usage of questionnaires
∙ No differentiation between WOM and eWOM
∙ Undifferentiated approach to eWOM (Type,
channel, content, tone etc.)
Author (year)Main topics and
Key findings
Incentiviced
eWOM on
SMN
Limitations
Quantitative
measure of
eWOM
Determinants
Taxonomy and determinants of engagement 58
3.1.3 INTERPRETATION AND RESEARCH GAPS
The interpretation of the augmented literature matrix is structured along the five
antecedent dimensions of eWOM engagement. In addition, the operationalizations of
eWOM engagement which were found are summarized.
Psychological motives
Several authors have researched the psychological motives that affect prosumer eWOM
behavior. It is generally agreed upon that there are a variety of motives which are
important antecedents of eWOM engagement. The set of motives derive from Hennig-
Thurau’s initial set of factors, which provides decent explanatory power regarding the
variance in eWOM intentions.310 Lin et al.’s elaborated set of motives explains the most
variance, with 72.1%: Social benefits, social enhancement, economic incentives, message
intrigue, immediate social affective communication, and immediate information
support.311 Nevertheless, the dependent variable “intention to share eWOM”, measured
on self-reported Likert scales, still leaves the opportunity for finding research designs
with higher external validity. It remains unclear which eWOM inherent factors (de-)
motivate prosumers to engage in specific eWOM types.
Psychological rewards and different kinds of emotions also affect eWOM behavior.312
Septianto et al. found that some positive emotions facilitate eWOM.313 Nevertheless, the
definition of eWOM and the measurement of personality traits etc. are vague, and it is
questionable if the research design allows for the drawing of causal conclusions from
seemingly unconnected traits, environmental perceptions and unspecified eWOM
behavior. Humorous content in eWOM creates positive emotions like amusement, and is
regularly observed in viral advertisements (successful eWOM designs without monetary
incentives).314 Nevertheless, humor as a multidimensional construct has been so far
neglected in eWOM research. Therefore, additional research is needed regarding the
effects of different humor categories in eWOM,315 especially in light of the required
310 Hennig-Thurau, Thorsten/Gwinner, Kevin P./Walsh, Gianfranco/Gremler, Dwayne D. (2004), p.38-52. 311 Lin, Yu-Hsiang/Hsu, Chia-Lin/Chen, Mei-Fang/Fang, Cheng-Hsi (2017), p. 390. 312 Barreda, Albert A./Bilgihan, Anil/Nusair, Khaldoon/Okumus, Fevzi (2015), p. 600-609. 313 Septianto, Felix/Chiew, Tung Moi (2018), p. 6. 314 Lowe-Calverley, Emily/Grieve, Rachel (2018), p. 1906. 315 Septianto, Felix/Chiew, Tung Moi (2018), p. 6.
Taxonomy and determinants of engagement 59
incentive levels, in order to provide marketing managers with insights on how to
effectively manage eWOM.316
Economic rewards are often part of the motives for sharing eWOM that were researched,
but findings about its effect are contradictory. While Hennig-Thurau317, Wirtz et al.318,
and Lin et al.319 found a significant effect of economic rewards as an independent
variable, Yen et al. and Tong et al. found insignificant effects.320 Moreover, Heimbrach
found contradicting results about the effect of incentives on eWOM intentions.321 Extant
literature also provides contradictory findings about the effects of different reward levels.
While Wirtz et al. found a proportional relationship between eWOM occurrences and the
reward level (the higher the incentive, the more eWOM),322 surprisingly, Ryu et al. found
no significant differences between low and high rewards.323 These contradictions might
be a result of the fuzzy or missing definitions of the multidimensional eWOM construct,
small convenience samples and problematic operationalization of eWOM engagement
behavior through ‘intention to share’, measured solely on explicit Likert scales (which
are generally prone to biased responses). Therefore, research with (1) a thorough
definition of eWOM within the study design, (2) sound theorization and less prone to bias
implicit measurement of eWOM engagements, as well as (3) an integration of a
representative prosumer sample is required, to clarify the effectiveness and importance
of monetary incentives in prosumer eWOM engagement decisions.
Good and brand
Several authors have researched how good (product / service) and brand-related attributes
affect eWOM behavior. It is generally agreed that customer satisfaction positively affects
prosumer intention to share.324 Product visibility, cues and interest positively affect
immediate and on-going eWOM.325 Prosumers also prefer to share eWOM about novel
brands over established brands.326 Since eWOM on social media networks is embedded
316 Wirtz, Jochen/Chew, Patricia (2002), p. 156-158. Petrescu, Maria/O’Leary, Kathleen/Goldring, Deborah/Ben Mrad, Selima (2018), p. 294-295. 317 Hennig-Thurau, Thorsten/Gwinner, Kevin P./Walsh, Gianfranco/Gremler, Dwayne D. (2004), p. 48. 318 Wirtz, Jochen/Chew, Patricia (2002), p. 152. 319 Lin, Yu-Hsiang/Hsu, Chia-Lin/Chen, Mei-Fang/Fang, Cheng-Hsi (2017), p. 390-391. 320 Tong, Yu/Xinwei Wang and Hock-Hai Teo (2007), p. 7-8 | Yen, Chih-Lun Alan/Tang, Chun-Hung Hugo (2019), p. 14-15. 321 Heimbrach, Irina (2016), p. 99. 322 Wirtz, Jochen/Chew, Patricia (2002), p. 152. 323 Ryu, Ehri (2015), p. 92. 324 Liang, Silvia Wan-Ju/Ekinci, Yuksel/Occhiocupo, Nicoletta/Whyatt, Georgina (2013), p. 597. 325 Berger, Jonah/Schwartz, Eric M. (2011), p. 876-877. 326 Killian, Michelle/Fahy, John/O ’Loughlin, Deirdre/Kunz, Werner H. (2018), p. 16.
Taxonomy and determinants of engagement 60
into the context of the hedonic respectively utilitarian focus of the network used, it
remains unclear how prosumer eWOM behavior and preferences are affected by the
hedonic and utilitarian usage of products and brands. This relationship depicts an
interesting research gap: do eWOM senders prefer to engage in eWOM on hedonic or
utilitarian networks, and is there an interaction effect between product usage (hedonic,
utilitarian) and network usage (hedonic, utilitarian) that needs to be considered?
eWOM type
The definition of eWOM as a unidimensional communicative behavior about commercial
content on digital platforms, operationalized by “intention to share”, measured on self-
reported Likert scales, seems insufficient for capturing the versatile spectrum of the
multidimensional phenomenon. Nevertheless, most of the analyzed literature does not
specify the considered eWOM type, and therefore leaves room for different
interpretations of the questionnaire items from the participants’ perspectives, as well as
unobserved effects from the superficiality of the analyses.
Extant eWOM differentiators include the assessment type: whether the eWOM contains
positive, neutral, or negative statements. In this regard, Cabosky et al. researched the
differences between positive and negative eWOM and found that positive eWOM is more
commonly shared than negative eWOM.327
The network, as an outlet for the eWOM, precedes the kind of eWOM prosumers intend
to share.328 However, no study was found which combined and differentiated between the
different networks. Instead, only one network was researched at a time, or social media
networks in general were opposed to other outlets like e-mails or blogs.329 Gvili et al.
therefore call for future research about eWOM on social media networks, as platforms for
eWOM.330 In line with Gvili et al., Lin et al. call for future research on what kind eWOM
senders prefer to share on which social media network.331
Although Johnson et al. mention some of the different types of eWOM engagement
(sharing and liking), extant literature about the effect of different engagement types is
scarce.332 Kim et al. differentiate different engagement types, but lack both a theorization
327 Cabosky, Joseph (2016), p. 172-176. 328 Ibid., p. 176-178. 329 Gvili, Yaniv/Levy, Shalom (2016), p. 1051. 330 Ibid., p. 1044. 331 Lin, Yu-Hsiang/Hsu, Chia-Lin/Chen, Mei-Fang/Fang, Cheng-Hsi (2017), p. 393. 332 Johnson, Benjamin K./Ranzini, Giulia (2018), p. 156.
Taxonomy and determinants of engagement 61
and an empirical investigation of prosumer preferences.333 Particularly in the context of
eWOM, the different preferences and required incentive levels to motivate different
eWOM engagement types are relevant research gaps.334
Besides the eWOM network and engagement type, the media type (text, picture, video)
is a relevant factor in understanding eWOM. Hoffman et al. found that pictures receive
more attention than text messages, though the sender’s perspective on sharing preferences
by media type is an interesting research gap.335 Furthermore, videos are an increasingly
popular media type of social interaction, along with information sharing on social media
networks.336 Research about eWOM media types therefore needs to be complemented by
text, pictures and video media types.
Economic rewards, such as price discounts, are potential attributes of eWOM types as
well. As mentioned before, extant findings regarding their general effect and the effect of
different reward levels on eWOM engagement are contradictory. Furthermore, Ryu,
Petrescu et al. and Wirtz et al. call for future research on the different incentives, such as
incentives for the sender in comparison with incentives for the receiving network.337
All in all, extant knowledge about eWOM types is characterized by a number of
inadequacies and gaps, since there is no knowledge on how to comprehensively define
the multidimensional eWOM construct from the sender’s perspective. Thus, it needs to
be researched which attributes determine the perceptions and preferences of eWOM
manifestations from the potential sender’s perspective.338 Such research enables the
development of an empirical eWOM classification (taxonomy), which forms the basis for
unambiguous research designs and, thus, help to resolve contradictory findings in extant
literature. Based on the eWOM taxonomy and the underlying attributes, as design factors
for eWOM manifestations, the prosumers’ eWOM preferences can be researched which,
due to missing taxonomy, are a further research gap.339 There is also no extant knowledge
about the senders’ preferences for the different levels each decision attribute subsumes.
In addition, Han et al. name the relative importance of the attributes that determine
333 Kim, Cheonsoo/Yang, Sung-Un (2017), p. 442-443. 334 Nieto-García, Marta/Muñoz-Gallego, Pablo A./González-Benito, Óscar (2017), p. 74. 335 Ibid., p. 74. 336 van Esch, Patrick/Mente, Margaret (2018), p. 266. 337 Wirtz, Jochen/Chew, Patricia (2002), p. 157-158 | Ryu, Gangseog/Feick, Lawrence (2007), p. 93. Petrescu, Maria/O’Leary, Kathleen/Goldring, Deborah/Ben Mrad, Selima (2018), p. 295. 338 Lin, Yu-Hsiang/Hsu, Chia-Lin/Chen, Mei-Fang/Fang, Cheng-Hsi (2017), p. 393. 339 Ahrens, Jan/Coyle, James R./Strahilevitz, Michal Ann (2013), p. 1046-1047.
Taxonomy and determinants of engagement 62
eWOM behavior as an interesting research gap in their call for future research.340
Considering the growing importance of eWOM in marketing and scarce knowledge in
academia and business practice, the research of eWOM attributes, their importance and
level preferences from the sender’s perspective, is a fruitful opportunity for further
contributions. Such research would contribute to the understanding required and
management of prosumer engagement in eWOM on social media networks.341
Socio-demographic moderations
Although rarely controlled as a moderator variable, prosumer nature and nurture are
important determinants of eWOM behavior.342 For instance, Cabosky found that gender
is a relevant factor, since women share more eWOM than men.343 Many researchers have
called for future research regarding the different eWOM behavior in a comparison of
generations344: Chu et al. call for future research to understand how eWOM behavior is
moderated by the different generations and psychographic segments that engage in
eWOM on social media networks.345 Research regarding the effect of Digital Nativity on
eWOM engagements seems, therefore, highly relevant. In addition, levels of education
are a determinant of prosumer online privacy concerns, and thus might also moderate
eWOM perceptions and behavior.346 Since most of the extant literature is based on
convenience samples of students, the consideration of different education levels and
employment statuses provides an opportunity for creating more generalizable and
nuanced knowledge about prosumer eWOM engagement.347
Technology and process
The applied social commerce technology precedes eWOM behavior too, in that
prosumers vary in their perceived ability and subsequently willingness to use such
technology.348 Since the ability to use digital technologies varies by Digital Nativity, this
segmentation might unearth moderating effects about the prosumer engagement in
eWOM. There are also different ways of designing eWOM and the process of creating
340 Han, Hui/Xu, Hongyi/Chen, Hongquan (2018), p. 47. 341 Rossmann, Alexander/Wilke, Tim/Kabaoglu, Hüseyin (2017), p. 16-17. 342 Mishra, Anubhav/Maheswarappa, Satish S./Maity, Moutusy/Samu, Sridhar (2018), p. 476-479. 343 Cabosky, Joseph (2016), p. 175-178. 344 Huang, Zhao/Benyoucef, Morad (2017), p. 43. 345 Chu, Shu-Chuan/Kim, Yoojung (2015), p. 68. 346 Zukowski, Tomasz/Brown, Irwin (2007), p. 201-202. 347 Xi, Qinwei/Kukla, Matthew (2012), p. 157. 348 Liang, Silvia Wan-Ju/Ekinci, Yuksel/Occhiocupo, Nicoletta/Whyatt, Georgina (2013), p. 595.
Taxonomy and determinants of engagement 63
eWOM. In this regard, Killian et al. found that prosumers, unsurprisingly, stated that their
intentions for sharing eWOM were lower for difficult sharing processes than easy ones.349
Operationalization and measurement
In summary, only two papers specifically cover the determinants of incentivized eWOM
behavior on social media networks as the dependent variable.350 The other relevant papers
mostly operationalize the dependent variable as “intention to share” or attitudes towards
sharing eWOM, measured on Likert scales. Mostly, eWOM was treated unidimensionally
and thus not ambiguously defined. The research settings are thus likely to be interpreted
in many different ways by the respondents, as mentioned in the section about the missing
eWOM taxonomy. Furthermore, the vaguely defined dependent variable is then measured
mostly on self-reported 5-point Likert scales, which limits the range of potential outcomes
and often leaves an undefined midpoint or unwarranted interpretation of the mean.351
Relationships between the researched independent and dependent variables lack sound
theorization and appropriate research designs for drawing causal conclusions (see the
limitations of Septianto et al.’s paper). In addition, the respondents can state an unlimited
amount of high or low ratings, which blurs preference differences and increases
hypothetical bias. Although respondents might indicate high intentions to share of e.g.
5/5 for two options, they may still strongly prefer one over the other.
The other papers use partially interesting but untransferable operationalizations like eye
fixation rates, or imprecise measurers like WOM occurrences (self-reported, number of
communications of any kind about a brand).352 Therefore, future research with more
sophisticated operationalizations of eWOM engagement as the dependent variable is
needed.353 In this regard, Acquisti et al.’s usage of prosumer Willingness-to-Accept
(WTA) to operationalize the minimum monetary incentive equivalents for personal
information disclosure is an inspiring approach, which would also enable a deeper
understanding of the incentive levels required to motivate prosumer engagements in
specific eWOM types.
349 Killian, Michelle/Fahy, John/O ’Loughlin, Deirdre/Kunz, Werner H. (2018), p. 15. 350 Ibid., p. 12-16. | Lin, Yu-Hsiang/Hsu, Chia-Lin/Chen, Mei-Fang/Fang, Cheng-Hsi (2017), p. 382-397. 351 Pornel, Jonny B./Saldana, Giabelle, A. (2013), p. 18. 352 Berger, Jonah/Schwartz, Eric M. (2011), p. 872. 353 Xi, Qinwei/Kukla, Matthew (2012), p. 157.
Taxonomy and determinants of engagement 64
Summary of research gaps about the determinants of prosumer eWOM engagement
Extant knowledge about the determinants for prosumer engagement inherent in eWOM
types is scarce and incomplete.354 The few research papers which contribute to the field
are contradictory regarding vital points, due to the ambiguous research designs on the
definition and operationalization of eWOM as a unidimensional construct, as well as the
use of unrepresentative convenience samples. In line with the manifold cited calls for
future research, five major opportunities for contributions were identified:
(1) An eWOM taxonomy based on the attributes that determine prosumer engagement is
missing; this is required to understand the multidimensional construct and enable
unambiguous research designs.
(2) The relative importance of eWOM attributes and prosumer preferences regarding the
attributes’ levels are unknown; these are required to understand and explain prosumer
engagement choices.
(3) A thorough investigation of the importance of monetary incentives and inherent levels
is missing; this is required to replace contradictory findings in extant literature with
reliable and valid findings that draw upon the valid operationalization of eWOM as a
multidimensional construct, with a reliable representative sample of prosumers.
(4) The consideration of socio-demographic variables (e.g. education and Digital
Nativity) and the interaction of eWOM attributes (e.g. product category and network
channel) is missing; this is required to detect underlying moderations and interactions
regarding prosumer eWOM preferences.
(5) The effect of humor as a multidimensional construct on prosumer eWOM engagement
has been neglected so far, and is required to understand the phenomenon of eWOM and
viral advertisements (FreeWOM, i.e. eWOM without monetary incentives). The accurate
measurement of the required WTA levels to elicit eWOM depending on the different
humor categories, constitute the fifth key opportunity for contribution and thus an avenue
for empirical research.
354 Zheng, Xiabing/Cheung, Christy M. K./Lee, Matthew K.O./Liang, Liang (2015), p. 93.
Taxonomy and determinants of engagement 65
3.2 PROSUMER DECISION MAKING AS SOCIAL EXCHANGE
3.2.1 DEVELOPMENT AND PRINCIPLES OF SOCIAL EXCHANGE THEORY
“Of all our many ‘approaches’ to social behavior, the one that sees it as an economy is
the most neglected, and yet it is the one we use every moment of our lives - except when
we write sociology.”355
The Social Exchange Theory has been developed over a period of decades, and today it
is a well-established theory in many research fields that involve human interactions and
decision-making, such as marketing science. Specifically, the theory is referred to in the
context of customer transaction utility evaluation by Doligalski,356 in the context of online
feedback systems as a subtype of eWOM by Tong et al.357, in the context of eWOM
behavior on social media networks by Xi et al.358 and Zheng et al.359, and within the
context of behavioral intentions related to incentivized eWOM by Petrescu et al.360. Liang
et al. name Social Exchange Theory as one of the theories in social commerce that provide
a robust foundation for future research, and thus serve as fertile ground for relevant
theoretical advancements.361 For this reason, Social Exchange Theory has been chosen to
explain and depict prosumer decision-making processes within the Value Growth Model.
Furthermore, the theory enables the development of specific research questions and
hypotheses about the determinants of prosumer engagement in eWOM on social media
networks.
Although the first mentions of social exchange as a process derived from the paradigm of
Utilitarian Exchange go back to Frazer in 1919,362 Homans is regarded as the father of
the Social Exchange Theory, due to his seminal work on the subject. He applied the
paradigm, and proposed what is known today as the original Social Exchange Theory, in
1950.363 He enriched the neoclassical paradigm of economics with knowledge from fields
like sociology, to account for the social influences on human decision-making processes.
He also published several refinements to this work, most notably “Social behavior as
355 Homans, George Caspar (1961), p. 606. 356 Doligalski, Tymoteusz (2014), p. 26. 357 Tong, Yu/Xinwei Wang and Hock-Hai Teo (2007), p. 1. 358 Xi, Qinwei/Kukla, Matthew (2012), p. 151. 359 Zheng, Xiabing/Cheung, Christy M. K./Lee, Matthew K.O./Liang, Liang (2015), p. 93. 360 Petrescu, Maria/O’Leary, Kathleen/Goldring, Deborah/Ben Mrad, Selima (2018), p. 294. 361 Liang, Ting-Peng/Turban, Efraim (2014), p. 7-8. 362 McDonell, J., Strom-Gottfried, K. J., Burton, D. L., & Yaffe, J (2006), p. 363 | Befu, Harumi (1977), p. 255. | Doligalski, Tymoteusz (2014), p. 26. 363 McDonell, J., Strom-Gottfried, K. J., Burton, D. L., & Yaffe, J (2006), p. 363-366.
Taxonomy and determinants of engagement 66
exchange”364 in 1958 and “Social behavior: Its elementary forms”365 in 1961. Other
researchers, such as Blau and Emerson, enriched and expanded upon the theory to explain
social relationships and human interaction behavior in a broad range of contexts, like
organizational management, politics and prosumer purchase decision-making.366 Blau
was also quoted by Homans in his 1961 paper, which shows how the joint effort resulted
in one of the most-recognized theories regarding human behavior.367 Today, the theory
consists of some core principles and a range of related theory variations which emphasize
certain concepts of the theory to explain specific situations of human behavior.368 The
three main applications of Social Exchange Theory are (1) the psychological process of
human (purchase) decision making, (2) the human behavior in dyadic or group
interactions, and (3) the formation and maintenance of social relationships.369
All applications of the Social Exchange Theory draw on a distinctive set of elements
applied in the core principles of the theory.370 The first element is the term ‘social
exchange’, which refers to the definition of human interaction as a bilateral contribution
of benefits and the acceptance of costs.371 The benefits (and rewards) subsume all
subjective perceptions of valuable gains from the exchange.372 The costs subsume all
investments of valuable factors that are forfeited as inputs from the exchange.373 The
difference between benefits and costs is utility. In earlier works, profit is used
synonymously for utility. For exceeding costs (exchange benefits < exchange costs),
people perceive a negative exchange utility, which is called “cognitive effort”. After 65
years of developments, and in line with the paradigm of Utilitarian Exchange, Redmond
summarizes the core principles of the theory as follows:
(1) Social behavior is motivated by the benefits and demotivated by the costs immanent
in exchanges,
364 Homans, George Caspar (1958), p. 597-606. 365 Homans, George Caspar (1961), p. 1-404. 366 Redmond, Mark V. Iowa State University (2015), p. 5 | McDonell, J., Strom-Gottfried, K. J., Burton, D. L., & Yaffe, J (2006), p. 364. 367 Homans, George Caspar (1961), p. 605. 368 Redmond, Mark V. Iowa State University (2015), p. 19-20. 369 Ibid., p. 13-14. 370 Ibid., p. 6-10. 371 Thibaut, John/Kelley, Haralod (1994), p. 198. 372 Lambe, C. Jay/Wittmann, C. Michael/Spekman, Robert E. (2001), p. 8-9. 373 McDonell, J., Strom-Gottfried, K. J., Burton, D. L., & Yaffe, J (2006), p. 364-365.
Taxonomy and determinants of engagement 67
(2) People seek to maximize their transactional profits through maximizing benefits and
/ or minimizing costs,
(3) Exchanges involve at least two parties, each in need of a reward from the other,
(4) Besides one time transactions, the principles explain the formation and management
of long-term bilateral relationships,
(5) The conduct of social exchange also shapes the multi-lateral relationships within
groups, networks and organizations.374
The integration of eWOM in commercial transactions depicts such an exchange between
prosumers and businesses, while potentially affecting the social network of the sending
prosumer. The elements and principles of Social Exchange Theory are therefore a great
fit, and applied to structure and explain prosumer decision making processes for eWOM
engagement.375
3.2.2 PROSUMER DECISION MAKING BASED ON SOCIAL EXCHANGE
THEORY
The groundwork of Homans and the theoretical advancements of the Social Exchange
Theory by Blau, Emerson and Thibaut et al. are used to depict and explain the prosumers’
decision making process regarding eWOM behavior on social media networks. In
addition, theoretical advancements to the theory from more recent publications are
incorporated, to reflect the full spectrum of current knowledge and thus derive a realistic
and theoretically sound process of prosumer decision making. In this regard, Burns et
al.’s summary of the steps within the process and Tong et al.’s analysis of the benefits
and costs immanent in prosumer communication on online feedback systems (e.g.
reviews on Amazon or eBay) are synthesized.376 Furthermore, Hauser’s two-staged
consider-then-choose decision making process is integrated, in order to reflect recent
empirical findings regarding rational prosumer decision-making.377
374 Redmond, Mark V. Iowa State University (2015), p. 15-18. 375 Zheng, Xiabing/Cheung, Christy M. K./Lee, Matthew K.O./Liang, Liang (2015), p. 93. 376 Tong, Yu/Xinwei Wang and Hock-Hai Teo (2007), p.3| Burns, Tom/Roszkowska, Ewa (2016), p. 197. 377 Hauser, John R. (2014), p. 1986-1990.
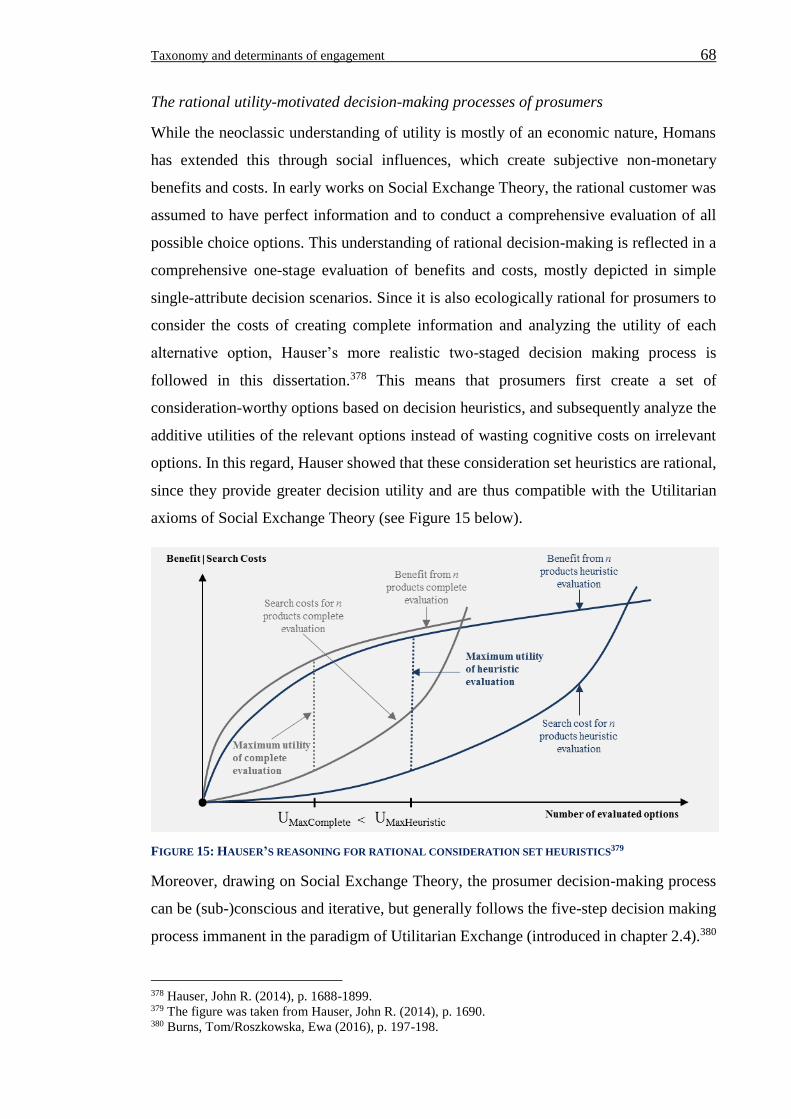
Taxonomy and determinants of engagement 68
The rational utility-motivated decision-making processes of prosumers
While the neoclassic understanding of utility is mostly of an economic nature, Homans
has extended this through social influences, which create subjective non-monetary
benefits and costs. In early works on Social Exchange Theory, the rational customer was
assumed to have perfect information and to conduct a comprehensive evaluation of all
possible choice options. This understanding of rational decision-making is reflected in a
comprehensive one-stage evaluation of benefits and costs, mostly depicted in simple
single-attribute decision scenarios. Since it is also ecologically rational for prosumers to
consider the costs of creating complete information and analyzing the utility of each
alternative option, Hauser’s more realistic two-staged decision making process is
followed in this dissertation.378 This means that prosumers first create a set of
consideration-worthy options based on decision heuristics, and subsequently analyze the
additive utilities of the relevant options instead of wasting cognitive costs on irrelevant
options. In this regard, Hauser showed that these consideration set heuristics are rational,
since they provide greater decision utility and are thus compatible with the Utilitarian
axioms of Social Exchange Theory (see Figure 15 below).
FIGURE 15: HAUSER’S REASONING FOR RATIONAL CONSIDERATION SET HEURISTICS379
Moreover, drawing on Social Exchange Theory, the prosumer decision-making process
can be (sub-)conscious and iterative, but generally follows the five-step decision making
process immanent in the paradigm of Utilitarian Exchange (introduced in chapter 2.4).380
378 Hauser, John R. (2014), p. 1688-1899. 379 The figure was taken from Hauser, John R. (2014), p. 1690. 380 Burns, Tom/Roszkowska, Ewa (2016), p. 197-198.
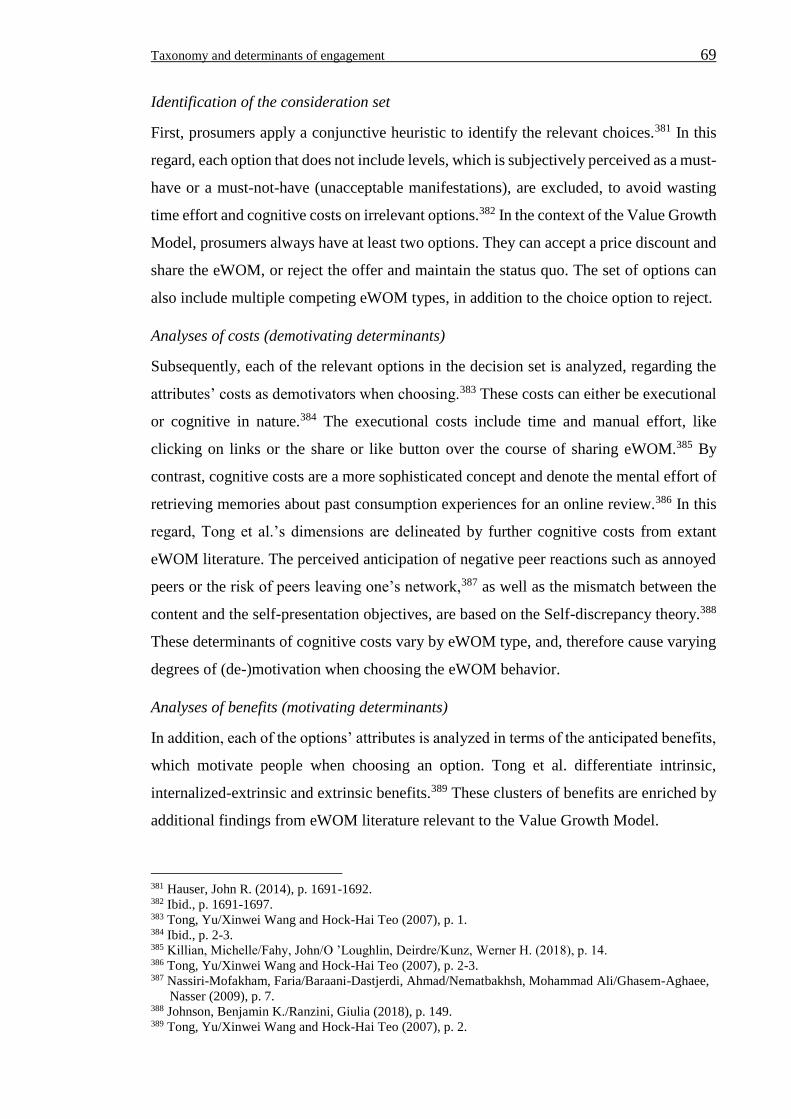
Taxonomy and determinants of engagement 69
Identification of the consideration set
First, prosumers apply a conjunctive heuristic to identify the relevant choices.381 In this
regard, each option that does not include levels, which is subjectively perceived as a must-
have or a must-not-have (unacceptable manifestations), are excluded, to avoid wasting
time effort and cognitive costs on irrelevant options.382 In the context of the Value Growth
Model, prosumers always have at least two options. They can accept a price discount and
share the eWOM, or reject the offer and maintain the status quo. The set of options can
also include multiple competing eWOM types, in addition to the choice option to reject.
Analyses of costs (demotivating determinants)
Subsequently, each of the relevant options in the decision set is analyzed, regarding the
attributes’ costs as demotivators when choosing.383 These costs can either be executional
or cognitive in nature.384 The executional costs include time and manual effort, like
clicking on links or the share or like button over the course of sharing eWOM.385 By
contrast, cognitive costs are a more sophisticated concept and denote the mental effort of
retrieving memories about past consumption experiences for an online review.386 In this
regard, Tong et al.’s dimensions are delineated by further cognitive costs from extant
eWOM literature. The perceived anticipation of negative peer reactions such as annoyed
peers or the risk of peers leaving one’s network,387 as well as the mismatch between the
content and the self-presentation objectives, are based on the Self-discrepancy theory.388
These determinants of cognitive costs vary by eWOM type, and, therefore cause varying
degrees of (de-)motivation when choosing the eWOM behavior.
Analyses of benefits (motivating determinants)
In addition, each of the options’ attributes is analyzed in terms of the anticipated benefits,
which motivate people when choosing an option. Tong et al. differentiate intrinsic,
internalized-extrinsic and extrinsic benefits.389 These clusters of benefits are enriched by
additional findings from eWOM literature relevant to the Value Growth Model.
381 Hauser, John R. (2014), p. 1691-1692. 382 Ibid., p. 1691-1697. 383 Tong, Yu/Xinwei Wang and Hock-Hai Teo (2007), p. 1. 384 Ibid., p. 2-3. 385 Killian, Michelle/Fahy, John/O ’Loughlin, Deirdre/Kunz, Werner H. (2018), p. 14. 386 Tong, Yu/Xinwei Wang and Hock-Hai Teo (2007), p. 2-3. 387 Nassiri-Mofakham, Faria/Baraani-Dastjerdi, Ahmad/Nematbakhsh, Mohammad Ali/Ghasem-Aghaee,
Nasser (2009), p. 7. 388 Johnson, Benjamin K./Ranzini, Giulia (2018), p. 149. 389 Tong, Yu/Xinwei Wang and Hock-Hai Teo (2007), p. 2.

Taxonomy and determinants of engagement 70
The altruistic enjoyment of helping other prosumers and influencing the business
involved are subsumed as the motives of intrinsic utility.390 For instance, engaging in
eWOM that contains an interesting offer or discount for the network can be motivated by
intrinsic utility. The internalized-extrinsic utility refers to the self-enhancement
prosumers gain by sharing eWOM and subsequently experiencing network feedback,
such as approval and gratitude for the information.391 Furthermore, fostering an expert
status about the related product category or market falls in this cluster of motivational
determinants.392 Extrinsic utility arises from monetary rewards of varying levels, such as
price discounts.393
Weighting and comparison
Prosumers use the insights gained about their subjective perceptions of costs and benefits
immanent in each attribute of the choices (part-worth utilities) to evaluate the total utility
of the option by addition. In this regard, Thibaut and Kelley introduce the two standards
of the internal and alternative comparison levels (CL) to describe how prosumers evaluate
the utility of a choice.394 The CL depicts an internal benchmark and refers to the
comparison level people develop over time based on prior experiences. It depicts the
threshold of the options’ attractiveness.395 The second standard CLalt refers to the
comparison level of alternatives, similar to the concept of opportunity costs. Thus, the
second benchmark of evaluating the utility of choice options depends on the utility level
of the other choices available. In other words, the immanent costs of one option include
the opportunity costs of not choosing the most beneficial alternative option.396 As a
consequence, the perceived utility can either be negative (effort) or positive (surplus).
If a business wants to motivate a prosumer into showing a certain type of eWOM
behavior, it has to create a superior utility to the other options, such as the option of
rejecting the offer (‘none-option’). This can be done inter alia by increasing the level of
the extrinsic reward (e.g. price discount). The utility of the best initial option determines
the WTA level, to motivate the prosumer to choose another eWOM type instead. The
390 Tong, Yu/Xinwei Wang and Hock-Hai Teo (2007), p. 3. 391 Cheung, Christy M.K./Lee, Matthew K.O. (2012), p. 219-223 | Hennig-Thurau, Thorsten/Gwinner, Kevin P./Walsh, Gianfranco/Gremler, Dwayne D. (2004), p. 43. 392 Liu, Xianwei/Schuckert, Markus/Law, Rob (2018), p. 38. 393 Tong, Yu/Xinwei Wang and Hock-Hai Teo (2007), p. 4-5. 394 Thibaut/John W./Kelley/Harold H. (1959), p. v-vi | Thibaut, John/Kelley, Haralod (1994), p. 198-200. 395 Ibid., p. 198-200. 396 Homans, George Caspar (1958), p. 603.
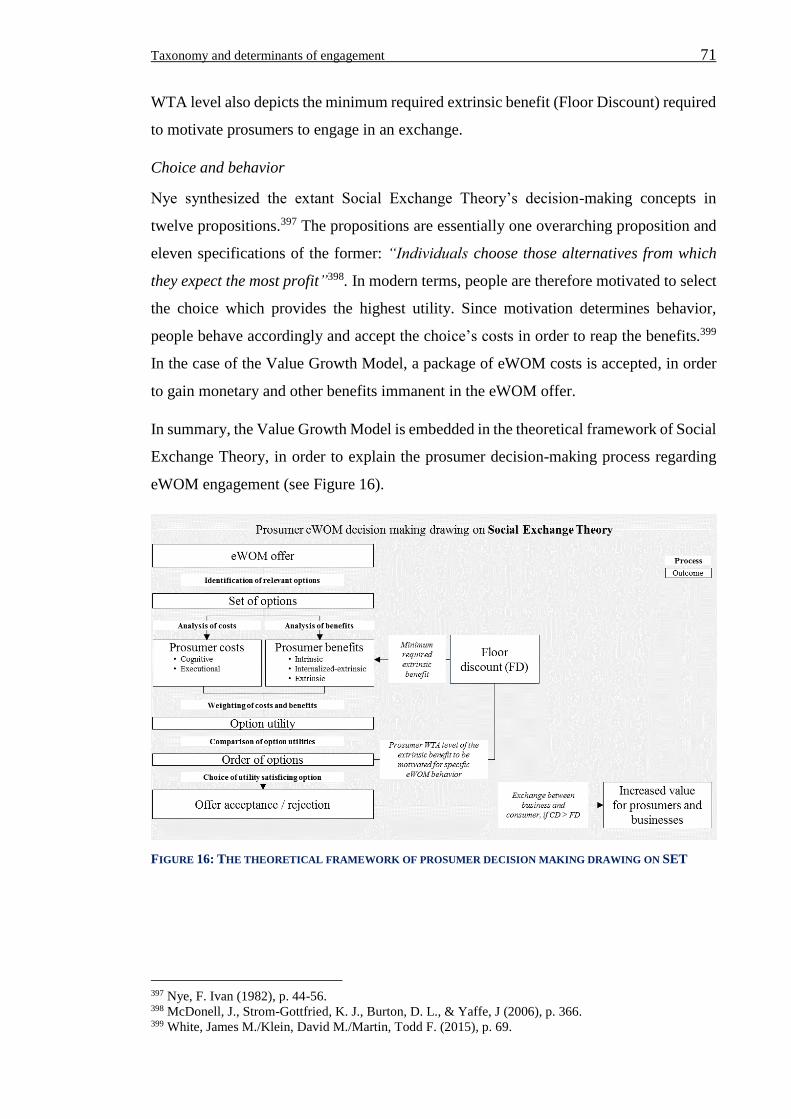
Taxonomy and determinants of engagement 71
WTA level also depicts the minimum required extrinsic benefit (Floor Discount) required
to motivate prosumers to engage in an exchange.
Choice and behavior
Nye synthesized the extant Social Exchange Theory’s decision-making concepts in
twelve propositions.397 The propositions are essentially one overarching proposition and
eleven specifications of the former: “Individuals choose those alternatives from which
they expect the most profit”398. In modern terms, people are therefore motivated to select
the choice which provides the highest utility. Since motivation determines behavior,
people behave accordingly and accept the choice’s costs in order to reap the benefits.399
In the case of the Value Growth Model, a package of eWOM costs is accepted, in order
to gain monetary and other benefits immanent in the eWOM offer.
In summary, the Value Growth Model is embedded in the theoretical framework of Social
Exchange Theory, in order to explain the prosumer decision-making process regarding
eWOM engagement (see Figure 16).
FIGURE 16: THE THEORETICAL FRAMEWORK OF PROSUMER DECISION MAKING DRAWING ON SET
397 Nye, F. Ivan (1982), p. 44-56. 398 McDonell, J., Strom-Gottfried, K. J., Burton, D. L., & Yaffe, J (2006), p. 366. 399 White, James M./Klein, David M./Martin, Todd F. (2015), p. 69.
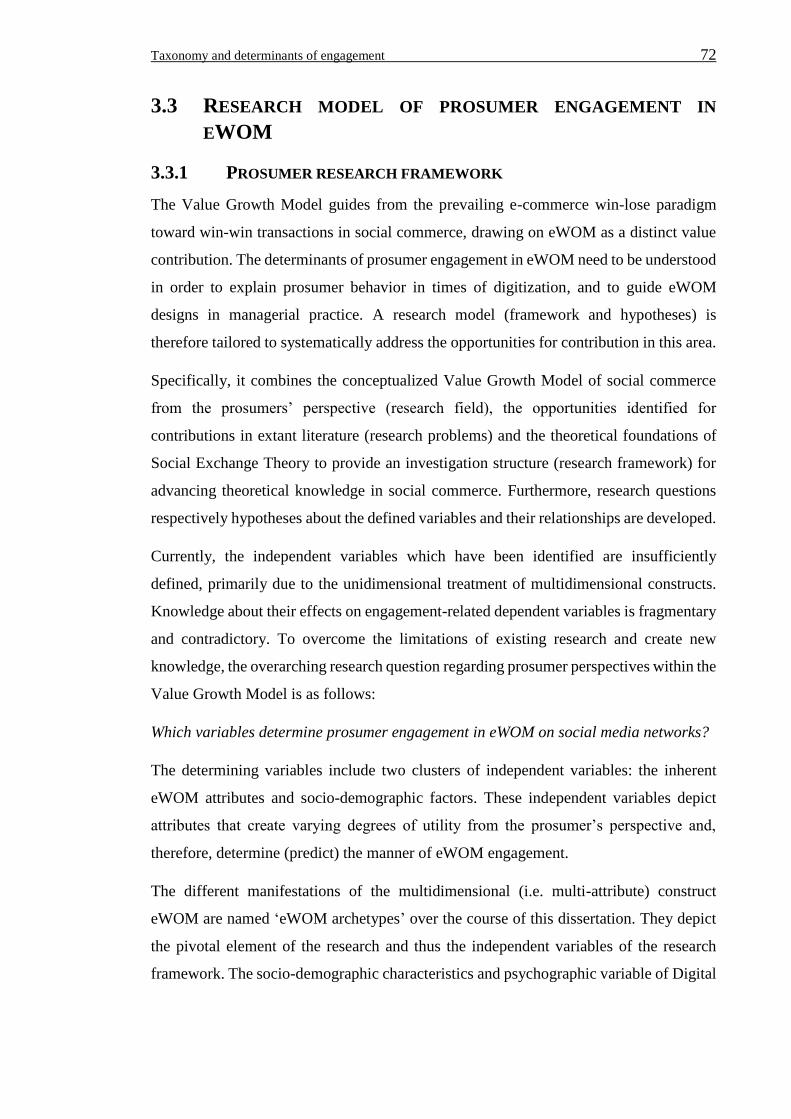
Taxonomy and determinants of engagement 72
3.3 RESEARCH MODEL OF PROSUMER ENGAGEMENT IN
EWOM
3.3.1 PROSUMER RESEARCH FRAMEWORK
The Value Growth Model guides from the prevailing e-commerce win-lose paradigm
toward win-win transactions in social commerce, drawing on eWOM as a distinct value
contribution. The determinants of prosumer engagement in eWOM need to be understood
in order to explain prosumer behavior in times of digitization, and to guide eWOM
designs in managerial practice. A research model (framework and hypotheses) is
therefore tailored to systematically address the opportunities for contribution in this area.
Specifically, it combines the conceptualized Value Growth Model of social commerce
from the prosumers’ perspective (research field), the opportunities identified for
contributions in extant literature (research problems) and the theoretical foundations of
Social Exchange Theory to provide an investigation structure (research framework) for
advancing theoretical knowledge in social commerce. Furthermore, research questions
respectively hypotheses about the defined variables and their relationships are developed.
Currently, the independent variables which have been identified are insufficiently
defined, primarily due to the unidimensional treatment of multidimensional constructs.
Knowledge about their effects on engagement-related dependent variables is fragmentary
and contradictory. To overcome the limitations of existing research and create new
knowledge, the overarching research question regarding prosumer perspectives within the
Value Growth Model is as follows:
Which variables determine prosumer engagement in eWOM on social media networks?
The determining variables include two clusters of independent variables: the inherent
eWOM attributes and socio-demographic factors. These independent variables depict
attributes that create varying degrees of utility from the prosumer’s perspective and,
therefore, determine (predict) the manner of eWOM engagement.
The different manifestations of the multidimensional (i.e. multi-attribute) construct
eWOM are named ‘eWOM archetypes’ over the course of this dissertation. They depict
the pivotal element of the research and thus the independent variables of the research
framework. The socio-demographic characteristics and psychographic variable of Digital
Taxonomy and determinants of engagement 73
Nativity are integrated into the framework, since they also may predict prosumer
preferences and behavior, as detailed in the section on research gaps.
Prosumer engagement in eWOM is the overarching dependent variable for the
framework. Specifically, part-worth utilities of attribute levels, utilities of eWOM
archetypes and the relative attribute importances are researched.
The research framework is illustrated below in Figure 17.
FIGURE 17: THE RESEARCH FRAMEWORK FOR THE DETERMINANTS OF PROSUMER ENGAGEMENT
The research framework structures the key variables and their potential relationships in
accordance with the overarching research question regarding prosumer decision making
about eWOM engagements.400
Since the variables, potential relationships and research question are derived from the
developed opportunities for contributions, the research framework guides the empirical
research toward relevant insights in the field of prosumer eWOM decision-making in light
of Social Exchange Theory.
400 Sekaran, Uma/Bougie, Roger (2016), p. 71-75.
Taxonomy and determinants of engagement 74
3.3.2 DEVELOPMENT OF RESEARCH QUESTIONS AND HYPOTHESES
3.3.2.1 EWOM INHERENT PROSUMER DECISION-MAKING ATTRIBUTES
In the following, research questions and hypotheses are developed within the defined
research framework. In this respect, the thematic clusters with a common research
problem are elaborated upon towards research questions and hypotheses. The chapter
consists of a concise problem statement as a comparison between the current and ideal
state of the research field.401 Moreover, research questions are derived, the answers to
which advance from the current state towards an ideal state of research and, if feasible,
hypotheses to test the assumptions theorized within the research question.
The precise and unambiguous definition of eWOM from the perspective of the study
participants depicts an often-neglected prerequisite to ensuring both a consistent
interpretation of the interview questions and, thus, undistorted interpretation during the
analyses. The eWOM taxonomy based on the attributes, which the prosumers consider
during their conjunctive-additive decision-making process to engage in eWOM, is
required to enable valid research designs about the phenomenon. This includes the
definition of attribute levels, as alternative manifestations of each attribute in an
archetype.
As mentioned in Chapter 3.1, no taxonomies were found about eWOM inherent attributes
that determine engagement from the prosumer perspective. Most of the extant studies
measure eWOM intentions on Likert scales as a rather unspecified, unidimensional
construct, without considering different eWOM attributes that constitute varying degrees
of utility and hence determine prosumer engagement: “I will use eWOM to
communicate”402. This leaves the study participants with ambiguous possibilities of
interpretation and, as a consequence, may distort interpretations of the research results,
due to unobserved effects on the data. Moreover, there are merely calls for future research
regarding certain decision attributes.403 Since the theoretical knowledge is therefore too
scarce to test specific hypotheses, the first research question is explorative:
401 Bwisa, Henry M., Webpage of: Editage Insights (2018). 402 Liang, Silvia Wan-Ju/Ekinci, Yuksel/Occhiocupo, Nicoletta/Whyatt, Georgina (2013), p. 584-606. 403 Lin, Yu-Hsiang/Hsu, Chia-Lin/Chen, Mei-Fang/Fang, Cheng-Hsi (2017), p. 393.
Taxonomy and determinants of engagement 75
3.3.2.2 THE ATTRIBUTE IMPORTANCES, LEVEL PREFERENCES AND
INTERACTION EFFECTS
The exploratory identification of eWOM attributes and levels is the foundation to
understanding and explaining prosumer eWOM engagement. The next step to deepening
knowledge is an investigation into the extent to which the attributes matter, and which
levels are preferential within each attribute. In this regard, attribute importance reflects
what matters to prosumers, and thus how much each attribute affects prosumer
decisions.404 Drawing on the Social Exchange Theory and the inherent principle of
additive level utilities in multi-attribute decision-making scenarios, prosumer attribute
level preferences manifest themselves in the form of part-worth utilities, which in sum
constitute the total utility of eWOM archetypes. The latter depict the order of eWOM
archetypes and hence motivate prosumer choice behavior.405 Therefore, knowledge of
attributes and their levels (‘what matters?’), their importance (‘how much do they
matter?’) and level preferences (‘what is preferred?’) are the comprehensive pillars of
understanding the multidimensional construct of eWOM engagement, explained through
utility motivated choice behavior. In addition, insights about the potential interaction
effects of certain level combinations and socio-demographic effects are required.
Since a comprehensive and empirical eWOM taxonomy is currently lacking, the relative
importance of the attributes is also unknown. In order to close the research gap and answer
Han et al.’s call for future research,406 research question two is postulated:
Besides the attribute importances, the prosumers’ preferences for the distinct attribute
levels are currently unknown and thus require an empirical investigation. This objective
is represented by the third research question:
Furthermore, current literature shows contradictory findings about the relevance of the
economic rewards (price discount) attribute as a decision criteria. To resolve the
404 Rao, P. H. (2013), p. 166. 405 Hogarth, Robin M./Karelaia, Natalia (2005), p. 1860. 406 Han, Hui/Xu, Hongyi/Chen, Hongquan (2018), p. 47.
Taxonomy and determinants of engagement 76
contradictory findings, based on more valid and reliable research designs, research
question four is defined as follows:
Moreover, discounts can not only be offered to the potential sender, but also to the
sender’s network. In this respect, Wirtz et al. have called for future research to better
understand how important those different types of discounts are to the prosumers.407 The
axiom of self-interested behavior is fundamental to the Social Exchange Theory, and
indicates that prosumers prefer rewards for themselves rather than for their peers on the
social media network.408 Therefore, it is hypothesized that:
Ensuing on the attribute price discount, extant literature provides contradictory findings
regarding the effect of different reward levels on prosumer eWOM engagement. While
among others Wirtz et al. found that the reward levels matter,409 inter alia Tong et al.
found that reward levels do not affect eWOM engagements.410 Potential reasons for such
confusion, like the ambiguous definition of eWOM and homogenous convenience
samples, are detailed in Chapter 3.1. However, from the theoretical standpoint of Social
Exchange Theory, the attribute discount level is an extrinsic benefit and in line with the
axiom of profit maximization, greater benefits are preferred over lower benefits.411 To
clarify the contradicting findings in extant literature, it is thus hypothesized that:
While extant literature gives contradictory findings about prosumer reward level
preferences, preferences for the levels of other attributes are entirely neglected. Prosumer
preferences for the network channel attribute and immanent levels of hedonic and
utilitarian networks are neglected. In this regard, each engagement has the unpleasant risk
of sharing unwittingly inappropriate content, which is a source of cognitive costs in Social
Exchange Theory. However, people trust more in the indulgence of their friends and
407 Wirtz, Jochen/Chew, Patricia (2002), p. 157. 408 Ahrens, Jan/Coyle, James R./Strahilevitz, Michal Ann (2013), p. 1045. 409 Wirtz, Jochen/Chew, Patricia (2002), p. 155. 410 Tong, Yu/Xinwei Wang and Hock-Hai Teo (2007), p. 7-8 |
Yen, Chih-Lun Alan/Tang, Chun-Hung Hugo (2019), p. 14-15. 411 Heimbach, Irina (2016), p. 89-93.
Taxonomy and determinants of engagement 77
family (great tie strength) on hedonic networks, in comparison to the indulgence of their
colleagues and clients on utilitarian networks (lower tie strength). Moreover, prosumers
post far more content on hedonic than utilitarian networks.412 Prosumers are thus more
experienced in engagements on hedonic networks and are assumed to perceive lower
cognitive costs related to both procedure and the uncertainty of peer reactions (risk).
Consequently, it is hypothesized that:
Following on from the description of the attributes and levels by researching importance
and preferences, eWOM, in view of the Social Exchange Theory, needs to be further
researched through considering potential interaction effects between attribute levels. Both
network channels and product categories have primarily-intended, hedonic or utilitarian
uses.413 The combination of different levels from both attributes can be either matching
or mismatching. For mismatches, eWOM engagement has a greater risk of being
perceived as inappropriate and thus a greater risk of negative peer reactions and undesired
identity cues. Prosumers are therefore assumed to perceive greater cognitive costs of
engaging in eWOM archetypes that contain mismatches between the primary product
category and network channel. In line with this reasoning, it is therefore hypothesized
that:
Moreover, Acquisti et al. found that privacy is a valuable asset for prosumers.414 In view
of Social Exchange Theory, the revelation of private information on social media
networks (such as purchases) depict a cognitive cost factor. Regarding distinct eWOM
archetypes, it is therefore hypothesized that the prosumer’s cognitive cost perception for
higher degrees of information disclosure is higher than for lower degrees of information
disclosure in the course of eWOM engagement. The corresponding hypothesis is
postulated as follows:
412 Harris Interactive, Webpage of: Statista, Inc. (2014). | Saleh, Khalid, Webpage of: Invesp (2015). 413 Babin, Barry J./Darden, William R./Griffin, Mitch (1994), p. 645-646 | Pillai, Anandan/Mukherjee, Jaydeep (2011), p. 180-181. 414 Acquisti, Alessandro/John, Leslie/Loewenstein, George (2013), p. 26-27.
Taxonomy and determinants of engagement 78
Moreover, socio-demographic characteristics are found to have a significant effect on the
peoples’ sharing behavior on social media networks.415 To reveal such effects and
mitigate the risk of distorted results of prosumer preferences for eWOM engagements,
three hypotheses about socio-demographic variables are postulated.
Each generation in each western society is confronted by social media networks.
However, younger generations of digital natives have significantly higher levels of online
trust and show more activity on social media networks in general.416 This translates to a
greater familiarity with social media networks, i.e. lower uncertainty and risk perception
of such younger generations in comparison to older, less active and less familiar
generations. In view of Social Exchange Theory, Digital Natives might, therefore, have
lower cognitive cost perceptions about eWOM sharing and thus higher engagement rates
than older generations, who are less familiar with and literate in the social media
networks’ technical and social functionalities. This reasoning is reflected and tested under
hypothesis six, answering Chu et al.’s call for future research about the varying eWOM
engagement behavior over generations.417
Privacy concerns about social media networks have been extensively covered by the news
media, e.g. over the course of the European General Data Protection Regulation
(GDPR).418 In addition, the risk and negative effects of shared content on social media
networks on the professional lives of academics is a fear factor.419 Since academics (as
opposed to non-academics) are more widely read and, thus, more regularly confronted
with such content and fears,420 they perceive greater cognitive costs and thus engage less
in eWOM, in comparison to non-academics. Therefore, it is hypothesized that:
Furthermore, those who are employed face the risk of negative peer reactions from both
private and business contacts. Unemployed prosumers only face such a risk from friends
and family members. Employed prosumers therefore perceive higher cognitive costs of
415 Cabosky, Joseph (2016), p. 175-177. 416 Hoffmann, Christian Pieter/Lutz, Christoph/Meckel, Miriam (2015), p. 138-171. 417 Chu, Shu-Chuan (2009), p. 87-88. | Chu, Shu-Chuan/Kim, Yoojung (2015), p. 68-69. 418 Voss, Oliver, Webpage of: Der Tagesspiegel (2018). 419 Lupton, Deborah. University of Canberra (2014), p. 25-26. 420 Pimpl, Roland, Webpage of: Horizont - Zeitung für Marketing, Werbung und Medien (2015).

Taxonomy and determinants of engagement 79
engaging in eWOM than unemployed prosumers, due to the perceived cognitive costs
resulting from a greater risk of, e.g. losing one’s job or a decreased social status due to
colleagues’ judgement. Thus, last it is hypothesized that:
Taxonomy and determinants of engagement 80
3.4 EMPIRICAL EXPLORATION OF PROSUMER ENGAGEMENT
DETERMINANTS
3.4.1 RESEARCH DESIGN
3.4.1.1 OBJECTIVES
The wide range of eWOM manifestations show that the construct is too diverse for
unidimensional treatment. Moreover, calls for future research about potential attributes
that determine prosumer engagement inherent in eWOM itself supports this assumption.
An eWOM taxonomy, i.e. an empirical typology, is needed to enable unambiguously
stated research items from the respondents’ perspective. Furthermore, the taxonomy and
its distinctive eWOM archetypes are required for a sound interpretation of data regarding
scientific analyses. Therefore the attributes are explored, which prosumers evaluate while
going through the decision making process of engaging in eWOM on social media
networks (RQ1).
To answer the research question, empirical data is the foundation of deriving a taxonomy
of eWOM archetypes, which helps to better understand eWOM and can be used by
researchers to define eWOM unambiguously in their research designs. The taxonomy
provides a holistic set of attributes (eWOM inherent determinants of engagement) from
the prosumer’s perspective, as well as possible manifestations of these attributes. EWOM
archetypes, on the other hand, depict distinct manifestations of these taxonomic attributes.
As reasoned in Chapter 3.1.3, the missing taxonomy depicts a fundamental research gap
in social commerce literature, as well as regarding Social Exchange Theory in light of
prosumer behavior in digital environments. The objective of this empirical study is thus
to develop the first eWOM taxonomy, which consists of a comprehensive set of decision
attributes derived from empirical prosumer data.
This is a relevant contribution in itself, but also enables sound research designs for
investigating the other research questions of this dissertation, and to test related
hypotheses, as defined in research framework about prosumer engagement in eWOM.
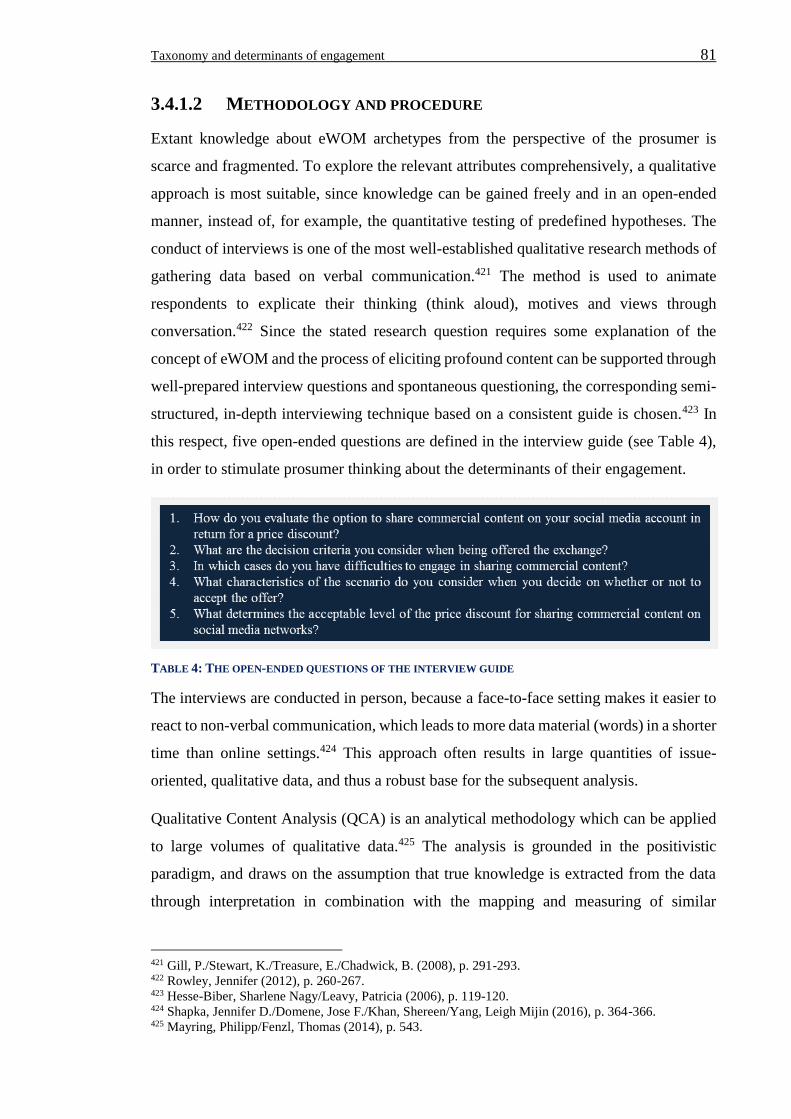
Taxonomy and determinants of engagement 81
3.4.1.2 METHODOLOGY AND PROCEDURE
Extant knowledge about eWOM archetypes from the perspective of the prosumer is
scarce and fragmented. To explore the relevant attributes comprehensively, a qualitative
approach is most suitable, since knowledge can be gained freely and in an open-ended
manner, instead of, for example, the quantitative testing of predefined hypotheses. The
conduct of interviews is one of the most well-established qualitative research methods of
gathering data based on verbal communication.421 The method is used to animate
respondents to explicate their thinking (think aloud), motives and views through
conversation.422 Since the stated research question requires some explanation of the
concept of eWOM and the process of eliciting profound content can be supported through
well-prepared interview questions and spontaneous questioning, the corresponding semi-
structured, in-depth interviewing technique based on a consistent guide is chosen.423 In
this respect, five open-ended questions are defined in the interview guide (see Table 4),
in order to stimulate prosumer thinking about the determinants of their engagement.
TABLE 4: THE OPEN-ENDED QUESTIONS OF THE INTERVIEW GUIDE
The interviews are conducted in person, because a face-to-face setting makes it easier to
react to non-verbal communication, which leads to more data material (words) in a shorter
time than online settings.424 This approach often results in large quantities of issue-
oriented, qualitative data, and thus a robust base for the subsequent analysis.
Qualitative Content Analysis (QCA) is an analytical methodology which can be applied
to large volumes of qualitative data.425 The analysis is grounded in the positivistic
paradigm, and draws on the assumption that true knowledge is extracted from the data
through interpretation in combination with the mapping and measuring of similar
421 Gill, P./Stewart, K./Treasure, E./Chadwick, B. (2008), p. 291-293. 422 Rowley, Jennifer (2012), p. 260-267. 423 Hesse-Biber, Sharlene Nagy/Leavy, Patricia (2006), p. 119-120. 424 Shapka, Jennifer D./Domene, Jose F./Khan, Shereen/Yang, Leigh Mijin (2016), p. 364-366. 425 Mayring, Philipp/Fenzl, Thomas (2014), p. 543.
Taxonomy and determinants of engagement 82
statements to consolidating categories.426 From an epistemological stand point, it is
assumed that knowledge creation through interpretation and analysis is a co-creation of
the researcher, respondent and text, since text (or any other symbolic content) has no
objective qualities alone.427
First introduced in 1983 by Mayring as an advancement of content analysis, QCA is
commonly used in explorative marketing research today, to interpret, aggregate and
condense qualitative data into meaningful categories.428 In terms of the research question
raised by this study, QCA is used to extract the attributes (categories) and their levels
(sub-categories) that determine prosumer engagement in eWOM. Besides the
methodological and data fit, QCA not only facilitates the explorative analysis of decision
attributes with wholly new and open-ended results (inductive approach), but also allows
for the integration of theory-driven assumptions, based on a rigorous approach that can
easily be reconstructed by other researchers and meaningfully tested, with regard to the
quality of the analytical results (deductive approach). A strong advantage of QCA is the
possibility of using a mixed deductive-inductive approach, which is elaborated upon in
the procedure section.429
In comparison to the Grounded Theory, QCA is strictly rule-based and therefore inter-
subjectively verifiable by other researchers.430 It draws on two materials that guide the
analysis. First, a categorization matrix reflects the deductive beginning of the analysis.431
Based on existing insights from the literature review and conceptual groundwork, an
initial set of potentially relevant (sub-)categories is given.432 Second, a coding guide is
defined, that contains the (sub-)categories from the matrix and provides additional
information required for the coding of interview content. The guide combines
psychological, linguistic as well as neuroscientific insights of human data comprehension
and sense making in one approach for data analysis. As a consequence, the three-part
coding guide is the centerpiece of QCA, which combines three elements of rigorous data
interpretation with an evolving set of contextual categories. First, the classical view
assumes that categories are mentally represented by specific definitions.433 Therefore, a
426 Graneheim, Ulla H./Lindgren, Britt-Marie/Lundman, Berit (2017), p. 29-30. 427 Ibid., p. 29 | Krippendorff, Klaus (2019), p. 27-31. 428 Mayring, Philipp/Fenzl, Thomas (2014), p. 543 | Sebald, Anna Kathrin/Jacob, Frank (2018), p. 191. 429 Ibid., p. 549-551. 430 Ibid., p. 543. 431 Elo, Satu/Kyngas, Helvi (2008), p. 109-113. 432 Ibid., p. 109-113. 433 Murphy, Gregory L. (2002), p. 15.
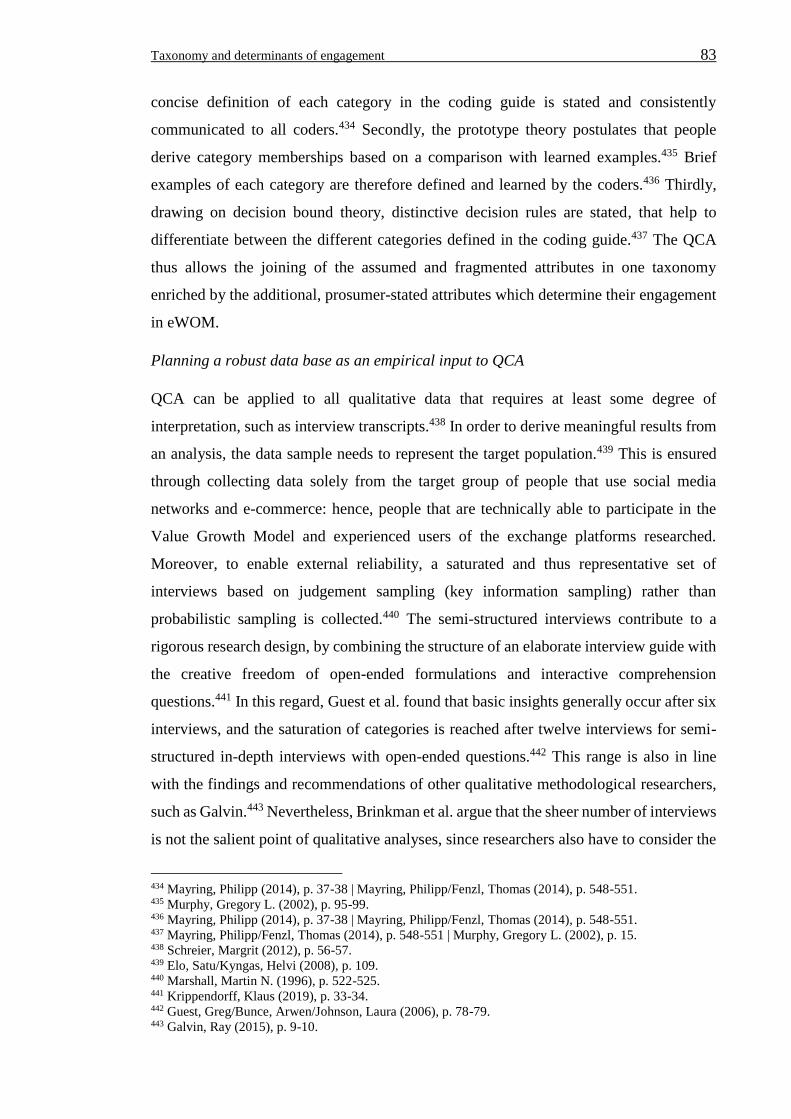
Taxonomy and determinants of engagement 83
concise definition of each category in the coding guide is stated and consistently
communicated to all coders.434 Secondly, the prototype theory postulates that people
derive category memberships based on a comparison with learned examples.435 Brief
examples of each category are therefore defined and learned by the coders.436 Thirdly,
drawing on decision bound theory, distinctive decision rules are stated, that help to
differentiate between the different categories defined in the coding guide.437 The QCA
thus allows the joining of the assumed and fragmented attributes in one taxonomy
enriched by the additional, prosumer-stated attributes which determine their engagement
in eWOM.
Planning a robust data base as an empirical input to QCA
QCA can be applied to all qualitative data that requires at least some degree of
interpretation, such as interview transcripts.438 In order to derive meaningful results from
an analysis, the data sample needs to represent the target population.439 This is ensured
through collecting data solely from the target group of people that use social media
networks and e-commerce: hence, people that are technically able to participate in the
Value Growth Model and experienced users of the exchange platforms researched.
Moreover, to enable external reliability, a saturated and thus representative set of
interviews based on judgement sampling (key information sampling) rather than
probabilistic sampling is collected.440 The semi-structured interviews contribute to a
rigorous research design, by combining the structure of an elaborate interview guide with
the creative freedom of open-ended formulations and interactive comprehension
questions.441 In this regard, Guest et al. found that basic insights generally occur after six
interviews, and the saturation of categories is reached after twelve interviews for semi-
structured in-depth interviews with open-ended questions.442 This range is also in line
with the findings and recommendations of other qualitative methodological researchers,
such as Galvin.443 Nevertheless, Brinkman et al. argue that the sheer number of interviews
is not the salient point of qualitative analyses, since researchers also have to consider the
434 Mayring, Philipp (2014), p. 37-38 | Mayring, Philipp/Fenzl, Thomas (2014), p. 548-551. 435 Murphy, Gregory L. (2002), p. 95-99. 436 Mayring, Philipp (2014), p. 37-38 | Mayring, Philipp/Fenzl, Thomas (2014), p. 548-551. 437 Mayring, Philipp/Fenzl, Thomas (2014), p. 548-551 | Murphy, Gregory L. (2002), p. 15. 438 Schreier, Margrit (2012), p. 56-57. 439 Elo, Satu/Kyngas, Helvi (2008), p. 109. 440 Marshall, Martin N. (1996), p. 522-525. 441 Krippendorff, Klaus (2019), p. 33-34. 442 Guest, Greg/Bunce, Arwen/Johnson, Laura (2006), p. 78-79. 443 Galvin, Ray (2015), p. 9-10.
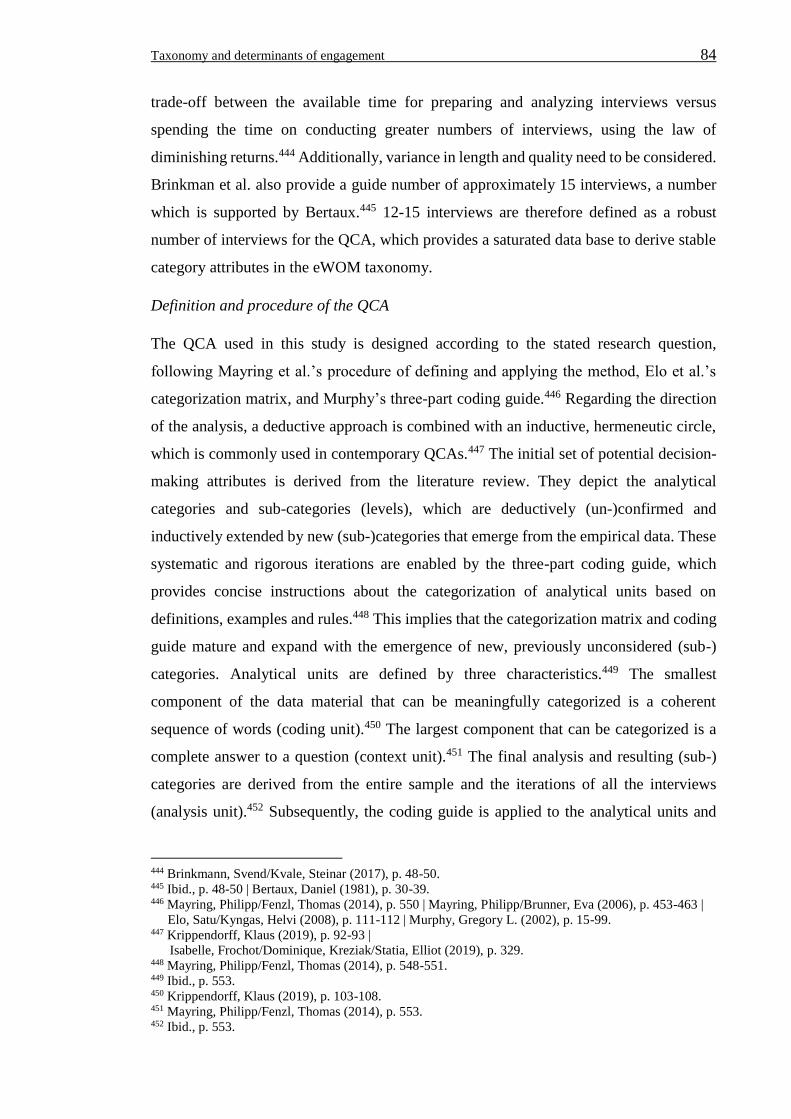
Taxonomy and determinants of engagement 84
trade-off between the available time for preparing and analyzing interviews versus
spending the time on conducting greater numbers of interviews, using the law of
diminishing returns.444 Additionally, variance in length and quality need to be considered.
Brinkman et al. also provide a guide number of approximately 15 interviews, a number
which is supported by Bertaux.445 12-15 interviews are therefore defined as a robust
number of interviews for the QCA, which provides a saturated data base to derive stable
category attributes in the eWOM taxonomy.
Definition and procedure of the QCA
The QCA used in this study is designed according to the stated research question,
following Mayring et al.’s procedure of defining and applying the method, Elo et al.’s
categorization matrix, and Murphy’s three-part coding guide.446 Regarding the direction
of the analysis, a deductive approach is combined with an inductive, hermeneutic circle,
which is commonly used in contemporary QCAs.447 The initial set of potential decision-
making attributes is derived from the literature review. They depict the analytical
categories and sub-categories (levels), which are deductively (un-)confirmed and
inductively extended by new (sub-)categories that emerge from the empirical data. These
systematic and rigorous iterations are enabled by the three-part coding guide, which
provides concise instructions about the categorization of analytical units based on
definitions, examples and rules.448 This implies that the categorization matrix and coding
guide mature and expand with the emergence of new, previously unconsidered (sub-)
categories. Analytical units are defined by three characteristics.449 The smallest
component of the data material that can be meaningfully categorized is a coherent
sequence of words (coding unit).450 The largest component that can be categorized is a
complete answer to a question (context unit).451 The final analysis and resulting (sub-)
categories are derived from the entire sample and the iterations of all the interviews
(analysis unit).452 Subsequently, the coding guide is applied to the analytical units and
444 Brinkmann, Svend/Kvale, Steinar (2017), p. 48-50. 445 Ibid., p. 48-50 | Bertaux, Daniel (1981), p. 30-39. 446 Mayring, Philipp/Fenzl, Thomas (2014), p. 550 | Mayring, Philipp/Brunner, Eva (2006), p. 453-463 | Elo, Satu/Kyngas, Helvi (2008), p. 111-112 | Murphy, Gregory L. (2002), p. 15-99. 447 Krippendorff, Klaus (2019), p. 92-93 |
Isabelle, Frochot/Dominique, Kreziak/Statia, Elliot (2019), p. 329. 448 Mayring, Philipp/Fenzl, Thomas (2014), p. 548-551. 449 Ibid., p. 553. 450 Krippendorff, Klaus (2019), p. 103-108. 451 Mayring, Philipp/Fenzl, Thomas (2014), p. 553. 452 Ibid., p. 553.
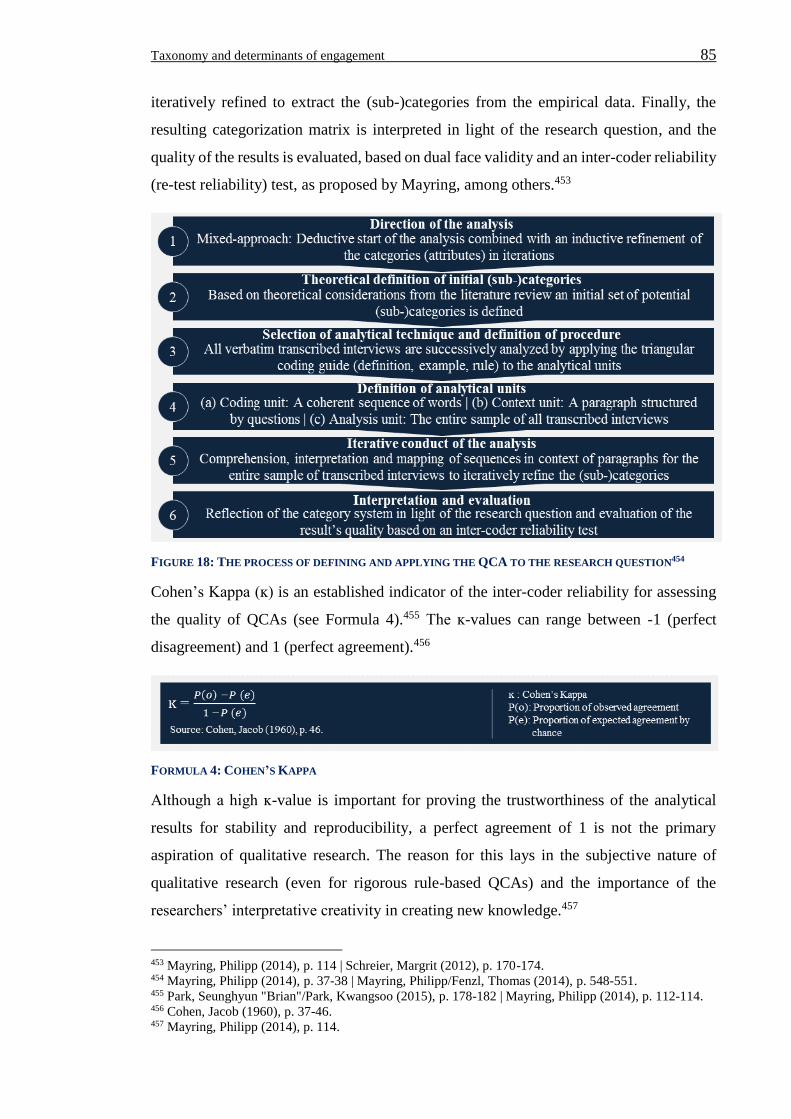
Taxonomy and determinants of engagement 85
iteratively refined to extract the (sub-)categories from the empirical data. Finally, the
resulting categorization matrix is interpreted in light of the research question, and the
quality of the results is evaluated, based on dual face validity and an inter-coder reliability
(re-test reliability) test, as proposed by Mayring, among others.453
FIGURE 18: THE PROCESS OF DEFINING AND APPLYING THE QCA TO THE RESEARCH QUESTION454
Cohen’s Kappa (ĸ) is an established indicator of the inter-coder reliability for assessing
the quality of QCAs (see Formula 4).455 The ĸ-values can range between -1 (perfect
disagreement) and 1 (perfect agreement).456
FORMULA 4: COHEN’S KAPPA
Although a high ĸ-value is important for proving the trustworthiness of the analytical
results for stability and reproducibility, a perfect agreement of 1 is not the primary
aspiration of qualitative research. The reason for this lays in the subjective nature of
qualitative research (even for rigorous rule-based QCAs) and the importance of the
researchers’ interpretative creativity in creating new knowledge.457
453 Mayring, Philipp (2014), p. 114 | Schreier, Margrit (2012), p. 170-174. 454 Mayring, Philipp (2014), p. 37-38 | Mayring, Philipp/Fenzl, Thomas (2014), p. 548-551. 455 Park, Seunghyun "Brian"/Park, Kwangsoo (2015), p. 178-182 | Mayring, Philipp (2014), p. 112-114. 456 Cohen, Jacob (1960), p. 37-46. 457 Mayring, Philipp (2014), p. 114.
Taxonomy and determinants of engagement 86
3.4.2 ANALYSES AND RESULTS
3.4.2.1 FIELDING AND SAMPLE
In different public places in Berlin, semi-structured interviews were conducted by the
author between August 19th and 22nd 2016. Potential respondents for the interviews were
randomly approached and offered an incentive for taking the time to answer the interview
questions.458 The anonymous interview started with a brief introduction to the topic and
a check for whether or not the respondent was part of the target group. If the respondent
indicated both social media and e-commerce usage, the interview progressed by
introducing the concepts of eWOM and the Value Growth Model to the respondent. The
explanatory process description from the experiment is depicted in Figure 19 below.
FIGURE 19: THE PRIMING SCENARIO FOR THE RESPONDENTS
Subsequently, the five questions from the interview guide were asked, enriched by
spontaneous comprehension questions to enable a greater depth to the answers provided
and start the process of meaningful interpretation of the content.
In total, fifteen interviews were conducted and recorded using an audio recorder. The
average duration of the recordings was 10.04 minutes (median: 9.41 min. | minimum:
6.27 min. | maximum: 15.2 min.). The socio-demographic characteristics of the sample
are depicted in Figure 20, on the following page.
458 A voucher worth 10€ for a popular coffeehouse chain was offered as an incentive to the respondents.
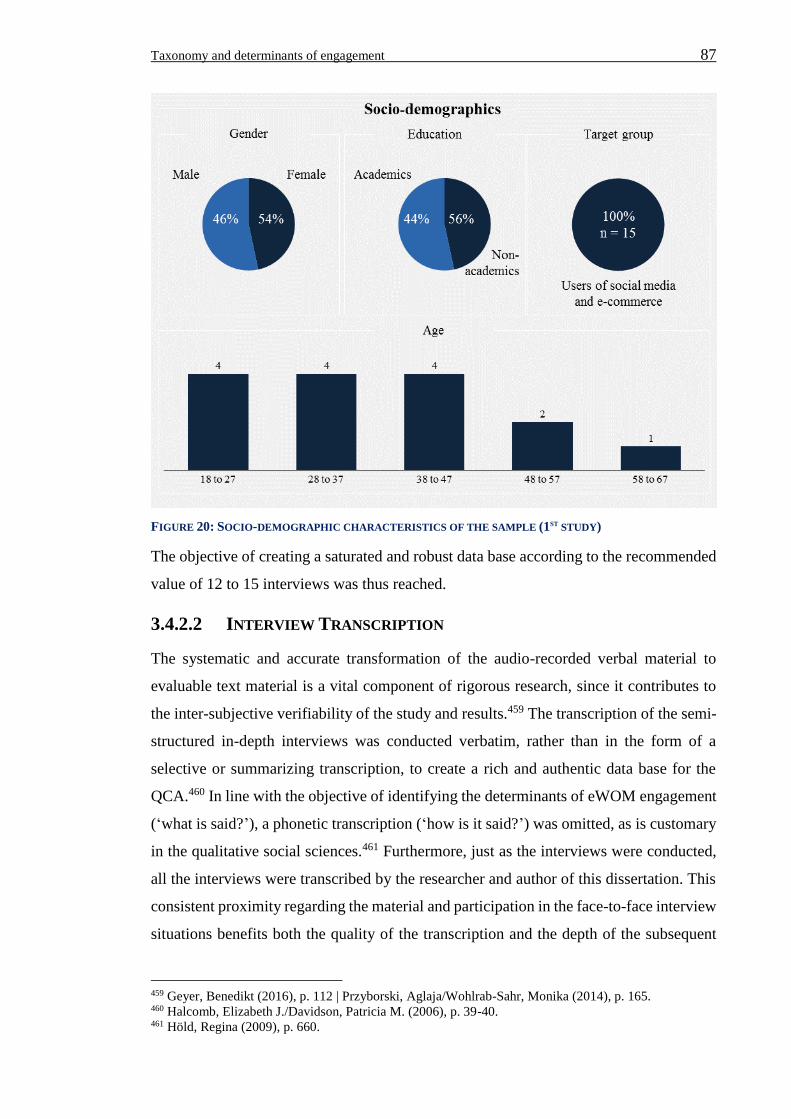
Taxonomy and determinants of engagement 87
FIGURE 20: SOCIO-DEMOGRAPHIC CHARACTERISTICS OF THE SAMPLE (1ST STUDY)
The objective of creating a saturated and robust data base according to the recommended
value of 12 to 15 interviews was thus reached.
3.4.2.2 INTERVIEW TRANSCRIPTION
The systematic and accurate transformation of the audio-recorded verbal material to
evaluable text material is a vital component of rigorous research, since it contributes to
the inter-subjective verifiability of the study and results.459 The transcription of the semi-
structured in-depth interviews was conducted verbatim, rather than in the form of a
selective or summarizing transcription, to create a rich and authentic data base for the
QCA.460 In line with the objective of identifying the determinants of eWOM engagement
(‘what is said?’), a phonetic transcription (‘how is it said?’) was omitted, as is customary
in the qualitative social sciences.461 Furthermore, just as the interviews were conducted,
all the interviews were transcribed by the researcher and author of this dissertation. This
consistent proximity regarding the material and participation in the face-to-face interview
situations benefits both the quality of the transcription and the depth of the subsequent
459 Geyer, Benedikt (2016), p. 112 | Przyborski, Aglaja/Wohlrab-Sahr, Monika (2014), p. 165. 460 Halcomb, Elizabeth J./Davidson, Patricia M. (2006), p. 39-40. 461 Höld, Regina (2009), p. 660.
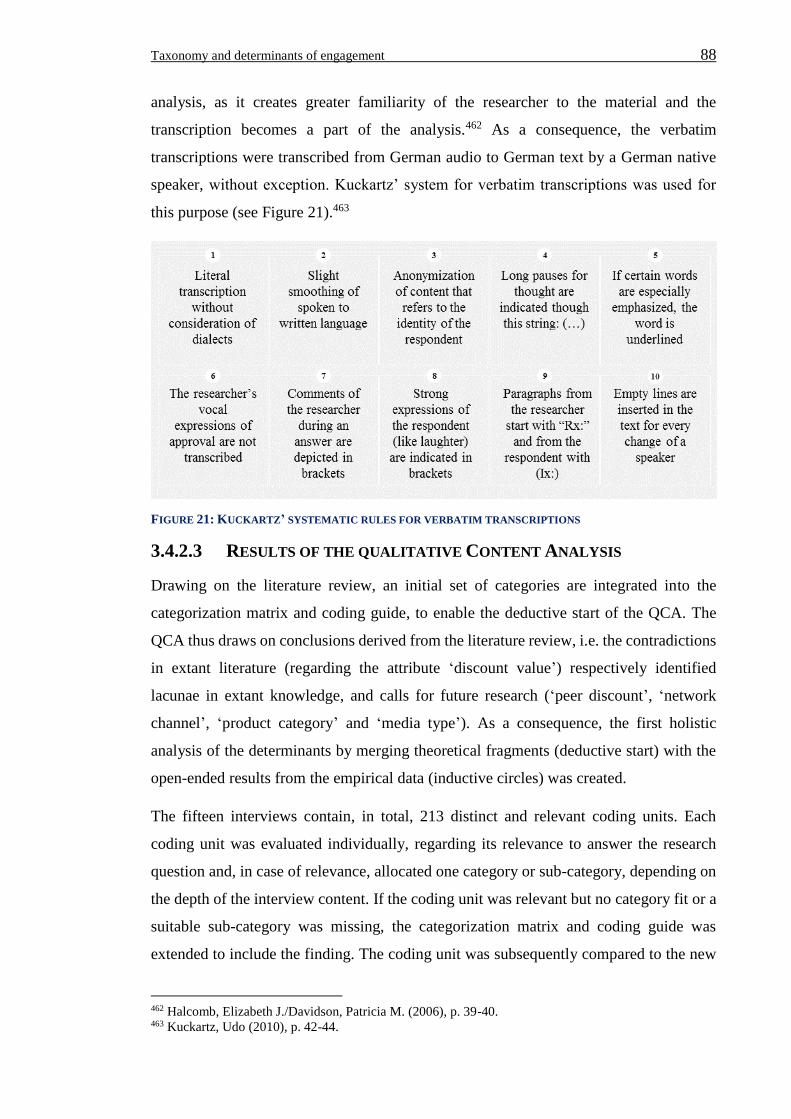
Taxonomy and determinants of engagement 88
analysis, as it creates greater familiarity of the researcher to the material and the
transcription becomes a part of the analysis.462 As a consequence, the verbatim
transcriptions were transcribed from German audio to German text by a German native
speaker, without exception. Kuckartz’ system for verbatim transcriptions was used for
this purpose (see Figure 21).463
FIGURE 21: KUCKARTZ’ SYSTEMATIC RULES FOR VERBATIM TRANSCRIPTIONS
3.4.2.3 RESULTS OF THE QUALITATIVE CONTENT ANALYSIS
Drawing on the literature review, an initial set of categories are integrated into the
categorization matrix and coding guide, to enable the deductive start of the QCA. The
QCA thus draws on conclusions derived from the literature review, i.e. the contradictions
in extant literature (regarding the attribute ‘discount value’) respectively identified
lacunae in extant knowledge, and calls for future research (‘peer discount’, ‘network
channel’, ‘product category’ and ‘media type’). As a consequence, the first holistic
analysis of the determinants by merging theoretical fragments (deductive start) with the
open-ended results from the empirical data (inductive circles) was created.
The fifteen interviews contain, in total, 213 distinct and relevant coding units. Each
coding unit was evaluated individually, regarding its relevance to answer the research
question and, in case of relevance, allocated one category or sub-category, depending on
the depth of the interview content. If the coding unit was relevant but no category fit or a
suitable sub-category was missing, the categorization matrix and coding guide was
extended to include the finding. The coding unit was subsequently compared to the new
462 Halcomb, Elizabeth J./Davidson, Patricia M. (2006), p. 39-40. 463 Kuckartz, Udo (2010), p. 42-44.
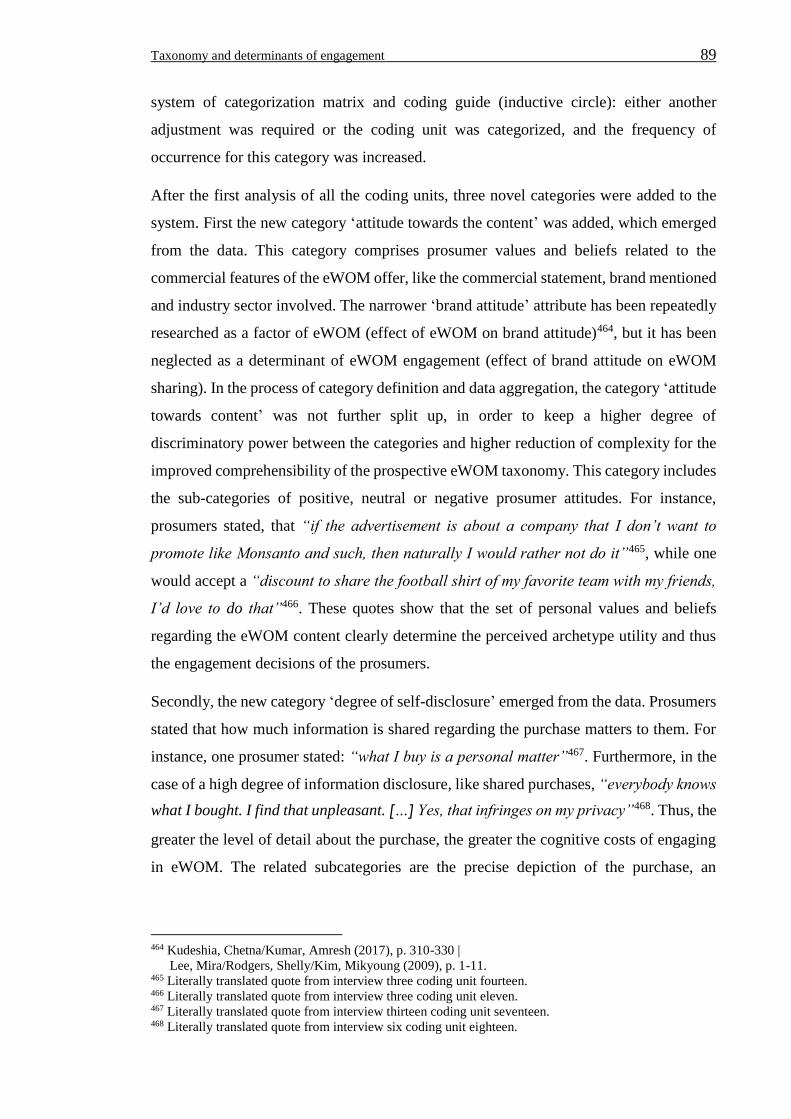
Taxonomy and determinants of engagement 89
system of categorization matrix and coding guide (inductive circle): either another
adjustment was required or the coding unit was categorized, and the frequency of
occurrence for this category was increased.
After the first analysis of all the coding units, three novel categories were added to the
system. First the new category ‘attitude towards the content’ was added, which emerged
from the data. This category comprises prosumer values and beliefs related to the
commercial features of the eWOM offer, like the commercial statement, brand mentioned
and industry sector involved. The narrower ‘brand attitude’ attribute has been repeatedly
researched as a factor of eWOM (effect of eWOM on brand attitude)464, but it has been
neglected as a determinant of eWOM engagement (effect of brand attitude on eWOM
sharing). In the process of category definition and data aggregation, the category ‘attitude
towards content’ was not further split up, in order to keep a higher degree of
discriminatory power between the categories and higher reduction of complexity for the
improved comprehensibility of the prospective eWOM taxonomy. This category includes
the sub-categories of positive, neutral or negative prosumer attitudes. For instance,
prosumers stated, that “if the advertisement is about a company that I don’t want to
promote like Monsanto and such, then naturally I would rather not do it”465, while one
would accept a “discount to share the football shirt of my favorite team with my friends,
I’d love to do that”466. These quotes show that the set of personal values and beliefs
regarding the eWOM content clearly determine the perceived archetype utility and thus
the engagement decisions of the prosumers.
Secondly, the new category ‘degree of self-disclosure’ emerged from the data. Prosumers
stated that how much information is shared regarding the purchase matters to them. For
instance, one prosumer stated: “what I buy is a personal matter”467. Furthermore, in the
case of a high degree of information disclosure, like shared purchases, “everybody knows
what I bought. I find that unpleasant. […] Yes, that infringes on my privacy”468. Thus, the
greater the level of detail about the purchase, the greater the cognitive costs of engaging
in eWOM. The related subcategories are the precise depiction of the purchase, an
464 Kudeshia, Chetna/Kumar, Amresh (2017), p. 310-330 |
Lee, Mira/Rodgers, Shelly/Kim, Mikyoung (2009), p. 1-11. 465 Literally translated quote from interview three coding unit fourteen. 466 Literally translated quote from interview three coding unit eleven. 467 Literally translated quote from interview thirteen coding unit seventeen. 468 Literally translated quote from interview six coding unit eighteen.
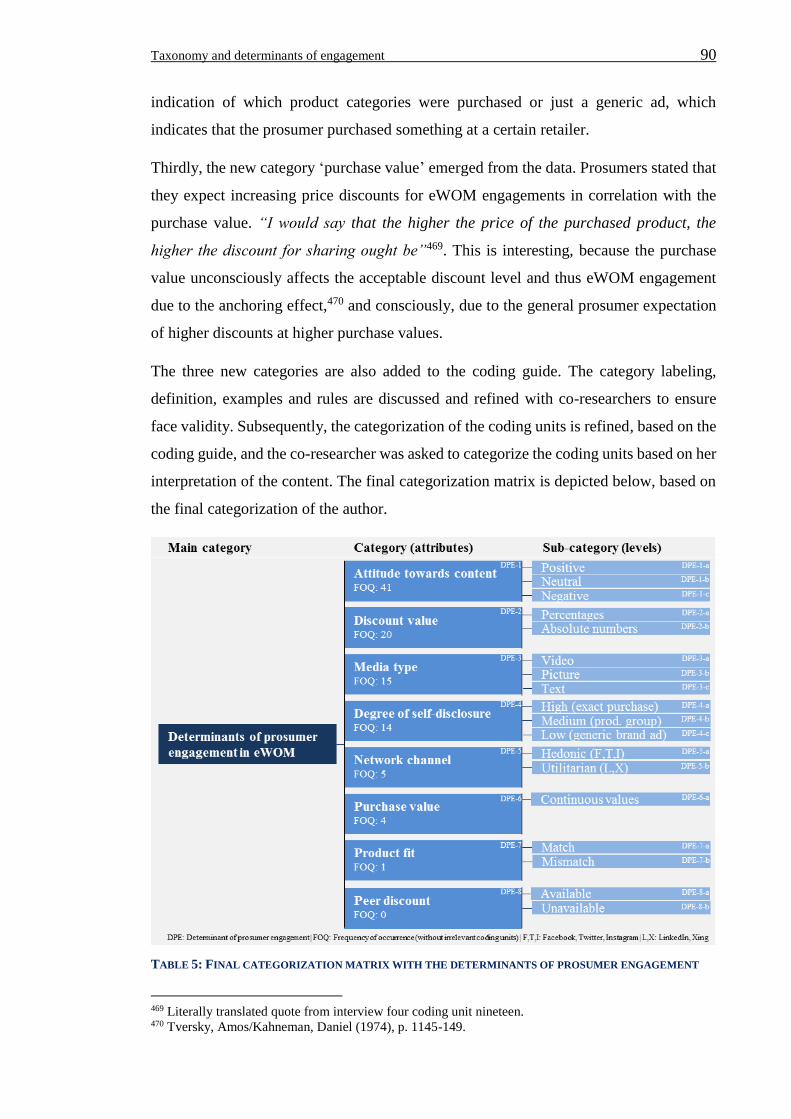
Taxonomy and determinants of engagement 90
indication of which product categories were purchased or just a generic ad, which
indicates that the prosumer purchased something at a certain retailer.
Thirdly, the new category ‘purchase value’ emerged from the data. Prosumers stated that
they expect increasing price discounts for eWOM engagements in correlation with the
purchase value. “I would say that the higher the price of the purchased product, the
higher the discount for sharing ought be”469. This is interesting, because the purchase
value unconsciously affects the acceptable discount level and thus eWOM engagement
due to the anchoring effect,470 and consciously, due to the general prosumer expectation
of higher discounts at higher purchase values.
The three new categories are also added to the coding guide. The category labeling,
definition, examples and rules are discussed and refined with co-researchers to ensure
face validity. Subsequently, the categorization of the coding units is refined, based on the
coding guide, and the co-researcher was asked to categorize the coding units based on her
interpretation of the content. The final categorization matrix is depicted below, based on
the final categorization of the author.
TABLE 5: FINAL CATEGORIZATION MATRIX WITH THE DETERMINANTS OF PROSUMER ENGAGEMENT
469 Literally translated quote from interview four coding unit nineteen. 470 Tversky, Amos/Kahneman, Daniel (1974), p. 1145-149.
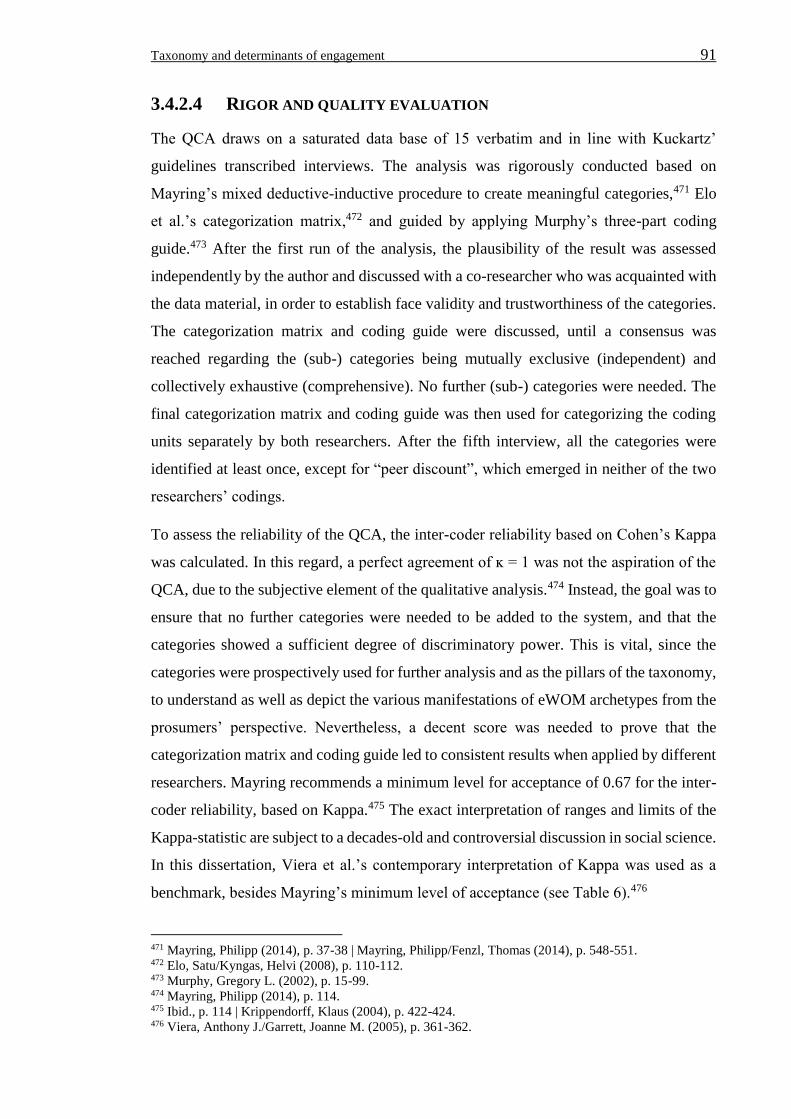
Taxonomy and determinants of engagement 91
3.4.2.4 RIGOR AND QUALITY EVALUATION
The QCA draws on a saturated data base of 15 verbatim and in line with Kuckartz’
guidelines transcribed interviews. The analysis was rigorously conducted based on
Mayring’s mixed deductive-inductive procedure to create meaningful categories,471 Elo
et al.’s categorization matrix,472 and guided by applying Murphy’s three-part coding
guide.473 After the first run of the analysis, the plausibility of the result was assessed
independently by the author and discussed with a co-researcher who was acquainted with
the data material, in order to establish face validity and trustworthiness of the categories.
The categorization matrix and coding guide were discussed, until a consensus was
reached regarding the (sub-) categories being mutually exclusive (independent) and
collectively exhaustive (comprehensive). No further (sub-) categories were needed. The
final categorization matrix and coding guide was then used for categorizing the coding
units separately by both researchers. After the fifth interview, all the categories were
identified at least once, except for “peer discount”, which emerged in neither of the two
researchers’ codings.
To assess the reliability of the QCA, the inter-coder reliability based on Cohen’s Kappa
was calculated. In this regard, a perfect agreement of ĸ = 1 was not the aspiration of the
QCA, due to the subjective element of the qualitative analysis.474 Instead, the goal was to
ensure that no further categories were needed to be added to the system, and that the
categories showed a sufficient degree of discriminatory power. This is vital, since the
categories were prospectively used for further analysis and as the pillars of the taxonomy,
to understand as well as depict the various manifestations of eWOM archetypes from the
prosumers’ perspective. Nevertheless, a decent score was needed to prove that the
categorization matrix and coding guide led to consistent results when applied by different
researchers. Mayring recommends a minimum level for acceptance of 0.67 for the inter-
coder reliability, based on Kappa.475 The exact interpretation of ranges and limits of the
Kappa-statistic are subject to a decades-old and controversial discussion in social science.
In this dissertation, Viera et al.’s contemporary interpretation of Kappa was used as a
benchmark, besides Mayring’s minimum level of acceptance (see Table 6).476
471 Mayring, Philipp (2014), p. 37-38 | Mayring, Philipp/Fenzl, Thomas (2014), p. 548-551. 472 Elo, Satu/Kyngas, Helvi (2008), p. 110-112. 473 Murphy, Gregory L. (2002), p. 15-99. 474 Mayring, Philipp (2014), p. 114. 475 Ibid., p. 114 | Krippendorff, Klaus (2004), p. 422-424. 476 Viera, Anthony J./Garrett, Joanne M. (2005), p. 361-362.
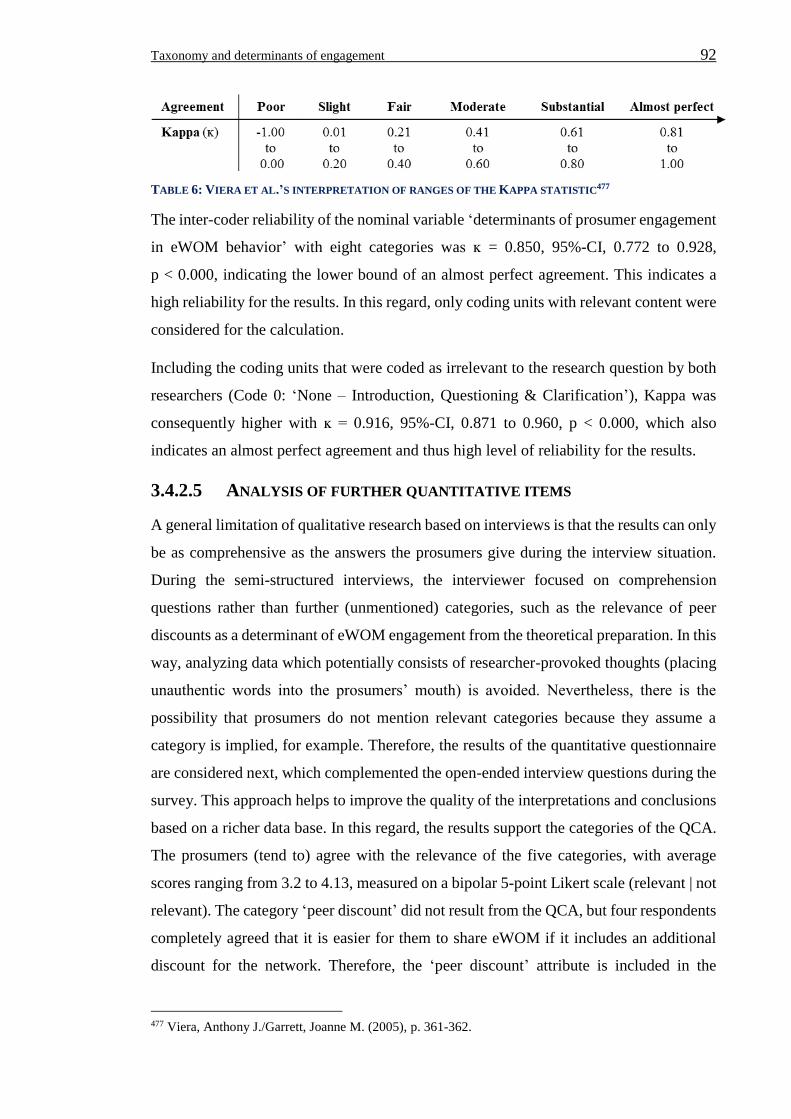
Taxonomy and determinants of engagement 92
TABLE 6: VIERA ET AL.’S INTERPRETATION OF RANGES OF THE KAPPA STATISTIC477
The inter-coder reliability of the nominal variable ‘determinants of prosumer engagement
in eWOM behavior’ with eight categories was ĸ = 0.850, 95%-CI, 0.772 to 0.928,
p < 0.000, indicating the lower bound of an almost perfect agreement. This indicates a
high reliability for the results. In this regard, only coding units with relevant content were
considered for the calculation.
Including the coding units that were coded as irrelevant to the research question by both
researchers (Code 0: ‘None – Introduction, Questioning & Clarification’), Kappa was
consequently higher with ĸ = 0.916, 95%-CI, 0.871 to 0.960, p < 0.000, which also
indicates an almost perfect agreement and thus high level of reliability for the results.
3.4.2.5 ANALYSIS OF FURTHER QUANTITATIVE ITEMS
A general limitation of qualitative research based on interviews is that the results can only
be as comprehensive as the answers the prosumers give during the interview situation.
During the semi-structured interviews, the interviewer focused on comprehension
questions rather than further (unmentioned) categories, such as the relevance of peer
discounts as a determinant of eWOM engagement from the theoretical preparation. In this
way, analyzing data which potentially consists of researcher-provoked thoughts (placing
unauthentic words into the prosumers’ mouth) is avoided. Nevertheless, there is the
possibility that prosumers do not mention relevant categories because they assume a
category is implied, for example. Therefore, the results of the quantitative questionnaire
are considered next, which complemented the open-ended interview questions during the
survey. This approach helps to improve the quality of the interpretations and conclusions
based on a richer data base. In this regard, the results support the categories of the QCA.
The prosumers (tend to) agree with the relevance of the five categories, with average
scores ranging from 3.2 to 4.13, measured on a bipolar 5-point Likert scale (relevant | not
relevant). The category ‘peer discount’ did not result from the QCA, but four respondents
completely agreed that it is easier for them to share eWOM if it includes an additional
discount for the network. Therefore, the ‘peer discount’ attribute is included in the
477 Viera, Anthony J./Garrett, Joanne M. (2005), p. 361-362.
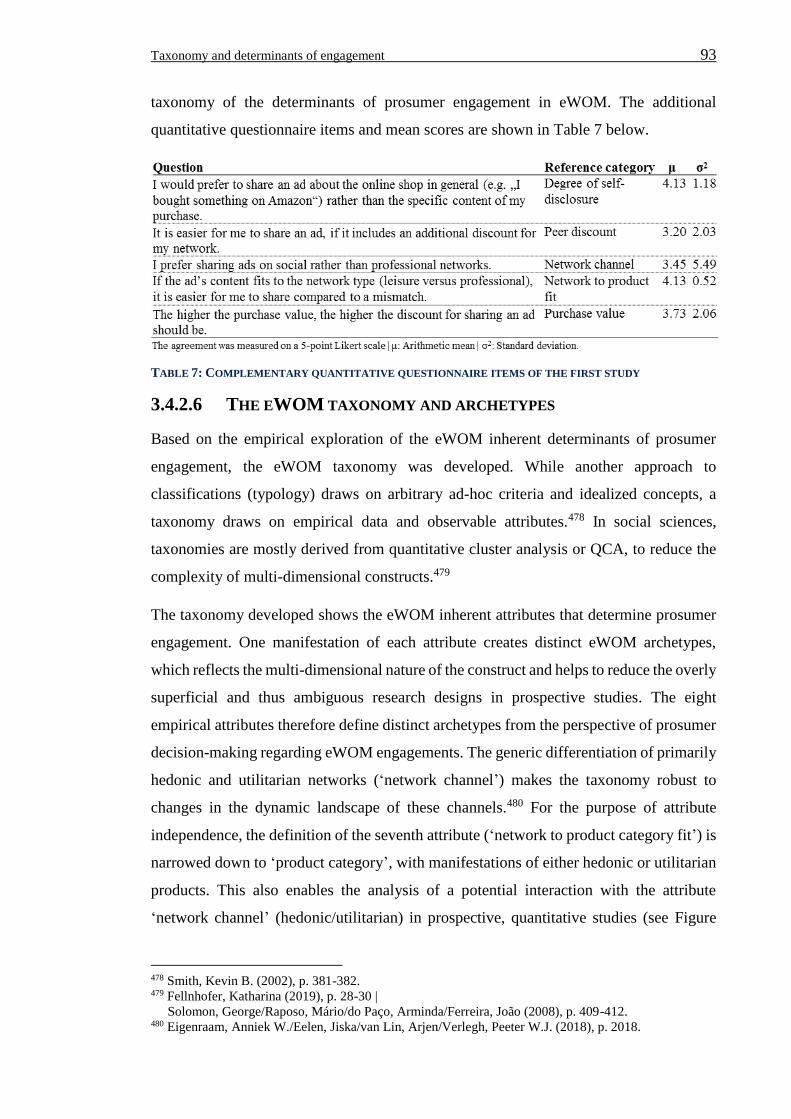
Taxonomy and determinants of engagement 93
taxonomy of the determinants of prosumer engagement in eWOM. The additional
quantitative questionnaire items and mean scores are shown in Table 7 below.
TABLE 7: COMPLEMENTARY QUANTITATIVE QUESTIONNAIRE ITEMS OF THE FIRST STUDY
3.4.2.6 THE EWOM TAXONOMY AND ARCHETYPES
Based on the empirical exploration of the eWOM inherent determinants of prosumer
engagement, the eWOM taxonomy was developed. While another approach to
classifications (typology) draws on arbitrary ad-hoc criteria and idealized concepts, a
taxonomy draws on empirical data and observable attributes.478 In social sciences,
taxonomies are mostly derived from quantitative cluster analysis or QCA, to reduce the
complexity of multi-dimensional constructs.479
The taxonomy developed shows the eWOM inherent attributes that determine prosumer
engagement. One manifestation of each attribute creates distinct eWOM archetypes,
which reflects the multi-dimensional nature of the construct and helps to reduce the overly
superficial and thus ambiguous research designs in prospective studies. The eight
empirical attributes therefore define distinct archetypes from the perspective of prosumer
decision-making regarding eWOM engagements. The generic differentiation of primarily
hedonic and utilitarian networks (‘network channel’) makes the taxonomy robust to
changes in the dynamic landscape of these channels.480 For the purpose of attribute
independence, the definition of the seventh attribute (‘network to product category fit’) is
narrowed down to ‘product category’, with manifestations of either hedonic or utilitarian
products. This also enables the analysis of a potential interaction with the attribute
‘network channel’ (hedonic/utilitarian) in prospective, quantitative studies (see Figure
478 Smith, Kevin B. (2002), p. 381-382. 479 Fellnhofer, Katharina (2019), p. 28-30 | Solomon, George/Raposo, Mário/do Paço, Arminda/Ferreira, João (2008), p. 409-412. 480 Eigenraam, Anniek W./Eelen, Jiska/van Lin, Arjen/Verlegh, Peeter W.J. (2018), p. 2018.
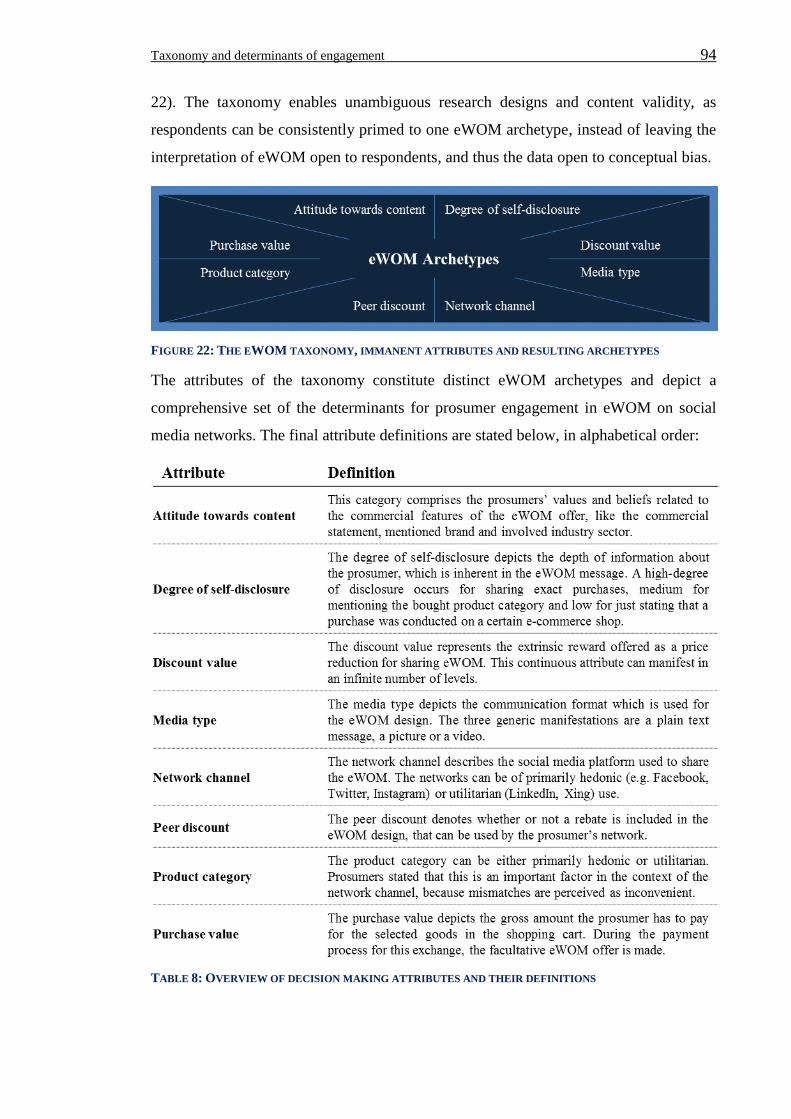
Taxonomy and determinants of engagement 94
22). The taxonomy enables unambiguous research designs and content validity, as
respondents can be consistently primed to one eWOM archetype, instead of leaving the
interpretation of eWOM open to respondents, and thus the data open to conceptual bias.
FIGURE 22: THE EWOM TAXONOMY, IMMANENT ATTRIBUTES AND RESULTING ARCHETYPES
The attributes of the taxonomy constitute distinct eWOM archetypes and depict a
comprehensive set of the determinants for prosumer engagement in eWOM on social
media networks. The final attribute definitions are stated below, in alphabetical order:
TABLE 8: OVERVIEW OF DECISION MAKING ATTRIBUTES AND THEIR DEFINITIONS
Taxonomy and determinants of engagement 95
The first research question is therefore conceptually and empirically answered. Further
research questions and hypotheses that build upon these results can now be rigorously
researched. The relative importance of the eWOM attributes, prosumer preferences
regarding the different manifestations of these attributes (levels) and potential
moderations, like interaction effects, are subsequently researched in the following
quantitative study.
3.4.3 SYNTHESIS AND DISCUSSION
The purpose of the first study was to research the inherent eWOM attributes which
determine prosumer engagement and derive a first-of-its-kind eWOM taxonomy. Due to
the saturated data base and rigorous analytical procedure, the results are representative of
the target group, reliable and valid. Eight distinct attributes reflect multidimensional
construct eWOM from the prosumers’ perspective, regarding archetype utility and thus
engagement. One manifestation of each of the attributes defines specific archetypes.
Therefore, the taxonomy guides future research on eWOM by reducing the level of
uncontrolled distortions (design ambiguity) due to varying interpretations by the
respondents. The results also indicate that the existing forced-choice studies that measure
unidimensional eWOM intentions (intention to share eWOM on binary 5-, 6- or 7-point
Likert scales)481 draw conclusions from measurers with limited content validity. Such
data cannot be interpreted meaningfully, because the intention and actual decision to
engage in eWOM depends on the specific eWOM archetypes. The unidimensional
treatment of the multi-dimensional construct eWOM in extant literature also explains the
contradictory findings. As detailed in the literature review, researchers unintentionally
primed respondents on different archetypes in their respective studies, or left
interpretation open to arbitrary situations and subjectivity, which compromised the
generalizability of the respective findings.
Limitations and future research
No study, however, comes without limitations. Therefore, a number of limitations have
to be acknowledged, simultaneously depicting avenues for future research.
Firstly, the study primarily takes a qualitative approach to exploring the decisive features
of eWOM archetypes from the prosumers’ perspective. This does not allow profound
481 Lo, Louis Yi-Shih/Lin, Sheng-Wei (2017), p. 288-289 | Killian, Michelle/Fahy, John/O ’Loughlin,
Deirdre/Kunz, Werner H. (2018), p. 14 | Septianto, Felix/Chiew, Tung Moi (2018), p. 3-5 | Mishra,
Anubhav/Maheswarappa, Satish S./Maity, Moutusy/Samu, Sridhar (2018), et al. (2018) p. 474-475.
Taxonomy and determinants of engagement 96
conclusions for how much the identified attributes matter, or analyze interactions between
specific manifestations of the attributes (levels).
Secondly, all respondents are homogenous in their cultural imprint. Thus, the taxonomy
might require attribute adjustments in cultures that are fundamentally different to the
German sample.
Thirdly, socio-demographic characteristics were not considered, and all respondents were
treated equally, as one representative group for German users of social media and social
commerce. A segmented approach, controlling socio-demographic effects, would provide
an even more detailed understanding of the determinants of prosumer engagement in
eWOM.
Hence, besides this qualitative-explorative study, a complementary and deeper
quantitative study is needed, in order to investigate attribute importance, attribute-level
preferences, interactions and socio-demographic effects, which constitute a profound
understanding of the phenomenon of prosumer eWOM engagement.
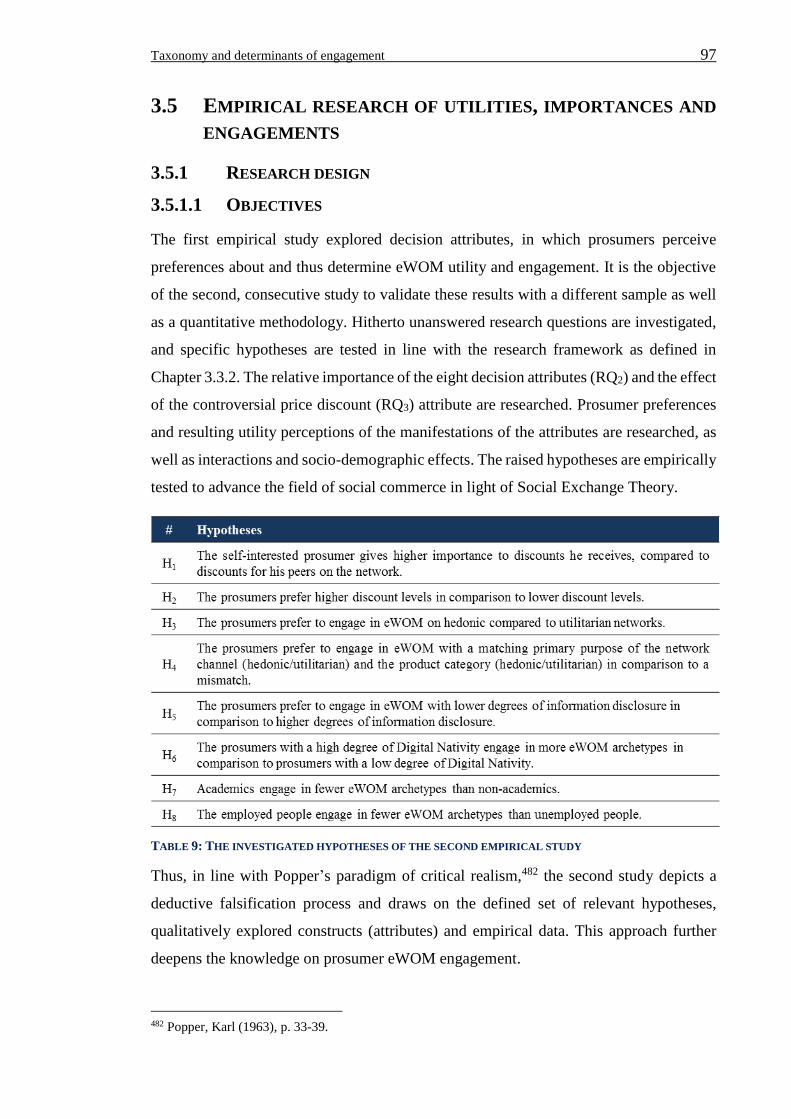
Taxonomy and determinants of engagement 97
3.5 EMPIRICAL RESEARCH OF UTILITIES, IMPORTANCES AND
ENGAGEMENTS
3.5.1 RESEARCH DESIGN
3.5.1.1 OBJECTIVES
The first empirical study explored decision attributes, in which prosumers perceive
preferences about and thus determine eWOM utility and engagement. It is the objective
of the second, consecutive study to validate these results with a different sample as well
as a quantitative methodology. Hitherto unanswered research questions are investigated,
and specific hypotheses are tested in line with the research framework as defined in
Chapter 3.3.2. The relative importance of the eight decision attributes (RQ2) and the effect
of the controversial price discount (RQ3) attribute are researched. Prosumer preferences
and resulting utility perceptions of the manifestations of the attributes are researched, as
well as interactions and socio-demographic effects. The raised hypotheses are empirically
tested to advance the field of social commerce in light of Social Exchange Theory.
TABLE 9: THE INVESTIGATED HYPOTHESES OF THE SECOND EMPIRICAL STUDY
Thus, in line with Popper’s paradigm of critical realism,482 the second study depicts a
deductive falsification process and draws on the defined set of relevant hypotheses,
qualitatively explored constructs (attributes) and empirical data. This approach further
deepens the knowledge on prosumer eWOM engagement.
482 Popper, Karl (1963), p. 33-39.
Taxonomy and determinants of engagement 98
3.5.1.2 VARIABLES, STIMULI AND OPERATIONALIZATIONS
A number of variables have to be defined and operationalized to answer the defined
research questions and test the hypotheses.
The independent variables which constitute the stimulus ‘eWOM archetype’
The attributes of the eWOM taxonomy are comprehensively adopted in the second study
as the independent variables (factors) which determine eWOM engagement. Therefore,
the different manifestations of the variables (attribute levels and factor levels) need to be
specified and operationalized. During the definition of the attribute levels, the trade-off
between a greater number of levels and experimental complexity from the study
participants’ perspective is considered, to develop a realistic yet comprehensible research
design.
(1) The attribute attitude towards content refers to the prosumer’s perception of
advertisements based on the concordance of its features (e.g. brand) to their personal
values and beliefs. In line with the eWOM taxonomy and Wood’s established
differentiation of attitudes in prosumer psychology, three levels of the attribute are
defined: positive, neutral and negative.483 The attribute and levels from the developed
taxonomy were used without further adaptations in this study.
(2) The attribute degree of self-disclosure denotes the amount of personal information
which the eWOM advertisement reveals about the sender. Three levels of information
disclosure were derived from the eWOM taxonomy and the principles of the Value
Growth Model: exact purchase, class of purchased goods and seller (selling social
commerce business). These levels were stated in decreasing order of information
disclosure, since the information for later levels is included in the levels mentioned earlier
(i.e. the disclosure of an exact purchase includes the disclosure of the shop).
(3) The attribute price discount level concerns the monetary benefit which is offered to
the prosumer as part of the eWOM exchange. In order to include realistic values in the
study, shops in the category with the highest online sales volume (fashion) were
researched,484 which also exchange a monetary price discount with the digital value
contribution eWOM, as defined in the Value Growth Model. Several shops with discount
483 Wood, Wendy (2000), p. 540-560 | Reich-Stiebert, Natalia/Eyssel, Friederike/Hohnemann, Charlotte (2018), p. 291. 484 EHI Retail Institute, Webpage of: www.handelsdaten.de (2016).
Taxonomy and determinants of engagement 99
levels ranging from 5%485 up to 30%486 discount on the purchase value were found. Real
values of fashion online purchases were used to calculate realistic absolute discount
values. This retail data was originally taken from twelve fashion shops and 2.3 million
business transactions for Deloitte and IntelliAd’s e-commerce fashion index.487 Drawing
on the percentage discount levels and average purchase values in different fashion
segments, seven realistic discount levels were calculated as manifestations of the attribute
discount level: 2, 4, 8, 12, 20, 25, 50 (in €).
(4) The attribute media type refers to the communication format, which is used to depict
the eWOM. The three levels of text, picture and video are differentiated: these factor
levels are also directly transferred from the definition in the eWOM taxonomy.
(5) The attribute network channel denotes the hedonic or utilitarian social media platform
which is used for eWOM engagement. The three most popular hedonic networks
(Facebook, Instagram, Twitter) and the two most popular utilitarian networks (LinkedIn,
Xing) were included in the study.488
(6) The attribute network discount refers to the inclusion of a rebate for the members of
the prosumer’s network within the eWOM message. The attribute was binary
operationalized as the two levels ‘yes’ (network discount is included) and ‘no’ (there is
no additional discount for the sender’s network).
(7) The attribute product category denotes the primary usage of the advertised good,
which is promoted in the eWOM message. In line with the taxonomy, hedonic and
utilitarian products were differentiated. This differentiation is also in line with the
common differentiation of product and service types in marketing literature.489 Voss et
al. define hedonic products as fun and enjoyable goods, whereas utilitarian products are
defined as effective, helpful and functional goods.490
(8) The attribute purchase value denotes the total invoice amount of the transaction,
during which the eWOM offer is made. In accordance with the operationalization of the
attribute discount level, the average purchase values of twelve fashion e-commerce
businesses were used as a benchmark, in order to include realistic values. The data
485 Amasty Development Ltd, Webpage of: https://amasty.com (2019). 486 Printer's Studio Limited, Webpage of: printerstudio.com (2018). 487 Karon, Christoph. Deloitte and intelliAd Media GmbH (2017), p. 1-5. 488 Statista, Inc. statista.com (2018), statistics ID: 445011. 489 Isabella, Giuliana/Mazzon, José Afonso/Dimoka, Angelika (2017), p. 204. 490 Voss, Kevin E./Spangenberg, Eric R./Grohmann, Bianca (2018), p. 312-316.
Taxonomy and determinants of engagement 100
includes the whole range of fashion retailers from discounters to premium shops.491
Referring to these authentic values, the levels were defined as 50, 110, 180, 220 and 500
(in €).
Further independent variables
In accordance with the defined research framework, three additional independent
variables were included in the research design.
(1) The level of education was integrated as the first socio-demographic variable. Five
common options are offered and the study participants are asked to indicate their highest
educational achievement. The options “no educational attainment” and “vocational
education” indicate non-academic achievements, and the levels “bachelor’s degree”,
“master’s degree” and “Ph.D.” indicate academic educational status.
(2) The employment status was the second socio-demographic variable in the research
framework. Five options were offered: Pupil, student, no occupation, employed, retiree.
All options other than “employed” were clustered as “unemployed”.
(3) The construct of Digital Nativity was the psychographic independent variable, which
describes the changing psychographic properties of generations based on their exposure
to and usage of Internet-based technologies.492 The construct was operationalized through
ten items from four categories (grew up with technology, comfortable with multi-tasking,
reliant on graphics for communication, thrive on instant gratifications and rewards) and
measured on bipolar 7-point Likert-type scales, which were adapted from Teo’s Digital
Nativity Assessment Scale (DNAS).493
The dependent variables of the research model
The prosumers’ utility perception of distinct eWOM archetypes is the focal point of the
Value Growth Model from the prosumer perspective. Therefore, the part-worth utility of
the archetypes’ attribute levels was defined as the key dependent variable.
The part-worth utilities also allowed for the calculation of the attribute importance, which
represents the second dependent variable in the research model.
491 Karon, Christoph. Deloitte and intelliAd Media GmbH (2017), p. 1-5. 492 Gentina, Elodie/Chen, Rui (2018), p. 1 (article in press). 493 Teo, Timothy (2013), p. 55-56 | See Appendix A4.
Taxonomy and determinants of engagement 101
In line with the Social Exchange Theory’s axiom of utility maximizing behavior, the net
archetype utility (additive archetype utility in accordance with the immanent attribute
levels minus the utility of no engagement) also determines prosumer eWOM engagement,
since a positive net archetype utility represents the behavioral choice option with the
greatest utility. The number of calculative eWOM engagements was therefore the third
dependent variable in the research design.
Hence, the part-worth utilities depict (1) the main dependent variable, which was used to
calculate the further dependent variables: (2) the attribute importance (span-width of part-
worth utilities), and (3) the eWOM engagements (number of positive net archetype
utilities).
(1) Prosumers analyze the manifestation of eight attributes in the form of the respective
levels regarding their perceived costs, benefits and thus utility. These part-worth utilities
formed the first dependent variable. The second to fifth hypothesis describe effects on
this dependent variable.
(2) Besides the identification of the relevant attributes of prosumer decision making, the
investigation into their relative importance for choices was defined as a research objective
and was subject to the first research hypothesis. The importance of all the attributes was
thus defined as the second dependent variable.
(3) EWOM engagement depends on the sum of the part-worth utilities immanent in an
archetype, in comparison to the perceived utility of maintaining the status-quo (no
engagement utility). Thus, eWOM engagement axiomatically occurs in cases of higher
archetype utility in comparison to the utility of no engagement. The number of archetypes
with a positive net utility per prosumer represented the third dependent variable of the
research design. The variable is required to test the hypotheses number six to eight.
Control variables
Furthermore, gender (male, female), age (six clusters) and income (seven clusters) were
measured, to enable the analysis of common control variables in prosumer research.
Taxonomy and determinants of engagement 102
3.5.1.3 METHODOLOGY AND STATISTICS
In the following, the research methodology and corresponding statistical procedures are
presented, to investigate the raised research questions and test the hypotheses.
Choosing the right research methodology
Conjoint analyses are a cluster of established research methodologies in marketing
science, applied to decompose prosumer decision-making in realistic experiments.494
Meta analyses show the advantages of the conjoint analyses, providing (predictive)
validity in comparison to compositional, Likert-scale based analyses.495 Moreover,
conjoint analyses provide a great theoretical fit and rigor to investigating the effect of
attributes and levels of prosumer utility as a determinant of eWOM engagement. The
methodology and statistics follow the assumption of utility-maximizing decision-making
by the prosumers, immanent in the research’s underlying theoretical foundations of Social
Exchange Theory.496 The decomposed part-worth utilities of attribute levels are estimated
to represent past and predict future prosumer choice behavior. Furthermore, the advanced
versions of conjoint analyses enable the estimation of attribute importances, interaction
effects and the consideration of heterogeneous prosumer preferences, all of which are
needed to answer the research questions and test the corresponding hypotheses from the
research framework.
The traditional conjoint analysis is based on Luce and Tukey’s seminal work about
conjoint measurement.497 In traditional conjoint analysis, prosumers are asked to rank a
comprehensive set of alternative options, with one level for each attribute (full profile and
full factorial design), according to their preferences.498 This approach, though a landmark
for its time, has a number of limitations. The need to include all the profiles in the ranking
of each respondent limits the possible amount of attributes within the study, due to the
time and complexity constraints of prosumer research.499 Furthermore, rankings do not
translate to actual choices, since it is unknown up to which point in the ranking profiles
494 Kannan, P. K./Li, Hongshuang Alice (2017), p. 33-34 | Tamimi, Nabil/Sebastianelli, Rose (2015), p. 169-170. 495 Pelzer, Elena (2018), p. 5-6 | Sattler, Henrik/Hensel-Börner, Susanne (2007), p. 67-76. 496 Dieckmann, Anja/Dippold, Katrin/Dietrich, Holger (2009), p. 200-201 | Louviere, Jordan J./Flynn, Terry N./Carson, Richard T. (2010), p. 58-62. 497 Luce, Duncan R./Tukey, John W. (1964), p. 1-27 | Green, Paul E./Krieger, Abba M./Wind, Yoram (Jerry) (2001), p. 56-57. 498 Böhler, Heymo/Scigliano, Dino (2009), p. 105. 499 Louviere, Jordan J./Flynn, Terry N./Carson, Richard T. (2010), p. 58-61 |
Böhler, Heymo/Scigliano, Dino (2009), p. 103.
Taxonomy and determinants of engagement 103
are still chosen.500 In other words, the last choice option in the ranking that is still
acceptable for the respondent remains unknown.
To resolve these issues, a number of advancements have been introduced by researchers
in the field of psychological mathematics.501 For instance, Richard Johnson developed
the methodological advancement named Adaptive Conjoint Analysis (ACA).502 He is also
the founder of today’s market leading software provider for conjoint analyses, Sawtooth
Software.503 The ACA does not require a full-factorial or full-profile design, due to the
use of a two-staged interview process. First, respondents indicate their preferences for all
attribute levels and attribute importance, in order to estimate the initial part-worth
utilities.504 Subsequently, this information is used to adapt the partial profile pairs (not all
attributes are depicted in every dual comparison) shown to each respondent and to update
the part-worth utilities accordingly.505 This increases the possible number of assimilable
attributes in the study and yields more relevant data for estimating the utilities.506
Nevertheless, in ACA partial profile designs, the increased number of attributes in the
analysis comes at the cost of less realistic decision scenarios, as prosumers need to keep
the attributes in mind which are hold constant and thus are not shown during the paired
choice tasks.507 Furthermore, the issuing of self-reported preference rankings to model
choices remains unresolved.
Therefore, a different kind of conjoint analyses was developed, which draws on more
reliable customer choices (trade-off decisions) instead of self-reported preferences to
measure preferences implicitly.508 These so-called choice-based conjoint analyses (CBC)
build upon the seminal works of discrete choice models by Daniel McFadden, who was
awarded the Nobel Memorial Prize in Economic Sciences in 1974.509 Louviere developed
the method known today as CBC, which does not ask respondents to rank profiles, but to
choose one preferred profile (discrete choice) out of a set of numerous profiles.510
Therefore, CBC is actually a discrete choice analysis applied to data from conjoint design
500 Louviere, Jordan J./Flynn, Terry N./Carson, Richard T. (2010), p. 61-62. 501 Teichert, Thorsten/Shehu, Edlira (2009), p. 20-21. 502 Johnson, Richard M. (1991), p. 223-225. 503 Charan, Ashok (2015), p. 470-471. 504 Herrmann, Andreas/Huber, Frank/Regier, Stefanie (2009), p. 114-121. 505 Huber, Joel C., Wittink, Dick R./Fiedler, John A./Miller, Richard (1991), p. 3-4. 506 Agarwal, Manoj K./Green, Paul E. (1991), p. 141-142. 507 Hardon, Jeroen, Webpage of: SKIM decision behavior experts (2018). 508 Helm, Sabrina/Günter, Bernd/Eggert, Andreas (2017), p. 339-340 | Anand, Adarsh/Bansal,
Gunjan/Aggrawal, Deepti (2018), p. 218. 509 Badge, Peter/Turner, Nikolaus/Richmond, Chris (2008), p. 366-368 | Orme, Bryan K. (2010), p. 29. 510 Louviere, Jordan J./Woodworth, George (1983), p. 350-367 | Charan, Ashok (2015), p. 470-471.
Taxonomy and determinants of engagement 104
experiments.511 The methodological improvements increased the number of possible
attributes in realistic full profile designs, and thus enables a mimic of decision-making
scenarios on the market.512 Furthermore, the analysis’ explanatory power of actual
prosumer decision making increased, based on more accurate estimations of the attribute
levels’ part-worth utilities and compared to traditional ranking-based conjoint analyses.513
Due to the consistent theoretical paradigm of Utilitarian Exchange, empirically validated
accuracy, calculability of individual and aggregated utilities, superiority over
compositional Likert scale designs, and outstanding technical implementation of the
methodology, the CBC has prevailed against other methods of researching utility-
motivated decision making behavior.514 Moreover, the CBC methodology is successfully
applied in articles in the related field of customer’s willingness to disclose data (e.g.
location) on the Internet.515 As a consequence, the CBC methodology is chosen to conduct
both the survey design and the statistical analysis. In this regard, e.g. Backhaus et al.
recommend Sawtooth Software as a solution for technical implementation of CBCs.516
The choice-based conjoint analyses – conjoint design and discrete choice analysis
CBCs draw on data which is gathered through a conjoint design, and apply discrete choice
analysis to estimate the attribute levels’ part-worth utilities.
In discrete choice analysis, the dependent variable is binary coded and is observable from
choices instead of the self-explicated ordinal and metric preference statements measured
in traditional conjoint analysis.517 In line with the Social Exchange Theory’s axiom of
utility maximization, the probability of a prosumer’s choice of one particular option
(eWOM archetype) depends on its utility when compared to the alternatives utilities (see
Formula 5 on the following page).518
511 Teichert, Thorsten/Shehu, Edlira (2009), p. 25-26 | Balderjahn, Ingo/Hedergott, Doreen/Peyer, Mathias (2009), p. 129. 512 Ben-Akiva, Moshe/Bierlaire, Michel (2003), p. 8. 513 Karniouchina, Ekaterina V./Moore, William L./van der Rhee, Bo/Verma, Rohit (2009), p. 340-348. 514 Balderjahn, Ingo/Hedergott, Doreen/Peyer, Mathias (2009), p. 135-137. 515 Ziefle, Martina/Halbey, Julian, Kowalewski, Sylvia (2016), p. 255-265. 516 Backhaus, Klaus/Erichson, Bernd/Weiber, Rolf (2015), p. 232-247. 517 Balderjahn, Ingo/Hedergott, Doreen/Peyer, Mathias (2009), p. 129. 518 Temme, Jarg (2007), p. 328 | Gensch, Dennis H./Recker, Wilfred W. (1979), p. 125.
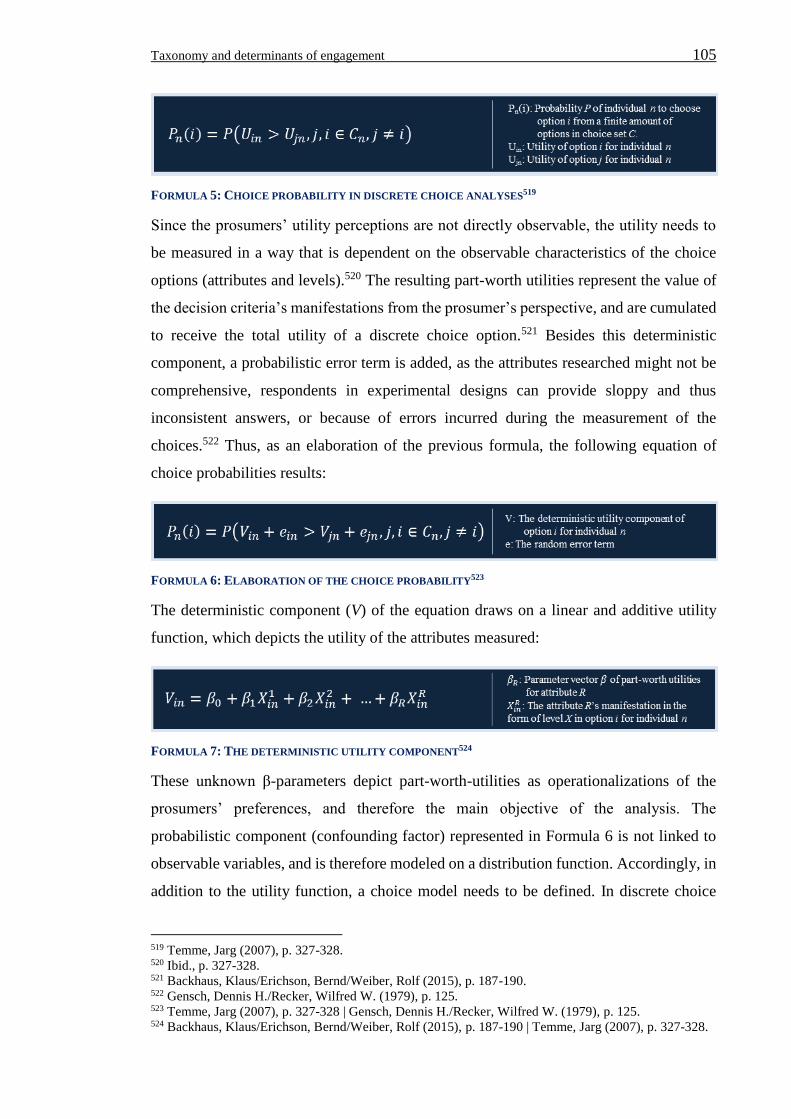
Taxonomy and determinants of engagement 105
FORMULA 5: CHOICE PROBABILITY IN DISCRETE CHOICE ANALYSES519
Since the prosumers’ utility perceptions are not directly observable, the utility needs to
be measured in a way that is dependent on the observable characteristics of the choice
options (attributes and levels).520 The resulting part-worth utilities represent the value of
the decision criteria’s manifestations from the prosumer’s perspective, and are cumulated
to receive the total utility of a discrete choice option.521 Besides this deterministic
component, a probabilistic error term is added, as the attributes researched might not be
comprehensive, respondents in experimental designs can provide sloppy and thus
inconsistent answers, or because of errors incurred during the measurement of the
choices.522 Thus, as an elaboration of the previous formula, the following equation of
choice probabilities results:
FORMULA 6: ELABORATION OF THE CHOICE PROBABILITY523
The deterministic component (V) of the equation draws on a linear and additive utility
function, which depicts the utility of the attributes measured:
FORMULA 7: THE DETERMINISTIC UTILITY COMPONENT524
These unknown β-parameters depict part-worth-utilities as operationalizations of the
prosumers’ preferences, and therefore the main objective of the analysis. The
probabilistic component (confounding factor) represented in Formula 6 is not linked to
observable variables, and is therefore modeled on a distribution function. Accordingly, in
addition to the utility function, a choice model needs to be defined. In discrete choice
519 Temme, Jarg (2007), p. 327-328. 520 Ibid., p. 327-328. 521 Backhaus, Klaus/Erichson, Bernd/Weiber, Rolf (2015), p. 187-190. 522 Gensch, Dennis H./Recker, Wilfred W. (1979), p. 125. 523 Temme, Jarg (2007), p. 327-328 | Gensch, Dennis H./Recker, Wilfred W. (1979), p. 125. 524 Backhaus, Klaus/Erichson, Bernd/Weiber, Rolf (2015), p. 187-190 | Temme, Jarg (2007), p. 327-328.
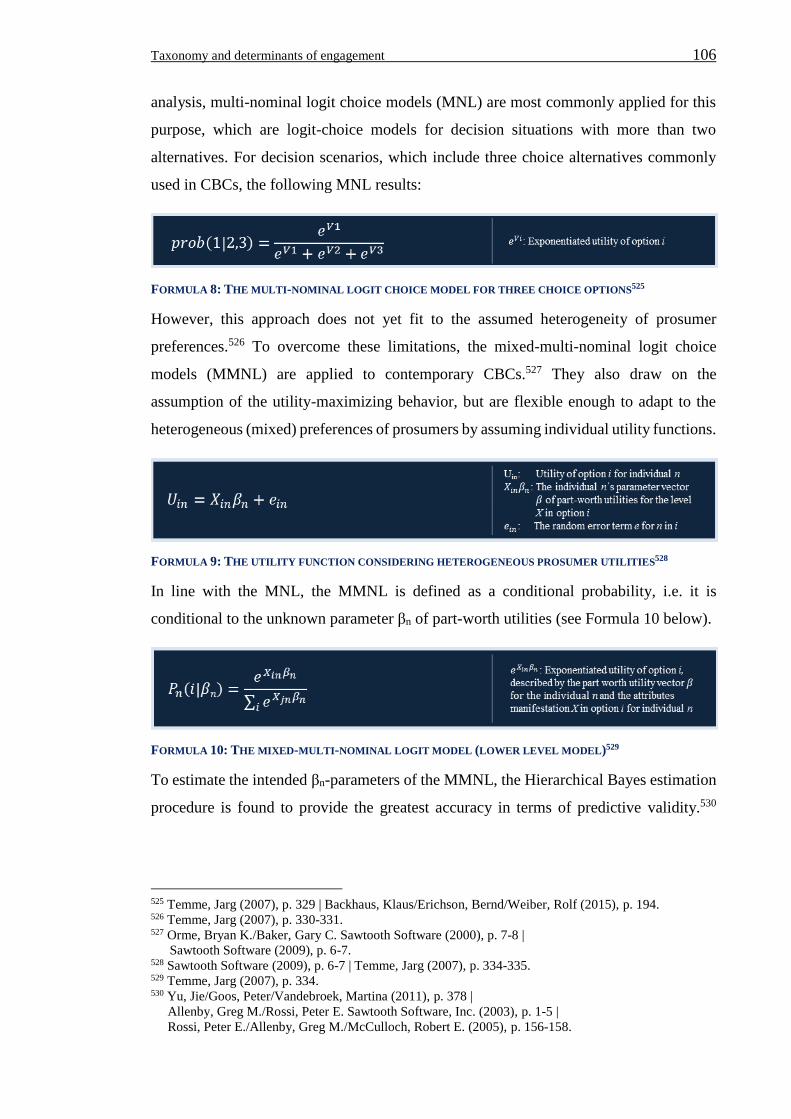
Taxonomy and determinants of engagement 106
analysis, multi-nominal logit choice models (MNL) are most commonly applied for this
purpose, which are logit-choice models for decision situations with more than two
alternatives. For decision scenarios, which include three choice alternatives commonly
used in CBCs, the following MNL results:
FORMULA 8: THE MULTI-NOMINAL LOGIT CHOICE MODEL FOR THREE CHOICE OPTIONS525
However, this approach does not yet fit to the assumed heterogeneity of prosumer
preferences.526 To overcome these limitations, the mixed-multi-nominal logit choice
models (MMNL) are applied to contemporary CBCs.527 They also draw on the
assumption of the utility-maximizing behavior, but are flexible enough to adapt to the
heterogeneous (mixed) preferences of prosumers by assuming individual utility functions.
FORMULA 9: THE UTILITY FUNCTION CONSIDERING HETEROGENEOUS PROSUMER UTILITIES528
In line with the MNL, the MMNL is defined as a conditional probability, i.e. it is
conditional to the unknown parameter βn of part-worth utilities (see Formula 10 below).
FORMULA 10: THE MIXED-MULTI-NOMINAL LOGIT MODEL (LOWER LEVEL MODEL)529
To estimate the intended βn-parameters of the MMNL, the Hierarchical Bayes estimation
procedure is found to provide the greatest accuracy in terms of predictive validity.530
525 Temme, Jarg (2007), p. 329 | Backhaus, Klaus/Erichson, Bernd/Weiber, Rolf (2015), p. 194. 526 Temme, Jarg (2007), p. 330-331. 527 Orme, Bryan K./Baker, Gary C. Sawtooth Software (2000), p. 7-8 |
Sawtooth Software (2009), p. 6-7. 528 Sawtooth Software (2009), p. 6-7 | Temme, Jarg (2007), p. 334-335. 529 Temme, Jarg (2007), p. 334. 530 Yu, Jie/Goos, Peter/Vandebroek, Martina (2011), p. 378 |
Allenby, Greg M./Rossi, Peter E. Sawtooth Software, Inc. (2003), p. 1-5 |
Rossi, Peter E./Allenby, Greg M./McCulloch, Robert E. (2005), p. 156-158.
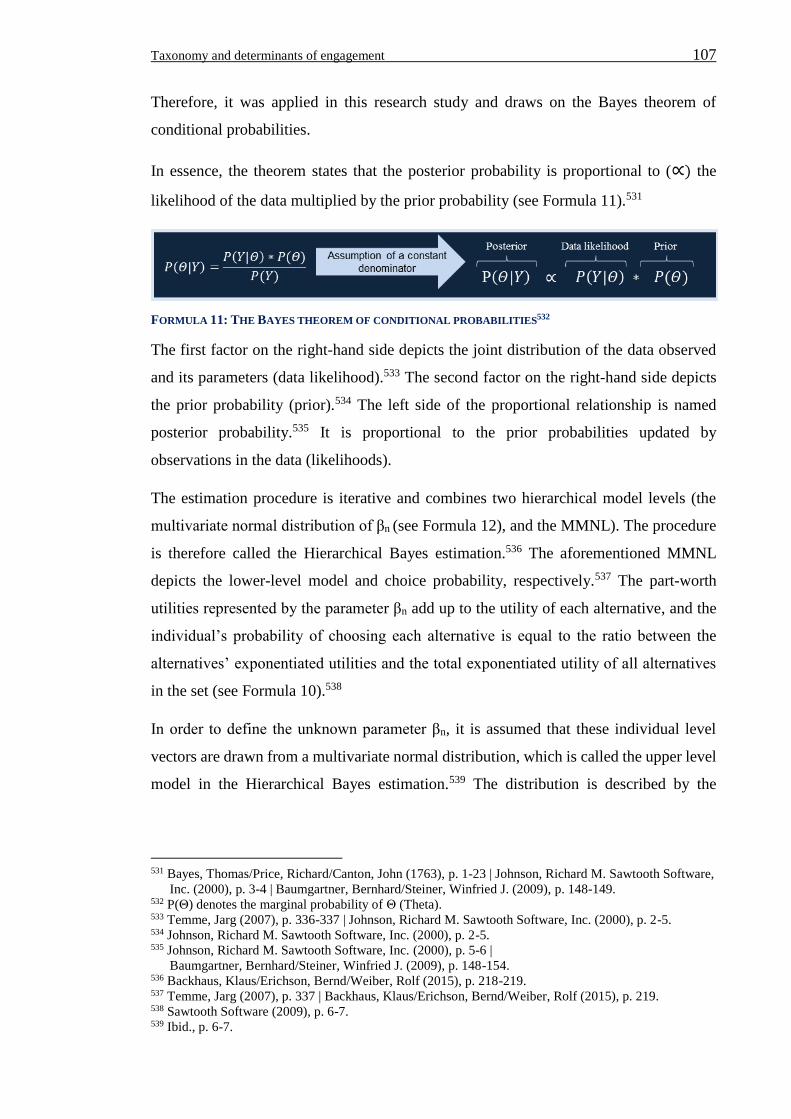
Taxonomy and determinants of engagement 107
Therefore, it was applied in this research study and draws on the Bayes theorem of
conditional probabilities.
In essence, the theorem states that the posterior probability is proportional to (∝) the
likelihood of the data multiplied by the prior probability (see Formula 11).531
FORMULA 11: THE BAYES THEOREM OF CONDITIONAL PROBABILITIES532
The first factor on the right-hand side depicts the joint distribution of the data observed
and its parameters (data likelihood).533 The second factor on the right-hand side depicts
the prior probability (prior).534 The left side of the proportional relationship is named
posterior probability.535 It is proportional to the prior probabilities updated by
observations in the data (likelihoods).
The estimation procedure is iterative and combines two hierarchical model levels (the
multivariate normal distribution of βn (see Formula 12), and the MMNL). The procedure
is therefore called the Hierarchical Bayes estimation.536 The aforementioned MMNL
depicts the lower-level model and choice probability, respectively.537 The part-worth
utilities represented by the parameter βn add up to the utility of each alternative, and the
individual’s probability of choosing each alternative is equal to the ratio between the
alternatives’ exponentiated utilities and the total exponentiated utility of all alternatives
in the set (see Formula 10).538
In order to define the unknown parameter βn, it is assumed that these individual level
vectors are drawn from a multivariate normal distribution, which is called the upper level
model in the Hierarchical Bayes estimation.539 The distribution is described by the
531 Bayes, Thomas/Price, Richard/Canton, John (1763), p. 1-23 | Johnson, Richard M. Sawtooth Software,
Inc. (2000), p. 3-4 | Baumgartner, Bernhard/Steiner, Winfried J. (2009), p. 148-149. 532 P(Θ) denotes the marginal probability of Θ (Theta). 533 Temme, Jarg (2007), p. 336-337 | Johnson, Richard M. Sawtooth Software, Inc. (2000), p. 2-5. 534 Johnson, Richard M. Sawtooth Software, Inc. (2000), p. 2-5. 535 Johnson, Richard M. Sawtooth Software, Inc. (2000), p. 5-6 |
Baumgartner, Bernhard/Steiner, Winfried J. (2009), p. 148-154. 536 Backhaus, Klaus/Erichson, Bernd/Weiber, Rolf (2015), p. 218-219. 537 Temme, Jarg (2007), p. 337 | Backhaus, Klaus/Erichson, Bernd/Weiber, Rolf (2015), p. 219. 538 Sawtooth Software (2009), p. 6-7. 539 Ibid., p. 6-7.
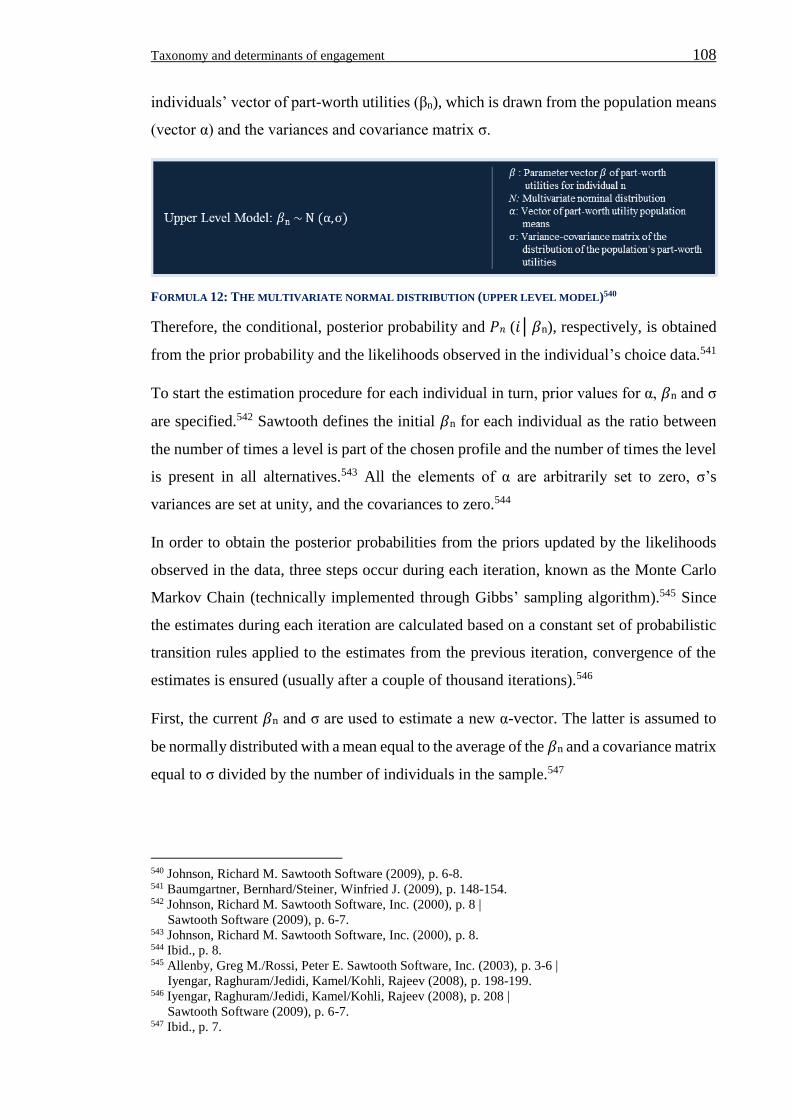
Taxonomy and determinants of engagement 108
individuals’ vector of part-worth utilities (βn), which is drawn from the population means
(vector α) and the variances and covariance matrix σ.
FORMULA 12: THE MULTIVARIATE NORMAL DISTRIBUTION (UPPER LEVEL MODEL)540
Therefore, the conditional, posterior probability and 𝑃𝑛 (𝑖│𝛽n), respectively, is obtained
from the prior probability and the likelihoods observed in the individual’s choice data.541
To start the estimation procedure for each individual in turn, prior values for α, 𝛽n and σ
are specified.542 Sawtooth defines the initial 𝛽n for each individual as the ratio between
the number of times a level is part of the chosen profile and the number of times the level
is present in all alternatives.543 All the elements of α are arbitrarily set to zero, σ’s
variances are set at unity, and the covariances to zero.544
In order to obtain the posterior probabilities from the priors updated by the likelihoods
observed in the data, three steps occur during each iteration, known as the Monte Carlo
Markov Chain (technically implemented through Gibbs’ sampling algorithm).545 Since
the estimates during each iteration are calculated based on a constant set of probabilistic
transition rules applied to the estimates from the previous iteration, convergence of the
estimates is ensured (usually after a couple of thousand iterations).546
First, the current 𝛽n and σ are used to estimate a new α-vector. The latter is assumed to
be normally distributed with a mean equal to the average of the 𝛽n and a covariance matrix
equal to σ divided by the number of individuals in the sample.547
540 Johnson, Richard M. Sawtooth Software (2009), p. 6-8. 541 Baumgartner, Bernhard/Steiner, Winfried J. (2009), p. 148-154. 542 Johnson, Richard M. Sawtooth Software, Inc. (2000), p. 8 |
Sawtooth Software (2009), p. 6-7. 543 Johnson, Richard M. Sawtooth Software, Inc. (2000), p. 8. 544 Ibid., p. 8. 545 Allenby, Greg M./Rossi, Peter E. Sawtooth Software, Inc. (2003), p. 3-6 |
Iyengar, Raghuram/Jedidi, Kamel/Kohli, Rajeev (2008), p. 198-199. 546 Iyengar, Raghuram/Jedidi, Kamel/Kohli, Rajeev (2008), p. 208 |
Sawtooth Software (2009), p. 6-7. 547 Ibid., p. 7.
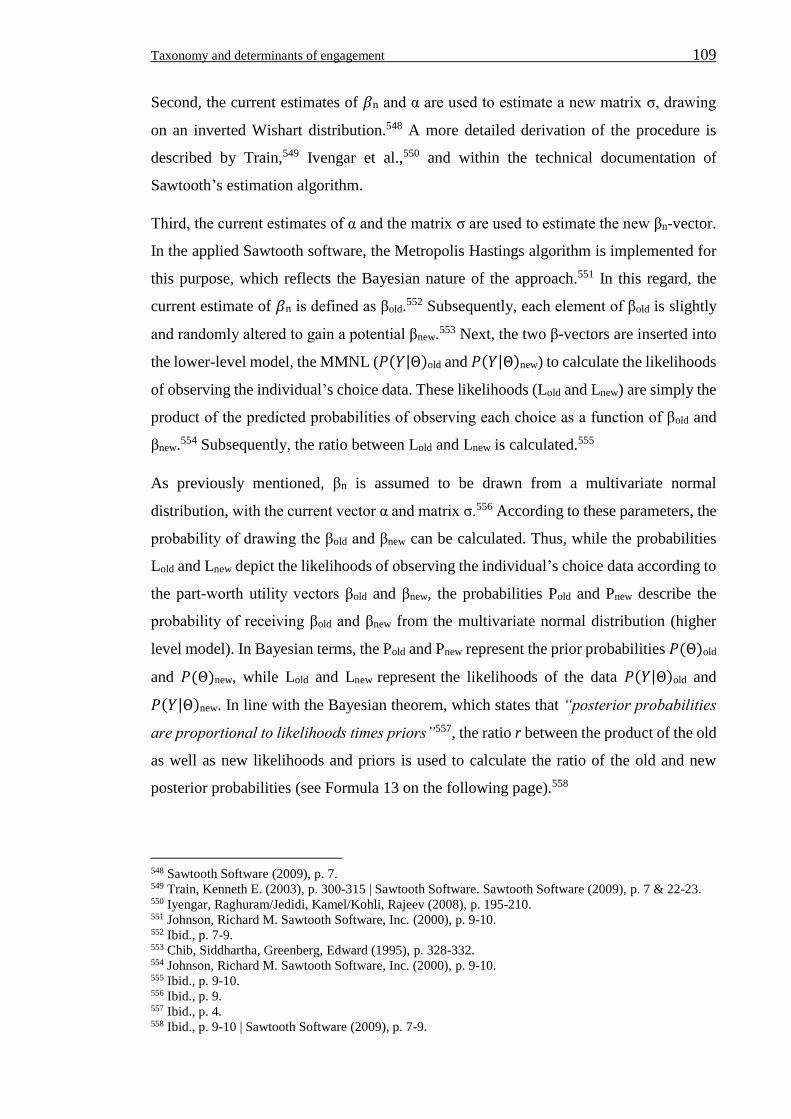
Taxonomy and determinants of engagement 109
Second, the current estimates of 𝛽n and α are used to estimate a new matrix σ, drawing
on an inverted Wishart distribution.548 A more detailed derivation of the procedure is
described by Train,549 Ivengar et al.,550 and within the technical documentation of
Sawtooth’s estimation algorithm.
Third, the current estimates of α and the matrix σ are used to estimate the new βn-vector.
In the applied Sawtooth software, the Metropolis Hastings algorithm is implemented for
this purpose, which reflects the Bayesian nature of the approach.551 In this regard, the
current estimate of 𝛽n is defined as βold.552 Subsequently, each element of βold is slightly
and randomly altered to gain a potential βnew.553 Next, the two β-vectors are inserted into
the lower-level model, the MMNL (𝑃(𝑌|Θ)old and 𝑃(𝑌|Θ)new) to calculate the likelihoods
of observing the individual’s choice data. These likelihoods (Lold and Lnew) are simply the
product of the predicted probabilities of observing each choice as a function of βold and
βnew.554 Subsequently, the ratio between Lold and Lnew is calculated.555
As previously mentioned, βn is assumed to be drawn from a multivariate normal
distribution, with the current vector α and matrix σ.556 According to these parameters, the
probability of drawing the βold and βnew can be calculated. Thus, while the probabilities
Lold and Lnew depict the likelihoods of observing the individual’s choice data according to
the part-worth utility vectors βold and βnew, the probabilities Pold and Pnew describe the
probability of receiving βold and βnew from the multivariate normal distribution (higher
level model). In Bayesian terms, the Pold and Pnew represent the prior probabilities 𝑃(Θ)old
and 𝑃(Θ)new, while Lold and Lnew represent the likelihoods of the data 𝑃(𝑌|Θ)old and
𝑃(𝑌|Θ)new. In line with the Bayesian theorem, which states that “posterior probabilities
are proportional to likelihoods times priors”557, the ratio r between the product of the old
as well as new likelihoods and priors is used to calculate the ratio of the old and new
posterior probabilities (see Formula 13 on the following page).558
548 Sawtooth Software (2009), p. 7. 549 Train, Kenneth E. (2003), p. 300-315 | Sawtooth Software. Sawtooth Software (2009), p. 7 & 22-23. 550 Iyengar, Raghuram/Jedidi, Kamel/Kohli, Rajeev (2008), p. 195-210. 551 Johnson, Richard M. Sawtooth Software, Inc. (2000), p. 9-10. 552 Ibid., p. 7-9. 553 Chib, Siddhartha, Greenberg, Edward (1995), p. 328-332. 554 Johnson, Richard M. Sawtooth Software, Inc. (2000), p. 9-10. 555 Ibid., p. 9-10. 556 Ibid., p. 9. 557 Ibid., p. 4. 558 Ibid., p. 9-10 | Sawtooth Software (2009), p. 7-9.
Taxonomy and determinants of engagement 110
FORMULA 13: THE RATIO WHICH INDICATES REJECTION OR ACCEPTANCE OF BETA ESTIMATIONS559
If the ratio is greater than 1, βnew provides a higher posterior probability than βold and is
therefore accepted as the new estimation of βn. The accepted βn is subsequently used as
the current βold in the next iteration of the Monte Carlo Markov Chain, to incrementally
improve the estimations until a convergence is reached.560 In this way, the iteratively
improving βn provides a good fit to the individual’s choice data, and conforms to the
assumed multivariate normal distribution of the population. Several thousand iterations
are usually calculated (after the burn-in iterations). The resulting alpha draws of the
iterations are saved and used to calculate the confidence intervals of the part-worth
utilities. In this regard, the 2.5th and 97.5th percentile of these alpha draws depict the 95%
confidence interval of the part-worth utility estimates.561
The ACBC – Better questions, better data for the analysis
The Adaptive Choice-based Conjoint analysis (ACBC) is closely related to the CBC in
terms of the statistical procedure described, but draws on an elaborated interviewing
technique to yield the most insightful data from each individual respondent for the
analysis.562 The ACBC is adaptive, as the content of the three-stage interview process is
adjusted to the theorized two-staged conjunctive decision-making process of each
individual respondent. In this regard, the rational decision-making heuristic is first used
to narrow down the set of relevant choice profiles, based on must-have as well as
unacceptable attribute levels. Second, the additive part-worth utilities of the relevant
alternatives are considered and the prosumers choose the utility maximizing option (see
Chapter 3.2).563
The ACBC’s adjustment within the experiment provides insights into the attributes that
are considered during the first part of the conjunctive decision making process, which
remain unknown in other conjoint designs. In addition, most types of conjoint analyses,
559 Johnson, Richard M. Sawtooth Software, Inc. (2000), p. 2-10. 560 Chib, Siddhartha, Greenberg, Edward (1995), p. 328-329 |
Sawtooth Software (2009), p. 8-9. 561 Orme, Bryan K./Chrzan, Keith (2017), p. 182-184. 562 Voleti, Sudhir/Srinivasan, V./Ghosh, Pulak (2017), p. 325-326. 563 Hauser, John R. (2014), p. 1688-1690 |
Hauser, John R./Ding, Min/Gaskin, Steven P. Sawtooth Software, Inc. (2009), p. 1-2.
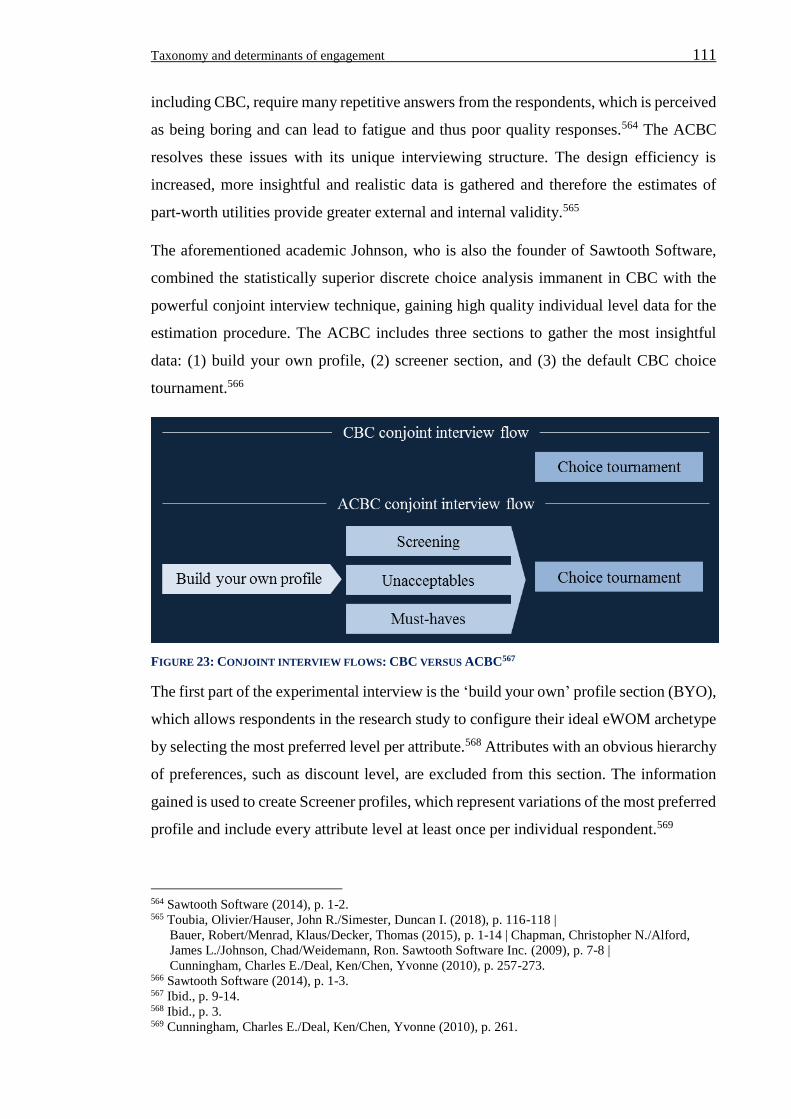
Taxonomy and determinants of engagement 111
including CBC, require many repetitive answers from the respondents, which is perceived
as being boring and can lead to fatigue and thus poor quality responses.564 The ACBC
resolves these issues with its unique interviewing structure. The design efficiency is
increased, more insightful and realistic data is gathered and therefore the estimates of
part-worth utilities provide greater external and internal validity.565
The aforementioned academic Johnson, who is also the founder of Sawtooth Software,
combined the statistically superior discrete choice analysis immanent in CBC with the
powerful conjoint interview technique, gaining high quality individual level data for the
estimation procedure. The ACBC includes three sections to gather the most insightful
data: (1) build your own profile, (2) screener section, and (3) the default CBC choice
tournament.566
FIGURE 23: CONJOINT INTERVIEW FLOWS: CBC VERSUS ACBC567
The first part of the experimental interview is the ‘build your own’ profile section (BYO),
which allows respondents in the research study to configure their ideal eWOM archetype
by selecting the most preferred level per attribute.568 Attributes with an obvious hierarchy
of preferences, such as discount level, are excluded from this section. The information
gained is used to create Screener profiles, which represent variations of the most preferred
profile and include every attribute level at least once per individual respondent.569
564 Sawtooth Software (2014), p. 1-2. 565 Toubia, Olivier/Hauser, John R./Simester, Duncan I. (2018), p. 116-118 |
Bauer, Robert/Menrad, Klaus/Decker, Thomas (2015), p. 1-14 | Chapman, Christopher N./Alford,
James L./Johnson, Chad/Weidemann, Ron. Sawtooth Software Inc. (2009), p. 7-8 | Cunningham, Charles E./Deal, Ken/Chen, Yvonne (2010), p. 257-273.
566 Sawtooth Software (2014), p. 1-3. 567 Ibid., p. 9-14. 568 Ibid., p. 3. 569 Cunningham, Charles E./Deal, Ken/Chen, Yvonne (2010), p. 261.
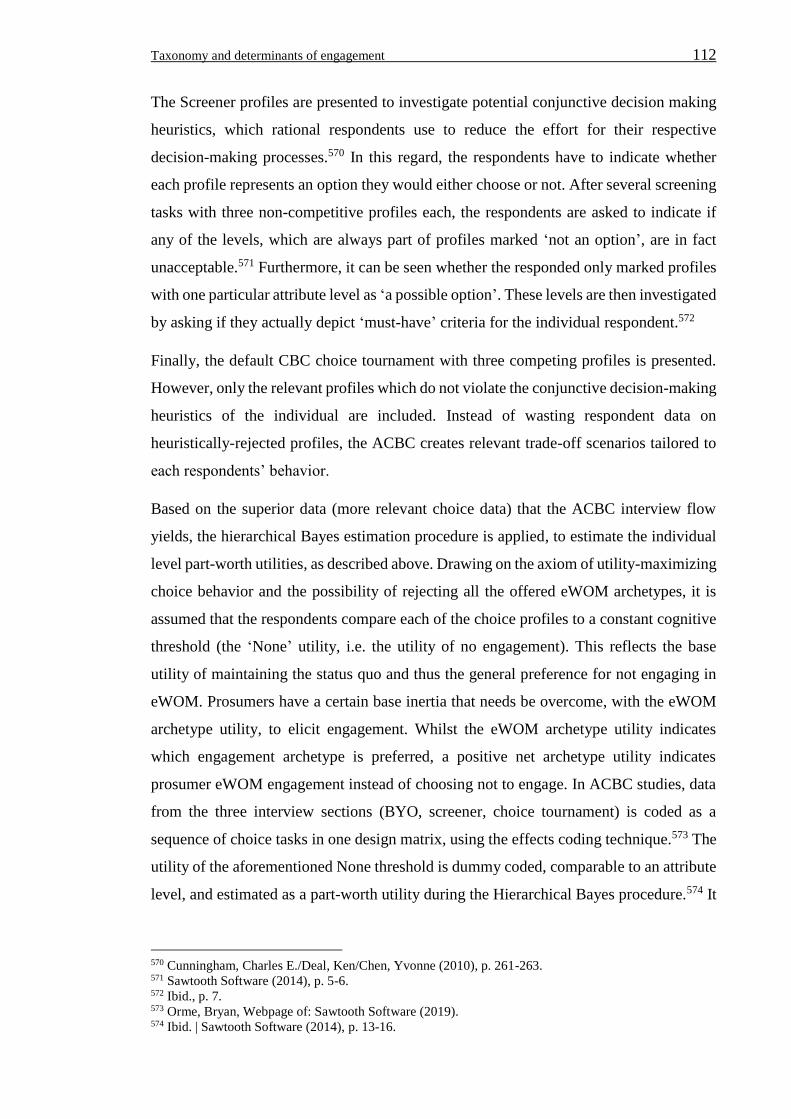
Taxonomy and determinants of engagement 112
The Screener profiles are presented to investigate potential conjunctive decision making
heuristics, which rational respondents use to reduce the effort for their respective
decision-making processes.570 In this regard, the respondents have to indicate whether
each profile represents an option they would either choose or not. After several screening
tasks with three non-competitive profiles each, the respondents are asked to indicate if
any of the levels, which are always part of profiles marked ‘not an option’, are in fact
unacceptable.571 Furthermore, it can be seen whether the responded only marked profiles
with one particular attribute level as ‘a possible option’. These levels are then investigated
by asking if they actually depict ‘must-have’ criteria for the individual respondent.572
Finally, the default CBC choice tournament with three competing profiles is presented.
However, only the relevant profiles which do not violate the conjunctive decision-making
heuristics of the individual are included. Instead of wasting respondent data on
heuristically-rejected profiles, the ACBC creates relevant trade-off scenarios tailored to
each respondents’ behavior.
Based on the superior data (more relevant choice data) that the ACBC interview flow
yields, the hierarchical Bayes estimation procedure is applied, to estimate the individual
level part-worth utilities, as described above. Drawing on the axiom of utility-maximizing
choice behavior and the possibility of rejecting all the offered eWOM archetypes, it is
assumed that the respondents compare each of the choice profiles to a constant cognitive
threshold (the ‘None’ utility, i.e. the utility of no engagement). This reflects the base
utility of maintaining the status quo and thus the general preference for not engaging in
eWOM. Prosumers have a certain base inertia that needs be overcome, with the eWOM
archetype utility, to elicit engagement. Whilst the eWOM archetype utility indicates
which engagement archetype is preferred, a positive net archetype utility indicates
prosumer eWOM engagement instead of choosing not to engage. In ACBC studies, data
from the three interview sections (BYO, screener, choice tournament) is coded as a
sequence of choice tasks in one design matrix, using the effects coding technique.573 The
utility of the aforementioned None threshold is dummy coded, comparable to an attribute
level, and estimated as a part-worth utility during the Hierarchical Bayes procedure.574 It
570 Cunningham, Charles E./Deal, Ken/Chen, Yvonne (2010), p. 261-263. 571 Sawtooth Software (2014), p. 5-6. 572 Ibid., p. 7. 573 Orme, Bryan, Webpage of: Sawtooth Software (2019). 574 Ibid. | Sawtooth Software (2014), p. 13-16.
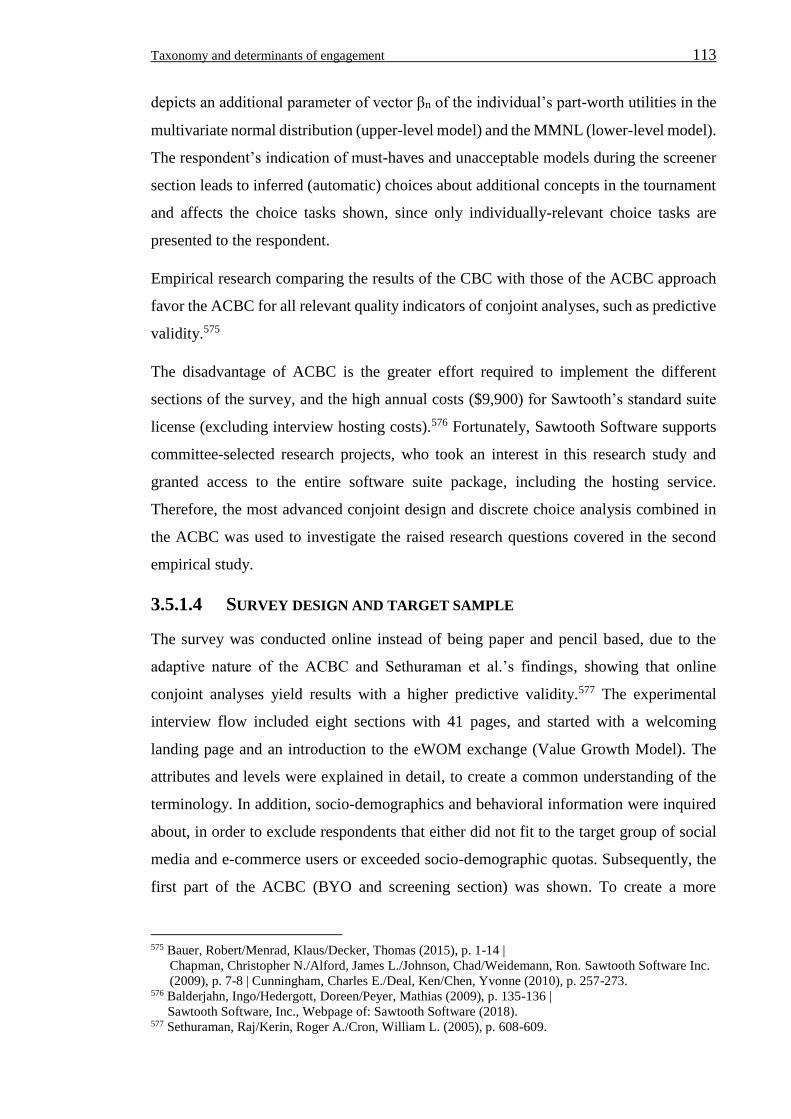
Taxonomy and determinants of engagement 113
depicts an additional parameter of vector βn of the individual’s part-worth utilities in the
multivariate normal distribution (upper-level model) and the MMNL (lower-level model).
The respondent’s indication of must-haves and unacceptable models during the screener
section leads to inferred (automatic) choices about additional concepts in the tournament
and affects the choice tasks shown, since only individually-relevant choice tasks are
presented to the respondent.
Empirical research comparing the results of the CBC with those of the ACBC approach
favor the ACBC for all relevant quality indicators of conjoint analyses, such as predictive
validity.575
The disadvantage of ACBC is the greater effort required to implement the different
sections of the survey, and the high annual costs ($9,900) for Sawtooth’s standard suite
license (excluding interview hosting costs).576 Fortunately, Sawtooth Software supports
committee-selected research projects, who took an interest in this research study and
granted access to the entire software suite package, including the hosting service.
Therefore, the most advanced conjoint design and discrete choice analysis combined in
the ACBC was used to investigate the raised research questions covered in the second
empirical study.
3.5.1.4 SURVEY DESIGN AND TARGET SAMPLE
The survey was conducted online instead of being paper and pencil based, due to the
adaptive nature of the ACBC and Sethuraman et al.’s findings, showing that online
conjoint analyses yield results with a higher predictive validity.577 The experimental
interview flow included eight sections with 41 pages, and started with a welcoming
landing page and an introduction to the eWOM exchange (Value Growth Model). The
attributes and levels were explained in detail, to create a common understanding of the
terminology. In addition, socio-demographics and behavioral information were inquired
about, in order to exclude respondents that either did not fit to the target group of social
media and e-commerce users or exceeded socio-demographic quotas. Subsequently, the
first part of the ACBC (BYO and screening section) was shown. To create a more
575 Bauer, Robert/Menrad, Klaus/Decker, Thomas (2015), p. 1-14 |
Chapman, Christopher N./Alford, James L./Johnson, Chad/Weidemann, Ron. Sawtooth Software Inc.
(2009), p. 7-8 | Cunningham, Charles E./Deal, Ken/Chen, Yvonne (2010), p. 257-273. 576 Balderjahn, Ingo/Hedergott, Doreen/Peyer, Mathias (2009), p. 135-136 | Sawtooth Software, Inc., Webpage of: Sawtooth Software (2018). 577 Sethuraman, Raj/Kerin, Roger A./Cron, William L. (2005), p. 608-609.
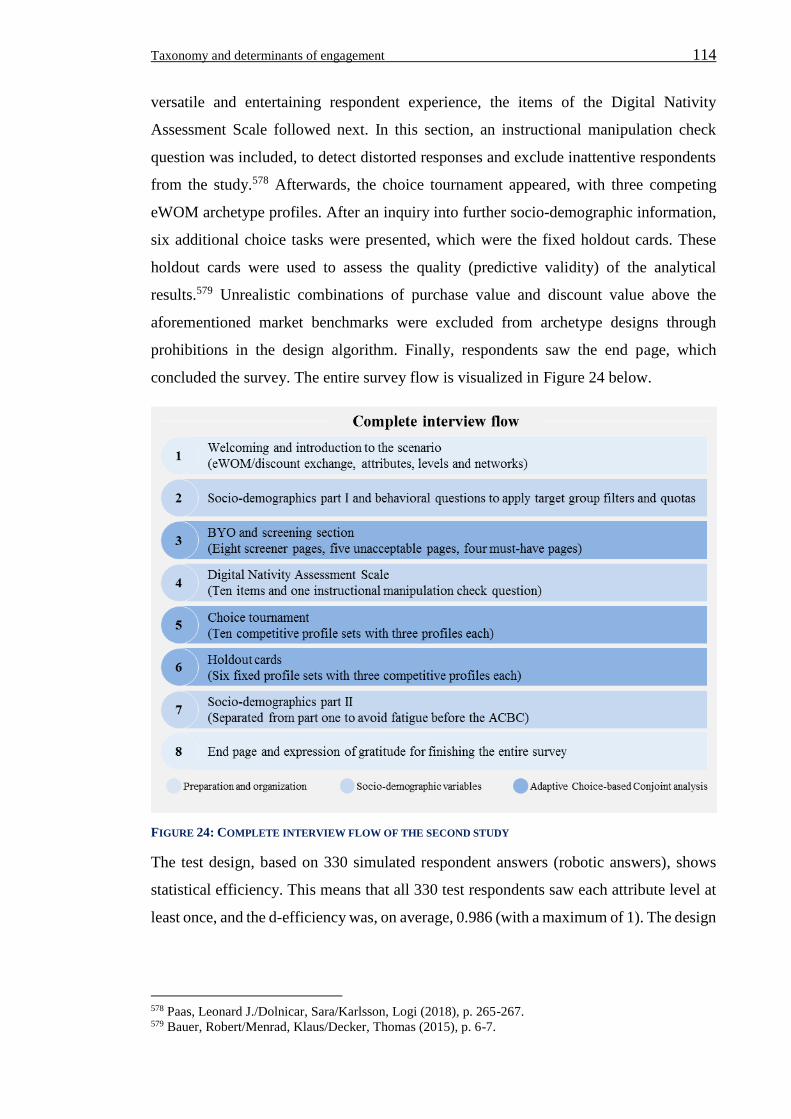
Taxonomy and determinants of engagement 114
versatile and entertaining respondent experience, the items of the Digital Nativity
Assessment Scale followed next. In this section, an instructional manipulation check
question was included, to detect distorted responses and exclude inattentive respondents
from the study.578 Afterwards, the choice tournament appeared, with three competing
eWOM archetype profiles. After an inquiry into further socio-demographic information,
six additional choice tasks were presented, which were the fixed holdout cards. These
holdout cards were used to assess the quality (predictive validity) of the analytical
results.579 Unrealistic combinations of purchase value and discount value above the
aforementioned market benchmarks were excluded from archetype designs through
prohibitions in the design algorithm. Finally, respondents saw the end page, which
concluded the survey. The entire survey flow is visualized in Figure 24 below.
FIGURE 24: COMPLETE INTERVIEW FLOW OF THE SECOND STUDY
The test design, based on 330 simulated respondent answers (robotic answers), shows
statistical efficiency. This means that all 330 test respondents saw each attribute level at
least once, and the d-efficiency was, on average, 0.986 (with a maximum of 1). The design
578 Paas, Leonard J./Dolnicar, Sara/Karlsson, Logi (2018), p. 265-267. 579 Bauer, Robert/Menrad, Klaus/Decker, Thomas (2015), p. 6-7.
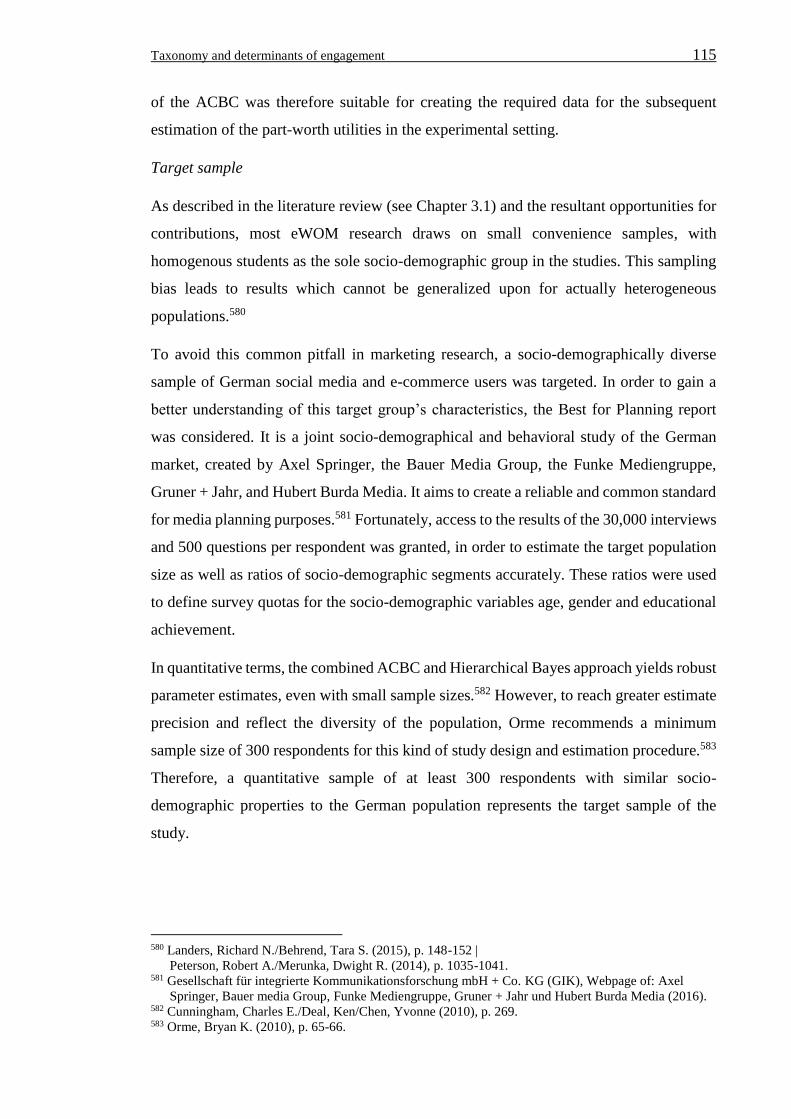
Taxonomy and determinants of engagement 115
of the ACBC was therefore suitable for creating the required data for the subsequent
estimation of the part-worth utilities in the experimental setting.
Target sample
As described in the literature review (see Chapter 3.1) and the resultant opportunities for
contributions, most eWOM research draws on small convenience samples, with
homogenous students as the sole socio-demographic group in the studies. This sampling
bias leads to results which cannot be generalized upon for actually heterogeneous
populations.580
To avoid this common pitfall in marketing research, a socio-demographically diverse
sample of German social media and e-commerce users was targeted. In order to gain a
better understanding of this target group’s characteristics, the Best for Planning report
was considered. It is a joint socio-demographical and behavioral study of the German
market, created by Axel Springer, the Bauer Media Group, the Funke Mediengruppe,
Gruner + Jahr, and Hubert Burda Media. It aims to create a reliable and common standard
for media planning purposes.581 Fortunately, access to the results of the 30,000 interviews
and 500 questions per respondent was granted, in order to estimate the target population
size as well as ratios of socio-demographic segments accurately. These ratios were used
to define survey quotas for the socio-demographic variables age, gender and educational
achievement.
In quantitative terms, the combined ACBC and Hierarchical Bayes approach yields robust
parameter estimates, even with small sample sizes.582 However, to reach greater estimate
precision and reflect the diversity of the population, Orme recommends a minimum
sample size of 300 respondents for this kind of study design and estimation procedure.583
Therefore, a quantitative sample of at least 300 respondents with similar socio-
demographic properties to the German population represents the target sample of the
study.
580 Landers, Richard N./Behrend, Tara S. (2015), p. 148-152 |
Peterson, Robert A./Merunka, Dwight R. (2014), p. 1035-1041. 581 Gesellschaft für integrierte Kommunikationsforschung mbH + Co. KG (GIK), Webpage of: Axel
Springer, Bauer media Group, Funke Mediengruppe, Gruner + Jahr und Hubert Burda Media (2016). 582 Cunningham, Charles E./Deal, Ken/Chen, Yvonne (2010), p. 269. 583 Orme, Bryan K. (2010), p. 65-66.
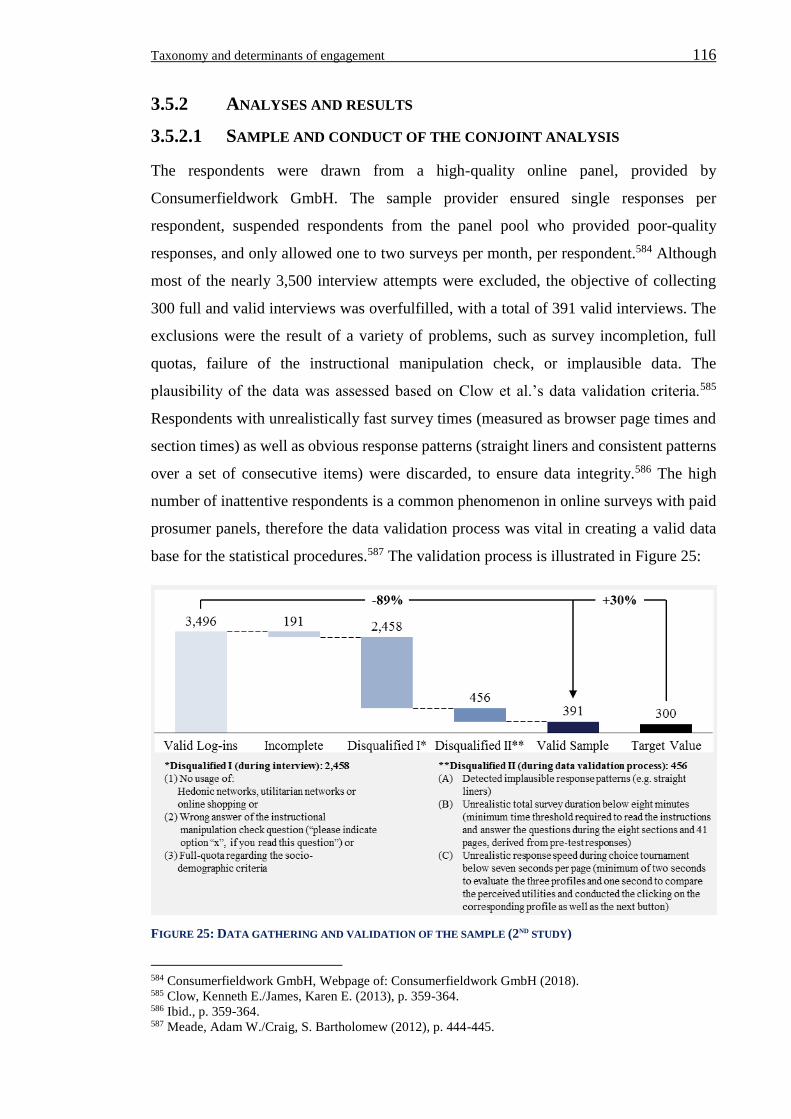
Taxonomy and determinants of engagement 116
3.5.2 ANALYSES AND RESULTS
3.5.2.1 SAMPLE AND CONDUCT OF THE CONJOINT ANALYSIS
The respondents were drawn from a high-quality online panel, provided by
Consumerfieldwork GmbH. The sample provider ensured single responses per
respondent, suspended respondents from the panel pool who provided poor-quality
responses, and only allowed one to two surveys per month, per respondent.584 Although
most of the nearly 3,500 interview attempts were excluded, the objective of collecting
300 full and valid interviews was overfulfilled, with a total of 391 valid interviews. The
exclusions were the result of a variety of problems, such as survey incompletion, full
quotas, failure of the instructional manipulation check, or implausible data. The
plausibility of the data was assessed based on Clow et al.’s data validation criteria.585
Respondents with unrealistically fast survey times (measured as browser page times and
section times) as well as obvious response patterns (straight liners and consistent patterns
over a set of consecutive items) were discarded, to ensure data integrity.586 The high
number of inattentive respondents is a common phenomenon in online surveys with paid
prosumer panels, therefore the data validation process was vital in creating a valid data
base for the statistical procedures.587 The validation process is illustrated in Figure 25:
FIGURE 25: DATA GATHERING AND VALIDATION OF THE SAMPLE (2ND STUDY)
584 Consumerfieldwork GmbH, Webpage of: Consumerfieldwork GmbH (2018). 585 Clow, Kenneth E./James, Karen E. (2013), p. 359-364. 586 Ibid., p. 359-364. 587 Meade, Adam W./Craig, S. Bartholomew (2012), p. 444-445.
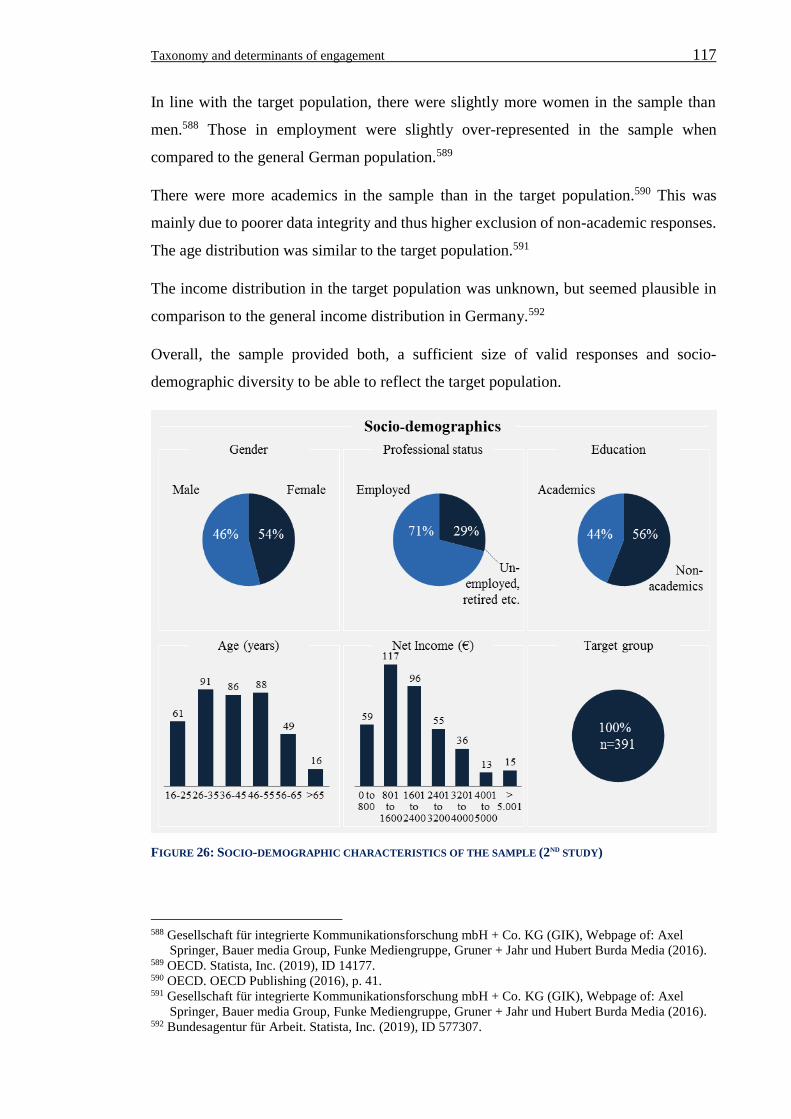
Taxonomy and determinants of engagement 117
In line with the target population, there were slightly more women in the sample than
men.588 Those in employment were slightly over-represented in the sample when
compared to the general German population.589
There were more academics in the sample than in the target population.590 This was
mainly due to poorer data integrity and thus higher exclusion of non-academic responses.
The age distribution was similar to the target population.591
The income distribution in the target population was unknown, but seemed plausible in
comparison to the general income distribution in Germany.592
Overall, the sample provided both, a sufficient size of valid responses and socio-
demographic diversity to be able to reflect the target population.
FIGURE 26: SOCIO-DEMOGRAPHIC CHARACTERISTICS OF THE SAMPLE (2ND STUDY)
588 Gesellschaft für integrierte Kommunikationsforschung mbH + Co. KG (GIK), Webpage of: Axel
Springer, Bauer media Group, Funke Mediengruppe, Gruner + Jahr und Hubert Burda Media (2016). 589 OECD. Statista, Inc. (2019), ID 14177. 590 OECD. OECD Publishing (2016), p. 41. 591 Gesellschaft für integrierte Kommunikationsforschung mbH + Co. KG (GIK), Webpage of: Axel
Springer, Bauer media Group, Funke Mediengruppe, Gruner + Jahr und Hubert Burda Media (2016). 592 Bundesagentur für Arbeit. Statista, Inc. (2019), ID 577307.
Taxonomy and determinants of engagement 118
Furthermore, based on Teo’s Digital Nativity Assessment Scale (DNAS),593 a diverse
spectrum of Digital Nativity scores were reached, ranging from 25 to 70 (with a
theoretical minimum of 10 and maximum of 70). In this regard, the score gap between 10
and 24 might have resulted from a sampling bias, since only members of the digitally
active target group (users of social media networks and e-commerce shops) were accepted
in the sample, which is discussed in the limitations of the study. However, the filter
criteria were necessary for extracting the target group and reducing the hypothetical bias
for the main research questions.
FIGURE 27: DIGITAL NATIVITY SCORES IN THE SAMPLE
Conduct of the Hierarchical Bayes estimation procedure
Drawing on the described sample, the Hierarchical Bayes estimation procedure was run
on Sawtooth’s Lighthouse Studio Version 9.6.1. First, 10,000 burn-in iterations were
calculated to reduce the influence of the arbitrarily-set starting points of the parameters.594
Subsequently, another 10,000 iterations were conducted until the model convergence was
assumed from stable parameter estimates.
3.5.2.2 ATTRIBUTE IMPORTANCES
Besides the decision attributes of prosumer engagement in eWOM (RQ1), their relative
importance is a lacunae in extant literature, and forms the subject of the second research
question. The importance is calculated as the span-width of the part-worth utilities. It is
the quotient of the difference of the lowest and the highest part-worth utility of a
respective attribute and the sum of these differences for all attributes (see Appendix A3
for the formula).595 The relative attribute importances, including the conventional 95%-
confidence intervals, are visualized in Figure 28. If the confidence intervals of two
593 Teo, Timothy (2013), p. 51-57. 594 Ibid., p. 16-17. 595 Orme, Bryan K. (2010), p. 79-80 | Wilcox, Ron D./Kohler, Thomas, Webpage of: Coursera (2017).
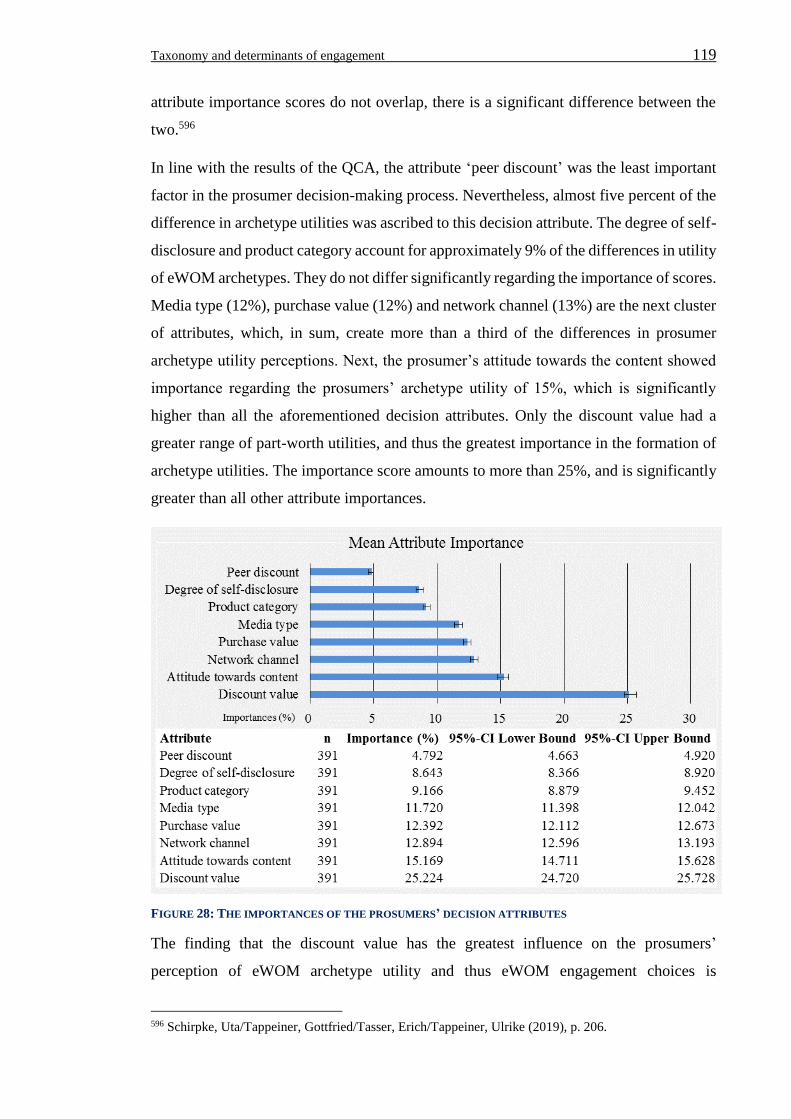
Taxonomy and determinants of engagement 119
attribute importance scores do not overlap, there is a significant difference between the
two.596
In line with the results of the QCA, the attribute ‘peer discount’ was the least important
factor in the prosumer decision-making process. Nevertheless, almost five percent of the
difference in archetype utilities was ascribed to this decision attribute. The degree of self-
disclosure and product category account for approximately 9% of the differences in utility
of eWOM archetypes. They do not differ significantly regarding the importance of scores.
Media type (12%), purchase value (12%) and network channel (13%) are the next cluster
of attributes, which, in sum, create more than a third of the differences in prosumer
archetype utility perceptions. Next, the prosumer’s attitude towards the content showed
importance regarding the prosumers’ archetype utility of 15%, which is significantly
higher than all the aforementioned decision attributes. Only the discount value had a
greater range of part-worth utilities, and thus the greatest importance in the formation of
archetype utilities. The importance score amounts to more than 25%, and is significantly
greater than all other attribute importances.
FIGURE 28: THE IMPORTANCES OF THE PROSUMERS’ DECISION ATTRIBUTES
The finding that the discount value has the greatest influence on the prosumers’
perception of eWOM archetype utility and thus eWOM engagement choices is
596 Schirpke, Uta/Tappeiner, Gottfried/Tasser, Erich/Tappeiner, Ulrike (2019), p. 206.
Taxonomy and determinants of engagement 120
particularly interesting (RQ4), because it contradicts Tong et al.’s and Yen et al.’s
systematic findings (monetary incentives do not matter).597 As described in Chapter 3.1.3,
the reasons for the different findings presumably lie in the previous usage of convenience
samples, ambiguous eWOM definitions in the experiments, and the explicit measurement
of eWOM intentions on superficial Likert scales.
Furthermore, the difference between the importances of the discount value for the sender
when compared to the peer discount was addressed in H1. Based on the above-visualized
confidence intervals and a paired samples t-test, the hypothesis is tested. After the
investigation of the non-overlapping confidence intervals between the least and most
important decision attributes, it comes as no surprise that the t-test also showed that
prosumers ascribe a significantly higher importance to their own discounts when
compared to peer discounts, t(390) = 38.115, p < 0.0005, d = 1.930.598 The effect size is
very large, since the two mean importances are almost two standard deviations apart from
one another.
3.5.2.3 PROSUMER PREFERENCES OF ATTRIBUTE LEVELS
Drawing on the conjunctive decision-making process of Social Exchange Theory, the
attributes and levels are the determinants of prosumer engagement choices regarding the
distinct eWOM archetypes.599 Prosumers first discard unattractive archetypes based on
missing must-have or presently unacceptable levels inherent in the eWOM archetypes
offered, and subsequently decide on the remaining archetype with the highest sum of the
part-worth utilities (or the None option, for no engagement and consequently no
incentive).
The interval scaled part-worth utilities represent prosumer preference for specific
manifestations of the decision attributes. The higher the part-worth utility of a level, the
more it is preferred over other the levels within each attribute.600 The addition of part-
597 Tong, Yu/Xinwei Wang and Hock-Hai Teo (2007), p. 7-8. |
Yen, Chih-Lun Alan/Tang, Chun-Hung Hugo (2019), p. 14-15. 598 Since the difference in importances between the individual and the peer discount were not normally
distributed (Shapiro-Wilk’s test p = 0.023), the result was validated with a non-parametric test, which
does not require a normal but symmetrical distribution of the differences. The related samples
Wilcoxon signed-rank test confirmed the significantly higher importance of individual over peer
discounts: Z = -17.049, p < 0.0005, r = -0.862. 599 Tong, Yu/Xinwei Wang and Hock-Hai Teo (2007), p. 3 | Hauser, John R. (2014), p. 1688-1699. 600 Veitch, Jenny/Salmon, Jo/Deforche, Benedicte/Ghekiere, Ariane/van Cauwenberg, Jelle/Bangay,
Shaun/Timperio, Anna (2017), p. 54.
Taxonomy and determinants of engagement 121
worth utilities to archetype utilities determines the utility-motivated choice behavior of
the prosumer.
The individual level utilities (part-worth utilities) from the Hierarchical Bayes estimation
were aggregated by normalizing the raw part-worth utilities. The sum of all the
normalized part-worth utilities of one attribute is zero, which simplifies the interpretation
and gives each respondent equal weight during the aggregation.601 The normalized part-
worth utilities are reported in Table 10 on the following page.
Besides the independent preference for attribute levels (main effects), the hypothesized
interaction effect of product category and network channel was analyzed, to validate the
qualitative findings of the QCA. In reference to RQ3, prosumer preference for distinct
attribute levels are operationalized as part-worth utilities.
The hypotheses raised around prosumer preferences for attribute levels from Chapter
3.3.2.2 were tested, and are presented in the following structure, alongside the attributes.
601 Ziefle, Martina/Halbey, Julian, Kowalewski, Sylvia (2016), p. 260.
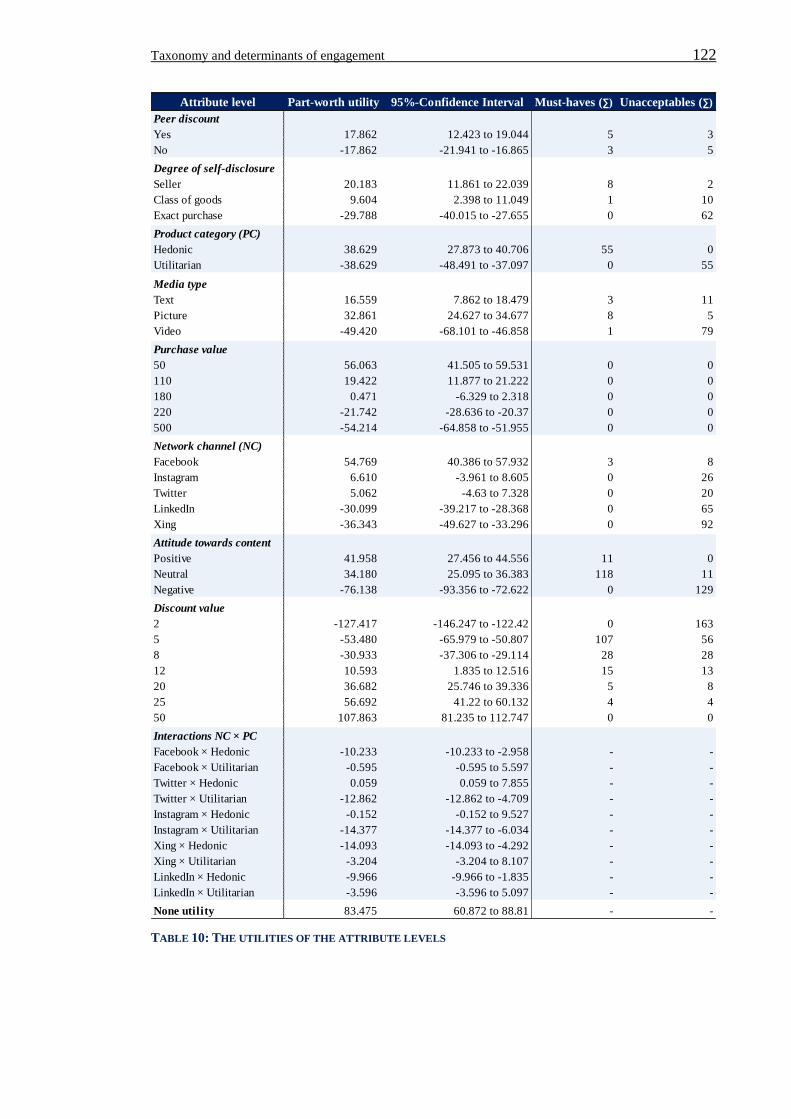
Taxonomy and determinants of engagement 122
TABLE 10: THE UTILITIES OF THE ATTRIBUTE LEVELS
Attribute level Part-worth utility 95%-Confidence Interval Must-haves (∑) Unacceptables (∑)
Peer discount
Yes 17.862 12.423 to 19.044 5 3
No -17.862 -21.941 to -16.865 3 5
Degree of self-disclosure
Seller 20.183 11.861 to 22.039 8 2
Class of goods 9.604 2.398 to 11.049 1 10
Exact purchase -29.788 -40.015 to -27.655 0 62
Product category (PC)
Hedonic 38.629 27.873 to 40.706 55 0
Utilitarian -38.629 -48.491 to -37.097 0 55
Media type
Text 16.559 7.862 to 18.479 3 11
Picture 32.861 24.627 to 34.677 8 5
Video -49.420 -68.101 to -46.858 1 79
Purchase value
50 56.063 41.505 to 59.531 0 0
110 19.422 11.877 to 21.222 0 0
180 0.471 -6.329 to 2.318 0 0
220 -21.742 -28.636 to -20.37 0 0
500 -54.214 -64.858 to -51.955 0 0
Network channel (NC)
Facebook 54.769 40.386 to 57.932 3 8
Instagram 6.610 -3.961 to 8.605 0 26
Twitter 5.062 -4.63 to 7.328 0 20
LinkedIn -30.099 -39.217 to -28.368 0 65
Xing -36.343 -49.627 to -33.296 0 92
Attitude towards content
Positive 41.958 27.456 to 44.556 11 0
Neutral 34.180 25.095 to 36.383 118 11
Negative -76.138 -93.356 to -72.622 0 129
Discount value
2 -127.417 -146.247 to -122.42 0 163
5 -53.480 -65.979 to -50.807 107 56
8 -30.933 -37.306 to -29.114 28 28
12 10.593 1.835 to 12.516 15 13
20 36.682 25.746 to 39.336 5 8
25 56.692 41.22 to 60.132 4 4
50 107.863 81.235 to 112.747 0 0
Interactions NC × PC
Facebook × Hedonic -10.233 -10.233 to -2.958 - -
Facebook × Utilitarian -0.595 -0.595 to 5.597 - -
Twitter × Hedonic 0.059 0.059 to 7.855 - -
Twitter × Utilitarian -12.862 -12.862 to -4.709 - -
Instagram × Hedonic -0.152 -0.152 to 9.527 - -
Instagram × Utilitarian -14.377 -14.377 to -6.034 - -
Xing × Hedonic -14.093 -14.093 to -4.292 - -
Xing × Utilitarian -3.204 -3.204 to 8.107 - -
LinkedIn × Hedonic -9.966 -9.966 to -1.835 - -
LinkedIn × Utilitarian -3.596 -3.596 to 5.097 - -
None utility 83.475 60.872 to 88.81 - -
Taxonomy and determinants of engagement 123
Attribute level main effects
(1) The part-worth utilities of the discount levels increase proportionally to the price
reduction. The different attribute levels also have the greatest count of must-have and
unacceptable selections by prosumers, indicating the high relevance of this attribute
during the heuristic part of the conjunctive decision-making process. Thus, in contrast to
Ryu’s findings and in line with those of Wirtz et al.,602 the amount of monetary incentive
affects eWOM engagement choices, as prosumers significantly prefer to receive higher
to lower monetary rewards for eWOM engagement. The inspection of the CI-bounds for
discount levels show no overlaps, therefore the part-worth utilities were significantly
different in all pairwise comparisons. This might sound trivial, but contradictory findings
in extant literature required clarification through a rigorous research design. In order to
test the corresponding H2 and to receive the exact level of significance and effect size,
Cochran’s Q test was run.603 In this regard, the discount level was the independent
variable and the dichotomously-coded eWOM engagements the dependent variable. The
results showed that prosumers engage in significantly more eWOM archetypes at
increased discount levels: χ2(6) = 5,351.904, p < 0.0005, Cramer’s V = 0.575. A post-hoc
test with a Bonferroni correction for multiple comparisons revealed significant pairwise
differences in each pair at an α-level of 0.001 (see Appendix A5).
(2) The inclusion of a peer discount provides significantly more utility than no peer
discount, as the non-overlapping confidence intervals revealed. Interestingly, some
prosumers perceived the existence of a peer discount as unacceptable and the lack of a
peer discount as a must-have manifestation of the attribute. The respondents had perhaps
assumed that peer discounts would reduce their own discount offers, although this was
not mentioned in the introduction of the experiment, and thus rejected peer discounts to
maximize their individual monetary incentive.
(3) The prosumers preferred lower purchase values in comparison to higher purchase
values. Not one respondent selected any purchase value level as neither a must-have nor
an unacceptable level, which indicates that the attribute is not considered during the
conjunctive part of the decision-making process.
602 Ryu, Gangseog/Feick, Lawrence (2007), p. 92 | Wirtz, Jochen/Chew, Patricia (2002), p. 151. 603 The assumption of sphericity was not met, therefore the Greenhouse-Geisser correction was applied.
Taxonomy and determinants of engagement 124
(4) Regarding the network channel attribute, a clear hierarchy in preferences between the
hedonic and utilitarian networks was found, since the confidence intervals of the part-
worth utilities of the least preferred hedonic network (Twitter) was still significantly
greater than the most preferred utilitarian network (LinkedIn). Facebook was the most
preferred network channel for eWOM engagements, followed by Instagram and Twitter,
which did not show significantly different part-worth utilities. In general, hedonic
networks were considered unacceptable by only 2-7% of the prosumers. By
contrast, the utilitarian networks are considered unacceptable by 16% (LinkedIn) and
24% (Xing) of the prosumers. With respect to H3, a repeated measurers ANOVA was
conducted to reveal the effect size and level of significance regarding the difference
between the average utility of the hedonic in comparison utilitarian networks. Drawing
on the 391 individual part-worth utilities, the test results support the hypothesis raised,
and on average, the hedonic was significantly preferred over utilitarian networks:
F(1, 390) = 436.844, p < 0.0005, η² = 0.528.604 Prosumer utility perception for Facebook
was particularly interesting. It was both the prosumers’ preferred network channel for
eWOM engagements and provided the greatest reach, measured by the mean number of
user contacts as a proxy of business value (x̅Facebook: 250 followed by x̅Instagram: 113). This
means that the prosumers demanded the lowest price discount for sharing eWOM on
Facebook, due to the high compensatory part-worth utility of this level, whilst also
providing the business with the greatest value in peer-to-peer reach.
(5) With respect to media type, text messages were the preferred alternative, followed by
eWOM archetypes that include pictures and finally videos. Only the part-worth utility of
the level video was significantly different from the other two manifestations. Moreover,
approximately 20% of the respondents indicated that the videos were unacceptable for
them. This means that a fifth of prosumers used a decision heuristic and automatically
excluded eWOM archetypes from their decision sets, which included a video from their
decision sets of eWOM engagement choices.
(6) The degree of self-disclosure was also subject to decision making heuristics. About
16% of the respondents indicated the disclosure of the exact purchase, and 2.5% that the
604 The parametric test results are complemented by a non-parametric test, due to outliers in the data and a
violation of normality assessed based on the Shapiro-Wilk test (p < 0.0005). The related samples
Wilcoxon signed-rank test also shows significantly higher utility for hedonic over utilitarian networks:
Z = -15.452, p < 0.0005, Rosenthal’s r = -0.781 (Rosenthal, 1994). The findings therefore consistently
supported H3.
Taxonomy and determinants of engagement 125
class of goods purchased is unacceptable. The confidence intervals of the three levels’
part worth utilities do not overlap and are thus significantly different. Drawing on the
individual part-worth utility estimates and in response to H5, a repeated measurers
ANOVA revealed the p-value and effect size.605 Since the assumption of sphericity was
not met, the Greenhouse-Geisser correction was applied (ε = 0.644). The degree of self-
disclosure significantly affected prosumer utility perceptions: F(1.288, 502.510) =
149.247, p < 0.0005, η² = 0.277.606 The post-hoc test for the three levels of disclosure
(disclosing the exact purchase, disclosing the category of goods or disclosing just the
selling shop) was also significant for all pairwise comparisons: p < 0.0005.607
(7) Regarding the attribute product category and by inspection of the confidence level
bounds of the two levels, prosumers significantly preferred sharing hedonic products over
utilitarian products. This attribute is also subject to prosumer decision heuristics, since
14% of the prosumers marked only hedonic products as acceptable (must-have criteria to
be part of the decision set which is analyzed in detail during the decision-making process).
(8) The attribute attitude towards the content was also considered during the heuristic
part of the decision making-process, as one third of the respondents marked only eWOM
messages which contain positively or at least neutrally perceived content acceptable.
Inspection of the confidence intervals revealed that negatively-perceived content is
significantly less preferred than neutrally and positively-perceived content.
Interaction effects between attribute levels
In line with the qualitative findings (QCA) that the prosumers consider the matching of
the primary purpose of the network channel and the primary usage of the product
category, the two-way interaction effects between network channel and product category
were investigated (H4). In this regard, Sawtooth’s recommended 2-log likelihood (2LL)
test for interactions in attribute levels was used.608 The difference observed in fit between
the first model (main effects only) and the second model (main effects and interaction
605 Rosenthal, Robert (1994), p. 239 | Lund, Adam/Lund, Mark, Webpage of: Lund Research Ltd (2019). 606 Since the assumption of sphericity was not met, the Greenhouse-Geisser correction is applied. 607 To account for violated assumptions of the repeated measurers ANOVA (existing outliers and non-
normal distribution), the non-parametric Friedman test with a Bonferroni correction for multiple
comparisons was conducted. The test does not require the violated assumptions. The difference in
utility between the degrees of self-disclosure remained significant: χ²(2) = 153.458, p < 0.0005.
Moreover, all pairwise comparisons remained significant between the disclosure of the exact purchase
(x̃ = -24.15) and disclosure of the class of goods (x̃ = 6.18) (p < 0.0005), exact purchase and selling
shop (x̃ = 18.35) (p < 0.0005) as well as class of goods and the selling shop (p = 0.018). 608 Sawtooth Software, Inc., Webpage of: Sawtooth Software, Inc. (2019).
Taxonomy and determinants of engagement 126
effects), which included the two-way interaction effect, was significantly greater than
expected by chance: χ2(4) = 17.442, p = 0.002. Therefore, the interaction effect was
significant, and the additional part-worth utilities of the interactions were included in the
calculation of archetype utilities. Furthermore, the interaction part-worth utilities are used
to calculate the mean utilities of the matching and mismatching level combinations.609 As
hypothesized and drawing on a repeated measures ANOVA, the prosumers significantly
preferred sharing matching over mismatching eWOM archetypes: F(1, 35,971.141) =
81.093, p < 0.0005, η² = 0.172.610
The None utility, net archetype utilities and thus eWOM engagements
As expected, the None utility, i.e. the base threshold utility of maintaining the status quo
(no engagement) instead of engaging in eWOM, gave a positive value: 83.475 | 95%-CI
60.872 to 88.810. Thus, in line with the Social Exchange Theory, prosumers generally
perceive a cognitive effort for engaging in eWOM, which needs to be overcompensated
for with the part-worth utilities from preferred attribute levels (like sufficient discount
levels), in order to motivate prosumer engagement in eWOM archetypes over the status
quo option of no engagement. In other words, prosumers only engage in archetypes with
a positive net utility (archetype utility minus the None utility). Just as not every
theoretically possible configuration of, for example, a car provides more utility than costs
for each customer, not every technically possible eWOM archetype provides more
benefits than cost to prosumers. In this regard, the None threshold is used to calculate the
number of beneficial eWOM engagements, based on the net utility of eWOM archetypes
(additive archetype utility minus None utility).611 Theoretically, 18,900 unique eWOM
archetypes result from the combination of all attribute levels. This number is reduced to
16,740 combinations by excluding unrealistic combinations of discount levels and
purchase values (see Chapter 3.5.1.4). Drawing on the average part-worth utilities of the
sample, the utility-motivated prosumers perceive positive net utilities for 3,142
609 Mismatches: Facebook x Utilitarian, Instagram x Utilitarian, Twitter x Utilitarian,
Xing x Hedonic, LinkedIn x Hedonic |
Matches: Facebook x Hedonic, Instagram x Hedonic, Twitter x Hedonic,
Xing x Utilitarian, LinkedIn x Utilitarian. 610 Due to some outlier in the data, the effect was also tested based on the non-parametric Wilcoxon
signed-rank test in SPSS: Z = -8.345, p < 0.0005, Rosenthal’s r = -0.422. Hence, the median utility for
sharing matching eWOM messages about hedonic products and hedonic networks (Facebook, Twitter,
Instagram) and utilitarian products on utilitarian networks (Xing, LinkedIn) was significantly higher
in comparison to the mismatches. 611 As expected, the None threshold was highly and negatively correlated with the number of eWOM
engagements rSpearman(359) = -0.977, p < 0.0005.
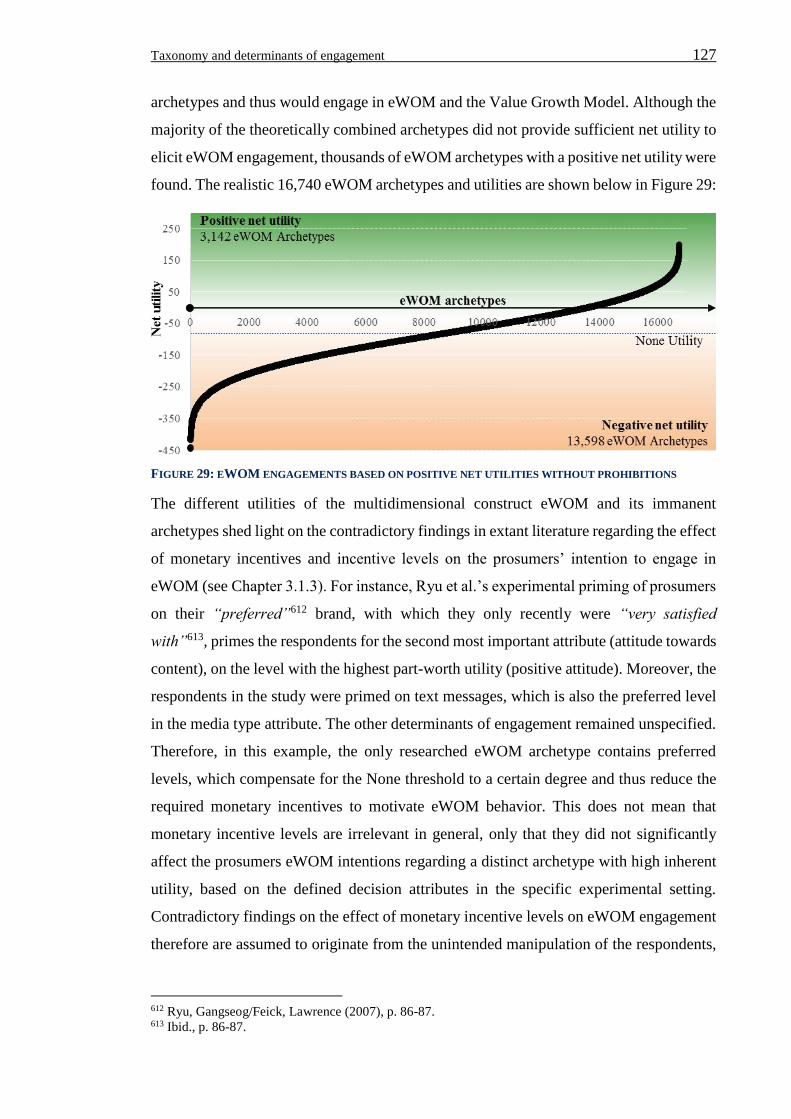
Taxonomy and determinants of engagement 127
archetypes and thus would engage in eWOM and the Value Growth Model. Although the
majority of the theoretically combined archetypes did not provide sufficient net utility to
elicit eWOM engagement, thousands of eWOM archetypes with a positive net utility were
found. The realistic 16,740 eWOM archetypes and utilities are shown below in Figure 29:
FIGURE 29: EWOM ENGAGEMENTS BASED ON POSITIVE NET UTILITIES WITHOUT PROHIBITIONS
The different utilities of the multidimensional construct eWOM and its immanent
archetypes shed light on the contradictory findings in extant literature regarding the effect
of monetary incentives and incentive levels on the prosumers’ intention to engage in
eWOM (see Chapter 3.1.3). For instance, Ryu et al.’s experimental priming of prosumers
on their “preferred”612 brand, with which they only recently were “very satisfied
with”613, primes the respondents for the second most important attribute (attitude towards
content), on the level with the highest part-worth utility (positive attitude). Moreover, the
respondents in the study were primed on text messages, which is also the preferred level
in the media type attribute. The other determinants of engagement remained unspecified.
Therefore, in this example, the only researched eWOM archetype contains preferred
levels, which compensate for the None threshold to a certain degree and thus reduce the
required monetary incentives to motivate eWOM behavior. This does not mean that
monetary incentive levels are irrelevant in general, only that they did not significantly
affect the prosumers eWOM intentions regarding a distinct archetype with high inherent
utility, based on the defined decision attributes in the specific experimental setting.
Contradictory findings on the effect of monetary incentive levels on eWOM engagement
therefore are assumed to originate from the unintended manipulation of the respondents,
612 Ryu, Gangseog/Feick, Lawrence (2007), p. 86-87. 613 Ibid., p. 86-87.
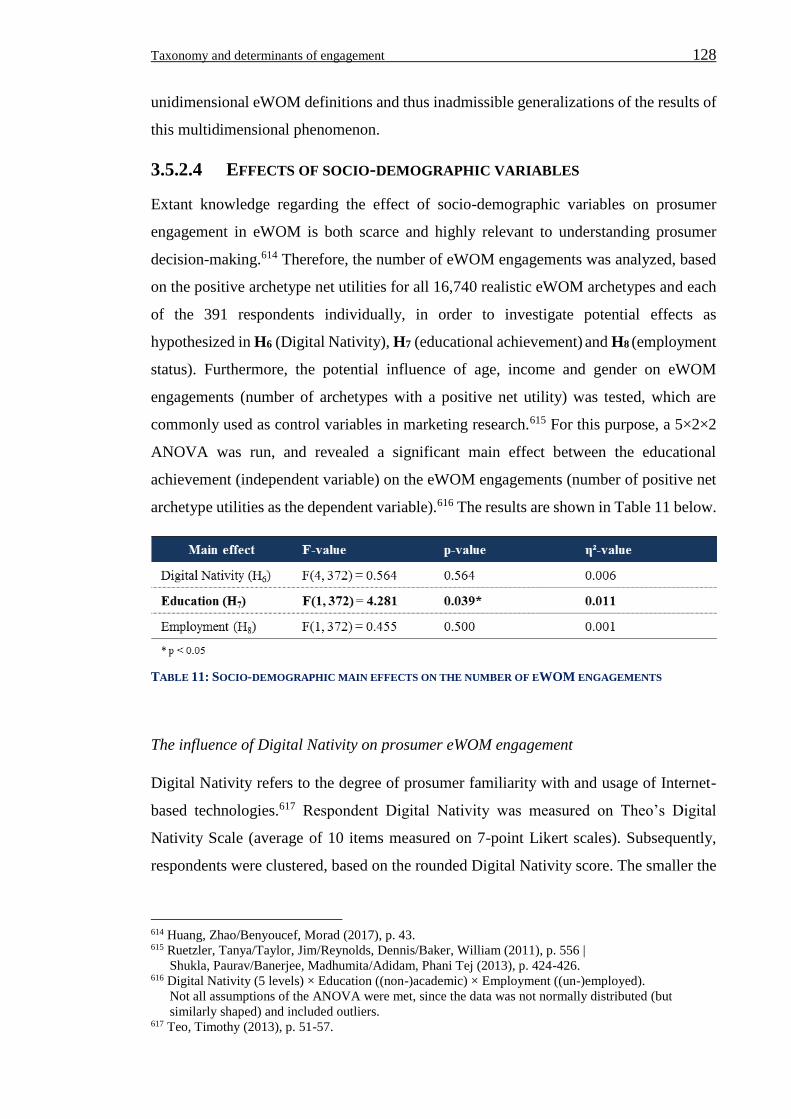
Taxonomy and determinants of engagement 128
unidimensional eWOM definitions and thus inadmissible generalizations of the results of
this multidimensional phenomenon.
3.5.2.4 EFFECTS OF SOCIO-DEMOGRAPHIC VARIABLES
Extant knowledge regarding the effect of socio-demographic variables on prosumer
engagement in eWOM is both scarce and highly relevant to understanding prosumer
decision-making.614 Therefore, the number of eWOM engagements was analyzed, based
on the positive archetype net utilities for all 16,740 realistic eWOM archetypes and each
of the 391 respondents individually, in order to investigate potential effects as
hypothesized in H6 (Digital Nativity), H7 (educational achievement) and H8 (employment
status). Furthermore, the potential influence of age, income and gender on eWOM
engagements (number of archetypes with a positive net utility) was tested, which are
commonly used as control variables in marketing research.615 For this purpose, a 5×2×2
ANOVA was run, and revealed a significant main effect between the educational
achievement (independent variable) on the eWOM engagements (number of positive net
archetype utilities as the dependent variable).616 The results are shown in Table 11 below.
TABLE 11: SOCIO-DEMOGRAPHIC MAIN EFFECTS ON THE NUMBER OF EWOM ENGAGEMENTS
The influence of Digital Nativity on prosumer eWOM engagement
Digital Nativity refers to the degree of prosumer familiarity with and usage of Internet-
based technologies.617 Respondent Digital Nativity was measured on Theo’s Digital
Nativity Scale (average of 10 items measured on 7-point Likert scales). Subsequently,
respondents were clustered, based on the rounded Digital Nativity score. The smaller the
614 Huang, Zhao/Benyoucef, Morad (2017), p. 43. 615 Ruetzler, Tanya/Taylor, Jim/Reynolds, Dennis/Baker, William (2011), p. 556 |
Shukla, Paurav/Banerjee, Madhumita/Adidam, Phani Tej (2013), p. 424-426. 616 Digital Nativity (5 levels) × Education ((non-)academic) × Employment ((un-)employed).
Not all assumptions of the ANOVA were met, since the data was not normally distributed (but
similarly shaped) and included outliers. 617 Teo, Timothy (2013), p. 51-57.
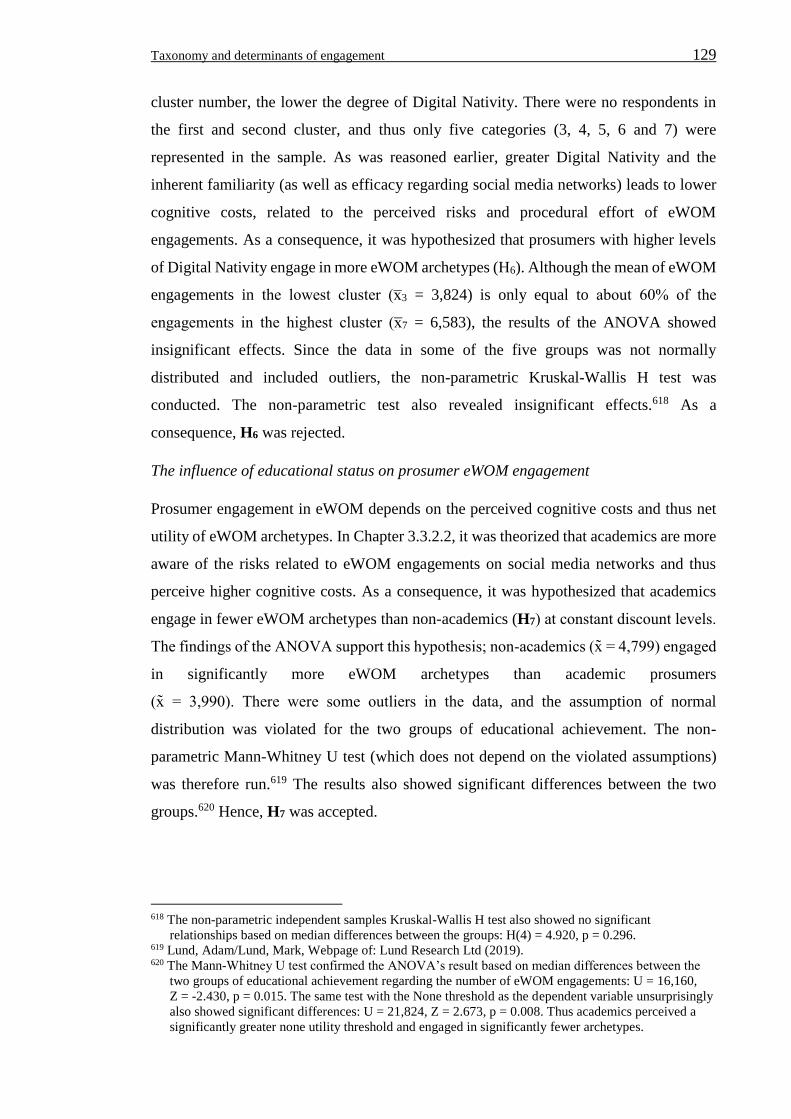
Taxonomy and determinants of engagement 129
cluster number, the lower the degree of Digital Nativity. There were no respondents in
the first and second cluster, and thus only five categories (3, 4, 5, 6 and 7) were
represented in the sample. As was reasoned earlier, greater Digital Nativity and the
inherent familiarity (as well as efficacy regarding social media networks) leads to lower
cognitive costs, related to the perceived risks and procedural effort of eWOM
engagements. As a consequence, it was hypothesized that prosumers with higher levels
of Digital Nativity engage in more eWOM archetypes (H6). Although the mean of eWOM
engagements in the lowest cluster (x̅3 = 3,824) is only equal to about 60% of the
engagements in the highest cluster (x̅7 = 6,583), the results of the ANOVA showed
insignificant effects. Since the data in some of the five groups was not normally
distributed and included outliers, the non-parametric Kruskal-Wallis H test was
conducted. The non-parametric test also revealed insignificant effects.618 As a
consequence, H6 was rejected.
The influence of educational status on prosumer eWOM engagement
Prosumer engagement in eWOM depends on the perceived cognitive costs and thus net
utility of eWOM archetypes. In Chapter 3.3.2.2, it was theorized that academics are more
aware of the risks related to eWOM engagements on social media networks and thus
perceive higher cognitive costs. As a consequence, it was hypothesized that academics
engage in fewer eWOM archetypes than non-academics (H7) at constant discount levels.
The findings of the ANOVA support this hypothesis; non-academics (x̃ = 4,799) engaged
in significantly more eWOM archetypes than academic prosumers
(x̃ = 3,990). There were some outliers in the data, and the assumption of normal
distribution was violated for the two groups of educational achievement. The non-
parametric Mann-Whitney U test (which does not depend on the violated assumptions)
was therefore run.619 The results also showed significant differences between the two
groups.620 Hence, H7 was accepted.
618 The non-parametric independent samples Kruskal-Wallis H test also showed no significant
relationships based on median differences between the groups: H(4) = 4.920, p = 0.296. 619 Lund, Adam/Lund, Mark, Webpage of: Lund Research Ltd (2019). 620 The Mann-Whitney U test confirmed the ANOVA’s result based on median differences between the
two groups of educational achievement regarding the number of eWOM engagements: U = 16,160, Z = -2.430, p = 0.015. The same test with the None threshold as the dependent variable unsurprisingly
also showed significant differences: U = 21,824, Z = 2.673, p = 0.008. Thus academics perceived a
significantly greater none utility threshold and engaged in significantly fewer archetypes.
Taxonomy and determinants of engagement 130
The influence of professional status on prosumer eWOM engagement
The perceived risk of negative reactions from colleagues in response to eWOM
engagements adds cognitive costs to the decision-making process of employed versus
unemployed prosumers. Therefore, it was hypothesized that employed prosumers engage
in fewer eWOM archetypes than unemployed prosumers. However, as reported in Table
11, the main effect of employment status on eWOM engagements was insignificant. A
non-parametric verification of the results (Mann-Whitney U test) also revealed
insignificant effects.621 Thus, the H8 is rejected.
Moreover, drawing on a 2×6×7 ANOVA,622 the additional socio-demographic control
variables gender: F(1, 329) = 1.334, p = 0.249, η² = 0.004), age: (F(5, 329) = 1.466,
p = 0.200, η² = 0.022) and income: (F(6, 329) = 3.067, p = 0.513, η² = 0.016) showed no
significant effect on the number of eWOM engagements.
3.5.2.5 QUALITY EVALUATION OF THE ACBC
The quality of ACBC studies with Hierarchical Bayes estimation of part-worth utilities is
assessed using the re-test reliability of prosumer choices and the predictive validity of the
estimation model.623 For this purpose, six holdout cards were included in a further,
subsequent conjoint design following the ACBC. Two holdout cards were repetitive, with
equal choice options in a different order to assess re-test reliability. In line with the design
of the choice tournament in the ACBC, each hold out card included three choice options.
The re-test reliability (𝜔) of prosumer choices was very high, with 95.652% reliable
choices, indicating good quality data and stability in prosumer preferences. Prosumer
choices within the holdout cards (not included in the part-worth utility estimation) were
predicted, based on the estimated part-worth utilities and assumption of utility
maximizing behavior.624 One holdout card was excluded from the prediction, since the
two preferred options coincidently had quasi-equal utilities, which means that the fixed
choice tasks did not discriminate from a prosumer perspective.625 The hit rate by pure
621 The distributions of the eWOM engagements of employed and unemployed prosumers was similar
with insignificant differences between the medians as assessed by a Mann-Whitney U test:
U = 15,907, Z = 0.197, p = 0.843 | Lund, Adam/Lund, Mark, Webpage of: Lund Research Ltd (2019). 622 Some assumptions of the ANOVA were violated, so non-parametric tests were run which confirmed
the results regarding the insignificance of effects. 623 Bauer, Robert/Menrad, Klaus/Decker, Thomas (2015), p. 6-7. 624 Ibid., p. 7. 625 The two preferred concepts had a marginal difference of 3 utility points at a mean difference of 216
utility points between the two preferred concepts in the other hold-out cards. Since the respondents
decide quickly in experimental designs, the concepts in one hold-out card did not discriminate.
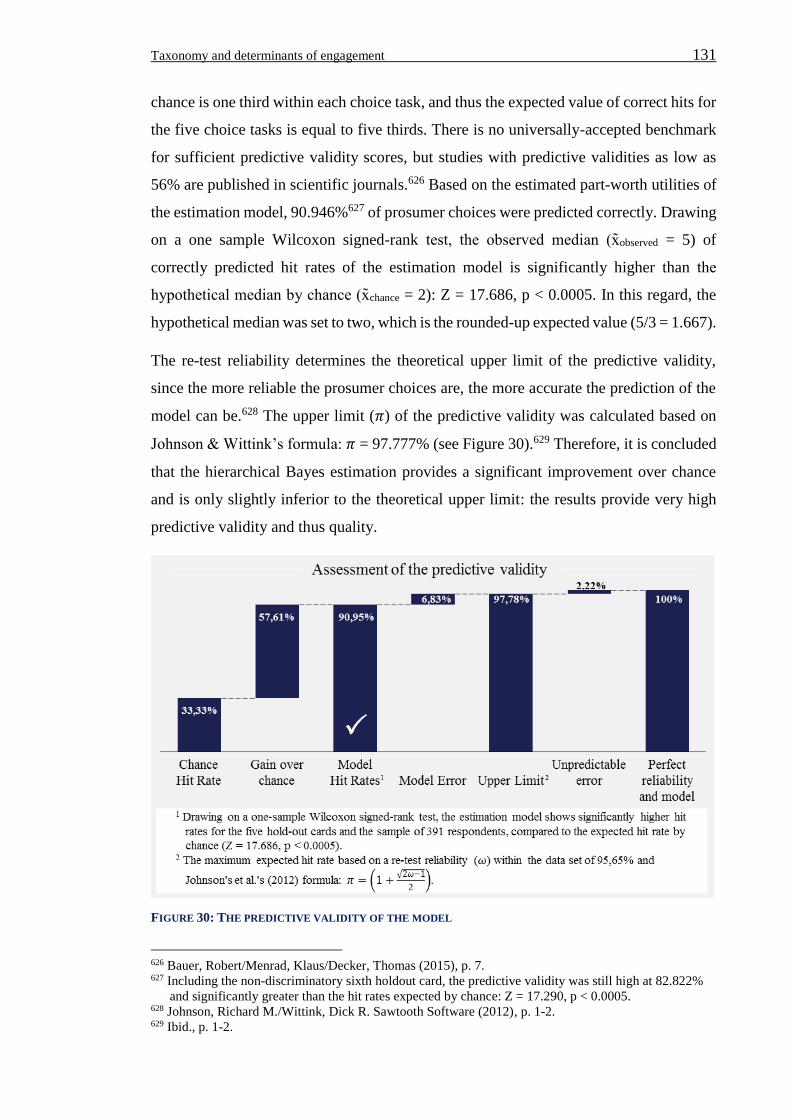
Taxonomy and determinants of engagement 131
chance is one third within each choice task, and thus the expected value of correct hits for
the five choice tasks is equal to five thirds. There is no universally-accepted benchmark
for sufficient predictive validity scores, but studies with predictive validities as low as
56% are published in scientific journals.626 Based on the estimated part-worth utilities of
the estimation model, 90.946%627 of prosumer choices were predicted correctly. Drawing
on a one sample Wilcoxon signed-rank test, the observed median (x̃observed = 5) of
correctly predicted hit rates of the estimation model is significantly higher than the
hypothetical median by chance (x̃chance = 2): Z = 17.686, p < 0.0005. In this regard, the
hypothetical median was set to two, which is the rounded-up expected value (5/3 = 1.667).
The re-test reliability determines the theoretical upper limit of the predictive validity,
since the more reliable the prosumer choices are, the more accurate the prediction of the
model can be.628 The upper limit (𝜋) of the predictive validity was calculated based on
Johnson & Wittink’s formula: 𝜋 = 97.777% (see Figure 30).629 Therefore, it is concluded
that the hierarchical Bayes estimation provides a significant improvement over chance
and is only slightly inferior to the theoretical upper limit: the results provide very high
predictive validity and thus quality.
FIGURE 30: THE PREDICTIVE VALIDITY OF THE MODEL
626 Bauer, Robert/Menrad, Klaus/Decker, Thomas (2015), p. 7. 627 Including the non-discriminatory sixth holdout card, the predictive validity was still high at 82.822%
and significantly greater than the hit rates expected by chance: Z = 17.290, p < 0.0005. 628 Johnson, Richard M./Wittink, Dick R. Sawtooth Software (2012), p. 1-2. 629 Ibid., p. 1-2.
Taxonomy and determinants of engagement 132
3.5.3 POST-STUDY: THE PROSUMERS’ PREFERENCES FOR PRODUCT
TYPES
3.5.3.1 CONCEPTUAL FOUNDATIONS AND RESEARCH DESIGN
In the previous study (see Chapter 3.5.1) the attribute ‘product category’ was binary
differentiated (hedonic and utilitarian products) and is thus in line with the empirical
taxonomy, but neglected potential differences between hedonic and utilitarian products.
To address this limitation and thus create a more profound understanding of the effect of
product categories on prosumer eWOM engagement, two objectives for this
complementary post-study were defined. First, the findings of the second study regarding
prosumer preference for sharing hedonic rather than utilitarian products needed to be re-
tested, based on a different prosumer sample and novel research design. This strengthens
the generalizability of the previous results by proving the reliability of the findings in a
different research setting. Specifically, whether the prosumers prefer to share eWOM
about hedonic over utilitarian products was tested (H3). In this study, Golan et al.’s more
nuanced differentiation of product categories (‘product types’ henceforward, to avoid
inconsistent definitions) was used to receive multiple values and thus more robust data
for each product category.630 Prosumer ‘Willingness to Share’ (WTS) was the dependent
variable, and was measured based on Mishra et al.’s adapted scale.631 Secondly, the
potential differences between product types (e.g. entertainment media versus alcohol and
cigarettes in the cluster of hedonic products) depict a lacunae in extant literature and
needed to be explored. The approach thus allowed the closing of the current research gap
regarding prosumer preference for specific product types, which complements the
previous findings of the main studies presented earlier in Chapter 3.
With respect to the first research objective (replicative research design), the binary coded
product category represented the independent variable in the research design.
Second, the more differentiated product types were the independent variables for the
complementary research question about the effect of the hedonic and utilitarian product
types on prosumer WTS.
In line with the occurrence of eWOM in an online environment, the empirical study was
conducted as a web-based survey. All twelve product types of Golan’s differentiation
were included in the survey in a randomized order, to mitigate item order effects. The
630 Golan, Guy J./Zaidner, Lior (2008), p. 969. 631 Mishra, Anubhav/Maheswarappa, Satish S./Maity, Moutusy/Samu, Sridhar (2018), p. 483.
Taxonomy and determinants of engagement 133
following product types were placed under the hedonic product category: entertainment,
alcohol and cigarettes, travel, fashion, foods and beverages, and social events.
Pharmaceutical, insurance and banking products, as well as consumer products (priming
on tooth paste), were placed under utilitarian products. Electronic devices, interior
equipment and automotive products were not assigned to either of the two clusters,
because the product types were assumed to provide a balanced ratio of hedonic and
utilitarian value. Although the clustering in the two product categories was derived from
extant literature, it was still somewhat arbitrary. Therefore, a more specific hedonic or
utilitarian product example was used in the survey, to emphasize the hedonic or utilitarian
value of each product type.
Furthermore, the respondents were primed on one consistent eWOM archetype that only
differed by the product types in order to reduce the ambiguity of the experimental setting
and strengthen the content validity of the design. In order to mitigate biases from between-
group differences, each respondent was tested under each condition in a within-subjects
design. A representative sample size of around 384 respondents was striven for, with
authentic, heterogeneous socio-demographic segments (gender, age, education and
employment status) to gather a valid data sample regarding the German target
population.632
3.5.3.2 ANALYSES AND RESULTS
In cooperation with the panel provider Consumerfieldwork GmbH, a sample of 600
unique responses was gathered in November 2018. Due to a poor response quality
according to the respondents’ self-reporting, unrealistic survey times and straight lining
across all items, 169 respondents were excluded. The remaining 431 respondents
nonetheless form a representative sample size of the target population (52% female |
x̅Age = 40.05, σAge = 13.44 | 26% academics).
Drawing on the gathered data base, the replication hypothesis (see H3) about prosumer
preference for sharing hedonic over utilitarian product categories was first tested.
Running a paired-samples t-test, the prosumer consistently stated a significantly higher
willingness to share eWOM for hedonic over utilitarian products: t(430) = 27.011,
p < 0.0005, d = 1.301. Since the data was not normally distributed and due to outliers, the
632 See Chapter 4.5.1.5 for a more detailed development of the required qualitative and quantitative
characteristics of a representative sample for the prosumer target group.
Taxonomy and determinants of engagement 134
results were validated based on the non-parametric Friedman test, which confirmed the
previous results.633 The replication was thus methodologically valid and successful.
Next, the differences within each product category were explored based on the assigned
product types. Starting with the cluster of the hedonic product types, an ANOVA revealed
a large and highly significant effect of the product type on the WTS: F(4.428, 1,904.160)=
277.790, p < 0.0005, η² = 0.392. Since the assumption of sphericity was not met, the
Huynh-Feldt’s (ε = 0.886) correction was used. Drawing on a Bonferroni corrected post-
hoc test, all pairwise comparisons were highly significant (p < 0.0005) except for two
pairwise comparisons: (1) social events (x̅ = 3.69) and entertainment (x̅ = 3.59) and (2)
travel (x̅ = 3.31) and food and beverages (3.32).634 The WTS for the product types fashion
(x̅ = 2.97) as well as alcohol and cigarettes (x̅ = 1.67) were significantly different to all
other hedonic product types. Due to the existence of outliers in the sample, the tests were
repeated based on the robust Friedman Test, which confirmed the significant main effect
(χ2(5) = 756.499, p < 0.0005, Kendall’s W = 0.351) and pairwise comparisons (all
previously significant effects p < 0.05, the two non-significant comparisons p > 0.1).
The findings are in line with Social Exchange and Self-Discrepancy theories, which
explain selective sharing intentions and behavior on social media networks. Specifically,
people seek to curate a digital persona that reflects their different selves and displays
favorable personal traits to their peers in order to be associated with those traits in real-
life.635 Referring to product categories and types, certain traits are linked to certain
product types. Hedonic products are by definition associated with the characteristics of
fun, pleasure and enjoyment that eWOM senders use to cue such characteristics about
themselves.636 For instance, sharing content about travel products transports the message
of being out-going and culturally experienced. Considering the significant differences
within the hedonic product categories, prosumers prefer certain cues, such as being social.
Drawing on the statistical results, entertainment and social products were the prosumers’
preferred product types. Entertainment products like films and music provide prosumers
with social utility, because they allow them to serve other ideal, own ideal and actual-self
motives in social media self-curation, by showing an entertaining lifestyle and potential
633 The willingness to share was again significantly different with a large effect size:
(x̃Hedonic = 3.167 | x̃Utilitarian = 2.000): χ2(1) = 306.612, p < 0.0005, d = 1.301. 634 See Appendix A9 for the details. 635 Hogan, Bernie (2010), p. 380-385 | Chua, Trudy Hui Hui/Chang, Leanne (2016), p. 191-192. 636 Lu, Jingyi/Liu, Zhengyan, Fang, Zhe (2016), p. 332.
Taxonomy and determinants of engagement 135
personality.637 Furthermore, sharing non-profit products and social events is a means to
cue the favored character trait of altruism and allows people to avoid the cognitive costs
of guilt for turning down help, serving the human ‘need to help’.638 The findings therefore
indicated that prosumers value the cues of being entertaining as well as social the most,
and managers in these respective industries have the greatest chance to elicit eWOM
engagements.
Similarly, the second most preferred cluster of the product types travel, food and
beverages provide social value, because they are a means to cue favorable traits like being
outgoing and having access to enjoyable activities or e.g. a healthy and nutritious diet
(“you are what you tweet”639).640
Fashion was the third most-preferred product type for eWOM engagements, but seemed
not to provide an equal level of utility, since prosumers were less willing to share such
content.
By contrast, alcohol and cigarettes were clearly hedonic products, yet they also showed
an unhealthy lifestyle and held the risk of being perceived as inappropriate by peers on
the network.641 Thus, in comparison to the other hedonic product types, alcohol and
cigarettes seemed to create additional cognitive costs rather than benefits, which led to
the low WTS levels.642
Prosumer preferences regarding utilitarian products
Regarding the utilitarian product category, significant differences between the three
product types were also found: F(1.967, 845.867) = 87.199, p < 0.0005, η² = 0.169. Since
the assumption of sphericity was not met, Huynh-Feldt’s (ε = 0.984) correction was
applied for the repeated measurers ANOVA. Drawing on a Bonferroni-corrected post-
hoc test, the pairwise comparison between utilitarian consumer products (x̅ = 2.52) and
banking and insurance products (x̅ = 1.900), as well as between consumer products and
pharmaceutical products (x̅ = 1.998), was highly significant (p < 0.0005). Due to
derivations from a normal distribution in the data, the results were re-tested based on the
637 Johnson, Benjamin K./Ranzini, Giulia (2018), p. 148. 638 Guy, Bonnie S. (1988), p. 11-14 | Aaker, Jennifer L./Akutsu, Satoshi (2009), p. 267-270. 639 Rousseau, Signe (2012), p. 1-118. 640 Lowe-Calverley, Emily/Grieve, Rachel (2018), p. 1905. 641 Bagdare, Shilpa/Jain, Rajnish (2013), p. 163-164. 642 In this regard, the influence of prosumer alcohol and cigarette consumption on their respective
willingness to share eWOM could be investigated in the future, since this potential moderator effect
was not controlled within this study.
Taxonomy and determinants of engagement 136
Friedman test, which confirmed the significant main effect (χ2(2) = 157.415, p < 0.0005,
Kendall’s W = 0.183) and pairwise comparisons (all previously significant effects
p < 0.0005, the two other comparisons remained not significant p > 0.1).
3.5.4 SYNTHESIS AND DISCUSSION
The purpose of this main and post-study was to investigate the (1) importance of the
eWOM inherent decision attributes, (2) prosumer preference for specific attribute levels,
(3) level interactions and (4) the effects socio-demographic variables regarding prosumer
engagement in eWOM archetypes.
In summary, eight previously-explored attributes determine archetype utility and thus
prosumer engagement in eWOM, with varying degrees of importance: peer discount
(4.8%), degree of self-disclosure (8.6%), product category (9.2%), media type (11.7%),
purchase value (12.4%), network channel (12.9%), attitude towards content (15.2%), and
discount value (25.2%).
In line with Social Exchange Theory and the eWOM taxonomy, the positive None
threshold utility value revealed that utility-motivated prosumers generally perceive
cognitive effort for eWOM engagements that needs to be compensated with sufficient
archetype utility to elicit the engagement choice over the status quo of no engagement.
Prosumer preference for attribute levels manifest itself in the varying part-worth utilities
within each attribute. The discount value is the most important eWOM attribute in
prosumer decision-making. As hypothesized, prosumers prefer discounts for themselves
rather than for their peers (H1) and prefer to engage in eWOM with higher discount rather
than lower levels (H2), on hedonic compared to utilitarian networks (H3), with lower
degrees of self-disclosure (H4) and with a matching primary purpose of network channel
(hedonic/utilitarian) to the product category (hedonic/utilitarian) (H5). Regarding the
attribute ‘product category’, significant differences between the specific hedonic and
utilitarian product types were found. The prosumers stated the greatest WTS levels for
the hedonic product types: social events, entertainment, travel and food products. All the
WTS levels of the three utilitarian product types were relatively low, potentially due to
the lower social benefits of the immanent cues.
Non-academic prosumers engaged in significantly more eWOM archetypes than
academic prosumers (H7). The degree of Digital Nativity and employment status of the
Taxonomy and determinants of engagement 137
respondents did not significantly affect the number of prosumer eWOM engagements,
measured as eWOM archetypes with a positive net utility (H6&8).
From a managerial perspective, the insights hold a number of important implications.
First, managers can in fact increase the utility of their eWOM designs by including a
discount, and thus increase the likelihood of prosumer eWOM engagement. Additional
discounts for prosumer networks are of little importance, and can even have a negative
effect on the prosumer’s utility perception of the eWOM offer. Academics are a more
difficult target group for eWOM engagements due to higher thresholds for eWOM
engagement, and thus require greater monetary incentives to motivate such behavior.
Facebook is the most lucrative channel for eWOM campaigns, since it was both the
prosumers’ preferred (‘cheapest’) network channel and provides social media marketing
managers with the greatest peer-to-peer reach (high value), since prosumers indicated the
greatest number of peer contacts on this network. The managerial implications of the
findings are elaborated in Chapter 5.1.
Limitations and future research
With respect to this study, a number of limitations have to be acknowledged.
Although all the respondents indicated the usage of at least one hedonic and one utilitarian
network, it is likely that not all the respondents used all five network channels equally in
the study. This increased the hypothetical bias for unused network channels and thus was
a limitation of the study. To mitigate the bias, a concise description of each network and
the network’s logo were presented at the beginning of the survey, so all respondents were
aware of the distinct characteristics of each network and could recall real-life experiences
with the networks, e.g. through witnessing a friends’ use of the network.
Since prosumers make engagement choices based on their individual utility perceptions,
the prosumers’ eWOM engagement (dependent variable) was operationalized in the main
study as the number of eWOM archetypes with a higher utility than the individual utility
perception of the None threshold. However, this approach did not reflect actual eWOM
engagements in social commerce exchanges and neither did the measurement of prosumer
WTS levels to share distinct product types in the post-study: the experimental settings
and operationalizations of the phenomenon were therefore limited in regards to the
external validity. Future studies should draw on field tests or market data to mitigate this
limitation.
Taxonomy and determinants of engagement 138
Besides the eWOM attributes and socio-demographic characteristics researched,
individual factors like self-esteem643 and cultural orientation644 influence prosumer
eWOM engagement. The exclusion of these factors limits the external validity of the
results. They should therefore be controlled for in future research.
Moreover, humor in advertisements affects prosumer attitudes and thus, presumably, the
prosumer attitude towards the eWOM archetype of the advertisement.645 However, the
variable ‘attitude towards content’ was only differentiated in the study for the three levels:
a positive, a neutral or a negative overall attitude. This differentiation is in line with
Wood’s differentiation, and serves the purpose of investigating the research questions one
to three,646 but is too superficial to cover the emotional factor of humor in the design of
eWOM messages.
Humor likely affects the utility of eWOM designs, since it has been repeatedly found in
FreeWOM: prosumers perceived a positive net utility for the eWOM engagement without
any monetary incentives, although the latter depicts the most important attribute of
prosumer eWOM choices. One reason for this observation might lay in the perceived
benefits of self-curation of digital personas with the favorable personality trait of being
humorous.
To investigate if and explain how humor affects the required monetary incentive levels to
elicit prosumer eWOM engagements, further research is required. The investigation of
humor as a design element of eWOM messages is therefore the missing piece to explain
prosumer (Fre-)eWOM engagement comprehensively and it is the subject of the
subsequent empirical study presented in Chapter 4.
643 Mishra, Anubhav/Maheswarappa, Satish S./Maity, Moutusy/Samu, Sridhar (2018), p. 477-478. 644 Chu, Shu-Chuan (2009), p. 88. 645 Eisend, Martin (2009), p. 197-199. 646 Wood, Wendy (2000), p. 540-560 | Reich-Stiebert, Natalia/Eyssel, Friederike/Hohnemann, Charlotte (2018), p. 291.
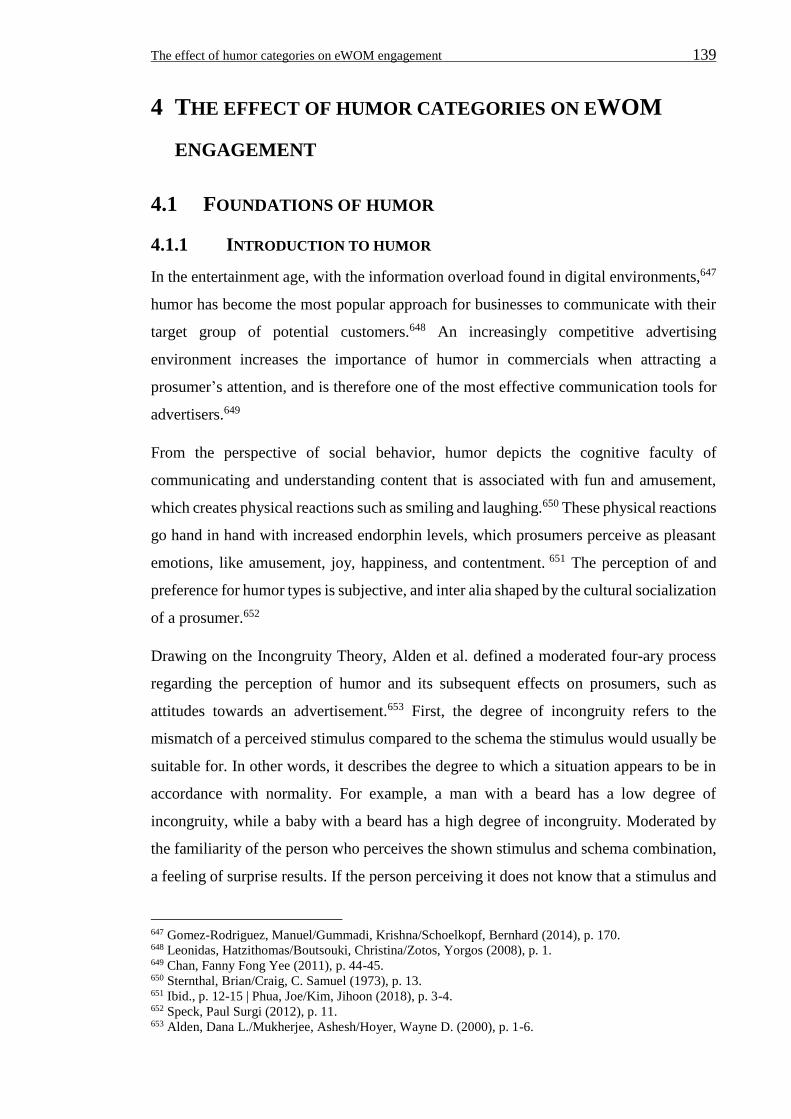
The effect of humor categories on eWOM engagement 139
4 THE EFFECT OF HUMOR CATEGORIES ON EWOM
ENGAGEMENT
4.1 FOUNDATIONS OF HUMOR
4.1.1 INTRODUCTION TO HUMOR
In the entertainment age, with the information overload found in digital environments,647
humor has become the most popular approach for businesses to communicate with their
target group of potential customers.648 An increasingly competitive advertising
environment increases the importance of humor in commercials when attracting a
prosumer’s attention, and is therefore one of the most effective communication tools for
advertisers.649
From the perspective of social behavior, humor depicts the cognitive faculty of
communicating and understanding content that is associated with fun and amusement,
which creates physical reactions such as smiling and laughing.650 These physical reactions
go hand in hand with increased endorphin levels, which prosumers perceive as pleasant
emotions, like amusement, joy, happiness, and contentment. 651 The perception of and
preference for humor types is subjective, and inter alia shaped by the cultural socialization
of a prosumer.652
Drawing on the Incongruity Theory, Alden et al. defined a moderated four-ary process
regarding the perception of humor and its subsequent effects on prosumers, such as
attitudes towards an advertisement.653 First, the degree of incongruity refers to the
mismatch of a perceived stimulus compared to the schema the stimulus would usually be
suitable for. In other words, it describes the degree to which a situation appears to be in
accordance with normality. For example, a man with a beard has a low degree of
incongruity, while a baby with a beard has a high degree of incongruity. Moderated by
the familiarity of the person who perceives the shown stimulus and schema combination,
a feeling of surprise results. If the person perceiving it does not know that a stimulus and
647 Gomez-Rodriguez, Manuel/Gummadi, Krishna/Schoelkopf, Bernhard (2014), p. 170. 648 Leonidas, Hatzithomas/Boutsouki, Christina/Zotos, Yorgos (2008), p. 1. 649 Chan, Fanny Fong Yee (2011), p. 44-45. 650 Sternthal, Brian/Craig, C. Samuel (1973), p. 13. 651 Ibid., p. 12-15 | Phua, Joe/Kim, Jihoon (2018), p. 3-4. 652 Speck, Paul Surgi (2012), p. 11. 653 Alden, Dana L./Mukherjee, Ashesh/Hoyer, Wayne D. (2000), p. 1-6.
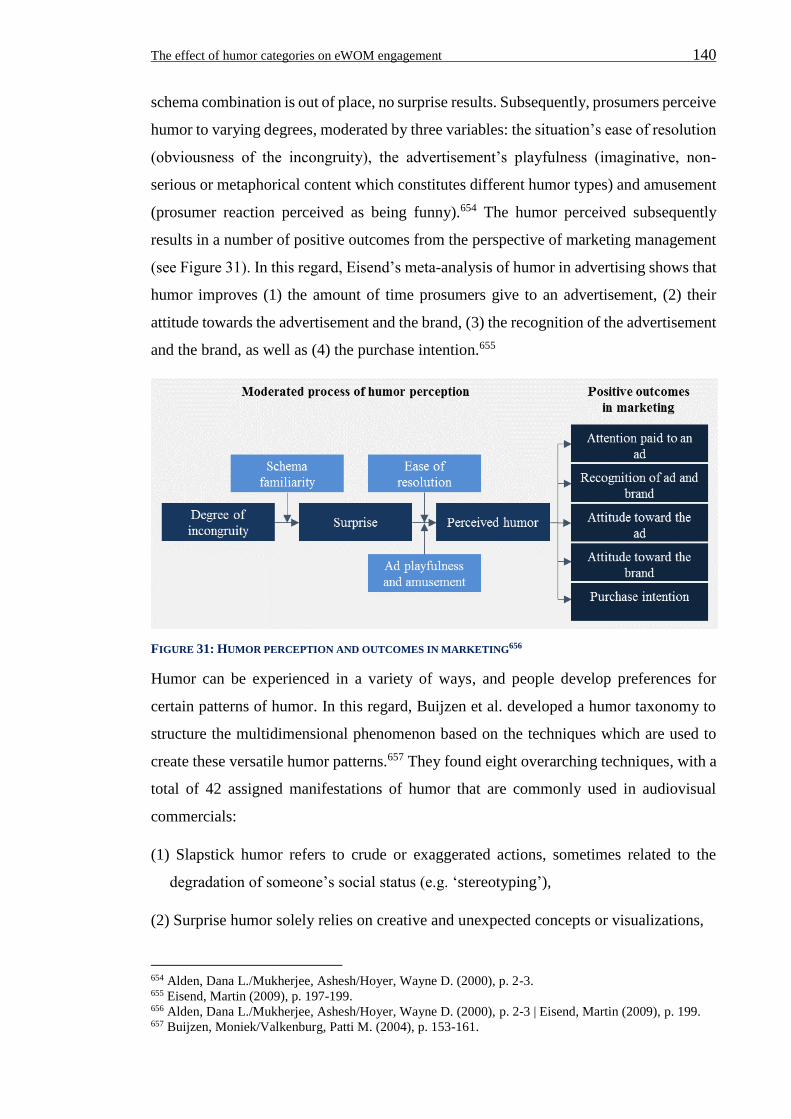
The effect of humor categories on eWOM engagement 140
schema combination is out of place, no surprise results. Subsequently, prosumers perceive
humor to varying degrees, moderated by three variables: the situation’s ease of resolution
(obviousness of the incongruity), the advertisement’s playfulness (imaginative, non-
serious or metaphorical content which constitutes different humor types) and amusement
(prosumer reaction perceived as being funny).654 The humor perceived subsequently
results in a number of positive outcomes from the perspective of marketing management
(see Figure 31). In this regard, Eisend’s meta-analysis of humor in advertising shows that
humor improves (1) the amount of time prosumers give to an advertisement, (2) their
attitude towards the advertisement and the brand, (3) the recognition of the advertisement
and the brand, as well as (4) the purchase intention.655
FIGURE 31: HUMOR PERCEPTION AND OUTCOMES IN MARKETING656
Humor can be experienced in a variety of ways, and people develop preferences for
certain patterns of humor. In this regard, Buijzen et al. developed a humor taxonomy to
structure the multidimensional phenomenon based on the techniques which are used to
create these versatile humor patterns.657 They found eight overarching techniques, with a
total of 42 assigned manifestations of humor that are commonly used in audiovisual
commercials:
(1) Slapstick humor refers to crude or exaggerated actions, sometimes related to the
degradation of someone’s social status (e.g. ‘stereotyping’),
(2) Surprise humor solely relies on creative and unexpected concepts or visualizations,
654 Alden, Dana L./Mukherjee, Ashesh/Hoyer, Wayne D. (2000), p. 2-3. 655 Eisend, Martin (2009), p. 197-199. 656 Alden, Dana L./Mukherjee, Ashesh/Hoyer, Wayne D. (2000), p. 2-3 | Eisend, Martin (2009), p. 199. 657 Buijzen, Moniek/Valkenburg, Patti M. (2004), p. 153-161.
The effect of humor categories on eWOM engagement 141
(3) Ironic humor includes puns and statements that were meant in the opposite way they
were said,
(4) Clownish humor refers to clumsy and exaggerated physical behavior,
(5) Satirical humor is making a fool of public figures or showing irreverent behavior,
(6) Misunderstandings include an ignorance or peculiar sounds which are inappropriate
for a situation,
(7) Parodies are the imitation of styles and absurd interpretations of such,
(8) The miscellaneous technique cluster includes sexual allusions (the most popular
category).658
Humor and its associated positive emotions can regularly be seen in popular
advertisements.659 Some campaigns are specifically tailored to go viral, i.e. gain extensive
reach and interaction through prosumer likes and shares due to the humorous content.660
For instance, Edeka’s advertisement “Iss wie der, der du sein willst - #issso”, which tells
the humorous story of the fictitious character Eatkarus, currently has 546,555 shares and
more than 45 million views on Facebook.661
In most marketing research, humor is used as a unidimensional construct, without
considering humor categories.662 Nevertheless, a few researchers emphasize the evidence
that humor is a multidimensional construct which requires a differentiated
operationalization.663 Drawing on Buijzen et al.’s taxonomy and Beard’s categorization,
humor techniques are therefore further differentiated into warm and offensive humor
categories.664 This is especially important with regards to social commerce and eWOM,
since although prosumers might find two advertisements humorous, their sharing and
liking behavior could differ.665
Based on extant literature, two potentially offensive humor categories are distinguished
between in this study. The use of stereotypes in humor, e.g., related to gender (sexist
658 Buijzen, Moniek/Valkenburg, Patti M. (2004), p. 153-161. 659 Borges-Tiago, Maria Teresa/Tiago, Flavio/Cosme, Carla (2018), p. 3. 660 Lowe-Calverley, Emily/Grieve, Rachel (2018), p. 1906. 661 EDEKA, Webpage of: EDEKA on Facebook (2017). (“Eat like the person you want to become”) 662 Speck, Paul Surgi (2012), p. 3-4. 663 Lee, Seung Hwan/Brandt, Alan/Groff, Yuni/Lopez, Alyssa/Neavin, Tyler (2017), p. 77-79. 664 Beard, Fred K. (2008), p. 2-4 | Buijzen, Moniek/Valkenburg, Patti M. (2004), p. 153-161. 665 Zarco, Timothy H. (2015), p. 82.
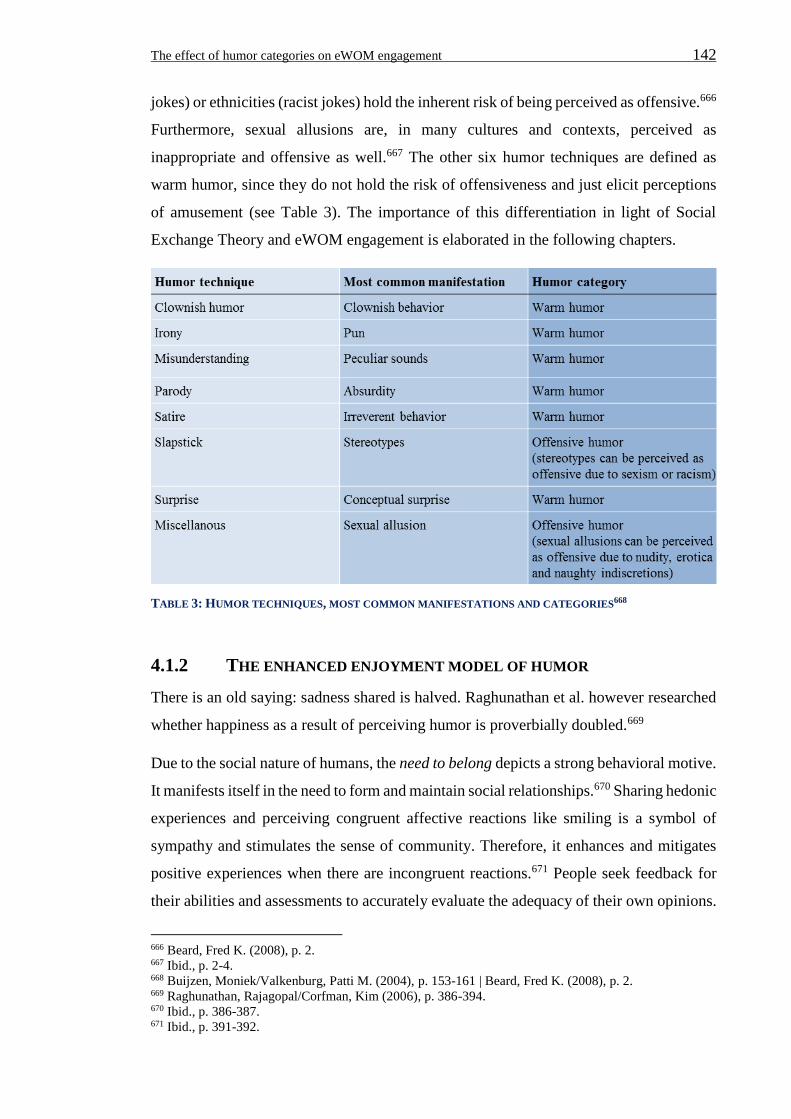
The effect of humor categories on eWOM engagement 142
jokes) or ethnicities (racist jokes) hold the inherent risk of being perceived as offensive.666
Furthermore, sexual allusions are, in many cultures and contexts, perceived as
inappropriate and offensive as well.667 The other six humor techniques are defined as
warm humor, since they do not hold the risk of offensiveness and just elicit perceptions
of amusement (see Table 3). The importance of this differentiation in light of Social
Exchange Theory and eWOM engagement is elaborated in the following chapters.
TABLE 3: HUMOR TECHNIQUES, MOST COMMON MANIFESTATIONS AND CATEGORIES668
4.1.2 THE ENHANCED ENJOYMENT MODEL OF HUMOR
There is an old saying: sadness shared is halved. Raghunathan et al. however researched
whether happiness as a result of perceiving humor is proverbially doubled.669
Due to the social nature of humans, the need to belong depicts a strong behavioral motive.
It manifests itself in the need to form and maintain social relationships.670 Sharing hedonic
experiences and perceiving congruent affective reactions like smiling is a symbol of
sympathy and stimulates the sense of community. Therefore, it enhances and mitigates
positive experiences when there are incongruent reactions.671 People seek feedback for
their abilities and assessments to accurately evaluate the adequacy of their own opinions.
666 Beard, Fred K. (2008), p. 2. 667 Ibid., p. 2-4. 668 Buijzen, Moniek/Valkenburg, Patti M. (2004), p. 153-161 | Beard, Fred K. (2008), p. 2. 669 Raghunathan, Rajagopal/Corfman, Kim (2006), p. 386-394. 670 Ibid., p. 386-387. 671 Ibid., p. 391-392.
The effect of humor categories on eWOM engagement 143
Raghunathan et al. call this the human need for accuracy.672 In the context of humor,
people validate their perceptions of funniness by observing peer reactions. In case of a
joint positive experience, the peers’ affective reactions, like laughing, increase confidence
in their own assessment and allow for a fuller engagement in the seemingly, socially
appropriate behavior. As it turns out in their empirical study, sharing and perceiving
congruent happiness enhances positive experiences, while shared but incongruent
happiness mitigates positive experiences.673 The mediating role of (1) the need to belong
and (2) the need for accuracy regarding the enjoyment of shared experiences is named the
enhanced enjoyment model of humor.674
Since similar humor is one of the most important factors of social bonding and stable
friendships,675 it is likely that humorous content shared on social media networks of
friends and family causes congruent reactions in the form of likes, shares, and comments.
Fu et al. call this phenomenon on Facebook ‘group joy’, and describe it as a communal
incentive to engage in humorous content on social media networks.676
4.2 STATE OF HUMOR RESEARCH IN LIGHT OF EWOM
ENGAGEMENT
4.2.1 APPROACH TO AND CONDUCT OF LITERATURE REVIEW II
The second systematic literature review consistently follows Cooper’s and Randolph’s
procedure and Webster’s augmented literature matrix, in order to visualize and evaluate
the extant knowledge about the effect of humor on eWOM engagement.677
(1) Problem formulation and key variables
Extrinsic rewards are important determinants for prosumer engagement in eWOM.
Nevertheless, in practice, successful viral marketing (FreeWOM) campaigns are regularly
found which do not include such extrinsic incentives, but humorous content. Therefore,
the extent to which knowledge is available regarding the potential effect of humor on
prosumer eWOM engagement needs to be investigated. The key search variables are
672 Raghunathan, Rajagopal/Corfman, Kim (2006), p. 387. 673 Ibid., p. 392-393. 674 Ibid., p. 388. 675 Campbell, Kelly/Holderness, Nicole/Riggs, Matt (2015), p. 244. 676 Fu, Pei-Wen/Wu, Chi-Cheng/Cho, Yung-Jan (2017), p. 26-27. 677 Cooper, Harris M./Patall, Erika A./Lindsay, James J. (2009), p. 349-351 |
Randolph/Justus (2009), p. 4-5 | Webster, Jane/Watson, Richard T. (2002), p. xvi-xvii.
The effect of humor categories on eWOM engagement 144
therefore defined as ‘eWOM’ and ‘viral marketing’ in conjunction with ‘humor’, ‘funny’
and ‘amusement’ (see Chapter 2.2.2 and 4.1.1 for definitions).
(2) Boundaries and procedure of the data collection
The search for peer-reviewed articles and dissertations is conducted on the established
literature aggregators JSTOR, Science Direct, EBSCO and Emerald Insight, with a
temporal restriction to publications between 2004 and 2019. Based on the author-selected
key words, paper title and summary, the intermediate selection of peer-reviewed literature
was created.
(3) Data evaluation and enrichment
The intermediate literature base was evaluated, to extract the most relevant publications
regarding the effect of humorous content on prosumer eWOM engagement. The
systematic literature review was conducted in 2018, but further relevant literature was
added upon finding to keep the review up to date and enrich the knowledge extract, as
well as the interpretation.
(4) Analysis, interpretation, and (5) visualization
The relevant papers are catalogued and analyzed regarding the stated problem. To get a
grasp on extant knowledge about the effect of humor on eWOM engagement, suitable
evaluation criteria were defined and iteratively refined to condense the complex
publication landscape to concise statements about the effect researched.
The first evaluation criteria was the explicit covering of humor in light of eWOM.
Secondly, whether humor is researched as a multidimensional construct was analyzed,
as discussed in the section about the foundations of humor.678 Thirdly, the literature base
was evaluated regarding insights about the effect of humor on eWOM engagement and on
the prosumers WTA levels, which are required to motivate eWOM engagement behavior
in the form of sharing or liking commercial content on social media networks.679 In order
to reduce information complexity, the papers were coded in a binary manner (regarding
the aforementioned evaluation criteria in the respective fields) as : yes and : no,
complemented with clarifying comments. A brief summary of the listed papers’
weaknesses and limitations was stated. The final result is shown in the augmented
literature matrix on the following page.
678 Buijzen, Moniek/Valkenburg, Patti M. (2004), p. 153-161. 679 See empirical study II of this dissertation.
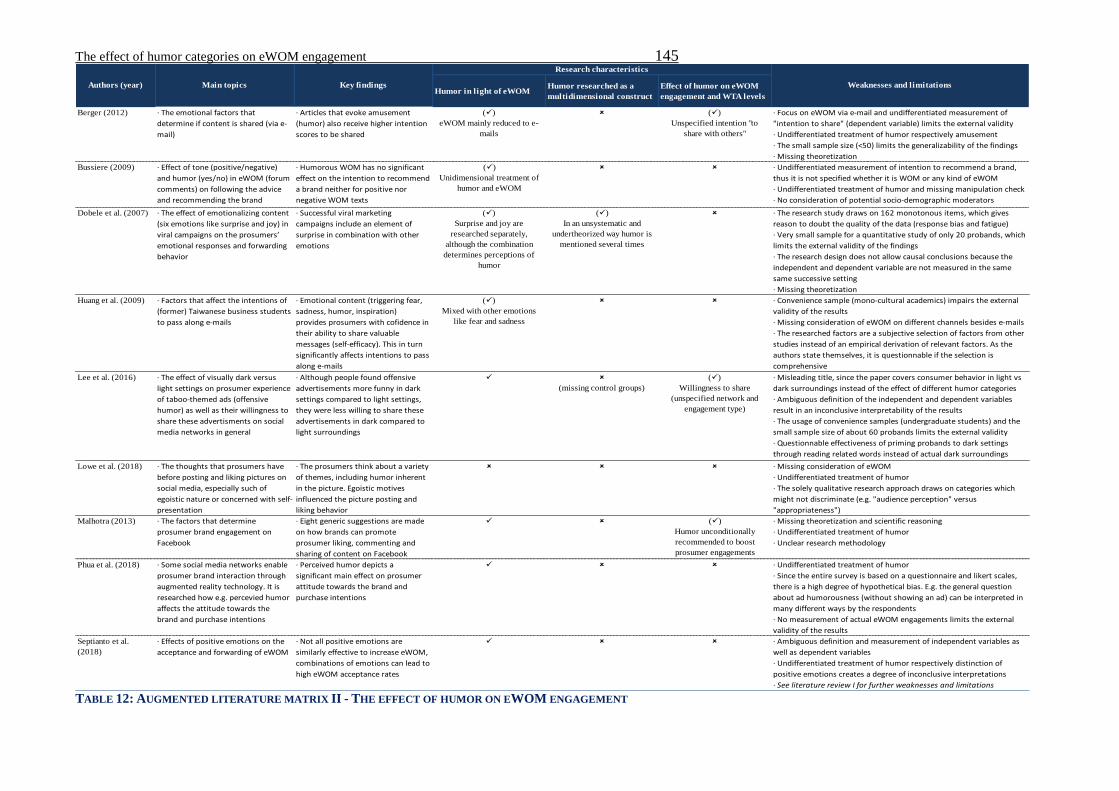
The effect of humor categories on eWOM engagement 145
TABLE 12: AUGMENTED LITERATURE MATRIX II - THE EFFECT OF HUMOR ON EWOM ENGAGEMENT
Humor in light of eWOMHumor researched as a
multidimensional construct
Effect of humor on eWOM
engagement and WTA levels
Berger (2012) ∙ The emotional factors that
determine if content is shared (via e-
mail)
∙ Articles that evoke amusement
(humor) also receive higher intention
scores to be shared
()
eWOM mainly reduced to e-
mails
()
Unspecified intention "to
share with others"
∙ Focus on eWOM via e-mail and undifferentiated measurement of
"intention to share" (dependent variable) limits the external validity
∙ Undifferentiated treatment of humor respectively amusement
∙ The small sample size (<50) limits the generalizability of the findings
∙ Missing theoretization
Bussiere (2009) ∙ Effect of tone (positive/negative)
and humor (yes/no) in eWOM (forum
comments) on following the advice
and recommending the brand
∙ Humorous WOM has no significant
effect on the intention to recommend
a brand neither for positive nor
negative WOM texts
()
Unidimensional treatment of
humor and eWOM
∙ Undifferentiated measurement of intention to recommend a brand,
thus it is not specified whether it is WOM or any kind of eWOM
∙ Undifferentiated treatment of humor and missing manipulation check
∙ No consideration of potential socio-demographic moderators
Dobele et al. (2007) ∙ The effect of emotionalizing content
(six emotions like surprise and joy) in
viral campaigns on the prosumers’
emotional responses and forwarding
behavior
∙ Successful viral marketing
campaigns include an element of
surprise in combination with other
emotions
()
Surprise and joy are
researched separately,
although the combination
determines perceptions of
humor
()
In an unsystematic and
undertheorized way humor is
mentioned several times
∙ The research study draws on 162 monotonous items, which gives
reason to doubt the quality of the data (response bias and fatigue)
∙ Very small sample for a quantitative study of only 20 probands, which
limits the external validity of the findings
∙ The research design does not allow causal conclusions because the
independent and dependent variable are not measured in the same
same successive setting
∙ Missing theoretization
Huang et al. (2009) ∙ Factors that affect the intentions of
(former) Taiwanese business students
to pass along e-mails
∙ Emotional content (triggering fear,
sadness, humor, inspiration)
provides prosumers with cofidence in
their ability to share valuable
messages (self-efficacy). This in turn
significantly affects intentions to pass
along e-mails
()
Mixed with other emotions
like fear and sadness
∙ Convenience sample (mono-cultural academics) impairs the external
validity of the results
∙ Missing consideration of eWOM on different channels besides e-mails
∙ The researched factors are a subjective selection of factors from other
studies instead of an empirical derivation of relevant factors. As the
authors state themselves, it is questionnable if the selection is
comprehensive
Lee et al. (2016) ∙ The effect of visually dark versus
light settings on prosumer experience
of taboo-themed ads (offensive
humor) as well as their willingness to
share these advertisments on social
media networks in general
∙ Although people found offensive
advertisements more funny in dark
settings compared to light settings,
they were less willing to share these
advertisements in dark compared to
light surroundings
(missing control groups)
()
Willingness to share
(unspecified network and
engagement type)
∙ Misleading title, since the paper covers consumer behavior in light vs
dark surroundings instead of the effect of different humor categories
∙ Ambiguous definition of the independent and dependent variables
result in an inconclusive interpretability of the results
∙ The usage of convenience samples (undergraduate students) and the
small sample size of about 60 probands limits the external validity
∙ Questionnable effectiveness of priming probands to dark settings
through reading related words instead of actual dark surroundings
Lowe et al. (2018) ∙ The thoughts that prosumers have
before posting and liking pictures on
social media, especially such of
egoistic nature or concerned with self-
presentation
∙ The prosumers think about a variety
of themes, including humor inherent
in the picture. Egoistic motives
influenced the picture posting and
liking behavior
∙ Missing consideration of eWOM
∙ Undifferentiated treatment of humor
∙ The solely qualitative research approach draws on categories which
might not discriminate (e.g. "audience perception" versus
"appropriateness")
Malhotra (2013) ∙ The factors that determine
prosumer brand engagement on
∙ Eight generic suggestions are made
on how brands can promote
prosumer liking, commenting and
sharing of content on Facebook
()
Humor unconditionally
recommended to boost
prosumer engagements
∙ Missing theoretization and scientific reasoning
∙ Undifferentiated treatment of humor
∙ Unclear research methodology
Phua et al. (2018) ∙ Some social media networks enable
prosumer brand interaction through
augmented reality technology. It is
researched how e.g. percevied humor
affects the attitude towards the
brand and purchase intentions
∙ Perceived humor depicts a
significant main effect on prosumer
attitude towards the brand and
purchase intentions
∙ Undifferentiated treatment of humor
∙ Since the entire survey is based on a questionnaire and likert scales,
there is a high degree of hypothetical bias. E.g. the general question
about ad humorousness (without showing an ad) can be interpreted in
many different ways by the respondents
∙ No measurement of actual eWOM engagements limits the external
validity of the results
Septianto et al.
(2018)
∙ Effects of positive emotions on the
acceptance and forwarding of eWOM
∙ Not all positive emotions are
similarly effective to increase eWOM,
combinations of emotions can lead to
high eWOM acceptance rates
∙ Ambiguous definition and measurement of independent variables as
well as dependent variables
∙ Undifferentiated treatment of humor respectively distinction of
positive emotions creates a degree of inconclusive interpretations
∙ See literature review I for further weaknesses and limitations
Authors (year) Main topics Key findings Weaknesses and limitations
Research characteristics
The effect of humor categories on eWOM engagement 146
4.2.2 INTERPRETATION AND RESEARCH GAPS
In total, nine publications were extracted from the 64 papers in the intermediate literature
base, due to their high degree of relevance and originality regarding the effect of humor
on eWOM engagement.
Humor in light of eWOM
Content, including positive emotions related to humor (surprise, amusement, joy), is often
found to be present in successful viral marketing campaigns, and therefore eWOM
designs with high degrees of engagement.680 Nevertheless, the extant literature is mainly
based on one type of eWOM (e-mail forwarding), which does not leverage the great reach
and network effects of social media networks. Furthermore, a sound theoretical
explanation for the observations is missing. Both eWOM and humor are treated as
unidimensional constructs, measured on superficial Likert scales (e.g. willingness to
share eWOM),681 which do not provide a robust data base to conclusively explain the
usage and effect of humor on prosumer engagement in eWOM.
Humor as a multidimensional construct
While Huang et al. do not differentiate between negative and positive emotions “such as
humor, fear, sadness”682, Lee et al. at least acknowledge the distinctiveness of humor, as
well as offensive (‘taboo’) humor, as one dimension of the multidimensional construct.683
Nevertheless, no publication has been found that includes the different categories of
humor in one research design and in light of (Fre-)eWOM. Extant social commerce
literature only provides undifferentiated results about humor in general, though humor
research underpins the multidimensionality of the construct from the prosumer
perspective.684 The multidimensional treatment of humor in eWOM research is thus an
important avenue for the empirical research.
Effect of humor on eWOM engagement and WTA levels
Although humor is consistently observed in successful viral marketing campaigns, and
Malhitra et al. categorically postulate that “the posts that generate a chuckle receive a
680 Berger, Jonah/Milkman, Katherine L. (2012), p. 199 | Rubenking, Bridget (2019), p. 64 | Borges-Tiago, Maria Teresa/Tiago, Flavio/Cosme, Carla (2018), p. article in press | Lowe-Calverley, Emily/Grieve, Rachel (2018), p. 1906. 681 Dobele, Angela/Lindgreen, Adam/Beverland, Michael/Vanhamme, Joëlle/van Wijk, Robert (2007), p. 295-297 | Berger, Jonah/Milkman, Katherine L. (2012), p. 200. 682 Huang, Chien-Chih/Lin, Tung-Ching/Lin, Kuei-Ju (2009), p. 164. 683 Lee, Seung Hwan/Brandt, Alan/Groff, Yuni/Lopez, Alyssa/Neavin, Tyler (2017), p. 75-90. 684 Beard, Fred K. (2008), p. 10-12 | Speck, Paul Surgi (2012), p. 3.
The effect of humor categories on eWOM engagement 147
significant boost in the number of likes”685, extant literature is characterized by four major
research gaps. (1) There is no comprehensive, theoretical explanation regarding the effect
of humor as a multidimensional construct on prosumer eWOM engagements. (2) There
is no empirical research which accounts for humor as a multidimensional construct
regarding its effect on eWOM engagement. (3) The existing empirical research mostly
draws on convenience samples of students from a single university, which further limits
the generalizability of the findings on humor as a unidimensional construct.
Hence, extant literature, utilizes ambiguous research designs due to overly simplified
construct treatments, and also neglects potential socio-demographic differences in
prosumer perceptions and behavior. These research gaps provide directions for advancing
the research field of social commerce through sound, theoretical reasoning and empirical
investigation of the effect of humor categories on prosumer eWOM engagement.
4.3 SELF-DISCREPANCY THEORY AND HUMOR AS SOCIAL
EXCHANGE
Extant research in the field of social commerce and eWOM does not integrate the current
state of theory in humor research. As mentioned in the foundations of humor and literature
review, a solid definition of humor as a multidimensional construct has not yet been
transferred to social commerce research. Furthermore, a comprehensive embedding of
humor perceptions into the overarching process of prosumer decision-making for eWOM
engagement is currently lacking. Therefore, the theoretical effect of humor categories on
prosumers is synthesized over the course of the decision-making process inherent to
Social Exchange Theory.
Besides the confirmation people seek to validate their perception of humor, people also
seek social esteem reflected in, e.g., likes received on social media networks. Posting
humorous content is a means of reaching this objective, and explains the addictive nature
of social media networks.686 Chawla, the founder of Lovematically, even describes likes
on social media networks as the digital equivalent of crack-cocaine.687 Since likes are
perceived as a type of appreciation and measure of popularity, it can therefore be
685 Malhotra, Arvind/Kubowcicz-Malhotra, Claudia/See, Alan (2013), p. 18. 686 Lowe-Calverley, Emily/Grieve, Rachel (2018), p. 1909-1910. 687 Alter, Adam L. (2017), p. 127.
The effect of humor categories on eWOM engagement 148
experienced as an embarrassment if a post does not receive a lot of them. Lovematically
sells likes on social media networks as a business model.688 In this regard, Dumas et al.
have also shown that people use social media networks for self-promotion and seek likes
as a form of self-validation,689 which is more likely to happen through humorous than
non-humorous content.690
This underpins the important role of social media networks as platforms of social
validation over the course of forming and curating digital selves. Drawing on the Self-
Discrepancy Theory, as introduced in Chapter 2.2.1.3, people consider three self-
presentation motives to decide which content they share on their digital profiles: the
actual, the ideal, and the ought-to-self.691 Humor is one of the most valued personality
traits in any kind of social relationship, be it romantic, platonic, or professional.692
Therefore, people curate their digital personas with humorous content, like humorous
advertisements in eWOM posts, to provide cues indicating that humor is a trait of their
own personality. Nonetheless, offensive types of humor are also linked to racism, sexism
and other inappropriate behaviors.693 People therefore perceive these advertisements
included in eWOM as humorous, but avoid engagements in order to prevent an
association with the unfavorable traits of e.g. racism or sexism. In light of the Social
Exchange Theory, the humorous content is therefore either perceived as beneficial (warm
humor cues positive character traits) or costly (offensive humor cues negative character
traits) when associated with one’s digital persona.
In this regard, the phenomenon of viral marketing (FreeWOM) on social media networks
also suggests that humor affects the prosumer’s perception of eWOM costs and benefits.
Such viral advertisements, often in the form of videos, are shared and viewed millions of
times, although no monetary rewards are offered. Therefore, the integration of humor as
a determinant of prosumer costs and benefit perceptions is required to advance Social
Exchange Theory in the light of prosumer eWOM engagements.
Warm humor provides additional benefits to the prosumer, since the act of reviewing an
eWOM offer becomes a pleasant activity in itself, which reduces the cognitive costs of
688 Alter, Adam L. (2017), p. 127-129. 689 Dumas, Tara M./Maxwell-Smith, Matthew/Davis, Jordan P./Giulietti, Paul A. (2017), p. 2. 690 Lowe-Calverley, Emily/Grieve, Rachel (2018), p. 1906. 691 Whitty, Monica (2008), p. 1708 | Sirgy, M. Joseph (1982), p. 287-300. 692 Medlin, Mary M./Brown, Mitch/Sacco, Donald F. (2018), p. 192 | Petraki, Eleni/Ramayanti, Ismarita (2018), p. 199. 693 Beard, Fred K. (2008), p. 1-2.
The effect of humor categories on eWOM engagement 149
the analytical process. Furthermore, prosumers perceive internalized-extrinsic benefits,
since the anticipated positive feedback from other network members allows for the
enhanced enjoyment of humor when the humorous commercial is shared.694 Humor is one
of the most appreciated qualities in both business and social life.695 Drawing on the Self-
Discrepancy Theory, people therefore integrate this favorable trait in their self-concepts.
They want to be perceived as humorous (ideal self) and think they are supposed to be
humorous, in order to receive social appreciation (ought-to self). Bargh et al. also found
that it is easier for people to express their inner attributes, such as being humorous (actual
self), online rather than offline.696 Sharing eWOM containing warm humor therefore
provides internalized-extrinsic benefits by serving all three motives of online self-
curation.
Offensive humor, on the other hand, includes by definition sexist jokes, racist jokes or
potentially inappropriate sexual allusions.697 The likelihood of receiving positive
feedback for enhanced enjoyment is, therefore, lower. Furthermore, there is even the risk
of negative feedback from the network, such as condemnation; which is a cognitive cost
factor. While people want to curate humorous identities, the traits of being sexist or racist
are generally perceived as hostile and thus negative personality traits.698 Therefore,
prosumers perceive additional cognitive costs when considering the posting of eWOM
containing offensive humor.
Hence, the two humor categories are integrated in the theoretical framework for
explaining the prosumers’ different cost, benefit and thus utility perceptions of eWOM
containing warm or offensive humor.
The integration of the theoretical effects of humor in the course of utility-motivated
choice behavior by prosumers is visualized below in Figure 32.
694 Raghunathan, Rajagopal/Corfman, Kim (2006), p. 386. 695 Whitty, Monica (2008), p. 1717. 696 Bargh, John A./McKenna, Katelyn Y. A./Fitzsimons, Grainne M. (2002), p. 42-45. 697 Buijzen, Moniek/Valkenburg, Patti M. (2004), p. 156-161 | Lee, Seung Hwan/Brandt, Alan/Groff, Yuni/Lopez, Alyssa/Neavin, Tyler (2017), p. 75-77. 698 Wood, Julia T./Pearce, W. Barnett (1980), p. 239-243 | Bohner, Gerd/Ahlborn, Katrin/Steiner, Regine (2010), p. 574-575.

The effect of humor categories on eWOM engagement 150
FIGURE 32: THE THEORETICAL EFFECT OF HUMOR ON PROSUMER EWOM DECISION MAKING
This theorization is the basis for developing theoretically sound research questions and
deriving hypotheses regarding the effect of humor types on prosumer eWOM engagement
in the following.
4.4 RESEARCH FRAMEWORK AND HYPOTHESES
4.4.1 RESEARCH FRAMEWORK
The first two studies contributed the set of eWOM-specific decision attributes, which
determine prosumer engagement in eWOM. As mentioned earlier, the complementary
research of the humor’s effect on eWOM engagement substantially advances the field of
social commerce due to (1) the unexplained observation of extreme cases where the
required price discount for eWOM engagement is reduced to zero (FreeWOM), (2) the
high managerial relevance of humor in marketing effectiveness and (3) the closing of
research gaps identified in extant literature landscape about the effect of humor on
prosumer engagement in eWOM. The overarching research question of this empirical
study is thus stated as follows:
How does humor affect prosumer utility perception of eWOM archetypes, and thus the
required extrinsic incentive level (WTA) in motivating eWOM engagement?
Using this research question, a causal structure of research variables and their potential
relationships is depicted in the second research framework (see Figure 33).
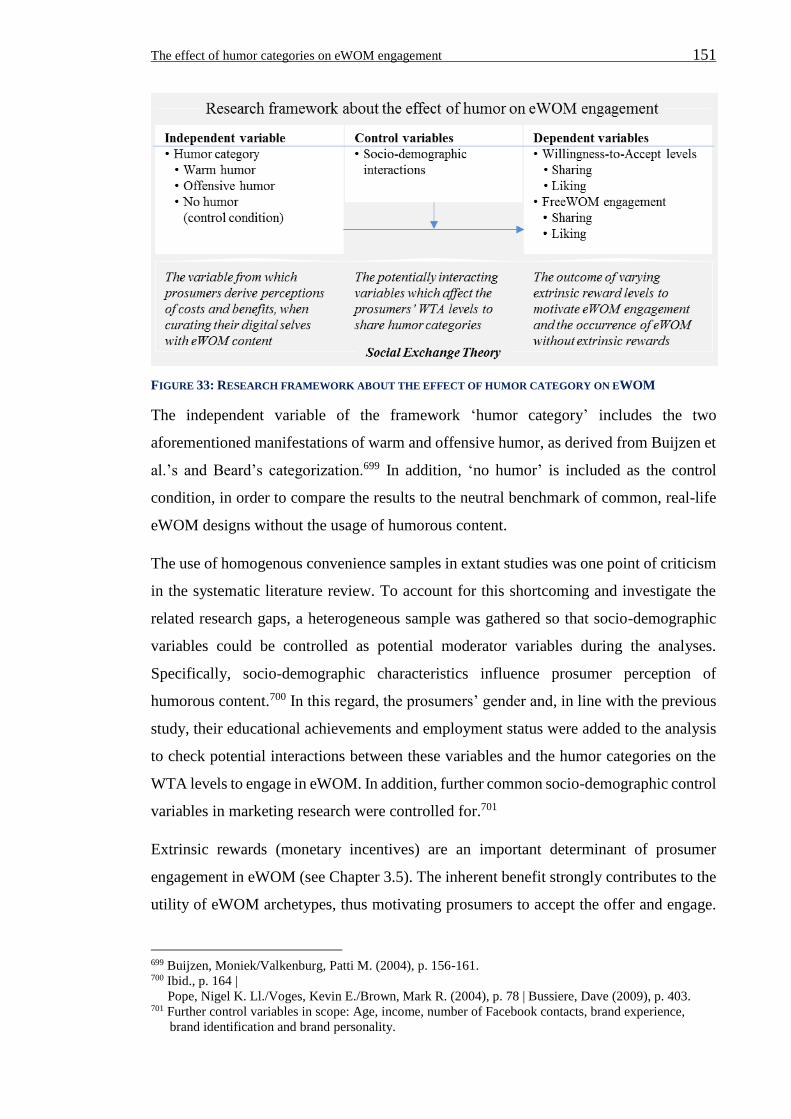
The effect of humor categories on eWOM engagement 151
FIGURE 33: RESEARCH FRAMEWORK ABOUT THE EFFECT OF HUMOR CATEGORY ON EWOM
The independent variable of the framework ‘humor category’ includes the two
aforementioned manifestations of warm and offensive humor, as derived from Buijzen et
al.’s and Beard’s categorization.699 In addition, ‘no humor’ is included as the control
condition, in order to compare the results to the neutral benchmark of common, real-life
eWOM designs without the usage of humorous content.
The use of homogenous convenience samples in extant studies was one point of criticism
in the systematic literature review. To account for this shortcoming and investigate the
related research gaps, a heterogeneous sample was gathered so that socio-demographic
variables could be controlled as potential moderator variables during the analyses.
Specifically, socio-demographic characteristics influence prosumer perception of
humorous content.700 In this regard, the prosumers’ gender and, in line with the previous
study, their educational achievements and employment status were added to the analysis
to check potential interactions between these variables and the humor categories on the
WTA levels to engage in eWOM. In addition, further common socio-demographic control
variables in marketing research were controlled for.701
Extrinsic rewards (monetary incentives) are an important determinant of prosumer
engagement in eWOM (see Chapter 3.5). The inherent benefit strongly contributes to the
utility of eWOM archetypes, thus motivating prosumers to accept the offer and engage.
699 Buijzen, Moniek/Valkenburg, Patti M. (2004), p. 156-161. 700 Ibid., p. 164 | Pope, Nigel K. Ll./Voges, Kevin E./Brown, Mark R. (2004), p. 78 | Bussiere, Dave (2009), p. 403. 701 Further control variables in scope: Age, income, number of Facebook contacts, brand experience,
brand identification and brand personality.
The effect of humor categories on eWOM engagement 152
As discussed in Chapter 3.2.2, the minimum required incentive the prosumers are willing
to accept is therefore the required compensation for the level of cognitive effort they
perceive for engaging in an eWOM archetype. If the utility of an eWOM archetype
without monetary incentive is perceived as being positive, prosumers engage in
FreeWOM and state a WTA equal to zero. The WTA levels and derived FreeWOM
occurrences are therefore modeled as the dependent variables in the framework for
researching the effect of humor categories on prosumer eWOM engagements.
4.4.2 HYPOTHESES DEVELOPMENT
In Chapter 4.2, the key variables were defined and relevant research gaps derived from
extant publications about the effect of humor category on prosumer engagement in
eWOM. In Chapter 4.3, the theoretical effect of humor was embedded, inter alia as a
means of curating a digital self, in the process of prosumer decision-making based on
Social Exchange Theory and Self-discrepancy Theory. The combination of the defined
variables, relevant research gaps and theoretical processes allows for the formulation of
sound research hypotheses regarding the relationships, as visualized in the research
framework.
The effect of humor on prosumer WTA to engage in eWOM
The three fundamental categories of the multidimensional construct humor have not been
researched comprehensively for their effect on eWOM engagement on social media
networks. As stated above, prosumers use eWOM content to curate their digital selves on
social media networks. In this regard, eWOM which contains warm humor reduces the
perceived cognitive costs of analyzing the proposed content before engaging, due to
entertainment and enjoyment of the content. Prosumers perceive engagement in eWOM
containing warm humor as beneficial due to their need for accuracy and the enhanced
enjoyment of humor based on peer reactions. Furthermore, warm humor is a social benefit
and much-appreciated artifact which prosumers seek to curate themselves with on social
media networks, displaying favorable traits to their peers. By definition, offensive humor
draws on stereotypes (e.g. racism, sexism) that can insult peers or sexual allusions, which
can be perceived as inappropriate.702 Offensive humor therefore has the risk of negative
peer reactions and unfavorable peer perceptions of the eWOM sender, which prosumers
seek to avoid on social media networks. Positive peer reactions are also less likely under
702 Lee, Seung Hwan/Brandt, Alan/Groff, Yuni/Lopez, Alyssa/Neavin, Tyler (2017), p. 76-77.
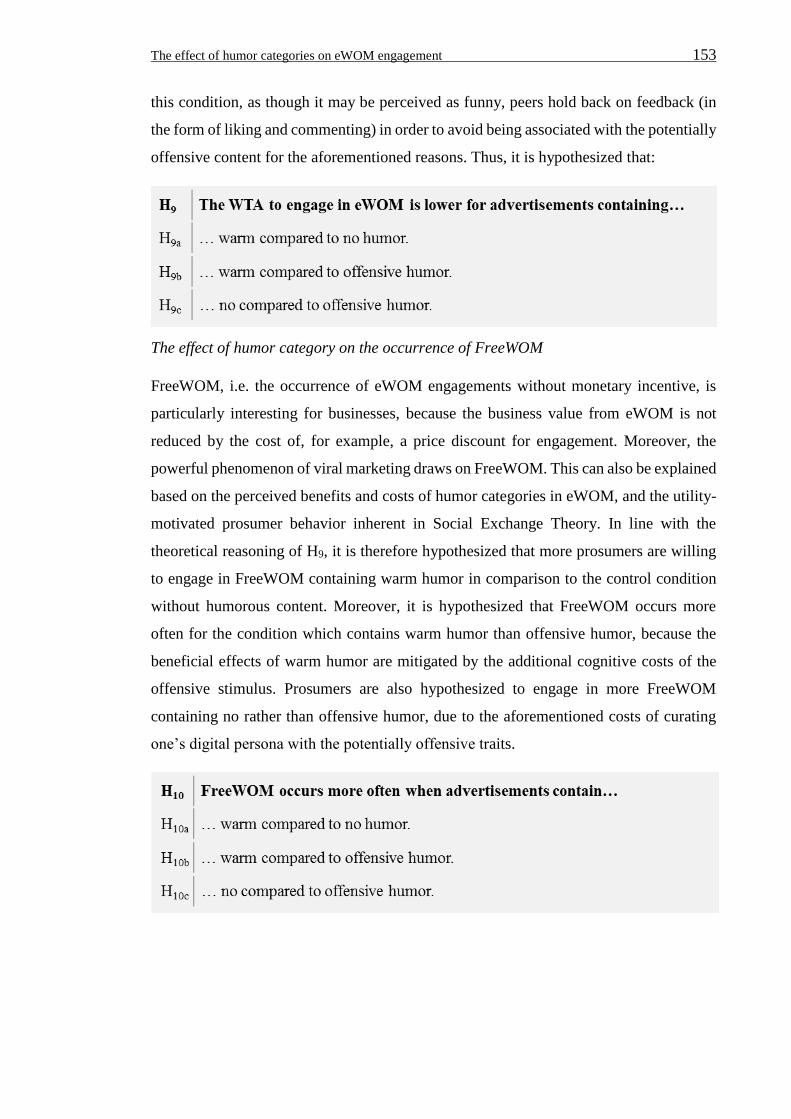
The effect of humor categories on eWOM engagement 153
this condition, as though it may be perceived as funny, peers hold back on feedback (in
the form of liking and commenting) in order to avoid being associated with the potentially
offensive content for the aforementioned reasons. Thus, it is hypothesized that:
The effect of humor category on the occurrence of FreeWOM
FreeWOM, i.e. the occurrence of eWOM engagements without monetary incentive, is
particularly interesting for businesses, because the business value from eWOM is not
reduced by the cost of, for example, a price discount for engagement. Moreover, the
powerful phenomenon of viral marketing draws on FreeWOM. This can also be explained
based on the perceived benefits and costs of humor categories in eWOM, and the utility-
motivated prosumer behavior inherent in Social Exchange Theory. In line with the
theoretical reasoning of H9, it is therefore hypothesized that more prosumers are willing
to engage in FreeWOM containing warm humor in comparison to the control condition
without humorous content. Moreover, it is hypothesized that FreeWOM occurs more
often for the condition which contains warm humor than offensive humor, because the
beneficial effects of warm humor are mitigated by the additional cognitive costs of the
offensive stimulus. Prosumers are also hypothesized to engage in more FreeWOM
containing no rather than offensive humor, due to the aforementioned costs of curating
one’s digital persona with the potentially offensive traits.
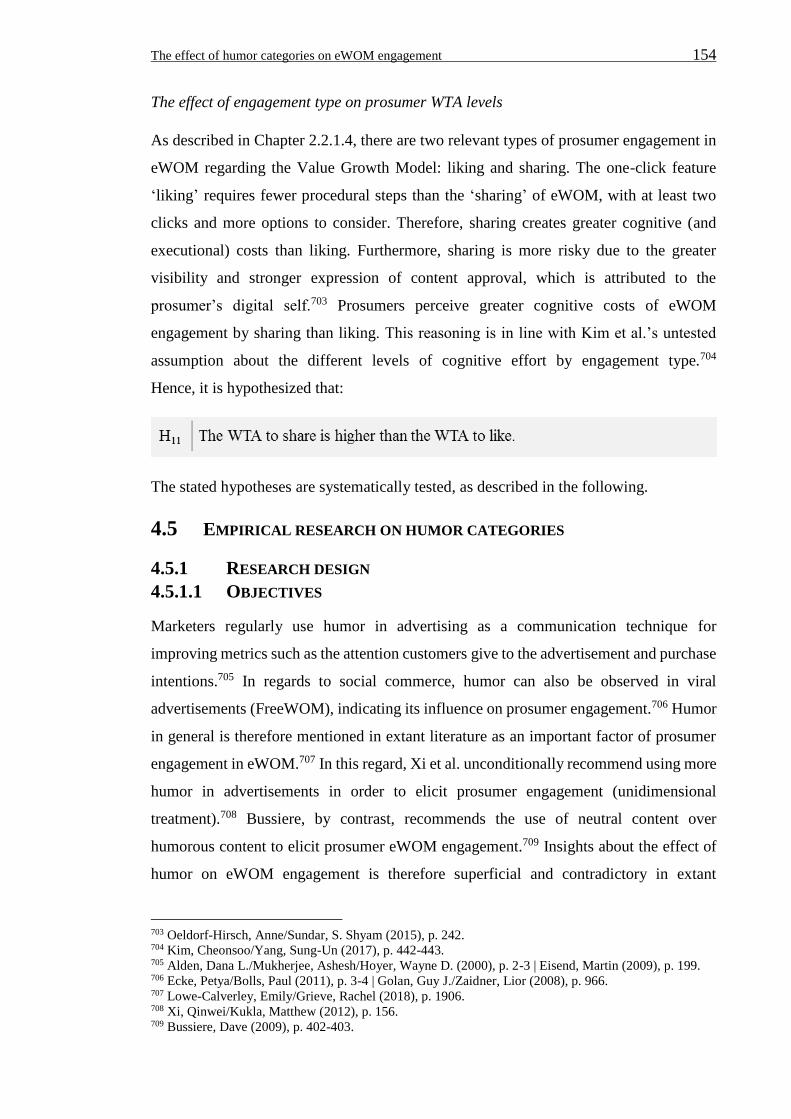
The effect of humor categories on eWOM engagement 154
The effect of engagement type on prosumer WTA levels
As described in Chapter 2.2.1.4, there are two relevant types of prosumer engagement in
eWOM regarding the Value Growth Model: liking and sharing. The one-click feature
‘liking’ requires fewer procedural steps than the ‘sharing’ of eWOM, with at least two
clicks and more options to consider. Therefore, sharing creates greater cognitive (and
executional) costs than liking. Furthermore, sharing is more risky due to the greater
visibility and stronger expression of content approval, which is attributed to the
prosumer’s digital self.703 Prosumers perceive greater cognitive costs of eWOM
engagement by sharing than liking. This reasoning is in line with Kim et al.’s untested
assumption about the different levels of cognitive effort by engagement type.704
Hence, it is hypothesized that:
The stated hypotheses are systematically tested, as described in the following.
4.5 EMPIRICAL RESEARCH ON HUMOR CATEGORIES
4.5.1 RESEARCH DESIGN
4.5.1.1 OBJECTIVES
Marketers regularly use humor in advertising as a communication technique for
improving metrics such as the attention customers give to the advertisement and purchase
intentions.705 In regards to social commerce, humor can also be observed in viral
advertisements (FreeWOM), indicating its influence on prosumer engagement.706 Humor
in general is therefore mentioned in extant literature as an important factor of prosumer
engagement in eWOM.707 In this regard, Xi et al. unconditionally recommend using more
humor in advertisements in order to elicit prosumer engagement (unidimensional
treatment).708 Bussiere, by contrast, recommends the use of neutral content over
humorous content to elicit prosumer eWOM engagement.709 Insights about the effect of
humor on eWOM engagement is therefore superficial and contradictory in extant
703 Oeldorf-Hirsch, Anne/Sundar, S. Shyam (2015), p. 242. 704 Kim, Cheonsoo/Yang, Sung-Un (2017), p. 442-443. 705 Alden, Dana L./Mukherjee, Ashesh/Hoyer, Wayne D. (2000), p. 2-3 | Eisend, Martin (2009), p. 199. 706 Ecke, Petya/Bolls, Paul (2011), p. 3-4 | Golan, Guy J./Zaidner, Lior (2008), p. 966. 707 Lowe-Calverley, Emily/Grieve, Rachel (2018), p. 1906. 708 Xi, Qinwei/Kukla, Matthew (2012), p. 156. 709 Bussiere, Dave (2009), p. 402-403.
The effect of humor categories on eWOM engagement 155
literature. To advance social commerce theory in light of humor, a sound theorization of
the phenomenon and empirical investigation into how humor influences prosumer
perceptions of eWOM utility and thus eWOM engagement must first be made. Moreover,
humor depicts a multidimensional construct which is too diverse for the current
unidimensional treatment. It is therefore the objective of this third empirical study to test
the hypothesized effects of humor on prosumer eWOM engagement as social exchange.
This requires a valid research design, representative sample for the target population of
German prosumers and a sound statistical analysis to shed light on the research gaps
identified. Besides the theoretical advancement of Social Exchange Theory in light of
prosumer eWOM engagement by synthesizing humor theory, the research also aims to
provide marketing managers with empirical insights regarding efficient eWOM designs
and thus resolve the contradictory recommendations in extant literature.
4.5.1.2 VARIABLES, OPERATIONALIZATIONS AND STIMULI
The humor category depicts the independent variable in the relationship of hypotheses
nine and ten. Besides the two manifestations of warm and offensive humor, it is necessary
to include the manifestation of no humor as the control condition in order to be able to
test the set of hypotheses comprehensively. Since the monetary incentive is the most
important decision attribute inherent in eWOM archetypes, which provides utility that
can (over-)compensate the cognitive effort of eWOM engagement, the prosumers’ WTA
level for the incentive is the dependent variable in the research design. It is a more
accurate and meaningful measure than the prevalent Likert scales (intention to share) in
eWOM research, which limit the range of potential outcomes. The usage of the
prosumers’ WTA level to engage in eWOM also enables the testing of the tenth
hypothesis about the occurrences of FreeWOM, and is therefore used in the research
design.
Moreover, eWOM engagement is operationalized as both liking and sharing, in order to
receive individual WTA levels for each experimental stimuli and (re-)test prosumer
preferences regarding these two different social media behaviors.
“Humorous communication is simply the one which is perceived to be humorous by the
receiver.”710 It is therefore of vital importance for meaningful results to ensure the
intended manipulation of the individual respondents in the experiment for each of the
710 Chan, Fanny Fong Yee (2011), p. 49.
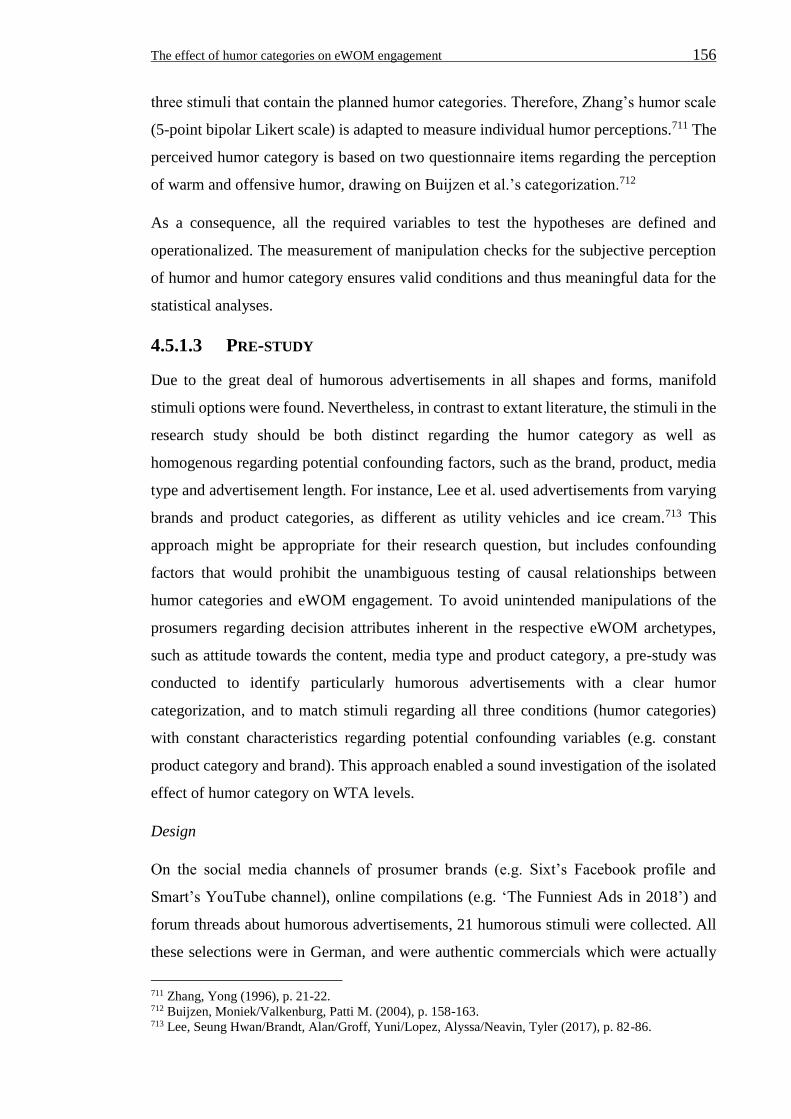
The effect of humor categories on eWOM engagement 156
three stimuli that contain the planned humor categories. Therefore, Zhang’s humor scale
(5-point bipolar Likert scale) is adapted to measure individual humor perceptions.711 The
perceived humor category is based on two questionnaire items regarding the perception
of warm and offensive humor, drawing on Buijzen et al.’s categorization.712
As a consequence, all the required variables to test the hypotheses are defined and
operationalized. The measurement of manipulation checks for the subjective perception
of humor and humor category ensures valid conditions and thus meaningful data for the
statistical analyses.
4.5.1.3 PRE-STUDY
Due to the great deal of humorous advertisements in all shapes and forms, manifold
stimuli options were found. Nevertheless, in contrast to extant literature, the stimuli in the
research study should be both distinct regarding the humor category as well as
homogenous regarding potential confounding factors, such as the brand, product, media
type and advertisement length. For instance, Lee et al. used advertisements from varying
brands and product categories, as different as utility vehicles and ice cream.713 This
approach might be appropriate for their research question, but includes confounding
factors that would prohibit the unambiguous testing of causal relationships between
humor categories and eWOM engagement. To avoid unintended manipulations of the
prosumers regarding decision attributes inherent in the respective eWOM archetypes,
such as attitude towards the content, media type and product category, a pre-study was
conducted to identify particularly humorous advertisements with a clear humor
categorization, and to match stimuli regarding all three conditions (humor categories)
with constant characteristics regarding potential confounding variables (e.g. constant
product category and brand). This approach enabled a sound investigation of the isolated
effect of humor category on WTA levels.
Design
On the social media channels of prosumer brands (e.g. Sixt’s Facebook profile and
Smart’s YouTube channel), online compilations (e.g. ‘The Funniest Ads in 2018’) and
forum threads about humorous advertisements, 21 humorous stimuli were collected. All
these selections were in German, and were authentic commercials which were actually
711 Zhang, Yong (1996), p. 21-22. 712 Buijzen, Moniek/Valkenburg, Patti M. (2004), p. 158-163. 713 Lee, Seung Hwan/Brandt, Alan/Groff, Yuni/Lopez, Alyssa/Neavin, Tyler (2017), p. 82-86.
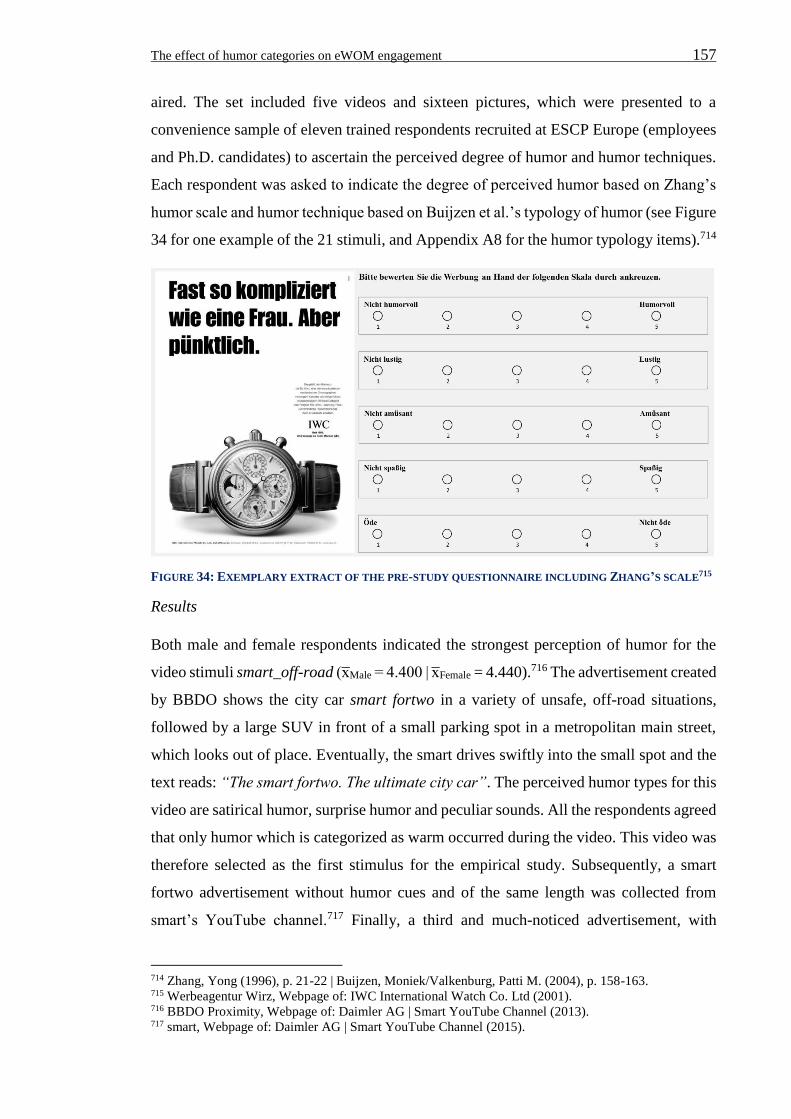
The effect of humor categories on eWOM engagement 157
aired. The set included five videos and sixteen pictures, which were presented to a
convenience sample of eleven trained respondents recruited at ESCP Europe (employees
and Ph.D. candidates) to ascertain the perceived degree of humor and humor techniques.
Each respondent was asked to indicate the degree of perceived humor based on Zhang’s
humor scale and humor technique based on Buijzen et al.’s typology of humor (see Figure
34 for one example of the 21 stimuli, and Appendix A8 for the humor typology items).714
FIGURE 34: EXEMPLARY EXTRACT OF THE PRE-STUDY QUESTIONNAIRE INCLUDING ZHANG’S SCALE715
Results
Both male and female respondents indicated the strongest perception of humor for the
video stimuli smart_off-road (x̅Male = 4.400 | x̅Female = 4.440).716 The advertisement created
by BBDO shows the city car smart fortwo in a variety of unsafe, off-road situations,
followed by a large SUV in front of a small parking spot in a metropolitan main street,
which looks out of place. Eventually, the smart drives swiftly into the small spot and the
text reads: “The smart fortwo. The ultimate city car”. The perceived humor types for this
video are satirical humor, surprise humor and peculiar sounds. All the respondents agreed
that only humor which is categorized as warm occurred during the video. This video was
therefore selected as the first stimulus for the empirical study. Subsequently, a smart
fortwo advertisement without humor cues and of the same length was collected from
smart’s YouTube channel.717 Finally, a third and much-noticed advertisement, with
714 Zhang, Yong (1996), p. 21-22 | Buijzen, Moniek/Valkenburg, Patti M. (2004), p. 158-163. 715 Werbeagentur Wirz, Webpage of: IWC International Watch Co. Ltd (2001). 716 BBDO Proximity, Webpage of: Daimler AG | Smart YouTube Channel (2013). 717 smart, Webpage of: Daimler AG | Smart YouTube Channel (2015).
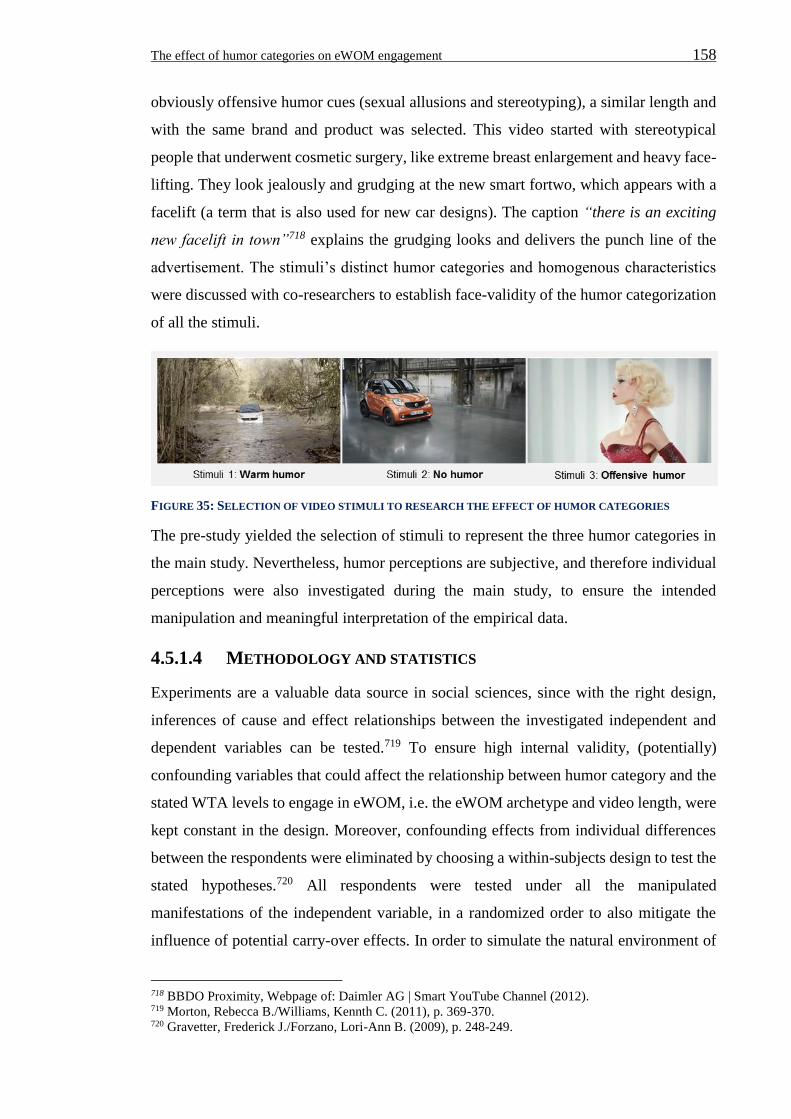
The effect of humor categories on eWOM engagement 158
obviously offensive humor cues (sexual allusions and stereotyping), a similar length and
with the same brand and product was selected. This video started with stereotypical
people that underwent cosmetic surgery, like extreme breast enlargement and heavy face-
lifting. They look jealously and grudging at the new smart fortwo, which appears with a
facelift (a term that is also used for new car designs). The caption “there is an exciting
new facelift in town”718 explains the grudging looks and delivers the punch line of the
advertisement. The stimuli’s distinct humor categories and homogenous characteristics
were discussed with co-researchers to establish face-validity of the humor categorization
of all the stimuli.
FIGURE 35: SELECTION OF VIDEO STIMULI TO RESEARCH THE EFFECT OF HUMOR CATEGORIES
The pre-study yielded the selection of stimuli to represent the three humor categories in
the main study. Nevertheless, humor perceptions are subjective, and therefore individual
perceptions were also investigated during the main study, to ensure the intended
manipulation and meaningful interpretation of the empirical data.
4.5.1.4 METHODOLOGY AND STATISTICS
Experiments are a valuable data source in social sciences, since with the right design,
inferences of cause and effect relationships between the investigated independent and
dependent variables can be tested.719 To ensure high internal validity, (potentially)
confounding variables that could affect the relationship between humor category and the
stated WTA levels to engage in eWOM, i.e. the eWOM archetype and video length, were
kept constant in the design. Moreover, confounding effects from individual differences
between the respondents were eliminated by choosing a within-subjects design to test the
stated hypotheses.720 All respondents were tested under all the manipulated
manifestations of the independent variable, in a randomized order to also mitigate the
influence of potential carry-over effects. In order to simulate the natural environment of
718 BBDO Proximity, Webpage of: Daimler AG | Smart YouTube Channel (2012). 719 Morton, Rebecca B./Williams, Kennth C. (2011), p. 369-370. 720 Gravetter, Frederick J./Forzano, Lori-Ann B. (2009), p. 248-249.
The effect of humor categories on eWOM engagement 159
eWOM engagement and establish external validity, the experiment was conducted online
on the personal devices of the respondents. This approach is also suitable for cooperating
with a panel institute, which was required to efficiently reach the target group and a
representative sample size. Anonymity was guaranteed at the beginning of the survey, to
avoid biased responses due to the social desirability effect. In addition, the socio-
demographic characteristics of the respondents were measured, to control the defined
between-subjects factors. Hence, a mixed design was chosen for the web-based
experiment, which drew on a within-subjects design regarding the hypothesized effect of
the independent variable “humor category” on the dependent variable “WTA”, while
controlling for socio-demographic between-subjects factors.
For the statistical test of the hypotheses a (repeated measurers) ANOVA was run, which
is one of the most important analysis methods for experiments.721 It allows for the
determining of whether there is a significant mean difference between the three
measurements per respondent for each manifestation of the independent variable.722 In
this regard, the conventional confidence interval of 95% (α = 0.05) was used to test the
hypotheses on significance: i.e. for p < α, the underlying null-hypotheses was rejected,
stating that there is no relationship between the variables and thus no significant mean
differences between the groups.723 The statistical research design was discussed with a
professional statistician to ensure the application of state of the art methodologies. The
chosen repeated measures ANOVA relies on a number of assumptions: (1) the
independent variable has at least three categorical levels, (2) the dependent variable is
measured on a continuous scale, (3) there are no significant outliers, (4) the dependent
variable is (approximately) normally distributed, and (5) there is sphericity (equal
differences of variances).724 It is common that the empirical data violates some of these
assumptions, but the ANOVA is considered fairly robust regarding the type I error (false
positive) in the case of moderate derivations from normality, especially within a large or
equal sample size for each group.725 Furthermore, SPSS 25 includes established
corrections in the output that were applied, in case sphericity cannot be assumed.726
721 Backhaus, Klaus/Erichson, Bernd/Plinke, Wulff/Weiber, Rolf (2016), p. 174. 722 Ibid., p. 174-184. 723 Ibid., p. 184. 724 Lund, Adam/Lund, Mark, Webpage of: Lund Research Ltd (2019). (Section on ANOVA) 725 Brownie, Cavell/Boos, Dennis D. (1994), p. 542-549 |
Glass, Gene V./Peckham, Percy D./Sanders, James R. (1972), p. 284 | Maxwell, Scott E./Delaney, Harold D. (2004), p. 129- 130.
726 Hinton, Perry R./McMurray, Isabella/Brownlow, Charlotte (2014), p. 147-151.
The effect of humor categories on eWOM engagement 160
Nevertheless, depending on the data distributions, additional non-parametric tests are
envisaged in case of violated assumptions, which do not rely on the ANOVA’s
assumptions, to cross-validate the results.727
4.5.1.5 SURVEY DESIGN AND TARGET SAMPLE
The study started with a landing page to welcome the respondents, followed by a brief
introduction about the scenario and information about the requirements of participation,
like a sufficiently strong internet connection to load the videos, audio capability, and
about eight minutes of time. Next, the target group of German social media and
e-commerce users was filtered through inquiring social media (Facebook) and online
shopping usage within the last twelve months. Then, the socio-demographic questions
were displayed, which were subject to quotas to ensure a qualitatively representative
sample. On the following page, the respondents were introduced to the task of watching
three videos (in a randomized order) that could be shared and liked, in return for a
monetary reward. The respondents’ WTA for engaging in the eWOM needed to be stated
(in ‘Euros, Cents’) straight after watching each video. Furthermore, the perception of
humor and perceived humor categories were inquired about after the WTA for each video
stimulus. In order to minimize the respondents’ need to memorize the definition of the
categories, a brief definition was provided each time. After the offensive humor stimuli,
an additional manipulation check questions was included about the perception of the
cleavage displayed as well as a question about the background music of the video, to
exclude inattentive respondents. Based on technical restrictions, the respondents were
unable to skip or fast-forward the videos. Subsequently, the survey included items about
control variables (e.g. income), an instructional manipulation check question, self-
reported diligence and video flow quality (connectivity). Finally, further socio-
demographic information was required.
Target sample
Drawing on quota sampling strategies (authentic representation of socio-demographic
segments) and sufficient total sample sizes, to reflect the population at a confidence level
of 95%, confidence interval of 5% and an estimated population size of 6,850,000
individuals,728 384 full and valid responses were needed. At a less conservative
727 Lund, Adam/Lund, Mark, Webpage of: Lund Research Ltd (2019). 728 Gesellschaft für integrierte Kommunikationsforschung mbH + Co. KG (GIK), Webpage of: Axel
Springer, Bauer media Group, Funke Mediengruppe, Gruner + Jahr und Hubert Burda Media (2016).
The effect of humor categories on eWOM engagement 161
confidence interval of 6%, 267 respondents were required to reach an assumed
representative sample for the defined target population in Germany. Depending on the
response rate, response quality and the conditional panel costs per respondent, a sample
between those two estimated sample sizes was striven for, to conduct the study within the
restricted research resources of time and financial funding. The respondents were
delivered by the panel institute Consumerfieldwork GmbH.
4.5.2 ANALYSES AND RESULTS
4.5.2.1 SAMPLE AND DATA VALIDATION
The main study was conducted between late June and early July of 2018. Only
respondents from the panel were provided with the unique access codes required to
participate once in the study. The subsequent data cleansing process was a necessary step
for meaningful analysis, since especially in paid online studies, respondents can lack the
required seriousness necessary for reliable and valid data.729 To extract the valid sample
from the 2,248 log-ins, all incomplete responses were discarded automatically and Clow
et al.’s data validation criteria were again used to discard further poor-quality responses
from, inter alia, speeders and straight liners, as described in Figure 36 on the following
page.730
Furthermore and most importantly, on an individual level, it was checked whether the
planned manipulation worked for each of the three stimuli: i.e., only respondents that (1)
perceived the stimulus smart_off-road as humorous based on solely warm humor
techniques, (2) the stimulus smart_facelift as humorous based on offensive humor
techniques and (3) the control condition smart_hall as not humorous were considered
valid for the analysis. In total, the 413 valid responses formed a representative sample of
the target population.
729 Ilieva, Janet/Baron, Steve/Healey, Nigel M. (2002), p. 370-372. 730 Clow, Kenneth E./James, Karen E. (2013), p. 359-364.
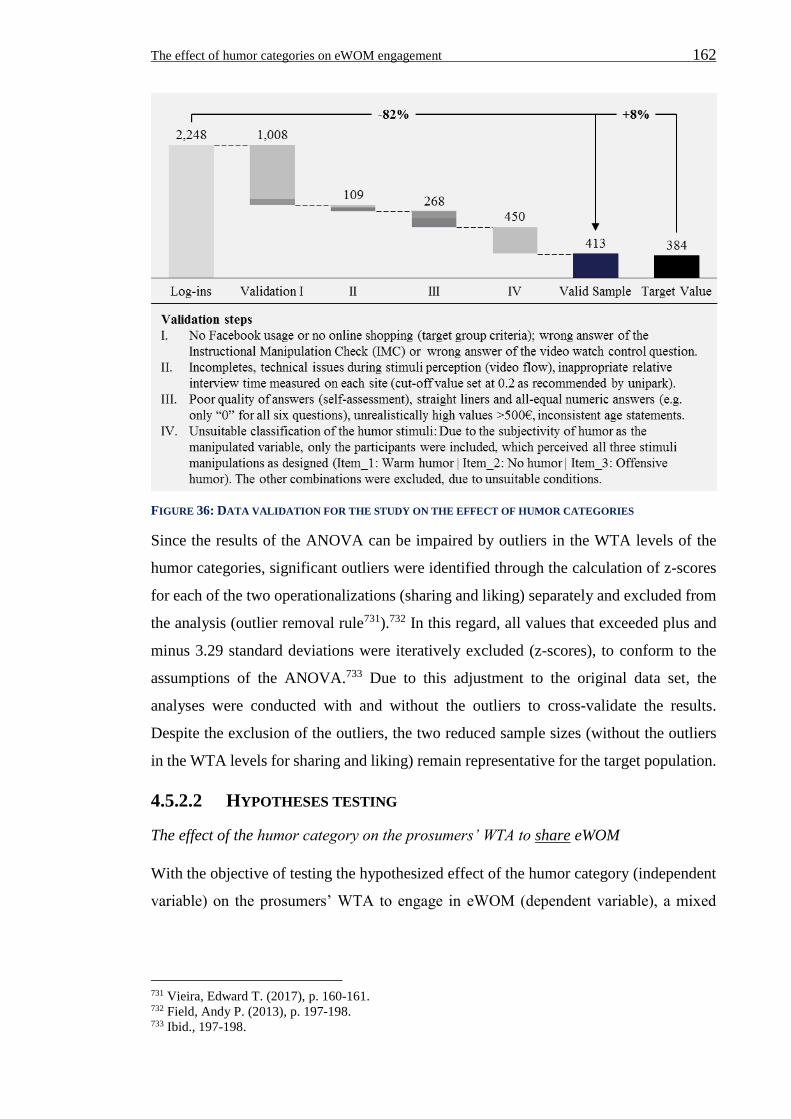
The effect of humor categories on eWOM engagement 162
FIGURE 36: DATA VALIDATION FOR THE STUDY ON THE EFFECT OF HUMOR CATEGORIES
Since the results of the ANOVA can be impaired by outliers in the WTA levels of the
humor categories, significant outliers were identified through the calculation of z-scores
for each of the two operationalizations (sharing and liking) separately and excluded from
the analysis (outlier removal rule731).732 In this regard, all values that exceeded plus and
minus 3.29 standard deviations were iteratively excluded (z-scores), to conform to the
assumptions of the ANOVA.733 Due to this adjustment to the original data set, the
analyses were conducted with and without the outliers to cross-validate the results.
Despite the exclusion of the outliers, the two reduced sample sizes (without the outliers
in the WTA levels for sharing and liking) remain representative for the target population.
4.5.2.2 HYPOTHESES TESTING
The effect of the humor category on the prosumers’ WTA to share eWOM
With the objective of testing the hypothesized effect of the humor category (independent
variable) on the prosumers’ WTA to engage in eWOM (dependent variable), a mixed
731 Vieira, Edward T. (2017), p. 160-161. 732 Field, Andy P. (2013), p. 197-198. 733 Ibid., 197-198.
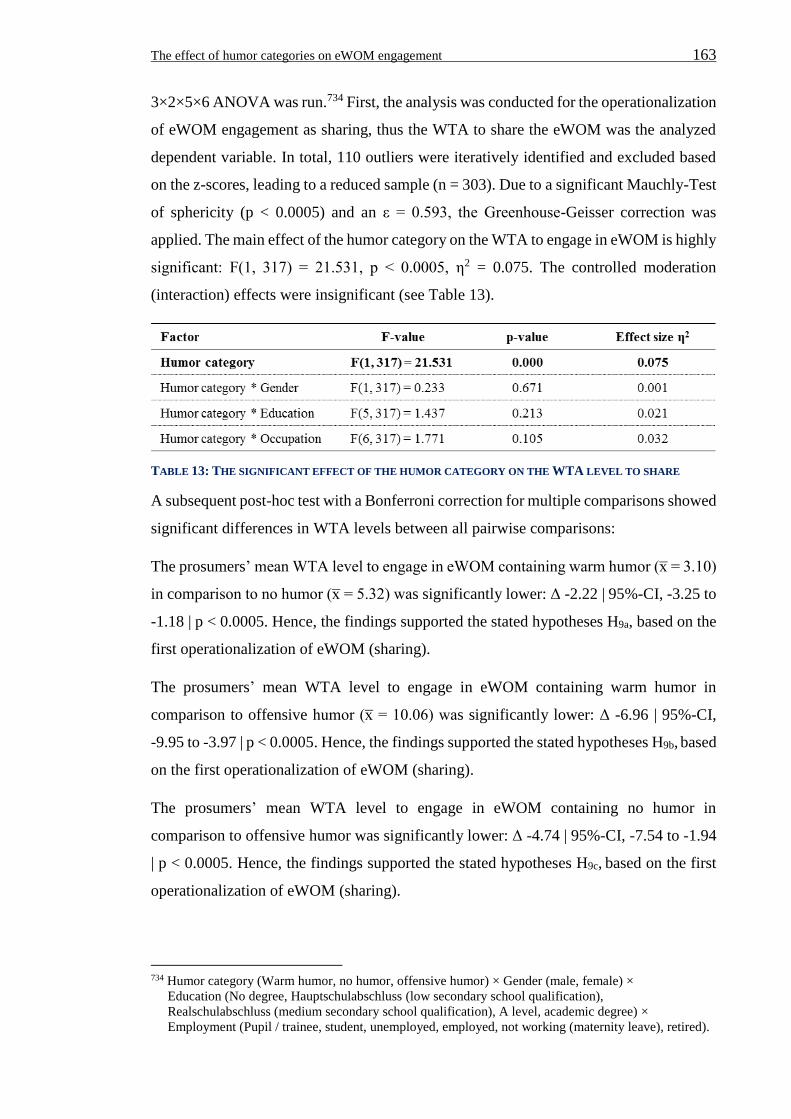
The effect of humor categories on eWOM engagement 163
3×2×5×6 ANOVA was run.734 First, the analysis was conducted for the operationalization
of eWOM engagement as sharing, thus the WTA to share the eWOM was the analyzed
dependent variable. In total, 110 outliers were iteratively identified and excluded based
on the z-scores, leading to a reduced sample (n = 303). Due to a significant Mauchly-Test
of sphericity (p < 0.0005) and an ε = 0.593, the Greenhouse-Geisser correction was
applied. The main effect of the humor category on the WTA to engage in eWOM is highly
significant: F(1, 317) = 21.531, p < 0.0005, η2 = 0.075. The controlled moderation
(interaction) effects were insignificant (see Table 13).
TABLE 13: THE SIGNIFICANT EFFECT OF THE HUMOR CATEGORY ON THE WTA LEVEL TO SHARE
A subsequent post-hoc test with a Bonferroni correction for multiple comparisons showed
significant differences in WTA levels between all pairwise comparisons:
The prosumers’ mean WTA level to engage in eWOM containing warm humor (x̅ = 3.10)
in comparison to no humor (x̅ = 5.32) was significantly lower: Δ -2.22 | 95%-CI, -3.25 to
-1.18 | p < 0.0005. Hence, the findings supported the stated hypotheses H9a, based on the
first operationalization of eWOM (sharing).
The prosumers’ mean WTA level to engage in eWOM containing warm humor in
comparison to offensive humor (x̅ = 10.06) was significantly lower: Δ -6.96 | 95%-CI,
-9.95 to -3.97 | p < 0.0005. Hence, the findings supported the stated hypotheses H9b, based
on the first operationalization of eWOM (sharing).
The prosumers’ mean WTA level to engage in eWOM containing no humor in
comparison to offensive humor was significantly lower: Δ -4.74 | 95%-CI, -7.54 to -1.94
| p < 0.0005. Hence, the findings supported the stated hypotheses H9c, based on the first
operationalization of eWOM (sharing).
734 Humor category (Warm humor, no humor, offensive humor) × Gender (male, female) × Education (No degree, Hauptschulabschluss (low secondary school qualification), Realschulabschluss (medium secondary school qualification), A level, academic degree) × Employment (Pupil / trainee, student, unemployed, employed, not working (maternity leave), retired).
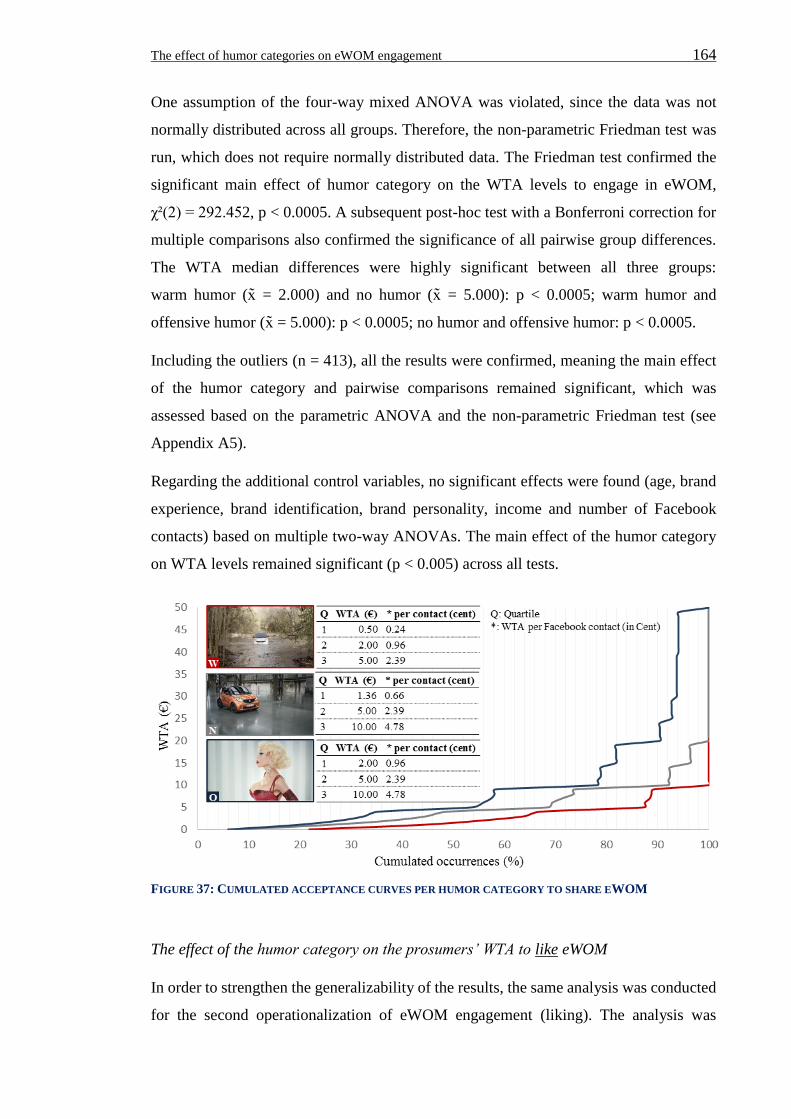
The effect of humor categories on eWOM engagement 164
One assumption of the four-way mixed ANOVA was violated, since the data was not
normally distributed across all groups. Therefore, the non-parametric Friedman test was
run, which does not require normally distributed data. The Friedman test confirmed the
significant main effect of humor category on the WTA levels to engage in eWOM,
χ²(2) = 292.452, p < 0.0005. A subsequent post-hoc test with a Bonferroni correction for
multiple comparisons also confirmed the significance of all pairwise group differences.
The WTA median differences were highly significant between all three groups:
warm humor (x̃ = 2.000) and no humor (x̃ = 5.000): p < 0.0005; warm humor and
offensive humor (x̃ = 5.000): p < 0.0005; no humor and offensive humor: p < 0.0005.
Including the outliers (n = 413), all the results were confirmed, meaning the main effect
of the humor category and pairwise comparisons remained significant, which was
assessed based on the parametric ANOVA and the non-parametric Friedman test (see
Appendix A5).
Regarding the additional control variables, no significant effects were found (age, brand
experience, brand identification, brand personality, income and number of Facebook
contacts) based on multiple two-way ANOVAs. The main effect of the humor category
on WTA levels remained significant (p < 0.005) across all tests.
FIGURE 37: CUMULATED ACCEPTANCE CURVES PER HUMOR CATEGORY TO SHARE EWOM
The effect of the humor category on the prosumers’ WTA to like eWOM
In order to strengthen the generalizability of the results, the same analysis was conducted
for the second operationalization of eWOM engagement (liking). The analysis was
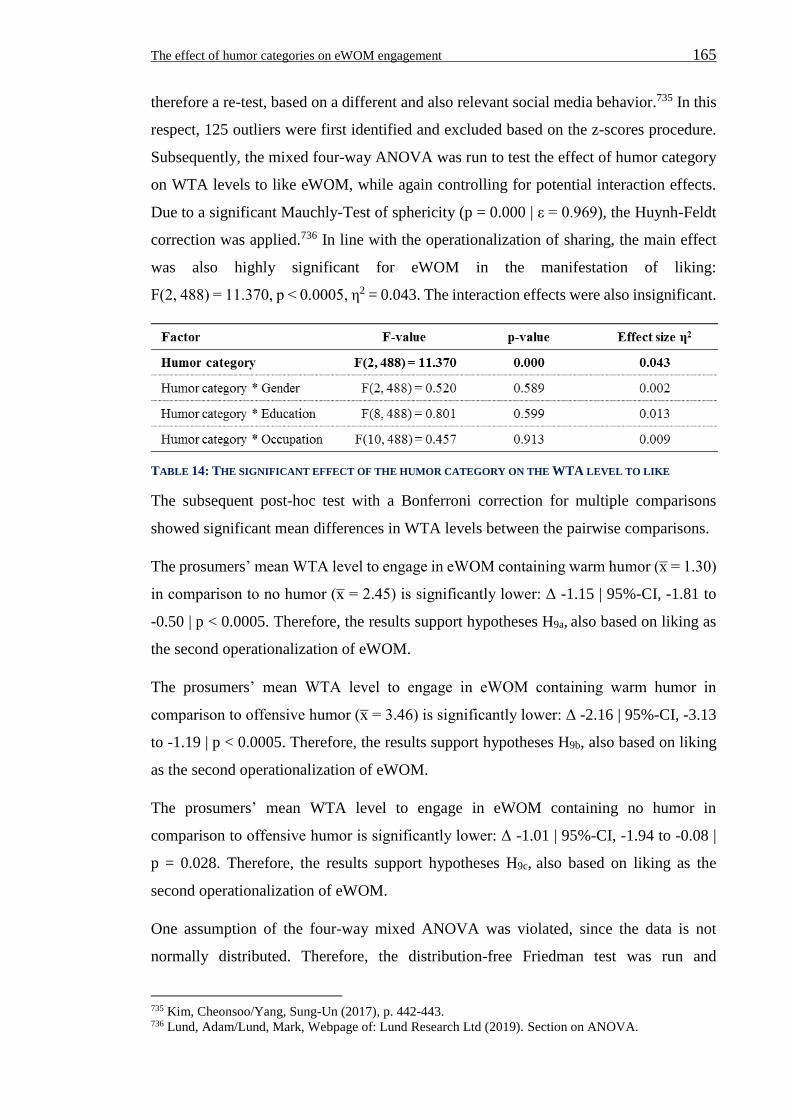
The effect of humor categories on eWOM engagement 165
therefore a re-test, based on a different and also relevant social media behavior.735 In this
respect, 125 outliers were first identified and excluded based on the z-scores procedure.
Subsequently, the mixed four-way ANOVA was run to test the effect of humor category
on WTA levels to like eWOM, while again controlling for potential interaction effects.
Due to a significant Mauchly-Test of sphericity (p = 0.000 | ε = 0.969), the Huynh-Feldt
correction was applied.736 In line with the operationalization of sharing, the main effect
was also highly significant for eWOM in the manifestation of liking:
F(2, 488) = 11.370, p < 0.0005, η2 = 0.043. The interaction effects were also insignificant.
TABLE 14: THE SIGNIFICANT EFFECT OF THE HUMOR CATEGORY ON THE WTA LEVEL TO LIKE
The subsequent post-hoc test with a Bonferroni correction for multiple comparisons
showed significant mean differences in WTA levels between the pairwise comparisons.
The prosumers’ mean WTA level to engage in eWOM containing warm humor (x̅ = 1.30)
in comparison to no humor (x̅ = 2.45) is significantly lower: Δ -1.15 | 95%-CI, -1.81 to
-0.50 | p < 0.0005. Therefore, the results support hypotheses H9a, also based on liking as
the second operationalization of eWOM.
The prosumers’ mean WTA level to engage in eWOM containing warm humor in
comparison to offensive humor (x̅ = 3.46) is significantly lower: Δ -2.16 | 95%-CI, -3.13
to -1.19 | p < 0.0005. Therefore, the results support hypotheses H9b, also based on liking
as the second operationalization of eWOM.
The prosumers’ mean WTA level to engage in eWOM containing no humor in
comparison to offensive humor is significantly lower: Δ -1.01 | 95%-CI, -1.94 to -0.08 |
p = 0.028. Therefore, the results support hypotheses H9c, also based on liking as the
second operationalization of eWOM.
One assumption of the four-way mixed ANOVA was violated, since the data is not
normally distributed. Therefore, the distribution-free Friedman test was run and
735 Kim, Cheonsoo/Yang, Sung-Un (2017), p. 442-443. 736 Lund, Adam/Lund, Mark, Webpage of: Lund Research Ltd (2019). Section on ANOVA.
The effect of humor categories on eWOM engagement 166
confirmed the previous results: χ²(2) = 227.826, p < 0.0005.737 The subsequent post-hoc
test with a Bonferroni correction for multiple comparisons also confirmed the
significance of the pairwise group differences. To be exact, the WTA medians were
different between all three groups: warm humor (x̃ = 1.000) and no humor (x̃ = 2.000): p
< 0.0005; warm humor and offensive humor (x̃ = 3.000): p < 0.0005 as well as no humor
and offensive humor: p < 0.0005.
Including the outliers (full sample of n = 413), the main effect and pairwise comparisons
remained significant, both assessed based on the parametric ANOVA as well as the non-
parametric Friedman test (see Appendix A6).
Moreover, no significant interaction effects regarding the additional control variables
were found (age, brand experience, brand identification, brand personality, income and
number of Facebook contacts), while the main effect of humor category on WTA levels
remained significant (p < 0.005) across each test.
The effect of the humor category on the occurrence of FreeWOM
FreeWOM, like viral advertisements, provide sufficient utility without monetary
incentives to elicit eWOM engagement behavior. To test whether FreeWOM is more
likely to occur under the different categories of humor, the prosumers’ WTA levels were
dichotomously coded (1: WTA = 0 (FreeWOM) | 2: WTA ≠ 0 (no FreeWOM)) to create
two mutually exclusive groups within each humor category. Once more, the approach
was conducted for both operationalizations of eWOM engagement to strengthen the
generalizability of the results. The Cochran’s Q test with a Bonferroni correction for
multiple corrections was the suitable test statistic for the hypotheses and data set-up.738
Since the non-parametric test does not require a normal distribution free of outliers, the
full sample (n = 413) was used. The frequency of heterogeneous scores across the related
groups (humor categories) was large enough to assume a chi-square distribution for
comparison regarding both operationalizations.739
First, the tenth hypothesis cluster (H10a - H10c) was tested, based on FreeWOM in the
operationalization of eWOM sharing. The occurrences were significantly different for the
different humor categories: χ2(2) = 55.219, p < 0.0005. To test the stated hypotheses,
737 Lund, Adam/Lund, Mark, Webpage of: Lund Research Ltd (2019). 738 Cochran, William G. (1950), p. 256-266 | Patil, Kashinath D. (1975), p. 186-189 |
Lund, Adam/Lund, Mark, Webpage of: Lund Research Ltd (2019). Section on Cochran’s Q test. 739 Ibid. (The frequency of heterogeneous scores times the number of groups is greater than 24).
The effect of humor categories on eWOM engagement 167
Dunn’s post-hoc test with a Bonferroni correction for multiple comparisons was
conducted.740 Significantly more occurrences of FreeWOM were found under the
condition of warm humor (15%) in comparison to the control group of no humor (5%):
p < 0.0005. As a consequence, hypothesis H10a was supported, based on sharing as the
operationalization of eWOM engagement.
In addition, there were significantly more occurrences of FreeWOM under the condition
of warm humor compared to offensive humor (4%): p < 0.0005. Therefore, support for
hypothesis H10b was found, based on eWOM sharing.
The greater number of FreeWOM occurrences under the control condition of no humor
compared to offensive humor was not significant: p = 0.759. Therefore, hypothesis H10c
was rejected based on sharing as the operationalization of eWOM behavior.
Second, the hypotheses were tested based on the occurrence of FreeWOM in the form of
liking. Significant differences in the three humor categories were found: χ2(2) = 117.894,
p < 0.0005. To test the related hypotheses, Dunn’s post-hoc test with a Bonferroni
correction for multiple comparisons was run again.741 All the findings on FreeWOM in
the manifestation of liking conformed to the findings on FreeWOM sharing. Hence, there
were significantly more occurrences of FreeWOM under the influence of warm humor
(27%) in comparison to the control group of no humor (8%): p < 0.0005. Due to the
repeated finding of support for hypothesis H10a, the hypothesis is accepted.
There were also significantly more occurrences of FreeWOM under the condition of
warm humor compared to offensive humor (7%): p < 0.0005. Due to the repeated finding
of support for hypothesis H10b, the hypothesis is accepted.
The greater number of FreeWOM occurrences under the influence of no humor compared
to offensive humor remained not significant: p = 0.565. Therefore, hypothesis H10c is
rejected based on both liking and sharing as the operationalization of eWOM engagement.
The relative frequency of FreeWOM occurrences in the form of liking is visualized per
humor category in Figure 38 on the following page.
740 Cochran, William G. (1950), p. 256-266 | Patil, Kashinath D. (1975), p. 186-189 |
Lund, Adam/Lund, Mark, Webpage of: Lund Research Ltd (2019). Section on Cochran’s Q test. 741 Ibid.
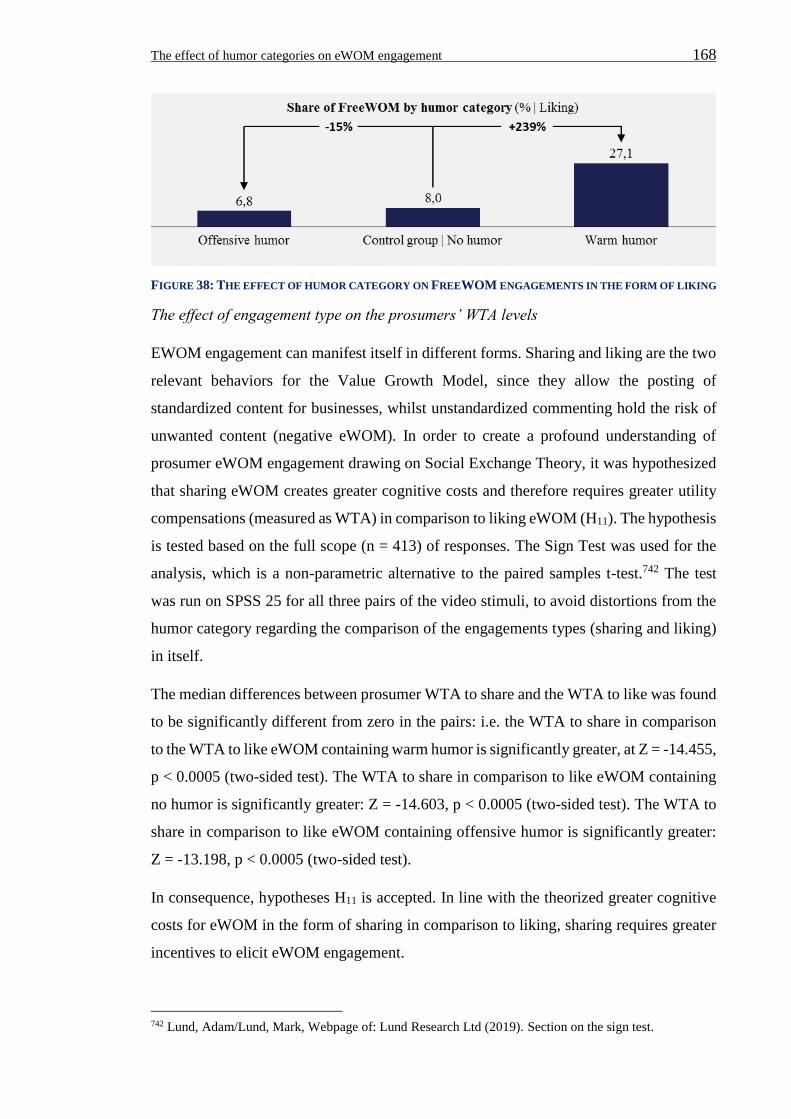
The effect of humor categories on eWOM engagement 168
FIGURE 38: THE EFFECT OF HUMOR CATEGORY ON FREEWOM ENGAGEMENTS IN THE FORM OF LIKING
The effect of engagement type on the prosumers’ WTA levels
EWOM engagement can manifest itself in different forms. Sharing and liking are the two
relevant behaviors for the Value Growth Model, since they allow the posting of
standardized content for businesses, whilst unstandardized commenting hold the risk of
unwanted content (negative eWOM). In order to create a profound understanding of
prosumer eWOM engagement drawing on Social Exchange Theory, it was hypothesized
that sharing eWOM creates greater cognitive costs and therefore requires greater utility
compensations (measured as WTA) in comparison to liking eWOM (H11). The hypothesis
is tested based on the full scope (n = 413) of responses. The Sign Test was used for the
analysis, which is a non-parametric alternative to the paired samples t-test.742 The test
was run on SPSS 25 for all three pairs of the video stimuli, to avoid distortions from the
humor category regarding the comparison of the engagements types (sharing and liking)
in itself.
The median differences between prosumer WTA to share and the WTA to like was found
to be significantly different from zero in the pairs: i.e. the WTA to share in comparison
to the WTA to like eWOM containing warm humor is significantly greater, at Z = -14.455,
p < 0.0005 (two-sided test). The WTA to share in comparison to like eWOM containing
no humor is significantly greater: Z = -14.603, p < 0.0005 (two-sided test). The WTA to
share in comparison to like eWOM containing offensive humor is significantly greater:
Z = -13.198, p < 0.0005 (two-sided test).
In consequence, hypotheses H11 is accepted. In line with the theorized greater cognitive
costs for eWOM in the form of sharing in comparison to liking, sharing requires greater
incentives to elicit eWOM engagement.
742 Lund, Adam/Lund, Mark, Webpage of: Lund Research Ltd (2019). Section on the sign test.
The effect of humor categories on eWOM engagement 169
4.5.2.3 FINDINGS ON CONTROL VARIABLES
During the statistical analyses the potential effect of common confounding variables from
humor and eWOM research (gender, education, employment) were controlled to account
for the purposefully heterogeneous socio-demographic characteristics within the sample.
No significant moderation or main effects were found. Moreover, no significant effects
(α = 0.05) were found regarding the additional control variables (age, income, brand
personality, brand experience, brand identification and the number of Facebook contacts).
The main effect of the humor category on the WTA levels remained significant (p < 0.05)
across all the tests. Thus, the results were found to be generalizable without limitation
across the socio-demographic segments.
4.5.3 SYNTHESIS AND DISCUSSION
In extant literature, the effect of humor on eWOM engagement lacked a sound
theorization. Furthermore, the unidimensional treatment of the multidimensional
construct humor left vital research gaps unanswered regarding the effect of humor
categories, and led to contradictory findings and recommendations about the use of humor
to elicit prosumer eWOM engagement. Therefore, it was the objective of this study to
empirically test the theoretical propositions that were derived from merging Social
Exchange Theory with humor theories, based on a novel set of hypotheses that close these
extant research gaps. Therefore, investigating the effect of humor categories on prosumer
eWOM engagement have both advanced theoretical knowledge and resolved the
contradictory managerial implications.
To test the hypotheses, a rigorous research design was developed and conducted to ensure
the reliability and validity of the findings. With great care, the study stimuli were selected
based on a pre-study and the planned manipulations were tested on an individual level
during the main study to establish valid research results. The potentially confounding
factors that could have offered alternative explanations for the causal relationship
between the humor category and the WTA levels to engage in eWOM were controlled by
holding these other factors constant. Specifically, real-world stimuli were consistently
drawn from smart’s social media campaigns, which are homogenous regarding the
eWOM archetype and design (product category, brand, corporate design, video length
etc.), and heterogeneous regarding the independent variable in the design (humor
category). For the purpose of external validity, a heterogeneous and large sample of
responses was used from the target population of experienced German social media users
The effect of humor categories on eWOM engagement 170
and online shoppers. The experiment was also conducted in a realistic online setting on
the respondents’ own devices, which contributed to the psychological realism of the
study.743 Moreover, the heterogeneous socio-demographic characteristics in the sample
were controlled during the analyses to reveal potential moderations. Since no moderation
effects were significant, the findings can be generalized without segmented
differentiations.
Drawing on two operationalizations of eWOM engagement (sharing and liking) and
assessed based on both a parametric (ANOVA) and non-parametric tests (Friedman Test),
consistently strong evidence for the stated hypothesis H9a was found. The prosumers’
WTA to engage in eWOM was lower for advertisements containing warm than no humor.
This is theoretically explained by the lower cognitive costs (procedural effort and risk of
negative peer reactions) and higher benefits (enhanced enjoyment through peer reactions
and positive curation of one’s digital persona) of eWOM containing warm humor.
Moreover, prosumers’ stated significantly lower WTA levels of only about a third for
engaging in eWOM which contained warm in comparison to offensive humor. Therefore,
hypothesis H9b was accepted. The finding was in line with the theoretical reasoning that
prosumers perceive greater cognitive costs for sharing offensive humor, due to the
potential negative peer reactions and negative curation of one’s digital persona with, for
example, sexist traits.
Furthermore, the prosumers’ WTA to engage in eWOM was lower for advertisements
containing no rather than offensive humor. The results were consistent and highly
significant across both operationalizations and in both tests. Therefore, it is concluded
that the increased cognitive costs of potential negative peer reactions and the negative
curation of one’s digital persona through offensive humor overcompensates the benefits,
like the chance of enhanced enjoyment in comparison to the control group of the non-
humorous eWOM.
An overview of the results of the hypotheses tests is presented in Table 15 on the
following page.
743 Baumeister, Roy F./Vohs, Kathleen D. (2007), p. 275.
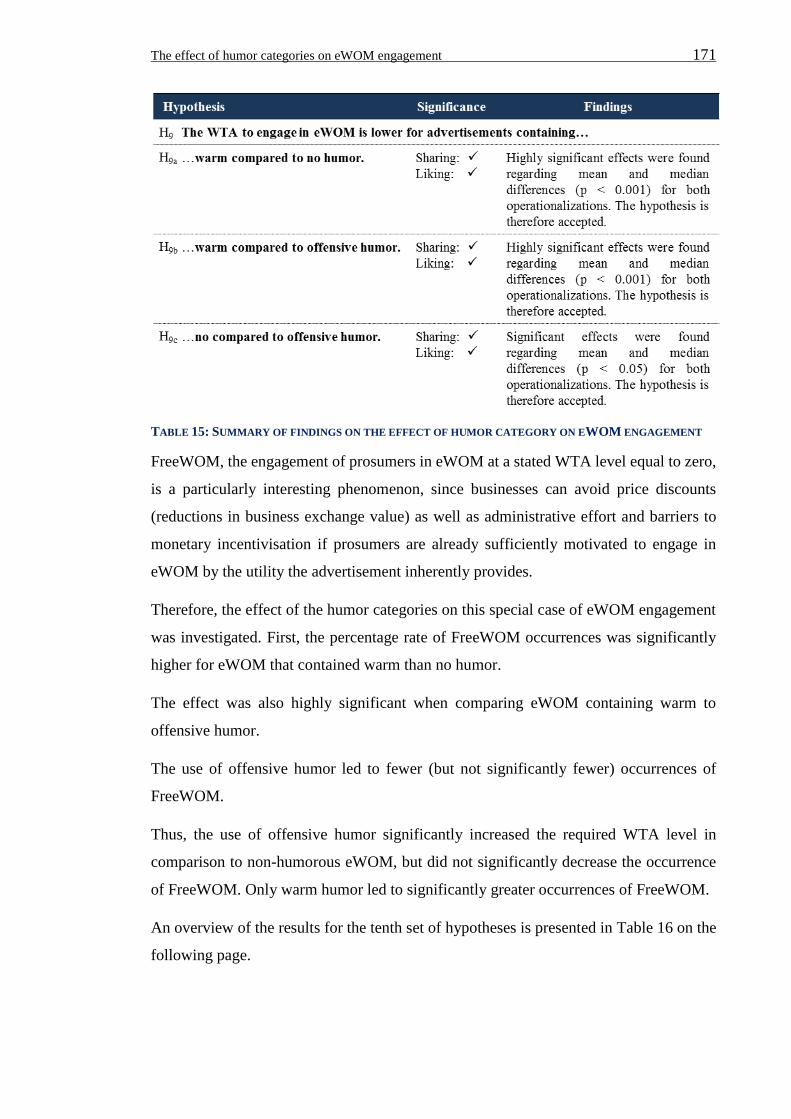
The effect of humor categories on eWOM engagement 171
TABLE 15: SUMMARY OF FINDINGS ON THE EFFECT OF HUMOR CATEGORY ON EWOM ENGAGEMENT
FreeWOM, the engagement of prosumers in eWOM at a stated WTA level equal to zero,
is a particularly interesting phenomenon, since businesses can avoid price discounts
(reductions in business exchange value) as well as administrative effort and barriers to
monetary incentivisation if prosumers are already sufficiently motivated to engage in
eWOM by the utility the advertisement inherently provides.
Therefore, the effect of the humor categories on this special case of eWOM engagement
was investigated. First, the percentage rate of FreeWOM occurrences was significantly
higher for eWOM that contained warm than no humor.
The effect was also highly significant when comparing eWOM containing warm to
offensive humor.
The use of offensive humor led to fewer (but not significantly fewer) occurrences of
FreeWOM.
Thus, the use of offensive humor significantly increased the required WTA level in
comparison to non-humorous eWOM, but did not significantly decrease the occurrence
of FreeWOM. Only warm humor led to significantly greater occurrences of FreeWOM.
An overview of the results for the tenth set of hypotheses is presented in Table 16 on the
following page.
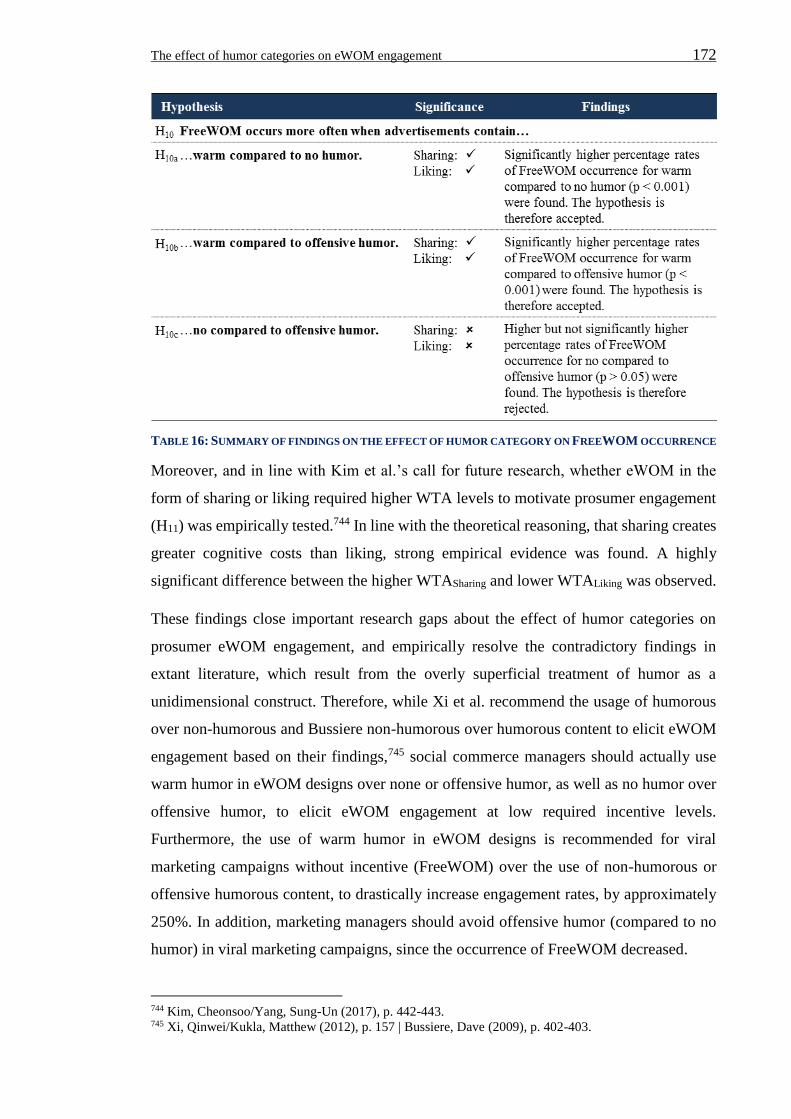
The effect of humor categories on eWOM engagement 172
TABLE 16: SUMMARY OF FINDINGS ON THE EFFECT OF HUMOR CATEGORY ON FREEWOM OCCURRENCE
Moreover, and in line with Kim et al.’s call for future research, whether eWOM in the
form of sharing or liking required higher WTA levels to motivate prosumer engagement
(H11) was empirically tested.744 In line with the theoretical reasoning, that sharing creates
greater cognitive costs than liking, strong empirical evidence was found. A highly
significant difference between the higher WTASharing and lower WTALiking was observed.
These findings close important research gaps about the effect of humor categories on
prosumer eWOM engagement, and empirically resolve the contradictory findings in
extant literature, which result from the overly superficial treatment of humor as a
unidimensional construct. Therefore, while Xi et al. recommend the usage of humorous
over non-humorous and Bussiere non-humorous over humorous content to elicit eWOM
engagement based on their findings,745 social commerce managers should actually use
warm humor in eWOM designs over none or offensive humor, as well as no humor over
offensive humor, to elicit eWOM engagement at low required incentive levels.
Furthermore, the use of warm humor in eWOM designs is recommended for viral
marketing campaigns without incentive (FreeWOM) over the use of non-humorous or
offensive humorous content, to drastically increase engagement rates, by approximately
250%. In addition, marketing managers should avoid offensive humor (compared to no
humor) in viral marketing campaigns, since the occurrence of FreeWOM decreased.
744 Kim, Cheonsoo/Yang, Sung-Un (2017), p. 442-443. 745 Xi, Qinwei/Kukla, Matthew (2012), p. 157 | Bussiere, Dave (2009), p. 402-403.
The effect of humor categories on eWOM engagement 173
Limitations and future research
Although the rigorous research design and sound statistical analyses mitigated many
common limitations in marketing research, the results of this study need to be considered
in light of a number of limitations. First, the target population was exclusively defined as
German social media and social commerce users. Therefore, the generalizability of the
results in other cultural areas with different humor preferences might be limited. Future
research could replicate the study in fundamentally different cultural areas, such as China.
Second, Facebook was consistently defined as the network channel for eWOM
engagements. During the conduct of the experiment in mid-2018, Facebook received a
lot of negative press, since the network’s influence on the US elections came to light
(Cambridge Analytica’s personalized campaigns for the Republicans, plus scandals about
Russian and Iranian fake accounts) and Facebook admitted to selling personal user data
to Amazon, Apple and Microsoft, among others.746 Although criticism about the social
media giant is not uncommon, the especially large degree of media attention might have
affected the perceived cognitive costs of eWOM engagement and thus the stated WTA
levels. Nevertheless, this presumed effect would be constant across the three conditions,
thus it should not have affected the relative pairwise comparisons.
Third, in order to enable the high internal validity of the experimental design, authentic,
real-world advertisements were used in the experiment, but the respondents were not
required to actually share or like the eWOM under the different conditions at the stated
WTA levels. Thus, the results draw on hypothetical settings rather than actual market data
from social commerce exchanges. Moreover, the measurement of WTA is prone to bias
due to strategic behavior by the respondents. Future research should therefore resolve
these limitations by cooperation with a business, to investigate actual rather than
experimental eWOM engagement behavior and WTA levels.
Fourth, the research was solely conducted in a B2C scenario and only on a hedonic
network. Future research should address these limitations by testing the generalizability
of the results on a utilitarian network, since prosumers might evaluate humor in eWOM
designs differently on professional networks.
746 Lapowsky, Issie, Webpage of: Wired (2018).
Discussion 174
5 DISCUSSION
5.1 RESULTS AND THEORETICAL CONTRIBUTIONS
5.1.1 GENERAL SYNTHESIS AND OVERVIEW
In this doctoral thesis, the disconnected research fields of pricing and eWOM were
merged by conceptualizing the Value Growth Model of social commerce. It guides from
the prevailing win-lose paradigm toward the win-win paradigm of simultaneously
increased prosumer utility and business value. This novel model draws on the hitherto
un-described disproportional relationship between prosumer cognitive effort and business
value, related to the non-monetary price component of eWOM. Moreover, Locke et al.’s
grounded theory of developing opportunities for contribution was systematically applied
in the chosen research field of social commerce from the prosumers’ perspective.747
Therefore, the synthesis of the extant publications cumulated the agreed knowledge and
yielded a number of incompletions (research gaps), with respect to the determinants of
prosumer engagement in eWOM. Moreover, contradictory findings were identified which
indicate inadequacies in extant literature. Subsequently, relevant research questions that
address the problems found (incompletions and inadequacies) were stated. The three main
research questions were:
(1) Which eWOM inherent attributes do prosumers evaluate when they go through the
decision-making process of engaging in eWOM on social media networks, and how
important are those?
(2) What are the prosumers’ preferences for the attribute levels?
(3) How does the multidimensional construct humor affect the prosumers’ eWOM
engagement regarding WTA levels and FreeWOM occurrences?
These research questions combined with the merged foundations Social Exchange Theory
and humor theories were used to develop relevant hypotheses. The conducted empirical
investigation of the research questions and hypotheses addressed the opportunities for
contribution and thus advanced the field of social commerce research.
In the following, these key contributions are summarized.
747 Locke, Karen/Golden-Biddle/Karen (1997), p. 1023-1062.
Discussion 175
First, the existing literature neglects the eWOM inherent attributes that determine
prosumer engagement on social media networks. This incompletion led to ambiguous
(low validity) and thus inadequate research designs, with contradicting findings as a
consequence. To mitigate this inadequacy, the attributes that constitute the distinct
eWOM archetypes were empirically researched and represented in the first eWOM
taxonomy of eight mutually exclusive and collectively exhaustive decision attributes.
Researchers in social commerce can use this advancement to create unambiguous
research designs from the prosumers’ perspective and control for potentially confounding
factors in their analyses. This key contribution is elaborated upon in Chapter 5.1.2.
Second, besides the decision attributes themselves, their relative importance and the
prosumers’ preferences for the manifestations of these attributes (levels) are
comprehensively unknown and contradictory in terms of the incomplete fragments found
in extant publications. Hence, the lacunae regarding the inherent eWOM determinants of
prosumer engagement and the resulting inability to predict prosumer eWOM
engagements form a blind spot in social commerce literature. To shed light on this
research gap, an empirical study748 that represented the theorized conjunctive prosumer
decision making process was conducted, resulting in highly reliable and valid results.
These results, in the form of attribute importances and level preferences, explain and
predict prosumer eWOM engagement and empirically underpin the theoretical
propositions of Social Exchange Theory in prosumer behavior on social media networks.
These findings are elaborated upon in Chapter 5.1.3.
Third, the few existing studies in social commerce literature cover humor as a
unidimensional construct, ignoring the evidence from humor research, and as a
consequence provide contradictory findings. To overcome this incompleteness and
inadequacy, the theoretical knowledge from humor research was integrated into the
theoretical framework of Social Exchange Theory. Subsequently, hypotheses were
derived and empirically tested to advance the field of social commerce. As hypothesized,
highly significant effects of the independent variable humor category on the prosumers’
WTA to engage in eWOM were found. Notably, the conceptualization and investigation
of FreeWOM also merged the fields of eWOM and viral marketing research, since viral
748 In contrast to the questionable, common practice in social commerce research to generalize findings
from data of convenience samples, a heterogeneous sample of experienced German social media and e-
commerce users was gathered above the required quantity to ensure representativeness at a conservative
confidence level of 95% and confidence interval of +/-5%.
Discussion 176
marketing represents successful eWOM campaigns without monetary incentives. Hence,
the findings theoretically explained and empirically showed why some (but not all
humorous) advertisements are shared without monetary incentive, although eWOM in
general is associated with cognitive costs, and the monetary reward respectively
compensation is the most important decision attribute. This third key contribution is
elaborated upon in Chapter 5.1.4.
5.1.2 THE EWOM TAXONOMY
In the early years of social commerce research, the undifferentiated treatment of eWOM
might have been acceptable. Nowadays, eWOM on social media networks manifests itself
in so many different ways that a differentiated treatment is inevitable. The current
superficial treatment of eWOM in many studies is problematic, along the entire research
process. During the research design and data gathering, the unidimensional
conceptualization and generic measurement of eWOM intentions on Likert scales (e.g.
Mishra et al. and Liang et al.749) leave a lot of uncontrolled space for the respondents’
subjective interpretations. This compromises the content validity of the research designs
and thus meaningful analysis of the data.
Furthermore, the uncontrolled usage of different eWOM archetypes in stimuli to research
the effect of influencing factors of eWOM engagement (e.g. Lee et al.750) is biased, due
to the evident effect of the varying archetype utilities on eWOM engagement. The
practice of comparing inconsistent settings within research designs and between research
designs reduces the generalizability and repeatability of the results. Consequently,
contradictions in extant literature include the (in-)significant effect of monetary
incentives and incentive levels on eWOM engagement.
The first research question therefore referred to inherent eWOM attributes, which the
prosumers evaluate as they go through the decision making process of engaging in eWOM
on social media networks. The empirical exploration of these eWOM inherent attributes
provides guidance for developing unambiguous research designs and thus enabling
meaningful analyses, as well as generalizable conclusions.
Drawing on a saturated data base and rigorous QCA, eight attributes were found that
prosumers evaluate during the decision-making process of eWOM engagement. In
749 Mishra, Anubhav/Maheswarappa, Satish S./Maity, Moutusy/Samu, Sridhar (2018), p. 483. Liang, Silvia Wan-Ju/Ekinci, Yuksel/Occhiocupo, Nicoletta/Whyatt, Georgina (2013), p. 584-606. 750 Lee, Seung Hwan/Brandt, Alan/Groff, Yuni/Lopez, Alyssa/Neavin, Tyler (2017), p. 86-87.
Discussion 177
alphabetical order, these are (1) the attitude towards the content, (2) the degree of self-
disclosure, (3) the discount value, (4) the media type, (5) the network channel, (6) the
peer discount, (7) the product category, and the (8) purchase value. These determine
whether or not prosumers engage in eWOM over the course of social commerce
exchanges. The almost perfect inter-coder reliability (ĸ = 0.85) across more than 200
relevant coding units indicated the high quality of the results. Therefore, researchers
should use the taxonomy to clearly define eWOM-related questions, enabling an adequate
interpretation and, consequently, meaningful answers. In case researchers wish to use
different eWOM stimuli in their research designs, the inherent eWOM attributes should
be held constant or controlled. This helps to rule out any confounding effects due to the
comparison of different archetypes. The taxonomy served the purpose of exploring the
unknown decision attributes inherent in eWOM manifestations, and is therefore limited
to answering the question: what matters? To create a deeper understanding of and even
predict eWOM engagement decisions based on the propositions of Social Exchange
Theory further insights were needed, which are covered in the following contribution.
5.1.3 THE ATTRIBUTE IMPORTANCES AND PROSUMER PREFERENCES
Although the antecedents of eWOM are thematized frequently in social commerce
research, surprisingly, the eWOM inherent determinants of prosumer engagement still
form a lacunae in extant literature. In line with the aforementioned problems of treating
eWOM as a unidimensional construct, a deeper understanding of the decision attributes
is needed to (1) test the theoretical explanation of the phenomenon, (2) shed light on the
present contradictory findings based on an adequate research design, and (3) close the
research gaps regarding the unknown relative attribute importances, prosumer
preferences, socio-demographic effects and attribute level interactions. Therefore, and in
in line with Han et al.’s call for future research,751 three research questions were raised:
How important are the decision attributes regarding utility-motivated choice
behavior to engage in eWOM?
What are the prosumers’ preferences for the distinct attribute levels?
Does the attribute ‘price discount’ affect prosumer choice behavior for eWOM
engagement?
751 Han, Hui/Xu, Hongyi/Chen, Hongquan (2018), p. 46-47.
Discussion 178
Answering these questions not only closed relevant research gaps, but also validated the
findings of the explorative QCA, based on a different research setting and methodology.
Drawing on a sophisticated, Adaptive Choice-based Conjoint design, a representative
sample for the target group, and a discrete choice analysis, the following attribute
importances during prosumer decision-making were found: peer discount (5%), degree
of self-disclosure (9%), product category (9%), media type (12%), purchase value (12%),
network channel (13%), attitude towards content (15%) and discount value (25%).
The results confirm the previous findings of the QCA, since drawing on the eight
attributes, prosumer decisions in a subsequent CBC were predicted with a very high
predictive validity (more than 90%). In contrast to Tong et al.’s findings, the discount is
an important attribute of prosumer decision-making.752 As hypothesized, and in contrast
to Yen et al.’s findings, the greater discount levels provide greater utility and thus
significantly increase the occurrence of prosumer engagements.753 Therefore, the
procedural improvement of researching large and heterogeneous samples rather than
small convenience samples, as well as the conceptual improvement of treating eWOM as
multidimensional construct, resolved the contradictory findings in extant literature. In
response to Gvili et al.’s and Lin at al.’s calls for future research, it was found that
prosumers significantly prefer sharing eWOM on hedonic (as opposed to utilitarian)
networks.754 To be more specific, Facebook was the social media network that was the
preferred outlet for eWOM messages (with the lowest cognitive costs that needs to be
compensated). Prosumers also had the greatest number of network contacts on Facebook.
Facebook therefore provided the best ratio regarding the required discount level and
eWOM reach, as a proxy of eWOM value for social media managers.
As hypothesized, there was also a significant interaction effect between the network
channel and product category, since prosumers preferred to share matching product
categories (hedonic / utilitarian) on the respective social media networks. In addition, the
socio-demographic segment of academics perceived significantly greater thresholds for
eWOM engagement in comparison to non-academics, and thus engaged in fewer eWOM
archetypes respectively, requiring greater incentive levels.
752 Tong, Yu/Xinwei Wang and Hock-Hai Teo (2007), p. 7-8. 753 Yen, Chih-Lun Alan/Tang, Chun-Hung Hugo (2019), p. 14-15. 754 Gvili, Yaniv/Levy, Shalom (2016), p. 1044 | Lin, Yu-Hsiang/Hsu, Chia-Lin/Chen, Mei-Fang/Fang, Cheng-Hsi (2017), p. 393.
Discussion 179
By closing the identified research gaps in social commerce literature, the findings
contribute to the completeness of explaining prosumer engagement in eWOM on social
media networks. Furthermore, the theoretical propositions of Social Exchange Theory
were advanced through a more comprehensive list of cognitive cost factors and the
resulting varying levels of archetype utility from a prosumer perspective. Researchers
may use the findings to create sound research designs, drawing on eWOM as a
multidimensional construct and re-testing their unidimensional findings to ensure the
legitimate generalization of prior studies.
5.1.4 THE EFFECT OF THE HUMOR CATEGORY ON EWOM
ENGAGEMENT
Humor is repeatedly found in viral marketing and thus eWOM messages. Nevertheless,
the two fields of social commerce and humor research have hitherto not been sufficiently
linked. This becomes obvious when considering that humor is mostly treated as a simple,
unidimensional construct in social commerce research. The neglecting of evidence from
humor theory also affects the extant knowledge about the influence of humor in eWOM
on prosumer engagement. Notably, the effect of the multidimensional construct ‘humor
category’ (warm and offensive humor in comparison to the control condition of no humor)
forms a lacunae. This is problematic, because the under-appreciated effect of humor
categories has led to contradictory findings about the generic effect of humor on prosumer
eWOM engagement.
To advance the field by closing the research gaps described, differing effects of humor
categories on eWOM engagement were theorized by integrating humor theory into the
utility-motivated decision-making process of Social Exchange Theory. As hypothesized,
a contrary effect of the two humor categories (warm and offensive) on eWOM
engagement in comparison to the control condition without humorous content was found.
Whilst prosumers stated significantly lower WTA levels for engaging in eWOM
containing warm humor, the WTA levels significantly increased over the control stimuli
under the offensive condition. In this regard, the sound within-subjects research design,
representative sample for the German target group and robust statistical methodologies
established a high level of reliability and validity of the results. Contradictory statements
about the effect of generic humor was therefore ascribed to the inadequate conception and
treatment of humor as a unidimensional construct in extant literature. In addition, eWOM
and viral marketing research were joined by introducing FreeWOM (eWOM at a
Discussion 180
monetary incentive level equal to zero). As hypothesized, significantly greater
occurrences of FreeWOM under the warm humor condition was found, in comparison to
offensive humor and the control condition no humor. FreeWOM under the offensive
stimulus occurred less frequently than in the control condition, but not significantly less.
Fellow researchers can use the findings to explain phenomena in the connected research
streams of eWOM and viral marketing. Furthermore, the evidence guides control of the
humor category in related between-stimuli designs, in order to avoid confounded results.
5.2 SUPPLEMENTARY STUDIES
5.2.1 COMPLEMENTING CONTEXT FOR THE REFLECTION OF THE MAIN
STUDIES
As reasoned in Chapter 1, the focus of the dissertation was set on the prosumer
perspective on the Value Growth Model of social commerce. In consequence, the main
empirical studies closed manifold research gaps regarding the determinants of prosumer
engagement in eWOM and the effect of humor categories on prosumer eWOM
engagement. In order to critically reflect on the significance of these main results for
social commerce managers and to complement the prosumer-oriented with business-
oriented research (the other perspective in the Value Growth Model), both the strategic
and the operational aspects of the Value Growth Model require consideration:
(1) The effect of the conceptualized eWOM offers on the prosumers’ experience
(strategic key success factor of social commerce business models755); and
(2) The formation of eWOM engagement value for businesses
(operational determinant of the maximum price discount offered in the model756).
The investigation of these strategic and operational issues provides complementing
context and thus enriches the discussion of the dissertation in three ways.
First, the complementary research contributions mitigate limitations in scope of the main
studies. Furthermore, the managerial implications of the main studies are substantiated
through insights on both strategic and operational decision criteria regarding the
implementation and management of the Value Growth Model. Thirdly, the conceptual
groundwork concerning the eWOM engagement value depicts a systematic structure and
framework for future research in the field of social commerce.
755 See Chapter 2.3.1 and Lemon, Katherine N./Verhoef, Peter C. (2016), p. 69-96. 756 See Ceiling Discount introduced in Chapter 2.3.2.
Discussion 181
5.2.2 THE EFFECT OF EWOM OFFERS ON THE PRICING EXPERIENCE
5.2.2.1 CONCEPTUAL FOUNDATIONS
Hu et al. define the user-generated and socially empowered customer experience as a
distinct feature of social commerce businesses, in contrast to the rather passive customer
experience in e-commerce.757 The Value Growth Model is such a manifestation of the
prosumer’s interactive role in social commerce business models. It is an empowerment to
exchange more value by customizing the price composition based on both the traditional
monetary and novel non-monetary (eWOM) price components.
“Creating a strong customer experience is now a leading management objective”758, and
ever since Lemon et al.’s seminal paper in the Journal of Marketing, it is also an
established research field.759 Customer experience is defined as a multidimensional
construct that shows the customer’s responses (inter alia cognitive, social and behavioral)
to every aspect of a businesses’ offering.760 In a retail context, the overall experience
subsumes the prosumers’ functional experiences, like the pricing experience.761 The latter
occurs when the customer perceives and potentially pays the price during an exchange,
which includes the important processual dimension of price payment (payment
experience) in comparison to the sole observation of a price.762 Therefore, the Value
Growth Model, i.e. the offering of a price discount in return for an eWOM engagement,
alters the pricing process and thus potentially affects the prosumer’s pricing experience.
The effect of customer experience on prosumer eWOM engagement has been thematized
in hospitality management literature.763 Due to the novelty of the model and early stages
of customer experience research, the converse effect of eWOM offers on prosumer
pricing experience has, by contrast, not been researched. To close this lacunae, extant
literature and the inherent theory were used to develop sound hypotheses about the effect
of eWOM offers on the prosumers’ pricing experience as a supplementary study to the
previous studies on prosumer eWOM engagement. In other words, while the four
previous studies empirically shed light on the determinants of prosumer eWOM
757 Hu, Tao/Dai, Hua/Salam, A. F. (2018), p. 251-254 | Li, Chia-Ying (2017), p. 282-288. 758 Lemon, Katherine N./Verhoef, Peter C. (2016), p. 69. 759 Lemon, Katherine N./Verhoef, Peter C. (2016), p. 69-96. 760 Ibid., p. 70-71 | Schwager, Andre/Meyer, Chris (2007), p. 117. 761 Lemon, Katherine N./Verhoef, Peter C. (2016), p. 70 | Grewal, Dhruv/Levy, Michael/Kumar, V. (2009), p. 2-6. 762 Ibid., p. 2-6 | Humphry, David B./Kim, Moshe/Vale, Bent (2012), p. 216-222. 763 Jeong, EunHa/Jang, SooCheong (2011), p. 356-366.
Discussion 182
engagement, this study complements the insights regarding the effect of eWOM offers on
prosumer pricing experience.
Besides the theoretical contribution in the field of social commerce research, the study is
also important to better understand the managerial implications of the Value Growth
Model, since customer experience is a strategic success factor for social commerce
businesses.764
5.2.2.2 RESEARCH DESIGN
Prosumer experience depends on cognitive and affective factors, such as the
connectedness and other perceived benefits of the entire business offering.765
Connectedness is defined as the opportunity to interact and share information with peers
as well as the business through shop features. It is a dimension of the business model’s
sociability (see Chapter 2.3.1) from the prosumers’ perspective. Itani et al. also found that
the prosumers value the opportunity to participate in the social commerce business model
to receive personal appreciation and for the empowerment to serve psychological motives
like altruism, as elaborated upon in Chapter 3.1.766 The other perceived effects of the
eWOM offer refer to the general offering and convenience of the purchasing process.767
In this regard, prosumers compare their subjective expectations to their actual perceptions
of, for example, purchasing process steps (customer journey), which leads to
(dis-)conformation, (dis-)satisfaction and thus a positive or negative experience.768 The
Value Growth Model is a sociability feature that represents a means for improved
connectedness. It adds a component to the offer (the non-monetary price component
eWOM in return for a price discount), which can (dis-)satisfy the prosumers’ expectations
of the offered discount. Therefore, there might be a moderated effect of the eWOM offer
on the prosumers’ pricing experience, depending on prosumer ratios between their
discount expectation (WTA level) and the actual discount offer, immanent in the eWOM
archetype (‘discount satisfaction’).
In the first case of dissatisfaction (WTA > discount), the prosumer’s WTA is higher than
the price discount offered. These prosumers value the opportunity to connect but
764 Zhang, Hong/Lu, Yaobin/Gupta, Sumeet/Zhao, Ling (2014), p. 1025-1027. 765 Rose, Susan/Clark, Moira/Samouel, Phillip/Hair, Neil (2012), p. 317-319. 766 Itani, Omar S./Kassar, Abdul-Nasser/Loureiro, Sandra Maria Correia (2019), p. 79-81. 767 Rose, Susan/Clark, Moira/Samouel, Phillip/Hair, Neil (2012), p. 309-317. 768 Lemon, Katherine N./Verhoef, Peter C. (2016), p. 71.
Discussion 183
experience additional costs during the payment process, since the additional procedural
effort is not compensated by a sufficiently beneficial price discount. Put simply, the
discount-dissatisfied prosumers invest time and attention on an unacceptable
(disappointing) offer and are thus left with additional, uncompensated transaction costs.
Hence, it was hypothesized that:
H12: The discount-dissatisfied prosumers perceive a worsened pricing experience,
including the eWOM offer, in comparison to their initial pricing experience.
In the second case of marginal satisfaction (WTA = discount), the prosumers with an
equal WTA level to the offered price discount are marginal accepters.769 In reference to
the term marginal buyers from WTP research, the marginal accepters perceive the offer
as marginally beneficial at the stated discount level and thus accept the offer, but would
reject the offer if there were slightly lower discounts. Besides the benefits of slightly
exceeding the discount expectations, increased connectedness and participation improve
the experience.
Therefore, it was hypothesized that:
H13: The marginally-satisfied prosumers perceive an improved pricing experience,
including the eWOM offer, in comparison to their initial pricing experience.
In the third case of a positive disconfirmation respectively exceeded satisfaction
(WTA < discount), the prosumers perceive the overarching cognitive benefits of greater
participation opportunities through eWOM offers. In addition, the general offer
(including the price) is more beneficial for the prosumer, since the WTA is overbid.
Therefore, it was hypothesized that:
H14: The exceedingly-satisfied prosumers perceive an improved pricing experience,
including the eWOM offer, in comparison to their initial pricing experience.
H15: The improvement in pricing experience is higher for exceedingly-satisfied over
marginally-satisfied prosumers.
In order to gather robust data for testing the hypothesis, an online survey was developed
that included an eWOM offer for an authentic advertisement, taken from Amazon’s
769 The term “marginal accepter” was derived from the equivalent in WTP research of “marginal buyers”. Marginal accepters are the prosumers who would start to reject the offer if the price discount is reduced any further.
Discussion 184
Facebook channel.770 For this reason, only actual social commerce (Amazon) and social
media (Facebook) users were permissible for the study to enable valid responses.
In the research design, the dependent variable of prosumer payment and thus pricing
experience was measured on Bagdare et al.’s adapted retail experience scale. It included
four items, representing the perceptions of joy, mood, leisure and distinctiveness, each
measured on a 5-point Likert scale.771 The independent variable of eWOM offers was
dichotomously coded (yes/no) and represented the within-subjects factor in the research
design. In this regard, the participants’ initial experiences as actual Amazon customers
was measured first.
Next, the manipulated process, including the eWOM offer, was illustrated, and the
experience was measured again. In this regard, the experience after the manipulated
condition was measured twice, to control affective short-term changes in the pricing
experience.
Specifically, the experience was measured directly after the perception of the manipulated
condition (immediate experience) and approximately two days later in a second study
(deferred experience). The design was thus a longitudinal (repeated, temporarily
separated measurement), within-subjects study with two surveys, resulting in three
measurements for each respondent.
The procedure and content of the two surveys is shown in Figure 39 on the following
page.
770 Cyber monday advertisement: Amazon.de, Webpage of: Amazon.de Facebook channel (2016). 771 Bagdare, Shilpa/Jain, Rajnish (2013), p. 795-799 | See Appendix A10. 1: Strongly disagree | 2: Disagree | 3: So-so | 4: Agree | 5: Strongly agree.
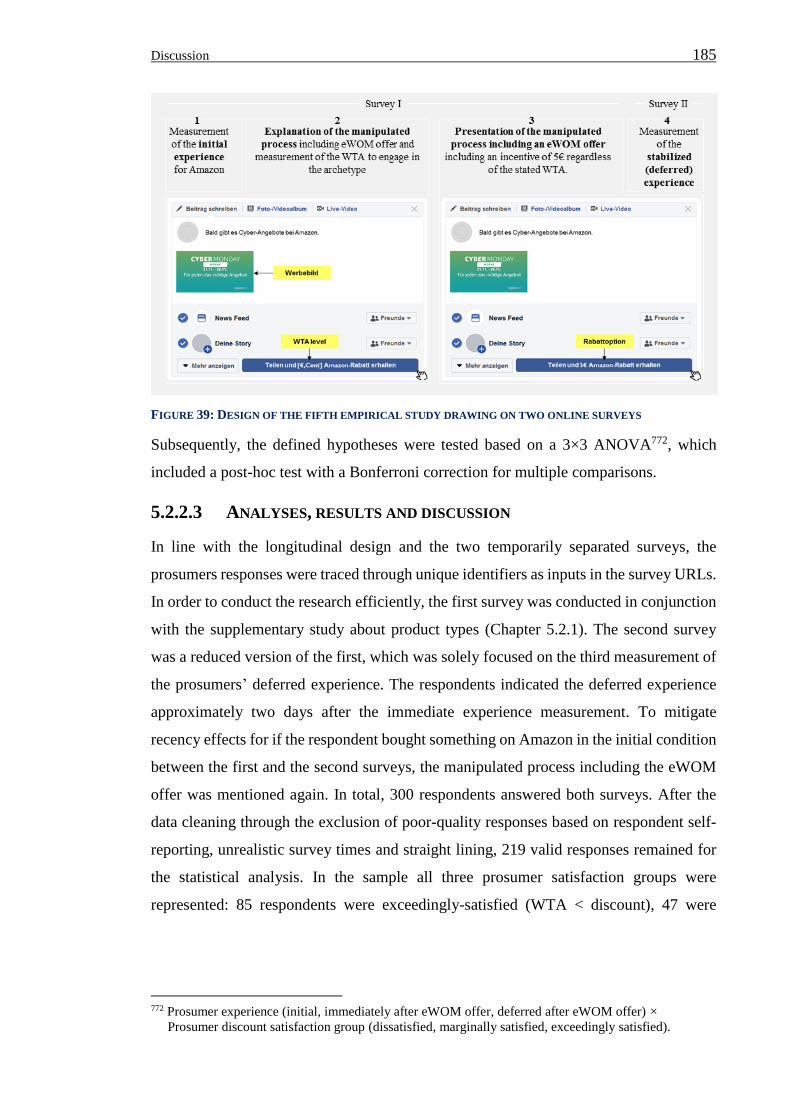
Discussion 185
FIGURE 39: DESIGN OF THE FIFTH EMPIRICAL STUDY DRAWING ON TWO ONLINE SURVEYS
Subsequently, the defined hypotheses were tested based on a 3×3 ANOVA772, which
included a post-hoc test with a Bonferroni correction for multiple comparisons.
5.2.2.3 ANALYSES, RESULTS AND DISCUSSION
In line with the longitudinal design and the two temporarily separated surveys, the
prosumers responses were traced through unique identifiers as inputs in the survey URLs.
In order to conduct the research efficiently, the first survey was conducted in conjunction
with the supplementary study about product types (Chapter 5.2.1). The second survey
was a reduced version of the first, which was solely focused on the third measurement of
the prosumers’ deferred experience. The respondents indicated the deferred experience
approximately two days after the immediate experience measurement. To mitigate
recency effects for if the respondent bought something on Amazon in the initial condition
between the first and the second surveys, the manipulated process including the eWOM
offer was mentioned again. In total, 300 respondents answered both surveys. After the
data cleaning through the exclusion of poor-quality responses based on respondent self-
reporting, unrealistic survey times and straight lining, 219 valid responses remained for
the statistical analysis. In the sample all three prosumer satisfaction groups were
represented: 85 respondents were exceedingly-satisfied (WTA < discount), 47 were
772 Prosumer experience (initial, immediately after eWOM offer, deferred after eWOM offer) ×
Prosumer discount satisfaction group (dissatisfied, marginally satisfied, exceedingly satisfied).
Discussion 186
marginally-satisfied (WTA = discount), and 87 were discount-dissatisfied (WTA >
discount) by the price discount offered for the eWOM engagement presented.
Drawing on this valid data sample, hypotheses H12-H14 were tested by running the 3×3
repeated measurers ANOVA. There was a highly significant within-subjects main effect
of the eWOM offer on the pricing experience: F(1.941, 419.198) = 16.306,
p < 0.0005, η² = 0.070.773 On an aggregated level, the prosumer pricing experience
significantly improved from x̅initial = 3.281 to x̅immediate = 3.526 (p < 0.0005) as well as
from the initial to the deferred experience (x̅deferred = 3.482) (p < 0.0005), whilst no
significant change occurred between the immediate and deferred measurement
(p = 0.873). Moreover, the hypothesized interaction effect of the prosumer satisfaction
was also highly significant: F(3.881, 419.198) = 6.453, p < 0.0005, η² = 0.056. Therefore,
the file was split in SPSS 25 into the three groups of the interacting variable (prosumer
discount satisfaction groups). Subsequently, the analysis was repeated for each group, in
order to investigate the hypothesized pairwise differences.
Surprisingly, in the group of dissatisfied prosumers, no significant difference was found
between the initial experience without the eWOM offer (x̅initial = 3.170) and the two
measurements after the integration of the eWOM offer (x̅immediate = 3.170 | x̅deferred =
3.210): F(1.879, 161.579) = 0.204, p = 0.802, η² = 0.002.774 This means that the
dissatisfying eWOM offer did not negatively affect the prosumers’ pricing experience. It
is assumed that the cognitive costs of dissatisfaction and analyzing the additional option
in the payment process were compensated for by the perceived cognitive benefits of the
expressed appreciation and the option of generally participating more in the social
commerce business.
In the group of marginally-satisfied prosumers, a significant main effect was found:
F(2, 92) = 6.535, p = 0.002, η² = 0.124. As hypothesized, the experience significantly
improved from the condition without the eWOM offer (x̅initial = 3.250) to the manipulated
condition including the eWOM offer (x̅immediate = 3.484): Δ 0.234 | 95%-CI, 0.440 to 0.028
| p = 0.010. The improvement remained significant regarding the comparison of the initial
experience and the deferred experience (x̅deferred = 3.505): Δ 0.255 | 95%-CI, 0.459 to
0.051 | p = 0.021. The difference between the immediate and deferred experience was not
773 Since Mauchly’s test revealed that sphericity could not be assumed (p = 0.004 | ε = 0.970), the Huynh-
Feldt correction was applied. 774 Since Mauchly’s test revealed that sphericity could not be assumed (p = 0.021 | ε = 0.939), the Huynh-
Feldt correction was applied.
Discussion 187
significant (p = 1.000), indicating a stable improvement in pricing experience. Hence, the
stated hypothesis was accepted.
In the group of exceedingly-satisfied prosumers, a significant main effect was found:
F(2, 168) = 25.331, p < 0.0005, η² = 0.232. As hypothesized, the experience significantly
improved between the initial condition without the eWOM offer (x̅initial = 3.424) and the
experience for the manipulated process, including the eWOM offer (x̅immediate = 3.921):
Δ 0.497 | 95%-CI, 0.672 to 0.322 | p < 0.0005. The improvement remained significant
regarding the comparison of the initial experience and the deferred experience (x̅deferred =
3.729): Δ 0.306 | 95%-CI, 0.487 to 0.125 | p < 0.0005. Therefore, the stated hypothesis
was accepted. In this regard, the difference between the immediate and deferred
experience was significant: Δ 0.191 | 95%-CI, 0.032 to 0.350 | p < 0.0005, thus the
improvement stabilized at a slightly lower level over time.
Furthermore, an independent samples t-test was run, to investigate the hypothesized
difference in pricing experience improvement between the marginally-satisfied and the
exceedingly-satisfied prosumers. As hypothesized, the improvement in experience for the
exceedingly-satisfied prosumers (x̅exc-sat-imm = 0.497) was greater than the improvement
of marginally-satisfied prosumers’ experience, when comparing the initial to the
immediate experiences (x̅mar-sat-imm = 0.234): t(130) = 2.296, p = 0.023, d = 0.042.
Interestingly, the difference became insignificant when comparing the initial to the
deferred experiences, because the two difference scores converged. Counterintuitively,
the experience improvement increased based on the deferred measurement for the
marginally-satisfied prosumers (x̅mar-sat-def = 0.255), while it decreased for the
exceedingly-satisfied prosumers (x̅exc-sat-def = 0.306): t(130) = 0.432, p = 0.666, d = 0.008.
A summary of the findings regarding the four raised and tested hypotheses H12-15 is
depicted on the following page in Table 17.
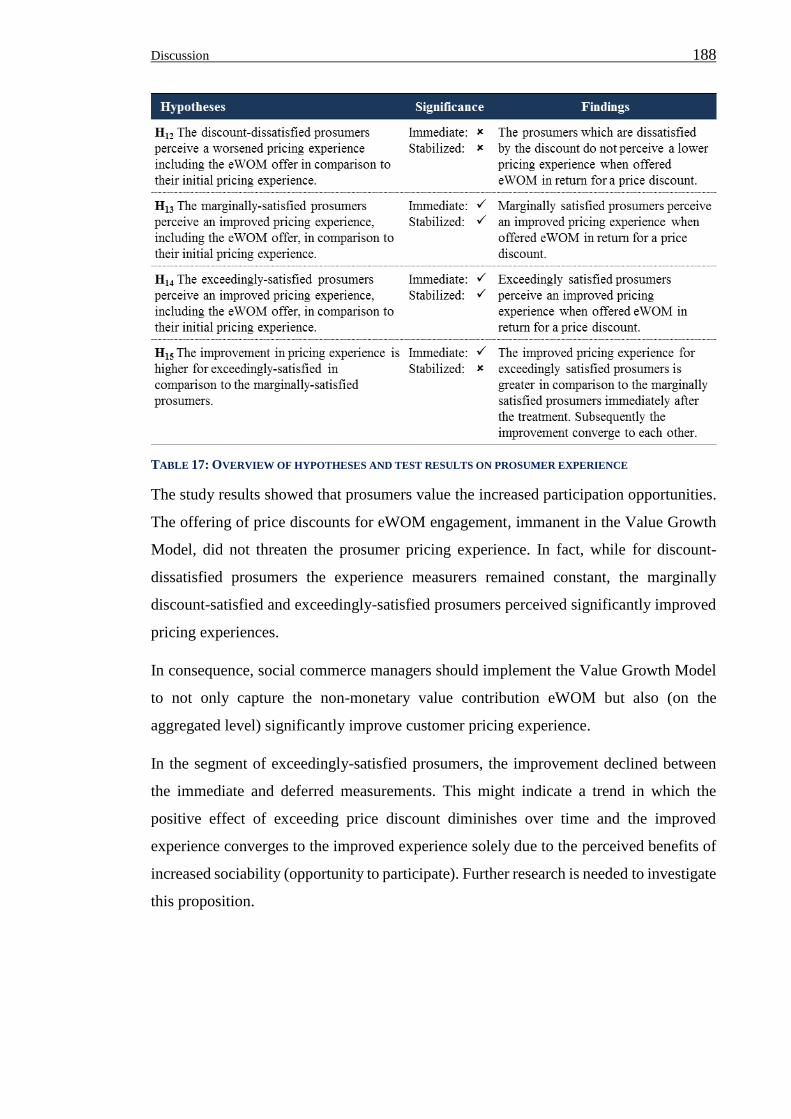
Discussion 188
TABLE 17: OVERVIEW OF HYPOTHESES AND TEST RESULTS ON PROSUMER EXPERIENCE
The study results showed that prosumers value the increased participation opportunities.
The offering of price discounts for eWOM engagement, immanent in the Value Growth
Model, did not threaten the prosumer pricing experience. In fact, while for discount-
dissatisfied prosumers the experience measurers remained constant, the marginally
discount-satisfied and exceedingly-satisfied prosumers perceived significantly improved
pricing experiences.
In consequence, social commerce managers should implement the Value Growth Model
to not only capture the non-monetary value contribution eWOM but also (on the
aggregated level) significantly improve customer pricing experience.
In the segment of exceedingly-satisfied prosumers, the improvement declined between
the immediate and deferred measurements. This might indicate a trend in which the
positive effect of exceeding price discount diminishes over time and the improved
experience converges to the improved experience solely due to the perceived benefits of
increased sociability (opportunity to participate). Further research is needed to investigate
this proposition.
Discussion 189
5.2.3 THE CONCEPT OF EWOM ENGAGEMENT VALUE
5.2.3.1 RESEARCH DESIGN
This doctoral thesis started with the conceptualization of the Value Growth Model, which
provides a novel perspective to overcoming the prevailing win-lose paradigm in
marketing, followed by five empirical studies that shed light on the prosumers’
perspective in the model. The dissertation focus was set on the prosumer’s perspective
toward the Value Growth Model, due to the manifold opportunities for contribution, the
research economy and the feasibility of conducting prosumer versus business-oriented
empiricism in this field and the limited resources (funding, time, scope of pages) available
for such dissertation projects. In this chapter, the prioritized prosumer perspective is
complemented by a second conceptual study about the business perspective on the value
of eWOM engagements on social media networks.
The value of (e)WOM has been researched repeatedly as an extension of the Customer
Lifetime Value (CLV) measure.775 These approaches miss a sound theorization and draw
on an important conceptual limitation, which is the unsubstantiated assumption of a
singular, directly-proportional relationship between the annual contribution margin of the
sender and the eWOM value.776 Since eWOM value is calculated as a product of the
prosumers’ monetary CLV, in current models, the eWOM value of a non-paying customer
is assumed to be equal to zero. Moreover, research on the value of one distinct eWOM
engagement is scarce and incomplete. In this regard, Trusov et al. investigated the
monetary value of e-mail invitations (referral) for social media networks, but do not
include a generalizable framework about how eWOM engagement value is created for
other eWOM types and business models.777 Therefore they state: “further research is
needed to determine whether our substantive findings generalize to other companies and
settings”778.
Although decreasingly pursued in marketing science, constructs (hypothetical concepts)
and nomological networks (relationships of constructs) are of major importance for
advancing the marketing field when compared to solely empirical papers, due to the
novelty of knowledge and disproportionally higher citation rates.779 The
775 Green, Teegan Courtney Clare/Hartley, Nicole (2015), p. 301-320 | Weinberg, Bruce D./Berger, Paul D. (2011), p. 328-344. 776 Weinberg, Bruce D./Berger, Paul D. (2011), p. 339. 777 Trusov, M./Bucklin, R. E./Pauwels, K. (2009), p. 100. 778 Ibid., p. 98. 779 Yadav, Manjit S. (2010), p. 1-2 | MacInnis, Deborah J. (2011), p. 146-151.
Discussion 190
conceptualization of eWOM engagement value is an important contribution to better
understand the determinants of eWOM engagement value by (1) defining the construct
eWOM engagement value as a distinct research entity as well as a dependent variable, and
(2) explicating the inherent determining constructs (independent and moderator
variables).
Drawing on Rational Choice Theory780, profitability-maximizing businesses offer only
profitable eWOM archetypes (higher eWOM engagement value than discount costs). The
eWOM engagement value therefore determines the maximum offered discount (Ceiling
Discount) in the Value Growth Model. In other words, it is the determinant (maximum
offered discount by the business) of the determinant (discount value as a determinant of
prosumer engagement). Scholars and practitioners alike agree that eWOM depicts a
crucial value contribution for businesses. The unanswered question is, what determines
the value of one distinct engagement of eWOM?
Answering this question sheds a light on a phenomenon which is, currently, poorly-
understood in theory, deriving an agenda for future empirical research and guiding
businesses to offering profitable eWOM designs in the course of operational Social
Commerce management.
MacInnis’ framework, from her article in the Journal of Marketing, is a rigorous guide
for conceptual contributions, which is pursued in this study.781 Consequently, the entities
of this research study are defined as the eWOM engagement value and its determining
factors (constructs), as well as their relationships (nomological network). In this regard,
these constructs (and their relationships) are established and coherently defined.
Subsequently, the constructs are explained in greater detail by specifying the related
lower-level constructs, as well as their relationships through the (1) summarization of
extant knowledge and (2) delineation in the sense of logical, deductive reasoning to
expand knowledge within a novel nomological network of eWOM engagement value for
businesses.782
780 Rational Choice Theory, in line with Social Exchange Theory, draws on the Utilitarian Exchange
paradigm. It emphasizes the algorithmic analysis of economic costs and benefits, and explains
organizational behavior based on profit maximization. It depicts the most suitable theory to explain
business decision making processes, supported by the software agents commonly applied in social
commerce operations. (see Burns et al. 2016) 781 MacInnis, Deborah J. (2011), p. 136-154. 782 Cronbach, Lee J./Meehl, Paul E. (1955), p. 292-293.
Discussion 191
5.2.3.2 CONCEPTUALIZATION
The conceptualization of eWOM engagement value requires clear construct definitions
(identification), a concise summary of what is known (summarization) and a coherent
expansion of the latter through deductive reasoning (delineation) in order to develop a
comprehensive nomological network.783
(1) Identification: the establishment and definition of constructs
One might ask the question: why the distinction of eWOM engagement value? Isn’t it
more or less the same as the eWOM referral value, divided by the number of eWOM
referrals? It is necessary to be more precise regarding the theorization, involved constructs
as well as their relationships, and less focused on isolated, anecdotal cases to create a
valid and generalizable understanding of eWOM engagement value. Drawing on extant
concept definitions and the propositions of the Rational Choice Theory, first eWOM
engagement value and then the integrated constructs are defined.
The eWOM engagement value subsumes the benefits for a business which result from
one specific act and type of communicating commercial content on social media networks
by a sending prosumer to a network of receivers.
The constructs eWOM type, sender and receivers therefore determine the varying degrees
of eWOM engagement value for businesses (see Figure 40). The dependent construct
eWOM engagement value comprises all the effects that are subjectively perceived as
beneficial by a business to serve its objectives.784 The construct business is an
organization that, in light of the Rational Choice Theory, operates a business model to
pursue the objective of profit maximization.785 The multidimensional construct eWOM
manifests itself in many different forms, depending on the engagement (sharing and
liking), archetype attributes (see Chapter 3.4.2.6) and tone (positive / negative), among
other things. It therefore affects the resulting value, e.g. due to the varying visibility on
network channels and resultant peer attention.786 The eWOM sender is the
communicating individual that becomes an agent of the commercial content, such as an
advertisement text, by posting it under their profile in social media networks.787 The
783 MacInnis, Deborah J. (2011), p. 143-145. 784 Burns, Tom/Roszkowska, Ewa (2016), p. 197. 785 Ibid., p. 197-198 | Harris, Neil (2001), p. 49-54 | Yunus, Muhammad/Moingeon, Bertrand/Lehmann-Ortega, Laurence (2010), p. 308-325. 786 See chapter 2.2.2 and 3.4.2.6. 787 Oeldorf-Hirsch, Anne/Sundar, S. Shyam (2015), p. 242.
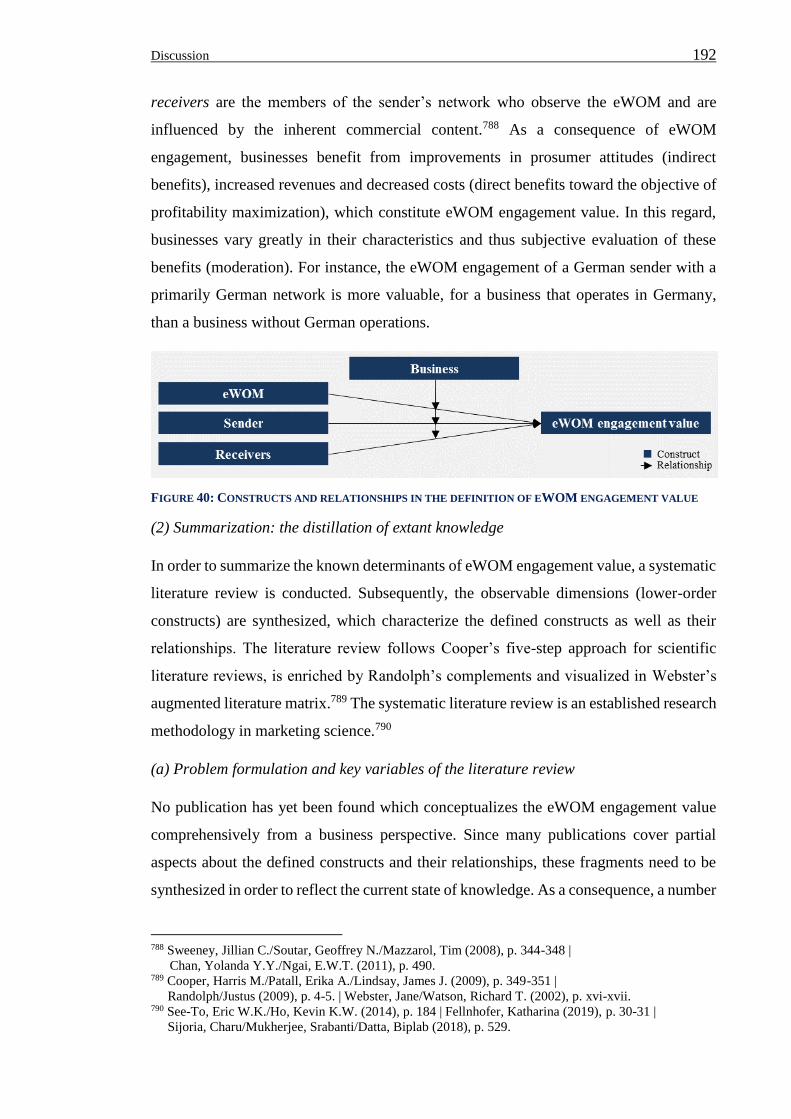
Discussion 192
receivers are the members of the sender’s network who observe the eWOM and are
influenced by the inherent commercial content.788 As a consequence of eWOM
engagement, businesses benefit from improvements in prosumer attitudes (indirect
benefits), increased revenues and decreased costs (direct benefits toward the objective of
profitability maximization), which constitute eWOM engagement value. In this regard,
businesses vary greatly in their characteristics and thus subjective evaluation of these
benefits (moderation). For instance, the eWOM engagement of a German sender with a
primarily German network is more valuable, for a business that operates in Germany,
than a business without German operations.
FIGURE 40: CONSTRUCTS AND RELATIONSHIPS IN THE DEFINITION OF EWOM ENGAGEMENT VALUE
(2) Summarization: the distillation of extant knowledge
In order to summarize the known determinants of eWOM engagement value, a systematic
literature review is conducted. Subsequently, the observable dimensions (lower-order
constructs) are synthesized, which characterize the defined constructs as well as their
relationships. The literature review follows Cooper’s five-step approach for scientific
literature reviews, is enriched by Randolph’s complements and visualized in Webster’s
augmented literature matrix.789 The systematic literature review is an established research
methodology in marketing science.790
(a) Problem formulation and key variables of the literature review
No publication has yet been found which conceptualizes the eWOM engagement value
comprehensively from a business perspective. Since many publications cover partial
aspects about the defined constructs and their relationships, these fragments need to be
synthesized in order to reflect the current state of knowledge. As a consequence, a number
788 Sweeney, Jillian C./Soutar, Geoffrey N./Mazzarol, Tim (2008), p. 344-348 |
Chan, Yolanda Y.Y./Ngai, E.W.T. (2011), p. 490. 789 Cooper, Harris M./Patall, Erika A./Lindsay, James J. (2009), p. 349-351 | Randolph/Justus (2009), p. 4-5. | Webster, Jane/Watson, Richard T. (2002), p. xvi-xvii. 790 See-To, Eric W.K./Ho, Kevin K.W. (2014), p. 184 | Fellnhofer, Katharina (2019), p. 30-31 | Sijoria, Charu/Mukherjee, Srabanti/Datta, Biplab (2018), p. 529.
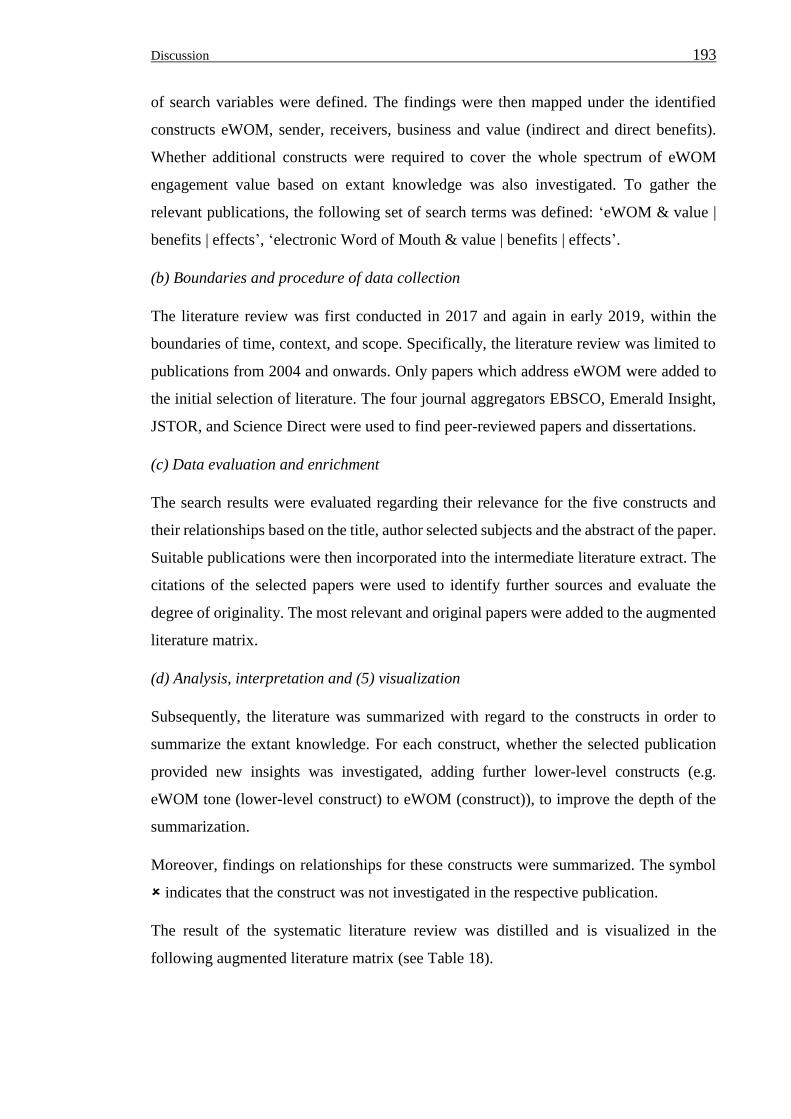
Discussion 193
of search variables were defined. The findings were then mapped under the identified
constructs eWOM, sender, receivers, business and value (indirect and direct benefits).
Whether additional constructs were required to cover the whole spectrum of eWOM
engagement value based on extant knowledge was also investigated. To gather the
relevant publications, the following set of search terms was defined: ‘eWOM & value |
benefits | effects’, ‘electronic Word of Mouth & value | benefits | effects’.
(b) Boundaries and procedure of data collection
The literature review was first conducted in 2017 and again in early 2019, within the
boundaries of time, context, and scope. Specifically, the literature review was limited to
publications from 2004 and onwards. Only papers which address eWOM were added to
the initial selection of literature. The four journal aggregators EBSCO, Emerald Insight,
JSTOR, and Science Direct were used to find peer-reviewed papers and dissertations.
(c) Data evaluation and enrichment
The search results were evaluated regarding their relevance for the five constructs and
their relationships based on the title, author selected subjects and the abstract of the paper.
Suitable publications were then incorporated into the intermediate literature extract. The
citations of the selected papers were used to identify further sources and evaluate the
degree of originality. The most relevant and original papers were added to the augmented
literature matrix.
(d) Analysis, interpretation and (5) visualization
Subsequently, the literature was summarized with regard to the constructs in order to
summarize the extant knowledge. For each construct, whether the selected publication
provided new insights was investigated, adding further lower-level constructs (e.g.
eWOM tone (lower-level construct) to eWOM (construct)), to improve the depth of the
summarization.
Moreover, findings on relationships for these constructs were summarized. The symbol
indicates that the construct was not investigated in the respective publication.
The result of the systematic literature review was distilled and is visualized in the
following augmented literature matrix (see Table 18).
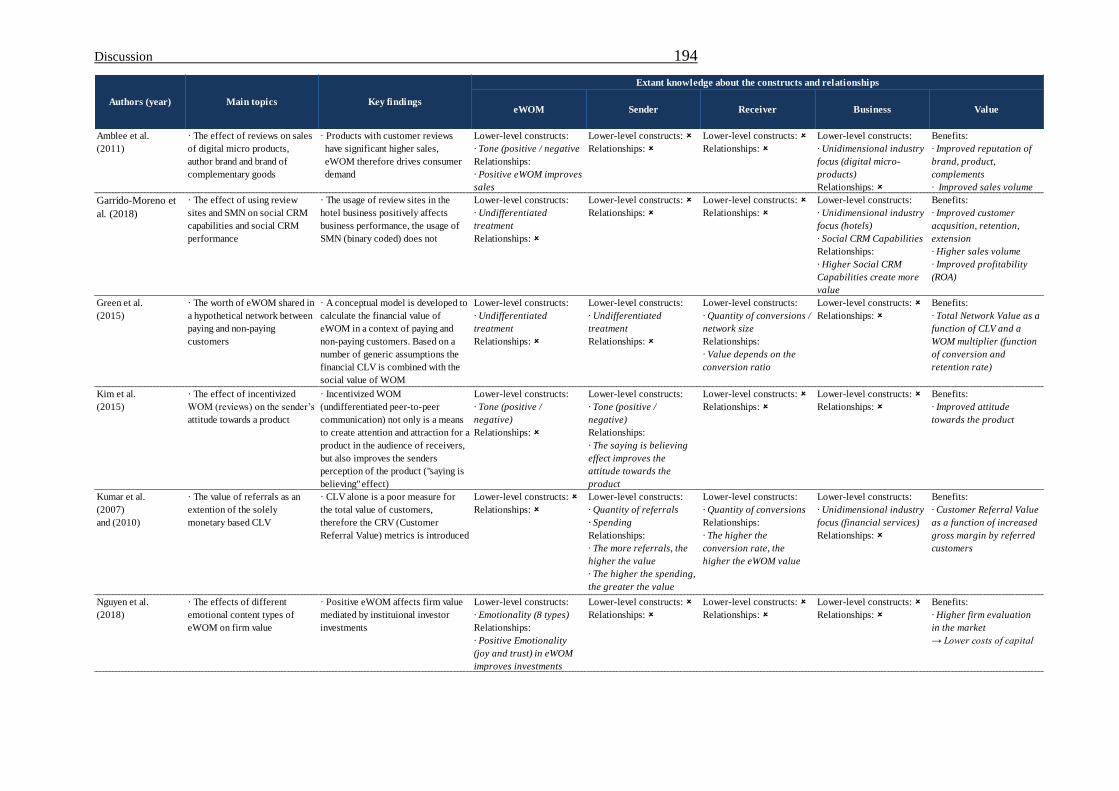
Discussion 194
eWOM Sender Receiver Business Value
Amblee et al.
(2011)
· The effect of reviews on sales
of digital micro products,
author brand and brand of
complementary goods
· Products with customer reviews
have significant higher sales,
eWOM therefore drives consumer
demand
Lower-level constructs:
· Tone (positive / negative
Relationships:
· Positive eWOM improves
sales
Lower-level constructs:
Relationships:
Lower-level constructs:
Relationships:
Lower-level constructs:
· Unidimensional industry
focus (digital micro-
products)
Relationships:
Benefits:
· Improved reputation of
brand, product,
complements
· Improved sales volume
Garrido-Moreno et
al. (2018)
· The effect of using review
sites and SMN on social CRM
capabilities and social CRM
performance
· The usage of review sites in the
hotel business positively affects
business performance, the usage of
SMN (binary coded) does not
Lower-level constructs:
· Undifferentiated
treatment
Relationships:
Lower-level constructs:
Relationships:
Lower-level constructs:
Relationships:
Lower-level constructs:
· Unidimensional industry
focus (hotels)
· Social CRM Capabilities
Relationships:
· Higher Social CRM
Capabilities create more
value
Benefits:
· Improved customer
acqusition, retention,
extension
· Higher sales volume
· Improved profitability
(ROA)
Green et al.
(2015)
· The worth of eWOM shared in
a hypothetical network between
paying and non-paying
customers
· A conceptual model is developed to
calculate the financial value of
eWOM in a context of paying and
non-paying customers. Based on a
number of generic assumptions the
financial CLV is combined with the
social value of WOM
Lower-level constructs:
· Undifferentiated
treatment
Relationships:
Lower-level constructs:
· Undifferentiated
treatment
Relationships:
Lower-level constructs:
· Quantity of conversions /
network size
Relationships:
· Value depends on the
conversion ratio
Lower-level constructs:
Relationships:
Benefits:
· Total Network Value as a
function of CLV and a
WOM multiplier (function
of conversion and
retention rate)
Kim et al.
(2015)
· The effect of incentivized
WOM (reviews) on the sender’s
attitude towards a product
· Incentivized WOM
(undifferentiated peer-to-peer
communication) not only is a means
to create attention and attraction for a
product in the audience of receivers,
but also improves the senders
perception of the product ("saying is
believing" effect)
Lower-level constructs:
· Tone (positive /
negative)
Relationships:
Lower-level constructs:
· Tone (positive /
negative)
Relationships:
· The saying is believing
effect improves the
attitude towards the
product
Lower-level constructs:
Relationships:
Lower-level constructs:
Relationships:
Benefits:
· Improved attitude
towards the product
Kumar et al.
(2007)
and (2010)
· The value of referrals as an
extention of the solely
monetary based CLV
· CLV alone is a poor measure for
the total value of customers,
therefore the CRV (Customer
Referral Value) metrics is introduced
Lower-level constructs:
Relationships:
Lower-level constructs:
· Quantity of referrals
· Spending
Relationships:
· The more referrals, the
higher the value
· The higher the spending,
the greater the value
Lower-level constructs:
· Quantity of conversions
Relationships:
· The higher the
conversion rate, the
higher the eWOM value
Lower-level constructs:
· Unidimensional industry
focus (financial services)
Relationships:
Benefits:
· Customer Referral Value
as a function of increased
gross margin by referred
customers
Nguyen et al.
(2018)
· The effects of different
emotional content types of
eWOM on firm value
· Positive eWOM affects firm value
mediated by instituional investor
investments
Lower-level constructs:
· Emotionality (8 types)
Relationships:
· Positive Emotionality
(joy and trust) in eWOM
improves investments
Lower-level constructs:
Relationships:
Lower-level constructs:
Relationships:
Lower-level constructs:
Relationships:
Benefits:
· Higher firm evaluation
in the market
→ Lower costs of capital
Authors (year) Main topics
Extant knowledge about the constructs and relationships
Key findings
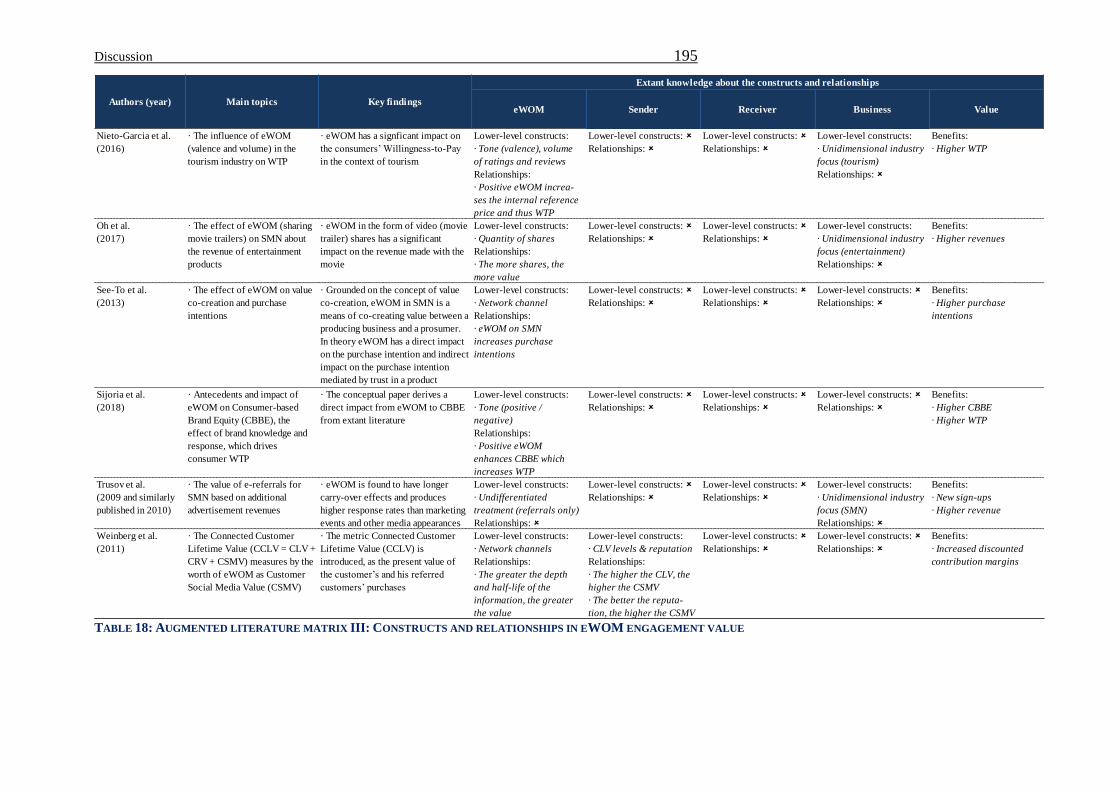
Discussion 195
TABLE 18: AUGMENTED LITERATURE MATRIX III: CONSTRUCTS AND RELATIONSHIPS IN EWOM ENGAGEMENT VALUE
eWOM Sender Receiver Business Value
Nieto-Garcia et al.
(2016)
· The influence of eWOM
(valence and volume) in the
tourism industry on WTP
· eWOM has a signficant impact on
the consumers’ Willingness-to-Pay
in the context of tourism
Lower-level constructs:
· Tone (valence), volume
of ratings and reviews
Relationships:
· Positive eWOM increa-
ses the internal reference
price and thus WTP
Lower-level constructs:
Relationships:
Lower-level constructs:
Relationships:
Lower-level constructs:
· Unidimensional industry
focus (tourism)
Relationships:
Benefits:
· Higher WTP
Oh et al.
(2017)
· The effect of eWOM (sharing
movie trailers) on SMN about
the revenue of entertainment
products
· eWOM in the form of video (movie
trailer) shares has a significant
impact on the revenue made with the
movie
Lower-level constructs:
· Quantity of shares
Relationships:
· The more shares, the
more value
Lower-level constructs:
Relationships:
Lower-level constructs:
Relationships:
Lower-level constructs:
· Unidimensional industry
focus (entertainment)
Relationships:
Benefits:
· Higher revenues
See-To et al.
(2013)
· The effect of eWOM on value
co-creation and purchase
intentions
· Grounded on the concept of value
co-creation, eWOM in SMN is a
means of co-creating value between a
producing business and a prosumer.
In theory eWOM has a direct impact
on the purchase intention and indirect
impact on the purchase intention
mediated by trust in a product
Lower-level constructs:
· Network channel
Relationships:
· eWOM on SMN
increases purchase
intentions
Lower-level constructs:
Relationships:
Lower-level constructs:
Relationships:
Lower-level constructs:
Relationships:
Benefits:
· Higher purchase
intentions
Sijoria et al.
(2018)
· Antecedents and impact of
eWOM on Consumer-based
Brand Equity (CBBE), the
effect of brand knowledge and
response, which drives
consumer WTP
· The conceptual paper derives a
direct impact from eWOM to CBBE
from extant literature
Lower-level constructs:
· Tone (positive /
negative)
Relationships:
· Positive eWOM
enhances CBBE which
increases WTP
Lower-level constructs:
Relationships:
Lower-level constructs:
Relationships:
Lower-level constructs:
Relationships:
Benefits:
· Higher CBBE
· Higher WTP
Trusov et al.
(2009 and similarly
published in 2010)
· The value of e-referrals for
SMN based on additional
advertisement revenues
· eWOM is found to have longer
carry-over effects and produces
higher response rates than marketing
events and other media appearances
Lower-level constructs:
· Undifferentiated
treatment (referrals only)
Relationships:
Lower-level constructs:
Relationships:
Lower-level constructs:
Relationships:
Lower-level constructs:
· Unidimensional industry
focus (SMN)
Relationships:
Benefits:
· New sign-ups
· Higher revenue
Weinberg et al.
(2011)
· The Connected Customer
Lifetime Value (CCLV = CLV +
CRV + CSMV) measures by the
worth of eWOM as Customer
Social Media Value (CSMV)
· The metric Connected Customer
Lifetime Value (CCLV) is
introduced, as the present value of
the customer’s and his referred
customers’ purchases
Lower-level constructs:
· Network channels
Relationships:
· The greater the depth
and half-life of the
information, the greater
the value
Lower-level constructs:
· CLV levels & reputation
Relationships:
· The higher the CLV, the
higher the CSMV
· The better the reputa-
tion, the higher the CSMV
Lower-level constructs:
Relationships:
Lower-level constructs:
Relationships:
Benefits:
· Increased discounted
contribution margins
Authors (year) Main topics
Extant knowledge about the constructs and relationships
Key findings
Discussion 196
(3) Delineation: framework expansion to create a comprehensive nomological network
In the following, the summarized insights are amalgamated and delineated with further
lower-level constructs. Complemented by their relationships, a nomological network of
eWOM engagement value for businesses is created. As a specification of the identified
constructs and relationships (see Figure 41), the definition of the lower-level constructs
and their relationships are reasoned about in the following.
eWOM engagement value
As introduced earlier, the eWOM engagement value depicts the sum of (in-)direct
benefits, which result from the manifestation of eWOM and the inherent exertion of
influence by a sender on their network of receivers.791 Direct benefits denote such lower-
level constructs, which are part of the equation to calculate the business profits:
(sales volume × price level) – costs = revenue – costs = profits. These direct benefits are
immediately conducive to the goal of profit maximization. Further indirect benefits
strategically contribute to improve these direct benefits. For instance, businesses value
the indirect benefit of an improved customer attitude towards their brand, due to the
positive effect on the direct benefits of complementary sales (sales volume) and higher
achievable price levels.792
eWOM → eWOM engagement value
Just as eWOM manifests itself in different forms from the prosumers’ perspective, it is a
multidimensional construct from the perspective of a business value as well. The lower-
level construct eWOM ‘tone’ (also valence) is defined as the sender’s communicated
judgement about a commercial entity (e.g. brand) and is manifested as either a positive,
neutral or negative tone.793 It congruently affects eWOM engagement value, i.e. a
positive-toned eWOM engagement, such as a positively-commented share of a purchase,
results in strategic benefits such as an improved prosumer attitude towards the brand,
product and complementary products794, as well as direct benefits such as higher
achievable price levels (increased WTP)795 and improved sales (volume and revenue)796.
Moreover, positive eWOM is more effective for influencing prosumer purchase decisions
791 Kumar, V./Mirchandani, Rohan (2012), p. 58 | Hubell, Charles H. (1965), p. 397-379. 792 Kudeshia, Chetna/Kumar, Amresh (2017), p. 320-323. 793 Babic, Ana/Sotgiu, Francesca/Valek, Kristine de/Bijmolt, Tammo H. A. (2015), p. 308. 794 Amblee, Naveen/Bui, Tung (2011), p. 91. 795 Nieto-García, Marta/Muñoz-Gallego, Pablo A./González-Benito, Óscar (2017), p. 67. 796 Babic, Ana/Sotgiu, Francesca/Valek, Kristine de/Bijmolt, Tammo H. A. (2015), p. 311-318.
Discussion 197
than advertising or personal selling, which can be used to reduce marketing costs and the
costs of customer acquisition.797 Due to the ‘saying is believing’ effect, these benefits not
only result from changes in the eWOM receivers but also in the senders, which in the case
of incentivized engagements, adapt their opinions as agents of the communicated
statements.798 In the following, only positively-toned eWOM is considered, since
businesses obviously only incentivize this type of eWOM in the Value Growth Model.
Emotionality refers to the sender’s expressions of feelings such as joy, anger, fear, disgust
or trust in the eWOM message. Businesses benefit from joy and trust cues in eWOM,
based on increasing investor stock investments and firm values (market capitalization),
which reduces the cost of capital and thus improves the financial business performance.799
Furthermore, it is delineated that expressions of joy increase customer attitudes and
purchases, since the communicated peer joy creates awareness and desire, which
promotes sales. The trust cues reduce the perceived transaction risk with the business and
thus also promote sales.
As introduced in Chapter 4.1.1, humorous eWOM in general improves prosumer
advertisement and brand recognition, attitudes and purchase intentions (indirect
benefits).800 Furthermore, warm humor can be used to reduce the eWOM costs (discount
levels) of the business, which is a means to improving net eWOM engagement value.801
The media type denotes the communication format which manifests itself in the form of
text, pictures (images) or videos. Videos create the greatest value, because they transport
the greatest depth of information (marketing message), stimulate both the visual and
audio sensory systems and thus wield the strongest influence on the direct and indirect
benefits of eWOM.802 Moreover, positive eWOM engagements containing pictures are
more beneficial than plain text messages, because they can include text elements, draw
greater attention on social media networks, and thus more strongly improve attitudes.803
The network channel is defined as the social media platform on which the eWOM is
posted. These channels vary by depth of information and the half-life of such
797 Ahrens, Jan/Coyle, James R./Strahilevitz, Michal Ann (2013), p. 1036 |Ryals, Lynette (2008), p. 851 | Gruen, Thomas W./Osmonbekov, Talai/Czaplewski, Andrew J. (2006), p. 450. 798 Kim, John/Naylor, Gillian/Sivadas, Eugene/Sugumaran, Vijayan (2015), p. 411. 799 Nguyen, Hang, Calantone, Roger, Krishnan, Ranjani (2018), p. 5-6. 800 Alden, Dana L./Mukherjee, Ashesh/Hoyer, Wayne D. (2000), p. 2-3 | Eisend, Martin (2009), p. 199. 801 See chapter 4. 802 Scheinbaum, Angeline Close/Hampel, Stefan/Kang, Mihyun (2017), p. 631-633. 803 Hoffman, Ernst/Daugherty, Terry (2013), p. 329 | Leung, Xi/Tanford, Sarah/Jiang, Lan (2017), p. 18.
Discussion 198
information.804 For instance, the number of text message characters on Twitter is, in 2019,
limited to 280 (low depth), snapchat posts are deleted automatically after 1-30 days and
can only be seen once (low half-life). Greater depth and half-life of information create
greater benefits, since the positive effects of eWOM receive more space and time to
influence the peers, e.g. in terms of brand attitude.805
Sender → eWOM engagement value
The eWOM sender is a determinant of eWOM engagement value, due to changes in
themselves (the ‘saying is believing effect’806) and the varying influence on peers, which
leads to new, retained (in-)direct benefits as described by the construct ‘eWOM’.807
The sender’s current spending (monetary value measured e.g. as a gross margin based
CLV) and disposable income is repeatedly mentioned as a determinant of eWOM
engagement value. The eWOM engagement can improve the sender’s attitude towards
the brand, which reduces the risk of brand change and thus loss of revenue. Furthermore,
a sender with a high disposable income and an improved attitude towards the brand is
more likely to buy complementary products by the brand, and thus increase revenue. Due
to the phenomenon of network assortativity, senders with a high monetary value are
connected with similar individuals and thus influence more valuable peers in their
network.808 The value of the peers is elaborated upon in the construct ‘receivers’.
Prosumers use the heuristic decision of relying on eWOM in times of information
overload, in order to reduce the cognitive effort of purchase decision-making.809 If a
sender frequently shares eWOM over short periods of time, it is likely that the receivers
give less attention to the sender’s eWOM. This reduces the sender’s influence and also
the eWOM engagement value, in comparison to less frequently-engaged and thus more
considered senders.
Another related lower-level construct is the sender’s trustworthiness, which denotes the
sender’s reputation in terms expertise and credibility within the network.810 The greater
804 Weinberg, Bruce D./Berger, Paul D. (2011), p. 334-335. 805 Ibid., p. 336. 806 Oeldorf-Hirsch, Anne/Sundar, S. Shyam (2015), p. 242 | Kim, John/Naylor, Gillian/Sivadas, Eugene/Sugumaran, Vijayan (2015), p. 411. 807 Lin, Xiaolin/Li, Yibai/Wang, Xuequn (2017), p. 190. 808 Haenlein, Michael/Libai, Barak (2013), p. 65. 809 Zhang, Kem Z.K./Zhao, Sesia J./Cheung, Christy M.K./Lee, Matthew K.O. (2014), p. 78-81. 810 Ibid., p. 82.
Discussion 199
the perceived trustworthiness, the greater the sender’s persuasiveness and thus the greater
their eWOM engagement value.
The network size refers to the quantity of connected peers on the social media platform,
who are potentially reached and thus influenced by the eWOM engagement.811 The
greater the network size, the greater the number of influenced peers and thus the greater
the eWOM engagement value. Since some receivers become senders themselves by
forwarding the eWOM, a greater number of initial receivers also creates greater eWOM
engagement value through network effects.
Receivers → eWOM engagement value
The influenced receivers vary for each eWOM engagement, which is the third
determinant of eWOM engagement value. Besides the quantity of receivers, which is
already considered in the form of the sender’s network size, a number of qualitative,
receiver-specific and lower-level constructs need to be differentiated, to depict their
impact on the (in-)direct benefits subsumed as the eWOM engagement value. First,
receivers vary in terms of the customer status, which refers to the general demand for the
product category (binary: yes/no), awareness of the product (binary), past purchases of
the brand (binary), past purchases of the product (binary) and brand loyalty (low to
high).812 The eWOM engagement value is greater for receivers that have a demand for
the eWOM inherent product category, that were previously unaware of the product,
purchased the brand but not the product before, and are less loyal to their current brand
(easier switching), since in these cases the greatest incremental effect on the (in-)direct
benefits such as revenue growth can be reached. These relationships are delineated in
Godes et al.’s and Dost et al.’s research, who found congruent effects regarding WOM
(not eWOM) based on free products for seeds rather than price discounts for buyers (as
conceptualized in the Value Growth Model).813
The receiver’s disposable income is defined as the monetary means which are available
for spending on goods.814 A higher disposable income for the receivers is a more lucrative
segment, since the eWOM influence allows for a greater improvement in revenues than
receivers with a low disposable income.
811 Weinberg, Bruce D./Berger, Paul D. (2011), p. 336. 812 Godes, David/Mayzlin, Dina (2009), p. 721. 813 Ibid., p. 721 | Dost, Florian/Sievert, Jens/Kassim, David (2016), p. 236-239. 814 Arnold, Roger A. (2010), p. 209.
Discussion 200
The receivers’ socio-demographic characteristics, such as gender and location, also
determine eWOM engagement value, since eWOM has a greater impact on purchase
intentions for male than female customers.815 Moreover, these factors often determine
target group membership of the receivers from the perspective of the business. This
moderated effect of socio-demographics on eWOM engagement value is elaborated upon
in the construct ‘business’.
The relationship between receiver and sender, in light of eWOM on social media
networks, describes the nature and roles of the connection. It manifests as either an
authoritative ranking (e.g. a superior and their employee), communal sharing (e.g. blood
relation between mother and son), equality matching (friends and other peers) or market
relationships (e.g. colleagues and customers).816 The tie-strength (perceived closeness),
on the other hand, describes the potency of the respective connection between the sender
and receiver.817 It is assumed that tie-strength positively correlates with the degree of
interaction (quantity and recency) on social media networks. In this regard, Facebook’s
algorithm gives more visibility (higher ranking) to posts on the receivers’ news feeds
from family and friends (relationship), as well as to more interactive connections (tie-
strength).818 Since greater post visibility leads to greater eWOM engagement influence,
these lower-level constructs affect the eWOM engagement value.
The moderating effect of the business construct
The aforementioned relationship between the three constructs that determine the
(in-)direct benefits which constitute eWOM engagement value is moderated by the
properties of the business involved. This means that, based on business-specific
characteristics, subjective evaluations of the benefits from an eWOM engagement result.
Simply put, a highly beneficial eWOM engagement for one business is not necessarily
highly beneficial for another. In the following, the relevant lower-level constructs and
their moderating effects are delineated.
First of all, businesses vary regarding their target markets, which refers to the strategic
combination of specific customer segments (target groups) with business offerings.
815 Fan, Yi-Wen/Miao, Yi-Feng (2012), p. 178-179. 816 Pongjit, Chompunuch/Beise-Zee, Rian (2015), p. 722. 817 Grannovetter, Mark (1973), p. 1361 | Mittal, Vikas/Huppertz, John W./Khare, Adwait (2008), p. 195. 818 Mosseri, Adam, Webpage of: Facebook, Inc. (2017).
Discussion 201
Therefore, the benefits of the sender’s and receivers’ socio-demographic characteristics
are subjectively evaluated based on the respective target group memberships.
The business capabilities refers to social commerce skills, like customer experience
design, online customer support (e.g. chatbots), retargeting and personalized offering,
which resonate with the eWOM to sales conversion rates. Hence, an eWOM engagement
for a business with high social commerce capabilities results in higher conversion rates,
more revenue and is therefore more valuable than for a business with low social
commerce capabilities.
The product properties refer to the type (tangible or service), utility (utilitarian or
hedonic) and lifecycle stages. The influencing effect of eWOM on sales about tangible
products is greater in comparison to services.819 The value of posting eWOM with
matching network purpose (utilitarian or hedonic) to the product utility is greater than to
mismatches, because prosumers are more likely to look for and thus be influenced by
matching eWOM. The product lifecycle stage (innovation, early introduction,
established) moderates which senders are the most beneficial to increase sales
revenues.820
The business’ operations moderate how valuable specific senders and receivers are, e.g.
based on the varying supply chain efficiency for varying customer locations. Thus, the
value of an eWOM engagement received by potential customers in a well-developed
region by one business results in low delivery costs and thus higher margins than the same
eWOM engagement with a lower value for a business with less-developed operations in
this region. In addition, eWOM engagement value is situationally moderated by the
operational ability to deliver, which is required to capture the beneficial effects of eWOM
on sales.
In line with McInnis’ quality criteria for contributions through summarization and
delineation, the constructs developed are visualized in boxes and the relationships through
arrows in a nomological network.821 The source of each construct is stated as either
summarization (author and publication year) or as a delineation, in the case of a
theoretical reasoning beyond the extant knowledge (see Figure 41 on the following page).
819 Babic, Ana/Sotgiu, Francesca/Valek, Kristine de/Bijmolt, Tammo H. A. (2015), p. 297. 820 Dost, Florian/Sievert, Jens/Kassim, David (2016), p. 236-239. 821 MacInnis, Deborah J. (2011), p.144.
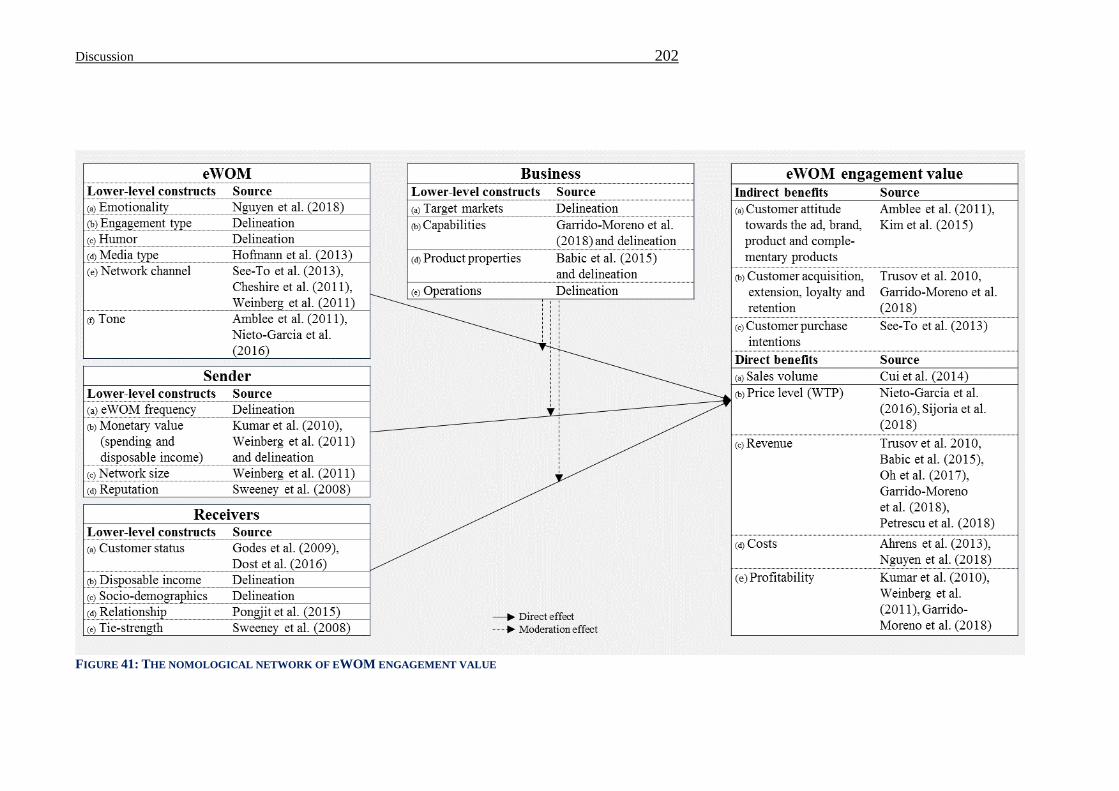
Discussion 202
FIGURE 41: THE NOMOLOGICAL NETWORK OF EWOM ENGAGEMENT VALUE
Discussion 203
5.2.3.3 DISCUSSION OF THE SUPPLEMENTARY STUDY
It was the objective of the second supplementary study to conceptualize the hitherto
neglected eWOM engagement value within a nomological network. MacInnis’
framework for developing conceptual contributions was systematically followed,
meaning the nomological network of eWOM engagement value is the result of the
identification of the inherent constructs, comprehensive summarization of relevant
knowledge and coherent delineation of the inherent lower-level constructs, as well as their
relationships. In addition, face validity and logical stringency were established through
discussions with fellow marketing researchers.
In line with Kumar et al.’s call for future research, the nomological network helps to better
understand the value of eWOM, which guides managers in designing profitable eWOM
incentives.822 Thus, the eWOM engagement value depicts the theoretical Ceiling
Discount in the Value Growth Model, which marketing managers can use to estimate the
range of profitable discounts in eWOM archetype designs. Moreover, researchers can use
the nomological network of eWOM engagement value to advance the currently
incomplete measures of the total customer lifetime value.
Although the nomological network substantially contributes, through identification,
summarization and delineation, to a previously-fragmented and incomplete phenomenon,
a couple of limitations are acknowledged that simultaneously represent directions for
future research.
For the purpose of complexity reduction, only the moderating effect of the business
construct and the network relationships on the level of constructs rather than lower-level
constructs were depicted. Thus, adding the neglected interactions between manifestations
of the lower-level constructs and potential further moderators should be addressed in
future research. Furthermore, conceptual contributions are, by definition, not empirical.
As a consequence, an empirical validation of the nomological network reflects an
important subject for future research. The exact translation of (in-)direct benefits in
monetary terms depicts a further lacunae which needs to be closed in the future, especially
to increase the managerial impact of the research in this field. The nomological network
of eWOM engagement value provides a framework to add and organize these avenues for
future research.
822 Kumar, V./Petersen, J. Andrew/Leone, Robert P. (2010), p. 17.
Discussion 204
5.2.4 SYNTHESIS OF SUPPLEMENTARY STUDIES
The purpose of the two supplementary studies in this discussion was to provide additional
insights that put the results of the main studies into a broader context for a more profound
interpretation, mitigate limitations in scope of the main studies, and create a framework
for future empirical contributions regarding the eWOM engagement value.
First, the offering of a price discount in return for an eWOM engagement represents a
change to the social commerce design features regarding the payment and thus pricing
process. The Value Growth Model can therefore affect the functional customer
experience, which represents a strategic success factor of social commerce business
models. In this regard, prosumer satisfaction with the discount offered was considered a
moderator variable, since the effect of eWOM offering on the prosumer pricing
experience was assumed to be different in the three manifestations of this interaction
variable. In fact, the offering of eWOM archetypes immanent in the Value Growth Model
had a positive, highly significant, and temporally stable effect on the pricing experience
of marginally-satisfied and highly-satisfied prosumers. It had no significant effect on the
pricing experience of prosumers, who have a greater WTA than the discount offer. The
Value Growth Model is therefore recommended for implementation in social commerce
practice.
Second, the price discount offered within eWOM archetypes is the most important
determiner of prosumer eWOM engagement. Drawing on Rational Choice Theory,
businesses offer only discounts that increase their exchange value in the sense of
increased profitability. The eWOM engagement value is therefore the Ceiling Discount
offered in eWOM archetypes to the prosumers. The hitherto-neglected eWOM
engagement value was therefore conceptualized in a nomological network. It depends on
the constructs eWOM type, sender, receiver and the specific business itself. The
constructs and relationships depicted in the nomological network can be systematically
researched in future empirical studies.
In summary, the results of the supplementary studies provide the relevant context for a
critical reflection on the main results, create fruitful avenues for future research, and
provide strategic and operational management implications that are elaborated upon in
the following chapter.
Discussion 205
5.3 MANAGERIAL IMPLICATIONS
5.3.1 BUSINESS MODELING AND PERFORMANCE MANAGEMENT
In times of growing digitization, eWOM exerts a decisive influence on prosumers’
attitudes and purchasing behavior. The ability of businesses to elicit eWOM can therefore
form a source of competitive advantage.823 Businesses that lack the ability to create
positive eWOM are increasingly excluded from the prosumers’ decision set in purchasing
situations. The conceptualized Value Growth Model shows an innovative business model
component that helps social commerce businesses, and those that seek to become one, to
increase their sociability and thus foster eWOM as a strategic value contribution. Today,
the Value Growth Model can easily be implemented through customizable apps like
‘Social Marketing + Share Offer’ on the social commerce platform Shopify.
Business modeling
How can social commerce business models be improved toward greater value captured,
prosumer utility and experience?
The conceptualized Value Growth Model provides strategists with an interactive feature
that can be integrated into social commerce business models. It creates the opportunity to
simultaneously improve prosumer utility and business value captured, based on the
disproportional relationship of prosumer cognitive costs and business value inherent in
eWOM (see Chapter 2.3.2). Both the business’ evaluation of the eWOM engagement
value and the prosumer’s perceived cognitive costs to engage are subjective. Therefore,
businesses should investigate the nomological network of eWOM engagement value, as
shown in Chapter 5.2.3, and estimate the individual range of profitable eWOM price
discounts along the dimensions of value from the sender, receiver, as well as the specific
eWOM features.
Businesses that offer the hedonic product types entertainment, travel, food and fashion
are particularly suited to the Value Growth Model, since prosumers have the greatest
willingness to share eWOM for these product types (see chapters 3.5 and 5.2.1).
Much the same as not every product offer is attractive for every customer, not every
eWOM offer is lucrative for every prosumer. This becomes evident in view of prosumers’
varying WTA levels and uniform incentives in practice. Nevertheless, the prosumer’s
823 Alvarez-Milán, Agarzelim/Felix, Reto/Rauschnabel, Philipp A./Hinsch, Christian (2018), p. 67.
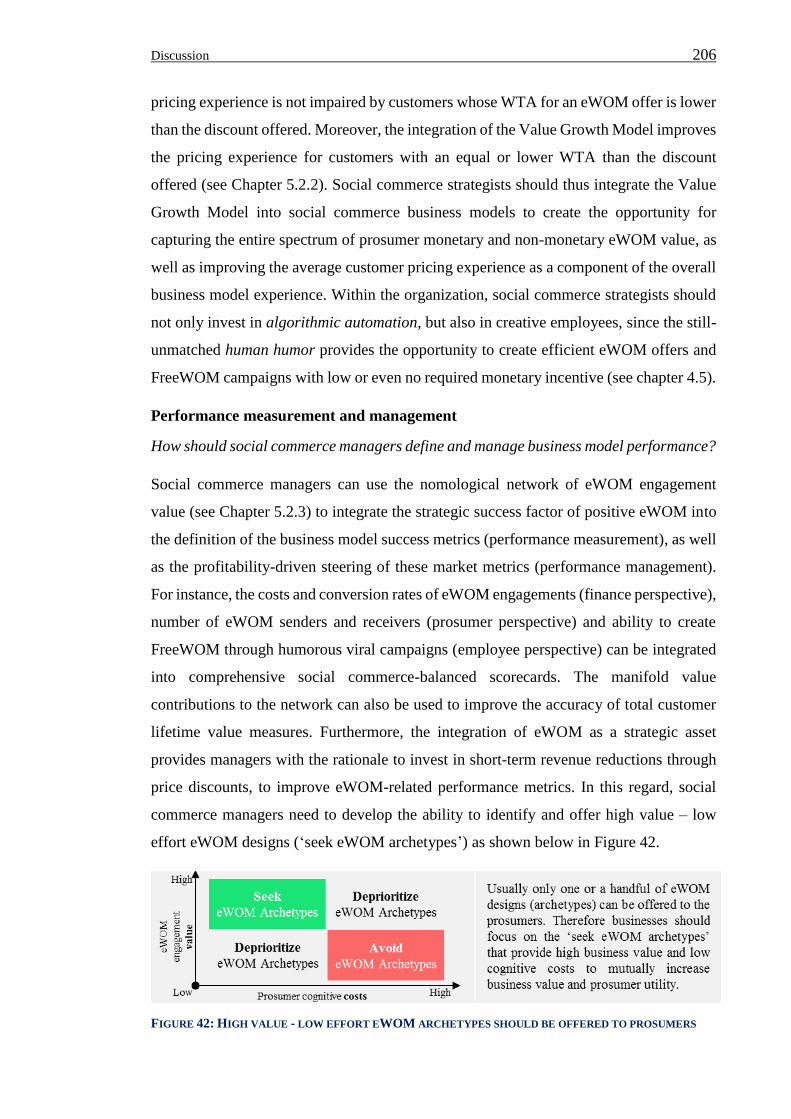
Discussion 206
pricing experience is not impaired by customers whose WTA for an eWOM offer is lower
than the discount offered. Moreover, the integration of the Value Growth Model improves
the pricing experience for customers with an equal or lower WTA than the discount
offered (see Chapter 5.2.2). Social commerce strategists should thus integrate the Value
Growth Model into social commerce business models to create the opportunity for
capturing the entire spectrum of prosumer monetary and non-monetary eWOM value, as
well as improving the average customer pricing experience as a component of the overall
business model experience. Within the organization, social commerce strategists should
not only invest in algorithmic automation, but also in creative employees, since the still-
unmatched human humor provides the opportunity to create efficient eWOM offers and
FreeWOM campaigns with low or even no required monetary incentive (see chapter 4.5).
Performance measurement and management
How should social commerce managers define and manage business model performance?
Social commerce managers can use the nomological network of eWOM engagement
value (see Chapter 5.2.3) to integrate the strategic success factor of positive eWOM into
the definition of the business model success metrics (performance measurement), as well
as the profitability-driven steering of these market metrics (performance management).
For instance, the costs and conversion rates of eWOM engagements (finance perspective),
number of eWOM senders and receivers (prosumer perspective) and ability to create
FreeWOM through humorous viral campaigns (employee perspective) can be integrated
into comprehensive social commerce-balanced scorecards. The manifold value
contributions to the network can also be used to improve the accuracy of total customer
lifetime value measures. Furthermore, the integration of eWOM as a strategic asset
provides managers with the rationale to invest in short-term revenue reductions through
price discounts, to improve eWOM-related performance metrics. In this regard, social
commerce managers need to develop the ability to identify and offer high value – low
effort eWOM designs (‘seek eWOM archetypes’) as shown below in Figure 42.
FIGURE 42: HIGH VALUE - LOW EFFORT EWOM ARCHETYPES SHOULD BE OFFERED TO PROSUMERS
Discussion 207
5.3.2 SOCIAL MEDIA MARKETING
Social media marketing (the promotion of goods and brands on digital platforms inter alia
through eWOM) is of great importance in times of digitization. The prosumers’ purchase
decision-making process is increasingly conducted in digital environments like social
media networks, and eWOM today exerts the greatest influence on prosumer purchase
decision-making.824 This changing customer behavior and online competition of global
businesses has recently caused McKinsey to herald the age of ‘Digital Darwinism’.825 In
this regard, businesses need to digitize and foster positive eWOM as a key survival and
success factor.826 Similarly, BCG estimates the volume of digitally-influenced sales in
emerging markets alone to “a staggering $3.9 trillion”827 between 2018 and 2022. Social
media marketing managers therefore require insights to foster the powerful phenomenon
of eWOM to remain competitive and participate in the online sales growth. However,
extant literature is, in many aspects, scarce and contradictory (e.g. eWOM decision
attributes from the prosumer’s perspective, effectiveness of monetary incentives, effect
of humor on eWOM engagement and so forth). The results of this dissertation therefore
imply numerous actionable results for marketing managers that have already integrated
eWOM into value contributions, or plan to do so in the future. In the following, a selection
of the most relevant, original and viable recommendations are presented in response to
the most problematic questions related to eWOM management on social media.
eWOM design and incentivisation
Are price discounts effective means of eliciting eWOM engagements or not?
The contradictory findings in extant literature on the effectiveness of monetary incentives
like price discounts on eWOM engagements were resolved based on reliable and valid,
qualitative and quantitative research. Strong evidence was found that discounts for the
sender are an effective means of eliciting eWOM engagements. Peer discounts to the
receivers, on the other hand, only slightly affect the sender’s eWOM engagement
decision. The answer then is yes, marketing managers should offer monetary incentives
(e.g. in the form of price discounts) to the sender and can expect increasing engagements
the higher the level of the incentive. Moreover, the required incentive level to motivate
prosumer engagement depends on the specific eWOM design: prosumers evaluate the
824 Kulmala, Marianne/Mesiranta, Nina/Tuominen, Pekka (2013), p. 21. 825 Bughin, Jacques (2015), p. 1-5. 826 Ibid., p. 1-5. 827 Jain, Nimisha, Walters, Jeff, Bharadwaj et al. The Boston Consulting Group (2018), p. 5-16.
Discussion 208
distinct design features of the eWOM offer, perceive varying degrees of utility, and derive
the monetary compensation (benefit) they are willing to accept for the eWOM
engagement.
Which factors need to be considered to design effective and efficient eWOM offers?
An effective eWOM offer is acceptable to the prosumer and thus provides them with
greater benefits than costs (positive utility). Besides the discount level, in an increasing
order of importance, the peer discount, degree of self-disclosure, product category, media
type, purchase value, network channel and the attitude towards the content determine the
prosumers perceived eWOM utility and thus engagement. Prosumers have distinct
preferences regarding the different manifestations (levels) of these decision attributes.
Less-preferred levels require a greater monetary compensation in order to motivate
eWOM engagement. Specifically, prosumers prefer lower levels of self-disclosure,
dislike mismatches between the primary usage of the network channel (hedonic or
utilitarian) and the advertised product category (hedonic or utilitarian), and generally
prefer to engage in eWOM on hedonic rather than utilitarian networks. Overall, Facebook
is the preferred (cheapest) network for eWOM engagements, thus this network channel
requires the lowest incentive levels to motivate eWOM engagement. In addition,
marketing managers can significantly reduce the required incentive level by including
warm humor in the advertisement, but increase the required incentive level through
offensive humor, due to higher cognitive costs from the sending prosumer’s perspective.
Marketing managers that already use or plan to implement the Value Growth Model
should then consider prosumer preferences and the cognitive costs of the manifold
eWOM designs to avoid unnecessarily high cognitive costs and thus higher required
incentive levels respective rejection rates. To avoid unnecessarily high incentives and
thus create efficient eWOM offers, marketing managers should apply a technique called
effort-based offering. It denotes the differentiation of eWOM incentive levels based on
the varying degrees of prosumer cognitive effort (negative utility) immanent in eWOM
designs. For instance, if a marketing manager seeks to elicit eWOM about entertainment
products, prosumers prefer to engage with hedonic rather than utilitarian networks.
Presumably, hedonic networks are also a better channel by which to reach customers in
the situational mood for hedonic goods, and are more likely to look for information about
such products. Facebook is the preferred hedonic network, with the greatest average reach
by network size in most countries. Instead of offering channel averages or arbitrary
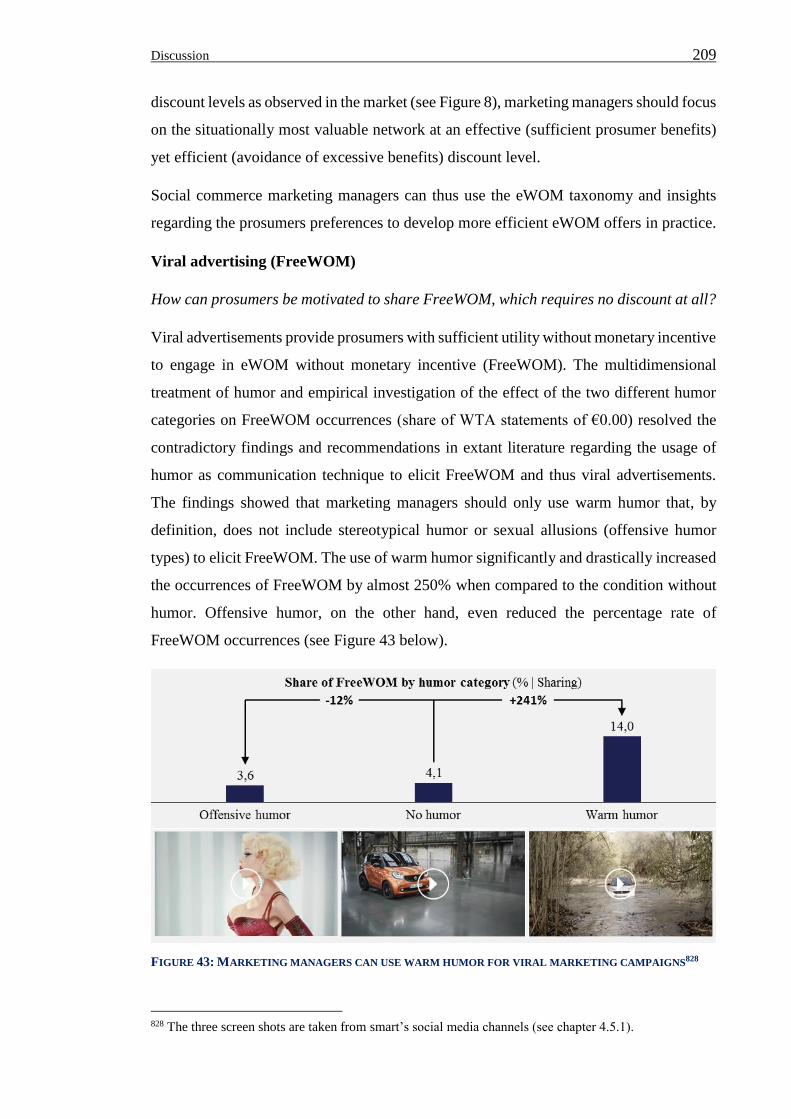
Discussion 209
discount levels as observed in the market (see Figure 8), marketing managers should focus
on the situationally most valuable network at an effective (sufficient prosumer benefits)
yet efficient (avoidance of excessive benefits) discount level.
Social commerce marketing managers can thus use the eWOM taxonomy and insights
regarding the prosumers preferences to develop more efficient eWOM offers in practice.
Viral advertising (FreeWOM)
How can prosumers be motivated to share FreeWOM, which requires no discount at all?
Viral advertisements provide prosumers with sufficient utility without monetary incentive
to engage in eWOM without monetary incentive (FreeWOM). The multidimensional
treatment of humor and empirical investigation of the effect of the two different humor
categories on FreeWOM occurrences (share of WTA statements of €0.00) resolved the
contradictory findings and recommendations in extant literature regarding the usage of
humor as communication technique to elicit FreeWOM and thus viral advertisements.
The findings showed that marketing managers should only use warm humor that, by
definition, does not include stereotypical humor or sexual allusions (offensive humor
types) to elicit FreeWOM. The use of warm humor significantly and drastically increased
the occurrences of FreeWOM by almost 250% when compared to the condition without
humor. Offensive humor, on the other hand, even reduced the percentage rate of
FreeWOM occurrences (see Figure 43 below).
FIGURE 43: MARKETING MANAGERS CAN USE WARM HUMOR FOR VIRAL MARKETING CAMPAIGNS828
828 The three screen shots are taken from smart’s social media channels (see chapter 4.5.1).
Discussion 210
5.3.3 DIGITAL PRICING
How should marketing managers understand and design pricing in times of digitization?
Pricing is defined as the value division between customers and businesses. Within the
Value Growth Model, eWOM is conceptualized as a non-monetary, digital value
component in price compositions. Digital pricing is therefore a composition of monetary
and non-monetary value components, exchanged between prosumers and businesses.829
Further potential digital value contributions that could be used as a price component are
customer data and attention.830 Pricing managers that seek to contribute to the strategic
profitability of their businesses should therefore consider the integration of digital price
components in their price compositions, instead of an isolated focus on the short-term
transaction optimizations of monetary revenues. This implies that it could be profitable
to exchange monetary price components (price discount) with a non-monetary price
component (higher value eWOM engagement). Moreover, pricing managers in retail are
often forced to offer (literally) pricy discounts in order to achieve a relevant ranking on
price-comparison platforms. The conditional monetary discounts for eWOM might be an
opportunity to reach top positions without cuts in profitability.
Nevertheless, pricing managers often neglect the important factor of non-monetary value
price components in practice. In this regard, the prevailing win-lose paradigm in pricing
led to the usage of digital technologies solely for the sophisticated exploitation of the
customer’s WTP and implementation of different price discrimination tactics (see
Chapters 1.2 and 2.3.2). However, digital price discrimination tactics have proven to be
a significant threat to virtually all metrics of marketing strategy, like customer attitudes,
trust, loyalty, store choice, (re-)purchases and business profitability.831 Pricing as an
organizational function under the common win-lose paradigm therefore works against
other marketing functions like branding or customer relationship management.
Solely monetarily-driven pricing managers should consider non-monetary pricing and
change their mindset toward the win-win paradigm immanent in the Value Growth
Model. They should turn their attention away from solely consumer WTP exploitations
829 Kolodziejczak, Christian/Monti, Alessandro. Deutscher Marketing Verband (2018), p. 3. 830 Doligalski, Tymoteusz (2014), p. 27. 831 Wu, Chi-Cheng/Liu, Yi-Fen/Chen, Ying-Ju/Wang, Chih-Jen (2012), p. 106-116 | Garbarino, Ellen/Maxwell, Sarah (2010), p. 1066-1072 | Anderson, Eric T./Simester, Duncan I. (2008), p. 498-500 | Grewal, Dhruv/Hardesty, David M./Iyer, Gopalkrishnan R. (2004), p. 87-100.
Discussion 211
to prosumer WTS integration, in order to grow value exchange instead of customer
resentment. The model also provides guidance to streamlining the objectives and impact
of the pricing with other marketing departments and thriving on the entire spectrum of
customer value. In contrast to Grewal et al.’s symptomatic statement in the Journal of
Retailing: “The three other Ps create value for the seller; the fourth P of price captures
value”832, every marketing function holds the potential to contribute to the value creation
process of a business model, especially pricing in times of digitization.
5.4 LIMITATIONS AND DIRECTIONS FOR FUTURE RESEARCH
5.4.1 SCOPE OF THE RESEARCHED CONSTRUCTS AND RELATIONSHIPS
This doctoral thesis started with the conceptualization of the Value Growth Model and it
aspired to investigate the prioritized prosumer perspective regarding the aforementioned
research questions and hypotheses. They were thoroughly investigated through a
combination of conceptual and empirical, qualitative and quantitative, implicit and
explicit methodologies, in order to limit research limitations.
Nevertheless, the extensive results must be interpreted in light of a number of constraints.
In the following, the most important limitations with respect to the reliability and validity
of the results are critically evaluated. The limitations identified and further emerging
research questions simultaneously represent fruitful avenues for future research.
The fascinating and versatile phenomenon of eWOM occurs in many different forms (see
Chapter 2.2.2.3). However, the studies conducted are focused on eWOM only on social
media networks. This particular type is highly influential, the most relevant regarding the
Value Growth Model and still holds the potential for future research.833 Due to the
different levels of communication and interaction, the decision attributes valid for eWOM
on social media networks inevitably vary for other types of eWOM, such as blogs and
emails. Future research could therefore investigate the eWOM inherent determinants of
prosumer engagement and the effect of humor categories in the light of, for example,
email eWOM.
The landscape of social media networks is dynamic and versatile. Due to the limited
respondent attention span and resulting impossibility to include all social media networks,
a meaningful selection of social media networks was required to conduct the second
832 Grewal, Dhruv/Levy, Michael/Kumar, V. (2009), p. 5. 833 Mishra, A./Satish, S. M. (2016), p. 230.
Discussion 212
empirical study (see Chapter 3.5). Thus, insights regarding prosumer preferences for
engaging in eWOM on, e.g., Snapchat, Pinterest, Amazon Spark or any other social media
network of the future are missing. Nevertheless, since both the most popular hedonic and
utilitarian networks were included, the selection seems adequate for answering the
research question raised. Moreover, the eWOM taxonomy was defined independently of
specific networks: it includes the dimensions of hedonic and utilitarian networks rather
than a list of social media networks. The taxonomy and further results based on this
differentiation, are therefore considered robust to changes in the landscape of social media
networks. Nevertheless, future research should investigate a greater number of and newly
dominant networks, in order to create a more nuanced understanding of prosumer
preferences for engaging in eWOM on different social media networks and the underlying
network features. This way, potential changes over time in the prosumers’ preferences for
specific networks could also be investigated.
Almost 89% of the German population purchase goods online at least once a month, 29%
thereof at least once a week.834 This would enable a frequent offering of and engagement
in eWOM. Potentially, prosumers perceive an increasing risk of negative peer reactions
with a greater frequency (lower time span) between two eWOM engagements, since the
messages can be seen as being increasingly annoying. The potential perception of greater
social risks immanent in the eWOM behavior at greater frequency are assumed to lead to
greater cognitive costs. In this regard, the moderating effect of eWOM recency on the
prosumer’s perceptions of cognitive costs for eWOM engagements (operationalized as
intentions (WTS) and WTA levels) are interesting research gaps that were not covered in
the main and supplementary studies presented. The potential eWOM recency effect could
thus be investigated in future research. The study would also provide managerial
implications regarding the optimal frequency of eWOM offers to individual prosumers.
In Figure 8, exemplary offers from social commerce shops to exchange eWOM for a price
discount were summarized. The monetary incentives in the quantitative studies were only
operationalized in absolute terms, although many offers on the market are also percentage
discounts on the purchase value. In this regard, discount framing has been found to affect
customer behavior (purchase intentions).835 Furthermore, over the course of the
conceptualizing of eWOM engagement value, a couple of random shops that offered
834 idealo, Webpage of: Statista, Inc. (2018). 835 González, Eva M./Esteva, Eduardo/Roggeveen, Anne L./Grewal, Dhruv (2016), p. 1022-1027.
Discussion 213
incentives for eWOM were interviewed about their implementations and experiences.
One shop offered a lottery to win a voucher, rather than immediately applicable absolute
or percentage discounts. Therefore, the investigation into the effectiveness of different
incentive framings represents an interesting avenue for future research. In other words,
the effect of different discount types is an interesting research gap in view of eliciting
eWOM engagements. For instance, a future research study could investigate the
effectiveness of a cash discount worth €5, in comparison to a 5% discount on a €100
purchase and a lottery ticket to win €100 with a (known or unknown) expectancy value
of €5.
5.4.2 RESEARCH METHODOLOGY AND RESULTS
A number of constraints have to be acknowledged with respect to the research designs,
leading to a limited generalizability of the results or limited validity due to sampling
restrictions and experimental design trade-off decisions.
First and foremost, there were a number of trade-off decisions that occurred regarding the
selection of the research methodologies. The popular web-based experiments (online
surveys) provided a high internal validity (ability to draw causal conclusions from the
observed correlations) but a relatively low external validity (ability to generalize the
findings to other settings). However, the somewhat artificial settings for these
experiments enabled the high internal validity, e.g. through the controlling of
respondents, conditions and measurement of control variables.836 Market data on the other
side of the trade-off spectrum provides a low internal validity and high external validity.
All the studies were conducted in experimental designs to ensure the high internal validity
and established an acceptable degree of external validity through authentic settings within
the experiments. Notably, eWOM is conducted online on the prosumers personal devices,
just like the quantitative-empirical surveys were conducted. Nevertheless, the
hypothetical choices in the discrete choice experiment (ACBC) and stated WTA levels in
the humor study would still benefit from further analysis based on current social
commerce exchanges (market data or even field experiments) to strengthen the external
validity of the results. This is especially true, when measuring WTA levels, as the stated
values from the prosumers were prone to strategic behavior, i.e. the indication of higher
values than the actual WTA levels as a negotiation strategy in anticipation of more highly-
836 Roe, Brian E./Just, David R. (2009), p. 1266-1268.
Discussion 214
received incentive offers. Lloyd-Smith et al. discuss survey techniques for improving the
validity of WTA measurements through the Becker-DeGroot-Marschak (BDM)
method,837 which is established in the related WTP research. In this regard, an
improvement to the research design of the third study (about humor categories presented
in Chapter 4.5) would be a three stage measurement process, including actual eWOM
offers. In this regard, prosumers first need to indicate the minimum required amount of
money they are willing to accept to engage in an eWOM archetype. Second, a random
incentive level is drawn. If this incentive level is higher than the prosumer’s WTA
indication, they are offered the eWOM archetype and could actually engage on a social
media network to receive the respective incentive. However, if the WTA is lower than
the randomly-drawn incentive, no eWOM offer occurs and the prosumer does not receive
any incentive. This way, the prosumers are motivated to reduce strategic behavior and
state more truthful WTA levels.
Another trade-off in experimental designs occurs with respect to within- and between-
subjects designs. In within-subjects designs, the effect of random noise and unobserved
individual differences between subjects is mitigated, but learning and transfer effects can
occur. For between-subjects designs it is the other way around; advantages become
disadvantages and vice versa. In the third empirical study, the effect of humor categories
on WTA levels and FreeWOM occurrences was solely investigated in within-subject
designs. To strengthen the reliability of the results, future research should repeat the study
based on a between-subjects design.
In all five empirical studies, qualitatively saturated or large heterogeneous samples with
authentic socio-demographic properties for the German target population of current social
media and commerce users were gathered. Although the samples are representative for
the German target population, the results might have a limited external validity for
populations in areas that differ widely in their cultural orientation. The degree of self-
disclosure (the depth of shared information) is one of several determinants of prosumer
engagement in eWOM and the disagreement to share personal data (e.g. health-related)
is conceptually different from eWOM engagements. Nevertheless, the GfK study838
837 Lloyd-Smith, Patrick/Adamowicz, Wiktor (2018), p. 133-140. 838 22,000 people from 17 countries were asked to indicate their Willingness to Share personal data in return for an unspecified reward: “I am willing to share my personal data (health, financial, driving records, energy use, etc.) in exchange for benefits or rewards like lower costs or personalized service”. The disagreement rate was measured as the indications of 1 and 2 on a 7-point Likert scale (1: Don’t agree at all | 7: Agree completely).
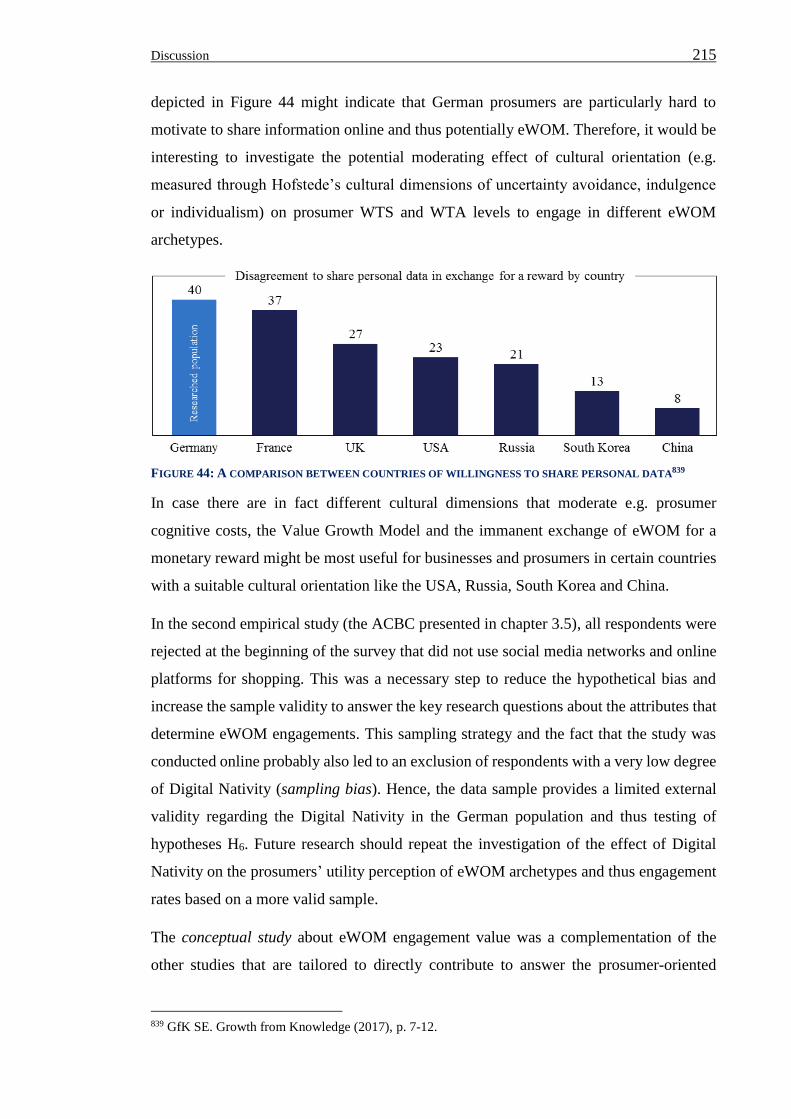
Discussion 215
depicted in Figure 44 might indicate that German prosumers are particularly hard to
motivate to share information online and thus potentially eWOM. Therefore, it would be
interesting to investigate the potential moderating effect of cultural orientation (e.g.
measured through Hofstede’s cultural dimensions of uncertainty avoidance, indulgence
or individualism) on prosumer WTS and WTA levels to engage in different eWOM
archetypes.
FIGURE 44: A COMPARISON BETWEEN COUNTRIES OF WILLINGNESS TO SHARE PERSONAL DATA839
In case there are in fact different cultural dimensions that moderate e.g. prosumer
cognitive costs, the Value Growth Model and the immanent exchange of eWOM for a
monetary reward might be most useful for businesses and prosumers in certain countries
with a suitable cultural orientation like the USA, Russia, South Korea and China.
In the second empirical study (the ACBC presented in chapter 3.5), all respondents were
rejected at the beginning of the survey that did not use social media networks and online
platforms for shopping. This was a necessary step to reduce the hypothetical bias and
increase the sample validity to answer the key research questions about the attributes that
determine eWOM engagements. This sampling strategy and the fact that the study was
conducted online probably also led to an exclusion of respondents with a very low degree
of Digital Nativity (sampling bias). Hence, the data sample provides a limited external
validity regarding the Digital Nativity in the German population and thus testing of
hypotheses H6. Future research should repeat the investigation of the effect of Digital
Nativity on the prosumers’ utility perception of eWOM archetypes and thus engagement
rates based on a more valid sample.
The conceptual study about eWOM engagement value was a complementation of the
other studies that are tailored to directly contribute to answer the prosumer-oriented
839 GfK SE. Growth from Knowledge (2017), p. 7-12.
Discussion 216
research questions of the dissertation, because it represents the business perspective
within the Value Growth Model. However, the main limitations of this study are
summarized in the following, due to the relevant opportunities for future contributions
that result from them. The contribution of the nomological network was constituted
through the complexity-reducing summarization of extant knowledge and delineation of
novel constructs as well as relationships that reflect the emergence of eWOM engagement
value. It requires a currently missing empirical investigation to test and strengthen the
reliability and validity of the proposed nomological network. Furthermore, manifold
additional moderator and mediator variables can be added to the framework, if the
objective of completeness is prioritized over complexity reduction, which can be
necessary in the future to deepen the understanding about the formation of eWOM
engagement value. Recently a number of software solutions (such as apps on shopify) for
social commerce shops have been introduced to the market. The increasing awareness of
eWOM value for businesses and easy implementation tools are assumed to lead to a
growing number of businesses that offer price discounts in return for eWOM
engagements.840 This enables the empirical investigation of eWOM engagement value
within the nomological network based on authentic social commerce exchanges in the
future.
5.4.3 AVENUES FOR FUTURE RESEARCH IN SUMMARY
In summary, two overarching avenues for future research were identified:
(1) the repetition of the aforementioned studies with actual social commerce exchange
data, and (2) the investigation of novel moderators regarding the determinants of
prosumer engagement in eWOM on social media networks.
The most fruitful avenues for future research may lay in contributions through the
repetition of the humor study, based either on a more sophisticated measurement of WTA
levels or a field study with actual market exchange data. For instance, the growing number
of retailers that offer incentives for eWOM engagement on the platform Shopify provides
manifold points of contact for this purpose. Furthermore, an empirical investigation of
the eWOM engagement value is the next step to strengthening the reliability and validity
of the concept.
840 Recently launched “eWOM for incentives apps” on Shopify include inter alia: Social Marketing +
Share Offer by AAAecommerce Inc, Rewards and Referrals by Swell and Checkout Share by Space
Squirrel Ltd. The apps are priced at about $9.00 per month.
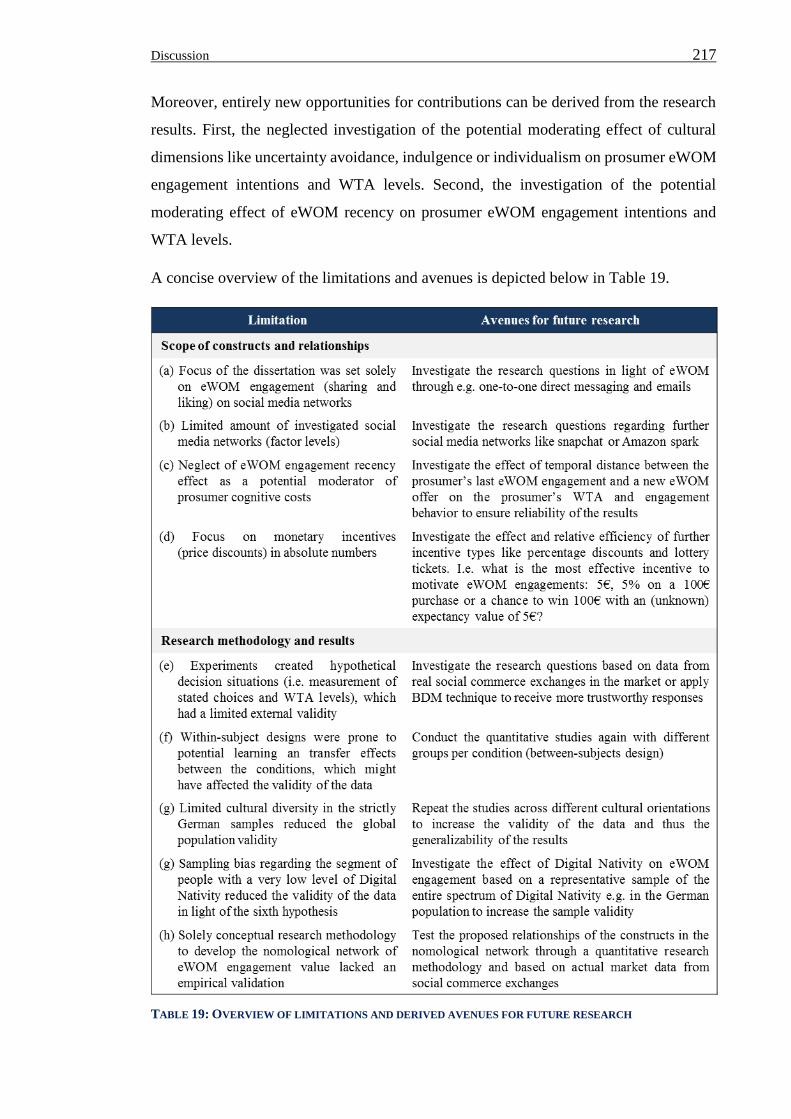
Discussion 217
Moreover, entirely new opportunities for contributions can be derived from the research
results. First, the neglected investigation of the potential moderating effect of cultural
dimensions like uncertainty avoidance, indulgence or individualism on prosumer eWOM
engagement intentions and WTA levels. Second, the investigation of the potential
moderating effect of eWOM recency on prosumer eWOM engagement intentions and
WTA levels.
A concise overview of the limitations and avenues is depicted below in Table 19.
TABLE 19: OVERVIEW OF LIMITATIONS AND DERIVED AVENUES FOR FUTURE RESEARCH
Conclusion 218
6 CONCLUSION
The Value Growth Model of social commerce and immanent exchange of prosumer
eWOM for price discounts is embedded in one of the most challenging research arenas
of digital marketing science. It also holds the chance to mutually increase business value
and prosumer utility. To better understand the factors that determine if such a mutually-
beneficial eWOM offer is in fact created, six studies were conducted with a focus on the
prioritized perspective of prosumer engagement in eWOM. Although, the fascinating
phenomenon eWOM has been being researched globally for about two decades,
surprisingly many fundamental lacunae were found regarding the extant knowledge about
prosumer eWOM decision making. In this regard, systematic literature reviews yielded
several incompletions (research gaps) and inadequacies (unobserved effects leading to
contradictory findings) that were synthesized in order to develop the opportunities for
contributions within this dissertation. In this regard, the advent and dynamics of social
media networks combined with the complex and increasingly eWOM reliant prosumer
behavior, ensure the continuous relevance of the findings and research field in general.
The eWOM taxonomy, thus the empirical differentiation of eWOM manifestations from
the prosumers’ perspective, was the foundation for reflecting upon the
multidimensionality of the hitherto unidimensionally treated construct. Simply put, from
the prosumers’ perspective, eWOM does not equal eWOM, but a distinct eWOM
archetype equals a distinct eWOM archetype, which enables meaningful interpretations
and comparisons in eWOM research. Hence, acknowledging the versatile variations of
eWOM is an important contribution to increasing the validity of research designs by
reducing the ambiguity of, for example, experimental settings including eWOM
engagement as an independent or dependent variable. The eWOM taxonomy also enabled
the advancement of the Social Exchange Theory’s explanatory power, in light of the
prosumers’ utility-motivated behavior on social media networks. Notably, empirical
insights regarding the immanent attribute importances, level preferences, level
interactions, as well as socio-demographic effects specify the formation of prosumer
utility and were used to predict prosumer decision-making with a very high predictive
validity. With respect to the contradictory findings on the effectiveness of monetary
incentives on eWOM engagement, the multidimensional treatment and analyses of
representative rather than convenience samples evidenced that monetary incentives are
effective in eliciting eWOM engagements.
Conclusion 219
The integration of theoretical knowledge from humor research (multidimensionality of
humor categories) in social commerce research represented an important advancement to
theoretically and empirically resolving the contradictory findings in extant literature
regarding the effect of humor on prosumer eWOM engagement. Specifically, the different
humor categories had a contrary effect on prosumer engagement in FreeWOM and
required mean WTA levels to elicit eWOM: warm humor is related to cognitive benefits
such as enhanced enjoyment and digital identity curation, which resulted in the drastically
decreased WTA levels to motivate the engagement behavior. Offensive humor, on the
other hand, is related to cognitive costs such as the increased risk of negative peer
reactions and unfavorable traits in digital identity curation, which resulted in a reduced
frequency of FreeWOM and significantly higher WTA levels in comparison to both the
non-humorous and warmly-humorous conditions.
The Value Growth Model is also a social commerce business model feature that holds the
potential to immediately and sustainably improve the customer pricing experience. It
enables social media managers to design and manage eWOM as a digital, non-monetary
value contribution and thus tap a source of competitive advantage in times of
digitization.841 The focus on non-monetary value contributions, respectively price
components with a disproportional relationship between business value and prosumer
effort, helps managers to overcome the prevailing win-lose paradigm in pricing toward
the win-win paradigm of the Value Growth Model. It also guides to reconnect the solely
transaction revenue-focused pricing functions, which harm customer relationships
through dynamic WTP exploitations, with the other business functions that seek higher
total customer lifetime value through sustainable prosumer relationships.
In conclusion, eWOM wields “the greatest influence on purchase decisions”842 in today’s
digitally connected prosumer markets. The findings of this dissertation theoretically
explain and empirically evidence the determinants of prosumer eWOM engagement to
create mutually beneficial exchanges in social commerce. In practice, social commerce
managers increasingly implement the customizable apps that enable the Value Growth
Model and benefit from the insights found in this dissertation to create effective and
efficient eWOM offers for prosumers.
841 Alvarez-Milán, Agarzelim/Felix, Reto/Rauschnabel, Philipp A./Hinsch, Christian (2018), p. 67. 842 Kulmala, Marianne/Mesiranta, Nina/Tuominen, Pekka (2013), p. 21 | Manafy, Michelle (2010), p. 5.
References 220
7 REFERENCES
Aaker, Jennifer L./Akutsu, Satoshi (2009): Why do people give? The role of identity in giving. In:
Journal of Consumer Psychology, 19(3), pp. 267–270.
Acquisti, Alessandro/John, Leslie/Loewenstein, George (2013): What is privacy worth? In: Journal of
Legal Studies, 42(2), pp. 249–274.
Adamic, Lada A./Huberman, Bernardo A. (2002): Zipf’s law and the Internet. In: Glottometrics, 3(1), pp.
143–150.
Agarwal, Manoj K./Green, Paul E. (1991): Adaptive Conjoint Analysis versus self-explicated models:
Some empirical results. In: International Journal of Research in Marketing, 8(2), pp. 141–146.
Ahmad, Shimi Naurin/Laroche, Michel (2017): Analyzing electronic word of mouth. In: International
Journal of Information Management, 37(3), pp. 202–213.
Ahrens, Jan/Coyle, James R./Strahilevitz, Michal Ann (2013): Electronic word of mouth. In: European
Journal of Marketing, 47(7), pp. 1034–1051.
Akçayır, Murat/Dündar, Hakan/Akçayır, Gökçe (2016): What makes you a digital native? In: Computers
in Human Behavior, 60(1), pp. 435–440.
Alden, Dana L./Mukherjee, Ashesh/Hoyer, Wayne D. (2000): The effects of incongruity, surprise and
positive moderators on perceived humor in television advertising. In: Journal of Advertising, 29(2),
pp. 1–15.
Allenby, Greg M./Rossi, Peter E. Sawtooth Software, Inc. (2003): Perspectives Based on 10 Years of HB
in Marketing Research, Sequim.
Alter, Adam L. (2017): Irresistible: The rise of addictive technology and the business of keeping us
hooked, Penguin Press, New York.
Alvarez-Milán, Agarzelim/Felix, Reto/Rauschnabel, Philipp A./Hinsch, Christian (2018): Strategic
customer engagement marketing. In: Journal of Business Research, 92, pp. 61–70.
Amasty Development Ltd (2019): Share Me. Webpage of: https://amasty.com. URL:
https://amasty.com/magento-share-me.html (02.04.2019).
Amazon.de (2016): Cyber Monday. Webpage of: Amazon.de Facebook channel. URL:
https://www.facebook.com/Amazon.de/photos/a.327005587345521/1213226775390060/?type=3&t
heater (22.05.2019).
Amblee, Naveen/Bui, Tung (2011): Harnessing the influence of social proof in online shopping: The
effect of Electronic Word of Mouth on sales of digital microproducts. In: International Journal of
Electronic Commerce, 16(2), pp. 91–114.
Anand, Adarsh/Bansal, Gunjan/Aggrawal, Deepti (2018): Choice based diffusion model for predicting
sales of mobile phones using conjoint analysis. In: The Journal of High Technology Management
Research, 29(2), pp. 216–226.
Anderl, Eva/März, Armin/Schumann, Jan H., (2014): There Is No Such Thing as a Free Lunch:
Nonmonetary Customer Value Contributions in Free E-Services In: Anderl, Eva Maria (2014,
Hrsg.): Three Essays on Analyzing and Managing Online Consumer Behavior. Dissertation, Passau,
2014, pp. 11–32.
Anderl, Eva Maria (2014): Three Essays on Analyzing and Managing Online Consumer Behavior,
Dissertation, Passau 2014.
Anderson, Eric T./Simester, Duncan I. (2008): Research note - Does demand fall when customers
perceive that prices are unfair? The case of premium pricing for large sizes. In: Marketing Science,
27(3), pp. 492–500.
References 221
Arbeitsgemeinschaft Verbrauchs- und Medienanalyse (VuMA). Statista, Inc. (2018): Verbrauchs- und
Medienanalyse - VuMA 2019.
Arnold, Roger A. (2010): Economics. 9th ed., South-Western Cengage Learning, Australia, Mason OH.
Babic, Ana/Sotgiu, Francesca/Valek, Kristine de/Bijmolt, Tammo H. A. (2015): The effect of electronic
Word-of-Mouth on sales: A meta-analytic review of platform, product, and metric factors. In:
Journal of Marketing Research, 53(3), pp. 297–318.
Babin, Barry J./Darden, William R./Griffin, Mitch (1994): Work and/or fun: Measuring hedonic and
utilitarian shopping value. In: Journal of Consumer Research, 20(4), pp. 644–656.
Backhaus, Klaus/Erichson, Bernd/Plinke, Wulff/Weiber, Rolf (2016): Multivariate Analysemethoden.
14th ed., Springer Berlin Heidelberg; Imprint: Springer Gabler, Berlin, Heidelberg 2016.
Backhaus, Klaus/Erichson, Bernd/Weiber, Rolf (2015): Fortgeschrittene Multivariate Analysemethoden.
3rd ed., Gabler, Berlin.
Badge, Peter/Turner, Nikolaus/Richmond, Chris (2008): Nobel faces: A gallery of Nobel Prize winners,
Wiley-VCH, Weinheim.
Bagdare, Shilpa/Jain, Rajnish (2013): Measuring retail customer experience. In: International Journal of
Retail & Distribution Management, 41(10), pp. 790–804.
Bagozzi, Richard P. (1975): Marketing as exchange. In: Journal of Marketing, 39(4), pp. 32–39.
Bakshy, Eytan/Hofman, Jake M./Mason, Winter A./Watts, Duncan J. (2011): Everyone’s an influencer:
Quantifying influence on twitter. In: Proceedings of the fourth ACM international conference on
Web search and data mining, 11, pp. 65–74.
Balasubramanian, Sridhar/Mahajan, Vijay (2001): The Economic Leverage of the Virtual Community. In:
International Journal of Electronic Commerce, 5(1), pp. 103–138.
Balderjahn, Ingo/Hedergott, Doreen/Peyer, Mathias, (2009): Choice-Based Conjointanalyse In: Baier,
Daniel/Brusch, Michael (2009, Hrsg.): Conjointanalyse, Springer, Berlin, New York, 2009, pp. 129–
146.
Bali, Raghav/Sarkar, Dipanjan/Sharma, Tushar (2017): Learning social media analytics with R, Packt
Publishing, Birmingham, UK.
Bargh, John A./McKenna, Katelyn Y. A./Fitzsimons, Grainne M. (2002): Can you see the real me?
Activation and expression of the “true self” on the internet. In: Journal of Social Issues, 58(1), pp.
33–48.
Barreda, Albert A./Bilgihan, Anil/Nusair, Khaldoon/Okumus, Fevzi (2015): Generating brand awareness
in Online Social Networks. In: Computers in Human Behavior, 50, pp. 600–609.
Bauer, Robert/Menrad, Klaus/Decker, Thomas (2015): Adaptive Hybrid Methods for Choice-Based
Conjoint Analysis. In: International Journal of Marketing Studies, 7(1), pp. 1–14.
Baumeister, Roy F., (2003): Writing a literature review In: Prinstein, Mitchell J./Patterson, Marcus D.
(2003, Hrsg.): The Portable Mentor, Springer US, Boston, MA, 2003, pp. 119–132.
Baumeister, Roy F./Leary, Mark R. (1997): Writing narrative literature reviews. In: Review of General
Psychology, 1(3), pp. 311–320.
Baumeister, Roy F./Vohs, Kathleen D. (2007): Encyclopedia of social psychology, SAGE, Los Angeles,
London.
Baumgartner, Bernhard/Steiner, Winfried J., (2009): Hierarchisch bayesianische Methoden bei der
Conjointanalyse In: Baier, Daniel/Brusch, Michael (2009, Hrsg.): Conjointanalyse, Springer, Berlin,
New York, 2009, pp. 147–159.
Bayes, Thomas/Price, Richard/Canton, John (1763): An essay towards solving a problem in the doctrine
of chances.
References 222
Baymard Institute (2016): 33 Cart Abandonment Rate Statistics. URL: http://baymard.com/lists/cart-
abandonment-rate (23.07.2016).
BBDO Proximity (2012): Smart fortwo Facelift. Webpage of: Daimler AG | Smart YouTube Channel.
URL: https://www.youtube.com/watch?v=HMCPEHNr07g and
https://www.youtube.com/watch?v=i07AHhmn-4E (07.05.2019).
BBDO Proximity (2013): Smart Spot Gelände. Webpage of: Daimler AG | Smart YouTube Channel.
URL: https://www.youtube.com/watch?v=Gy9P_JENXsc and
https://www.youtube.com/watch?v=O-HPMmumC_w (07.05.2019).
Beard, Fred K. (2008): Advertising and audience offense: The role of intentional humor. In: Journal of
Marketing Communications, 14(1), pp. 1–17.
Befu, Harumi (1977): Social Exchange. In: Annual Review of Anthropology, 6(1), pp. 255–281.
Ben-Akiva, Moshe/Bierlaire, Michel, (2003): Discrete choice methods and their application to short term
travel decisions In: Hall, Randolph W. (2003, Hrsg.): Handbook of transportation science. 2nd ed.,
Kluwer Academic, Boston, 2003, pp. 7–39.
Berger, Jonah/Milkman, Katherine L. (2012): What makes online content viral? In: Journal of Marketing
Research, 49(2), pp. 192–205.
Berger, Jonah/Schwartz, Eric M. (2011): What drives immediate and ongoing Word of Mouth? In:
Journal of Marketing Research, 48(5), pp. 869–880.
Bertaux, Daniel (1981): Biography and society. 2nd print, SAGE, Beverly Hills, California.
Bertini, Marco/Gourville, John T. (2012): Pricing to create shared value. In: Harvard Business Review,
90(6), pp. 96–104.
Bitcom Research (2017): ID 469969: Share of smartphone users in Germany in 2017. Webpage of:
Statista, Inc. URL: https://www-statista-com.revproxy.escpeurope.eu/statistics/469969/share-of-
smartphone-users-in-germany-by-age-group/ (19.07.2019).
Bitcom Research (2018): ID 461801: Number of smartphone users in Germany from 2009 to 2018.
Webpage of: Statista, Inc. URL: https://www-statista-
com.revproxy.escpeurope.eu/statistics/461801/number-of-smartphone-users-in-germany/
(18.07.2019).
Boerman, Sophie C./Willemsen, Lotte M./van der Aa, Eva P. (2017): “This Post Is Sponsored” - Effects
of sponsorship disclosure on persuasion knowledge and Electronic Word of Mouth in the context of
facebook. In: Journal of Interactive Marketing, 38, pp. 82–92.
Böhler, Heymo/Scigliano, Dino, (2009): Traditionelle Conjointanalyse In: Baier, Daniel/Brusch, Michael
(2009, Hrsg.): Conjointanalyse, Springer, Berlin, New York, 2009, pp. 101–112.
Bohner, Gerd/Ahlborn, Katrin/Steiner, Regine (2010): How sexy are sexist men? In: Sex Roles, 62(7-8),
pp. 568–582.
Bone, Paula Fitzgerald (1995): Word-of-mouth effects on short-term and long-term product judgments.
In: Journal of Business Research, 32(3), pp. 213–223.
Borges-Tiago, Maria Teresa/Tiago, Flavio/Cosme, Carla (2018): Exploring users' motivations to
participate in viral communication on social media. In: Journal of Business Research, 101, pp. 574–
582.
Boudon, Raymond, (2009): Rational Choice Theory In: Turner, Bryan S. (2009, Hrsg.): The new
Blackwell companion to social theory, Wiley-Blackwell, Oxford, 2009, pp. 179-195.
Brinkmann, Svend/Kvale, Steinar (2017): Doing interviews. 2nd edition, SAGE Publications, Thousand
Oaks CA.
Brosch, Anna (2016): When the child is born into the Internet: Sharenting as a growing trend among
parents on Facebook. In: The New Educational Review, pp. 225–235.
References 223
Brownie, Cavell/Boos, Dennis D. (1994): Type I error robustness of ANOVA and ANOVA on ranks
when the number of treatments is large. In: Biometrics, 50(2), pp. 542–549.
Buggisch, Christian (2019): Social Media, Messenger und Streaming – Nutzerzahlen in Deutschland
2019. Webpage of: Buggisch. URL: https://buggisch.wordpress.com/2019/01/02/social-media-
messenger-und-streaming-nutzerzahlen-in-deutschland-2019/ (19.07.2019).
Bughin, Jacques (2015): Brand success in an era of Digital Darwinism. In: McKinsey Quarterly, pp. 1–5.
Buijzen, Moniek/Valkenburg, Patti M. (2004): Developing a typology of humor in audiovisual media. In:
Media Psychology, 6(2), pp. 147–167.
Bundesagentur für Arbeit. Statista, Inc. (2019): Verteilung der sozialversicherungspflichtigen
Vollzeitbeschäftigten in Deutschland nach Einkommensgruppen (Bruttoeinkommen pro Monat) von
2011 bis 2017.
Bundesnetzagentur (2018): Number of SMS sent in Germany from 2000 to 2017 (in billions). Webpage
of: Statista, Inc. URL: https://www.statista.com/statistics/459863/number-of-sms-sent-in-germany/
(21.08.2018).
Burns, Tom/Roszkowska, Ewa (2016): Rational Choice Theory. In: Theoretical Economics Letters, 6(2),
pp. 195–207.
Bussiere, Dave (2009): The effects of humor on the processing of Word-of-Mouth. In: Advances in
Consumer Research, pp. 399–404.
Buttle, Francis A. (1998): Word of mouth: understanding and managing referral marketing. In: Journal of
Strategic Marketing, no. 6, pp. 241–254.
Bwisa, Henry M. (2018): The basics of writing a statement of the problem for your research proposal.
Webpage of: Editage Insights. URL: https://www.editage.com/insights/the-basics-of-writing-a-
statement-of-the-problem-for-your-research-proposal (26.08.2018).
Cabosky, Joseph (2016): Social media opinion sharing: Beyond volume. In: Journal of Consumer
Marketing, 33(3), pp. 172–181.
Campbell, Kelly/Holderness, Nicole/Riggs, Matt (2015): Friendship chemistry: An examination of
underlying factors. In: Social Science Journal, 52(2), pp. 239–247.
Carl, Walter J. (2016): What's all the buzz about? In: Management Communication Quarterly, 19(4), pp.
601–634.
Chan, Fanny Fong Yee (2011): The use of humor in television advertising in Hong Kong. In:
International Journal of Humor Research, 24(1), pp. 29.
Chan, Yolanda Y.Y./Ngai, E.W.T. (2011): Conceptualising electronic word of mouth activity. In:
Marketing Intelligence & Planning, 29(5), pp. 488–516.
Chapman, Christopher N./Alford, James L./Johnson, Chad/Weidemann, Ron. Sawtooth Software Inc.
(2009): CBC VS. ACBC: Comparing results with real product selection, Sequim.
Charan, Ashok (2015): Marketing analytics: A practitioner's guide to marketing analytics and research
methods, World Scientific, New Jersey.
Cheung, Christy M.K./Lee, Matthew K.O. (2012): What drives consumers to spread electronic word of
mouth in online consumer-opinion platforms. In: Decision Support Systems, 53(1), pp. 218–225.
Chib, Siddhartha, Greenberg, Edward (1995): Understanding the Metropolis-Hastings Algorithm. In: The
American Statistician, 49(4), pp. 327–335.
Cho, Youngsang/Hwang, Junseok/Lee, Daeho (2012): Identification of effective opinion leaders in the
diffusion of technological innovation. In: Technological Forecasting and Social Change, 79(1), pp.
97–106.
Choudhury, Masudul Alam (1994): Economic theory and social institutions, University Press of America,
Lanham, Md., London.
References 224
Chu, Shu-Chuan (2009): Determinants of Consumer Engagement in Electronic Word-of-Mouth in Social
Networking Sites, Austin.
Chu, Shu-Chuan/Kim, Yoojung (2015): Determinants of consumer engagement in electronic word-of-
mouth (eWOM) in social networking sites. In: International Journal of Advertising, 30(1), pp. 47–
75.
Chua, Trudy Hui Hui/Chang, Leanne (2016): Follow me and like my beautiful selfies: Singapore teenage
girls’ engagement in self-presentation and peer comparison on social media. In: Computers in
Human Behavior, 55, pp. 190–197.
Chun, Se-Hak (2018): Machine learning techniques and statistical methods for business applications:
Implications on Big Data gold rush. In: Advanced Science Letters, 24(7), pp. 5474–5477.
Cisco public (2017): The Zettabyte Era: Trends and Analysis. Webpage of: Cisco. URL:
https://www.cisco.com/c/en/us/solutions/collateral/service-provider/visual-networking-index-
vni/vni-hyperconnectivity-wp.pdf (12.09.2018).
Clow, Kenneth E./James, Karen E. (2013): Essentials of marketing research: Putting research into
practice, SAGE, Thousand Oaks, Calif., London.
Cochran, William G. (1950): The Comparison of Percentages in Matched Samples. In: Biometrika, 37(3-
4), pp. 256–266.
Cohen, Jacob (1960): A coefficient of agreement for nominal scales. In: Educational and Pscychological
Measurement, xx(1), pp. 37–46.
Coleman, James Samuel (2009): Individual interests and collective action: Selected essays, Cambridge
University Press, Cambridge.
Colwyn, Susanne (2015): Why do online shoppers abandon their Ecommerce shopping baskets and what
can retailers do to re-engage? Webpage of: Smart Insights (Marketing Intelligence) Ltd. URL:
http://www.smartinsights.com/conversion-optimisation/checkout-optimisation/reasons-cart-
abandonment-digitalinsights/ (23.07.2016).
Consumerfieldwork GmbH (2018): Online-Panels und Panelqualität. Webpage of: Consumerfieldwork
GmbH. URL: http://www.consumerfieldwork.de/onlinepanel.htm (16.06.2019).
Cooper, Harris M./Patall, Erika A./Lindsay, James J., (2009): Research synthesis as a scientific process
In: Bickman, Leonard/Rog, Debra (2009, Hrsg.): The SAGE handbook of applied social research
methods, SAGE Publications, Inc, 2455 Teller Road, Thousand Oaks California 91320 United
States, 2009, pp. 344–370.
Cornelsen, Jens/Diller, Hermann (1998): References within the context of customer valuation. In:
Interaction, relationships and networks: Visions for the future, proceedings of the 14th IMP
conference, 2, pp. 203–222.
Cronbach, Lee J./Meehl, Paul E. (1955): Construct validity in psychological tests. In: Psychological
bulletin, 52(4), pp. 281–302.
Cunningham, Charles E./Deal, Ken/Chen, Yvonne (2010): Adaptive Choice-Based Conjoint Analysis. In:
The Patient: Patient-Centered Outcomes Research, 3(4), pp. 257–273.
Dennison, Gabe/Bourdage-Braun, Stephanie/Chetuparambil, Madhu. IBM (2009): Social commerce
defined.
Dieckmann, Anja/Dippold, Katrin/Dietrich, Holger (2009): Compensatory versus noncompensatory
models for predicting consumer preferences. In: Judgment and Decision Making, 4(3), pp. 200–213.
Dobele, Angela/Lindgreen, Adam/Beverland, Michael/Vanhamme, Joëlle/van Wijk, Robert (2007): Why
pass on viral messages? Because they connect emotionally. In: Business Horizons, 50(4), pp. 291–
304.
Doligalski, Tymoteusz (2014): Internet-based customer value management - Developing customer
relationships online, Springer, New York.
References 225
Dost, Florian/Sievert, Jens/Kassim, David (2016): Revisiting firm-created word of mouth: High-value
versus low-value seed selection. In: International Journal of Research in Marketing, 33(1), pp. 236–
239.
Dumas, Tara M./Maxwell-Smith, Matthew/Davis, Jordan P./Giulietti, Paul A. (2017): Lying or longing
for likes? Narcissism, peer belonging, loneliness and normative versus deceptive like-seeking on
Instagram in emerging adulthood. In: Computers in Human Behavior, 71, pp. 1–10.
Dunbar, R. I. M. (1993): Coevolution of neocortical size, group size and language in humans. In:
Behavioral and Brain Sciences, 16(4), pp. 681–735.
Ecke, Petya/Bolls, Paul (2011): Spreading the virus: emotional tone of viral advertising and its effect on
forwarding intentions and attitudes. In: Journal of Interactive Advertising, 11(2), pp. 1–11.
EDEKA (2017): Iss wie der, der du sein willst - #issso. Webpage of: EDEKA on Facebook. URL:
https://www.facebook.com/EDEKA/videos/1235040276571804/?v=1235040276571804
(10.07.2019).
EHI Retail Institute (2016): Top 20 der umsatzstärksten Warengruppen im Online-Handel in Deutschland
nach Umsatz im Jahr 2015 (in Millionen Euro). Webpage of: www.handelsdaten.de. URL:
https://www.handelsdaten.de/e-commerce-und-versandhandel/online-umsatzstaerkste-
warengruppen-im-interaktiven-handel-nach-onlin-0 (11.04.2019).
Eichholz-Klein, Susanne/Heinze, Julia/Heinick, Hansjürgen/Brylla, Thomas. IFH Köln (2014):
Handelsszenario 2020.
Eigenraam, Anniek W./Eelen, Jiska/van Lin, Arjen/Verlegh, Peeter W.J. (2018): A consumer-based
taxonomy of digital customer engagement practices. In: Journal of Interactive Marketing, 44, pp.
102–121.
Einav, Liran/Levin, Jonathan/Popov, Igor/Sundaresan, Neel (2014): Growth, adoption, and use of mobile
e-commerce. In: American Economic Association, 104(5), pp. 489–494.
Eisend, Martin (2009): A meta-analysis of humor in advertising. In: Journal of the Academy of Marketing
Science, 37(2), pp. 191–203.
Ellision, Glenn/Ellison, Sara (2004): Search, obfuscation, and price elasticities on the Internet,
Massachusetts, 2004, Working paper series. Massachusetts Institute of Technology, Massachusetts,
2004.
Ellison, Nicole B./Steinfield, Charles/Lampe, Cliff (2007): The benefits of Facebook “Friends": Social
capital and college students’ use of online social network sites. In: Journal of Computer-Mediated
Communication, 12(4), pp. 1143–1168.
Elo, Satu/Kyngas, Helvi (2008): The qualitative content analysis process. In: Journal of Advanced
Nursing, 1, pp. 107–115.
Eranti, Veikko/Lonkila, Markku (2015): The social significance of the Facebook Like button. In: First
Monday, 20(6).
Erkan, Ismail/Evans, Chris (2016): The influence of eWOM in social media on consumers’ purchase
intentions: An extended approach to information adoption. In: Computers in Human Behavior, 61,
pp. 47–55.
European Commission. Statista, Inc. (2018): Standard Eurobarometer 88: Media Use in the European
Union.
Facebook (2019): Facebook Reports First Quarter 2019 Results. Webpage of: Facebook, Inc. URL:
https://investor.fb.com/investor-news/press-release-details/2019/Facebook-Reports-First-Quarter-
2019-Results/default.aspx (19.07.2019).
Facebook, Inc. (2018a): How do I share a post I see on my News Feed? | Facebook Help Centre.
Webpage of: Facebook, Inc. URL: https://www.facebook.com/help/163779957017799
(16.07.2019).
References 226
Facebook, Inc. (2018b): What does it mean to "Like" something? Webpage of: Facebook, Inc. URL:
https://www.facebook.com/help/110920455663362 (16.07.2019).
Facebook, Inc. (2019): ID 346167: Number of daily active Facebook users worldwide as of 1st quarter
2019 (in millions). Webpage of: Statista, Inc. URL: https://www-statista-
com.revproxy.escpeurope.eu/statistics/346167/facebook-global-dau/ (26.06.2019).
Fan, Yi-Wen/Miao, Yi-Feng (2012): Effect of electronic word-of-mouth on consumer purchase intention:
The perspective of gender differences. In: International Journal of Electronic Business
Management, 10(3), pp. 175–181.
Fanelli, Daniele (2010): Do pressures to publish increase scientists’ bias? An empirical support from US
states data. In: Public Library of Science One, 5(4), pp. 1–7.
Fellnhofer, Katharina (2019): Toward a taxonomy of entrepreneurship education research literature: A
bibliometric mapping and visualization. In: Educational Research Review, 27, pp. 28–55.
Field, Andy P. (2013): Discovering statistics using IBM SPSS statistics. 4th ed., SAGE, London.
Fu, Pei-Wen/Wu, Chi-Cheng/Cho, Yung-Jan (2017): What makes users share content on Facebook?
Compatibility among psychological incentive, social capital focus, and content type. In: Computers
in Human Behavior, 67, pp. 23–32.
Gabler Wirtschaftslexikon (2018): Sozialwissenschaften. Webpage of: Springer Fachmedien Wiesbaden
GmbH. URL: https://wirtschaftslexikon.gabler.de/definition/sozialwissenschaften-52181/version-
275327 (23.04.2019).
Galvin, Ray (2015): How many interviews are enough? Do qualitative interviews in building energy
consumption research produce reliable knowledge? In: Journal of Building Engineering, 1, pp. 2–
12.
Garbarino, Ellen/Maxwell, Sarah (2010): Consumer response to norm-breaking pricing events in e-
commerce. In: Journal of Business Research, 63(9-10), pp. 1066–1072.
Gensch, Dennis H./Recker, Wilfred W. (1979): The Multinomial, multiattribute logit choice model. In:
Journal of Marketing Research, 16(1), pp. 124–132.
Gentina, Elodie/Chen, Rui (2018): Digital natives’ coping with loneliness - Facebook or face-to-face? In:
Information & Management, article in press.
Gesellschaft für integrierte Kommunikationsforschung mbH + Co. KG (GIK) (2016): Best for planning
report 2016. Webpage of: Axel Springer, Bauer media Group, Funke Mediengruppe, Gruner + Jahr
und Hubert Burda Media. URL: https://gik.media/cms/wp-
content/uploads/2018/04/b4p_2016_Factsheet_englisch.pdf (01.07.2019).
Geyer, Benedikt, (2016): Die Transkription In: Wintzer, Jeannine (2016, Hrsg.): Herausforderungen in
der Qualitativen Sozialforschung, Springer Spektrum, Berlin, 2016, pp. 111–119.
GfK SE. Growth from Knowledge (2017): Willingness to share personal data in exchange for benefits or
rewards, Nürnberg.
Ghose, Anindya/Yao, Yuliang (2011): Using transaction prices to re-examine price dispersion in
electronic markets. In: Information Systems Research, 22(2), pp. 269–288.
Gill, P./Stewart, K./Treasure, E./Chadwick, B. (2008): Methods of data collection in qualitative research:
Interviews and focus groups. In: British Dental Journal, 6, pp. 291–295.
Glass, Gene V./Peckham, Percy D./Sanders, James R. (1972): Consequences of failure to meet
assumptions underlying the fixed effects analyses of variance and covariance. In: Review of
Educational Research, 42(3), pp. 237–288.
Godes, David/Mayzlin, Dina (2009): Firm-created Word-of-Mouth communication - Evidence from a
field test. In: Marketing Science, 28(4), pp. 721–739.
Goffman, Erving (1959): The presentation of self in everyday life, Doubleday, Garden City, N.Y.
References 227
Golan, Guy J./Zaidner, Lior (2008): Creative strategies in viral advertising - An application of Taylor’s
six-segment message strategy wheel. In: Journal of Computer-Mediated Communication, 13(4), pp.
959–972.
Gomez-Rodriguez, Manuel/Gummadi, Krishna/Schoelkopf, Bernhard (2014): Quantifying information
overload in social media and its impact on social contagions. In: Proceedings of the Eighth
International AAAI Conference on Weblogs and Social Media, pp. 170–179.
González, Eva M./Esteva, Eduardo/Roggeveen, Anne L./Grewal, Dhruv (2016): Amount off versus
percentage off—when does it matter? In: Journal of Business Research, 69(3), pp. 1022–1027.
Goodwin, Neva R./Harris, Jonathan/Nelson, Julie A./Roach, Brian/Torras, Mariano/Devine, James R.
(2014): Macroeconomics in context. Second edition, M.E. Sharpe, Armonk, New York.
Graneheim, Ulla H./Lindgren, Britt-Marie/Lundman, Berit (2017): Methodological challenges in
qualitative content analysis. In: Nurse Education Today, 56, pp. 29–34.
Grannovetter, Mark (1973): The strength of weak ties. In: Journal of Sociology, 78(6), pp. 1360-1380.
Gravetter, Frederick J./Forzano, Lori-Ann B. (2009): Research methods for the behavioral sciences. 3rd
ed., Wadsworth Cengage Learning, Belmont, CA.
Green, Paul E./Krieger, Abba M./Wind, Yoram (Jerry) (2001): Thirty years of conjoint analysis:
Reflections and prospects. In: Interfaces, 31(3), pp. 56–73.
Green, Teegan Courtney Clare/Hartley, Nicole (2015): Using Graph Theory to value paying and
nonpaying customers in a social network - Linking customer lifetime value to Word-of-Mouth social
value. In: Journal of Relationship Marketing, 14(4), pp. 301–320.
Grewal, Dhruv/Hardesty, David M./Iyer, Gopalkrishnan R. (2004): The effects of buyer identification and
purchase timing on consumers’ perceptions of trust, price fairness, and repurchase intentions. In:
Journal of Interactive Marketing, 18(4), pp. 87–100.
Grewal, Dhruv/Levy, Michael/Kumar, V. (2009): Customer experience management in retailing. In:
Journal of Retailing, 85(1), pp. 1–14.
Groves, Danny (2015): Share before you purchase and get 10% off your order. Webpage of: Sweet Peas
Kidswear Ltd. URL: https://sweetpeaskidswear.com/blogs/news/17801629-share-before-you-
purchase-and-get-10-off-your-order (22.10.2018).
Gruen, Thomas W./Osmonbekov, Talai/Czaplewski, Andrew J. (2006): eWOM - The impact of customer-
to-customer online know-how exchange on customer value and loyalty. In: Journal of Business
Research, 59(4), pp. 449–456.
Guest, Greg/Bunce, Arwen/Johnson, Laura (2006): How many interviews are enough? In: Field Methods,
18(1), pp. 59–82.
Guy, Bonnie S. (1988): The marketing of altruistic causes: Understanding why people help. In: Journal of
Services Marketing, 2(1), pp. 5–16.
Gvili, Yaniv/Levy, Shalom (2016): Antecedents of attitudes toward eWOM communication: Differences
across channels. In: Internet Research, 26(5), pp. 1030–1051.
Haenlein, Michael/Libai, Barak (2013): Targeting revenue leaders for a new product. In: Journal of
Marketing, 77(3), pp. 65–80.
Halcomb, Elizabeth J./Davidson, Patricia M. (2006): Is verbatim transcription of interview data always
necessary? In: Applied Nursing Research, 19(1), pp. 38–42.
Han, Hui/Xu, Hongyi/Chen, Hongquan (2018): Social commerce: A systematic review and data
synthesis. In: Electronic Commerce Research and Applications, 30, pp. 38–50.
Hanna, Richard/Rohm, Andrew/Crittenden, Victoria L. (2011): We’re all connected: The power of the
social media ecosystem. In: Business Horizons, 54(3), pp. 265–273.
References 228
Hardon, Jeroen (2018): Adaptive Conjoint Analysis (ACA). Webpage of: SKIM decision behavior
experts. URL: https://skimgroup.com/methodologies/conjoint-analysis/adaptive-conjoint-analysis-
aca/ (28.10.2018).
Harris, Neil (2001): Business economics: Theory and application, Butterworth-Heinemann, Oxford.
Harris Interactive (2014): ID 304402: Social networks ranked by share of monthly content volume
generated in the United Kingdom (UK) in January and May 2014. Webpage of: Statista, Inc. URL:
https://www-statista-com.revproxy.escpeurope.eu/statistics/304402/social-networks-ranked-by-
share-of-content-volume-generated-uk/ (16.09.2019).
Hashem, Ibrahim Abaker Targio/Yaqoob, Ibrar/Anuar, Nor Badrul/Mokhtar, Salimah/Gani,
Abdullah/Ullah Khan, Samee (2015): The rise of “big data” on cloud computing: Review and open
research issues. In: Information Systems, 47, pp. 98–115.
Hauser, John R. (2014): Consideration-set heuristics. In: Journal of Business Research, 67(8), pp. 1688–
1699.
Hauser, John R./Ding, Min/Gaskin, Steven P. Sawtooth Software, Inc. (2009): Non-compensatory (and
compensatory) models of consideration-set decisions, Delray Beach.
Heath, Anthony (1976): Rational choice and social exchange, Cambridge University Press, Cambridge.
Heimbrach, Irina (2016): Social Sharing Design: Paying incentives for social sharing, Dissertation an der
Technischen Universität Darmstadt, Darmstadt.
Hellenkemper, Mona (2017): Celebrity vs. micro-influencer: Who wins the battle of engagement?
Webpage of: InfluencerDB Tech GmbH & Co. KG. URL: https://blog.influencerdb.com/celebrity-
vs-micro-influencer-battle-of-engagement/ (19.06.2019).
Helm, Sabrina/Günter, Bernd/Eggert, Andreas (2017): Kundenwert: Grundlagen, Innovative Konzepte,
Praktische Umsetzungen. 4th ed., Springer Gabler, Wiesbaden, Germany.
Hennig-Thurau, Thorsten/Gwinner, Kevin P./Walsh, Gianfranco/Gremler, Dwayne D. (2004): Electronic
word-of-mouth via consumer-opinion platforms: What motivates consumers to articulate themselves
on the Internet? In: Journal of Interactive Marketing, 18(1), pp. 38–52.
Herrmann, Andreas/Huber, Frank/Regier, Stefanie, (2009): Adaptive Conjointanalyse In: Baier,
Daniel/Brusch, Michael (2009, Hrsg.): Conjointanalyse, Springer, Berlin, New York, 2009, pp. 113–
127.
Hesse-Biber, Sharlene Nagy/Leavy, Patricia (2006): The practice of qualitative research, SAGE, London.
Hinton, Perry R./McMurray, Isabella/Brownlow, Charlotte (2014): SPSS explained. 2nd ed., Routledge,
London.
Ho, Teck-Hua/Li, Shan/Park, So-Eun/Shen, Zuo-Jun Max (2012): Customer influence value and purchase
acceleration in new product diffusion. In: Marketing Science, 31(2), pp. 236–256.
Hoffman, Ernst/Daugherty, Terry (2013): Is a picture always worth a thousand words? Attention to
structural elements of eWOM for consumer brands within social media. In: Advances in Consumer
Research, 41, pp. 326–331.
Hoffmann, Christian Pieter/Lutz, Christoph/Meckel, Miriam (2015): Digital Natives or Digital
Immigrants? The impact of user characteristics on online trust. In: Journal of Management
Information Systems, 31(3), pp. 138–171.
Hogan, Bernie (2010): The Presentation of self in the age of social media: Distinguishing performances
and exhibitions online. In: Bulletin of Science, Technology & Society, 30(6), pp. 377–386.
Hogarth, Robin M./Karelaia, Natalia (2005): Simple models for multiattribute choice with many
alternatives: When it does and does not pay to face trade-offs with binary attributes. In: Management
Science, 51(12), pp. 1860–1872.
Höld, Regina, (2009): Zur Transkription von Audiodaten In: Buber, Renate (2009, Hrsg.): Qualitative
Marktforschung: Konzepte, Methoden, Analysen. 2nd ed., Gabler, Wiesbaden, 2009.
References 229
Holsapple, Clyde W./Singh, Meenu (2000): Toward a unified view of electronic commerce, electronic
business, and collaborative commerce: A knowledge management approach. In: Knowledge and
Process Management, 7(3), pp. 151–164.
Homans, George Caspar (1958): Social behavior as exchange. In: American Journal of Sociology, 63(6),
pp. 597–606.
Homans, George Caspar (1961): Social behavior: Its elementary forms, Routledge and Kegan Paul,
London.
Hopper (2018): Instagram Rich List 2018. Webpage of: Hopper HQ Ltd. URL:
https://www.hopperhq.com/blog/instagram-rich-list (07.10.2018).
Hopper (2019): Instagram Rich List 2019. Webpage of: Hopper HQ Ltd. URL:
https://www.hopperhq.com/blog/instagram-rich-list (04.08.2019).
Howe, Neil/Strauss, William (2000): Millennials rising, Vintage Books, New York 2000.
Hu, Tao/Dai, Hua/Salam, A. F. (2018): Integrative qualities and dimensions of social commerce. In:
Information & Management, pp. 249–270.
Huang, Chien-Chih/Lin, Tung-Ching/Lin, Kuei-Ju (2009): Factors affecting pass-along email intentions
(PAEIs): Integrating the social capital and social cognition theories. In: Electronic Commerce
Research and Applications, 8(3), pp. 160–169.
Huang, Zhao/Benyoucef, Morad (2013): From e-commerce to social commerce: A close look at design
features. In: Electronic Commerce Research and Applications, 12(4), pp. 246–259.
Huang, Zhao/Benyoucef, Morad (2017): The effects of social commerce design on consumer purchase
decision-making: An empirical study. In: Electronic Commerce Research and Applications, 25, pp.
40–58.
Hubell, Charles H. (1965): An input-output approach to clique identification. In: Sociometry, 28(4), pp.
377–399.
Huber, Joel C., Wittink, Dick R./Fiedler, John A./Miller, Richard (1991): An empirical comparison of
ACA and full profile judgments. In: Sawtooth Software Conference Proceedings, pp. 1–16.
Humphry, David B./Kim, Moshe/Vale, Bent (2012): Realizing the gains from electronic payments: Costs,
pricing, and payment choice. In: Journal of Money, Credit and Banking, vol. 33, no. 2, pp. 216–234.
idealo (2018): Umfrage zur Häufigkeit des Online-Shoppings in Deutschland 2018. Webpage of: Statista,
Inc. URL: https://de.statista.com/statistik/daten/studie/800752/umfrage/haeufigkeit-des-online-
shoppings-in-deutschland/ (19.06.2019).
IFH Köln/Handelsverband Deutschland (2019): ID 3979: Umsatz durch E-Commerce (B2C) in
Deutschland in den Jahren 1999 bis 2018 sowie eine Prognose für 2019 (in Milliarden Euro).
Webpage of: Statista, Inc. URL: https://de-statista-com.revproxy.escpeurope.eu/statistik/daten/
studie/3979/umfrage/e-commerce-umsatz-in-deutschland-seit-1999/ (24.06.2019).
Ilieva, Janet/Baron, Steve/Healey, Nigel M. (2002): Online surveys in marketing research: pros and cons.
In: International Journal of Market Research, 44, pp. 361–376.
Instagram (2019): ID 421169: Instagram accounts with the most followers worldwide as of May 2019 (in
millions). Webpage of: Statista, Inc. URL: https://www-statista-com.revproxy.escpeurope.eu/
statistics/421169/most-followers-instagram/ (24.06.2019).
Isabella, Giuliana/Mazzon, José Afonso/Dimoka, Angelika (2017): Impacts of product type and
representation type on the perception of justice and price fairness. In: Journal of Business Research,
81, pp. 203–211.
Isabelle, Frochot/Dominique, Kreziak/Statia, Elliot (2019): Home away from home: A longitudinal study
of the holiday appropriation process. In: Tourism Management, 71, pp. 327–336.
References 230
Itani, Omar S./Kassar, Abdul-Nasser/Loureiro, Sandra Maria Correia (2019): Value get, value give: The
relationships among perceived value, relationship quality, customer engagement, and value
consciousness. In: International Journal of Hospitality Management, 80, pp. 78–90.
Iyengar, Raghuram/Jedidi, Kamel/Kohli, Rajeev (2008): A conjoint approach to multipart pricing. In:
Journal of Marketing Research, 45(2), pp. 195–200.
Jacobsen, Nils (2019): Wie Kylie Jenner mit Influencer Marketing in eigener Sache zur jüngsten
Milliardärin der Welt wurde. Webpage of: Absatzwirtschaft. URL:
http://www.absatzwirtschaft.de/wie-kylie-jenner-mit-influencer-marketing-in-eigener-sache-zur-
juengsten-milliardaerin-der-welt-wurde-154074/ (16.09.2019).
Jain, Nimisha, Walters, Jeff, Bharadwaj et al. The Boston Consulting Group (2018): Digital consumers,
emerging markets, and the $4 trillion future.
Jeong, EunHa/Jang, SooCheong (2011): Restaurant experiences triggering positive electronic word-of-
mouth (eWOM) motivations. In: International Journal of Hospitality Management, 30(2), pp. 356–
366.
Johnson, Benjamin K./Ranzini, Giulia (2018): Click here to look clever: Self-presentation via selective
sharing of music and film on social media. In: Computers in Human Behavior, 82, pp. 148–158.
Johnson, Richard M. (1991): Comment on "Adaptive Conjoint Analysis: Some Caveats and Suggestions".
In: Journal of Marketing Research,, 28(2), pp. 223–225.
Johnson, Richard M. Sawtooth Software, Inc. (2000): Understanding HB: An Intuitive Approach,
Sequim.
Johnson, Richard M. Sawtooth Software (2009): The CBC/HB System for Hierarchical Bayes Estimation
Version 5 .0 Technical Paper, Sequim.
Johnson, Richard M./Wittink, Dick R. Sawtooth Software (2012): Reliability of Holdout Choices,
Sequim.
Joiner, Richard/Gavin, Jeff/Brosnan, Mark/Cromby, John/Gregory, Helen/Guiller, Jane/Maras,
Pam/Moon, Amy (2013): Comparing first and second generation Digital Natives' Internetuse,
Internet anxiety, and Internet identification. In: Cyberpsychology, Behavior, and Social Networking,
16(7), pp. 549–552.
Jones, Chris/Ramanau, Ruslan/Cross, Simon/Healing, Graham (2010): Net generation or Digital Natives:
Is there a distinct new generation entering university? In: Computers & Education, 54, pp. 722–732.
Joseph E. Phelps/Lewis, Regina/Mobillio, Lynne/Perry, David/Raman, Niranjan (2004): Viral marketing
or Electronic Word of Mouth Advertising: Examining consumer responses and motivations to pass
along email. In: Journal of Advertising Research, 44(4), pp. 333–348.
Kane, Gerald C./Alavi, Maryam/Labianca, Joe/Borgatti, Stephen P. (2014): What’s different about social
media networks? A framework and research agenda. In: MIS Quarterly, pp. 275–304.
Kannan, P. K./Li, Hongshuang Alice (2017): Digital marketing: A framework, review and research
agenda. In: International Journal of Research in Marketing, 34(1), pp. 22–45.
Kaplan, Andreas M./Haenlein, Michael (2010): Users of the world, unite! The challenges and
opportunities of Social Media. In: Business Horizons, 53(1), pp. 59–68.
Karniouchina, Ekaterina V./Moore, William L./van der Rhee, Bo/Verma, Rohit (2009): Issues in the use
of ratings-based versus choice-based conjoint analysis in operations management research. In:
European Journal of Operational Research, 197(1), pp. 340–348.
Karon, Christoph. Deloitte and intelliAd Media GmbH (2017): intelliAd E-Commerce Branchenindex Q4
/2016: Mobile Commerce boomt, Warenkörbe schrumpfen.
Keil, Maximilian (2018): Statistiken zur Social-Media-Nutzung in Deutschland. Webpage of: HubSpot.
URL: https://blog.hubspot.de/marketing/social-media-in-deutschland (19.07.2019).
References 231
Kemp, Simon (2019): Digital 2019: Global Internet use accelerates. Webpage of: WeAreSocial. URL:
https://wearesocial.com/blog/2019/01/digital-2019-global-internet-use-accelerates.
Kietzmann, Jan H./Hermkens, Kristopher/McCarthy, Ian P./Silvestre, Bruno S. (2011): Social media? Get
serious! Understanding the functional building blocks of social media. In: Business Horizons, 54(3),
pp. 241–251.
Killian, Michelle/Fahy, John/O’Loughlin, Deirdre/Kunz, Werner H. (2018): Individual versus Contextual
Motives in Electronic Word-of-Mouth (eWOM). In: AMA Winter Educators' Conference
Proceedings, pp. 12–16.
Kim, Cheonsoo/Yang, Sung-Un (2017): Like, comment, and share on Facebook: How each behavior
differs from the other. In: Public Relations Review, 43(2), pp. 441–449.
Kim, John/Naylor, Gillian/Sivadas, Eugene/Sugumaran, Vijayan (2015): The unrealized value of
incentivized eWOM recommendations. In: Marketing Letters, 27(3), pp. 411–421.
Kim, Young Ae/Srivastava, Jaideep (2007): Impact of Social Influence in E-Commerce Decision Making.
In: Proceedings of the ninth international conference on Electronic commerce, pp. 293–301.
King, Robert Allen/Racherla, Pradeep/Bush, Victoria D. (2014): What We Know and Don't Know About
Online Word-of-Mouth: A Review and Synthesis of the Literature. In: Journal of Interactive
Marketing, 28(3), pp. 167–183.
Kolodziejczak, Christian/Monti, Alessandro. Deutscher Marketing Verband (2018): Digital Pricing:
Definition und best practices, Düsseldorf.
Koo, Dong-Mo (2016): Impact of tie strength and experience on the effectiveness of online service
recommendations. In: Electronic Commerce Research and Applications, 15, pp. 38–51.
Krippendorff, Klaus (2004): Reliability in Content Analysis. In: Human Communication Research, 30(3),
pp. 411–433.
Krippendorff, Klaus (2019): Content analysis: An introduction to its methodology. Fourth Edition,
SAGE, Los Angeles.
Kuckartz, Udo (2010): Einführung in die computergestützte Analyse qualitativer Daten. 3rd ed., Verlag
für Sozialwissenschaften | GWV Fachverlage GmbH, Wiesbaden.
Kudeshia, Chetna/Kumar, Amresh (2017): Social eWOM. In: Management Research Review, 40(3), pp.
310–330.
Kulmala, Marianne/Mesiranta, Nina/Tuominen, Pekka (2013): Organic and amplified eWOM in
consumer fashion blogs. In: Journal of Fashion Marketing and Management: An International
Journal, 17(1), pp. 20–37.
Kumar, V./Mirchandani, Rohan (2012): Increasing the ROI of Social Media Marketing. In: MIT Sloan
Management Review, 54(1), pp. 55–61.
Kumar, V./Petersen, J. Andrew/Leone, Robert P. (2007): How Valuable Is Word of Mouth? In: Harvard
Business Review, 85(10), pp. 1–12.
Kumar, V./Petersen, J. Andrew/Leone, Robert P. (2010): Driving profitability by encouraging customer
referrals: Who, when, and how. In: Journal of Marketing, 74(5), pp. 1–17.
Kumar, V./Petersen, J. Andrew/Leone, Robert P. (2013): Defining, measuring, and managing Business
Reference Value. In: Journal of Marketing, 77(1), pp. 68–86.
Lambe, C. Jay/Wittmann, C. Michael/Spekman, Robert E. (2001): Social Exchange Theory and research
on Business-to-Business relational exchange. In: Journal of Business-to-Business Marketing, 8(3),
pp. 1–36.
Landers, Richard N./Behrend, Tara S. (2015): An inconvenient truth: Arbitrary distinctions between
organizational, mechanical turk, and other convenience samples. In: Industrial and Organizational
Psychology, 8(2), pp. 142–164.
References 232
Lapowsky, Issie (2018): The 21 (and counting) biggest Facebook scandals of 2018. Webpage of: Wired.
URL: https://www.wired.com/story/facebook-scandals-2018/ (14.05.2019).
Laudon, Kenneth C./Traver, Carol Guercio (2018): E-commerce: Business, technology, society. 4th ed.,
Pearson, Boston.
Lee, Mira/Rodgers, Shelly/Kim, Mikyoung (2009): Effects of Valence and Extremity of eWOM on
Attitude toward the Brand and Website. In: Journal of Current Issues and Research in Advertising,
31(2), pp. 1–11.
Lee, Seung Hwan/Brandt, Alan/Groff, Yuni/Lopez, Alyssa/Neavin, Tyler (2017): I’ll laugh, but I won’t
share: The role of darkness on evaluation and sharing of humorous online taboo ads. In: Journal of
Research in Interactive Marketing, 11(1), pp. 75–90.
Lemon, Katherine N./Verhoef, Peter C. (2016): Understanding customer experience throughout the
customer journey. In: Journal of Marketing, 80(6), pp. 69–96.
Leonidas, Hatzithomas/Boutsouki, Christina/Zotos, Yorgos (2008): Humorous message taxonomy:
Exploring the role of the various humor types on advertising, Article. In: International Journal of
Technology Marketing, pp. 1–9.
Leung, Xi/Tanford, Sarah/Jiang, Lan (2017): Is a picture really worth a thousand words? In: Journal of
Hospitality and Tourism Technology, 8(1), pp. 19–38.
Lever, Michael W./Mulvey, Michael S./Elliot, Statia (2017): From hashtags to shopping bags: Measuring
the rise of eWOM through social media and its impact on travelers’ shopping patterns. In: Tourism
Travel and Research Association, 12.
Levin, Jonathan/Milgrom, Paul (2004): Introduction to choice theory. Webpage of: Stanford University.
URL: http://web.stanford.edu/~jdlevin/Econ%20202/Choice%20Theory.pdf (11.10.2018).
Li, Chia-Ying (2017): How social commerce constructs influence customers' social shopping intention?
An empirical study of a social commerce website. In: Technological Forecasting and Social
Change, 144, pp. 282–294.
Li, Chia-Ying/Ku, Yi-Cheng (2018): The power of a thumbs-up: Will e-commerce switch to social
commerce? In: Information & Management, 55(3), pp. 340–357.
Liang, Silvia Wan-Ju/Ekinci, Yuksel/Occhiocupo, Nicoletta/Whyatt, Georgina (2013): Antecedents of
travellers' electronic word-of-mouth communication. In: Journal of Marketing Management, 29(5-
6), pp. 584–606.
Liang, Ting-Peng/Turban, Efraim (2014): Introduction to the special Issue Social Commerce: A research
framework for Social Commerce. In: International Journal of Electronic Commerce, 16(2), pp. 5–
13.
Liebana-Cabanillas, F./Alonso-Dos-Santos, M. (2017): Factors that determine the adoption of Facebook
commerce: The moderating effect of age. In: Journal of Engineering and Technology Management,
44, pp. 1–18.
Lin, Xiaolin/Li, Yibai/Wang, Xuequn (2017): Social commerce research: Definition, research themes and
the trends. In: International Journal of Information Management, 37(3), pp. 190–201.
Lin, Yu-Hsiang/Hsu, Chia-Lin/Chen, Mei-Fang/Fang, Cheng-Hsi (2017): New gratifications for social
word-of-mouth spread via mobile SNSs: Uses and gratifications approach with a perspective of
media technology. In: Telematics and Informatics, 34(4), pp. 382–397.
Liu, Fei/Xiao, Bo/Lim, Eric T.K./Tan, Chee-Wee (2017): The art of appeal in electronic commerce. In:
Internet Research, 27(4), pp. 752–771.
Liu, Jiangmeng/Li, Cong/Ji, Yi Grace/North, Michael/Yang, Fan (2017): Like it or not: The Fortune 500's
Facebook strategies to generate users' electronic word-of-mouth. In: Computers in Human Behavior,
73, pp. 605–613.
Liu, Qihong/Shuai, Jie (2013): Multi-dimensional price discrimination. In: International Journal of
Industrial Organization, 31(5), pp. 417–428.
References 233
Liu, Xianwei/Schuckert, Markus/Law, Rob (2018): Utilitarianism and knowledge growth during status
seeking: Evidence from text mining of online reviews. In: Tourism Management, 66, pp. 38–46.
Lloyd-Smith, Patrick/Adamowicz, Wiktor (2018): Can stated measures of willingness-to-accept be valid?
Evidence from laboratory experiments. In: Journal of Environmental Economics and Management,
91, pp. 133–149.
Lo, Louis Yi-Shih/Lin, Sheng-Wei (2017): An approach to initiating eWOM intentions. In: Internet
Research, 27(2), pp. 277–302.
Locke, Karen/Golden-Biddle/Karen (1997): Constructing opportunities for contribution: Structuring
intertextual coherence and "problematizing" in organizational studies. In: Academy of Management,
40(5), pp. 1023–1062.
Lopez, Manuela/Sicillia, Maria (2016): Advertising in new formats and media. 1st ed., Emerald Group
Publishing Limited, Bingley UK.
Louviere, Jordan J./Flynn, Terry N./Carson, Richard T. (2010): Discrete choice experiments are not
conjoint analysis. In: Journal of Choice Modelling, 3(3), pp. 57–72.
Louviere, Jordan J./Woodworth, George (1983): Design and analysis of simulated consumer choice or
allocation experiments: An approach based on aggregate data. In: Journal of Marketing Research,
20(4), pp. 350–367.
Lowe-Calverley, Emily/Grieve, Rachel (2018): Thumbs up: A thematic analysis of image-based posting
and liking behaviour on social media. In: Telematics and Informatics, 35(7), pp. 1900–1913.
Lu, Jingyi/Liu, Zhengyan, Fang, Zhe (2016): Hedonic products for you, utilitarian products for me. In:
Judgment and Decision Making, 11(4), pp. 332–341.
Luce, Duncan R./Tukey, John W. (1964): Simultaneous conjoint measurement: A new type of
fundamental measurement. In: Journal of mathematical psychology, 1, pp. 1–27.
Lund, Adam/Lund, Mark (2019): Laerd statistics. Webpage of: Lund Research Ltd. URL:
https://statistics.laerd.com/ (17.04.2019).
Lupton, Deborah. University of Canberra (2014): ‘Feeling Better Connected’: Academics’ use of social
media, Canberra.
MacInnis, Deborah J. (2011): A framework for conceptual contributions in marketing. In: Journal of
Marketing, 75(4), pp. 136–154.
Malhotra, Arvind/Kubowcicz-Malhotra, Claudia/See, Alan (2013): How to create brand engagement on
Facebook. In: MIT Sloan Management Review, 54(2), pp. 18–20.
Manafy, Michelle (2010): Peer pressure. In: EContent, 33(2), pp. 1-5.
Manzo, Gianluca (2013): Is rational choice theory still a rational choice of theory? A response to Opp. In:
Social Science Information, 52(3), pp. 361–382.
Marshall, Martin N. (1996): Sampling for qualitative research. In: Family Practice, 13(6), pp. 522–525.
Martínez-López, Francisco J. (2014): Handbook of Strategic e-Business Management, Springer, Berlin,
Heidelberg 2014.
Mas-Colell, Andreu/Whinston, Michael D./Green, Jerry R. (1995): Microeconomic theory, Oxford
University Press, New York, Oxford.
Maxwell, Scott E./Delaney, Harold D. (2004): Designing experiments and analyzing data. 2nd ed.,
Lawrence Erlbaum Associates, Mahwah, N.J., London.
Mayring, Philipp (2014): Qualitative content analysis: theoretical foundation, basic procedures and
software solution, Klagenfurt.
Mayring, Philipp/Brunner, Eva, (2006): Qualitative Textanalyse - Qualitative Inhaltsanalyse In: Flaker,
Vito (2006, Hrsg.): Von der Idee zur Forschungsarbeit, Böhlau, Wien, Köln, Weimar, 2006, pp.
453–463.
References 234
Mayring, Philipp/Fenzl, Thomas, (2014): Qualitative Inhaltsanalyse In: Blasius, Jörg/Baur, Nina (2014,
Hrsg.): Handbuch Methoden der empirischen Sozialforschung, Springer VS, Wiesbaden, 2014, pp.
543–556.
McDonell, J., Strom-Gottfried, K. J., Burton, D. L., & Yaffe, J, (2006): Behaviorism, social learning, and
exchange theory In: Robbins, Susan P./Chatterjee, Pranab/Canda, Edward R. (2006, Hrsg.):
Contemporary human behavior theory. 2nd ed., Pearson/A&B, Boston, London, 2006, pp. 349–385.
Meade, Adam W./Craig, S. Bartholomew (2012): Identifying careless responses in survey data. In:
Psychological Methods, 17(3), pp. 437–455.
Medlin, Mary M./Brown, Mitch/Sacco, Donald F. (2018): That's what she said! Perceived mate value of
clean and dirty humor displays. In: Personality and Individual Differences, 135, pp. 192–200.
Miettinen, Topi/Stenbacka, Rune (2015): Personalized pricing versus history-based pricing: Implications
for privacy policy. In: Information Economics and Policy, 33, pp. 56–68.
Milkau, Udo/Bott, Jürgen (2015): Digitalisation in payments. In: Journal of Payments Strategy &
Systems, 9(3), pp. 321–339.
Mill, John Stuart (1863): Utilitariansim, Parker, Son, and Bourn, West Strand, London.
Mishra, A./Satish, S. M. (2016): eWOM: Extant research review and future research avenues. In: Vikalpa
- The Journal for Decision Makers, 41(3), pp. 222–233.
Mishra, Anubhav/Maheswarappa, Satish S./Maity, Moutusy/Samu, Sridhar (2018): Teenagers’ eWOM
intentions: A nature vs nurture perspective. In: Marketing Intelligence and Planning, 36(4), pp. 470–
483.
Mittal, Vikas/Huppertz, John W./Khare, Adwait (2008): Customer complaining: The role of tie strength
and information control. In: Journal of Retailing, 84(2), pp. 195–204.
Morton, Rebecca B./Williams, Kennth C., (2011): Electoral systems and strategic voting (Laboratroy
election experiments) In: Druckman, James N. (2011, Hrsg.): Cambridge Handbook of Experimental
Political Science, Cambridge University Press, Cambridge, New York, 2011, pp. 369–383.
Mosseri, Adam (2017): How Does Facebook News Feed Ranking Work? Webpage of: Facebook, Inc.
URL: https://www.youtube.com/watch?v=5kXYC265yn8 (19.06.2019).
Muntinga, Daniël G./Moorman, Marjolein/Smit, Edith G. (2015): Introducing COBRAs: Exploring
motivations for brand-related social media use. In: International Journal of Advertising, 30(1), pp.
13–46.
Murphy, Gregory L. (2002): The big book of concepts, MIT Press, Cambridge, Mass., London.
Mustonen, Johanna (2015): Evaluating the blog as an arena of word of mouth marketing. Lindblom Arto,
Helsinki, 2015, Research paper. Aalto University, Helsinki, 2015.
Nakayama, Makoto/Wan, Yun/Sutcliffe, Norma (2010): WOM or eWOM or something else: How does
the web affect our dependence on shopping information sources? In: AMCIS 2010 Proceedings, pp.
1–10.
Nassiri-Mofakham, Faria/Baraani-Dastjerdi, Ahmad/Nematbakhsh, Mohammad Ali/Ghasem-Aghaee,
Nasser (2009): Electronic promotion to new customers using mkNN learning. In: Information
Sciences, 179(3), pp. 248–266.
Nguyen, Hang, Calantone, Roger, Krishnan, Ranjani (2018): How online emotional Word-of-Mouth
influences institutional stock holdings and firm value. In: Winter AMA Proceedings, pp. 5–6.
Nieto-García, Marta/Muñoz-Gallego, Pablo A./González-Benito, Óscar (2017): Tourists’ willingness to
pay for an accommodation: The effect of eWOM and internal reference price. In: International
Journal of Hospitality Management, 62, pp. 67–77.
Nisar, Tahir M./Prabhakar, Guru (2017): What factors determine e-satisfaction and consumer spending in
e-commerce retailing? In: Journal of Retailing and Consumer Services, 39, pp. 135–144.
Nye, F. Ivan (1982): Family relationships: Rewards and costs, SAGE, Beverly Hills, London.
References 235
OECD. OECD Publishing (2016): Education at a Glance 2016: OECD indicators, Paris.
OECD. Statista, Inc. (2019): ID 14177: Deutschland: Verhältnis der "inaktiven" Bevölkerung ab 65 Jahre
zur gesamten Erwerbsbevölkerung von 2000 bis 2050.
Oeldorf-Hirsch, Anne/Sundar, S. Shyam (2015): Posting, commenting, and tagging: Effects of sharing
news stories on Facebook. In: Computers in Human Behavior, 44, pp. 240–249.
Opp, Karl-Dieter (2014): Methodologie der Sozialwissenschaften: Einführung in Probleme ihrer
Theorienbildung und praktischen Anwendung. 7th ed., Springer, Wiesbaden.
Orme, Bryan (2019): ACBC HB estimation of the None utility. Webpage of: Sawtooth Software. URL:
https://www.sawtoothsoftware.com/forum (16.07.2019).
Orme, Bryan K. (2010): Getting started with conjoint analysis. 2nd ed., Research Publishers, Madison,
WI.
Orme, Bryan K./Baker, Gary C. Sawtooth Software (2000): Comparing the Use of Hierarchical Bayes
Draws and Randomized First Choice, Sequim.
Orme, Bryan K./Chrzan, Keith (2017): Becoming an expert in conjoint analysis, Sawtooth Software,
Orem, UT.
Orosz, Gábor/Tóth-Király, István/Bőthe, Beáta (2016): Four facets of Facebook intensity — The
development of the Multidimensional Facebook Intensity Scale. In: Personality and Individual
Differences, 100, pp. 95–104.
O'Shaughnessy, John/Jackson O'Shaughnessy, Nicholas (2009): The service‐dominant perspective: A
backward step? In: European Journal of Marketing, 43(5/6), pp. 784–793.
Paas, Leonard J./Dolnicar, Sara/Karlsson, Logi (2018): Instructional Manipulation Checks: A longitudinal
analysis with implications for MTurk. In: International Journal of Research in Marketing, 35, pp.
258–269.
Park, Seunghyun "Brian"/Park, Kwangsoo (2015): Intercoder reliability indices in tourism research. In:
Annals of Tourism Research, 55, pp. 178–180.
Patil, Kashinath D. (1975): Cochran's Q Test: Exact distribution. In: Journal of the American Statistical
Association, 70(349), pp. 186–189.
Pelzer, Elena (2018): The potential of conjoint analysis for communication research. In: Communication
Research Reports, 36(2), pp. 136–147.
Peterson, Robert A./Merunka, Dwight R. (2014): Convenience samples of college students and research
reproducibility. In: Journal of Business Research, 67(5), pp. 1035–1041.
Petraki, Eleni/Ramayanti, Ismarita (2018): Navigating the Indonesian workplace hierarchy: Managers' use
of humour as a rapport building strategy. In: Journal of Pragmatics, 134, pp. 199–209.
Petrescu, Maria/O’Leary, Kathleen/Goldring, Deborah/Ben Mrad, Selima (2018): Incentivized reviews:
Promising the moon for a few stars. In: Journal of Retailing and Consumer Services, 41, pp. 288–
295.
Phua, Joe/Kim, Jihoon (2018): Starring in your own Snapchat advertisement: Influence of self-brand
congruity, self-referencing and perceived humor on brand attitude and purchase intention of
advertised brands. In: Telematics and Informatics, 35(5), pp. 1524–1533.
Pillai, Anandan/Mukherjee, Jaydeep (2011): User acceptance of hedonic versus utilitarian social
networking web sites. In: Journal of Indian Business Research, 3(3), pp. 180–191.
Pimpl, Roland (2015): Jeder Deutsche liest im Schnitt acht Zeitschriften. Webpage of: Horizont - Zeitung
für Marketing, Werbung und Medien. URL: https://www.horizont.net/medien/nachrichten/Print-
MA-Jeder-Deutsche-liest-im-Schnitt-acht-Zeitschriften-135486 (16.06.2019).
Pongjit, Chompunuch/Beise-Zee, Rian (2015): The effects of word-of-mouth incentivization on consumer
brand attitude. In: Journal of Product & Brand Management, 24(7), pp. 720–735.
References 236
Pope, Nigel K. Ll./Voges, Kevin E./Brown, Mark R. (2004): The effect of provocation in the form of
mild erotica on attitude to the ad and corporate image: Differences between cause-related and
product-based advertising. In: Journal of Advertising, 33(1), pp. 69–82.
Popper, Karl (1963): Science as Falsification. In: Conjectures and Refutations, pp. 33–39.
Pornel, Jonny B./Saldana, Giabelle, A. (2013): Four Common Misuses of the Likert Scale. In: Philippine
Journal of Social Sciences and Humanities, 18(2), pp. 12–19.
Prensky, Marc (2001): Digital Natives, Digital Immigrants. In: On the Horizon - MCB University Press,
9(5), pp. 1–6.
Printer's Studio Limited (2018): FAQ: How do I get my "bonus code" by sharing my purchase on
Facebook? Webpage of: printerstudio.com. URL: http://www.printerstudio.com/faq-facebook-
promo.aspx#4 (22.10.018).
Przyborski, Aglaja/Wohlrab-Sahr, Monika (2014): Qualitative Sozialforschung: Ein Arbeitsbuch. 4th ed.,
Oldenbourg Verlag, München.
Raghunathan, Rajagopal/Corfman, Kim (2006): Is happiness shared doubled and sadness shared halved?
Social influence on enjoyment of hedonic experiences. In: Journal of Marketing Research, 43(3),
pp. 386–394.
Randolph/Justus (2009): A guide to writing the dissertation literature review. In: Practical Assessment,
Research & Evaluation, 14(13), pp. 1–13.
Rao, P. H. (2013): Business analytics: An application focus, Prentice-Hall Of India, Delhi.
Rao, Vithala R. (2011): Wiley international encyclopedia of marketing: Conjoint Analysis, pp. 1–12.
Ratcliffe, John W. (1983): Notions of validity in qualitative research methodology. In: Knowledge.
Creation, diffusion, utilization, 5(2), pp. 147–167.
Redmond, Mark V. Iowa State University (2015): Social Exchange Theory, Iowa.
Reich-Stiebert, Natalia/Eyssel, Friederike/Hohnemann, Charlotte (2018): Involve the user! Changing
attitudes toward robots by user participation in a robot prototyping process. In: Computers in Human
Behavior, 91, pp. 290–296.
Reimer, Thomas/Benkenstein, Martin (2016): Altruistic eWOM marketing: More than an alternative to
monetary incentives. In: Journal of Retailing and Consumer Services, 31, pp. 323–333.
Rezaeian, Ali/Shokouhyar, Sajjad/Dehghan, Fariba (2016): Measuring customers satisfaction of e-
commerce sites using clustering techniques: Case study of Nyazco website. In: International
Journal of Management, Accounting and Economics, 3(1), pp. 61–74.
Richins, Marsha L. (1983): Negative Word-of-Mouth by dissatisfied consumers: A pilot study. In: The
Journal of Marketing, 47(1), pp. 68–78.
Ritzer, George/Jurgenson, Nathan (2010): Production, consumption, prosumption: The nature of
capitalism in the age of the digital 'prosumer'. In: Journal of Consumer Culture, 10(1), pp. 13–36.
Roe, Brian E./Just, David R. (2009): Internal and external validity in economics research: Tradeoffs
between experiments, field experiments, natural experiments, and field data. In: American Journal
of Agricultural Economics, 91(5), pp. 1266–1271.
Rohleder, Bernahrd. Bitkom (2018): Social-Media-Trends 2018, Berlin.
Rose, Susan/Clark, Moira/Samouel, Phillip/Hair, Neil (2012): Online customer experience in e-retailing:
An empirical model of antecedents and outcomes. In: Journal of Retailing, 88(2), pp. 308–322.
Rosenthal, Robert, (1994): Parametric measures of effect size In: Hedges, Larry V./Cooper, Harris M.
(1994, Hrsg.): The Handbook of research synthesis, Russell Sage Foundation, New York, 1994, pp.
231–239.
Rossi, Peter E./Allenby, Greg M./McCulloch, Robert E. (2005): Bayesian statistics and marketing, John
Wiley, Chichester.
References 237
Rossmann, Alexander/Wilke, Tim/Kabaoglu, Hüseyin (2017): Current research on Electronic Word-of-
Mouth communication: Literature analysis and further research directions. In: AMA Winter
Educators' Conference Proceedings, 28, pp. 10–19.
Rousseau, Signe (2012): Food and social media: You are what you tweet, Altamira Press/Rowman &
Littlefield, Lanham.
Rowley, Jennifer (2012): Conducting research interviews. In: Management Research Review, 35(3-4), pp.
260–271.
Rubenking, Bridget (2019): Emotion, attitudes, norms and sources: Exploring sharing intent of disgusting
online videos. In: Computers in Human Behavior, pp. 63–71.
Ruetzler, Tanya/Taylor, Jim/Reynolds, Dennis/Baker, William (2011): Understanding perceptions of
professional attributes using conjoint analysis. In: International Journal of Hospitality Management,
30(3), pp. 551–557.
Ryals, Lynette (2008): Determining the indirect value of a customer. In: Journal of Marketing
Management, 24(7-8), pp. 847–864.
Ryu, Ehri (2015): Multiple-group analysis approach to testing group difference in indirect effects. In:
Behavior Research Methods, 47(2), pp. 484–493.
Ryu, Gangseog/Feick, Lawrence (2007): A penny for your thoughts: Referral reward programs and
referral likelihood. In: Journal of Marketing, 71(1), pp. 84-94.
Saleh, Khalid (2015): Social media engagement – Statistics and trends. Webpage of: Invesp. URL:
https://www.invespcro.com/blog/social-media-engagement/ (17.06.2019).
Sattler, Henrik/Hensel-Börner, Susanne, (2007): A comparison of conjoint measurement with self-
explicated approaches In: Gustafsson, Anders/Herrmann, Andreas/Huber, Frank (2007, Hrsg.):
Conjoint Measurement. Fourth edition, Springer-Verlag Berlin Heidelberg, Berlin, Heidelberg,
2007, pp. 67–76.
Sawtooth Software. Sawtooth Software (2009): The CBC/HB System for Hierarchical Bayes Estimation,
Sequim.
Sawtooth Software, Inc. (2018): Sawtooth Software Pricing | Suite Subscriptions. Webpage of: Sawtooth
Software. URL: https://www.sawtoothsoftware.com/products/pricing-ordering (21.12.2018).
Sawtooth Software, Inc. (2019): Interaction Search Tool. Webpage of: Sawtooth Software, Inc. URL:
https://www.sawtoothsoftware.com/help/lighthouse-studio/manual/interaction_search_tool.html
(22.04.2019).
Sawtooth Software Inc. Sawtooth Software Inc. (2014): The Adaptive Choice-Based Conjoint (ACBC)
technical paper, Orem.
Scheinbaum, Angeline Close/Hampel, Stefan/Kang, Mihyun (2017): Future developments in IMC: Why
e-mail with video trumps text-only e-mails for brands. In: European Journal of Marketing, 51(3),
pp. 627–645.
Schirpke, Uta/Tappeiner, Gottfried/Tasser, Erich/Tappeiner, Ulrike (2019): Using conjoint analysis to
gain deeper insights into aesthetic landscape preferences. In: Ecological Indicators, 96, pp. 202–
212.
Schreier, Margrit (2012): Qualitative content analysis in practice. 1st ed., SAGE, London.
Schwager, Andre/Meyer, Chris (2007): Understanding customer experience. In: Harvard Business
Review, pp. 117–126.
Scott, John, (2000): Rational Choice Theory In: Browning, Gary K./Halcli, Abigail/Webster, Frank
(2000, Hrsg.): Understanding contemporary society, SAGE, London, 2000, pp. 126–138.
Sebald, Anna Kathrin/Jacob, Frank (2018): Help welcome or not: Understanding consumer shopping
motivation in curated fashion retailing. In: Journal of Retailing and Consumer Services, 40, pp.
188–203.
References 238
See-To, Eric W.K./Ho, Kevin K.W. (2014): Value co-creation and purchase intention in social network
sites: The role of electronic Word-of-Mouth and trust - A theoretical analysis. In: Computers in
Human Behavior, 31, pp. 182–189.
Sekaran, Uma/Bougie, Roger (2016): Research methods for business: A skill-building approach. Seventh
edition, Wiley, Chichester, West Sussex.
Septianto, Felix/Chiew, Tung Moi (2018): The effects of different, discrete positive emotions on
electronic word-of-mouth. In: Journal of Retailing and Consumer Services, 44, pp. 1–10.
Sethuraman, Raj/Kerin, Roger A./Cron, William L. (2005): A field study comparing online and offline
data collection methods for identifying product attribute preferences using conjoint analysis. In:
Journal of Business Research, 58(5), pp. 602–610.
Shapka, Jennifer D./Domene, Jose F./Khan, Shereen/Yang, Leigh Mijin (2016): Online versus in-person
interviews with adolescents: An exploration of data equivalence. In: Computers in Human Behavior,
58, pp. 361–367.
Shukla, Paurav/Banerjee, Madhumita/Adidam, Phani Tej (2013): The moderating influence of socio-
demographic factors on the relationship between consumer psychographics and the attitude towards
private label brands. In: Journal of Consumer Behaviour, 12(6), pp. 423–435.
Sijoria, Charu/Mukherjee, Srabanti/Datta, Biplab (2018): Impact of the antecedents of eWOM on CBBE.
In: Marketing Intelligence & Planning, 5, pp. 528–542.
Simon, Herbert A., (1972): Theories of bounded rationality In: McGuire, Charles Bartlett/Radner,
Roy/Marschak, Jacob (1972, Hrsg.): Decision and organization, North-Holland Publishing Co,
Amsterdam, London, 1972, pp. 161–176.
Sirgy, M. Joseph (1982): Self-concept in consumer behavior: A critical review. In: Journal of Consumer
Research, 9(3), pp. 287–300.
smart (2015): The new smart fortwo with twinamic. Webpage of: Daimler AG | Smart YouTube Channel.
URL: https://www.youtube.com/watch?v=IAJBtPz6sZE&pbjreload=10 (07.05.2019).
Smith, Adam (1776): An inquiry into the nature and causes of the wealth of nations, London.
Smith, Kevin B. (2002): Typologies, Taxonomies, and the Benefits of Policy Classification. In: Policy
Stduies Journal, pp. 379–395.
Solomon, George/Raposo, Mário/do Paço, Arminda/Ferreira, João (2008): Entrepreneur's profile: A
taxonomy of attributes and motivations of university students. In: Journal of Small Business and
Enterprise Development, 15(2), pp. 405–418.
Song, Chanho (2015): An experimental test of the performance of referral reward programs. Wiggens-
Johnson, Jennifer, Kent, 2015, Dissertation. Kent State University Graduate School of Management,
Kent, 2015.
Sonnenschein, Bernd. InfluencerDB Tech GmbH & Co. KG (2019): Media value per post of
@bibisbeautypalace and @pamela_rf, Münster.
Speck, Paul Surgi (2012): The humorous message taxonomy: A framework for the study of humorous
ads. In: Current Issues and Research in Advertising, 13(1-2), pp. 1–44.
Splendid Research (2016): Gewohnheiten nach dem Aufstehen. Webpage of: Statista, Inc. URL:
https://de-statista-com.revproxy.escpeurope.eu/statistik/daten/studie/601229/umfrage/gewohnheiten-
nach-dem-aufstehen-in-deutschland/ (18.07.2019).
Srinivasana, Srini S./Andersona, Rolph/Ponnavolu, Kishore (2002): Customer loyalty in e-commerce: An
exploration of its antecedents and consequences. In: Journal of Retailing, 78, pp. 41–50.
Statista, Inc. (2017): Number of monthly active Instagram users from January 2013 to April 2017 (in
millions), New York.
Statista, Inc. statista.com (2018): Most popular social networks by number of page visits in Germany in
October 2016 (in millions).
References 239
Statista, Inc. (2019): ID 272014: Most famous social network sites worldwide as of April 2019, ranked by
number of active users (in millions). Webpage of: Statista, Inc. URL: https://www-statista-
com.revproxy.escpeurope.eu/statistics/272014/global-social-networks-ranked-by-number-of-users/
(24.06.2019).
Sternthal, Brian/Craig, C. Samuel (1973): Humor in advertising. In: Journal of Marketing, 37(4), pp. 12–
18.
Sutcliffe, Alistair G./Binder, Jens F./Dunbar, Robin I.M. (2018): Activity in social media and intimacy in
social relationships. In: Computers in Human Behavior, 85, pp. 227–235.
Sweeney, Jillian C./Soutar, Geoffrey N./Mazzarol, Tim (2008): Factors influencing word of mouth
effectiveness: receiver perspectives. In: European Journal of Marketing, 42, pp. 344–364.
Tamimi, Nabil/Sebastianelli, Rose (2015): The relative importance of e-tailer website attributes on the
likelihood of online purchase. In: Internet Research, 25(2), pp. 169–183.
Tapscott, Don (1998): Growing up digital: The rise of the Net generation, McGraw-Hill, New York,
London.
Teichert, Thorsten/Shehu, Edlira, (2009): Diskussion der Conjointanalyse in der Forschung In: Baier,
Daniel/Brusch, Michael (2009, Hrsg.): Conjointanalyse, Springer, Berlin, New York, 2009, pp. 19–
39.
Temme, Jarg, (2007): Discrete-Choice-Modelle In: Albers, Sönke (2007, Hrsg.): Methodik der
empirischen Forschung. 2nd ed., Gabler, Wiesbaden, 2007, pp. 327–342.
Teo, Timothy (2013): An initial development and validation of a Digital Natives Assessment Scale
(DNAS). In: Computers & Education, 67, pp. 51–57.
Tercia, Christiana Yosevina/Teichert, Thorsten (2017): How consumers respond to incentivized word of
mouth: An examination across gender. In: Australasian Marketing Journal (AMJ), 25(1), pp. 46–56.
Thibaut/John W./Kelley/Harold H. (1959): The social psychology of groups, Routledge, New York.
Thibaut, John/Kelley, Haralod, (1994): Social Exchange Theory In: Griffin, Em (1994, Hrsg.): A first
look at communication theory. 2nd ed., McGraw-Hill, New York, London, 1994, pp. 196–205.
Thomas Reuters (2019): Facebook Inc stock information. Webpage of: Reuters. URL:
https://www.reuters.com/finance/stocks/overview/FB.OQ (18.02.2019).
tom Dieck, M. Claudia/Jung, Timothy Hyungsoo/Kim, Woo Gon/Moon, Yunji (2017): Hotel guests’
social media acceptance in luxury hotels. In: International Journal of Contemporary Hospitality
Management, 29(1), pp. 530–550.
Tong, Yu/Xinwei Wang and Hock-Hai Teo (2007): Understanding the intention of information
contribution to online feedback systems from social exchange and motivation crowding
perspectives. In: Proceedings of the 40th Hawaii International Conference on System Sciences,
HICSS'07, pp. 1–10.
Toubia, Olivier/Hauser, John R./Simester, Duncan I. (2018): Polyhedral methods for Adaptive Choice-
Based Conjoint Analysis. In: Journal of Marketing Research, 41(1), pp. 116–131.
Train, Kenneth E. (2003): Discrete choice methods with simulation, Cambridge University Press,
Cambridge.
Trusov, M./Bucklin, R. E./Pauwels, K. (2009): Effetcs of Word-of-Mouth versus traditional marketing:
Findings from an internet social networking site. In: Journal of Marketing, 73, pp. 90–102.
Turban, Efraim/King, David R./Lee, Jae Kyu/Liang, Ting-Peng/Turban, Deborrah C. (2015): Electronic
commerce: A managerial and social networks perspective. Eighth edition, Revised Edition,
Springer, Cham.
Tversky, Amos/Kahneman, Daniel (1974): Judgment under uncertainty: Heuristics and biases. In:
Science, pp. 1124–1131.
References 240
van Doorn, Jenny/Lemon, Katherine N./Mittal, Vikas/Nass, Stephan/Pick, Doreén/Pirner, Peter/Verhoef,
Peter C. (2010): Customer engagement behavior: Theoretical foundations and research directions.
In: Journal of Service Research, 13(3), pp. 253–266.
van Esch, Patrick/Mente, Margaret (2018): Marketing video-enabled social media as part of your e-
recruitment strategy: Stop trying to be trendy. In: Journal of Retailing and Consumer Services, 44,
pp. 266–273.
Vargo, Stephen L./Lusch, Robert F. (2004): Evolving to a new dominant logic for marketing. In: Journal
of Marketing, 68, pp. 1–17.
Veitch, Jenny/Salmon, Jo/Deforche, Benedicte/Ghekiere, Ariane/van Cauwenberg, Jelle/Bangay,
Shaun/Timperio, Anna (2017): Park attributes that encourage park visitation among adolescents: A
conjoint analysis. In: Landscape and Urban Planning, 161, pp. 52–58.
Venkatesh, Viswanath/Hoehle, Hartmut/Aljafari, Ruba (2014): A usability evaluation of the Obamacare
website. In: Government Information Quarterly, 31(4), pp. 669–680.
Vieira, Edward T. (2017): Introduction to real world statistics: With step-by-step SPSS instructions,
Routledge, London.
Viera, Anthony J./Garrett, Joanne M. (2005): Understanding interobserver agreement: The Kappa
statistic. In: Family medicine, 37(5), pp. 360–363.
Voleti, Sudhir/Srinivasan, V./Ghosh, Pulak (2017): An approach to improve the predictive power of
choice-based conjoint analysis. In: International Journal of Research in Marketing, 34(2), pp. 325–
335.
Voss, Kevin E./Spangenberg, Eric R./Grohmann, Bianca (2018): Measuring the hedonic and utilitarian
dimensions of consumer attitude. In: Journal of Marketing Research, 40(3), pp. 310–320.
Voss, Oliver (2018): Nur Mark Zuckerberg muss zittern vor der DSGVO. Webpage of: Der Tagesspiegel.
URL: https://www.tagesspiegel.de/politik/neue-datenschutzregeln-nur-mark-zuckerberg-muss-
zittern-vor-der-dsgvo/22595086.html (11.05.2019).
Wang, Yichuan/Yu, Chiahui (2017): Social interaction-based consumer decision-making model in social
commerce: The role of word of mouth and observational learning. In: International Journal of
Information Management, 37(3), pp. 179–189.
Warner-Søderholm, Gillian/Bertsch, Andy/Sawe, Everlyn/Lee, Dwight/Wolfe, Trina/Meyer, Josh/Engel,
Josh/Fatilua, Uepati Normann (2018): Who trusts social media? In: Computers in Human Behavior,
81, pp. 303–315.
We Are Social/Google (2018): Daily internet access of users in selected global online markets of January
2018. Webpage of: Statista, Inc. URL: https://www.statista.com/statistics/408506/internet-usage-
frequency-daily-worldwide/ (18.07.2019).
Webster, Jane/Watson, Richard T. (2002): Analyzing the past to prepare for the future: Writing a
literature review, 26(2), pp. xiii–xxiii.
Weinberg, Bruce D./Berger, Paul D. (2011): Connected customer lifetime value: The impact of social
media. In: Journal of Direct, Data and Digital Marketing Practice, 12(4), pp. 328–344.
Weisfeld-Spolter, Suri/Sussan, Fiona/Gould, Stephen (2014): An integrative approach to eWOM and
marketing communications. In: Corporate Communications: An International Journal, 19(3), pp.
260–274.
Werbeagentur Wirz (2001): Fast so kompliziert wie eine Frau. Aber pünktlich. Webpage of: IWC
International Watch Co. Ltd. URL: https://100percentpassion.net/2015/01/28/iwc-werbung-wirkt/
(08.05.2019).
White, James M./Klein, David M./Martin, Todd F. (2015): Family theories. Fourth Edition, SAGE, Los
Angeles.
White, Martin (2012): Digital workplaces. In: Business Information Review, 4, pp. 205–214.
References 241
Whitty, Monica (2008): Revealing the ‘real’ me, searching for the ‘actual’ you: Presentations of self on
an internet dating site. In: Computers in Human Behavior, 24, pp. 1707–1723.
Wilcox, Ron D./Kohler, Thomas (2017): Pricing strategy in practice. Webpage of: Coursera. URL:
https://www.coursera.org/lecture/uva-darden-bcg-pricing-strategy-practice/attribute-importances-
ulPZr (02.07.2019).
Wirtz, Jochen/Chew, Patricia (2002): The effects of incentives, deal proneness, satisfaction and tie
strength on word‐of‐mouth behaviour. In: International Journal of Service Industry Management,
13(2), pp. 141–162.
Wood, Julia T./Pearce, W. Barnett (1980): Sexists, racists, and other classes of classifiers: Form and
function of “…Ist” accusations. In: Quarterly Journal of Speech, 66(3), pp. 239–250.
Wood, Wendy (2000): Attitude Change: Persuasion and Social Influence. In: Annual Review of
Psychology, 51, pp. 539–570.
Wu, Chi-Cheng/Liu, Yi-Fen/Chen, Ying-Ju/Wang, Chih-Jen (2012): Consumer responses to price
discrimination: Discriminating bases, inequality status, and information disclosure timing
influences. In: Journal of Business Research, 65(1), pp. 106–116.
Wu, Yen-Chun Jim/Shen, Ju-Peng/Chang, Chan-Lan (2015): Electronic service quality of Facebook
social commerce and collaborative learning. In: Computers in Human Behavior, 51, pp. 1395–1402.
Xi, Qinwei/Kukla, Matthew (2012): Share it on Facebook: Examining viral marketing and motives to
pass along electronic content on SNS. In: Proceedings of the 2012 Conference of the American
Academy of Advertising, 1, pp. 148–160.
Yadav, Manjit S. (2010): The decline of conceptual articles and implications for knowledge development.
In: Journal of Marketing, 74(1), pp. 1–19.
Yan, Qiang/Wu, Shuang/Wang, Lingli/Wu, Pengfei/Chen, Hejie/Wei, Guohong (2016): E-WOM from e-
commerce websites and social media: Which will consumers adopt? In: Electronic Commerce
Research and Applications, pp. 62–73.
Yap, Kenneth B./Soetarto, Budi/Sweeney, Jillian C. (2013): The relationship between electronic word-of-
mouth motivations and message characteristics: The sender’s perspective. In: Australasian
Marketing Journal (AMJ), 21(1), pp. 66–74.
Yen, Chih-Lun Alan/Tang, Chun-Hung Hugo (2019): The effects of hotel attribute performance on
electronic word-of-mouth (eWOM) behaviors. In: International Journal of Hospitality Management,
76, pp. 9–18.
Yu, Jie/Goos, Peter/Vandebroek, Martina (2011): Individually adapted sequential Bayesian conjoint-
choice designs in the presence of consumer heterogeneity. In: International Journal of Research in
Marketing, 28(4), pp. 378–388.
Yunus, Muhammad/Moingeon, Bertrand/Lehmann-Ortega, Laurence (2010): Building social business
models: Lessons from the Grameen experience. In: Long Range Planning, 43(2-3), pp. 308–325.
Zafirovski, Milan (1999): What is really rational choice? Beyond the Utilitarian concept of rationality. In:
Current Sociology, 47(1), pp. 47–113.
Zalando SE. Zalando SE (2015): Annual Report 2014, Berlin.
Zalando SE. Zalando SE (2016): Annual Report 2016, Berlin.
Zalando SE. Zalando SE (2018): Annual Report 2017, Berlin.
Zarco, Timothy H. (2015): Effects of online review valence on consumer attitudes and behavioral
Intentions. In: Philippine Management Review, 22, pp. 75–88.
Zentes, Joachim/Morschett, Dirk, (2003): Horizontale und vertikale Online-Kooperationen im Vertrieb
In: Büttgen, Marion (2003, Hrsg.): Online-Kooperationen. 1st ed., Gabler, Wiesbaden, 2003, pp.
223–248.
References 242
Zhang, Hong/Lu, Yaobin/Gupta, Sumeet/Zhao, Ling (2014): What motivates customers to participate in
social commerce? The impact of technological environments and virtual customer experiences. In:
Information & Management, 51(8), pp. 1017–1030.
Zhang, Kem Z.K./Zhao, Sesia J./Cheung, Christy M.K./Lee, Matthew K.O. (2014): Examining the
influence of online reviews on consumers' decision-making: A heuristic-systematic model. In:
Decision Support Systems, 67, pp. 78–89.
Zhang, Wenping/Kang, Lele/Jiang, Qiqi/Pei, Lei (2018): From buzz to bucks: The impact of social media
opinions on the locus of innovation. In: Electronic Commerce Research and Applications, 30, pp.
125–137.
Zhang, Yong (1996): Responses to humorous advertising the moderating effect of need for. In: The
Journal of Advertising, vol. XXV, no. 1, pp. 15–32.
Zheng, Xiabing/Cheung, Christy M. K./Lee, Matthew K.O./Liang, Liang (2015): Building brand loyalty
through user engagement in online brand communities in social networking sites. In: Information
Technology & People, 28(1), pp. 90–106.
Ziefle, Martina/Halbey, Julian, Kowalewski, Sylvia (2016): Users’ Willingness to Share Data on the
Internet: Perceived benefits and caveats. In: Proceedings of the International Conference on Internet
of Things and Big Data, IoTBD 2016, pp. 255–265.
Zuckerberg, Mark. Facebook (2007): Facebook Advertising Announcement 2007 - Liveblogging by Erick
Schonfeld (Speech by Facebook CEO Mark Zuckerberg). Webpage of: https://techcrunch.com.
URL: https://techcrunch.com/2007/11/06/liveblogging-facebook-advertising-announcement/
(07.08.2017).
Zuckerberg, Mark (2018): Big focus areas for 2018. Webpage of: Facebook, Inc. URL:
https://www.facebook.com/zuck/posts/10104413015393571 (15.07.2019).
Zukowski, Tomasz/Brown, Irwin (2007): Examining the Influence of Demographic Factors on Internet
Users’ Information Privacy Concerns. In: Proceedings of the 2007 Association for Computing
Machinery (ACM), pp. 197–204.
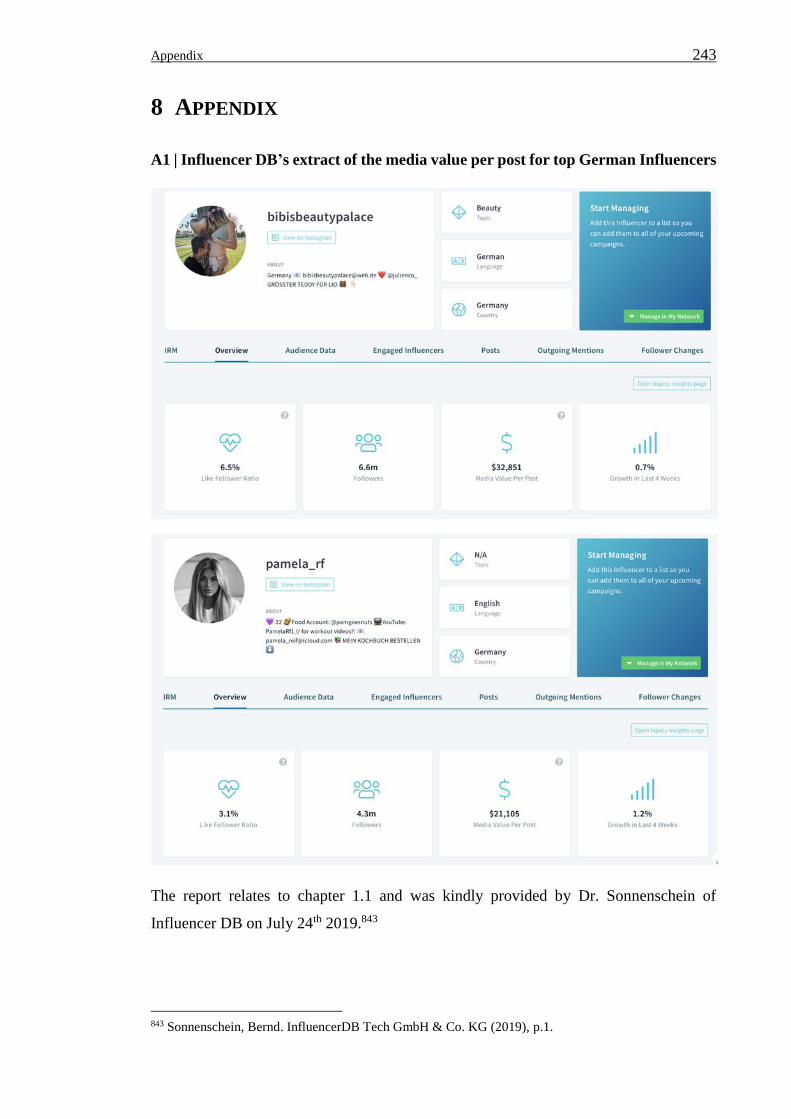
Appendix 243
8 APPENDIX
A1 | Influencer DB’s extract of the media value per post for top German Influencers
The report relates to chapter 1.1 and was kindly provided by Dr. Sonnenschein of
Influencer DB on July 24th 2019.843
843 Sonnenschein, Bernd. InfluencerDB Tech GmbH & Co. KG (2019), p.1.
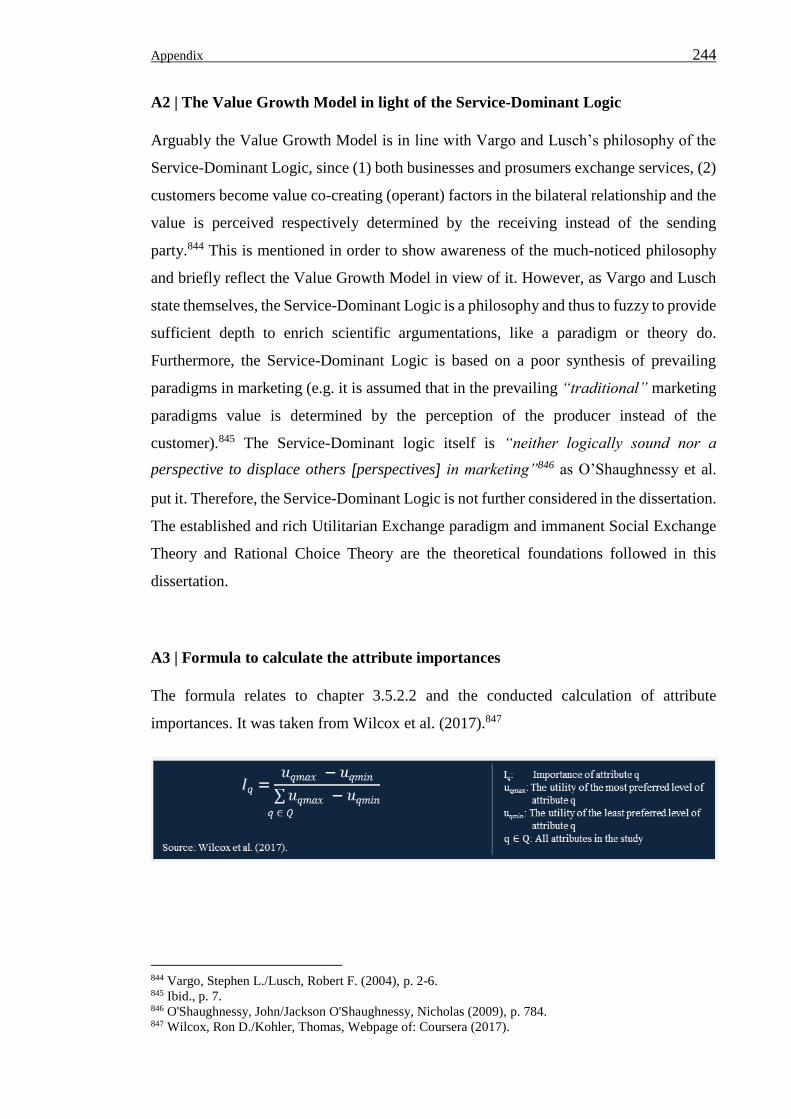
Appendix 244
A2 | The Value Growth Model in light of the Service-Dominant Logic
Arguably the Value Growth Model is in line with Vargo and Lusch’s philosophy of the
Service-Dominant Logic, since (1) both businesses and prosumers exchange services, (2)
customers become value co-creating (operant) factors in the bilateral relationship and the
value is perceived respectively determined by the receiving instead of the sending
party.844 This is mentioned in order to show awareness of the much-noticed philosophy
and briefly reflect the Value Growth Model in view of it. However, as Vargo and Lusch
state themselves, the Service-Dominant Logic is a philosophy and thus to fuzzy to provide
sufficient depth to enrich scientific argumentations, like a paradigm or theory do.
Furthermore, the Service-Dominant Logic is based on a poor synthesis of prevailing
paradigms in marketing (e.g. it is assumed that in the prevailing “traditional” marketing
paradigms value is determined by the perception of the producer instead of the
customer).845 The Service-Dominant logic itself is “neither logically sound nor a
perspective to displace others [perspectives] in marketing”846 as O’Shaughnessy et al.
put it. Therefore, the Service-Dominant Logic is not further considered in the dissertation.
The established and rich Utilitarian Exchange paradigm and immanent Social Exchange
Theory and Rational Choice Theory are the theoretical foundations followed in this
dissertation.
A3 | Formula to calculate the attribute importances
The formula relates to chapter 3.5.2.2 and the conducted calculation of attribute
importances. It was taken from Wilcox et al. (2017).847
844 Vargo, Stephen L./Lusch, Robert F. (2004), p. 2-6. 845 Ibid., p. 7. 846 O'Shaughnessy, John/Jackson O'Shaughnessy, Nicholas (2009), p. 784. 847 Wilcox, Ron D./Kohler, Thomas, Webpage of: Coursera (2017).
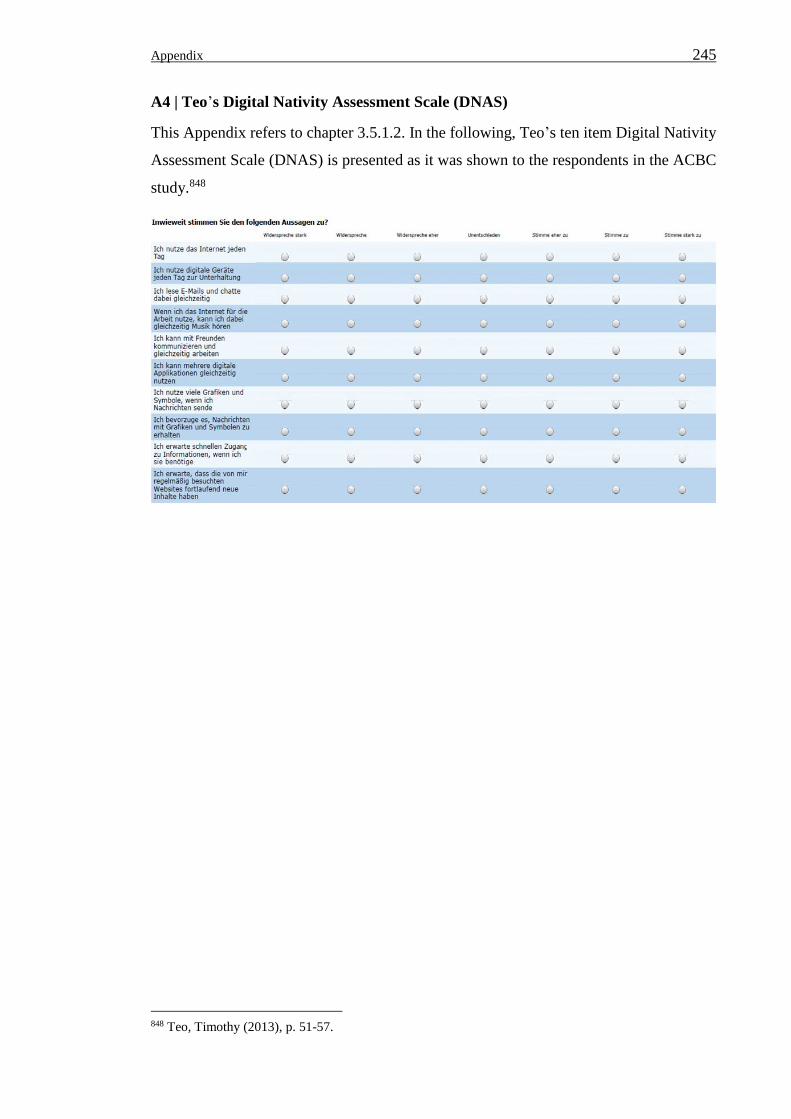
Appendix 245
A4 | Teo’s Digital Nativity Assessment Scale (DNAS)
This Appendix refers to chapter 3.5.1.2. In the following, Teo’s ten item Digital Nativity
Assessment Scale (DNAS) is presented as it was shown to the respondents in the ACBC
study.848
848 Teo, Timothy (2013), p. 51-57.
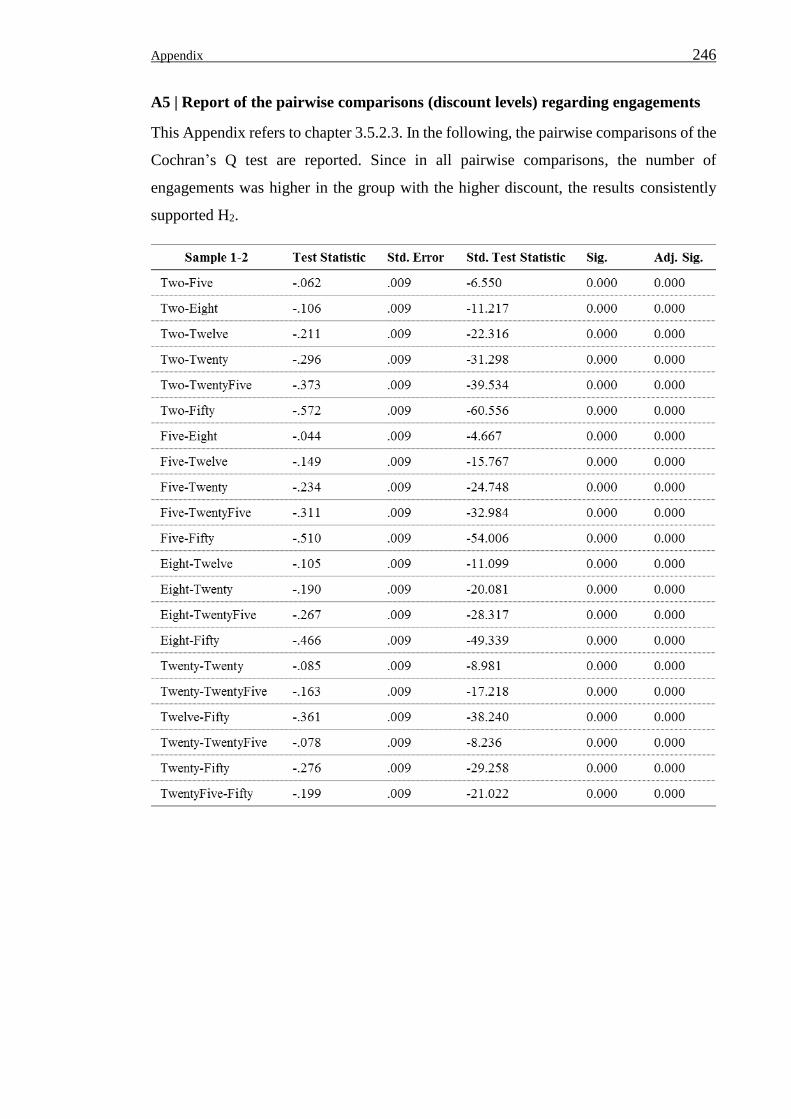
Appendix 246
A5 | Report of the pairwise comparisons (discount levels) regarding engagements
This Appendix refers to chapter 3.5.2.3. In the following, the pairwise comparisons of the
Cochran’s Q test are reported. Since in all pairwise comparisons, the number of
engagements was higher in the group with the higher discount, the results consistently
supported H2.
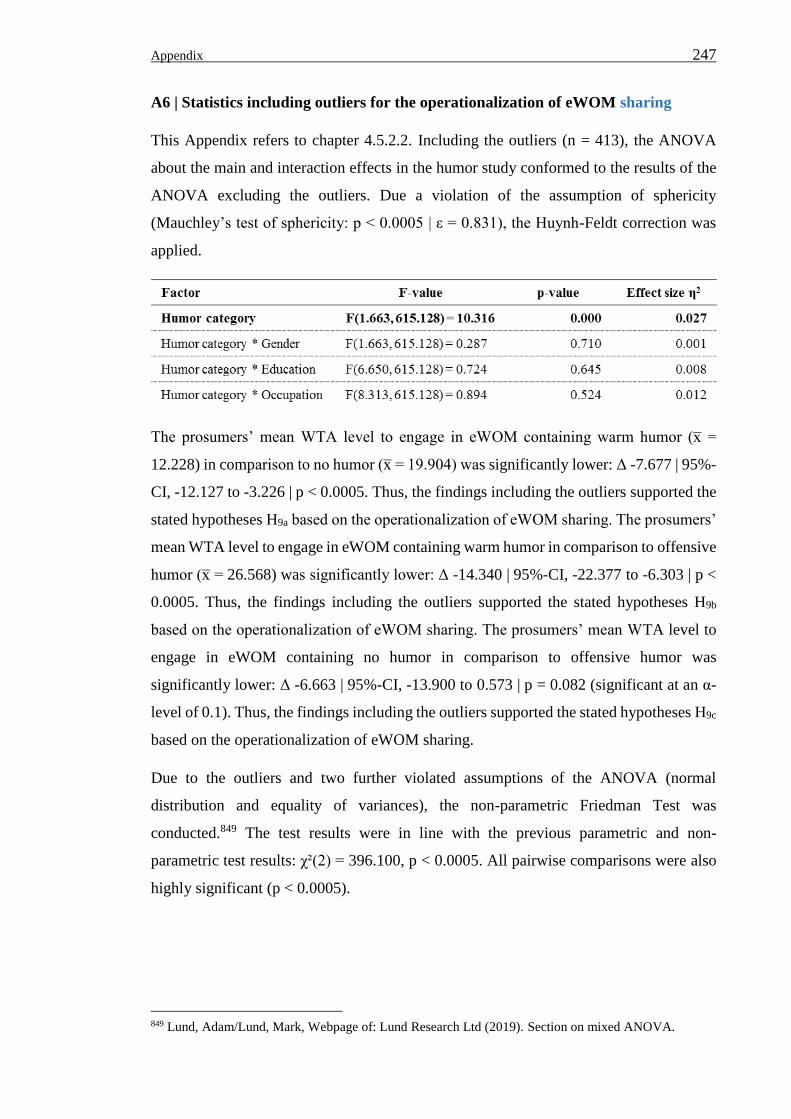
Appendix 247
A6 | Statistics including outliers for the operationalization of eWOM sharing
This Appendix refers to chapter 4.5.2.2. Including the outliers (n = 413), the ANOVA
about the main and interaction effects in the humor study conformed to the results of the
ANOVA excluding the outliers. Due a violation of the assumption of sphericity
(Mauchley’s test of sphericity: p < 0.0005 | ε = 0.831), the Huynh-Feldt correction was
applied.
The prosumers’ mean WTA level to engage in eWOM containing warm humor (x̅ =
12.228) in comparison to no humor (x̅ = 19.904) was significantly lower: Δ -7.677 | 95%-
CI, -12.127 to -3.226 | p < 0.0005. Thus, the findings including the outliers supported the
stated hypotheses H9a based on the operationalization of eWOM sharing. The prosumers’
mean WTA level to engage in eWOM containing warm humor in comparison to offensive
humor (x̅ = 26.568) was significantly lower: Δ -14.340 | 95%-CI, -22.377 to -6.303 | p <
0.0005. Thus, the findings including the outliers supported the stated hypotheses H9b
based on the operationalization of eWOM sharing. The prosumers’ mean WTA level to
engage in eWOM containing no humor in comparison to offensive humor was
significantly lower: Δ -6.663 | 95%-CI, -13.900 to 0.573 | p = 0.082 (significant at an α-
level of 0.1). Thus, the findings including the outliers supported the stated hypotheses H9c
based on the operationalization of eWOM sharing.
Due to the outliers and two further violated assumptions of the ANOVA (normal
distribution and equality of variances), the non-parametric Friedman Test was
conducted.849 The test results were in line with the previous parametric and non-
parametric test results: χ²(2) = 396.100, p < 0.0005. All pairwise comparisons were also
highly significant (p < 0.0005).
849 Lund, Adam/Lund, Mark, Webpage of: Lund Research Ltd (2019). Section on mixed ANOVA.
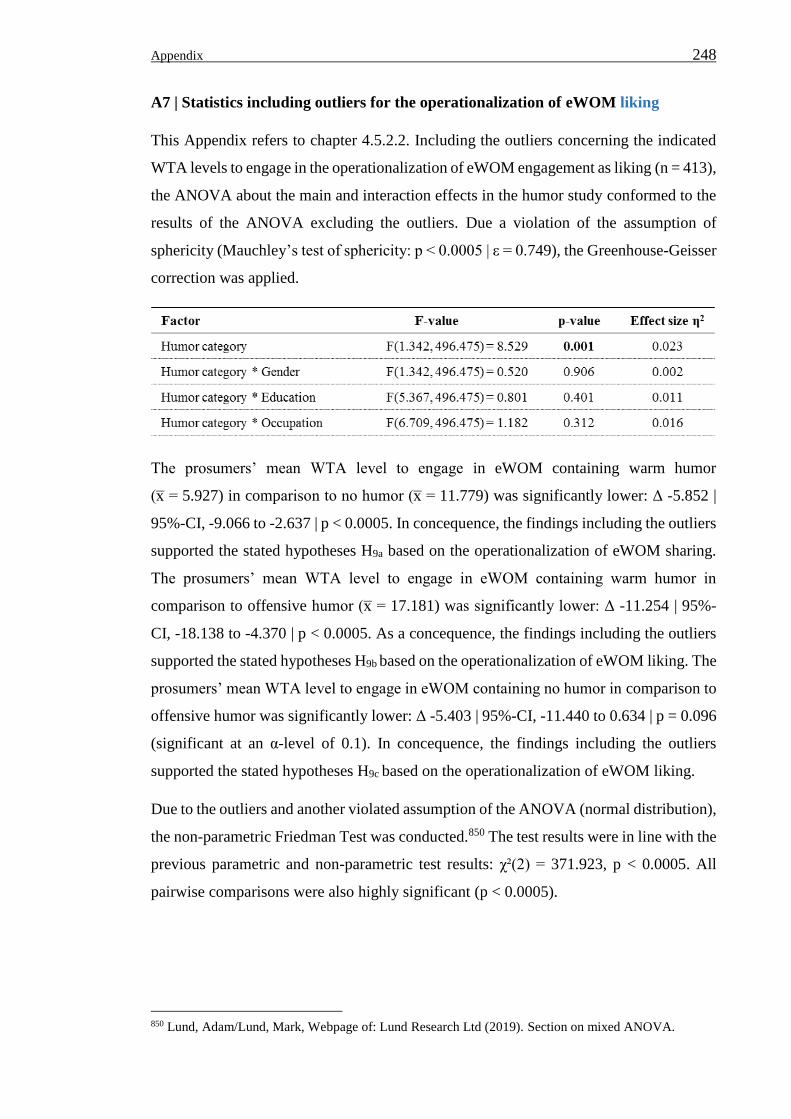
Appendix 248
A7 | Statistics including outliers for the operationalization of eWOM liking
This Appendix refers to chapter 4.5.2.2. Including the outliers concerning the indicated
WTA levels to engage in the operationalization of eWOM engagement as liking (n = 413),
the ANOVA about the main and interaction effects in the humor study conformed to the
results of the ANOVA excluding the outliers. Due a violation of the assumption of
sphericity (Mauchley’s test of sphericity: p < 0.0005 | ε = 0.749), the Greenhouse-Geisser
correction was applied.
The prosumers’ mean WTA level to engage in eWOM containing warm humor
(x̅ = 5.927) in comparison to no humor (x̅ = 11.779) was significantly lower: Δ -5.852 |
95%-CI, -9.066 to -2.637 | p < 0.0005. In concequence, the findings including the outliers
supported the stated hypotheses H9a based on the operationalization of eWOM sharing.
The prosumers’ mean WTA level to engage in eWOM containing warm humor in
comparison to offensive humor (x̅ = 17.181) was significantly lower: Δ -11.254 | 95%-
CI, -18.138 to -4.370 | p < 0.0005. As a concequence, the findings including the outliers
supported the stated hypotheses H9b based on the operationalization of eWOM liking. The
prosumers’ mean WTA level to engage in eWOM containing no humor in comparison to
offensive humor was significantly lower: Δ -5.403 | 95%-CI, -11.440 to 0.634 | p = 0.096
(significant at an α-level of 0.1). In concequence, the findings including the outliers
supported the stated hypotheses H9c based on the operationalization of eWOM liking.
Due to the outliers and another violated assumption of the ANOVA (normal distribution),
the non-parametric Friedman Test was conducted.850 The test results were in line with the
previous parametric and non-parametric test results: χ²(2) = 371.923, p < 0.0005. All
pairwise comparisons were also highly significant (p < 0.0005).
850 Lund, Adam/Lund, Mark, Webpage of: Lund Research Ltd (2019). Section on mixed ANOVA.

Appendix 249
A8 | Pre-study: Identification of humor types according to Buijzen et al.’s typology
This Appendix refers to chapter 4.5.1.3. It shows the warm and offensive humor types
offered for identification during the pre-study and draws on Buijzen et al.’s humor
typlogy.851
A9 | Comparison of mean WTS differences between hedonic product types
This Appendix refers to chapter 3.5.3.2. Below the pairwise comparisons of the hedonic
product types are reported.
851 Buijzen, Moniek/Valkenburg, Patti M. (2004), p. 157-161.
Lower Bound Upper Bound
Social non-profit -,378* 0.073 0.000 -0.592 -0.164
Food & Beverages -0.016 0.052 1.000 -0.171 0.138
Fashion ,334* 0.056 0.000 0.169 0.500
Alcohol & Cigarettes 1,636* 0.069 0.000 1.431 1.841
Entertainment -,283* 0.060 0.000 -0.460 -0.106
Travel ,378* 0.073 0.000 0.164 0.592
Food & Beverages ,362* 0.067 0.000 0.165 0.559
Fashion ,712* 0.071 0.000 0.501 0.923
Alcohol & Cigarettes 2,014* 0.073 0.000 1.798 2.230
Entertainment 0.095 0.060 1.000 -0.082 0.272
Travel 0.016 0.052 1.000 -0.138 0.171
Social non-profit -,362* 0.067 0.000 -0.559 -0.165
Fashion ,350* 0.051 0.000 0.201 0.500
Alcohol & Cigarettes 1,652* 0.065 0.000 1.461 1.843
Entertainment -,267* 0.052 0.000 -0.421 -0.113
Travel -,334* 0.056 0.000 -0.500 -0.169
Social non-profit -,712* 0.071 0.000 -0.923 -0.501
Food & Beverages -,350* 0.051 0.000 -0.500 -0.201
Alcohol & Cigarettes 1,302* 0.062 0.000 1.119 1.484
Entertainment -,617* 0.058 0.000 -0.788 -0.446
Travel -1,636* 0.069 0.000 -1.841 -1.431
Social non-profit -2,014* 0.073 0.000 -2.230 -1.798
Food & Beverages -1,652* 0.065 0.000 -1.843 -1.461
Fashion -1,302* 0.062 0.000 -1.484 -1.119
Entertainment -1,919* 0.065 0.000 -2.111 -1.727
Travel ,283* 0.060 0.000 0.106 0.460
Social non-profit -0.095 0.060 1.000 -0.272 0.082
Food & Beverages ,267* 0.052 0.000 0.113 0.421
Fashion ,617* 0.058 0.000 0.446 0.788
Alcohol & Cigarettes 1,919* 0.065 0.000 1.727 2.111
Entertainment
Travel
Social non-profit
Food & Beverages
Fashion
Alcohol & Cigarettes
Mean Difference (I-J) Std. Error Sig.
95% Confidence Interval for
Difference
(I) Hedonics (J) Hedonics

Appendix 250
A10 | The Payment Experience Scale as part of the pricing experience
This Appendix refers to chapter 5.2.2.2. It shows Bagdare’s adapted experience scale to
measure the respondents’ payment and thus pricing process experience.852
852 Bagdare, Shilpa/Jain, Rajnish (2013), p. 795-799 |
Lemon, Katherine N./Verhoef, Peter C. (2016), p. 70 |
Grewal, Dhruv/Levy, Michael/Kumar, V. (2009), p. 2-6.
Copyright © 2022 FDOKUMEN

