


Bahasa
Halaman
Hukum


Tirathai Public Company Limited
Opportunity Day on March 16, 2017

Content
• Company Profile
• Operating Result of Year 2016
• Outlook 2017
• Forecast 2017-2019
• Q &A
2

Company Profile
3

TIRATHAI & It’s subsidiary
TIRATHAI Public company Limited
TIRATHAI E&S Co.,ltd.Distribution , installation maintenance service of electrical power equipment
Manufacture for Tank and fabricate steel , EPC Conveyor System
JV L.D.S - N.D.POperation and Maintenance of Conveyor System of HongsaPower Co. Ltd, (HPC), Laos PDR
THAIFINS Co.,ltd.Manufacture for Transformer’s fins and Tank support to Tirathai Plc.,ltd.
L.D.S. METAL WORK Co.,ltd.
100% 100% 92.50%
20% 80%
Manufacturer of Distribution and Power Transformers and Repair Service
4

II.
Non-transformer• Arial Derrick Crane• Steel Fabrication• Constructions• Bulk Handling System• Operation and Maintenance Conveyor Belt
System
• Distribution Transformer
• Power Transformer• Transformer Service • Transformer Repair
Products of TirathaiGroup
I.Transformer
5

I. Transformer Product &
Service
6
Distribution Transformer
Power Transformer
Special Transformer
Our Main Customers
1. Utilities(PEA,MEA,EGAT)
2. Private2.1 Steel industry2.2 Sugar industry2.3 Power Plant2.4 Energy industry2.5 International
Contractors2.6 Others
3. Export(ASIA+SE.ASIA)
16%
58%
26%
Utilites Private Export
Transformer Revenue 2016 by Customer

II. Non Transformer Products
7
• Arial Crane Device and Digger Derick Unit
• Steel Fabrication
• Construction• EPC Conveyor Belt
System • Operating and
Maintenance Service of Conveyor Belt System
73%
27%
Transformer Non transformer
Total Revenue 2015by Product Group

TRT’s Key Strength
• Experience management team with more than 25 years in the Transformer business
• Engineering-to-Order • High Quality Products and Services• Top three of manufacturer of 300 MVA 230 kV Power Transformer
in Thailand• Well recognize as a successful player in bulk handling system
including a provider of Operating & Maintenance Service for power plant, mining and related industry
8

Operating Result of Year 2016
9

Consolidated financial Statements
Unit: Million Baht 2013 2014 2015 2016Total Revenue 2,534.96 2,163.26 2,265.90 2,577.33
Revenue from Sales & Service 2,517.89 2,131.63 2,223.97 2,536.52
Gross Profit 657.94 508.29 411.84 661.01EBITDA 320.30 170.24 44.87 192.89EBIT 268.35 66.59 (6.81) 125.81Net Profit/(Net Loss) attributable
to equity holders177.52 48.64 (45.97) 61.22
Total Assets 2,575.98 2,653.19 3,024.84 3,303.62Total Liabilities 1,391.62 1,478.97 1,947.70 2,176.83Shareholders' Equity 1,184.36 1,174.22 1,077.14 1,126.79Financial Ratio
Gross Profit Margin (%) 26.13% 23.85% 18.52% 26.06%
Net Profit (Loss)Margin (%) 6.98% 2.24% (2.57%) 2.38%
Return on Asset (%) 10.53% 1.85% (2.05%) 1.87%Return on Equity (%) 16.08% 4.10% (5.18%) 5.36%Book Value Per Share (Par1Baht)
3.85 3.81 3.50 3.66
Earning Per Share 0.58 0.16 (1.15) 0.20Dividend Per Share 0.30 0.10 0.05 0.13
10

Structure of Incomes by
Group Customer2015 2016
Transformer 1. Gov+Local 937 1,306
2.Export 650 479
3. Transformer Service
56 82
Total Transformer 1,643 1,867
Non-Transformer
4. Steel Structure & Fabricate
370 161
5. Distributing Digger/Arial truck
99 209
6. Operating & Maintenance
111 299
7. Others 41 41
Total non-transformer 621 710
Total 2,264 2,577 11
1,643 1,867
621 426
-
500
1,000
1,500
2,000
2015 2016
Transformer Non-Transformer
Million
73% 73%
27% 27%
0%
10%
20%
30%
40%
50%
60%
70%
80%
2015 2016
Transformer Non-Transformer
12
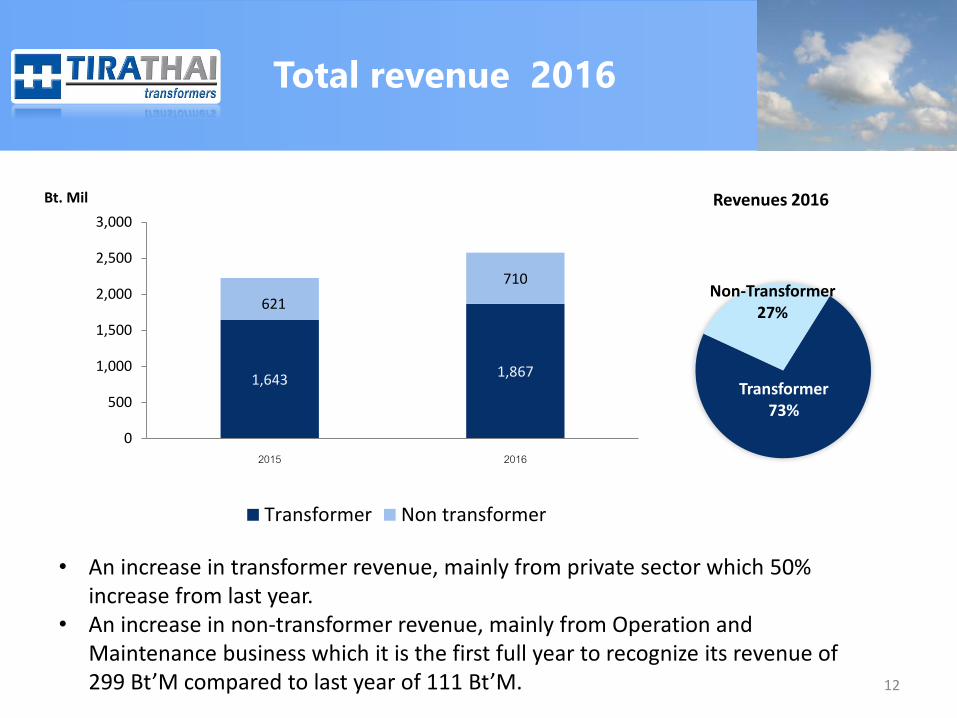
1,6431,867
621
710
0
500
1,000
1,500
2,000
2,500
3,000
2015 2016
Bt. Mil
Transformer Non transformer
Revenues 2016
Transformer73%
Non-Transformer27%
Total revenue 2016
• An increase in transformer revenue, mainly from private sector which 50% increase from last year.
• An increase in non-transformer revenue, mainly from Operation and Maintenance business which it is the first full year to recognize its revenue of 299 Bt’M compared to last year of 111 Bt’M.

Gross Profit Margin by products
QoQ
13
13
% 19
%
19
% 25
%
23
%
25
%
14
%
14
% 20
%
22
%
39
%
-38
%
47
%
28
%
47
%
47
%
27
%
27
%
15
%
38
%
Q1' 15 Q2' 15 Q3' 15 Q'4 15 Q1' 16 Q2' 16 Q3' 16 Q4' 16 2015 2016
Transformer Non transformer
• Improve in gross profit margin both Transformer and Non-Transformer group due to selective market which need engineering design in all business group of TRT

Total Gross Profit (GP) VS Net
Profit Margin (NP) VS SG&A
(Consolidated)
14
SG&A still being in line with our budget
19%
26%
-2%
2%
23%22%
-5%
0%
5%
10%
15%
20%
25%
30%
2015 2016
GP NP SG&A

Interest Bearing Debt/Equity Ratio is in line with our business plan
1.12
0.99
1.31 1.251.37 1.38
1.49 1.46
0.00
0.20
0.40
0.60
0.80
1.00
1.20
1.40
1.60
0
200
400
600
800
1000
1200
1400
1600
1800
Interest Bearing Debt Interest Bearing Debt/Equity Ratio
Q1 2105 Q2 2105 Q3 2105 Q4 2105 Q1 2106 Q2 2106 Q3 2106 Q4 2106
Interest Bearing Debt/Equity Ratio
Mill Baht Times
15

Outlook 2017
16

Outlook 2017
17
Transformer Group
• Expected total revenue growth 15-20% from 2016.• Increase in Distribution Transformer Demand especially Utilities
sector due to spending 2016 and 2017 budget starting from 2017.• Increase in Power Transformer Demand due to increase in
Transformer demand to support ASIAN Grid as per PDP 2015.• Backlog as of 31.12.2016 of 1,012 Bt’M, of which 861 Bt’M to be
delivered in 2017, 122 Bt’M in 2018 and 29 Bt’M 2019.• Bids and quotations in process as of 31.12.2016 for transformer
group = 10,857 Bt’M with 20%-25% succession rate.• Expected gross profit margin 20%-23%

Outlook 2017
18
Non-Transformer Group
• Expected total revenue growth 45%-50%from 2016.• Expected 27% increase in revenue from operation and maintenance
from 2016 due to having potential service to be awarded in 2017.• Expected 73% increase in revenue from steel fabrication and EPC
from 2016 due to having backlog to be delivered in 2017 of 302 Bt’M.• Backlog as of 31.12.2016 of 1,202 Bt’M, of which 602 Bt’M to be
delivered in 2017, 300 Bt’M in 2018 and 300 Bt’M 2019.• Bids and quotations in process as of 31.12.2016 for non-transformer
group = 2,618 Bt’M with 20%-25% succession rate.• Expected gross profit margin 20%-23%

TRT Group Backlog As of 31.12.2016
Group Customer Total (1)+(2)+(3)
Delivery in 2017 (1)
Delivery in 2018 (2)
Delivery in 2019 (3)
Transformer 1. GOV+Local 653 566 87 -
2. Export 359 295 35 29
3.Transformer Service
- -
Total transformer 1, 012 861 122 29
Non-Transformer
4. Steel Structure & Fabricate
302 302 - -
5. Distributing Derrick/Arial truck
- - - -
6. Operating & Maintenance
900 300 300 300
Total non-transformer
1,202 602 300 300
Total 2,214 1,463 422 329
Transformer 46%
Non-Transformer
54%
Transformer
Non-transformer
19

Bids and Quotations in Process As of 31 December 2016
Customer M’ Baht
1.MEA 2,000
2.PEA 2,500
3.EGAT 3,587
4.Local 1,800
5.Export 970
6. Transformer Service -
7. Distributing Derrick/Arial crane 1,500
8. Steel Structure & Fabricate 1,118
Total 13,475
** Expect to receive the above orders approximately 20-25%
20

Forecast 2017 - 2019
21
Forecast % Growth from last year 2017 2018 2019
Revenue growth from last year 25%-30% 19% 8%
Expected Revenue from Transformer Group as % of Total Revenue
68% 63% 64%
Expected Revenue from Non-Transformer Group % of Total Revenue
32% 37% 36%
Expected gross margin 20-23% 20%-23% 20%-23%
SG&A Growth 4% 5% 5%
SG&A as % of sales 17%-18% 15% 15%

Investment Progress of
New Distribution Transformer Plant
22

Detail Time Schedule
Construction of Factory and office March2015 – March 2016
Installation of machinery and equipment April - August 2016
Test Run September - November 2016
Start the production December 2016
Investment Progress of
New Distribution Transformer Plant
23

1,000 1,500
4,000
7,500
-
1,000
2,000
3,000
4,000
5,000
6,000
7,000
8,000
9,000
10,000
Before Investment After Investment
Distribution transformer Power Transformer
MVA
5,000
9,000
Increase Transformer Production Capacities
from 5,000 MVA to 9,000 MVA or 80% Increase After Investment
24

25

APPENDIX
26
APPENDIX TRT GROUP

27

Summary of PDP 2015
28

Summary of PDP 2015
*ทีม่า : www.eppo.go.th
29

III.
Special Transformer
Capacity 1-10 MVA Rated Voltage 36 kV.
Capacity 5-300 MVA Rated Voltage 230 kV.
II.Distribution Transformer
Capacity 1-100 MVA Rated
Voltage 36 kV.
Products of Tirathai
I.
Power Transformer
30

Transmission line500, 230, 115 kV
Transmission line230, 115, 69 kV
PRIVATE SUBSTATIONBig Industry > 10 MVA
Transmission line230, 115, 69 kV
MEA’S SUBSTATION ~60 MVA
6.6, 22, 3324 kV
6.6, 3.3416/240, 400/230 kV
Distribution line24, 12/24 kV
Distribution line22, 33 kV
Infrastructure & Housing416/240 V
Industry & Big Building400/230 V
PEA’S SUBSTATION ~60 MVA
Step upTransformerPower Plant
Transmission Line
31

Distribution Transformer≤ 3,000 kV – 10,000 kV Voltage ≤ 33 kV
Power Transformer≤ 100 MVA Voltage ≤ 132 kV
Power Transformer>100 – 500 MVA Voltage
≤ 230 kV
TRT 11%
TRT33%
ABB34%
Daihen33%
TRT Local Market Share
TRT25%
DAIHEN25%
ABB25%
FUJI TUSO25%
32

Government Sector
Private Sector
Main Customers
28
Sub-contractor

Laos
CambodiaVietnam
Philippin
eMalaysia
SingaporeIndonesia
Brunei
Myanmar
JapanChina
India
Sri
Lanka
Oman
Saudi
Arabia
SyriaIran
Azerbaijan
Ghana
Australia
Nepal
Argentin
a
Trinidad
&
Tobago
Canada
Republic
of Korea
South Africa
Papua
New
Guinea
United Arab
Emirates
Export Countries
30

TRT Competitive Advantage
TRT
Production Standards Corporate Compliance
Short Circuit Test Certificate
Test Laboratory
PM Export for Local Brand Awards
ISO Accreditation
HIGH-POWER
LABORATORYNETHERLAND
TESTING
No. 0140
ISO/IEC 17025certified by TISI
ISO 9001 certified by
MASCI
ISO 14001 certified by
MASCI
TIS 18001 certified by
MASCI
OHSAS 18001 certified by
MASCI
1999 2008
- CG Score 2016 – Good
- TRIS Rating for Companyand Bond in 2016 = BBB
Technology Developed from
35
2016

HV Gas Insulated SwitchgearAerial Crane Device and
Digger Derrick Unit
Tirathai E&S Co.,Ltd.
Products of TRT E&S
36

TERMINAL STATION
POWER PLANT
230, 500 kV
SUBSTATION
12, 22,24,33 kV
69, 115 kV
240/416 , 230/400 V
Power Network Products
Tirathai E&S Co.,Ltd.
37

Products of L.D.S.
Transformer Tank Drying Oven
38

Products of L.D.S.
39

Hongsa Power Plant Project
40

Products of L.D.S.
Belt Conveyor system
41
Top Related
Copyright © 2022 FDOKUMEN

