


Bahasa
Halaman
Hukum


Tilburg University
Crossing boundaries
Slot, J.H.
Publication date:2013
Document VersionPublisher's PDF, also known as Version of record
Link to publication in Tilburg University Research Portal
Citation for published version (APA):Slot, J. H. (2013). Crossing boundaries: Involving external parties in innovation. CentER, Center for EconomicResearch.
General rightsCopyright and moral rights for the publications made accessible in the public portal are retained by the authors and/or other copyright ownersand it is a condition of accessing publications that users recognise and abide by the legal requirements associated with these rights.
• Users may download and print one copy of any publication from the public portal for the purpose of private study or research. • You may not further distribute the material or use it for any profit-making activity or commercial gain • You may freely distribute the URL identifying the publication in the public portal
Take down policyIf you believe that this document breaches copyright please contact us providing details, and we will remove access to the work immediatelyand investigate your claim.
Download date: 10. Jul. 2022

i
Crossing Boundaries:
Involving External Parties in Innovation
Johanna H. Slot


i
Crossing Boundaries:
Involving External Parties in Innovation
PROEFSCHRIFT
ter verkrijging van de graad van doctor aan Tilburg University
op gezag van rector magnificus, prof. dr. Ph. Eijlander,
in het openbaar te verdedigen
ten overstaan van een door het college voor promoties aangewezen commissie
in de aula van de Universiteit op woensdag 18 december 2013 om 16.15 uur
door
Johanna Hendrika Slot
geboren op 26 augustus 1982 te Brederwiede

ii
Promotor: Prof. dr. Inge Geyskens
Copromotor: Dr. Stefan Wuyts

iii
Committee
Prof. dr. Barbara Deleersnyder, Associate Professor of Marketing, Department of
Marketing, Tilburg School for Economics and Management, Tilburg University, The
Netherlands.
Prof. dr. Inge Geyskens, Professor of Marketing and CentER Fellow, Department of
Marketing, Tilburg School for Economics and Management, Tilburg University, The
Netherlands.
Prof. dr. Katrijn Gielens, Associate Professor of Marketing, Department of Marketing,
Kenan-Flagler Business School, University of North Carolina at Chapel Hill, USA.
Prof. dr. Lisa Scheer, Professor of Marketing, Department of Marketing, College of
Business, University of Missouri, USA.
Prof. dr. Raji Srinivasan, Professor of Marketing, Department of Marketing, McCombs
School of Business, University of Texas at Austin, USA.
Prof. dr. Stefan Wuyts, Associate Professor of Marketing, Department of Marketing,
Tilburg School of Economics and Management, Tilburg University, The Netherlands, and
Associate Professor of Marketing, Department of Marketing, Faculty of Business
Administration, Koç University, Turkey.


i
And ever, as the story drained
The wells of fancy dry,
And faintly strove that weary one
To put the subject by,
"The rest next time -" "It is next time!"
The happy voices cry.
Thus grew the tale of Wonderland:
Thus slowly, one by one,
Its quaint events were hammered out –
And now the tale is done,
And home we steer, a merry crew,
Beneath the setting sun.
Lewis Carroll, Alice’s Adventures in Wonderland,
“All in the Golden Afternoon,” stanza 5 and 6
Acknowledgments
Following a career in business, my first steps in the world of academia made me
feel like Lewis Carroll’s Alice when she started her Adventures in Wonderland. My first
courses in Tilburg, Marnik Dekimpe’s “Marketing Models” and Xavier Martin’s
“Advanced Strategy in Business”, seduced me with a combination of theoretical
challenge, methodological rigor, and managerial relevance. As if research were a cake,
with the words “EAT ME” beautifully printed on it in large letters. After one bite, I
already shrank, and shrank, and shrank some more – and I instantly felt very small,
finding myself in the midst of the great (and sometimes puzzling!) minds of the Tilburg
Marketing faculty. I was attracted to the new challenge that faced me immediately. And
that is how the Adventures of Johanna in Wonderland commenced.
Now I have completed the first leg of my journey in the world of academia. I could
not have accomplished without the support of many. I would like to take this
opportunity to express my thanks.

Acknowledgments
ii
First and foremost, I am greatly indebted to my advisors, Inge Geyskens and Stefan
Wuyts. Inge, meeting you was the very reason for me to come to Tilburg. You were the
one who expressed faith in my research capabilities at a very early stage. You sowed the
seed of my ambition overseas, a career path I had never envisioned myself taking. You
have been a great source of inspiration – your incredible precision, perseverance, and
personal attention have helped me enormously. Stefan, you have taught me to translate
my business experience into research ideas and testable hypotheses. Your everlasting
stream of comments, changes, and critical questions helped me to develop my skills in
developing theory. Even though you are at Koç University most of the time, your
responsiveness to my many, many emails made the distance between Tilburg and
Istanbul disappear. Inge and Stefan, thank you for believing in me (also in moments that
I did not), and for pushing me to higher levels. This dissertation would not be here
without you.
Second, I am equally indebted to Raji Srinivasan. You have helped me a lot in
becoming a better researcher. After taking your online class, you invited me to spend a
semester at McCombs Business School, in Austin, Texas, an amazing opportunity. By
working with me, you taught me lessons I will remember forever. Our research projects
are a true inspiration. On a personal level, you always keep an eye out for me. Thanks
for being my friend. You have changed my life, and I am incredibly grateful for it.
Third, I also would like to thank the members of my doctoral committee: Barbara
Deleersnyder, Katrijn Gielens, Lisa Scheer, and Raji Srinivasan. I feel very privileged to
have such distinguished academics in my committee. I appreciate your comments,
questions, and suggestions; they have certainly improved the essays in this dissertation.
Special thanks go to Barbara Deleersnyder. You have helped me greatly as I developed
my teaching skills. Moreover, you were always available to discuss my career
opportunities, for which I am truly thankful.
In addition, this dissertation would not have been here without the help of the firms
I worked with. Specifically, I would like to thank the many (project) managers and
engineers at the National Aerospace Laboratory. In particular, I would like to thank
Louis Aartman, Marc van Beek, and Rolinde Storm for their help in gathering data,
discussing ideas, and presenting my research. Also, many thanks go “Uncle Harm”, who

Acknowledgments
iii
initiated my collaboration with NLR. Furthermore, I want to thank Maxim Schram and
Eveline van Eekelen of CMNTY, who were so kind to share the data of the Redesignme
community with me. In addition, at ASML, I thank Bert Koek and the many other
managers I met, who sparked my fascination for high-tech industries.
Thanks also to CentER and the Marketing Department of Tilburg for the
coordination of the doctoral program and the financial support that enabled me to go
abroad and to visit conferences. A special word of gratitude goes to the Institute for the
Study of Business Markets. Receiving the Doctoral Support Award facilitated my
research greatly.
My paranimphs have been particularly important to me in the last years. First,
Arjen, my great office mate - I enjoyed discussing papers, issues in retail marketing
(your work), innovation (my work), and our job market adventures. I wish you the best
in Amsterdam. For every one of your many future accomplishments, I will decorate my
office in your name, like in the ‘old days’. Second, Anne, my academic sister – you are
always available for me being next door, both literally in Tilburg and in Leuven. You
have been – and continue to be – an inspiring example to me. Thank you for our many
win-win conversations, for your encouragements, and for your personal advice. Arjen
and Anne, I will never ever forget you. It is an honor to have you by my side.
Being a PhD student at the Tilburg Marketing Department was a great pleasure. Not
in the least, my other fellow PhD students have been very important to me. Millie and
Didi brightened up the day with many ‘hallway’ conversations. Néomie shared my
interest in strategic issues. Jonne sharpened my econometric skills. Mark, Jaione, Femke,
Yufeng, Soulimane, Max, and Kristopher, among other things, thank you for your
passionate participation during our annual Sinterklaas events.
Thanks also to the other members of the Marketing Department, who provided a
very stimulating environment. Bart B., Els, Henk, Marnik, and Rik, thank you for
exposing me to your knowledge, and thank you for the indispensable advice about the
next steps of my academic career. Barbara B., Aurelie, and Anne K., I enjoyed jogging
(and talking, of course) in the Warandebos, I will miss it so much! Anke, Elaine, Ellen,
Marit, and Ernst – thank you for being there. Discussing the things we shared – whether
it is our passion for shoes, clothing, or music, or being from ‘up North’ – was great fun.

Acknowledgments
iv
Robert, I would like to thank you for sharing your view on the world with me. Anick,
Bart S., Carlos, George, Hans, Michel, Natasja, Rutger, and Vincent, your stories livened
up lunch and coffee breaks. Scarlett, Heidi, Nancy, Angelique, and Nienke – you were
always ready to help out when needed. Furthermore, thanks to my friends around the
world. Dear Emine, you cheered up the office during your time in Tilburg and welcomed
me in Istanbul. Dear Leah, you will be my Austin friend forever. Lastly, I would like to
thank my new colleagues at The Smeal College of Business at The Penn State University
for giving me the opportunity to continue my academic career.
Importantly, I have always felt the unconditional support of my loving family and
friends. Pa en ma, voor jullie was het geen verrassing dat ik me zo thuis voelde op de
universiteit. Dank voor jullie onbegrensde liefde en voor jullie hartverwarmende steun
op de moeilijke momenten. Jullie hebben mij altijd gestimuleerd. Albertine, Klaas, en
Hendrieke, ik ben er trots op dat ik jullie ‘grote zus’ mag zijn. Ik kan me geen betere
broer en zussen wensen! Roelant, Linda, Robin, en natuurlijk ook Anne-Marie en Floris,
het is fijn om jullie erbij te hebben. Loek, Afra, Diana, en Luke, dank voor jullie warme
belangstelling (en welkom Fenna! Hoe klein je ook bent, je bent het bewijs dat alles
slechts relatief is). Mijn vrienden van De Keet: hoewel ik weet dat ik soms een rare eend
in de bijt kan zijn, kan ik altijd op jullie rekenen.
Last but not least, my loved one. Lieve Michiel, als jij niet aan mijn zijde had gestaan
in de afgelopen jaren, was me dit niet gelukt. Je kent me door en door, voelt me precies
aan. Je hebt me onvoorwaardelijk gesteund in mijn carrièreswitch aan het begin van dit
traject. Gedurende de afgelopen jaren heb jij ervoor gezorgd dat ik mijn doel voor ogen
hield. En nu gaan we weer verder… Dank je voor je vertrouwen in onze toekomst. Ons
leven gaat verder in Amerika. De volgende stap wordt een hele grote. Maar samen
kunnen we het aan. Ik hou van je, zielsveel, wanneer en waar dan ook.
Johanna
v
Contents
Chapter 1:
Introduction . . . . . . . . . . . . . . . . . . . . . . . . . . . . . . . . . . . . . . . . . . . . . . . . . . . . . . . . . . . . . . . . . . . 1
1.1 From Closed to Open Innovation . . . . . . . . . . . . . . . . . . . . . . . . . . . . . . . . . . . . . . . . . . . 1
1.2 Research Gaps and Contributions . . . . . . . . . . . . . . . . . . . . . . . . . . . . . . . . . . . . . . . . . . 4
1.3 Outline . . . . . . . . . . . . . . . . . . . . . . . . . . . . . . . . . . . . . . . . . . . . . . . . . . . . . . . . . . . . . . . . . . . . 6
Chapter 2:
The Role of Supplier and Customer Involvement
in New Product Development: A Meta-Analysis . . . . . . . . . . . . . . . . . . . . . . . . . . . . . . 11
2.1 Introduction . . . . . . . . . . . . . . . . . . . . . . . . . . . . . . . . . . . . . . . . . . . . . . . . . . . . . . . . . . . . . . 11
2.2 Conceptual Background . . . . . . . . . . . . . . . . . . . . . . . . . . . . . . . . . . . . . . . . . . . . . . . . . . . 13
2.3 Antecedents of Supplier and Customer Involvement . . . . . . . . . . . . . . . . . . . . . . . 15
2.4 Consequences of Supplier and Customer Involvement . . . . . . . . . . . . . . . . . . . . . 21
2.5 Method . . . . . . . . . . . . . . . . . . . . . . . . . . . . . . . . . . . . . . . . . . . . . . . . . . . . . . . . . . . . . . . . . . . 26
2.6 Results . . . . . . . . . . . . . . . . . . . . . . . . . . . . . . . . . . . . . . . . . . . . . . . . . . . . . . . . . . . . . . . . . . . . 31
2.7 Discussion . . . . . . . . . . . . . . . . . . . . . . . . . . . . . . . . . . . . . . . . . . . . . . . . . . . . . . . . . . . . . . . . 37
Appendix: List of Studies Included in the Meta-Analysis . . . . . . . . . . . . . . . . . . . . . . . . . 44

Contents
vi
Chapter 3:
The Effect of Customer Participation in Outsourced NPD
on Supplier Task Performance: The Role of Relationship Multiplexity . . . . . . 49
3.1 Introduction . . . . . . . . . . . . . . . . . . . . . . . . . . . . . . . . . . . . . . . . . . . . . . . . . . . . . . . . . . . . . . 49
3.2 Conceptual Background . . . . . . . . . . . . . . . . . . . . . . . . . . . . . . . . . . . . . . . . . . . . . . . . . . . 52
3.3 Theory and Hypotheses . . . . . . . . . . . . . . . . . . . . . . . . . . . . . . . . . . . . . . . . . . . . . . . . . . . 54
3.4 Method . . . . . . . . . . . . . . . . . . . . . . . . . . . . . . . . . . . . . . . . . . . . . . . . . . . . . . . . . . . . . . . . . . . 61
3.5 Results . . . . . . . . . . . . . . . . . . . . . . . . . . . . . . . . . . . . . . . . . . . . . . . . . . . . . . . . . . . . . . . . . . . 67
3.6 Discussion . . . . . . . . . . . . . . . . . . . . . . . . . . . . . . . . . . . . . . . . . . . . . . . . . . . . . . . . . . . . . . . . 73
Appendix: Measurements . . . . . . . . . . . . . . . . . . . . . . . . . . . . . . . . . . . . . . . . . . . . . . . . . . . . . . 78
Chapter 4:
Managing the Crowd:
Prize Structure and Creativity In Online Idea Generation Contests . . . . . . . . . . 81
4.1 Introduction . . . . . . . . . . . . . . . . . . . . . . . . . . . . . . . . . . . . . . . . . . . . . . . . . . . . . . . . . . . . . . 81
4.2 Theory and Hypotheses . . . . . . . . . . . . . . . . . . . . . . . . . . . . . . . . . . . . . . . . . . . . . . . . . . . 84
4.3 Method . . . . . . . . . . . . . . . . . . . . . . . . . . . . . . . . . . . . . . . . . . . . . . . . . . . . . . . . . . . . . . . . . . . 90
4.4 Results . . . . . . . . . . . . . . . . . . . . . . . . . . . . . . . . . . . . . . . . . . . . . . . . . . . . . . . . . . . . . . . . . . . . 99
4.5 Discussion . . . . . . . . . . . . . . . . . . . . . . . . . . . . . . . . . . . . . . . . . . . . . . . . . . . . . . . . . . . . . . . 105
Appendix: Contest Brief and Submission Examples . . . . . . . . . . . . . . . . . . . . . . . . . . . . 111
Chapter 5:
Conclusion . . . . . . . . . . . . . . . . . . . . . . . . . . . . . . . . . . . . . . . . . . . . . . . . . . . . . . . . . . . . . . . . . . 113
5.1 Summary and Conclusions . . . . . . . . . . . . . . . . . . . . . . . . . . . . . . . . . . . . . . . . . . . . . . . 113
5.2 Implications for Practice . . . . . . . . . . . . . . . . . . . . . . . . . . . . . . . . . . . . . . . . . . . . . . . . . 115
5.3 Limitations . . . . . . . . . . . . . . . . . . . . . . . . . . . . . . . . . . . . . . . . . . . . . . . . . . . . . . . . . . . . . . 118
5.4 Future Research Directions . . . . . . . . . . . . . . . . . . . . . . . . . . . . . . . . . . . . . . . . . . . . . . 120
References . . . . . . . . . . . . . . . . . . . . . . . . . . . . . . . . . . . . . . . . . . . . . . . . . . . . . . . . . . . . . . . . . . . . . . . . . 125

1
“Begin at the beginning,"
the King said, very gravely,
"and go on till you come to the end: then stop.”
Lewis Carroll, Alice’s Adventures in Wonderland, Chapter 12
Chapter 1
Introduction
To improve the return on investments in innovation, firms increasingly open up
their new product development (NPD) processes by applying open innovation tactics. A
prevalent phenomenon is the involvement of external parties in innovation, which
forms the central topic of this dissertation. Before going over to the empirical core of the
thesis, this chapter will first introduce the topic of open innovation. Next, we describe
the gaps in extant research this thesis aims to address. Finally, we will provide an
outline of the dissertation in which the empirical studies are briefly introduced.
1.1 FROM CLOSED TO OPEN INNOVATION
Innovation is key to business success and a top priority among managers and
academic researchers (Hauser, Tellis, and Griffin 2006). The development of new
products is crucial for firms to create value, generate new customer bases, and develop
new sources of profit. In today’s turbulent business environment, characterized by
globalization, rapid technological developments, and strong competition, successful
NPD efforts are crucial to achieve and maintain competitive advantage. The most
successful firms generate about half of their sales and profits from products developed
in the last five years (Barczak, Griffin, and Kahn 2009). It comes as no surprise that 97%
of the CEOs consider NPD a top priority, as reported in a global survey by
PricewaterhouseCoopers (Percival and Shelton 2013).

Chapter 1 – Introduction
2
Yet, the development of new products is tough, for multiple reasons. First, NPD is a
risky activity. Many NPD initiatives fail before reaching the market. According to a
benchmarking study of 416 firms executed by Barczak, Griffin, and Kahn (2009), seven
ideas are needed for every single NDP project initiated. Unsure technological
developments make that only one out of eleven of the NPD projects started leads to a
market introduction of a new product. Once on the market, only about half of the new
products are successful commercially. Comparing the benchmarking study’s survey
results over time (Page 1993; Griffin 1997, 2002), NPD success rates are remarkably
stable, indicating the difficulty firms experience in improving the return on NPD
investments. Second, NPD is expensive, requiring large investments in the development
of new knowledge, skills, and technologies (Schmidt and Calantone 2002) that have
limited ability to increase short-term cash flows (Srinivasan, Lilien, and Sridhar 2011).
Over the last decades, the costs of technology development have increased dramatically,
a trend that is reported in a wide variety of industries, including computer and
semiconductors, pharmaceuticals, and even consumer products (Chesbrough 2007).
Third, completing the NPD process takes times: the development of new products takes
three years to complete, on average (Barczak, Griffin, and Kahn 2009). Reducing NPD
cycle time such that new products are introduced to the market earlier is imperative for
new product success (Cooper and Kleinschmidt 1994), especially in a business
environment characterized by shrinking product life cycles (Chesbrough 2007).
Traditionally, NPD is organized within the boundaries of the firm. In this model, the
complete development process is internally executed and largely self-contained. All
stages of the NPD process, including the activities for idea generation, marketing and
business evaluation of the product concept, research and development (R&D) of the
technology, product design, and prototype development and testing, are under control
of the firm. For a long time, the internally organized NPD process proved to be an
important source of competitive advantage and a significant barrier to entry for new
entrants (Chesbrough 2003). However, internally organized NPD has its downsides.
NPD organized within the boundaries of the firm can be slow, as all necessary
knowledge, skills, and technologies must be developed internally. In addition, internal
NPD is largely dependent on a firm’s own resources, which limits a firm’s strategic
flexibility.

Chapter 1 – Introduction
3
Nowadays, the NPD process has changed. In an attempt to increase the efficiency
and effectiveness of the NPD process, firms increasingly apply open innovation
practices (Chesbrough 2003). Open innovation describes a new paradigm based on the
premise that valuable ideas can come from inside or outside a firm and can go to market
from inside or outside the firm as well (Chesbrough 2003). By crossing firm boundaries,
firms do not need to rely solely on internal research and development as sources for
innovation. Examples include buying externally developed technology on the market or
licensing internally developed technology (Chesbrough 2003; Von Hippel 2005), and
forming joint ventures or alliances for innovation (Rothaermel and Deeds 2004).
This dissertation focuses on the practice of involving external parties in the
formerly internally organized NDP process. The benefits of inviting external parties to
participate in NPD include access to external resources including knowledge and skills
(Fang 2008; Handfield et al. 1999; Jeppesen and Lakhani 2010). Involving external
parties may be the source of new product ideas (Afuah and Tucci 2012; Stump, Athaide,
and Joshi 2002). Depending on their role, external parties could also share materials,
equipment, and machinery, for use in the developing firm’s NPD process.
Gaining access to external party resources may increase the developing firm’s
technological and market knowledge, which may reduce the risk associated with
developing (Walter et al. 2003) and marketing a new product (Chen, Li, and Evans
2012). Furthermore, access to external parties’ resources may reduce the time to
market (Campbell and Cooper 1999), although the additional activities necessary for
managing the external party involvement might also lengthen the NPD process (Bajaj,
Kekre, and Srinivasan 2004). Similarly, external party involvement can affect the cost
efficiency of NPD processes both positively and negatively (Bensaou 1997; Koufteros,
Vonderembse, and Jayaram 2005).
This dissertation focuses on the participation of three types of external parties in
NPD: suppliers, customers, and the “crowd”.1
1 A firm can also involve other types of external parties in its NPD projects, such as research institutes and universities (e.g., Powell, Koput, and Smith-Doerr 1996), consultants (e.g., Knudsen 2007), and competitors (e.g., Luo, Rindfleisch, and Tse 2007).
Chapter 1 – Introduction
4
1.2 RESEARCH GAPS AND CONTRIBUTIONS
The overarching objective of this dissertation is to shed light on how to successfully
manage the participation of external parties in NPD. Organized per type of external party
involved, we formulate gaps in extant research that form the basis for the contributions
of this dissertation.
Supplier Involvement
Developments in supply chain management in the 1980s initiated opening up the
innovation process by letting suppliers participate in car manufacturers’ NPD processes
(e.g., Clark 1989; Kotabe, Martin, and Domoto 2003; Takeishi 2001), a practice that was
rapidly adopted in other industries. Supplier involvement ranges from minor
participation to close collaboration with the developing firm. For example, involved
suppliers may provide suggestions during the product’s design phase or share their
technological knowledge with the firm’s engineers during the development phase.
Alternatively, suppliers may co-locate their employees on-site. Suppliers may also take
over design, development, engineering, and testing tasks (Handfield et al. 1999; Wasti
and Liker 1997; Wynstra and Ten Pierick 2000).
The growth in relevant research has paralleled the growth of supplier involvement
in practice. Yet, an integrative review that consolidates prior findings on the role of
supplier involvement in NPD is still lacking. The first contribution of this dissertation is
to take stock of the extant literature on supplier involvement in NPD by analyzing the
antecedents and consequences.
Customer Involvement
Next to suppliers, customers also play a role in the firm’s NPD process (e.g., Fang
2008; Prahalad and Ramaswamy 2004). Customer involvement in NPD focuses on the
buyers and users of the products to be developed. The involvement of customers in NPD
is increasingly used in practice, and can take many forms. For example, customers can
be the source of new product concepts. When selecting lead users, whose current needs
will become general in the future marketplace, customer involvement can contribute to
innovation (Von Hippel 1986). Customers may also participate in testing concepts or
product prototypes. Especially in industrial markets, customers can contribute

Chapter 1 – Introduction
5
technological knowledge and skills to the NPD process (Fang, Palmatier, and Evans
2008), whereas in consumer markets, their contribution may come in the form of co-
development (Chan, Yim, and Lam 2010; Franke, Schreier, and Kaiser 2010).
The growing popularity of customer participation is reflected in the academic
literature. Now that a substantial body of research on customer involvement in NPD has
accumulated, an integrative review that consolidates prior findings is opportune. This
dissertation will contribute to the literature by systematically analyzing the antecedents
and the consequences of customer involvement in NPD, in a similar fashion to our
analysis of supplier involvement in NPD. In addition, this dissertation will contribute to
the extant literature by comparing the involvement of suppliers and customers in terms
of their antecedents and consequences.
Although the academic attention for customer involvement in NPD is growing,
extant research on customer involvement focuses on the traditional ‘markets of many.’
In contrast, the role of the involved customer in ‘markets of one,’ in which only one
customer purchases the product developed, is not studied. These interactions are
common in business-to-business markets, where a single customer firm outsources the
development of technology or a product to an external supplier firm. The question rises
whether the outsourcing customer should be involved in the developing firm’s NPD
process. A complicating feature of these industrial relationships is their multiplex
nature: these relationships often include more than one role: the customer may also be
a partner of, a competitor against, or even a supplier to the developing firm (Tuli,
Bharadwaj, and Kohli 2010). We contribute to the literature by empirically investigating
the effects of customer involvement in outsourced NPD in these multiplex relationships.
Crowd Involvement
A more recent application of open innovation is the involvement of the ‘crowd’, an
unidentified group of individuals, external to the firm, in the NPD process. This practice
has been coined as “crowdsourcing” in the business literature (Howe 2006, 2008).
Enabled by recent developments in Web 2.0 technology, firms use crowdsourcing
applications to reach individuals with a wide diversity of knowledge and skills
(Jeppesen and Lakhani 2010). One application of crowd involvement in NPD is the
online idea generation contest, in which individuals external to the firm enter a contest

Chapter 1 – Introduction
6
and submit ideas in response to a firm’s open call for ideas. Many firms, including
Heineken, Frito-Lay, Unilever, and Samsung, organize these contests to gather input to
be used in the idea generation phase of the NPD process.
Despite the growing importance of the crowd as an external resource for the NPD
process, motivating the crowd to expend effort in such contests is a key challenge
(McKinsey 2009, p. 53). This dissertation aims to add to the emerging literature on the
involvement of the crowd in NPD by empirically investigating how to motivate the
crowd to contribute to the idea generation phase of the NPD process.
1.3 OUTLINE
This dissertation consists of three essays that focus on the involvement of external
parties in an NPD context. An overview of the chapters’ content, research approach, and
sample is depicted in Table 1.1. Despite their common focus on external party
involvement in NPD, each chapter is self-contained and can be read independently. Each
chapter starts with its own introduction and ends with a discussion of the major
findings. The next sections will outline the three chapters that form the core of this
dissertation.
We start our analysis in Chapter 2 – The Role of Supplier and Customer Involvement
in New Product Development: A Meta-Analysis – by taking stock of the extant empirical
work on supplier and customer involvement in NPD. In the last decades, the
participation of suppliers and customers in a firm’s internal NPD process have become
increasingly important in business. Following practitioners’ interests, researchers in
marketing, strategic management, operations management, and other academic
domains studied the role of supplier and customer involvement in NPD, contributing to
a fragmented literature base on the topic. Using meta-analytic techniques, which are
indispensible for integrating and expanding a field’s knowledge base (Hunter and
Schmidt 1990), we bring sharper focus to these seemingly distinct streams of research.
Specifically, we meta-analyze data harvested from 119 independent samples
reported in 140 empirical studies. The theoretical perspective central to our hypotheses
is the resource-based view (Barney 1991), originally developed in the field of strategic
management, but also applied to explain marketing phenomena (e.g., Day 1994; Hunt
and Morgan 1996; Srivastava, Shervani, and Fahey 1998).

Chapter 1 – Introduction
7
We propose and test a framework including both antecedents and consequences of
supplier and customer involvement in NPD. Regarding the antecedents, we focus on (i)
a firm’s resources (in technology and marketing) and (ii) the environmental uncertainty
a firm faces (with respect to technology and the market) as predictors of supplier and
customer involvement in NPD. In terms of the consequences, we focus on (i) product
innovativeness, (ii) speed to market, and (iii) cost performance as outcomes of supplier
and customer involvement. We find that supplier involvement improves speed to
market and cost performance, but lowers product innovativeness. In contrast, customer
involvement improves product innovativeness while lowering speed to market.
TABLE 1.1: Chapter Overview
Chapter 2 Chapter 3 Chapter 4
Research
Question
What are the antecedents and
consequences of supplier and
customer involvement in
NPD?
How does customer
participation in outsourced
NPD affect supplier task
performance for multiplex
relationships?
How does the prize
structure of an online
idea generation
contest affect idea
creativity?
External
Party
Studied
Supplier
Customer
Customer
(in partner, competitor, and
reversed supplier roles)
Crowd
(undefined group of
individuals)
Context NPD projects NPD projects Idea generation
contests
Performance
Measure
Innovativeness
Speed to market
Cost performance
Supplier task performance
(customer and supplier
perspective)
Creativity
Research
Approach Meta-analysis Primary study Primary study
Data
Sources
Empirical work in marketing,
strategic management,
operations management, and
supply chain management
Project administration data
Evaluation reports
Strategic cooperation plans
Procurement records
Surveys
Contest data
Submissions
Panel of judges
Sample 119 samples from 140
studies 140 NPD projects
106 idea generation
contests
Methodology Full information maximum
likelihood
Seemingly unrelated
regression with
randomized intercept
Full information
maximum likelihood

Chapter 1 – Introduction
8
Chapter 3 – The Effect of Customer Participation in Outsourced NPD on Supplier Task
Performance: The Role of Relationship Multiplexity – considers the prevalent industrial
context of outsourced NPD. In outsourced NPD, a firm outsources NPD activities to an
external supplier that executes the product development work. Yet, as the outsourcing
customer is highly knowledgeable and may start thinking about technological avenues
to follow in the NPD project, customers increasingly participate in the supplier’s NPD
process. In many outsourced NPD projects, the involvement of the customer in the NPD
project is complicated by the multiplex nature of the relationship between the customer
and supplier: a customer may also be a partner of, competitor against, or even supplier
to its supplier firm (Ross and Robertson 2007; Tuli, Bharadwaj, and Kohli 2010).
Prior research important to this topic can be found in the fields of marketing and
strategic management. Role theory (Biddle 1986; Katz and Kahn 1966), which has its
roots in the sociology literature, forms the theoretical basis of our analysis. Specifically,
we propose how customer participation affects the task performance of the developing
supplier under conditions of (i) customer-as-partner, (ii) customer-as-competitor, and
(iii) customer-as-supplier multiplexity. In this chapter, we consider the effects of
customer involvement at both sides of the dyad by analyzing the effects on the
customer’s perception as well as the supplier’s own perception of supplier task
performance. We test our hypotheses using a proprietary data set on 140 outsourced
NPD projects, composed of multiple sources of archival data, survey data, and key
qualitative insights.
We find that involving a customer that is also one’s partner increases supplier task
performance, but the effect holds only for partnerships that are composed by the parties
themselves and not for partnerships that are engineered by a triggering entity. In
contrast, participation of a customer that also has a supplier role decreases supplier
task performance. Participation of a customer that is also a competitor lowers supplier
task performance in the eyes of the customer, but does not affect the supplier’s self-
reported task performance. Our results provide managerial insight as to when customer
participation helps or hurts.

Chapter 1 – Introduction
9
Chapter 4 – Managing the Crowd: Prize Structure and Creativity in Online Idea
Generation Contests – deals with online idea generation contests, a nascent application
of open innovation. Unlike the research contexts central to Chapters 2 and 3, in which
the external party had a supplier or a customer role, online idea generation contests
enable the involvement of external parties without any relationship to the firm. In these
contests, an idea generation challenge is disclosed as an open call to the ‘crowd’: an
undefined group of individuals external to the firm (Howe 2006, 2008). Those that
compete in these crowdsourcing contests do not receive any upfront or guaranteed
payment for their efforts. Instead, they are motivated by the possibility of winning a
prize (Afuah and Tucci 2012). In Chapter 4, we examine the effects of prize structure
characteristics of online idea generation contests on idea creativity, a core element of
innovation strategy (Im and Workman 2004).
Relevant extant work on idea generation contests has been done in both marketing
and strategic management. Our theoretical angle is rooted in psychology. Specifically,
we use arguments from motivation theory (Amabile 1996; Deci and Ryan 1985) to form
our hypotheses. We propose how a contest’s (i) total prize value, (ii) number of prizes,
and (iii) prize spread affect the creativity of the ideas submitted in the contest.
Controlling for the endogeneity of the number of contestants, we test our hypotheses
using a proprietary dataset on 106 online idea generation contests, complemented with
data supplied by expert judges.
We find that total prize value and number of prizes increase idea creativity, while
prize spread decreases idea creativity. Furthermore, the effects of prize structure
characteristics on idea creativity are interdependent. Contest sponsors who are unable
to offer a high total prize value can increase idea creativity by having many prizes of low
value. Contest sponsors should strive to set prizes of equal value as prize spread
decreases idea creativity, especially for contests with few prizes.
Chapter 5 summarizes the main findings and provides general conclusions.
Furthermore, we propose managerial implications of the findings. Finally, we conclude
this chapter with a discussion of the limitations of the studies, and offer potential
avenues for future research.


11
“Consider your verdict,” the King said to the jury.
“Not yet, not yet!” the Rabbit hastily interrupted.
“There's a great deal to come before that!”
Lewis Carroll, Alice’s Adventures in Wonderland, Chapter 11
Chapter 2
The Role of Supplier and Customer Involvement
in New Product Development:
A Meta-Analysis
2.1 INTRODUCTION
Understanding the drivers of successful new product development (NPD) has been
a long-standing goal of managers and researchers. NPD is associated with high resource
requirements, large investments, long time horizons, and substantial risk (Cooper and
Kleinschmidt 1995). A recent benchmarking study (Barczak, Griffin, and Kahn 2009)
reports that firms require about seven ideas for every single NPD project initiated.
Furthermore, NPD projects take about three years to complete. In addition, firms
commercialize only one product for every eleven NPD projects started, and only about
half of these market introductions are reported to be successful. It is therefore not
surprising that a recent worldwide survey by PricewaterhouseCoopers shows that 97%
of the CEOs consider improving NPD performance a top priority, and a major and
lingering concern (Percival and Shelton 2013).
In an attempt to improve their NPD performance, firms have increasingly opened
up their NPD processes (Chesbrough 2003). A popular practice is the involvement of
parties outside firm boundaries in NPD projects (Wind and Mahajan 1997). Starting in
the 1980s, practitioners and researchers alike have recognized the potential of supplier

Chapter 2 –Supplier and Customer Involvement in New Product Development: A Meta-Analysis
12
involvement as a way to improve NPD performance (Johnsen 2009). In the 1990s, the
role of the customer as an external resource became more important: in an attempt to
find new sources of value, firms let customers participate in innovation processes
(Prahalad and Ramaswamy 2004). Accordingly, academia started to examine customer
involvement in NPD as well. However, despite the accumulating body of research on
NPD, an integrative review that consolidates prior findings on the role of supplier and
customer involvement in NPD is still lacking.
The purpose of this study is to provide an integrative meta-analysis of research on
both supplier and customer involvement in NPD. We limit our analysis to the situation
in which a firm involves suppliers and/or customers in an internal NPD project, and
thus exclude other, more formal forms of collaborative NPD between two firms, such as
joint ventures. Using correlations obtained from 140 studies from a wide range of fields,
including marketing, strategic management, operations management, and supply chain
management, we propose and test a model that encompasses the antecedents and
consequences of both supplier and customer involvement. Specifically, we focus on a
firm’s resources (in technology and marketing) and environmental uncertainty (with
respect to technology and the market) as drivers of its use of supplier and customer
involvement in NPD. We extend prior research (e.g., Barczak, Griffin, and Kahn 2009) by
taking into account the multifaceted nature of NPD success (Griffin and Page 1996) and
by investigating the effects of supplier and customer involvement on three measures of
NPD performance: product innovativeness, speed to market, and cost performance. In
addition, we extend the literature on external party involvement (e.g., Chesbrough 2003)
by explicitly comparing supplier and customer involvement in NPD as two different
strategies to access external resources.
We find that a firm’s internal resources (in technology and marketing) and
environmental uncertainty (with respect to technology and the market) are important
predictors of its use of both supplier and customer involvement in NPD. Further, we find
that supplier and customer involvement affect operational NPD performance differently.
Notably, there are trade-offs between the effects of supplier and customer involvement
on product innovativeness, speed to market, and cost performance, which suggests that
firms should selectively involve external parties in NPD. The results suggest useful
directions for NPD practitioners and scholars.
Chapter 2 – Supplier and Customer Involvement in New Product Development: A Meta-Analysis
13
The rest of this essay is organized as follows. First, we describe the resource-based
view, which is the foundation to our theory. Second, we develop our hypotheses that
explain the effects of a firm’s internal resources and environmental uncertainty on the
use of supplier and customer involvement in NPD. Subsequently, we present our
hypotheses on the consequences of supplier and customer involvement, in terms of
product innovativeness, speed to market, and cost performance. Then, we explain the
data collection procedure and offer the results. We conclude with the study’s
implications for research and practice.
2.2 CONCEPTUAL BACKGROUND
A theoretical perspective that can help to improve our understanding of customer
and supplier involvement in NPD is the resource-based view of the firm (Barney 1991;
Wernerfelt 1984), which has been widely used in other work on NPD (e.g., Kleinschmidt,
De Brentani, and Salomo 2007; Verona 1999). The resource-based view considers the
firm as a unique bundle of tangible and intangible resources. Resources include all of a
firm’s assets, capabilities, organizational processes, information, and knowledge that
enable the firm to deploy strategies that improve its position (Barney 1991).
Importantly, the resource-based view of the firm does not limit itself to a firm’s internal
resources. Crucial resources may also lie outside of the firm (Doz and Hamel 1998).
Specifically, resources that are accessed by means of involving external parties in a
firm’s NPD operations may extend a firm’s resource base (Song et al. 2005). Two
external parties that have received considerable attention of both practitioners and
academics are suppliers and customers (Wind and Mahajan 1997). Using the resource-
based view of the firm, we develop hypotheses on what drives firms to involve suppliers
and/or customers in NPD, and how this affects their performance. We define supplier
involvement in NPD as the extent of supplier participation in the focal firm’s NPD
project (Ragatz, Handfield, and Scannell 1997). Supplier involvement may range from
giving minor design suggestions (e.g., to improve the manufacturability of a component)
to participating in a firm’s NPD project by co-locating supplier employees on-site and
taking over tasks in the design, development, engineering, or testing of particular
components or subsystems (Handfield et al. 1999; Wasti and Liker 1997; Wynstra and
Ten Pierick 2000). During supplier involvement in NPD, the focal firm and the involved
supplier work together. This collaboration allows the firm to use the involved supplier’s

Chapter 2 –Supplier and Customer Involvement in New Product Development: A Meta-Analysis
14
knowledge, competences, and capabilities in the NPD project (Ragatz, Handfield, and
Scannell 1997).
Along the same lines, we define customer involvement in NPD as the extent to
which customers participate in the focal firm’s NPD project (Fang 2008). Typically,
customers involved in an NPD project participate by providing information on customer
needs and preferences, by providing feedback on product concepts and prototypes,
and/or by co-developing technology (Fang 2008; Gruner and Homburg 2000). For this
purpose, the focal firm can organize customer visits, customer workshops, and product
tests with customers. During these activities, the interaction between the firm and the
involved customer allows the firm to access external customer knowledge, competences,
and capabilities.
The goals of our meta-analysis are to examine the antecedents and consequences of
supplier and customer involvement in NPD. The conceptual framework guiding our
analysis is depicted in Figure 2.1.
FIGURE 2.1: Antecedents and Consequences
of Supplier and Customer Involvement in NPD
First, we argue that the extent to which a firm involves suppliers and customers to
access external resources depends on its internal resources and the external
Supplier involvement
Customer involvement
NPD performance
• Innovativeness• Speed to market
• Cost performance
Firm resources
• Technology• Marketing
Uncertainty
• Technology• Market
Product importance
Firm size
= hypothesized relationship= control

Chapter 2 – Supplier and Customer Involvement in New Product Development: A Meta-Analysis
15
circumstances the firm faces in the form of environmental uncertainty (cf. DeSarbo et al.
2005). We distinguish between a firm’s technological and marketing resources, and
between technological and market uncertainty. Second, we argue how supplier and
customer involvement in NPD contribute to NPD performance, in terms of product
innovativeness, speed to market, and cost performance.
2.3 ANTECEDENTS OF SUPPLIER AND CUSTOMER INVOLVEMENT
We start our theory development by examining the antecedents of supplier and
customer involvement in NPD. We distinguish between internal resources and
environmental uncertainty.
Effects of Firm Resources on Supplier and Customer Involvement in NPD
Firm resources refer to all assets, capabilities, organizational processes, information,
knowledge, etc. controlled by the firm that enable the firm to formulate and implement
strategies to improve its competitive position (Barney 1991). Extant research finds that
firm resources play an important role in the NPD process. For example, Cooper (1979)
shows that technical proficiency and marketing knowledge are key to the NPD process.
Moenaert and Souder (1990) study R&D and marketing personnel as important actors
in the NPD process. Similarly, Calantone and Di Benedetto (1988), Song and Parry
(1997), and Song and Montoya-Weiss (2001) describe how technical and marketing
resources are key inputs to the innovation process. Thus, both technological resources
as well as marketing resources have been recognized as playing a role in the
development of new products.
A firm’s technological resources relevant to NPD are the inputs to the technological
development of a new product (Calantone and Di Benedetto 1988), including its
machinery and installations, R&D personnel, engineering expertise, design capabilities,
production skills, patents, the stock of previously accumulated technological knowledge,
etc. (Song and Montoya-Weiss 2001). A firm’s marketing resources relevant to NPD
include market information as well as the skills to screen, use, and disseminate the
resulting marketing knowledge in the firm (Day 1994; Hunt and Morgan 1995).
Specifically, knowledge about customer needs and preferences, channel partners, and
competitors comprise important resources during the NPD process (Day 1994; Song
and Montoya-Weiss 2001). In addition, marketing resources include the firm’s test

Chapter 2 –Supplier and Customer Involvement in New Product Development: A Meta-Analysis
16
marketing and product launching capabilities (Cooper 1979). We expect that both types
of firm resources – technology and marketing – affect the extent to which firms involve
suppliers and customers in the NPD process.
Technological resources and supplier involvement. We argue that a firm’s internal
resources are a necessary condition for firms to deploy the resources sourced from
external parties. As a firm has accumulated more domain-specific prior knowledge and
skills, it is better able to recognize, value, and employ externally sourced knowledge
(Cohen and Levinthal 1990).
Firms with more internally developed technological resources have a higher
absorptive capacity to process supplier knowledge in the NPD project (Cassiman and
Veugelers 2006), which may lead to higher levels of supplier involvement in NPD for
four reasons. First, a firm with more internally developed technological resources is
more likely to understand its current technological knowledge deficiencies, which
increases the involvement of suppliers as a way to use the externally sourced
knowledge to fill its internal knowledge gaps. Second, a firm with more internally
developed technological resources is better able to assimilate supplier know-how and
subsequently employ it in its own NPD project (Cohen and Levinthal 1990), which may
also increase the extent of supplier involvement in NPD. Third, a firm with high levels of
internal technological resources is more proficient to jointly develop new knowledge
with the involved supplier. Fourth, a firm with a strong R&D track record can better
judge and select fruitful technologies among those offered among the supplier base
(Narasimhan, Rajiv, and Dutta 2006), making supplier involvement more attractive.
Turning to the supplier’s perspective, LaBahn and Krapfel (2000) note that a
supplier is more willing to participate in a firm’s NPD project when the latter has a
stronger internal technological resource base, because this also offers the supplier more
learning opportunities. In sum, we expect that firms with stronger internal
technological resources will more intensely involve suppliers in their NPD projects. We
hypothesize:
H1SI: A firm’s technological resources increase supplier involvement in NPD
Technological resources and customer involvement. We expect that a firm’s
internally developed technological resource base also affects the involvement of

Chapter 2 – Supplier and Customer Involvement in New Product Development: A Meta-Analysis
17
customers in NPD projects. Prior research has suggested that new technology-intensive
products are best developed through extensive involvement of customers in the NPD
project (Neale and Corkindale 1998), because customer involvement leads to better
insight into market opportunities for these products. We argue that a stronger
technological resource base improves a firm’s ability to evaluate, select, and translate
these market opportunities into new products. First, a firm that has accumulated more
technological knowledge and skills can better evaluate the technical feasibility and
realism of customer input (cf. Kim and Wilemon 2002) and can therefore select the
most promising customer ideas (Huston and Sakkab 2006). Second, strong
technological knowledge and high levels of design and engineering skills are necessary
to effectively translate unmet customer needs and preferences into new products
(Narasimhan, Rajiv, and Dutta 2006). Thus, customer involvement is likely to be a more
attractive strategy for firms with a stronger technological resource base.
Turning to the perspective of the customer, one key motivation for customers to be
involved in the firm’s NPD activities is to increase the fit between the product and their
requirements (Fang, Palmatier, and Evans 2008). However, involvement in an NPD
project also requires time and effort from the customer’s behalf (Brockhoff 2003) for
which the firm possibly competes with other manufacturers seeking the customer’s
participation. The translation of customer input into usable products requires
technological resources. Therefore, the likelihood that a customer is willing to
participate in a firm’s NPD project is higher when the latter has more technological
resources, because it has a higher ability to turn the customer input into a product that
suits the customer’s needs. In sum, we expect that a firm with more internal
technological resources will more intensely involve customers in its NPD efforts.
Reflecting our thinking, we hypothesize:
H1CI: A firm’s technological resources increase customer involvement in NPD
Marketing resources and customer involvement. We argue that a firm with strong
internally developed marketing resources is more likely to involve customers in NPD,
for three reasons. First, a firm with more marketing resources has a stronger external
orientation (Day 1994; Vorhies and Morgan 2005), which fuels the development of
strong channel bonding capabilities. The resulting improved customer relationships
Chapter 2 –Supplier and Customer Involvement in New Product Development: A Meta-Analysis
18
offer easier access to customer input (Chen, Li, and Evans 2012), which makes it more
likely to involve customers in NPD. Second, a firm with more marketing resources is
more likely to understand its current market knowledge deficiencies (Atuahene-Gima
2005), which may increase the use of customer involvement as a way to fill its
knowledge gaps. Third, a firm with more marketing resources is better able to translate
information about customer needs and preferences into promising market
introductions. Specifically, a firm’s market sensing abilities and its ability to formulate
product concepts based on customer needs and preferences render customer
involvement in NPD a more attractive strategy.
Turning to the perspective of the customer, a firm’s marketing resources improve
its channel bonding capabilities, which strengthen the relationship between the
customer and the firm. It is expected that the resulting improved customer relationships
will make customers more willing to share their input with the firm (Ritter and Walker
2003). In sum, a firm with more marketing resources is more likely to intensely engage
its customers in NPD. We hypothesize:
H2CI: A firm’s marketing resources increase customer involvement in NPD
Marketing resources and supplier involvement. We expect that a firm’s marketing
resources affect supplier involvement in NPD as well, for three reasons. First, a firm that
has superior access to marketing assets and that has stronger marketing capabilities is
more externally oriented (Day 1994). As a result, the firm will be more motivated to
source external knowledge from suppliers. Second, a firm with an external orientation
has stronger market-sensing abilities (Day 1994), which will aid in selecting the
technological assets that are most promising from a market point of view from those
available in the supplier resource base. This will make supplier involvement in NPD a
more attractive strategy for firms with a strong marketing resource base.
Turning to the perspective of the supplier, a firm with higher levels of marketing
resources typically has stronger channel bonding capabilities with its supply chain
partners as a result of its external orientation (Day 1994; Vorhies and Morgan 2005).
Close, collaborative relationships between the firm and its suppliers will make it easier
to realize supplier involvement in NPD as close suppliers will be more willing to invest
time and effort in the firm’s NPD project (Joshi and Stump 1999; Walter 2003). In sum,

Chapter 2 – Supplier and Customer Involvement in New Product Development: A Meta-Analysis
19
we expect that a firm with stronger internally developed marketing resources will
demonstrate higher levels of supplier involvement in NPD. Accordingly, we hypothesize:
H2SI: A firm’s marketing resources increase supplier involvement in NPD
Effects of Environmental Uncertainty on Supplier and Customer Involvement in NPD
The strategic choices of a firm are not only influenced by its resources but also by
its environment (Porter 1980). We distinguish between two types of environmental
uncertainty: technological uncertainty and market uncertainty. We define technological
uncertainty as the extent to which technology in an industry is in a state of flux
(Jaworski and Kohli 1993). Under high levels of technological uncertainty, firms
struggle to understand new and incompletely specified processes or products
(Burkhardt and Brass 1990; Rindfleisch and Heide 1997). We define market uncertainty
as the speed and the unpredictability with which customer needs and preferences
change (De Luca and Atuahene-Gima 2007; Rindfleisch and Heide 1997).
Technological uncertainty and supplier involvement. We expect technological
uncertainty to increase a firm’s need to involve suppliers in NPD projects. Under
conditions of technological uncertainty, a firm needs to remain flexible in terms of
technological resources (John, Weiss, and Dutta 1999). By involving suppliers in NPD, a
firm can broaden its technological options and assure itself of the resource flexibility
that is necessary to face technological uncertainty. Furthermore, accessing externally
developed technological resources reduces the focal firm’s technology development risk
substantially (Bidault, Depres, and Butler 1998), which also increases the attractiveness
of supplier involvement to the focal firm. We hypothesize:
H3SI: Technological uncertainty increases supplier involvement in NPD
Technological uncertainty and customer involvement. Technological uncertainty is
also likely to increase the need to involve customers in the NPD process. Under
conditions of rapid technological change, a firm may be unsure which of the multiple
possible technological trajectories to select for further development. Technological
trajectories differ in terms of the customer benefits offered (Anderson and Tushman
1990). In these circumstances, a firm needs market resources for making informed
choices about the customer needs that can be solved with the various technological

Chapter 2 –Supplier and Customer Involvement in New Product Development: A Meta-Analysis
20
avenues available. Interacting with customers results in increased first-hand market
insight, which provides direction in such changing product markets (Narver and Slater
1990). Customer involvement under conditions of technological uncertainty may be
beneficial to the involved customer as well, as being involved may contribute to
choosing the technology that offers the most customer benefits. Thus, in technological
uncertain environments, customer involvement helps a firm to align technological
choices with customer needs (Von Hippel 1986). Accordingly, we hypothesize:
H3CI: Technological uncertainty increases customer involvement in NPD
Market uncertainty and customer involvement. We expect that a high level of market
uncertainty increases customer involvement in NPD. Changing customer needs and
preferences increase a firm’s need for market resources. Customer involvement can
fulfill the firm’s need for additional market resources by providing first-hand market
insights about customer needs and preferences (Fang 2008). External resources from
customers can reduce the market uncertainty a firm faces in several ways. For example,
customers can offer feedback about product concepts that fit their needs best. Involved
customers can also assure their needs are met by assisting in designing a product, which
is expected to increase customers’ willingness to be involved in the focal firm’s NPD
project. Further along in the NPD process, customers may play a role in field testing,
which contributes to a better fit between the newly developed product and a customer’s
usage situation. In sum, under conditions of market uncertainty, involving customers in
NPD allows the firm to respond to new demand curves (Slater and Narver 1995). We
hypothesize:
H4CI: Market uncertainty increases customer involvement in NPD
Market uncertainty and supplier involvement. Under conditions of market
uncertainty, a firm has greater needs for technological resources, because a firm that
faces rapidly changing customer needs and preferences requires strategic response
flexibility (Grewal and Tansuhaj 2001). New-to-the-firm technologies may be required
to meet changing customer needs. This may spur supplier involvement in NPD, as it
offers a firm access to a variety of technological resources which increases the firm’s
flexibility to respond to new demand curves (cf. Slater and Narver 1995). Thus, we
Chapter 2 – Supplier and Customer Involvement in New Product Development: A Meta-Analysis
21
expect that market uncertainty increases the likelihood to involve suppliers in the NPD
project:
H4SI: Market uncertainty increases supplier involvement in NPD
2.4 CONSEQUENCES OF SUPPLIER AND CUSTOMER INVOLVEMENT
We continue our theory development by examining the consequences of supplier
and customer involvement in NPD. Prior research has reported inconsistent results as
to the effects of supplier and customer involvement on NPD performance. For example,
Potter and Lawson (2013) report positive effects of supplier involvement on NPD
performance, whereas Millson and Wilemon (2002) show negative effects of supplier
involvement. As to customer involvement, Brettel and Cleven (2011) find that it
improves the performance of NPD projects, but Knudsen (2007) reports a negative
influence of customer involvement. These inconsistencies in prior research may be
attributable to the multifaceted nature of NPD performance (Griffin and Page 1996).
Recognizing that no single measure is able to completely gauge the performance of an
NPD project (Griffin and Page 1996), we set out to examine the effects of supplier and
customer involvement on three interrelated, yet distinct measures of NPD performance:
product innovativeness, speed to market, and cost performance.
A product’s level of innovativeness is defined as its newness in terms of technology
and market (Kleinschmidt and Cooper 1991). A product is high on technological
newness when its development requires the use of new technology, engineering, design,
and production processes (Kleinschmidt and Cooper 1991). A product is high on market
newness when it serves new customers, fills new customer needs, and faces new
competitors on the market (Kleinschmidt and Cooper 1991). Innovative products can
disproportionally contribute to firm profitability (Wind and Mahajan 1997), and are
crucial to maintain a competitive advantage (Abernathy and Clark 1985).
However, developing innovative products comes with challenges. Developing
radically innovative products takes longer than developing incrementally innovative
products (Griffin 1997): trade-offs may have to be made between product
innovativeness on the one hand and speed to market on the other hand (e.g., Fang 2008;
Swink, Talluri, and Pandejpong 2006). We define speed-to-market as the time it takes
from concept screening and evaluation, technical development and testing, up to the

Chapter 2 –Supplier and Customer Involvement in New Product Development: A Meta-Analysis
22
production startup, excluding market introduction (Cooper and Kleinschmidt 1986).
Speed-to-market is also referred to as time to market (Tatikonda and Montoya-Weiss
2001), project completion time (Terwiesch and Loch 1999), product development time
(Lilien and Yoon 1989), and lead time (Ulrich et al. 1993).
In turn, developing products with a high speed to market comes – literally – at a
cost. Increasing the speed of development lowers a project’s cost performance (Bayus
1997; Langerak, Rijsdijk, and Dittrich 2009). Thus, we also study cost performance. We
define cost performance as the firm’s ability to keep developing costs within budget
(Kessler 2000). Increasingly intense competition forces firms to improve the efficiency
of their product development activities (Rothwell 1994), which underlies the
importance of paying attention to cost performance in NPD.
We now discuss the effects of supplier and customer involvement in NPD on each of
these performance measures: product innovativeness, speed to market, and cost
performance.
Effects of Supplier and Customer Involvement in NPD on Product Innovativeness
Supplier involvement and product innovativeness. We argue that supplier
involvement in NPD increases product innovativeness. First, involving suppliers in NPD
increases the developing firm’s resource base, including knowledge and skills, which is
crucial for innovation (Håkansson & Eriksson 1993; Ragatz, Handfield, and Petersen
2002; Takeishi 2002; Wynstra, Van Weele, and Weggeman 2001). As the focal firm and
the involved supplier share a common goal (Un, Cuervo-Cazurra, and Asakawa 2010),
relevant explicit and tacit information is shared openly (Brown and Eisenhardt 1995;
Ragatz, Handfield, and Petersen 2002). Open information sharing may increase
innovation spillovers from the supplier to the developing firm (Inkpen 1996) and may
enhance knowledge creation between the two parties (Inkpen 1996), thereby
increasing a firm’s ability to develop radically innovative products by employing new
technologies in the NPD project (Koufteros, Cheng, and Lai 2007). Second, involving
suppliers may contribute to the selection of promising nascent technologies, because of
the suppliers’ scout function in the innovation process. Suppliers may have more
technological insights and experience in particular areas, such that they can share
reliable, meaningful, and relevant knowledge about emerging technologies with the
Chapter 2 – Supplier and Customer Involvement in New Product Development: A Meta-Analysis
23
focal firm (Walter et al. 2003). Third, suppliers can also be a source of market insight
(Song and Thieme 2009). A supplier may have invested in marketing activities directed
at its supply chain and may have developed insights about customer demands and
unfulfilled market opportunities that can be relevant and valuable to the developing
firm. In turn, the focal firm can use these external marketing resources to increase its
product innovativeness. We offer the following hypothesis:
H5SI: Supplier involvement in NPD increases product innovativeness
Customer involvement and product innovativeness. We expect that intensively
involving customers in the NPD process also contributes to product innovativeness.
Customers have been recognized as a source for many innovative ideas (Feng et al. 2012;
Von Hippel 1986) of a broad nature (Un, Cuervo-Cazurra, and Asawaka 2010) that
stimulate product innovativeness. Exposure to customer needs is critical for developing
superior products (Clark and Fujimoto 1991). A firm that closely interacts with
customers during NPD builds an in-depth understanding of customer interests as well
as their expressed and unexpressed needs (Griffin and Hauser 1993; Ramani and Kumar
2008; Vargo and Lusch 2004). This way, a firm can identify market trends early on,
which allows it to act on unexplored market opportunities (Chen, Li, and Evans 2012),
increasing product innovativeness. Next to being a source of improved market insight,
customers can also offer technological knowledge. Customers with needs that precede
the majority of the market are likely to try developing a solution themselves and to
build early technological insights (Von Hippel 1986), which can help increase the
innovativeness of the product developed. However, a strong customer orientation has
also been associated with lower product novelty (Im and Workman 2004). Customers
may define their needs in terms of existing products (Bonner and Walker 2004), such
that customer involvement may lead to more application-oriented developments
associated with lower investments and less risk (Knudsen 2007), which restricts the
exploration of very innovative alternatives (Danneels 2003). Acknowledging this risk of
customer involvement in NPD, prior research has shown that involved customers
should be carefully managed, and customer input needs to be thoroughly processed
before being put to use in the NPD project (Sethi 2000). Under these conditions,
customer input is well-channeled and improves, rather than deteriorates, product

Chapter 2 –Supplier and Customer Involvement in New Product Development: A Meta-Analysis
24
innovativeness. Hence, overall, customer involvement in NPD has the potential to
increase product innovativeness. We hypothesize:
H5CI: Customer involvement in NPD increases product innovativeness
Effects of Supplier and Customer Involvement in NPD on Speed to Market
Supplier involvement and speed to market. Prior research has suggested three ways
in which supplier involvement may help reduce the speed to market of a newly
developed product. First, by involving suppliers, additional personnel join the focal
firm’s project team and may take over non-core tasks, such as the development of
particular components or the execution of testing activities. This may reduce the
workload of the focal firm (Clark and Fujimoto 1991), and allows it to specialize into
tasks that require the firm’s key competencies and skills (Eisenhardt and Tabrizi 1995).
As a result, the critical path of development projects may be shortened (Brown and
Eisenhardt 1995; Ragatz, Handfield, and Petersen 2002), improving speed to market.
Second, by involving suppliers more intensively in the NPD process, the focal firm is
more likely to identify potential technical problems in the product specification, product
design, or production early on (Knudsen 2007; Zirger and Hartley 1994). This
eliminates rework, thereby speeding up the NPD process (Ragatz, Handfield, and
Petersen 2002). Third, involving suppliers increases the number of technological
perspectives held among the NPD team members (Eisenhardt and Tabrizi 1995), which
reduces the time needed to solve technical problems, in case any occur. Fourth, closely
involving suppliers in an NPD project contributes to a better coordination of
communication and information exchange between the parties, which reduces delays
and helps to achieve time goals (Ragatz, Handfield, and Petersen 2002). Therefore, we
hypothesize:
H6SI: Supplier involvement in NPD increases speed to market
Customer involvement and speed to market. In contrast to involved suppliers, who
typically take over tasks from the firm’s NPD team, involved customers do not take over
tasks, but rather join the firm’s NPD team to provide feedback and co-development
assistance to the firm’s engineers (Fang 2008). Listening to involved customers and
translating customer input into usable knowledge of customer needs and preferences
requires substantial time commitment on behalf of the developing firm (Bajaj, Kekre,
Chapter 2 – Supplier and Customer Involvement in New Product Development: A Meta-Analysis
25
and Srinivasan 2004), as customer input requires processing before it can be used
(Sethi 2000). Thus, instead of speeding up the NPD process, involving customers adds
extra tasks that the focal firm must execute, thereby increasing development time and
reducing speed to market. The reduced speed to market as a result of involving
customers in the NPD project can be partially compensated for. A firm that involves
customers in NPD is likely to identify product benefit misspecifications and product
design flaws in an earlier stage, which could save rework in later stages of the NPD
process (Campbell and Cooper 1999; Koufteros, Vonderembse, and Jayaram 2005).
However, such time benefits can only be attained when customers become involved in
various stages of the NPD process. Specifically, customer involvement is valuable during
the preliminary market and technical analysis, because the insight gained can reduce
costs and problems in the more costly and risky stages of (post-) development
(Campbell and Cooper 1999). In addition, customer involvement is critical during the
testing and evaluation stages of the project, because it provides pre-commercialization
feedback (Campbell and Cooper 1999). However, the more NPD stages in which
customers are involved, the more customer-related project tasks are added to the focal
firm’s task list in a project. Thus, net, we expect that customer involvement in NPD
lengthens rather than shortens the NPD project. Reflecting our thinking, we hypothesize:
H6CI: Customer involvement in NPD decreases speed to market
Effects of Supplier and Customer Involvement in NPD on Cost Performance
Supplier involvement and cost performance. We expect that supplier involvement in
NPD improves an NPD project’s cost performance, for the following reasons. First,
specialized supplier personnel can take over tasks otherwise executed by the focal firm.
As both the supplier and the focal firm specialize into tasks based on their core skills
and competencies, the NDP process is likely more efficient (Eisenhardt and Tabrizi
1995), reducing the cost of development. Furthermore, supplier involvement may spur
joint investments in new technologies while sharing the development cost (Dröge,
Jayaram, and Vickery 2000; Hartley et al. 1997; Langerak and Hultink 2008). In addition,
intensive collaboration leads to an improved relationship, which facilitates coordination
and communication, which, in turn, lowers the cost of problem solving (Cannon and
Homburg 2001; Scannell, Vickery, and Dröge 2000). Finally, involving suppliers in the

Chapter 2 –Supplier and Customer Involvement in New Product Development: A Meta-Analysis
26
NPD process allows firms to eliminate design and production problems early on in the
NPD process (Knudsen 2007; Zirger and Hartley 1994), which reduces costly rework
(Ragatz, Handfield, and Petersen 2002). We expect:
H7SI: Supplier involvement in NPD increases cost performance
Customer involvement and cost performance. Also customer involvement is likely to
affect the cost performance of NPD. On the one hand, involved customers provide
resources to the NPD process that the company may not have access to (Feng 2012;
Gruner and Homburg 2000), saving the focal firm the costs of acquiring these resources
on the market. In addition, interacting with customers during the NPD project can
improve a firm’s understanding of customer needs (Brown and Eisenhardt 1995), which
helps it to prevent mistakes in the design phase of the project. As a result, costly
changes to the product design later in the project can be avoided (Campbell and Cooper
1999; Koufteros, Vonderembse, and Jayaram 2005). On the other hand, the coordination
of involving customers in the NPD process is associated with additional costs (Bajaj,
Kekre, and Srinivasan 2004; Bensaou 1997). For example, additional customer visits,
workshops and product tests with customers, and development team meetings aimed at
gathering customer knowledge must be organized. In addition, processing the newly
gained customer information and translating it into usable resources for the NPD
project takes substantial resources from the focal firm (Sethi 2000), which ultimately
lowers the project’s cost performance. We expect that these additional costs for
coordination and processing, which can be substantial as they affect each project task in
which customers participate, outweigh the potential cost savings achieved. We
hypothesize:
H7CI: Customer involvement in NPD decreases cost performance
2.5 METHOD
Literature Search
The role of supplier and/or customer involvement in NPD have been studied in
multiple fields, including marketing, strategy, operations management, and supply chain
management. We therefore employed a wide search to retrieve the relevant
publications for inclusion in the meta-analysis, covering the period 1990-2013. We used

Chapter 2 – Supplier and Customer Involvement in New Product Development: A Meta-Analysis
27
the following search strategies. First, via a computerized search, we retrieved studies on
either supplier or customer involvement in the ABI Inform Global and ECONLIT
databases using the keywords “supplier involvement,” “supplier participation,”
“supplier collaboration,” “supplier integration,” “customer involvement,” “customer
participation,” “customer collaboration,” “customer integration,” “customer co-creation,”
“customer co-development,” and “customer coproduction.”
Second, we executed an issue-by-issue search for the following journals: Academy of
Management Journal, Administrative Science Quarterly, International Journal of Research
in Marketing, Industrial Marketing Management, Journal of the Academy of Marketing
Science, Journal of Management, Journal of Marketing, Journal of Marketing Research,
Journal of Product Innovation Management, Management Science, Marketing Science,
Organization Science, and Strategic Management Journal. Third, we examined the SSRN
network for unpublished studies and work in progress to address the “file-drawer”
problem (Rosenthal 1991). Fourth, we examined the reference sections of eight reviews
on NPD (e.g., Calantone, Harmancioglu, and Dröge 2010; Cankurtaran, Langerak, and
Griffin 2013; Henard and Szymanski 2001; Evanschitzky et al. 2012). Finally, we
examined the reference sections of all studies identified in the previous four steps to
retrieve any study that might have been overlooked in the process.
After identifying studies for potential inclusion in the dataset, we evaluated the
appropriateness of each study. We excluded studies on collaborative NPD in joint
ventures and alliances (e.g., Rothaermel and Deeds 2004). We excluded studies that
reported on supplier and/or customer involvement in domains other than NPD, such as
manufacturing (e.g., Jayaram, Xub, and Nicolae 2011). Furthermore, we excluded studies
on suppliers (e.g., Carson 2008) or customers (e.g., Franke, Schreier, and Kaiser 2010)
fully taking over the NPD process. In addition, we excluded studies for which we could
not identify which type of external party (supplier or customer) was involved (e.g.,
Kessler, Bierly, and Gopalakrishnan 2000; McNally, Akdeniz, and Calantone 2011).
Further, we excluded studies reporting on the willingness or intention to (be) involve(d)
in NPD rather than actual involvement in NPD (e.g., Porter and Donthu 2008). Lastly, we
excluded studies that failed to report a Pearson correlation coefficient between
supplier/customer involvement in NPD and one of the other constructs in our model,

Chapter 2 –Supplier and Customer Involvement in New Product Development: A Meta-Analysis
28
and that also lacked sufficient statistical information to allow the computation of a
correlation coefficient using the formulas in Hunter and Schmidt (1990, p. 272).
A total of 140 studies were eligible for inclusion in the meta-analysis (see the
Appendix for an overview). Three of these studies were unpublished at the time of data
collection. Some studies merely reanalyzed previously reported data (e.g., De Toni and
Nassimbeni 1999, 2000), or reported subsamples of data that were expanded in later
studies (e.g., Liker, Kamath, and Wasti 1998; Wasti and Liker 1997, 1999). Other studies
examined data from more than one sample (e.g., Lin et al. 2005). In all, we obtained 119
independent samples, reported in 140 studies. Supplier (customer) involvement in NPD
was studied in 91 (54) independent samples.
Data Collection Procedure
Correlations between variables of interest were recorded. In case correlations were
not reported, we converted phi, standardized beta, and univariate F to correlation
coefficients using the formulas provided by Hunter and Schmidt (1990, p. 272) and
Peterson and Brown (2005, p. 179).
All harvested correlations were categorized on the basis of operationalizations of
the construct. In a number of cases, multiple variables within one sample referred to the
same underlying construct. To correct for the interdependence of the recorded
correlation coefficients, these correlations were combined into a composite correlation
following the formulas of Hunter and Schmidt (1990, pp. 435-348).
Testing our hypotheses requires that we collect the correlations between every pair
of constructs in our model, rather than only the correlations between supplier
(customer) involvement and their hypothesized antecedents and consequences (cf.
Geyskens, Steenkamp, and Kumar 1999). As a result, we also extracted correlations for
every pair of constructs in our model (e.g., marketing resources and technology
resources) from the same set of primary studies.
Table 2.1 presents an overview of the constructs in the model, including definitions
and representative measures.

Chapter 2 – Supplier and Customer Involvement in New Product Development: A Meta-Analysis
29
TABLE 2.1: Construct Definitions and Representative Measures
Construct Definition Representative measures
Product
innovativeness
Degree to which the developed product is
innovative (is new or technologically
groundbreaking, and/or fulfills new customer
needs)
Kouferos, Cheng, and Lai
(2007); Lau, Tang, and
Yam (2012)
Speed to
market
Degree to which the developed product arrives
on the market timely, measured by e.g. time to
market and development speed
Feng et al. (2012); Wynstra
et al. (2012)
Cost
performance
Degree to which the developed product's cost
targets are met, measured by e.g. percentage
over budget
Primo and Amundson
(2002); Ragatz, Handfield,
and Petersen (2002)
Supplier
involvement
The extent to which suppliers work together
with the focal firm in the NPD project, measured
by e.g. intensity of supplier collaboration,
supplier integration, and supplier participation
Sánchez and Pérez
(2003a,b); Sherman,
Souder, and Jenssen
(2000)
Customer
involvement
The extent to which customers work together
with the focal firm in the NPD project, measured
by e.g. intensity of customer collaboration,
customer participation, and customer co-
development
Athaide and Zhang (2011);
Mishra and Shah (2009)
Technological
resources
Technological assets, knowledge, capabilities,
and organizational processes of the focal firm,
measured by e.g. R&D investments, patents, and
technological proficiency
Cousins et al. (2011); Un,
Cuervo-Cazurra, and
Asakawa (2010)
Marketing
resources
Marketing assets, knowledge, capabilities, and
organizational processes of the focal firm,
measured by e.g. level of market forecasting
ability, market knowledge and market response
capability
Chen, Li, and Evans (2012);
Souder, Sherman, and
Davies-Cooper (1998)
Technology
uncertainty
The rate of change in the technological
environment
Jean, Sinkovics, and
Hiebaum (2013); Petersen,
Handfield, and Ragatz
(2003)
Market
uncertainty
The rate of change with respect to the
composition of customers, and their needs,
preferences, and demand; and nature of
competitive actions
Chen, Li, and Evans (2012);
Lau, Tang, and Yam (2012)
Product
importance
Strategic importance of the product(s)
developed, e.g. project criticality
Fang (2008); Gulati and
Sytch (2007)
Firm size Scale and scope of organizational operations, e.g.
number of employees and plant size
Atuahene-Gima (2003);
Dabhilkar et al. (2011)
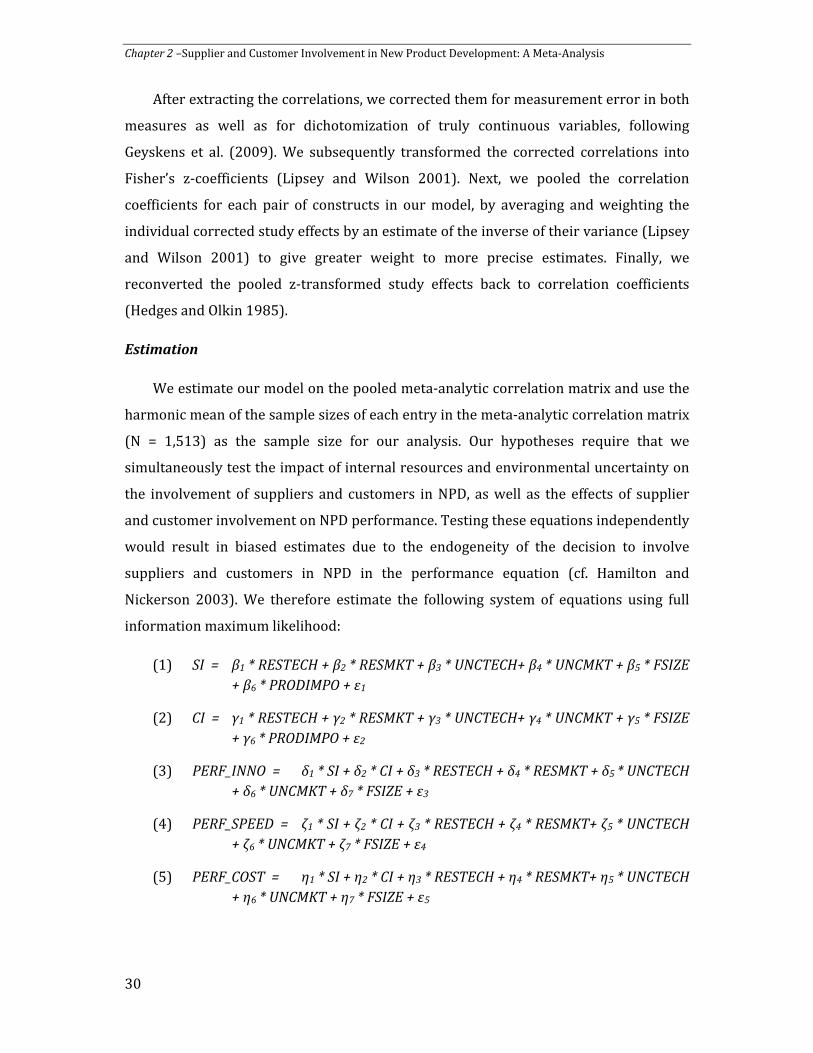
Chapter 2 –Supplier and Customer Involvement in New Product Development: A Meta-Analysis
30
After extracting the correlations, we corrected them for measurement error in both
measures as well as for dichotomization of truly continuous variables, following
Geyskens et al. (2009). We subsequently transformed the corrected correlations into
Fisher’s z-coefficients (Lipsey and Wilson 2001). Next, we pooled the correlation
coefficients for each pair of constructs in our model, by averaging and weighting the
individual corrected study effects by an estimate of the inverse of their variance (Lipsey
and Wilson 2001) to give greater weight to more precise estimates. Finally, we
reconverted the pooled z-transformed study effects back to correlation coefficients
(Hedges and Olkin 1985).
Estimation
We estimate our model on the pooled meta-analytic correlation matrix and use the
harmonic mean of the sample sizes of each entry in the meta-analytic correlation matrix
(N = 1,513) as the sample size for our analysis. Our hypotheses require that we
simultaneously test the impact of internal resources and environmental uncertainty on
the involvement of suppliers and customers in NPD, as well as the effects of supplier
and customer involvement on NPD performance. Testing these equations independently
would result in biased estimates due to the endogeneity of the decision to involve
suppliers and customers in NPD in the performance equation (cf. Hamilton and
Nickerson 2003). We therefore estimate the following system of equations using full
information maximum likelihood:
(1) SI = β1 * RESTECH + β2 * RESMKT + β3 * UNCTECH+ β4 * UNCMKT + β5 * FSIZE
+ β6 * PRODIMPO + ε1
(2) CI = γ1 * RESTECH + γ2 * RESMKT + γ3 * UNCTECH+ γ4 * UNCMKT + γ5 * FSIZE
+ γ6 * PRODIMPO + ε2
(3) PERF_INNO = δ1 * SI + δ2 * CI + δ3 * RESTECH + δ4 * RESMKT + δ5 * UNCTECH
+ δ6 * UNCMKT + δ7 * FSIZE + ε3
(4) PERF_SPEED = ζ1 * SI + ζ2 * CI + ζ3 * RESTECH + ζ4 * RESMKT+ ζ5 * UNCTECH
+ ζ6 * UNCMKT + ζ7 * FSIZE + ε4
(5) PERF_COST = η1 * SI + η2 * CI + η3 * RESTECH + η4 * RESMKT+ η5 * UNCTECH
+ η6 * UNCMKT + η7 * FSIZE + ε5
Chapter 2 – Supplier and Customer Involvement in New Product Development: A Meta-Analysis
31
where SI (CI) = supplier (customer) involvement in NPD, RESTECH (RESMKT) =
technological (marketing) resources of the focal firm, UNCTECH (UNCMKT) =
technological (market) uncertainty, FSIZE = firm size, PRODIMPO = strategic importance
of the product developed, PERF_INNO = product innovativeness, PERF_SPEED = speed to
market, and PERF_COST = cost performance.
We control for firm size (e.g., Fang 2008; Lau, Tang, and Yam 2010) in the
involvement and the performance equations. Larger firms are expected to be more
likely to involve customers and suppliers in their NPD as they have more financial
resources to allocate to strategic collaborations (Koufteros, Cheng, and Lai 2007). In
addition, larger firms have more personnel that they may dedicate to innovation, and
are thus more likely to develop more innovative products. Also, larger firms are more
likely to have NPD procedures in place which help speed up the development process
and contribute to keeping costs down (cf. Hitt, Hoskisson, and Kim 1997).
Furthermore, we control for the influence of product importance (e.g., Athaide,
Stump, and Joshi 2003) in the involvement equations, since firms may be more prone to
allocate external resources to strategically important development projects.
Finally, in the performance equations, we also control for potential direct effects of
the firm’s technological and marketing resources and technological and market
uncertainty (cf. Gatignon and Xuereb 1997; Kessler 2000; Tomlinson 2010).
Because the decisions to involve suppliers and customers in NPD may be related in
ways other than the model accounts for, we allow the residuals of equations (1) and (2)
to be correlated. Similarly, because the different performance indicators may have
common antecedents other than those specified, we allow the residuals of equations (3),
(4), and (5) to be correlated (see Franke and Park 2006 for a similar practice).
2.6 RESULTS
Table 2.2 reports the meta-analytic correlations for the focal relationships in our
model. We report the following summary statistics for each bivariate relationship of
interest to our study: the number of samples reporting on the bivariate relationships k,
the total sample size N, the average corrected correlation (��), the corresponding
standard error (SE), and the 95% confidence interval around ��.
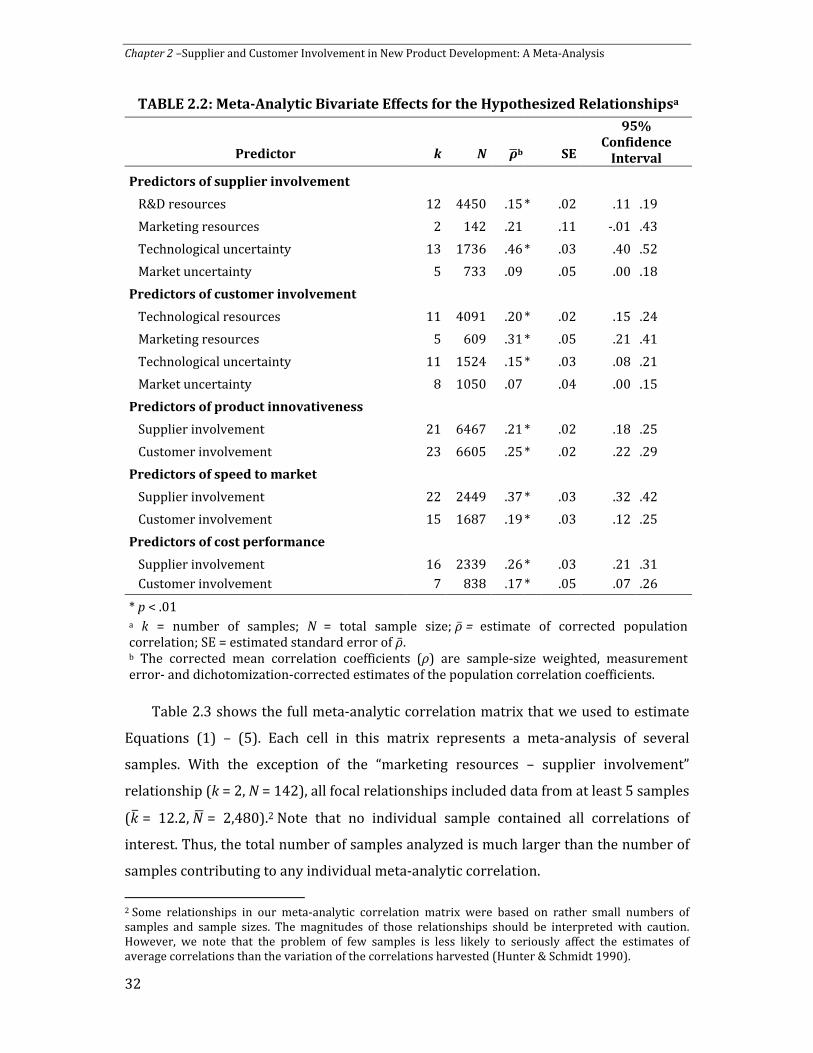
Chapter 2 –Supplier and Customer Involvement in New Product Development: A Meta-Analysis
32
TABLE 2.2: Meta-Analytic Bivariate Effects for the Hypothesized Relationshipsa
95%
Confidence
Interval Predictor k N ��b SE
Predictors of supplier involvement
R&D resources 12 4450 .15 * .02 .11 .19
Marketing resources 2 142 .21
.11 -.01 .43
Technological uncertainty 13 1736 .46 * .03 .40 .52
Market uncertainty 5 733 .09
.05 .00 .18
Predictors of customer involvement
Technological resources 11 4091 .20 * .02 .15 .24
Marketing resources 5 609 .31 * .05 .21 .41
Technological uncertainty 11 1524 .15 * .03 .08 .21
Market uncertainty 8 1050 .07 .04 .00 .15
Predictors of product innovativeness
Supplier involvement 21 6467 .21 * .02 .18 .25
Customer involvement 23 6605 .25 * .02 .22 .29
Predictors of speed to market
Supplier involvement 22 2449 .37 * .03 .32 .42
Customer involvement 15 1687 .19 * .03 .12 .25
Predictors of cost performance
Supplier involvement 16 2339 .26 * .03 .21 .31
Customer involvement 7 838 .17 * .05 .07 .26
* p < .01 a k = number of samples; N = total sample size; �� = estimate of corrected population correlation; SE = estimated standard error of ��. b The corrected mean correlation coefficients (ρ) are sample-size weighted, measurement error- and dichotomization-corrected estimates of the population correlation coefficients.
Table 2.3 shows the full meta-analytic correlation matrix that we used to estimate
Equations (1) – (5). Each cell in this matrix represents a meta-analysis of several
samples. With the exception of the “marketing resources – supplier involvement”
relationship (k = 2, N = 142), all focal relationships included data from at least 5 samples
(�� = 12.2, �� = 2,480).2 Note that no individual sample contained all correlations of
interest. Thus, the total number of samples analyzed is much larger than the number of
samples contributing to any individual meta-analytic correlation.
2 Some relationships in our meta-analytic correlation matrix were based on rather small numbers of samples and sample sizes. The magnitudes of those relationships should be interpreted with caution. However, we note that the problem of few samples is less likely to seriously affect the estimates of average correlations than the variation of the correlations harvested (Hunter & Schmidt 1990).
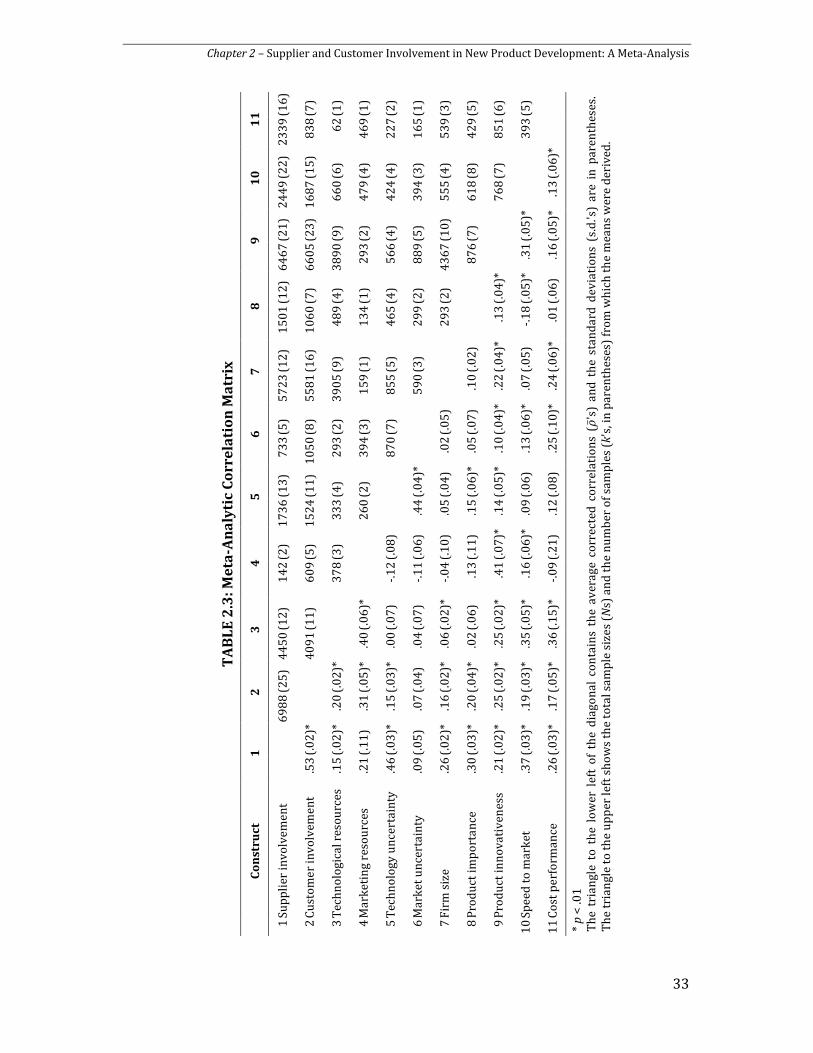
Chapter 2 – Supplier and Customer Involvement in New Product Development: A Meta-Analysis
33
TA
BL
E 2
.3:
Me
ta-A
na
lyti
c C
or
re
lati
on
Ma
trix
C
on
stru
ct
1
2
3
4
5
6
7
8
9
10
1
1
1 S
up
pli
er in
volv
emen
t
69
88
(2
5)
44
50
(12
) 1
42
(2
) 1
73
6 (
13
) 7
33
(5)
57
23
(12
) 1
50
1 (
12
) 6
46
7 (2
1)
24
49
(22
) 2
33
9 (1
6)
2 C
ust
om
er in
volv
emen
t .5
3 (
.02
)*
4
09
1 (1
1)
60
9 (
5)
15
24
(1
1)
10
50
(8)
55
81
(16
) 1
06
0 (
7)
66
05
(23
) 1
68
7 (1
5)
83
8 (7
)
3 T
ech
no
logi
cal r
eso
urc
es
.15
(.0
2)*
.2
0 (
.02
)*
3
78
(3
) 3
33
(4
) 2
93
(2)
39
05
(9)
48
9 (
4)
38
90
(9)
66
0 (6
) 6
2 (1
)
4 M
ark
etin
g re
sou
rces
.2
1 (
.11
) .3
1 (
.05
)*
.40
(.0
6)*
26
0 (
2)
39
4 (3
) 1
59
(1)
13
4 (
1)
29
3 (2
) 4
79
(4)
46
9 (1
)
5 T
ech
no
logy
un
cert
ain
ty
.46
(.0
3)*
.1
5 (
.03
)*
.00
(.0
7)
-.1
2 (
.08
)
87
0 (7
) 8
55
(5)
46
5 (
4)
56
6 (4
) 4
24
(4)
22
7 (2
)
6 M
ark
et u
nce
rtai
nty
.0
9 (
.05
) .0
7 (
.04
) .0
4 (.
07
) -.
11
(.0
6)
.44
(.0
4)*
59
0 (3
) 2
99
(2
) 8
89
(5)
39
4 (3
) 1
65
(1)
7 F
irm
siz
e
.26
(.0
2)*
.1
6 (
.02
)*
.06
(.0
2)*
-.
04
(.1
0)
.05
(.0
4)
.02
(.0
5)
2
93
(2
) 4
36
7 (1
0)
55
5 (4
) 5
39
(3)
8 P
rod
uct
imp
ort
ance
.3
0 (
.03
)*
.20
(.0
4)*
.0
2 (.
06
) .1
3 (
.11
) .1
5 (
.06
)*
.05
(.0
7)
.10
(.0
2)
8
76
(7)
61
8 (8
) 4
29
(5)
9 P
rod
uct
inn
ova
tive
nes
s .2
1 (
.02
)*
.25
(.0
2)*
.2
5 (.
02
)*
.41
(.0
7)*
.1
4 (
.05
)*
.10
(.0
4)*
.2
2 (.
04
)*
.13
(.0
4)*
76
8 (7
) 8
51
(6)
10
Sp
eed
to
mar
ket
.3
7 (
.03
)*
.19
(.0
3)*
.3
5 (.
05
)*
.16
(.0
6)*
.0
9 (
.06
) .1
3 (.
06
)*
.07
(.0
5)
-.1
8 (
.05
)*
.31
(.0
5)*
39
3 (5
)
11
Co
st p
erfo
rman
ce
.26
(.0
3)*
.1
7 (
.05
)*
.36
(.1
5)*
-.
09
(.2
1)
.12
(.0
8)
.25
(.1
0)*
.2
4 (.
06
)*
.01
(.0
6)
.16
(.0
5)*
.1
3 (.
06
)*
* p
< .0
1
Th
e tr
ian
gle
to t
he
low
er l
eft
of
the
dia
gon
al c
on
tain
s th
e av
erag
e co
rrec
ted
co
rrel
atio
ns
('s
) an
d t
he
stan
dar
d d
evia
tio
ns
(s.d
.'s)
are
in p
aren
thes
es.
Th
e tr
ian
gle
to t
he
up
per
left
sh
ow
s th
e to
tal s
amp
le s
izes
(N
s) a
nd
th
e n
um
ber
of
sam
ple
s (k
's, i
n p
aren
thes
es)
fro
m w
hic
h t
he
mea
ns
wer
e d
eriv
ed.

Chapter 2 –Supplier and Customer Involvement in New Product Development: A Meta-Analysis
34
T
AB
LE
2.4
: O
ve
rv
iew
of
An
tec
ed
en
ts a
nd
Co
ns
eq
ue
nc
es
of
Su
pp
lie
r-
an
d C
us
tom
er
In
vo
lve
me
nt
Pe
rfo
rma
nc
e C
on
stru
cts
Su
pp
lie
r
Inv
olv
em
en
t
Cu
sto
me
r
Inv
olv
em
en
t
Pro
du
ct
Inn
ov
ati
ve
ne
ss
Sp
ee
d t
o M
ark
et
Co
st P
erf
orm
an
ce
Pre
dic
tors
β
t
β
t
β
t
β
t
β
t
Tec
hn
olo
gica
l res
ou
rces
.0
4
1.9
1 *
* .0
7
2.5
3 *
**
.07
2
.70
†††
.3
1
12
.71
†††
.4
3
18
.44
†††
Mar
ket
ing
reso
urc
es
.23
1
0.0
0 *
**
.29
1
1.2
5 *
**
.41
1
6.1
3 †
††
-.0
4
-1.5
8
-.3
1
-12
.46
†††
Tec
hn
olo
gy u
nce
rtai
nty
.5
1
22
.24
***
.1
5
5.6
0 *
**
.17
5
.92
†††
-.
18
-6
.31
†††
-.
15
-5
.18
†††
Mar
ket
un
cert
ain
ty
-.1
3
-5.6
6 †
††
.03
1
.00
.0
6
2.5
5 †
† .1
6
6.3
6 †
††
.24
9
.96
†††
Fir
m s
ize
.23
1
1.2
5 †
††
.15
6
.57
†††
.2
3
10
.07
†††
-.
05
-2
.20
††
.13
5
.86
†††
Pro
du
ct im
po
rtan
ce
.18
8
.73
†††
.1
2
5.0
4 †
††
Sup
pli
er in
volv
emen
t
-.
07
-2
.27
††
.46
1
4.8
5 *
**
.26
8
.97
***
Cu
sto
mer
invo
lvem
ent
.08
3
.09
***
-.
08
-2
.87
***
.0
2
.93
***
p <
.01
, **
p <
.05
, * p
< .1
0 (
on
e-si
ded
); †
†† p
< .0
1, †
† p
< .0
5, †
p <
.10
(tw
o-s
ided
); h
arm
on
ic m
ean
= 1
51
3; χ
2 (
4)
= 2
54
.2 (
p <
.01
);
GF
I =
.97
; CF
I =
.94
; NF
I =
.94
; RM
SR =
.04
.

Chapter 2 – Supplier and Customer Involvement in New Product Development: A Meta-Analysis
35
Table 2.4 presents the results. The overall fit statistics of the model are satisfactory:
χ2 = 254.2, d.f. = 4, p < .01; goodness of fit index [GFI] = .97; comparative fit index [CFI]
= .94; normed fit index [NFI] = .94; and root mean square residual [RMSR] = .04.
Hypothesis Testing
Turning to the antecedents of supplier involvement first, we find that internal
technological resources (β = .04, p < .05) and internal marketing resources (β = .23, p
< .01) increase supplier involvement in NPD, confirming hypotheses H1SI and H2SI.
Furthermore, we find that technological uncertainty (β = .51, p < .01) increases supplier
involvement in NPD, confirming H3SI. However, counter to H4SI, market uncertainty (β = -
.13, p < .01) reduces supplier involvement in NPD.
Customer involvement in NPD is positively affected by the focal firm’s internal
technological resources (β = .07, p < .01), its internal marketing resources (β = .29, p
< .01), and the technological uncertainty in its environment (β = .15, p < .01), confirming
hypotheses H1CI, H2CI, and H3CI. We do not find support for the positive effect of market
uncertainty on customer involvement in NPD (H4CI: β = .03, p = .16).
We continue with the consequences side of the model. Interestingly, we find that
supplier involvement in NPD has a negative effect on product innovativeness (β = -.07, p
< .05), counter to what we hypothesized in H5SI. We do find evidence of the hypothesized
positive effect of customer involvement on product innovativeness (β = .08, p < .01),
confirming H5CI. With respect to speed to market, we find support for the hypothesized
positive effect of supplier involvement (H6SI: β = .46, p < .01) and customer involvement
(H6CI: β = -.08, p < .01) in NPD. Lastly, the positive effect of supplier involvement on an
NPD project’s cost performance (β = .26, p < .01) confirms H7SI. In contrast, we do not
find a significant effect of customer involvement on cost performance (H7CI: β = .02, p
= .18).
Robustness Checks
The individual correlations may be affected by idiosyncratic study characteristics.
We explored this issue in depth for the correlations involving our two focal constructs
using the Parametric Adjustability approach (Farley, Lehmann, and Sawyer 1995).
Specifically, we regressed the individual study correlations involving supplier (91

Chapter 2 –Supplier and Customer Involvement in New Product Development: A Meta-Analysis
36
correlations) and customer (80 correlations) involvement on a set of (i) sample, (ii)
study scope, and (iii) publication characteristics. With respect to the sample
characteristics, we examined the effects of type of distribution channel (industrial
versus consumer), industry composition of the sample (single industry versus a mix of
industries), product type (goods versus services), and level of technology (samples with
exclusively high-technology products versus otherwise, following the industry
classification developed by Eurostat of the European Commission). In addition, we
tested for the effect of location of the sample firms (developed versus developing
countries) for a subset of 48 studies on supplier involvement (73 correlations) and a
subset of 32 studies on customer involvement (57 correlations) that disclose country
information. Furthermore, we examined the effects of study scope characteristics. We
tested for the effect of involvement scope (involvement examined for the whole NPD
project versus a part of the NPD project), and external party scope (focus on supplier or
customer involvement versus focus on supplier and customer involvement). Lastly, we
examined the effects of publication characteristics: publication year, outlet (top tier
versus other), and academic field (marketing versus strategy versus operations and
supply chain versus innovation and technology). We controlled for the constructs
related to customer and supplier involvement using dummy variables. Specifically, we
regress the variables discussed above on the Fisher’s z-coefficients by estimating the
following equations:
(6) �� = � + ∑ ���� �� + ∑ ����� ��
��� + ���
(7) �� = � + ∑ ���� �� + ∑ ����� ��
��� + ���
where �� and �� are the z-transformed correlations between supplier (customer)
involvement and their antecedent or consequence construct i in study j; � and � are
intercepts, � , �� , �, and �� are the parameters to be estimated, �� are dummy variable
matrices that specify which antecedent or consequence construct is related to supplier
(customer) involvement, ��� are the variable matrices of the moderators discussed
above, and ��� and ���are the residual terms. For the models specifying correlations with
supplier involvement, none of the study characteristics were significant at the .05 level.
For the models specifying correlations with customer involvement, only one of the
study characteristics was significant at the .05 level. Specifically, the correlations

Chapter 2 – Supplier and Customer Involvement in New Product Development: A Meta-Analysis
37
between customer involvement and its antecedents and consequences are weaker for
samples based on goods than those for services (b = -.26, p = .04).
2.7 DISCUSSION
Our study provides insight into the antecedents and consequences of supplier and
customer involvement in NPD. Analyzing data obtained from 119 independent samples
reported in 140 studies, we show how a firm’s internal technological and marketing
resources influence the involvement of suppliers and customers in the firm’s internal
NPD projects. In addition, we show how supplier and customer involvement improve or
deteriorate three dimensions of NPD performance.
Implications for Theory
In terms of antecedents, we find that firms with stronger technological and
marketing resource bases demonstrate higher levels of supplier and customer
involvement in NPD. Rather than using externally obtained resources as substitutes for
lacking internal resources, our results suggest that high levels of firms’ internal
resources increase their access to external resources. Marketing resources have
stronger effects on the involvement of suppliers (β2 = .23) and customers (γ2 = .29) in
NPD than technological resources do (β1 = .04 and γ1 = .07, respectively). This suggests
that internal marketing assets and skills increase the value of externally obtained
resources to a larger extent than internal technological assets and skills do.
Further, we find that technological uncertainty stimulates firms to involve suppliers
and, to a lesser extent, customers. This suggests that firms try to deal with a
technologically turbulent environment by increasing their technological options (by
involving suppliers) and by obtaining technological directions from the market (by
involving customers). Contrary to our expectations, firms reduce their use of supplier
involvement under conditions of market uncertainty. A possible explanation is that
uncertain customer needs and preferences increase a firm’s difficulty of articulating the
necessary external technological assistance, which may hamper the use of supplier
involvement in NPD (Salvador and Villena 2013). An alternative explanation is that
firms develop a stronger technology orientation as a result of supplier involvement in
NPD. A strong technology orientation pre-empts a fast market response to changing
customer needs (Gatignon and Xuereb 1997), which makes supplier involvement a less

Chapter 2 –Supplier and Customer Involvement in New Product Development: A Meta-Analysis
38
attractive strategy. From the perspective of the supplier, one could argue that increased
market uncertainty in an industry might reduce the supplier’s willingness to become
closely involved in the NPD project of one particular firm, because participation in one
firm’s NPD would strengthen the relationship with that specific firm and reduce the
supplier’s future strategic flexibility.
While controlling for the direct effects of firm resources and environmental
uncertainty, we find that both supplier and customer involvement affect NPD
performance. Importantly, the effects of supplier involvement on NPD performance
differ from the effects of customer involvement on NPD performance. Thus, the type of
external party involved matters in NPD. Future research should therefore always take
into account the nature of the external party when investigating the benefits of
externally sourced resources in NPD contexts. Failing to differentiate between suppliers
and customers (as in, e.g., Faems, Van Looy, and Debackere 2005; Jung and Wang 2006;
Kessler, Bierly, and Gopalakrishnan 2000; McNally, Akdeniz, and Calantone 2011)
potentially leads to misleading results.
Furthermore, we find that the involvement of suppliers and customers in NPD has
different effects on different dimensions of NPD performance. Specifically, supplier
involvement positively affects speed to market and cost performance, but negatively
affects product innovativeness. The latter finding is somewhat unexpected: although
prior research has repeatedly argued that supplier involvement should lead to
increased product innovativeness because of the sourcing of new technological
knowledge, the results of our meta-analysis suggest that involved suppliers take over
work, thereby saving money and increasing speed to market, but do not enrich a project
technologically with innovative inputs. Future research may further examine in which
conditions involved suppliers could improve the innovativeness of new products.
With regard to customer involvement, the results suggest a trade-off between
higher product innovativeness and lower speed to market. To reflect these trade-offs,
researchers examining NPD success are advised to investigate multiple dimensions of
performance in combination (e.g., Atuahene-Gima 2003; Fang 2008), instead of focusing
on one aspect of NPD performance only (e.g., Allocca and Kessler 2006; Feng et al. 2012).
Not only does the use of multiple performance measures reflect the multifaceted nature

Chapter 2 – Supplier and Customer Involvement in New Product Development: A Meta-Analysis
39
of NPD success (Griffin and Page 1996), it increases the measurement precision of data
collection efforts (Silk and Kalwani 1982). By structuring the assessment task into
multiple dimensions, the complexity of key informants’ evaluation task is reduced,
decreasing measurement error (Silk and Kalwani 1982).
Finally, the positive effect of customer involvement on product innovativeness
deserves to be emphasized. The benefits of involving customers in innovation have not
always been evident. Many captains of industry have questioned the use of listening to
customers during the development of new products. To quote Steve Jobs, the late co-
founder and former CEO of Apple Inc., “A lot of times, people don’t know what they want
until you show it to them.” He was not the first to ignore customer inputs. Henry Ford
said: “If I’d listened to customers, I’d have given them a faster horse.” These beliefs have
been reflected in extant research on strategic orientations, which finds that being
customer oriented negatively affects the innovativeness of new products (e.g., Gatignon
and Xuereb 1997; Im and Workman 2004). Our meta-analysis shows that involving
customers in NPD increases the innovativeness of newly developed products. This
finding shows that letting customers participate in the NPD project is of a different
nature than merely listening to customers or having a customer orientation, and that
customers can contribute to the development of innovative products.
Managerial Implications
This study offers three key takeaways for managers:
Takeaway 1: Plan supplier and customer involvement differently, depending on
objectives. In case a project development team strives for innovative outputs, let
customers rather than suppliers participate. For products that require to be introduced
on the market fast, involve suppliers and refrain from the participation of customers. In
case product development is under cost pressure, consider involving suppliers and let
them take over development tasks.
Takeaway 2: Take into account the trade-offs associated with involving suppliers and
customers in NPD projects. Involving suppliers contributes to fast market introductions
and efficient development processes but lowers the innovativeness of the product
developed. Involving customers contributes to increasing product innovativeness but
slows down the speed to market.
Chapter 2 –Supplier and Customer Involvement in New Product Development: A Meta-Analysis
40
Takeaway 3: The internal resource base and external environment influence the
attractiveness of involving suppliers and customers. The stronger the internal
technological and marketing resource bases of a firm are, the more that firm implements
supplier and customer involvement in NPD projects. Furthermore, a firm’s environment
influences the involvement of suppliers and customers in NPD. Specifically, uncertain
technological environments contribute to the involvement of suppliers and customers,
whereas uncertain market environments lower the involvement of suppliers in an
internal NPD project.
Limitations and Future Research Suggestions
Our study has limitations, a number of which offer opportunities for future
research. First, our meta-analysis is restricted to the constructs measured in extant
studies. While it is also interesting to investigate the effects of a firm’s strategic
orientation on supplier and customer involvement, this is not possible in the current
study due to the lack of primary research. Second, the constructs of technological and
marketing resources have been defined rather broadly, which is common in meta-
analysis. Future empirical research could improve our understanding of the impact of
firm resources on the involvement of suppliers and customers by taking a more fine-
grained perspective by distinguishing between different types of technological and
marketing resources.
Meta-analysis takes stock of the knowledge available about a topic. The ultimate
goal of meta-analysis is to give directions for future research. The current meta-analysis,
like many of the collected empirical studies, took the point of view of the focal firm: the
antecedents as well as the consequences of supplier and customer involvement in NPD
were studied from the perspective of the developing firm. Future research could extend
our understanding of supplier and customer involvement by taking the perspective of
the involved party: What are the characteristics of suppliers and customers that make
them fit for involvement in an NPD project? For example, does a supplier’s customer
orientation improve its value as an external resource in an NPD project, or is a
technology orientation more beneficial? In addition, characteristics of the relationship
between the focal firm and the involved party, such as the length of the relationship,
trust, and dependence, could enrich the current state of knowledge.
Chapter 2 – Supplier and Customer Involvement in New Product Development: A Meta-Analysis
41
The current meta-analysis shows that supplier/customer involvement in NPD
has different effects on product innovativeness, speed to market, and cost performance.
Future studies on supplier and customer involvement could extend these insights by
focusing on other outcomes, such as knowledge transfer to the focal firm, firm image,
relational consequences, and market performance of the new product.
In addition, and as is commonplace in meta-analytical work, the model estimated
main effects of supplier and customer involvement on the three dependent variables. It
is conceivable that involving both suppliers and customers simultaneously leads to
additional benefits/downsides not accounted for by this additive model. For example,
market insights offered by involved suppliers could be verified by participating
customers. Similarly, the technological feasibility of market opportunities emerging as a
result of involving customers can be directly explored using resources of involved
suppliers. Unfortunately, none of the 31 samples included in the data set measuring
both supplier and customer involvement has been analyzed with an interaction term
between the two involvement variables, such that the data offered by these studies does
not allow the further analysis of interaction effects of supplier involvement * customer
involvement on the three dependent variables. Given that involving external parties is
an increasingly used business practice, future research should examine the interaction
effects of involving multiple types of external parties.
On a similar note, it is interesting to test curvilinear effects of a firm’s resources
on its use of supplier/customer involvement. Possibly, the positive effects of internal
firm resources on the use of supplier/customer involvement become weaker when
firms have very strong resource positions. In such cases, a firm might be able but not
need to involve suppliers/customers in its NPD process. A comparable issue pertains to
possible curvilinear effects of supplier and customer involvement on performance. Very
high levels of supplier and customer involvements could cause firms to focus too hard
on the currently available technologies of suppliers and currently immediate needs of
customers, which could blind firms to future challenges and opportunities, lowering
product innovativeness. Unfortunately, the data offered by extant research does not
allow an empirical test of quadratic effects of supplier and customer involvement
(Williams and Livingstone 1994). Future research on supplier and customer
involvement could extend the state of the literature by studying non-linear patterns.

Chapter 2 –Supplier and Customer Involvement in New Product Development: A Meta-Analysis
42
A related issue is the effect of combining high technology and marketing resource
levels with the development of strong supplier and customer relationships, which
follows from our theory. Combining both high levels of internal resources and external
relationships may negatively affect a firm’s profitability. Unfortunately, we lack the
necessary data for an empirical test. Future research could extend our understanding of
the combination of involving supplier and customer involvement with resource
positions.
In the current study, we find that involving suppliers has different effects on NPD
performance than involving customers. This finding has a number of implications for
further research. First, future research on external party participation in NPD should
distinguish between the various parties involved. In several cases, authors of prior
studies could contribute to the literature simply by reanalyzing existing data sets on
external party involvement and presenting their findings per type of party. In addition,
future research could extend its theoretical lens by examining the involvement of other
types of external parties, such as competitors, research institutes and universities, and
consultants.
Second, these findings have implications for research on product development
for business markets. In these markets, the relationship between two parties often
includes more than one role, and thus is ‘compound’ (Ross and Robertson 2007) or
‘multiplex’ (Tuli, Bharadwaj, and Kohli 2010): a customer may also be a partner of, a
competitor against, or even a supplier to the same firm. Given our finding that the
effects of involving a customer differ from the effects of involving a supplier, what are
the effects of involving a customer that also is a supplier to the firm? In a similar vein,
should firms involve customers that are also their partners, or their competitors? We
will take up this issue in Chapter 3 of this dissertation.
Third, the finding that the role of the party involved is important for managing
NPD is interesting in the light of current developments in open innovation. Increasingly,
NPD projects are opened up to the “crowd”: an undefined group of individuals external
to the firm that generate ideas (Howe 2006, 2008; Poetz and Schreier 2012). In these
crowdsourcing settings, the relationship of the involved party with the focal firm
disappears: especially external parties without a relationship with the focal firm are

Chapter 2 – Supplier and Customer Involvement in New Product Development: A Meta-Analysis
43
targeted to contribute to the NPD project. Thus, as a result of crowdsourcing, a new type
of external party emerges. An emerging issue for future research is, then: what
influences the effectiveness of crowdsourcing, or, formulated differently, how to
manage the crowd? This question is central to Chapter 4 of this dissertation.

Chapter 2 –Supplier and Customer Involvement in New Product Development: A Meta-Analysis
44
APPENDIX: List of Studies Included in the Meta-Analysis
Reference1 Journal2
Sample
size
Industries
in sample3
Level of
technology 3,4
Data on
supplier
involvement
Data on
customer
involvement
Allocca & Kessler 2006 C&IM 158 mix 2-4 x
Al-Zu'bi & Tsinopoulos 2012 JPIM 313 n.s. n.s. x x
Atuahene-Gima 2003 AMJ 104 mix 4
x
Bidault, Depres, & Butler 1998 IJTM 24 mix 3 x
Bonner 2010 IMM 134 mix 1-4
x
Brettel & Cleven 2011 C&IM 254 mix 3-4 x x
Callahan & Lasry 2004 R&DM 55 single 4
x
Callahan & Moretton 2001 IJPM 44 single 4 x
Carbonell, Rodríguez-Escudero, & Pujari 2009
JPIM 102 mix 1-4
x
Carr et al. 2008 IJO&PM 166 n.s. n.s. x
Chen & Paulraj 2004 JOM 138 mix 3-4 x
Chen, Li, & Evans 2012 IMM 159 single 4
x
Chien & Chen 2010 SIJ 125 single 2 x x
Corsten & Felde 2005 IJPD&LM 135 single 3 x
Dabhilkar et al. 2009 JP&SM 136 mix 3-4 x
Danese & Filippini 2010 IJO&PM 186 mix 3-4 x
Das, Narasimhan, & Talluri 2006 JOM 322 mix 3-4 x
Dowlatshahi & Contreras 1999 IJPR 171 mix 3-4 x
Dröge, Jayaram, & Vickery 2000; Scannell, Vickery, & Dröge 2000; Vickery et al. 2003; Dröge, Jayaram, & Vickery 2004; Jayaram, Vickery, & Dröge 2008
JPIM; JBL; JOM; JOM; JOM
57 single 3 x
Dvir et al. 2003 IJM&DM 117 mix 3-4
x
Eisenhardt & Tabrizi 1995 ASQ 72 single 4 x
Ellis, Henke, & Kull 2012 IMM 233 single 3 x
Fang 2008 JM 134 mix 3-4
x
Fang, Palmatier, & Evans 2008 JAMS 188 mix 3-4
x
Feng et al. 2012 IMM 176 mix 1-4
x
Feng, Sun, & Zhang 2010 IMM 139 mix 2-4 x x
Fillippini, Salmaso, & Tessarolo 2004
JPIM 85 mix 3 x x
Flynn, Schroeder, & Sakakibara 1994
JOM 42 mix 3-4
x
Gales & Mansour-Cole 1995 JE&TM 44 single 3
x
González & Palacios 2002 IMM 54 mix 3-4
x
González-Benito, Da Rocha, & Queiruga 2010
IJPE 96 mix 3 x
Griffith, Harmancioglu, & Dröge 2009
JWB 200 mix 1-4 x
Gruber et al. 2010 SMJ 130 mix 3-4
x
Gulati & Sytch 2007 ASQ 151 single 3 x
Handfield et al. 2009 IJO&PM 151 mix 3-4 x

Chapter 2 – Supplier and Customer Involvement in New Product Development: A Meta-Analysis
45
APPENDIX: List of Studies Included in the Meta-Analysis – continued
Reference1 Journal2
Sample
size
Industries
in sample3
Level of
technology 3,4
Data on
supplier
involvement
Data on
customer
involvement
Hartley, Zirger, & Kamath 1997; Hartley et al. 1997*
JOM; ITEM
79 mix 3-4 x
Hoegl & Wagner 2005 JMAN 28 mix 4 x
Hong & Hartley 2011 JSCM 313 mix 3-4 x
Inemek & Matthyssens 2013 IMM 189 mix 1-4 x
Ittner & Larcker 1997a; Ittner & Larcker 1997b; Ittner & Larcker 1995*
JMR; MANSCI;
JAR;
184; 249; 184
single 3-4 x x
Jayaram 2008 IJPR 338 mix 3-4 x
Jean, Sinkovics, & Hiebaum 2013 JPIM 170 single 3 x
Joshi & Stump 1999 JAMS 184 mix 3-4 x
Knudsen 2007 JPIM 210+207 n.s. n.s. x x
Koufteros, Cheng, & Lai 2007 JOM 157 mix 2-4 x
Koufteros, Rawski, & Rupak 2010 DS 191 single 3 x x
Koufteros, Vonderembse, & Jayaram 2005
DS 244 mix 3-4 x x
Laamanen 2005 RP 85 single 4
x
Lai et al. 2011 TA&SM 126 n.s. n.s. x x
Lakshman & Parente 2008 JMS 136 single 3 x
Langerak & Hultink 2005 ITEM 233 mix 3-4 x x
Langerak & Hultink 2008 JE&TM 93+122 mix 3-4 x
Langerak, Rijsdijk, & Dittrich 2009
ML 129 single 2
x
Lau, Tang, & Yam 2010; Lau, Yam, & Tang 2010; Lau, Yam, & Tang 2007*
JPIM; JPIM;
IM&DS 251 mix 2-4 x x
Lawson et al. 2009; Cousins et al. 2011
JPIM; JPIM
111 mix 2-4 x
Li et al. 2007 IJPE 142 single 4 x
Liker, Kamath, & Wasti 1998 IJQS 365 single 3 x
Lin & Germain 2004 EMJ 191 mix 1-3
x
Lin & Huang 2013 JB&IM 179 single 4
x
Lin et al. 2005 IJPE 103+109 mix 3 x
Maylor 2001; Maylor 1997*
OME; IJO&PM
46 n.s. n.s. x x
Millson & Wilemon 2002; Millson & Wilemon 2006
IMM; TECH
118; 58
mix 3-4 x x
Mishra & Shah 2009 JOM 189 mix 3-4 x x Naor et al. 2008; Kristal, Huang, & Schroeder 2010; Luo, Mallick, & Schroeder 2010; Peng et al. 2013
DS; IJO&PM;
EJIM; JSCM
189; 167; 189; 155
mix 3-4 x x
Nassimbeni 1996; De Toni & Nassimbeni 1999* De Toni & Nassimbeni 2000
IJPE; IJPR; OME
50 mix 3-4 x
Naveh 2005; Naveh 2007
IJPR; JOM
62 single 4 x

Chapter 2 –Supplier and Customer Involvement in New Product Development: A Meta-Analysis
46
APPENDIX: List of Studies Included in the Meta-Analysis – continued
Reference1 Journal2
Sample
size
Industries
in sample3
Level of
technology 3,4
Data on
supplier
involvement
Data on
customer
involvement
Nieto & Santamaría 2007 TECH 1300 mix 1-4 x x
Nijssen et al. 2012 JPIM 136 mix 3-4
x
O'Cass & Ngo 2012; Ngo & O'Cass 2013
IMM; JBR
155 mix 1-3
x
Parker, Zsidisin, & Ragatz 2008 JSCM 116 mix 3-4 x
Perols, Zimmerman, & Kortmann 2013
JOM 116 mix 3-4 x
Petersen, Handfield, & Ragatz 2003
JPIM 88 mix 1-4 x
Phan, Abdallah, & Matsui 2011 IJPE 27 mix 3-4
x
Potter & Lawson 2013 JPIM 119 mix 3-4 x
Primo & Amundson 2002 JOM 38 single 4 x
Pujari 2006 TECH 66 mix 1-4 x
Pujari, Wright, & Peattie 2003 JBR 151 n.s. n.s. x
Quesada, Syamil, & Doll 2006 JSCM 406 single 3 x
Ragatz, Handfield, & Petersen 2002
JBR 83 n.s. n.s. x
Ramaswami, Srivastava, & Bhargava 2009
JAMS 88 mix n.s. x x
Ritter & Walter 2003 IJTM 233 mix 3-4
x
Salvador & Villena 2013 JSCM 165 mix 3-4 x
Sánchez & Pérez 2003a; Sánchez & Pérez 2003b
TECH; JPIM
60; 63
single 3 x
Sethi 2000 JM 141 mix 1-3
x
Sherman, Souder, & Jenssen 2000 JPIM 65 mix 4 x x
Sing & Power 2009 SCM 418 n.s. n.s. x
Sobrero & Roberts 2001; Sobrero & Roberts 2002*
MANSCI; RP
50 single 3 x
Song & Di Benedetto 2008 JOM 173 mix 3-4 x
Song & Thieme 2009 JPIM 205+110 mix 3-4 x
Souder, Sherman, & Davies-Cooper 1998
JPIM 101 mix 4
x
Spina, Verganti, & Zotteri 2002 IJO&PM 67 mix 3-4 x
Stock & Zacharias 2013 JPIM 180 mix 3-4
x
Stuart 1993 IJPMM 240 n.s. n.s. x
Stump, Athaide, & Joshi 2002; Athaide, Stump, & Joshi 2003; Athaide & Zhang 2011
JPIM; JMT&P;
JPIM 296 mix 4
x
Swink 1999 JOM 91 mix 3-4 x
Swink, Narasimhan, & Wang 2007; Narasimhan, Swink, & Viswanathan 2010*
JOM; DS
224 mix 2-4 x x
Takeishi 2001; Takeishi 2002*
SMJ; OS
45 single 3 x
Tan & Tracey 2007 JSCM 175 n.s. n.s. x
Tavani et al. 2013 IJPR 161 mix 1-4 x

Chapter 2 – Supplier and Customer Involvement in New Product Development: A Meta-Analysis
47
APPENDIX: List of Studies Included in the Meta-Analysis – continued
Reference1 Journal2
Sample
size
Industries
in sample3
Level of
technology 3,4
Data on
supplier
involvement
Data on
customer
involvement
Tomlinson 2010 RP 436 mix 1-4 x x
Tracey & Tan 2001; Tracey 2004
SCM; JSCM
180 n.s. n.s. x
Tsai 2009 RP 753 mix 1-4 x x
Un, Cuerzo-Cazurra, & Asawaka 2010
JPIM 781 n.s. n.s. x x
Vonderembse & Tracey 1999 JSCM 268 n.s. n.s. x
Wagner 2012 JSCM 67 mix 3-4 x
Walker 1994 OS 95 mix 3 x
Walter 2003 JBR 247 mix n.s. x
Wasti & Liker 1997 JPIM 122 single 3 x
Wasti & Liker 1999 TEM 174 single 3 x
Wu & Ragatz 2010 IJISM 124 mix 3-4 x
Wynstra et al. 2012 JPIM 185 mix 3-4 x
Wynstra, Von Corswant, & Wetzels 2010
JPIM 161 single 4 x
Zhang, Henke, & Griffith 2009 JOM 2012 single 3 x
Zirger & Hartley 1996 ITEM 44 mix 4 x
1 Studies with a (partially) overlapping sample are grouped together
2 AMJ = Acad of Man't J; ASQ = Adm Sci Quarterly; C&IM = Creativity & Innovation Man't; DS = Decision Sciences; EJIM = Eur J of Innovation Man't; EMJ = Eur Man't J; ITEM = IEEE Transactions on Eng Man't; IM&DS = Ind Man't & Data Systems; IMM = Ind Marketing Man't; IJISM = Int J of Integrated Supply Man't; IJM&DM = Int J of Man't & Decision Making; IJO&PM = Int J of Operations & Prod Man't; IJPD&LM = Int J of Physical Distr & Logistics Man't; IJPE = Int J of Prod Econ; IJPR = Int J of Prod Res; IJPM = Int J of Project Man't; IJPMM = Int J of Purch & Materials Man't; IJQS = Int J of Quality Sci; IJTM = Int J of Tech Man't; JAR = J of Accounting Res; JB&IM = J of Bus & Ind Marketing; JBL = J of Bus Logistics; JBR = J of Bus Res; JE&TM = J of Eng & Tech Man't; JMAN = J of Man't; JMS = J of Man't Studies; JM = J of Marketing; JMR = J of Marketing Res; JMT&P = J of Marketing Theory & Practice; JOM = J of Operations Man't; JPIM = J of Product Innovation Man't; JP&SM = J of Purch & Supply Man't; JSCM = J of Supply Chain Man't; JAMS = J of the Acad of Marketing Sci; JWB = J of World Bus; MANSCI = Man't Sci; ML = Marketing Letters; OME = Omega; OS = Org Sci; R&DM = R&D Man't; RP = Res Policy; SIJ = Service Industries J; SMJ = Strat Man't J; SCM = Supply Chain Man't; TA&SM = Tech Analysis & Strat Man't; TECH = Technovation 3 n.s. = not specified 4 1 = low technology; 2 = medium-low technology; 3 = medium-high technology; 4 = high technology; following the classification of Eurostat (European Commission) * These studies did not add new information over and above the other studies reporting on the same sample and are therefore excluded from the meta-analysis

49
“But it’s no use now,” thought poor Alice,
“to pretend to be two people!
Why, there’s hardly enough of me left to make one respectable person!”
Lewis Carroll, Alice’s Adventures in Wonderland, Chapter 1
Chapter 3
The Effect of Customer Participation
in Outsourced NPD on Supplier Task Performance:
The Role of Relationship Multiplexity3
3.1 INTRODUCTION
In a wide variety of business markets, such as aerospace, automotive, chemicals,
ICT, and software, firms increasingly outsource new product development (NPD)
activities to external suppliers (Engardio and Einhorn 2005). Business customers are
typically highly knowledgeable (Appleyard 2002) and may start thinking of technology
solutions themselves beyond merely expressing their technology needs to the supplier
(Urban and von Hippel 1988). As a consequence, they regularly participate in the
supplier’s NPD process. For example, Airbus has outsourced the development of engines
for its new A350-1000 model to Rolls-Royce, but is a close participant in Rolls-Royce’s
fundamental research program to develop new materials for the engine. Similarly, Volvo
has outsourced the development of its electric motor to Siemens, but instead of being a
passive buyer, it closely participates in the electric motor’s inverter design.
3 We sincerely thank the executives and the project managers who participated in the interviews and the survey for sharing their time and insights. Furthermore, we gratefully acknowledge the financial support that was received from the Institute for the Study of Business Markets at the Pennsylvania State University.

Chapter 3 – Customer Participation in Outsourced NPD: The Role of Relationship Multiplexity
50
The growing popularity of customer participation is reflected in the academic
literature, which falls into two research streams. The first stream focuses on co-
production by consumers and has largely reported positive effects of customer
participation, e.g. on customer value (Chan, Yim, and Lam 2010) and customer
satisfaction with the firm (Franke, Schreier, and Kaiser 2010; Troye and Supphellen
2012). The second stream, which focuses on industrial customers’ participation in
suppliers’ NPD processes, has established that customer participation is beneficial on
average (Fang, Palmatier, and Evans 2008) but does not always lead to desirable
outcomes (Fang 2008). As both research streams focus on ‘markets of many,’ they are
silent on a key complicating feature of customer participation in ‘markets of one.’ In
markets of one, where a single customer outsources an NPD project to an external
supplier, the relationship between customer and supplier often includes more than one
role, and thus is ‘compound’ (Ross and Robertson 2007) or ‘multiplex’ (Tuli, Bharadwaj,
and Kohli 2010): a customer firm may also be a partner of, a competitor against, or even
a supplier to its supplier firm. Roundtable discussions with executives from three high-
tech firms underscore that firms struggle with the question whether to involve
customers in the NPD process when these customers also play other roles. The
marketing director of a large contract R&D firm conveyed that sentiment as follows:
“I am not sure whether we should allow customer X to participate in the NPD
process, as we also compete against each other. […] Should we let customer Y
participate in the development process, as they are also our partner in a
consortium? I don’t know. […] I believe the other roles played by our customers
in relation to our firm may matter and should be taken into account when we
decide on customer participation.”
The main goal of this essay is to investigate how customer participation in
outsourced NPD affects supplier task performance for multiplex relationships. The
study makes the following contributions. First, we address recent calls for examining
customer integration in the innovation process (ISBM Research Priorities 2012; MSI
Research Priorities 2010-2012). The general hypothesis that emerges from the extant
literature is that customer participation in NPD is beneficial. However, previous
empirical research has not been unequivocally supportive of the positive effects of
customer participation (e.g., Stump, Athaide, and Joshi 2002). Following up on Fang,
Palmatier, and Evans’ (2008, p. 334) call that “future research should also investigate
Chapter 3 – Customer Participation in Outsourced NPD: The Role of Relationship Multiplexity
51
the conditions when customer participation negatively affects performance,” we build a
contingency framework and systematically analyze when customer participation helps
or hurts.
Second, extant research on customer participation analyzes a single tie between the
customer and the supplier (e.g., Fang 2008; Noordhoff et al. 2011), whereas we
incorporate the multiplex nature of customer-supplier relationships. Specifically, we
theorize and test how relationship multiplexity moderates the effect of customer
participation on supplier task performance, a key outcome in outsourced NPD projects
(cf. Carson 2007). Research on role theory forms the theoretical basis for our
examination. Following Ross and Robertson (2007), we distinguish between three types
of multiplexity. First, we consider customer-as-partner multiplexity, the situation where
a customer that participates in the supplier’s NPD process simultaneously shares
partner ties with the supplier. Second, we study customer-as-competitor multiplexity,
which occurs when the participating customer also competes with the supplier. Third,
we examine customer-as-supplier multiplexity, which happens when the participating
customer shares role-reversal ties with the supplier such that the customer and the
supplier also face each other in reversed roles. We extend the Ross and Robertson
(2007) framework by distinguishing between two sub-types of partnerships, viz. self-
initiated partnerships and engineered partnerships (Doz, Olk, and Ring 2000; Koza and
Lewin 1999). Although both are in use in technology development and innovation,
extant marketing research has not distinguished between them. By examining the
interplay between customer participation and three types of multiplex relationships, we
also address recent calls for more research on relationship multiplexity (e.g., Lilien et al.
2010; Rindfleisch et al. 2010; Ross and Robertson 2007; Tuli, Bharadwaj, and Kohli
2010).
Finally, we test our hypotheses regarding the effects of customer participation on
supplier task performance at both sides of the customer-supplier dyad. First, we
examine the customer’s perception of supplier task performance, as a function of its
participation in the NPD project and the multiplexity of its relationship with the
supplier. Next, we compare the results for the customer with the results for the
supplier’s self-reported task performance. By incorporating both the evaluations of the
customer and the supplier in the analysis, we do not presume consensus about supplier
Chapter 3 – Customer Participation in Outsourced NPD: The Role of Relationship Multiplexity
52
task performance across the dyad (see Rokkan, Heide, and Wathne 2003 for a similar
practice). Any differential effects of customer participation on the customer’s versus the
supplier’s perception of supplier task performance may have important implications for
how to manage customer participation in NPD. For example, even if customer
participation does not affect the supplier’s self-reported task performance, the supplier
may still want to involve the customer if doing so improves the customer’s perception of
supplier task performance, as this may create opportunities for future business.
To test our hypotheses, we assembled a unique, proprietary data set on 140
outsourced NPD projects. Our data set combines multiple sources of archival data,
including project administration records, project evaluation reports, strategic
cooperation plans, and procurement records. We supplement these data with survey
data gathered specifically for this study, and key insights taken from three roundtable
discussions with senior executives and eighteen in-depth interviews with project
managers.
The remainder of this essay is organized as follows. First, we advance our
conceptual framework and we present hypotheses. Next, we describe the empirical
context and the data collection procedures, followed by the method and results. The
final section discusses implications for researchers and managers, and provides
suggestions for further research.
3.2 CONCEPTUAL BACKGROUND
Following Fang (2008, p. 91), we define customer participation as “the extent to
which the customer is involved in the manufacturer’s NPD process.” The specific context
of this study is an outsourcing customer’s involvement in the executing supplier’s NPD
process. Customer participation in outsourced NPD projects varies in terms of the
activities performed and can range from fundamental research over product design to
prototype testing. Customer participation also varies in terms of the intensity with
which those activities are performed by the customer (Appleyard 2002; Fang 2008).
Sometimes, customers provide mere assistance in tasks mainly executed by the supplier;
in other situations, customers play a more central role in the NPD process (Fang,
Palmatier, and Evans 2008).

Chapter 3 – Customer Participation in Outsourced NPD: The Role of Relationship Multiplexity
53
Although the potential benefits of customer participation have been well
articulated in the business press, customer participation may not always be beneficial.
Fang (2008) has taken a first step to follow up on his and his colleagues’ call for
research on the conditions when customer participation negatively affects performance
(Fang, Palmatier, and Evans 2008, p. 334) by studying, among others, the moderating
role of downstream network connectivity. A key difference in our approach is that, in
contrast to Fang who studies ‘markets of many,’ we study ‘markets of one.’ Such a
context, where the participating customer constitutes the ‘market,’ requires a shift in
focus from downstream connectivity (the relationship between the customer and its
distributors) to upstream connectivity (the relationship between the customer and the
supplier). In outsourced NPD, that relationship often extends beyond the tie in which
the customer participates in the supplier’s NPD process, as the customer and the
supplier may also share other ties with each other in which both parties play different
roles. We argue that the effect of customer participation on supplier task performance is
contingent on the types of ties constituting the multiplex relationship between the
supplier and the customer.
We use role theory to argue how relationship multiplexity moderates the effect of
customer participation in outsourced NPD on supplier task performance. Role theory is
the study of characteristic behavioral patterns (roles) of actors within contexts (Biddle
1986; Katz and Kahn 1966). The roles that are played are evoked by the situation in
which actors find themselves. Based on the role of an actor, specific behavioral
expectations are formed (Biddle 1986) – sometimes also referred to as rules
(Montgomery 1998) or norms (Heide and John 1992) – that serve as explanations for
behavior. In the context of our study, the behavioral expectations associated with the
role of a participating customer in outsourced NPD relate to the sharing of various
resources with the developing supplier, including intangible resources such as
information, expertise, and human capital, as well as tangible resources such as
materials and equipment (Campbell and Cooper 1999; Fang 2008).
A largely unaddressed issue in role theory pertains to the specific way in which the
roles played in different ties may affect one another. To address this issue, we rely on a
branch of role theory that has recently received attention in the marketing literature,
viz. functional role theory (Heide and Wathne 2006). In functional role theory, the
Chapter 3 – Customer Participation in Outsourced NPD: The Role of Relationship Multiplexity
54
‘identity’ of an actor is based on his position within a social system, i.e. the function of
the actor (Biddle 1986). In our context, the use of terms such as ‘customer,’ ‘partner,’
‘competitor,’ and ‘supplier’ are applications of functional role theory (cf. Heide and
Wathne 2006). Building on functional role theory, and in line with Ross and Robertson
(2007), we distinguish between three types of relationship multiplexity: customer-as-
partner multiplexity (when the participating customer also shares partner ties with the
supplier), customer-as-competitor multiplexity (when the participating customer also
shares a competitor tie with the supplier), and customer-as-supplier multiplexity (when
the participating customer also shares role-reversal ties with the supplier).
3.3 THEORY AND HYPOTHESES
Examining customer participation from a relationship multiplexity perspective
moves our research into uncharted territory. To ground our approach in managerial
practice, a qualitative pre-phase preceded the development of the hypotheses.
Grounded Theory Development
To get more insight into the effects of customer participation in multiplex
relationships, we held three roundtable discussions with senior executives in general
management, marketing, and R&D, and we conducted eighteen in-depth interviews with
project managers who led NPD projects for their respective firms. To capture a broad
set of perspectives, we selected interviewees from three firms in different industries
(aerospace, IT system development, and photolithography), with annual revenues
ranging from $85 million to $8.5 billion. On average, the roundtables lasted ninety
minutes and the in-depth interviews lasted fifty minutes.
The roundtable discussions underscored that customer participation in outsourced
NPD is a pervasive phenomenon and that customers are increasingly pushing suppliers
for increased participation in their outsourced NPD projects. From these roundtables, it
further became clear that the concerns the executives expressed centered on whether
or not they should let customers participate if these customers also fulfilled other roles.
Several interviewees indicated that they were inclined to let partners participate.
When asked why, they indicated “because they are frequently at our premises anyway.”
That said, they added that they were unsure whether this was the right strategy.

Chapter 3 – Customer Participation in Outsourced NPD: The Role of Relationship Multiplexity
55
Opinions diverged with regard to the consequences of participation by a competing
customer. Some interviewees argued that “it seems wise to keep competitors at a
distance” and “we tend not to involve competing customers in their outsourced NPD
projects – why enlighten them more than is absolutely necessary?” This belief stands in
direct contrast with other interviewees noting just the opposite: “we don’t mind
involving competitors, as they will get to learn the technologies and knowledge we
develop sooner or later anyway. However, competitors need to bring something to the
table as well – it’s not a one-way street.” With regard to participation by customers that
also play a supplier role, one interviewee explained that “it signals our intent to
strengthen and deepen our relationship with this important stakeholder,” while also
pointing to a potential problem: “A bad experience with the customer in its supplier role
may negatively affect the way we deal with it in its participating-customer role […], a
situation we should try to avoid because termination of the customer relationship
would imply a lose-lose situation.”
In sum, the roundtable discussions and in-depth interviews in this qualitative pre-
phase underscore that (1) relationship multiplexity is a pervasive phenomenon in the
context of customer participation in outsourced NPD, and (2) managers are either
unsure or do not converge on whether or not they should let customers participate if
these customers also fulfill other roles.
Hypotheses Development
Next, we build hypotheses on how customer participation affects supplier task
performance. Specifically, we draw on role theory to hypothesize how the nature of the
multiplex relationship (customer-as-partner, customer-as-competitor, customer-as-
supplier) moderates the impact of customer participation in outsourced NPD on
supplier task performance.
Customer participation. The potential benefits of customer participation in the
supplier’s NPD process are considerable. The role of a participating customer is to share
resources with the developing supplier. An important resource to be shared by the
participating customer is information (Fang 2008). Information does not only help the
supplier gain a better understanding of the customer’s problems and needs at the outset
of the NPD process, but may also help to better understand how customer needs evolve

Chapter 3 – Customer Participation in Outsourced NPD: The Role of Relationship Multiplexity
56
as the customer is confronted with new ideas, concepts, and prototypes across the NPD
stages (Fang, Palmatier, and Evans 2008; Stump, Athaide, and Joshi 2002). This may
enable the supplier to develop a better solution (Bonner and Walker 2004). Besides
information sharing, customer participation may also involve the sharing of other
resources, such as human capital (experienced personnel), materials, equipment, and
machinery (Campbell and Cooper 1999). These resources may help the supplier to
better perform its product development task, by opening up alternative development
paths that otherwise might not have been accessible to the supplier.
In sum, customer participation creates a platform for sharing information and other
resources during the NPD process, which may provide the supplier with better
customer insight and improved development paths, thereby contributing to supplier
task performance. In line with the generally positive tone of the academic and business
literature on customer participation, we hypothesize:
H1: Customer participation in outsourced NPD positively affects supplier task
performance
While customer participation potentially increases supplier task performance
through the sharing of resources, this potential may not be realized. Specifically, we
examine how the nature of the multiplex relationship may facilitate or impede resource
sharing and thereby moderate the effect of customer participation on supplier task
performance.
Customer-as-partner multiplexity. Customer-as-partner multiplexity refers to the
situation where a customer that participates in the supplier’s NPD process
simultaneously shares (one or more) partner ties with the supplier. A partner tie is a
horizontal collaborative arrangement among two or more organizations, intended to
jointly acquire and utilize information and resources to develop new technology
(Rindfleisch and Moorman 2001). In partnerships, firms work together as equals on the
basis of the complementarity of their knowledge and resources, in the pursuit of
mutually beneficial outcomes (Jap 1999).
Partners tend to develop norms that specify how information is shared (Dyer and
Singh 1998; Gundlach, Ravi, and Mentzer 1995). These norms prescribe behaviors that
facilitate communication. The improved communication between partners stimulates
Chapter 3 – Customer Participation in Outsourced NPD: The Role of Relationship Multiplexity
57
the emergence of heuristics for processing knowledge (Hansen 1999). Especially when
the knowledge to be shared is complex in nature or tied to technologies, such heuristics
facilitate knowledge transfer (Reagans and McEvily 2003). Therefore, the supplier is
likely to perform its NPD task more effectively for a participating customer when both
parties are also partners.
This may, however, not hold for all partnerships. Based on their formation process,
we distinguish between two types of partnerships, namely self-initiated partnerships
and engineered partnerships (Doz, Olk, and Ring 2000; Koza and Lewin 1999), both of
which are prominent in technology development and innovation (Millson, Raj, and
Wilemon 1996; Wallsten 2000). In self-initiated partnerships, the partners themselves
(the supplier or the customer) initiate the partnership and decide on the composition of
the partnership. In this type of partnership, all partners know each other’s identity in
advance and deliberately agree to jointly develop new technology. For example, the
collaboration between Nike and Philips Electronics to develop audio sports products,
and USCAR – the collaboration between Ford, Chrysler, and GM for automotive research
– are self-initiated partnerships. Self-initiated partnerships typically emerge in response
to environmental changes, when managers of different organizations recognize they
have similar interests (Doz, Olk, and Ring 2000). As such, self-initiated partnerships
tend to have precisely formulated objectives (Koza and Lewin 1999). Therefore,
partners in self-initiated partnerships are expected to easily coordinate and achieve
consensus over the domain of collaboration (Doz, Olk, and Ring 2000).
Conversely, engineered partnerships have been orchestrated by an overarching
initiator, or triggering entity (Doz, Olk, and Ring 2000), which often is a governmental
or other non-profit organization that wants to leverage innovation (Link and Scott
2010). These top-down induced innovation projects are announced publicly, and
organizations are invited to join. Partnering organizations are teamed up without the
partners’ full control of and consent to the match-making process. As a result, the
partners have to cooperate, regardless of their desire to do so. Sematech, an R&D
partnership between 14 U.S.-based semiconductor manufacturers that have been
brought together by the U.S. Department of Defense, is an example of an engineered
partnership (Browning, Beyer, and Shetler 1995). Other examples are the R&D
consortia which develop new technologies under the European Framework
Chapter 3 – Customer Participation in Outsourced NPD: The Role of Relationship Multiplexity
58
Programmes supported by the European Commission. Engineered partnerships are
formed in response to environmental changes that the managers of the different firms
either interpret differently or overlook or ignore (Doz, Olk, and Ring 2000). In that case,
a triggering entity is required to make firms coalesce into a partnership.
Since the firms’ different interpretations of their environment complicate
communication (Doz, Olk, and Ring 2000), heuristics related to information sharing are
less likely to emerge in engineered partner ties than in self-initiated partner ties. We
therefore expect that the synergistic effects between the participating-customer role
and the partner role are stronger for self-initiated partnerships than for engineered
partnerships. We hypothesize:
H2: (a) Self-initiated partner ties and (b) engineered partner ties between a
supplier and a customer strengthen the effect of customer participation in
outsourced NPD on supplier task performance
H3: The moderating effect on the relationship between customer participation in
outsourced NPD and supplier task performance is stronger for self-initiated
partner ties than for engineered partner ties
Customer-as-competitor multiplexity. Customer-as-competitor multiplexity occurs
when the participating customer also competes with the supplier. Thus, the customer
holds two relationship roles, a participating-customer role and a competitor role.
Competitors have similar knowledge bases (Lane and Lubatkin 1998), which facilitates
knowledge absorption (Cohen and Levinthal 1990) when the competing customer
shares information with the supplier while participating in the NPD project. Thus, the
supplier is better able to apply the newly gained knowledge, thereby increasing supplier
task performance.
However, the potential benefits of customer-as-competitor multiplexity may be
overshadowed by role conflict. In its participating-customer role, the customer is
expected to share information and other resources with the supplier with the purpose
of joint value creation (Fang, Palmatier, and Evans 2008). The role of competitors, on
the other hand, is to focus on value division and appropriation (Jap 1999). Hence, on the
basis of its competitor role, the participating customer may worry that the supplier will
opportunistically appropriate its knowledge (cf. Hamel, Doz, and Prahalad 1989; Lado,

Chapter 3 – Customer Participation in Outsourced NPD: The Role of Relationship Multiplexity
59
Boyd, and Hanlon 1997). Although sharing information always carries the risk of
knowledge leakage and opportunistic exploitation, this risk amplifies when the
collaborating parties have conflicting objectives (Mohr and Sengupta 2002). Thus, the
behavioral expectations (sharing knowledge) associated with the participating-
customer role may conflict with the behavioral expectations (protecting knowledge)
associated with the competitor role. A likely consequence of such role conflict is that
interactions between the participating customer and the supplier are hampered by
discussions about ownership and the customer’s attempts to hedge against knowledge
leakage. The supplier may be similarly concerned about knowledge appropriation by
the participating customer, and also hedge against knowledge leakage. As more
resources are dedicated to cope with appropriation concerns and reconcile role conflict,
the supplier can devote fewer resources to performing job responsibilities (Nygaard
and Dahlstrom 2002), thereby decreasing supplier task performance.
In sum, although competitor multiplexity facilitates knowledge absorption, this
potential benefit may not manifest itself because of motivational concerns.
H4: A competitor tie between a supplier and a customer weakens the effect of
customer participation in outsourced NPD on supplier task performance
Customer-as-supplier multiplexity. Customer-as-supplier multiplexity refers to the
situation where the participating customer shares (one or more) role-reversal ties with
the supplier. Role-reversal ties arise when the customer and the supplier also face each
other in reversed roles. Customer A and its supplier B share a role-reversal tie if A also
acts as a supplier to B. In business markets, role-reversal ties often occur when firms
operate in multiple market segments. For example, Nokia is known worldwide as a
device manufacturer, but it is also a leading provider of network equipment (Basole
2009). In case of role-reversal ties, Nokia may encounter the same firm in two roles: in a
supplier role for its device production and, contemporaneously, in a customer role for
its network equipment.
In contrast to customer-as-partner multiplexity – which creates role synergy – and
customer-as-competitor multiplexity – which creates role conflict – we argue that the
presence of role-reversal ties leads to role ambiguity. Role ambiguity refers to the lack
of clarity regarding role expectations and the consequences of one’s role performance

Chapter 3 – Customer Participation in Outsourced NPD: The Role of Relationship Multiplexity
60
(Biddle 1986; Netemeyer, Johnston, and Burton 1990). The popular notion that “the
customer is king” illustrates the prototypical nature of customer-supplier ties in which
the customer poses demands that the selected supplier is expected to adhere to
(Cannon and Perreault 1999). In case of role-reversal ties, however, the customer may
be unsure how strictly it can impose its demands. Can the customer still be exigent or
should the customer be more compliant, given the presence of a role-reversal tie? It is
not only unclear how the customer is expected to behave when simultaneously acting as
a supplier in another project; also the consequences of its behavior are unclear. The
supplier – who is equally uncertain about how to behave in its supplier role when
simultaneously acting as a customer in the role-reversal tie – may or may not adhere to
the requirements of the exigent customer and may or may not expect reciprocation in
the role-reversal tie. In sum, role-reversal ties cause ambiguity for the customer and the
supplier by blurring behavioral expectations and creating uncertainty regarding the
consequences of both parties’ behaviors. The consequences of role ambiguity are well
documented. Prior research has shown repeatedly that role ambiguity leads to lower
(job) performance (Bagozzi 1980; Singh 1993). For example, Singh (1993) shows that
sales agents’ performance wanes in the presence of customer-based role ambiguity.
Role ambiguity is expected to affect supplier task performance especially when
both parties cooperate, such as in customer participation. From a cognitive perspective,
as customer and supplier role expectations become more ambiguous, they must
dedicate more cognitive resources to clarify role expectations (cf. Jackson and Schuler
1985). As a result, meetings between the customer and the supplier risk being
dominated by efforts to sort out role obligations, which may detract from the project at
hand (Nygaard and Dahlstrom 2002, p. 70), and result in behaviors that are more likely
to be inefficient, misdirected, or insufficient (Jackson and Schuler 1985; Van Sell, Brief,
and Schuler 1981). From a motivational perspective, role ambiguity has been shown to
reduce firms’ ‘effort-to-performance’ expectancy (Jackson and Schuler 1985). When
uncertainty regarding role expectations reduces the customer’s confidence in the
efficacy of its participation efforts, the customer may become discouraged to fully
deploy its innovative potential to the project (Solomon et al. 1985). Consequently, the
effect of customer participation on supplier task performance should decrease. We
hypothesize:
Chapter 3 – Customer Participation in Outsourced NPD: The Role of Relationship Multiplexity
61
H5: Role-reversal ties between a supplier and a customer weaken the effect of
customer participation in outsourced NPD on supplier task performance
3.4 METHOD
Empirical Context
We obtained access to a unique sample of NPD projects carried out by a single
contract R&D organization (the supplier) for a variety of customers. The contract R&D
organization is a globally operating organization that is active in various high-
technology markets that are associated with the aerospace industry, including
aerospace craft, materials, onboard equipment, and avionics software. The firm is
sufficiently large to ensure an adequate sample size, and its customers and the NPD
projects it performs for its customers are diverse enough to ensure variation in our key
constructs. Gathering data within a single (supplier) firm allows us to capture rich and
detailed data on individual projects that otherwise would be difficult to obtain. In
addition, it enables us to control for industry effects as explanations for supplier task
performance (cf. Mayer and Nickerson 2005) and thus “provide(s) for greater
comparability of key dependent and independent variables” across projects (Chandy
2003, p. 353).
The aerospace industry is ideal to test our hypotheses, for two reasons. First, the
development of components, products, and technologies used in aerospace craft are
often outsourced to specialized suppliers. For example, in developing the Boeing 787
Dreamliner, as much as 70% of the research and manufacturing of the plane was
outsourced (Kotha and Nolan 2005). Second, the industry is characterized by many
different types of ties between organizations, leading to multiplex relationships. Partner
ties are prominent: numerous new products are developed in self-initiated partnerships
or in engineered partnerships. Many firms in this industry are active in multiple market
domains, which increases the prevalence of customer-as-competitor multiplexity and
customer-as-supplier multiplexity.
When a customer outsources an NPD project to the focal contract R&D organization
(the supplier), this supplier appoints a project manager, who writes a ‘project plan.’ The
project plan is a formal document used to manage project execution. It defines the
objectives of the project, documents each activity included in the project, estimates the

Chapter 3 – Customer Participation in Outsourced NPD: The Role of Relationship Multiplexity
62
time and resources required to complete each activity, and specifies the parties that will
be involved in each activity. During the project, the project manager provides regular
project-status updates in a ‘project status report.’ Together, the project plan and the
project status report include whether, when, and how customers participate in NPD.
Immediately following project completion, both the supplier’s project manager and the
customer’s representative formally appraise the project by, independently, filling out
project evaluation reports.
Sample
We obtained permission from the board of the contract R&D organization to study a
sample of 150 NPD projects, executed between 2003 and 2009, representative for all
three operational divisions of the firm and all seventeen underlying departments. The
board facilitated our research by providing access to a wealth of internal documentation.
In addition, we were granted access to several managerial levels ranging from the
project managers to the corporate office. We ensured that the collected sample was
representative for the firm, by comparing the 150 sampled projects with the firm’s
entire portfolio of 311 NPD projects spanning the period 2003-2009. Along dimensions
we could measure (viz., project budget and project duration), we found no significant
differences between the sampled projects and the non-sampled projects.
Data Sources
We combined data from a wide variety of sources. First, the organization’s quality
assurance officers supplied us with project evaluation reports for our sample of 150 NPD
projects. These project evaluation reports are filled out by the customer and by the
supplier’s project manager independently upon completion of the project, and are filed
by the organization’s quality assurance officers. Second, the contract R&D organization
granted us access to their project administration records, for all projects executed
between 2000 and 2009. These records contain key descriptors of the projects,
including project duration (start date, end date), project budget, and identification of
the customer. Third, we reviewed and coded the organization’s strategic cooperation
plans for the years 2000-2009 (2500+ pages in total). These plans describe all
partnerships – self-initiated and engineered – the firm engaged in. Fourth, we obtained
access to the organization’s procurement records, which contain all its purchase orders

Chapter 3 – Customer Participation in Outsourced NPD: The Role of Relationship Multiplexity
63
between 2000 and 2009 and thus provide insight into the organization’s role-reversal
ties. Fifth, the board facilitated a focus group session with five senior managers to identify
all competitors of the contract R&D organization. Sixth, we obtained permission to
administer a brief (one-page) survey to the project managers, in which they were asked
to report on customer participation by referring to their own (confidential) project
plans and project status reports. The project managers were sent a package containing a
letter from the executive management endorsing the study and the survey instrument.
Overall, 140 surveys were returned.4
Measurement
Supplier task performance. Supplier task performance (STP) measures are taken
from the project evaluation reports that are filed by the company’s quality assurance
officers. STP as perceived by the customer (STP_CUS) is measured through two five-
point items that capture the customer’s evaluation of (1) the supplier’s performance
with respect to the end result in general, and (2) the developed product. The supplier’s
self-reported STP (STP_SUP) is measured through one five-point item that captures the
supplier’s evaluation of project execution. Although we would have preferred identical,
multi-item scales for the supplier and the customer to measure STP, the advantage of
the available scales may compensate for this limitation: by using data that were
collected by the firm immediately following project closure, the STP measures do not
suffer from the memory-bias problems that are prone to affect survey-based research.5
Customer participation. The extent of customer participation (PARTIC) in the
supplier’s NPD process is documented in the project managers’ project plans and
project status reports. Since we did not have permission to consult these (confidential)
plans and reports, we measured customer participation using a survey among the
project managers. However, we specifically instructed the project managers to consult
their project plans and status reports to retrieve the necessary details. Following Fang,
4 For ten projects, the survey was not returned. We compared these ten projects with the 140 remaining projects in terms of project budget, project duration, relationship multiplexity, and supplier task performance as perceived by the supplier and by the customer. We did not find statistical differences. 5 Nevertheless, we tested the robustness of our findings for an alternative measure of the supplier’s self-reported STP. Specifically, in the survey that we administered to the project managers, we included the same two items that were used to measure the customer’s perception of STP (STP_CUS) to measure the supplier’s self-reported STP. Results remained substantively the same. See the Robustness Checks section for more details.

Chapter 3 – Customer Participation in Outsourced NPD: The Role of Relationship Multiplexity
64
Palmatier, and Evans (2008), our measure of customer participation captures both
breadth (number of activities in the supplier’s NPD process in which the customer
participates) and depth (how deeply the customer participates in each of these activities)
of customer participation. Based on interviews with five project managers, we identified
twelve activities that can be part of an NPD project executed by the contract R&D
organization. For each of the twelve activities, we asked whether the activity was
included in the sample project and, if so, whether the customer participated in that
activity (0 = did not participate, 1 = participated). If the customer participated, we
subsequently asked about the customer’s depth of participation using a seven-point
Likert scale, ranging from ‘very superficially involved’ to ‘very deeply involved.’ We
measure customer participation as the average of customer participation breadth (the
ratio of the number of activities in which the customer participated to the number of
activities present in the project) and customer participation depth (the average depth
across the activities the customer participated in), after standardization.
Relationship multiplexity. Self-initiated partner ties (SELFPART) and engineered
partner ties (ENGPART) are measured as the number of self-initiated and engineered
technology development projects in which the contract R&D organization and the
customer collaborate during the focal project period. Competitor tie (COMPET) is
operationalized as a dummy variable that equals one if the customer is also a
competitor to the contract R&D organization, and is zero otherwise. Role-reversal ties
(REVERSE) are measured as the number of projects in which the customer serves as a
supplier to the contract R&D organization during the focal project period. We log-
transform SELFPART, ENGPART, and REVERSE to correct for non-normality.
Control variables. In addition to the focal theoretical variables, several control
variables are also included as main effects. At the project level, we account for the
project’s size (PR_SIZE), measured by the project budget. To normalize the project
budget, a log-transformation was used. We further include project innovativeness
(INNOV) since a radically innovative project may result in more excitement (Schmidt
and Calantone 1998) and thus more positive task performance evaluations than a less
innovative project. In a similar vein, we control for time pressure (TIME_PRESS), since
task performance evaluations may be affected negatively in projects where time
pressure is intense (Payne, Bettman, and Luce 1996). Project innovativeness (INNOV)
Chapter 3 – Customer Participation in Outsourced NPD: The Role of Relationship Multiplexity
65
and time pressure (TIME_PRESS) are both operationalized using seven-point Likert
scales included in the survey among project managers.
At the firm level, we control for the firm size of the customer (CUS_SIZE), measured
as the number of employees (log-transformed). In addition, customers may take more
credit for the outcome if they have already made many investments ex ante, i.e. prior to
outsourcing the NPD project, in the technology to be developed or if they have been
involved intensively in developing the project plan. We therefore control for ex-ante
customer investments in the technology to be developed (INV) and customer
involvement in project-plan development (PLAN). Both constructs are measured using
seven-point Likert scales included in the project-manager survey.
Finally, we take into account the number of concurrent projects the supplier
executes for the customer. The development of technology takes long (Rosenberg 1990),
which increases the occurrence of concurrent outsourced NPD projects for the same
customer. Executing multiple projects simultaneously generates cooperativeness
between the supplier and the customer (cf. Heide and John 1990), which may increase
the effectiveness of customer participation. Therefore, we control for the main effect of
the number of concurrent projects executed for the customer as well as the interaction
effect between the number of concurrent projects and customer participation. We
measure concurrent projects (CONCURR) as the number of other projects (besides the
focal project) the supplier executes for the customer during the focal project period
(log-transformed). The Appendix provides an overview of the measures used in our
study, and their data sources.
Estimation
The customer and the supplier provided independent evaluations of STP at the
completion of the outsourced NPD project. Since we do not presume consensus about
STP across the dyad (cf. Rokkan, Heide, and Wathne 2003), we estimate two equations
with, respectively, the customer’s perception of STP and the supplier’s self-reported STP
in project i executed for customer j as the dependent variables. The first of these
equations captures the perspective of the customer and is specified in the following
fashion:

Chapter 3 – Customer Participation in Outsourced NPD: The Role of Relationship Multiplexity
66
(1) STP_CUSij = β0j + β1 * SELFPARTij + β2 * ENGPARTij + β3* COMPETij
+ β4 * REVERSEij + β5 * CONCURRij + PARTICij [β6 + β7 * SELFPARTij
+ β8 * ENGPARTij + β9 * COMPETij + β10 * REVERSEij + β11 * CONCURRij]
+ β12 * PR_SIZEij + β13 * INNOVij + β14 * TIME_PRESSij + β15 * CUS_SIZEj
+ β16 * INVij + β17 * PLANij + εij
The second equation, which we estimate using STP_SUPij as the dependent variable,
captures the perspective of the supplier and is specified in a parallel fashion:
(2) STP_SUPij = γ0j + γ1 * SELFPARTij + γ2 * ENGPARTij + γ3* COMPETij
+ γ4 * REVERSEij + γ5 * CONCURRij + PARTICij [γ6 + γ7 * SELFPARTij
+ γ8 * ENGPARTij + γ9 * COMPETij + γ10 * REVERSEij + γ11 * CONCURRij]
+ γ12 * PR_SIZEij + γ13 * INNOVij + γ14 * TIME_PRESSij + γ15 * CUS_SIZEj
+ γ16 * INVij + γ17 * PLANij + μij
We use mean-centering prior to forming the interactions to ease interpretation.
Estimation of our model is complicated by three factors. First, customer
participation may be strategically chosen to optimize STP. This may result in samples in
which only maximizing choices are included. To examine whether such endogeneity is
present, we conduct a Durbin-Wu-Hausman test, which augments the two STP
equations with the first-stage structural residual of a model estimating customer
participation. In this model, we include all independent variables and control variables
from our main model, supplemented with additional exclusion instruments for
identification purposes (Wooldridge 2002). We use three exclusion instruments, viz. the
project’s duration (in number of activities included in the project), the customer’s level
of technological expertise (two items on a seven-point scale),6 and a dummy variable
that is 1 if the customer is a government agency and 0 otherwise.7 In the augmented
regression equations, the parameter estimates for the residuals do not reveal any
violation of the assumed exogeneity of the customer-participation variable (p > .10).
Consequently, endogeneity is found not to be an issue.
Second, our sample contains more than one project for twenty-one customers. The
inclusion of multiple projects for the same customer in the sample is representative for
6 Customer technological expertise is measured through two seven-point items that were included in the survey among project managers. Cronbach’s alpha was .90. 7 Instrumental variables must satisfy two requirements: they must be correlated with the potential endogenous variable (i.e., customer participation), and they must be orthogonal to the error. The F-statistic suggested by Staiger and Stock (1997) confirms that the first condition is satisfied (F = 14.0, p
< .01), while the J-statistic of Hansen (1982) provides support for the second condition (J = .18, p = .91).

Chapter 3 – Customer Participation in Outsourced NPD: The Role of Relationship Multiplexity
67
the contract R&D organization’s order book in particular and for the aerospace industry
in general.8 Because of unobserved heterogeneity, these observations may not be
independent of each other. We control for unobserved heterogeneity by randomizing
the intercepts.
Third, if unobserved factors explain variation in both the customer’s and the
supplier’s evaluations of task performance, the error terms are correlated. Seemingly
unrelated regression (SUR) accounts for potentially correlated errors across the two
equations by estimating them simultaneously.9
3.5 RESULTS
Descriptive Insights
The average budget of the 140 projects in our sample is approximately $250k, with
a total amounting to $35 million. The sample projects have an average duration of 22
months, with a maximum of 75 months. This is not unusual in technology development:
technology exploration followed by the development of technology applications and
extensive testing takes time (Rosenberg 1990).
Customers participate in 132 out of 140 projects, in line with our field-interview
observation that customers are pushing suppliers for increased participation in their
outsourced NPD projects. In these 132 projects, customers participate in, on average, 73%
of the activities of the project and their depth of participation in these activities is, on
average, above the scale midpoint (4.5 on a seven-point scale). Customer participation
differs dramatically between projects: the number of activities in which customers
participate ranges from 9% to 100% and the depth of participation ranges from 1 to 7.
Multiplex relationships are commonplace: 101 projects are executed for customers that
simultaneously play a self-initiated partner role in one or more other projects, 87
projects are executed for customers that simultaneously play an engineered partner
8 Executing multiple projects for a single customer is also not uncommon in other business markets, including automotive (Liker and Choi 2004), telecommunications (Wu and Choi 2005), and pharmaceuticals (Wuyts, Dutta, and Stremersch 2004). 9 As we specify random effects in both equations, the specification of the equations is not identical. Hence, SUR is more efficient than OLS (Singh and Ullah 1974).

Chapter 3 – Customer Participation in Outsourced NPD: The Role of Relationship Multiplexity
68
TA
BL
E 3
.1:
De
sc
rip
tiv
e S
tati
sti
cs
an
d C
or
re
lati
on
s
Va
ria
ble
M
ea
n
SD
M
in
Ma
x
1
2
3
4
5
6
7
8
9
10
1
1
12
1
3
14
1
STP
(cu
stom
er p
erce
pti
on
)
4.2
0
.56
2
.0
5.0
1
2
STP
(su
pp
lier
per
cep
tio
n)
4
.16
.6
3
2.0
5
.0
.49
1
3
Cu
sto
mer
par
tici
pat
ion
.0
0
.85
-2
.4
1.3
.0
6
-.0
1
1
4
Self
-in
itia
ted
par
tner
tie
s
5.1
1
5.7
8
0
38
-.
12
-.
10
.0
4
1
5
En
gin
eere
d p
artn
er t
ies
19
.32
3
6.0
7
0
15
3
.02
-.
06
-.
14
.0
5
1
6
Com
pet
ito
r ti
e .3
9
.49
0
1
.0
4
-.0
6
.10
.4
3
.49
1
7
Ro
le-r
ever
sal t
ies
3
.91
6
.19
0
2
6
.03
-.
01
.1
0
.46
.1
9
.46
1
8
Pro
ject
siz
e 2
.47
3
.18
.0
4
19
.42
.0
1
-.0
2
.06
-.
10
-.
08
-.
13
-.
13
1
9
Inn
ova
tive
nes
s 3
.38
1
.37
1
7
.2
3
.21
.0
2
-.0
6
-.0
1
.00
-.
11
.1
0
1
10
T
ime
pre
ssu
re
3.6
5
1.8
8
1
7
.12
.1
.1
9
-.0
1
-.0
9
.05
-.
05
.1
7
.21
1
11
C
ust
om
er s
ize
2.4
8
3.8
2
.00
1
12
.6
-.0
7
-.1
2
-.1
4
.18
.6
4
.44
.0
1
.17
.0
1
.10
1
12
E
x an
te c
ust
om
er
inve
stm
ents
3
.3
1.7
8
1
7
-.0
3
-.0
6
.26
-.
02
.0
5
.19
-.
13
-.
01
.1
7
.30
.2
5
1
13
C
ust
om
er in
volv
emen
t in
p
roje
ct-p
lan
dev
elo
pm
ent
4.5
3
1.6
1
1
7
-.0
6
.02
.3
5
.04
-.
10
.1
9
-.0
8
-.0
7
.36
.1
6
.11
.3
5
1
14
C
on
curr
ent
pro
ject
s 2
6.4
9
43
.12
0
3
07
-.
07
.0
8
-.2
9
.19
-.
05
-.
17
-.
11
.3
3
-.1
1
-.0
1
.01
-.
26
-.
22
1
No
tes:
All
co
rrel
atio
ns
in b
old
are
sig
nif
ican
t at
th
e 5
% l
evel
(tw
o-s
ided
). D
escr
ipti
ve s
tati
stic
s (c
orr
elat
ion
s) a
re r
epo
rted
bef
ore
(aft
er)
log-
tran
sfo
rmin
g an
d m
ean
-cen
teri
ng.

Chapter 3 – Customer Participation in Outsourced NPD: The Role of Relationship Multiplexity
69
role,10 and 54 out of 140 projects are executed for customers that are also competitors
to the contract R&D organization. Role-reversal ties occur in 79 out of 140 projects.
Table 3.1 provides descriptive statistics.
Hypotheses Testing
The results are reported in Table 3.2. None of the VIF statistics exceed four,
suggesting that multicollinearity is not an issue. In presenting the results, we use ‘c’ to
signify the effect on the customer’s evaluation of STP, and ‘s’ to signify the effect on the
supplier’s self-reported STP. When differences across the dyad occur, we take up the
implications of these findings in the discussion section.
Conform H1, we find that customer participation positively affects the customer’s
evaluation of STP (c = .19, p < .05). However, and contrary to expectations, customer
participation does not significantly influence the supplier’s evaluation of STP (s = -.15,
p > .10). We thus find partial support for H1.
Overall, the results indicate that the relationship between customer participation
and STP strongly depends on relationship multiplexity. Consistent with H2a, we find that
the effect of customer participation on STP increases when the number of self-initiated
partner ties with the participating customer increases, both from the customer’s and the
supplier’s perspective (c = .21, p < .01; s = .16, p < .05). Thus, H2a is supported. Simple
slope analyses reveal that customer participation has no effect on the customer’s
perception of STP when customers share no self-initiated partner ties with the supplier
(cABSENCE = -.08, n.s.), but increases STP for high levels of self-initiated partner ties (cHIGH
= .40, p = .01), as reflected in one standard deviation above the mean. From the
perspective of the supplier, on the other hand, customer participation lowers STP in
case self-initiated partner ties are absent (sABSENCE = -.20, p < .01), whereas this negative
effect disappears for high levels of self-initiated partner ties (sHIGH = .15, n.s.).
Contrary to H2b, we do not find a significant interaction effect between customer
participation and engineered partner ties (c = .04, n.s.; s = -.03, n.s.). Tests on the
parameter distances (β7 – β8 and γ7 – γ8 ) reveal that the effect of customer participation
10 In our sample, self-initiated and engineered partnerships coexist in the relationship: 68 projects are executed for customers that simultaneously play a self-initiated partner role and an engineered partner role.

Chapter 3 – Customer Participation in Outsourced NPD: The Role of Relationship Multiplexity
70
on STP is more positive for multiplex relationships consisting of self-initiated rather
than engineered partner ties (p < .05), lending statistical support for H3. In sum, the
beneficial effect of customer participation on supplier task performance only pertains to
self-initiated partner ties, and not to engineered partner ties.
H4 poses that customer-as-competitor multiplexity weakens the effect of customer
participation on STP. Consistent with H4, we find a negative interaction effect between
customer participation and competitor tie from the perspective of the customer (c = -.29,
p < .05). Everything else equal, in the absence of a competitor tie, customer participation
positively affects STP as perceived by the customer (cABSENCE = .19, p < .10), but this
positive effect disappears if the participating customer is also a competitor to the
supplier (cPRESENCE = -.10, n.s.). Regarding the supplier’s self-reported STP, the results
paint a different picture. In contrast to H4, we find a positive but nonsignificant
interaction effect between customer participation and competitor tie (s = .22, n.s.). Thus,
H4 is only partially supported.
We find support for H5 that role-reversal ties weaken the effect of customer
participation on STP (c = -.12, p < .05; s = -.13, p < .05). Simple slope analyses show that
the effect of customer participation on the customer’s evaluation of STP is positive for
relationships without role-reversal ties (cABSENCE = .31, p < .01), but not significant for
relationships with high levels of role-reversal ties (cHIGH = .07, n.s.). Turning to the
perspective of the supplier, customer participation does not significantly affect the
supplier’s self-reported STP in the absence of role-reversal ties (sABSENCE = .28, n.s.), but
lowers the supplier’s self-reported STP for high levels of role-reversal ties (sHIGH = -.14, p
< .10).
Although not the focus of our study, we also find that some of the multiplexity
variables exert a significant main effect on STP. We find a negative main effect of self-
initiated partner ties on STP (c = -.14, p < .05; s = -.13, p < .10). Further, whereas a
competitor tie positively affects the customer’s perception of STP (c = .31, p = .05), it has
no impact on the supplier’s self-reported STP (s = .06, n.s.).
Turning to the control variables, we find that perceptions of supplier task
performance increase as project innovativeness increases (c = .13, p < .01; s = .12, p
< .01). Further, we find a negative effect of customer involvement in project-plan
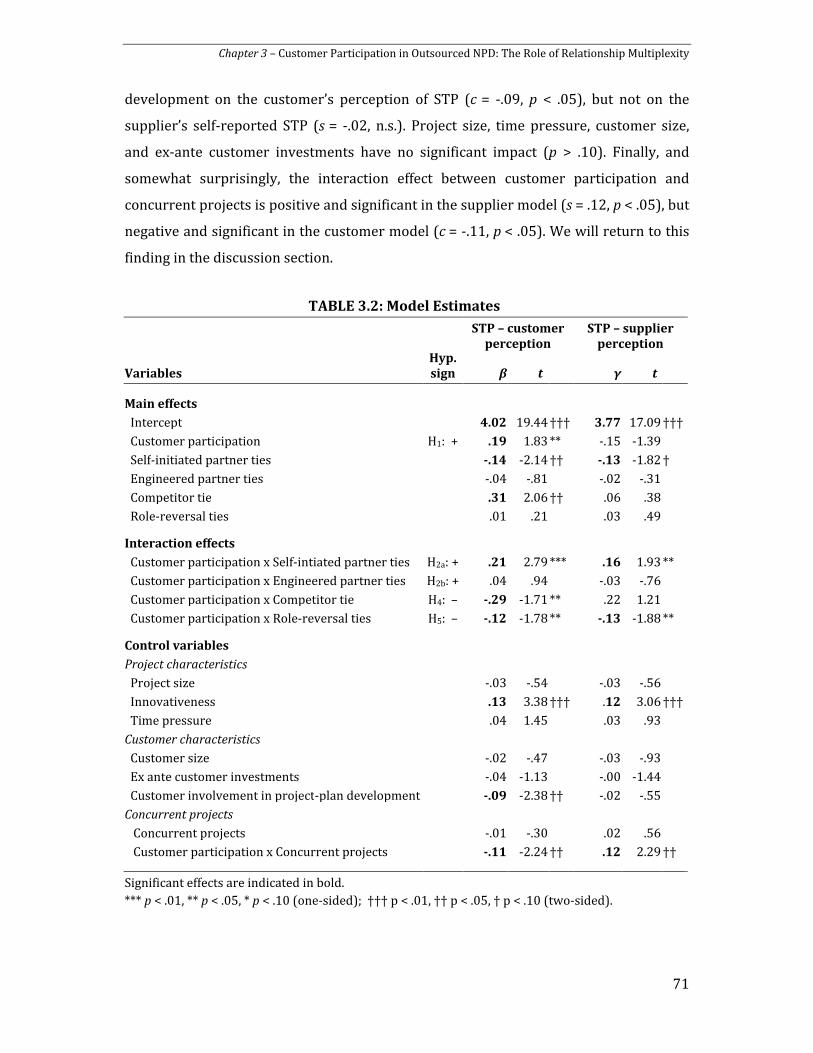
Chapter 3 – Customer Participation in Outsourced NPD: The Role of Relationship Multiplexity
71
development on the customer’s perception of STP (c = -.09, p < .05), but not on the
supplier’s self-reported STP (s = -.02, n.s.). Project size, time pressure, customer size,
and ex-ante customer investments have no significant impact (p > .10). Finally, and
somewhat surprisingly, the interaction effect between customer participation and
concurrent projects is positive and significant in the supplier model (s = .12, p < .05), but
negative and significant in the customer model (c = -.11, p < .05). We will return to this
finding in the discussion section.
TABLE 3.2: Model Estimates
Hyp.
sign
STP – customer
perception
STP – supplier
perception
Variables β t γ t
Main effects
Intercept 4.02 19.44 ††† 3.77 17.09 †††
Customer participation H1: + .19 1.83 ** -.15 -1.39
Self-initiated partner ties -.14 -2.14 †† -.13 -1.82 †
Engineered partner ties -.04 -.81 -.02 -.31
Competitor tie .31 2.06 †† .06 .38
Role-reversal ties .01 .21 .03 .49
Interaction effects
Customer participation x Self-intiated partner ties H2a: + .21 2.79 *** .16 1.93 **
Customer participation x Engineered partner ties H2b: + .04 .94 -.03 -.76
Customer participation x Competitor tie H4: – -.29 -1.71 ** .22 1.21
Customer participation x Role-reversal ties H5: – -.12 -1.78 ** -.13 -1.88 **
Control variables
Project characteristics
Project size -.03 -.54 -.03 -.56
Innovativeness .13 3.38 ††† .12 3.06 †††
Time pressure .04 1.45 .03 .93
Customer characteristics
Customer size -.02 -.47 -.03 -.93
Ex ante customer investments -.04 -1.13 -.00 -1.44
Customer involvement in project-plan development -.09 -2.38 †† -.02 -.55
Concurrent projects
Concurrent projects -.01 -.30 .02 .56
Customer participation x Concurrent projects -.11 -2.24 †† .12 2.29 ††
Significant effects are indicated in bold.
*** p < .01, ** p < .05, * p < .10 (one-sided); ††† p < .01, †† p < .05, † p < .10 (two-sided).

Chapter 3 – Customer Participation in Outsourced NPD: The Role of Relationship Multiplexity
72
Robustness Checks
To further validate our results, we perform several robustness checks.
Including additional interaction effects. Partner ties (self-initiated or engineered),
competitor ties, and role-reversal ties are not necessarily mutually exclusive but can
occur in combination, in which case they can reinforce or obstruct one another. To
explore this formally, we re-estimated our model including all two-way interactions
between these four types of ties. None of the interactions were significant (p > .10), nor
did they substantially change the significance of the hypothesized effects reported in
Table 3.2. In a similar vein, we re-estimated our model including higher-order
interactions between customer participation and partner ties, competitor ties, and role-
reversal ties. None of these higher-order interactions were significant (p > .10).
Using an alternative measure for self-reported supplier task performance. The
measurement items that we obtained from the quality assurance officers for (i) STP as
perceived by the customer and (ii) STP as perceived by the supplier were similarly
although not identically worded. We tested the robustness of our findings to an
alternative measure of STP as perceived by the supplier. Specifically, in the survey that
we administered to the project managers, we measured their perception of STP using
the same items that the company had used to measure the customer’s perception of STP.
We re-estimated our model using this alternative self-reported STP measure. Results
remained substantively the same. In our focal model, we preferred using the non-
identical measures that were provided to us by the quality assurance officers over the
identical measures that were included in the project-manager survey, since the former
were administered by the company immediately following project completion whereas
the latter were administered up to eight years after project completion.
Using alternative time windows to operationalize the multiplexity variables. Conform
with our conceptualization, the multiplexity variables were measured based on the focal
project period. For example, the self-initiated partner ties variable is measured as the
number of self-initiated technology development projects in which the contract R&D
organization and the customer collaborate during the focal project period. We re-
estimated our model with measures based on alternative time windows, starting one,
Chapter 3 – Customer Participation in Outsourced NPD: The Role of Relationship Multiplexity
73
two, or three years prior to the project start date, and ending at project completion. The
results were robust to these alternative time windows.
Breadth versus depth of customer participation. Following precedence (e.g., Fang,
Palamtier, and Evans 2008), our measure of customer participation captures both
breadth (number of activities in the supplier’s NPD process in which the customer
participates) and depth (how deeply the customer participates in each of these
activities). To investigate the robustness of our findings to the measurement of
customer participation, we re-estimated the model specified in Eqs. 1-2 twice, replacing
our two-dimensional measure of customer participation with i) the breadth dimension
only (operationalized as the ratio of the number of activities in which the customer
participated to the number of activities present in the project), and ii) the depth
dimension only (operationalized as the average depth across the activities the customer
participated in). Overall, the results of these two models are substantively the same to
those reported in Table 2. There are two notable differences. In the customer evaluation
equation, the significant positive main effect of customer participation and the
significant negative interaction effect between customer participation and competitor
tie only hold for the breadth measure but not for the depth measure. For the depth
measure, the parameters are of the correct signs. This further attests to the robustness
of our findings.
3.6 DISCUSSION
Does customer participation in outsourced NPD increase supplier task performance,
and how does this effect vary according to other relationship roles customers may play?
Using a unique database combining several sources of archival data with survey data,
and testing effects at both sides of the dyad, we show in which types of multiplex
relationships customer participation helps or hurts supplier task performance. We
conclude with a discussion of the essay’s contributions to marketing theory,
implications for managerial practice, and limitations and opportunities for further
research.
Theoretical Implications
The essay’s findings extend the literature on customer participation. Specifically,
our study helps explain why the previous literature has not unequivocally established

Chapter 3 – Customer Participation in Outsourced NPD: The Role of Relationship Multiplexity
74
that customer participation is beneficial (e.g., Stump, Athaide, and Joshi 2002).
Moreover, we find that whether customer participation helps or hurts is contingent on
relationship multiplexity.
Furthermore, our findings extend the literature on multiplex relationships (e.g.,
Lilien et al. 2010; Rindfleisch et al. 2010; Ross and Robertson 2007; Tuli, Bharadwaj,
and Kohli 2010). First, we offer empirical evidence that relationship multiplexity
matters in the context of customer participation. Our findings indicate that the various
ties shared between a supplier and a customer affect the effectiveness of customer
participation. Second, we extend the framework devised by Ross and Robertson (2007)
to analyze relationship multiplexity by distinguishing between self-initiated and
engineered partnerships.
In addition, our approach to incorporate both the evaluations of the customer and
the supplier in the analysis uncovered systematic differences between the customer and
the supplier – what is beneficial in the eyes of the customer is not necessarily beneficial
in the eyes of the supplier, and vice versa. Thus, our overall pattern of results paints a
more complex picture than is currently expressed in the literature.
Specifically, the customers in our study evaluate supplier task performance more
favorably when they participate more in the outsourced NPD project, whereas customer
participation has no direct effect on the supplier’s self-reported task performance. A
possible explanation of these perceptual differences across the dyad is that the
customer’s evaluation is colored. This corresponds with the “I designed it myself effect”
reported by Franke, Schreier, and Kaiser (2010), in which they show that customer self-
design leads to higher outcome appraisals because of feelings of accomplishment. In a
similar vein, Troye and Supphellen (2012) report an “I made it myself effect”; consumer
participation in co-production improves outcome evaluations, via the creation of
linkages between the outcome and the self.
Managerial Implications
The essay’s findings, which offer evidence of interactions between customer
participation and relationship multiplexity, translate into guidelines for managers. We
discuss the managerial implications that follow from our findings by answering three
questions.

Chapter 3 – Customer Participation in Outsourced NPD: The Role of Relationship Multiplexity
75
Does customer participation help or hurt in case of customer-as-partner multiplexity?
The managers we interviewed thought the answer was a straightforward ‘yes.’ However,
the empirical evidence indicates otherwise. Involving a customer that is also a partner is
only synergistic when the participating customer and the supplier share self-initiated
partner ties, but not so when they share engineered partner ties. Our findings thus
underscore the need to distinguish between these two types of partner ties, a
distinction that has been largely overlooked in the marketing literature but that is
prominent in industrial markets. Interestingly, the beneficial effect of involving
customers in case of self-initiated partner ties was found at both sides of the dyad: both
the customer and the supplier report increased supplier task performance in this
situation.
Somewhat surprisingly, we also found a negative main effect of self-initiated
partner ties on supplier task performance, as perceived by both the customer and the
supplier. The fact that partner ties sometimes work counter-productively is commonly
referred to as the dark side of partnerships. One explanation for this dark side is that
customers develop higher expectations whereas suppliers invest less effort (Grayson
and Ambler 1999). The negative effect of self-initiated partner ties on supplier task
performance may reflect a spillover of such dark side effects to the focal customer-
supplier tie. When discussing our results with the marketing director of the contract
R&D organization that supplied the data for our study, he acknowledged that partnering
customers developed increased expectations: “Our organization and this partner
collaborate as equals. Over time, we have learned each other’s weaknesses and
strengths, which is helpful in joint projects. However, I have also experienced that this
insider knowledge may backfire on us – in its customer role, our partner tends to
increase its expectations.”
Does customer participation help or hurt in case of customer-as-competitor
multiplexity? As our field interviews indicated, the answer to this question is not
obvious, with some interviewees preferring to keep competitors at a distance and
others acknowledging the positive aspects of involving competitors. Our empirical test
confirms that the answer is not a simple ‘yes’ or ‘no’: we find different effects at both
sides of the dyad. Conform expectations, we find that from the perspective of the
customer, customer participation is less beneficial in case of customer-as-competitor

Chapter 3 – Customer Participation in Outsourced NPD: The Role of Relationship Multiplexity
76
multiplexity. Thus, in the eyes of the customer, the potential benefits of customer-as-
competitor multiplexity appear to be overshadowed by role conflict. From the
perspective of the supplier, however, it does not matter whether the participating
customer is also a competitor. Neither the main effect of a competitor tie nor the
interaction with customer participation is significant. The lack of support for our
hypothesis at the supplier side questions our initial argument that the conflict between
the participating-customer role (sharing knowledge) and the competitor role
(protecting knowledge) hinders effective resource sharing. Then, how can we explain
why the role conflict leads to a negative appraisal of the outcome by the customer, and
not by the supplier? Although firm conclusions require additional evidence, we offer an
alternative explanation rooted in the nature of the outsourcing relationship, where the
supplier agrees to develop a new product for the customer in exchange for payment.
The customer, on the one hand, may consider resource sharing with a competitor as an
important cost, which devalues the project outcome. The supplier, on the other hand,
may not view resource sharing with a competing customer as a cost because it is
financially compensated according to the terms of the outsourcing contract.
Does customer participation help or hurt in case of customer-as-supplier multiplexity?
Our theorizing and empirical analyses indicate that role-reversal ties lower the
effectiveness of customer participation. A situation where the customer is also a
supplier to its supplier, and the supplier is also a customer to its customer, creates role
ambiguity. When the customer is unsure about what is appropriate behavior, the
participating-customer role is likely to be played in an ineffective way. The same holds
for the supplier. As a result, supplier task performance decreases.
In addition to the hypothesized effects, we find that when the supplier executes
more concurrent projects for a customer, the supplier’s self-reported task performance
improves with customer participation. We speculate that executing concurrent projects
offers a supplier access to additional customer knowledge, which the supplier can use to
perform better in the focal project (cf. Tuli, Bharadwaj, and Kohli 2010). In contrast, the
participating customer’s perception of supplier task performance declines when the
supplier executes more concurrent projects for the customer. Possibly, when multiple
concurrent projects are executed, the customer expects that the supplier is sufficiently
familiar with its situation to meet customer demands without customer participation.

Chapter 3 – Customer Participation in Outsourced NPD: The Role of Relationship Multiplexity
77
Limitations and Opportunities for Further Research
The study suffers from a number of limitations, which offer interesting avenues for
future research. First, although our sample involves multiple NPD projects for multiple
customers, we only considered outsourced NPD projects executed by one supplier firm
active in a single industry, which warrants caution regarding the generalizability of the
findings. However, focusing on one firm allowed us to collect very detailed and rich
information about the relationships between the firm and the multiple customers
included in the sample. In addition, we achieved greater comparability of key variables
by controlling for organizational and environmental factors. To gain confidence in the
broader applicability of our findings, it would be desirable for follow-up studies to
collect information from multiple companies and across multiple industries.
Nevertheless, it is comforting that the qualitative insights that we obtained in the
roundtables and in-depth interviews with executives and project managers from three
different industries showed great similarity across these industries.
Second, future research could investigate the specific reasons for differences across
the dyad. Why do customers evaluate customer participation more positively than
suppliers? Why is customer-as-competitor multiplexity not an issue in the eyes of the
supplier, but detrimental in the eyes of the customer? We offered possible explanations
for the differential effects, but firm conclusions require additional evidence.
Third, we focused on the effects of customer participation on supplier task
performance. Although this is an important outcome variable in the context of
outsourced NPD (see e.g. also Carson 2007), future research could study other
outcomes, such as knowledge development, innovativeness of the end product, costs of
the NPD process, repeat orders, and customer lifetime value.
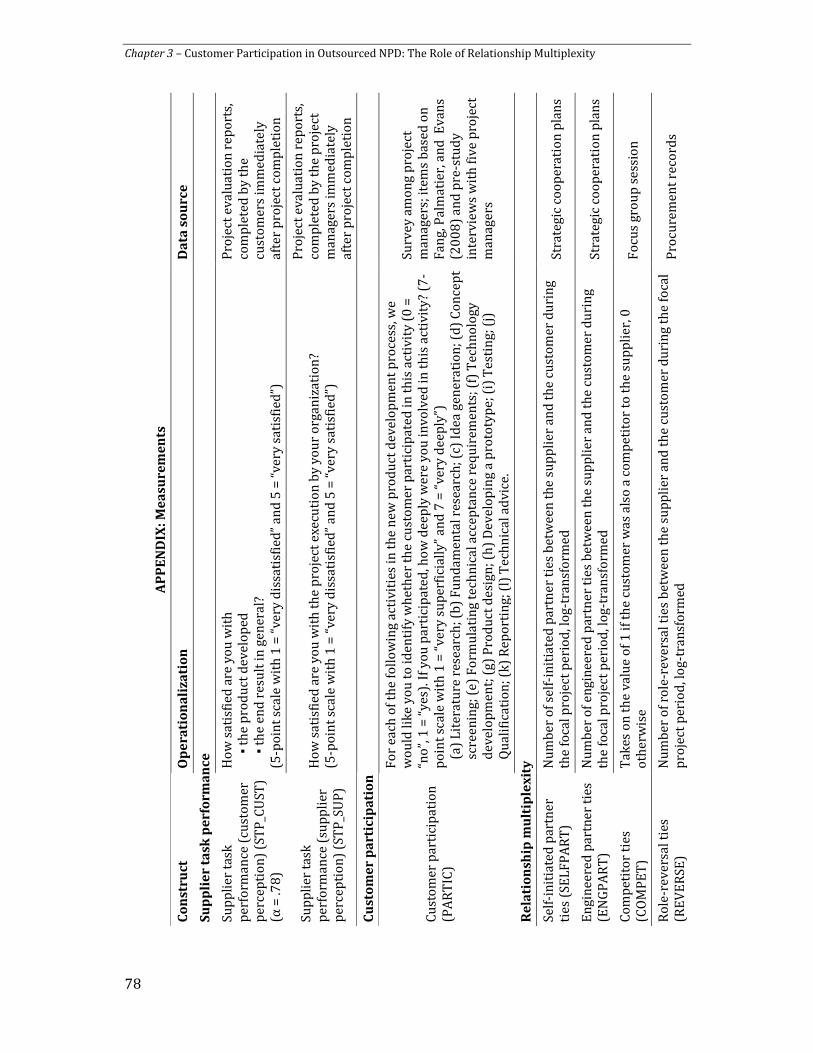
Chapter 3 – Customer Participation in Outsourced NPD: The Role of Relationship Multiplexity
78
AP
PE
ND
IX:
Me
asu
rem
en
ts
Co
nst
ruct
O
pe
rati
on
ali
za
tio
n
Da
ta s
ou
rce
Su
pp
lie
r ta
sk p
erf
orm
an
ce
Sup
pli
er t
ask
per
form
ance
(cu
sto
mer
p
erce
pti
on
) (S
TP
_CU
ST)
(α =
.78
)
Ho
w s
atis
fied
are
yo
u w
ith
▪ t
he
pro
du
ct d
evel
op
ed
▪
th
e en
d r
esu
lt in
gen
eral
? (5
-po
int
scal
e w
ith
1 =
“ve
ry d
issa
tisf
ied
” an
d 5
= “
very
sat
isfi
ed”)
Pro
ject
eva
luat
ion
rep
ort
s,
com
ple
ted
by
the
cust
omer
s im
med
iate
ly
afte
r p
roje
ct c
omp
leti
on
Sup
pli
er t
ask
per
form
ance
(su
pp
lier
p
erce
pti
on
) (S
TP
_SU
P)
Ho
w s
atis
fied
are
yo
u w
ith
th
e p
roje
ct e
xecu
tio
n b
y yo
ur
org
aniz
atio
n?
(5
-po
int
scal
e w
ith
1 =
“ve
ry d
issa
tisf
ied
” an
d 5
= “
very
sat
isfi
ed”)
Pro
ject
eva
luat
ion
rep
ort
s,
com
ple
ted
by
the
pro
ject
m
anag
ers
imm
edia
tely
af
ter
pro
ject
com
ple
tio
n
Cu
sto
me
r p
art
icip
ati
on
Cu
sto
mer
par
tici
pat
ion
(P
AR
TIC
)
Fo
r ea
ch o
f th
e fo
llo
win
g ac
tivi
ties
in t
he
new
pro
du
ct d
evel
op
men
t p
roce
ss, w
e w
ou
ld li
ke y
ou
to
iden
tify
wh
eth
er t
he
cust
om
er p
arti
cip
ated
in t
his
act
ivit
y (0
=
“no
”, 1
= “
yes)
. If y
ou
par
tici
pat
ed, h
ow
dee
ply
wer
e yo
u in
volv
ed in
th
is a
ctiv
ity?
(7
-p
oin
t sc
ale
wit
h 1
= “
very
su
per
fici
ally
” an
d 7
= “
very
dee
ply
”)
(a
) L
iter
atu
re r
esea
rch
; (b
) F
un
dam
enta
l res
earc
h; (
c) I
dea
gen
erat
ion
; (d
) C
on
cep
t
sc
reen
ing;
(e)
Fo
rmu
lati
ng
tech
nic
al a
ccep
tan
ce r
equ
irem
ents
; (f)
Tec
hn
olo
gy
d
evel
op
men
t; (
g) P
rod
uct
des
ign
; (h
) D
evel
op
ing
a p
roto
typ
e; (
i) T
esti
ng;
(j)
Qu
alif
icat
ion
; (k)
Rep
ort
ing;
(l)
Tec
hn
ical
ad
vice
.
Surv
ey a
mo
ng
pro
ject
m
anag
ers;
item
s b
ased
on
F
ang,
Pal
mat
ier,
an
d E
van
s (2
00
8)
and
pre
-stu
dy
inte
rvie
ws
wit
h f
ive
pro
ject
m
anag
ers
Re
lati
on
ship
mu
ltip
lex
ity
Self
-in
itia
ted
par
tner
ti
es (
SEL
FP
AR
T)
Nu
mb
er o
f sel
f-in
itia
ted
par
tner
tie
s b
etw
een
th
e su
pp
lier
an
d t
he
cust
omer
du
rin
g th
e fo
cal p
roje
ct p
erio
d, l
og-
tran
sfo
rmed
St
rate
gic
coo
per
atio
n p
lan
s
En
gin
eere
d p
artn
er t
ies
(EN
GP
AR
T)
Nu
mb
er o
f en
gin
eere
d p
artn
er t
ies
bet
wee
n t
he
sup
pli
er a
nd
th
e cu
sto
mer
du
rin
g th
e fo
cal p
roje
ct p
erio
d, l
og-
tran
sfo
rmed
St
rate
gic
coo
per
atio
n p
lan
s
Com
pet
ito
r ti
es
(CO
MP
ET
) T
akes
on
th
e va
lue
of
1 if
th
e cu
sto
mer
was
als
o a
co
mp
etit
or
to t
he
sup
pli
er, 0
o
ther
wis
e F
ocu
s gr
ou
p s
essi
on
Ro
le-r
ever
sal t
ies
(RE
VE
RSE
) N
um
ber
of r
ole
-rev
ersa
l tie
s b
etw
een
th
e su
pp
lier
an
d t
he
cust
om
er d
uri
ng
the
foca
l p
roje
ct p
erio
d, l
og-
tran
sfo
rmed
P
rocu
rem
ent
reco
rds

Chapter 3 – Customer Participation in Outsourced NPD: The Role of Relationship Multiplexity
79
AP
PE
ND
IX:
Me
asu
rem
en
ts –
co
nti
nu
ed
Co
ntr
ol
va
ria
ble
s (p
roje
ct
ch
ara
cte
rist
ics)
Pro
ject
siz
e (P
R_S
IZE
) P
roje
ct b
ud
get
in $
/ 1
00
,00
0, l
og-
tran
sfo
rmed
P
roje
ct a
dm
inis
trat
ion
re
cord
s
Exp
ecte
d
inn
ova
tive
nes
s
(IN
NO
V)
▪
At
the
star
t o
f th
is p
roje
ct, i
t w
as e
xpec
ted
th
at a
rev
olu
tio
nar
y ch
ange
in
tech
no
logy
wo
uld
be
nec
essa
ry.
▪
At
its
star
t, it
was
exp
ecte
d t
hat
th
is p
roje
ct w
ou
ld m
eet
cust
omer
req
uir
emen
ts in
a
sup
erio
r w
ay.
Surv
ey a
mo
ng
pro
ject
m
anag
ers
Pro
ject
tim
e p
ress
ure
(T
IME
_PR
ESS
) ▪
In t
his
pro
ject
, th
e cu
sto
mer
pu
t u
s u
nd
er g
reat
tim
e p
ress
ure
. Su
rvey
am
on
g p
roje
ct
man
ager
s
Co
ntr
ol
va
ria
ble
s (c
ust
om
er
ch
ara
cte
rist
ics)
Cu
sto
mer
siz
e (C
US_
SIZ
E)
Nu
mb
er o
f em
plo
yees
/ 1
0,0
00
, lo
g-tr
ansf
orm
ed
An
nu
al r
epo
rts
Ex
ante
cu
sto
mer
in
vest
men
ts (
INV
)
(α =
.87
)
▪
Th
e cu
sto
mer
had
alr
ead
y in
vest
ed h
eavi
ly in
th
e te
chn
olo
gy b
efo
re w
e w
ere
bro
ugh
t in
. ▪
Th
e cu
sto
mer
had
alr
ead
y d
evel
op
ed t
he
pro
ject
to
a la
rge
exte
nt
bef
ore
th
e
cust
om
er h
ired
us.
▪
Th
e cu
sto
mer
had
alr
ead
y ex
ecu
ted
a lo
t o
f R&
D b
efo
re t
he
cust
omer
ou
tsou
rced
th
e p
roje
ct t
o u
s.
Surv
ey a
mo
ng
pro
ject
m
anag
ers
Cu
sto
mer
invo
lvem
ent
in p
roje
ct-p
lan
d
evel
op
men
t (P
LA
N)
(α
= .8
1)
▪
Bef
ore
th
e st
art
of t
his
pro
ject
, all
pro
ject
pla
n c
om
po
nen
ts w
ere
set
in c
lose
co
op
erat
ion
wit
h t
he
cust
om
er.
▪
Bef
ore
th
e st
art
of t
his
pro
ject
, all
pro
ject
ph
ases
wer
e d
iscu
ssed
in d
etai
l wit
h t
he
cust
om
er.
Surv
ey a
mo
ng
pro
ject
m
anag
ers
Co
ncu
rren
t p
roje
cts
(CO
NC
UR
R)
Nu
mb
er o
f pro
ject
s o
ther
th
an t
he
foca
l pro
ject
th
e su
pp
lier
car
ries
ou
t fo
r th
e cu
sto
mer
du
rin
g th
e fo
cal p
roje
ct p
erio
d, l
og-
tran
sfo
rmed
P
roje
ct a
dm
inis
trat
ion
re
cord
s
No
te: A
ll it
ems
are
mea
sure
d o
n a
7-p
oin
t sc
ale,
wit
h 1
= c
om
ple
tely
dis
agre
e an
d 7
= c
om
ple
tely
agr
ee, u
nle
ss o
ther
wis
e in
dic
ated
.


81
At last the Dodo said,
“Everybody has won, and all must have prizes.”
Lewis Carroll, Alice’s Adventures in Wonderland, Chapter 3
Chapter 4
Managing the Crowd:
Prize Structure and Creativity
In Online Idea Generation Contests11
4.1 INTRODUCTION
Fueled by developments in Web 2.0 technologies, many firms are now using online
idea generation contests, a form of crowdsourcing in which individuals external to the
firm generate ideas (Howe 2006, 2008; Poetz and Schreier 2012). In an online idea
generation contest, a company (contest sponsor) posts an idea generation challenge,
which is open to the general public. The disclosure of the challenge as an open call
reaches many individuals with diverse knowledge bases and skills (Girotra, Terwiesch,
and Ulrich 2010; Jeppesen and Lakhani 2010; Terwiesch and Xu 2008). The challenge
specifies the ideation task and the prize structure. At the end of the contest, the contest
sponsor awards prizes to one (or more) contestant(s).
Online idea generation contests are growing in popularity across diverse industries
(Lowry 2011). For example, since 2008, Frito-Lay has organized multiple ‘Do Us A
Flavor’ contests to generate ideas for flavors for potato chips in the United States,
11
We thank the senior executives of the online idea generation contest platform company for insightful discussions and for providing access to confidential data. We also thank seminar participants at McCombs Business School for useful feedback on the research. Further, we acknowledge useful inputs from Sandeep Arora, Gary Lilien, Raj Raghunathan, Gaia Rubera, and Debika Sihi on a previous version of this article.
Chapter 4 – Managing the Crowd: Prize Structure and Creativity in Online Idea Generation Contests
82
Australia, Spain, The Netherlands, and the United Kingdom, which generate between
300,000-800,000 submissions per contest. In 2012, Titan Inc., a Tata Group company in
India, organized an online contest for their jewelry brand ‘Tanishq’ which resulted in
over 3,000 product design ideas within just six weeks. In 2011, Schiphol Airport in
Amsterdam, Netherlands, organized an online contest to generate ideas for their new
terminal, which resulted in 125 entries.
A McKinsey and Company survey of companies using online innovation contests
indicated that motivating contestants is the key challenge in effective contest design
(McKinsey 2009, p. 53). As contestants of online contests do not receive any upfront or
guaranteed payment for their efforts, they are motivated by the possibility of winning a
prize (Afuah and Tucci 2012). Hence, a key design element of an online idea generation
contest is its prize structure. Comparing the prize structures of various online idea
generation contests, we observe that prize structures vary in terms of three
characteristics: the total prize value, the number of prizes, and the prize spread (i.e., the
variance in the values of the different prizes). In this essay, we study the effects of these
three prize structure characteristics of online idea generation contests on idea creativity.
Insights on increasing creativity in online idea generation contests have high
managerial relevance. Idea creativity is considered a core element of the fuzzy front end
of the innovation process (Im and Workman 2004). Historically, firms have relied
primarily on their employees as a source of new product ideas (Burroughs et al. 2011).
However, using employees for idea generation has some limitations. People tend to
interpret information and develop new ideas in terms of existing frames (Reeves and
Weisberg 1993). Employees tend to explore familiar rather than novel paths as they are
constrained by their experiences with their company’s technologies, products, and
resource constraints. In addition, the employees’ potential involvement in the
implementation of the idea may also constrain their creativity. In contrast, participants
in online idea generation contests are free agents, unaffiliated with the contest sponsor,
and may be able to generate very creative ideas.
The study’s findings also have the potential to extend the marketing literature.
While idea generation is central to the “fuzzy front end” of the new product
development process (Toubia 2006), there are only limited insights on idea generation

Chapter 4 – Managing the Crowd: Prize Structure and Creativity in Online Idea Generation Contests
83
by sources external to the firm. In a recent conceptual paper, Afuah and Tucci (2012)
identify conditions under which crowdsourcing outperforms internal sourcing and
designated contracting (with suppliers) in idea generation. There is also some emergent
evidence of the benefits of crowdsourcing. Bayus (2013) reports that online community
members contribute high quality new product ideas and Poetz and Schreier (2012)
report that user-generated ideas are on par (in terms of novelty and customer benefits)
with those generated by professionals. Yet, to the best of our knowledge, there is no
evidence of how prize structures affect the creative outcomes of idea generation by
external sources, the issue we focus on in this essay.
We define creativity as the degree to which something is novel, unusual, or original,
and differs from existing solutions to a problem (Marsh, Ward, and Landau 1999;
Oldham and Cummings 1996). Whereas other conceptualizations of creativity have also
included a meaningfulness dimension (e.g., Amabile 1996; Burroughs, Moreau, and Mick
2008; Im and Workman 2004), we focus on the novelty dimension of creativity for two
reasons. First, prior research (Shalley and Zhou 2008) has argued that novelty is the
primary dimension of creativity, especially in the idea generation process (Shah, Smith,
and Vargas-Hernandez 2003). Second, the main objective of organizing an online idea
generation contest is to avoid the myopic focus of the company’s employees and
develop really novel ideas (Jeppesen and Lakhani 2010; Terwiesch and Xu 2008).
Extending developments in organizational theory (e.g., Malhotra 2010), psychology
(e.g., Amabile 1996; Deci and Ryan 1985), and economics (e.g., Lazear and Rosen 1981),
we examine the effects of a contest’s total prize value, number of prizes, and prize
spread on the creativity of the ideas submitted in the contest. We hypothesize that the
total prize value and number of prizes of an online idea generation contest will increase
idea creativity, while prize spread will decrease idea creativity. Furthermore, we
hypothesize that the three prize structure characteristics of the contest will interact
with each other to affect idea creativity.
The empirical context is an online contest platform used by companies (i.e., contest
sponsors) to field idea generation challenges to a community of about 10,000
contestants. The contest platform is used for idea generation for products, packaging,
brand identity, and advertising copy. We collected data on 106 online contests using the

Chapter 4 – Managing the Crowd: Prize Structure and Creativity in Online Idea Generation Contests
84
contest briefs provided by the contest sponsors and contestants’ submissions. We take
into account the possibility that the prize structure of the contest may not only increase
idea creativity, but also attract more contestants. We address this endogeneity concern
by using a system estimation procedure to model idea creativity and the number of
contestants. The results strongly support the hypotheses. Further, the results are robust
to alternative measures of idea creativity and explanatory variables, and alternative
model specifications.
We proceed as follows. We first propose theory and hypotheses that link the prize
structure characteristics of online idea generation contests to idea creativity. Next, we
discuss the data, measures, and method used to test the hypotheses. We then present
the results and additional robustness analyses. We conclude with a discussion of the
essay’s managerial implications, theoretical contributions, and limitations and
opportunities for future research.
4.2 THEORY AND HYPOTHESES
Although some early scholars (Vinacke 1953; Wertheimer 1945) considered
creativity to be a mysterious process, subsequent work has generated a large body of
insights on the factors influencing creative behaviors. Motivation is considered to be a
key factor that affects creative performance (Amabile 1996; Deci and Ryan 1985;
Vallerand 1997). Contextual factors of the task environment, such as rewards, can
increase or decrease motivation and thereby, affect creative performance (Amabile,
Hennessey, and Grossman 1986; Burroughs et al. 2011; Eisenberger and Armeli 1997).
Zhou and Shalley (2003) provide a review of the past literature on the effects of
rewards on creativity in noncompetitive contexts.
Motivation increases the time and effort that contestants may be willing to invest in
the idea generation task (cf. Shalley 1995), which will, ceteris paribus, increase idea
creativity. We identify four sources of motivation in online idea generation contests.
First, a contest’s prize structure may increase contestants’ efforts because of the
monetary value at stake in the contest (Eisenberger and Armeli 1997). Second, the heat
of the competition in the contest (i.e., rivalry among contestants) may also be another
motivator (Malhotra 2010). Third, the prospect of getting social recognition by winning
a prize in the contest may also motivate contestants (Amabile, Hennessey, and

Chapter 4 – Managing the Crowd: Prize Structure and Creativity in Online Idea Generation Contests
85
Grossman 1986). In addition, prizes in contests offer contestants opportunities for
positive self-confirmation of their creative competency (Deci and Ryan 1985), which
should increase their motivation to invest time and effort in the idea generation task.
Applying these arguments, we propose main effects of the total value of all prizes,
the number of prizes, and prize spread among the prizes on idea creativity, as well as
interaction effects between the three prize structure characteristics on idea creativity.
Total Prize Value
We define the total prize value as the sum of the amounts across the different prizes
in the contest. We propose multiple mechanisms by which the total prize value in the
contest will increase idea creativity. First, a high total prize value has obvious monetary
advantages that may motivate contestants to work hard and long to increase their
chances of winning in the contest (Eisenberger and Armeli 1997).
Second, a high total prize value increases the heat of the competition (Malhotra
2010), which will motivate contestants to expend more effort and time in the contest
(Boudreau, Lacetera, and Lakhani 2011).
Third, the literature on creativity indicates that individuals are motivated by the
prospect of social recognition (Amabile 1996; Amabile, Hennessey, and Grossman 1986).
Developments in the Web 2.0 literature suggest that building an online reputation of
competency is an important motivation for online contributors of content (Dellarocas
2003; Yoganarasimhan 2012). Similarly, free agent contestants of online idea
generation contests may be motivated by the social recognition and reputational effects
associated with winning a prize. The total prize value of a contest reflects the contest’s
prestige, enhancing the social recognition derived from being a winner in the contest.
Thus, we expect that an increase in the total prize value of the online idea generation
contest increases the efforts invested by contestants in generating ideas.
Fourth, winning an online idea generation contest with a high total prize value
sends a strong positive signal to the contestant about her creative competency,
increasing her motivation (Deci and Ryan 1985) to invest time and effort in the idea
generation task. Hence, we offer H1:

Chapter 4 – Managing the Crowd: Prize Structure and Creativity in Online Idea Generation Contests
86
H1: The higher the total prize value in the online idea generation contest, the
higher the idea creativity of the contest
Number of Prizes
A second prize structure characteristic of online idea generation contests is the
number of prizes. Holding the total prize value constant, although an increase in the
number of prizes dilutes the average value of the prizes, the probability of winning a
prize increases. We argue that there may be several advantages associated with
increasing the number of prizes with regard to idea creativity.
First, as discussed in the development of H1 above, winning a prize may enhance
contestants’ online reputations by providing them social recognition. A contest with
more prizes increases contestants’ opportunities for social recognition. As the
opportunity for social recognition motivates contestants, contestants will likely invest
more time and effort in the task, increasing their creativity.
Second, individuals prefer situations that are more likely to result in self-enhancing
outcomes (Pfeffer and Fong 2005). Since multiple prizes offer more possibilities to
contestants to confirm their creative abilities to themselves, contestants may also be
more motivated as a result of the prize structure (Deci and Ryan 1985), again increasing
their creativity. In sum, we expect that increasing the number of prizes in an online idea
generation contest will increase idea creativity. Accordingly, we hypothesize H2:
H2: The higher the number of prizes in the online idea generation contest, the
higher the idea creativity of the contest
Prize Spread
We define the prize spread as the variation in the value of the different prizes in the
contest. When multiple prizes are awarded in an online idea generation contest, this
may be through a “grouped-winner” or a “rank-order” prize structure (Clark and Riis
1998; Lazear and Rosen 1981). An example of grouped-winner prize structure is a
contest in which all (say five) winners get the same prize of $600 (zero prize spread) for
a total prize value of $3,000. An example of a rank-order prize structure is a contest
where the $3,000 is split into five unequal prizes of $1250, $750, $500, $350, and $150

Chapter 4 – Managing the Crowd: Prize Structure and Creativity in Online Idea Generation Contests
87
(prize spread = .71, as measured by the coefficient of variation of the different prizes, i.e.,
standard deviation scaled by the mean).
Following Festinger’s (1954) theory of social comparison, we propose that the
value of a prize to a contestant in an online idea generation contest serves as an
indicator of the contestant’s competence relative to other contestants. In online contests
with a high prize spread, low ranked winners may receive less social recognition since a
high prize spread may result in unflattering upward social comparisons (Collins 1996).
Thus, in contests with a high prize spread, the prospect of being a runner-up or a lower
ranked winner may therefore weaken the effectiveness of prizes as motivators. Hence,
contestants may be less motivated to invest time and effort in the task, decreasing idea
creativity.
In addition, when a contest has a high prize spread, the (many) low ranked winners
may not perceive themselves as ‘true’ winners when they engage in upward social
comparisons with the high ranked winners. Hence, a high prize spread reduces
opportunities for self-confirmation of contestants’ creative competence, decreasing
their motivation. In other words, in contests with low prize spread, contestants may be
more motivated to invest time and effort, increasing idea creativity, because the
negative impact of potentially negative social comparisons is low when winning a low
ranked prize (which is close in value to the high ranked prize). Thus, we hypothesize H3:
H3: The higher the prize spread in the online idea generation contest, the lower
the idea creativity of the contest
Interactions between Prize Structure Characteristics
Total prize value and number of prizes. Recall that as we discussed in H1, a high total
prize value in the contest has a monetary advantage, increases the heat of competition,
provides high social recognition, and sends a strong signal of self-confirmation to the
winners, all of which increase idea creativity.
We propose that these four mechanisms by which total prize value affects idea
creativity are weakened as the number of prizes increases. First, an increase in the total
prize value offers less monetary advantage when this increase is to be divided across a
high number of prizes. Second, the heat of competition effect of a high total prize value

Chapter 4 – Managing the Crowd: Prize Structure and Creativity in Online Idea Generation Contests
88
on idea creativity is undermined when the number of prizes is high: the large number of
prizes reduces the need to compete for a piece of the pie. Third, the social recognition
stemming from an increase in total prize value is weakened by a high number of prizes
as multiple winners have to share the prestige of winning. Fourth, for similar reasons,
the signal of self-confirmation of contestants’ creative competence associated with
winning a contest with high total prize value is weakened when the high total prize
value is to be divided among many contestants.
In sum, we expect that the motivating mechanisms of monetary advantage, heat of
competition, social recognition, and self-confirmation on idea creativity, all associated
with higher total prize value, are weakened by the number of prizes. As a result, we
expect that the positive effect of total prize value on the time and effort vested in
generating creative ideas, and thus on the creativity of the contest, is weakened as the
number of prizes increases. Thus, we propose H4:
H4: The higher the number of prizes in the online idea generation contest, the
weaker the positive effect of total prize value on idea creativity of the contest
Total prize value and prize spread. We propose that the positive effect of total prize
value on idea creativity of the contest will also be weakened by a high prize spread.
Relative to low prize spread, when the prize spread is high, increasing the total
prize value of the contest increases the difference between any given prize and the one
ranked next to it, which we illustrate using two examples. Consider moving from a
contest where the total prize value of $3,000 is split into five equal prizes of $600 (prize
spread = 0) to one where the total prize value of $4,000 is split into five equal prizes of
$800 (again prize spread = 0). The prize spread remains unchanged, at zero. Now,
consider moving from a contest where the total prize value of $3,000 is split into five
unequal prizes of $1250, $750, $500, $350, and $150 (prize spread = .71, measured as
the coefficient of variation) to one where the total prize value of $4,000 is split into five
unequal prizes of $1667, $1000, $666, $467, and $200 (again prize spread = .71). The
average difference between two adjacent prizes is larger in the latter contest ($367)
than in the former contest ($275). These examples illustrate that increasing total prize
value in an online idea generation contest with high prize spread exacerbates the
problem of negative upward social comparisons, decreasing opportunities for social

Chapter 4 – Managing the Crowd: Prize Structure and Creativity in Online Idea Generation Contests
89
recognition and reducing motivation. More pronounced negative upward comparisons
also decrease the opportunity to confirm one’s creative competency. Consequently,
contestants are likely to be less motivated to invest less time and effort in the task,
reducing idea creativity. In sum, given these different arguments, we expect that the
positive effect of increasing total prize value in online contests will be weakened as the
prize spread in the contest increases. Accordingly, we hypothesize H5:
H5: The higher the prize spread in the online idea generation contest, the weaker
the positive effect of total prize value on idea creativity of the contest
Number of prizes and prize spread. Finally, we propose that the negative effect of
prize spread on idea creativity is weaker in contests with more prizes.
We propose that controlling for the total prize value, increasing the number of
prizes in contests with high prize spread is likely to decrease the salience of the
difference between any given prize and the one ranked next to it. As an illustration,
compare a contest where the total prize value of $3,000 is split into five unequal prizes
of $1250, $750, $500, $350, and $150 (prize spread = .71) with a contest where the total
prize value of $3,000 is split into six unequal prizes of $1050, $725, $550, $375, $225,
and $75 (prize spread = .71). In the contest with five prizes, the average difference
between two adjacent prizes is $275, whereas in a contest with six prizes, the average
difference between two adjacent prizes is lower at $195. We propose that the social
recognition problem associated with an increased prize spread hypothesized in H3 is
weakened when the number of prizes in the contest increases, because the upward
social comparisons for contestants are more favorable when the distance to the next
higher prize in the contest is smaller. As a result, contestants’ motivation is higher in
contests with many prizes and high prize spread, compared to contests with few prizes
and high prize spread.
Similarly, more favorable upward social comparisons for contestants may increase
the opportunities for confirmation of their creative competence, thereby increasing
their motivation to expend time and effort in the contest, increasing idea creativity. In
sum, given these different arguments, we expect that the negative effect of increasing
prize spread in online contests will be weakened as the number of prizes increases.
Accordingly, we propose H6:

Chapter 4 – Managing the Crowd: Prize Structure and Creativity in Online Idea Generation Contests
90
H6: The higher the number of prizes in the online idea generation contest, the
weaker the negative effect of prize spread on idea creativity of the contest
4.3 METHOD
Empirical Context
We obtained access to a sample of idea generation contests from an online contest
platform. The online idea generation contest platform was launched in early 2008 and
had about 10,000 international contestants in their community by December 2011, the
end of the observation period. Using data from a single contest platform rules out
potential biases caused by unobserved differences across contest platforms.
The contest platform hosts online idea generation contests for product innovation,
new packaging design, brand identity, and advertising copy, for contest sponsors from
many countries including the United States, Canada, Australia, Russia, the United
Kingdom, Germany, Italy, The Netherlands, Sweden, and South Africa. For example, in a
contest for new diabetic monitors, the content sponsor sought product ideas for
integrated sensors (e.g., in clothes or glasses). In a contest for new packaging for an
existing food product, contestants developed ideas for new packaging including wrap,
box, etc. We provide a fictionalized example of a contest and a submission for the
contest in the Appendix.12
The contest sponsor sets the contest’s prize structure and task constraints, which
are then posted on the contest platform’s website. A contestant works independently
and submits his or her idea(s) to the contest platform before the contest deadline.
Intellectual property rights are assigned to the contest sponsor when the ideas are
submitted to the contest. Following the contest deadline, the contest sponsor awards
(one or more) prizes to the contestants.
The majority of contestants are male (68% vs. 32% female; with 12% missing data).
They are on average 33.2 years old (standard deviation (s.d.) = 11.2; with 11% missing
data) and come from various countries including the United States, Canada, Mexico,
Australia, several European countries, and Asian countries including India and China. 23%
12 We show a representative, fictionalized example of the contest as our confidentiality agreement with the online contest platform company precludes disclosure of contest details.

Chapter 4 – Managing the Crowd: Prize Structure and Creativity in Online Idea Generation Contests
91
of the contestants disclose their profession; 54% of these contestants are professionally
active in design/art/creativity. 38% of the contestants submitted ideas for more than
one contest.
Sample and Measures
We use a sample of 106 online idea generation contests, executed between July
2008 and December 2011. The sample includes 84% of all contests in this period on the
contest platform.13 We have access to all submissions (n = 5,299) for the 106 contests;
623 of these submissions were judged as winners by the contest sponsors. We use data
from the contest briefs and submissions for the measures. Table 4.1 provides an
overview of the variables and measures in the study. Table 4.2 contains the descriptive
statistics and the correlation matrix of the measures.
The contest briefs include details of the idea generation task, the start and end
dates of the contest, and the number and value of the prizes. Total prize value
(TOTAL_PRIZE_VALUE; mean = 3,990, minimum = 500, maximum = 21,500, s.d. = 4,252)
is the sum of the value of all prizes as measured in points which can be redeemed for
cash through the contest platform for an exchange rate of 1 point = $.20. Thus, the mean
value of the total prize value is $798, which is comparable to those on other contest
platforms such as Brandsupply ($565, for design ideas), 99designs ($411, for design
ideas), Crowdspring ($1112, for website ideas), and CreatAd (€1753, for ad ideas).
Number of prizes (NO_PRIZES; mean = 6.09, s.d. = 6.53) is a count variable. Prize spread
(PRIZE_SPREAD; mean = .67, s.d. = .42) is calculated as the coefficient of variation: the
standard deviation of the values of all prizes, divided by the average prize value, which
controls for any scale effects. We log-transform total prize value and number of prizes
to account for skewedness.
As many of the ideas generated in contests may be mediocre, the success of an online
idea generation contest depends on the most creative idea and not on the mean
creativity of all ideas generated in the contest (Dahan and Mendelson 2001; Girotra,
13 Twelve contests fielded on the platform in the time period are not included in the study as they pertained to a very simple task of new brand name generation. We were unable to obtain data on the dependent variable (idea creativity) for eight idea generation contests because of a technical malfunction in the contest platform’s database. There were no significant differences for total prize value, number of prizes and prize spread between the 106 contests in our sample and the excluded twenty contests.

Chapter 4 – Managing the Crowd: Prize Structure and Creativity in Online Idea Generation Contests
92
TA
BL
E 4
.1:
Va
ria
ble
s a
nd
Me
asu
res
Var
iab
le
Nam
e M
easu
re
Dep
end
ent
Va
ria
ble
C
reat
ivit
y
CR
EA
TIV
ITY
o
ver
the
win
nin
g
idea
s in
a c
onte
st, w
her
e i i
nd
icat
es e
xper
t ju
dge
(i
= 1
-10
)
Idea
Ori
gin
alit
y
OR
IGIN
AL
ITY
i “H
ow
ori
gin
al is
th
is id
ea?”
(1
=n
ot
at a
ll; 7
=ve
ry),
by
exp
ert
jud
ge i
(i =
1–1
0),
am
on
g w
inn
ing
idea
s
Idea
Un
usu
aln
ess
UN
US
UA
LN
ES
Si
“Ho
w u
nu
sual
is t
his
idea
?” (
1=
no
t at
all
; 7=
very
), b
y ex
per
t ju
dge
i (i
= 1
–10
),
amo
ng
win
nin
g id
eas
Idea
No
velt
y N
OV
EL
TY
i “H
ow
no
vel i
s th
is id
ea?”
(1
=n
ot
at a
ll; 7
=ve
ry),
by
exp
ert
jud
ge i
(i =
1–1
0),
am
on
g w
inn
ing
idea
s
Pri
ze S
tru
ctu
re V
ari
ab
les
T
ota
l Pri
ze V
alu
e T
OT
AL
_PR
IZE
_VA
LU
E
Sum
of a
ll a
war
ded
po
ints
for
all p
rize
s (l
og-
tran
sfo
rmed
)
Nu
mb
er o
f Pri
zes
NO
_PR
IZE
S
Nu
mb
er o
f aw
ard
s (l
og-
tran
sfo
rmed
)
Pri
ze S
pre
ad
PR
IZE
_SP
RE
AD
C
oef
fici
ent
of
vari
atio
n;
, wh
ere
σ is
th
e st
and
ard
dev
iati
on
of
all p
rize
valu
es a
nd
μ is
th
e m
ean
pri
ze v
alu
e.
Co
ntr
ol
Va
ria
ble
s
Nu
mb
er o
f Con
test
ants
N
O_C
ON
TE
ST
AN
TS
N
um
ber
of c
onte
stan
ts (
log-
tran
sfo
rmed
)
New
Tas
k D
um
my
NE
WT
AS
K_D
UM
D
um
my
taki
ng
on
1 fo
r n
ew id
eas,
0 fo
r re
do
’s fo
r ex
isti
ng
pro
du
cts/
con
cep
ts
Co
nte
st B
rief
Len
gth
L
EN
GT
H
Nu
mb
er o
f wo
rds
in c
on
test
bri
ef (
excl
ud
ing
spo
nso
r p
rofi
le)
(lo
g-tr
ansf
orm
ed)
Inst
ruct
ion
Gu
idan
ce
INS
TR
UC
T
Nu
mb
er o
f in
pu
t co
nst
rain
ts in
th
e b
rief
(co
din
g ex
erci
se)
Tar
get
Ou
tco
me
TA
RG
ET
N
um
ber
of o
utp
ut
con
stra
ints
in t
he
bri
ef (
cod
ing
exer
cise
)
Co
nte
st S
po
nso
r R
epu
tati
on
R
EP
UT
AT
ION
N
um
ber
of h
its
in G
oo
gle
on
th
e fi
nal
day
of t
he
con
test
(lo
g-tr
ansf
orm
ed)
Nu
mb
er o
f Pic
ture
s in
Bri
ef
PIC
TU
RE
S
Nu
mb
er o
f pic
ture
s in
con
test
bri
ef
Co
nte
st D
ura
tion
D
UR
AT
ION
C
on
test
du
rati
on
in n
um
ber
of d
ays
(lo
g-tr
ansf
orm
ed)
Co
mm
un
ity
Size
C
OM
MU
NIT
Y_S
IZE
N
um
ber
of c
om
mu
nit
y m
emb
ers
of c
on
test
pla
tfo
rm a
t st
art
dat
e (l
og-
tran
sfo
rmed
)

Chapter 4 – Managing the Crowd: Prize Structure and Creativity in Online Idea Generation Contests
93
TA
BL
E 4
.2:
De
sc
rip
tiv
e S
tati
sti
cs
an
d C
or
re
lati
on
s
Me
an
S
D
Min
M
ax
1
2
3
4
5
6
7
8
9
1
0
11
1
2
13
1 C
reat
ivit
y 4
.52
.5
5
3.1
7
5.9
3
1
2 T
ota
l Pri
ze V
alu
e 3
99
0
42
52
5
00
2
15
00
.2
9
1
3 N
um
ber
of
Pri
zes
6.0
9
6.5
3
1
55
.3
0
.33
1
4 P
rize
Sp
read
.6
7
.42
0
2
.39
.0
5
.53
.3
8
1
5 N
um
ber
of C
on
test
ants
2
4.9
2
18
.00
3
1
17
.0
2
.41
.2
8
.29
1
6 N
ew T
ask
Du
mm
y
.71
.4
6
0
1
.08
.0
0
.07
.0
3
.31
1
7 L
engt
h o
f C
on
test
Bri
ef
15
9.0
0
94
.30
4
7
46
5
-.0
3
.36
.0
8
.17
-.
12
-.
19
1
8 I
nst
ruct
ion
al G
uid
ance
1
.38
1
.85
0
8
-.
30
.0
3
-.2
0
.12
-.
08
-.
16
.1
7
1
9 T
arge
t O
utc
om
es
2.4
2
2.4
2
0
9
.08
.3
4
-.1
2
.21
.0
8
-.0
9
.53
.1
1
1
10
Co
nte
st S
po
nso
r R
epu
tati
on
1
48
,99
4
60
2,9
60
0
4
,16
0,0
00
.1
5
.39
.4
1
.05
.3
3
.02
.1
9
-.2
0
.17
1
11
Nu
mb
er o
f P
ictu
res
2
.60
2
.16
0
9
.0
4
.17
.0
1
.04
-.
02
-.
04
.0
9
.03
.1
1
.07
1
12
Co
nte
st D
ura
tio
n
44
.66
4
8.1
8
5.9
2
28
2.3
2
.21
.0
1
.50
-.
21
.0
9
-.2
1
.05
-.
29
-.
17
.3
2
.03
1
13
Co
mm
un
ity
Size
5
70
8
21
81
2
57
9
07
7
-.1
5
.35
-.
38
.3
3
.14
.1
5
.07
.2
4
.27
-.
12
.1
2
-.7
6
1
No
tes:
Des
crip
tive
sta
tist
ics
(co
rrel
atio
ns)
are
rep
ort
ed b
efo
re (
afte
r) lo
g-tr
ansf
orm
ing
and
mea
n-c
ente
rin
g. A
ll c
orr
elat
ion
s in
bo
ld a
re
sign
ific
ant
at t
he
5%
leve
l (tw
o-s
ided
).
Chapter 4 – Managing the Crowd: Prize Structure and Creativity in Online Idea Generation Contests
94
Terwiesch, and Ulrich 2010). Hence, we conceptualize idea creativity as the creativity of
the most creative idea generated in the contest.
Following prior research (e.g., Amabile 1982; Dahl, Chattopadhyay, and Gorn 1999),
we measure the creativity of the ideas using the ratings of ten creative judges, who hold
bachelor degrees in creative domains, such as art, photography, and graphic design. The
judges were not aware of the study’s hypotheses. They received an honorarium of $150
for their rating services. As the total number of submissions is very large (n = 5,299), we
restricted the judges’ rating activities to the subset of 623 winning submissions (judged
as such by the contest sponsor) across the 106 contests. As the task descriptions
included on average 2.2 mentions of phrases stimulating creativity (e.g., “think out of
the box,” “looking for innovative designs,” and “we are open to new ideas”), the data
support our premise that contest sponsors seek creative ideas. Consequently, the
winning ideas are likely more creative than the submissions that did not receive a
prize.14 We randomized the submissions and the order of the measurement items across
judges (Amabile 1982). The judges independently completed the task over a period of
three weeks. For each submission, each judge completed three seven-point scales
measuring the winning submissions’ novelty (not at all novel/very novel), originality
(not at all original/very original) and unusualness (not at all unusual/very unusual)
(Burroughs et al. 2011; Dahl, Chattopadhyay and Gorn 1999).15 To examine the
consistency of ratings across the different judges, we computed the inter-judge
reliability, i.e., the intraclass reliability coefficient (Shrout and Fleiss 1979) between the
different judges’ ratings for each of the three items; the correlations were above .60
(‘originality’ (.62), ‘novelty’ (.63), ‘unusualness’ (.66)) and statistically significant (p
< .001). The reliability scores are similar in magnitude to the reliability scores reported
14 Because we focus on the ideas that are identified as winners (by the contest sponsor) among the idea submissions, they are presumably considered “meaningful” from the contest sponsor’s perspective. 15 We also measured the winning submissions’ meaningfulness by having the expert judges complete two additional seven-point scales measuring the winning submissions’ usefulness (not at all useful/very useful) and appropriateness (not at all appropriate/very appropriate). To verify the existence of the two dimensions of novelty and meaningfulness, we performed a confirmatory factor analysis. We compared a first-order factor structure of creativity, with the five items as indicators, with a second-order factor structure, incorporating the two latent factors of novelty (three items) and meaningfulness (two items). The analysis supported the higher order structure: the second-order factor model of creativity outperformed the first-order factor model (second-order factor model: χ2(4) = 40.6, Goodness of Fit Index [GFI] = .88, Root Mean Square Residual [RMR] = .06, Akaike’s Information Criterion [AIC] = 32.6, Consistent Akaike’s Information Criterion [CAIC] = 17.9, Schwarz’s Bayesian Criterion [BIC] = 21.9; first-order factor model: χ2(5) = 651.5, GFI = .33, RMR = .58, AIC = 641.5, CAIC = 623.1, BIC = 628.1).
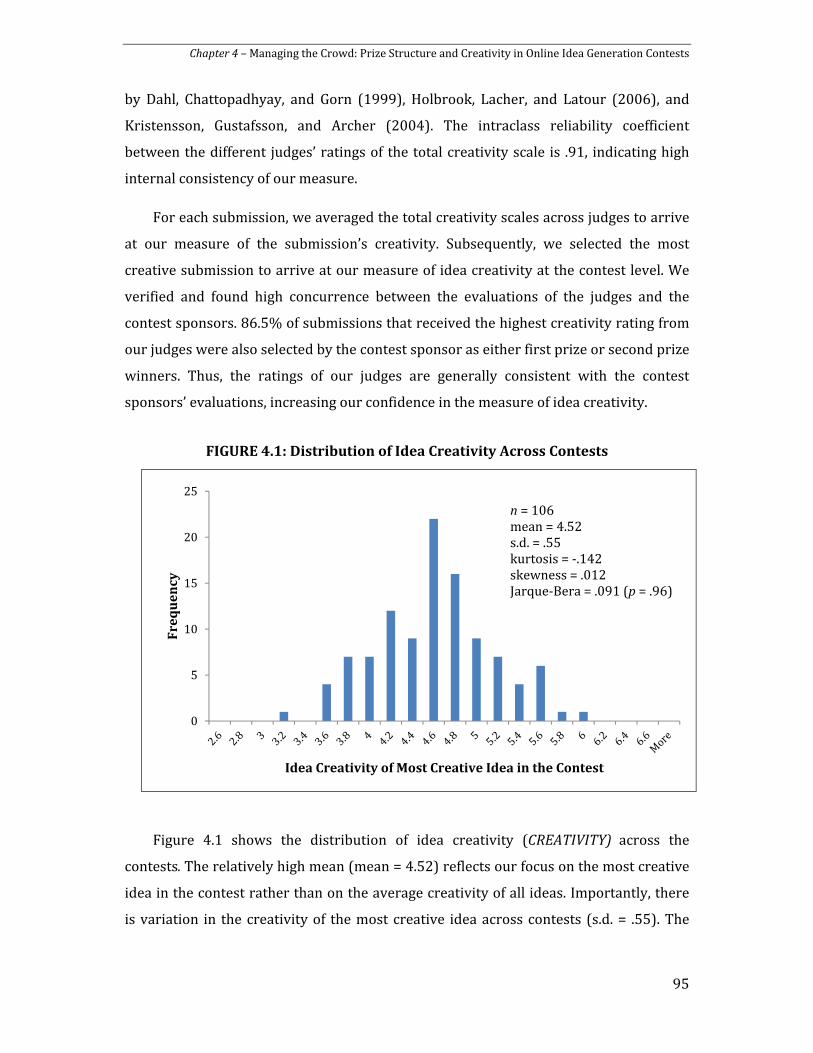
Chapter 4 – Managing the Crowd: Prize Structure and Creativity in Online Idea Generation Contests
95
by Dahl, Chattopadhyay, and Gorn (1999), Holbrook, Lacher, and Latour (2006), and
Kristensson, Gustafsson, and Archer (2004). The intraclass reliability coefficient
between the different judges’ ratings of the total creativity scale is .91, indicating high
internal consistency of our measure.
For each submission, we averaged the total creativity scales across judges to arrive
at our measure of the submission’s creativity. Subsequently, we selected the most
creative submission to arrive at our measure of idea creativity at the contest level. We
verified and found high concurrence between the evaluations of the judges and the
contest sponsors. 86.5% of submissions that received the highest creativity rating from
our judges were also selected by the contest sponsor as either first prize or second prize
winners. Thus, the ratings of our judges are generally consistent with the contest
sponsors’ evaluations, increasing our confidence in the measure of idea creativity.
FIGURE 4.1: Distribution of Idea Creativity Across Contests
Figure 4.1 shows the distribution of idea creativity (CREATIVITY) across the
contests. The relatively high mean (mean = 4.52) reflects our focus on the most creative
idea in the contest rather than on the average creativity of all ideas. Importantly, there
is variation in the creativity of the most creative idea across contests (s.d. = .55). The
0
5
10
15
20
25
Fr
eq
ue
nc
y
Idea Creativity of Most Creative Idea in the Contest
n = 106mean = 4.52s.d. = .55kurtosis = -.142skewness = .012Jarque-Bera = .091 (p = .96)

Chapter 4 – Managing the Crowd: Prize Structure and Creativity in Online Idea Generation Contests
96
Jarque-Bera test for the assumption of normality could not be rejected, indicating that
the dependent variable is normally distributed.
Control variables. In addition to our focal variables, we also include contest and
contest sponsor characteristics as control variables. First, we control for the number of
contestants in the contest (NO_CONTESTANTS; mean = 24.92, s.d. = 18.00) as increased
competition may increase idea creativity (log-transformed). Second, we use a dummy
variable (NEWTASK_DUM; mean = .71, s.d. = .46) to control for the nature of the task in
terms of idea generation for a new product, package, or brand (NEWTASK_DUM = 1) or
“redo” idea generation for improving an existing product, package, or brand
(NEWTASK_DUM = 0). Third, we control for the length of the contest brief, measured by
the number of words (LENGTH; mean = 159.00, s.d. = 94.30) (log-transformed).
Furthermore, we control for the level of instructional guidance pertaining to the use
of specific materials, textures, and colors, among others, in the creative task (Moreau
and Dahl 2005) as input constraints limit exploratory thinking and decrease creativity
(Dahl and Moreau 2007). We also control for the number of requirements that the
target outcome must fulfill (e.g., the product must be environmentally friendly to
produce) as output constraints provide task clarity and free cognitive resources to
increase creativity (Amabile 1998; Dahl and Moreau 2007). Two graduate marketing
students, not aware of the study’s hypotheses, independently coded task descriptions in
the contest briefs to develop these two measures of the creative task constraints:
number of items of instructional guidance (INSTRUCT; mean = 1.38, s.d. = 1.85) and the
number of target outcome specifications (TARGET; mean = 2.42, s.d. = 2.42). The two
coders agreed on the coding in 89% of the contests. A third coder (also a graduate
marketing student) helped resolve inconsistencies in the remaining 11% of the contests.
Finally, we control for the reputation of the contest sponsor, as reputed contest
sponsors may increase contestants’ effort in the idea generation task. Given the online
context and the international character of the contest sponsors and contestant base, we
proxy the contest sponsor’s reputation by using the (log-transformed) number of hits
on Google on the final day of the contest (REPUTATION; mean = 148,994, s.d. = 602,960).
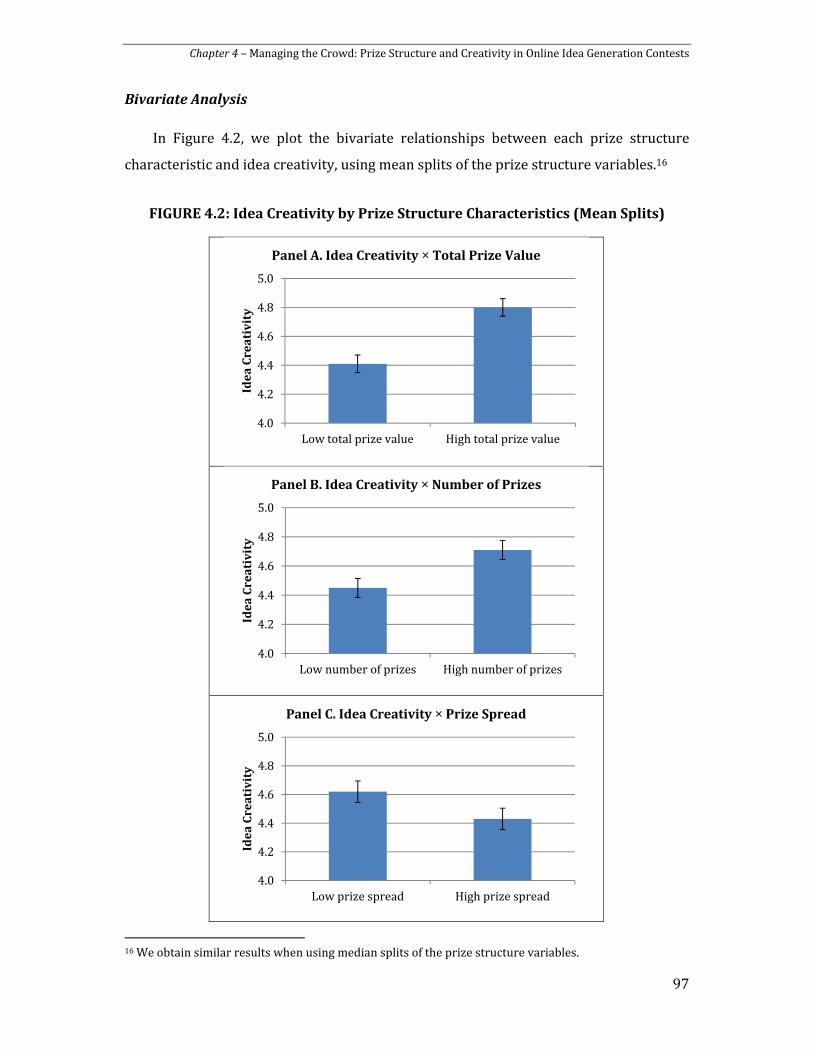
Chapter 4 – Managing the Crowd: Prize Structure and Creativity in Online Idea Generation Contests
97
Bivariate Analysis
In Figure 4.2, we plot the bivariate relationships between each prize structure
characteristic and idea creativity, using mean splits of the prize structure variables.16
FIGURE 4.2: Idea Creativity by Prize Structure Characteristics (Mean Splits)
16 We obtain similar results when using median splits of the prize structure variables.
4.0
4.2
4.4
4.6
4.8
5.0
Low total prize value High total prize value
Ide
a C
re
ati
vit
yPanel A. Idea Creativity × Total Prize Value
4.0
4.2
4.4
4.6
4.8
5.0
Low number of prizes High number of prizes
Ide
a C
re
ati
vit
y
Panel B. Idea Creativity × Number of Prizes
4.0
4.2
4.4
4.6
4.8
5.0
Low prize spread High prize spread
Ide
a C
re
ati
vit
y
Panel C. Idea Creativity × Prize Spread
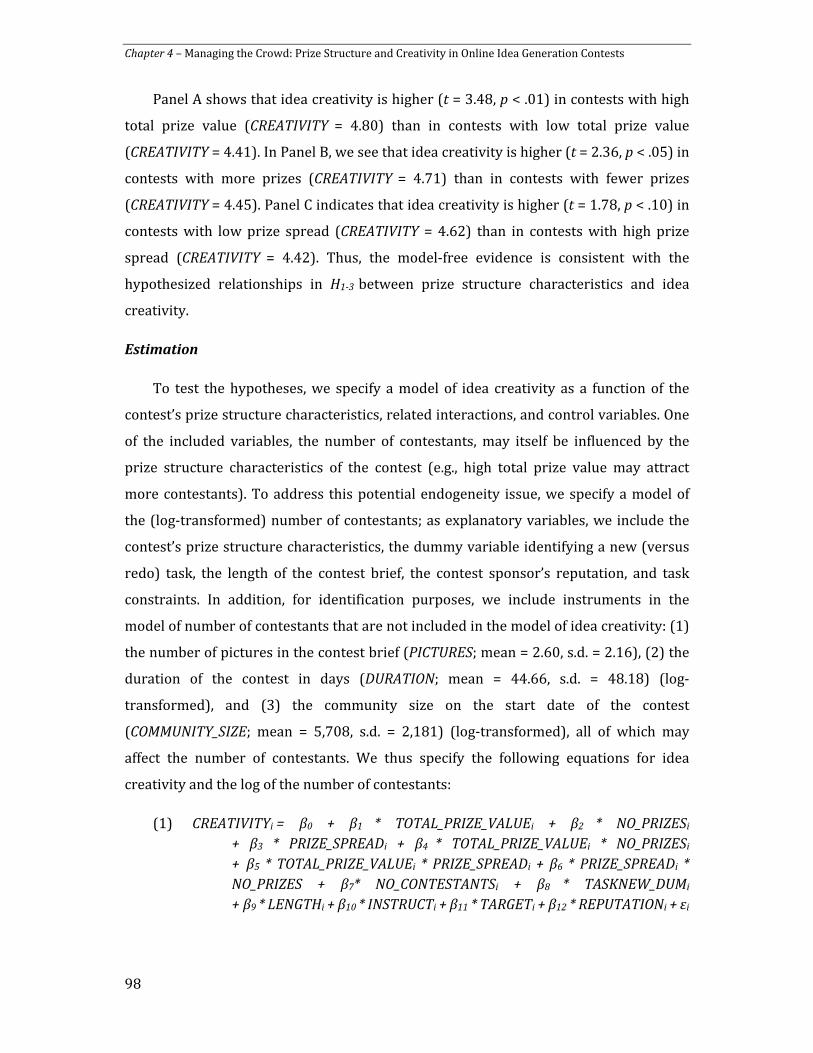
Chapter 4 – Managing the Crowd: Prize Structure and Creativity in Online Idea Generation Contests
98
Panel A shows that idea creativity is higher (t = 3.48, p < .01) in contests with high
total prize value (CREATIVITY = 4.80) than in contests with low total prize value
(CREATIVITY = 4.41). In Panel B, we see that idea creativity is higher (t = 2.36, p < .05) in
contests with more prizes (CREATIVITY = 4.71) than in contests with fewer prizes
(CREATIVITY = 4.45). Panel C indicates that idea creativity is higher (t = 1.78, p < .10) in
contests with low prize spread (CREATIVITY = 4.62) than in contests with high prize
spread (CREATIVITY = 4.42). Thus, the model-free evidence is consistent with the
hypothesized relationships in H1-3 between prize structure characteristics and idea
creativity.
Estimation
To test the hypotheses, we specify a model of idea creativity as a function of the
contest’s prize structure characteristics, related interactions, and control variables. One
of the included variables, the number of contestants, may itself be influenced by the
prize structure characteristics of the contest (e.g., high total prize value may attract
more contestants). To address this potential endogeneity issue, we specify a model of
the (log-transformed) number of contestants; as explanatory variables, we include the
contest’s prize structure characteristics, the dummy variable identifying a new (versus
redo) task, the length of the contest brief, the contest sponsor’s reputation, and task
constraints. In addition, for identification purposes, we include instruments in the
model of number of contestants that are not included in the model of idea creativity: (1)
the number of pictures in the contest brief (PICTURES; mean = 2.60, s.d. = 2.16), (2) the
duration of the contest in days (DURATION; mean = 44.66, s.d. = 48.18) (log-
transformed), and (3) the community size on the start date of the contest
(COMMUNITY_SIZE; mean = 5,708, s.d. = 2,181) (log-transformed), all of which may
affect the number of contestants. We thus specify the following equations for idea
creativity and the log of the number of contestants:
(1) CREATIVITYi = β0 + β1 * TOTAL_PRIZE_VALUEi + β2 * NO_PRIZESi
+ β3 * PRIZE_SPREADi + β4 * TOTAL_PRIZE_VALUEi * NO_PRIZESi
+ β5 * TOTAL_PRIZE_VALUEi * PRIZE_SPREADi + β6 * PRIZE_SPREADi *
NO_PRIZES + β7* NO_CONTESTANTSi + β8 * TASKNEW_DUMi
+ β9 * LENGTHi + β10 * INSTRUCTi + β11 * TARGETi + β12 * REPUTATIONi + εi

Chapter 4 – Managing the Crowd: Prize Structure and Creativity in Online Idea Generation Contests
99
(2) NO_CONTESTANTSi = γ0 + γ1 * TOTAL_PRIZE_VALUEi + γ2 * NO_PRIZESi
+ γ3* PRIZE_SPREADi + γ4* TASKNEW_DUMi + γ5* LENGTHi
+ γ6* INSTRUCTi + γ7* TARGETi + γ8* REPUTATIONi + γ9 * PICTURESi
+ γ10 * DURATIONi + γ11* COMMUNITY_SIZEi + νi
where i denotes the online idea generation contest. We note that we mean-centered the
prize structure variables to facilitate interpretation of the interaction effects.
Since the number of contestants is included as an explanatory variable in the
equation of idea creativity, we jointly estimate the two equations using the full
information maximum likelihood method (Maddala 1977). A possible drawback of full
information methods is that misspecification in one equation may bias the parameter
estimates in both equations. The RESET specification test (Ramsey 1969) did not
indicate misspecification (parameters for additional paths and alternative functional
forms were neither statistically significant, nor did they improve model fit).
4.4 RESULTS
Model Selection
We provide the results of the simultaneous estimation of the models for idea
creativity and for the number of contestants in Table 4.3. Column 1 and Column 2
contain the results with only the main effects of the contest’s prize structure
characteristics (i.e., total prize value, number of prizes, and prize spread) and the
control variables. Column 3 and Column 4 contain the results for the models that also
include the hypothesized interaction effects. Minus two times the difference between
the log-likelihoods of both models is distributed as Chi-square with 3 degrees of
freedom. The ��-test statistic (10.88) indicates that the interaction effects significantly
improve model fit (p = .01). In both equations, none of the Variance Inflation Factors
exceeds four, suggesting that multicollinearity is not a threat to the validity of the
estimation.
We first discuss the results of the model of the number of contestants. As expected
(Column 3 of Table 4.3), the total prize value increases the number of contestants (b
= .19, p < .05). With respect to other contest characteristics, new idea generation tasks
relative to redo tasks (b = .43, p < .01), specification of target outcomes (b = .04, p < .10)
and contest duration (b = .37, p < .05) increase the number of contestants, whereas
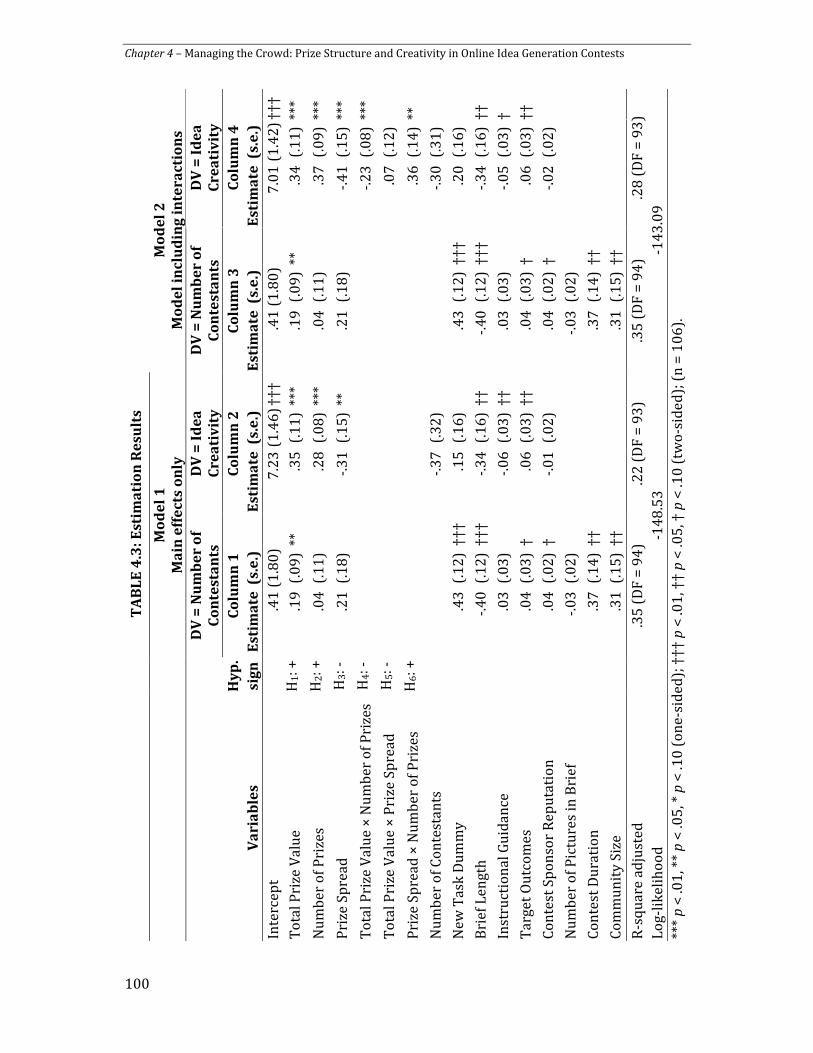
Chapter 4 – Managing the Crowd: Prize Structure and Creativity in Online Idea Generation Contests
100
TA
BL
E 4
.3:
Es
tim
ati
on
Re
su
lts
M
od
el
1
Ma
in e
ffe
cts
on
ly
Mo
de
l 2
Mo
de
l in
clu
din
g i
nte
ra
cti
on
s
D
V =
Nu
mb
er
of
Co
nte
sta
nts
DV
= I
de
a
Cr
ea
tiv
ity
DV
= N
um
be
r o
f
Co
nte
sta
nts
DV
= I
de
a
Cr
ea
tiv
ity
H
yp
. C
olu
mn
1
Co
lum
n 2
C
olu
mn
3
Co
lum
n 4
Va
ria
ble
s
sig
n
Es
tim
ate
(s
.e.)
Es
tim
ate
(s
.e.)
Es
tim
ate
(s
.e.)
E
sti
ma
te (
s.e
.)
Inte
rcep
t
.41
(1
.80
)
7.2
3 (
1.4
6) †
††
.41
(1
.80
) 7
.01
(1
.42
) †
††
To
tal P
rize
Val
ue
H1: +
.1
9 (
.09
) **
.3
5
(.1
1)
***
.19
(.
09
) **
.3
4
(.1
1)
***
Nu
mb
er o
f P
rize
s H
2: +
.0
4 (
.11
)
.28
(.
08
) **
* .0
4
(.1
1)
.3
7
(.0
9)
***
Pri
ze S
pre
ad
H3: -
.2
1 (
.18
)
-.3
1
(.1
5)
**
.21
(.
18
)
-.4
1
(.1
5)
***
To
tal P
rize
Val
ue
× N
um
ber
of
Pri
zes
H4: -
-.2
3
(.0
8)
***
To
tal P
rize
Val
ue
× P
rize
Sp
read
H
5: -
.07
(.
12
)
Pri
ze S
pre
ad ×
Nu
mb
er o
f P
rize
s H
6: +
.36
(.
14
) **
Nu
mb
er o
f C
on
test
ants
-.
37
(.
32
)
-.
30
(.
31
)
New
Tas
k D
um
my
.4
3 (
.12
) †
††
.15
(.
16
)
.43
(.
12
) †
††
.20
(.
16
)
Bri
ef L
engt
h
-.
40
(.1
2)
††
† -.
34
(.
16
) ††
-.
40
(.
12
) †
††
-.3
4
(.1
6)
††
Inst
ruct
ion
al G
uid
ance
.03
(.0
3)
-.
06
(.
03
) ††
.0
3
(.0
3)
-.
05
(.
03
) †
Tar
get
Ou
tco
mes
.04
(.0
3)
†
.06
(.
03
) ††
.0
4
(.0
3)
†
.06
(.
03
) †
†
Co
nte
st S
po
nso
r R
epu
tati
on
.04
(.0
2)
†
-.0
1
(.0
2)
.0
4
(.0
2)
†
-.0
2
(.0
2)
N
um
ber
of
Pic
ture
s in
Bri
ef
-.
03
(.0
2)
-.0
3
(.0
2)
Co
nte
st D
ura
tio
n
.3
7 (
.14
) †
†
.37
(.
14
) †
†
Co
mm
un
ity
Size
.31
(.1
5)
††
.3
1
(.1
5)
††
R
-sq
uar
e ad
just
ed
.3
5 (
DF
= 9
4)
.22
(D
F =
93
) .3
5 (
DF
= 9
4)
.28
(D
F =
93
)
Lo
g-li
keli
ho
od
-14
8.5
3
-14
3.0
9
***
p <
.01
, **
p <
.05
, * p
< .1
0 (
on
e-si
ded
); †
††
p <
.01
, ††
p <
.05
, † p
< .1
0 (
two
-sid
ed);
(n
= 1
06
).

Chapter 4 – Managing the Crowd: Prize Structure and Creativity in Online Idea Generation Contests
101
contest brief length decreases the number of contestants (b = -.40, p < .01). Furthermore,
the contest sponsor’s reputation (b = .04, p < .10) and community size (b = .31, p < .05)
increase the number of contestants.
Hypotheses Testing
Next, we discuss the tests of hypotheses (Column 4 of Table 4.3). We find support
for the three hypotheses of the main effects of the prize structure characteristics.
Supporting H1 and H2 respectively, total prize value (b = .34, p < .01) and number of
prizes (b = .37, p < .01) of the online contest both increase idea creativity, and in support
of H3, prize spread of the online contest decreases (b = -.41, p < .01) idea creativity.
We find support for H4, that the number of prizes of the online contest weakens the
positive effect of total prize value (b = -.23, p < .01) on idea creativity. We also find
support for H6, that the number of prizes of the online contest weakens the negative
effect of prize spread (b = .36, p <. 05) on idea creativity. However, the results do not
support the hypothesized negative interaction effect (H5) between total prize value and
prize spread (b = .07, p = .31) of the online contest on idea creativity.17
With respect to the control variables, the length of the contest brief (b = -.34, p < .05)
and instructional guidance (b = -.05, p < .10) decrease idea creativity, whereas
specification of target outcomes (b = .06, p < .05) increases idea creativity. Before
discussing these results, we examine their robustness and report additional analyses.
Additional Analyses
Idea creativity of top three ideas in the contest. As discussed earlier, the success of an
online idea generation contest is judged by the creativity of the most creative idea
generated in the contest. We next estimate the system of equations replacing the
original idea creativity measure (most creative idea) with an alternative measure: the
mean idea creativity of the top three creative ideas. To this end, we selected the three
ideas per contest with the highest creativity ratings for 92 contests with three or more
17 Although we did not hypothesize a three-way interaction among the three prize structure characteristics, we estimated a model including a three-way interaction term. The results (not reported in the essay in the interest of brevity) indicate that the three-way interaction term is not significant (b = -.10, p = .31). In addition, we examined quadratic effects to account for the possibility that the effects of the prize variables decrease and perhaps turn negative at high levels, but we do not observe any quadratic effects within the boundaries of the data.
Chapter 4 – Managing the Crowd: Prize Structure and Creativity in Online Idea Generation Contests
102
prizes. To avoid losing observations, we retained contests with only two prizes (8
contests, dependent variable is measured as the mean creativity of the two winning
ideas) and contests with only one prize (6 contests, dependent variable is unchanged).
We present the results of the system estimation using this alternative dependent
variable in Model 3 (reported in Columns 1 and 2 of Table 4.4). The results, which are
consistent with the model estimating the idea creativity of the single most creative idea,
indicate that the findings are robust to this broader definition of idea creativity.
Alternative measure of prize spread. In the hypothesis tests reported in Model 2 of
Table 3, we use the coefficient of variation as the measure of prize spread of the contest.
We examine the robustness of the results to an alternative measure, namely the relative
mean difference (RMD). This measure averages the differences in prize values for each
prize pair, relative to the average prize value. More formally, the relative mean
difference is computed as follows: ��� � �!" ∑ ∑ |$ % $�
!���
!�� |& /(, where n is the
number of prizes, each combination of xi and xj represents a prize pair, and μ is the
mean prize value.
We present the results of the system estimation using this alternative measure of
prize spread of the online contest in Model 4 (reported in Columns 3 and 4 of Table 4.4).
The results reported are generally consistent with those measuring prize spread using
the coefficient of variation (reported in Column 3 and 4 of Table 4.3), showing that our
results are robust to the choice of measure for prize spread.
Dependent variable of idea meaningfulness. As discussed earlier, we focus on novelty
as the primary dimension of creativity, as the focus of online idea generation contests is
to generate novel ideas. Nonetheless, we also estimate a model with the (main and
interaction) effects of prize structure characteristics and control variables on two
measures of idea meaningfulness: meaningfulness of the most meaningful idea and
meaningfulness of the most creative (i.e., novel) idea. As expected, the results indicate
that prize structure characteristics of the online contest have no effect on either
measure of meaningfulness of ideas generated (the results are not reported in the essay
in the interest of brevity, but are available upon request from the authors).
Selection of contestants. We developed the hypotheses based on the theoretical
premise that a contest’s prize structure characteristics influence contestants’

Chapter 4 – Managing the Crowd: Prize Structure and Creativity in Online Idea Generation Contests
103
TA
BL
E 4
.4:
Ro
bu
stn
es
s C
he
ck
s
M
od
el
3
Alt
ern
ati
ve
de
pe
nd
en
t v
ari
ab
le:
Ide
a c
rea
tiv
ity
of
top
3 i
de
as
Mo
de
l 4
Alt
ern
ati
ve
pri
ze
sp
rea
d m
ea
sure
:
Re
lati
ve
me
an
dif
fere
nce
D
V =
Nu
mb
er
of
Co
nte
sta
nts
DV
= I
de
a
Cre
ati
vit
y
DV
= N
um
be
r o
f
Co
nte
sta
nts
DV
= I
de
a
Cre
ati
vit
y
H
yp
.
C
olu
mn
1
C
olu
mn
2
C
olu
mn
3
Co
lum
n 4
Va
ria
ble
s
sig
n
Est
ima
te (
s.e
.)
E
stim
ate
(s.
e.)
Est
ima
te (
s.e
.)
E
stim
ate
(s
.e.)
Inte
rcep
t
.84
(1
.77
) 5
.43
(1
.27
) †††
.6
7 (
1.7
7)
6.7
2 (
1.4
3) †
††
To
tal P
rize
Val
ue
H1: +
.2
0 (
.09
) **
.2
3
(.1
0)
**
.20
(.
09
) **
.3
2
(.1
1)
***
Nu
mb
er o
f Pri
zes
H2: +
.0
1 (
.11
)
.43
(.
08
) **
* .0
9
(.1
0)
.3
2
(.0
9)
***
Pri
ze S
pre
ad
H3: -
.2
4 (
.18
)
-.6
0
(.1
3)
***
.40
(.
36
)
-.7
6
(.3
0)
***
To
tal P
rize
Val
ue
× N
um
ber
of
Pri
zes
H4: -
-.1
6
(.0
7)
**
-.
15
(.
07
) **
To
tal P
rize
Val
ue
× P
rize
Sp
read
H
5: -
-.0
9
(.1
1)
.03
(.
25
)
Pri
ze S
pre
ad ×
Nu
mb
er o
f Pri
zes
H6: +
.49
(.
13
) **
*
.67
(.
36
) **
Nu
mb
er o
f Co
nte
stan
ts
-.0
4
(.2
8)
-.2
2
(.3
1)
N
ew T
ask
Du
mm
y
.45
(.1
2)
†††
.01
(.
14
)
.43
(.
12
) ††
† .1
4
(.1
5)
B
rief
Len
gth
-.4
0 (
.12
) ††
† -.
18
(.
14
)
-.4
0
(.1
2)
†††
-.3
0
(.1
6)
†
Inst
ruct
ion
al G
uid
ance
.03
(.0
3)
-.
06
(.
02
) ††
† .0
2
(.0
3)
-.
05
(.
04
) ††
Tar
get
Ou
tcom
es
.0
4 (
.03
)
.05
(.
02
) ††
.0
4
(.0
3)
.0
6
(.0
2)
††
Co
nte
st S
po
nso
r R
epu
tati
on
.04
(.0
2)
† -.
03
(.
02
) †
.04
(.
02
) †
-.0
3
(.0
2)
N
um
ber
of P
ictu
res
in B
rief
-.0
3 (
.02
)
-.
03
(.
02
)
C
on
test
Du
rati
on
.37
(.1
4)
††
.3
5
(.1
4)
††
C
om
mu
nit
y Si
ze
.2
6 (
.15
) †
.2
8
(.1
5)
†
R-s
qu
are
adju
sted
.35
(D
F =
94
) .3
8 (
DF
= 9
3)
.35
(D
F =
94
) .3
0 (
DF
= 9
3)
Lo
g-li
kel
iho
od
-13
0.2
0
-14
2.8
6
***
p <
.01
, **
p <
.05
, * p
< .1
0 (
on
e-si
ded
); †
†† p
< .0
1, †
† p
< .0
5, †
p <
.10
(tw
o-s
ided
); (
n =
10
6).

Chapter 4 – Managing the Crowd: Prize Structure and Creativity in Online Idea Generation Contests
104
motivation, which affects idea creativity. Alternatively, it is possible that the effects of
prize structure characteristics of online idea generation contests on idea creativity are
driven by a selection effect. That is, the prize structure characteristics of online idea
generation contests could attract more (or less) creative contestants to a contest, which
directly influences idea creativity. Although we are unable to measure the creativity of
the contestants, we are able to examine the “winning histories” of contestants.
Assuming that contestants who have won in prior contests have superior creative
abilities, we would find evidence of selection if the proportion of winners systematically
differs across high and low levels of the prize structure characteristics of online contests.
Mean split analyses indicate that the proportion of contestants who had previously won
contests does not differ between contests with a high or a low total prize value (t = -.63,
p = .53), number of prizes (t = -1.03, p = .30), and prize spread (t = .14, p = .89). This
evidence, albeit indirect, does not support the alternative explanation that prize
structure characteristics of online idea generation contests attract contestants with
different creative abilities.
Repeater contestants. The different idea generation contests are organized by one
contest platform, which allows contestants to compete in multiple contests. To rule out
the possibility that “repeater contestants” (i.e., contestants who have entered prior
contests) systematically affect idea creativity of the online contest, we re-estimate the
system of equations including a control variable measuring the percentage of repeater
contestants in the contest. The results (not reported in the essay in the interest of
brevity) indicate that the proportion of repeater contestants in online contests has no
effect on idea creativity (b = .06, p = .82) and its inclusion does not improve model fit.
Professional contestants. A number of the contestants have disclosed a professional
background in design, art, or creativity. To control for the effect of the share of
professionals competing in the contest, we re-estimate the system of equations
including a control variable measuring the share of professional contestants in the
contest, based on the disclosed data. The results show that inclusion of the variable does
not improve model fit and that the share of professional contestants does not affect idea
creativity (b = .02, p = .93).

Chapter 4 – Managing the Crowd: Prize Structure and Creativity in Online Idea Generation Contests
105
Multiple submissions per contestant. Contestants are allowed to submit multiple
ideas to a single contest. 49.99 submissions per contest on average (5,299 submissions
in total for 106 contests in the sample) are generated by an average of 24.92 contestants,
implying that each contestant submits 1.98 ideas on average. To rule out the theoretical
possibility that the contestants who submit multiple submissions systematically affect
the idea creativity of the online contest, we re-estimate the model using a control
variable measuring the average number of submissions per contestant in the contest.
The results indicate that the number of submissions per contestant has no effect on idea
creativity (b = -.11, p = .14), and its inclusion does not improve the fit of the model.
Effect of demanding creative ideas. It is possible that contest sponsors who require
very creative ideas may set prize structures accordingly. To control for this effect, we
re-estimated the system while controlling for the frequency of phrases to stimulate
creativity (e.g., “Think out of the box”) in the contest brief. The control variable is
marginally significant (b = .04, p = .06) and the hypothesized effects are retained. The
results indicate the model is robust to stimulating creativity.
Overall, the findings strongly support the hypotheses and are robust to alternative
measures of the variables and model specifications.
4.5 DISCUSSION
Online idea generation contests are an increasingly popular crowdsourcing
approach in business practice to generate new ideas. Yet, very little is known about the
effective design of these contests in the marketing literature. In this essay, we develop
theory and report evidence on the effects of prize structure characteristics of online
idea generation contests on the creativity of the ideas generated in these contests. We
conclude with a discussion of the essay’s implications for managerial practice,
contributions to marketing theory, and limitations and opportunities for further
research.
Managerial Implications
The study’s findings, which point to interactions among the prize structure
characteristics, provide guidelines for contest sponsors and platform managers for the
effective design of online idea generation contests to improve idea creativity. We report
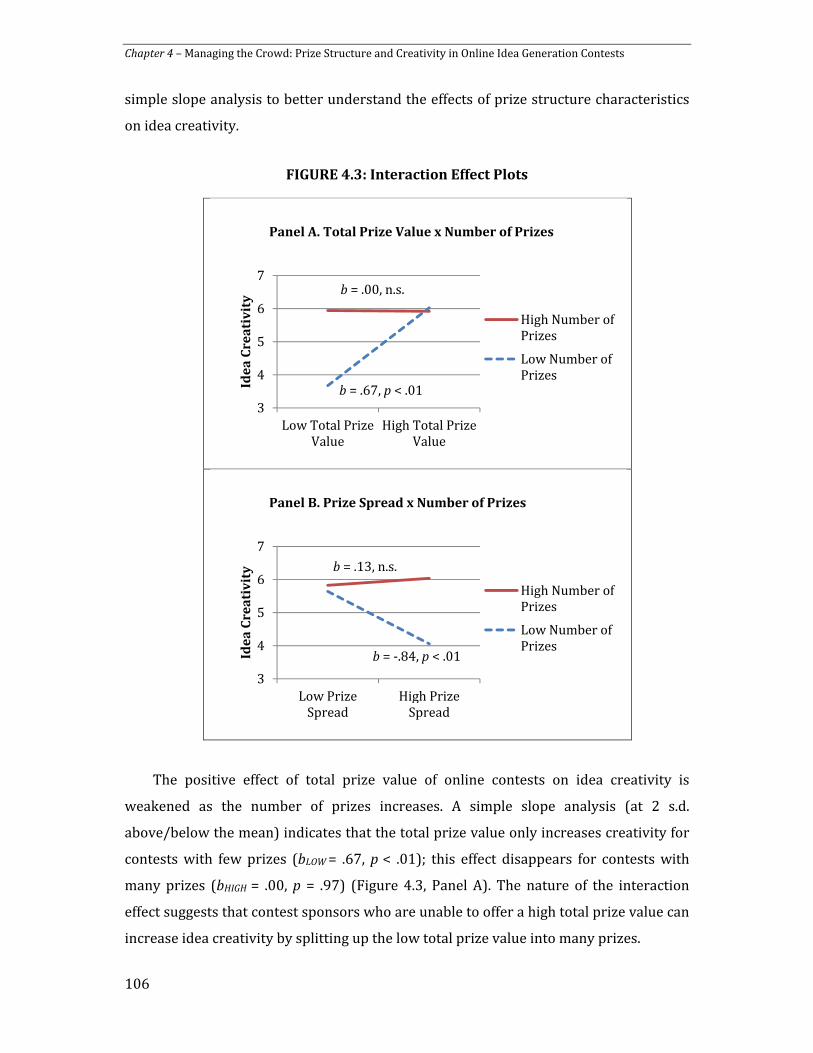
Chapter 4 – Managing the Crowd: Prize Structure and Creativity in Online Idea Generation Contests
106
simple slope analysis to better understand the effects of prize structure characteristics
on idea creativity.
FIGURE 4.3: Interaction Effect Plots
The positive effect of total prize value of online contests on idea creativity is
weakened as the number of prizes increases. A simple slope analysis (at 2 s.d.
above/below the mean) indicates that the total prize value only increases creativity for
contests with few prizes (bLOW = .67, p < .01); this effect disappears for contests with
many prizes (bHIGH = .00, p = .97) (Figure 4.3, Panel A). The nature of the interaction
effect suggests that contest sponsors who are unable to offer a high total prize value can
increase idea creativity by splitting up the low total prize value into many prizes.
3
4
5
6
7
Low Total Prize Value
High Total Prize Value
Ide
a C
re
ati
vit
yPanel A. Total Prize Value x Number of Prizes
High Number of Prizes
Low Number of Prizes
b = .00, n.s.
b = .67, p < .01
3
4
5
6
7
Low Prize Spread
High Prize Spread
Ide
a C
re
ati
vit
y
Panel B. Prize Spread x Number of Prizes
High Number of Prizes
Low Number of Prizes
b = .13, n.s.
b = -.84, p < .01

Chapter 4 – Managing the Crowd: Prize Structure and Creativity in Online Idea Generation Contests
107
While the negative effect of prize spread on idea creativity is strong in online
contests with few prizes (bLOW = -.84, p < .01), it is not significant in contests with many
prizes (bHIGH =.13, p = .59). (Figure 4.3, Panel B). This finding suggests that the negative
effects of prize spread on idea creativity can be overcome by setting many prizes, which
decreases the distance between the different prizes.
Overall, the findings indicate that prize spread in an online idea generation contest
never increases idea creativity. Thus, contest sponsors should strive to set prizes of
equal value since prize spread decreases idea creativity, especially in contests with few
prizes. In addition, the findings indicate that setting many prizes in online idea
generation contests generally results in higher idea creativity than setting few prizes.
We also examined several characteristics of the contest brief, which generate
managerial recommendations. Contest sponsors should compose a concise contest brief
as long contest briefs reduce idea creativity. Further, contest sponsors should provide
limited instructional guidance in the contest brief, because increasing input constraints
decreases idea creativity. In contrast, they should provide detailed descriptions of the
target outcome, because specifying such output constraints increases idea creativity.
Finally, it is interesting that while the total prize value of the contest increases the
number of contestants, the number of contestants does not translate into higher idea
creativity (b = -.33, n.s., in Column 4 of Table 4.3). The null effect of the number of
contestants in online contest on idea creativity combined with the support for the
effects of prize structure characteristics on idea creativity suggests that idea creativity
in online idea generation contests can be increased by effectively managing the crowd
(through prize structure characteristics and contest brief) and not by merely increasing
the size of the crowd.
Theoretical Contributions
The essay’s findings extend the marketing literature on idea generation. Although
there is a large body of work on idea generation, past research has primarily focused on
(offline) idea generation by employees (e.g. Burroughs et al. 2011; Girotra, Terwiesch,
and Ulrich 2010; Rossiter and Lilien 1994; Toubia 2006). By examining Web 2.0 based,
online idea generation contests, we extend the nascent work in the marketing literature
on idea generation by individuals external to the firm. Recently, Bayus (2013) and Poetz

Chapter 4 – Managing the Crowd: Prize Structure and Creativity in Online Idea Generation Contests
108
and Schreier (2012) provided empirical evidence that crowdsourcing can result in high
quality ideas for new product development, raising questions about mechanisms to
improve the quality of the ideas generated by crowds. In this essay, we extend this
recent work on crowdsourcing idea generation by moving beyond idea generation in
noncompetitive offline settings and developing new theory to understand the
phenomenon of crowdsourcing of ideas in the competitive setting of online idea
generation contests. We argue that in competitive settings, the nature of the prize
structure can affect the heat of competition and activate mechanisms of social
comparison, which affect creativity. We hope that the evidence we provide in this study,
that contest sponsors can enhance idea creativity by the effective design of prize
structure characteristics, inspires future theory development on the sources of
motivation in crowdsourced contests.
Further, we extend the literature on incentives and tools to stimulate creativity,
thereby addressing the recent call for research on this topic by Hauser, Tellis and Griffin
(2006). Specifically, we identify new approaches (i.e., prize structure characteristics) to
“incentivize” creative performance in online idea generation contests. The findings
related to the effects of the three prize structure characteristics indicate that total prize
value, number of prizes, and prize spread, both independently and jointly, affect idea
creativity. In particular, our findings underline the importance of discriminating
between contests with a grouped-winner design (with equal prizes) and those with a
ranked-winner design (with unequal prizes), which has not yet been distinguished in
the extant literature on the effects of incentives on creativity. The findings also offer
evidence of the dominant positive effects of setting many prizes on idea creativity; in
addition to their positive main effect on idea creativity, setting many prizes offsets the
negative effects of both a low total prize value and a high prize spread. Overall, the
findings suggest contingency effects of the prize structure characteristics on idea
creativity in competitive settings such as online idea generation contests. Future
research on whether and how these findings apply to other types of incentives (e.g.,
lottery tickets, recognition prizes, and non-monetary rewards) and in other competitive
settings (e.g., tournaments) would be useful.
Finally, the essay’s findings also generate implications for the creativity literature.
Primarily using student subjects in experimental studies, some studies (e.g., Amabile,
Chapter 4 – Managing the Crowd: Prize Structure and Creativity in Online Idea Generation Contests
109
Hennessey, and Grossman 1986; Hennessey and Amabile 1988) report that rewards
decrease creativity, while others (e.g., Eisenberger and Selbst 1994; Eisenberger and
Shanock 2003) suggest the opposite. Moreover, there is limited research in the
creativity literature on whether and how competition between contestants affects the
effects of rewards on creativity (see review by Zhou and Shalley 2003). In this essay, we
provide a comprehensive picture of the effects of rewarding idea creativity via prizes in
contests in the context of new product development. Further research on creativity
contests in other domains (e.g., writing, arts) would determine the applicability of our
theory and identify its boundary conditions.
Limitations and Opportunities for Further Research
Our research approach was focused on collecting data on the most creative idea of
all ideas generated in the contest. The creativity of the most creative idea is an
important outcome variable for idea generation contests from a managerial point of
view (Dahan and Mendelson 2001; Girotra, Terwiesch, and Ulrich 2010). In brainstorm
ideations, in which the goal is to generate as many creative ideas as possible, the idea
creativity of all ideas in the contest matter. Future research could focus on this outcome,
such that it is possible to examine the effect of prize structure characteristics on the
mean creativity of all ideas and the proportion of highly creative ideas among all ideas
generated in the contest.
In this first study on the effects of prize structure characteristics on idea creativity
in crowdsourced innovation contests, we focus on idea generation in a marketing
context. However, crowdsourcing can also be used to develop new software (e.g., Netflix
Prize), movie scripts (e.g., Script Pipeline), and pharmaceutical formulations (e.g.,
InnoCentive and IdeaConnection). It would be insightful to extend the proposed theory
by incorporating the characteristics of contests (e.g., type of product), and contestants
(e.g., profiles of scientists in research and development contests), and by using
alternative performance indicators (e.g., patents).
Also, to control for characteristics of the online contest platform, we analyzed
contests from one contest platform. This precludes us from considering the effects of
platform characteristics (e.g., user interface design, other types of prizes including non-
monetary rewards). Moreover, as many sponsors use contests repeatedly (e.g., Netflix,

Chapter 4 – Managing the Crowd: Prize Structure and Creativity in Online Idea Generation Contests
110
Google, Frito-Lay), an interesting avenue for future research would be to examine the
effects of prize structure on idea creativity in such repeated contests.
Finally, while our secondary data context has many advantages including external
validity, experimental studies may validate the developed theory by explicitly testing
the effects of prize structure variables on contestants’ motivation.
In conclusion, in this first study on the effects of rewards in idea generation
contests, we identify prize structure characteristics that affect idea creativity. We
anticipate that this essay’s insights are useful to contest sponsors and contest platform
owners. As the practice of crowdsourcing innovations is expected to grow in the future,
we hope that our work stimulates additional research in the area.

Chapter 4 – Managing the Crowd: Prize Structure and Creativity in Online Idea Generation Contests
111
APPENDIX: Contest Brief and Submission Examples
Panel A. Fictionalized Contest Brief Text pertaining to instructional guidance and target outcomes are underlined and italicized
respectively.
Panel B. Fictionalized Submission


113
Would you tell me, please, which way I ought to go from here?”, asked Alice.
“That depends a good deal on where you want to get to,” said the Cat.
Lewis Carroll, Alice’s Adventures in Wonderland, Chapter 6
Chapter 5
Conclusion
Firms increasingly open up their NPD processes to include external parties. By
crossing the boundaries of the firm, firms aim to improve the returns on investments in
innovation. Three types of external parties that are often involved in a firm’s NPD
process are suppliers, customers, and ‘the crowd’: an undefined group of individuals
that bear no relationship with the firm. The research presented in this dissertation
contributes to the literature on open innovation by studying the involvement of these
three groups of external parties in a firm’s NPD process. In the following section, the
conclusions from each chapter are summarized. Next, the chapter offers managerial
implications. The following section discusses the limitations of the studies. The final
section proposes directions for future research on involving external parties in NPD.
5.1 SUMMARY AND CONCLUSIONS
This dissertation contains three main chapters. Chapter 2 examines the role of
supplier and customer involvement in NPD by meta-analyzing prior empirical research.
Chapter 3 studies customer involvement in NPD, with special attention to the
multiplexity of the relationships that are characteristic to industrial outsourced NPD.
Chapter 4 focuses on the effects of prize structure characteristics on contestants’ idea
creativity in online idea generation contests. In the following sections, the main
conclusions are discussed per chapter.

Chapter 5 – Conclusion
114
Chapter 2: The Role of Supplier and Customer Involvement in New Product
Development: A Meta-Analysis
We meta-analyze the empirical research on supplier and customer involvement in
NPD. We find that a firm’s internal resources in marketing and, to a lesser extent, in
technology, are important enablers of supplier and customer involvement. Our results
indicate that high levels of firms’ internal resources increase firms’ access to external
resources. In addition, we find that technological uncertainty stimulates firms to involve
suppliers, and, to a lesser extent, customers, in their NPD process. Market uncertainty
lowers supplier involvement.
Involving suppliers and customers affects NPD outcomes as well. Whereas supplier
involvement saves costs and time, it lowers the innovativeness of the newly developed
product. Involving customers is associated with a trade-off between higher product
innovativeness and lower speed to market. The study underscores the need to examine
multiple NPD outcomes in tandem. In addition, the analysis emphasizes the need to
distinguish supplier involvement from customer involvement in NPD.
Chapter 3: The Effect of Customer Participation in Outsourced NPD on Supplier
Task Performance: The Role of Relationship Multiplexity
Focusing on outsourced NPD, a ‘market of one’, we analyze the effect of customer
participation in NPD on the developing supplier’s task performance. Drawing on role
theory, we argue that multiplex relationships cause role synergy, role conflict, and role
ambiguity, which moderate the effect of customer participation on supplier task
performance.
Largely in line with our hypotheses, we find that involving a customer that is also
one’s partner increases supplier task performance, but the effect holds only for
partnerships that are initiated by the parties themselves and not for partnerships that
are engineered by a triggering entity. In contrast, participation of a customer that also
has a supplier role decreases supplier task performance. Participation of a customer
that is also a competitor lowers supplier task performance in the eyes of the customer,
but does not affect the supplier’s self-reported task performance.
Chapter 5 – Conclusion
115
Chapter 4: Managing the Crowd: Prize Structure and Creativity In Online Idea
Generation Contests
In Chapter 4, we study the involvement of individuals without a relationship with
the firm: the “crowd”. We examine how prize structures stimulate contestants’
creativity in online idea generation contests. Using arguments from motivation theory,
we argue how a contest’s total prize value, number of prizes, and prize spread affect the
idea creativity of the most creative idea, both independently and in interaction.
We find that total prize value and number of prizes increase idea creativity, while
prize spread decreases idea creativity. Furthermore, the effects of prize structure
characteristics on idea creativity are interdependent. Contest sponsors who are unable
to offer a high total prize value can increase idea creativity by having many prizes of low
value. Contest sponsors should strive to set prizes of equal value as prize spread
decreases idea creativity, especially for contests with few prizes.
5.2 IMPLICATIONS FOR PRACTICE
Managers planning for external party involvement in innovation may benefit from
the insights derived from the research in this dissertation. In the following section, the
implications for practice are discussed.
Implications for Involving Suppliers
Managers planning for involving suppliers in their internal NPD processes may
improve the supplier involvement process by following these instructions:
• Do not consider the involvement of suppliers in NPD as an alternative for lacking
internal resources. Instead, develop the internal resource bases prior to
involving suppliers in the NPD process. Supplier involvement is more attractive
to a firm as well as the involved supplier when the firm has more internal
technological and marketing resources. Especially strong internal marketing
resources are associated with high levels of supplier involvement.
• In business environments with high levels of technological uncertainty, supplier
involvement may be very beneficial. Involving suppliers may help firms to
increase the technological options available in response to technological

Chapter 5 – Conclusion
116
developments. In case of market uncertainty, firms tend to stay away from
supplier involvement.
• Consider the effects of supplier involvement on various NPD performance
indicators jointly. Depending on the strategic need, supplier involvement may
help or hurt the NPD process. Supplier involvement affects product
innovativeness, speed to market, and cost performance:
o NPD projects in which suppliers are involved are associated with lower
levels of product innovativeness. Thus, in case a radically innovative
product is required, supplier involvement in the NPD process is to be
avoided.
o Supplier involvement improves the speed to market of newly developed
products, and is therefore suitable in the development process for
products that need to be launched on the market quickly.
o The involvement of suppliers is also associated with improved cost
performance. Thus, NPD project managers on a tight budget could greatly
benefit from reaching out to suppliers.
Implications for Involving Customers
Managers that set out to let customers participate in NPD activities may benefit
from these guidelines:
• Customer involvement thrives when firms have strong resource positions, both
in terms of technological and marketing resources. Similar to supplier
involvement, customer involvement fares best when firms have strong internal
resource bases, and should not be considered as an alternative for insufficient
internal resources.
• When facing business environments that are affected by high levels of
technological uncertainty, firms can be unsure which technological options
should be explored in the innovation process. In such a situation, firms should
consider involving customers, as they may offer valuable market insights that
can provide technological directions.
• Balance the consequences of customer involvement in NPD carefully prior to the
NPD project execution. Whereas customer involvement increases product

Chapter 5 – Conclusion
117
innovativeness as a result of the customer knowledge and other resources
accessed, the additional process steps required to accommodate customer
involvement decrease the speed to market of a newly developed product.
• In case of outsourced NPD, in which the customer asks an external supplier to
develop a technology, component, or product, customer participation can be
beneficial. The customer’s evaluation of a supplier’s task performance in the
outsourced NPD project becomes more positive as a result of participation, even
though the developing firm itself does not share that perception.
• Importantly, the extent to which customer participation can affect a supplier’s
task performance in the NPD project depends strongly on relationship
multiplexity: the other ties between the customer and the supplier:
o Suppliers executing outsourced NPD projects for a customer with whom
they share partner ties are advised to involve the customer. However,
customer participation will only be more effective in case of sharing self-
initiated partner ties. In case of sharing engineered partner ties, customer
involvement will not bring additional benefits.
o Suppliers that share competitor ties with their customer should avoid
customer participation as it hurts the customer’s perception of the
supplier’s task performance.
o For relationships that are characterized by reversed supplier roles,
suppliers are advised to avoid customer participation as well.
Implications for Involving the Crowd
Managers considering to source ideas using crowdsourcing techniques by
organizing online idea generation contests may improve contest outcomes as follows:
• To improve the idea creativity of the best idea submitted to the contest, carefully
design the prize structure of the contest. Take into account the total prize value,
number of prizes, and prize spread in tandem:
o Set a high total prize value, as a high total prize value will motivate
contestants to work hard on their ideas, which stimulates creativity. For
firms that cannot afford to set high total prize values, split up the (low)
total prize value into many (small) prizes.

Chapter 5 – Conclusion
118
o Set many prizes. Offering more prizes increases contestants’ effort by
increasing the chances of winning, which has a social effect in an online
contest, even if the total prize value is not very high.
o Avoid prize spread. A prize structure of unequal prizes can cause
unflattering social upward comparisons for the many winners of the
lower prizes, which is avoided by setting equal prizes. Especially for prize
structures with only few prizes, it is important to reduce the differences
in value between the prizes as much as possible.
• Although the prize structure will have an effect on the number of contestants
that will compete in the contest, do not focus on increasing the number of
contestants. The size of the crowd of contestants does not translate into higher
idea creativity of the online contest.
• To improve idea creativity, the contest brief delineating the idea generation task
should be as short as possible. Further, it should describe the target outcome in
detail, but it should refrain from providing detailed instructions pertaining to the
input to the creative process.
5.3 LIMITATIONS
The implications of this research must be tempered by an understanding of its
limitations. At the end of the chapters, we already pointed out a number of limitations.
We refer to these sections for a discussion of the limitations that are specific to the
studies. We now turn to a discussion of limitations that are common to all three main
chapters.
First, the three chapters were restricted to the setting of NPD. External party
involvement may also be applied in other activities. For example, suppliers are closely
involved in manufacturing (e.g., Vonderembse and Tracey 1999); customers are
increasingly involved in co-production (e.g., Bendapudi and Leone 2003) and
participate in brand promotion using consumer-to-consumer communication enabled
by social networks (e.g, Mangold and Faulds 2009); and the crowd becomes an
increasingly important source for the funding of new business initiatives (e.g., Ordanini
et al. 2011). The impact of external party involvement on activities other than NPD
requires further study.

Chapter 5 – Conclusion
119
Second, the theory and hypotheses development in all three chapters is based on
mechanisms that could not always be tested using the data that was available to us. In
Chapter 2, we argued that a firm’s internal resource levels influence the firm’s ability to
involve suppliers and customers in NPD. In addition, we argued that environmental
uncertainty influences the firm’s need to involve suppliers and customers in the NPD
process. Furthermore, we argued how internal resource levels and environmental
uncertainty affect the motivation of suppliers and customers to become involved in a
particular firm’s NPD process. In Chapter 3, we argued that the potential beneficial
effects of customer participation on supplier task performance may not materialize in
multiplex relationships: in customer-as-partner multiplexity, we argued for the
presence of role synergy; in customer-as-competitor multiplexity, we argued for the
presence of role conflict; in customer-as-supplier multiplexity, we argued for the
presence of role ambiguity. In Chapter 4, we argued that prize structure characteristics
affect contestants’ motivations to expend effort in an idea generation contest. Controlled
experiments in lab settings may confirm that the mechanisms in our theory cause the
effects we have observed.
Third, the two chapters with original empirical research (Chapters 3 and 4) and the
vast majority of the empirical studies that were the foundation for the meta-analysis
(Chapter 2) focused on project-level mechanisms and outcomes. It is likely that external
party involvement not only affects the NPD project at hand, but also affects the
relationship between the developing firm and the involved party. However, due to data
limitations, we were unable to provide insights on the effects of external party
involvement beyond the transactional level of the NPD project. Future investigation is
required to examine effects of external party involvement on long-term relationship-
level outcomes.
Fourth, data limitations prevented us from using objective NPD success measures.
While our empirical analysis employed data on subjective customer and project
manager evaluations (Chapter 3) and expert judge ratings (Chapter 4), it is worthwhile
to investigate the effects of external party involvement on objective NPD success
measures, such as market performance.

Chapter 5 – Conclusion
120
Fifth, the original empirical research in this dissertation was executed using data
supplied by a single firm (Chapter 3) and a single contest platform (Chapter 4).
Although having multiple observations from a uniform context improves comparability
and controls for industry/platform effects, the generalizability of our findings to other
contexts is potentially reduced. To increase the confidence in our results, replication of
the studies using data from different firms, from different industries, and from different
contest platforms, is warranted.
5.4 FUTURE RESEARCH DIRECTIONS
The following sections discuss several avenues for future research on involving
external parties in innovation that resulted from the studies included in this
dissertation. We start with summarizing the research opportunities on supplier
involvement that emerged from the meta-analysis. Next, we will identify future research
opportunities that are associated with the involvement of customers. We end the
section with future research directions for the examination of crowd involvement, a
nascent area of research.
Research Opportunities on Supplier Involvement
The meta-analysis in Chapter 2 of this dissertation examined the state of the
empirical literature on supplier and customer involvement. Close inspection of relevant
extant research showed that the antecedents of supplier involvement beyond the
developing firm’s internal resources and environmental uncertainty are insufficiently
studied. For example, the effects of a firm’s strategic orientation on the use of supplier
involvement are unknown. In addition, the majority of the empirical studies examined
focused on the perspective of the developing firm. The motivations of the participating
supplier to join in the developing firm’s NPD process as well as the (resource)
characteristics of the participating supplier that stimulate supplier involvement in NPD
are understudied.
With respect to the consequences of supplier involvement, a number of research
opportunities emerged. Using meta-analytic techniques, we studied linear effects of
supplier (and customer) involvement on NPD performance. These analyses have offered
interesting insights, which could be extended with more fine-grained analyses requiring
new data. Possibly, the effects of supplier involvement on NPD performance have a
Chapter 5 – Conclusion
121
different functional form. For example, if a firm involves its suppliers to a very high
extent, it may focus too much on technology and miss out on customer-related
opportunities. On a more general note, the benefits of both supplier and customer
involvement may have diminishing returns: as a result of very high levels of supplier
and customer involvement in the NPD process, the firm may become blind to relevant
developments in the firm itself. As the data underlying our meta-analysis did not allow
for an empirical test of quadratic effects, we leave this issue for future research.
Research Opportunities on Customer Involvement
Similar to the empirical literature on supplier involvement, the empirical literature
on the antecedents of customer involvement can be extended. Next to the firm’s internal
resources and environmental uncertainty, other aspects may influence the firm’s
decision to involve customers in the NPD process. For example, the tie strength of the
relationship between the customer and the developing firm may stimulate the firm to
invite customers to participate in NPD projects. Likewise, a strong relationship with the
firm may motivate customers to participate in the firm’s NPD project. Research into the
motivations of the customer to be involved in NPD, in conjunction with the motivations
of the developing firm to invite customers to be involved in NPD, is necessary to offer a
complete picture.
As firms increasingly reach out to external parties, the strategy of involving both
suppliers and customers becomes more prevalent. Involving both suppliers and
customers in the NPD process may result in synergistic effects. For example, involving
both types of parties allows for the verification of an involved supplier’s market insight
with the involved customer, which could improve product innovativeness. Similarly, the
technological knowledge offered by involved customers could be readily checked or
developed further by involved suppliers, which could speed up the NPD process. As a
downside, however, bringing together suppliers and customers and internal employees
may increase the costs of coordination beyond the costs required to coordinate supplier
and customer involvement separately. Thus, combining both suppliers and customers
may affect product innovativeness, speed to market, and cost performance beyond the
additive effects uncovered in the current research. Future research could explore these
synergistic effects in more detail.

Chapter 5 – Conclusion
122
Research Opportunities on Crowd Involvement
Research on crowdsourcing is still in its infancy. The results of the current study
can be extended to other contexts. In addition, many other research questions are open
for future research efforts.
Apart from extensions of our framework to include other types of prizes, such as
non-monetary prizes, and to include other types of contests, such as R&D and creative
writing contests, the theory we developed could also be extended to include other types
of outcome variables. To verify our theoretical argument that contestants increase their
effort in response to specific prize structures, a close examination of time spent by
contestants is opportune. In addition, the measurement of the idea creativity of the total
set of submissions is necessary to examine the effects of prize structure characteristics
on the average idea creativity rather than the idea creativity of the most creative idea of
the contest.
More and more firms are using online idea generation contests to jump-start
creativity (McKinsey 2009). Firms may also use these contests for branding purposes,
which raises questions about the impact of organizing online idea generation contests
on the firm’s brand image. Prize structure characteristics may also impact the firm’s
brand image: advertising big prizes likely has a bigger branding effect than small prizes.
When firms choose to organize multiple crowdsourcing contests, they might
consider growing a community themselves. In such a situation, community managers
need to grow and maintain a community of creative individuals. One may ask what the
effects of losing and winning a contest on the participation and performance are in
future contests, as this may influence the performance of the community as an idea
generating resource. Winning a contest may lead contestants to focus on the winning
recipe which could lower the diversity of their ideas, thereby affecting the performance
of the idea generating community. Losing a contest could stimulate a contestant to
spend more effort in preparing her submission for a next submission; alternatively, she
could become demotivated. Another research question pertains to the open character of
online idea generation contests, which may cause learning effects among the
community members across contests, thereby affecting the diversity of ideas submitted
to the contest by the community.
Chapter 5 – Conclusion
123
Furthermore, insights on the effects of crowd composition in terms of gender
diversity (Jeppesen and Lakhani 2010), cultural diversity, variation in knowledge
background and experience on community performance help community managers to
bring together the most creative crowd. Moreover, a popular method of managing a
community is to employ social media and social networking features, such as voting and
liking, commenting, and connecting possibilities. This adds transparency to a contest
and allows contestants to discuss the contest among each other (e.g., eYeka). The
resulting combination of collaboration and competition complicates the practice of
crowdsourcing and offers a multitude of research opportunities.
Lastly, future research efforts on crowd involvement may also be focused on the
use of the crowd in other phases of the NPD process, such as concept evaluation or beta
testing. The success of these activities is measured by outcomes other than idea
creativity (e.g., precision), which may be impacted differently by prize structure
characteristics.
To Close
Collectively, the three essays in this dissertation have shed light on how to
successfully manage the participation of external parties in NPD. We hope our research
stimulates additional work in this managerially relevant and theoretically interesting
area.


125
References18
A
Abernathy, William J. and Kim B. Clark (1985), “Innovation: Mapping the Winds of Creative Destruction,” Research Policy, 14 (1), 3–22.
Afuah, Allan and Christopher L. Tucci (2012), “Crowdsourcing as a Solution to Distant Search,” Academy of Management Review, 37 (3), 355–375.
Allocca, Michael A. and Eric H. Kessler (2006), “Innovation Speed in Small and Medium-Sized Enterprises,” Creativity and Innovation Management, 15 (3), 279–295.*
Al-Zu’bi, Zu’bi M. F. and Christos Tsinopoulos (2012), “Suppliers versus Lead Users: Examining Their Relative Impact on Product Variety,” Journal of Product Innovation
Management, 29 (4), 667–680.*
Amabile, Teresa M. (1982), “Social Psychology of Creativity: A Consensual Assessment Technique,” Journal of Personality and Social Psychology, 43 (5), 997–1013.
Amabile, Teresa M. (1996), Creativity in Context, Boulder, CO: Westview Press.
Amabile, Teresa M. (1998), “How to Kill Creativity,” Harvard Business Review, 76 (September-October 1998), 76–87.
Amabile, Teresa M., Beth A. Hennessey, and Barbara S. Grossman (1986), “Social Influences on Creativity: The Effects of Contracted-for Reward,” Journal of
Personality and Social Psychology, 50 (1), 14–23.
Appleyard, Melissa M. (2002), “Cooperative Knowledge Creation: The Case of Buyer-Supplier Co-Development in the Semiconductor Industry”, in Cooperative Strategies
and Alliances, Farok J. Contractor and Peter Lorange, eds., Oxford: Elsevier Science, 381–418.
18
References indicated with an asterix (*) have been included in the meta-analysis reported in Chapter 2.
References
126
Athaide, Gerard A., Rodney L. Stump, and Ashwin W Joshi (2003), “Understanding New Product Co-Development Relationships in Technology-Based Industrial Markets,” Journal of Marketing Theory and Practice, 11 (3), 46–58.*
Athaide, Gerard A. and Jason Q. Zhang (2011), “The Determinants of Seller-Buyer Interactions during New Product Development in Technology-Based Industrial Markets,” Journal of Product Innovation Management, 28 (s1), 146–158.*
Atuahene-Gima, Kwaku (2003), “The Effects of Centrifugal and Centripetal Forces on Product Development Speed and Quality: How Does Problem Solving Matter?” The
Academy of Management Journal, 46 (3), 359–373.*
Atuahene-Gima, Kwaku (2005), “Resolving the Capability-Rigidity Paradox in New Product Innovation,” Journal of Marketing, 69 (4), 61–83.
B
Bagozzi, Richard P. (1980), “Performance and Satisfaction in an Industrial Sales Force: An Examination of Their Antecedents and Simultaneity,” Journal of Marketing, 44 (2), 65–77.
Bajaj, Akhilesh, Sunder Kekre, and Kannan Srinivasan (2004), “Managing NPD: Cost and Schedule Performance in Design and Manufacturing,” Management Science, 50 (4), 527–536.
Barczak, Gloria, Abbie Griffin, and Kenneth B. Kahn (2009), “Perspective: Trends and Drivers of Success in NPD Practices: Results of the 2003 PDMA Best Practices Study,” Journal of Product Innovation Management, 26 (1), 3–23.
Barney, Jay (1991), “Firm Resources and Sustained Competitive Advantage,” Journal of
Management, 17 (1), 99–120.
Basole, Rahul C. (2009), “Visualization of Interfirm Relationships in a Converging Mobile Ecosystem,” Journal of Information Technology, 24 (2), 144–159.
Bayus, Barry L. (1997), “Speed-to-Market and New Product Performance Tradeoffs,”
Journal of Product Innovation Management, 14 (6), 485–497.
Bayus, Barry L. (2013), “Crowdsourcing New Product Ideas over Time: An Analysis of the Dell IdeaStorm Community,” Management Science, 59 (1), 226–244.
Bendapudi, Neeli and Robert P. Leone (2003), “Psychological Implications of Customer Participation in Co-Production,” Journal of Marketing, 67 (1), 14–28.
Bensaou, Michael (1997), “Interorganizational Cooperation: The Role of Information Technology an Empirical Comparison of US and Japanese Supplier Relations,” Information Systems Research, 8 (2), 107–124.
Bidault, Francis, Charles Despres, and Christina Butler (1998), “New Product Development and Early Supplier Involvement (ESI): The Drivers of ESI Adoption,” International Journal of Technology Management, 15 (1-2), 49–69.*

References
127
Biddle, Bruce J. (1986), “Recent Developments in Role Theory,” Annual Review of
Sociology, 12, 67–92.
Bonner, Joseph M. (2010), “Customer Interactivity and New Product Performance: Moderating Effects of Product Newness and Product Embeddedness,” Industrial
Marketing Management, 39 (3), 485–492.*
Bonner, Joseph M. and Orville C. Walker (2004), “Selecting Influential Business-to-Business Customers in New Product Development: Relational Embeddedness and Knowledge Heterogeneity Considerations,” Journal of Product Innovation
Management, 21 (3), 155–169.
Boudreau, Kevin J., Nicola Lacetera, and Karim R. Lakhani (2011), “Incentives and Problem Uncertainty in Innovation Contests: An Empirical Analysis,” Management
Science, 57 (5), 843–863.
Brettel, Malte and Nina J. Cleven (2011), “Innovation Culture, Collaboration with External Partners and NPD Performance,” Creativity and Innovation Management,
20 (4), 253–272.*
Brockhoff, Klaus (2003), “Customers Perspectives of Involvement in New Product Development,” International Journal of Technology Management, 26 (5), 5–6.
Brown, Shona L. and Kathleen M. Eisenhardt (1995), “Product Development: Past Research, Present Findings, and Future Directions,” Academy of Management
Review, 20 (2), 343–378.
Browning, Larry D., Janice M. Beyer, and Judy C. Shetler (1995), “Building Cooperation in a Competitive Industry: SEMATECH and the Semiconductor Industry,” Academy of
Management Journal, 38 (1), 113–151.
Burkhardt, Marlene E. & Brass, Daniel J. (1990), “Changing Patterns of Patterns of Change: The Effects of a Change in Technology on Social Network Structure and Power,” Administrative Science Quarterly, 35 (1), 104–127.
Burroughs, James E., Darren W. Dahl, C. Page Moreau, Amitava Chattopadhyay, and Gerald J. Gorn (2011), “Facilitating and Rewarding Creativity During New Product Development,” Journal of Marketing, 75 (4), 53–67.
Burroughs, James E., C. Page Moreau, and David Glen Mick (2008), “Toward a Psychology of Consumer Creativity,” in Handbook of Consumer Psychology, Curtis P. Haugtvedt, Paul M. Herr, and Frank R. Kardes, eds., New York, NY: Erlbaum, 1011–1038.
C
Calantone, Roger J. and C. Anthony Di Benedetto (1988), “An Integrative Model of the New Product Development Process: An Empirical Validation,” Journal of Product
Innovation Management, 5 (3), 201–215.
References
128
Calantone, Roger J., Nukhet Harmancioglu, and Cornelia Droge (2010), “Inconclusive Innovation “Returns”: A Meta-Analysis of Research on Innovation in New Product Development,” Journal of Product Innovation Management, 27 (7), 1065–1081.
Callahan, John and Eytan Lasry (2004), “The Importance of Customer Input in the Development of Very New Products,” R&D Management, 34 (2), 107–120.*
Callahan, John and Brian Moretton (2001), “Reducing Software Product Development Time,” International Journal of Project Management, 19 (1), 59–70.*
Campbell, Alexandra J. and Robert G. Cooper (1999), “Do Customer Partnerships Improve New Product Success Rates?” Industrial Marketing Management, 28 (5), 507–519.
Cankurtaran, Pinar, Fred Langerak, and Abbie Griffin (2013), “Consequences of New Product Development Speed,” Journal of Product Innovation Management, 30 (3), 465–486.
Cannon, Joseph P. and Christian Homburg (2001), “Buyer–Supplier Relationships and Customer Firm Costs,” Journal of Marketing, 65 (1), 29–43.
Cannon, Joseph P. and William D. Perreault Jr. (1999), “Buyer-Seller Relationships in Business Markets,” Journal of Marketing Research, 36 (4), 439–460.
Carbonell, Pilar, Ana I. Rodríguez–Escudero, and Devashish Pujari (2009), “Customer Involvement in New Service Development: An Examination of Antecedents and Outcomes,” Journal of Product Innovation Management, 26 (5), 536–550.*
Carr, Amelia S., Hale Kaynak, Janet L. Hartley, and Anthony Ross (2008), “Supplier Dependence: Impact on Supplier's Participation and Performance,” International
Journal of Operations & Production Management, 28 (9), 899–916.*
Carson, Stephen J. (2007), “When to Give Up Control of Outsourced New Product Development,” Journal of Marketing, 71 (1), 49–66.
Cassiman, Bruno and Reinhilde Veugelers (2006), “In Search of Complementarity in Innovation Strategy: Internal R&D and External Knowledge Acquisition,” Management Science, 52 (1), 68–82.
Chan, Kimmy Wa, Chi Kin Yim, and Simon S.K . Lam (2010), “Is Customer Participation in Value Creation a Double-Edged Sword? Evidence from Professional Financial Services Across Cultures,” Journal of Marketing, 74 (3), 48–64.
Chandy, Rajesh K. (2003), “Research as Innovation: Rewards, Perils, and Guideposts for Research and Reviews in Marketing,” Journal of the Academy of Marketing Science, 31 (3), 351–355.
Chen, Injazz J. and Antony Paulraj (2004), “Towards a Theory of Supply Chain Management: The Constructs and Measurements,” Journal of Operations
Management, 22 (2), 119–150.*
References
129
Chen, Jiyao, Fariborz Damanpour, and Richard R. Reilly (2010), “Understanding Antecedents of New Product Development Speed: A Meta-Analysis,” Journal of
Operations Management, 28 (1), 17–33.
Chen, Yen-Chun, Po-Chien Li, and Kenneth R. Evans (2012), “Effects of Interaction and Entrepreneurial Orientation on Organizational Performance: Insights into Market Driven and Market Driving,” Industrial Marketing Management, 41 (6), 1019–1034.*
Chesbrough, Henry William (2003), Open Innovation: The New Imperative for Creating
and Profiting from Technology, Boston, MA: Harvard Business Press.
Chesbrough, Henry William (2007), “Why Companies Should Have Open Business Models,” MIT Sloan Management Review, 48 (2), 22–28.
Chien, Shu-Hua and Jyh-Jye Chen (2010), “Supplier Involvement and Customer Involvement Effect on New Product Development Success in the Financial Service Industry,” The Service Industries Journal, 30 (2), 185–201.*
Clark, Derek J. and Christian Riis (1998) “Influence and the Discretionary Allocation of Several Prizes,” European Journal of Political Economy, 14 (4), 605–625.
Clark, Kim B. (1989) “Project Scope and Project Performance: The Effect of Parts Strategy and Supplier Involvement on Product Development,” Management Science, 35 (10), 1247–1263.
Clark, Kim B. and Takahiro Fujimoto (1991), Product Development Performance:
Strategy, Organization, and Management in the World Auto Industry, Boston, MA: Harvard Business School Press.
Cohen, Wesley M. and Daniel A. Levinthal (1990), “Absorptive Capacity: A New Perspective on Learning and Innovation,” Administrative Science Quarterly, 35 (1), 128–152.
Collins, Rebecca L. (1996), “The Impact of Upward Social Comparison on Self-Evaluations,” Psycholoogical Bulletin, 119 (1), 51–69.
Cooper, Robert G. (1979), “The Dimensions of Industrial New Product Success and Failure,” Journal of Marketing, 43 (3), 93–103.
Cooper, Robert G. and Elko J. Kleinschmidt (1986), “An Investigation into the New Product Process: Steps, Deficiencies, and Impact,” Journal of Product Innovation
management, 3 (2), 71–85.
Cooper, Robert G. and Elko J. Kleinschmidt (1994), “Determinants of Timeliness in Product Development,” Journal of Product Innovation Management, 11 (5), 381–396.
Corsten, Daniel and Jan Felde (2005), “Exploring the Performance Effects of Key–Supplier Collaboration,” International Journal of Physical Distribution & Logistics
Management, 35 (6), 445–461.*

References
130
Cousins, Paul D., Benn Lawson, Kenneth J. Petersen, and Robert B. Handfield (2011), “Breakthrough Scanning, Supplier Knowledge Exchange, and New Product Development Performance,” Journal of Product Innovation Management, 28 (6), 930–942.*
D
Dabhilkar, Mandar, Lars Bengtsson, Robin von Haartman, and Par Ahlstrom (2009), “Supplier Selection or Collaboration? Determining Factors of Performance Improvement When Outsourcing Manufacturing,” Journal of Purchasing and Supply
Management, 15 (3), 143–153.*
Dahan, Ely and Haim Mendelson (2001), “An Extreme-Value Model of Concept Testing,” Management Science, 47 (1), 102–116.
Dahl, Darren W., Amitava Chattopadhyay, and Gerald J. Gorn (1999), “The Use of Visual Mental Imagery in New Product Design,” Journal of Marketing Research, 36 (1), 18–28.
Dahl, Darren W. and C. Page Moreau (2007), “Thinking Inside the Box: Why Consumers Enjoy Constrained Creative Experiences,” Journal of Marketing Research, 44 (3), 357–369.
Danese, Pamela and Roberto Filippini (2010), “Modularity and the Impact on New Product Development Time Performance,” International Journal of Operations &
Production Management, 30 (11), 1191–1209.*
Danneels, Erwin (2003), “Tight-Loose Coupling with Customers: The Enactment of Customer Orientation,” Strategic Management Journal, 24 (6), 559–576.
Das, Ajay, Ram Narasimhan, and Srinivas Talluri (2006), “Supplier Integration: Finding an Optimal Configuration,” Journal of Operations Management, 24 (5), 563–582.*
Day, George S. (1994), “The Capabilities of Market–Driven Organizations,” Journal of
Marketing, 58 (4), 37–52.
De Luca, Luigi M. and Kwaku Atuahene–Gima (2007), “Market Knowledge Dimensions and Cross-Functional Collaboration: Examining the Different Routes to Product Innovation Performance,” Journal of Marketing, 71 (1), 95–112.
De Toni, Alberto and Guido Nassimbeni (1999), “Buyer-Supplier Operational Practices, Sourcing Policies and Plant Performances: Results of an Empirical Research,” International Journal of Production Research, 37 (3), 597–619.*
De Toni, Alberto and Guido Nassimbeni (2000), “Just-in-Time Purchasing: An Empirical Study of Operational Practices, Supplier Development and Performance,” Omega, 28 (6), 631–651.*
Deci, Edward L. and Richard M. Ryan (1985), Intrinsic Motivation and Self-Determination
in Human Behavior, New York, NY: Kluwer.
References
131
Dellarocas, Chrysanthos (2003), “The Digitization of Word of Mouth: Promise and Challenges of Online Feedback Mechanisms,” Management Science, 49 (10), 1407–1424.
Desarbo, Wayne S., C. Anthony Di Benedetto, Michael Song, and Indrajit Sinha (2005), “Revisiting the Miles and Snow Strategic Framework: Uncovering Interrelationships between Strategic Types, Capabilities, Environmental Uncertainty, and Firm Performance,” Strategic Management Journal, 26 (1), 47–74.
Dowlatshahi, Shad and N. Contreras (1999), “The Role of Designer-Buyer-Supplier in the Maquiladora Industry,” International Journal of Production Research, 37 (9), 1963–1086.*
Doz, Yves L. and Gary Hamel (1998), Alliance Advantage: The Art of Creating Value
Through Partnering, Boston, MA: Harvard Business Press.
Doz, Yves L., Paul Olk, and Peter Smith Ring (2000), “Formation Processes of R&D Consortia: Which Path to Take? Where Does it Lead?” Strategic Management Journal, 21 (3), 239–266.
Dröge, Cornelia L., Jayanth Jayaram, and Shawnee K. Vickery (2000), “The Ability to Minimize the Timing of New Product Development and Introduction: An Examination of Antecedent Factors in the North American Automobile Supplier Industry,” Journal of Product Innovation Management, 17 (1), 24–40.*
Dröge, Cornelia L., Jayanth Jayaram, and Shawnee K. Vickery (2004), “The Effects of Internal Versus External Integration Practices on Time-Based Performance and Overall Firm Performance,” Journal of Operations Management, 22 (6), 557–573.*
Dvir, Dov, Stanislav Lipovetsky, Aaron J. Shenhar, and Asher Tishler (2003), “What is Really Important for Project Success? A Refined, Multivariate, Comprehensive Analysis,” International Journal of Management and Decision Making, 4 (4), 382–404.*
Dyer, Jeffrey H. and Harbir Singh (1998), “The Relational View: Cooperative Strategy and Sources of Interorganizational Competitive Advantage,” Academy of
Management Review, 23 (4), 660–679.
E
Eisenberger, Robert and Stephen Armeli (1997), “Can Salient Reward Increase Creative Performance Without Reducing Intrinsic Creative Interest?” Journal of Personality
and Social Psychology, 72 (3), 652–663.
Eisenberger, Robert and Michael Selbst (1994), “Does Reward Increase or Decrease Creativity?” Journal of Personality and Social Psychology, 66 (6), 1116–1127.
Eisenberger, Robert and Linda Shanock (2003), “Rewards, Intrinsic Motivation, and Creativity: A Case Study of Conceptual and Methodological Isolation,” Creativity
Research Journal, 15 (2 & 3), 121–130.
References
132
Eisenhardt, Kathleen M. and Behnam N. Tabrizi (1995), “Accelerating Adaptive Processes: Product Innovation in the Global Computer Industry,” Administrative
Science Quarterly, 40 (1), 84–110.*
Ellis, Scott C., John W. Henke Jr., and Thomas J. Kull (2012), “The Effect of Buyer Behaviors on Preferred Customer Status and Access to Supplier Technological Innovation: An Empirical Study of Supplier Perceptions,” Industrial Marketing
Management, 41 (8), 1259–1269.*
Engardio, Pete and Bruce Einhorn (2005), “Outsourcing Innovation,” Business Week, March 21.
Evanschitzky, Heiner, Martin Eisend, Roger J. Calantone, and Yuanyuan Jiang (2012), “Success Factors of Product Innovation: An Updated Meta-Analysis,” Journal of
Product Innovation Management, 29 (S1), 21–37.
F
Faems, Dries, Bart Van Looy, and Koenraad Debackere (2005), “Interorganizational Collaboration and Innovation: Toward a Portfolio Approach,” Journal of Product
Innovation Management, 22 (3), 238–250.
Fang, Eric (2008), “Customer Participation and the Trade-Off Between New Product Innovativeness and Speed to Market,” Journal of Marketing, 72 (4), 90–104.*
Fang, Eric, Robert W. Palmatier, and Kenneth R. Evans (2008), “Influence of Customer Participation on Creating and Sharing of New Product Value,” Journal of the
Academy of Marketing Science, 36 (3), 322–326.*
Farley, John U., Donald R. Lehmann, and Alan Sawyer (1995), “Empirical Marketing Generalization Using Meta-Analysis,” Marketing Science, 14 (3, supplement), G36–G46.
Feng, Taiwen, Linyan Sun, and Ying Zhang (2010), “The Effects of Customer and Supplier Involvement on Competitive Advantage: An Empirical Study in China,” Industrial Marketing Management, 39 (8), 1384–1394.*
Feng, Taiwen, Linyan Sun, Chunyan Zhue, and Amrik S. Sohal (2012), “Customer Orientation for Decreasing Time-to-Market of New Products: IT Implementation as a Complementary Asset,” Industrial Marketing Management, 41 (6), 929–939.*
Festinger, Leon (1954), “A Theory of Social Comparison Processes,” Human Relations, 7, 117–140.
Filippini, Roberto, Luigi Salmaso, and Paolo Tessarolo (2004), “Product Development Time Performance: Investigating the Effect of Interactions between Drivers,” Journal of Product Innovation Management, 21 (3), 199–214.*
Flynn, Barbara B., Roger G. Schroeder, and Sadao Sakakibara (1994), “A Framework for Quality Management Research and an Associated Measurement Instrument,” Journal of Operations Management, 11 (4), 339–366.*

References
133
Franke, George, R. and Jeong-Eun Park (2006), “Salesperson Adaptive Selling Behavior and Customer Orientation: A Meta-Analysis,” Journal of Market Research, 43 (4), 693–702.
Franke, Nikolaus, Martin Schreier, and Ulrike Kaiser (2010), “The “I Designed It Myself” Effect in Mass Customization,” Management Science, 56 (1), 125–140.
Fuchs, Christoph and Martin Schreier (2011), “Customer Empowerment in New Product Development,” Journal of Product Innovation Management, 28 (1), 17–32.
G
Gales, Lawrence and Dina Mansour-Cole (1995), “User Involvement in Innovation Projects: Toward an Information Processing Model,” Journal of Engineering and
Technology Management, 12 (1–2), 77–109.*
Gatignon, Hubert and Jean-Marc Xuereb (1997), “Strategic Orientation of the Firm New Product Performance,” Journal of Marketing Research, 34 (1), 77–90.
Geyskens, Inge, Jan-Benedict E. M. Steenkamp, and Nirmalya Kumar (1999), “A Meta-Analysis of Satisfaction in Marketing Channel Relationships,” Journal of Marketing
Research, 36 (2), 223–238.
Girotra, Karan, Christian Terwiesch, and Karl T. Ulrich (2010), “Idea Generation and the Quality of the Best Idea,” Management Science, 56 (4), 591–605.
González, Francisco Javier Miranda and Tomás Manuel Bañegil Palacios (2002), “The Effect of New Product Development Techniques on New Product Success in Spanish Firms,” Industrial Marketing Management, 31 (3), 261–271.*
González-Benito, Javier, Duilio Reis da Rocha, and Dolores Queiruga (2010), “The Environment as a Determining Factor of Purchasing and Supply Strategy: An Empirical Analysis of Brazilian Firms,” International Journal of Production
Economics, 124 (1), 1–10.*
Grayson, Kent and Tim Ambler (1999), “The Dark Side of Long-Term Relationships in Marketing Services,” Journal of Marketing Research, 36 (1), 132–141.
Greene, William H. (2000), Econometric Analysis, Upper Saddle River, NJ: Prentice-Hall.
Grewal, Rajdeep and Patriya Tansuhaj (2001), “Building Organizational Capabilities for Managing Economic Crisis: The Role of Market Orientation and Strategic Flexibility,” Journal of Marketing, 65 (2), 67–80.
Griffin, Abbie (1997), “PDMA Research on New Product Development Practices: Updating Trends and Benchmarking Best Practices,” Journal of Product Innovation
Management, 14 (6), 429–458.
Griffin, Abbie (2002), “Product Development Cycle Time for Business-to-Business Products,” Industrial Marketing Management, 31 (2), 291–304.
References
134
Griffin, Abbie and Albert L. Page (1996), “PDMA Success Measurement Project: Recommended Measures for Product Development Success and Failure,” Journal of
Product Innovation Management, 13 (6), 478–496.
Griffin, Abbie, and John R. Hauser (1993), “The Voice of the Customer,” Marketing
Science, 12 (1), 1–27.
Griffith, David A., Nukhet Harmancioglu, and Cornelia L. Dröge (2009), “Governance Decisions for the Offshore Outsourcing of New Product Development in Technology Intensive Markets,” Journal of World Business, 44 (3), 217–224.*
Gruber, Marc, Florian Heinemann, Malte Brettel, and Stephan Hungeling (2010), “Configurations of Resources and Capabilities and their Performance Implications: An Exploratory Study on Technology Ventures,” Strategic Management Journal, 31 (12), 1337–1356.*
Gruner, Kjell E. and Christian Homburg (2000), “Does Customer Interaction Enhance New Product Success?" Journal of Business Research, 49 (1), 1–14.
Gulati, Ranjay and Maxim Sytch (2007), “Dependence Asymmetry and Joint Dependence in Interorganizational Relationships: Effects of Embeddedness on a Manufacturer's Performance in Procurement Relationships,” Administrative Science Quarterly, 52 (1), 32–69.*
Gundlach, Gregory T., Ravi S. Achrol, and John T. Mentzer (1995), “The Structure of Commitment in Exchange,” Journal of Marketing, 59 (1), 78–92.
H
Håkansson, Hakan and Ann Kristen Eriksson (1993), “Getting Innovations Out of the Supplier Networks,” Journal of Business-to-Business Marketing, 1 (3), 3–34.
Hamel, Gary, Yves L. Doz, and C.K. Prahalad (1989), “Collaborate with Your Competitors – and Win,” Harvard Business Review, 67 (1), 190–196.
Hamilton, Barton H. and Jackson A. Nickerson (2003), “Correcting for Endogeneity in Strategic Management Research,” Strategic Organization, 1 (1), 51–78.
Handfield, Robert B., Gary L. Ragatz, Kenneth Peterson, and Robert M. Monczka (1999), “Involving Suppliers in New Product Development?” California Management Review, 42 (1), 59–82.
Handfield, Robert B., Kenneth J. Petersen, Paul D. Cousins, and Benn Lawson (2009), “An Organizational Entrepreneurship Model of Supply Management Integration and Performance Outcomes,” International Journal of Operations & Production
Management, 29 (2), 100–126.*
Handfield, Robert B., Gary L. Ragatz, Kenneth Peterson, and Robert M. Monczka (1999), “Involving Suppliers in New Product Development?” California Management Review, 42 (1), 59–82.

References
135
Hansen, Lars P. (1982), “Large Sample Properties of Generralized Method of Moments Estimators,” Econometrica, 50 (3), 1029–1054.
Hansen, Morten T. (1999), “The Search-Transfer Problem: The Role of Weak Ties in Sharing Knowledge Across Organization Subunits,” Administrative Science Quarterly,
44 (1), 82–111.
Hartley, Janet L., Jack R. Meredith, David McCutcheon, and Rajan R. Kamath (1997), “Suppliers’ Contributions to Product Development: An Exploratory Study,” IEEE
Transactions on Engineering Management, 44 (3), 258–267.*
Hartley, Janet L., Billie J. Zirger, and Rajan R. Kamath (1997), “Managing the Buyer-Supplier Interface For On-Time Performance in Product Development,” Journal of
Operations Management, 15 (1), 57–70.*
Hauser, John, Gerard J. Tellis, and Abbie Griffin (2006), “Research on Innovation: A Review and Agenda for Marketing Science,” Marketing Science, 25 (6), 687–717.
Hedges, Larry V. and Ingram Olkin (1985), Statistical Methods for Meta-Analysis,
Orlando, FL: Academic Press.
Heide, Jan B. and George John (1990), “Alliances in Industrial Purchasing: The Determinants of Joint Action in Buyer-Supplier Relationships,” Journal of Marketing
Research, 27 (1), 24–36.
Heide, Jan B. and George John (1992), “Do Norms Matter in Marketing Relationships?” Journal of Marketing, 56 (2), 32–44.
Heide, Jan B. and Kenneth H. Wathne (2006), “Friends, Businesspeople, and Relationship Roles: A Conceptual Framework and a Research Agenda,” Journal of
Marketing, 70 (3), 90–103.
Henard, David H. and David M. Szymanski (2001), “Why Some New Products are More Successful Than Others,” Journal of Marketing Research, 38 (3), 362–375.
Hennessey, Beth A. and Teresa M. Amabile (1988), “The Conditions of Creativity,” in The
Nature of Creativity, Robert J. Sternberg, ed., New York, NY: Cambridge University Press, 11–38.
Hitt, Michael A., Robert E. Hoskisson, and Hicheon Kim (1997), “International Diversification: Effects on Innovation and Firm Performance in Product-Diversified Firms,” Academy of Management Journal, 40 (4), 767–798.
Hoegl, Martin and Stephan M. Wagner (2005), “Buyer-Supplier Collaboration in Product Development Projects,” Journal of Management, 31 (4), 530–548.*
Holbrook, Morris B., Kathleen T. Lacher, and Michael S. LaTour (2006), “Audience Judgments as the Potential Missing Link Between Expert Judgments and Audience Appeal: An Illustration Based on Musical Recordings of “My Funny Valentine”,” Journal of the Academy of Marketing Science, 34 (1), 8–18.

References
136
Hong, Yunsook and Janet L. Hartley (2011), “Managing the Supplier-Supplier Interface in Product Development: The Moderating Role of Technological Newness,” Journal
of Supply Chain Management, 47 (3), 43–62.*
Howe, Jeff (2006), “The Rise of Crowdsourcing,” Wired, June 14.
Howe, Jeff (2008), Why the Power of the Crowd is Driving the Future of Business, New York, NY: Random House.
Hunt, Shelby D. and Robert M. Morgan (1996), “The Resource-Advantage Theory of Competition: Dynamics, Path Dependencies, and Evolutionary Dimensions,” Journal
of Marketing, 60 (4), 107–114.
Hunter, John E. and Frank L. Schmidt (1990), Methods of Meta-Analysis: Correcting Error
and Bias in Research Findings, Newbury Park, CA: Sage Publications.
Huston, Larry and Nabil Sakkab (2006), “Connect and Develop,” Harvard Business
Review, 84 (3), 58–66.
I
Im, Subin and John P. Workman Jr. (2004), “Market Orientation, Creativity, and New Product Performance in High-Technology Firms,” Journal of Marketing, 68 (2), 114–132.
Inemek, Aydin and Paul Matthyssens (2013), “The Impact of Buyer-Supplier Relationships on Supplier Innovativeness: An Empirical Study in Cross-Border Supply Networks,” Industrial Marketing Management, 42 (4), 580–594.*
Inkpen, Andrew C. (1996), “Creating Knowledge Through Collaboration,” California
Management Review, 39 (1), 123–140.
Ittner, Christopher D. and David F. Larcker (1995), “Total Quality Management and the Choice of Information and Reward Systems,” Journal of Accounting Research, 33 (Studies on Managerial Accounting), 1–34.*
Ittner, Christopher D. and David F. Larcker (1997a), “Product Development Cycle Time and Organizational Performance,” Journal of Marketing Research, 34 (1), 13–23.*
Ittner, Christopher D. and David F. Larcker (1997b), “The Performance Effects of Process Management Techniques,” Management Science, 43 (4), 522–534.*
J
Jackson, Susan E. and Randall S. Schuler (1985), “A Meta-Analysis and Conceptual Critique of Research on Role Ambiguity and Role Conflict in Work Settings,” Organizational Behavior and Human Decision Processes, 36 (1), 16–78.
Jap, Sandy D. (1999), “Pie-Expansion Efforts: Collaboration Processes in Buyer–Supplier Relationships,” Journal of Marketing Research, 36 (4), 461–475.
References
137
Jayanth Jayaram (2008), “Supplier Involvement in New Product Development Projects: Dimensionality and Contingency Effects,” International Journal of Production
Research, 46 (13), 3717–3735.*
Jayaram, Jayanth, Shawnee K. Vickery, and Cornelia L. Dröge (2008), “Relationship Building, Lean Strategy and Firm Performance: An Exploratory Study in the Automotive Supplier Industry,” International Journal of Production Research, 46 (20), 5633–5649.*
Jayaram, Jayanth, Kefeng Xub, and Mariana Nicolae (2011), “The Direct and Contingency Effects of Supplier Coordination and Customer Coordination on Quality and Flexibility Performance,” International Journal of Production Research, 49 (1), 59–85.
Jaworski, Bernard J. and Ajay K. Kohli (1993), “Market Orientation: Antecedents and Consequences,” Journal of Marketing, 57 (3), 53–70.
Jean, Ruey-Jer ‘Bryan’, Rudolf R. Sinkovics, and Thomas Hiebaum (forthcoming), “The Effects of Supplier Involvement and Knowledge Protection on Product Innovation in Customer–Supplier Relationships: A Study of Global Automotive Suppliers in China,” Journal of Product Innovation Management.*
Jeppesen, Lars Bo and Karim R. Lakhani (2010), “Marginality and Problem-Solving Effectiveness in Broadcast Search,” Organization Science, 21 (5), 1016–1033.
John, George, Allen M. Weiss, and Shantanu Dutta (1999), “Marketing in Technology-Intensive Markets: Toward a Conceptual Tramework, Journal of Marketing, 63 (Special Issue), 78–92.
Johnsen, Thomas E. (2009), “Supplier Involvement in New Product Development and Innovation: Taking Stock and Looking to the Future,” Journal of Purchasing and
Supply Management, 15 (3), 187–197.
Joshi, Ashwin W. and Rodney L. Stump (1999), “The Contingent Effect of Specific Asset Investments on Joint Action in Manufacturer-Supplier Relationships: An Empirical Test of the Moderating Role of Reciprocal Asset Investments, Uncertainty, and Trust,” Journal of the Academy of Marketing Science, 27 (3), 291–305.*
Jung, Joo Y. and Yong Jian Wang (2006), “Relationship between Total Quality Management (TQM) and Continuous Improvement of International Project Management (CIIPM),” Technovation, 26 (5–6), 716–722.
K
Katz, Daniel and Robert L. Kahn (1966), The Social Psychology of Organizations, New York, NY: John Wiley & Sons.
Kessler, Eric H. (2000), “Tightening the Belt: Methods for Reducing Development Costs Associated with New Product Innovation,” Journal of Engineering and Technology
Management, 17 (1), 59–92.
References
138
Kessler, Eric H., Paul E. Bierly, and Shanthi Gopalakrishnan (2000), “Internal vs. External Learning in New Product Development: Effects on Speed, Costs and Competitive Advantage,” R&D Management, 30 (3), 213–223.
Kim, Jongbae and David Wilemon (2002), “Focusing the Fuzzy Front–End in New Product Development,” R&D Management, 32 (4), 269–279.
Kleinschmidt, Elko J. and Robert G. Cooper (1991), “The Impact of Product Innovativeness on Performance,” Journal of Product Innovation Management, 8 (4), 240–251.
Kleinschmidt, Elko J., Ulrike De Brentani, and Sören Salomo (2007), “Performance of Global New Product Development Programs: A Resource-Based View,” Journal of
Product Innovation Management, 24 (5), 419–441.
Knudsen, Mette Praest (2007), “The Relative Importance of Interfirm Relationships and Knowledge Transfer for New Product Development Success,” Journal of Product
Innovation Management, 24 (2), 117–138.*
Kotabe, Masaaki, Xavier Martin, and Hiroshi Domoto, (2003), “Gaining from Vertical Partnerships: Knowledge Transfer, Relationship Duration, and Supplier Performance Improvement in the US and Japanese Automotive Industries,” Strategic Management Journal, 24 (4), 293–316.
Kotha, Suresh and Richard Nolan (2005), Boeing 787: The Dreamliner, Boston, MA: Harvard Business School Publishing.
Koufteros, Xenophon A., T.C. Edwin Cheng, and Kee-Hung Lai (2007), ““Black-Box” and “Gray-Box” Supplier Integration in Product Development: Antecedents, Consequences and the Moderating Role of Firm Size,” Journal of Operations
Management, 25 (4), 847–870.*
Koufteros, Xenophon A., Greg E. Rawski, and Rauniar Rupak (2010), “Organizational Integration for Product Development: The Effects on Glitches, On-Time Execution of Engineering Change Orders, and Market Success,” Decision Sciences, 41 (1), 49–80.*
Koufteros, Xenophon A., Mark Vonderembse, and Jayanth Jayaram (2005), “Internal and External Integration for Product Development: The Contingency Effects of Uncertainty, Equivocality, and Platform Strategy”, Decision Sciences, 36 (1), 97–133.*
Koza, Mitchell P. and Arie Y. Lewin (1999), “The Coevolution of Network Alliance: A Longitudinal Analysis of an International Professional Service Network,” Organization Science, 10 (5), 638–653.
Kristal, Mehmet Murat, Xiaowen Huang, and Roger G. Schroeder (2010), “The Effect of Quality Management on Mass Customization Capability,” International Journal of
Operations & Production Management, 30 (9), 900–922.*
Kristensson, Per, Anders Gustafsson, and Trevor Archer (2004), “Harnessing the Creative Potential among Users,” Journal of Product Innovation Management, 21 (1), 4–14.

References
139
L
Laamanen, Tomi (2005), “Dependency, Resource Depth, and Supplier Performance During Industry Downturn,” Research Policy, 34 (2), 125–140.*
LaBahn, Douglas W. and Robert Krapfel (2000), “Early Supplier Involvement in Customer New Product Development: A Contingency Model of Component Supplier Intentions,” Journal of Business Research, 47 (3), 173–190.
Lado, Augustine A., Nancy G. Boyd, and Susan C. Hanlon (1997), “Competition, Cooperation, and the Search for Economic Rents: A Syncretic Model,” Academy of
Management Review, 22 (1), 110–141.
Lai, Chi-Shiun, Chun-Shou Chen, Chih-Jen Chiu, and Da-Chang Pai (2011), “The Impact of Trust on the Relationship between Inter-Organisational Collaboration and Product Innovation Performance,” Technology Analysis & Strategic Management, 23 (1), 65–74.*
Lakshman, C. and Ronaldo C. Parente (2008), “Supplier-Focused Knowledge Management in the Automobile Industry and Its Implications for Product Performance,” Journal of Management Studies, 45 (2), 317–342.*
Lane, Peter J. and Michael Lubatkin (1998), “Relative Absorptive Capacity and Interorganizational Learning,” Strategic Management Journal, 19 (5), 461–477.
Langerak, Fred and Erik Jan Hultink (2005), “The Impact of New Product Development Acceleration Approaches on Speed and Profitability: Lessons for Pioneers and Fast Followers,” IEEE Transactions on Engineering Management, 52 (1), 30–42.*
Langerak, Fred and Erik Jan Hultink (2008), “The Effect of New Product Development Acceleration Approaches on Development Speed: A Case Study,” Journal of
Engineering and Technology Management, 25 (3), 157–167.*
Langerak, Fred, Serge Rijsdijk, and Koen Dittrich (2009), “Development Time and New Product Sales: A Contingency Analysis of Product Innovativeness and Price,” Marketing Letters, 20 (4), 399–413.*
Lau, Antonio K. W., Esther Tang, and Richard C. M. Yam (2010), “Effects of Supplier and Customer Integration on Product Innovation and Performance: Empirical Evidence in Hong Kong Manufacturers,” Journal of Product Innovation Management, 27 (5), 761–777.*
Lau, Antonio K.W., Richard C.M. Yam, and Esther P.Y. Tang (2010), “Supply Chain Integration and Product Modularity: An Empirical Study of Product Performance for Selected Hong Kong Manufacturing Industries,” International Journal of
Operations & Production Management, 30 (1), 20–56.*
Lau, Antonio K.W., Richard C.M. Yam, and Esther P.Y. Tang (2007), “Supply Chain Product Co–Development, Product Modularity and Product Performance: Empirical Evidence from Hong Kong Manufacturers,” Industrial Management & Data Systems, 107 (7), 1036–1065.*
References
140
Lawson, Benn, Kenneth J. Petersen, Paul D. Cousins, and Robert B. Handfield (2009), “Knowledge Sharing in Interorganizational Product Development Teams: The Effect of Formal and Informal Socialization Mechanisms,” Journal of Product Innovation
Management, 26 (2), 156–172.*
Lazear, Edward P. and Sherwin Rosen (1981), “Rank-Order Tournaments as Optimum Labor Contracts,” Journal of Political Economy, 89, (5), 841–864.
Li, Wenli, Paul K. Humphreys, Andy C.L. Yeung, and T.C. Edwin Cheng (2007), “The Impact of Specific Supplier Development Efforts on Buyer Competitive Advantage: An Empirical Model,” International Journal of Production Economics, 106 (1), 230–247.*
Liker, Jeffrey K. and Thomas Y. Choi (2004), “Building Deep Supplier Relationships,” Harvard Business Review, 82 (12), 104–113.
Liker, Jeffrey K., Rajan R. Kamath, and S. Nazli Wasti (1998), “Supplier Involvement in Design: A Comparative Survey of Automotive suppliers in the USA, UK and Japan,” International Journal of Quality Science, 3 (3), 214–238.*
Lilien, Gary L. and Eunsang Yoon (1990), “The Timing of Competitive Market Entry: An Exploratory Study of New Industrial Products,” Management Science, 36 (5), 568–585.
Lilien, Gary L., Rajdeep Grewal, Douglas Bowman, Min Ding, Abbie Griffin, V. Kumar, Das Narayandas, Renana Peres, Raji Srinivasan, and Qiong Wang (2010), “Calculating, Creating, and Claiming Value in Business Markets: Status and Research Agenda,” Marketing Letters, 21 (3), 287–299.
Lin, Chinho, Wing S. Chow, Christian N. Madu, Chu-Hua Kuei, and Pei Pei Yu (2005), “A Structural Equation Model of Supply Chain Quality Management and Organizational Performance,” International Journal of Production Economics, 96 (3), 355–365.*
Lin, Xiaohua and Richard Germain (2004), “Antecedents to Customer Involvement in Product Development: Comparing US and Chinese Firms,” European Management
Journal, 22 (2), 244–255.*
Lin, Ming-Ji James and Chin-Hua Huang (2013), “The Impact of Customer Participation on NPD Performance: The Mediating Role of Inter–Organisation Relationship,” Journal of Business & Industrial Marketing, 28 (1), 3–15.*
Link, Albert N. and John T. Scott (2010), “Government as Entrepreneur: Evaluating the Commercialization Success of SBIR projects,” Research Policy, 39 (5), 589–601.
Lipsey, Mark W. and David B. Wilson (2001), Practical Meta-Analysis, Thousand Oaks, CA: Sage Publications.
Lowry, Annie (2011), “Can Cash Prizes for Innovation Get the Economy Rolling Again?” Washington Post, January 2.
References
141
Luo, Changyue, Debasish N. Mallick, and Roger G. Schroeder (2010), “Collaborative Product Development: Exploring the Role of Internal Coordination Capability in Supplier Involvement,” European Journal of Innovation Management, 13 (2), 244–266.*
Luo, Xueming, Aric Rindfleisch, and David K. Tse (2007), “Working with Rivals: The Impact of Competitor Alliances on Financial Performance,” Journal of Marketing
Research, 44 (1), 73–83.
M
Maddala, G. S. (1977), Econometrics, New York, NY: McGraw-Hill.
Mangold, W. Glynn and David J. Faulds (2009), “Social Media: The New Hybrid Element of the Promotion Mix,” Business Horizons, 52 (4), 357–365.
Malhotra, Deepak (2010), “The Desire to Win: The Effects of Competitive Arousal on Motivation and Behavior,” Organizational Behavior and Human Decision Processes,
111 (2), 139–146.
Mankins, John C. (2009), “Technology Readiness Assessments: A Retrospective,” Acta
Astronautica, 65 (9), 1216–1223.
Marsh, Richard L., Thomas B. Ward, and Joshua D. Landau (1999), “The Inadvertent Use of Prior Knowledge in a Generative Cognitive Task,” Memory and Cognition, 27 (1), 94–105.
Mayer, Kyle J. and Jack A. Nickerson (2005), “Antecedents and Performance Implications of Contracting for Knowledge Workers: Evidence from Information Technology Services,” Organization Science, 16 (3), 225–242.
Maylor, Harvey (1997), “Concurrent New Product Development: An Empirical Assessment,” International Journal of Operations & Production Management, 17 (12), 1196–1214.*
Maylor, Harvey (2001), “Assessing the Relationship between Practice Changes and Process Improvement in New Product Development,” Omega, 29 (1), 85–96.*
McNally, Regina, M. Billlur Akdeniz, and Roger J. Calantone (2011), “New Product Development Processes and New Product Profitability: Exploring the Mediating Role of Speed to Market and Product Quality,” Journal of Product Innovation
Management, 28 (S1), 63–77.
McKinsey (2009), And the Winner is…: Capturing the Promise of Philanthropic Prizes,
Sydney: McKinsey and Company.
Millson, Murray R. and David Wilemon (2002), “The Impact of Organizational Integration and Product Development Proficiency on Market Success,” Industrial
Marketing Management, 31 (1), 1–23.*
Millson, Murray R. and David Wilemon (2006), “Driving New Product Success in the Electrical Equipment Manufacturing Industry,” Technovation, 26 (11), 1268–1286.*
References
142
Millson, Murray R., S.P. Raj, and David Wilemon (1996), “Strategic Partnering for Developing New Products,” Research-Technology Management, 12 (May-June), 41–49.
Mishra, Anant A. and Rachna Shah (2009), “In Union Lies Strength: Collaborative Competence in New Product Development and its Performance Effects,” Journal of
Operations Management, 27 (4), 324–338.*
Moenaert, Rudy K. and William E. Souder (1990), “An Information Transfer Model for Integrating Marketing and R&D Personnel in New Product Development Projects,” Journal of Product Innovation Management, 7 (2), 91–107.
Mohr, Jakki J. and Sanjit Sengupta (2002), “Managing the Paradox of Inter-Firm Learning: the Role of Governance Mechanisms,” Journal of Business & Industrial Marketing, 17 (4), 282–301.
Montgomery, James D. (1998), “Toward a Role-Theoretic Conception of Embeddedness,” American Journal of Sociology, 104 (1), 92–125.
Moreau, Page C. and Darren W. Dahl (2005), “Designing the Solution: The Impact of Constraints on Consumers’ Creativity,” Journal of Consumer Research, 32 (1), 13–22.
N
Naor, Michael, Susan M. Goldstein, Kevin W. Linderman, and Roger G. Schroeder (2008), “The Role of Culture as Driver of Quality Management and Performance: Infrastructure versus Core Quality Practices,” Decision Sciences, 39 (4), 671–702.*
Narasimhan, Om, Surendra Rajiv, and Shantanu Dutta (2006), “Absorptive Capacity in High–Technology Markets: The Competitive Advantage of the Haves,” Marketing
Science, 25 (5), 510–524.
Narasimhan, Ram, Morgan Swink, and Sridhar Viswanathan (2010), “On Decisions for Integration Implementation: An Examination of Complementarities Between Product-Process Technology Integration and Supply Chain Integration,” Decision
Sciences, 41 (2), 355–372.*
Narver, John C. and Stanley F. Slater (1990), “The Effect of Market Orientation on Business Profitability,” Journal of Marketing, 54 (4), 20–35.
Nassimbeni, Guido (1996), “Factors Underlying Operational JIT Purchasing Practices: Results of an Empirical Research,” International Journal of Production Economics, 42 (3), 275–288.*
Naveh, Eitan (2005), “The Effect of Integrated Product Development on Efficiency and Innovation,” International Journal of Production Research, 43 (13), 2789–2808.*
Naveh, Eitan (2007), “Formality and Discretion in Successful R&D Projects,” Journal of
Operations Management, 25 (1), 110–125.*
Neale, Michael R. and David R. Corkindale (1998), “Co-Developing Products: Involving Customers Earlier and More Deeply,” Long Range Planning, 31 (3), 418–425.
References
143
Netemeyer, Richard G., Mark W. Johnston, and Scot Burton (1990), “Analysis of Role Conflict and Role Ambiguity in a Structural Equations Framework,” Journal of
Applied Psychology, 75 (2), 148–157.
Ngo, Liem Viet and Aron O'Cass (2013), “Innovation and Business Success: The Mediating Role of Customer Participation,” Journal of Business Research, 66 (8), 1134–1142.*
Nieto, María Jesús and Lluis Santamaría (2007), “The Importance of Diverse Collaborative Networks for the Novelty of Product Innovation,” Technovation, 27 (6–7), 367–377.*
Nijssen, Edwin J., Bas Hillebrand, Jeroen P. J. de Jong, and Ron G. M. Kemp (2012), “Strategic Value Assessment and Explorative Learning Opportunities with Customers,” Journal of Product Innovation Management, 29 (S1), 91–102.*
Noordhoff, Corine S., Kyriakos Kyriakopoulos, Christine Moorman, Pieter Pauwels, and Benedict G.C. Dellaert (2011), “The Bright Side and Dark Side of Embedded Ties in Business-to-Business Innovation,” Journal of Marketing, 75 (5), 34–52.
Nygaard, Arne and Robert Dahlstrom (2002), “Role Stress and Effectiveness in Horizontal Alliances,” Journal of Marketing, 66 (2), 61–82.
O
O'Cass, Aron and Liem Viet Ngo (2012), “Creating Superior Customer Value for B2B Firms Through Supplier Firm Capabilities,” Industrial Marketing Management, 41 (1), 125–135.*
Oldham, Greg R. and Anne Cummings (1996), “Employee Creativity: Personal and Contextual Factors at Work,” Academy of Management Journal, 39 (3), 607–634.
Ordanini, Andrea, Lucia Miceli, Marta Pizzetti, and A. Parasuraman (2011), “Crowdfunding: Transforming Customers into Investors Through Innovative Service Platforms,” Journal of Service Management, 22 (4), 443–470.
P
Page, Albert L. (1993), “Assessing New Product Development Practices and Performance: Establishing Crucial Norms,” Journal of Product Innovation
Management, 10 (4), 273–290.
Parker, Delvon B., George A. Zsidisin, and Gary L. Ragatz, (2008), “Timing and Extent of Supplier Integration in New Product Development A Contingency Approach,” Journal of Supply Chain Management, 44 (1), 71–83.*
Payne, John W., James R. Bettman, and Mary Frances Luce (1996), “When Time Is Money: Decision Behavior under Opportunity-Cost Time Pressure,” Organizational Behavior
and Human Decision Processes, 66 (2), 131–152.

References
144
Peng, David Xiaosong, Rachna Shah, Roger G. Schroeder, and Anto Verghese (forthcoming), “The Relationship between External Integration and Plant Improvement and Innovation Capabilities: The Moderation Effect of Product Clockspeed,” Journal of Supply Chain Management.*
Percival, David and Robert D. Shelton (2013), Unleashing the Power of Innovation, London: PricewaterhouseCoopers.
Perols, Johan, Carsten Zimmermann, and Sebastian Kortmann (2013), “On the Relationship between Supplier Integration and Time-to-Market,” Journal of
Operations Management, 31 (3), 153–167.*
Petersen, Kenneth J., Robert B. Handfield, and Gary L. Ragatz (2003), “A Model of Supplier Integration into New Product Development,” Journal of Product Innovation
Management, 20 (4), 284–299.*
Peterson, Robert A. and Steven P. Brown (2005), “On the Use of Beta Coefficients in Meta-Analysis,” Journal of Applied Psychology, 90 (1), 175–181.
Pfeffer, Jeffrey and Christina T. Fong (2005), “Building Organization Theory from First Principles: The Self-Enhancement Motive and Understanding Power and Influence, Organization Science, 16 (4), 372–388.
Phan, Anh Chi, Ayman Bahjat Abdallah, and Yoshiki Matsui (2011), “Quality Management Practices and Competitive Performance: Empirical Evidence from Japanese Manufacturing Companies,” International Journal of Production Economics, 133 (2), 518–529.*
Poetz, Marion K. and Martin Schreier (2012), “The Value of Crowdsourcing: Can Users Really Compete with Professionals in Generating New Product Ideas?” Journal of
Product Innovation Management, 29 (2), 245–256.
Porter, Michael E. (1980), Competitive Strategy: Techniques for Analyzing Industries and
Competitors, New York, NY: Free Press.
Porter, Constance Elise and Naveen Donthu (2008), “Cultivating Trust and Harvesting Value in Virtual Communities,” Management Science, 54 (1), 113–128.
Potter, Antony and Benn Lawson (2013), “Help or Hindrance? Causal Ambiguity and Supplier Involvement in New Product Development Teams,” Journal of Product
Innovation Management, 30 (4), 794–808.*
Powell, Walter W., Kenneth W. Koput, and Laurel Smith-Doerr (1996), “Interorganizational Collaboration and the Locus of Innovation: Networks of Learning in Biotechnology,” Administrative Science Quarterly, 41 (1), 116–145.
Prahalad, Coimbatore K. and Venkatram Ramaswamy (2004), The Future of Competition:
Co–Creating Unique Value with Customers, Boston, MA: Harvard Business Press.
Primo, Marcos A.M. and Susan D. Amundson (2002), “An Exploratory Study of the Effects of Supplier Relationships on New Product Development Outcomes,” Journal
of Operations Management, 20 (1), 33–52.*

References
145
Pujari, Devashish (2006), “Eco-Innovation and New Product Development: Understanding the Influences on Market Performance,” Technovation, 26 (1), 76–85.*
Pujari, Devashish, Gillian Wright, and Ken Peattie (2003), “Green and Competitive Influences on Environmental New Product Development Performance,” Journal of
Business Research, 56 (8), 657–671.*
Q
Quesada, Gioconda, Ahmad Syamil, and William J. Doll (2006), “OEM New Product Development Practices: The Case of the Automotive Industry,” Journal of Supply
Chain Management, 42 (3), 30–40.*
R
Ragatz, Gary L., Robert B. Handfield, and Kenneth J. Petersen (2002), “Benefits Associated with Supplier Integration into New Product Development under Conditions of Technology Uncertainty,” Journal of Business Research, 55 (5), 389–400.*
Ragatz, Gary L., Robert B. Handfield, and Thomas V. Scannell (1997), “Success Factors for Integrating Suppliers into New Product Development,” Journal of Product
Innovation Management, 14 (3), 190-202.
Ramani, Girish and Vipin Kumar (2008), “Interaction Orientation and Firm Performance,” Journal of Marketing, 72 (1), 27–45.
Ramaswami, Sridhar N., Rajendra K. Srivastava, and Mukesh Bhargava (2009), “Market-Based Capabilities and Financial Performance of Firms: Insights into Marketing’s Contribution to Firm Value,” Journal of the Academy of Marketing Science, 37 (2), 97–116.*
Ramsey, James B. (1969), “Tests for Specification Errors in Classical Linear Least-Squares Regression Analysis,” Journal of the Royal Statistical Society, Series B, 31 (2), 350–371.
Reagans, Ray and Bill McEvily (2003), “Network Structure and Knowledge Transfer: The Effects of Cohesion and Range,” Administrative Science Quarterly, 48 (2), 240–267.
Reeves, Lauretta M. and Robert W. Weisberg (1993), “On the Concrete Nature of Human Thinking: Content and Context in Analogical Transfer,” Educational Psychology, 13 (3), 245–258.
Rindfleisch, Aric and Christine Moorman (2001), “The Acquisition and Utilization of Information in New Product Alliances: A Strength-of-Ties Perspective,” Journal of
Marketing, 65 (2), 1–18.
Rindfleisch, Aric and Jan B. Heide (1997), “Transaction Cost Analysis: Past, Present, and Future Applications, Journal of Marketing, 61 (4), 30–54.
References
146
Rindfleisch, Aric, Kersi D. Antia, Janet Bercovitz, James Brown, Joseph Cannon, Stephen Carson, Susan Helper, Mrinal Ghosh, Diana C. Robertson, and Kenneth H. Wathne (2010), “Transaction Costs, Opportunism, and Governance: Contextual Considerations and Future Research Opportunities,” Marketing Letters, 21 (3), 211–222.
Ritter, Thomas and Achim Walter (2003), “Relationship-Specific Antecedents of Customer Involvement in New Product Development,” International Journal of
Technology Management, 26 (5/6), 482–498.*
Rokkan, Aksel I., Jan B. Heide, and Kenneth H. Wathne (2003), “Specific Investments in Marketing Relationships: Expropriation and Bonding Effects,” Journal of Marketing
Research, 40 (2), 210–224.
Rosenberg, Nathan (1990), “Why do Firms do Basic Research (With Their Own Money)?” Research Policy, 19 (2), 165–174.
Rosenthal, Robert (1991), Meta-Analytic Procedures for Social Research, Newbury Park, CA: Sage Publications.
Ross Jr., William T. and Diana C. Robertson (2007), “Compound Relationships between Firms,” Journal of Marketing, 71 (3), 108–123.
Rossiter, John R. and Gary Lilien (1994), “New ‘Brainstorming’ Principles,” Australian
Journal of Management, 19 (1), 61–72.
Rothaermel, Frank T. and David L. Deeds (2004), “Exploration and Exploitation Alliances in Biotechnology: A System of New Product Development,” Strategic
Management Journal, 25 (3), 201–221.
Rothwell, Roy (1994), “Towards the Fifth-Generation Innovation Process,” International
Marketing Review, 11 (1), 7–31.
Rubera, Gaia and Ahmet H. Kirca (2012), “Firm Innovativeness and its Performance Outcomes: A Meta-Analytic Review and Theoretical Integration,” Journal of
Marketing, 76 (3), 130–147.
Rupak, Rauniar, William Doll, Greg Rawski, and Paul Hong (2008), “Shared Knowledge and Product Design Glitches in Integrated Product Development,” International
Journal of Production Economics, 114 (2), 723–736.
S
Salvador, Fabrizio and Veronica H. Villena (2013), “Supplier Integration and NPD Outcomes: Conditional Moderation Effects of Modular Design Competence,” Journal
of Supply Chain Management, 49 (1), 87–113.*
Sánchez, Angel Martínez and Manuela Pérez Pérez (2003a), “Cooperation and the Ability to Minimize the Time and Cost of New Product Development within the Spanish Automotive Supplier Industry,” Journal of Product Innovation Management, 20 (1), 57–69.*

References
147
Sánchez, Angel Martínez and Manuela Pérez Pérez (2003b), “Flexibility In New Product Development: A Survey of Practices and its Relationship with the Product's Technological Complexity,” Technovation, 23 (2), 139–145.*
Scannell, Thomas V., Shawnee K. Vickery, and Cornelia L. Dröge (2000), “Upstream Supply Chain Management and Competitive Performance in the Automotive Supply Industry,” Journal of Business Logistics, 21 (1), 23–48.*
Schmidt, Jeffrey B. and Roger J. Calantone (1998), “Are Really New Product Development Projects Harder to Shut Down?” Journal of Product Innovation
Management, 15 (2), 111–123.
Schmidt, Jeffrey B. and Roger J. Calantone (2002), “Escalation of Commitment During New Product Development,” Journal of the Academy of Marketing Science, 30 (2), 103–118.
Sethi, Rajesh (2000), “New Product Quality and Product Development Teams,” Journal
of Marketing, 64 (2), 1–14.*
Shah, Jami J., Steve M. Smith, and Noe Vargas-Hernandez (2003), “Metrics for Measuring Ideation Effectiveness,” Design Studies, 24 (2), 111–134.
Shalley, Christina E. (1995), “Effects of Coaction, Expected Evaluation, and Goal Setting on Creativity and Productivity,” Academy of Management Journal, 38 (2), 483–503.
Shalley, Christina E. and Jing Zhou (2008), “Organizational Creativity Research: A Historical Overview,” in Handbook of Organizational Creativity, Jing Zhou and Christina E. Shalley, eds., New York, NY: Erlbaum, 3–31.
Sherman, J. Daniel, William E. Souder, and Svenn A. Jenssen (2000), “Differential Effects of the Primary Forms of Cross Functional Integration on Product Development Cycle Time,” Journal of Product Innovation Management, 17 (4), 257–267.*
Shrout, Patrick E. and Joseph L. Fleiss (1979), “Intraclass Correlations: Uses in Assessing Rater Reliability,” Psychological Bulletin, 86 (2), 420–428.
Silk, Alvin J. and Manohar U. Kalwani (1982), “Measuring Influence in Organizational Purchase Decisions,” Journal of Marketing Research, 19 (2), 165-181.
Singh, Balvir and Aman Ullah (1974), “Estimation of Seemingly Unrelated Regressions with Random Coefficients,” Journal of the American Statistical Association, 69 (3), 191–195.
Singh, Jagdip (1993), “Boundary Role Ambiguity: Facts, Determinants, and Impacts,” Journal of Marketing, 57 (2), 11–31.
Singh, Prakash J. and Damien Power (2009), “The Nature and Effectiveness of Collaboration between Firms, their Customers and Suppliers: A Supply Chain Perspective,” Supply Chain Management, 14 (3), 189–200.*
Sivadas, Eugene and F. Robert Dwyer (2000), “An Examination of Organizational Factors Influencing New Product Success in Internal and Alliance-Based Processes,” Journal
of Marketing, 64 (1), 31–49.

References
148
Slater, Stanley F. and John C. Narver (1995), “Market Orientation and the Learning Organization,” Journal of Marketing 59 (3), 63–74.
Sobrero, Maurizio and Edward B. Roberts (2001), “The Trade-Off Between Efficiency and Learning in Interorganizational Relationships for Product Development,” Management Science, 47 (4), 493–511.*
Sobrero, Maurizio and Edward B. Roberts (2002), “Strategic Management of Supplier-Manufacturer Relations in New Product Development,” Research Policy, 31 (1), 159–182.*
Solomon, Michael R., Carol Surprenant, John A. Czepiel, and Evelyn G. Gutman (1985), “A Role Theory Perspective on Dyadic Interactions: The Service Encounter,” Journal of
Marketing, 49 (1), 99–111.
Song, Michael and C. Anthony Di Benedetto (2008), “Supplier's Involvement and Success of Radical New Product Development in New Ventures,” Journal of Operations
Management, 26 (1), 1–22.*
Song, Michael, Cornelia L. Dröge, Sangphet Hanvanich, and Roger J. Calantone (2005), “Marketing and Technology Resource Complementarity: An Analysis of their Interaction Effect in Two Environmental Contexts,” Strategic Management Journal, 26 (3), 259–276.
Song, Michael and Mitzi M. Montoya-Weiss (2001), “The Effect of Perceived Technological Uncertainty on Japanese New Product Development,” Academy of
Management Journal, 44 (1), 61–80.
Song, X. Michael and Mark E. Parry (1997), “A Cross-National Comparative Study of New Product Development Processes: Japan and the United States,” Journal of Marketing, 61 (2), 1–18.
Song, Michael and Jeff Thieme (2009), “The Role of Suppliers in Market Intelligence Gathering for Radical and Incremental Innovation,” Journal of Product Innovation
Management, 26 (1), 43–57.*
Souder, William E., J. Daniel Sherman, and Rachel Davies-Cooper (1998), “Environmental Uncertainty, Organizational Integration, and New Product Development Effectiveness: A Test of Contingency Theory,” Journal of Product
Innovation Management, 15 (6), 520–533.*
Spina, Gianluca, Roberto Verganti, and Giulio Zotteri (2002), “Factors Influencing Co-Design Adoption: Drivers and Internal Consistency,” International Journal of
Operations & Production Management, 22 (12), 1354–1366.*
Srinivasan, Raji, Gary L. Lilien, and Shrihari Sridhar, “Should Firms Spend More on Research and Development and Advertising During Recessions?” Journal of
Marketing, 75 (3), 49–65.
Srivastava, Rajendra K., Tasadduq A. Shervani, and Liam Fahey (1998), “Market-Based Assets and Shareholder Value: A Framework for Analysis,” Journal of Marketing, 62 (1), 2–18.

References
149
Staiger, Douglas and James H. Stock (1997), “Instrumental Variables Regression with Weak Instruments,” Econometrica 65 (3), 557–586.
Stock, Ruth Maria and Nicolas A. Zacharias (2013), “Two Sides of the Same Coin: How Do Different Dimensions of Product Program Innovativeness Affect Customer Loyalty?” Journal of Product Innovation Management, 30 (3), 516–532.*
Stuart, F. Ian (1993), “Supplier Partnerships: Influencing Factors and Strategic Benefits,” Journal of Supply Chain Management, 29 (4), 22–28.*
Stump, Rodney L., Gerard A. Athaide, and Ashwin W. Joshi (2002), “Managing Seller-Buyer New Product Development Relationships for Customized Products: A Contingency Model Based on Transaction Cost Analysis and Empirical Test,” Journal
of Product Innovation Management, 19 (6), 439–454.*
Swink, Morgan (1999), “Threats to New Product Manufacturability and the Effects of Development Team Integration Processes,” Journal of Operations Management, 17 (6), 691–709.*
Swink, Morgan, Ram Narasimhan, Cynthia Wang (2007), “Managing beyond the Factory Walls: Effects of Four types of Strategic Integration on Manufacturing Plant Performance,” Journal of Operations Management, 25 (1), 148–164.*
Swink, Morgan, Srinivas Talluri, and Temyos Pandejpong (2006), “Faster, Better, Cheaper: A Study of NPD Project Efficiency and Performance Tradeoffs,” Journal of
Operations Management, 24 (5), 542–562.
T
Takeishi, Akira (2002), “Knowledge Partitioning in the Interfirm Division of Labor: The Case of Automotive Product Development,” Organization Science, 13 (3), 321–338.*
Takeishi, Akira (2001), “Bridging Inter– and Intra–Firm Boundaries: Management of Supplier Involvement in Automobile Product Development,” Strategic Management
Journal, 22 (5), 403–433.*
Tan, Chong Leng and Michael Tracey (2007), “Collaborative New Product Development Environments: Implications for Supply Chain Management,” Journal of Supply Chain
Management, 43 (3), 2–15.*
Tatikonda, Mohan V. and Mitzi M. Montoya-Weiss (2001), “Integrating Operations and Marketing Perspectives of Product Innovation: The Influence of Organizational Process Factors and Capabilities on Development Performance,” Management
Science, 47 (1), 151–172.
Tavani, Saeed Najafi, Hossein Sharifi, Sohrab Soleimanof, and Manoochehr Najmi (forthcoming), “An Empirical Study of Firm’s Absorptive Capacity Dimensions, Supplier Involvement and New Product Development Performance,” International
Journal of Production Research.*
References
150
Terwiesch, Christian and Christoph H. Loch (1999), “Measuring the Effectiveness of Overlapping Development Activities,” Management Science, 45 (4), 455–465.
Terwiesch, Christian and Yi Xu (2008), “Innovation Contests, Open Innovation, and Multiagent Problem Solving,” Management Science, 54 (9), 1529–1543.
Tomlinson, Philip R. (2010), “Co-Operative Ties and Innovation: Some New Evidence for UK Manufacturing,” Research Policy, 39 (6), 762–775.*
Toubia, Olivier (2006), “Idea Generation, Creativity, and Incentives,” Marketing Science,
25 (5), 411–425.
Tracey, Michael (2004), “A Holistic Approach to New Product Development: New Insights,” Journal of Supply Chain Management, 40 (4), 37–55.*
Tracey, Michael and Chong Leng Tan (2001), “Empirical Analysis of Supplier Selection and Involvement, Customer Satisfaction, and Firm Performance,” Supply Chain
Management, 6 (3/4), 174–188.*
Troye, Sigurd Villads and Magne Supphellen (2012), “Consumer Participation in Coproduction: “I Made It Myself” Effects on Consumers’ Sensory Perceptions and Evaluations of Outcome and Input Product,” Journal of Marketing, 76 (2), 33–46.
Tsai, Kuen–Hung (2009), “Collaborative Networks and Product Innovation Performance: Toward a Contingency Perspective,” Research Policy, 38 (5), 765–778.*
Tuli, Kapil R., Sundar G. Bharadwaj, and Ajay K. Kohli (2010), “Ties that Bind: The Impact of Multiple Types of Ties with a Customer on Sales Growth and Sales Volatility,” Journal of Marketing Research, 47 (1), 36–50.
U
Ulrich, Karl, David Sartorius, Scott Pearson, and Mark Jakiela (1993), “Including the Value of Time in Design-for-Manufacturing Decision Making,” Management Science,
39 (4), 429–447.
Un, C. Annique, Alvaro Cuervo-Cazurra, and Kazuhiro Asakawa (2010), “R&D Collaborations and Product Innovation,” Journal of Product Innovation Management,
27 (5), 673–689.*
Urban, Glen L. and Eric von Hippel (1988), “Lead User Analysis for the Development of New Industrial Products,” Management Science, 34 (5), 569–582.
V
Vallerand, Robert J. (1997), “Toward a Hierarchical Model of Intrinsic and Extrinsic Motivation,” Advances in Experimental Social Psychology, 29, 271–360.
References
151
Van Sell, Mary, Arthur P. Brief, and Randall S. Schuler (1981), “Role Conflict and Role Ambiguity: Integration of the Literature and Directions for Future Research,” Human Relations, 34 (1), 43–71.
Vargo, Stephen L. and Robert F. Lusch (2004), “Evolving to a New Dominant Logic for Marketing,” 68 (1), 1–17.
Verona, Gianmario (1999), “A Resource-Based View of Product Development,” Academy
of Management Review, 24 (1), 132–142.
Vickery, Shawnee K., Jayanth Jayaram, Cornelia L. Dröge, and Roger J. Calantone (2003), “The Effects of an Integrative Supply Chain Strategy on Customer Service and Financial Performance: An Analysis of Direct Versus Indirect Relationships,” Journal
of Operations Management, 21 (5), 523–539.*
Vinacke, W. Edgar (1953), The Psychology of Thinking, New York, NY: McGraw Hill.
Vonderembse, Mark A. and Michael Tracey (1999), “The Impact of Supplier Selection Criteria and Supplier Involvement on Manufacturing Performance,” Journal of
Supply Chain Management, 35 (3), 33–39.*
Von Hippel, Eric, (1986), “Lead Users: A Source of Novel Product Concepts,” Management Science, 32 (7), 791–805.
Von Hippel, Eric (2005), Democratizing Innovation, Cambridge, MA: The MIT Press.
Vorhies, Douglas W. and Neil A. Morgan (2005), “Benchmarking Marketing Capabilities for Sustainable Competitive Advantage,” Journal of Marketing, 69 (1), 80–94.
W
Wagner, Stephan M. (2012), “Tapping Supplier Innovation,” Journal of Supply Chain
Management, 48 (2), 38–52.*
Walker, Gordon (1994), “Asset Choice and Supplier Performance in Two Organizations-US and Japanese,” Organization Science, 5 (4), 583–593.*
Wallsten, Scott J. (2000), “The Effects of Government-Industry R&D Programs on Private R&D: The Case of the Small Business Innovation Research Program,” The RAND
Journal of Economics, 31 (1), 82–100.
Walter, Achim (2003), “Relationship–Specific Factors Influencing Supplier Involvement in Customer New Product Development,” Journal of Business Research, 56 (9), 721–733.*
Walter, Achim, Thilo A. Müller, Gabriele Helfert, and Thomas Ritter, (2003), “Functions of Industrial Supplier Relationships and their Impact on Relationship Quality,” Industrial Marketing Management, 32 (2), 159–169.
Wasti, S. Nazli and Jeffrey K. Liker (1997), “Risky Business or Competitive Power? Supplier Involvement in Japanese Product Design,” Journal of Product Innovation
Management, 14 (5), 337–355.*

References
152
Wasti, S. Nazli and Jeffrey K. Liker (1999), “Collaborating with Suppliers in Product Development: A US and Japan Comparative Study,” IEEE Transactions on
Engineering Management, 46 (4), 444–461.*
Wernerfelt, Birger (1984), “A Resource-Based View of the Firm,” Strategic Management
Journal, 5 (2), 171–180.
Wertheimer, Max (1945), Productive Thinking, New York, NY: Harper.
Williams, Charles R. and Linda Parrack Livingstone (1994), “Another Look at the Relationship between Performance and Voluntary Turnover,” Academy of
Management Journal, 37 (2), 269-298.
Wind, Jerry and Vijay Mahajan (1997), “Editorial: Issues and Opportunities in New Product Development: An Introduction to the Special Issue,” Journal of Marketing
Research, 34 (1), 1–12.
Wooldridge, Jeffrey M. (2002), Econometric Analysis of Cross Section and Panel Data, Cambridge, MA: The MIT Press.
Wu, Sarah Jinhui and Gary L. Ragatz (2010), “Evaluating the Total Effect of Early Supplier Involvement on Project Team Effectiveness: Collaboration and Interaction,” International Journal of Integrated Supply Management, 5 (3), 239–259.*
Wu, Zhaohui and Thomas Y. Choi (2005), “Supplier-Supplier Relationships in the Buyer-Supplier Triad: Building Theory from Eight Case Studies,” Journal of Operations
Management, 24 (1), 27–52.
Wuyts, Stefan, Shantanu Dutta, and Stefan Stremersch (2004), “Portfolios of Interfirm Agreements in Technology-Intensive Markets: Consequences for Innovation and Profitability,” Journal of Marketing, 68 (April), 88–100.
Wynstra, Finn and Eric ten Pierick (2000), “Managing Supplier Involvement in New Product Development: A Portfolio Approach,” European Journal of Purchasing &
Supply Management, 6 (1), 49–57.
Wynstra, Finn, James C. Anderson, James A. Narus, and Marc Wouters (2012), “Supplier Development Responsibility and NPD Project Outcomes: The Roles of Monetary Quantification of Differences and Supporting–Detail Gathering,” Journal of Product
Innovation Management, 29 (s1), 103–123.*
Wynstra, Finn, Arjan J. Van Weele, and Matthieu Weggeman (2001), “Managing Supplier Involvement in Product Development: Three Critical Issues,” European
Management Journal, 19 (2), 157–167.
Wynstra, Finn, Fredrik von Corswant, and Martin Wetzels (2010), “In Chains? An Empirical Study of Antecedents of Supplier Product Development Activity in the Automotive Industry,” Journal of Product Innovation Management, 27 (5), 625–639.*
References
153
Y
Yoganarasimhan, Hema (2012), “The Value of Reputation in an Online Freelance Marketplace,” working paper.
Z
Zhang, Chun, John W. Henke Jr., and David A. Griffith (2009), “Do Buyer Cooperative Actions Matter under Relational Stress? Evidence from Japanese and U.S. Assemblers in the U.S. Automotive Industry,” Journal of Operations Management, 27 (6), 479–494.*
Zhou, Jing and Christina E. Shalley (2003), “Research on Employee Creativity: A Critical Review and Directions for Future Research,” Research in Personnel and Human
Resource Management, 22, 165–217.
Zirger, Billie J. and Janet L. Hartley (1994), “A Conceptual Model of Product Development Cycle Time,” Journal of Engineering and Technology Management, 11 (3), 229–251.
Zirger, Billie J. and Janet L. Hartley (1996), “The Effect of Acceleration Techniques on Product Development Time,” IEEE Transactions on Engineering Management, 43 (2), 143–152.*


Center Dissertation Series
CentER for Economic Research, Tilburg University, The Netherlands
No. Author Title ISBN Published
264 Hsing-Er Lin Effects of Strategy, Context, and Antecedents and Capabilities on Outcomes of Ambidexterity– A Multiple Country Case Study of the US, China and Taiwan
978 90 5668 264 4
December 2010
265 Jeffrey Powell The Limits of Economic Self-interest: The Case of Open Source Software
978 90 5668 265 1
December 2010
266 Galla Salganik Essays on Investment Flows of Hedge Fund and Mutual Fund Investors
978 90 5668 266 8
December 2010
267 Cécile Fruteau Biological markets in the everyday lives of mangabeys and vervets: An observational and experimental study
978 90 5668 267 5
December 2010
268 Yang Zhao The Role of Directors’ Professional and Social Networks in CEO Compensation and the Managerial Labour Market
978 90 5668 268 2
December 2010
269 Mieszko Mazur Essays on Managerial Remuneration, Organizational Structure and Non-Cash Divestitures
978 90 5668 269 9
December 2010
270 Ralph Stevens Longevity Risk in Life Insurance Products 978 90 5668 270 5
February 2011
271 Cristian Dobre Semidefinite programming approaches for structured combinatorial optimization problems
978 90 5668 271 2
March 2011
272 Kenan Kalayci Essays in Behavioral Industrial Organization
978 90 5668 272 9
February 2011
273 Néomie Raassens The Performance Implications of Outsourcing
978 90 5668 273 6
March 2011
274 Muhammad Ather Elahi
Essays on Financial Fragility 978 90 5668 274 3
March 2011
275 Jan Stoop Laboratory and Field Experiments on Social Dilemmas
978 90 5668 275 0
March 2011
276 Maria Cristina Majo A Microeconometric Analysis of Health Care Utilization in Europe
978 90 5668 276 7
February 2011
277 Jérémie Lefebvre Essays on the Regulation and Microstructure of Equity Markets
978 90 5668 277 4
March 2011
No. Author Title ISBN Published
278 Willem Muhren Foundations of Sensemaking Support Systems for Humanitarian Crisis Response
978 90 5668 278 1
March 2011
279 Mary Pieterse-Bloem The Effect of EMU on Bond market Integration and Investor Portfolio Allocations
978 90 5668 279 8
May 2011
280 Chris Müris Panel Data Econometrics and Climate Change
978 90 5668 280 4
April 2011
281 Martin Knaup Market-Based Measures of Bank Risk and Bank Aggressiveness
978 90 5668 281 1
April 2011
282 Thijs van der Heijden Duration Models, Heterogeneous Beliefs, and Optimal Trading
978 90 5668 282 8
May 2011
283 Titus Galama A Theory of Socioeconomic Disparities in Health
978 90 5668 283 5
June 2011
284 Hana Voňková The Use of Subjective Survey Data: Anchoring Vignettes and Stated Preference Methods
978 90 5668 284 2
May 2011
285 Frans Stel Improving the performance of co-innovation alliances: Cooperating effectively with new business partners
978 90 5668 285 9
July 2011
286 Eric Engesaeth Managerial Compensation Contracting 978 90 5668 286 6
June 2011
287 David Kroon The Post-Merger Integration Phase of Organizations: A longitudinal Examination of Unresolved Issues of Justice and Identity
978 90 5668 287 3
May 2011
288 Christian Bogmans Essays on International Trade and the Environment
978 90 5668 288 0
June 2011
289 Kim Peijnenburg Consumption, Savings, and Investments over the Life Cycle
978 90 5668 289 7
May 2011
290 Youtha Cuypers The Determinants and Performance Implications of Change in Inter-Organizational Relations
978 90 5668 290 3
June 2011
291 Marta Serra Garcia Communication, Lending Relationships and Collateral
978 90 5668 291 0
June 2011
292 Marike Knoef Essays on Labor Force Participation, Aging, Income and Health
978 90 5668 292 7
September 2011
293 Christophe Spaenjers Essays in Alternative Investments 978 90 5668 293 4
September 2011
294 Moazzam Farooq Essays on Financial Intermediation and Markets
978 90 5668 294 1
September 2011
No. Author Title ISBN Published
295 Jan van Tongeren From National Accounting to the Design, Compilation, and Use of Bayesian Policy Analysis Frameworks
978 90 5668 295 8
October 2011
296 Lisanne Sanders Annuity Market Imperfections 978 90 5668 296 5
October 2011
297 Miguel Atanásio Lopes Carvalho
Essays in Behavioral Microeconomic Theory
978 90 5668 297 2
September 2011
298 Marco Della Seta Essays in Corporate Financing and Investment under Uncertainty
978 90 5668 298 9
October 2011
299 Roel Mehlkopf Risk Sharing with the Unborn 978 90 5668 299 6
October 2011
300 Roy Lindelauf Design and Analysis of Covert Networks, Affiliations and Projects
978 90 5668 300 9
October 2011
301 Viswanadha Reddy Essays on Dynamic Games 978 90 5668 301 6
November 2011
302 Pedro Duarte Bom The Macroeconomics of Fiscal Policy and Public Capital
978 90 5668 302 3
November 2011
303 Daniël Smit Freedom of Investment between EU and non-EU Member States and its impact on corporate income tax systems within the European Union
978 90 5668 303 0
December 2011
304 Juan Miguel Londoño Yarce
Essays in Asset Pricing 978 90 5668 304 7
December 2011
305 Edwin Lohmann Joint Decision Making and Cooperative Solutions
978 90 5668 305 4
January 2012
306 Verena Hagspiel Flexibility in Technology Choice: A Real Options Approach
978 90 5668 306 1
December 2011
307 Fangfang Tan Behavioral Heterogeneity in Economic Institutions: An Experimental Approach
978 90 5668 307 8
January 2012
308 Luc Bissonnette Essays on Subjective Expectations and Stated Preferences
978 90 5668 308 5
January 2012
309 Unnati Saha Econometric Models of Child Mortality Dynamics in Rural Bangladesh
978 90 5668 309 2
February 2012
310 Anne ter Braak A New Era in Retail: Private-Label Production by National-Brand Manufacturers and Premium-Quality Private Labels
978 90 5668 310 8
February 2012

No. Author Title ISBN Published
311 Emiel Maasland Essays in Auction Theory 978 90 5668 311 5
February 2012
312 John Glen Essays on the UK Residential Property Market
978 90 5668 312 2
March 2012
313 Amal Elgammal Towards a Comprehensive Framework for Business Process Compliance
978 90 5668 313 9
April 2012
314 David Hollanders The Effect of Aging on Pensions 978 90 5668 315 3
June 2012
315 Salima Douhou Essays on (Small) Crime: Perception, Social Norms, Happiness, and Prevention
978 90 5668 316 0
June 2012
316 Christoph Schottmueller
Essays in Microeconomic Theory 978 90 5668 317 7
June 2012
317 Peter Cziraki Insider Trading, Shareholder Activism, and Corporate Policies
978 90 5668 318 4
September 2012
318 Philipp Geiler Essays on Executive Remuneration Contracting: Managerial Power, Corporate Payout, and Gender Discrimination
978 90 5668 319 1
September 2012
319 Ivo van Amelsfoort Firm decisions and market responses: Three accounting essays
978 90 5668 320 7
September 2012
320 Ronald Spanjers Be Patient: A Longitudinal Study on Adoption and Diffusion of IT-Innovation in Dutch Healthcare
978 90 5668 321 4
September 2012
321 Jinqiang Guo Quantitative Investment Strategies and Portfolio Management
978 90 5668 322 1
October 2012
322 Karen Poghosyan Structural and Reduced-Form Modeling and Forecasting with Application to Armenia
978 90 5668 323 8
September 2012
323 Igor Fedotenkov Pensions and Ageing in a Globalizing World: International Spillover Effects via Trade and Factor Mobility
978 90 5668 324 5
September 2012
324 Zongxin Qian Essays on Globalization, Monetary Policy and Financial Crisis
978 90 5668 325 2
September 2012
325 Tunga Kantarcı Essays on Partial Retirement 978 90 5668 326 9
September 2012
326 Patrick Hullegie Essays on health and labor economics 978 90 5668 327 6
October 2012
327 Mark Vroegrijk “Smart Shopping": Implications of Hard-Discounters and Multiple-Store Patronage
978 90 5668 328 3
September 2012
No. Author Title ISBN Published
328 Millie Elsen Thin and Thicker Slices: How Advertising Effectiveness Depends on Exposure Duration
978 90 5668 329 0
October 2012
329 Juan-Juan Cai Estimation concerning risk under extreme value conditions
978 90 5668 330 6
October 2012
330 Fatih Cemil Özbuğday Empirical Essays on Ex Post Evaluations of Competition and Regulatory Authorities’ Decisions and Policy Reform
978 90 5668 331 3
November 2012
331 Jon Pluyter Designing Immersive Surgical Training Against Information Technology-Related Overload in the Operating Room
978 90 5668 332 0
November 2012
332 Benedikt Kratz A Model and Language for Business-aware Transactions
978 90 5668 333 7
November 2012
333 Mark Humphery-Jenner
Corporate Governance Mechanisms as a driver of Value-Destruction and Value-Creation
978 90 5668 334 4
November 2012
334 Jaap Voeten Understanding Responsible Innovation in Small Producers’ Clusters in Northern Vietnam: A grounded theory approach to globalization and poverty alleviation.
978 90 5668 335 1
December 2012
335 Jaione Yabar Arriola Wait, Bond, and Buy: Consumer Responses to Economic Crisis
978 90 5668 336 8
December 2012
336 Erik von Schedvin Essays on banking, corporate bankruptcy, and corporate finance
978 90 5668 337 5
December 2012
337 Irene Gaia Becheri Limiting Experiments for Panel-Data and Jump-Diffusion Models
978 90 5668 338 2
December 2012
338 Rob Nijskens Bank risk, bailouts and ambiguity 978 90 5668 339 9
December 2012
339 Jie Zheng Essays on Pensions, Health Expectancy and Credit Insurance
978 90 5668 340 5
December 2012
340 Vincent van Kervel Competition between Stock Exchanges and Optimal Trading
978 90 5668 341 2
January 2013
341 Sara Amoroso Heterogeneity of innovative, collaborative, and productive firm-level processes
978 90 5668 342 9
January 2013
342 Aukje Leufkens Accounts of Interest and Strategies of Inter-Organizational Projects: Towards Integrative Collaboration in the Dutch Shipbuilding Industry
978 90 5668 343 6
February 2013
343 Mohammed Chahim Impulse Control Maximum Principle: Theory and Applications
978 90 5668 344 3
February 2013
No. Author Title ISBN Published
344 Özge Özdemir Simulation Modeling and Optimization of Competitive Electricity Markets and Stochastic Fluid Systems
978 90 5668 345 0
February 2013
345 Dorothe Singer The Role of Institutions in International Finance
978 90 5668 346 7
March 2013
346 Jeewanie Jayasinghe Arachchige
A unified modeling framework for service design
978 90 5668 347 4
March 2013
347 Michele Aquaro Pairwise difference estimation of linear data models
978 90 5668 348 1
April 2013
348 Pedro Santos Raposo Flexibility of the labor market 978 90 5668 349 8
April 2013
349 Peter van Oudheusden Essays on Fiscal Policy 978 90 5668 350 4
May 2013
350 Gerard van der Meijden
The Macroeconomic Dynamics of Trade Liberalization, Resource Exploitation, and Backstop Technologies
978 90 5668 351 1
May 2013
351 Robert Kozarski Pricing and Hedging in the VIX Derivative Market
978 90 5668 352 8
May 2013
352 Beatrice Pataracchia Ambiguity Aversion and Heterogeneity in Financial Markets: An Empirical and Theoretical Perspective
978 90 5668 353 5
May 2013
353 Jan Bonenkamp Risk, redistribution and retirement: the role of pension schemes
978 90 5668 354 2
June 2013
354 Thomas Michielsen Essays in Environmental and Resource Economics
978 90 5668 355 9
September 2013
355 Radomir Todorov Essays on Banking and Regulation 978 90 5668 356 6
June 2013
356 Liping Lu Essays on Banking and Finance in China 978 90 5668 357 3
June 2013
357 Thijs Peeters External Knowledge Search and Use in New Product Development
978 90 5668 358 0
June 2013
358 Patrício de Alencar Silva
Value Activity Monitoring 978 90 5668 359 7
June 2013
359 Andreas Zenthöfer Essays on Development Economics 978 90 5668 360 3
June 2013
360 Po Yan Edith Leung The Influence of Reporting Standards and Inter-Firm Relationships on Financial Reporting
978 90 5668 361 0
September 2013

No. Author Title ISBN Published
361 Cees Peters The faltering legitimacy of international tax law
978 90 5668 362 7
September 2013
362 Nathanaël Vellekoop Essays on Household Saving, Religion and Pay Frequency
978 90 5668 363 4
September 2013
363 Angèle Pieters Care and Cure: Compete or Collaborate? Improving Inter-Organizational Designs in Healthcare: A Case Study in Dutch Perinatal Care
978 90 5668 364 1
October 2013
364 Zeynep Burcu Ugur From Headscarves to Donation; Three Essays on the Economics of Gender, Health and Happiness
978 90 5668 365 8
October 2013
365 Consuelo Silva Buston Essays on Risk Management and Systemic Risk
978 90 5668 366 5
November 2013
366 Dinh Khoa Nguyen Blueprint Model and Language for Engineering Cloud Applications
978 90 5668 367 2
November 2013
367 Kan Ji Essays on tax policy, institutions, and output
978 90 5668 368 9
November 2013
368 Wendun Wang Essays on model averaging and political economics
978 90 5668 369 6
November 2013
369 Yaping Mao Essays on Leveraged Buyouts 978 90 5668 370 2
November 2013
370 Antonios Varvitsiotis Combinatorial Conditions for Low Rank Solutions in Semidefinite Programming
978 90 5668 371 9
November 2013
371 Johanna Slot Crossing Boundaries: Involving External Parties in Innovation
978 90 5668 372 6
December 2013
Top Related
Copyright © 2022 FDOKUMEN

