


Bahasa
Halaman
Hukum


ELSEVIER
Journal of Food Engineering 24 (1995) 225-248 © 1994 Elsevier Science Limited
Printed in Great Britain. All rights reserved 0260-8774/95/$9.50
Theoretical Consideration of the General Validity of the Equivalent Point Method in Thermal Process Evaluation
G. Maesmans, M. Hendrickx,* S. De Cordt & P. Tobback
Katholieke Universiteit Leuven, Faculty of Agricultural Sciences, Centre for Food Science and Technology, Unit Food Preservation, Kardinaal
Mercierlaan 92, B-3001 Heverlee, Belgium
(Received 14 January 1993; revised version received 1 July 1993; accepted 26 January 1994)
ABSTRACT
The general validity of the Equivalent Point Method as an evaluation technique in thermal processing is considered. An analysis, based on analytical expressions for the impact of a heat treatment on food quality attributes indicates that the basic assumption of the methodology, i.e. a unique intersection point for a series of thermal reduction relationships, is only warranted theoretically for isothermal heating processes. Under time-variable temperature conditions, the difference between the impact on a target quality attribute calculated from the equivalent point and the impact evaluated directly from the temperature profile increases with increasing deviation from the isothermal heating. This conclusion is proven for process evaluation, based on both the Arrhenius concept and the Thermal Death Time model
NOTATION
b B
D
Dref Ea z FTre f Ea G
E a GTre f
Slope of a linear heating curve (temperature/time) Pre-exponential factor in the Arrhenius equation (time- 1)
(kT = B * e x p [ ( - Ea/Rg) (1 /T )] '= kref* exp[( - Ea/Rg)(1/T- 1/Tref)])
Decimal reduction time, i.e. the time needed at a constant lethal temperature to reduce the concentration of a quality attribute by 90% Decimal reduction time at reference temperature Activation energy (J/tool) Processing value -- TDT model (time a t Tref) Processing value -- Arrhenius model (time at T= oo ) Processing value -- Arrhenius model (time at T-- Trey)
*To whom correspondence should be addressed.
225

226 G. Maesmans, M. Hendrickx, S. De Cordt, P. Tobback
krel In L
L~ LEa
Log M R~ i IE IH T
r . Tint
Trel- z
Reaction rate constant (time- ~ ) at temperature T Reaction rate constant at reference temperature (time ~) Natural logarithm Lethal rate, i.e. time needed at reference temperature per time unit at temperature T that results in the same concentration reduction Lethal rate in terms of the TDT concept ( = 10 it- r,o,)/~ = Dr,,r/D) Lethal rate in terms of the Arrhenius terminology
( = exp[( - Ea/Rg)( 1 / T - 1 / Tref) ] = k/kref) Decimal logarithm ln(N0/N) = In(initial concentration/final concentration) Universal gas constant (8"314 J/mol/K) Time Equivalent time Holding time at isothermal holding temperature Temperature (K or °C) Equivalent temperature (K or °C) Isothermal holding temperature (K or °C) Temperature at the intersection point of two thermal reduction relationships (K or °C) Reference temperature (K or °C) Temperature change needed to change the D-value by 90% (°C)
Abbreviations EPM Equivalent Point Method NLSR Non-linear Least Squares Regression TDT Thermal Death Time WLSR Weighted Least Squares Regression
INTRODUCTION
Accurate evaluation of the integrated impact of time and temperature on a heat treated food or drug is the essential step in the design, control and optimization of thermal processing (Lund, 1975; Pflug, 1987; Maesmans et al., 1990; Teixeira, 1992). However, in a number of heating conditions, practical and technological limitations restrict the exact quantification of the effect of steriliza- tion/pasteurization on a specific quality attribute by the conventional evaluation techniques: (i) in-situ monitoring of changes in the concentration of microbial (spore) load or of any other food quality characteristic (flavour, colour, vitamin content... ) is quite often confined by detection limits, sample size required, time and effort put into the analysis . . . . ; (ii) physical mathematical evaluation tech- niques, i.e. combining a-priori knowledge of the kinetic response of a food quality attribute with physically registered temperature data in a mathematical model to calculate the impact of the process, can only be applied if time- temperature data of the heating medium and product are available. Registering the temperature history of the freely moving particulate part in foods com- prising solids and liquid is not obvious in rotating retorts (May and Cossey, 1989) or aseptic processing conditions (Sastry, 1986). The lack of adequate

EPM general validity in thermal process evaluation 227
evaluation techniques for these types of processing conditions is in sharp contrast to the widespread use of rotating retort systems. Aseptic processing of solid/liquid mixtures still awaits a guaranteed evaluation method to gain and justify its marketplace (Pflug et al., 1990). For these types of heat treatments, process design relies on applying factors-of-safety to processes calculated in a conservative manner (Pflug, 1987; Pflug et al., 1990), optimization relies on empiricism. Proper process evaluation techniques therefore currently receive high imerest.
In thermal processing, a common ground to express the impact of time and variable temperature on a specific food quality attribute (microbial (spore) load, vitamin content, colour, ... ) is the equivalent time at a chosen constant reference temperature which causes the same change in the quality attribute under study as the variable temperature history. From this concept, the denominated
~z rocessing value (ZFTref) for sterilization processes and pasteurization units PUTref) in the case of moderate temperature treatments, the concentration
change in a quality attribute can readily be calculated from the specific equivalent time for the specific quality attribute under study. In order to compare the impact of heat treatments in several processes or to relate the effect of direct and indirect UHT heating units, researchers hence tabulate processing values and/or logarithmic concentration reductions for a few chosen key compounds of high quality importance (e.g. destruction of Clostridium botul inum spores, thiamine, browning of milk,...) (Hallstrrm, 1977). A table of the impact on a number of product compounds is needed because each quality attribute responds according to its specific reaction kinetics (different activation energy-reaction rate constant or z-value-D-value) on the course of the heating/ cooling process.
As an alternative, Swartzel (1982) proposed to characterize the heating process by a unique equivalent time at a unique equivalent (constant) tempera- ture which would result in the same product constituent reduction as the variable time-temperature profile. In contrast to the previously used method where the reference temperature is an arbitrary rescaling factor, the equivalent temperature cannot be chosen freely in the equivalent point method (EPM) but is determined by the heating process. It is professed that each thermal treatment can be characterized by a unique equivalent point (time and temperature), independent from the kinetic behaviour of the product constituents, making this data reduction technique a very handsome tool to compare and communicate heat treatments. Whereas this method was introduced to evaluate and compare direct and indirect heating of fluids in continuous processes, it has also been claimed that the effect of heating particulates in foods comprising solids and a liquid could be monitored in this way (Swartzel, 1985; Sadeghi and Swartzel, 1990b; Swartzel et al., 1991). If it could be proven that the EPM has general applicability, this method would constitute a major breakthrough in our thinking on process evaluation and open interesting perspectives for kinetic parameter determination (Swartzel, 1984; Swartzel and Jones, 1985; Sadeghi and Swartzel, 1990a). However, no study is available in the open literature that illustrates the theoretical justification and validity of the EPM for various processing conditions. Here, we will consider possibilities and restrictions to the use of this concept to express the integrated impact of time and temperature on a heat- treated food or drug. Because the impact of a heat treatment on many quality
228 G. Maesmans, M. Hendrickx, S. De Cordt, P. Tobback
attributes is described by first order reaction kinetics (Stumbo, 1973; Lund, 1975; Pflug and Odlaug, 1978; Ohlsson, 1980), the examples used in this theoretical study will be limited to these types of reactions.
THEORETICAL CONSIDERATIONS
Background of the equivalent point method
The basis of the EPM is the observation that, apparently, a unique point of inter- section can be found when the natural logarithm of the time needed to obtain a specific thermal reduction level (EaG), is plotted as a function of the inverse absolute temperature for a series of E~-values (Swartzel, 1982, 1984, 1986; Swartzel and Jones, 1985; Sadeghi et al., 1986; Sadeghi and Swartzel, 1990 a, b). The thermal reduction level G for each specific E a can be determined either from integration of the temperature history when these data are available or from the change in concentration of a specific (food) constituent. This is represented in eqn ( 1 ) where M = ln(N o/N) for a first order reaction and B is the pre-exponential factor in the Arrhenius equation.
f ' M t:~'G= exp[(-Ed/R~)(1/T)]dt=-- (1)
~~'G represents the time at T = co ( = the temperature at which B is determined) that induces the same concentration change in a specific constituent (E~) as the actual temperature history. Once this EaG is determined for a given variable temperature profile, one can imagine an infinite number of time and constant temperature combinations (t, T) that result in the same reduction for that constituent.
~aG = exp[( - E,/Rg)( 1/T )It (2)
A plot of
ln(t) = In(~G) + (EJRg)(I / 7") (3)
will result in a straight line per Ea-value and per corresponding E"G for a given process. This curve represents all possible combinations of T and t that cause the same concentration change in the quality attribute characterized by this Ea-value and is therefore called a 'thermal reduction relationship'. In the Arrhenius terminology, the logarithm of the rate constant (k) is given as a linear function of the inverse absolute temperature, with a slope (Ea/R) determined
. . . . . g ,
by the activation energy. Thermal reduction relationships, expressed m terms of ln(G)-values therefore will also be a linear function of the inverse absolute temperature ( 1 / T ).
Two thermal reduction relationships, characterized by a different slope of (Eal/R~) and (Eaz/R~) will have no intersect. For any pair of Ea-values , one can determine the temperature at the intersection point after equating the thermal reduction relationship for the two Ea-values as
1 = In( E"l G) --In( Ea2 G) (4)
(Ea2/R - E.,/&)

EPM general validity in thermal process evaluation 229
By substituting the thus found temperature Ti,t for T in eqn (3), the corre- sponding time tint can then be calculated for either one of the Ea-values. Accord- ing to the EPM, this intersection point (tint, Tint) would not depend on the absolute values of Eal and E~2. In other words, a series of thermal reduction relationships, obtained for any set of Ea-Values, would all intersect at a unique, equivalent point, characterizing the heating process by the equivalent time (tE) at the equivalent temperature (TE). This is graphically represented in Fig. 1 for an isothermal heating process. It has been stated that also for variable time-temperature profiles, this intersection point is unique (Swartzel, 1982).
A rescaling finite reference temperature has been introduced in the original EPM as described above to correct for problems associated with limitations in
2 . 0 .
1 . 5
~ , , , , , "
/ , , "
~D
E 1.o c-
._J
o51/ ....
0.0] 0.00252
. _..--- .o-'"'
.,," , , " "
w"
.-" /,,'
.,.,"
0.00255 0.00254 0.00255 0 0 0 2 5 6 0.00257
1/Temperature (1/K) Fig. 1. Thermal reduction relationships (eaG T. ,o-original EPM phrasing) for Ea = 100 kJ/mol (e), E a = 200 kJ/mol (a) and E a = 300 kJ/mol (.), calculated for a heating process consisting of one isothermal ( ) step (2.7130 s at 394.1 K) and of two subsequent isothermal steps ( - - - ) (2.5 s at 380 K followed by 2.5 s at 394.1 K), both yielding an 200k'l/m°lG394.1K = 2"7130 s. A unique equivalent temperature and equivalent time, equal to the actual processing temperature and time is visualized for the single step isothermal heating but cannot be found for the non-constant heating profile. Thermal reduction
relationships for Ea = 200 kJ/mol are equal for the two heating conditions.

230 G. Maesmans, M. Hendrickx, S. De Cordt, P. Tobback
exponential capabilities of (early) microcomputers and work with more convenient numbers (Nunes and Swartzel, 1990; Nunes et al., 1993). In this reparameterized phrasing, eqn ( 1 ) can be written as
f, E~'G-~,,= exp[(-E~/R~)(1/T- 1/ir;~f)] d t= ~M (5) j0 krel
Here, EaGTref represents the time at the constant lethal temperature Tre f ( = the temperature at which the reaction rate constant is kTref ) that induces the same concentration change in a specific constituent (Ea) as the actual temperature history. Please note that eqn (1) is identical to eqn (5): in eqn (1), Tr~.r = oo and k~T=~I=B, the Arrhenius pre-exponential factor. The intersection point between two thermal reduction relationships can readily be calculated from
1 _In( TM G)-In('~-~G)+ 1 (6) T~,~ (Ea:/R~ - E,I/Rg) li~,
The unique equivalent point can be graphically determined (Sadeghi et al., 1986) from the intersection point of a series of straight lines representing
In(t) = ln(EaGTr~f)+(1/T- 1/T~,,f)(Ea/Rg ) (7)
as of function of the inverse equivalent temperature (1/T) for a series of E,- values. The authors who have used the EPM (all belonging to the same research group) note that accumulating errors, e.g. in thermocouple calibration and data acquisition of the temperature history, in solving the integral (eqn (1) or (5)), in determining concentration changes of temperature sensitive components, etc., would be reflected in a less than perfect intersection of three or more of the thermal reduction relationships. In order to reduce this error, Nunes and Swartzel (1990) proposed to use Non-linear Least Squares Regression (NLSR) or Weighted Least Squares Regression (WLSR) on the reparametrized thermal reduction relationships (eqn (5)) to estimate the most error free equivalent point on a statistical basis rather than determining (t~, TE) from averaging graphically determined intersection points for a series of thermal reduction relationships (Sadeghi et al., 1986). In the WLSR, preferred because of its simplicity and accuracy, a linear regression is performed on ln(E~GTr~f)-values as a function of these Ea-values. In case the equivalent point would be truly unique, the expression
In(E~GTr~r)=In(tE)--(1/TE - 1/Tref)(Ea/Rg) (8)
should be met. From the slope of the best fit regression line of ln(~'GTref) as a function of (Ea/R~), TE could be estimated and the intercept allows calculation of tE- A global weight factor was incorporated in the linear regression to account for non-constant variance throughout the range of measured values and use of exponential functions to estimate this point (Nunes and Swartzel, 1990).
Although the equivalent point method as originally described by Swartzel (1982) used activation energies to describe the influence of temperature on the reaction rate constants, the method can also be given in terms of the Thermal Death Time concept (Bigelow, 1921) because also the 'traditional' processing

EPM general validity in thermal process evaluation 2 31
values F or pasteurization units (PU) present measures for the reduction level of specific quality attributes.
If the EPM holds, a unique point of intersection should be found when the decimal logarithm of the time needed to obtain a specific processing value (ZFrref) is plotted as a function of temperature for a series of z-values. Processing values can be determined by integrating from an in-process recorded variable temperature ( T ) history when these data are available,
ZFTref= L z dt = 10 (r-r' ')/:dt (9)
or determined from the concentration change (N/No) in a set of target quality attributes (z) and knowledge of the decimal reduction times (Dref) at reference temperature in the absence of information on the temperature profile through
ZFTref---- Dre f X log(No/N ) (10)
is plotted as a function of the 'equivalent temperature', for different z-values. The processing value represents the time at a constant lethal reference tempera- ture which results in the same concentration change of the parameter, characterized by that z-value, as the actual variable temperature history does. The ZFrref value hence embodies, both in concept and in units, the TDT- terminology counterpart of the ZGrref-value in the Arrhenius model (Ramaswamy et al., 1989; Sadeghi and Swartzel, 1990b; Nunes and Swartzel, 1990; Mwangi et al., 1992; De Cordt et al., 1992). For any time-temperature history, one can write the processing value (ZFTref) for a specific quality attribute (z -value) as
ZFTref = 10 t r - r,,)/z x t ( 11 )
An infinite number of T-t combinations can be proposed that meet eqn (11 ). Using 'log' to refer to the decimal logarithm, a plot of
log(t) = log(ZFrref)- ( T - Tref)/Z (12)
for a variable T will result in a straight line per z-value and its corresponding ZFrree resulting from a given process. The slope of this line is determined by the z-value, the intercept by the processing value at reference temperature. This curve represents all possible combinations of T and t that cause the same con- centration change in the quality attribute characterized by this z-value (eqn (11)) and can in analogy with eqn (3) or eqn (7) be called a 'thermal reduction relationship'. In the TDT terminology, the logarithm of the decimal reduction time (D), and hence the lethal rate Lz, is a linear function of temperature, its temperature dependence quantified by the z-value. Consequently, the thermal reduction relationship log(F ) will be a linear function of temperature as well.
Two thermal reduction relationships, characterized by a (different) slope of 1/zl and 1/z2 respectively, will have to intersect. For any pair of z-values one can determine the temperature at the intersection point after equating the thermal reduction relationship (eqn (12)) for the two z-values as
log~'Zx- T~,,t = /¢rref'-- Iog'~ZFrr"f' + T,~f (13) (l/z~ - 1/z2)

232 G. Maesmans, M. Hendrickx, S. De Cordt, P. Tobback
By substituting the thus found temperature Tin t for T in eqn (11), the corresponding time tint can then be calculated for either one of the z-values. According to the EPM, this intersection point (tin,, Ti.,) would not depend on the absolute values of Zl and z2. In other words, a series of thermal reduction relationships, obtained for any set of z-values, would all intersect at a unique, equivalent point, characterizing the heating process by the equivalent time (tE) at the equivalent temperature (TE). In the equations given above, a reference temperature of 121.1 °C (250°F) is traditionally chosen for in-pack sterilization of foods, but depending on the main kinetic attribute of interest, appropriate rescaling temperatures for quantification of pasteurization processes may vary between 70°C and 100°C.
In analogy to what is given above, the 'equivalent point' can be determined either from averaging graphically determined intersection points for a series of thermal reduction relationships or from a Weighted Least Squares Regression (WLSR) to estimating the most error free equivalent point on a statistical basis. In the WLSR, a linear regression is performed on log(~Frr~f)-values as a function of the z-values. In case the equivalent point would be truly unique, the expression
log(ZFTref) = (T E - Tref)/Z + Iog(tE) (14)
should be met. From the slope of the best fit regression line of Iog(:-FTref ) as a function of 1/Z, T E can be estimated and the intercept allows calculation of tv.
The above indicates that the same path of reasoning can be followed when the Thermal Death Time concept (Bigelow, 1921) or the Arrhenius model is used to describe temperature dependence of first order rate constants encountered in a temperature history. The conclusion obtained is similar. Depending on the measured reaction kinetics, there can only be experimental reasons to prefer either one of the models: the temperature dependence of the decimal reduction time DT( = 2"303/kT ) for a quality attribute has been quanti- fied by its z-value with the same accuracy as the dependence of the reaction rate constant k by its activation energy (Ea) (Lund, 1975; Pflug, 1987; Teixeira, 1992). Without kinetic proof, the discussion on which model is applicable in a broader temperature range is irrelevant: predictions on kinetic behaviour outside the experimental temperature domain should be avoided. Both ZFTref and EaGTref represent the time at (constant) reference temperature that would result in the same change in quality attribute concentration as the actual time variable heating profile. The conceptual meaning of these two parameters is hence identical, only the model chosen to describe the temperature dependence of the reaction rate constant is different. The terminology of F-values will be reserved for process impact times calculated from z-values and will refer to G- values when the Arrhenius model is used. Although mathematically not justifiable, an approximate conversion relation has been proposed to convert z- into Ea-values (and hence F- and G-values)and vice versa estimates for conditions where original kinetic data are no longer at hand, again for first order reactions (Lund, 1975; Ramaswamy et aL, 1989). Because of the mathematical flaw in combining two different models and errors associated with the trans- formation from z to E,, or vice versa (Datta, 1993; Nunes et al., 1993), no attempts will be made here to make this conversion: temperature profiles will be integrated using either the Arrhenius or the TDT model and the selected model will be consequently used further in the EPM.

EPM general validity in thermal process evaluation 233
If the equivalent point really were independent of the z- or Ea-value, it would provide a powerful data reduction tool: the concentration change (N/No) in any target quality attribute (Ztar.et o r Eatar~t) could be predicted without integrating the actual time-temperature pro~file for this z-value but by calcula- ting ztargetFrref at (tE, TE) and knowledge of the decimal reduction time (Drcf), respectively rate constant (kr~f). Another field of application for this technique lies in processing conditions which are not readily accessible to physical experi- mentation (rotating retorts, continuous processing): the EPM would allow characterization of a heat treatment from the change in a few 'calibration materials', i.e. kinetically well-characterized temperature sensitive devices (Sadeghi & Swartzel, 1987, 1990a; Swartzel et al., 1991). Processing values are calculated, for example, with eqn (10), from the concentration change of a set of different constituents and their Dre f. The equivalent point (t E, TE) is then determined by looking for the so-called unique intersection point of the thermal reduction relationships for these processing values. A list of processing values or concentration changes for a number of quality attributes would hence no longer be needed since the equivalent point (tE, TE) could be used to communicate the impact of the process.
Here, we want to compare the validity of the equivalent point method in terms of F- and G-values and critically evaluate if a unique intersection point can be found. The above clearly shows that any discussion, given below in terms of F, z and T can equally be given in terms of G, E a and 1 / T and vice versa.
Critical reconsideration of the EPM
A logarithmic transformation of the processing value ZFTref , determined for any conceivable heating/cooling profile from eqn (9), can be written as
log(ZFrree) = - T~ef/z +log Jl 10/r//z dt (15)
If an equivalent point truly exists, a set of these lines for a given heating profile and any series of z-values will intersect at a unique point. It is rather puzzling how the right-hand part of eqn (15) for an arbitrary time-temperature curve can equal the right-hand part of the basic EPM statement (eqn (11)) when in the last term of eqn (15) time and temperature cannot be separated. In fact, the follow- ing equality has to be investigated:
tl - T~edz +log 10 ITI/z d -- - T~e~/Z + TE/Z +log(rE) (16)
or
lo {i (16')
A similar deduction results when the G-value concept is reconsidered. The equivalence to be investigated then becomes

234 G. Maesmans, M. Hendrickx, S. De Cordt, P. Tobback
III 1 (E~,/Rg)(1/Tk.,)+ In exp[(- E~,/Rg)(1/T)] dt )
= (1/T~et)(E.~/Rg)+(1/Tz )( - lSa/Rg)+ ln(tE) (17)
o r
In exp[( -E~, /Rg) (1 /T)Jd t = ( l / l ~ ) ( - - E , J R g ) + l n ( t E ) (17')
Note that eqns (16') and (17') do not refer to the chosen reference temperature. They indicate that the option of using the original EPM or the reparameterized version with the rescaling reference temperature does not affect the general basis of the EPM. To investigate the general validity of eqns (16), (16') or eqns (17), (17'), the EPM will be tested here for simple heating conditions.
VALIDITY OF THE EQUIVALENT POINT METHOD FOR VARIOUS PROCESSING CONDITIONS
I s o t h e r m a l h e a t i n g p r o c e s s
For single step isothermal heating processes, the temperature history can be represented by a square wave function of heating time tH at a constant holding temperature (TH) (immediate heating and cooling). The impact of heating for a processing time tH at a temperature T H can be expressed analytically in the TDT terminology as
:l;j,~t = 10 'I t;,- 1;~,~,,~ in 18)
from which
Iog(:Frr~f ) = ( T H - Tref)/Z + Iog(tH) 19)
Likewise, for a one step isothermal heating profile (tH at TH) where for two different activation energies Ea~ and E,2 the impact of the process in terms of G- values can be expressed as
ln(/:al G/-rcf) = ( - Ea, /Rg)(1 /T H - 1 /T~f)+ln( tn) (20)
and
In ( E ~'2 G Tr~f ) = ( -- Eae / Rg )( l I T H - 1/7~,)+ ln(tH) (21)
The graphical representation of a unique equivalent point for a heating process consisting of a single isothermal heating step, evaluated in terms of a processing value E"G (Fig. 1) and ZFTref (Fig. 2), indicates the existence of the equivalent point for this kind of heating process and the validity of the use of the TDT concept to determine the equivalent point. This unique (t z, TE) combina- tion is not surprising because there is only one term in the integration of the processing value (eqn (18)) for an isothermal heating process. It is understood that in such a case the order of integrating ( = summing) and taking the logarithm

EPM general validity in thermal process evaluation 2 3 5
2-
E o
CY~ 0
_..3
- 1
I1,, ",,.,,,
" , ,
........... ~:t:::,.
" " ' ~ "II ",,, "',,, "',,., hl,, ",. ,,
"l "',,.
11
"-,
-- 2 "'e 120 125 130 135 140
Temperoture ( C) Fig. 2. Thermal reduction relationships for z = 5°C (o), z = 10°C (D) and z = 15°C (,), calculated for a heating process consisting of one isothermal ( ) step (0.5 min at 1310C) and of two subsequent isothermal steps ( - - - ) (25 min at 111.1°C followed by 0.25 min at 131.1 °C), both yielding a m°CF 121*c = 5 min. A unique equivalent temperature and equivalent time, equal to the actual processing temperature and time is visualized for the single step isothermal heating but cannot be found for the non-consistent heating profile. Thermal reduction relationships for z = 10°C are equal to the two heating
conditions.
(eqn (19)) is irrelevant. Substituting the appropriate expression for the processing value ZFrref in the case of isothermal heating (eqn (18)) in the expression for the intersection point (eqn (13)), reveals (not surprisingly) that
T E = T n (22)
an expression truly independent of the z-value and for which the unique equiva- lent time
tE=tH (23)
i.e. the two parameters describing the actual temperature profile exactly are the actual processing time and the actual processing temperature. The same result can be obtained by choosing the process temperature T u as a reference

236 G. Maesmans, M. Hendrickx, S. De Cordt, P. Tobback
temperature Tr~f in eqn (9). By filling out the appropriate expression (eqns (20) and (21 )) for Ca~G and E,2 G in the expression for the intersection point (eqn (4)) in the case of a single step isothermal heating process evaluated in the Arrhenius terminology, it is readily seen that
1/T~= I/TH (24)
which indicates again that for isothermal heating the equivalent temperature is indeed independent of the activation energy. Here also, the equivalent time rE* is equal to the processing time tH. Applying either the Arrhenius or the TDT model to determine a thermal reduction relationship results in the same equivalent time and equivalent temperature for such a heating process.
Heating process consist ing of two isothermal steps
As an introduction to more complex heating curves, a heating process consisting of two subsequent square wave profiles was considered, The impact of a residence time t~ at a (lethal) temperature T~, immediately followed by a heating period of t2 at T2 and instantaneous cooling, can be integrated analytically for both the Ea- and z-value models by summing the effect of each heating phase on a specific quality attribute. In some numerical integration techniques, the heating profile is subdivided into a large number of isothermal heat treatments and this case can hence provide a basis for the EP determination from a numerically integrated heating curve.
Since the total processing value (F) for this type of heating curve equals
:Frr~l = ZFTref( TI, t l ) + :FTrcl( T2, 12) (25)
~FTref=exp[ln(lO)x(Ti-Tref)/z]xt1+exp[ln(lO)x(~-T~f)/z]xt2 (26)
the logarithm of :Fr~f contains a sum of two terms that cannot be separated. The exact expression for the intersection point of any z-pair in the TDT
model for a heating process consisting of two consecutive isothermal steps is then given by
• \ zl /
exp ln(lO) Xt l+exp ln(lO) T2-Tr~ x _ \ Z2 / j
Tin t = -s t- '/'re I (z2 xz2)
(27)
The analogue deduction for a two-step heating curve in terms of G-values results in
l 1)] EaG~e~=exp - T~ 7~cf × t , + e x p Rg]~ T2 × t2 (28) 7 of

E PM general validity in thermal process evaluation 237
from which the temperature at the intersection between two EaGrref-ValUe lines can be calculated as
[ [(Rgl) ( 1 . exp . . . . ~-~]\-T22 T~.f,___J__ ~_} In{{ [( _RII£( I TI Tr~i)]xfi+exp[( E"!I(1 l ) ] x t ' l ]
e x p - Ea---2 1 l~f)]Xtl+exp[(- Ea21(l 1 ) ] x t , l / 1 RgJ~T2 Tr~t,J "J "1
Ti.t ( E a l _ Ea2)/Rg Tre,. (29)
In the original phrasing of the EPM, i.e. in the form with the reference tempera- ture Tref= oo, the same e~ln (29) can be used to calculate the intersection temperature between two ~aG-value lines for a given process when it is taken into account that the terms containing 1/Tre f then disappear.
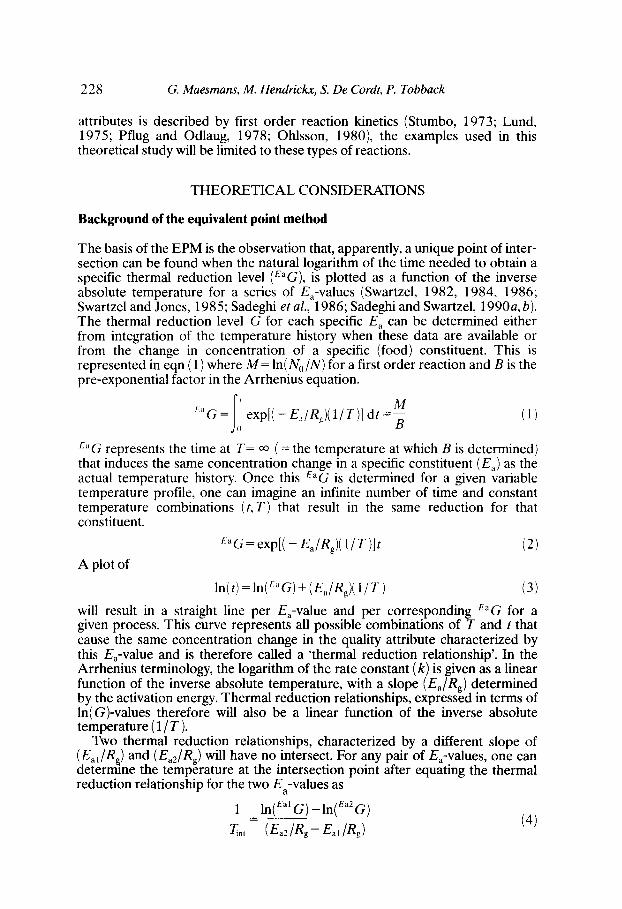
Intersection points were determined from the above equations for a series of two-step heating processes where the same total impact on a target quality attribute (ztarg~tFrref or EatargetGrref ) consisted of a different contribution of the respective heating steps. Intersection points, determined for the separate thermal reduction relationships, were compared with equivalent temperatures and times (tE, TE) , determined by performing a weighted least squares regres- sion (SAS, 1992) on 15 thermal reduction relationships. 1/z-values in the linear regression were varied between 0.02 and 0.30°(2 -1 at 0"02°C -~ intervals (3-3°C<z<50"C), Ea-values from 50 kJ/mol to 330 kJ/mol per 20 kJ/mol. Results for the G-values are given in Table i and Fig. 1. Figure 2 indicates inter- section points for some F-value thermal reduction relationships. Typical results for and from the linear regression to determine the EP (eqns (3) and (7)) for this kind of temperature prof'de are given in Figs 3, 4 and 5.
Figure 1 illustrates the shift in different directions of three thermal reduction relationships in terms of Ea G-values for a two-step heating profile as compared to a single isothermal heating step which has the same impact on a target quality attribute (original EPM). Figure 2 indicates the same for ZFrr~i-values for a two- step heating profile as compared to a single isothermal heating step profile which has the same impact on a target quality attribute (l°'CF121.rc of 5 min). The thermal reduction relationship for the target quality attribute is of course identical for both heating processes. Per E~-, respectively z-value, lines are parallel for the two heating conditions since their slope is given by (Ea/Rg) or ( 1/ z), but thermal reduction relationships are not coinciding because E~G respect- ively ZFTref alSO depend on the temperature history. The intercepts of these lines as compared to the isothermal heating process lines shift in different directions, according to the specific Ea- or z-value and shape of the heating profile, and therefore, a unique intersection point, independent of the Ea- or z-value, can no longer be identified. Because in the logarithmic transformation of the integral expression for the two-step heating process, time and temperature can no longer be separated as requested by eqns (16') and (17'), a unique equivalent point can no longer be found for this type of heating processes. The same conclusion can

238 G. Maesmans, M. Hendrickx, S. De Cordt, P. Tobback
TABLE 1 Dependence of the Equivalent Point on the Deviation from 'Isothermal' Heating for a List of Two-step Heating Processes Consisting of a Time t t at Tl ( = 383.887 K) and t~ at T z (= 404-893 K) which Result in a 283"3kJ/m°lG394. I K = 5"0 min (for Eat~r~et = 283'3 kJ/ mol). %Gt is the Contribution in Percent of the First Heating Step to the Total G-value. T , , t l , Tint2 , Tint3 Represent the Temperature at the Point of Intersection between the Thermal Reduction Relationships for E a = Eatargct with Eli = 50"0 kJ/mol, E~ = 100"0 kJ/ mol and E~= 300-0 kJ/mol Respectively. The Associated Times with the Analytically Determined Intersection Points are given by/intl, li,,t2 and tint3. ( Tint, lint) Calculated from eqns (1) and (4)( T,¢f = co) or eqns (5) and (6)( T~f= 394.1 K) are Identical. ( T*~f, t~r~l) is the Equivalent Point as Determined from a Set of 15 E,'s (50 kJ/mol-< E < 330 kJ/mol per 20 kJ/mol) with a WLSR from the Analysis Including the Reference Temperature, T E, tF~) IS the Equivalent Point as Determined from the Same Set of 15 E~'s with a Non- weighted Linear Regression from the Analysis Excluding the Reference Temperature
t I t, %G I Ti,,fl ti,,tl 7;,,t2 ti,,2 Ti,,,3 ti,,,3 (mit 0 (min) (K) (min) (K) (min) (K) (min)
5"0 0.450 10'0 395"341 3"820 397"207 2'548 402.939 0"752 4"5 0"455 9"0 395"831 3"446 397'690 2"296 403"135 0"721 4'0 0"460 8'0 396'331 3"079 398"208 2.054 403"332 0"692 3"5 0"465 7"0 396"903 2'721 398'769 1 " 8 2 1 403"528 0"665 3"0 0.470 6"0 397'543 2'370 399"379 1"598 403-724 0"638 2"5 0"475 5"0 398"266 2'028 400.047 1"386 403"919 0-612 2"0 0"480 4"0 399"100 1'696 400'786 1"184 404"115 0"588 1"5 0"485 3-0 400"083 1 " 3 7 5 401'611 0"994 404"310 0'564 1"0 0"490 2"0 401"277 1'067 402"546 0"817 404"504 0"542 0-5 0"495 1"0 402"799 0'774 403"623 0-651 404"699 0-521 0"0 0-500 0"0 404"893 0'500 404"893 0-500 404-893 0"500
t, t~ %G, T~¢r t~'rej T~ t~- (min) (min) (K) (ram) (K) (min)
5"0 0"450 10-0 397"482 2-501 396"899 2"581 4-5 0"455 9"0 398"029 2"222 397"357 2"339 4"0 0"460 8"0 398-616 1"958 397"851 2"104 3-5 0'465 7"0 399-247 1-708 398"390 1'875 3"0 0"470 6"0 399"926 1-473 398"981 1"655 2-5 0'475 5"0 400"658 1-257 399"637 1'442 2"0 0'480 4"0 401"445 1"059 400"373 1'238 1"5 0'485 3"0 402"284 0"882 401"214 1'041 1"0 0'490 2"0 403"163 0"729 402"197 0'853 0"5 0'495 1'0 404"051 0"601 403"383 0'673 0"0 0'500 0'0 404"893 0"500 404"893 0"500
be drawn f rom an analytical solution to the expressions for the intersection points of different z or E a thermal reduction relationships. Calculated intersec- tion ~oints of thermal reduction relationships for different E a pairs (both EaG- and aGrref-values ) resulting f rom heating processes consisting of two isother- mal heating steps are repor ted in Table 1 and confirm the graphical indication of Fig. 1. It is apparent that the intersection point is not unique but depends on the chosen pair of Ea'S (z-values). For these heating processes, intersection points
E PM general validity in thermal process evaluation 239
-10
-20
-30
-40
- 50
-60
-70
-80-
-90 t -100 . . . . . . .
0 90000 180000 270000 360000
Eo ( J / t o o O
Fig. 3. Apparent linearity of ln(eaG T. co) as a function of Ea in the equivalent point linear regression for a heating process consisting of two subsequent isothermal steps
(2"5 s at 380 K followed by 2.5 s at 394.1 K -- cf. Fig. 1).
calculated from eqn (4)(original EPM) or eqn (6) (reparameterized version with finite TreY) were identical. For each of the heating processes tabulated in Table 1, the 'equivalent' point (rE, TE) was determined by performing a least squares regression (SAS, 1992) on 15 thermal reduction relationships. A weighted least squares regression, using (E~GTreY)2 as weight factor had to be applied in the reparameterized version only (Swartzel et al., 1993). The perfect linearity of ln(EaG) as a function of Ea( Try f = oo, r 2 = 1"0) for a two-step heating curve (Fig. 3) is contradicted by residual analysis (Fig. 5) which indicates misspecification of the (linear) regression model (Myers, 1990). This non-linearity emerges when the reparameterized version of the EPM is used (Fig. 4, r E < 1"0, Try f-- finite). Comparing eqns (5) and ( 1 ) reveals that
Ea Ea In(G~rref) = ~- ln(EaG) (30)
(Rg x T~ef)
Obviously [Ea/(Rg x TreY) ] is a perfectly linear function of Ea. Since summing two straight lines will always result in a new straight line, the curvature in Fig. 4 therefore has to be inherent in the ln(EaG) term. This also shows in the residual analysis of the reparameterized EPM version: the absolute values of the residuals remain unchanged, because the introduction of an error free linear function [ga/(Rg × TreY) ] does not contribute to the absolute error. Depending on the heating process, the set of E~-values used in the EPM and the chosen value

240 G. Maesmans, M. Hendrickx, S. De Cordt, P. Tobback
1"~ I ¶ 1 4 \ \,
1 5
1 1
1 0
0 9
\
"\\
9 0 0 0 0 1 8 0 0 0 0 2 7 0 0 0 0 3 6 0 0 0 0
Ea (J/too 0
Fig. 4. Relation between ln(EaG3944 K) as a function of E, in the equivalent point linear regression for a heating process consisting of two subsequent isothermal steps (2.5 s at 380 K followed by 2.5 s at 394.1 K -- cf. Fig. 1), magnifying the inherent non-linearity in
Fig. 3 (eqn (30)).
of Eatar_et,. s an underestimation or overestimation of the actual impact delivered by the process hence may occur when the 'equivalent point' is used to estimate the impact. Only when the contribution of one isothermal heating step becomes negligibly small as compared to the other, because of the discrepancy in lethal rate L and/or residence time at either one of the temperatures, the expression for the intersection point becomes independent of z (Ea). (This comes down to the case where plotting the lethal rate L as a function of time results in a square wave lethality profile.) Because all ZFTref , EaG and EaGTref w e r e determined analytically, the lack of a unique intersection of three (or more) of the thermal reduction relationships cannot be caused by round-off errors in integration of the heating profile nor by inaccuracies in time-temperature data.
Linear heating curve
Deindoerfer and Humphrey (1959) mention batch heating with a constant rate of heat flow as a typical heating profile in sterilization of liquids, resulting in a linear relation between time and temperature. Linear heating is also used in the design of heat processes as the 'worst case' behaviour when using a fouled heat exchanger (Swartzel, 1986). The explicit expression for a G-value turns into a second order exponential upon substituting the linear function of temperature in eqn (5) and one hence has to rely on a numerical approximation to solve this.

EPM general validity in thermal process evaluation
0.15
241
0.10
0,05
0,00
-0 .05
-0 .10 0 90000 180000 270000 560000
F-o (J/moO
Fig. 5. Residuals (lnGactual-lnGspM) for the EPM analysis on a heating process consisting of two subsequent isothermal steps (2-5 s at 380 K followed by 2"5 s at 394"1 K -- cf. Fig. 1). A non-weighted linear regression, performing on both In(r'aGr~o) (original EPM) and ln(eaG394.1K) (reparameterized EPM) yielded the same residual
values. The distinct trend indicates misspecification of the regression model.
Numerical integration errors, mentioned as one of the reasons for a non-perfect intersection point, might result f rom this. Notwithstanding, an analytical solution for the integrated impact of time and temperature on a quality attribute subjected to a linear heating profile can be obtained if the T D T model is used to characterize the quality attribute reaction kinetics. For a linear increase in temperature from T~ to T 2 it can be written that
z x 10 (r'-r'°')/~ x [10 Ir2-r')/z- 1] ZFrref = (31)
ln(10) x b
with b the slope of the linear heating curve, i.e. the temperature difference (T 2 - 7"1) divided by the processing time t. A n intersection point between the thermal reduction relationships for two z-values can be found by substituting zl FTref and Z2FTre f from eqn (31 ) and eqn (13).
The intersection point between thermal reduction relationships for z = 5°C, 20°(2 and 50"C with the one for z = 10°C was calculated from the above equation for a set of linear heating profiles, all resulting in a l°*CFi21.1. C of 5 rain. The heating time required to reach this target processing value was determined analytically from eqn (31) for initial temperatures T~ varying from 101.11°C up to and including 141"11 per 5°(2. Results, including the 'equivalent' point for each heating condition, determined from a W L S R with 1/z-values varying between 0.02 and 0"30°C - 1 per 0"02°C - 1 (SAS, 1992), are given in Table 2.

2 4 2 G. Maesmans, M. Hendrickx, S. De Cordt, P. Tobback
~.-= N "
M
- ~.,, ~ , ~
. ~ - ,_-~ v~
~ ' . ~ ._~ ~-~
~ ~
-~ ~ ~~
k . . ' - . _

EPM general validity in thermal process evaluation 243
Also for linear heating profiles, it is difficult to perceive how the equivalent temperature determined from the intersection for Zl and z2 can equal the one calculated from Zl and z3, based on the exact expression for the intersection point of two thermal reduction relationships. From the data reported in Table 2, it is again clear that the point of intersection is not unique. Residuals after applying EPM also confirmed non-linearity between log(ZFrref) and 1/z. The 'equivalent point', determined from a WLSR, can thus only approximate the actual point of intersection between two specific thermal reduction relationships for these linear heating curves.
Heating profiles for conduction heating foods
To illustrate the use of the EPM for more realistic heating conditions, tempera- ture profiles were generated for conduction heating foods with a one- dimensional finite difference heat transfer model (Silva et al., 1992). Modelling conditions are summarized in Table 3. Heating and cooling times for immersion of the particle in an isothermal heating and cooling medium were estimated to obtain a desired ztargetFTref-value at the centre of the cylinder. With the estimated heating and cooling times, the time-temperature history for each of the 270 cases mentioned above was accurately calculated with a time step 10 times smaller than the time step needed for stability of the finite difference method (Chau and Gaffney, 1990). The heating (cooling) profiles were written into data files and integrated for different z (Ea)-Values with a Simpson routine (Carnahan et al., 1969). No data file contained less than 1000 data points. Again, the series of Ea's considered for the EPM was 50 kJ/mol-330 kJ/mol in steps of 20 kJ/ mol. From these 15 E a- and G-values, the equivalent point was calculated from a weighted least squares linear regression (using the SAS statistical package) as suggested by Nunes and Swartzel (1990). The EatargetGTref.EPM, calculated from the EP using Ea--283"3 kJ/mol (Deindoerfer and Humphrey, 1959) was compared with EatargetGTref_act-ValUeS , directly integrated from the time-tempera- ture history for Eatarget.
TABLE 3 Processing Conditions Used to Generate Temperature Profiles for Conduction Heating
Particles with a Finite Difference Heat Transfer Model
Particle properties Shape Radius Density Heat capacity Thermal diffusivity Initial temperature
Processing conditions Surface heat transfer coefficient Heating medium Cooling medium l°*CFt 2t.rc (particle centre)
Infinite cylinder 0.0125-0.0725 m by 0.0125 m 1063 kg/m 3~ 3517 J/kg, K ~ 1.67 x 10 -7 m2/s a 20°C (homogeneous)
oo 100-140"C per 5"C 20"C 3-15 min per 3 min
°Deniston et al. (1987).

244 G. Maesmans, M. Hendrickx, S. De Cordt, P. Tobback
For the conduction heating cylinders considered in this theoretical study, the E~arg~tGrref_Er, M approximated the actual EatargetGTrct-_ac ,, for small radius cylinders. Upon increasing cylinder diameter, the error (Eatarg~t GTref_~c~ - E a t a r g e t Gr~j_EpM) increased as well. The more the t ime- tempera ture curve resembled the square wave profile (small diameter particles), the smaller the error, thus confirming the above conclusions on the general validity of the EPM. This is illustrated in Fig. 6. Even though the error associated with the EPM is low for small particles, the
2 0
15
E o_ ~10
?,
0- 0
J / '
J # 5 I0 15
GO-actual 2 0
20 I 15 /
z/ /
/ /
/ /
5 10 15 20 GO-actual
Fig. 6. Processing values (2~33kJ/m°lG394.1K) directly integrated for five different temperature profiles (= G0-actual) versus processing values GO_EPM(2~3"3kJ/rn°IG3,)4.tK), calculated from the equivalent points. The EPM used a WLSR with 15 E~,-values between 50 and 330 kJ/mol at 20 kJ/mol intervals. Agreement is reasonable for a small ( = 0.0125 m) radius cylinder but lacking for an infinite cylinder with large ( = 0"0750 m, bottom) radius. (The 45 ° line represents the perfect correlation, the heating temperature
was 393 K, processing conditions are listed in Table 3.)

EPM general validity in thermal process evaluation 245
same trend as mentioned in Fig. 5 showed up in the residual analysis, again indicating misspecification of the regression model.
DISCUSSION
From the above one can but conclude that the equivalent point method is not a generally valid, theoretically justified evaluation procedure for thermal processing of foods, even when disregarding errors associated with data registration, numerical integration, etc. Only under processing conditions where the product temperature history or lethal rate profile is a square wave function, is the equivalent point truly unique and the EPM has theoretical soundness. For all other, non-square wave, product temperature histories, the absolute value of the 'equivalent point' will depend on the type of accuracy of the regression analysis (reparameterized version or not, TDT or Arrhenius model), number and value of the series of Ea-(Z)-values used in the integration, number and kinetic characteristics of constituents evaluated, reference temperature, etc. In such cases, the working limits and accuracy of the EPM should be established.
Although it will be very hard to accept the EP as an alternative for the theoretically justifiable G- or F-values to communicate the impact of a thermal treatment, it might contribute as an interesting engineering tool in the design and evaluation of cases where the temperature profile approaches a square wave condition, such as in UHT processing of liquids or canning operations where the main contribution to the process lethality is delivered when the product is almost at a constant temperature. It should however be critically examined if the error arising from the EPM is acceptably small and not larger than experimental errors. Without information on the actual shape of the heating profile, no general conclusion should be drawn from it. Especially when the EPM is used to determine the contribution of heating or cooling to the total process impact value (Swartzel, 1982, 1984), the use of this technique is difficult to justify theoretically. Confiding in the EPM to calculate the impact on a target quality attribute from the change in concentration of several components, characterized by different z-values/activation energies from the parameter of interest, can result in erroneous interpretations of process severity. The response of a combination of tracer molecules such as sucrose hydrolysis (E a -- 94.6 kJ/mol), Blue No. 2 colour degradation at p H = 11.3 (Ea=58.2 kJ/mol) and pH=9.5 (Ea -- 74.5 kJ/mol) (Sadeghi and Swartzel, 1990 a, b) or of diffusional processes at different activation energies in the Thermal Memory Cell (Swartzel et al., 1991) should be carefully considered since the choice of the series of E a- (z)-values used in the EPM influences the absolute value of the EP. The basic axiom that in the absence of information on the temperature history, a third system can be used to evaluate the impact of the process if and only if the activation energy of the target quality attribute and the monitoring system are identical (Hayakawa, 1978; Taoukis and Labuza, 1989; Weng et al., 1991; Tobback et al., 1992) is still preferred. The use of the EPM to determine reaction kinetics (Swartzel, 1983, 1984; Ramsey and Swartzel, 1984; Swartzel and Jones, 1985; Sadeghi and Swartzel, 1990a) under non-isothermal heating conditions cannot be warranted without information on the temperature history and the corresponding error in the EPM.

246 G. Maesmans, M. Hendrickx, S. De Cordt, P. Tobback
CONCLUSION
Since the basic assumption of the EPM, i.e. that a series of thermal reduction relationships, determined for a specific thermal treatment, all intersect at a unique point (t E, TE), is seriously questioned, care is advised when using this methodology. Before relying on the EPM, it shall be checked if the product temperature history approaches square wave heating. If so, the error associated with the EPM may be acceptable for rough design purposes and probably not larger than experimental errors in physically registering the temperature history. However, it will have to be verified for every thermal treatment that the process impact (N/No, or F- or G-value), calculated from the 'equivalent point' is a conservative approximation of the actual process lethality.
R E F E R E N C E S
Bigelow, W. D. (1921). The logarithmic nature of thermal death time curves. J. Infect. Dis., 29(5), 528-36.
Carnahan, B., Luther, H. A. & Wilkes, J. O. (1969). Numerical integration. In Applied Numerical Methods, Chapter 2. John Wiley, New York, pp. 69-140.
Chau, K. V. & Gaffney, J. J. (1990). A finite difference model for heat and mass transfer in products with internal heat generation and transpiration. J. FoodSci., 55(2), 484-7.
Datta, A. K. (1993). Error estimates for approximate kinetic parameters used in food literature. J. Food Engng, 18, 181-200.
De Cordt, S., Hendrickx, M., Maesmans, G. & Tobback, E (1992). Immobilized alfa- amylase from Bacillus licheniformis: a potential enzymic time-temperature integrator for thermal processing. Int. J. FoodSci. Technol., (in press).
Deindoerfer, E H. & Humphrey, A. E. (1959). Analytical method for calculating heat sterilization times. Appl. Microbiok, 7,256-64.
Deniston, M. E, Hassan, B. H. & Merson, R. L. (1987). Heat transfer coefficients to liquid foods with food particles in axially rotating cans. J. Food Sci., 52(4), 962-6.
Hallstr6m, B. (1977). Heat preservation involving liquid food in continuous-flow pasteurisation and UHT. In Physical, Chemical and Biological (hanges in Food Caused by Thermal Processing, ed. T. Hoyem & O. Kvhle. Applied Science Publishers, London, pp. 31-41.
Hayakawa, K.-I. (1978). A critical review of mathematical procedures for determining proper heat sterilization processes. Food Technol., 32(3), 59-65.
Hendrickx, M., Zhijun Weng, Maesmans, G. & Tobback, E (1992). Validation of a time-temperature-integrator for thermal processing of foods under pasteurization conditions. Int. Z Food Sci. Technol., 27( 1 ), 21-31.
Hendrickx, M., Maesmans, G., De Cordt, S., Noronha, J. & Tobback, E (1993). Evalua- tion of the integrated impact of time and temperature in thermal processing of foods. Submitted.
Lund, D. B. (1975). Heat processing. In f¥inciples of kood Science, Part 11, Physical Principles of Food Preservation, ed. M. Karel, O. R. Fennema & D. B. Lund. Marcel Dekker, New York.
Maesmans, G., Hendrickx, M., Weng, Z., Keteleer, A. & Tobback, P. (1990). Endpoint definition, determination and evaluation of thermal processess in food preservation. Belgian J. Food Chem. Biotechnol., 45(5), 179-92.
May, N. & Cossey, R. (1989). Review of data acquisition units for in-container tempera- ture measurement and initial evaluation of the Ball datatrace system -- part 1. Techni- cal Memorandum No. 567, Campden Food and Drink Research Association, Chipping Campden, Gloucestershire, pp. 1-50.

EPM general validity in thermal process evaluation 247
Mwangi, J. M., Datta, A. K. & Rizvi, S. S. H. (1992). Heat transfer in aseptic processing of foods. In Advances in Aseptic Processing Technologies, Chapter 4, ed. R. K. Singh & P. E. Nelson. Elsevier Applied Science, London.
Myers, R. H. (1990). Analysis of residuals. In Classical and Modem Regression with Applications, Chapter 5. PWS-Kent Publishing Company, Boston, MA, pp. 210-49.
Nunes, R. V. & Swartzel, K. R. (1990). Modelling thermal processes using the equivalent point method. J. FoodEngng, 11,103-17.
Nunes, R. V., Swartzel, K. R. & Ollis, D. E (1993). Thermal evaluation of food processes: the role of a reference temperature: J. Food Engng, 20(1), 1-16.
Ohlsson, T. (1980). Temperature dependence of sensory quality changes during thermal processing. J. FoodSci., 45(5), 836-9.
Pflug, I. J. (1987). Using the straight-line semilogarithmic microbial destruction model as an engineering design model for determining the F-value for heat processes. J. Food Prot., 50(4), 342-6.
Pflug, I. J. & Odlaug, T. E. (1978). A review of z- and F-values used to ensure the safety of low-acid canned food. Food Technol., 32(6), 63-70.
Pflug, I. J., Berry, M. R. & Dignan, D. M. (1990). Establishing the heat-preservation process for aseptically-packaged low-acid food containing particulates, sterilized in a continuous heat-hold-cool system. J. Food Prot., 53(4), 312-21.
Ramaswamy, H. S., Van de Voort, F. R. & Ghazala, S. (1989). An analysis of TDT and Arrhenius methods for handling process and kinetic data. J. Food Sci., 54(5), 1322-6.
Ramsey, J. & Swartzel, K. (1984). Effect of ultra-high temperature processing and storage conditions on rates of sedimentation and fat separation of aseptically packaged milk. J. Food Sci., 49(1), 257-62.
Sadeghi, F. & Swartzel, K. R. (1990a). Generating kinetic data for use in design and evaluation of high temperature food processing system. J. Food Sci., 55(3), 851-3.
Sadeghi, F. & Swartzel, K. R. (1990b). Time-temperature equivalence of discrete particles during thermal processing. J. Food Sci., 55(6), 1696-8.
Sadeghi, F., Hamid-Samimi, M. H. & Swartzel, K. R. (1986). Micro-computer program for determining the unique time-temperature associated with the equivalent point method for thermal evaluation. J. Food Preserv., 1 O, 331-5.
SAS (1992). Statistical Analysis System: Statistics User Guide. Cary, NC. Sastry, S. K. (1986). Mathematical evaluation of process schedules for aseptic processing
of low-acid foods containing discrete particulate matter. J. Food Sci., 51(5), 1323-8. Silva, C., Hendrickx, M., Oliveira, F. & Tobback, P. (1992). Optimal sterilization
temperatures for conduction heated foods with finite surface heat transfer coeffi- cients. J. FoodSci., 57(3), 743-8.
Stumbo, C. R. (1973). Thermobacteriology in Food Processing. Academic Press, New York.
Swartzel, K. R. (1982). Arrhenius kinetics as applied to product constituent losses in ultra high temperature processing. J. Food Sci., 47(6 ), 1886-91.
Swartzel, K. R. (1984). A continuous flow procedure for reaction kinetic data genera- tion. J. Food Sci., 49(3), 803-6.
Swartzel, K. R. (1985). Generation, interpretation and use of kinetic data in the design and evaluation of aseptic systems. Proc. Symposium Aseptic Processing and Packaging of Foods, September 9-12, Tyl6sand, Sweden, pp. 22-9.
Swartzel, K. R. (1986). Equivalent-point method for thermal evaluation of continuous- flow system. J. Agric. Food Chem., 34, 396-401.
Swartzel, K. R. & Jones, V. (1985). System design and calibration of a continuous flow apparatus for kinetic studies. J. Food Sci., 50(4), 1203-4, 1207.
Swartzel, K. R., Ganesan, S. G., Kuehn, R. T., Hamaker, R. W. & Sadeghi, F. (1991). Thermal memory cell and thermal system evaluation. US Patent 5,021,981.
Taoukis, P. S. & Labuza, T. (1989). Applicability of time-temperature indicators as shelf life monitors of food products. J. Food Sci., 54(4), 789-92.

248 G. Maesmans, M. Hendrickx, S. De Cordt, P. Tobback
Teixeira, A. A. (1992). In Handbook of Food Engineering, Chapter 11, ed. D. R. Heldman & D. B. Lund. Marcel Dekker, New York, pp. 563-619.
Tobback, P., Hendriekx, M. E., Weng, Z., Maesmans, G. J. & De Cordt, S, V. (1992). The use of immobilized enzymes as time-temperature indicator system in thermal processing. In Advances in Food Engineering, ed. R. P. Singh & M. A. Wirakartakusu- mah. CRC Press, Boca Raton, FL, pp. 561-74.
Weng Zhijun, Hendrickx, M., Maesmans, G. & Tobback, E (1991). Immobilized peroxidase: a potential bioindieator for evaluation of thermal processes. J. Food Sci., 56(2), 567-70.
Top Related
Copyright © 2022 FDOKUMEN

