


Bahasa
Halaman
Hukum


The value of Integrated Community Energy Systems for the energy community of Buiksloterham
Master thesis submitted to Delft University of Technology
in partial fulfilment of the requirements for the degree of
MASTER OF SCIENCE
in Complex Systems Engineering and Management
Faculty of Technology, Policy and Management
by
Menno van Baalen
Student number: 4176707
To be defended in public on December 18, 2017
Graduation committee
Chairperson : Prof.dr.ir. Z. Lukszo, Section Energy and Industry First Supervisor : Dr.ir. L. Stougie, Section Energy and Industry Second Supervisor : Dr. M.E. Warnier, Section Systems Engineering Third Supervisor : Ö.O. Okur, Section Energy and Industry

2

3
Acknowledgements
This report is written as a result of the research for the Master thesis project of CoSeM at the Delft
University of Technology. Many months of research were spent in writing the report. For the choice
of the research subject many people inside the university helped me to find the right direction. With
the good help of my first supervisor Lydia Stougie I was able to find a suitable graduation committee
for my Master thesis project.
I would like to thank Lydia Stougie and my third supervisor Özge Okur, for their supportive attitude
and sharing their expertise during my work on the thesis. Both of them often provided me with
meetings and feedback moments that were beneficial for the progress of my work. I would also like
to thank my second supervisor Martijn Warnier and chairperson Zofia Lukszo for their important and
critical feedback that they gave me, mostly around the important scheduled meetings that are part
of the Master thesis project. Apart from the graduation committee I want to thank Binod Koirala, a
PhD candidate who did research himself on the topic of my thesis, and also helped me in this
research. I also thank my family for always supporting my decisions and helping me in achieving what
I want to achieve.
4
Contents Acknowledgements ................................................................................................................................................. 3
Executive summary ................................................................................................................................................. 5
Chapter 1: Introduction .......................................................................................................................................... 7
1.1 The rise of energy community initiatives .............................................................................................. 7
1.2 Integrated Community Energy Systems approach ................................................................................ 9
1.3 The energy system of Buiksloterham .................................................................................................... 9
1.4 Research problem ................................................................................................................................ 11
1.5 Research questions .............................................................................................................................. 12
1.6 Approach and structure ....................................................................................................................... 12
Chapter 2: Integrated Community Energy Systems .............................................................................................. 14
2.1 Changing the energy system with ICES ................................................................................................ 14
2.2 Technologies connected to ICES .......................................................................................................... 15
2.3 Barriers and opportunities for ICES ..................................................................................................... 16
Chapter 3: The smart transition in the Buiksloterham community ...................................................................... 18
3.1 Plans of municipality............................................................................................................................ 18
3.2 Possible applications of ICES in Buiksloterham ................................................................................... 19
3.3 Key Performance Indicators of the energy community ....................................................................... 20
Chapter 4: Model study Buiksloterham energy system ........................................................................................ 22
4.1 System demarcation and the simulation model .................................................................................. 22
4.2 Modeling data and assumption ........................................................................................................... 28
4.3 Model verification and validation ........................................................................................................ 37
Chapter 5: Simulation results of the model of Buiksloterham .............................................................................. 41
5.1 Investigated scenarios and future developments ............................................................................... 41
5.2 Electricity flow of Buiksloterham 2034 ................................................................................................ 42
5.3 Results on Key Performance Indicators ............................................................................................... 46
5.4 Uncertain future developments .......................................................................................................... 51
5.5 Implications of the simulation output ................................................................................................. 54
Chapter 6: Discussion ............................................................................................................................................ 57
6.1 Assumptions ........................................................................................................................................ 57
6.2 ICES approach for other energy communities ..................................................................................... 59
6.3 Scientific contribution and further research ....................................................................................... 61
Chapter 7: Conclusions ......................................................................................................................................... 63
Reflection .............................................................................................................................................................. 65
References ............................................................................................................................................................ 66
Appendix A: Equations of KPIs in the simulation model ....................................................................................... 71
Appendix B: Forming the simulation output tables .............................................................................................. 76
Appendix C: Simulation output for the scenarios ................................................................................................. 77
5
Executive summary
With the growing population and urbanization of the living environment, challenges have come up
for cities to bring down their emissions and become more smart. Smart city development can
respond to these challenges. This means a change in the way in which the energy system is
organized. In this research, the concept of Integrated Community Energy Systems (ICES) is applied to
the energy community of Buiksloterham. The ICES concept tries to find solutions for amongst others
the optimal integration of renewable energy sources and reach a better synergy between different
energy carriers such as electricity and heat. This research looks into the value that the ICES approach
can have for the energy system of the Buiksloterham community. A literature study and simulation
model study have been performed. In the exploratory simulation model, a community point of view
is taken to answer the main research question of this research:
‘What value does ICES have for the community of Buiksloterham to reach the sustainable energy
goals of their smart community development?’
To find an answer to the main research question, the technologies related to ICES have to be
investigated. These technologies can be integrated in community energy systems and are part of the
ICES approach. The ICES technologies that are investigated in this research are energy efficient
buildings, household RES in the form of solar panels on rooftops, community RES in the form of wind
turbines in Buiksloterham and electrical heat pumps that can be installed in households. The
formulated key performance indicators are able to measure the performance of the energy grid of
Buiksloterham. These KPIs are based on both the goals of the energy community of Buiksloterham
and goals that other energy communities could have in their sustainable energy transition.
Different scenarios of ICES developments in Buiksloterham are tested with the simulation model that
is created. These scenarios differ in the level of integration of the four different ICES technologies.
The model simulates the year 2034, which means that the values of different factors can change in
the future. For this reason, different uncertain future developments, such as the development of the
electricity price and the energy demand, are also included in the simulation study.
The simulation results show that for Buiksloterham to meet the most ambitious sustainability goals
of 50% self-sufficiency and a lower energy demand and CO₂ emission, large ICES investments are
needed. These large investments lead however to high payback times of the ICES related
technologies. It is recommended for the energy community of Buiksloterham to invest in energy
efficient building and renewable energy sources. Community RES investments have a more beneficial
influence on the KPIs than household RES investments. Energy efficient buildings are decreasing the
CO₂ emissions more than RES, relative to the investment costs of these technologies, but RES also
increase the self-sufficiency slightly. The integration of electrical heat pumps, combined with a high
integration of RES so that renewable energy inputs can be used, are important for a high self-
sufficiency of energy communities. The investment costs and payback time of an ICES with a full
integration of heat pumps are however high and possibly not acceptable for the end-users of the
system. A full ICES technology integration composition without heat pumps gives a more appealing
payback time of around 12 years, but with less beneficial results on the sustainability goals.
Dependent on the direction of the uncertain future developments, such as when the capital

6
investments decrease in the future, a number of heat pumps could be implemented in some or all of
the households to achieve this much higher self-sufficiency level and lower CO₂ emissions. The
limiting factor is however the investment costs and payback time that are connected to this. Further
exploration of the uncertain future developments could give an even better idea of the value and
necessity in reaching the goals of the energy community of Buiksloterham.
The integration of renewable energy sources is important for other energy communities that are also
using heat pumps as a thermal energy technology. The heat pumps are namely giving the best results
when having input from renewable energy sources. Energy communities that would make use of
other sustainable heating options, such as solar boilers and city heating are less dependent on the
integration of renewables, as these options already have sustainable inputs. Integration of renewable
energy sources, of which community RES is most effective, influence mainly the self-sufficiency of a
community. Other ICES technologies investments, such as in electricity storage, are needed to always
meet the demand in a grid-defected ICES. Thermal energy technologies are also of greater
importance in a grid-defected ICES, as gas import is not possible. The value of energy efficient
buildings, which can be found mostly in bringing down CO₂ emissions, is dependent on whether
(most of) the buildings are already built and whether the buildings are possible to be made more
energy efficient if they are currently at a low level of energy efficiency. The most important and
influential uncertain development is the development of the electricity price that used on the APX
market. This development is however not having effect on energy communities that are grid-
defected.
Further research could be done by expanding the simulation study with more ICES technologies to
integrate. The willingness of the end-users of the energy system to participate in an ICES could also
be researched. Finally, the model validation that is proposed in this research could be performed on
the simulation model.
7
Chapter 1: Introduction
The energy consumption and the organization of the energy supply in urban areas have changed
drastically over the last years. Scientists that study the pattern of greenhouse gas (GHG) emissions
and the climate agree that rising CO₂ and other greenhouse gas emissions are causing climate change
(EPA, 2016). According to estimations, cities are responsible for 75% of global CO₂ emissions of which
buildings and transport are major contributors (UNEP, 2016). The rising use of the concept of smart
cities is a response to the, amongst others energy related problems that have come with the growth
of the urban population and the rapid urbanization of the living environment (Chourabi et al., 2012).
The growth of people living in urban areas instead of rural areas is expected to continue in the
coming decades. This makes the problems and possible response strategies even more urgent.
It is difficult to give a generally accepted definition of a smart city (Hollands, 2008). It involves a wide
range of subjects such as information technology, governance and sustainability, and often the
opinions differ on how to relate these things to each other. The municipality of Amsterdam sees
smart cities as ‘’cities that maximise social and environmental capital in the competitiveness of urban
areas through the use of modern infrastructure, highly efficient resource management, and active
citizen participation.’’ (Gladek et al., 2014, pp. 14).
For this research the concept of smart city development is used in the case of Buiksloterham, a
district in the North of Amsterdam. Buiksloterham is an area that has the ambitions of becoming a
sustainable and circular community. The concept of smart cities can be used in Buiksloterham by
referring to the term ‘smart community’. This research will focus on the smart development of the
energy system in the district of Buiksloterham. Currently amongst others the building of houses and
companies in Buiksloterham is done in a more energy efficient way and with possibilities for
providing infrastructure for photovoltaic panels (Gladek et al., 2014). The further development of the
energy supply in the area is most interesting for this research, as the energy supply of such urban
areas can have a large influence on the problems related to climate change and the goals of smart
city development.
The subject of interest of this research is the development of energy communities. The Integrated
Community Energy System (ICES) approach is taken because of the completeness and its multi-
faceted character, which will be explained later. Previous studies on ICES applications (Koirala et al.,
2016, van den Hil, 2015) have optimized a certain energy technology set for specific households in an
energy community to see how these households together can provide for instance low emissions or
high self-sufficiency. This study takes a view that is on the community level and explores the value of
different ICES compositions in different possible futures for energy communities. This value can be
defined in many indicators of performance that are important for the performance of energy
communities. An explanation of the subject of this research is given in sections 1.1 to 1.3. The
motivation behind this research, together with the research questions and the structure of the
research, are explained in sections 1.4 to 1.6.
1.1 The rise of energy community initiatives
Looking at the ambitions that are set for the development of the community of Buiksloterham, the
concept of community energy could be valuable for its energy system, as it shares the most
8
important ambitions on amongst others bringing down emissions and energy consumption with the
municipality of Amsterdam. Community energy involves small scaled, locally based projects that are
dependent on engagement of the end users of the energy system (Oteman et al., 2014). The last
years, the possibility of power generation by the end users of an energy system has increased
significantly. Important reasons for this are the drop on costs of photovoltaic (PV) systems and the
commoditization of panels and inverters of these systems (Khalilpour et al., 2015). Together with the
increasing social acceptance this has led to the global cumulative installed PV capacity growing from
1.4 GW in 2000 to over 100 GW at the end of 2013 (EPIA, 2013). PV capacity, other renewable energy
sources and the increasing use of energy storage systems are technologies that have the potential to
increase the efficiency of an energy system largely. Energy transmission and distribution losses are
smaller because there is less need for import of energy from centrally placed generators when more
energy comes from decentralized generators. This principle is a starting point for energy
communities.
The research on energy communities has increased in the last years and in the UK many projects on
energy communities have been supported by government policy (Walker et al., 2010). Community-
based implementation of renewable energy technologies is on the rise (Oteman et al., 2014) and is
widely seen as ‘a way of implementing renewable energy technologies, emphasizing themes of self-
sufficiency, local determination, engagement and empowerment’ (Walker, 2008, p. 4401).
Community initiatives are decentralized initiatives of local communities and citizens, focusing on the
successful implementation of renewable energy sources (Oteman et al., 2014). It makes the
consumers pro-active instead of passive. These consumers often have a common goal of for instance
bringing down the energy costs or emissions (Koirala, 2015). In Germany, there have come up over
700 registered community energy initiatives in the last years (Holstenkamp and Müller, 2012) and
almost 500 initiatives in the Netherlands (HIERopgewekt, 2015). The community of Buiksloterham
does not present itself as an energy community because of their focus on a sustainable and circular
area development that covers more than only subject of energy. The principles of community energy
systems are however applicable and interesting for the development of the energy system in
Buiksloterham.
There are some important incentives for creating a community energy system and thus
implementing community ownership of the energy grid in a community such as Buiksloterham. First
of all, return of investment is feasible because of the possibility to sell generated electricity to
neighbouring grids. This return of investment is of course dependent on the market price of
electricity that could be influenced by factors such as hourly (renewable) electricity generation.
Together with the creation of employment that energy communities push, this can generate local
income (Walker, 2008). Next to this, community ownership will lead to the projects being better
accepted on the local level than others projects on a hierarchical level. Other incentives are the fact
that control on the development of the project will be more easily maintainable, than when
community projects are owned by a hierarchically higher authority. Also load management, that is
problematic for large-scale implementation of renewables, is likely to be more overview clear, and
thus less problematic in smaller-scale projects than when trying to arrange the integration of
renewables on a national scale (Hain et al., 2005). This means that for the sustainable development
of the energy system of Buiksloterham, the energy community approach can be of value.
9
1.2 Integrated Community Energy Systems approach
There are multiple options that can make an energy system ‘smarter’ and integrate distributed
energy sources. Different frameworks and concepts, such as community micro-grids (Koirala et al.,
2015), virtual power plants (Ravindra, et al., 2014), energy hubs (Koirala et al., 2015) and community
energy systems (Walker et al., 2012) have been developed to facilitate this community energy
approach. These frameworks and concepts for community energy focus mainly on only electricity
and not on all energy carriers. A concept that is different from these, is developed through the notion
of the changing energy landscape and the upcoming locally organized energy communities is the
Integrated Community Energy Systems concept (Koirala et al., 2015). The ICES concept tries to find
solutions for the drawbacks that can be found with the optimal integration of renewable energy
sources into the energy system. These drawbacks are amongst others the flexibility of the grid, the
full integration of renewable energy sources as main energy source and the transmission losses. With
ICES, the energy requirements of local communities can be fulfilled by reaching a better synergy
between different energy carriers such as heat, gas and electricity (Koirala et al., 2015).
ICES is about the design, analysis, construction and long term utilization of the energy system at the
local, regional and household level (Cartes et al., 2007). With the development of a smart
community, which is driven by the municipality of Amsterdam, the use of the concept of ICES is a
way to improve its energy system and thus contribute in this transition to a smart city. It is therefore
interesting to see what value the use of ICES can exactly have for the energy system in this ambitious
community and to contribute to further research in seeing the value ICESs can have for other energy
communities. The application of ICESs is not straightforward and can be done in many different ways.
For communities it is valuable to know which technologies of ICESs and thus what type of ICES
composition can lead to certain results in the trend of becoming a sustainable energy community.
The ICES concept can also be used to balance the own community energy system with neighbouring
energy systems, of which the latter could be the larger, national energy system. The grid of the
community could have a ‘storage function’, providing flexibility, when the ICES is integrated with
other energy grids. An example is that the national energy system could benefit from communities
implementing the concept of ICES by trading energy and receiving flexibility services. Integrated
Community Energy System have been demonstrated internationally to enlarge the sustainability,
security of supply, self-reliance and independence of the energy system (Koirala et al., 2016).
Engagement in local energy systems through the application of ICES can motivate new investments in
power lines, so that eventually system peaks are reduced and distributing load is more evenly spread
over the day. ICES can be seen as multi-dimensional approach that stimulates delivering sustainable
electricity, heat and cold to decentralized communities. With ICES, the population in a community
can benefit in a technical, as well as in an economic, environmental and social way (Mendes et al.,
2011).
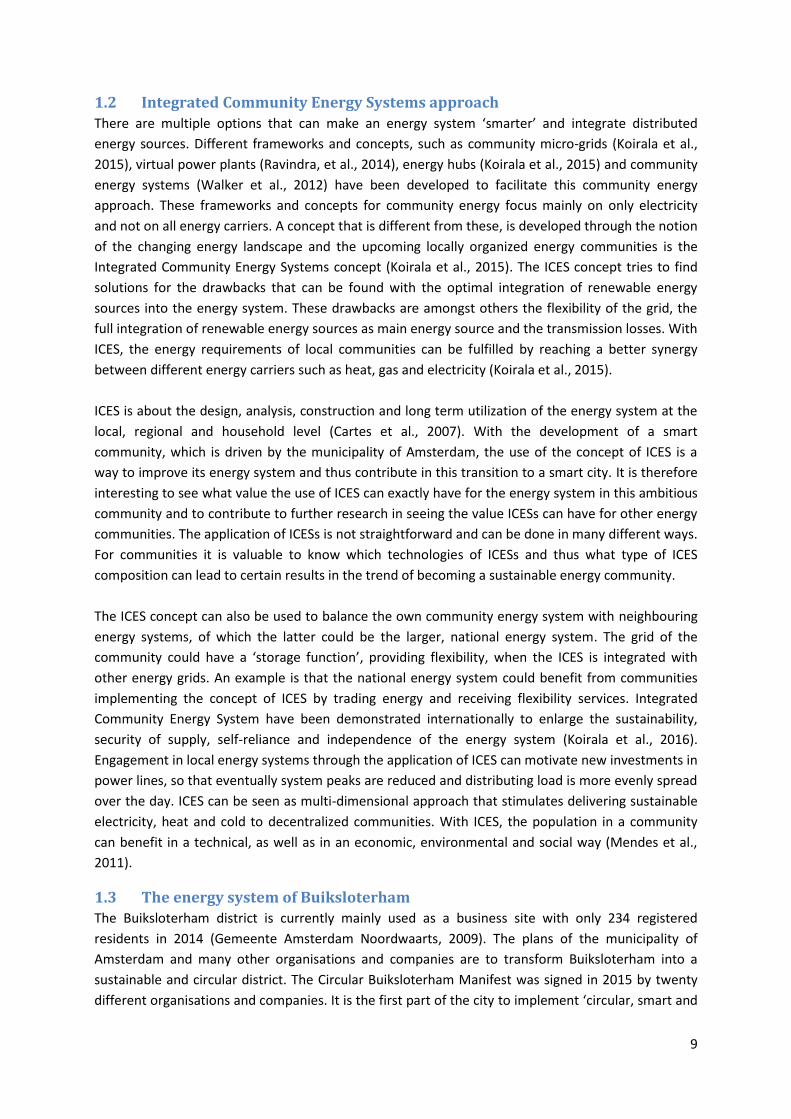
1.3 The energy system of Buiksloterham
The Buiksloterham district is currently mainly used as a business site with only 234 registered
residents in 2014 (Gemeente Amsterdam Noordwaarts, 2009). The plans of the municipality of
Amsterdam and many other organisations and companies are to transform Buiksloterham into a
sustainable and circular district. The Circular Buiksloterham Manifest was signed in 2015 by twenty
different organisations and companies. It is the first part of the city to implement ‘circular, smart and
10
bio based development’ (Amsterdam City, 2016). It serves as a living lab to explore the possibilities of
transforming Amsterdam into a smart city. There are multiple projects and experiments in and
around the area taking place. Energy, infrastructure, water, material, ecosystems are the most
important topics that the project of Circular Buiksloterham focuses on. There is a growing
commitment of many parties, organizations and individuals in the community to use Buiksloterham
as a ‘test-case’ for the city of Amsterdam as a whole. The aim is that in 2034 there will be around
3500 households in the Buiksloterham district (BIES, 2016). Many plans for the building of these new
houses have already started.
Figure 1.1: Map of Buiksloterham (Gladek et al., 2014)
Not only technical solutions, but also the actors involved with the Circular Buiksloterham Manifest
themselves, are influencing how the community energy system could be changed. The parties,
especially the residents, who are the energy consumers and end users of the energy system, are
influencing what can be achieved with the application of the concept of ICES and how this should be
achieved. The level and type of involvement of the residents is an important part of this. Involvement
is already taking place in subjects, other than energy, in the community, with programs such as
TransformCity and Amsterdam Smart Citizens Lab (Amsterdam City, 2016). Data from research in
energy communities in the UK shows that people generally find the role of participant attractive;
however taking control by having a role of project leader is not attractive for the households (Rogers,
2008). Total control by the community itself is less attractive and residents do not feel qualified for
this. Another research states that for community initiatives, access to a resource base where there is
expertise in the development of the community and in technical issues is required (Letcher et al.,
2007). To have full participation from the energy consumers in an energy community, so that this
energy community can function optimally, institutional support from for example local authorities,
government policy, or other parties are needed (Rogers, 2008). Different policies already promote
energy communities, for example in UK with the community energy strategy and on European level
with the EU 2030 framework (Koirala et al., 2015). The barriers and opportunities of ICES are
therefore further researched in the next section.
11
1.4 Research problem
The research in this project is about the possible changes in the energy system of communities that
could lead to improvement of the performance of energy systems. The concept of ICES can offer
solutions to the integration of these different energy carriers and in this way improve the energy
efficiency of the system (NRCAN, 2014). This concerns amongst others the use of (sustainable)
electricity, gas and heating. Using this concept on energy systems can improve the integration of
renewables and can bring down the emission of greenhouse gases. What is now unclear and what
this research wants to find out, is which technologies and developments that are part of the ICES
approach lead to which improvements of the performances of energy systems. In order to do so, the
technologies that the ICES approach includes should be found, as well as which factors determine the
performance of an energy system. After this, the value that the integration of certain ICES related
technologies can offer for the performance of energy community grids needs to be explored.
The application of an ICES on an energy community means that different levels of integration of ICES
parts needs to be chosen. In this research, a case study is used to find the value that different ICES
applications can have for a specific energy community. The case is about the energy community of
Buiksloterham, which is a neighbourhood in the city of Amsterdam. This community is interesting
because of the sustainable goals that the municipality has and the fact that this neighbourhood is still
far away from their desired end-situation. The neighbourhood is in development, is growing in
buildings and smart city development initiatives are coming up, as is explained in the previous
sections. It is a community in one of the most liberal and progressive cities in the world (Gilderbloom
et al., 2009). The municipality of Amsterdam wants to start sustainable development of energy
systems and starts this in a community that has large potential for this. In this research, a simulation
model about the application of the ICES approach on the community of Buiksloterham is developed
to find the value of an ICES for energy communities. To be able to create a simulation model and use
this to evaluate the value of ICES, it needs to be clear which ICES compositions are available and how
they can be translated to an exploratory simulation study.
Previous studies on the application of ICES have developed optimization models with which they
want to find the optimal set of energy technologies for one or multiple households in the energy
community. These studies focus on the household level ICES application and try to see what the
optimal decisions are for a household in an energy community. For this, certain boundaries on for
example the maximum expenses of a household or the payback time of technologies are used. These
studies optimize on for instance self-sufficiency or CO₂ reduction. In this study, an exploratory focus
is taken and the focus is on the energy community as a whole. The simulation model that is
developed is not an optimization model. By varying the inputs of the model, and through creation of
scenarios in which the properties of an ICES differ, the value of the ICES approach for energy
communities are examined in an exploratory manner. With this study the effect of community level
ICES applications on the functioning of this energy community can be analysed. One of the objectives
of the research is to find the value of ICES for the community of Buiksloterham and provide
recommendations to the municipality of Amsterdam. Besides this, it is shown how the ICES approach
can be used by other energy communities to explore their smart community development
possibilities. The knowledge gaps that this research aims to close are firstly about which ICES
technologies and compositions are available for energy communities, secondly about how an
exploratory model on a community level point of view can be developed to be used by energy
12
communities, and thirdly which factors of performance of energy systems are influenced by ICES and
how large the value is that they can have on the different performance factors of energy
communities. To close the knowledge gaps, research questions are formulated in section 1.5.
The scientific relevance of this research can be found in that the value of the application of the ICES
approach on energy communities is investigated in an exploratory way of modelling. A simulation
model that simulates the energy system of the community of Buiksloterham specifically can give
insight in this. The goal is to find the value of the ICES approach for Buiksloterham and to find which
insight that are gained from this study can be used by other energy communities that are interested
in the ICES approach.
1.5 Research questions
To find solutions for the research problem that is described in the previous section, different
research questions can be formulated to structure the research in this research. Firstly, the main
research question is formulated as follows:
‘What value does ICES have for the community of Buiksloterham, to reach the sustainable energy
goals of their smart community development?’
To give an answer to this research question, two sub-questions have been formulated. The sub-
questions are broken down into sub-sub-questions to show the steps and provide guidance in finding
an answer to the sub-questions. The following research questions have been formulated:
1. How can the development of an ICES in the community of Buiksloterham be quantified for a
model study?
1.1 What are the most important input variables in quantifying an ICES in Buiksloterham?
1.2 In which way can the national energy system be included in the simulation model?
1.3 What are the most important indicators for measuring the performance of the
energy system of the community of Buiksloterham?
2. What value can different ICES compositions in different scenarios have for the community
energy system in Buiksloterham in 2034?
2.1 Which scenarios can be chosen to analyse the effect of ICES on the KPIs of the
community energy system?
2.2 What effect do different ICES compositions have on the KPIs that measure the
performance of the community energy system?
2.3 How can the scoring on the KPIs be interpreted so that an advice regarding the value
of ICES can be given for the energy community of Buiksloterham?
1.6 Approach and structure
The approach that is used in this research is finding answers to the research questions by doing a
literature study and an exploratory modelling study. For the first sub question, on how the
development of an ICES can be quantified, a literature study is performed. To find information about
all the possibilities, characteristics and drawbacks, as well as the related institutions and technologies
of Integrated Community Energy Systems, chapter 2 of this research is about the concept of ICES and

13
the current research that has been done on this topic. Subsequently, chapter 3 is about the
Buiksloterham ambitions and goals, and the current progress and outlook of the community. This
also includes an analysis about the stakeholders involved in the transition of Buiksloterham and the
possibilities of applying the ICES concept specifically in Buiksloterham. The second research question
on what value different ICES compositions can have for the community energy system of
Buiksloterham, is answered by performing and evaluating an exploratory simulation study. Chapter 4
is focused on quantitative research in order to develop a simulation model that, using key
performance indicators of the community of Buiksloterham, can find the value of different ICES
compositions for energy communities. Chapter 5 analyses the results of the model study which
thereafter leads to the discussion in chapter 6 and the conclusion of the research in chapter 7.
14
Chapter 2: Integrated Community Energy Systems
Energy communities are formed because of their potential in moving towards a sustainable energy
system. A reason for opposition against renewable energy developments are the scale of the
development, the unacceptably high ratio of local costs to benefits and a lack of adequate
communication (Rogers, 2008). In research, it has been seen that residents are far more likely to
support a smaller project that is proposed by a local group, when it is controlled by the community. A
higher degree of public participation should be thus reached. Using decentralized, community-based
renewable energy schemes is one way to achieve this. The current perception of a power system is
centralised and hierarchical, with the rise of energy communities, this perception is changing.
2.1 Changing the energy system with ICES
A power system consists of different sources, loads and interconnections so that the load that is
required by consumers can be supplied by any of the sources (Cartes et al., 2007). The general design
purpose of the power system is to make sure that the demand can be met by the power sources in
the system. When incorporating renewables as the main source of the system, many changes have to
be made to the way the traditional power systems are built up. The power system needs to be
‘managed’ more in order to deal with peaks of supply of energy and periods where there is less
power generation possible. The management of this system will have to be done by making use of
both technological and ‘social’ assets. To achieve the sustainability and/or self-sufficiency goals that
many communities have, a new power system design has to be made. An enabling environment for
communities or consumers to disconnect from the grid is created with the increasing costs of energy
supply from the national grid, which is heavily dependent on exhaustible fossil energy sources, and
on the other hand the decreasing costs of distributed energy sources such as wind and solar energy
(Koirala, 2016).
In the field of energy management, there are multiple options that can integrate distributed energy
sources in an energy system. For communities that want to reach a certain degree of self-sufficiency,
several approaches on the concept of energy hubs, micro-grids and virtual power plants have been
used before. However, these approaches focus very much on improving the current centralised grid.
Most research that has been done on local energy systems focus on the implementation of individual
energy system related technologies, they less focus on an integrated and comprehensive approach to
change the energy system as a whole.
The Integrated Community Energy Systems (ICES) approach can be seen as a ‘multifaceted smart
energy system that optimizes the use of all local distributed energy resources, dealing effectively
with a changing local energy landscape’ (Koirala, 2017, p.366). This approach captures attributes of
many energy system integration options such as virtual power plants and energy hubs and applies
them to a community level energy system (Koirala, 2015). The ICES approach leads to energy systems
where distributed energy sources play a large role. This could lead to electrification of the grid, when
all demands for energy (amongst others heating and cooling) are fulfilled by electricity. In this
development energy systems are trying to get rid of the situation of being dependent on the use of
fossil fuels.
15
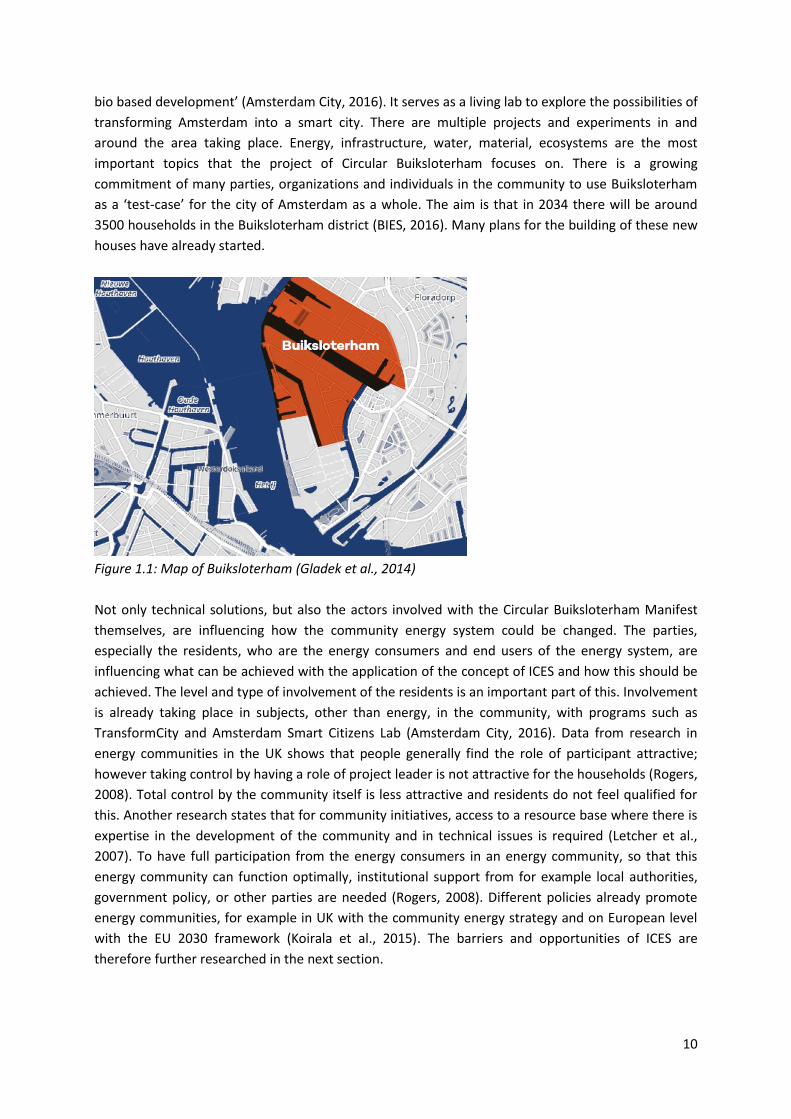
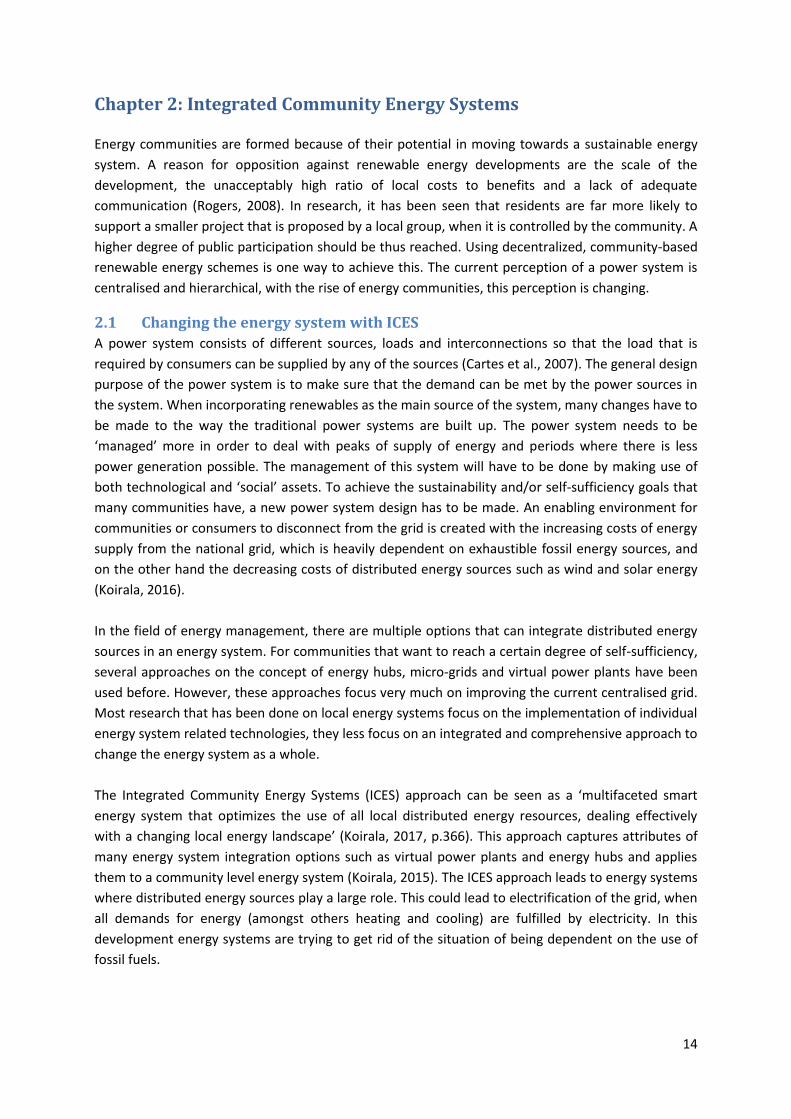
Figure 2.1: Multi-carrier energy flows in an integrated energy system (Koirala et al., 2016).
ICESs provide local energy systems with the possibility to optimize themselves, depending on the
conditions in which this local community is settled (Koirala et al., 2016). It is thus dependent on the
characteristics of the community how this ICES should be constituted (Sassen, 2011). This also means
that when using the ICES approach in the development of smart cities, the same solution is not
applicable for all cities (Townsend et al., 2010). In the research on ICESs, there can be found two
forms in which the systems are formed. Firstly, there can be an energy system that is part of the
bigger system, the national energy system, and thus has dependencies on this national energy
system. On the other hand, there could be a system that has no interconnections with the outside
grid and is completely independent of this grid. This means, there can either be a grid integrated
ICES, or a grid defected ICES (Koirala et al., 2016). In the grid-defected system, the demand needs to
be met locally by own power generation, no energy imports from other energy communities or the
national energy system is possible. In a grid-integrated system, the deficit of energy can be imported
from the national system so that the demand is always met.
2.2 Technologies connected to ICES
Different technologies are involved with ICES. Technologies on generating renewable energy via
renewable energy sources, such as solar panels and wind turbines are an example of this. With these
sources the community as a whole, or households in the community individually, can generate
electricity with low emissions and low variable costs. This generation can take place both at the
household level, for example when households have solar panels on their roofs, or at community
level, which is the case when for example a community as a whole invests in a wind turbine that
generates electricity for the community energy system. Koirala et al. (2015) mention the usage of
energy storage systems at the community level that are beneficial for the performance of ICESs in
terms of providing flexibility in the energy load. These energy storage systems could also help to
increase the effective use of renewable energy by the community. Renewable energy could be stored
in times that the generation is higher than the demand for energy, in this way this energy could be
16
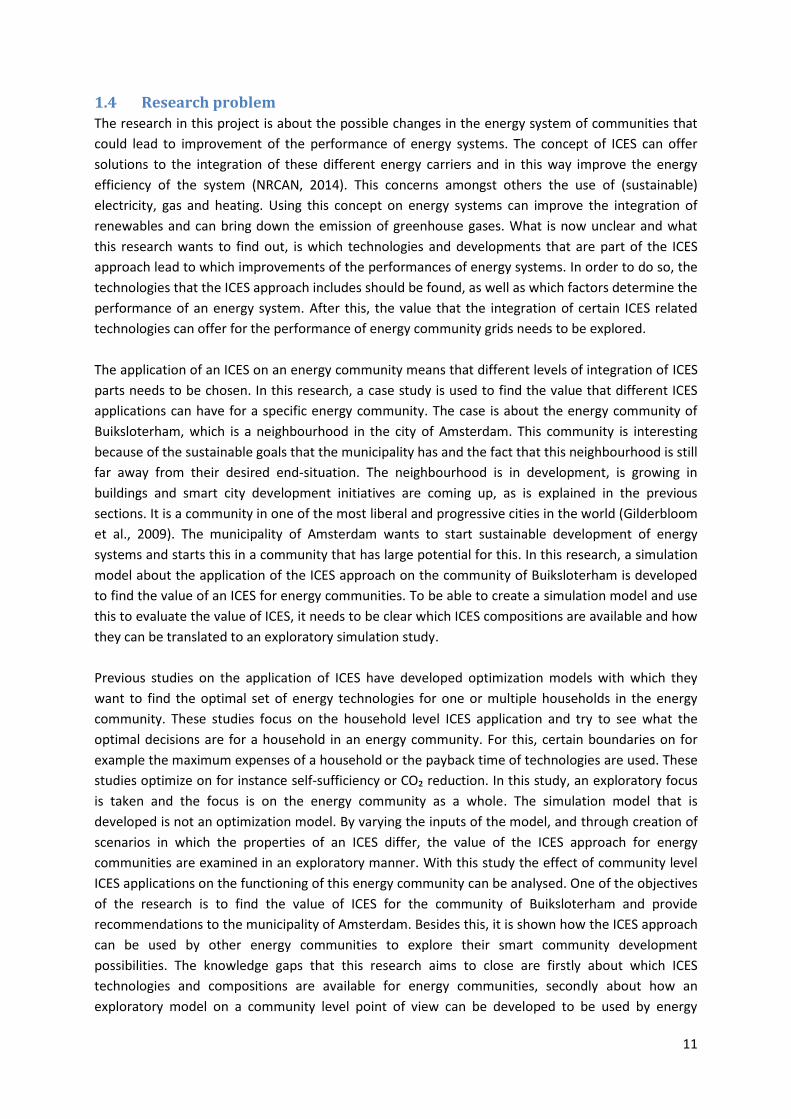
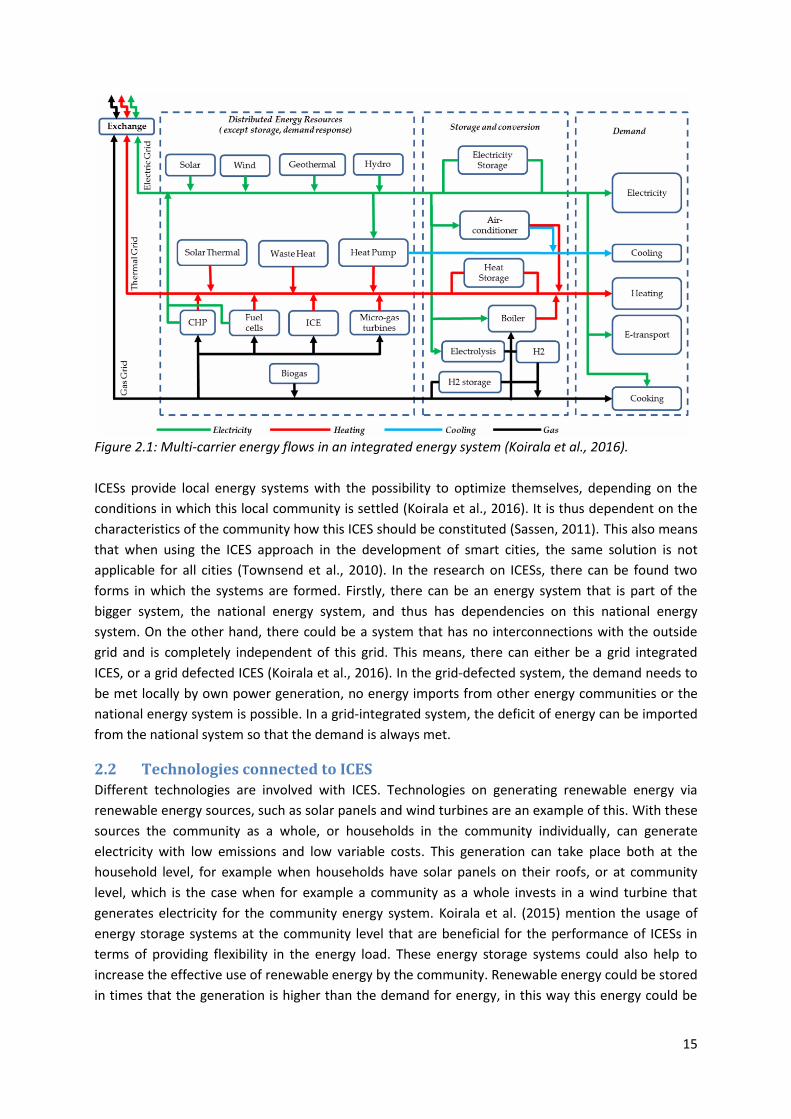
used at a later point in time instead of having to leave the system. Both electricity and thermal
storage are technological options in ICESs. Figure 2.2 is a conceptual design of an ICES. This figure
shows the possible technologies that can be involved with ICESs at household and community level
and their connection to the national grid or neighboring communities.
Figure 2.2: Conceptual design of ICES (Koirala et al., 2016).
Technologies that are part of electrification of the energy grid can also be linked to ICESs. Electric
vehicles, which have a large impact on the demand for electricity, are an example of this. Also
thermal energy technologies, that make it possible to meet heat demand by making use of electricity
as a source instead of conventional sources such as natural gas, are ICES technologies. Because
almost all types of energy demand could ideally be met with electricity, ICESs include technologies
that are part of this electrification of the grid. Flexible micro-generators are therefore often
integrated in energy communities; these are amongst others fuel cells, combined heat and power
generation and heat pumps. These are all technologies that change the way in which the community
deals with energy demand. The discussed technologies, together with smart local consumption, are
needed to enable a good power balance in the community (Koirala, 2015). Smart local consumption
can be reached through for instance the use of energy management systems. Home energy
management systems and community level energy management systems are also technologies that
are associated to ICES. With these management systems, energy consumption and generation is
shifted in a way that an optimal balance between demand and supply can be found for a community.
The exact application of the ICES concept depends on the available technologies and the composition
and the preferences of the community. Barriers and opportunities that can stimulate or hinder the
creation of Integrated Community Energy Systems also have a role in this application. These are
therefore discussed in section 2.3.
2.3 Barriers and opportunities for ICES The creation of Integrated Community Energy Systems can be influenced by barriers and
opportunities of many kinds. Structures that allow communities to deal with any issues between
17
them and the corporate- and municipal entities that they are connected to are also desired. The
government also has a role in preparing the public’s expectations and behaviour in the future success
of energy communities. Barriers for communities taking an ICES approach can be found in regulations
made by the government. These could be regulations that hinder storage systems to be installed
between photovoltaic generation units and the (smart) metering system (Soshinskaya, 2014). Some
other regulations, in this case in Spain, make the consumers that are produce their own energy are
obliged to pay system costs on the same level as consumers that are not self-producing energy.
These regulations can hinder the development of micro grids that are needed for decentralized
energy communities.
When applying the concept of ICES, economic incentives are often needed to make communities go
renewable. This makes the role of the government also important in these bottom-up approaches
(Cartes, 2007). Economic incentives such as subsidies can encourage communities or households to
make the required investments. The possibility of sales of locally generated electricity is an
opportunity of Integrated Community Energy Systems to receive a return of investment (Walker,
2008). This can be the case when the ICES is grid integrated with the national energy grid or other
energy communities. When the supply of self-generated renewable energy is higher than the
demand of the community, this energy does not always have to be wasted and can be sold. Next to
the fact that the cost of operation of decentralized renewable energy sources is relatively low, this
makes it possible to earn back the high up-front investments of ICESs over time. Also, the fact that
ICES are owned by the community themselves, are making it more easy to obtain planning
permission and to gain acceptability by the members of the energy community (Walker 2008). Other
opportunities for energy communities and ICESs are that they are stable and not dependent on large
upgrade of the national energy grid. When renewable energy sources would be implemented on
large-scale and on one grid, this would require large upgrades and extensions of the networks. Large,
central outages are less likely to happen with different isolated energy grids that have a high security
of supply (Hain et al., 2005).
These barriers and opportunities of ICES can influence the possible applications of ICES in
Buiksloterham. This is discussed in chapter 3, together with the situation of Buiksloterham in their
development to a smart energy community.
18
Chapter 3: The smart transition in the Buiksloterham community
The smart transition in Buiksloterham is driven by the plans and ambitions of the municipality.
Different parties are involved in this transition, and they are explained in this chapter. The
community characteristics that are important for the goal of this research project and the possible
applications of ICES are also discussed.
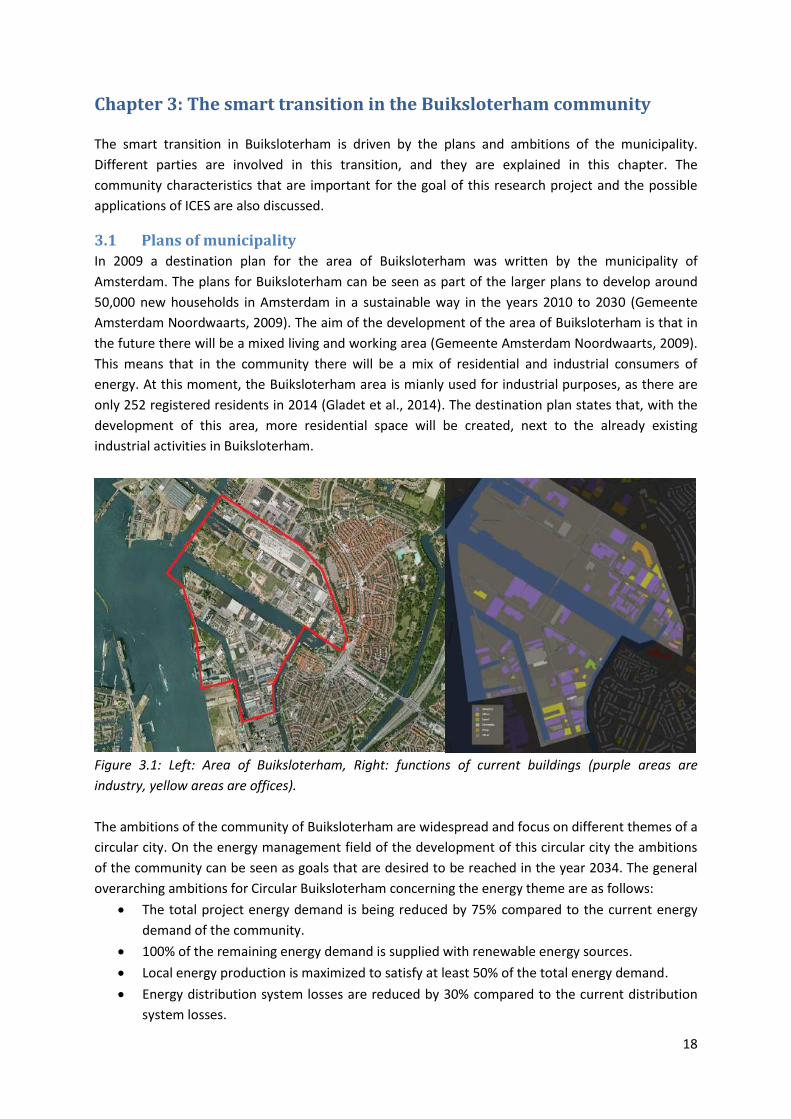
3.1 Plans of municipality
In 2009 a destination plan for the area of Buiksloterham was written by the municipality of
Amsterdam. The plans for Buiksloterham can be seen as part of the larger plans to develop around
50,000 new households in Amsterdam in a sustainable way in the years 2010 to 2030 (Gemeente
Amsterdam Noordwaarts, 2009). The aim of the development of the area of Buiksloterham is that in
the future there will be a mixed living and working area (Gemeente Amsterdam Noordwaarts, 2009).
This means that in the community there will be a mix of residential and industrial consumers of
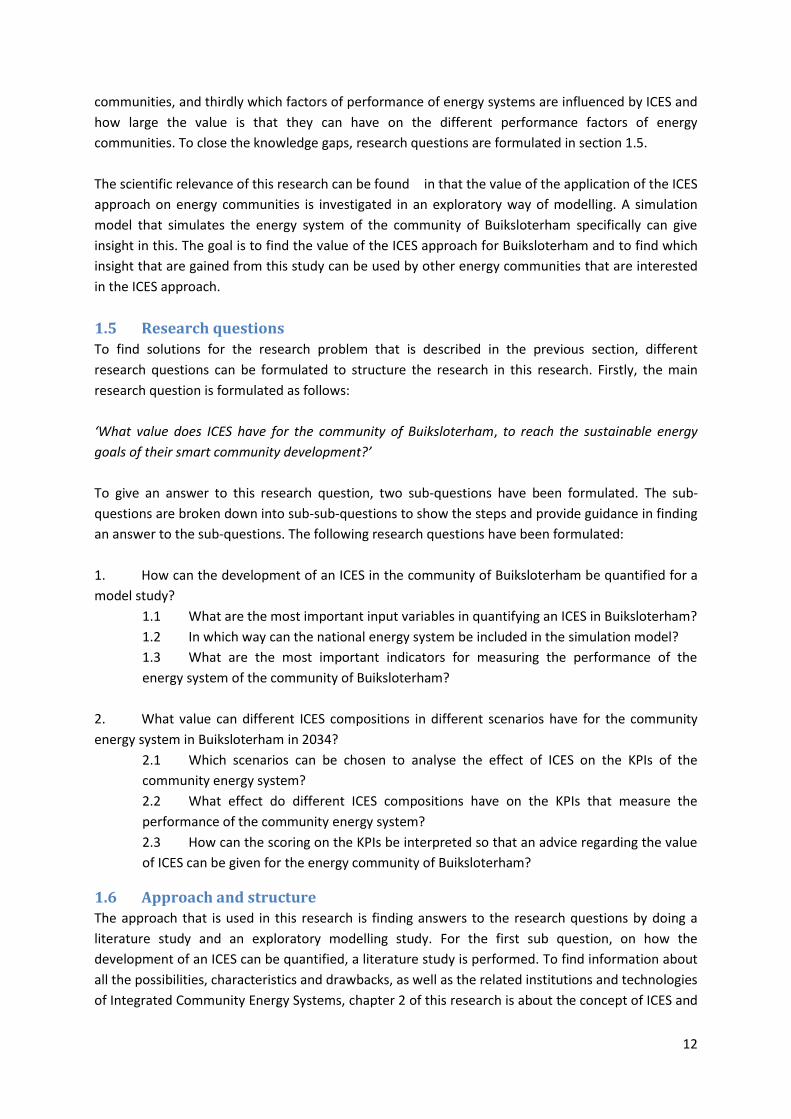
energy. At this moment, the Buiksloterham area is mianly used for industrial purposes, as there are
only 252 registered residents in 2014 (Gladet et al., 2014). The destination plan states that, with the
development of this area, more residential space will be created, next to the already existing
industrial activities in Buiksloterham.
Figure 3.1: Left: Area of Buiksloterham, Right: functions of current buildings (purple areas are
industry, yellow areas are offices).
The ambitions of the community of Buiksloterham are widespread and focus on different themes of a
circular city. On the energy management field of the development of this circular city the ambitions
of the community can be seen as goals that are desired to be reached in the year 2034. The general
overarching ambitions for Circular Buiksloterham concerning the energy theme are as follows:
The total project energy demand is being reduced by 75% compared to the current energy
demand of the community.
100% of the remaining energy demand is supplied with renewable energy sources.
Local energy production is maximized to satisfy at least 50% of the total energy demand.
Energy distribution system losses are reduced by 30% compared to the current distribution
system losses.
19
The development of a smart energy management system that includes monitoring and
feedback, a local smart grid and the use of electric vehicles for electricity storage.
Currently, the transition in Buiksloterham is still in the start-up phase. Different lots are already for
sale and a widespread variety of (small-scale) projects are brought up amongst others via a
cooperatively used community website. Active progress to an energy community that could be
independent from the national energy grid however is not yet taking place. The local effort of the
end users in an (energy) community is called bottom-up governance when it leads to problem-solving
behaviour through collective action (Huybrechts, 2013). Both creative thinking and investments are
needed to make the transition a success. Energy supply is one part of the transition to a smart city,
the governance behind this part has had little development yet (Gladek et al., 2014). The plans that
are presented for Buiksloterham are about building the fundaments of a renewable based energy
community, but not on how this community should function. The functioning of the governance in
the city is critical to the success of smart cities (Alawadhi et al., 2012).
In the development of local energy communities, less attention is paid to using a comprehensive and
integrated approach that covers all energy carriers and all aspects of the community, instead of only
focusing on separate sustainable energy technologies. Next to this, stakeholder relations can be seen
as a critical governance factor in determining the success of government projects that involve the use
of IT technologies, such as in the case of the development of smart communities (Scholl et al., 2009).
This means that there could be, in the case of the Buiksloterham, opportunities for the application of
approaches or frameworks that are aimed at structuring development of smart communities. The
ICES approach can provide guidance and coordination for the bottom-up approaches that take place
in the community of Buiksloterham with respect to the energy supply part of a smart community.
This energy supply could be developed as a decentralized energy system at a community level.
3.2 Possible applications of ICES in Buiksloterham
For the transition in Buiksloterham, no prescribed way of achieving the increase of sustainably built
residential area is presented. The community still needs to be formed, as not many residents live
there yet; the projected 3500 households are at this moment scheduled for building. This means that
in advance there are not any ICES compositions that are more desired or less desired to implement.
When talking about ICES compositions for Buiksloterham, this means that different technologies,
related to ICES, which could be implemented in the community. The implementation of these
technologies can happen at household level or at the community level and can be done in different
penetration levels. For example solar panels on the rooftop of houses can be considered household
level renewable energy sources and the capacity in which they are placed there determines the
penetration of this technology. A large wind turbine that is placed by the community as a whole is a
community level renewable energy source.
For the exploring of the value of ICES in the energy community of Buiksloterham, multiple ICES
technologies could be implemented separately or at the same time. The combination of those ICES
technologies forms an ICES composition that can be evaluated as a whole, but by looking at different
compositions the ICES technologies can also be evaluated separately. It can then be seen what
influence they have on the functioning of the future community energy grid. This functioning of the
grid has to be indicated by values for different variables of the energy system. The technologies that
20
are taken into account in the simulation study to see their value for the energy system of the
community of Buiksloterham are discussed in chapter 4. The way in which the functioning of the
energy system is evaluated is discussed in the next paragraph.
3.3 Key Performance Indicators of the energy community
To evaluate the value that an ICES has for the functioning of the energy system of Buiksloterham, Key
Performance Indicators (KPIs), that measure the performance of the energy system, can be used.
Different literature sources that look at performance of energy communities or grids have been
consulted. These studies both look at mainly environmental and economic benefits that renewable
developments of energy grids can bring. Modelling and literatu studies from BIES (2016), Koirala et al
(2016), van den Hil (2015), Voulis et al., (2016), Stadler et al. (2016), and Koirala et al. (2016) have
been used to select a list of key performance indicators that are most aligned to the goals of both
energy community development in general and the goals of the community of Buiksloterham. The
chosen KPIs also have to align with type of simulation model that is created in this research. Energy
communities can have different sustainable purposes when forming an ICES, for instance on having a
high self-sufficiency, a low CO₂ emission, or a high self-consumption of the produced renewable
energy. For this reason a list of key performance indicators that express the measurable values that
an ICES can have for energy communities such as Buiksloterham is used in this study.
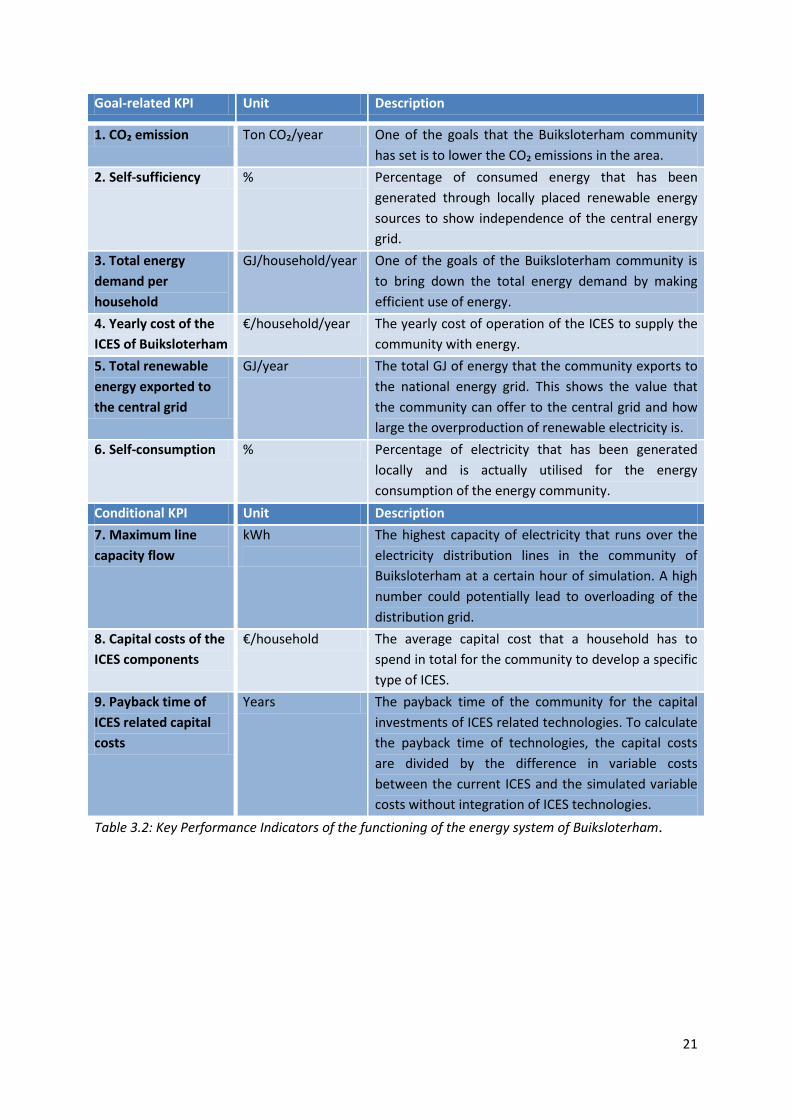
Table 3.2 shows the KPIs together with the unit in which they can be measured in the model study,
together with a description of what they mean. Both the advantages and downsides of the choice for
the development of an Integrated Community Energy System could be expressed in the KPIs. For this
reason the KPIs have been separated in goal-related and conditional key performance indicators.
Some of the KPIs are related to being a disadvantage for the development of the energy community,
namely the payback time of ICES related capital cost, the capital costs of the ICES components and
the maximum line flow capacity, rather than that they are a goal of the community development.
These can be seen as conditions under which the ICES is developed in an energy community. Goal-
related key performance indicators that have been chosen in this research can, as explained before,
reflect the goals that a community has in the development of an ICES. For some communities one of
the KPIs can be more important than the other, dependent on the community goals. Appendix A
shows the equations on how the values of the Key Performance Indicators are calculated in the
simulation model.
21
Goal-related KPI Unit Description
1. CO₂ emission Ton CO₂/year One of the goals that the Buiksloterham community
has set is to lower the CO₂ emissions in the area.
2. Self-sufficiency % Percentage of consumed energy that has been
generated through locally placed renewable energy
sources to show independence of the central energy
grid.
3. Total energy
demand per
household
GJ/household/year One of the goals of the Buiksloterham community is
to bring down the total energy demand by making
efficient use of energy.
4. Yearly cost of the
ICES of Buiksloterham
€/household/year The yearly cost of operation of the ICES to supply the
community with energy.
5. Total renewable
energy exported to
the central grid
GJ/year The total GJ of energy that the community exports to
the national energy grid. This shows the value that
the community can offer to the central grid and how
large the overproduction of renewable electricity is.
6. Self-consumption % Percentage of electricity that has been generated
locally and is actually utilised for the energy
consumption of the energy community.
Conditional KPI Unit Description
7. Maximum line
capacity flow
kWh
The highest capacity of electricity that runs over the
electricity distribution lines in the community of
Buiksloterham at a certain hour of simulation. A high
number could potentially lead to overloading of the
distribution grid.
8. Capital costs of the
ICES components
€/household The average capital cost that a household has to
spend in total for the community to develop a specific
type of ICES.
9. Payback time of
ICES related capital
costs
Years The payback time of the community for the capital
investments of ICES related technologies. To calculate
the payback time of technologies, the capital costs
are divided by the difference in variable costs
between the current ICES and the simulated variable
costs without integration of ICES technologies.
Table 3.2: Key Performance Indicators of the functioning of the energy system of Buiksloterham.
22
Chapter 4: Model study Buiksloterham energy system
The information on the principles of the ICES approach on smart community development in chapter
2, and the information on the goals and characteristics of Buiksloterham from chapter 3 are used as
input for the model study of the energy system of Buiksloterham. This chapter gives an answer to the
first research sub-question: ‘How can the development of an ICES in the community of Buiksloterham
be quantified for a model study?’ In order to do so, in section 4.1 a system demarcation is made and
the approach of this modelling study is explained. Section 4.2 provides an overview of the data that
has been found necessary for the development of the simulation models. Finally, in section 4.3 the
verification and validation of the simulation model is treated.
4.1 System demarcation and the simulation model
Before creating the simulation model, a system demarcation has been made to make clear what
should be included and what should not be included in the model. As explained before, the
neighbourhood of Buiksloterham, as a remote energy community, is taken into account in the model.
The households in Buiksloterham and their demand patterns form the energy community. The model
can simulate the energy production and usage over the course of a year in 2034. This represents the
year where the desired situation of a community with around 3500 households has been reached.
This is the number of households that the municipality of Amsterdam expects Buiksloterham to be
able to reach in 2034. The year is interesting because it’s the year for which the municipality of
Amsterdam has set their goals to make Buiksloterham a circular city. There are many possibilities for
what type of energy system will be present in this year, depending on the choices that the
community makes now.
In the simulation, the users and producers of energy are the households, the community as a whole
and the central energy grid (the national energy grid that can exchange energy with grid integrated
ICESs such as Buiksloterham). The modelling approach that is taking for this simulation study is to
create the model in MATLAB. MATLAB is a computing environment in which simulation models can
be developed. MATLAB is chosen because of the large and multitude of datasets that need to be
used, and the calculations that need to be made. With MATLAB large datasets of information can
easily be imported and complex calculations and simulations can be run.
4.1.1 Simulation model of Buiksloterham in 2034
The model, that simulates the community of Buiksloterham in 2034, has a heat and electricity
demand profile that is linked to the number of households of Buiksloterham. This demand has to be
fulfilled by a supply that matches the demand in every hour of the year. In this model, the energy
infrastructure is based on a traditional gas- and electric infrastructure. The electricity supply can be
(partly) generated by different renewable energy sources that are set up in the community, either at
the household or community level. The heat demand could also be fulfilled with electricity supply by
the integration of thermal energy technologies such as electrical heat pumps. Household level
renewable energy sources are here represented by solar PV panels that are placed on the roofs of
buildings in Buiksloterham, whereas the community renewable energy sources are community
owned wind turbines.
The simulation model is at the community point of view. The demand and the supply are determined
23
for the whole community, not for the single households in the community. The model is not an
optimization of ICES related technologies for each of the households, but explores the value of an
ICES for the whole community. The simulation study is exploratory and gives output of different ICES
compositions on all the key performance indicators at the same time. The ICES related technologies
and other input values have their influence on these variables and eventually on the key
performance indicators of this study. In the simulation model, the main principles are that when the
locally generated supply of electricity cannot fulfil the demand, the supply has to be met by buying
electricity from the central energy grid.
Electricity can thus be generated locally, while the supply of gas is in this model arranged via the
traditional way of central supply. When there is an oversupply of locally generated energy, this can
be sold to the central energy grid at the APX price level. This means that the simulation model looks
at:
- Demand: the community heating and electricity demand profiles.
- Supply: penetration of renewable energy sources at household level.
- Supply: penetration of renewable energy sources at community level.
- The energy efficiency level of buildings in Buiksloterham.
- The exchange of energy between the central energy grid and the community energy
grid of Buiksloterham.
- Integration of thermal energy technologies to meet the heat demand.
This means that different scenarios are possible to investigate with the model. These scenarios
represent the different choices that can be made in creating ICES in Buiksloterham in 2034. These
choices are in the scenarios translated to levels of integration of different ICES related technologies.
The scenarios also take into account different uncertain future factors that affect the simulation of
the Buiksloterham energy system in 2034. The scenarios and how they are formed are explained in
section 4.1.2. The goal of this simulation is to see what effect the different scenarios have on the
values of the key performance indicators of the functioning of the energy system of Buiksloterham.
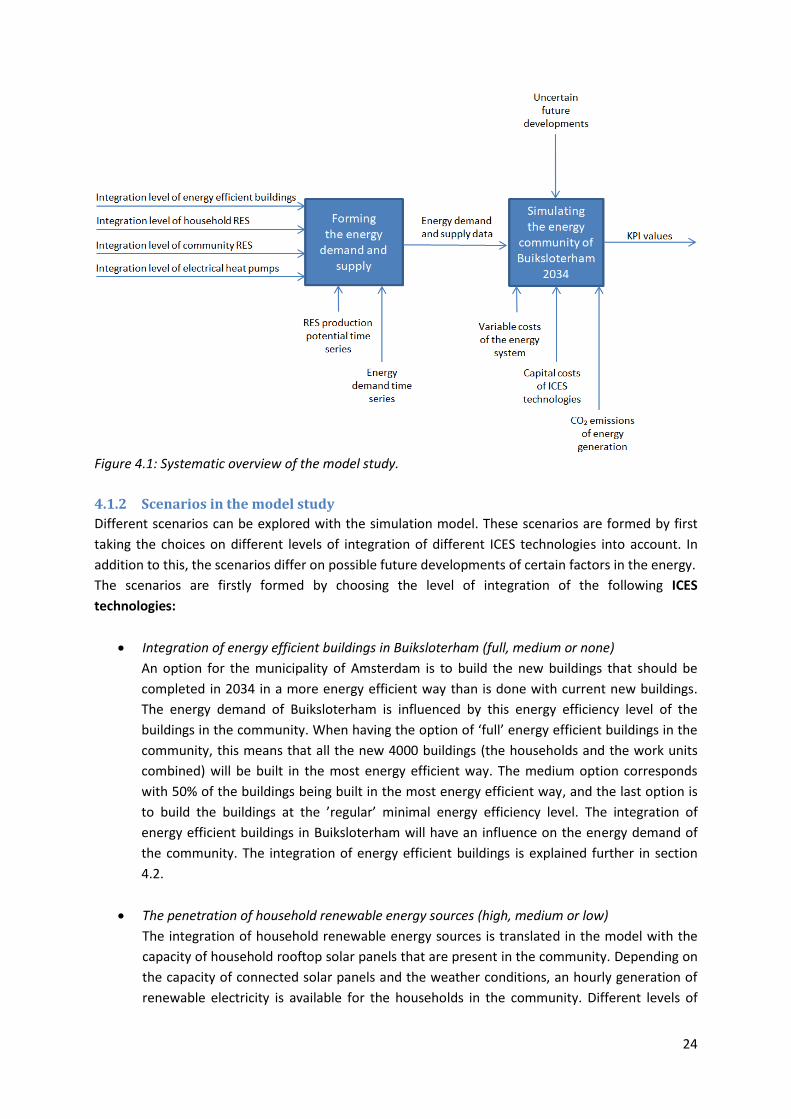
Figure 4.1 gives a systematic overview of the model study. First, the integration level of the ICES
related technologies, explained in section 4.1.2, which are determined by the scenarios that are
simulated, are the input for the first blue box activity: forming the energy demand and supply data.
This data is specific for every scenario that is simulated for the energy community of Buiksloterham.
Together with the RES production potential and the energy demand time series the integration levels
form the demand and supply. This data is the input for the second activity: simulating the energy
system of Buiksloterham 2034. Uncertain future developments, which are also explained in section
4.1.2 are influencing this simulation. Using more inputs of required information, which will be
explained in section 4.2 and is needed to simulate the model, the energy system of Buiksloterham
2034 can be simulated. The outputs of this simulation are the values of the key performance
indicators of the study.
24
Figure 4.1: Systematic overview of the model study.
4.1.2 Scenarios in the model study
Different scenarios can be explored with the simulation model. These scenarios are formed by first
taking the choices on different levels of integration of different ICES technologies into account. In
addition to this, the scenarios differ on possible future developments of certain factors in the energy.
The scenarios are firstly formed by choosing the level of integration of the following ICES
technologies:
Integration of energy efficient buildings in Buiksloterham (full, medium or none)
An option for the municipality of Amsterdam is to build the new buildings that should be
completed in 2034 in a more energy efficient way than is done with current new buildings.
The energy demand of Buiksloterham is influenced by this energy efficiency level of the
buildings in the community. When having the option of ‘full’ energy efficient buildings in the
community, this means that all the new 4000 buildings (the households and the work units
combined) will be built in the most energy efficient way. The medium option corresponds
with 50% of the buildings being built in the most energy efficient way, and the last option is
to build the buildings at the ’regular’ minimal energy efficiency level. The integration of
energy efficient buildings in Buiksloterham will have an influence on the energy demand of
the community. The integration of energy efficient buildings is explained further in section
4.2.
The penetration of household renewable energy sources (high, medium or low)
The integration of household renewable energy sources is translated in the model with the
capacity of household rooftop solar panels that are present in the community. Depending on
the capacity of connected solar panels and the weather conditions, an hourly generation of
renewable electricity is available for the households in the community. Different levels of
25
penetration are possible to explore in the model study. A high penetration means 8000 kW,
which is equal to when around 80% of the total rooftop capacity available for solar panels is
actually used for this capacity. A medium penetration is set at 5000 kW, which is equal to
around 50% of the total rooftop capacity available for solar panels. The low penetration is set
at 2000 kW, which is equal to around 20% of the total rooftop capacity available for solar
panels. The exact percentages of the penetration levels, here chosen to be 20, 50 or 80 per
cent are not of great importance. The main purpose of the different levels is to find out how
a higher or lower penetration of RES influences the performance of the energy community.
This could be explored by using a low, medium or high level of integration.
The penetration of community level renewable energy sources (high, medium or low)
The integration of household renewable energy sources is translated in the model with the
capacity of wind turbines that are built in the community. Again, depending on the capacity
and the weather conditions, an hourly generation of renewable electricity is available for the
community. Different levels of penetration are again explored in the model study, using the
same penetration levels as with the integration of household renewable energy sources. A
high penetration also means 8000 kW of wind turbine capacity. A medium penetration is set
at 5000 kW wind turbine capacity, and a low penetration of community level renewable
energy sources is set at 2000 kW, which is equal to around 20% of the total possible rooftop
capacity used for solar panels.
Integration of thermal energy technology (full, medium or none)
Different options are possible for the design of the thermal grid, dependent on the choices
that the Buiksloterham community makes. In 2034 there could still be a traditional gas
infrastructure for the thermal energy demand of Buiksloterham. Looking at the principles
and applications of ICES however, other options concern the use of heat pumps, solar
thermal installations or waste/district heat to fulfil this thermal energy demand, instead of
natural gas (Koirala, 2016). Heat pumps make it possible to generate heat in houses by using
only electricity. Solar thermal installations make sustainable heat generation possible at
community or at household level. By integrating these technologies, an all-electric energy
infrastructure could for example be made possible. In this simulation study, the integration
of heat pumps is investigated as an electrical option for supplying heat for the community of
Buiksloterham. This is because it is pragmatically the most straightforward option to include
in the simulation model. The demand for heat can be easily transformed into an extra
demand for electricity. Including this ICES technology gives this research the opportunity to
investigate to see what the value can be of fulfilling the heat demand with supply that could
be renewable (electricity), instead of using natural gas. This different thermal energy option
will have its impact on the energy demand and energy costs of Buiksloterham. It is therefore
interesting to see what effect it has on the performance of the energy community and take
this into the simulation study. The full integration of thermal energy technologies means that
every household in the community owns an electrical heat pump in 2034. The medium
setting means that half of the households own a heat pump, while the last option means no
integration of heat pumps in the households of Buiksloterham.
26
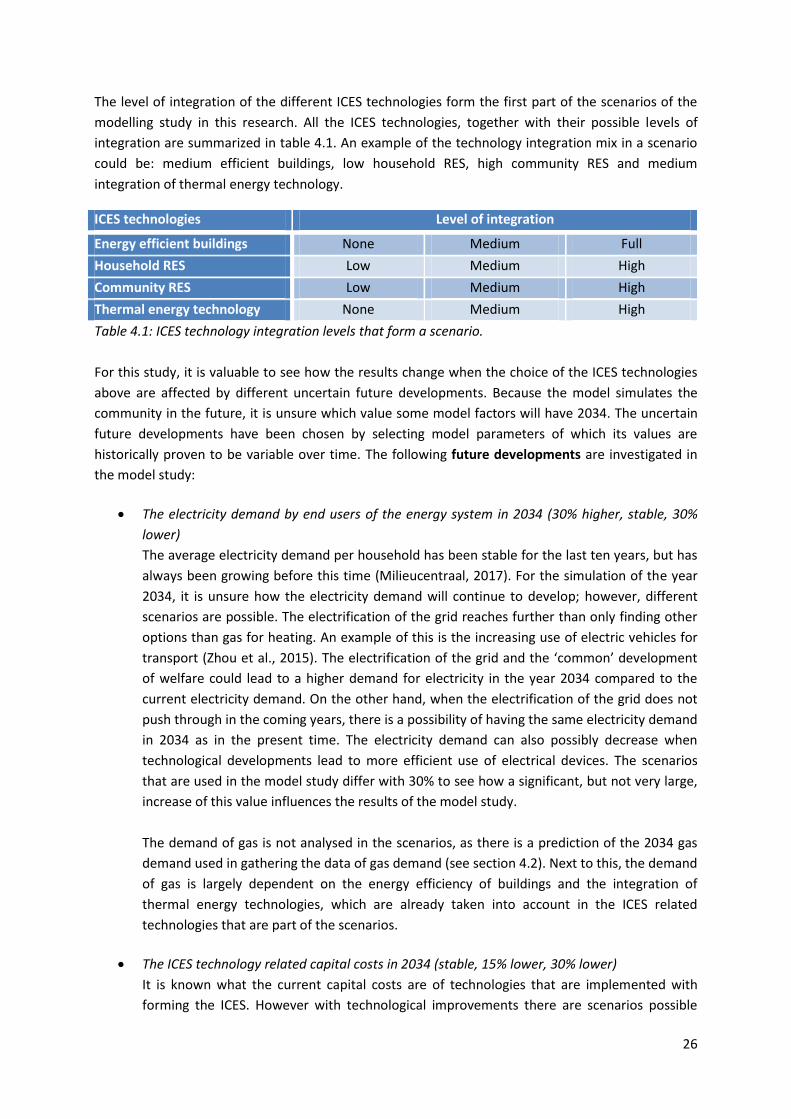
The level of integration of the different ICES technologies form the first part of the scenarios of the
modelling study in this research. All the ICES technologies, together with their possible levels of
integration are summarized in table 4.1. An example of the technology integration mix in a scenario
could be: medium efficient buildings, low household RES, high community RES and medium
integration of thermal energy technology.
ICES technologies Level of integration
Energy efficient buildings None Medium Full
Household RES Low Medium High
Community RES Low Medium High
Thermal energy technology None Medium High
Table 4.1: ICES technology integration levels that form a scenario.
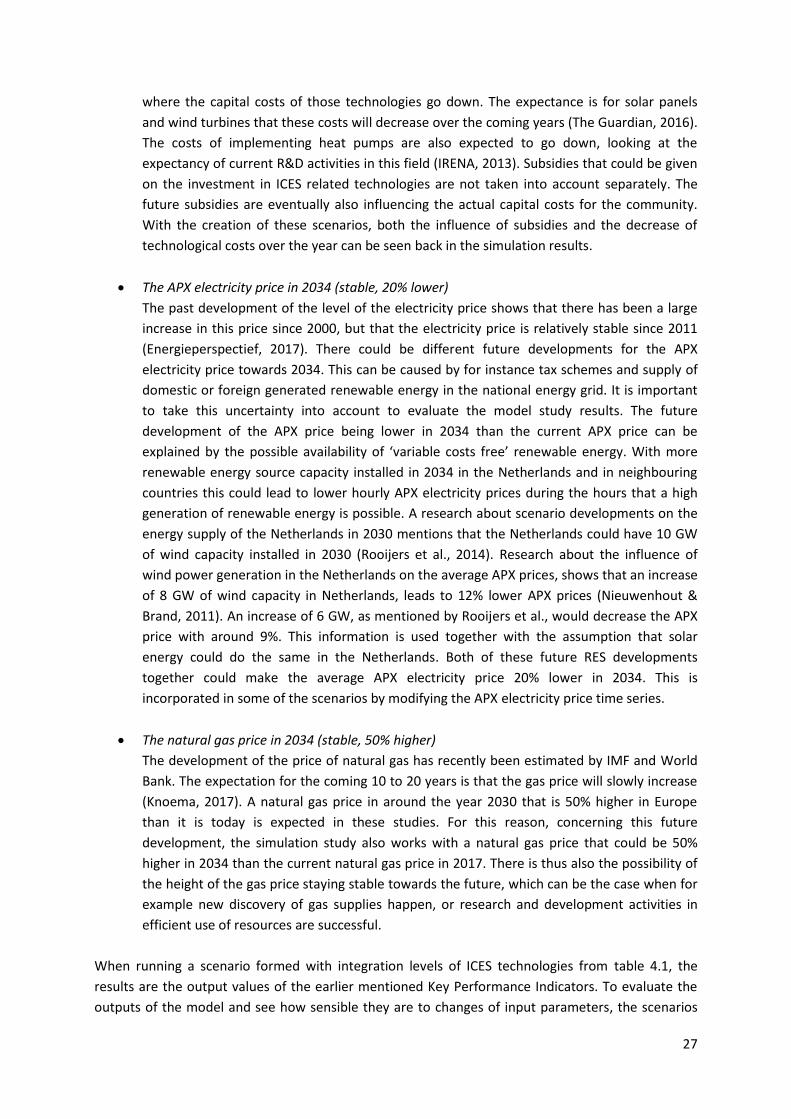
For this study, it is valuable to see how the results change when the choice of the ICES technologies
above are affected by different uncertain future developments. Because the model simulates the
community in the future, it is unsure which value some model factors will have 2034. The uncertain
future developments have been chosen by selecting model parameters of which its values are
historically proven to be variable over time. The following future developments are investigated in
the model study:
The electricity demand by end users of the energy system in 2034 (30% higher, stable, 30%
lower)
The average electricity demand per household has been stable for the last ten years, but has
always been growing before this time (Milieucentraal, 2017). For the simulation of the year
2034, it is unsure how the electricity demand will continue to develop; however, different
scenarios are possible. The electrification of the grid reaches further than only finding other
options than gas for heating. An example of this is the increasing use of electric vehicles for
transport (Zhou et al., 2015). The electrification of the grid and the ‘common’ development
of welfare could lead to a higher demand for electricity in the year 2034 compared to the
current electricity demand. On the other hand, when the electrification of the grid does not
push through in the coming years, there is a possibility of having the same electricity demand
in 2034 as in the present time. The electricity demand can also possibly decrease when
technological developments lead to more efficient use of electrical devices. The scenarios
that are used in the model study differ with 30% to see how a significant, but not very large,
increase of this value influences the results of the model study.
The demand of gas is not analysed in the scenarios, as there is a prediction of the 2034 gas
demand used in gathering the data of gas demand (see section 4.2). Next to this, the demand
of gas is largely dependent on the energy efficiency of buildings and the integration of
thermal energy technologies, which are already taken into account in the ICES related
technologies that are part of the scenarios.
The ICES technology related capital costs in 2034 (stable, 15% lower, 30% lower)
It is known what the current capital costs are of technologies that are implemented with
forming the ICES. However with technological improvements there are scenarios possible
27
where the capital costs of those technologies go down. The expectance is for solar panels
and wind turbines that these costs will decrease over the coming years (The Guardian, 2016).
The costs of implementing heat pumps are also expected to go down, looking at the
expectancy of current R&D activities in this field (IRENA, 2013). Subsidies that could be given
on the investment in ICES related technologies are not taken into account separately. The
future subsidies are eventually also influencing the actual capital costs for the community.
With the creation of these scenarios, both the influence of subsidies and the decrease of
technological costs over the year can be seen back in the simulation results.
The APX electricity price in 2034 (stable, 20% lower)
The past development of the level of the electricity price shows that there has been a large
increase in this price since 2000, but that the electricity price is relatively stable since 2011
(Energieperspectief, 2017). There could be different future developments for the APX
electricity price towards 2034. This can be caused by for instance tax schemes and supply of
domestic or foreign generated renewable energy in the national energy grid. It is important
to take this uncertainty into account to evaluate the model study results. The future
development of the APX price being lower in 2034 than the current APX price can be
explained by the possible availability of ‘variable costs free’ renewable energy. With more
renewable energy source capacity installed in 2034 in the Netherlands and in neighbouring
countries this could lead to lower hourly APX electricity prices during the hours that a high
generation of renewable energy is possible. A research about scenario developments on the
energy supply of the Netherlands in 2030 mentions that the Netherlands could have 10 GW
of wind capacity installed in 2030 (Rooijers et al., 2014). Research about the influence of
wind power generation in the Netherlands on the average APX prices, shows that an increase
of 8 GW of wind capacity in Netherlands, leads to 12% lower APX prices (Nieuwenhout &
Brand, 2011). An increase of 6 GW, as mentioned by Rooijers et al., would decrease the APX
price with around 9%. This information is used together with the assumption that solar
energy could do the same in the Netherlands. Both of these future RES developments
together could make the average APX electricity price 20% lower in 2034. This is
incorporated in some of the scenarios by modifying the APX electricity price time series.
The natural gas price in 2034 (stable, 50% higher)
The development of the price of natural gas has recently been estimated by IMF and World
Bank. The expectation for the coming 10 to 20 years is that the gas price will slowly increase
(Knoema, 2017). A natural gas price in around the year 2030 that is 50% higher in Europe
than it is today is expected in these studies. For this reason, concerning this future
development, the simulation study also works with a natural gas price that could be 50%
higher in 2034 than the current natural gas price in 2017. There is thus also the possibility of
the height of the gas price staying stable towards the future, which can be the case when for
example new discovery of gas supplies happen, or research and development activities in
efficient use of resources are successful.
When running a scenario formed with integration levels of ICES technologies from table 4.1, the
results are the output values of the earlier mentioned Key Performance Indicators. To evaluate the
outputs of the model and see how sensible they are to changes of input parameters, the scenarios
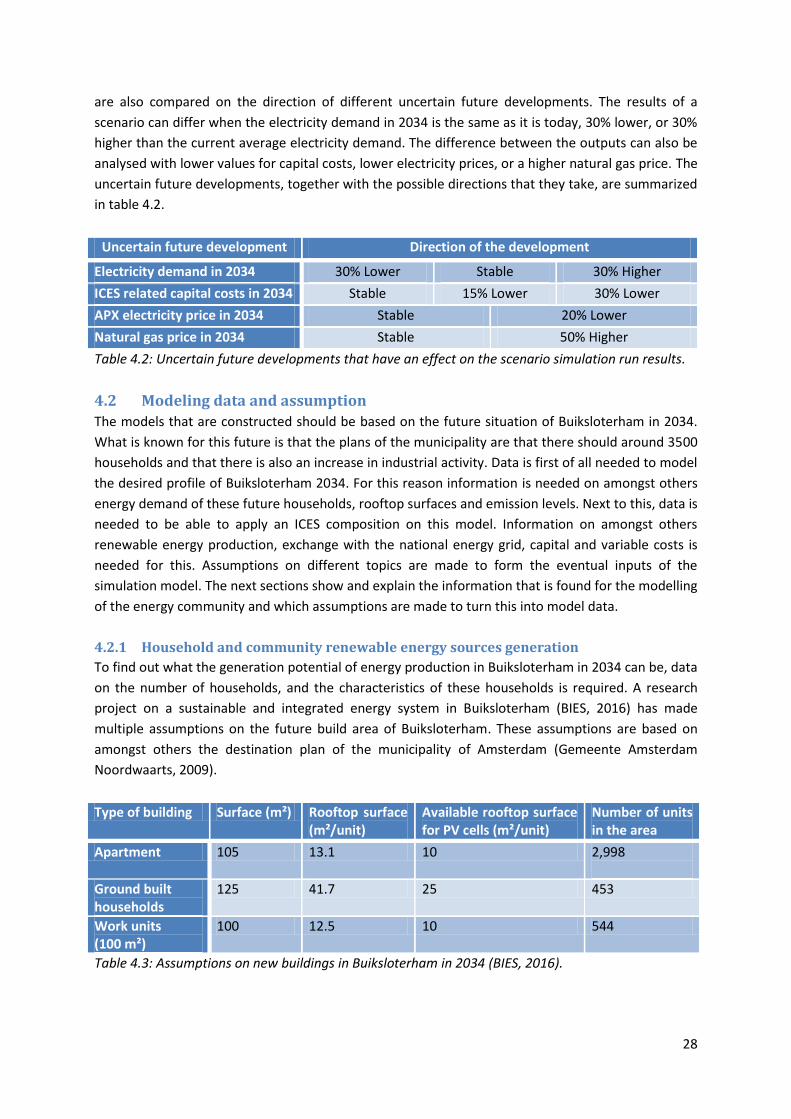
28
are also compared on the direction of different uncertain future developments. The results of a
scenario can differ when the electricity demand in 2034 is the same as it is today, 30% lower, or 30%
higher than the current average electricity demand. The difference between the outputs can also be
analysed with lower values for capital costs, lower electricity prices, or a higher natural gas price. The
uncertain future developments, together with the possible directions that they take, are summarized
in table 4.2.
Uncertain future development Direction of the development
Electricity demand in 2034 30% Lower Stable 30% Higher
ICES related capital costs in 2034 Stable 15% Lower 30% Lower
APX electricity price in 2034 Stable 20% Lower
Natural gas price in 2034 Stable 50% Higher
Table 4.2: Uncertain future developments that have an effect on the scenario simulation run results.
4.2 Modeling data and assumption
The models that are constructed should be based on the future situation of Buiksloterham in 2034.
What is known for this future is that the plans of the municipality are that there should around 3500
households and that there is also an increase in industrial activity. Data is first of all needed to model
the desired profile of Buiksloterham 2034. For this reason information is needed on amongst others
energy demand of these future households, rooftop surfaces and emission levels. Next to this, data is
needed to be able to apply an ICES composition on this model. Information on amongst others
renewable energy production, exchange with the national energy grid, capital and variable costs is
needed for this. Assumptions on different topics are made to form the eventual inputs of the
simulation model. The next sections show and explain the information that is found for the modelling
of the energy community and which assumptions are made to turn this into model data.
4.2.1 Household and community renewable energy sources generation
To find out what the generation potential of energy production in Buiksloterham in 2034 can be, data
on the number of households, and the characteristics of these households is required. A research
project on a sustainable and integrated energy system in Buiksloterham (BIES, 2016) has made
multiple assumptions on the future build area of Buiksloterham. These assumptions are based on
amongst others the destination plan of the municipality of Amsterdam (Gemeente Amsterdam
Noordwaarts, 2009).
Type of building Surface (m²) Rooftop surface (m²/unit)
Available rooftop surface for PV cells (m²/unit)
Number of units in the area
Apartment 105 13.1 10 2,998
Ground built households
125 41.7 25 453
Work units (100 m²)
100 12.5 10 544
Table 4.3: Assumptions on new buildings in Buiksloterham in 2034 (BIES, 2016).
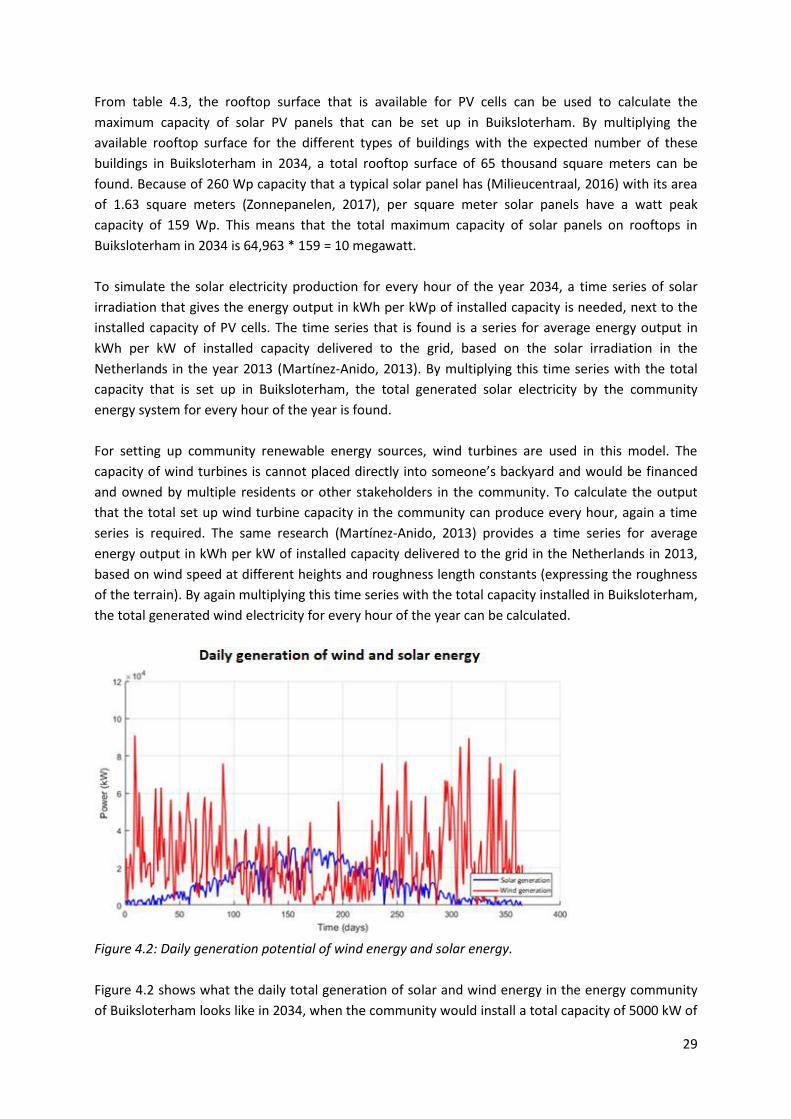
29
From table 4.3, the rooftop surface that is available for PV cells can be used to calculate the
maximum capacity of solar PV panels that can be set up in Buiksloterham. By multiplying the
available rooftop surface for the different types of buildings with the expected number of these
buildings in Buiksloterham in 2034, a total rooftop surface of 65 thousand square meters can be
found. Because of 260 Wp capacity that a typical solar panel has (Milieucentraal, 2016) with its area
of 1.63 square meters (Zonnepanelen, 2017), per square meter solar panels have a watt peak
capacity of 159 Wp. This means that the total maximum capacity of solar panels on rooftops in
Buiksloterham in 2034 is 64,963 * 159 = 10 megawatt.
To simulate the solar electricity production for every hour of the year 2034, a time series of solar
irradiation that gives the energy output in kWh per kWp of installed capacity is needed, next to the
installed capacity of PV cells. The time series that is found is a series for average energy output in
kWh per kW of installed capacity delivered to the grid, based on the solar irradiation in the
Netherlands in the year 2013 (Martínez-Anido, 2013). By multiplying this time series with the total
capacity that is set up in Buiksloterham, the total generated solar electricity by the community
energy system for every hour of the year is found.
For setting up community renewable energy sources, wind turbines are used in this model. The
capacity of wind turbines is cannot placed directly into someone’s backyard and would be financed
and owned by multiple residents or other stakeholders in the community. To calculate the output
that the total set up wind turbine capacity in the community can produce every hour, again a time
series is required. The same research (Martínez-Anido, 2013) provides a time series for average
energy output in kWh per kW of installed capacity delivered to the grid in the Netherlands in 2013,
based on wind speed at different heights and roughness length constants (expressing the roughness
of the terrain). By again multiplying this time series with the total capacity installed in Buiksloterham,
the total generated wind electricity for every hour of the year can be calculated.
Figure 4.2: Daily generation potential of wind energy and solar energy.
Figure 4.2 shows what the daily total generation of solar and wind energy in the energy community
of Buiksloterham looks like in 2034, when the community would install a total capacity of 5000 kW of
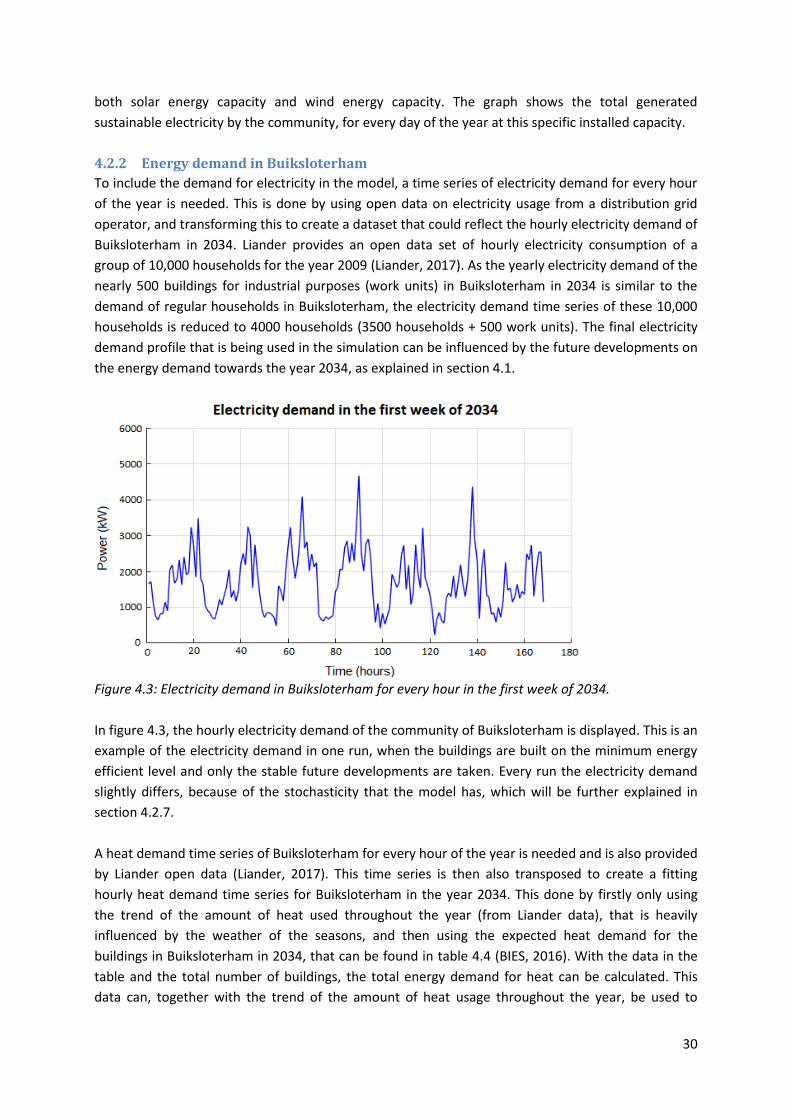
30
both solar energy capacity and wind energy capacity. The graph shows the total generated
sustainable electricity by the community, for every day of the year at this specific installed capacity.
4.2.2 Energy demand in Buiksloterham
To include the demand for electricity in the model, a time series of electricity demand for every hour
of the year is needed. This is done by using open data on electricity usage from a distribution grid
operator, and transforming this to create a dataset that could reflect the hourly electricity demand of
Buiksloterham in 2034. Liander provides an open data set of hourly electricity consumption of a
group of 10,000 households for the year 2009 (Liander, 2017). As the yearly electricity demand of the
nearly 500 buildings for industrial purposes (work units) in Buiksloterham in 2034 is similar to the
demand of regular households in Buiksloterham, the electricity demand time series of these 10,000
households is reduced to 4000 households (3500 households + 500 work units). The final electricity
demand profile that is being used in the simulation can be influenced by the future developments on
the energy demand towards the year 2034, as explained in section 4.1.
Figure 4.3: Electricity demand in Buiksloterham for every hour in the first week of 2034.
In figure 4.3, the hourly electricity demand of the community of Buiksloterham is displayed. This is an
example of the electricity demand in one run, when the buildings are built on the minimum energy
efficient level and only the stable future developments are taken. Every run the electricity demand
slightly differs, because of the stochasticity that the model has, which will be further explained in
section 4.2.7.
A heat demand time series of Buiksloterham for every hour of the year is needed and is also provided
by Liander open data (Liander, 2017). This time series is then also transposed to create a fitting
hourly heat demand time series for Buiksloterham in the year 2034. This done by firstly only using
the trend of the amount of heat used throughout the year (from Liander data), that is heavily
influenced by the weather of the seasons, and then using the expected heat demand for the
buildings in Buiksloterham in 2034, that can be found in table 4.4 (BIES, 2016). With the data in the
table and the total number of buildings, the total energy demand for heat can be calculated. This
data can, together with the trend of the amount of heat usage throughout the year, be used to
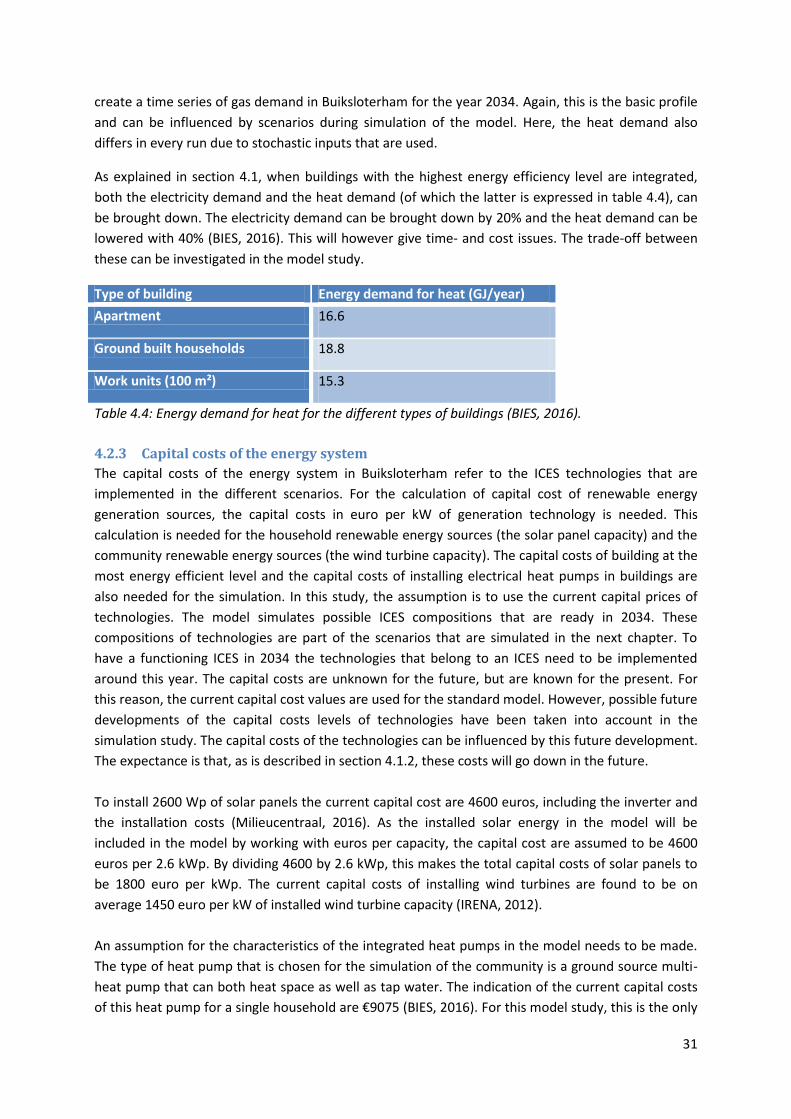
31
create a time series of gas demand in Buiksloterham for the year 2034. Again, this is the basic profile
and can be influenced by scenarios during simulation of the model. Here, the heat demand also
differs in every run due to stochastic inputs that are used.
As explained in section 4.1, when buildings with the highest energy efficiency level are integrated,
both the electricity demand and the heat demand (of which the latter is expressed in table 4.4), can
be brought down. The electricity demand can be brought down by 20% and the heat demand can be
lowered with 40% (BIES, 2016). This will however give time- and cost issues. The trade-off between
these can be investigated in the model study.
Type of building Energy demand for heat (GJ/year)
Apartment 16.6
Ground built households 18.8
Work units (100 m²) 15.3
Table 4.4: Energy demand for heat for the different types of buildings (BIES, 2016).
4.2.3 Capital costs of the energy system
The capital costs of the energy system in Buiksloterham refer to the ICES technologies that are
implemented in the different scenarios. For the calculation of capital cost of renewable energy
generation sources, the capital costs in euro per kW of generation technology is needed. This
calculation is needed for the household renewable energy sources (the solar panel capacity) and the
community renewable energy sources (the wind turbine capacity). The capital costs of building at the
most energy efficient level and the capital costs of installing electrical heat pumps in buildings are
also needed for the simulation. In this study, the assumption is to use the current capital prices of
technologies. The model simulates possible ICES compositions that are ready in 2034. These
compositions of technologies are part of the scenarios that are simulated in the next chapter. To
have a functioning ICES in 2034 the technologies that belong to an ICES need to be implemented
around this year. The capital costs are unknown for the future, but are known for the present. For
this reason, the current capital cost values are used for the standard model. However, possible future
developments of the capital costs levels of technologies have been taken into account in the
simulation study. The capital costs of the technologies can be influenced by this future development.
The expectance is that, as is described in section 4.1.2, these costs will go down in the future.
To install 2600 Wp of solar panels the current capital cost are 4600 euros, including the inverter and
the installation costs (Milieucentraal, 2016). As the installed solar energy in the model will be
included in the model by working with euros per capacity, the capital cost are assumed to be 4600
euros per 2.6 kWp. By dividing 4600 by 2.6 kWp, this makes the total capital costs of solar panels to
be 1800 euro per kWp. The current capital costs of installing wind turbines are found to be on
average 1450 euro per kW of installed wind turbine capacity (IRENA, 2012).
An assumption for the characteristics of the integrated heat pumps in the model needs to be made.
The type of heat pump that is chosen for the simulation of the community is a ground source multi-
heat pump that can both heat space as well as tap water. The indication of the current capital costs
of this heat pump for a single household are €9075 (BIES, 2016). For this model study, this is the only
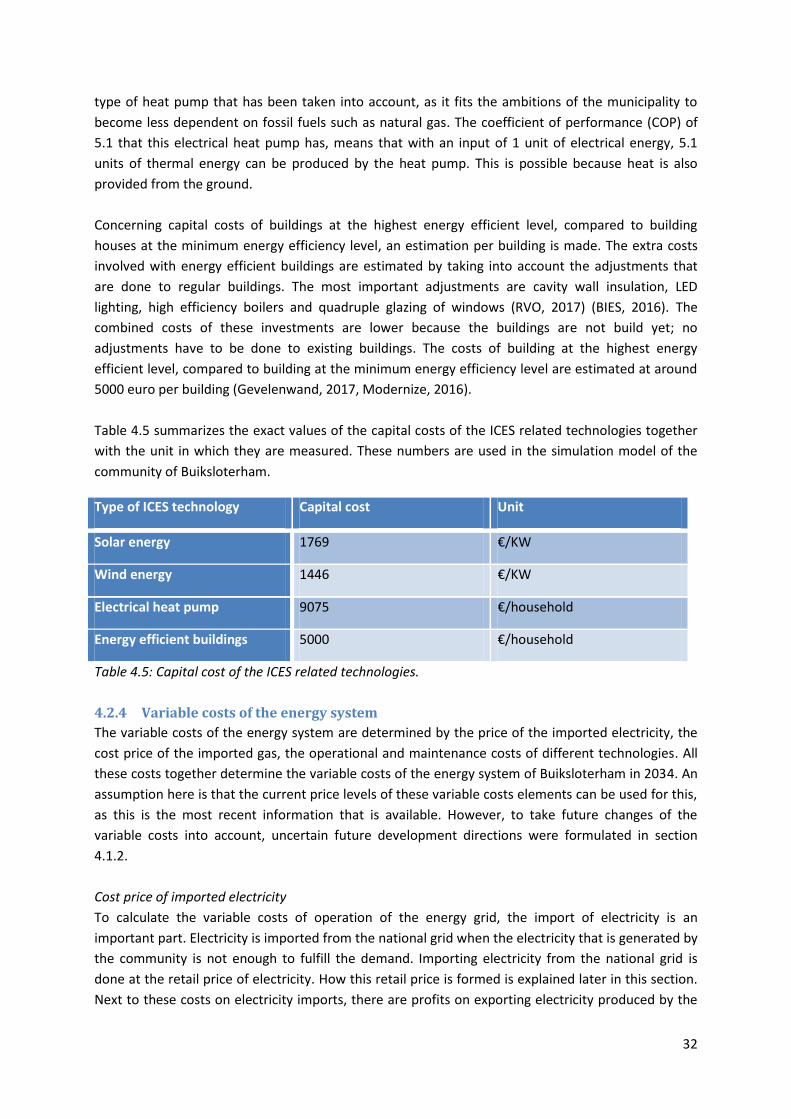
32
type of heat pump that has been taken into account, as it fits the ambitions of the municipality to
become less dependent on fossil fuels such as natural gas. The coefficient of performance (COP) of
5.1 that this electrical heat pump has, means that with an input of 1 unit of electrical energy, 5.1
units of thermal energy can be produced by the heat pump. This is possible because heat is also
provided from the ground.
Concerning capital costs of buildings at the highest energy efficient level, compared to building
houses at the minimum energy efficiency level, an estimation per building is made. The extra costs
involved with energy efficient buildings are estimated by taking into account the adjustments that
are done to regular buildings. The most important adjustments are cavity wall insulation, LED
lighting, high efficiency boilers and quadruple glazing of windows (RVO, 2017) (BIES, 2016). The
combined costs of these investments are lower because the buildings are not build yet; no
adjustments have to be done to existing buildings. The costs of building at the highest energy
efficient level, compared to building at the minimum energy efficiency level are estimated at around
5000 euro per building (Gevelenwand, 2017, Modernize, 2016).
Table 4.5 summarizes the exact values of the capital costs of the ICES related technologies together
with the unit in which they are measured. These numbers are used in the simulation model of the
community of Buiksloterham.
Type of ICES technology Capital cost Unit
Solar energy 1769 €/KW
Wind energy 1446 €/KW
Electrical heat pump 9075 €/household
Energy efficient buildings 5000 €/household
Table 4.5: Capital cost of the ICES related technologies.
4.2.4 Variable costs of the energy system
The variable costs of the energy system are determined by the price of the imported electricity, the
cost price of the imported gas, the operational and maintenance costs of different technologies. All
these costs together determine the variable costs of the energy system of Buiksloterham in 2034. An
assumption here is that the current price levels of these variable costs elements can be used for this,
as this is the most recent information that is available. However, to take future changes of the
variable costs into account, uncertain future development directions were formulated in section
4.1.2.
Cost price of imported electricity
To calculate the variable costs of operation of the energy grid, the import of electricity is an
important part. Electricity is imported from the national grid when the electricity that is generated by
the community is not enough to fulfill the demand. Importing electricity from the national grid is
done at the retail price of electricity. How this retail price is formed is explained later in this section.
Next to these costs on electricity imports, there are profits on exporting electricity produced by the
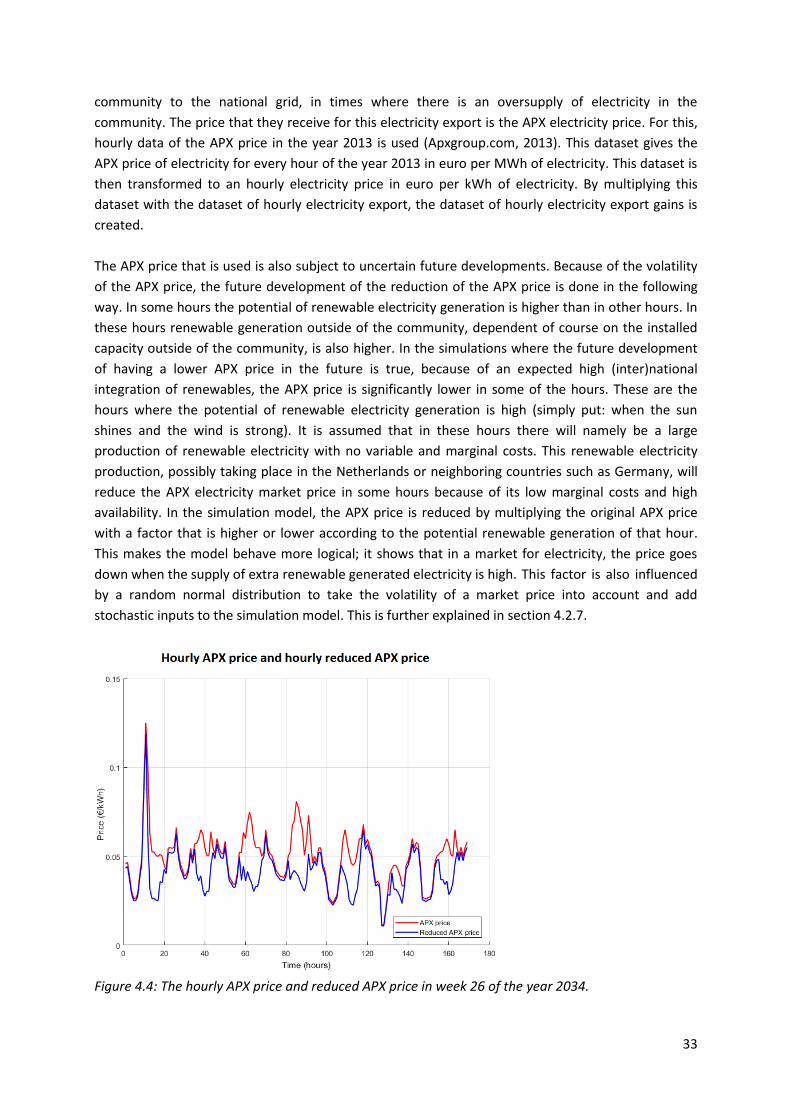
33
community to the national grid, in times where there is an oversupply of electricity in the
community. The price that they receive for this electricity export is the APX electricity price. For this,
hourly data of the APX price in the year 2013 is used (Apxgroup.com, 2013). This dataset gives the
APX price of electricity for every hour of the year 2013 in euro per MWh of electricity. This dataset is
then transformed to an hourly electricity price in euro per kWh of electricity. By multiplying this
dataset with the dataset of hourly electricity export, the dataset of hourly electricity export gains is
created.
The APX price that is used is also subject to uncertain future developments. Because of the volatility
of the APX price, the future development of the reduction of the APX price is done in the following
way. In some hours the potential of renewable electricity generation is higher than in other hours. In
these hours renewable generation outside of the community, dependent of course on the installed
capacity outside of the community, is also higher. In the simulations where the future development
of having a lower APX price in the future is true, because of an expected high (inter)national
integration of renewables, the APX price is significantly lower in some of the hours. These are the
hours where the potential of renewable electricity generation is high (simply put: when the sun
shines and the wind is strong). It is assumed that in these hours there will namely be a large
production of renewable electricity with no variable and marginal costs. This renewable electricity
production, possibly taking place in the Netherlands or neighboring countries such as Germany, will
reduce the APX electricity market price in some hours because of its low marginal costs and high
availability. In the simulation model, the APX price is reduced by multiplying the original APX price
with a factor that is higher or lower according to the potential renewable generation of that hour.
This makes the model behave more logical; it shows that in a market for electricity, the price goes
down when the supply of extra renewable generated electricity is high. This factor is also influenced
by a random normal distribution to take the volatility of a market price into account and add
stochastic inputs to the simulation model. This is further explained in section 4.2.7.
Figure 4.4: The hourly APX price and reduced APX price in week 26 of the year 2034.
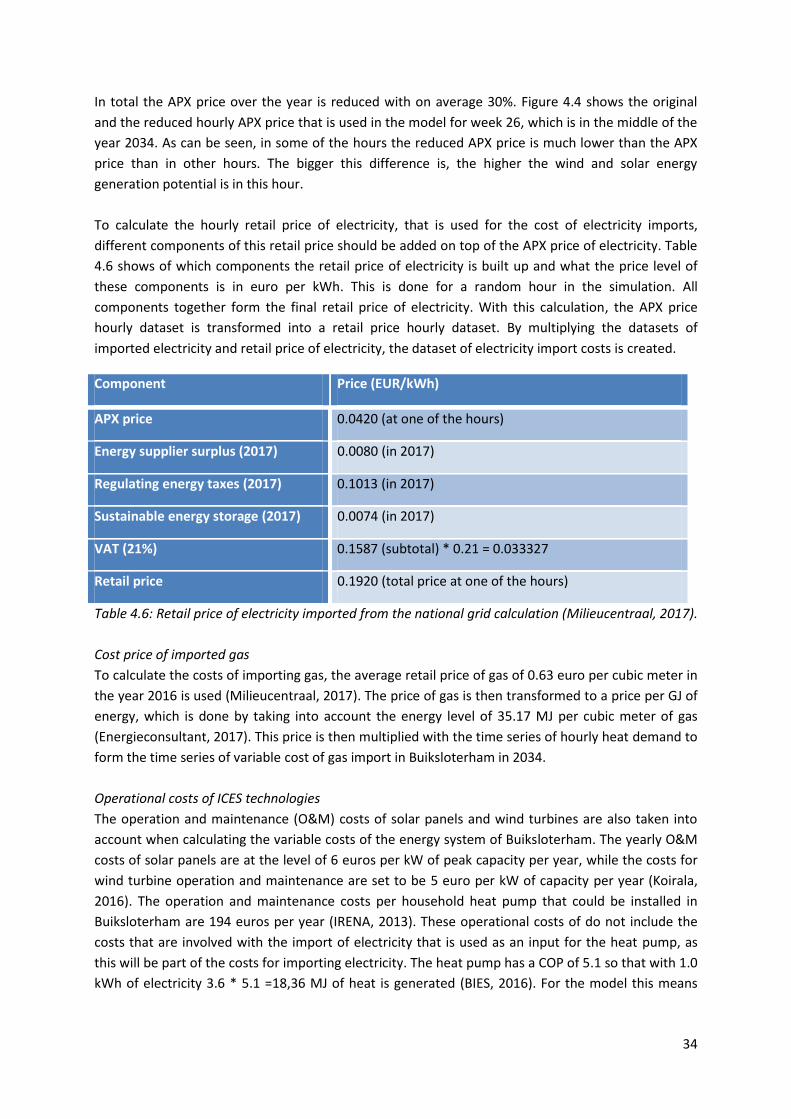
34
In total the APX price over the year is reduced with on average 30%. Figure 4.4 shows the original
and the reduced hourly APX price that is used in the model for week 26, which is in the middle of the
year 2034. As can be seen, in some of the hours the reduced APX price is much lower than the APX
price than in other hours. The bigger this difference is, the higher the wind and solar energy
generation potential is in this hour.
To calculate the hourly retail price of electricity, that is used for the cost of electricity imports,
different components of this retail price should be added on top of the APX price of electricity. Table
4.6 shows of which components the retail price of electricity is built up and what the price level of
these components is in euro per kWh. This is done for a random hour in the simulation. All
components together form the final retail price of electricity. With this calculation, the APX price
hourly dataset is transformed into a retail price hourly dataset. By multiplying the datasets of
imported electricity and retail price of electricity, the dataset of electricity import costs is created.
Component Price (EUR/kWh)
APX price 0.0420 (at one of the hours)
Energy supplier surplus (2017) 0.0080 (in 2017)
Regulating energy taxes (2017) 0.1013 (in 2017)
Sustainable energy storage (2017) 0.0074 (in 2017)
VAT (21%) 0.1587 (subtotal) * 0.21 = 0.033327
Retail price 0.1920 (total price at one of the hours)
Table 4.6: Retail price of electricity imported from the national grid calculation (Milieucentraal, 2017).
Cost price of imported gas
To calculate the costs of importing gas, the average retail price of gas of 0.63 euro per cubic meter in
the year 2016 is used (Milieucentraal, 2017). The price of gas is then transformed to a price per GJ of
energy, which is done by taking into account the energy level of 35.17 MJ per cubic meter of gas
(Energieconsultant, 2017). This price is then multiplied with the time series of hourly heat demand to
form the time series of variable cost of gas import in Buiksloterham in 2034.
Operational costs of ICES technologies
The operation and maintenance (O&M) costs of solar panels and wind turbines are also taken into
account when calculating the variable costs of the energy system of Buiksloterham. The yearly O&M
costs of solar panels are at the level of 6 euros per kW of peak capacity per year, while the costs for
wind turbine operation and maintenance are set to be 5 euro per kW of capacity per year (Koirala,
2016). The operation and maintenance costs per household heat pump that could be installed in
Buiksloterham are 194 euros per year (IRENA, 2013). These operational costs of do not include the
costs that are involved with the import of electricity that is used as an input for the heat pump, as
this will be part of the costs for importing electricity. The heat pump has a COP of 5.1 so that with 1.0
kWh of electricity 3.6 * 5.1 =18,36 MJ of heat is generated (BIES, 2016). For the model this means
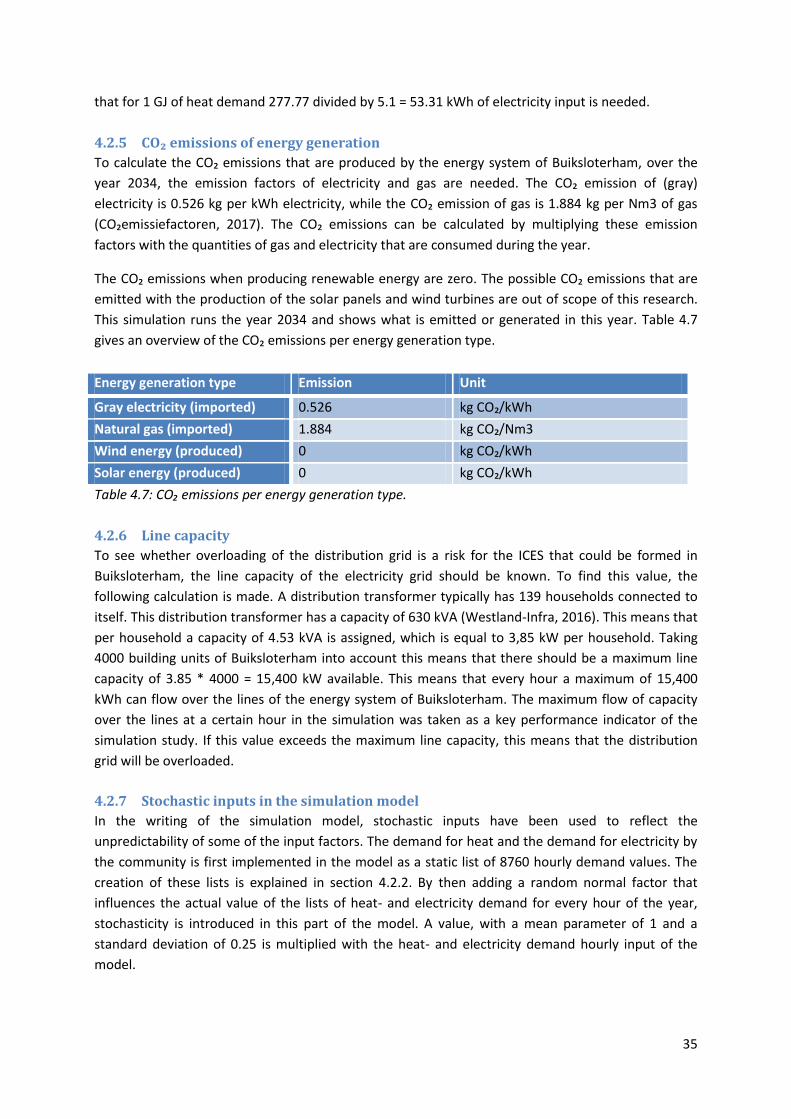
35
that for 1 GJ of heat demand 277.77 divided by 5.1 = 53.31 kWh of electricity input is needed.
4.2.5 CO₂ emissions of energy generation
To calculate the CO₂ emissions that are produced by the energy system of Buiksloterham, over the
year 2034, the emission factors of electricity and gas are needed. The CO₂ emission of (gray)
electricity is 0.526 kg per kWh electricity, while the CO₂ emission of gas is 1.884 kg per Nm3 of gas
(CO₂emissiefactoren, 2017). The CO₂ emissions can be calculated by multiplying these emission
factors with the quantities of gas and electricity that are consumed during the year.
The CO₂ emissions when producing renewable energy are zero. The possible CO₂ emissions that are
emitted with the production of the solar panels and wind turbines are out of scope of this research.
This simulation runs the year 2034 and shows what is emitted or generated in this year. Table 4.7
gives an overview of the CO₂ emissions per energy generation type.
Energy generation type Emission Unit
Gray electricity (imported) 0.526 kg CO₂/kWh
Natural gas (imported) 1.884 kg CO₂/Nm3
Wind energy (produced) 0 kg CO₂/kWh
Solar energy (produced) 0 kg CO₂/kWh
Table 4.7: CO₂ emissions per energy generation type.
4.2.6 Line capacity
To see whether overloading of the distribution grid is a risk for the ICES that could be formed in
Buiksloterham, the line capacity of the electricity grid should be known. To find this value, the
following calculation is made. A distribution transformer typically has 139 households connected to
itself. This distribution transformer has a capacity of 630 kVA (Westland-Infra, 2016). This means that
per household a capacity of 4.53 kVA is assigned, which is equal to 3,85 kW per household. Taking
4000 building units of Buiksloterham into account this means that there should be a maximum line
capacity of 3.85 * 4000 = 15,400 kW available. This means that every hour a maximum of 15,400
kWh can flow over the lines of the energy system of Buiksloterham. The maximum flow of capacity
over the lines at a certain hour in the simulation was taken as a key performance indicator of the
simulation study. If this value exceeds the maximum line capacity, this means that the distribution
grid will be overloaded.
4.2.7 Stochastic inputs in the simulation model
In the writing of the simulation model, stochastic inputs have been used to reflect the
unpredictability of some of the input factors. The demand for heat and the demand for electricity by
the community is first implemented in the model as a static list of 8760 hourly demand values. The
creation of these lists is explained in section 4.2.2. By then adding a random normal factor that
influences the actual value of the lists of heat- and electricity demand for every hour of the year,
stochasticity is introduced in this part of the model. A value, with a mean parameter of 1 and a
standard deviation of 0.25 is multiplied with the heat- and electricity demand hourly input of the
model.
36
With determining the APX price, both when the APX price would be 30% lower in 2034 (which is one
of the uncertain future development settings) or not, a more complex stochastic factor is been taken
into account. The APX price determines amongst others the amount of money that the community of
Buiksloterham receives when selling an overproduction of renewable generated electricity to the
national energy grid. The hourly APX prices that are used in the simulation are firstly taken from data
that is found in section 4.2.4. In the future development where APX electricity prices are going down,
the expectance is that these hourly prices are influenced by the hourly production potential of
renewables, as is explained in section 4.2.4. To simulate the volatility of the market price, the
multiplication factor that reduces the hourly prices, which is different for every hour (dependent on
the renewable energy production potential), is multiplied with a random normal factor as well to
reflect the unpredictability of the electricity price. In total, this determination of the APX price will
lead to an hourly APX price that is 30% lower on average over the whole year 2034. When the future
development of a lower APX electricity price in 2034 is not applied, the model only uses the random
normal factor to add stochastic inputs to the APX electricity price data that is imported to the
simulation model.
With these stochastic model inputs, most of the output values of the Key Performance Indicators for
the simulation runs are influenced, and will thus be slightly different for every run. The implication of
this introduction of stochastic factors in the model is that the output values of every simulation run
are not the same. This means that a simulation setting needs to be run different times to find reliable
‘average’ results. The simulation settings that will be used in the simulation study, and how the
simulations are run, are explained in more detail in section 5.1.
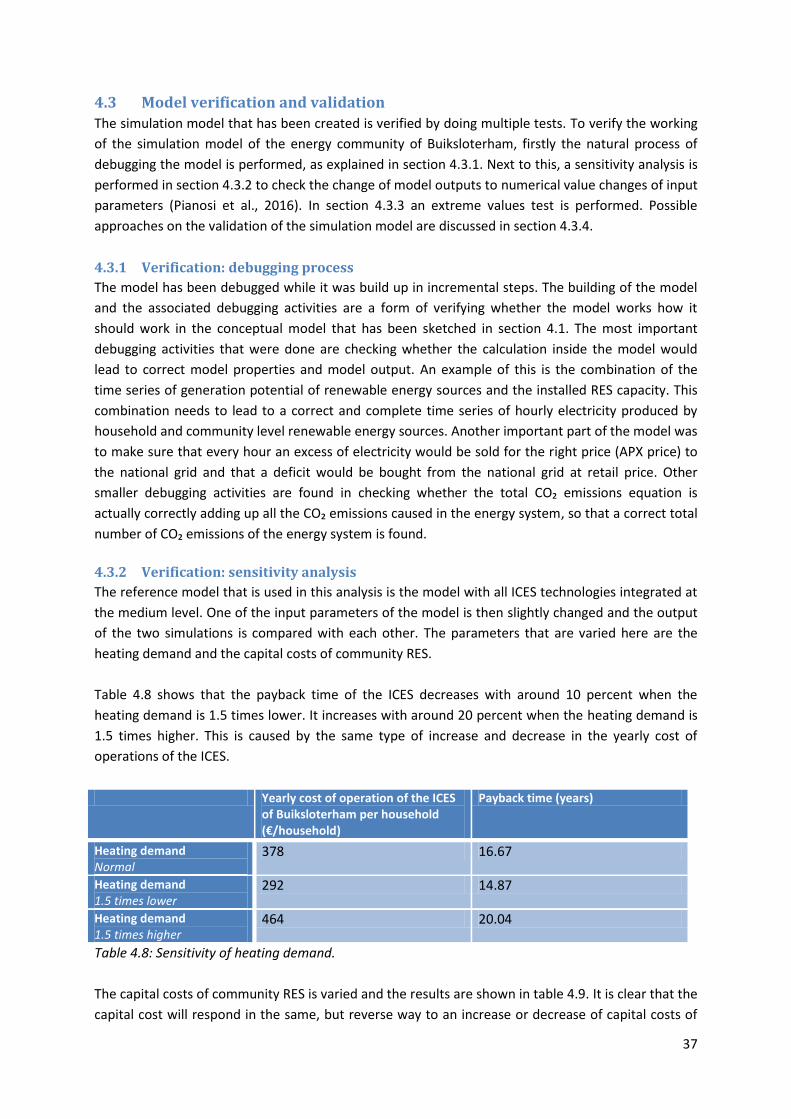
37
4.3 Model verification and validation
The simulation model that has been created is verified by doing multiple tests. To verify the working
of the simulation model of the energy community of Buiksloterham, firstly the natural process of
debugging the model is performed, as explained in section 4.3.1. Next to this, a sensitivity analysis is
performed in section 4.3.2 to check the change of model outputs to numerical value changes of input
parameters (Pianosi et al., 2016). In section 4.3.3 an extreme values test is performed. Possible
approaches on the validation of the simulation model are discussed in section 4.3.4.
4.3.1 Verification: debugging process
The model has been debugged while it was build up in incremental steps. The building of the model
and the associated debugging activities are a form of verifying whether the model works how it
should work in the conceptual model that has been sketched in section 4.1. The most important
debugging activities that were done are checking whether the calculation inside the model would
lead to correct model properties and model output. An example of this is the combination of the
time series of generation potential of renewable energy sources and the installed RES capacity. This
combination needs to lead to a correct and complete time series of hourly electricity produced by
household and community level renewable energy sources. Another important part of the model was
to make sure that every hour an excess of electricity would be sold for the right price (APX price) to
the national grid and that a deficit would be bought from the national grid at retail price. Other
smaller debugging activities are found in checking whether the total CO₂ emissions equation is
actually correctly adding up all the CO₂ emissions caused in the energy system, so that a correct total
number of CO₂ emissions of the energy system is found.
4.3.2 Verification: sensitivity analysis
The reference model that is used in this analysis is the model with all ICES technologies integrated at
the medium level. One of the input parameters of the model is then slightly changed and the output
of the two simulations is compared with each other. The parameters that are varied here are the
heating demand and the capital costs of community RES.
Table 4.8 shows that the payback time of the ICES decreases with around 10 percent when the
heating demand is 1.5 times lower. It increases with around 20 percent when the heating demand is
1.5 times higher. This is caused by the same type of increase and decrease in the yearly cost of
operations of the ICES.
Yearly cost of operation of the ICES of Buiksloterham per household (€/household)
Payback time (years)
Heating demand Normal
378 16.67
Heating demand 1.5 times lower
292 14.87
Heating demand 1.5 times higher
464 20.04
Table 4.8: Sensitivity of heating demand.
The capital costs of community RES is varied and the results are shown in table 4.9. It is clear that the
capital cost will respond in the same, but reverse way to an increase or decrease of capital costs of
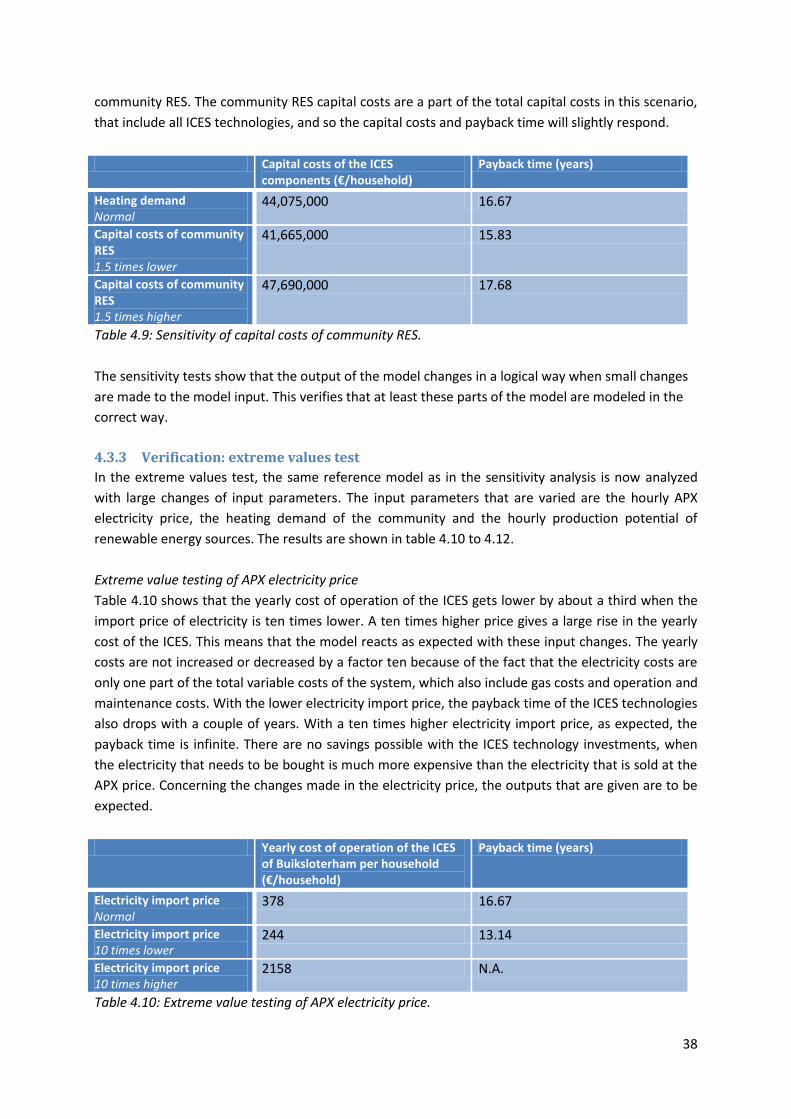
38
community RES. The community RES capital costs are a part of the total capital costs in this scenario,
that include all ICES technologies, and so the capital costs and payback time will slightly respond.
Capital costs of the ICES components (€/household)
Payback time (years)
Heating demand Normal
44,075,000 16.67
Capital costs of community RES 1.5 times lower
41,665,000 15.83
Capital costs of community RES 1.5 times higher
47,690,000 17.68
Table 4.9: Sensitivity of capital costs of community RES.
The sensitivity tests show that the output of the model changes in a logical way when small changes
are made to the model input. This verifies that at least these parts of the model are modeled in the
correct way.
4.3.3 Verification: extreme values test
In the extreme values test, the same reference model as in the sensitivity analysis is now analyzed
with large changes of input parameters. The input parameters that are varied are the hourly APX
electricity price, the heating demand of the community and the hourly production potential of
renewable energy sources. The results are shown in table 4.10 to 4.12.
Extreme value testing of APX electricity price
Table 4.10 shows that the yearly cost of operation of the ICES gets lower by about a third when the
import price of electricity is ten times lower. A ten times higher price gives a large rise in the yearly
cost of the ICES. This means that the model reacts as expected with these input changes. The yearly
costs are not increased or decreased by a factor ten because of the fact that the electricity costs are
only one part of the total variable costs of the system, which also include gas costs and operation and
maintenance costs. With the lower electricity import price, the payback time of the ICES technologies
also drops with a couple of years. With a ten times higher electricity import price, as expected, the
payback time is infinite. There are no savings possible with the ICES technology investments, when
the electricity that needs to be bought is much more expensive than the electricity that is sold at the
APX price. Concerning the changes made in the electricity price, the outputs that are given are to be
expected.
Yearly cost of operation of the ICES of Buiksloterham per household (€/household)
Payback time (years)
Electricity import price Normal
378 16.67
Electricity import price 10 times lower
244 13.14
Electricity import price 10 times higher
2158 N.A.
Table 4.10: Extreme value testing of APX electricity price.
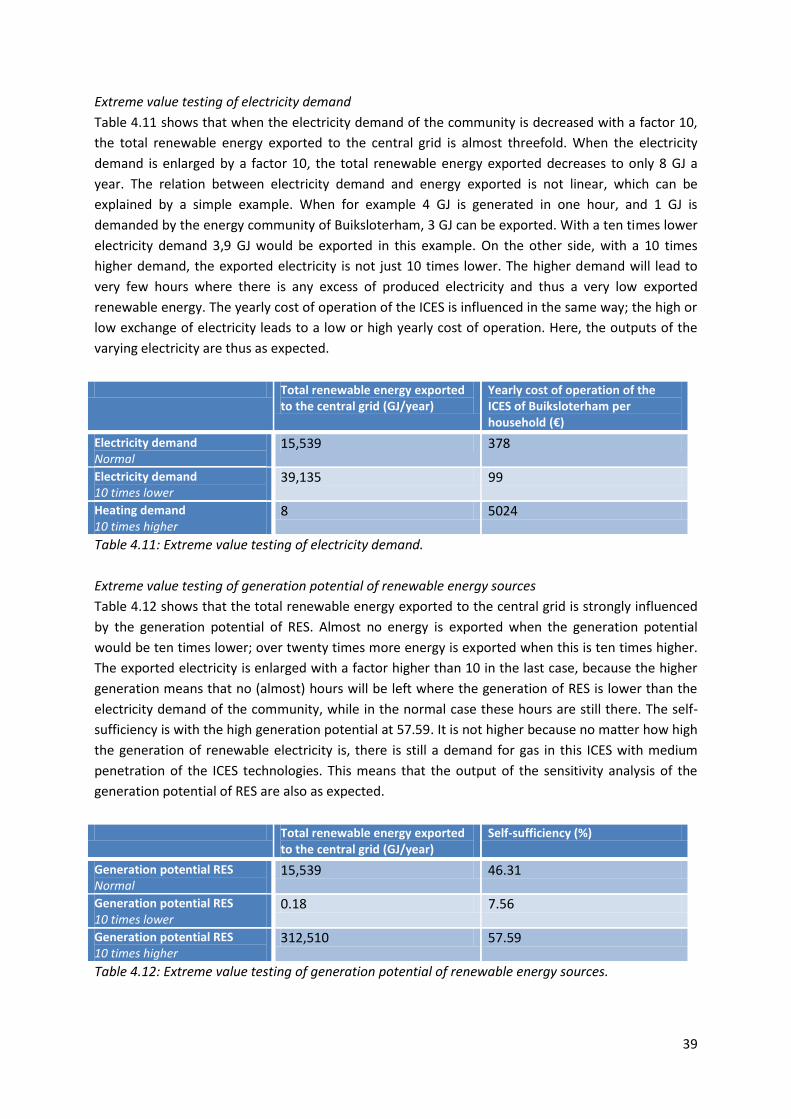
39
Extreme value testing of electricity demand
Table 4.11 shows that when the electricity demand of the community is decreased with a factor 10,
the total renewable energy exported to the central grid is almost threefold. When the electricity
demand is enlarged by a factor 10, the total renewable energy exported decreases to only 8 GJ a
year. The relation between electricity demand and energy exported is not linear, which can be
explained by a simple example. When for example 4 GJ is generated in one hour, and 1 GJ is
demanded by the energy community of Buiksloterham, 3 GJ can be exported. With a ten times lower
electricity demand 3,9 GJ would be exported in this example. On the other side, with a 10 times
higher demand, the exported electricity is not just 10 times lower. The higher demand will lead to
very few hours where there is any excess of produced electricity and thus a very low exported
renewable energy. The yearly cost of operation of the ICES is influenced in the same way; the high or
low exchange of electricity leads to a low or high yearly cost of operation. Here, the outputs of the
varying electricity are thus as expected.
Total renewable energy exported to the central grid (GJ/year)
Yearly cost of operation of the ICES of Buiksloterham per household (€)
Electricity demand Normal
15,539 378
Electricity demand 10 times lower
39,135 99
Heating demand 10 times higher
8 5024
Table 4.11: Extreme value testing of electricity demand.
Extreme value testing of generation potential of renewable energy sources
Table 4.12 shows that the total renewable energy exported to the central grid is strongly influenced
by the generation potential of RES. Almost no energy is exported when the generation potential
would be ten times lower; over twenty times more energy is exported when this is ten times higher.
The exported electricity is enlarged with a factor higher than 10 in the last case, because the higher
generation means that no (almost) hours will be left where the generation of RES is lower than the
electricity demand of the community, while in the normal case these hours are still there. The self-
sufficiency is with the high generation potential at 57.59. It is not higher because no matter how high
the generation of renewable electricity is, there is still a demand for gas in this ICES with medium
penetration of the ICES technologies. This means that the output of the sensitivity analysis of the
generation potential of RES are also as expected.
Total renewable energy exported to the central grid (GJ/year)
Self-sufficiency (%)
Generation potential RES Normal
15,539 46.31
Generation potential RES 10 times lower
0.18 7.56
Generation potential RES 10 times higher
312,510 57.59
Table 4.12: Extreme value testing of generation potential of renewable energy sources.
40
4.3.4 Model validation
The validation of the simulation model is not performed in this research, however, this could be a
valuable addition The validation of a model that simulates the future could be done in a couple of
ways. A first type of validation that could be suitable for this simulation is structural validation. In
structural validation, the structure of a simulation model is evaluated by comparing this to the
structure of the system that is being simulated (Pascual, 2015). As the real characteristics of an ICES
in 2034 are not information that is at hand, the model structure would be compared to knowledge
combined with expectances and assumptions about an energy system in 2034.
Another validation method that could be used is expert validation. Here, expert opinions are asked
about mainly the conceptual model to gather information about the correctness in which the model
is simulated is. Experts in the field of energy communities or energy systems in general can have
important insights in the system that is modeled. Different type of experts could be asked for
interviews to evaluate whether the model is reasonable for its purpose. Considering the type of
research that is performed, experts in the field of for instance renewable energy sources, energy
markets, energy supply systems and energy communities can be consulted.
The model study of this research has an exploratory purpose and is not able to be compared to
actual data of an existing ICES in the future. What therefore could also be valuable is to perform
cross validation (Kohavi, 1995). A suitable type of cross validation here would be to make use of
another simulation model that, like the simulation model in this research, also simulates an energy
system in a future point in time. This other model could be seen as a model that predicts the output
values of an energy system in the future. With this, the simulation model of Buiksloterham could be
tested when comparing the predicted results of the other model to the simulation results of the
Buiksloterham model. The difficulty in doing this is that a simulation model that is very similar to the
simulation model of Buiksloterham is required. With the stochastic inputs that the simulation model
has, this will even be more complicated. A more simplistic way of cross validation could therefore to
find a similar model on developed future energy systems and compare this to the simulation model
of Buiksloterham. The differences and similarities between the models can be input to say something
about the validity of the Buiksloterham model.
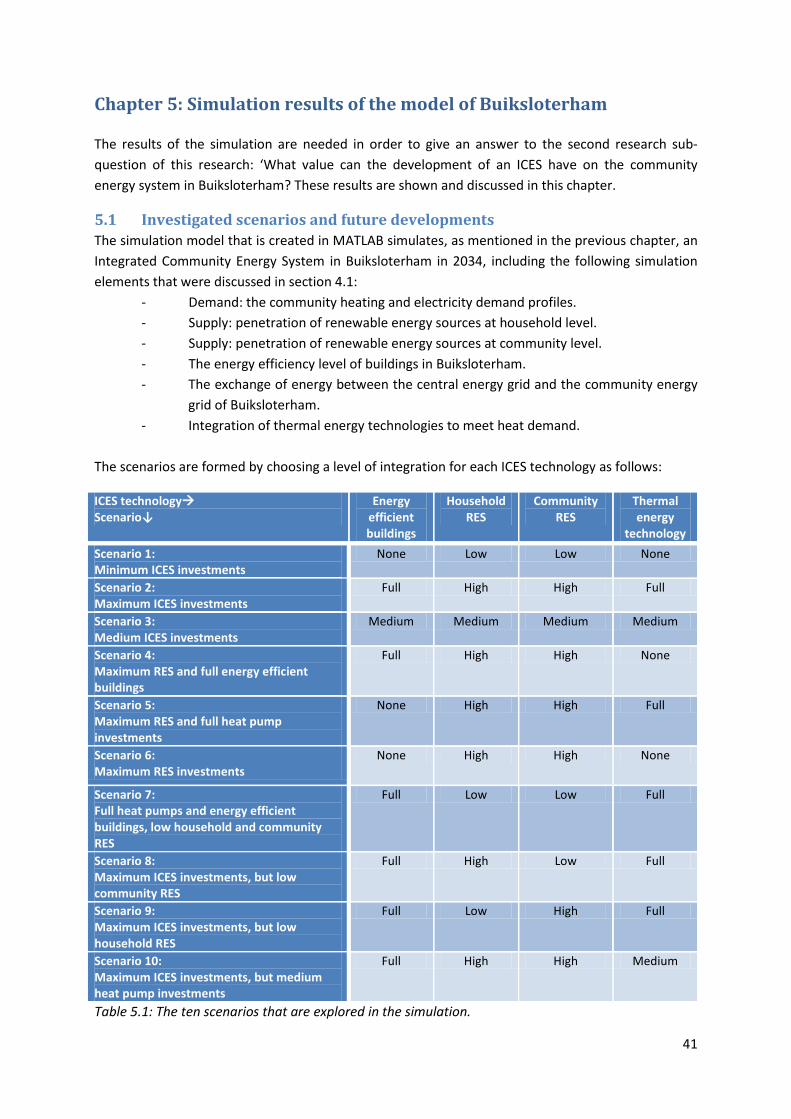
41
Chapter 5: Simulation results of the model of Buiksloterham
The results of the simulation are needed in order to give an answer to the second research sub-
question of this research: ‘What value can the development of an ICES have on the community
energy system in Buiksloterham? These results are shown and discussed in this chapter.
5.1 Investigated scenarios and future developments
The simulation model that is created in MATLAB simulates, as mentioned in the previous chapter, an
Integrated Community Energy System in Buiksloterham in 2034, including the following simulation
elements that were discussed in section 4.1:
- Demand: the community heating and electricity demand profiles.
- Supply: penetration of renewable energy sources at household level.
- Supply: penetration of renewable energy sources at community level.
- The energy efficiency level of buildings in Buiksloterham.
- The exchange of energy between the central energy grid and the community energy
grid of Buiksloterham.
- Integration of thermal energy technologies to meet heat demand.
The scenarios are formed by choosing a level of integration for each ICES technology as follows:
ICES technology Scenario↓
Energy efficient buildings
Household RES
Community RES
Thermal energy
technology
Scenario 1: Minimum ICES investments
None Low Low None
Scenario 2: Maximum ICES investments
Full High High Full
Scenario 3: Medium ICES investments
Medium Medium Medium Medium
Scenario 4: Maximum RES and full energy efficient buildings
Full High High None
Scenario 5: Maximum RES and full heat pump investments
None High High Full
Scenario 6: Maximum RES investments
None High High None
Scenario 7: Full heat pumps and energy efficient buildings, low household and community RES
Full Low Low Full
Scenario 8: Maximum ICES investments, but low community RES
Full High Low Full
Scenario 9: Maximum ICES investments, but low household RES
Full Low High Full
Scenario 10: Maximum ICES investments, but medium heat pump investments
Full High High Medium
Table 5.1: The ten scenarios that are explored in the simulation.
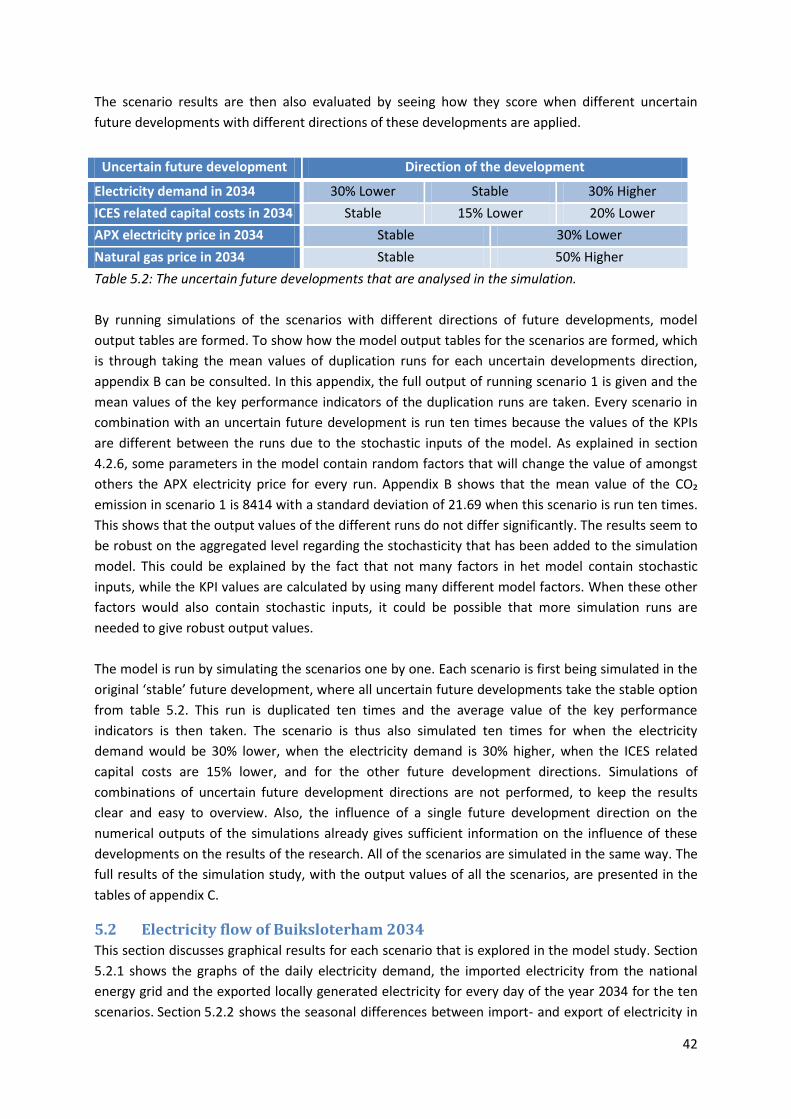
42
The scenario results are then also evaluated by seeing how they score when different uncertain
future developments with different directions of these developments are applied.
Table 5.2: The uncertain future developments that are analysed in the simulation.
By running simulations of the scenarios with different directions of future developments, model
output tables are formed. To show how the model output tables for the scenarios are formed, which
is through taking the mean values of duplication runs for each uncertain developments direction,
appendix B can be consulted. In this appendix, the full output of running scenario 1 is given and the
mean values of the key performance indicators of the duplication runs are taken. Every scenario in
combination with an uncertain future development is run ten times because the values of the KPIs
are different between the runs due to the stochastic inputs of the model. As explained in section
4.2.6, some parameters in the model contain random factors that will change the value of amongst
others the APX electricity price for every run. Appendix B shows that the mean value of the CO₂
emission in scenario 1 is 8414 with a standard deviation of 21.69 when this scenario is run ten times.
This shows that the output values of the different runs do not differ significantly. The results seem to
be robust on the aggregated level regarding the stochasticity that has been added to the simulation
model. This could be explained by the fact that not many factors in het model contain stochastic
inputs, while the KPI values are calculated by using many different model factors. When these other
factors would also contain stochastic inputs, it could be possible that more simulation runs are
needed to give robust output values.
The model is run by simulating the scenarios one by one. Each scenario is first being simulated in the
original ‘stable’ future development, where all uncertain future developments take the stable option
from table 5.2. This run is duplicated ten times and the average value of the key performance
indicators is then taken. The scenario is thus also simulated ten times for when the electricity
demand would be 30% lower, when the electricity demand is 30% higher, when the ICES related
capital costs are 15% lower, and for the other future development directions. Simulations of
combinations of uncertain future development directions are not performed, to keep the results
clear and easy to overview. Also, the influence of a single future development direction on the
numerical outputs of the simulations already gives sufficient information on the influence of these
developments on the results of the research. All of the scenarios are simulated in the same way. The
full results of the simulation study, with the output values of all the scenarios, are presented in the
tables of appendix C.
5.2 Electricity flow of Buiksloterham 2034
This section discusses graphical results for each scenario that is explored in the model study. Section
5.2.1 shows the graphs of the daily electricity demand, the imported electricity from the national
energy grid and the exported locally generated electricity for every day of the year 2034 for the ten
scenarios. Section 5.2.2 shows the seasonal differences between import- and export of electricity in
Uncertain future development Direction of the development
Electricity demand in 2034 30% Lower Stable 30% Higher
ICES related capital costs in 2034 Stable 15% Lower 20% Lower
APX electricity price in 2034 Stable 30% Lower
Natural gas price in 2034 Stable 50% Higher
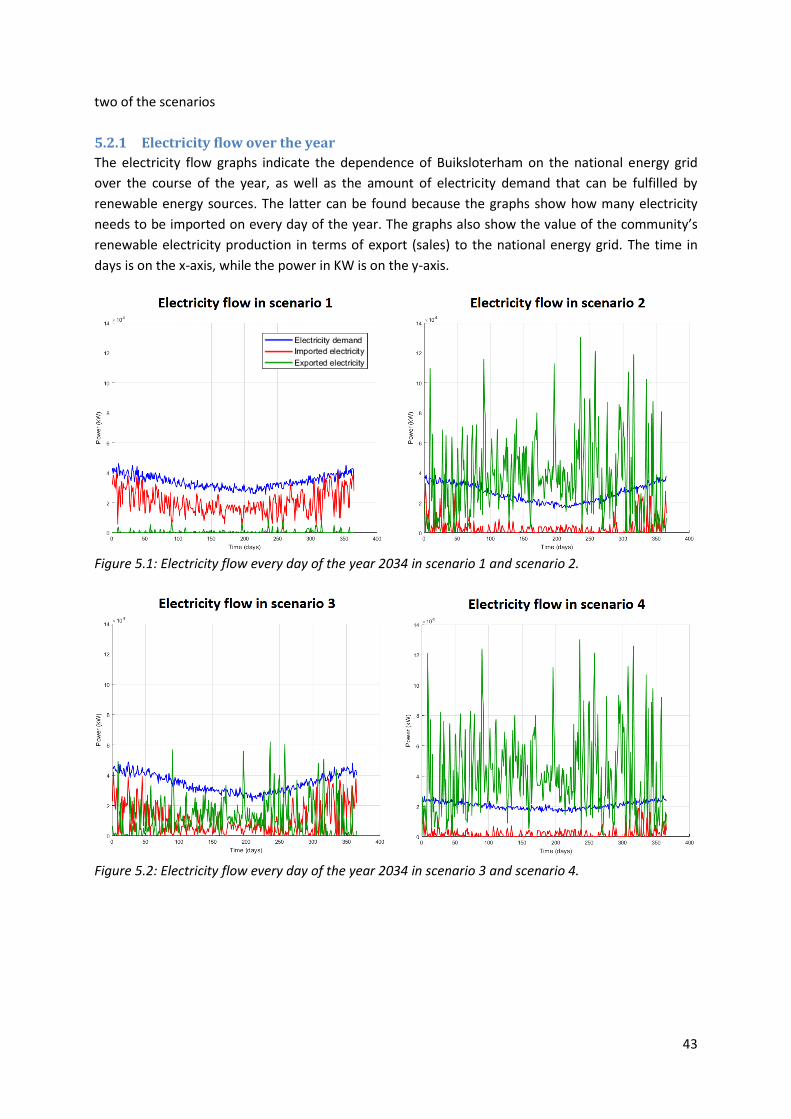
43
two of the scenarios
5.2.1 Electricity flow over the year
The electricity flow graphs indicate the dependence of Buiksloterham on the national energy grid
over the course of the year, as well as the amount of electricity demand that can be fulfilled by
renewable energy sources. The latter can be found because the graphs show how many electricity
needs to be imported on every day of the year. The graphs also show the value of the community’s
renewable electricity production in terms of export (sales) to the national energy grid. The time in
days is on the x-axis, while the power in KW is on the y-axis.
Figure 5.1: Electricity flow every day of the year 2034 in scenario 1 and scenario 2.
Figure 5.2: Electricity flow every day of the year 2034 in scenario 3 and scenario 4.
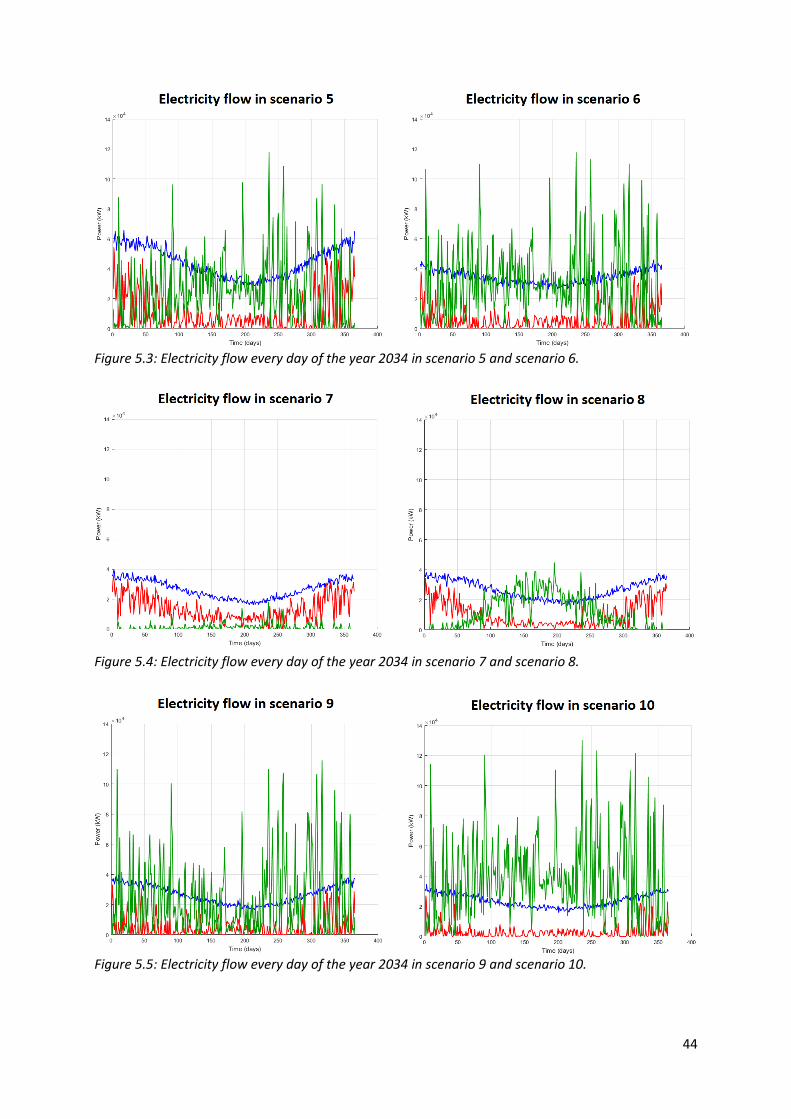
44
Figure 5.3: Electricity flow every day of the year 2034 in scenario 5 and scenario 6.
Figure 5.4: Electricity flow every day of the year 2034 in scenario 7 and scenario 8.
Figure 5.5: Electricity flow every day of the year 2034 in scenario 9 and scenario 10.
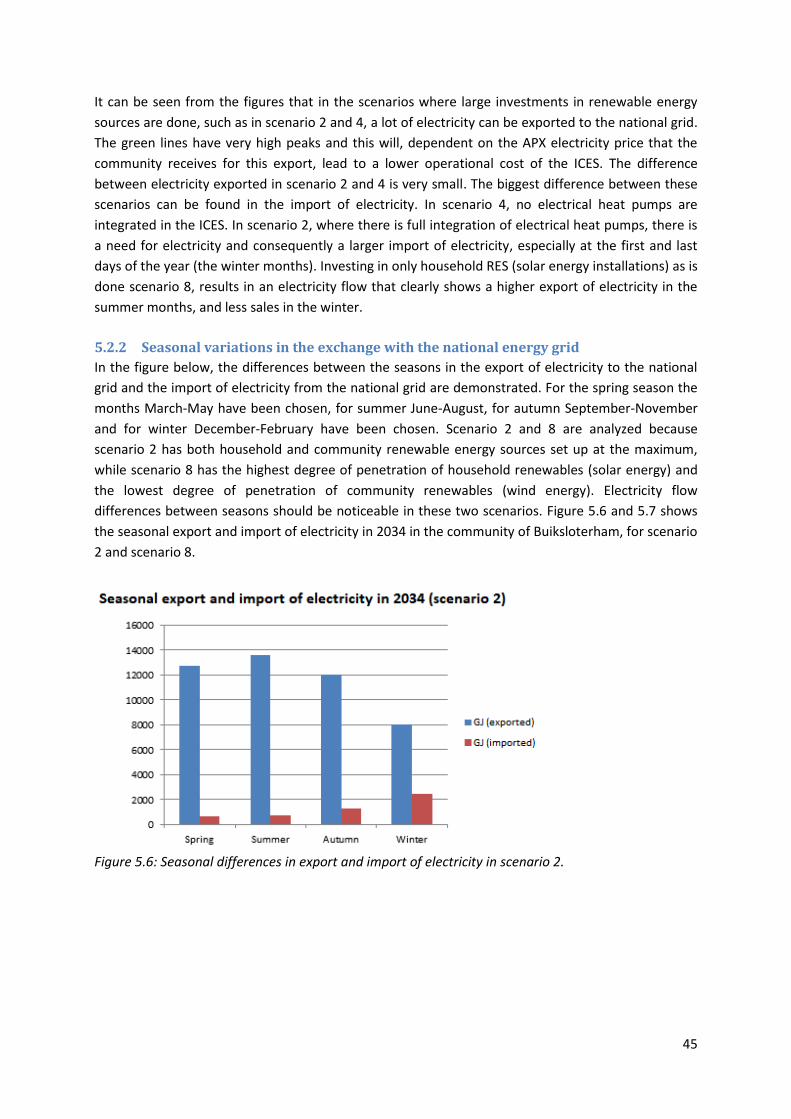
45
It can be seen from the figures that in the scenarios where large investments in renewable energy
sources are done, such as in scenario 2 and 4, a lot of electricity can be exported to the national grid.
The green lines have very high peaks and this will, dependent on the APX electricity price that the
community receives for this export, lead to a lower operational cost of the ICES. The difference
between electricity exported in scenario 2 and 4 is very small. The biggest difference between these
scenarios can be found in the import of electricity. In scenario 4, no electrical heat pumps are
integrated in the ICES. In scenario 2, where there is full integration of electrical heat pumps, there is
a need for electricity and consequently a larger import of electricity, especially at the first and last
days of the year (the winter months). Investing in only household RES (solar energy installations) as is
done scenario 8, results in an electricity flow that clearly shows a higher export of electricity in the
summer months, and less sales in the winter.
5.2.2 Seasonal variations in the exchange with the national energy grid In the figure below, the differences between the seasons in the export of electricity to the national
grid and the import of electricity from the national grid are demonstrated. For the spring season the
months March-May have been chosen, for summer June-August, for autumn September-November
and for winter December-February have been chosen. Scenario 2 and 8 are analyzed because
scenario 2 has both household and community renewable energy sources set up at the maximum,
while scenario 8 has the highest degree of penetration of household renewables (solar energy) and
the lowest degree of penetration of community renewables (wind energy). Electricity flow
differences between seasons should be noticeable in these two scenarios. Figure 5.6 and 5.7 shows
the seasonal export and import of electricity in 2034 in the community of Buiksloterham, for scenario
2 and scenario 8.
Figure 5.6: Seasonal differences in export and import of electricity in scenario 2.
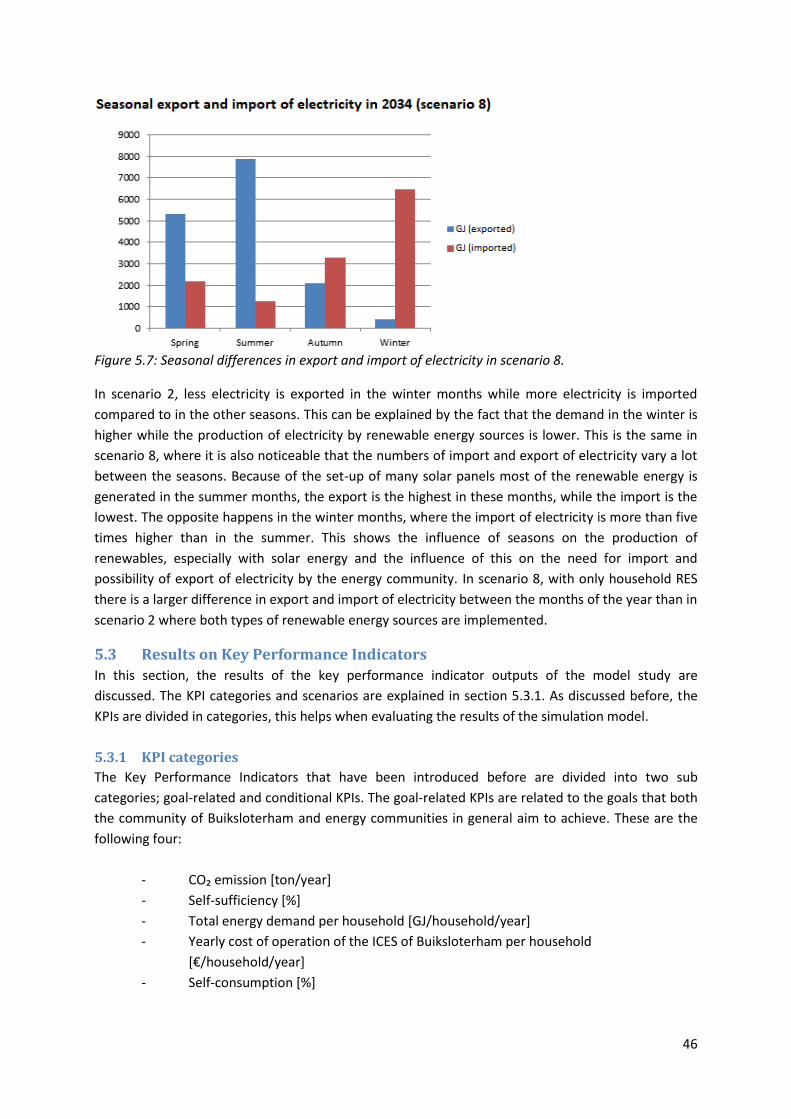
46
Figure 5.7: Seasonal differences in export and import of electricity in scenario 8.
In scenario 2, less electricity is exported in the winter months while more electricity is imported
compared to in the other seasons. This can be explained by the fact that the demand in the winter is
higher while the production of electricity by renewable energy sources is lower. This is the same in
scenario 8, where it is also noticeable that the numbers of import and export of electricity vary a lot
between the seasons. Because of the set-up of many solar panels most of the renewable energy is
generated in the summer months, the export is the highest in these months, while the import is the
lowest. The opposite happens in the winter months, where the import of electricity is more than five
times higher than in the summer. This shows the influence of seasons on the production of
renewables, especially with solar energy and the influence of this on the need for import and
possibility of export of electricity by the energy community. In scenario 8, with only household RES
there is a larger difference in export and import of electricity between the months of the year than in
scenario 2 where both types of renewable energy sources are implemented.
5.3 Results on Key Performance Indicators
In this section, the results of the key performance indicator outputs of the model study are
discussed. The KPI categories and scenarios are explained in section 5.3.1. As discussed before, the
KPIs are divided in categories, this helps when evaluating the results of the simulation model.
5.3.1 KPI categories
The Key Performance Indicators that have been introduced before are divided into two sub
categories; goal-related and conditional KPIs. The goal-related KPIs are related to the goals that both
the community of Buiksloterham and energy communities in general aim to achieve. These are the
following four:
- CO₂ emission [ton/year]
- Self-sufficiency [%]
- Total energy demand per household [GJ/household/year]
- Yearly cost of operation of the ICES of Buiksloterham per household
*€/household/year]
- Self-consumption [%]

47
The other KPIs can be considered as conditions that need to be kept as less disadvantageous as
possible. They are not related to goals of energy community development. The output of the
following two conditional KPIs are investigated in this section:
- Capital costs of the ICES components *€+
- Payback time of ICES related capital costs [years]
The maximum line capacity is not discussed in this chapter, as its value is never too high in any of the
simulation, however it can differ largely between the scenarios and uncertain future developments.
The next section 5.3.2 presents the results of the scenario exploration under a ‘stable future
development’. For the readability of this part, table 5.3 again shows the scenarios that are used in
this simulation study with a description of their choice of ICES components penetration level. The
influence of the uncertain future developments on the key performance indicator outputs of the
model study are taken into account in section 5.4. The full results of the simulation study can be
found in Appendix C, where the numerical output of each of the scenarios, under each of the
uncertain future development directions is displayed.
Scenario Description
1 Minimum ICES investments
2 Maximum ICES investments
3 Medium ICES investments
4 Maximum RES and full energy efficient buildings
5 Maximum RES and full heat pump investments
6 Maximum RES investments
7 Full heat pumps and energy efficient buildings, low household and community RES
8 Maximum ICES investments, but low community RES
9 Maximum ICES investments, but low household RES
10 Maximum ICES investments, but medium heat pump investments
Table 5.3: The scenarios of the simulation study with their description.
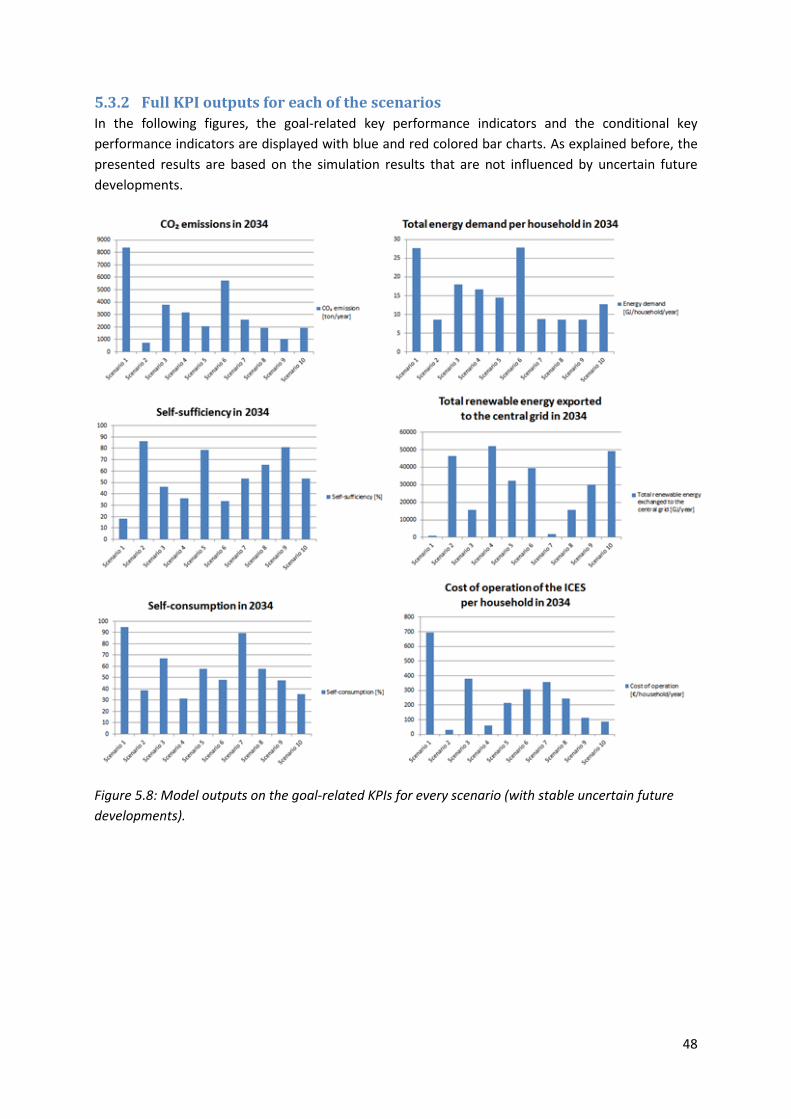
48
5.3.2 Full KPI outputs for each of the scenarios
In the following figures, the goal-related key performance indicators and the conditional key
performance indicators are displayed with blue and red colored bar charts. As explained before, the
presented results are based on the simulation results that are not influenced by uncertain future
developments.
Figure 5.8: Model outputs on the goal-related KPIs for every scenario (with stable uncertain future
developments).
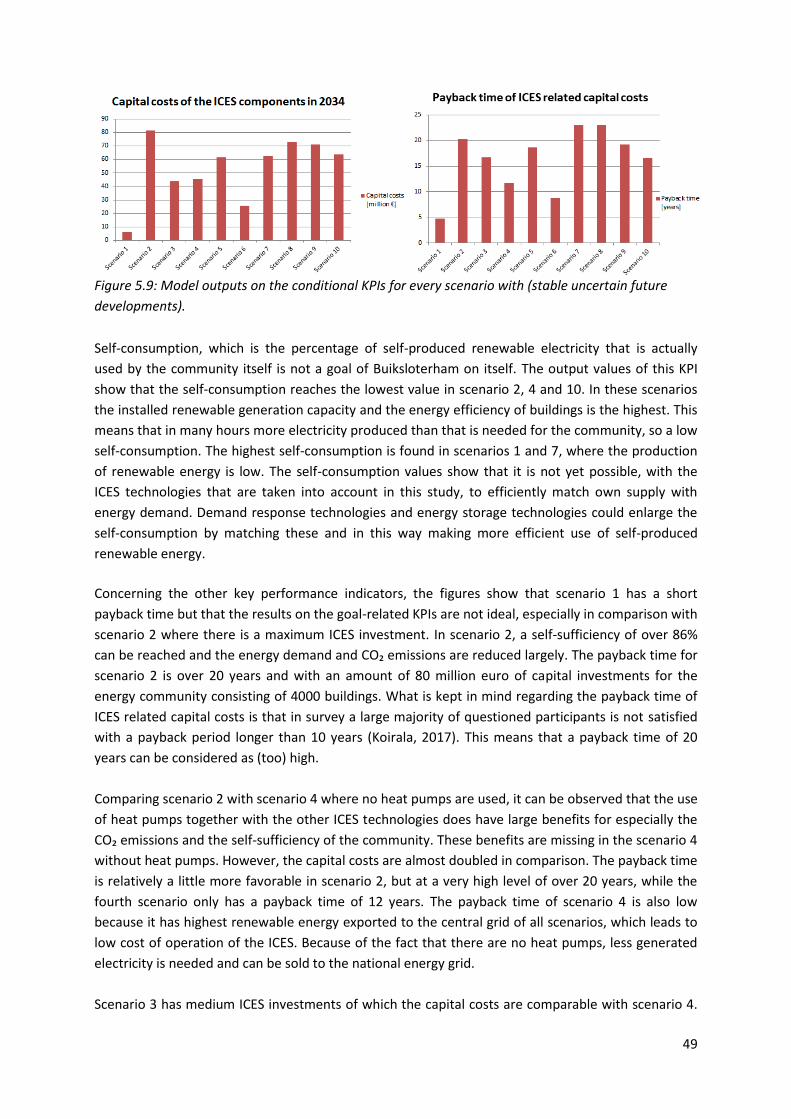
49
Figure 5.9: Model outputs on the conditional KPIs for every scenario with (stable uncertain future
developments).
Self-consumption, which is the percentage of self-produced renewable electricity that is actually
used by the community itself is not a goal of Buiksloterham on itself. The output values of this KPI
show that the self-consumption reaches the lowest value in scenario 2, 4 and 10. In these scenarios
the installed renewable generation capacity and the energy efficiency of buildings is the highest. This
means that in many hours more electricity produced than that is needed for the community, so a low
self-consumption. The highest self-consumption is found in scenarios 1 and 7, where the production
of renewable energy is low. The self-consumption values show that it is not yet possible, with the
ICES technologies that are taken into account in this study, to efficiently match own supply with
energy demand. Demand response technologies and energy storage technologies could enlarge the
self-consumption by matching these and in this way making more efficient use of self-produced
renewable energy.
Concerning the other key performance indicators, the figures show that scenario 1 has a short
payback time but that the results on the goal-related KPIs are not ideal, especially in comparison with
scenario 2 where there is a maximum ICES investment. In scenario 2, a self-sufficiency of over 86%
can be reached and the energy demand and CO₂ emissions are reduced largely. The payback time for
scenario 2 is over 20 years and with an amount of 80 million euro of capital investments for the
energy community consisting of 4000 buildings. What is kept in mind regarding the payback time of
ICES related capital costs is that in survey a large majority of questioned participants is not satisfied
with a payback period longer than 10 years (Koirala, 2017). This means that a payback time of 20
years can be considered as (too) high.
Comparing scenario 2 with scenario 4 where no heat pumps are used, it can be observed that the use
of heat pumps together with the other ICES technologies does have large benefits for especially the
CO₂ emissions and the self-sufficiency of the community. These benefits are missing in the scenario 4
without heat pumps. However, the capital costs are almost doubled in comparison. The payback time
is relatively a little more favorable in scenario 2, but at a very high level of over 20 years, while the
fourth scenario only has a payback time of 12 years. The payback time of scenario 4 is also low
because it has highest renewable energy exported to the central grid of all scenarios, which leads to
low cost of operation of the ICES. Because of the fact that there are no heat pumps, less generated
electricity is needed and can be sold to the national energy grid.
Scenario 3 has medium ICES investments of which the capital costs are comparable with scenario 4.
50
The results on the KPIs are however less beneficial and the payback time is much higher in scenario
3. This suggests that, comparing the capital investments of both scenarios, investing this first in
energy efficient buildings and renewable energy sources, instead of investing in heat pumps, is more
beneficial. What can be seen here is that heat pumps can have a large value for the energy system,
but only when combined with other large investments in renewable energy sources and energy
efficient buildings. The capital investment of this technology is high compared to the other
technologies.
Not investing in energy efficient buildings, but maximum investments in the other ICES technologies,
as done in scenario 5, does not give better results than doing maximum ICES investments. The
investment costs are a little lower than in scenario 2 with maximum ICES investments. The scores on
the KPIs are, except for the self-sufficiency level of the community, a lot less positive. The CO₂
emissions and the energy demand per household are still rather high. It is therefore interesting to
see the results when heat pumps or any of the installed renewable energy sources are abolished
from the scenario of maximum ICES related technology investments.
Only investing in household and community renewable energy sources, as done in scenario 6, does
bring CO₂ emissions down a little, but the energy demand per household is still very high. The self-
sufficiency is only at little over 30%, which is the second lowest of the scenario results, after
minimum ICES investment. The investments costs are rather low and take less than 9 years to pay
back, but it seems that both energy efficient buildings and electrical heat pumps are needed to give
good results on the goals of Buiksloterham, which are lower CO₂ emissions, lower energy demand
and higher self-sufficiency.
In scenarios 7, 8 and 9, the capital costs as well as the payback time of these scenarios are very high.
This is because the cost of operation of the ICES is still relatively high here. In scenario 7 there are
low investments in renewable energy sources and high investments and heat pumps and energy
efficient buildings. It can be seen that to earn back the investment, a very important factor is the
generation of renewable energy, as this makes the community be able to not have to pay for
imported electricity and instead sell their own electricity. The results on the goal related KPIs are
good in scenarios 7 to 9. Without much renewable generation capacity, relatively low CO₂ emissions
are still reached, as well as a low energy demand per household. However, the investment costs are
relatively high. Scenario 8 and 9 show that out of the two types of renewable energy source
generation, community energy (wind) is the most beneficial. This is because the relatively lower
investment costs of wind energy and the better generation possibility of this energy source. Scenario
9 scores better on the goal-related KPIs. Because of the lower cost of operation of scenario 9; the
payback time of scenario 9 is also lower than scenario 8. However the payback time and the capital
cost investments are still relatively high compared to the other scenarios. The scenarios with a lower
RES capacity have a relatively high cost of energy grid operation because more electricity has to be
bought from the national grid and less electricity is sold. This results in higher payback times of the
ICES.
To see the effect of heat pumps better, and have an alternative for the high investments costs of
scenario 2, scenario 10 shows the results of an ICES with half of the households owning electrical
heat pumps. The payback time of this scenario is 16.6 years and the capital costs are 63 million euros
51
instead of 80 million euros. However, the CO₂ emissions are over two times higher and the self-
sufficiency is only 53 percent compared to the more than 86% self-sufficiency in scenario 2.
Comparing costs and benefits of these two scenarios with each other, it seems that the full
integration of electrical heat pumps, in combination with full integration of the other ICES
technologies, is relatively more beneficial than the medium integration of heat pumps in scenario 10.
Comparing scenarios 7 to 9 to scenario 4 and scenario 6, where no heat pumps are installed, shows
that heat pumps are of importance to bring up the self-sufficiency of the ICES, but cause large
investments cost and payback times. Scenario 4 and 6 have a more appealing payback time of around
10 years. Scenario 6, with only household and community RES at the maximum, has a rather low
investment costs but due to the relatively high variable costs of the energy supply, the payback time
is around 8 years, compared to 12 years of scenario 4. The almost two times larger investments of
scenario 4 bring better scores on lowering the energy demand and CO₂ emissions and on the self-
sufficiency, but has a higher payback time than scenario 6. The integration of energy efficient
buildings on top of maximum RES investments has most effect on CO₂ emissions, which are almost
two times lower compared to scenario 6. Moreover, the self-sufficiency is some percent higher in
scenario 4. Investing in RES will make the self-sufficiency increase more than with energy efficient
buildings integration, but the real profits here are made with investments in electrical heat pumps in
combination with installed renewable energy sources.
5.4 Uncertain future developments
The most significant influences of uncertain future developments on the key performance indicators
are discussed in this section. To read the full results of all the scenarios and under the influence of
the uncertain future developments, see appendix C.
5.4.1 Electricity demand change
This uncertain future development can make the electricity demand 30% lower or 30% higher. A
lower electricity demand results in lower CO₂ emissions, especially in scenarios where much is
invested in ICES technologies. In scenario 2, where maximal ICES investments are done, the emissions
are almost two times lower with an electricity demand that is 30% lower than the standard electricity
demand. In scenario 6, where minimal investments are in place, the emissions are only 20% lower
when having a 30% lower electricity demand. On the other side, when the electricity demand is
higher, the CO₂ emissions are also higher and even higher in scenarios with large ICES investments.
The scenarios that include investments in heat pumps are also more influenced by a change in the
electricity demand. This can be explained because in these scenarios the demand for electricity is
very high and even the highest investments in renewable generation are not always enough to cover
the electricity demand in the community. Here, a lower demand for electricity always has a direct
effect on the needed import of electricity from the national grid.
The self-sufficiency changes in the same way, but not in large percentages. However, it is notable
that in scenarios 4 and 6, where no heat pumps are present, the self-sufficiency decreases when the
electricity demand is lower and increases when the demand is higher. This can be explained by the
fact that in these scenarios the extra demand, which comes from electrical heat pumps, is not
present. There is however a large capacity of renewable generation capacity installed. For this
reason, when the electricity demand is a little higher, the renewables can still fulfil the total
electricity demand of the community. In the hours that a lot renewable energy generation is
52
possible, a smaller part of this energy is exported to the national grid and used in own energy
community.
The self-consumption of the community is lower when the electricity demand of the community is
lower, because more electricity will be exported instead of consumed by the own community when
this happens. For instance: the self-consumption decreases from 35 to 26 per cent in scenario 10.
The opposite is then obviously true for when the electricity demand is higher in the future; the self-
consumption then increases from 35 to 44 per cent in scenario 10.
The total energy demand per household increases or decreases with the increase and decrease of
the electricity demand. The total renewable energy exported to the central grid increases largely
with a decreasing electricity demand. In many scenarios the exported energy increases with over 30
per cent, when the electricity demand is decreased in the future developments. These increases or
decreases of sold energy to the national grid then have their influence on yearly cost of operation of
the ICES and thus on the payback time of the ICES related capital costs. In the scenarios where the
yearly cost of operation are relatively high, which is the case when less is invested on ICES
technologies, a lower or higher electricity demand can change these yearly costs per household from
695 euros down to 514 or up to 890 euros. These changes in costs can make the payback time go up
or down from one year to a couple of years in some scenarios. The maximum line capacity increases
with an increase in electricity demand in the scenarios where fewer investments are done in ICES. In
scenarios with high ICES investments, the line capacity increases with a decrease in electricity
demand, because more renewable generated electricity will then flow from the community to the
national energy grid. The capital costs of the ICES components are logically not influenced by a
change in electricity demand.
5.4.2 ICES capital costs change
The uncertain future development of the costs for ICES technologies does not influence many key
performance indicators. Logically, the capital costs of the ICES components are decreasing by 15 or
30 per cent. For the same reason, the payback time of the ICES related capital costs are also
decreasing by these percentages. Especially for long term investments as is the case in scenario 1,
where the maximum ICES investments are done, the influence of this is considerable. Here the
payback time of over 20 years could be brought down to almost 14 years.
5.4.3 APX electricity price change
A decrease of 20% in the APX electricity price has its effect on the yearly cost of operation of the
ICES per household and on the payback time of the ICES related capital costs. The scenarios in which
the generation of renewable energy sources by the community is high, which is the case when the
capacity of renewable energy sources installed is high, are influenced the most. When the yearly
generation of renewables is high, this means that with a lower APX electricity price, less money is
earned by selling this electricity to the national grid. The import costs are also lower, but this effect is
much lower because the electricity price that is paid for import is only build up for a small portion by
the APX price and much more by fees and taxes, as is explained in the previous chapter. In scenario
2, with maximum ICES investments, the yearly cost of operation of the ICES are over three times
higher when the APX electricity price is 20% lower than the standard (current) price. This will make
the payback time of the capital costs increase with over one and a half year.

53
5.4.4 Natural gas price change
An increase of the natural gas price with 50% will obviously firstly only have an influence on the
yearly cost of operation of the ICES per household in the scenarios where heat pumps are not fully
used. In these scenarios there is namely no demand for gas for heating purposes. In scenario 4,
where there are maximum investments in ICES technologies, except for heat pumps, the yearly costs
of operation are almost three times higher when the natural gas price is 50% higher. This then causes
the payback time of the ICES related capital costs to go up from 11.67 to 12.64 years.
What can be seen from the uncertain future developments is that only some of the key performance
indicators are influenced by these developments and that these influences vary largely per scenario.
Some future developments have larger influences than others. For example the electricity demand
can have a large impact on the CO₂ emissions when the number triggers the possibility of fulfilling or
not fulfilling the own demand with renewables. Changes that influence the KPIs, such as
developments in ICES capital costs, can have large impacts when the number that they influence is
already high. An example of this is a high payback time in some of the scenarios, which will relatively
be more affected by lower capital costs than scenarios with a lower payback time. The developments
are not having game changing influences on the simulation results in the way that they change the
ranking of scenarios in terms of favorableness. They do however change the results of a scenario in
positive and negative ways.
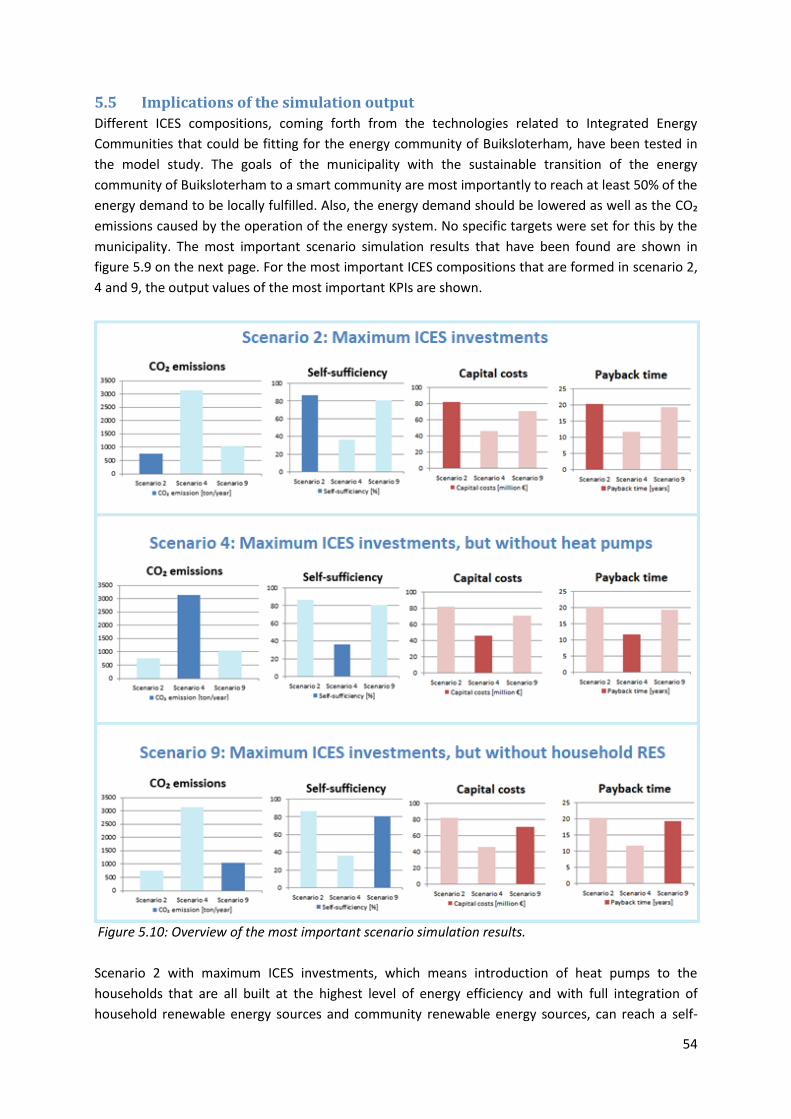
54
5.5 Implications of the simulation output
Different ICES compositions, coming forth from the technologies related to Integrated Energy
Communities that could be fitting for the energy community of Buiksloterham, have been tested in
the model study. The goals of the municipality with the sustainable transition of the energy
community of Buiksloterham to a smart community are most importantly to reach at least 50% of the
energy demand to be locally fulfilled. Also, the energy demand should be lowered as well as the CO₂
emissions caused by the operation of the energy system. No specific targets were set for this by the
municipality. The most important scenario simulation results that have been found are shown in
figure 5.9 on the next page. For the most important ICES compositions that are formed in scenario 2,
4 and 9, the output values of the most important KPIs are shown.
Figure 5.10: Overview of the most important scenario simulation results.
Scenario 2 with maximum ICES investments, which means introduction of heat pumps to the
households that are all built at the highest level of energy efficiency and with full integration of
household renewable energy sources and community renewable energy sources, can reach a self-

55
sufficiency of over 86% and very large CO₂ reductions as well as a low energy demand. These
investments require high investment costs. The investments will eventually pay back after 2034
because the costs of operation of the ICES are lower than what the cost of operation would be in an
energy system without ICES investments. The payback time for this ICES composition is 20 years. This
payback time 20 years can be influenced by the development of ICES capital costs, and could
therefore become 17 or 14 years in the most beneficial case. It could also be influenced by other
developments, namely a higher electricity demand or a lower APX price, to become 22 years; this is
less impactful. With the development of a lower electricity demand in the future this could be even
lower. This is however a high payback time, especially when comparing this to the 14% of the
respondents of a survey that is willing to have a payback time for ICES investments, longer than 10
years (Koirala, 2017). Investing at the maximum on all ICES technologies except for heat pumps, as is
the case in scenario 4 is at the same investment level as the scenario with medium ICES investments,
and has better results. Medium investments in all ICES technologies are less favorable; electrical heat
pumps are expensive and bring the best results when combined with a large capacity of renewable
energy sources so that renewable electricity can be used by the heat pumps.
When not investing in electrical heat pumps, but for the rest integrating ICES technology at the same
level as in the maximum investment scenario, scenario 4 is formed. The payback time and capital
investment costs here are significantly lower and could become closer to acceptable, especially with
some future developments of decreasing electricity demand and capital costs. The scenario scores
less beneficial on KPIs than the maximum ICES investments with or without household RES, the self
sufficiency of this scenario is at almost 36%. The payback time with stable future developments is at
less than 12 years. The ICES compositions without heat pumps show that the payback time of this
scenario is more appealing; around 10 years with stable future developments. It also shows that heat
pumps are important for especially the self-sufficiency of the ICES. As explained in section 5.3,
community RES investments are more effective on the KPI results than household RES investments.
For this reason, to find another less expensive alternative scenario for scenario 2, scenario 9 has a
low integration of household renewable energy sources. This scenario has a slightly lower payback
time and its capital costs are 15% lower than in scenario 2. The self-sufficiency and CO₂ emissions are
however slightly less beneficial. These two scenarios seem to, relatively to the costs, achieve the
same level of favorableness. The results on CO₂ emission can be influenced largely, especially by the
development of the electricity demand in the future. A 30% lower electricity demand would in the
scenarios with large ICES investments lead to an almost two times lower CO₂ emission. A lower
electricity price in the future can influence the payback time of large ICES investment scenarios. This
is because electricity sold by the community will receive a lower compensation. In none of the
scenarios, combined with uncertain future developments, the maximum line capacity is reached.
It is clear that to meet the goals of the municipality of Amsterdam regarding the smart transition of
Buiksloterham, the maximum ICES investments composition would give good results on the KPIs. The
integration of heat pumps lead to a high self-sufficiency and also lower CO₂ emissions, but the capital
costs of this option are very high. Some uncertain future developments could help this option to be
more applicable, but the option without heat pumps remains more affordable. The problem of this
latter option is that the latter option does not seem to reach the sustainable energy goals of the
community of Buiksloterham. What is clear is that a higher penetration of RES is always beneficial
and that when given the choice, community RES is more suited than household RES. As explained in

56
section 5.3.2, investing in energy efficiency buildings lowers the CO₂ emissions more than with RES
investments, relative to the investment costs of these technologies. Investments in RES decrease the
CO₂ emissions and also increase the self-sufficiency of the community. The choice to invest in heat
pumps could be made, but the risks of an acceptably high payback time are there. This is not certain
because of some future developments that can affect this, mainly only in a positive way. The option
without heat pumps gives less risk on acceptability, because the investment is almost two times
lower. The CO₂ emissions in this scenario 4 are however four times higher than in scenario 2.
Compared to scenario 2 the self-sufficiency drops from 86 per cent to 36 percent.
57
Chapter 6: Discussion
In the previous chapter, the results of the simulation study have been discussed. The purpose of this
part of the study was to find an answer to the second research question: What value can different
ICES compositions in different scenarios have for the community energy system in Buiksloterham in
2034? In order to answer this question best, it is necessary to look at how this research has been
performed. Before the simulation study was performed, data had to be found and assumptions had
to be made. Assumptions have been made throughout the entire research when choosing what to
simulate, how to simulate this to eventually give a valuable answer to the main research question. In
order to give a judgment about the value of the results that have been presented and discussed in
the previous chapter, it is important to reflect on the assumptions that have been made in
performing this research. This is also important to be able to see how the ICES approach, which is
investigated and applied to the case study of Buiksloterham in this research, can be used on other
energy communities.
The most important assumptions that have been made will be reflected upon in section 6.1. After
this, the value of the ICES approach for other energy communities is discussed in section 6.2. Finally,
section 6.3 discusses future research that could be done.
6.1 Assumptions
First of all, the simulation study is chosen to be performed at the community level. This is done
because of the fact that previous studies on ICES application focused on optimization of household
level ICES applications. The scenarios that have been investigated in the previous chapter are also
evaluated on the community level. For a community as a whole it is clearer which composition of
ICES technologies or which technology is more beneficial to a certain community goal than others.
The advantage with this is that recommendations can be given regarding the direction that a
municipality wants to follow, such as the municipality of Amsterdam in the case study of
Buiksloterham. This is less possible in studies that use the household level point of view, where
recommendations would mainly be given in order to help single households achieve their individual
goals in the energy community. The disadvantage of this point of view is that the feasibility of the
scenarios that have been simulated is more difficult to evaluate. In the end, the energy community is
formed by the end users of the energy grid. This means that they are the ones who actually need to
use the technologies and install them. The willingness of end users to invest in, and use the ICES
types is not in the scope of this research, as this research explores the energy community value of
the ICES approach on the higher level.
Assumptions have been made regarding the ICES technologies that were included in the simulation
model. Results are now shown for integration of four ICES technologies, namely energy efficient
building, community RES, household RES and electrical heat pumps. This means that in the value that
is assigned to the approach of ICES in this study, it must be noted that these technologies were
tested in the model, and no others. ICES is a broad approach that can include many technologies as
has been discussed in chapter 2. Because of pragmatic reasons such as time scope of the project, not
all technologies could be included. The conclusions on the value of ICES for energy communities is
thus limited to ICES compositions build upon the technologies that were included in this research. In
the ICES technologies that were included in this research some choices were also made. Electrical
58
heat pumps were chosen as a thermal energy technology option and wind turbines and solar panels
were chosen as renewable energy generation options. Especially other types of thermal energy
technologies, such as solar boilers could give other simulation results. The type of heat pump that is
used, which is explained in chapter 4, is also of importance in the final simulation results. The choice
that was made on these technologies was based on the fact that these technologies seemed best
fitting in the simulation model and are well-known and documented ICES related technologies. The
levels of integration of the technologies were chosen so that an exploration of what the effect is on
the performance of the energy system, when having a higher level of integration of one technology
or the other. Looking at the simulation results, the right amount of integration levels have been
chosen, as more scenarios would lead to a large number of scenarios that could make the results
section of the simulation less clear and there are still enough scenarios to get results from.
Concerning the uncertain future developments it can be seen that some of the developments that
were chosen indeed work through on many key performance indicators of the simulation study.
Especially electricity demand is important in this and can influence many of the KPIs. Both the
scenario where this demand goes higher and where this demand goes lower in the future are taken
into account. It was more difficult to find values for the future electricity demand, but sources were
found in chapter 4 to back the reasoning about the possible directions of this development. This
uncertain future development shows what direction the KPIs would go when this demand would be
lower or higher in the future, the exact numbers of less importance. For the APX price, finding values
for 2034 situations was relatively challenging. The assumption here was to look at different reports
that analyze the possible increase of RES in the Netherlands in the future and the influence of wind
power generation on the APX price in the Netherlands. It was also assumed that the same APX price
decrease would be true for the increase of solar energy. In this way the direction of a 20% decrease
of the APX price in 2034 was found. Another notable future development is the capital costs
development. This only has effect on the payback time and the capital investments of the energy
community; not many KPIs are influenced by this future development. This shows that some of the
uncertain future developments are more complex in the way in which they influence the system than
others.
As discussed before, to find data and process this data in order to create the right model input, many
assumptions had to be made. For the costs of electricity imports and the revenue of electricity
exports, the hourly APX price of 2013 is used. The assumption here is that the price could be the
same in 2034, however this price level is again influenced by the uncertain future development that
the APX electricity price could become lower in the future. In the simulation results, the effect of this
APX drop can be clearly seen, as is discussed in chapter 5. This means that the way of modeling this
part of the energy system can be seen as satisfactory. The imported electricity price is modeled by
adding taxes and surpluses to the APX electricity price. The values of these price elements were
based on data of the year 2017. The volatility of government policies this could potentially have
effect on the modeling results in terms of the received income for generated electricity that is sold to
the national grid. It is therefore important to note that the different energy policies that could be
used in the future are outside the scope of this research but could influence the financial parts of the
modeling results.
Literature sources were used to find out what the projected number of buildings for Buiksloterham
59
was in 2034 and how much space these buildings would offer for renewable energy generation. This
has influence on the renewable generation of the community and so on many KPIs of energy
communities. Another assumption is that the demand for electricity is found with Liander data from
the year 2009. The assumption is that this demand would stay the same in 2034. However, the
uncertain future development of energy demand does take into account this uncertainty. To model
the heating demand, the gas demand hourly trend is taken, as well as the projected heat demand for
Buiksloterham in 2034. When other communities would use the simulation model, the energy
demand is an important part that needs attention. In this study, the demand was included by also
simulating uncertain future developments for data that was from the current year of writing this
research, or earlier. In this same way, for including capital costs in the simulation model for instance,
prices from the year 2017 were used in the standard model but the development of the capital costs
were taken into account with simulating this development as well. Other assumptions that have
been made for the capital cost calculation are that one type of heat pump is investigated in the
model, with a specific cost level. With the heat pumps that have turned out to be quite expensive for
communities to implements, which could be seen in chapter 5, it could be valuable to investigate
more types and cost levels of the different heat pumps. This could give more insights to the
applicability and value of this specific ICES technology.
The way in which the model works is also based on some assumptions. Most importantly the model
is works in the way that the full overproduction of renewable electricity by the energy community is
bought (at a certain APX price) and delivered to the central energy grid. In measuring the line
capacity there seem to be no point in time where the line capacity is exceeded. This is done with a
calculation using data from a distribution transformer operating in a neighborhood in the
Netherlands. The key performance indicator concerning the potential congestion on electricity lines
is therefore included as a value of the highest reached electricity flow over the lines in the full
simulation. A different option would be to put a maximum capacity over the lines in the simulation
and then show how often congestion would take place at the electricity grid. Seeing the results of the
simulations and comparing this to the calculated theoretical maximum capacity over electricity lines,
assumed that this value is calculated correctly, this would however never happen.
A final assumption is the amount of stochastic inputs that have been included in the model. As
discussed before in this research, the stochasticity can make let the simulation model behave more
realistically when it shows the unpredictability of many factors in an energy system. Depending on
the stochasticity of the model, a number of model runs should be done in order to find robust results
for every simulated scenario. In the simulation model that is built in this research, a replication
number of 10 runs gave robust results. However, when more stochastic inputs would have been
added to the model, more replication could have been needed. What could be interesting is to see is
the consideration between having to change the simulation approach and the value that is added to
the quality of simulation model when adding more stochastic inputs. In this research the stochastic
inputs were only chosen for the most obvious model factors that could be modeled most logically
with stochastic inputs, such as the APX electricity price.
6.2 ICES approach for other energy communities
This research has been performed to see the value that the ICES approach can have for energy
communities. The community of Buiksloterham is used as a case study, the results of the ICES
60
approach on Buiksloterham have been discussed in the previous chapters. With this exploratory
modelling that been done for the case study, insights have been gained that could be used by other
energy communities. The literature study that has been performed and the case specific simulation
model that is created in this research provide these insights. The ICES approach is an approach that
could be used on other energy communities as well. It is dependent on the exact characteristics of
the community which ICES technologies are available to implement in the energy system. In this
section the way in which the research results could be used by other energy communities regarding
ICES integration is discussed. The key performance indicators that were used in the simulation study
are not only focused on the goals of Buiksloterham, but also on goals that energy communities in
general could have. This makes the case study research results more suitable for also looking at other
energy communities. As mentioned earlier in this chapter, not all possible ICES related technologies
have been used in the simulation model. There are more types of ICES technologies that could be
included for energy systems in communities than the four that were investigated in this research.
Two ICES technologies that were included in the simulation model for the generation of electricity by
the community are community RES and household RES. To meet the electricity demand of an energy
community the integration of renewable energy sources is important. The results of the simulation
study show that the integration of community RES give better results on the KPI values than the
integration household RES. The biggest value of household or community RES can mainly be found in
enlarging the self-sufficiency of the community. For communities that are still directly connected to
the central energy grid anymore, which is a grid integrated ICES, there is the possibility of selling an
excess of energy to the national energy grid and in this way lowering the cost of operation of the
ICES. For a grid-defected ICES this is not the case. Without other investments in for example energy
storage installations, the same results as in the simulation study of Buiksloterham are not possible
for an energy system of an energy grid-defected community. A grid-defected ICES requires more
technologies to optimally make use of the generated energy by renewable energy sources. This could
lead to higher investments in renewable energy sources than in the grid-integrated ICES in
Buiksloterham, as the produced hourly overcapacity is not sold to the national energy grid but should
be stored or converted so that it can be used at a point in time where no or lower renewable
generation is possible.
The role of thermal energy technologies, such as heat pumps, will also be more important in a grid-
defected ICES, as there is no import of gas for the heating demand. Instead of bringing up the self-
sufficiency, as was the case in the study of the energy community of Buiksloterham, they now are
viral in order to meet the heating demand of the energy system. This means that a further
exploration of other ICES technologies than the ones that are used in the simulation model of this
research, is especially important for energy communities that, for example because self-sufficiency
purposes, would commit to a grid-defected energy system. An example of this are the other options
to integrate thermal energy technologies to meet heat demand in another way.
In the simulation model of this research, electrical heat pumps are used as the thermal energy
technology that could be integrated in the energy grid of the community of Buiksloterham. When
integrating electrical heat pumps in the energy system, the integration of renewable energy sources
at community or household level is important. Renewable generated electricity by the community
itself can be sustainable power input for the electrical heat pumps. Integration of RES combined with
61
the integration of electrical heat pumps gives the best results on the KPIs that have been used in the
model study. The combination with RES could be less important for the other heating options, as
many thermal energy technologies are already sustainable themselves and do not require external
input of electricity. An example of this is solar boilers that could also be integrated at the household
level to provide heating. More information about the acceptance and possibility of the households
(the end users of the energy system) in a specific energy community on doing these investments in
thermal energy technologies is of importance here. Most of the thermal energy technologies namely
result in large capital investments and long payback periods, as could be seen from the integration of
electrical heat pumps in Buiksloterham.
Regarding the ICES technology of building with a high level of energy efficiency, it can be seen that
the integration of energy efficient building will also have a positive impact on the performance of
other energy communities. The main impact is found in bringing down the CO₂ emissions of the
community. In this study however, the effect of Buiksloterham specific energy efficient buildings
have been investigated. For other energy communities, the costs of energy efficient buildings is
dependent on whether (most of) the buildings are already built and whether the buildings are
possible to be made more energy efficient, if the buildings are currently at a low energy efficiency
level.
The future developments, which have been investigated in this research, show how the values of the
key performance indicators that show the value of an ICES for an energy communities can be
affected by different uncertain factors. The most important and influential uncertain development is
the development of the electricity price that used on the APX market. For a grid-defected ICES this
development is of course not of importance, as no electricity is sold or bought to an external energy
grid there. The direction of this development and other future developments affect many of the
performance indicators of an energy system in the same way as is explained in chapter 5. The
importance of these future developments for energy communities is dependent on which ICES
technologies the energy community integrates , as some of the future developments have more
influence on some technologies than others. An example of this is the development of the natural
gas price that is less important in energy communities that use thermal energy technologies so that
less natural gas has to be used. The importance of these future developments for an energy
community is dependent on the period of time for which the value of an ICES is measured. In the
case of the community of Buiksloterham for example, the goal is to reach a transition in 2034. In the
period of time until this year, many factors are expected to change compared to the current
situation.
6.3 Scientific contribution and further research
This research has shown, in an exploratory way, from a community level point of view, what value
the ICES approach can offer for the community of Buiksloterham. Next to this, the results of the
study could be used by other municipalities or communities that want to implement an ICES. For this,
the effect of different ICES related technologies and ICES technology composition have been
researched in scenario simulations. The results of the simulations give information about the value of
different ICES technologies and the ICES approach in general. This information can be valuable input
for decisions of both the community of Buiksloterham and other energy communities. With finding
out which ICES technologies and compositions are available for energy communities, how an

62
exploratory model of the implementation of an ICES for an energy community can be created and
how the ICES scenarios influence the values of performance of an energy system, the knowledge gap
that were mentioned in section 1.4 have been closed.
After this study is performed, further research could be done in this topic, which is the exploratory
modeling of the value of the ICES approach for energy communities. Firstly, more research on other
ICES technologies could be done to expand the simulation study that has been performed in this
research. The ICES approach is broad and covers many energy system (related) technologies, as is
discussed in the first chapters of this document. Including more technologies in the possible ICES
compositions could give more complete information on the value of the ICES approach. In this way,
the simulation study could be applied to more energy communities with different characteristics and
goals. Not only adding more technologies, but also looking into alternatives for the same technology,
such as different types of electrical heat pumps, could be valuable here. Further research could also
be done on the willingness of the end-users of the energy system to participate in a certain type of
ICES. This research now only focuses on exploring the measurable value that an implemented ICES
can have for en energy community. Finally, validation of the simulation model can be an important
addition to the research in this report. In this research some methods for validation of the simulation
have been discussed but have not been performed.
63
Chapter 7: Conclusions
In this research, an answer is tried to be found to the sub research questions and the main research
question of this study, which were formulated in section 1.4. The main research question of this
study is: ‘What value does ICES have for the community of Buiksloterham, to reach the sustainable
energy goals of their smart community development?’
In order to do so, the first sub question was formulated: How can the development of an ICES in the
community of Buiksloterham be quantified for a model study? A MATLAB model is created to
simulate the functioning of a future ICES in Buiksloterham in 2034. The most important input
variables in the quantification of an ICES in Buiksloterham in this study the generation and demand of
energy. Next to this, the ICES related technologies that are included in this research: energy
efficiency of buildings, household RES, community RES and electrical heat pumps are important input
variables. These input values determine the simulation of the model of the energy system. The
national energy system is integrated in the simulation model giving it the function of selling to or
buying electricity from the energy community grid of Buiksloterham. The most important indicators
for measuring the performance of the energy system are the key performance indicators that can
represent sustainable energy community development goals of Buiksloterham and other energy
communities.
The KPIs were used to answer the second sub question: What value can different ICES compositions
in different scenarios have for the community energy system in Buiksloterham in 2034? The different
ICES compositions that were tested in the scenarios have different values and costs for the energy
community of Buiksloterham. Most importantly, the self-sufficiency of the community should be
increased while the energy demand and the CO₂ emissions should be decreased. An ICES
composition with maximum ICES investments can reach a high self-sufficiency and large CO₂
reductions and a low energy demand. The payback time and capital investments are however high.
Even with favourable future developments of amongst others the ICES related capital costs and the
energy demand it seems unlikely that the end-users of the system would be willing to accept these
levels payback periods. When using the ICES composition with full ICES investments, but without
electrical heat pumps, the effect on the KPIs is less beneficial and does not fit in the sustainable goals
of the community of Buiksloterham. As community RES investments are more effective on the KPIs
than household RES investments the composition with full ICES investments, but low community RES,
is explored. The payback time of this composition is slightly lower than in the full ICES investments
composition and the capital costs are 15% lower. Relatively to the costs of the compositions, the
results of these two compositions are comparable. The value of the compositions can be influenced
by future developments, most importantly so that the CO₂ emissions of large ICES investment
scenarios are almost two times lower when the electricity demand is 30% lower in the future.
An answer is then tried to be found to the main research question about the value of ICES for the
community of Buiksloterham. The ICES approach in this research is based on four ICES technologies.
The most ambitious combination of these technologies will lead to beneficial results but under large
costs and pay back periods. The main reason for this is the high investment costs of electrical heat
pumps. An ICES without heat pumps, but with high integration of the other ICES technologies gives
less risk on acceptability because of lower pay back times and costs, but the self-sufficiency and CO₂

64
emissions are significantly higher. A high integration of RES is beneficial in mainly lowering the CO₂
emissions of the community and it also leads to self-sufficiency, where energy efficient buildings
scores best on CO₂ emission and does not provide for self-sufficiency. The performance of electrical
heat pumps are dependent on with which other ICES technologies they are combined. Integration of
RES is very important for heat pumps, as it makes the heat pumps able to use self-generated
renewable electricity to provide for the heat demand of the energy community. In this way, heat
pumps can lead to a high self-sufficiency of the community, because it can provide sustainable supply
of heat. Investing in community RES is more attractive than investing in household RES and give,
together with investing in energy efficient building, beneficial results on the CO₂ emissions. The
consideration is then to invest in heat pumps, which are needed to reach the ambitious goals of
Buiksloterham. Relatively to cost, they give the best results with a high integration of heat pumps
combined with a high integration of other ICES technologies. The higher this integration of heat
pumps is however, the more risk there is in long pay back periods and acceptability of this ICES
composition. Investing in the ICES technologies other than electrical heat pumps gives beneficial
results, with the side node that the focus should be on community RES. Dependent on the direction
of the uncertain developments heat pumps should then be implemented to achieve the more
ambitious sustainable goals, for example when capital costs turn out lower in the future.
Other energy communities can learn from the results by taking into account the effect that different
ICES technologies and compositions of technologies have on different parameters that measure the
performance of the energy system of an energy community. This research has had scientific
contribution, mainly in the exploratory and community level point of view that is taken in the
creation of the simulation model for the energy system of the community of Buiksloterham. The
knowledge gaps that were formulated in section 1.4 of this report have been filled by firstly showing
which ICES technologies and compositions could be used by energy communities. A number of these
technologies were included in the simulation model that has been developed. Secondly, it was shown
how an exploratory model has been developed through gathering data and making different
assumptions. Thirdly, the value of the ICES approach has been expressed by discussing the most
important influences that different ICES technologies and compositions of technologies have on the
performance indicators of energy communities.

65
Reflection
After finding a suitable subject for my Master thesis project, my supervisors helped me in finding the
right direction to go. The kick-off of my research eventually took place about 6 months ago. A lot of
time was put into finding the right project proposal to work with. The field of research and subject in
which I wanted to do my research is broad and when trying to translate this into a project, the focus
would often be so broad and ambitious that unfeasibility was an easy trap. My supervisors helped
me a lot in narrowing down the scope of my research project and eventually making clear what I
wanted to research and how I wanted to do that.
I learned a lot about doing research from this Master Thesis Project. Not only about the subject
where this research is about, but also about the way in which these types of researches can be best
executed. Looking back at the process, it would have been helpful to create an idea of what type of
simulation model I wanted to create in order to get results. I think the hesitation in the choice of
methodology was one of the reasons that made it difficult for me to create a project proposal that
was feasible. In future research I would from the beginning try to make clear what I do and what I do
not want to include in my research scope so that it becomes clear which methodology is needed for
this.
Eventually a literature study and a simulation model study have been performed in this research.
Especially the design skills that you learn in the Master programme of CoSeM were useful to create a
MATLAB model that would simulate the energy system of the community of Buiksloterham.
Regarding the creation of this simulation model I have learned that it is very important to know at
which level you are designing something. Before the creation of an actual simulation model, when
designing a conceptual model, the level of detail and the scope of the model should be chosen to see
what needs to be included and what does not need to be included in the model. For me this was a
quite iterative process which might be unavoidable when doing this kind of research, but it is
something that you can keep in mind for future projects.
66
References
Alawadhi, S., Aldama-Nalda, A., Chourabi, H., Gil-Garcia, J. R., Leung, S., Mellouli, S., ... & Walker, S.
(2012, September). Building understanding of smart city initiatives. In International
Conference on Electronic Government (pp. 40-53). Springer Berlin Heidelberg.
Amsterdam City (2016). Retrieved 22-10-2017, from Amsterdam Smart City:
https://amsterdamsmartcity.com/projects
BIES. (2016). Buiksloterham Integrated Energy System. Naar een duurzaam en geintegreerd
energiesysteem voor een wijk in transitie.
Cartes, D., Ordonez, J., Harrington, J., Cox, D., & Meeker, R. (2007, June). Novel integrated energy
systems and control methods with economic analysis for integrated community based energy
systems. In Power Engineering Society General Meeting, 2007. IEEE (pp. 1-6). IEEE.
Chourabi, H., Nam, T., Walker, S., Gil-Garcia, J. R., Mellouli, S., Nahon, K., ... & Scholl, H. J. (2012,
January). Understanding smart cities: An integrative framework. In System Science (HICSS),
2012 45th Hawaii International Conference on (pp. 2289-2297). IEEE. ISO 690.
CO₂emissiefactoren (2017). Lijst emissiefactoren. Retrieved from CO₂emissiefactoren:
http://CO₂emissiefactoren.nl/lijst-emissiefactoren/
Energieconsultant. Omrekening van m3 naar kWh. Retrieved from Energieconsultant:
http://www.energieconsultant.nl/energiemarkt/energie-berekeningen-uit-de-
praktijk/omrekening-van-m3-n-naar-kwh/
Energieperspectief (2017). Rekenvoorbeeld Zonnepanelen Particulieren. Retrieved from:
https://www.energieperspectief.nl/rekenvoorbeeld-zonnepanelen-particulieren/
EPA (2016). Causes of climate change. Retrieved from EPA:
https://www.epa.gov/climate-change-science/causes-climate-change
European Photovoltaic Industry Association. "Global market outlook for photovoltaics 2013-
2017." EPIA Report (2013).
Gemeente Amsterdam Noordwaarts. (2009). Bestemmingsplan Buiksloterham.
Gevelenwand (2017). Spouwmuurisolatie kosten. Retrieved from Gevelenwand:
https://gevelenwand.nl/gevelisolatie/spouwmuurisolatie-kosten/
Gilderbloom, J. I., Hanka, M. J., & Lasley, C. B. (2009). Amsterdam: planning and policy for the ideal
city?. Local Environment, 14(6), 473-493.
67
Gladek, van Odijk, Theuws, Herder, E. (2014). Transitioning Amsterdam to a circular city Circular
Buiksloterham, vision and ambition.
Hain, J. J., Ault, G. W., Galloway, S. J., Cruden, A., & McDonald, J. R. (2005). Additional renewable
energy growth through small-scale community orientated energy policies. Energy Policy,
33(9), 1199-1212.
HIERopgewekt (2015). Initiatieven. Retrieved from HIERopgewekt:
http://www.hieropgewekt.nl/initiatieven
Hollands, R. G. (2008). Will the real smart city please stand up? Intelligent, progressive or
entrepreneurial?. City, 12(3), 303-320. ISO 690 .
Holstenkamp, L., Müller, J.R., 2012. Zum Stand von Energiegenossenschaften in Deutschland (No. 14).
Huybrechts, B. (2013). The role of networks in gaining legitimacy for hybrid organizations: the case of
renewable energy source cooperatives (REScoops). Quelle transition pour nos sociétés?, 61.
IRENA (2012). Renewable energy technologies: cost analysis series, 2012.
IRENA-IEA-ETSAP Technology Brief 3: Heat Pumps; International Renewable Energy Agency (IRENA):
Abu Dhabi, UAE, 2013.
Khalilpour, R., & Vassallo, A. (2015). Leaving the grid: An ambition or a real choice?. Energy Policy, 82,
207-221.
Knoema (2017). Natural Gas Prices Forecast. Retrieved from Knoema:
https://knoema.com/ncszerf/natural-gas-prices-forecast-long-term-2017-to-2030-data-and-
charts
Kohavi, R. (1995). A study of cross-validation and bootstrap for accuracy estimation and model
selection. In Ijcai (Vol. 14, No. 2, pp. 1137-1145).
Koirala, B. P., Chaves Ávila, J. P., Gómez, T., Hakvoort, R. A., & Herder, P. M. (2016). Local Alternative
for Energy Supply: Performance Assessment of Integrated Community Energy Systems.
Energies, 9(12), 981.
Koirala, B. P., Koliou, E., Friege, J., Hakvoort, R. A., & Herder, P. M. (2015). Energetic communities for
community energy: A review of key issues and trends shaping integrated community energy
systems. Renewable and Sustainable Energy Reviews, 56, 722-744.
Koirala (2017). Integrated Community Energy Systems. Doctoral Thesis.
68
Letcher, M., Redgrove, Z., Roberts, S., Longstaff, B., Inverarity, A., 2007. Mobilising individual
behaviour change through community initiatives: lessons for climate change. Report by the
Centre for Sustainable Energy (CSE) and Community Development Xchange (CDX) for: DEFRA,
Communities and Local Government, DTI, DfT and HM Treasury.
Liander. Available data. Retreived from Liander:
https://www.liander.nl/over-liander/innovatie/open-data/data
Mendes, G., Ioakimidis, C., & Ferrão, P. (2011). On the planning and analysis of Integrated
Community Energy Systems: A review and survey of available tools. Renewable and
Sustainable Energy Reviews, 15(9), 4836-4854.
Miliecentraal (2017). Gemiddeld energieverbruik. Retrieved from Milieucentraal:
https://www.milieucentraal.nl/energie-besparen/snel-besparen/grip-op-je-
energierekening/gemiddeld-energieverbruik/
Milieucentraal (2017). Snel besparen. Retrieved from Milieucentraal:
https://www.milieucentraal.nl/energie-besparen/snel-besparen/grip-op-je-
energierekening/energieprijzen/
Milieucentraal (2017). Zonnepanelen. Retrieved from Milieucentraal:
https://www.milieucentraal.nl/energie-besparen/zonnepanelen/zonnepanelen-
kopen/kosten-en-opbrengst-zonnepanelen/
Modernize (2016). How much does a gas boiler cost? Retrieved from Modernize:
https://modernize.com/home-ideas/21134/how-much-does-a-gas-boiler-cost
Nieuwenhout, F., & Brand, A. (2011, May). The impact of wind power on day-ahead electricity prices
in the Netherlands. In Energy Market (EEM), 2011 8th International Conference on the
European (pp. 226-230). IEEE.
NRCAN (2014). About Integrated Community Energy Solutions. Retrieved from NRCAN:
http://www.nrcan.gc.ca/energy/efficiency/communities-infrastructure/integrated-
community-energy-solutions/4369
Oteman M, Wiering M, Helderman J-K. The institutional space of community initiatives for renewable
energy: a comparative case study of the Netherlands, Germany and Denmark. Energy Sustain
Soc 2014;4:1–17.
Pascual, D. G. (2015). Artificial Intelligence Tools: Decision Support Systems in Condition Monitoring
and Diagnosis. Crc Press. ISO 690.
Pianosi, F., Beven, K., Freer, J., Hall, J. W., Rougier, J., Stephenson, D. B., & Wagener, T. (2016).
Sensitivity analysis of environmental models: A systematic review with practical workflow.
Environmental Modelling & Software, 79, 214-232.

69
Ravindra, K., & Iyer, P. P. (2014). Decentralized demand–supply matching using community
microgrids and consumer demand response: a scenario analysis. Energy, 76, 32-41.
Rogers, J. C., Simmons, E. A., Convery, I., & Weatherall, A. (2008). Public perceptions of opportunities
for community-based renewable energy projects. Energy Policy, 36(11), 4217-4226.
Rooijers, F., Schepers, B., van Gerwen, R., & Van der Veen, W. (2014). Scenario-ontwikkeling
energievoorziening 2030. Delft, The Netherlands: Publicatienummer, 14, C93.
RVO (2017). Energieprestatie – BENG. Retrieved from RVO:
https://www.rvo.nl/onderwerpen/duurzaam-ondernemen/gebouwen/wetten-en-regels-
gebouwen/nieuwbouw/energieprestatie-beng
Sassen, S. (2011). Talking back to your intelligent city. McKinsey.
Scholl, H.J., Barzilai-Nahon, K., Ahn, J., Olga, P., Barbara, R.: E-commerce and E-government: How do
They Compare? What Can They Learn from Each Other? In: Proceedings of the 42nd
Hawaiian International Conference on System Sciences (2009).
Soshinskaya M, Crijns-Graus WHJ, Guerrero JM, Vasquez JC. Microgrids: Experiences, barriers and
success factors. Renew Sustain Energy Rev 2014;40:659–72. doi:10.1016/j.rser.2014.07.198.
Stadler, M., Cardoso, G., Mashayekh, S., Forget, T., DeForest, N., Agarwal, A., & Schönbein, A. (2016).
Value streams in microgrids: A literature review. Applied Energy, 162, 980-989.
TenneT (2016). System & transmission data. Retrieved from TenneT:
http://www.tennet.org/english/operational_management/export_data.aspx
The Guardian (2016). Solar panel costs predicted to fall 10% a year. Retrieved from The Guardian:
https://www.theguardian.com/environment/2016/jan/26/solar-panel-costs-predicted-to-
fall-10-a-year
TNO (2015). Smart Cities. Retrieved from TNO:
https://www.tno.nl/en/focus-areas/urbanisation/smart-cities/
Townsend, A., Maguire, R., Liebhold, M., & Crawford, M. (2010). The future of cities, information,
and inclusion: A planet of civic laboratories. Institute for the Future, 2016.
UNEP (2016). Cities and Climate Change. Retrieved from UNEP:
http://www.unep.org/resourceefficiency/Policy/ResourceEfficientCities/FocusAreas/Citiesan
dClimateChange/tabid/101665/
Van den Hil, E. J. (2015). Multi-objective optimisation of Integrated Community Energy Systems and
assessment of the impact on households.

70
Voulis, N., Warnier, M., & Brazier, F. M. (2016). Impact of Service Sector Loads on Renewable
Resource Integration. arXiv preprint arXiv:1605.09667.
Walker, G. (2008). What are the barriers and incentives for community-owned means of energy
production and use?. Energy Policy, 36(12), 4401-4405.
Walker, G., Devine-Wright, P., Hunter, S., High, H., & Evans, B. (2010). Trust and community:
Exploring the meanings, contexts and dynamics of community renewable energy. Energy
Policy, 38(6), 2655-2663.
Walker, G., Simcock, N., & Smith, S. J. (2012). Community energy systems. International Encyclopedia
of Housing and Home, 1st ed.; Smith, SJ, Ed, 194-198.
Zhou, Y., Wang, M., Hao, H., Johnson, L., & Wang, H. (2015). Plug-in electric vehicle market
penetration and incentives: a global review. Mitigation and Adaptation Strategies for Global
Change, 20(5), 777-795.
Zonnepanelen (2017). Afmetingen. Retrieved from Zonnepanelen:
https://www.zonnepanelen.net/afmeting/
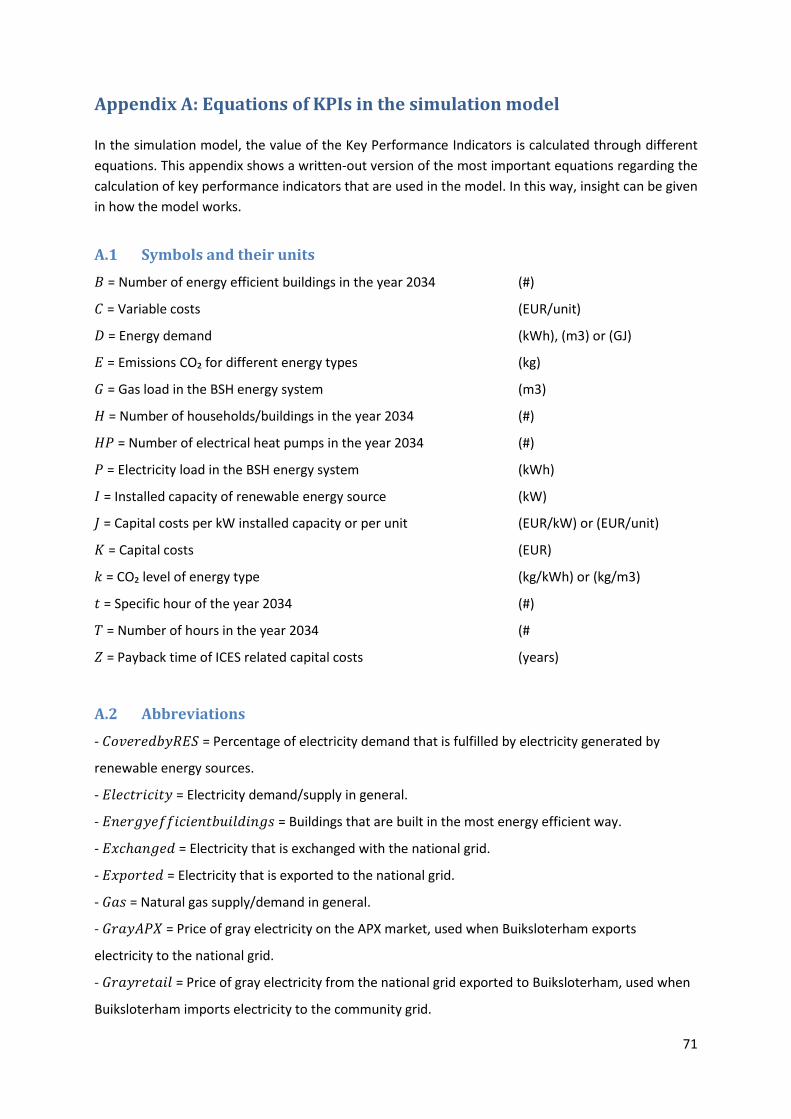
71
Appendix A: Equations of KPIs in the simulation model
In the simulation model, the value of the Key Performance Indicators is calculated through different
equations. This appendix shows a written-out version of the most important equations regarding the
calculation of key performance indicators that are used in the model. In this way, insight can be given
in how the model works.
A.1 Symbols and their units
= Number of energy efficient buildings in the year 2034 (#)
= Variable costs (EUR/unit)
= Energy demand (kWh), (m3) or (GJ)
= Emissions CO₂ for different energy types (kg)
= Gas load in the BSH energy system (m3)
= Number of households/buildings in the year 2034 (#)
= Number of electrical heat pumps in the year 2034 (#)
= Electricity load in the BSH energy system (kWh)
= Installed capacity of renewable energy source (kW)
= Capital costs per kW installed capacity or per unit (EUR/kW) or (EUR/unit)
= Capital costs (EUR)
= CO₂ level of energy type (kg/kWh) or (kg/m3)
= Specific hour of the year 2034 (#)
= Number of hours in the year 2034 (#
= Payback time of ICES related capital costs (years)
A.2 Abbreviations
- = Percentage of electricity demand that is fulfilled by electricity generated by
renewable energy sources.
- = Electricity demand/supply in general.
- = Buildings that are built in the most energy efficient way.
- = Electricity that is exchanged with the national grid.
- = Electricity that is exported to the national grid.
- = Natural gas supply/demand in general.
- = Price of gray electricity on the APX market, used when Buiksloterham exports
electricity to the national grid.
- = Price of gray electricity from the national grid exported to Buiksloterham, used when
Buiksloterham imports electricity to the community grid.
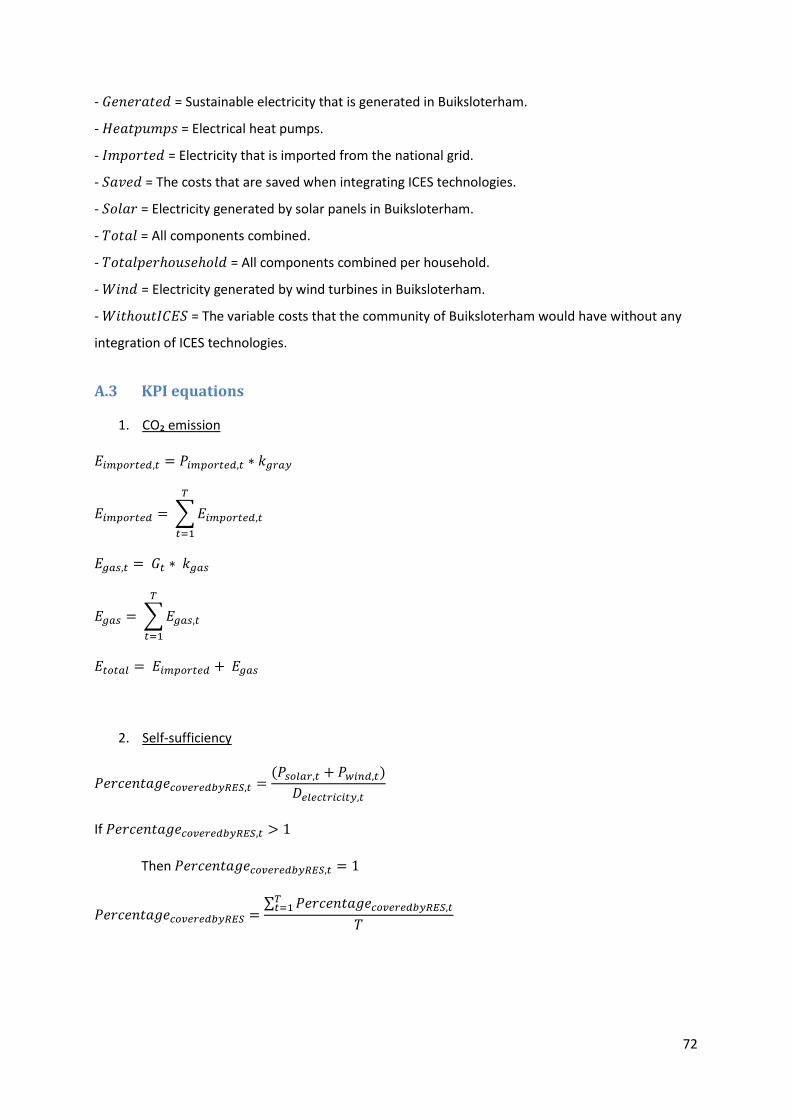
72
- = Sustainable electricity that is generated in Buiksloterham.
- = Electrical heat pumps.
- = Electricity that is imported from the national grid.
- = The costs that are saved when integrating ICES technologies.
- = Electricity generated by solar panels in Buiksloterham.
- = All components combined.
- = All components combined per household.
- = Electricity generated by wind turbines in Buiksloterham.
- = The variable costs that the community of Buiksloterham would have without any
integration of ICES technologies.
A.3 KPI equations
1. CO₂ emission
∑
∑
2. Self-sufficiency
If
Then
∑
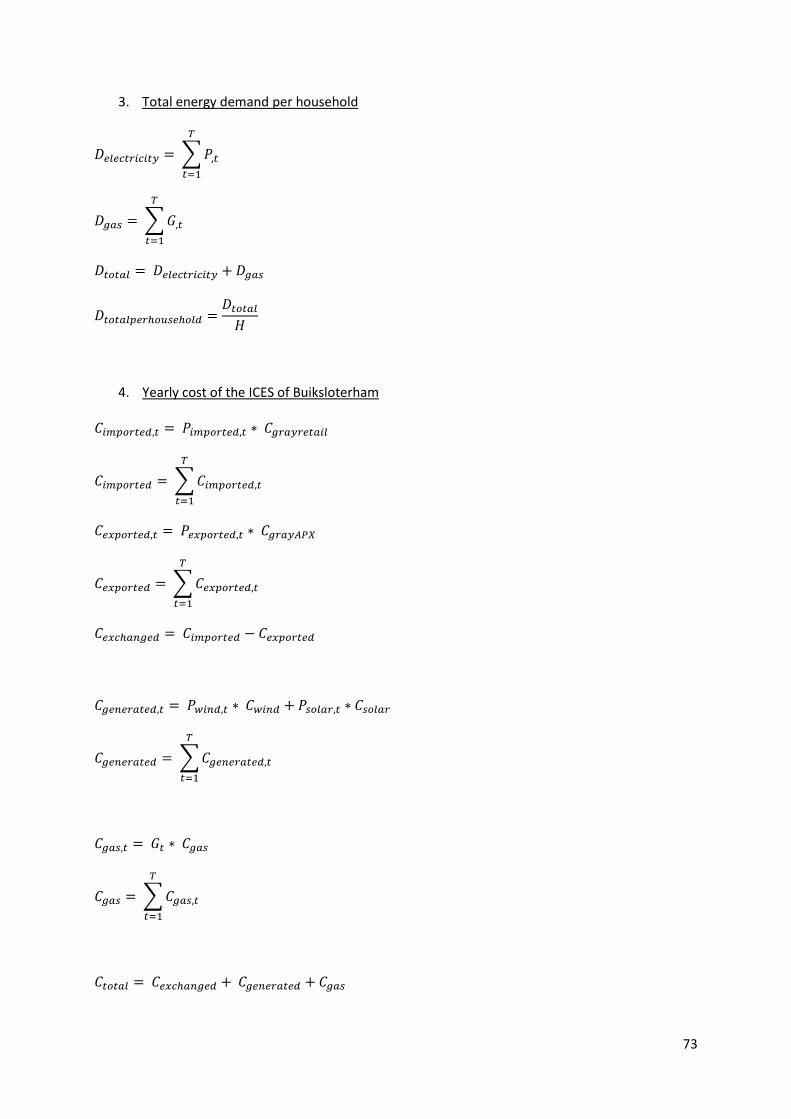
73
3. Total energy demand per household
∑
∑
4. Yearly cost of the ICES of Buiksloterham
∑
∑
∑
∑
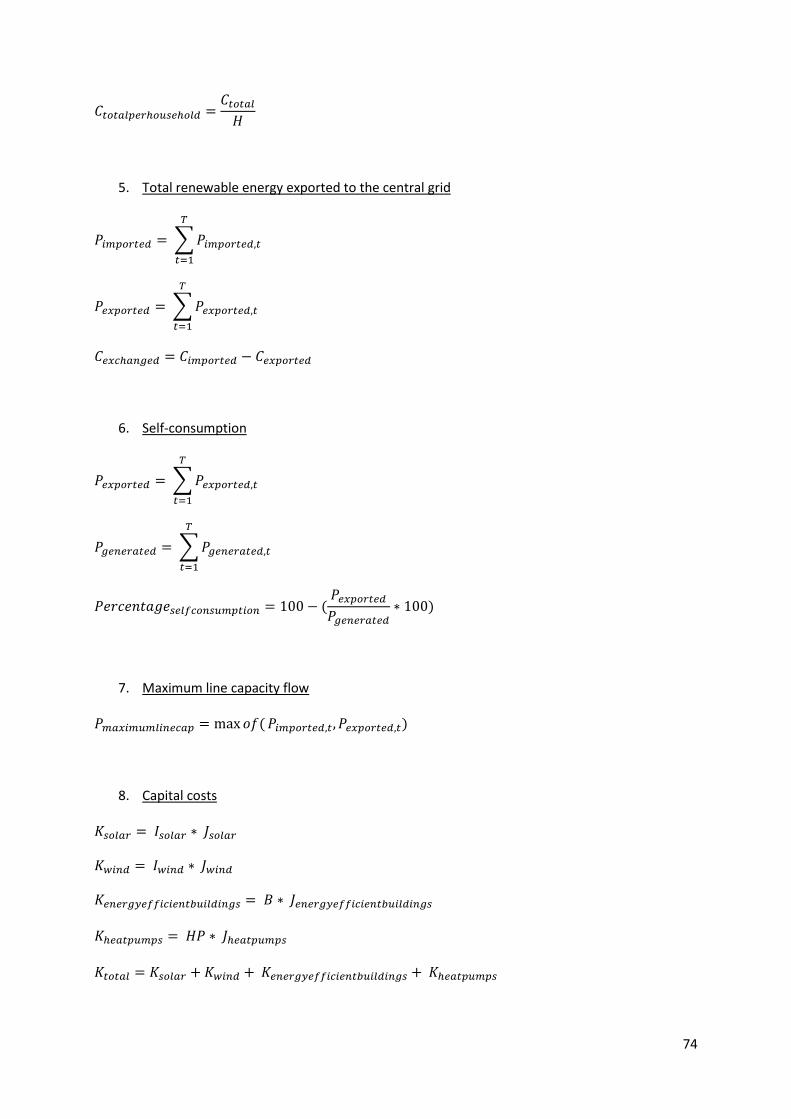
74
5. Total renewable energy exported to the central grid
∑
∑
6. Self-consumption
∑
∑
7. Maximum line capacity flow
8. Capital costs

75
9. Payback time of ICES related capital costs
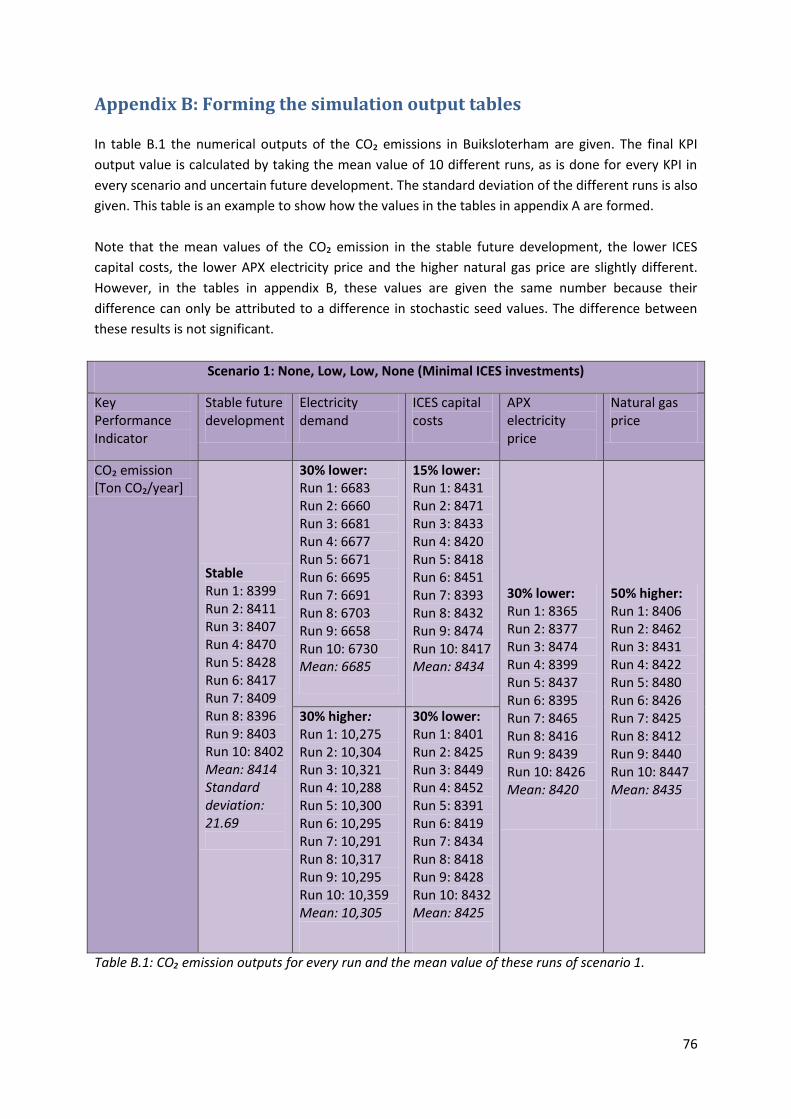
76
Appendix B: Forming the simulation output tables
In table B.1 the numerical outputs of the CO₂ emissions in Buiksloterham are given. The final KPI
output value is calculated by taking the mean value of 10 different runs, as is done for every KPI in
every scenario and uncertain future development. The standard deviation of the different runs is also
given. This table is an example to show how the values in the tables in appendix A are formed.
Note that the mean values of the CO₂ emission in the stable future development, the lower ICES
capital costs, the lower APX electricity price and the higher natural gas price are slightly different.
However, in the tables in appendix B, these values are given the same number because their
difference can only be attributed to a difference in stochastic seed values. The difference between
these results is not significant.
Scenario 1: None, Low, Low, None (Minimal ICES investments)
Key Performance Indicator
Stable future development
Electricity demand
ICES capital costs
APX electricity price
Natural gas price
CO₂ emission *Ton CO₂/year+
Stable Run 1: 8399 Run 2: 8411 Run 3: 8407 Run 4: 8470 Run 5: 8428 Run 6: 8417 Run 7: 8409 Run 8: 8396 Run 9: 8403 Run 10: 8402 Mean: 8414 Standard deviation: 21.69
30% lower: Run 1: 6683 Run 2: 6660 Run 3: 6681 Run 4: 6677 Run 5: 6671 Run 6: 6695 Run 7: 6691 Run 8: 6703 Run 9: 6658 Run 10: 6730 Mean: 6685
15% lower: Run 1: 8431 Run 2: 8471 Run 3: 8433 Run 4: 8420 Run 5: 8418 Run 6: 8451 Run 7: 8393 Run 8: 8432 Run 9: 8474 Run 10: 8417 Mean: 8434
30% lower: Run 1: 8365 Run 2: 8377 Run 3: 8474 Run 4: 8399 Run 5: 8437 Run 6: 8395 Run 7: 8465 Run 8: 8416 Run 9: 8439 Run 10: 8426 Mean: 8420
50% higher: Run 1: 8406 Run 2: 8462 Run 3: 8431 Run 4: 8422 Run 5: 8480 Run 6: 8426 Run 7: 8425 Run 8: 8412 Run 9: 8440 Run 10: 8447 Mean: 8435
30% higher: Run 1: 10,275 Run 2: 10,304 Run 3: 10,321 Run 4: 10,288 Run 5: 10,300 Run 6: 10,295 Run 7: 10,291 Run 8: 10,317 Run 9: 10,295 Run 10: 10,359 Mean: 10,305
30% lower: Run 1: 8401 Run 2: 8425 Run 3: 8449 Run 4: 8452 Run 5: 8391 Run 6: 8419 Run 7: 8434 Run 8: 8418 Run 9: 8428 Run 10: 8432 Mean: 8425
Table B.1: CO₂ emission outputs for every run and the mean value of these runs of scenario 1.

77
Appendix C: Simulation output for the scenarios
The tables C.1 to C.10 give the full simulation outputs for the ten scenarios that have been simulated
in the model study. Every table shows the results for one scenario. In the table, the numerical output
for each key performance indicators is given for each of the uncertain future developments. The first
column shows the output values when there is a ‘stable future development’ so neither the
electricity demand, the ICES related capital costs, the APX electricity price or the natural gas price is
different than the standard value that has been used in the simulation, so the value as it is today. The
other columns show the numerical outputs in the scenario of the key performance, when one of the
uncertain future developments takes one of the possible directions.

78
Scenario 1: None, Low, Low, None (Minimum ICES investments)
Key Performance Indicator
Stable future development
Electricity demand
ICES capital costs
APX electricity price
Natural gas price
1. CO₂ emission *Ton CO₂/year+
8403
30% lower: 6656
15% lower: 8403
30% lower: 8403
50% higher:
8403 30% higher: 10,320
30% lower: 8403
2. Self-sufficiency [%]
18.00
30% lower: 18.31
15% lower: 18.00
30% lower: 18.00
50% higher:
18.00 30% higher: 16.82
30% lower: 18.00
3. Total energy demand per household [GJ/household/year]
27.76
30% lower: 24.42
15% lower: 27.76
30% lower: 27.76
50% higher:
27.76 30% higher: 31.19
30% lower: 27.76
4. Yearly cost of operation of the ICES of Buiksloterham per household *€/household/year+
695
30% lower: 514
15% lower: 695
30% lower: 699
50% higher: 842
30% higher: 890
30% lower: 695
5. Total renewable energy exported to the central grid [GJ/year]
935
30% lower: 2436
15% lower: 935
30% lower: 935
50% higher:
935 30% higher: 379
30% lower: 935
6. Self-consumption [%]
95.06
30% lower: 87.30
15% lower: 95.06
30% lower: 95.06
50% higher: 95.06 30% higher:
97.91 30% lower: 95.06
7. Maximum line capacity flow [kWh] 4246
30% lower: 2654
15% lower: 4246
30% lower: 4246
50% higher:
4246 30% higher: 6151
30% lower: 4246
8. Capital costs of the ICES components *€] 6,430,000
30% lower: 6,430,000
15% lower: 5,465,500
30% lower: 6,430,000
50% higher: 6,430,000 30% higher:
6,430,000 30% lower: 4,501,000
9. Payback time of ICES related capital costs [Years]
4.67
30% lower: 3.06
15% lower: 4.03
30% lower:
4.75
50% higher: 8.1477
30% higher: 10.76
30% lower: 3.26
Table C.1: Numerical output of scenario 1.

79
Scenario 2: Full, High, High, Full (Maximum ICES investments)
Key Performance Indicator
Stable future development
Electricity demand
ICES capital costs
APX electricity price
Natural gas price
1. CO₂ emission *Ton CO₂/year+
749
30% lower: 388
15% lower: 749
30% lower: 749
50% higher:
749 30% higher: 1244
30% lower: 749
2. Self-sufficiency [%]
86.32
30% lower: 89.03
15% lower: 86.32
30% lower: 86.32
50% higher:
86.32 30% higher: 83.06
30% lower: 86.32
3. Total energy demand per household [GJ/household/year]
8.68
30% lower: 6.06
15% lower: 8.68
30% lower: 8.68
50% higher:
8.68 30% higher: 11.27
30% lower: 8.68
4. Yearly cost of operation of the ICES of Buiksloterham per household *€/household/year+
29
30% lower: -37
15% lower: 29
30% lower: 98
50% higher: 29
30% higher: 105
30% lower: 29
5. Total renewable energy exported to the central grid [GJ/year]
46,500
30% lower: 54,515
15% lower: 46,500
30% lower: 46,500
50% higher:
46,500 30% higher: 39,614
30% lower: 46,500
6. Self-consumption [%]
38.92
30% lower: 28.48
15% lower: 38.92
30% lower: 38.92
50% higher: 38.92 30% higher:
48.05 30% lower: 38.92
7. Maximum line capacity flow [kWh]
8385
30% lower: 8533
15% lower: 8385
30% lower: 8385
50% higher:
8385 30% higher: 8095
30% lower: 8385
8. Capital costs of the ICES components *€]
81,720,000
30% lower: 81,720,000
15% lower: 69,462,000
30% lower: 81,720,000
50% higher: 81,720,000 30% higher:
81,720,000 30% lower: 57,204,000
9. Payback time of ICES related capital costs [Years]
20.23
30% lower: 18.97
15% lower: 17.23
30% lower: 21.70
50% higher: 20.23
30% higher: 21.88
30% lower: 14.16
Table C.2: Numerical output of scenario 2.
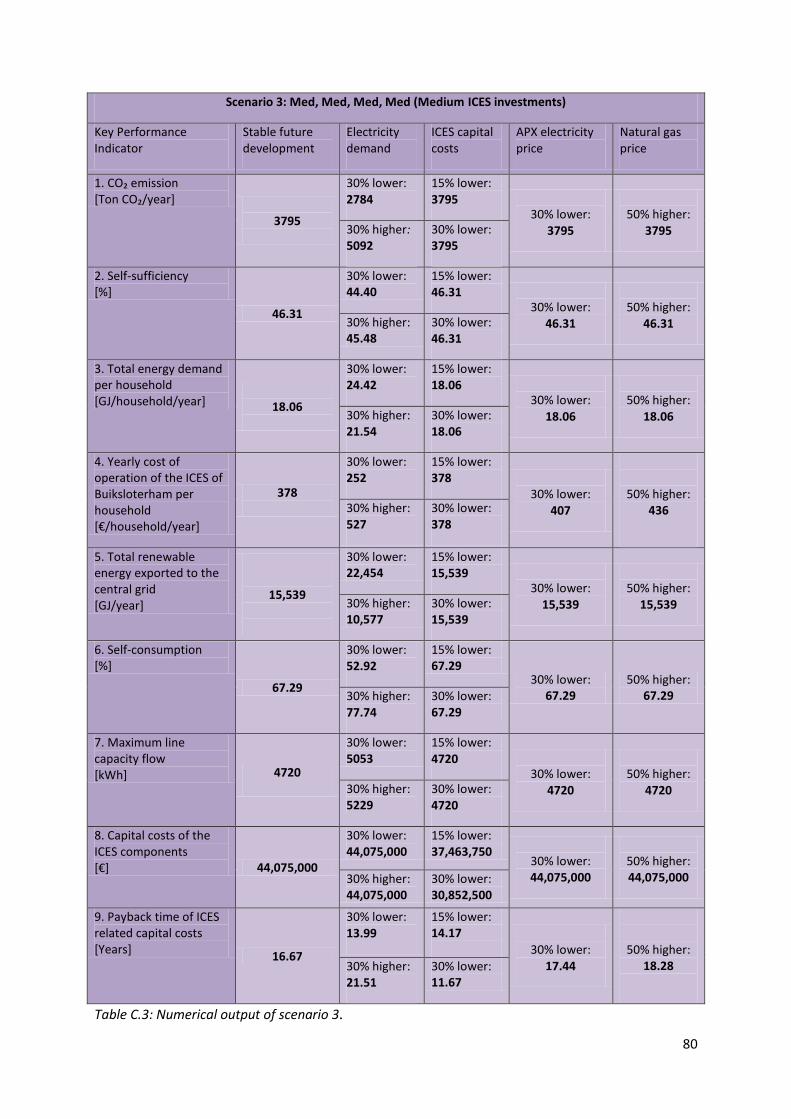
80
Scenario 3: Med, Med, Med, Med (Medium ICES investments)
Key Performance Indicator
Stable future development
Electricity demand
ICES capital costs
APX electricity price
Natural gas price
1. CO₂ emission *Ton CO₂/year+
3795
30% lower: 2784
15% lower: 3795
30% lower: 3795
50% higher:
3795 30% higher: 5092
30% lower: 3795
2. Self-sufficiency [%]
46.31
30% lower: 44.40
15% lower: 46.31
30% lower: 46.31
50% higher:
46.31 30% higher: 45.48
30% lower: 46.31
3. Total energy demand per household [GJ/household/year]
18.06
30% lower: 24.42
15% lower: 18.06
30% lower: 18.06
50% higher:
18.06 30% higher: 21.54
30% lower: 18.06
4. Yearly cost of operation of the ICES of Buiksloterham per household *€/household/year+
378
30% lower: 252
15% lower: 378
30% lower: 407
50% higher: 436
30% higher: 527
30% lower: 378
5. Total renewable energy exported to the central grid [GJ/year]
15,539
30% lower: 22,454
15% lower: 15,539
30% lower: 15,539
50% higher:
15,539 30% higher: 10,577
30% lower: 15,539
6. Self-consumption [%]
67.29
30% lower: 52.92
15% lower: 67.29
30% lower: 67.29
50% higher: 67.29 30% higher:
77.74 30% lower: 67.29
7. Maximum line capacity flow [kWh] 4720
30% lower: 5053
15% lower: 4720
30% lower: 4720
50% higher:
4720 30% higher: 5229
30% lower: 4720
8. Capital costs of the ICES components *€] 44,075,000
30% lower: 44,075,000
15% lower: 37,463,750
30% lower: 44,075,000
50% higher: 44,075,000 30% higher:
44,075,000 30% lower: 30,852,500
9. Payback time of ICES related capital costs [Years]
16.67
30% lower: 13.99
15% lower: 14.17
30% lower:
17.44
50% higher: 18.28
30% higher: 21.51
30% lower: 11.67
Table C.3: Numerical output of scenario 3.

81
Scenario 4: Full, High, High, None (Maximum RES investments and full energy efficient buildings)
Key Performance Indicator
Stable future development
Electricity demand
ICES capital costs
APX electricity price
Natural gas price
1. CO₂ emission *Ton CO₂/year+
3143
30% lower: 2959
15% lower: 3143
30% lower: 3143
50% higher:
3143 30% higher: 3438
30% lower: 3143
2. Self-sufficiency [%]
35.92
30% lower: 29.13
15% lower: 35.92
30% lower: 35.92
50% higher:
35.92 30% higher: 40.50
30% lower: 35.92
3. Total energy demand per household [GJ/household/year]
16.64
30% lower: 14.71
15% lower: 16.64
30% lower: 16.64
50% higher:
16.64 30% higher: 18.68
30% lower: 16.64
4. Yearly cost of operation of the ICES of Buiksloterham per household *€/household/year+
59
30% lower: 15
15% lower: 59
30% lower: 135
50% higher: 148
30% higher: 111
30% lower: 59
5. Total renewable energy exported to the central grid [GJ/year]
52,214
30% lower: 58,841
15% lower: 52,214
30% lower: 52,214
50% higher: 52,214
30% higher: 46,172
30% lower: 52,214
6. Self-consumption [%]
31.30
30% lower: 22.56
15% lower: 31.30
30% lower: 31.30
50% higher: 31.30 30% higher:
39.32 30% lower: 31.30
7. Maximum line capacity flow [kWh] 8443
30% lower: 8311
15% lower: 8443
30% lower: 8443
50% higher:
8443 30% higher: 8306
30% lower: 8443
8. Capital costs of the ICES components *€] 45,720,000
30% lower: 45,720,000
15% lower: 38,862,000
30% lower: 45,720,000
50% higher: 45,720,000 30% higher:
45,720,000 30% lower: 32,004,000
9. Payback time of ICES related capital costs [Years]
11.67
30% lower: 11.16
15% lower: 9.93
30% lower:
12.64
50% higher:
12.83
30% higher: 12.32
30% lower: 8.17
Table C.4: Numerical output of scenario 4.

82
Scenario 5: None, High, High, Full (Maximum RES and full heat pump investments)
Key Performance Indicator
Stable future development
Electricity demand
ICES capital costs
APX electricity price
Natural gas price
1. CO₂ emission *Ton CO₂/year+
2053
30% lower: 1007
15% lower: 2053
30% lower: 2053
50% higher:
2053 30% higher: 3450
30% lower: 2053
2. Self-sufficiency [%]
78.49
30% lower: 84.45
15% lower: 78.49
30% lower: 78.49
50% higher:
78.49 30% higher: 72.37
30% lower: 78.49
3. Total energy demand per household [GJ/household/year] 14.46
30% lower: 10.12
15% lower: 14,46
30% lower: 14,46
50% higher:
14,46 30% higher: 18.83
30% lower: 14,46
4. Yearly cost of operation of the ICES of Buiksloterham per household *€/household/year+
215
30% lower: 71
15% lower: 215
30% lower: 268
50% higher: 215
30% higher: 385
30% lower: 215
5. Total renewable energy exported to the central grid [GJ/year]
32,278
30% lower: 42,506
15% lower: 32,278
30% lower: 32,278
50% higher:
32,278 30% higher: 24,385
30% lower: 32,278
6. Self-consumption [%]
57.59
30% lower: 44.16
15% lower: 57.59
30% lower: 57.59
50% higher: 57.59 30% higher:
68.19 30% lower: 57.59
7. Maximum line capacity flow [kWh] 8123
30% lower: 8123
15% lower: 8123
30% lower: 8123
50% higher:
8123 30% higher: 7305
30% lower: 8123
8. Capital costs of the ICES components *€] 61,720,000
30% lower: 61,720,000
15% lower: 52.462.000
30% lower: 61,720,000
50% higher: 61,720,000 30% higher:
61,720,000 30% lower: 43.040.000
9. Payback time of ICES related capital costs [Years]
18.71
30% lower: 15.93
15% lower: 15.96
30% lower:
20.00
50% higher: 18.71
30% higher: 23.60
30% lower: 13.12
Table C.5: Numerical output of scenario 5.
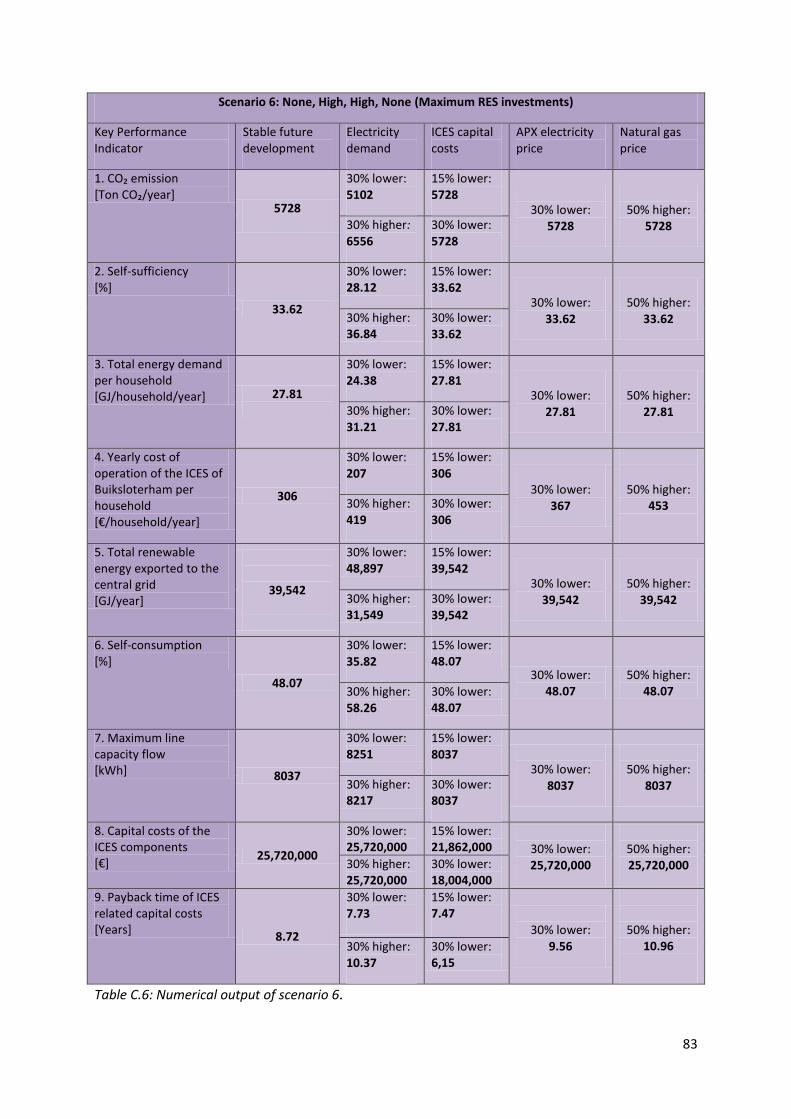
83
Scenario 6: None, High, High, None (Maximum RES investments)
Key Performance Indicator
Stable future development
Electricity demand
ICES capital costs
APX electricity price
Natural gas price
1. CO₂ emission *Ton CO₂/year+
5728
30% lower: 5102
15% lower: 5728
30% lower: 5728
50% higher:
5728 30% higher: 6556
30% lower: 5728
2. Self-sufficiency [%]
33.62
30% lower: 28.12
15% lower: 33.62
30% lower: 33.62
50% higher:
33.62 30% higher: 36.84
30% lower: 33.62
3. Total energy demand per household [GJ/household/year] 27.81
30% lower: 24.38
15% lower: 27.81
30% lower: 27.81
50% higher:
27.81 30% higher: 31.21
30% lower: 27.81
4. Yearly cost of operation of the ICES of Buiksloterham per household *€/household/year]
306
30% lower: 207
15% lower: 306
30% lower: 367
50% higher: 453
30% higher: 419
30% lower: 306
5. Total renewable energy exported to the central grid [GJ/year]
39,542
30% lower: 48,897
15% lower: 39,542
30% lower: 39,542
50% higher:
39,542 30% higher: 31,549
30% lower: 39,542
6. Self-consumption [%]
48.07
30% lower: 35.82
15% lower: 48.07
30% lower: 48.07
50% higher: 48.07 30% higher:
58.26 30% lower: 48.07
7. Maximum line capacity flow [kWh] 8037
30% lower: 8251
15% lower: 8037
30% lower: 8037
50% higher:
8037 30% higher: 8217
30% lower: 8037
8. Capital costs of the ICES components *€]
25,720,000
30% lower: 25,720,000
15% lower: 21,862,000
30% lower: 25,720,000
50% higher: 25,720,000 30% higher:
25,720,000 30% lower: 18,004,000
9. Payback time of ICES related capital costs [Years]
8.72
30% lower: 7.73
15% lower: 7.47
30% lower:
9.56
50% higher: 10.96
30% higher: 10.37
30% lower: 6,15
Table C.6: Numerical output of scenario 6.

84
Scenario 7: Full, Low, Low, Full (Full heat pumps and energy efficient buildings, low RES)
Key Performance Indicator
Stable future development
Electricity demand
ICES capital costs
APX electricity price
Natural gas price
1. CO₂ emission *Ton CO₂/year+
2581
30% lower: 1386
15% lower: 2581
30% lower: 2581
50% higher:
2581 30% higher: 3951
30% lower: 2581
2. Self-sufficiency [%]
53.61
30% lower: 65.26
15% lower: 53.61
30% lower: 53.61
50% higher:
53.61 30% higher: 44.70
30% lower: 53.61
3. Total energy demand per household [GJ/household/year] 8.72
30% lower: 6.10
15% lower: 8.72
30% lower: 8.72
50% higher:
8.72 30% higher: 11.27
30% lower: 8.72
4. Yearly cost of operation of the ICES of Buiksloterham per household *€/household/year+
357
30% lower: 229
15% lower: 357
30% lower: 363
50% higher: 357
30% higher: 498
30% lower: 357
5. Total renewable energy exported to the central grid [GJ/year]
1,990
30% lower: 4,100
15% lower: 1,990
30% lower: 1,990
50% higher:
1,990 30% higher: 972
30% lower: 1,990
6. Self-consumption [%]
89.63
30% lower: 78.22
15% lower: 89.63
30% lower: 89.63
50% higher: 89.63 30% higher:
95.01 30% lower: 89.63
7. Maximum line capacity flow [kWh] 3089
30% lower: 2414
15% lower: 3089
30% lower: 3089
50% higher:
3089 30% higher: 4130
30% lower: 3089
8. Capital costs of the ICES components *€] 62,430,000
30% lower: 62,430,000
15% lower: 53,065,500
30% lower: 62,430,000
50% higher: 62,430,000 30% higher:
62,430,000 30% lower: 43,701,000
9. Payback time of ICES related capital costs [Years]
22.97
30% lower: 19.26
15% lower: 19.43
30% lower:
23.07
50% higher: 22.97
30% higher: 28.86
30% lower: 16.04
Table C.7: Numerical output of scenario 7.

85
Scenario 8: Full, High, Low, High (Maximum ICES investments, but low community RES)
Key Performance Indicator
Stable future development
Electricity demand
ICES capital costs
APX electricity price
Natural gas price
1. CO₂ emission *Ton CO₂/year+
1913
30% lower: 1035
15% lower: 1913
30% lower: 1913
50% higher:
1913 30% higher: 2961
30% lower: 1913
2. Self-sufficiency [%]
65.30
30% lower: 73.40
15% lower: 65.30
30% lower: 65.30
50% higher:
65.30 30% higher: 58.48
30% lower: 65.30
3. Total energy demand per household [GJ/household/year] 8.67
30% lower: 6.08
15% lower: 8.67
30% lower: 8.67
50% higher:
8.67 30% higher: 11.27
30% lower: 8.67
4. Yearly cost of operation of the ICES of Buiksloterham per household *€/household/year+
245
30% lower: 140
15% lower: 245
30% lower: 271
50% higher: 245
30% higher: 362
30% lower: 245
5. Total renewable energy exported to the central grid [GJ/year]
15,672
30% lower: 20,033
15% lower: 15,672
30% lower: 15,672
50% higher:
15,672 30% higher: 12,462
30% lower: 15,672
6. Self-consumption [%]
58.03
30% lower: 46.30
15% lower: 58.03
30% lower: 58.03
50% higher: 58.03 30% higher:
66.88 30% lower: 58.03
7. Maximum line capacity flow [kWh] 4942
30% lower: 4942
15% lower: 4942
30% lower: 4942
50% higher:
4942 30% higher: 4578
30% lower: 4942
8. Capital costs of the ICES components *€] 73,044,000
30% lower: 73,044,000
15% lower: 62,087,400
30% lower: 73,044,000
50% higher: 73,044,000 30% higher:
73,044,000 30% lower: 51,130,800
9. Payback time of ICES related capital costs [Years]
23.00
30% lower: 20.31
15% lower: 19.58
30% lower:
23.77
50% higher: 23.00
30% higher: 26.97
30% lower: 16.09
Table C.8: Numerical output of scenario 8.
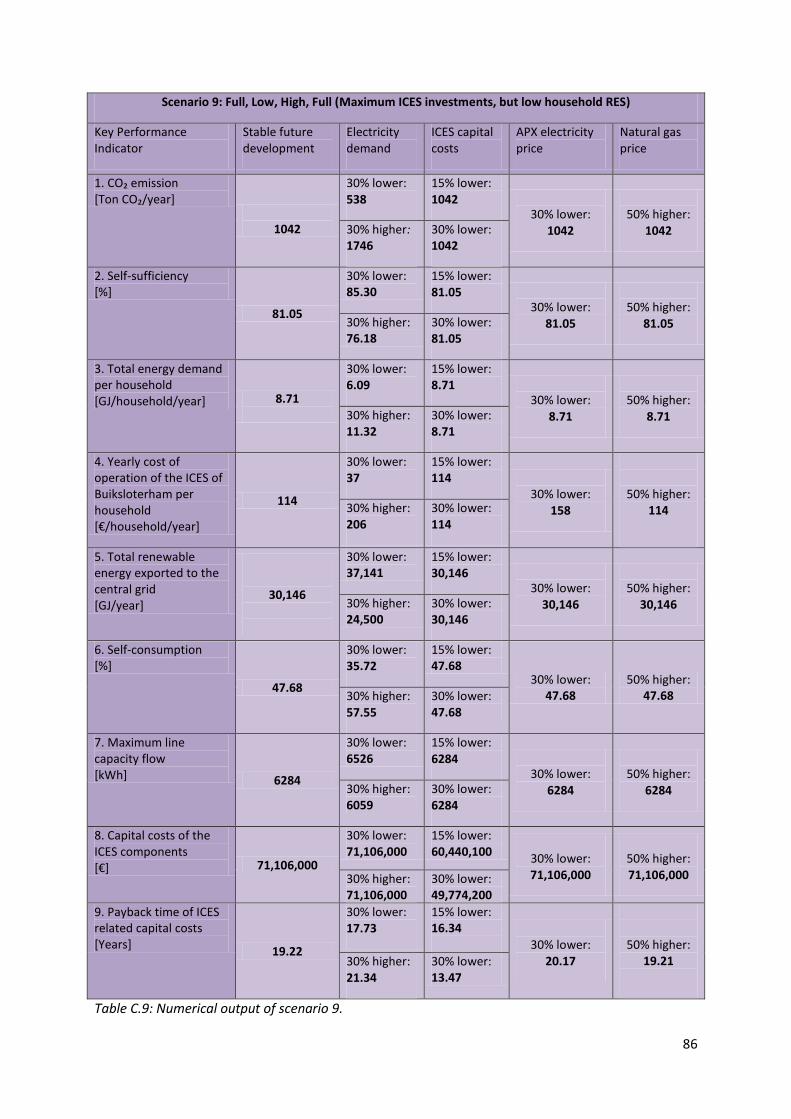
86
Scenario 9: Full, Low, High, Full (Maximum ICES investments, but low household RES)
Key Performance Indicator
Stable future development
Electricity demand
ICES capital costs
APX electricity price
Natural gas price
1. CO₂ emission *Ton CO₂/year+
1042
30% lower: 538
15% lower: 1042
30% lower: 1042
50% higher:
1042 30% higher: 1746
30% lower: 1042
2. Self-sufficiency [%]
81.05
30% lower: 85.30
15% lower: 81.05
30% lower: 81.05
50% higher:
81.05 30% higher: 76.18
30% lower: 81.05
3. Total energy demand per household [GJ/household/year] 8.71
30% lower: 6.09
15% lower: 8.71
30% lower: 8.71
50% higher:
8.71 30% higher: 11.32
30% lower: 8.71
4. Yearly cost of operation of the ICES of Buiksloterham per household *€/household/year+
114
30% lower: 37
15% lower: 114
30% lower: 158
50% higher: 114
30% higher: 206
30% lower: 114
5. Total renewable energy exported to the central grid [GJ/year]
30,146
30% lower: 37,141
15% lower: 30,146
30% lower: 30,146
50% higher:
30,146 30% higher: 24,500
30% lower: 30,146
6. Self-consumption [%]
47.68
30% lower: 35.72
15% lower: 47.68
30% lower: 47.68
50% higher: 47.68 30% higher:
57.55 30% lower: 47.68
7. Maximum line capacity flow [kWh] 6284
30% lower: 6526
15% lower: 6284
30% lower: 6284
50% higher:
6284 30% higher: 6059
30% lower: 6284
8. Capital costs of the ICES components *€] 71,106,000
30% lower: 71,106,000
15% lower: 60,440,100
30% lower: 71,106,000
50% higher: 71,106,000 30% higher:
71,106,000 30% lower: 49,774,200
9. Payback time of ICES related capital costs [Years]
19.22
30% lower: 17.73
15% lower: 16.34
30% lower:
20.17
50% higher: 19.21
30% higher: 21.34
30% lower: 13.47
Table C.9: Numerical output of scenario 9.
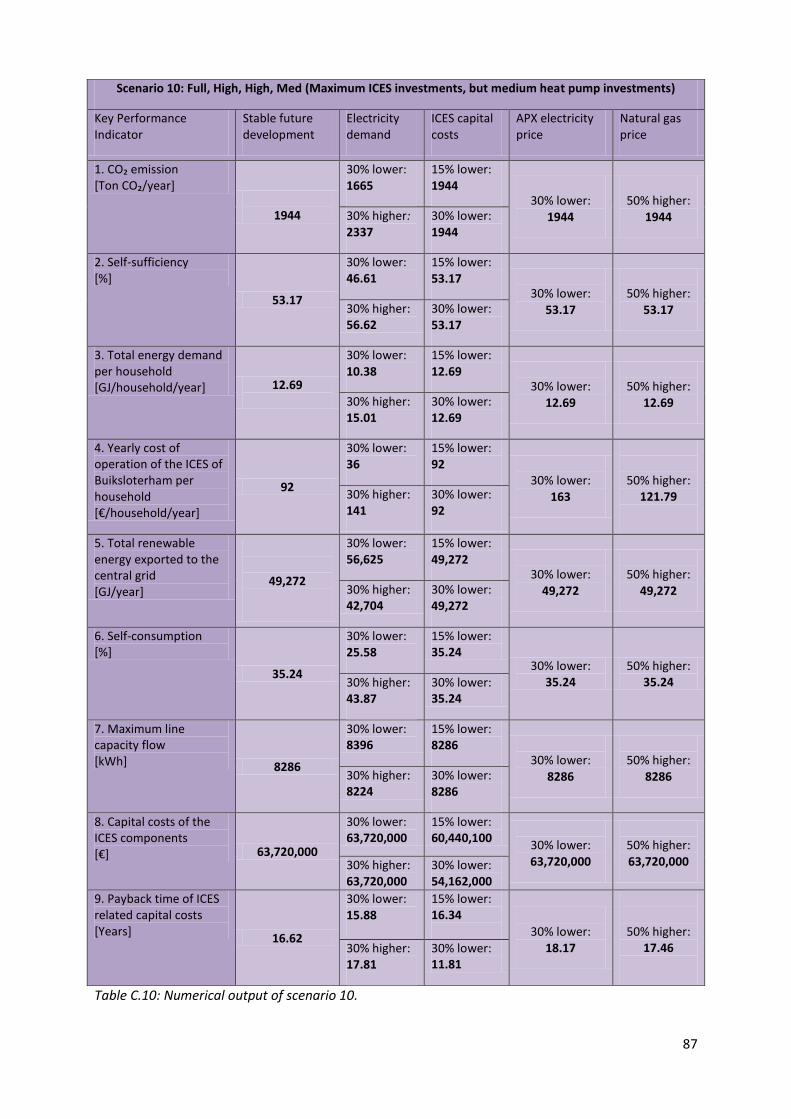
87
Table C.10: Numerical output of scenario 10.
Scenario 10: Full, High, High, Med (Maximum ICES investments, but medium heat pump investments)
Key Performance Indicator
Stable future development
Electricity demand
ICES capital costs
APX electricity price
Natural gas price
1. CO₂ emission *Ton CO₂/year+
1944
30% lower: 1665
15% lower: 1944
30% lower: 1944
50% higher:
1944 30% higher: 2337
30% lower: 1944
2. Self-sufficiency [%]
53.17
30% lower: 46.61
15% lower: 53.17
30% lower: 53.17
50% higher:
53.17 30% higher: 56.62
30% lower: 53.17
3. Total energy demand per household [GJ/household/year] 12.69
30% lower: 10.38
15% lower: 12.69
30% lower: 12.69
50% higher:
12.69 30% higher: 15.01
30% lower: 12.69
4. Yearly cost of operation of the ICES of Buiksloterham per household *€/household/year+
92
30% lower: 36
15% lower: 92
30% lower: 163
50% higher: 121.79
30% higher: 141
30% lower: 92
5. Total renewable energy exported to the central grid [GJ/year]
49,272
30% lower: 56,625
15% lower: 49,272
30% lower: 49,272
50% higher:
49,272 30% higher: 42,704
30% lower: 49,272
6. Self-consumption [%]
35.24
30% lower: 25.58
15% lower: 35.24
30% lower: 35.24
50% higher: 35.24 30% higher:
43.87 30% lower: 35.24
7. Maximum line capacity flow [kWh] 8286
30% lower: 8396
15% lower: 8286
30% lower: 8286
50% higher:
8286 30% higher: 8224
30% lower: 8286
8. Capital costs of the ICES components *€] 63,720,000
30% lower: 63,720,000
15% lower: 60,440,100
30% lower: 63,720,000
50% higher: 63,720,000 30% higher:
63,720,000 30% lower: 54,162,000
9. Payback time of ICES related capital costs [Years]
16.62
30% lower: 15.88
15% lower: 16.34
30% lower:
18.17
50% higher: 17.46
30% higher: 17.81
30% lower: 11.81
Top Related
Copyright © 2022 FDOKUMEN

