
!['Pie Memorie' [An Unknown Motet by Noel Bauldeweyn]](https://static.fdokumen.com/doc/165x107/6334bb0b6c27eedec605dd06/pie-memorie-an-unknown-motet-by-noel-bauldeweyn.jpg)


Bahasa
Halaman
Hukum


ORI GIN AL PA PER
The tropical storm Noel and its effects on the territoryof the Dominican Republic
Michela Izzo Æ Pietro Patrizio Ciro Aucelli Æ Yudith Javier ÆCaridad Perez Æ Carmen Maria Rosskopf
Received: 9 November 2008 / Accepted: 17 June 2009� Springer Science+Business Media B.V. 2009
Abstract In the period between the end of October and the beginning of November 2007,
the Dominican Republic was hit by the tropical storm Noel, then turned into hurricane in
its movement toward the Californian coasts. The passage of Noel was accompanied by
huge precipitation especially in the south-western part of the country. In some areas, the
rainfall registered in 6 days exceeded 700 mm, i.e., more than two-thirds of the mean
annual precipitation. The return periods calculated for this rainfall event vary greatly from
region to region: while they locally reach 200 years, such as in San Jose de Ocoa (50 km
west of Santo Domingo), in other areas, as for instance in the territory of the capital Santo
Domingo, return periods do not exceed 20 years. The tropical storm caused huge damage
both in terms of human victims and economic losses, related to diffused inundations and
landslide phenomena, which may be attributed only partially to the exceptionality of the
event. As a matter of fact, in many regions, the inadequate answer of the territory—widely
characterized by serious problems of land degradation and an almost complete lack of
territorial planning—appears to be the major responsible for the occurred negative effects.
The impact assessment, based on the calculation of an Impact Index, confirms this
statement.
Keywords Tropical storm Noel � Storm impact � Geomorphologic hazard �Land management � Dominican Republic
M. Izzo (&) � C. M. RosskopfDepartment of Sciences and Technologies for the Environment and Territory, University of Molise,C.da Fonte Lappone, Pesche, IS, Italye-mail: [email protected]
P. P. C. AucelliDiSAm, University of Naples ‘‘Parthenope’’, Centro Direzionale, isola C/4, 80143 Naples, Italy
Y. JavierNational Hydraulic Resources Institute (INDRHI), Av. Jimenez Moya, Centro de los Heroes,Santo Domingo, Dominican Republic
C. PerezNational Meteorological Office (ONAMET), Santo Domingo Este, Dominican Republic
123
Nat HazardsDOI 10.1007/s11069-009-9417-9

AbbreviationsCODOCAFE Consejo Dominicano del Cafe (Dominican Coffee Council)
ECLAC Economic Commission for Latin America and the Caribbean
GEF Global Environment Facility
INDRHI Instituto Nacional de Recursos Hidraulicos (National Hydraulic Resources
Institute of the Dominican Republic)
IPCC Intergovernamental Panel on Climate Change
NOAA National Oceanic and Atmospheric Administration
ONAMET Oficina Nacional de Meteorologıa (National Meteorological Office of the
Dominican Republic)
SEMARENA Secreatarıa de Estado de Medio Ambiente y Recursos Naturales (Ministry
of Environment of the Dominican Republic)
SGP Small Grants Programme
UNDP United Nations Development Programme
WFP World Food Programme
1 Introduction
Between the end of October and the beginning of November 2007, the territory of the
Dominican Republic (Fig. 1) was affected by the passage of the tropical storm Noel, which
caused heavy precipitation all over the country, especially in the southern and south-
western part of it.
Fig. 1 Location and main physiographic features of the Dominican Republic. The rectangle identifies thestudy area
Nat Hazards
123

After the phase of emergency, various programs of disaster recovery were started in the
country. According to a medium-term perspective, actions related to such programs try to
guarantee the survival of rural communities, seriously challenged by the destruction of
crops, agricultural lands and infrastructures, first of all those related to communication.
Programs such as the Small Grants Programme (SGP/GEF/UNDP) and the Food for Work
by the WFP (World Food Programme) are trying to create the conditions for an efficient
recovery of rural communities, highly exposed to land abandonment and consequent
increase of emigration toward urban areas, as already observed only a few days after the
storm.
This study presents a general characterization of the storm and a first evaluation of its
impact on the territory of the Dominican Republic. Given the large extent of the
Dominican territory, the investigation on storm effects was necessarily limited to some
minor, most impacted, areas. Therefore, attention was focused on the Nizao and Haina
hydrographical basins, located in the central-southern sector of the Dominican Republic
(Fig. 1), where very high amounts of rainfall and the hugest damage were registered. The
results of the analysis of the effects of the storm within the two hydrographic basins, which
are characterized by areas of high socio-economic and strategic importance, are presented,
and implications in terms of land management are discussed.
The Dominican Republic is located in the Caribbean region between 17�360 and 19�580
of latitude North and between 68�190 and 72�010 of longitude West, and belongs, as
Jamaica, Cuba, Haiti and Porto Rico, to the Great Antilles (Fig. 1). It is part of the
Hispaniola island, occupying its eastern portion and about two-thirds of its surface, while
the western portion is occupied by Haiti (26,100 km2). The Dominican territory has an area
of about 48,400 km2 and maximum east–west and north–south extensions of 390 and
265 km, respectively (Marcano 2007). Its external perimeter is 1,963 km, 1,575 km of
which is represented by its coasts, while 488 km refers to the border with the adjacent state
of Haiti.
The physiographic structure of the Hispaniola island is strongly controlled by the
presence of young mountainous structures. The main mountain chains and valleys are
frequently controlled by active fault systems with a prevalent NE–SW orientation (Mann
et al. 1990, 1995), evolving under the control of the complex dynamics of Caribbean
tectonics (Lewis 1980; Burke et al. 1984; DeMets et al. 1990). The island is characterized
by four main mountain chains: from NE to SW, the Cordillera Septentrional, the Cordillera
Central, the Sierra de Neyba and the Sierra de Bahoruco, where the highest peaks of the
Antilles are located (in the Cordillera Central, Pico Duarte and La Pelona reach 3,087 and
3,085 m, respectively). These mountain chains are separated by three major NW–SE
oriented tectonic depressions, which are occupied by the Cibao valley, the San Juan valley
and the Enriquillo valley (Fig. 1).
From a geological point of view, the Dominican territory is characterized by the
following main rocks: volcanic and metamorphic Cretaceous rocks, intrusive Cretaceous
and Tertiary rocks and sedimentary rocks of Cretaceous to Pleistocene age (Toloczyki
and Ramırez 1991). Sedimentary successions deformed by compressive tectonics widely
crop out in the Sierra de Neyba and Sierra de Bahoruco areas, while volcanic and
metamorphic rocks constitute the bulk of the Cordillera Central (Toloczyki and Ramırez
1991). Beneath the influence of the Dominican climate (see paragraph 3), outcropping
rocks are affected by intensive meteoric weathering, which produces a thick soil-regolith
cover.
Nat Hazards
123

2 Main geological–environmental features of the Haina and Nizao hydrographicbasins
The Haina and Nizao hydrographic basins were selected to investigate in detail the ground
effects produced by the passage of the storm Noel. These basins are located in the south-
eastern portion of the Cordillera Central (Fig. 1), which hosts most of the physiographic
and morphodynamic environments, which typically characterize the central-southern
sector of the Dominican Republic. The selected basins are of fifth order, and they are
characterized by an area of 564 and 1,036 km2 and an average altitude of 330 and 809 m
asl, respectively.
Starting from elevations up to 2,000 m asl, typical for the northern and north-western
portions of the Nizao basin (Fig. 2), the Haina and Nizao rivers reach the Caribbean Sea
crossing a wide hilly-mountainous region. Major peaks are Loma El Pinchon (2,354 m),
Loma de la Piedra de Manuel (2,600 m), Loma Alto de la Bandera (2,842 m) and Alto de
la Lechuguilla (2,540 m) in the North, and Alto de la Lechuga (2,400 m) and Loma de los
Chivos (2,073 m) in the Northwest.
Hilly-mountainous to high-mountainous terrains largely dominate in the Nizao basin
(nearly 78%), while they are very limited in the Haina basin (4%). The latter, in fact, is
characterized primarily by a coastal to hilly-territory located beneath 500 m asl (about
76.5%) and secondarily by hilly-mountainous terrains (19.5%).
About one-third and two-thirds of the Nizao and Haina basins respectively are char-
acterized by slope gradients less than 10 degrees, and about 93 and 98.4% respectively by
slope gradients less than 30 degrees (Table 1). Only the Nizao basin shows an appreciable
percentage (about 6.8%) of areas with slopes exceeding 30 degrees. The latter are con-
centrated within the northern portion and part of the central portion of the basin where
volcanic and sedimentary rocks crop out. Within the remaining central portion of the basin,
instead, where granitic rocks are typical, valley incisions are characterized by less steep
Fig. 2 Location and altitudinal characteristics of the Nizao and Haina hydrographical basins
Nat Hazards
123

flanks, generally under 20 degrees. In the Haina basin, the areas with the highest local
relief and the steepest slopes are limited to its western and north-western portions, while
the remaining zones are prevalently hilly or flat.
Within the headwater portions of the two basins, narrow valleys dominate that are
drained by steep, entrenched, cascading, step-pool streams characterized by a torrential
regime. Within the middle-upper basin portions, valley incisions are generally larger, and
streams are partially unconfined and characterized by a braided to sinuous (Rancho Arriba)
and, finally, meandering pattern (Villa Altagracia) where floodplains locally reach 2 km of
width. The lower basin portions are characterized by coastal and alluvial plains stretching
up to 15 km from the coastline and streams having a typical meandering channel pattern.
On the basis of main course lengths of 77 and 133 km, respectively, a corrivation period
of 14.5 and 13.8 h was estimated for the Haina and Nizao basin, respectively, by applying
the Giandotti method (Giandotti 1934, 1940).
The hilly to mountainous portions of the two basins slopes are characterized by more or
less thick soil-regolith mantles, which are highly unstable, especially where man has
removed the original forest cover for cultivations during the last centuries. According to
the land use map of the Dominican Republic, cultivated lands are in fact very widespread,
occupying 43% of the territory in the Haina basin. Coffee is largely cultivated, especially
in the headwater sectors of the two basins. In the high-mountainous zone of the Nizao
basin, forests prevail.
Rural population is typically distributed in permanent villages, which are composed of
the most internal areas of about one hundred families living in wooden and zinc houses.
Maintenance of this population is based on subsistence farming, consisting in clearing
small migratory farms of short cycle products (conuco, as this practice is locally called).
This type of farming, typical in mountainous steep-sloped areas, is characterized by low
productivity and causes a progressive land degradation. Cleared lands guarantee the sus-
tenance of a family of peasants only for a few months. In fact, rapid soil loss due to
accelerated erosion by running waters and mass wasting affect extensively the scarcely
protected slopes, causing lands to turn rapidly unproductive and obliging the peasant to
deforest nearby areas and repeat the same cycle.
It is important to point out that in the San Cristobal Province, which occupies the major
part of the Haina hydrographical basin and almost half of the Nizao basin, the average
population density is about 420 inhabitants/km2, according to the National Statistical
Office. Some of the biggest urban centers, such as the town of Los Cacaos (7,494
inhabitants according to the last population census by the National Statistical Office), are
located in inter-mountainous valleys at stream confluences.
The two hydrographical basins are very important also from an infrastructural and
industrial point of view and strategic in terms of water supply for one of the most populous
Table 1 Morphologic-altitudinal and slope features of the Haina and Nizao hydrographic basins
Morphologic units and relativealtitudinal limits (m asl)
NIZAO(%)
HAINA(%)
Slope classes(�)
NIZAO(%)
HAINA(%)
Alluvial and coastal plains (B50) 3.98 13.35 B 10 32.37 61.94
Hilly terrains (50 7 500) 18.14 63.18 10 7 20 38.63 24.41
Hilly-mountainous terrains (500 7 1,000) 43.68 19.45 20 7 30 22.22 12.01
Mountainous terrains (1,000 7 2,000) 27.26 4.02 30 7 40 6.11 1.62
High-mountainous terrains ([2,000) 6.94 0.00 [40 0.67 0.02
Nat Hazards
123

zones of the Dominican Republic (INDRHI 2006) as the Haina-Manoguayabo drainage
system provides 25% of the water supplied to the capital, according to a study carried out
in 2004 for the Aqueduct Corporation of Santo Domingo.
The road network, which connects the biggest urban centers of the country, develops
along the main water courses. Within the middle course of the Haina river, the Autopista
Duarte, the highway, which connects Santo Domingo to Santiago, the second urban center
of the Dominican Republic, runs along the valley floor.
The coastal and alluvial plains, characterized by high fertility, show the highest con-
centration of anthropic activities (mechanized intensive agriculture, industries, etc.) and
elevated population densities that reach 5,000 inhabitants/km2 in the area of Bajos de
Haina.
One of the biggest industrial poles of the country is located at the Haina river mouth,
which is characterized by artificial banks to protect the populous urban and industrial pole.
In this area, adjacent to the capital Santo Domingo, more than 100 industries can be found,
ranging from manufacturing to chemical, metallurgic and pharmaceutical industries, in
addition to electric power plants and the Dominican oil refinery. In 2006, this industrial
pole, known as Bajos de Haina, was listed among the ten most contaminated sites in the
world (Caravanos and Fuller 2006), because of its very high environmental lead concen-
trations, caused by a company recycling car batteries.
3 Climatic features of the Dominican Republic
Following the classification of Koppen (1936), the climate of the Dominican Republic can
be referred to class A (tropical rainy climates), which is characterized by monthly mean air
temperatures above 18�C and annual mean rainfall amounts, which exceed annual
evapotranspiration.
At a more detailed scale, the climate of the Dominican Republic appears strongly
influenced by its orography and hydrography, which are responsible for the high envi-
ronmental diversity not only between coastal areas and the internal hilly-mountainous
zones, but also between regions located at similar altitudes in different parts of the country.
According to Cocco Quezada (2001), the Hispaniola island is under the influence of the
North-Atlantic anticyclone, regulator of trade winds, and of the humid oceanic tropical air
masses, which, due to the perturbation by summer tropical waves, are responsible for a
great part of precipitation in the country. During winter, fronts and vaguadas, (the latter
corresponds to the Spanish name for an elongated barometric depression between two
anticyclones), are responsible for important precipitation during this season.
On the basis of these considerations, Cocco Quezada (2001) elaborated a climate
classification for the Dominican Republic based on the following climatic periods: a period
of frontal activity from November to April; a period of convective activity from May to
July, characterized by a reinforcement of eastern winds, which causes an intense con-
vection and the development of huge clouds and consequent thunderstorms and electric
storms; a period of tropical activity from August to October, characterized by abundant
precipitation. These three periods are accompanied by two short transition periods: the first
one in the second half of April, when the passage from frontal to convective activity
occurs, and the second one in the second half of November, when the cyclonic activity is
progressively replaced by the frontal one.
This type of classification allows to explain the reduction of precipitation in the northern
coastal plains, the presence of summer precipitation in the south of the country and the
Nat Hazards
123

occurrence of seasonal drought periods in different parts of the country. The weather and
climate of the island are highly influenced by the presence of mountain chains aligned
perpendicularly to the prevalent eastern currents. Their presence causes a remarkable
difference in mean annual rainfall between the areas located northeast and southwest of the
Cordillera Central, respectively. The first, in fact, are characterized by rainfall amounts
exceeding 2,000 mm, while the second receives very modest totals of 350–400 mm,
denoting conditions of arid environment (Koppen category BShw, warm arid steppe cli-
mate). Following the Koppen classification, in the country all the three subcategories of
climate A are present: Af (tropical rain forest climate), typical of the Samana peninsula, the
Cordillera Oriental, the Los Haitises karstic zone, the low Yuna valley and, partially, the
Cordillera Septentrional and the Sierra de Bahoruco; Am (tropical monsoon climate),
which can be identified in the area of Cabrera, Cotuı, El Seibo, Monte Plata, San Cristobal,
Villa Altagracia, Villa Riva, Yamasa and Yasica; Aw (tropical wet and dry or savanna
climate) typical for the Santo Domingo province. Finally, in the zone of Constanza valley
and within the highest mountainous areas, the climate category Cf (wet temperate climate)
can be recognized (Marcano 2007).
The analysis of the spatial distribution of some of the main climatic parameters, such as
air temperature and precipitation, allowed to define, as shown in Fig. 3, the Bagnouls–
Gaussen and Peguy diagrams for the weather stations, which represent the main climatic
regions of the country. In particular, the Bagnouls–Gaussen diagram (Gaussen and Bag-
nouls 1957; Bagnouls and Gaussen 1953) shows the relation between average monthly
rainfall amounts (in mm) and relative air temperatures (in �C) calculated for the 30-year
period 1971–2000 for the considered weather stations. The diagram allows to define a dry
period when the amount of average monthly precipitation is lower than the double of the
monthly mean temperature. The Peguy diagram (Peguy 1970) is based on the represen-
tation of segments, which join the monthly average values of air temperature and pre-
cipitation. Four sectors (C = Cold months; T = Temperate months; H = Hot months;
D = Dry months) are identified as the intersection of three straight lines: y = 1.71x;
y = 13.3x; and y = -19x ? 485.7.
The presented diagrams evidence a gradual reduction of precipitation from east to west.
For the eastern zones, even though a typical reduction of precipitation is clearly evident
during winter and spring, no arid period can be identified. The western zones, instead, are
characterized by a more or less pronounced aridity. In particular, within the south-western
sector (Barahona), aridity characterizes the periods from December to February and from
July to August, while it extends for the whole summer period (May–September) within the
north-western sector showing similarities to Mediterranean climate (Monte Cristi).
Typical elements of temperate climate appear in mountainous zones (Constanza), where
the elevation causes a considerable reduction of mean annual air temperature. As a matter
of fact, the mean annual air temperature, which is about 26�C for the country as a whole, at
altitudes above 1,200 m in some areas of the Cordigliera Central drops down to less than
18�C. Figure 4 shows the spatial distribution of mean annual precipitation (A) and that of
annual minimum and maximum temperatures (B and C) for the 30-year period 1971–2000.
The Dominican territory is characterized by a further important climatic aspect as it
belongs to the latitudinal zone interested by atmospheric phenomena known as tropical
cyclones.
Cyclones typically originate during summer when the warming of the oceanic surface is
maximum, from the beginning of June until the end of November in the Atlantic (Landsea
1993). Initially, cyclones move westwards, under the driving force of the easterlies that
flow at the latitudes where the cyclones take origin (between 5 and 30�), and then they
Nat Hazards
123

move slowly toward the poles. A lot of cyclones turn far enough from the Equator
reaching, at mid latitudes, areas dominated by western winds, which cause an inversion in
the direction of cyclones, which consequently move eastward (MetOffice 2008). According
to data from NOAA, the trajectory of a cyclone has a typical evolution depending on the
month of the year. In Fig. 5, the typical trajectories for June, July, August and September
are shown.
4 Dynamics and evolution of the storm
According to the Saffir–Simpson scale (Simpson and Riehl 1981), which classifies tropical
cyclones in relation to their intensity, Noel reaches the category of Hurricane 1, hitting the
Dominican territory as a tropical storm.
As described in Brown (2007), the development of the tropical cyclone Noel took its
origin from a tropical wave, which left the western coasts of Africa on October 16th.
During the following 7 days, the wave moved westwards across the eastern Atlantic
without showing any element of organization. On October 22nd, it reached the Lesser
Antilles as tropical wave. From that moment on, it started its interaction with a superficial
low pressure situated northward of Leeward Islands and with an upper-level trough
extending south-westward from the Atlantic Ocean to the eastern portion of the Caribbean
Sea. On October 23rd, this interaction caused the development of a low pressure area at
280 km ENE of northern Leeward Islands. Then, the new baric minimum moved slowly
westward, producing disorganized electric activity in the following 2 days, while upper-
level strong west winds inhibited further development. On October 25th, the low pressure
area turned west-south-westward, moving over the Virgin Islands and passing near the
south-eastern coast of Puerto Rico on October 26th. On October 27th, the upper-level west
Fig. 3 Thermo-pluviometric diagrams of some stations in the country: Bagnolus-Gaussen on the left; Peguyon the right
Nat Hazards
123

winds started to decrease, allowing convection to develop. An increase in the level of
organization, occurred on October 27th around midnight, caused the phenomenon to
convert in a tropical depression, about 340 km SSE of Port-Au-Prince.
Fig. 4 Territorial distribution of mean annual precipitation (a), mean annual minimum temperature (b) andmean annual maximum temperature (c) (reference period 1971–2000)
Nat Hazards
123

After its formation, the depression moved north-westwards. Convection continued to
increase, and typical banding features became evident from the early morning hours of
October 28th, when the phenomenon reached the category of tropical storm. Thereafter,
Noel continued to strengthen, reaching 6 h later an intensity of 50 knots (92.6 km/h). On
October 29th, following its north-western trajectory toward the southern coast of Haiti, the
interaction with mountainous terrain caused the disruption of the low-level circulation.
Consequently, wind velocity dropped to 45 knots (83.3 km/h).
The organization of the storm considerably reduced during its passage along the western
coast of Haiti. In its westward movement, the phenomenon regained strength passing over
the western Atlantic reaching an intensity of 50 knots (92.6 km/h) along the northern coast
of eastern Cuba. The storm remained over the Cuban territory for about 30 h, during which
it slightly reduced its intensity. The following passage over the ocean at north of Cuba,
accompanied by a progressive increase in convection, caused the storm to strengthen
progressively since it reached the category of hurricane on November 2nd, at north-west of
the Bahamas. Continuing its trajectory northwards, the hurricane progressively weakened,
and finally it merged with another extratropical low near the coasts of Greenland. Figure 6
shows the evolution of the tropical storm during its passage over the Dominican territory.
A synthesis of the geophysical parameters of the storm is reported in Table 2. The
maximum rainfall (about 1,000 mm) occurred in the territory of Hispaniola.
5 Intensity of the storm event
The passage of the tropical storm Noel over the territory of the Dominican Republic
(Fig. 6) caused heavy and persistent rainfall. Even though the cyclone was centered over
Haiti, its highly asymmetric structure provoked the most of precipitation to occur east of it.
More than wind intensity, the abundant rainfalls caused the most of impacts, even though
in Barahona and surrounding areas (SW of the country), winds up to 60 knots (111.1 km/h)
were registered (Brown 2007).
Fig. 5 Prevailing tracks of tropical cyclones from June to September in the Atlantic ocean (from NOAAmodified)
Nat Hazards
123

The meteorological reconstruction of the storm event was carried out using data reg-
istered by the National Meteorological Office (ONAMET) and the National Hydraulic
Resources Institute (INDRHI).
The spatial distribution of precipitation associated with the event (Fig. 7) shows that,
coherently with the storm trajectory, the most of rainfall occurred in the south and
southwest of the country. In particular, the Cordillera Central acted as a barrier, causing
differences in precipitation up to 500–600 mm between the southern and the northern flank
of the mountain chain.
Fig. 6 Evolution of the tropical cyclone Noel (source: UNISYS 2008)
Table 2 Geophysical parameters of the storm (according to Brown 2007)
Parameter Phenomenon category
Low (L) Tropicaldepression (TD)
Tropical storm(TS)
Hurricanecat.1 (H1)
Extratropicalcyclone (E)
Duration (hours) 96 12 108 24 72
Track length (km) 1,356 79 1,676 778 3,883
Land track length(km)
2 (PuertoRico)
0 458 (Haiti, Cuba,The Bahamas)
0 947 (Canada,Greenland)
Velocity (km/h) 14 7 16 32 54
Minimumpressure (mbar)
1,004 1,002 992 980 965
Maximum windspeed (m/s)
13 15 28 36 39
Nat Hazards
123

Confronting monthly precipitation occurred in the Dominican territory during 2007 with
the mean values (normal) registered during the 30-year period 1971–2000 (Fig. 8), two
main anomalies can be evidenced: the central and southern weather stations registered
monthly precipitation inferior or equal to the normal, while the northern stations show a
very inhomogeneous distribution of their rainfall amounts, significantly higher than the
normal in the majority of months, separated by one or more months with precipitations
similar to considerably lower than the normal (Arroyo Barril and Sabana de la Mar sta-
tions). Deviations of total average rainfall amounts and those registered during 2007,
calculated as percentage of [(total precipitation 2007-average annual precipitation)/
average annual precipitation], produce a typical zonation of the Dominican territory
(Fig. 8), which highlights the zones that were characterized in 2007 by an excess (over all
the central sector) and by a deficit of total annual rainfall (the north-western and eastern
sectors) with respect to the normal.
From a general point of view, a strong reduction of monthly rainfall in 2007 can be
observed for February, which is one of the driest months. On the other hand, October 2007
was definitely more rainy than the average (Fig. 9). Most of the stations (see for example
Fig. 8) registered daily values mostly beneath the normal during the weeks, which pre-
ceded the storm and a maximum of precipitation at the end of October, during the passage
of the tropical storm. Throughout the whole national territory, the precipitation registered
during this month presents positive percentages of deviation from the normal, with values
from 20% up to five times higher than the average (Rancho Arriba station).
In order to estimate the return periods of the storm event, total precipitation in 24 h and
6 days respectively, were compared with the historical series of Santo Domingo, Barahona,
Constanza, San Jose de Ocoa and San Cristobal, applying the First Type Gumbel distribution
(Gumbel 1958), with a percentage of available data generally around 80%. Data from the
stations of Villa Altagracia and Rancho Arriba were excluded from the analysis because of
their high percentage of no data. Performance of the chi-square test has shown that data are
distributed according to the First Type Gumbel distribution, at a confidence level of 95%.
The obtained results (Table 3) show that the storm cannot be defined as exceptional in
relation to daily rainfall amounts, as the calculated return periods are very short and only
Fig. 7 Distribution of precipitation and rain volumes in the main hydrographic basins from October 26th toNovember 1st 2007
Nat Hazards
123
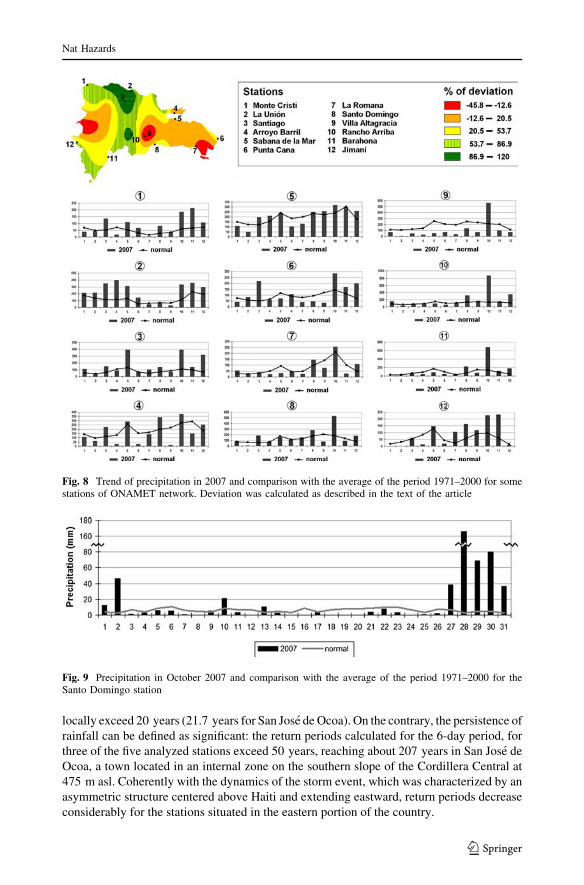
locally exceed 20 years (21.7 years for San Jose de Ocoa). On the contrary, the persistence of
rainfall can be defined as significant: the return periods calculated for the 6-day period, for
three of the five analyzed stations exceed 50 years, reaching about 207 years in San Jose de
Ocoa, a town located in an internal zone on the southern slope of the Cordillera Central at
475 m asl. Coherently with the dynamics of the storm event, which was characterized by an
asymmetric structure centered above Haiti and extending eastward, return periods decrease
considerably for the stations situated in the eastern portion of the country.
Fig. 8 Trend of precipitation in 2007 and comparison with the average of the period 1971–2000 for somestations of ONAMET network. Deviation was calculated as described in the text of the article
Fig. 9 Precipitation in October 2007 and comparison with the average of the period 1971–2000 for theSanto Domingo station
Nat Hazards
123

Ta
ble
3M
axim
um
dai
lyra
infa
llan
dra
infa
llam
ou
nts
inth
e6
-day
per
iod
regis
tere
dd
uri
ng
the
sto
rman
dre
lati
ve
retu
rnp
erio
ds
for
the
stat
ion
so
fS
anC
rist
ob
al,
San
toD
om
ing
o,
Co
nst
anza
,B
arah
on
aan
dS
anJo
sed
eO
coa
Sta
tio
nA
ltit
ud
e(m
asl)
To
tal
rain
fall
(mm
)D
ate
Ret
urn
per
iod
(yea
rs)
To
tal
rain
fall
(mm
)P
erio
dR
etu
rnp
erio
d(y
ears
)
SA
NC
RIS
TO
BA
L4
41
24
.42
9/1
0/2
00
72
.23
57
.42
8/1
0/2
007
–2
/11/2
00
79
.8
SA
NT
OD
OM
ING
O1
41
66
.22
8/1
0/2
00
74
.23
94
.32
7/1
0/2
007
–1
/11/2
00
71
8.7
CO
NS
TA
NZ
A1
,164
95
.22
9/1
0/2
00
73
.53
05
.42
5/1
0/2
007
–3
0/1
0/2
00
75
2.6
BA
RA
HO
NA
10
21
6.2
29
/10
/20
07
5.5
68
3.5
28
/10
/20
07
–2
/11/2
00
77
2.4
SA
NJO
SE
DE
OC
OA
47
51
75
.02
8/1
0/2
00
72
1.7
49
6.1
25
/10
/20
07
–3
0/1
0/2
00
72
06
.9
Nat Hazards
123

6 Main ground effects
According to an ECLAC report, the passage of the tropical storm Noel in the Dominican
territory caused 87 victims, while 48 persons resulted missing. More than 3,000 houses
were completely destroyed and other 16,000 were damaged, and about 79,000 people
remained in shelters for more than 2 weeks after the event. Two days after the passage of
the storm, the President of the Dominican Republic, on the basis of first evaluations of the
occurred devastation, declared the state of emergency in the country.
According to the same report, agriculture, the most damaged sector, was practically
kneeled down: first estimates report total damages exceeding 100 million dollars. Low
scale and subsistence agriculture were the most affected, with heavy social consequences
in particular for the most vulnerable components of the population. Musaceae (bananas and
planes) and coffee were the most damaged crops. Damages to coffee are estimated in about
6 million dollars by CODOCAFE, the main Dominican institution supporting coffee
cultivation.
Relevant damages were registered in the following provinces: the National District,
Santo Domingo, Barahona, San Pedro de Macorıs, San Cristobal, Santiago, Sanchez
Ramırez, Duarte, Samana, Azua, Independencia, Peravia, Pedernales, La Vega and Monte
Cristi. The San Cristobal and San Jose de Ocoa provinces, in whose territories the Haina
and Nizao basins are located, were among the most affected areas.
Most of the ground effects produced by the tropical storm were caused by rainfall and
consequent phenomena of river flooding and mass wasting. Only the south-western part of
the country and the Barahona province in particular were affected in a significant manner
by the action of winds (reaching up to 111 km/h), which caused huge damage to agri-
culture, infrastructures and rural structures (mainly wooden and zinc houses).
Even though data on peak discharge of rivers during the event are not available, the
observed ground effects suggest that peak discharge was considerable. An indicative
estimation was obtained through the application of the rational equation method (Kuichling
1889), which relates peak discharge to the drainage area, rainfall intensity and runoff
coefficient, the latter being based on catchment slope, land-use and hydrologic features of
soils, according to the following equation:
Q ¼ ciA
where Q is the peak discharge, c is the rational method runoff coefficient, function of the
soil type and drainage basin slope, i is the rainfall intensity, A is the drainage area.
The results show peak discharges at the river mouth around 1,500 and 2,000 m3/s for
the Haina and Nizao basins, respectively. Flooding affected the valley floors and alluvial
coastal plains to a greater extent. Its destructive effects were related both to the inundation
of land by water and to the erosion by flowing waters along river channels and within
floodplain areas. It involved wide areas pertaining to the municipalities of Rancho Arriba,
Los Cacaos and Yaguate in the Nizao basin and those of Villa Altagracia and Haina in the
Haina basin. The municipality of Villa Altagracia, where more than 30 people died in the
inter-mountainous valley of El Duey, had the highest number of victims. Here, entire rural
communities living along the river channels and within the floodplain areas (Fig. 10a–d)
pertaining to the confluence area of El Duey and Arroyo Grande rivers (both tributaries of
the Haina river) were destroyed by the flood (Fig. 10e), which surprised people during
sleep. This flood, as involved people afterwards referred, was the biggest one ever
observed in this area during the last 70 years.
Nat Hazards
123
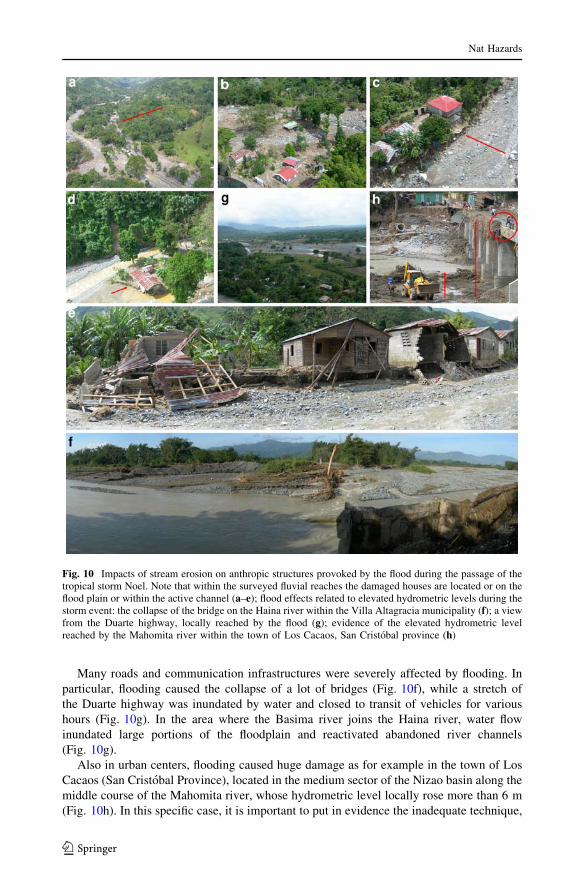
Many roads and communication infrastructures were severely affected by flooding. In
particular, flooding caused the collapse of a lot of bridges (Fig. 10f), while a stretch of
the Duarte highway was inundated by water and closed to transit of vehicles for various
hours (Fig. 10g). In the area where the Basima river joins the Haina river, water flow
inundated large portions of the floodplain and reactivated abandoned river channels
(Fig. 10g).
Also in urban centers, flooding caused huge damage as for example in the town of Los
Cacaos (San Cristobal Province), located in the medium sector of the Nizao basin along the
middle course of the Mahomita river, whose hydrometric level locally rose more than 6 m
(Fig. 10h). In this specific case, it is important to put in evidence the inadequate technique,
Fig. 10 Impacts of stream erosion on anthropic structures provoked by the flood during the passage of thetropical storm Noel. Note that within the surveyed fluvial reaches the damaged houses are located or on theflood plain or within the active channel (a–e); flood effects related to elevated hydrometric levels during thestorm event: the collapse of the bridge on the Haina river within the Villa Altagracia municipality (f); a viewfrom the Duarte highway, locally reached by the flood (g); evidence of the elevated hydrometric levelreached by the Mahomita river within the town of Los Cacaos, San Cristobal province (h)
Nat Hazards
123

which was adopted to build the bridge: short spans are not adequate for this kind of river,
which is characterized by significant solid loads and very variable flows.
Landslides occurred prevalently in the hilly-mountainous and mountainous zones of the
Haina and Nizao basins. The main types of movement were represented by slides, flows
and falls.
Debris flows and mudflows typically involved the soil and regolith mantles of steep
slopes (generally exceeding 30�) and affected mostly slopes, which had undergone recent
denudation due to the clearing of the original forest cover (Fig. 11a–c). In the investigated
basins, such flows produced a high negative impact on agriculture, based prevalently on
coffee. As a matter of fact, damage consisted not only in the loss of production, related to
the occurrence of the storm during the harvesting season, but also in the extensive land
degradation generated by soil loss or its burial due to debris accumulation.
Flows caused also the collapse of bridges and the interruption of accesses to built-up
areas with up to thousands of inhabitants. For example, the town of Los Cacaos was
accessible only by helicopter for more than 15 days. Entire suburbs of the town were
buried by debris flows (Fig. 11d), which descended from the mountainous territory sur-
rounding the town and in particular from the La Canada del Cafe hydrographical basin
where highly weathered igneous rocks are outcropping.
Landslides of minor dimensions but widely diffused were rock and earthfalls which
typically occurred along scarps characterized by excessive steepness due to artificial cuts
(for instance road cuts, Fig. 11e, f) or river undercutting during the event (Fig. 11g).
Fig. 11 Steep, mainly deforested, slopes affected by diffuse shallow earth-slides and earthflows triggeredby the rainfall during the storm event (a–c); evidence of huge debris flow impacts within the town of LosCacaos (San Cristobal) (d): rock and earthfalls occurred on very steep slopes along road cuts (e, f) andtriggered by stream undercutting (g), respectively
Nat Hazards
123

Field surveys carried out 3 months after the event in the areas, which were most
affected by landslides, revealed that the zones of depletion appeared still completely bare
and practically unmodified with respect to the morphology they showed immediately after
the storm, highlighting long periods necessary for reconstituting again the vegetation cover
and reaching, consequently, an amelioration of present slope conditions.
An evaluation of the potential damage caused by the storm was carried out applying the
Impact Index (Palmieri et al. 2006), according to the following equation:
I ¼ 0:9178þ 0:0030Lþ 0:0012D
where I is the Impact Index, L (in km) is the land track of the storm, D (in kg/s3) = CDVq,
being CD the surface drag coefficient (in the case of strong winds CD can be related to the
surface wind speed V by means of CD = (0.94 ? 0.034V)10-3), V the surface wind speed
and q the air density near the surface.
The Impact Index of the tropical storm, considering an air density of 0.9 kg/m3, is
estimated in 2.34, which represents a relatively low value (Palmieri et al. 2006).
7 Discussions and conclusions
On October 29th 2007, the Dominican Republic was hit by the Tropical Storm Noel, which
caused huge precipitation all over the country and strong winds in the South West of the
national territory.
The storm can be considered as an exceptional event as to the persistence of rainfall in
the considered 6-day period, for which recurrence periods of 50 to over 200 years could be
calculated in various provinces.
The collected data evidence that the main impacts on the population were provoked by
landslides and flooding, which accompanied the storm event.
The hugest socio-economic consequences involved rural communities, which were
affected very strongly by the interruption or destruction of communication infrastructures
and by the loss of a lot of foodstuffs and agricultural products. This created during the
weeks, which followed the storm event a very critic situation in relation to the fulfillment
of alimentary needs of the local population.
Zones where recuperation appears the most critic are those affected by landslides. In
particular, the complete removal of the vegetation cover makes very difficult, at least in the
short to medium-term period, the rehabilitation of agricultural parcels.
However, the analysis of ground effects, specifically the investigation carried out in the
Nizao and Haina basins, points out that the registered damage only partially may be
justified by the exceptionality of the event. Frequently, as stressed for natural hazards also
by Pielke et al. (2008) for other countries, human and economic losses are strongly related
to an inadequate or inexistent territorial planning. In the examined case of the Dominican
Republic, the low value of the calculated Impact Index of the storm confirms this
statement.
In the Dominican Republic, the absence of a territorial plan, together with the elevated
state of poverty of a large number of people, causes human settlements to be located
typically in areas, which are easily accessible and cultivable on one hand, but exposed, on
the other hand, to elevated geomorphologic hazard and related risk due to flooding and
slope degradation. The latter, in particular, is highly accentuated by inefficient and harmful
Nat Hazards
123

agriculture practices, based on clearing small migratory farms of short-cycle products,
which still constitutes the most frequent agricultural technique in many areas.
Within the main urban areas of the country, represented by Santo Domingo and San-
tiago de los Caballeros, entire popular suburbs (barrios) lie along large rivers, such as the
Ozama (Santo Domingo) and the Yaque del Norte (Santiago). These suburbs were among
the most damaged by the tropical storm Noel.
The exposed considerations highlight two main aspects, which can be generalized: first
of all, events as the described one that are normally defined as natural disasters should
better be defined as ‘‘manmade’’ disasters, as the provoked damage largely depends on the
high vulnerability of the territorial system and its inadequate response to the event. Sec-
ondly, such ‘‘manmade’’ disasters are typically characterized by a significant nonhomo-
geneity in the distribution and entity of social consequences, as major human and
economic losses mostly affect the poorest and consequently most vulnerable people.
On the basis of what has been discussed until now, the development of a policy of
territory management based on an adequate planning appears of primary importance for the
Dominican Republic. In order to reach this objective, it is necessary to work at various
levels:
1. Scientific research, which improves basic and specific knowledge on the Dominican
territory, as a fundamental instrument to evaluate any land use alternative;
2. Planning, which guarantees the possibility of identifying the most sustainable land use,
limiting risks related to natural phenomena to which the Dominican territory is
exposed;
3. A direct action involving local rural population, which focuses on the improvement of
living conditions and the spreading of a culture of respect and protection of the
environment. Poverty and lack of alternatives, together with ignorance about the
consequences, also economic, of environmental degradation, represent one of the main
causes for the high environmental vulnerability, which characterizes the country, as
well as a big barrier to human development.
The above listed points represent important elements in order to guarantee the sustainable
development and security of any territory, but are particularly essential in a country like the
Dominican Republic, which is exposed to extreme meteorological events such as tropical
cyclones.
Furthermore, as the Dominican Republic is located on an island, it is particularly
vulnerable to climate change (SEMARENA 2004), which, according to recent studies
(IPCC 2007) is expected to cause an increase in frequency of meteorological extreme
events. As a consequence, a correct territory planning can be considered the main action
for adaptation to climate change.
The present work creates the base for further studies. In particular, the investigations in
progress aim to characterize climate trends in the Dominican Republic territory, estimating
potential territory responses to the most likely future projections. The final objective is to
provide decision makers with information useful in orienting land use planning, coherently
with environmental characteristics of the Dominican territory, toward a sustainability in a
medium to long perspective.
Acknowledgments The authors gratefully acknowledge the precious collaboration of: Ing. Noris Araujo,Prof. Ludovico Brancaccio, Ing. Gloria Ceballos, Ing. Roberto Gaudio, Ing. Santiago Munoz, Ing. AlbertoSanchez and Mr. Hugo Segura.
Nat Hazards
123

References
Bagnouls F, Gaussen H (1953) Saison seche et indice xerothermique. Documents pour les Cartes desProductions Vegetales. Bull Soc Hist Nat Toulouse 88:193–240
Brown DP (2007) Hurricane Noel (AL162007) 28 October–2 November 2007. NOAA Tropical CycloneReport. http://www.nhc.noaa.gov/pdf/TCR-AL162007_Noel.pdf. Accessed 15 Oct 2008
Burke KC, Cooper C, Dewey JF, Mann P, Pindell JL (1984) Caribbean tectonics and relative plate motions.In: Bonini WE, Hargraves RB, Shagam R (eds) The Caribbean-South American Plate boundary andregional tectonics. Geological Society of America, Memoir 162:31–63
Caravanos J, Fuller R (2006) Polluted places: initial site assessment. Black Smith Institute, New YorkCocco Quezada A (2001) El ENOS, el clima dominicano y las sequıas meteorologicas. In: Jornada del Agua
para el Siglo XXI. Santo Domingo, 21–28 marzo de 2001. http://www.acqweather.com/ENOSClima.htm. Accessed 12 Jul 20
DeMets C, Gordon RG, Argus DF, Stein S (1990) Current plate motions. Geophys J Int 101:425–478. doi:10.1111/j.1365-246X.1990.tb06579.x
Gaussen H, Bagnouls F (1957) Les climats biologiques et leur classification. Ann Georgr 66:193–220. doi:10.3406/geo.1957.18482
Giandotti M (1934) Previsioni delle piene e delle magre dei corsi d’acqua. Memorie e Studi Idrografici, 8,Roma
Giandotti M (1940) Previsione empirica delle piene in base alle precipitazioni meteoriche, alle caratteris-tiche fisiche e morfologiche dei bacini. Applicazione del metodo ad alcuni bacini dell’AppenninoLigure. Memorie e Studi Idrografici, 10, Roma
Gumbel EJ (1958) Statistics of extremes. Columbia University Press, New YorkINDRHI (2006) Las estadısticas del agua en Republica Dominicana. INDRHI, Santo DomingoIPCC (2007) Climate change 2007: The physical science basis. In: Solomon S, Qin D, Manning M, Chen Z,
Marquis M, Averyt KB, Tignor M, Miller HL (eds) Contribution of the Working Group I to the fourthassessment report of the Intergovernmental Panel on Climate Change. Cambridge University Press,New York
Koppen W (1936) Das Geographische System der Klimate. In: Koppen W, Geiger R (eds) Handbuch derKlimatologie, 1, C. Gebruder Borntrager, Berlin, pp 26–31
Kuichling E (1889) The relation between the rainfall and the discharge of sewers in populous district. TransAm Soc Civ Eng 20:1–56
Landsea CW (1993) A climatology of intense (or major) Atlantic hurricanes. Mon Weather Rev 121:1703–1713. doi:10.1175/1520-0493(1993)121\1703:ACOIMA[2.0.CO;2
Lewis JF (1980) Resumen de la geologıa de la Hispaniola. In: Memorias de la 9a Conferencia Geologica delCaribe. Santo Domingo, Republica Dominicana, pp 5–31
Mann P, Schubert C, Burke K (1990) Review of Caribbean neotectonics. In: Dengo G, Case JE (eds) Thegeology of North America. Geological Society of America, Boulder, pp 307–338
Mann P, Taylor FW, Lawrence E, Ku TL (1995) Actively evolving microplate formation by obliquecollision and sideways motion along strike-slip faults: an example from the north eastern Caribbeanplate margin. Tectonophysics 246:1–69. doi:10.1016/0040-1951(94)00268-E
Marcano JE (2007) Clasificacion de los climas de la Republica Dominicana. In: Geografıa de la RepublicaDominicana. http://mipais.jmarcano.com/geografia/index.html. Accessed 10 Sep 2008
MetOffice (2008) http://www.metoffice.gov.uk/weather/tropicalcyclone/. Accessed 7 Aug 2008Palmieri S, Teodonio L, Siani AM, Casale GR (2006) Tropical storm impact in Central America. Meteorol
Appl 13:21–28. doi:10.1017/S1350482705001994Peguy CP (1970) Precis de climatologie. Masson, ParisPielke RA Jr, Gratz J, Landsea CW, Collins D, Saunders MA, Musulin R (2008) Normalized hurricane
damage in the United States: 1900–2005. Nat Hazards Rev 9(1):29–42. doi:10.1061/(ASCE)1527-6988(2008)9:1(29)
SEMARENA (2004) Primera Comunicacion Nacional. Convencion Marco de las Naciones Unidas sobreCambio Climatico. Editora Buho, Santo Domingo
Simpson RH, Riehl H (1981) The hurricane and its impact. Louisiana State University Press, Baton RougeToloczyki M, Ramırez I (1991) Mapa geologico de la Republica Dominicana 1:250000. Direccion General
de Minerıa, Santo DomingoUNISYS (2008) http://weather.unisys.com/. Accessed 25 June 2008
Nat Hazards
123
Top Related
Copyright © 2022 FDOKUMEN

