


Bahasa
Halaman
Hukum


THE RELATIVE USE OF FORMAL AND INFORMAL INFORMATION IN THE
EVALUATION OF INDIVIDUAL PERFORMANCE
by
GENE H. JOHNSON, B.B.A., M.S. in Acct.
A DISSERTATION
IN
BUSINESS ADMINISTRATION
Submitted to the Graduate Faculty of Texas Tech University in Partial Fulfillment of the Requirements for
the Degree of
DOCTOR OF PHILOSOPHY
December, 1986

•
//^,;¥
(c) 1986 Gene H. Johnson

ACKNOWLEDGMENTS
Funding for this research project was provided by the
National Association of Accountants, and was especially
beneficial in that it allowed the author to complete the
project in a timely manner. Subjects for the project were
provided by the research entity which must, for the sake of
anonymity, remain unnamed. Nonetheless, their partici
pation is greatly appreciated.
Early conceptual development of the project was
facilitated by a number of individuals, including the
doctoral students and Professors Don Clancy and Frank
Collins of Texas Tech University. Also helpful were the
experiences of Louis Johnson, John Johnson, Sam Nichols,
Darrell Adams, and Del Shumate. The members of the
committee provided valuable guidance and support throughout
the project; and although not a member of the committee.
Professor Roy Howell provided valuable assistance with data
analysis. Finally, Professor Donald K. Clancy served not
only as committee chairman but also as a role model/mentor
for the author. His participation made the project
interesting, educational, and enjoyable.
11

CONTENTS
ACKNOWLEDGMENTS ii
ABSTRACT vi
LIST OF TABLES viii
LIST OF FIGURES ix
I. INTRODUCTION AND BACKGROUND 1
Formal and Informal Information 2
Performance Evaluation 4
Purpose, Objectives, and Significance . . 6
Organization 7
II. PREVIOUS STUDIES OF INFORMATION
FOR PERFORMANCE EVALUATION 8
Goals and Goal-Directed Behavior 9
Early Studies on Performance Measures . . 11
Budget-Based Studies 17
Contingency Theory 19
Agency Theory 21
Markets and Hierarchies 22
Managerial Performance Appraisal 25
Informal Information 30
Summary 3 3
111
III. DISCUSSION OF VARIABLES AND RELATIONSHIPS:
MODEL DEVELOPMENT 36
Theoretical Perspective 36
Potential Explanatory Variables 41
Research Perspective 42
The Relative Use of Formal and
Informal Information 44
Attitudes Toward Formal and
Informal Information 45
Locus of Control 49
Role Stress 51
Leadership Style 54
Other Relationships Among
Explanatory Variables 57
Variables of Interest: Summary 58
Hypotheses 59
The Research Model 61
IV. RESEARCH METHODOLOGY 64
A Two-Phase Field Study 64
Phase One: Development of the Instrument . 66
Phase Two: A Single-Entity Sample . . . . 73
Statistical Analysis - LISREL 78
V. EMPIRICAL RESULTS 86
Verification of the Research Constructs . 86
Demographics and Other Potential
Explanatory Variables 100
iv

Testing Hypotheses with LISREL 103
Tests of Hypotheses 105
Stress as an Endogenous Variable:
A Fitted Model 109
VI. SUMMARY AND CONCLUSIONS 114
Summary of Findings 114
Implications of the Use of
Informal Information 119
Implications of the Relationships
Among the Variables 120
Policy Implications 121
Limitations of the Study 123
Suggestions for Future Research 124
REFERENCES 127
APPENDICES
A. INTERVIEW SCHEDULE 138
B. QUESTIONNAIRE 140
C. ANALYSIS OF DEMOGRAPHIC VARIABLES 147
D. THE NULL MODEL 150
E. THE ATTITUDES MODEL 153
F. THE FITTED MODEL 156
V

ABSTRACT
Individual performance evaluation is a critical
managerial function. Judgments of individual performance
are evident in certain managerial decisions, such as those
regarding the pay, promotion, and termination of
subordinates. While much has been written about the
measurement of performance and about performance-appraisal
techniques, little is known about the information managers
use in evaluating individual performance. Accordingly,
this study was conducted for two reasons: 1) to study the
extent to which informal information (unofficial, or
"non-sanctioned") is used in individual performance
evaluation, and 2) to examine the relationships among a
number of explanatory variables and the relative use of
formal and informal information. '
A questionnaire was used to measure the relative use
of formal and informal information in performance-related
decision making (the dependent variable), attitudes toward
the information used (ATTITUDES), role stress, two
dimensions of superior's leadership style (structure and
consideration), and one personality variable (locus of
control). The responses indicate that informal information \
vi

is used relatively more than formal information in the |
evaluation of individual performance. Further, the
managers perceived the informal information easier to use
and understand, more qualitative, and more confidential
than the formal information.
Covariance structural equations modeling (LISREL) was
used to study the relationships among the research
variables. As hypothesized, attitudes toward the
information are strongly related to the relative use of
formal and informal information. The hypothesized
relationship between the research variable ATTITUDES and
role stress, and the influences of leadership style and
locus of control on stress are also supported. Not
supported by the data, however, are the hypothesized
relationships among the relative use of formal and informal
information and role stress, leadership style, and locus of
control, and the hypothesized relationships among
ATTITUDES, leadership style, and locus of control.
The findings suggest a discrepancy between the
formally agreed upon rules of governance in organizations
and the true system of rewards. Contractual disputes and
other dysfunctional consequences are implied. However,
another plausible explanation is that the informal
information is necessary in order to compensate for the
inadequacies of the formal information. Thus, the formal
and informal information may be complementary.
vii

LIST OF TABLES
4.1: Non-Response Bias Test Results 77
5.1: Responses to RUFI Items 87
5.2: Tests For Differences in RUFI Responses . . . . 89
5.3: Correlations Among RUFI Responses 90
5.4: Responses to ATTITUDES items 93
5.5: Tests for Differences in ATTITUDES Responses . 95
5.6: Initial Factor Loadings: ATTITUDES 97
5.7: Promax Rotated Factor Loadings: ATTITUDES . . . 98
5.8: Tests for Differences by Department 101
5.9: Tests for Differences by Faction 102
5.10: Tests of Direct Hypotheses 106
5.11: Preliminary Tests of Indirect Hypotheses . . . 108
5.12: Sequential Tests of Indirect Hypotheses . . . . 110
5.13: Total Effects: The Fitted Model 112
Vlll

LIST OF FIGURES
3.1: Preliminary Theoretical Model 37
3.2: Theoretical Model 39
3.3: Research Model 63
4.1: The LISREL Model 81
4.2: LISREL Notation 83
4.3: LISREL Equations 85
5.1: The Fitted Model 113
6.1: The Research Model in Context 117
IX

CHAPTER I
INTRODUCTION AND BACKGROUND
Individual performance evaluation is a critical
managerial function. Many business decisions are
influenced by evaluations of individuals' past performance
and expectations of individuals' future performance.
Generally, the accounting role in the performance
evaluation process is through the use of accounting reports
as measures of performance. However, the task of
performance measurement is situational and decisions are
made by individuals. Accordingly, the type of information
obtained by an evaluator, and the extent to which each type
of information is used in arriving at a decision vary from
situation to situation and from individual to individual.
Many organizations have attempted to structure the
performance evaluation process (or related decisions such
as pay, promotion, termination, etc.) by adopting policies,
procedures, guidelines, and standards. These "formal"
systems are designed to produce a performance report and
are intended to support personnel decisions. However, the
individuals who make the decisions are subject to a variety
of influences such as additional information and the

opinions of others. It is naive to assume that individuals
rely strictly on the output of formal information systems
when making performance related judgments and decisions.
This study addresses the relative use of formal and
informal (other) information in the evaluation of
individual performance and the relationships among relative
reliance on informal information and a number of potential
explanatory variables.
Formal and Informal Information
Information can be classified in a variety of ways.
In studying organizations it may be useful to classify
information according to function (operations support,
external reporting, decision support, etc.). It may also
be useful to classify information as either formal or
informal [Banbury and Nahapiet, 1979; Clancy and Collins,
1979; Dirsmith and Covaleski, 1985; Jiambalvo, Watson, and
Baumler, 1983]. Formal information systems can be thought
of as those "sanctioned" by senior management, the output
of which becomes a part of "organizational awareness"
[Clancy and Collins, 1979]. Formal systems are
characterized by policies, procedures, and other
documentation. A formal performance evaluation information
system would frequently involve accounting and/or personnel
department participation with performance represented
numerically. Suggestions or guidelines as to the factors
to be considered and the "weight" to be assigned to each
factor when making performance judgments would often be
included.
The output of formal systems can be referred to as
formal information. Accordingly, any other data relevant
to a decision is informal information. Informal
information systems need not be documented, sanctioned, or
otherwise "official" in order to be relied upon. Unlike
formal systems, informal information systems are difficult i
to characterize. Such systems range from detailed records
maintained methodically, to hearsay, rumor, and memory.
Informal systems may even be computerized. Informal
information may be indirectly incorporated into an
"official" system, reflected primarily as adjustments or
modifications to formal information, or overtly relied upon
and incorporated into the formal system. Informal
information may affect decisions but otherwise never be
documented or made known to others. Also, informal
information may be in non-numeric form, and in fact, may be
perceived by some managers as the antithesis to formally
measured performance. The only distinguishing factor is
that informal information is not produced or required by
the formal system.
It is likely that the accounting function in an
organization is a part of the formal information system,
although accountants' participation in an informal system

is not precluded. It is also likely that performance
related decisions are based on both formal and informal
information.
Performance Evaluation
Performance evaluation is a process that serves
judgmental purposes (retention, promotion, and reward) and
developmental purposes (planning, training and development,
and superior/subordinate communications) [Jiambalvo et al.,
1983] . The part of the evaluation process involving
accounting is the measurement process, which results in
numerical representations of events and transactions
[Flamholtz, 1980]. Performance measurement involves the
application of both procedural rules and instruments to
observable characteristics of performance. The performance
measurement process may be formal or informal just as other
aspects of the evaluation process may be formal or
informal. In formal performance measurement the rules and
instruments have been established and sanctioned by senior
management. With informal performance measurement either
the instrument or the procedural rules of application, or
both, will not be sanctioned. Judgment may or may not be
involved in application of the instruments and rules.
Performance evaluation is intertwined with other
business activities. Company commitments are based upon
assumptions of individuals' future performance. Production

scheduling and other resource allocation decisions are
affected by perceptions of the performance of the
individuals involved. Virtually any business-related
decision is in some way affected by the decision maker's
judgments and expectations about individuals' performance.
Accordingly, performance evaluation is likely to be a
continual process rather than a periodic exercise.
However, the evaluation of performance assumes a periodic
nature because the intensity of the process is much greater
at some times than others. There are specific periodic
decisions made by managers in which performance judgments
are manifest, such as pay, promotion, and termination
decisions. Also, many businesses require managers to
document evaluations of subordinates' performance at
regular intervals or specified times regardless of the need
for pay increase, promotion, or termination.
Performance evaluation is by necessity a judgmental
process. The evaluator will consider the pattern of
performance measures and must make a judgment regarding the
quality of the overall performance: poor, adequate, good,
or outstanding. When the evaluator is the superior to the
person evaluated, the judgments made will influence
decisions on retention, salary, promotion, and assignment.
Jiambalvo et al. [1983] classified performance
evaluation processes as formative ("coaching" purposes) and
summative (a necessary precedent to pay and promotion

decisions). The concept of "summative evaluation"
[Jiambalvo et al., 1983; Zedeck and Kafry, 1977] is
particularly useful in the following discussions.
Purpose, Objectives, and Significance
The purpose of this study was to improve our
understanding of the sources of information relied upon by
individuals in making performance related decisions in
organizations. It was intended to gather and interpret
evidence regarding the relative use of formal and informal
information. More specifically, there were two research
objectives:
1. To examine the extent to which informal
information is relied upon relative to formal
information (RUFI) in performance-related
decision making, and
2. To study the relationships among a number of
a priori explanatory variables and RUFI.
The results contribute to the small body of informal
information systems literature, and may stimulate
additional research efforts and contribute toward
improvement in both systems design and performance
measurement. Empirical evidence of the relative importance
of informal information systems in the accounting
literature is scarce—few published works have been
located.
7
Organization
In the following chapter, selected relevant works are
reviewed and discussed. Chapters III and IV provide
discussions of the relationships among the variables of
interest and the research methodology applied. The
empirical results are presented in Chapter V, and the
conclusions and implications are discussed in Chapter VI.

CHAPTER II
PREVIOUS STUDIES OF INFORMATION
FOR PERFORMANCE EVALUATION
Performance evaluation and performance information
utilization research has generated a substantial
literature. Selected representative works on goals and
goal-directed behavior demonstrate individuals' needs for
performance related information. Early studies on
organizational performance measures and budget-based
studies illustrate the importance of performance-related
information and suggest a need for informal information.
When applied to information systems in organizations,
contingency theory provides a framework for discussing a
number of factors with the potential to influence the
systems' effectiveness. From a total labor force
perspective, both agency theory and the markets and
hierarchies paradigm are consistent with informal
information usage. Finally, research addressing managerial
performance measurement and appraisal, and studies of
informal information in organizations are particularly
relevant.
8

Goals and Goal-Directed Behavior
One way in which individual performance evaluation
influences the attitudes and actions of individuals is
through communication of the results. The information
exchanged facilitates individuals' goal setting processes
and constitutes feedback (knowledge of the results of
goal-directed behavior).
Goals and goal-directed behavior were discussed by
Lewin, Dembo, Festinger, and Sears [1944] in relation to
their concept of "level of aspiration," and their
associated "resultant valence theory." Lewin et al.,
hypothesized that the choice of level of aspiration is the
result of three factors: the seeking of success, the
avoiding of failure, and a probability of success judgment.
The strength of each of these three factors is dependent
upon situational influence and individual characteristics.
Thus, levels of aspiration (goals) are a function of an
individual's perceptions and attitudes regarding the
desirability and likelihood (valences) of success vs.
failure in goal attainment. Further, levels of aspiration
are altered as information and experience influence
perceptions and attitudes.
In addition to facilitating goal setting, the revealed
output of both performance measurement and evaluation
provides the subordinate with knowledge of the results of
goal-directed behavior (feedback), which is related

10
strongly to performance [Becker, 1978; Locke, 1968; Erez,
1911J Locke, Shaw, Saari, and Latham, 1981; Cook, 1967;
Pavett, 1983; Ilgen, Fisher, and Taylor, 1979]. Based on a
comprehensive review of goal setting and task performance
in laboratory and field studies, Locke, Shaw, Sari, and
Latham [1981] noted that performance is effected (improved)
only when goals are set and feedback is provided:
Goal setting is most likely to improve task performance when the goals are specific and sufficiently challenging, the subjects have sufficient ability (and ability differences are controlled), feedback is provided to show progress in relation to the goal, rewards such as money are given for goal attainment, the experimenter or manager is supportive, and assigned goals are accepted by the individual [p. 125; emphasis added].
Since goals are determined by individuals' perceptions
and attitudes regarding future outcomes and likelihoods
[Lewin et al., 1944], goals must be expected to change over
time as information and experience influence perceptions
and attitudes. Although not explicitly recognizing the
influence of information on performance through goal
setting. Cook [1967] studied the effects of frequency of
feedback on attitudes and performance. In a simulated
business setting, student subjects receiving performance
reports more frequently were more successful and had more
positive attitudes than other student subject participants.
In spite of methodological weaknesses in Cook's study as
discussed by Becker [1967] and Jensen [1967], the study
11
provides empirical evidence of the need for, and importance
of, timely feedback regarding performance.
Relevance to the current study
Performance-related information has been found to be
important in improving performance through its influence on
goal setting and on goal-directed behavior. A number of
characteristics of the information, such as timeliness, are
also important. Information, formal or informal, should be
frequent, specific, involve the job challenges, and concern
subordinates' abilities and the use thereof. The
information should relate to agreed upon goals and evidence
the performance-reward relationship. Of particular
relevance to this study is the implication that perceptions
regarding certain characteristics, or attributes of the
information are indicative of the information's usefulness.
Accordingly, the relative use of formal and informal
information is likely to be influenced by perceptions
regarding certain attributes of both the formal and
informal information.
Early Studies on Performance Measures
Some work has focused on the measurement and control
of various parts of an organization (segments, divisions,
profit centers, investment centers) rather than on
individuals. The performance of certain organizational

12
components is often a primary determinant of, or surrogate
for, the individual performance of segment management.
However, the influence of organizational performance
measures may be widespread. Hopwood [1972, 1974]
identified a "contagion" effect in the use of accounting
information. The suggested result is a "trickle-down" of
the influence of measured organizational performance.
Ridgway [1956] and Tiessen and Waterhouse [1983] suggest
that organizational performance measures influence
behaviors and attitudes even when the information is not
intended to be used as a measure of individual performance.
The following discussion indicates how early behavioral
researchers questioned the practice of performance
measurement and noted dysfunctional behavior associated
with single numeric representations of performance.
Single Performance Measures
Argyris [1952] reported a tendency of workers to
manipulate production scheduling in order to obtain the
desired effect on measured performance in spite of the
potentially negative economic consequences to the firm.
Blau [1955] observed similar behavior in a service oriented
organization. Simon, Guetzkow, Kozmetsky, and Tyndall
[1954] noticed that the use of standard cost as a single
performance criterion often led to considerable
inefficiencies. Employees spent time and effort on the

13
nonproductive practice of arguing the accuracy and
appropriateness of the numbers. Apparently, a general lack
of trust had resulted from a history of errors and problems
related to the allocation of uncontrollable, or indirect
costs. Studies in the Soviet Union [Granick, 1954;
Berlinger, 1956; Horwitz, 1970] support the basic
conclusion that single measures of performance are often
accompanied by dysfunctional behavioral consequences.
Relevance to the current study. When formal systems
have single performance measures, managers will need to
supplement the formal system with additional criteria in
evaluating their subordinates in order to counteract the
negative effects of the single measure.
Multiple and Composite Measures
The use of multiple measures of performance (a number
of single measures of different aspects of performance) is
currently espoused in the normative literature [Horngren,
1982]. Closely related to the multiple measures approach
is the use of a composite measure of performance, which is
the result of mathematically combining a number of
performance measures into a single score. A composite
measure is a known function of multiple measures. Using
either multiple measures or composite scores, it is argued
in the normative literature that the dysfunctional
consequences of single measures can be avoided [Horngren,

14
1982]. However, the added complexity may be accompanied by
a different set of behavioral concerns.
Ridgway [1956] hypothesized that when faced with
multiple performance criteria (multiple measures), an
individual may experience ambiguity. If a particular
action has equally desirable results on all criteria, there
is no ambiguity. Typically, however, there are conflicts,
tradeoffs, and compromises. If the individual knows how
the multiple measures will be reflected in some overall
(composite) measure of performance, again there is no
ambiguity. But, if the individual is unaware of how the
multiple measures are to be combined, the employee will be
forced to use judgment in deciding where to expend
resources. Based on his review of the literature, Ridgway
concluded:
Quantitative performance measurements—whether single, multiple, or composite--are seen to have undesirable consequences for over-all organizational performance [p. 247].
Perhaps more importantly, Ridgway continues to note another
very important behavioral concern:
Even where performance measures are instituted purely for purposes of information, they are probably interpreted as definitions of the important aspects of that job or activity and hence have important implications for the motivation of behavior [p. 247].
Rosen and Schneck [1967] referred to Ridgway's
summarization of the behavioral problem(s) associated with
multiple measures of performance. They were unable to add

15
any additional sources of information pertinent to the use
of either multiple or composite performance, but again
concluded:
Dysfunctions to the organization result from the use of single, multiple, and composite measures of performance. Single measures may not be properly selected or broad enough to coincide with the organization's goals. To be effective, multiple measures must be arranged in their degree of importance. Otherwise, in situations of ambiguity, employees may not focus on the one measure that gives the most desirable results for the organization. Composite measures also have potentially unfavorable effects, depending upon how management uses them [p. 14] .
Relevance to the current study. Even multi
dimensional measurements are inadequate representations of
performance when the behavioral consequences are
considered. The measurements can produce ambiguity and/or
result in dysfunctional consequences to the organization
whether or not they are presented as indicators of
performance. Again, the implication is that informal
information is needed to supplement the formal information.
Return on Investment (ROI)
Primarily because of a widespread move toward
organizational decentralization that began in the 1950s, a
particular composite performance measure relating income to
investment, return on investment (ROI), became popular with
companies in the 1960s [Mauriel and Anthony, 1966]. A
broad-based survey of United States businesses provided

16
Mauriel and Anthony the information necessary to reach
their most significant complaint about practice:
. . . that generally accepted accounting principles, including any internal company rules and procedures intended to govern the reporting to outsiders of financial data on the firm as a whole, tend to influence very strongly the methods used in calculating an investment center's profit and investment base [p. 99].
They continue to explain how the accounting distortions are
likely to produce incentives to favor the short-run
operations over the long-run growth of the organization.
The authors also consider the problems associated with the
use of ROI in determining executive compensation.
Mauriel and Anthony call for internal accounting
procedures based on the internal needs of the organization.
Similarly, Rappaport [1978] argues for the design of
incentive systems in such a manner as to avoid the
short-term emphasis of the "simplistic rhetoric of
accounting numbers" (ROI, earnings per share, or some other
measure of profit).
Reece and Cool [1978] replicated the Mauriel and
Anthony study and found that the use of GAAP-based ROI had
increased in use over a decade. In spite of a number of
critical flaws, ROI had become deeply ingrained in the
divisional performance evaluation process (only 3% of the
companies with investment centers reported no influence of
ROI on performance, and 74% of the companies surveyed
reported having investment centers). Also, GAAP-based

17
reports were deeply ingrained as performance measures (40%
of the companies reported no differences and/or
adjustments).
Relevance to the current study. Although widely
criticized in the literature, ROI and GAAP-based reports
strongly influence performance measurement and evaluation
practices in organizations. The inadequacies of numeric
representations of performance and the measurement error
attributable to the influence of GAAP are reflected in ROI.
Informal information is necessary to adjust for both.
Budget-Based Studies
Budgeting activities are pervasive in business just as
budget-based studies are abundant in the literature. Four
of these, regarding individual performance evaluation and
budgets, are particularly relevant to this study.
Argyris [1953] recognized the control function of
budgets, the pervasive influence of budgets in
organizational decision making, and the use of budgets in
individual performance evaluation:
Budgets are accounting techniques designed to control costs through people. As such their impact is felt by everyone in the organization. They are continuously being brought into the picture when anyone is trying to determine, plan, and implement an organizational policy or practice. Moreover, budgets frequently serve as a basis for rewarding and penalizing those in the organization [p. 97; emphasis on original].

18
Hopwood [1972, 1974] gathered empirical evidence
regarding the use of accounting information in performance
evaluation. He hypothesized that there were three distinct
styles of using budgeted and actual cost information:
budget constrained, profit conscious, and nonaccounting.
The Ohio State University leadership behavior descriptive
questionnaire (LBDQ) was used to measure various dimensions
of managerial style. Hopwood concluded that a manager is
more likely to be seen as using a budget constrained style
of evaluation if that manager has a leadership style low in
consideration and high in initiation of structure,
particularly if a budget constrained style is used by the
manager's superior (the contagion effect).
Otley [1978] replicated and extended Hopwood's earlier
study. Otley was particularly interested in the effects of
such intervening variables as the interactions among style
of budget use, budget accuracy, and profitability. He
concluded that it is inappropriate to use differences in
budget style to explain differences in performance because
both depend upon the state of the economic environment, and
pointed toward the need for:
. . . a more contingent theory of budgetary control based on differences in organizational types, the environmental circumstances in which they operate, and the norms and values current both within the organization itself and within the society in which it is set [p. 146].

19
Relevance to the current study
In spite of potential dysfunctional consequences,
budgets often constitute a large part of the formal
performance evaluation support system. Individual
variation in the use of budgetary information implies
individual variation in the use of other information as
well. If there are no other formal sources of performance
related information, informal information will be sought to
compensate for any perceived information inadequacies. In
explaining individual variation in the use of accounting
information, perceptions regarding the individual's
superior are particularly important (the contagion effect),
but there are a number of other potential influences.
Accordingly, the relative use of formal and informal
information in individual performance evaluation is
contingent upon such factors as superior's leadership
style, organizational type, environmental circumstance, and
norms and values.
Contingency Theory
Contingency theory has been applied to the study of a
variety of organizational phenomena. Hunt [1984] discusses
the contingency theory of organizational leadership, noting
its dominance as a research paradigm since the late 1960s.
Waterhouse and Tiessen [1978] suggest a contingency
framework for research in management accounting systems.

20
Relevant to this study is the research concerning
organizational structural contingencies.
Ford and Slocum [1977] summarize the literature
pertaining to the influence of size, technology, and
environment on the structure of organizations. The authors
measured four dimensions of organizational structure:
complexity, centralization, administrative intensity, and
formalization. Formalization was defined as:
. . . the degree to which rules and procedures within a system are specified and/or adhered to. As a strategy of control, it emcompasses both the existence of rules or procedures, whether or not they are codified, and the degree of variation allowed therein [p. 562].
Formalization was found to be positively related to both
technology (task routineness) and size (number of members),
and negatively related to environment (perceived
uncertainty).
Relevance to the current study
Contingency theory suggests that organizational
structures are dependent upon certain organizational and
environmental variables. Information systems are
organizational structures. Thus, formal and informal
systems of performance related information may be
contingent upon organizational and environmental variables.
Also, performance evaluation is based on information from a
variety of sources, formal and informal. Since

21
characteristics of both the formal and informal information
systems are contingent upon organizational and
environmental variables, the relative use of formal and
informal information is likely to vary due to
organizational and environmental variables.
Agency Theory
Agency theorists such as Arrow [1963; 1964; 1974],
Jensen and Meckling [1976] , and Demski and Feltham [1978]
view organizations:
. . . simply as a focus for a complex process in which the conflicting objectives of individuals are brought into equilibrium within the framework of contracts. In this sense, the behavior of an organization is like the behavior of a market in that it is the outcome of a complex equilibrium seeking process [Tiessen and Waterhouse, 1983; p. 254].
The fundamental principal/agent relationships are based on
contractual specifications of pay-off and risk sharing, and
the monitoring of behaviors is recognized to be imperfect
and costly. Pay-off is determined in accordance with
completely specified, contractual procedures for
performance measurement. Alterations in the
principal/agent relationship constitute renegotiation of
the employment contract.

22
Relevance to the current study
Agency theory does not preclude individual performance
evaluation nor the influence of informal information.
Performance measurement and pay-off are contractually
determined but the renegotiation process is not. The
result of individual performance evaluation is manifest in
the contract renegotiation process. Since renegotiation is
not contractually specified, performance evaluation
processes are by definition informal (non-contractual).
While agency theory is not inconsistent with the study
of information for performance evaluation, much of the
relationship between formal and informal information goes
beyond the hypothesized contractual relationships.
Markets and Hierarchies
The markets and hierarchies paradigm "is a positive
theory which seeks to explain the structure of markets and
hierarchies, and the division of activity between markets
and hierarchies" [Tiessen and Waterhouse, 1983; p. 258].
Based largely on the works of Williamson [1964, 1971, 1973,
1975], the markets and hierarchies paradigm emphasizes
information, structure, and control. Generally, the theory
suggests that hierarchies supplant markets when the market
transaction and contract enforcement costs become too
great. Regarding labor in organizations, hierarchies are
an alternative to a set of separate and individual

23
contracts. The hierarchical form of organization includes
an "internal labor market," membership in which
(employment) constitutes acceptance of an incomplete social
contract with the organization.
Subordinate managers have local information not
available to senior managers because they are closer to the
operations of their subdivisions. This information about
conditions and opportunities will be withheld (called
"information impactedness") unless senior managers offer
sufficient rewards in the form of opportunities and
security. Further, subordinates must learn specialized
skills, procedures, and language that have little value
outside the specific organization. In order to induce the
specialized learning, senior management must offer rewards
and continuity. The communication of local information and
the specialized learning become part of the performance
history of the subordinate.
The primary purposes for ex post accounting measures
in internal labor markets are "to assist in constructing
performance histories and in settling disputes" [Tiessen
and Waterhouse, 1983; p. 265]. While accounting numbers
may be arbitrary and unfair:
Other internal labor market customs and rules will simply adjust to compensate for the possibly undesirable direct effects of the accounting measures [Tiessen and Waterhouse, 1983, p. 265].

24
Relevance to the current study
Performance histories are not limited to a series of
accounting measurements, and "internal labor market customs
and rules" will require the consideration of informal
information in performance related decisions. Formal
performance information is included in the concept of
sanctioned performance history hypothesized in the
hierarchies and markets literature. While the terminology
differs, the substance and intent are similar. The
proportion of formal performance systems that are concerned
with long-run performance instead of short-term performance
measures is an empirical question already researched.
Reece and Cool [1978] and other findings indicate that the
majority of performance measures (circa 1978) are short-run
in nature. Thus, the markets and hierarchies paradigm does
provide a theory for why informal information is necessary
in the performance evaluation process. Since performance
measures are short-run in practice, informal information on
long-run performance and local information sharing is
necessary for performance evaluation. Further, since the
observed performance measures are GAAP-based, they must be
informally adjusted to make an equitable judgment on
performance.

25
Managerial Performance Appraisal
Performance appraisal, "which consists of the
observation and evaluation of an employee's work behavior
or the results of that behavior by someone," is the most
frequently used method of measuring employee performance
[Heneman, Schwab, Fossum, and Dyer, 1980; p. 116].
Periodic, all-purpose performance appraisal is a primary
subject in both descriptive and normative managerial
literature.
The normative literature addresses individual
performance in organizations from two approaches. First,
writers such as Landy and Farr [1983] and Heneman, Schwab,
Fossum, and Dyer [1980], emphasize measurement. Others,
typified by Lawler [1981] and Kane and Lawler [1979],
emphasize the subjective nature of the process. To the
former, periodic performance appraisal is the most common
method of performance measurement. To the later, periodic
performance appraisal serves a variety of purposes,
primarily developmental and reward allocation. Some
writers suggest that development and reward allocation are
incompatible functions [Kane and Lawler, 1979], while
others suggest that the tv;o functions may be inseparable
[Marshall, 1978].
Of particular relevance to this study are two surveys
of managerial performance appraisal practices and
techniques. A 1977 report by The Conference Board [Lazer

26
and Wikstrom, 1977] addressed current managerial
performance appraisal practices and existing performance
appraisal information systems. The study indicated that
managers were appraised annually (90%) and appraised by
their immediate superior (95%). A variety of techniques
was used to evaluate performance, the most common being
objective setting or MBO (management by objectives),
ratings, critical incident, checklists, and rankings or
comparisons. Further, 71% of the companies were found to
have formal appraisal systems for mid-to-low-level
management. Eight general categories of stated objectives
characterized the formal systems (presented in decreasing
frequency of occurrence):
Management development Performance measurement Performance improvement Compensation administration Identifying potential Feedback Manpower planning Communications [p. 11]
However, the actual uses of the performance appraisal
information were found to be quite different. The
responses were summarized into six groups (decreasing
frequency):
Performance feedback Compensation administration Promotion decisions Identifying management manpower needs Manpower planning Validation of selection procedures [p. 11]

27
A third ordering was suggested by a follow-up study of the
priorities associated with each of the six groups of uses
of performance appraisal (decreasing priority):
Compensation administration Performance feedback Identifying management development needs Promotion decisions Manpower planning Validation of selection procedures [p. 11]
The discrepancy between the stated objectives and the
actual use of the formal performance appraisal information
was attributed to dissatisfaction with the formal system.
A number of problems with the formal system was suggested,
with "conflicting multiple uses" being the most prevalent.
Even though the subjects seemed to perceive performance
appraisal for compensation adjustment purposes to differ
from performance appraisal for developmental purposes, the
data indicate that more than three-fourths of the companies
used the same appraisals for both.
Finally, the study found that "the performance of
managers not currently covered by a formal performance
appraisal system is still evaluated," citing a number of
subjects' descriptions of alternative (informal) appraisal
techniques:
Personal observation by the department head -nothing in writing
Our appraisal of managers consists of periodic visits with the supervisor, generally at salary evaluation time . . .
Seat of the pants

28
Since our management group is fairly small, we still enjoy an intimate set of supervisor-subordinate relations.
Performance evaluation, therefore, is an ongoing continuous activity rather than a fixed event occurring once a year
By their immediate supervisors, in whatever way the supervisor considers appropriate
Unwritten, mental appraisal
Observation by immediate supervisor, and confirmed by next highest supervisor. This is not usually written or even communicated . . . the "no news is good news" syndrome
Function of individual's manager's philosophy and techniques
What the boss's "tummy" tells him [Lazer and Wikstrom, 1977; page 23; subjects' descriptions deleted]
The findings reported by The Conference Board were
largely supported by a more recent report of the American
Management Associations (AMA) [Eichel and Bender, 1984].
Annual evaluations remained prevalent, particularly when
related to compensation adjustment. Goal setting, essays,
and critical incidents, respectively, continued to be the
three most commonly used techniques of performance
appraisal, but two new techniques, graphic ratings and BARS
(behaviorally anchored rating scales) were evident in
practice. Seven primary uses for performance evaluation
were identified (decreasing frequencies):
Compensation Counselling Training & development Promotion

29
Manpower planning Retention/discharge
Validation of selection technique [p. 12]
Again, the authors suggest that performance evaluation for
salary administration purposes differs from performance
evaluation for improvement and developmental purposes.
The AMA study did not specifically address sources of
information used in performance evaluation but did note
that the current legal environment required the use of a
formal, documented performance appraisal system emphasizing
quantification, replication, and standardization.
Relevance to the current study
Normative literature regarding performance
measurement, evaluation, and appraisal is abundant and
diverse. Both of the descriptive studies, however, suggest
that performance evaluation (appraisal) for compensation
related purposes is not the same as performance evaluation
for training and developmental purposes. Also, Lazer and
Wikstrom noticed a discrepancy between the formally stated
objectives of performance appraisal system and the actual
use of the information. Inadequacies of the formal
information are the identified causes of the discrepancy;
use of informal information to compensate for the
inadequacies is a likely result.

30
Informal Information
Four studies directly addressing informal information
in organizations have been identified. Clancy and Collins
[1977, 1979] report the results of a two-stage study (case
and questionnaire) of informal accounting information
systems. They defined a formal accounting information
system as:
. . . that which collects, stores, analyzes and reports events, typically of an economic and quantitative nature . . . (and) normally legitimized by top management [Clancy and Collins, 1979, pp. 21-22].
Informal accounting information systems were
"non-legitimized" or personally maintained. They found
that about 85% of the sampled managers kept an informal
system of records and, while the informal records were
important in control and evaluation, the records were
considered less important than the formal reports. The
questionnaire used by Clancy and Collins solicited
subjects' perceptions about a number of characteristics of
both the formal and informal information systems, such as
accuracy, understanding, importance, and level of detail.
Using the questionnaire data, Clancy and Collins determined
that the subjects perceived formal and informal information
systems as distinct and separate, and identified a number
of relevant characteristics. However, they were not able
to support their a priori expectations that the existence
of informal information systems would be correlated with

31
certain formal system characteristics. Generally, Clancy
and Collins conclude that informal a ccounting systems are
"a useful_and necessary adjunct to formal_systems rather
than an unnecessary dissipation of resources." Even though
the informal records were less important, both systems were
perceived to be useful and desirable by the subjects.
Collins and Johnson [1986] report the results of an
exploratory case study of organizational communication,
noting the importance of general, informal communication
activity. They suggest that general, informal
communications provide a "linking" function between j
organizational problems and solutions.
Based on series of interviews with individuals in
public accounting firms, Dirsmith and Covaleski [1985]
observed that "[all] individuals concurred that informal
communication networks were much in evidence" [p. 154;
emphasis on original], and that "[the] most mentioned theme
of informal communications was compensation" [p. 155] .
However, they disagreed with the conclusions of Clancy and
Collins [1979] regarding the complementarity of formal and
informal information systems. Instead they attribute
aberrant behavior to inaccuracies with, and perceptions
about, the informal information. However, the disagreement
may be one of semantics. Dirsmith and Covaleski suggest a
third "category" of information--nonformal. Nonformal
communications are seen to be distinct in that they are

32
associated with the formally recognized, "sanctioned"
practice of mentoring. What may have been "nonformal" to
Dirsmith and Covaleski may well have been "informal" to
Clancy and Collins.
Dirsmith and Covaleski's conclusions are also
inconsistent with the more recent findings of Collins and
Johnson [1986] regarding the importance of informal
communication activity. But again, the apparent
discrepancy is explainable. Collins and Johnson studied a
significantly less mature, formalized entity than the CPA
firms studied by Dirsmith and Covaleski. Accordingly, the
extent to which the formal performance evaluation support
system had been developed differed greatly.
Relevance to the current study
Researchers agree as to the pervasiveness of informal
information in organizations but disagree about its
effects. Informal information systems have been inferred
to complement formal information systems, and informal
communication activity has been demonstrated to be
beneficial to organizations. However, informal i
communications have also been shown to be dysfunctional.
While none of the studies of informal information activity
directly address performance evaluation, their inconsistent
conclusions suggest situational variability and semantic
difficulty in the study of informal information.

33
Summary
The evaluation of individual performance plays an
important role in organizations. Performance evaluation
influences goal setting and provides feedback regarding
goal-directed behavior. However, the relationships among
goals, performance, and feedback are situational.
Early studies on performance measures (single,
multiple, and composite) conclude that measures of various
aspects of organizational activity influence the behavior
of individuals even in cases in which the measures are not
intended to do so. Further, early budget studies indicate
the importance of budgets to individuals in organizations,
particularly because of their frequent use in pay and
promotion decision making. Also suggested is that some
effects "filter down" the organization thereby influencing
the behaviors of lower management. Potentially, the
dysfunctional consequences of organizational performance
measurement and the influences of budgeting will be evident
throughout the organization.
Periodic performance appraisals are pervasive.
Performance appraisals are used for a variety of purposes,
but the two most important and most frequent uses of
appraisals are compensation administration and feedback
(including counseling and development). In most formal
systems, and according to a great deal of the normative
literature, a single appraisal is intended to serve many
34
purposes. However, research has suggested that performance
appraisal for the purpose of compensation adjustment should
not be the same thing as performance appraisal for training
and developmental purposes. Since periodic performance
appraisals are incapable of supporting both salary
administration and training and development, superiors must
use additional information in at least one of the
processes.
From a total labor force perspective, the markets and
hierarchies literature recognizes the potential for
dysfunctional behavioral consequences of the use of
accounting measures alone because they are short-run in
nature, and suggests the role of informal information in
compensating for formal system inadequacies. This
complementary relationship between formal and informal
information is supported by Clancy and Collins [1979] and
Collins and Johnson [1986] , but disputed in Dirsmith and
Covaleski [1985].
Individual performance evaluation is influenced by a
number of situational and individual factors. Accordingly,
the relative use of formal and informal information in
performance evaluation is likely to be related to, or
contingent upon, a number of situational and individual
factors, or explanatory variables of interest. In the
following chapter, the dependent variable (relative use of
formal and informal information in individual performance

35
evaluation) and the explanatory variables of interest are
discussed, and illustrations of the expected relationships
among the variables are provided.

CHAPTER III
DISCUSSION OF VARIABLES AND RELATIONSHIPS
MODEL DEVELOPMENT
In this chapter, the research perspective is explained
and the variables of interest are discussed. Then,
hypotheses are stated in order to specify the a. priori
relationships among the variables, and a research model is
provided to illustrate the hypothesized relationships. In
the following chapter, the research methodology is
explained, and data gathering and analysis are discussed.
Theoretical Perspective
Performance information is relied upon in making
judgments about an individual's performance, and
performance judgments as a summative evaluation are a
primary determinant of performance related decisions
[Jiambalvo, Watson, and Baumler, 1983; Howell, 1976; Zedeck
and Kafry, 1977]. Therefore, performance evaluation is an
intervening variable between the relevant information and
performance-related decisions, such as pay, promotion, and
termination. Figure 3.1 (following page) illustrates these
basic relationships.
36

37
Performance
I n f o r m a t i on
Pe r fo rmance
E v a l u a t i on
Pay, P r o m o t i o n , or
T e r m i n a t i o n D e c i s i o n
Figure 3 . 1 : Preliminary Theoret ical Model

38
One characteristic of the relationship between
performance information and performance evaluation is the
relative use of formal and informal information (RUFI).
Variation in RUFI may evidence moderating effects of a
number of factors on the relationship betv/een information
and evaluation. From an individual decision-maker's
perspective, RUFI may be partially determined by that
individual's attitudes toward the information. Variance in
RUFI may be partially attributable to variation in
individuals' attitudes toward the information (ATTITUDES).
With the addition of the moderating variable (ATTITUDES)
and in illustration of the variable of interest (RUFI),
Figure 3.2 (following page) depicts the theoretical model.
Since the design of jobs influences the approach and
content of performance evaluation, variation in RUFI may
also be attributable to variation in the nature and content
of the individuals' organizational function. The nature
and content of jobs vary both within and among
organizations. Organizational size, technology, and
environment are likely to influence the design of jobs from
organization to organization. Delineation of
responsibilities within organizations (sales, production,
support, etc.) is likely to influence the design of jobs
within organizations. Of primary concern in this study,
however, are the individually-oriented factors that
influence RUFI. Thus, the models presented in this chapter
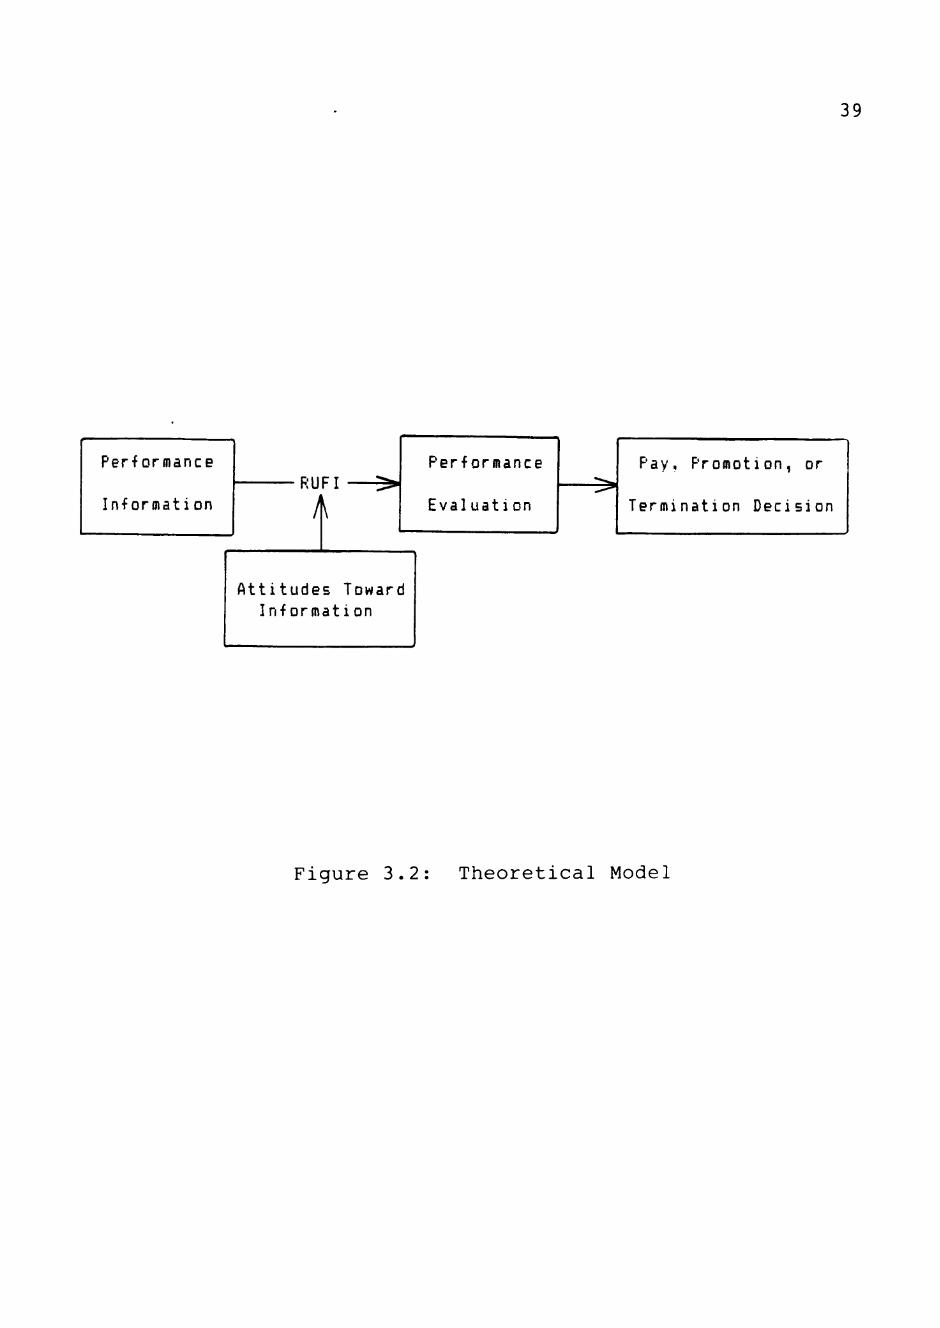
39
Per formance
I n f o r m a t i on RUFI
A
Per fo rmance
E v a l u a t i on • ^
Pay, P r o m o t i o n , or
T e r m i n a t i o n D e c i s i o n
A t t i t u d e s Toward I n f o r m a t i o n
Figure 3 . 2 : T h e o r e t i c a l Model

40
do not depict the influence of variation in job design on
RUFI, and the sampling procedures discussed in the
following chapter were designed to control for both
interorganizational and intraorganizational variation in
the nature of the individuals' jobs.
In this study, attitudes toward the information (and
other individually-oriented factors) are expected to
moderate the relationship between information and
evaluation. The relative use of formal and informal
information (RUFI) is descriptive of the relationship
between information and evaluation, and variation in RUFI
indicative of moderating effects on that relationship.
Finally, the results of performance evaluation are presumed
to be manifest in pay, promotion, and termination
decisions.
Under the hierarchies and markets theory [Tiessen and
Waterhouse, 1983] , a performance history is a necessary
part of an "internal labor market" that encourages
subordinates to reveal private information. In a dynamic
setting, the results of performance decisions become part
of the performance history of the employee. Thus, the
relationships illustrated in the theoretical models may not
be unidirectional as indicated. The static, unidirectional
models are presented in order to emphasize the primary

41
theoretical relationships. Of primary concern in this
study is the formal/informal classification, regardless of
the current/historical nature of the information.
Potential Explanatory Variables
In addition to ATTITUDES, there are a number of
measurable personality traits and other individually-
oriented variables with the potential of explaining
variation in RUFI. Possibilities include perceived role
stress; leadership style; the "needs" variables of power,
achievement, and affiliation; Jungian type;
Machiavellianism; authoritarianism; and demographic
variables such as age, tenure, and sex. Included in this
study, however, are only those variables for which an
a priori statement of casual relationship with RUFI could
be provided. Previous discussions justified the inclusion
of ATTITUDES as an explanatory variable. The following
discussion of the research perspective adopted explains why
role stress and superiors' leadership style are included.
One additional variable, locus of control, is included
since an extensive theoretical articulation and a pervasive
empirical base support a priori specification of the
relationships among locus of control and the other research
constructs of interest.

42
Research Perspective
Some researchers (see Collins and Clancy [1980]; *
Collins [1982]; Collins, Seller, and Clancy [1984]; Collins
and Johnson [1986]; Collins, Munter, and Finn [1983]) have
adopted the role perspective suggested by Katz and Kahn
[1967], viewing organizations as dynamic, interactive
systems capable of being described in terms of roles and
norms. Roles and norms are closely related concepts; the
former referring to a sets of behaviors and the latter
representing limitations, or expectations about the former.
Collins and Clancy [1980] note that "roles exist in
relationship to other roles," [p. 1] and recognize the
particular importance of the role-related expectations of
"salient" others [p. 2]. In a business setting, an
individual's superior is likely to be a particularly
salient other. Thus, both perceived role stress and
perceived leadership style (superiors') are likely to be
useful explainers of attitudes and behaviors of individuals
in organizations.
The influence of extraorganizational factors on
individual behavior (the external environment) is not
inconsistent with the research perspective. Norms and
roles are the result of both internal and external
influences. External influence is evident in the
subsystems within an organization [Katz and Kahn, 1967;
Collins and Clancy, 1980], and therefore is reflected in

43
individuals' attitudes toward those systems. Collins
[1982, p. 1] suggests that certain information-providing
subsystems "are useful in communicating role expectations."
Thus, additional external influence is evident in
individuals' role-related perceptions. Finally,
organizational attributes such as size, structure, and
technology also evidence external influence. To the extent
that individuals' perceptions and attitudes vary among
organizations, organizational variables such as size,
structure, and technology, are potentially useful
explanatory variables. Organizational variables are not
useful, however, in explaining variation within
organizations.
This study focuses on RUFI and on individually-
oriented factors that influence RUFI. Subjects' attitudes
and perceptions constitute the primary empirical evidence.
Also, a role perspective is adopted both in discussing
information systems in organizations and in studying the
attitudes of individuals. Thus, the role related variables
of role stress and perceived superiors' leadership style
are included as explanatory variables. Finally, a
personality variable, locus of control is of interest
largely because of the vast empirical history of the
construct and the intuitive appeal of locus of control as
an explanatory variable. Beginning with the dependent

44
variable, RUFI, discussions of each of the research
variables of interest follow.
The Relative Use of Formal and Informal Information
As previously stated, there are two primary research
objectives:
1. To examine the extent to which informal
information is relied upon relative to formal
information (RUFI) in performance-related
decision making, and
2. To study the relationships among a number of
a. priori explanatory variables and RUFI.
The dependent variable of interest, THE RELATIVE USE OF
FORMAL AND INFORMAL INFORMATION (RUFI), is operationally
defined as the extent to which formal information is
perceived to be relied upon relative to informal
information in performance-related decision-making in
organizations. This variable directly addresses the first
research objective; explained variation in RUFI addresses
the second.
RUFI is of particular relevance to anformation systems
analysis and design. In fact, RUFI might be considered as
a measure of the influence of the formal, or official,
system of performance information. Heavy reliance on
formal information (relative to informal) suggests that an
45
organization's formal system influences managers' judgments
greatly. Conversely, relatively heavy reliance on informal
information suggests that the formal system has less
influence. Positive and normative issues arise: To what
extent i_s the formal information relied upon (relative
to informal) and what factors explain the variation in use;
and to what extent should the formal information be
relied upon (relative to informal) and how can the reliance
be influenced? This study addresses the subject from a
positive research perspective.
In order to provide comparability, a definition of the
term "informal" similar to that applied by Clancy and
Collins [1979] is used in this study. Accordingly,
informal information is defined by default, as that which
is not formal. Formal information is that information
produced or required by official, "sanctioned" information
systems. All other information is informal. A large part
of the variation in RUFI is expected to be attributable to
attitudes toward both the formal (official) information and
the informal (other) information relied upon.
Attitudes Toward Formal and Informal Information
Perhaps most relevant to the designers of information
systems are the relationships among attitudes toward formal
and informal information and RUFI. Descriptive conclusions
46
and normative suggestions are likely to concern certain
attributes of the information, such as timeliness,
completeness, accuracy or confidentiality. Clancy and
Collins [1979] suggest several reasons for the informal
collection of accounting information, many of which refer
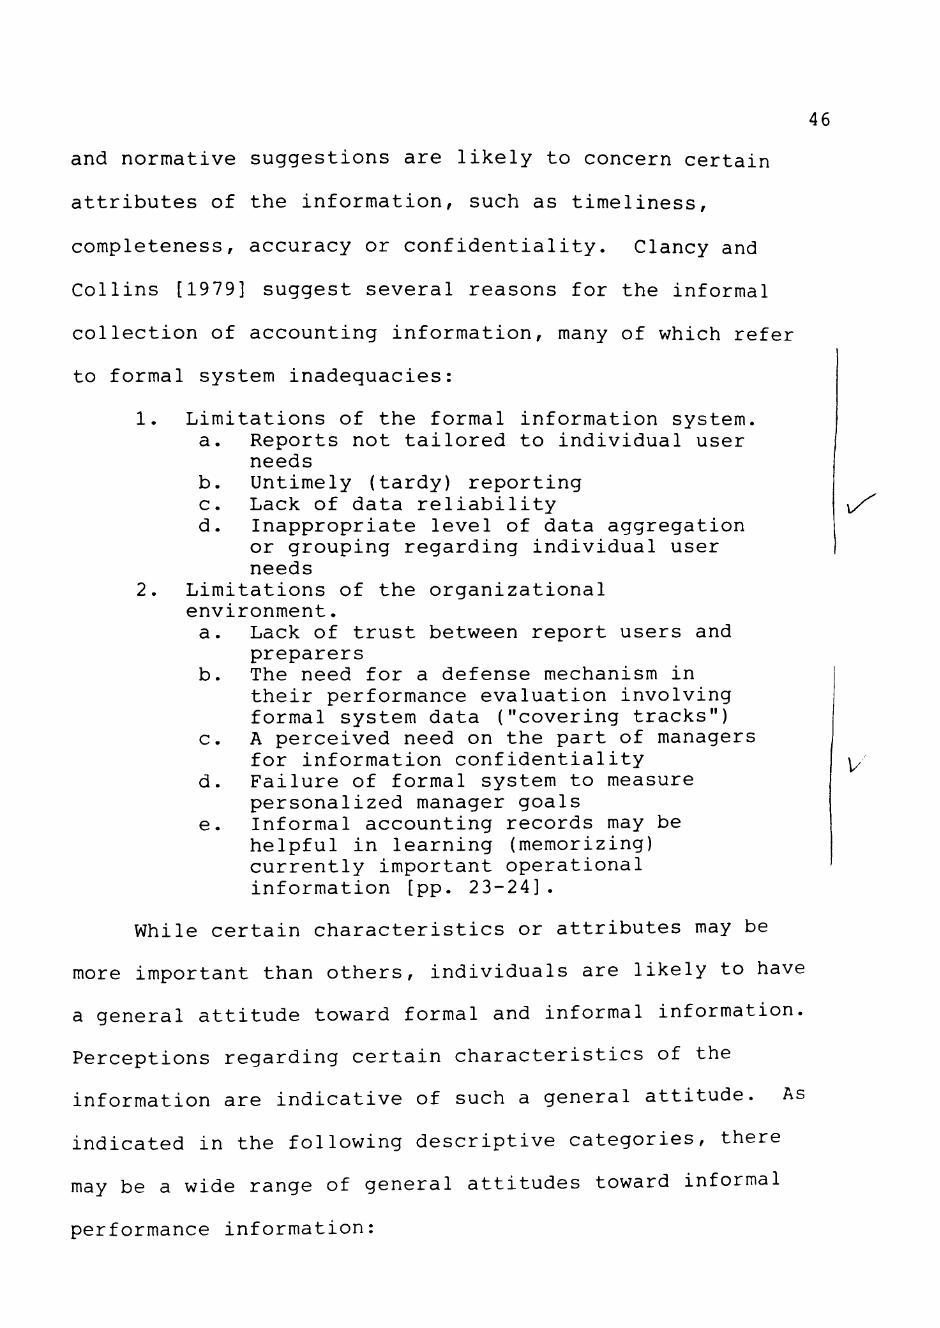
to formal system inadequacies:
1. Limitations of the formal information system. a. Reports not tailored to individual user
needs b. Untimely (tardy) reporting c. Lack of data reliability d. Inappropriate level of data aggregation
or grouping regarding individual user needs
2. Limitations of the organizational environment. a. Lack of trust between report users and
preparers b. The need for a defense mechanism in
their performance evaluation involving formal system data ("covering tracks")
c. A perceived need on the part of managers for information confidentiality
d. Failure of formal system to measure personalized manager goals
e. Informal accounting records may be helpful in learning (memorizing) currently important operational information [pp. 23-24].
While certain characteristics or attributes may be
more important than others, individuals are likely to have
a general attitude toward formal and informal information.
Perceptions regarding certain characteristics of the
information are indicative of such a general attitude. As
indicated in the following descriptive categories, there
may be a wide range of general attitudes toward informal
performance information:
iX
v

47
1. Highly negative: Informal information used in
performance evaluation is inherently bad.
If the information was any good, it could
easily be included in the formal system.
2. Mildly negative: Informal information is a
necessary evil. Even the most detailed,
bureaucratic formal system will not be able
to measure all the significant aspects of a
manager's performance.
3. Mildly positive: Informal information in
performance evaluation is necessary for the
exercise of good management. Good and poor
performance can be hidden in the details of
formal systems because the formal system cannot
consider all significant aspects of performance
and the unique facts and circumstances of each
manager.
4. Highly positive: Informal information is
most often an accurate indicator of performance.
Informal information is critical for the exercise
of good supervision of employees. Without
informal information, a manager is blinded by the
formal reports.

48
Attitudes toward the formal system may vary as well:
1- Highly negative: Formal performance measurement
systems are highly bureaucratic, satisficing
procedures with dysfunctional consequences.
2. Mildly negative: Formal performance measurement
systems do tell us something about performance,
but are far from complete.
3- Mildly positive: Formal systems are necessary
for adequate control, but some supplementary
information is needed.
4. Highly positive: Formal performance measurement
is a useful exercise in good management, and need
not be supplemented with additional information.
Perceptions regarding such attributes as completeness,
accuracy, usefulness, understandability, and
confidentiality of both formal and informal information
reflect individuals' general attitudes toward each. Thus,
the research construct, ATTITUDES, consists of two
dimensions—attitudes toward formal information and
attitudes toward informal information. Variation in
ATTITUDES is expected to explain a significant part of the
variation in RUFI. Generally, relatively positive
attitudes toward formal (informal) information is expected
to result in relatively greater reliance on formal
(informal) information.

49
Locus of Control
The concept of locus of control refers to individuals'
attributions regarding the control over events. Internals
attribute control to themselves, whereas externals
attribute control to outside forces. Spector [1982]
summarized the empirical research as follows:
. . . locus of control is related to motivation, effort, performance, satisfaction, perception of the job, compliance with authority, and supervisory style [p. 482].
Brownell [1979; 1981; 1982b] studied locus of control
as a moderator of the relationship between participation in
budgeting and organizational effectiveness (performance).
Brownell justified the treatment of locus of control as a
personality variable "simply as a function of the sheer
weight of evidence concerning the wide variety of
situations across which predictions regarding locus of
control have been confirmed" [1979; p. 41]. In general,
budgetary participation was found to have a positive effect
on the performance of internals and a negative effect on
the performance of externals [1981]. Since the budget is
often an important component related to performance
evaluation, the findings of Brownell suggest that locus of
control is relevant to this study as well.
Licata, Strawser, and Welker [1986] report the results
of an experiment that supports their hypothesis that
internal managers allow subordinates greater participation
50
in budgeting than do external managers. In another
experiment, Goodstadt and Hjelle [1973] found internals
exhibiting a personal, persuasive style of supervision and
externals exhibiting a coercive style. Both experiments
suggest that internals use a more flexible, subordinate
oriented managerial style. Implied is the use of a wider
range of information in performance related decision making
by internals than by externals.
Licata et al. suggest that:
It is conceivable that a supervisor involved in budget preparation may have a choice as to the amount of influence he will allow the subordinate to have on his determination of the budget and, further, that locus of control may affect the superior's behavior . . . biasing either toward or away from the subordinate's performance expectations [pg. 113].
The logical extension is that locus of control may affect
the superior's behavior regarding the evaluation of the
subordinate's performance as well.
In explaining the relative use of formal and informal
information systems, LOCUS OF CONTROL may be significant
not just because of relationships with other performance
related variables. In a laboratory experiment, Harvey,
Barnes, Sperry, and Harris [1974] found that internals
perceive more alternatives in a choice situation than do
externals. Accordingly, informal information systems are
more likely to be considered viable alternatives, or
supplements to the formal system by internals than by

51
externals. Conversely, externals may rely more on formal
systems than do internals because they are relatively less
able to perceive alternatives and are more likely to accept
what information is placed before them by the formal
system. Also, internals have been shown to exhibit less
conformity than externals [Crowne and Liverant, 1963].
Again, internals would be expected to rely relatively less
on formal information than do externals, particularly if
the individuals perceive pressure to conform to the formal
system.
Generally, externals are expected to have more
favorable attitudes toward, and rely relatively more on
formal information, whereas internals are expected to have
more favorable attitudes toward, and rely relatively more
on informal information systems.
Role Stress
Role stress is best defined as the strain that results
from one or both of two situations: role conflict and role
ambiguity [Kahn, Wolfe, Quinn, Snoek, and Rosenthal, 1964].
Based on their review of the literature. Van Sell, Brief,
and Schuler [1981] defined role conflict as "incongruity of
expectations associated with a role" [p. 44], but were
unable to provide a specific definition for role ambiguity,
noting the lack of an elaborate conceptualization in the
literature (see also McGrath [1976] and Sarbin and Allen

52
[1968]). The following forms of role ambiguity are
suggested by Van Sell et al:
(a) information is unclear regarding which potential role expectation—A, B, or C—should be performed;
(b) it is understood that expectation A should be met, but information is unclear regarding what behavior will in fact yield A;
(c) the consequences of behavior A are unclear [p. 44] .
Rizzo, House, and Lirtzman [1970] developed a
frequently used role stress measurement instrument and
provided the initial support for interpretation of the
scale's results along the two dimensions of conflict and
ambiguity. High construct validity and continued use of
the scale are supported by a psychometric evaluation
reported by Schuler, Aldag, and Brief [1977] and in the
review and discussion of Van Sell, Brief, and Schuler
[1981]. However, the later are careful to note high
correlation between the two constructs and to suggest
bi-directional causation. More recently, Howell and Wilcox
[1986], caution against separate interpretation of the two
dimensions of the scale on the basis of another
psychometric analysis. In this study, role stress is of
concern as an explanatory variable. Thus, the composition
of stress by dimension is secondary since the type, or
cause, of stress is not of primary concern.

53
Role stress has been studied in relation to a variety
of other research constructs. It has been hypothesized to
be related to budgetary attitudes [Collins, 1978; Collins
and Seller, 1981; Collins, Seller, and Clancy, 1984],
satisfaction [Sapp and Seller, 1980], leadership style
[Rizzo, House, and Lirtzman, 1970; Collins, Anderson, and
White; 1984], employee turnover [Ivancevich and Donnelly,
1975; Sorensen and Sorensen, 1974; Lyons, 1976],
performance [Greene, 1972; Brief and Aldag, 1976; Haas,
1964] , and perhaps most significantly to job satisfaction
(see Van Sell, Brief, and Schuler, [1981] for a review).
The hypothesized psychological and physiological
effects of stress on individuals are diverse. From a
psychological perspective, stress is often assumed to
result in fixed, or dominant (well-learned) response, but
the nature of this dominant response is situational, as
noted by Zajonc [1980] :
Stress conditions often elicit fixed response patterns, and different stress conditions elicit different responses in different species (e.g., quails freeze in the presence of a hawk, and rats attack each other when receiving electric shock) [p. 54] .
The general theme of the psychological literature
suggests that individuals under stress resort to what is
well-known, established, and "easy." Thus, an individual
under stress is likely to use the formal information system
since it is known, supported, and documented. In general,

54
high (low) ROLE STRESS is expected to influence both
ATTITUDES and RUFI in favor of formal (informal)
information.
Leadership Style
A great deal of leadership research is evident in the
social psychological literature (reviewed by Hosking [1981]
and Chemers [1983]). Much of the leadership research
focuses on the behaviors of the leader [Chemers, 1983; p.
10]. One extensive leader behavior research program was
conducted at the Ohio State University and produced the
Leadership Behavior Description Questionnaire (LBDQ), a
150-item scale to measure leader behavior [Hemphill, 1950;
Hemphill and Coons, 1957; Stogdill, 1963]. Halpin and
Winer [1957] used factor analytic techniques to identify
two primary factors, or dimensions, of leader behavior
reflected in the LBDQ data: consideration and initiation
of structure. Consideration is characterized by mutual
trust and respect, warmth, and open communications.
Initiation of structure refers to task directed
organizational and structural activities. These two
dimensions of leader behavior are conceptually similar
to the employee oriented and production oriented
supervisory styles identified by Kahn [1951] and Katz and
Kahn [1966] , the socioeconomic specialist and task

55
specialist referred to by Bales and Slater [1945], and
concern for people and concern for production supported
by Blake and Mouton, [1964]. Much of the research in
organizations concerning leadership utilizes the structure
and consideration dimensions [DeCoster and Fertakis, 1968;
Revsine, 1970; Hopwood, 1972, 1974; Otley, 1978; Collins,
Anderson, and White, 1984].
Of particular relevance to this research are studies
of leadership style and budgeting practices [Hopwood, 1972,
1974; Otley, 1978; and Brownell, 1982a and 1983].
Generally, Hopwood was able to support the contention that
a budget-constrained leadership style leads to job related
tension, and suggested that the increase in tension has
dysfunctional consequences. Otley's attempt to replicate
Hopwood's work resulted in apparently conflicting data,
suggesting a positive association between performance and a
budget-related leadership style. Finally, Brownell
extended the previous studies, noting that:
. . . a budget-focused leadership style is most effective under conditions of high participation, but is ineffective where participation is low [p. 13] .
Thus, relationships between leadership style and
subordinate performance are widely recognized, but the
nature of the relationship and the influence of situational
and individual variables remain unexplored. Nonetheless,
it is logical to expect the superior's leadership style to
be significantly related to the subordinate's performance

56
evaluation practices. The leadership style of the superior
serves to communicate role expectations to the subordinate.
Also, the performance evaluation practices of the
subordinate are a part of the subordinate's performance.
Therefore, the superior has a direct influence on the
performance evaluation practices of the subordinate through
evaluation of the subordinate's performance evaluation
"performance" and an indirect influence on the
subordinate's performance evaluation practices through the
role expectations communicated through the superior's
leadership behavior.
Individuals who perceive their superior to be high on
initiation of structure are expected to be influenced
toward the more structured, formal system. Further, the
contagion effect [Hopwood, 1972] implies that the
subordinate is likely to exhibit the superior's leadership
style, again implying a relatively greater reliance on the
structured, formal system when the superior is highly
structured in leadership style. Conversely, individuals
who perceive their superior to be highly considerate are
more likely to perceive the ability to deviate from the
formal system without retribution. As such, the
individuals are more likely to use informal information
than in- situations where the superior is less considerate
toward individual needs. Thus, high (low) structure is
expected to influence both ATTITUDES and RUFI toward formal

57
(informal) information, whereas high (low) consideration is
expected to influence both ATTITUDES and RUFI toward
informal (formal) information.
Other Relationships Among Explanatory Variables
Previous discussions have focused on the relationships
among ATTITUDES and RUFI and each of the individually
oriented explanatory variables. Additional relationships
among the explanatory variables include: 1) LOCUS OF
CONTROL and ROLE STRESS, 2) LOCUS OF CONTROL and LEADERSHIP
STYLE, 3) and ROLE STRESS and LEADERSHIP STYLE.
"Strictly speaking, locus of control is more popularly
conceived as being a relatively stable characteristic which
endures over time and across situations" [Brownell, 1979;
p. 36, note 27]. As such, LOCUS OF CONTROL may not be
influenced by the other variables of interest, but is
likely to influence perceptions of both ROLE STRESS and
LEADERSHIP STYLE. Further, the role perspective adopted
suggests that superiors' LEADERSHIP STYLE may influence
perceived ROLE STRESS.
LOCUS OF CONTROL, ROLE STRESS, and LEADERSHIP STYLE
are of interest in this study on the presumption that each
influences ATTITUDES and RUFI. The determinants, or
causes, of LOCUS OF CONTROL, ROLE STRESS, and LEADERSHIP
STYLE are beyond the scope of the research, but the fact

58
that the three are related is relevant. Relationships
among LOCUS OF CONTROL, ROLE STRESS, and LEADERSHIP STYLE
are recognized in order to portray a more accurate research
model and to facilitate statistical analysis. Exclusion
of these "other" relationships in data analysis could lead
to distorted or incorrect conclusions involving ATTITUDES
and RUFI.
Variables of Interest: Summary
Of primary concern are the direct relationships
between the dependent variable, RUFI, and each of the four
individually-oriented explanatory variables: ATTITUDES,
LOCUS OF CONTROL, ROLE STRESS, and LEADERSHIP STYLE. RUFI
is expected to be influenced toward informal information by
relatively favorable ATTITUDES toward informal information,
relatively more internally-oriented individuals regarding
LOCUS OF CONTROL, low levels of ROLE STRESS, and
supervisors exhibiting highly considerate, low structure
LEADERSHIP STYLE. RUFI is expected to be influenced toward
formal information by relatively favorable ATTITUDES toward
formal information, relatively more externally-oriented
individuals regarding LOCUS OF CONTROL, high levels of ROLE
STRESS, and supervisors exhibiting highly structured, low
consideration LEADERSHIP STYLE.
There are a number of relationships among the
explanatory variables with the potential of indirectly

59
influencing RUFI. ATTITUDES may be affected by the three
other explanatory variables. In fact, the influence of the
explanatory (and other) variables on RUFI may be primarily
"through" ATTITUDES. Finally, the relationships among
LEADERSHIP STYLE, ROLE STRESS, and LOCUS OF CONTROL must be
recognized so that the direct and indirect effects of the
explanatory variables are not distorted.
Hypotheses
The following research hypotheses refer to the
independent, or predictor variables, and are based
primarily on the previous discussions. Five hypotheses are
needed to specify the direct relationships between the
predictor variables and RUFI because two dimensions of
LEADERSHIP STYLE are of interest. Stated in the alternate
form, the five hypotheses follow:
HI: When making performance related decisions,
relatively favorable attitudes toward
informal (formal) information will be
associated with relatively greater reliance
on informal (formal) information.
H2: Individuals who are relatively strong
internals rely relatively more on informal
information when making performance related
decisions.

60
H3: Individuals in a high state of role stress
rely relatively less on informal information
when making performance related decisions.
H4: Individuals who perceive their superior to
be relatively high in initiating structure
rely relatively less on informal information
when making performance related decisions.
H5: Individuals who perceive their superior to
be relatively high in consideration rely
relatively more on informal information when
making performance related decisions.
There are four additional hypotheses that pertain to
indirect relationships between the predictor variables and
RUFI. Again in the alternate form, the hypothesized
relationships among the predictor variables and ATTITUDES
follow:
H6: Individuals who are relatively strong
internals are likely to have relatively more
favorable attitudes toward informal
information.
H7: Individuals in a relatively low state of
role stress are likely to have relatively
more positive attitudes toward informal
information.
H8: Individuals who perceive their superior to
be relatively high in initiation of

61
structure are likely to have relatively more
positive attitudes toward formal information.
H9: Individuals who perceive their superior to
be relatively high in consideration are
likely to have relatively more positive
attitudes toward informal information.
Although not of interest as hypotheses, additional
relationships among the explanatory variables are
recognized. In similar positive, or alternate form, there
are three "assumed" relationships:
Rl: Locus of control and role stress are related.
R2: Locus of control and superiors' leadership
style are related.
R3: Role stress and superiors' leadership style
are related.
The Research Model
In the conceptual model of the relationships between
performance information, performance evaluation, and
performance related decisions (pay, promotion, and
termination), attitudes toward the informal information
were hypothesized to have a moderating effect on the
relationship between performance information and
performance evaluation (see Figure 3.2: Theoretical Model,
page 39). Previous discussions have supported similar
moderating effects of LOCUS OF CONTROL, ROLE STRESS, and

62
LEADERSHIP STYLE, and have suggested some additional
relationships among the variables. The direct
relationships between RUFI and each of the four explanatory
variables and the relationships between ATTITUDES and each
of the three other explanatory variables are stated as
hypotheses. The assumed relationships summarize additional
relationships among the explanatory variables.
Accordingly, the research model is now complete and
illustrated as Figure 3.3 (following page). Straight lines
between constructs indicate hypothesized relationships,
whereas curved lives represent assumed relationships.
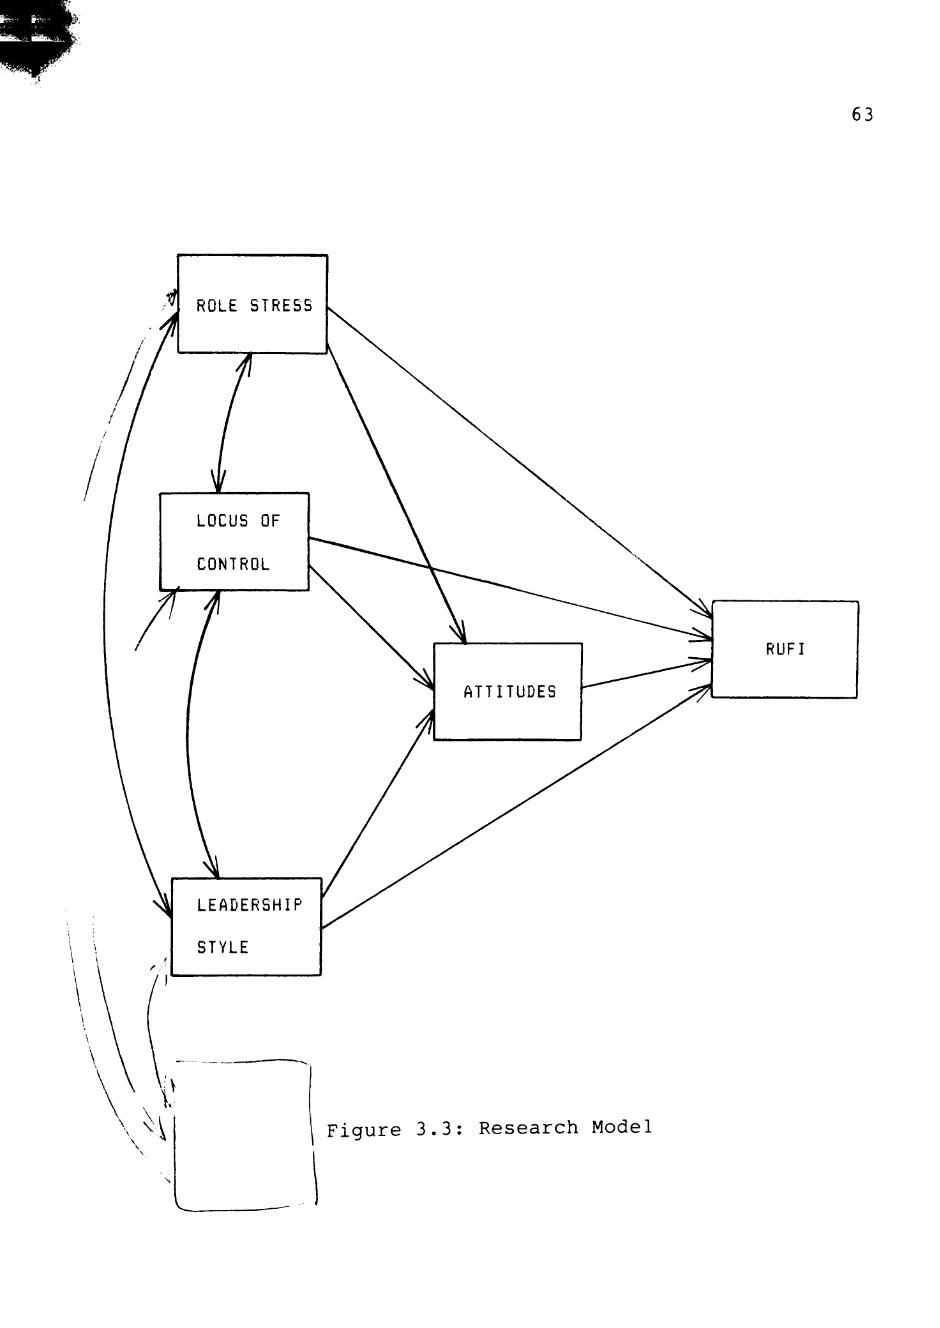
63
ROLE STRESS
LOCUS OF
CONTROL
LEADERSHIP
STYLE
RUFI
Figure 3.3: Research Model

CHAPTER IV
RESEARCH METHODOLOGY
The purposes of this chapter are to: 1) explain the
research methodology, describe the research subjects, and
discuss the research instrument; and 2) provide a brief
description of the statistical technique applied.
Particular emphasis is placed on the development and
measurement of the dependent variable—RUFI.
A Two-Phase Field Study
The first phase of the study consisted of a series of
interviews to develop the research instrument. The
interview approach was desirable because of the "richness"
of information available, and to promote internal and
external validity. The second phase of the study involved
pretesting of the instrument to a sub-sample of managers
and administration of the questionnaire. The empirical
data for statistical analysis were gathered in phase two.
Both phases involved a non-laboratory setting and
neither phase involved the manipulation of variables.
Accordingly the research is appropriately classified as a
field study:
64

65
. . . ex post facto scientific inquiries aimed at discovering the relations and interactions among sociological, psychological, and educational variables in real social structures [Kerlinger, 1973; p. 405].
Phase one of the study was exploratory in nature whereas
phase two was hypothesis-testing.
Phase One: Development of the Instrument
Performance evaluation was not directly observable for
research purposes because of both the confidential and
legal nature of employment records. The proposed
explanatory variables involved individuals' attitudes and
perceptions. Thus, the need for confidential, individual
participation suggested the appropriateness of a
questionnaire as the primary data source.
Measurement of RUFI and ATTITUDES
Standardized measures were available for each of the
independent variables in the research model except
ATTITUDES. The dependent variable (RUFI) and the
independent variable ATTITUDES are unique to this study and
had to be developed. Early development of the instrument
included a number of interviews with a variety of subjects.
The interviews consisted of a series of open-ended
questions regarding the use of information in pay and
promotion decisions, desirable and undesirable attributes
of that information, and descriptions of the source(s) of

66
the data. A general schedule for the early interviews is
presented as Appendix A.
Participants in the developmental interviews were of
diverse backgrounds and represented a variety of
supervisory roles. Included were a general manager and a
personnel manager of a national retail organization, an
operations manager of an energy service company, a
commercial-lending officer, a public school superintendent,
and a number of university professors and graduate students
with various supervisory experience. Each of the interview
subjects currently or previously played a significant role
in the determination of merit pay increases, promotions,
and terminations of subordinates.
Three semantic issues became evident during the
initial interviews. First, the subjects tended to
interpret "performance evaluation" as the periodic coaching
and development exercise required (and documented) by the
formal system rather than as the "summative evaluation" of
interest in this study. The evaluations were done at
varying time intervals and provided part of the information
used in performance-related decision making. Thus, the
subjects perceived "performance evaluation" to mean what
the normative managerial literature refers to as
"performance appraisal," and were consistent with the
previously summarized surveys of current managerial
practice regarding differences in performance evaluation

67
for coaching purposes and performance evaluation for pay
and promotion decisions. Since the later was of primary
concern in this study, the ATTITUDES and RUFI sections of
the questionnaire referred to pay, promotion, and
termination decisions. Questions regarding periodic
performance evaluation (appraisal) were included, but the
responses were expected to vary significantly from those
regarding pay, promotion, and termination decisions since
the two were treated differently by interviewees.
The second semantic issue identified in the early
interviews concerned the terms formal and informal.
Neither term was understood by the subjects. All subjects,
however, could easily define or describe the "official"
system, and had no problem describing "official
information." Further, all subjects were able to describe
"other" informational influences on performance appraisals
and pay, promotion, and termination decisions. Given the
"official" vs "other" terminology, the subjects were able
to discuss their attitudes toward each, frequently
mentioning such attributes as confidentiality,
completeness, and accuracy. The subjects described a
variety of "other" (i.e., informal) informational
influences and systems used by themselves and other
organizational members. The descriptions ranged from
"opinions of others" to elaborately developed, fully
documented measurement systems. Thus, in the

68
questionnaire, "official" and "other" were used to
represent "formal" and "informal," respectively, and the
ATTITUDES questions addressed such attributes as
confidentiality, completeness, accuracy, and timeliness.
The third issue pertained to differences in the
authority of the manager in performance-related decision
making. Some of those interviewed indicated that they
could not actually make pay, promotion, or termination
decisions but that they did have the ability to
significantly influence the decisions. Thus, the dependent
variable questions were worded to include "suggest" as well
as "make" when referring to performance-related decisions.
Generally, the initial interview subjects were willing
and able to discuss their own performance evaluation
practices as well as their perceptions of the practices of
others. Some subjects were quite opinionated regarding the
evaluation of performance, openly criticizing the
"official" system. Other interviewees stressed the need
for standardization and formality. Practices seemed to
vary within organizations as much as among organizations,
strongly implying the existence of individual differences.
The Questionnaire
The questionnaire consisted of four parts (see
Appendix B), and measured five primary research variables.
Three of the five were established research instruments:

69
LOCUS OF CONTROL, LEADERSHIP STYLE, and ROLE STRESS. The
remaining two variables, ATTITUDES and RUFI, were unique to
this study. The content and wording of the latter two
variables were largely the result of the phase one
interviews. V7ith the exception of the demographic
information and a multiple choice description of the
informal information used, all items solicited seven-point
Likert-type responses. Following are brief descriptions of
the contents of each part.
Part One: Demographics. In part one, subjects were
to report their sex, age, level of education, years in
current position, and years with the company. Also, the
organizational function, or department, was requested and
each manager was asked to indicate a "pre-merger"
affiliation (see Pretesting for additional discussion of
this last item).
Part Two: RUFI and ATTITUDES. In order to develop
scores for RUFI and ATTITUDES, the subjects were asked to
respond to twelve Likert-type questions twice each, once
regarding the "official" information used in performance
related decision making, and once regarding the "other"
information used.
Double responses to four Likert-type questions (nine
through- twelve) constituted the basis for RUFI scores.
Perceptions regarding the extent of influence of both the
"official" and "other" information regarding merit pay

70
adjustments, promotions, terminations, and periodic
performance evaluations were recorded on seven-point
scales. Four indicants of the relative use of formal and
informal information are the differences between the
"official" and "other" responses. Since the "official"
responses were subtracted from the "other" responses in
computing the relative scores, positive scores indicated
greater reliance on informal than formal information.
Therefore, four indicants of RUFI were obtained along a
continuum of scores from negative six (total reliance on
the "official" information) to positive six (total reliance
on the "other" information).
The first eight (numbered) questions in part two
solicited qualitative judgments regarding the accuracy,
completeness, ease of use, extent of detail,
understandability, confidentiality, timeliness, and
quantitative/qualitative nature of the information.
Responses to these eight questions were presumed to be
indicative of the subjects' general attitudes toward both
the formal and the informal information.
An additional question was included in part two in
order to provide a validity check on the formal versus
informal distinction and to aid in interpretation of the
results. A general description of the "other" information
used was obtained using a multiple choice format (first
question, not numbered). The alternatives provided were

71
developed from the phase one interviews and ranged from "an
organized, documented set of records, memos, or other data"
to "unwritten advice and/or memory." Also, a "none of the
above (please specify)" option was available.
Part Three: ROLE STRESS and LOCUS OF CONTROL.
Fourteen questions addressed ROLE STRESS and were from
Rizzo, House, and Lirtzman [1970]. Eight of the fourteen
referred to role conflict, whereas the remaining six
addressed role ambiguity. The Rizzo, House, and Lirtzman
scale has been widely applied and generally supported in
the literature [Van Sell, Brief, and Schuler, 1981]. The
remaining fifteen items in part three assessed LOCUS OF
CONTROL.
Robinson and Shaver [1973] report that most
researchers have applied the 58-item (29 pair), forced
choice format instrument developed by Rotter [1966] and
Lefcourt [1966, 1972] in measuring locus of control.
Collins [1974] converted the scale to a 58-item Likert-type
instrument in order to avoid the forced choice format and
to facilitate factor analysis. From the analysis reported
by Collins, fifteen questions were identified as
particularly significant. These fifteen items were the
LOCUS OF CONTROL questions in part three of the
questionnaire. An experiment using 234 undergraduate
business students of a large university in the southwest
supported the validity of the abbreviated instrument

72
[McGill and Johnson, 1986]. The fifteen item "LOC short"
scale produced scores that correlated strongly with scores
on the Rotter "LOC long" instrument (.63). Further, LOC
short was found to have a test-retest reliability of .81
and an alpha coefficient of .80.
Part Four: LEADERSHIP STYLE. The questions used to
measure LEADERSHIP STYLE were taken directly from the LBDQ
Manual [Stodgill, 1963]. Korman [1966, p. 349] noted the
significance of the leadership research program conducted
at The Ohio State University recognizing that "the most
important contribution was isolation of "Consideration" and
"Initiating Structure" as basic dimensions of leadership
behavior in the formal organization." The LBDQ instrument
was used in this study because it provides a measure of
subordinates' perceptions of superiors' leadership style
and since the instrument has been used in similar studies
of information usage in performance evaluation [Hopwood,
1972; 1974]. Perceptions of superiors' leadership
behavior, particularly along the structure and
consideration dimensions, evidence role-related
expectations of salient others. Thus, the LBDQ measurement
of the two dimensions was consistent with the role
perspective adopted in this research. Ten seven-point
Likert-type responses gathered perceptions of the
superiors' considerate behavior (CONSIDERATION). Ten
others measured initiation of structure (STRUCTURE).

73
Phase Two: A Single-Entity Sample
Variation in RUFI may be influenced by a number of
factors. In order to concentrate on individually-oriented,
intraorganizational influences, the empirical data were
from within a single operational department in a single
entity. A single-entity study was consistent with the role
perspective previously discussed and was designed to
eliminate the variance attributable to interorganizational
factors. Further, the sample population was restricted to
operations management in order to reduce variation in job
design as much as possible.
The population sampled was operations management of
the transportation division in the subject entity—a
Fortune 100 company involved primarily in transportation
and energy. All of the managers were line managers (as
opposed to staff managers) and all were core managers in
that each had limited contact with external parties. Each
manager had at least one subordinate, thus was presumed to
have input in performance related decision making. The
subordinates were either other managers or non-managers
responsible for the construction, maintenance, and/or
operation of equipment and facilities used in the
transportation of goods. Managers in support groups
(accounting, personnel, purchasing, etc.), top (executive)
management, and marketing were not represented. Thus, the
managers and the subordinates constituted two fairly

74
homogenous groups with reasonably similar job designs.
Approximately 500 managers constituted the population. Of
the managers, 279 were randomly selected to participate as
research subjects. A convenience sample of seven other
managers was made available to participate in pretesting
the questionnaire.
Pretesting
Pretesting interviews were more structured than the
phase one interviews in that administration of the entire
questionnaire preceded general discussion and specific
questioning regarding the instrument. Also, all of the
subjects involved in the pretesting were from the
population to be sampled by questionnaire. Seven managers
of a local facility of the subject entity participated in
pretesting interviews.
Generally, the subjects required no assistance other
than a brief introduction, completed the questionnaire in
less than fifteen minutes, and made few specific comments.
However, several of the participants suggested that the
responses might differ between two distinguishable elements
in the organization. Recent merger activity resulted in an
organization consisting of two operating factions, each
still relatively independent, with geographical and other
distinctions. The pretest subjects suggested that the
identification of responses by "pre-merger affiliation"
75
might provide information useful in understanding variation
in RUFI within the research entity. Accordingly, a final
question was added to part one of the questionnaire in
order to enable analysis by operating faction.
Distribution and Response
The names and addresses of 279 managers were provided
by the research contact, the senior operations executive of
the research entity. The sample was stratified in that 219
of the managers were mid-to-low-level managers of
decentralized operations throughout the central and western
U.S., whereas 60 of the managers were mid-to-upper-level
managers of operations at the subject entity's
headquarters. Initial mailings to each subject included
the questionnaire, a stamped return envelope, and a letter
of introduction from the senior operating executive. The
letter described the study and encouraged participation.
The packages were sent to the subjects' homes with the
request that the completed questionnaires be returned
directly to the researcher.
Approximately two weeks after the initial mailings,
second requests for participation were sent to all
non-responding subjects. For the second mailings, a letter
from the researcher accompanied the questionnaire and
return envelope. The initial mailings were referred to,
and particular emphasis was placed on contacting the

76
researcher by telephone to discuss any reservations or
interpretational problems.
Of the 279 subjects selected, 207 responses were
received for an overall response rate of 74 per cent, six
of the responses were unusable because the RUFI questions
were not answered ("usable" response rate of 72%). The
sample was almost entirely male (99%) . Only 6 percent of
the managers selected were less than 31 years of age. 98
percent of the subjects had completed high school, 67
percent reported some college, and 34 percent were college
graduates. Approximately one third of the subjects were
occupying positions they had held for two years or less and
an additional third reported only three to four years in
their current position. Half of the managers had been
affiliated with the subject company in excess of fifteen
years (26% in excess of 26 years) whereas only five percent
had been with the company five years or less. Except for
the exceptionally low number of female participants, the
demographic information appeared to provide a reasonable
profile of mid-to-low level business managers.
Although always an issue with self-report data, there
was no indication of non-response bias. Table 4.1
(following page) reports the results of tests of
differences in the means of the research variables between
those who returned the first questionnaire and those who
returned the second.

Table 4.1: Non-Response Bias Test Results
77
Test F-stat PR > F
Wilks' Criterion 1.17 .2607
L = .80117227
Pillai's Trace 1.17 .2607
V = .19882773
Hotelling-Lawley Trace 1.17 .2607
Trace = .24817101
Roy's Maximum Root Criterion 1.17 .2607
Criterion = .24817101

78
Based on the premise that those who respond to
subsequent requests are similar to those who do not respond
[Pace, 1939; Armstrong, 1977], the lack of significant
differences indicates that non-response bias is not a
significant issue.
Statistical Analysis - LISREL
Since the research addressed a number of latent
(unobservable) constructs, data analysis techniques of
factor analysis and structural equation models were both
desired. The statistical technique chosen is the
covariance structure modeling technique available through
the program LISREL [Joreskog and Sorbom, 1985]. Sujan
[1986, pg. 45] noted an advantage of LISREL over
traditional regression techniques that is particularly
relevant to this research: "(H)ypotheses can be tested in
the context of other relationships."
Several strengths of LISREL were noted by Bagozzi
[1980; p. 107]:
1. The general linear model is a comprehensive scheme for representing all of the elements and relationships of a theory in a single structure.
2. The general linear model provides one with direct measures of the degree to which theoretical constructs are related, the extent of errors in equations and variables, and the relationships between constructs and operationalizations.

79
I
3. Since the approach is a maximum likelihood procedure, parameter estimates are independent of scales of measurement for the variables in the model.
4. LISREL provides a test statistic for one's entire model.
5. Finally, as Burt [1973] indicates, maximum likelihood estimates from procedures such as LISREL are "optimally efficient . . . over variable sample sizes" and are "robust over nonnormality."
Several limitations, or assumptions, of LISREL were
noted also by Bagozzi: The data are assumed to be interval
scaled, functional relationships among variables are
assumed to be linear, the observations are assumed to be
from a multivariate normal distribution, and specific
hypotheses must be substantially supported a, priori.
An Introduction to LISREL
The LISREL model was introduced by Joreskog [1973] and
has been applied in a variety of research appearing in
journals of psychology, sociology, econometrics, and
various other social sciences. Generally, the LISREL
computer program uses maximum likelihood procedures to
estimate the unknown coefficients in a set of linear
equations. "The program is particularly designed to handle
models with latent variables, measurement errors, and
reciprocal causation (simultaneity, interdependence)"
[Joreskog and Sorbom, 1985, p. 1.2].

80
The LISREL model consists of a measurement model that
specifies how each of the latent (unobservable) constructs
relate to the observed variables, and a structural model
that specifies the relationships among the latent
constructs (including causation). Using either raw input
or a matrix of the relationships between the observed
variables, the program is able to generate maximum
likelihood estimates of the parameters in the model, such
as the strengths of the relationships among the latent
variables, the measurement errors, and the modeling error.
Application of LISREL requires an a_ priori specification j
of the relationships among the variables. j
Model Specification
Figure 4.1 (next page) is an illustration of the
LISREL_model applied in this research. The LISREL model is
an extension of the previously specified research model.
Two dimensions of both LEADERSHIP and ATTITUDES are
presented so that all of the hypothesized relationships can
be studied. Also, a number of additional variables and
relationships are illustrated to reflect the observed
variables and their relationships with the latent
constructs (i.e., measurement). Generally, the straight
lines indicate causal relationships v/hereas the curved
lines recognize relationships without specifying causality.

81
Figure 4.1: The LISREL Model

82
In LISREL terminology (summarized in Figure 4.2,
following page), the model consists of six latent variables
(the research variables of interest) and a number of
observable variables. Four of the latent variables
(STRESS, LOCUS OF CONTROL, CONSIDERATION, and STRUCTURE)
are referred to as exogenous (xi) variables since they are
presumed not to be "caused" by other latent variables in
the model. ATTITUDES and RUFI are endogenous (eta) since
they are depicted as being "caused" by other latent
variables in the model. The direct causal effects among
endogenous variables are referred to as "beta's", and the
direct causal effects of the exogenous variables on the
endogenous variables are called "gamma's." Correlational
relationships among the exogenous variables are referred to
as "phi's." The "zeta's" represent influence on the
endogenous variables not explained ("modeling" error).
The observed variables are referred to as either "x"
variables, which are indicants of the exogenous variables,
or "y" variables, which are indicants of the endogenous
variables. "Lambda-x" denotes a relationship between an
"x" variable and a exogenous variable, whereas "lambda-y"
denotes a relationship between a "y" variable and an
endogenous variable. Errors in measuring x's are "delta's"
and errors in measuring y's are "epsilon's." The x's and
y's can be single indicators of the latent construct or

83 Terms - General:
V
y x p q m n
(eta) - a latent endogenous variable (xi) - a latent exogenous variable
- an observed indicator of an endogenous variable - an observed indicator of an exogenous variable - the number of y-variables - the number of x-variables - the number of ^-variables - the number of I-variables
Terms - Specific:
"fl V2 !!3 h h h ^4 yl -y9 -yl7 • xl -x6 -x8 -xlO •
y8 yl6 - y20 x5 x7 x9 - xl2
ATTITUDES ATTITUDES RUFI LOCUS STRUCTURE CONSIDERATION STRESS indicators of indicators of indicators of factor scores factor scores factor scores factor scores
(formal) (informal)
(formal) (informal)
ATTITUDES ATTITUDES RUFI for LOCUS for STRUCTURE for CONSIDERATION for STRESS
Parameter Matrices:
Ay (Lambda-Y)
Ax (Lambda-X)
B (Beta)
r (Gamma)
* (Phi)
^ (Psi)
Be (Theta-Epsilon)
65 (Theta-Delta)
- a pxm matrix of the relationships among y's and v 's
- a qxn matrix of the relationships among x's and ^ 's
- an mxm matrix of the relationships among the V 's
- an mxn matrix of the relationships among the ^'s and the V 's
- an nxn matrix of the relationships among the ^'s
- an mxm matrix of the relationships among the ^'s error terms (f's)
- a pxp matrix of the relationships among the y's error terms (c's)
- a qxq matrix of the relationships among the x's error terms (6's)
Figure 4.2: LISREL Notation
84
factor or composite scores representing a number of
indicators. In the model presented, xl through x5 are
factor scores for LOCUS OF CONTROL, x6 and x7 are factor
scores for STRUCTURE, x8 and x9 are factor scores for
CONSIDERATION, and xlO through xl2 are factor scores for
STRESS. Responses to the ATTITUDES items were used to
measure ATTITUDES (formal) (yl to y8) and ATTITUDES
(informal) (y9 to yl6). Four relative scores (yl7 to y20)
measure RUFI.
From the model, and using the LISREL terminology, it
is now possible to present equations for the structural and
measurement models. Figure 4.3 (following page) presents
both the general forms for the equations and the equations
specific to this research.

85
Structural Equations:
General: v = Bri + T^ r Spe c i :
' ' ' I T?2
^ 3
f i e :
=
0 i821 1831
0 0 1832
0 0 0
' ' I r?2
^ 3
n i '^12 ^13 " 14 "^21 ^ 22 ' 23 " 24 ') 31 ^ 32 '^33 " 34
Measurement Equations
General:
Specific:
and
x l x2 x 3 x4 x 5 x6 x 7 x 8 x9 XlO x l l x l 2
=
yl y2 y3 y4 y5 y6 y7 y8 y9 ylO yll yl2 yl3 yl4 yl5 yl6 yl7 yl8 yl9 y20
r i «2 | 3
[h
+ f l h !-3
U mJ
Ax^ + 5 and
X l l ^ 2 1 ^ 3 1 X4I
X51 0 0 0 0 0 0 0
"Xl l X21 X31 M l X51 ^ 6 1 X71 X81 0 0 0 0 0 0 0 0 0 0 0 0
0 0 0 0 0 ^ 6 2 X72 0 0 0 0 0
0 0 0 0 0 0 0 0 X 9 , : X l O , X l l , X12 . X l 3 , Xl4< Xl5< XI6 0 0 0 0
0 0 0 0 0 0 0 M Xc 0 0 0
>
2 2 2
,2 ,2 r2 r2
13 )3
0 0 0 0 0 0 0 0 0 0 0 0 0 0 0 0
0 0 0 0 0 0 0 0 0 X l O , 4 X l l , 4 X l 2 , 4 j
"
X l 7 , 3 X l 8 , 3 X l 9 , 3 X20,3
r-
1
Ay'?
— —.
?l| h «3 h
+
•J
+ c
\ '
h h 64 55 56 57 58 69 5lO 5 l l 6 l2
''I '?2 ^3
^1 «2 «3 U «5 «6 «7 «8 '9 «10 *11 n2 «13 «14 15 ^6 «17 «18 «19 20
Figure 4.3: LISREL Equations

CHAPTER V
EMPIRICAL RESULTS
The primary statistical technique applied in analyzing
the questionnaire data was introduced in the previous
chapter. The purpose of this chapter is to report the
results of that analysis. Before discussing the fit of the
LISREL model and reporting the results of the tests of
hypotheses, a discussion of the steps taken to validate the
research constructs is provided and the results of tests of
significance of the demographic and other potentially
useful variables are provided.
Verification of the Research Constructs
Tests of validity were performed on the three
established research constructs (LOCUS OF CONTROL, ROLE
STRESS, and LEADERSHIP STYLE). Extended analyses were
afforded the two variables unique to this research—the
explanatory variable, ATTITUDES, and the dependent
variable, RUFI. Simple descriptive statistics for the RUFI
questions are presented in Table 5.1 (following page).
86

87
Table 5.1: Responses to RUFI Items
Variable (Dimension) Mean Standard Deviation
1.
1.
1.
1.
.80
.59
.92
.51
RUFIl: Pay Adjustments
RUFI2: Promotions
RUFI3: Terminations
RUFI4: Appraisals
.42
.65
.32
.29

88
The Relative Use of Formal and Informal Information
The range of scores possible for each of the four
indicants of RUFI (RUFIl, RUFI2, RUFI3, and RUFI4) was -6
(total reliance on formal information) to +6 (total
reliance on informal information). RUFIl and RUFI2 ranged
from -5 to +6, RUFI3 varied over the entire range, and
RUFI4 ranged from -5 to +5. Mean scores for each of the
four were positive (.42, .65, .33, and .29, respectively),
indicating that the subjects perceived greater reliance on
the informal information than on the formal information in
all four performance-related decision situations: pay
(RUFIl), promotion (RUFI2), termination (RUFI3), and
periodic evaluation (RUFI4). T-tests for differences in
means indicated significant differences (alpha < .05)
between formal and informal system responses for each of
the four items (see Table 5.2, following page). Also,
significant positive correlations among the four scores
supported the premise of a common underlying source of
variation (see Table 5.3, page 90).
Two additional analyses provided additional support
for the use of RUFI as a research construct. First, factor
analysis of the RUFI scores suggested the use of a single
factor. The first extracted factor using the principal
components method was able to explain over 70% of the

89
Table 5.2: Tests For Differences in RUFI Responses
Mean Std. Dimension Diff. Error T PR > T
Pay Adjustments
Promotions
Terminations
Appraisals
. 4 2
. 6 5
. 3 2
. 29
. 1 3
. 1 1
.14
. 1 1
3 . 2 9
5 . 7 8
2 . 3 9
2 . 6 8
. 0 0 1 2 * *
. 0 0 0 1 * * *
. 0 1 7 8 *
. 0 0 7 9 * *
* - significant at the .05 level
** - significant at the .01 level
*** - significant at the .001 level

90
Table 5.3: Correlations Among RUFI Responses
Dimension: Pay Adjustments Promotions Terminations
Pay Adjustments
Promotions
Terminations
Appraisals
1.00
.72
.59
.63
1.00
53
62
1.00
.54

91
variance (eigenvalue of 2.84), whereas the remaining
factors were each able to explain less than 13% of the
variance (eigenvalues less than .5). The minimum promax
rotated factor loading on the single factor was .79 and the
minimum communality estimate was .62. Second, a
reliability analysis supported the use of RUFI as a
measurement scale. The calculated reliability coefficient
(alpha) of .86 would have decreased slightly if any of the
four scores were deleted. Thus, the four scores seemed to
produce a reasonably accurate and reliable measurement of
the construct RUFI.
As indicated in the previous chapter, an additional
item was included in the questionnaire to provide a
validity check on the formal/informal distinction and to
facilitate interpretation. A multiple choice question
solicited subjects' descriptions of the informal
information relied on in performance-related decision
making. Eleven subjects (5.5%) did not respond to the
question and no "other" responses were provided. Of those
responding, 74% described the informal information as "some
combination of documentation, advice, and memory" (response
C). An additional 17% of the subjects reported the use of
"an organized, documented set of records, memos, or other
data" (response A). Responses B, "a loose collection of
documentation," and D, "unwritten advice and/or memory,"
comprised the remaining 9%. Thus, more than 90% of the

92
managers indicated that at least some of the informal
information was documented (response A, B, or C) , and
almost 80% of the managers included "advice and/or memory"
(responses C or D). Additional information descriptive of
both the formal and the informal information was available
in the responses to the ATTITUDES questions.
Attitudes Toward Formal and Informal Information
Table 5.4 (following page) contains descriptive
statistics for each of the sixteen ATTITUDES items (AFl to
AF8 for formal. All to AI8 for informal). The eight
questions referred to accuracy, completeness, ease of use,
extent of detail, understanding, confidentiality,
timeliness, and quantitative/qualitative nature of the
information, respectively. Mean scores for all but one of
the fourteen responses were above the scale midpoint of 4.
Suggested was that both the formal and the informal
information were perceived to be accurate, complete, easily
usable, understood, and timely. Also suggested were that
both types of information were more "words" than "numbers"
(AF8, AI8) and that both were closer to "excessive" than
"little" in detail provided (AF4, AI4). Finally, the mean
responses to the confidentiality question were above the
midpoint for the informal information (AI6) but below the
midpoint for the formal information (AF6).
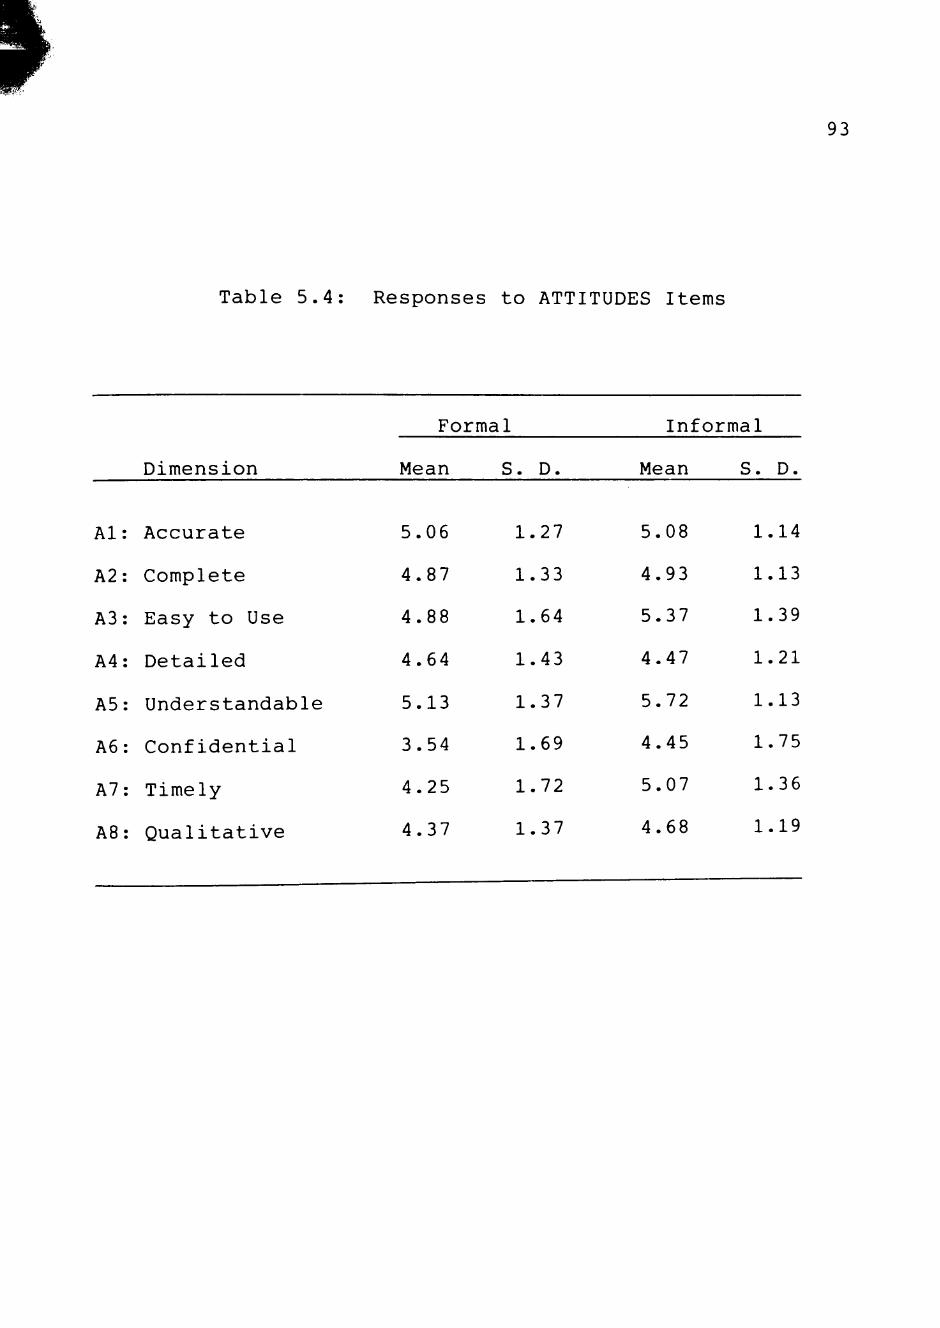
Table 5.4: Responses to ATTITUDES Items
Formal Informal
93
Dimension Mean S. D Mean S. D
Al: Accurate
A2: Complete
A3: Easy to Use
A4: Detailed
A5: Understandable
A6: Confidential
A7: Timely
A8: Qualitative
5 . 0 6
4 . 8 7
4 . 8 8
4 . 6 4
! 5 . 1 3
3 . 5 4
4 . 2 5
4 . 3 7
1 .27
1 .33
1 .64
1 .43
1 .37
1.69
1 .72
1 .37
5 . 0 8
4 . 9 3
5 . 3 7
4 . 4 7
5 . 7 2
4 . 4 5
5 . 0 7
4 . 6 8
1.14
1 .13
1.39
1 .21
1.13
1 .75
1.36
1.19

94
The ATTITUDES responses were also interpretable on a
relative basis, providing some indication of the subjects'
conceptualizations of both the formal and the informal
information. All but one of the mean relative ATTITUDES
scores (RELATl to RELAT8) were positive. Suggested was
that informal information was more accurate, more complete,
more easily usable, less detailed, better understood,
more timely, more confidential, and more qualitative than
the formal information. However, t-tests for differences
in mean responses to each of the eight pairs of ATTITUDES
items indicated that not all of the suggested relationships
were significant (see Table 5.5, following page). Five of
the eight pairs of responses differed significantly (less
than .01); whereas three of the pairs did not (min. of
.17). Formal responses were significantly different from
informal responses for ease of use, understanding,
confidentiality, timeliness, and quantitative/qualitative
nature of the information. Perceptions of accuracy,
completeness, and extent of detail did not significantly
vary.
Factor analysis of the sixteen ATTITUDES responses
supported both a common theme throughout the sixteen and a
formal/informal distinction. The first two extracted
factors"(principal components) had eigenvalues of 5.3 and
1.9, respectively, and together explained over 45 per cent
of the variance. No other factors explained as much as 10

Table 5.5: Tests for Differences in ATTITUDES Responses
95
Dimension Mean Std. Diff. Error PR > T
Al: Accurate
A2: Complete
A3: Easy to Use
A4: Detailed
A5: Understandable
A6: Confidential
A7: Timely
A8: Qualitative
02
06
49
17
59
91
82
31
.10
.10
.11
.12
.09
.13
.12
.11
.26
.58
4.43
1.37
6.36
7.27
6.77
2.82
.7948
.5659
.0001***
.1713
.0001***
.0001***
.0001***
.0052**
* - significant at the .05 level
** - significant at the .01 level
*** - significant at the .001 level

96
percent of the variance. Prior to rotation, 15 of the 16
variables loaded most heavily on the first factor (all
positive), and the second factor consisted of only negative
loadings for the formal items and only positive loadings
for the informal items (see Table 5.6, following page).
Promax rotated factors emphasized the distinction since all
eight of the formal responses loaded more heavily on the
first factor than on the second and all eight of the
informal responses loaded more heavily on the second factor
(see Table 5.7, page 98).
In the LISREL model the two sets of eight responses
(formal and informal) were used as indicators of two
closely-related latent constructs—ATTITUDES (formal) and
ATTITUDES (informal).
Role Stress
Mean responses to the individual STRESS items ranged
from 2.65 to 5.02 with standard deviations of approximately
2. The 14-item scale produced a reliability coefficient
(alpha) of .83, a grand mean of 3.86, and a mean aggregate
score of 54 on a scale from 0 to 98 (standard deviation of
14). Thus, even though a significant amount of variation
was evident, the overall level of role stress perceived by
the subjects was only slightly above the midpoint, and the
scale appeared to produce a reliable measure of an
underlying construct. These results seem to be comparable

97
Table 5.6: Initial Factor Loadings: ATTI TUDES
Source
Formal
Dimension
AFl: Accurate
AF2: Complete
AF3: Easy to Use
AF4: Detailed
AF5: Understandable
AF6: Confidential
AF7: Timely
AF8: Qualitative
First Factor
,68444
17258
61525
33530
Second Factor
.67314 -.44712
.69153 -.49501
.65399 -.38384
51393 -.33465
-.26342
-.10038
-.32301
-.24041
Informal
All: Accurate
AI2: Complete
AI3: Easy to Use
AI4: Detailed
AI5: Understandable
66498
65304
67764
58504
67902
.29753
.31906
.37850
.42760
.39805
AI6: Confidential
AI7: Timely
AI8: Qualitative
20838
62884
37842
.33876
.41585
.07405
Eigenvalue 5.32561 1.91390
Percent Explained .3329 .1196

98
Table 5.7: Promax Rotated Factor Loadings: ATTITUDES
First Second
Source Dimension Factor Factor
AFl: Accurate .80740 .32661
AF2: Complete .84795 .31633
AF3: Easy to Use .75824 .34453
Formal AF4: Detailed .61296 .25298
AF5: Understandable .72188 .43502
AF6: Confidential .19961 .09141
AF7: Timely .69358 .34463
AF8: Qualitative .41135 .15316
All: Accurate .41458 .72057
AI2: Complete .39321 .72210
AI3: Easy to Use .38346 .77483
Informal AI4: Detailed .27881 .72322
AI5: Understandable .37451 .78652
AI6: Confidential .00269 .35796
AI7: Timely .32237 .75381
AI8: Qualitative .29852 .36958
99
with other studies of role stress in organizations
reporting "moderate" levels of stress. For example,
Collins, Seller, and Clancy [1984] report mean stress
scores ranging from 2.32 to 5.00 (1 to 6 scale) and
Collins, Anderson, and White [1984] report mean scores
ranging from 2.22 to 6.62 (1 to 7 scale). Similarly,
Collins and Johnson [1986] report grand means of 2.22 (1 to
5 scale) and Collins and Munter [1986] report grand means
of 2.89 (1 to 5 scale).
Locus of Control and Leadership Style
Since LOCUS OF CONTROL and LEADERSHIP STYLE were
established research constructs, minimal verification
efforts were necessary. Reliability coefficients (alpha's)
were calculated for the 15-item LOCUS OF CONTROL scale, the
10-item STRUCTURE scale and the 10-item CONSIDERATION
scale. The resulting reliability coefficients were .84 for
the LOCUS OF CONTROL scale, .90 for the STRUCTURE scale,
and .91 for the CONSIDERATION scale.
Also, factor analyses were performed on the LOCUS OF
CONTROL, STRUCTURE, and CONSIDERATION scores. In model
fitting and hypotheses testing efforts, promax rotated
factor scores for the three variables (and STRESS) were
used instead of individual item responses. The use of
factor scores simplified the structure and reduced computer
time and space requirements. Three ROLE STRESS factors,

100
five LOCUS OF CONTROL factors, two STRUCTURE factors, and
two CONSIDERATION factors were selected and rotated
(promax). Twelve factor scores were produced for each
subject. A covariance matrix of the sixteen ATTITUDES
responses, the four RUFI scores, and the twelve factor
scores was used as LISREL input.
Demographics and Other Potential Explanatory Variables
Each of the managers were asked to provide their sex,
age, highest level of education attained (education),
length of time in their current position (position), length
of time with the company (career) , operating department
(department), and "pre-merger" affiliation (faction).
There was an insufficient number of female subjects to
allow meaningful analysis of the demographic variable sex.
The influence of the other demographic variables (age,
education, position, and career) was assessed using an
expanded LISREL model. None of the demographic variables
were found to be significant. Appendix C contains a more
complete description of the expanded model and the
analysis.
Table 5.8 (following page) reports the results of
multivariate tests for differences in the means of the
research variables by department. Table 5.9 (page 102)
reports the results of similar tests for differences by

w
Table 5.8: Tests for Differences by Department
101
Test F-stat PR > F
Wilks' Criterion 1.12 2254
L = .52451467
Pillai's Trace 1.13 .2160
V = .57765131
Hotelling-Lawley Trace
Trace = .72447895
Roy's Maximum Root Criterion
Criterion = .31808725
1.11 2353
1.50 (upper bound)

102
Table 5.9: Tests for Differences by Facti on
Test F-stat PR > F
Wilks' Criterion .90 .6207
L = .83943998
Pillai's Trace .90 .6207
V = .16056002
Hotelling-Lawley Trace .90 .6207
Trace = .19127039
Roy's Maximum Root Criterion .90 .6207
Criterion = .19127039

103
faction ("pre-merger" affiliation). Neither department nor
faction was associated with significant differences. Thus,
none of the demographic or other variables were included as
LISREL input for hypothesis testing. Further, the lack of
significant differences in the responses by department
supports the contention of homogeneity in job design
throughout the population sampled.
Testing Hypotheses with LISREL
Tests of hypotheses with LISREL consist of comparing
the goodness of fit of one model to that of another. The
null hypothesis of no significant differences between the
overall fit of the two models is rejected when the change
in degrees of freedom is accompanied by a significant
change in the Chi-square statistic for the total model.
The two models must be subsets of a larger model, and must
differ by the inclusion (or exclusion) of the
relationship(s) being tested. The procedure outlined was
suggested by Bentler and Bonnet [1980] , and supported with
Monte Carlo evidence of the asymptotic independence of
sequential Chi-square difference tests by Steiger, Shapiro,
and Browne [1985]. In essence the tests examine whether
the addition (or deletion) of the hypothesized
relationship(s) significantly improves the fit of the model
to the data.

104
The LISREL model that served as a basis for testing
the research hypotheses was presented near the end of the
previous chapter (Figure 4.1, page 81). All models used in
testing the research hypotheses were "nested" in that
model, thus any two could be "compared" using the change in
the degrees of freedom and the change in the Chi-square
statistic. Previous discussions in this and the previous
chapters have explained how the data were obtained and
prepared for input. Selected LISREL output from the "null"
model (i.e., no explanatory variable influence) is
presented in Appendix D. Appendix E contains similar data
except that ATTITUDES (formal and informal) were modeled as
having causal influence on RUFI. Comparison of these two
models serves to illustrate hypothesis testing with LISREL
while testing the first research hypothesis—ATTITUDES are
related to RUFI.
The model examined in Appendix D (the null model) has
458 degrees of freedom and a Chi-square statistic of
985.32. The Appendix E model has 3 fewer degrees of
freedom and a Chi-square of 882.03. Since the change in
the Chi-square of 103.29 is larger than the critical
Chi-square value at a .05 level of significance and 3
degrees of freedom (7.8), the null hypothesis of no
difference between the two models was rejected. A
significant part of the variation in RUFI was explained by
variation in ATTITUDES.

105
Tests of Hypotheses
To test hypotheses 2 through 5, each of the
explanatory variables (other than ATTITUDES) were depicted
as having a direct influence on RUFI in addition to the
influence of ATTITUDES. LOCUS, STRUCTURE, CONSIDERATION,
and STRESS were each tested for direct influence on RUFI
individually and without the indirect influence of any of
the four on RUFI through ATTITUDES. The only difference
between the two models compared for each test was the
"freedom" of the parameter representing the direct
relationship between the explanatory variable being tested
and RUFI. In each case the "null" model for the tests of
direct effects was the Appendix E model. The results of
the tests of hypotheses 2 through 5 are presented in Table
5.10 (following page). With ATTITUDES in the model, none
of the direct effects of the remaining explanatory
variables of interest on RUFI were able to significantly
contribute to the fit of the model. Thus, null hypotheses
2 through 5 could not be rejected. The alternate
hypotheses of direct effects on RUFI were not supported so
were not reflected in subsequent models.
The same procedure was used to test hypotheses 6
through 9 except that tv70 parameters were involved in each
test. Since ATTITUDES were modeled as two endogenous
variables, two parameters differed from the Appendix E

106
Table 5.10: Tests of Direct Hypotheses
Chi-Model Square Diff. D.F
Base: 882.03 - 455 Includes ATTITUDES-RUFI
Base plus LOCUS-RUFI 880.85 1.18 454
Base plus STRESS-RUFI 880.70 1.33 454
Base plus STRUCTURE-RUFI 881.11 .92 454
Base plus CONSIDERATION-RUFI 880.94 1.09 454
* - significant at the .05 level
** - significant at the .01 level
*** - significant at the .001 level

107
model for each test. The results of the tests are
presented in Table 5.11 (following page). With the
relationships among ATTITUDES and RUFI recognized in the
model, and without the direct influences of LOCUS,
STRUCTURE, CONSIDERATION, and STRESS on RUFI, any one of
the four latter variables was able to contribute
significantly to the overall fit of the model by explaining
part of the variation in RUFI through ATTITUDES. Rejection
of null hypotheses 6 through 9 was supported, however,
additional testing was necessary to substantiate the
suggested relationships.
Sequential tests of contribution to the model fit
were performed to more rigorously test hypotheses 6, 8, and
9. The sequential testing procedure differed from what has
been described only in that the most significant single
contributor to the model was retained each time all
candidates were tested. In the initial testing of indirect
explanation of variation in RUFI through ATTITUDES
(hypotheses 6 through 9), the most significant improvement
was provided by the addition of the STRESS to ATTITUDES
link. Thus, the STRESS to ATTITUDES link was reflected in
the model for subsequent hypothesis-testing "rounds." The
associated null hypothesis (7) could not be rejected,
however, because the direction of the relationship was the
reverse of that hypothesized. Next, the influence of each

108
Table 5.11: Preliminary Tests of Indirect Hypotheses
Chi-Model Square Diff. D.F
Base: 882.03 - 455 Includes ATTITUDES-RUFI
Base plus LOCUS-ATTITUDES 855.23 26.80*** 453
Base plus STRESS-ATTITUDES 848.00 34.03*** 453
Base plus STRUCTURE-ATTITUDES 852.76 29.27*** 453
Base plus CONSIDERATION-ATTITUDES 857.84 24.19*** 453
* - significant at the .05 level
** - significant at the .01 level
*** - significant at the .001 level

109
of the remaining explanatory variables (LOCUS, STRUCTURE,
and CONSIDERATION) on RUFI through ATTITUDES was tested
individually. The results of the sequential tests of
hypotheses 6 through 9 are presented in Table 5.12
(following page). With the influence of STRESS and
ATTITUDES in the model, LOCUS, STRUCTURE, and CONSIDERATION
were not able to contribute significantly to the fit.
Thus, null hypotheses 6, 8, and 9 could not be rejected.
Stress as an Endogenous Variable: A Fitted Model
Recognizing that LOCUS, STRUCTURE, and CONSIDERATION
were potentially useful in explaining variation in STRESS
(thus RUFI), an additional model was tested in search of a
"best fit" LISREL model. STRESS, ATTITUDES, and RUFI were
modeled as endogenous, interrelated variables. Sequential
testing procedures were used to test for the contribution
of LOCUS, STRUCTURE, and CONSIDERATION through STRESS. All
three variables contributed significantly to the fit of the
model when considered on an individual basis. The largest
individual contribution was from LOCUS. Thus, LOCUS was
included in the model used to test STRUCTURE and
CONSIDERATION. Both STRUCTURE and CONSIDERATION were able
to contribute significantly to the model including LOCUS,
however CONSIDERATION was not able to improve the fit once
the more significant variable STRUCTURE was included.

110
Table 5.12: Sequential Tests of Indirect Hypotheses
Chi-Model square Diff. D.F
Base: 848.00 - 453 Includes ATTITUDES-RUFI, and STRESS-ATTITUDES.
Base plus LOCUS-ATTITUDES 844.90 3.10 451
Base plus STRUCTURE-ATTITUDES 846.02 1.98 451
Base plus CONSIDERATION-ATTITUDES 847.79 .21 451
* - significant at the .05 level
** - significant at the .01 level
*** - significant at the .001 level

Ill
Thus, the "best fit" model includes all of the explanatory
variables of interest except CONSIDERATION. Selected
LISREL output for the fitted model is in Appendix F. The
total effects (direct and indirect) of each of the
explanatory variables of interest (provided as LISREL
output) are presented in Table 5.13 (following page).
Figure 5.1 (page 113) illustrates the variables and
relationships significant to the fitted model. The
implications of these findings and the results of the tests
of hypotheses are discussed in the following chapter.

112
Table 5.13: Total Effects: The Fitted Model
ATTITUDES ATTITUDES LOCUS STRUCTURE STRESS (formal) (informal)
STRESS -1.007 -.225
ATT.(form.) .687 .154 -.682
ATT.(inf.) .441 .099 -.438 .434
RUFI -.219 -.049 .217 -.565 1.192

113
LOCUS OF CONTROL
.-1.007
-.682
222 STRESS
-.141
-.225
STRUCTURE
ATTITUDES (formal)
.434
.
ATTITUDES (informal)
^1.083
RUFI
1.192
Figure 5.1: The Fitted Model

CHAPTER VI
SUMMARY AND CONCLUSIONS
This chapter includes: 1) a summary of the empirical
results, 2) discussions of the implications of the
findings, 3) a discussion of the limitations of the study,
and 4) some suggestions for future research.
Summary of Findings
The first of two research objectives was to examine
the extent to which informal information was relied upon
relative to formal information in performance-related
decision making. The data indicate that informal
information is relied upon relatively more than formal
information in all four of the performance-related decision
situations studied: pay, promotion, termination, and
periodic appraisal. Mean differences in the relative use
of formal and informal information ranged from .29 for
appraisals to .65 for promotions (scale of -6 to +6).
These results are consistent with the findings of Clancy
and Collins [1979] that "a strong majority, 79 per cent, of
the respondents maintained informal accounting information
systems" [p. 25], and with the observations of Dirsmith and
114

115
Covaleski [1985] that "(a)11 individuals concurred that
informal communication networks were much in evidence in
large public accounting firms" [p. 154, emphasis on
original]. The results are inconsistent with the findings
of Clancy and Collins that "the managers evaluated the
formal accounting system somewhat more highly than the
informal accounting system" [p. 25, emphasis on original],
and the conclusions of Dirsmith and Covaleski that
"informal communications . . . play a limited role in
informing organizational members of the politics and power
within the organization" [p. 149]. Neither study, however,
focused on the use of the informal information in
performance-related decision making.
In this study, the research subjects perceived the
informal information relied upon as "some combination of
documentation, advice, and memory" (74%). Both the formal
and the informal information relied upon were perceived to
be accurate, complete, and sufficiently detailed. The
informal information was perceived to be easier to use and
understand, more confidential, more timely, and more
qualitative than the formal information. Clancy and
Collins [1979] reported higher mean scores for formal than
informal on eight of thirteen measured attitudes. However,
the results are in disagreement only slightly. In both the
current study and the Clancy and Collins study, both the
formal and informal attitudes responses were generally
116
favorable. The data are in disagreement only regarding the
timeliness of the information. Clancy and Collins report
higher mean scores for ease of use and ability to
understand for informal information, and did not address
confidentiality or qualitative/quantitative nature.
The second research objective was to study the
relationships among a number of a priori explanatory
variables and the dependent variable of interest—RUFI.
Nine hypotheses were stated in order to specify the
relationships among RUFI and the explanatory variables of
interest—ATTITUDES, ROLE STRESS, STRUCTURE, CONSIDERATION,
and LOCUS OF CONTROL. Eight of the null hypotheses could
not be rejected. The hypothesized relationship between
ATTITUDES and RUFI is supported by the data. Also
supported is a significant relationship between ROLE STRESS
and ATTITUDES, but the data indicate that high ROLE STRESS
is associated with relatively favorable ATTITUDES toward
the informal information rather than toward the formal
information as hypothesized. Additionally, LOCUS OF
CONTROL and STRUCTURE were found to be useful in explaining
variation in ROLE STRESS. These relationships are
illustrated in model form at the end of the previous
chapter (Figure 5.1, page 113), and in the context of the
theoretical research model on the following page (Figure
6.1) .

117
Locus of Control
Role Stress Attitudes
Structure
Performance
Information
I
-•RUFI
I
Performance
Evaluation
Figure 6.1: The Research Model in Context

118
Generally, favorable attitudes toward the informal
information lead to relatively greater reliance on the
informal information, whereas relatively favorable
attitudes toward the formal information lead to relatively
less reliance on the informal information. STRESS is
negatively related to attitudes toward both formal and
informal information, but more negatively related to
attitudes toward the formal information. Thus, in a
relative sense, high stress leads to relatively favorable
attitudes toward the informal information. Finally,
perceptions of STRESS (high) are negatively related to
LOCUS OF CONTROL (external) and STRUCTURE (high).
Internals perceive more stress, and structured behavior of
the superior reduces stress.
The explanatory value of six additional variables was
also assessed. MANOVA was used to test for significant
differences in the variables of interest attributable to
departmental affiliation or "pre-merger" affiliation
(faction). LISREL was used to assess the usefulness of
four demographic variables: age, level of education,
length of time in current position, and length of time with
the research entity. The research variables did not
significantly vary by department or by faction, and the
demographic variables were not able to significantly
improve the fit of the LISREL model.

119
Implications of the Use of Informal Information
The relatively greater use of informal information
than formal information in performance-related decision
making suggests a discrepancy between the formally agreed
upon rules of governance in the organization and the true
system of rewards. Implied is a propensity for contractual
disputes, particularly when the formal system is intended
to assure legal compliance. Also implied are dysfunctional
consequences to the organization which may result from
conflicting or inaccurate "messages" regarding the
individuals' roles in the organization. In the extreme,
total use of informal information results in an
organization in which the organizational goals (as
reflected in the formal system) have no bearing on the
behaviors of the organizational members. Total reliance on
informal information, however, is unlikely.
The use of both formal and informal information in
performance-related decision making is consistent with a
markets and hierarchies perspective (see Chapter II). In
fact, the paradigm suggests a need for informal information
in order to compensate for the inadequacies of the formal
information. This complimentary relationship between the
formal and informal information is supported by the results
of this study: the mean differences in the use of formal
versus informal information were small; and the subjects

120
perceived the formal and informal information to be
significantly different in several dimensions
(qualitative/quantitative nature, timeliness,
confidentiality, understandability, and ease of use). The
complimentary nature of the formal and informal information
is supported by Clancy and Collins [1979], who suggest, "a
major research hypothesis that is not found in existing
literature: an informal system supplements rather than
replaces a formal system" [p. 29].
Implications of the Relationships Among the Variables
The strong relationships among ATTITUDES and RUFI is
not surprising. However, the ATTITUDES-RUFI "link" is so
strong that the additional explanatory value of any one of
ROLE STRESS, LOCUS OF CONTROL, STRUCTURE, and CONSIDERATION
directly on RUFI is insignificant. Strongly suggested is
the importance of attitudes in explaining behavior in
organizations. Personality characteristics, the influences
of significant others, and even role related perceptions
seem to be useful in understanding behavior only through
more specific attitudes.
The importance of ROLE STRESS in explaining variation
in RUFI through ATTITUDES supports the role perspective
adopted in this study. Also supported is the notion that
both personality variables (LOCUS OF CONTROL) and the

121
influence of significant "others" (LEADERSHIP STYLE) effect
role-related perceptions. Implied are a number of
"connections" or similarities between RUFI and a number of
previously studied organizational phenomena, such as
budgetary attitudes [Collins, Anderson, and White, 1981;
Collins, Seller, and Clancy, 1984], satisfaction [Sapp and
Seller, 1980], and budgetary gamesmanship [Collins, Munter,
and Finn, 1983].
Policy Implications
Perhaps most important to the designers and users of
information systems in organizations is the implication
that it may not be desirable to force managers to use
formal systems exclusively. Further, the nature of
business and the situational variability in decision-making
in organizations place practical limits on the ability of
an information system to remain current and to be flexible
enough to meet the managers' needs. Thus, the sole use of
formal information in decision making is likely to have
both short-term and long-term dysfunctional consequences,
and the forced use of inadequate information is likely to
compound the problem by negatively effecting attitudes
toward that information.
The importance of attitudes toward the information in
explaining variation in the relative use of formal and
informal information suggests that attempts to influence

122
managers' use of the information are best spent altering
the managers' attitudes toward the information. Managers'
attitudes can be influenced in a variety of ways.
Educational efforts and the opinions of significant others
may influence an individual's attitudes. Attitudes toward
information may also be influenced by changes in certain
characteristics of the information. This study found that
the formal information is significantly less confidential,
less timely, more quantitative, and more difficult to use
and understand than the informal information. Thus,
improvement in the formal information in these dimensions
is likely to improve managers' attitudes toward the formal
information and the relative use thereof.
The data suggest that attitudes are significantly
influenced by perceptions of ROLE STRESS and that ROLE
STRESS is significantly influenced by LOCUS OF CONTROL and
STRUCTURE. Contrary to expectations, high stress is
associated with relatively favorable attitudes toward
informal information. Implied is the ability of managers
and systems designers to encourage the use of formal
systems by reducing stress (conflict and ambiguity).
Certain leadership activities are apparently useful in
reducing stress, but the effort is complicated by the
influence of personality variables (such as LOCUS OF
CONTROL). Generally, the importance of
individually-oriented variables implies the use of an

123
individually-oriented information system and an
individually-oriented managerial approach. Strongly
suggested is the need to recognize the demands of the
organizational positions and the role-related perceptions
of the individuals occupying those positions.
Limitations of the Study
Even though a two-stage research design was applied in
order to reduce validity concerns, a number of limitations
remain. First, the initial interviews, although rich in
content and strong in internal validity, may not be totally
successful in avoiding all of the substantive and semantic
weaknesses of the questionnaire. The instrument is biased
toward the perceptions of the interview and pretest
subjects. Also, the interview approach to questionnaire
development and testing does not preclude the typical
questionnaire-related issues of self reported data, sample
selection, and non-response bias. Furthermore, interviews
are accompanied by additional weaknesses. Classification
and summarization are often difficult, and data are subject
to such distortions as result from the "halo" effect.
Second, as a field study, the study is strong in
"realism, significance, strength of variables, theory
orientation, and heuristic quality" [Kerlinger, 1973, p.
406], but weak due to the ex post facto nature of the
research, lack of precision in measurement, and potential

124
practical issues, such as feasibility, cost, sampling, and
time [Kerlinger, p. 407]. Since the variables are measured
at one point in time and none of the variables are
manipulated, implications of causality are difficult to
support. The data support only correlational association,
even though previous research, logic, and the statistical
technique employed may suggest directionality.
Finally, generalizability of the conclusions is not
supportable beyond the population sampled. Similar
findings in the interviews and from the questionnaire data
support external validity, but additional empirical
research efforts are important in validating the research
and extending the results of the study.
Suggestions for Future Research
Perhaps most needed are contributions toward the
measurement of the research constructs, RUFI and ATTITUDES.
More specifically, research using "harder" measures of the
use of informal information in decision situations is
needed. Controlled experiments and archival studies may be
useful in understanding the sources of information used by
decision makers in organizations. Additional dimensions
and alternative indicators of individuals' attitudes toward
the information used may also be beneficial. The
apparently conflicting findings of Clancy and Collins
[1979] with those of the current study regarding attitudes
125
suggest that different dimensions may be more important
than others in different decision situations or in
different organizations.
Also suggested are studies of RUFI and ATTITUDES in
other entities, other industries, and across organizational
and industry boundaries. A number of organizational
variables, industry characteristics, and environmental
influences have the potential of explaining
interorganizational variation in ATTITUDES and RUFI.
On a more individual level, RUFI and ATTITUDES may be
influenced by the nature of the position occupied by the
individual being evaluated or by the nature of the position
occupied by the individual making the performance-related
decisions. Certain organizational activities are more
easily monitored than others. Accordingly, different types
of information may be necessary in evaluating the
performance of individuals with differing organizational
responsibilities. Similarly, organizational
responsibilities vary in the extent to which an individual
is required to perform as an individual versus perform as a
group member. Thus, studies of the relationships among
RUFI and ATTITUDES and characteristics of the positions
occupied by the individuals are suggested.
The importance of STRESS in explaining variation in
RUFI contributes to the large volume of research including
role stress as an explanatory variable, and the

126
significance of LOCUS OF CONTROL and STRUCTURE in
explaining variation in STRESS contributes to the research
including role stress as a dependent variable. Suggested
is the continued use of the role perspective for research
in organizations. Additional research of the causes and
effects of role stress would contribute toward the
understanding of behavior in organizations. More specific
to this study, the finding that stress leads to relatively
favorable attitudes toward (and thus relatively more use
of) informal than formal information in performance-related
decision making suggests the need for supporting research.
Finally, the study demonstrates the usefulness of
covariance structural modeling (LISREL) in studying complex
organizational phenomena. The application of the
methodology in similar situations involving latent
constructs and numerous relationships among the constructs
of interest is suggested.

REFERENCES
Argyris, C , The Impacts of Budgets on People (Controllership Foundation, 1952).
, "Human Problems with Budgets," Harvard Business Review, Vol. 31, No. 1 (January-February 1953), pp. 97-110.
Armstrong, J. S., and T. S. Overton. "Estimating Nonresponse Bias in Mail Surveys," Journal of Marketing Research, Vol. 14 (1977), pp. 396-402.
Arrow, K. J., Social Choice and Individual Values, second ed., (Yale Univ. Press, 1963).
, "Control in Large Organizations," Management Science, Vol. 10, No. 3 (April 1964), pp. 397-408.
, The Limits of Organization (Norton & Co., 1974) .
Bagozzi, Causal Models in Marketing (Wiley, 1980). |
Bales, R. F., and P. E. Slater, "Role Differentiation in Small Decision Making Groups," in T. Parsons and R. F. Bales, eds.. Family, Localization, and Interation Processes (New York: Free Press, 1945).
Banbury, J., and J. E. Nahapiet, "Towards a Framework for the Study of the Antecedents and Consequences of Information Systems in Organizations," Accounting, Organizations and Society, Vol. 4, No. 3 (1979), pp. 163-177.
Becker, L. J., "Joint Effect of Feedback and Goal Setting on Performance: A Field Study of Residential Energy Conservation," Journal of Applied Psychology, Vol. 63 (1978), pp. 428-433.
Becker, S. W. , "Discussion of The Effect of Frequency of Feedback on Attitudes and Performance," Journal of Accounting Research (Supplement 1967), pp. 225-228.
127
128
Bentler, P. M., and D. G. Bonnett, "Significance Tests and Goodness of Fit in the Analysis of Covariance Structures," Psychological Bulletin, Vol. 88 (November 1980), pp. 588-606.
Berlinger, J. S., "A Problem in Soviet Business Management," Administrative Science Quarterly, Vol. 1, No. 1 (June 1956), pp. 86-101.
Blake, R., and J. Mouton, The Managerial Grid (Gulf Publishing, 1964).
Blau, P. M., The Dynamics of Bureaucracy (Chicago, 1955).
Brief, A. P., and R. J. Aldag, "Correlates of Role Indicies," Journal of Applied Psychology, Vol. 61 (1976), pp. 468-472.
Brownell, P., Participation in Budgeting, Locus of Control and Organizational Effectiveness (University Microfilms International: Ann Arbor, 1979).
"Participation in Budgeting, Locus of Control and Organizational Effectiveness," The Accounting Review, Vol. LVI, No. 4 (October 1981), pp. 844-860.
, "The Role of Accounting Data in Performance Evaluation, Budgetary Participation and Organizational Effectiveness," Journal of Accounting Research, Vol. 20, No. 1 (Spring 1982a), pp. 12-27.
, "A Field Study Examination of Budgetary Participation and Locus of Control," The Accounting Review (October 1982b), pp. 766-777.
, "Leadership Style, Budgetary Participation and Managerial Behavior," Accounting, Organizations and Society (1983), pp. 307-321.
Burt, R. S., "Confirmatory Factor-Analytic Structures and the Theory Construction Process," Sociological Methods and Research, Vol. 2, No. 2 (November 1973), pp. 131-190.
Chemers, M. M., "Leadership Theory and Research: A Systems-Process Integration," in P. B. Paulus, ed., Basic Group Processes (Springer-Verlag, 1983), pp. 9-39.
7

129
Clancy, D. K., and F. Collins, "Informal Information: An Exploratory Study," Proceedings of Southwest Regional Meeting (American Accounting Association, 1977), pp. 158-169.
and F. Collins, "Informal Accounting Information Systems: Some Tentative Findings," Accounting, Organizations and Society, Vol. 4, No. 1/2 (1979), pp. 21-30.
Collins, B. E., "Four Components of the Rotter Internal-External Scale," Journal of Personality and Social Psychology, Vol. 29, No. 3 (March 1974), pp. 381-391.
Collins, F., "The Interaction of Budget Characteristics and Personality Variables With Budgetary Response Attitudes," The Accounting Review, Vol. LIII, No. 2 (April 1978), pp. 324-335.
, "Managerial Accounting Sytems and Organizational Control: A Role Perspective," Accounting, Organizations and Society, Vol. 7, No. 2 (1982), pp. 107-122.
, L. K. Anderson, and G. E. White, "Identifying the Relationship Between Leadership Style, Role Stress and Budgetary Attitude," Proceedings of Southwest Regional Meeting (American Accounting Association, 1984) .
, and D. K. Clancy, "Management Accounting as a Role Process in Organizational Control: A Research Perspective," Proceedings of Southwest Regional Meeting (American Accounting Association, 1980).
, and G. H. Johnson, "Mapping the Garbage Can: In Search of Hypotheses," Proceedings of the Southwest Area Conference (American Institute of Decision Sciences, 1986), pp. 155-157.
, and P. Munter, "Exploring the Garbage Can: A Study of Information Flows," unpublished manuscript (1986).
, P. Munter, and D. Finn, "Gameplay in Budgeting: A Field Study," Proceedings of Southwest Regional Meeting (American Accounting Association, 1983) .
130
and R. E. Seller, "Need Satisfaction and Budget-Related Stress as Predictors of Budget Attitudes," Proceedings of the National Convention (American Accounting Association, 1981).
R. E. Seller, and D. K. Clancy, "Budgetary Attitudes: The Effects of Role Senders, Stress and Performance Evaluation," Accounting and Business Research, Vol. 14, No. 54 (Spring 1984), pp. 163-168.
Cook, D. M., "The Effect of Frequency of Feedback on Attitudes and Performance," Journal of Accounting Research (Supplement 1967), pp. 213-224.
Crowne, D. P., and S. Liverant, "Conformity Under Varying Conditions of Personal Commitment, Journal of Abnormal and Social Psychology, Vol. 66, No. 6 (June 1963), pp. 547-555.
DeCoster, D. T., and J. P. Fertakis, "Budget-Induced Pressure and Its Relationship to Supervisory Behavior," Journal of Accounting Research, Vol. 6, No. 2 (Autumn 1968), pp. 237-246.
Demski, J. S., and G. A. Feltham, "Economic Incentives in Budgetary Control Systems," The Accounting Review, Vol. LIII, No. 2 (April 1978), pp. 336-359.
Dirsmith, M. W., and M. A. Covaleski, "Informal Communications, Nonformal Communications and Mentoring in Public Accounting Firms," Accounting, Organizations and Society, Vol. 10, No. 2 (1985), pp. 149-169.
Eichel, E. and H. E. Bender, Performance Appraisal: A Study of Current Techniques (American Management Association, 1984) .
Erez, M., "Feedback: A Necessary Condition for the Goal-Setting-Performance Relationship," Journal of Applied Psychology, Vol. 62 (1977), pp. 624-627.
Ford, J. D., and J. W. Slocum, "Size, Technology, Environment and the Structure of Organizations, Academy of Management Review, Vol. 2, No. 4 (October 1977), pp. 561-574.
Goodstadt, B. E., and L. A. Hjelle, "Power to the Powerless: Locus of Control and the Use of Power, Journal of Personality and Social Psychology (August 1973), pp. 190-196.

131
Granick, D. , Management of the Industrial Firm in the U.S.S.R. (Columbia Univ. Press, 1954).
Greene, C. N., "Relationships Among Role Accuracy, Compliance, Performance Evaluation and Satisfaction Within Managerial Dyads," Academy of Management Journal, Vol. 15 (1972), pp. 205-515.
Halpin, A. W., and B. J. Winer, "A Factorial Study of the Leader Behavior Descriptions," in R. M. Stogdill and A. E. Coons, eds.. Leader Behavior: Its Description and Measurement (Ohio State: Bureau of Business Research, 1957) .
Harvey, J. H., R. D. Barnes, D. L. Sperry, and B. Harris, "Perceived Choice as a Function of Internal-External Locus of Control," Journal of Personality, Vol. 42, No. 3 (September 1974), pp. 437-452.
Haas, J. E., Role Conception and Group Consensus (Columbus, Ohio: Bureau of Business Research, 1964).
Hemphill, J. K., "Relations Between the Size of the Group and the Behavior of 'Superior' Leaders," Journal of Social Psychology, Vol. 32 (1950), pp. 11-22.
, and A. E. Coons, "Development of the Leader Behavior Description Questionnaire," in R. M. Stogdill and A. E. Coons, eds.. Leader Behavior: Its Description and Measurement (Ohio State: Bureau of Business Research, 1957) .
Heneman, H. G., Ill, D. P. Schwab, J. A. Fossum, and L. D. Dyer, Personnel/Human Resource Management (Irwin, 1980) .
Hopwood, A. G., "An Empirical Study of the Role of Accounting Data in Performance Evaluation," Journal of Accounting Research (Supplement 1972), pp. 156-182.
, "Leadership Climate and the Use of Accounting Data in Performance Evaluation," The Accounting Review, Vol. XLIX, No. 3 (July 1974), pp. 485-495.
Horngren, C. T., Cost Accounting, fifth ed., (Prentice-Hall, 1982) .
Horwitz, B., Accounting Controls and the Soviet Economic Reforms of 1966 (American Accounting Association, 1970) .

132
Hosking, D. M., "A Critical Evaluation of Fiedler's Contingency Hypothesis," Progress in Applied Social Psychology,.. Vol. 1 (Wiley, 1981) , pp. 103-154.
Howell, R., and J. Wilcox, "A Psychometric Analysis of Role Conflict and Ambiguity," unpublished manuscript
Howell, W. C , Essentials of Industrial and Organizational Psychology (Dorsev Press. 1976).
Hunt, J. G., "Organizational Leadership: The Contingency Paradigm and Its Challenges," Leadership: Multidisciplinary Perspectives (Prentice-Hall, 1984), pp. 114-138.
Ilgen, D. R., C. D. Fisher, and M. S. Taylor, "Consequences of Individual Feedback on Behavior in Organizations," Journal of Applied Psychology, Vol. 64 (1979), pp. 349-371.
Ivancevich, J. M., and J. H. Donnelly, Jr., "Relation of Organizational Structure to Job Satisfaction, Anxiety-Stress, and Performance," Administrative Science Quarterly, Vol. 20 (June 1975), pp. 272-280.
Jensen, M. C , and W. H. Meckling, "Theory of the Firm: Managerial Behavior, Agency Costs and Ownership Structure," Journal of Financial Economics, Vol. 3, No. 4 (October 1976), pp. 305-360.
Jensen, R. E., "Discussion of The Effect of Frequency of Feedback on Attitudes and Performance," Journal of Accounting Research (Supplement 1967), pp. 229-234.
Jiambalvo, J., D. J. H. Watson, and J. V. Baumler, "An Examination of Performance Evaluation Decisions in CPA Firm Subunits," Accounting, Organizations and Society, Vol. 8, No. 1 (1983), pp. 13-29.
Joreskog, K. G., "A General Method for Estimating a Linear Structural Equation System," in A. S. Goldberger and 0. D. Duncan, eds., Scructural Equations Models in the Social Sciences (New York: Seminar Press, 1973), pp. 85-112.
, and D. Sorbom, LISREL VI User's Guide (Uppsala, Sweden: University of Uppsala, 1985).
133
Kahn, R. L., "An Analysis of Supervisory Practices and Compmonents of Morale," in H. Guetzkow, ed.. Groups, Leadership, and Men (Pittsburg: Carnegie Press, 1951).
Kahn, R. L., D. M. Wolfe, R. P. Quinn, J. D. Snoek, and R. A. Rosenthal, Organizational Stress: Studies in Role Conflict and Ambiguity (Wiley, 1964) .
Kane, J. S., and E. E. Lawler, III, "Performance Appraisal Effectiveness: Its Assessment and Determinants," Research in Organizational Behavior, Vol. 1 (JAI Press, 1979), pp. 425-478.
Katz, D., and R. L. Kahn, The Social Psychology of Organizations, (Wiley, 1966).
Katz, D., and R. L. Kahn, The Social Psychology of Organizations, second ed., (Wiley, 1978).
Kerlinger, F. N., Foundations of Behavioral Research, second ed., (Holt, Rinehart and Winston, 1973).
Korman, A. "'Consideration,' 'Initiating Structure,' and Organizational Criteria - A Review," Personnel Psychology, Vol. 19, No. 4 (Winter 1966), pp. 349-362.
Landy, F. J., and J. L. Farr, The Measurement of Work Performance (Academic Press, 1983).
Lawler, E. E., Pay and Organizational Development (Addison-Wesley, 1981).
Lazer, R. I., and W. S. Wikstrom, Appraising Managerial Performance: Current Practices and Future Directions (The Conference Board, 1977).
Lefcourt, H. M., "Internal Versus External Control of Reinforcement: A Review," Psychological Bulletin (April 1966), pp. 206-220.
, "Recent Developments in the Study of Locus of Control," in B. A. Maher, ed., Progress in Experimental Personality Research, Vol. 6 (New York: Academic Press, 1972).
Lewin, K., T. Dembo, L. Festinger, and P. S. Sears, "Level of Aspiration," in J. McV. Hunt, ed., Personality and the Behavior Disorders (Ronald Press, 1944).
134
Licata, M. P., R. H. Strawser, and R. B. Welker, "A Note on Participation in Budgeting and Locus of Control," The Accounting Review, Vol. LXI, No. 1 (January 1986), pp. 112-117.
Locke, E. A., "Toward a Theory of Task Motivation and Incentives," Organizational Behavior and Human Performance, Vol. 3 (1968), pp. 157-189.
, K. N. Shaw, L. M. Sari, and G. P. Latham, "Goal Setting and Task Performance: 1969 - 1980," Psychological Bulletin, Vol. 90, No. 1 (July 1981), pp. 125-152.
Lyons, T. F., "Role Clarity, Need for Clarity, Satisfaction, Tension, and Withdrawal," Organizational Behavior and Human Performance, Vol. 6 (19 76), pp. 99-110.
McGill, G., and G. H. Johnson, "An Abbreviated Measureftient Instrument for Locus of Control," unpublished manuscript (1986).
McGrath, J. E., "Stress and Behavior in Organizations," in Dunnette, ed.. Handbook of Industrial and Organizational Psychology (Rand McNally, 1976), pp. 1351-1395.
Marshall, D. R. , Successful Techniques for Solving Employee Compensation Problems (Wiley, 1978).
Mauriel, J. J., and R. N. Anthony, "Misevaluation of Investment Center Performance," Harvard Business Review, Vol. 44, No. 2 (March-April 1966), pp. 98-105.
Otley, D. T., "Budget Use and Managerial Performance," Journal of Accounting Research, Vol. 16, No. 1 (Spring 1978), pp. 122-149.
Pace, C. R., "Factors Influencing Questionnaire Returns 'from Former University Students," Journal of Applied Psychology, Vol. 23 (1939), pp. 388-397.
Pavett, C. M., "Evaluation of the Impact of Feedback on Performance and Motivation," Human Relations, Vol. 36, No. 7 (July 1983), pp. 641-654.
Rappaport, A., "Executive Incentives vs. Corporate Growth," ^^ Harvard Business Review, Vol. 56, No. 4 (July-August
1978), pp. 81-88.

135
Reece, J. S., and W. R. Cool, "Measuring Investment Center Performance," Harvard Business Review, Vol. 56, No. 3 (May-June 1978), pp. 28-30+.
Revsine, L., "Change in Budget Pressure and Its Impact on Supervisor Behavior," Journal of Accounting Research (Autumn 1970), pp. 290-292.
Ridgway, V. F., "Dysfunctional Consequences of Performance Measurements," Administrative Science Quarterly, Vol. 1, No. 2 (September 1956), pp. 240-247.
Rizzo, J. R., R. J. House, and S. I. Lirtzman, "Role Conflict and Ambiguity in Complex Organizations," Administrative Science Quarterly, Vol. 15, No. 2 (June 1970), pp. 150-163.
Robinson, J. P., and P. R. Shaver, Measures of Social Psychological Attitudes (Institute for Social Research, 1973) .
Rosen, L. S., and R. E. Schneck, "Some Behavioral Consequences of Accounting Measurement Systems," Cost and Management, Vol. 41, No. 9 (October 1967), pp. 6-16.
Rotter, J. B., "Generalized Expectancies for Internal Versus External Control of Reinforcement," Psychological Monographs: General and Applied (Whole No. 609, 1966), pp. 1-28.
Sapp, R. W., and R. E. Seller, "Accounting for Performance: Stressful—But Satisfying," Management Accounting, Vol. LXII, No. 2 (August 1980), pp. 29-35.
Sarbin, T. R., and V. L. Allen, "Role Theory," in G. Lindzey and E. Aronson, eds.. The Handbook of Social Psychology, Vol. 1 (Reading, Mass.: Addison-Wesley, 1968) .
Schuler, R. S., R. J. Aldag, and A. P. Brief, ''Role Conflict and Ambiguity: A Scale Analysis, Organizational Behavior and Human Performance (1977), pp. 111-128.
Simon, H. A., H. Guetzkow, G. Kozmetsky, and G. Tyndall, ror. + .in^^Mon vs. Decentralization in Organizing the Control ler-'X'Department (Controllership Foundation ,
1954) .
136
Sorensen, J. E., and T. L. Sorensen, "The Conflict of Professionals in Bureaucratic Organizations," Administrative Science Quarterlv (March 1974), pp. 98-106. ' '
Spector, P. E., "Behavior in Organizations as a Function of Employee's Locus of Control," Psychological Bulletin, Vol. 91, No. 3 (May 1982), pp. 482-497. ~
Steiger, J. H., A. Shapiro, and M. W. Browne, "On The Multivariate Asymptotic Distribution of Sequential Chi-Square Statistics," Psychometrika, Vol. 50, No. 3 (1985), pp. 253-264.
Stogdill, R. M., Manual for the Leader Behavior Description Questionnaire - Form XII (The Ohio State University, 1963) .
Sujan, H., "Smarter Versus Harder: An Exploratory Attributional Analysis of Salespeople's Motivation," Journal of Marketing Research, Vol. XXIII (February 1986), pp. 41-49.
Tiessen, P., and J. H. Waterhouse, "Towards a Descriptive Theory of Management Accounting," Accounting, Organizations and Society, Vol. 8, No. 2/3 (1983), pp. 251-267.
Van Sell, M., A. P. Brief, and R. S. Schuler, "Role Conflict and Role Ambiguity: Integration of the Literature and Directions for Future Research," Human Relations, Vol. 34, No. 1 (January 1981), pp. 43-71.
Waterhouse, J. H., and P. Tiessen, "A Contingency Framework for Management Accounting Systems Research," Accounting, Organizations and Society, Vol. 3, No. 1 (1978), pp. 65-76.
Williamson, 0. E., The Economics of Discretionary Behavior: Managerial Objectives in a Theory of the Firm (Prentice Hall, 1964).
, Corporate Control and Business Behavior (Prentice-Hall, 1971).
, "Markets and Hierarchies: Some Elementary Considerations," American Economic Review, Vol. 63, No. 2 (May 1973), pp. 316-325.

137
, Markets and Hierarchies: Analysis and Antitrust Implications (Free Press, 1975).
Zajonc, R. B., "Compresence," in P. B. Paulus, ed.. Psychology of Group Influence (Erlbaum, 1980), pp. 35-60.
Zedeck, S., and D. Kafry, "Capturing Rater Policies for Processing Evaluation Data," Organizational Behavior and Human Performance (April 1977), pp. 269-294.

APPENDIX A
INTERVIEW SCHEDULE
138

139
1. When do you evaluate performance?
2. What influences performance evaluation?
3. What information does the company suggest you
should use?
4. What kind of information do you get from the company?
5. Describe the other information you use.
6. What does "formal" information (system) mean to you?
7. What is wrong with the formal information it produces?
8. What do you like/dislike about the formal information?
9. What do you like/dislike about the other information?

APPENDIX B
QUESTIONNAIRE
140
141
PART ONE: DEMOGRAPHICS
Instructions: Please circle the correct response for each of the following general questions about yourself.
1. Sex: MALE FEMALE
2. Age: under 21 21-25 26-30 31-35 36-40 41-45 46-50 51-55 56-60 over 60
3. Highest level of your education: GRAMMAR SCHOOL SOME HIGH SCHOOL HIGH SCHOOL GRAD. (or GED) SOME COLLEGE COLLEGE GRAD. GRADUATE DEGREE
4. Years in current position: 1 or less 2 3 4 5 6 7 8 9 10 or more
5. Years with the company: 1 or less 2-5 6-10 11-15 16-20 21-25 26 or more
6. Faction: (1 or 2)
7. Department: (1, 2, 3, or 4)

142
PART TWO: ATTITUDES AND RUFI
Instructions: Below you will be asked a number of questions about the information you use in making performance related decisions in your company. Please answer each question twice. The first response (Section A) refers to "official" company information (anything produced, required, or suggested by company policy or procedure). The second response (Section B) refers to any other information used, such as a "personally-maintained" file or system, memory, or the advice of others. First, please indicate which of the following best describes the "other" information you rely on:
A. An organized, documented set of records, memos, or other data.
B. A loose collection of documentation.
C. Some combination of documentation, advice, and memory.
D. Unwritten advice and/or memory.
E. Other (please specify):
1. How accurate is the information?
2. To what extent does the information "cover" vital items?
3. How easy is it for you to use the data?
4. To what extent is the information detailed?
5. How would you describe your understanding of the information?
6. How confidential is the information
7. How timely is the information?
8. To what extent is the data numbers vs. words?

143
9. To what extent does the information influence your decisions (or suggestions) regarding merit pay adjustments of subordinates?
10. To what extent does the information influence your decisions (or suggestions) regarding promotions of subordinates?
11. To what extent does the information influence your decisions (or suggestions) to terminate the employment of subordinates?
12. To what extent does the information influence the periodic performance evaluations you prepare?

144
PART THREE: STRESS AND LOCUS
Instructions: Please indicate how you feel about each of the following statements by circling the best response from 1 (strongly agree) to 7 (strongly disagree).
1. I receive an assignment without adequate resources and materials to execute it.
2. I have to do things that should be done differently, i^
3. I know what my responsibilities are.
4. I know that I have divided my time properly.
5. I do things that are apt to be accepted by \ one person and not accepted by others. ' ^
6. I know exactly what is expected of me.
7. I receive an assignment without the manpower to complete it.
8. I receive incompatible requests from two or more people.
9. There are clear, planned goals and objectives for my ^ job.
10. I work with two or more groups that operate quite differently.
11. I have to buck a rule or policy in order to carry out an assignment.
12. I feel certain about how much authority I have
13. I work on unnecessary things.
14. Explanation is clear of what has to be done, v /
15. It is impossible for me to believe that chance or luck plays an important role in my life.
16. Sometimes I feel that I don't have enough control over the direction my life is taking.
17. Many times I feel that I have little influence over the things that happen to me.
18. There really is no such thing as "luck."
145
19. Becoming a success is a matter of hard work; luck has little or nothing to do with it.
20. Many of the unhappy things in people's lives are partly due to bad luck.
21. Most people don't realize the extent to which their lives are controlled by accidental happenings.
22. There is a direct connection between how hard I work and the rewards I get.
23. People's misfortunes result from the mistakes they make.
24. The idea that bosses are unfair to workers is nonsense.
25. It is not always wise to plan too far ahead because many things turn out to be a matter of good or bad fortune any how.
26. In my case getting what I want has little or nothing to do with luck.
27. Who gets to be the boss often depends on who was lucky enough to be in the right place first.
28. Many times we might as well decide what to do by flipping a coin.
29. Getting people to do the right thing depends upon ability; luck has little or nothing to do with it.

146
PART FOUR: LEADER
Instructions: Circle the letter that best indicates how often your immediate superior (always to never):
1. Treats all group members as his/her equals
2. Makes his/her attitudes clear to the group
3. Gives advance notice of changes
4. Tries out his/her ideas in the group
5. Is friendly and approachable
6. Assigns group members to particular tasks
7. Does little things to make it pleasant to be a member of the group
8. Encourages the use of uniform procedures
9. Makes sure that his/her part in the group is understood by the group members
10. Maintains definite standards of performance
11. Decides what shall be done and how it shall be done
12. Keeps to himself (or herself)
13. Is willing to make changes
14. Acts without consulting the group
15. Refuses to explain his/her actions
16. Asks that group members follow standard rules and regulations
17. Puts suggestions made by the group into operation
18. Schedules the work to be done
19. Looks out for the personal welfare of group members
20. Lets group members know what is expected of them
APPENDIX C
ANALYSIS OF DEMOGRAPHIC VARIABLES
147

148
LISREL was used to test for the significance of the
demographic variables in explaining variation in the
research variables of interest. Selected LISREL output for
the "null" model used in testing the demographics is
presented on the following page. The particular model used
for testing the demographics portrayed all of the research
variables of interest as endogenous variables and all of
the demographic variables as exogenous variables. The Beta
matrix was left free to allow the research variables of
interest to correlate. The Gamma matrix was the focal
point for testing the significance of the demographic
variables. By freeing certain elements of the Gamma
matrix, the demographic variables were allowed to "load" on
the research variables of interest independently and in a
variety of combinations. Also, the demographics were
allowed to "load" on individual research variables as well
as on groups of research variables. None of the models
allowing the influence of any of the demographic variables
on any or all of the research variables were significant
improvements over the null model presented. Thus, the
demographic variables did not contribute toward explaining
variation in the research variables. Accordingly, none of
the LISREL models used in testing the research hypotheses
included the demographic variables.

149
L S C S A-F A - I R
LISREL ESTIMATES (MAXIMUM LIKELIHOOD)
CONSID BETA
LOCUS STRUCT STRESS ATT-FORM ATT-INFM RUFI
0 1 0
-1 -3 0 10
0 094 250 088 539 225 644
0 0 0 •0 •0 0 2
0 0 726 242 408 073 263
GAMMA AGE
LOCUS STRUCT CONSID STRESS ATT-FORM ATT-INFM RUFI
PHI AGE
AGE EDCTN POSITION CAREER
0 0 0 0
•0 •0 •0
0 .0 0 .0 0 .0 0 .0 0 .0 0 .0 0 .0
2 . 9 1 0 • 0 . 4 0 6 1 . 7 7 5 1 . 8 7 3
0 0 0 058 0 8 3 0 6 5 477
EDCTN
0 0 0 0 3 0 9
0 0 0 0 745 064 589
0 0 0 0 0 0
- 0
0 0 0 0 0 445 875
0 .0 0 .0 0 .0 0 .0 0 .0 0 .0 0 .0
EDCTN
0.0 0 .0 0 .0 0 .0 0 .0 0 .0 0 .0
POSITION
0 . 8 9 6 • 0 . 5 2 7 • 0 . 5 3 7
7 . 7 2 0 1 . 6 3 1
0 . 0 0 . 0 0 . 0 0 . 0 0 . 0 0 . 0 1 . 1 6 3
POSITION CAREER
0.0 0.0 0.0 0.0 0.0 0.0 0.0
CAREER
2.484
MEASURES OF GOODNESS OF FIT FOR THE WHOLE MODEL
CHI-SQUARE WITH 571 DEGREES OF FREEDOM IS 999.71 (PROB. LEVEL = 0.000)
GOODNESS OF FIT INDEX IS 0.791 ADJUSTED GOODNESS OF FIT INDEX IS 0.756 ROOT MEAN SQUARE RESIDUAL IS 0.141
0.0 0.0 0.0 0.0 0.0 0.0 0.0

APPENDIX D
THE NULL MODEL
150

151
LISREL ESTIMATES (MAXIMUM LIKELIHOOD)
AFl AF2 AF3 AF4 AF5 AF6 AF7 AF8 All AI2 AI3 AI4 AI5 AI6 AI7 AI8 RUFIl RUFI2 RUFI3 RUFI4
LAMBDA Y ATT-FORM
1 1 1 0 1 0 1 0 0 0, 0, 0, 0, 0, 0, 0. 0. 0. 0. 0.
,000 229 279 864 019 336 107 421 0 0 0 0 0 0 0 0 0 0 0 0
ATT-INFM RUFI
0 0 0 0 0, 0, 0, 0, 1. 0. 1. 1. 1. 0. 1. 0. 0. 0. 0. 0.
.0 ,0 ,0 ,0 0 0 0 0 000 969 306 006 023 544 199 467 0 0 0 0
0 . 0 0 . 0 0 . 0 0 . 0 0 . 0 0 . 0 0 . 0 0 . 0 0 . 0 0 . 0 0 . 0 0 . 0 0 . 0 0 . 0 0 . 0 0 . 0 1 .000 0 . 8 3 7 0 . 8 3 2 0 . 7 2 5
LAMBDA X LOCUS STRUCT CONSID STRESS
LOCI LOC 2 LOC 3 LOC 4 LOC 5 STRUCTl STRUCT2 CONSIDl C0NSID2 STRESSl STRESS2 STRESS3
1 0 1 1 1 0 0 0 0 0 0 0
000 898 249 168 229 0 0 0 0 0 0 0
0.0 0.0 0.0 0.0 0.0 1.000 0.550 0.0 0.0 0.0 0.0 0.0
0.0 0.0 0.0 0.0 0.0 0.0 0.0 1.000 0.749 0.0 0.0 0.0
0 0 0 0 0 0 0 0 0 1 0 0
0 0 0 0 0 0 0 0 0 000 717 963

152
GAMMA LOCUS
ATT-FORM ATT-INFM RUFI
0.0 0.0 0.0
PHI
LOCUS STRUCT CONSID STRESS
LOCUS
0.195 0.216 0.206
-0.258
STRUCT
OT^ 0.0 0.0
STRUCT
0.974 0.761
-0.436
CONSID
oTo" 0.0 0.0
CONSID
STRESS
oTo" 0.0 0.0
STRESS
0 -0
784 372 0.380
PSI ATT-FORM
0.852
ATT-INFM
0.626
RUFI
2.449
TOTAL COEFFICIENT OF DETERMINATION FOR Y - VARIABLES IS 0.972
TOTAL COEFFICIENT OF DETERMINATION FOR X - VARIABLES IS 0.993
MEASURES OF GOODNESS OF FIT CHI-SQUARE WITH 458 DEGREES
(PROB. LEVEL = 0.000) GOODNESS OF FIT INDEX IS 0.778 ADJUSTED GOODNESS OF FIT INDEX ROOT MEAN SQUARE RESIDUAL IS 0
FOR THE WHOLE MODEL OF FREEDOM IS 9 8 5.32
IS 0 242
744

APPENDIX E
THE ATTITUDES MODEL
153

154
LISREL ESTIMATES LAMBDA Y
(MAXIMUM LIKELIHOOD)
AFl AF2 AF3 AF4 AF5 AF6 AF7 AF8 All AI2 AI3 AI4 AI5 AI6 AI7 AI8 RUFIl RUFI2 RUFI3 RUFI4
ATT-FORM
1.000 1.169 1.278 0.847 1.019 0.332 1.134 0.435 0.0 0.0 0.0 0.0 0.0 0.0 0.0 0.0 0.0 0.0 0.0 0.0
LAMBDA X
LOCI LOC 2 LOC 3 LOC 4 LOC 5 STRUCTl STRUCT2 CONSIDl C0NSID2 STRESSl STRESS2 STRESS3
LOCUS
1.000 0.898 1.249 1.168 1.229 0.0 0.0 0.0 0.0 0.0 0.0
0.0
BETA
ATT-FORM ATT-INFM RUFI
ATT-FORM
0.0 0.480
-1.093
ATT-INFM
0.0 0.0 0.0 0.0 0.0 0.0 0.0 0.0 1.000 0.949 1.303 0.969 0.988 0.508 1.180 0.442 0.0 0.0 0.0 0.0
STRUCT
0.0 0.0 0.0 0.0 0.0 1.000 0.550 0.0 0.0 0.0 0.0 0.0
ATT-INFM
0.0 0.0 1.187
RUFI
0.0 0.0 0.0 0.0 0.0 0.0 0.0 0.0 0.0 0.0 0.0 0.0 0.0 0.0 0.0 0.0 1.000 0.852 0.825 0.736
CONSID
0.0 0.0 0.0 0.0 0.0 0.0 0.0 1.000 0.749 0.0 0.0 0 0 \j m \y
RUFI
0.0 0.0 0.0
STRESS
0.0 0.0 0. 0 0.0 0.0 0.0 0.0 0.0 0.0 1.000 0.717 0.963

155
GAMMA LOCUS
ATT-FORM 0.0 ATT-INFM 0.0 RUFI
LOCUS STRUCT CONSID STRESS
0.0
PHI LOCUS
0.195 0.216 0.206
-0.258
PSI ATT-FORM
STRUCT
0.0 0.0 0.0
STRUCT
0.974 0.761
-0.436
ATT-INFM
CONSID
0.0 0.0 0.0
CONSID
0.784 -0.372
RUFI
STRESS
0.0 0.0 0.0
STRESS
0.380
0.873 0.449 1.540
TOTAL COEFFICIENT OF DETERMINATION FOR Y - VARIABLES IS 0.970
TOTAL COEFFICIENT OF DETERMINATION FOR X - VARIABLES IS 0.993
SQUARED MULTIPLE CORRELATIONS FOR STRUCTURAL EQUATIONS ATT-FORM ATT-INFM RUFI
0.0 0.309 0.361
MEASURES OF GOODNESS OF FIT FOR THE WHOLE MODEL CHI-SQUARE WITH 455 DEGREES OF FREEDOM IS 882.03
(PROB. LEVEL = 0.000) GOODNESS OF FIT INDEX IS 0.793 ADJUSTED GOODNESS OF FIT INDEX IS 0.760 ROOT MEAN SQUARE RESIDUAL IS 0.167

APPENDIX F
THE FITTED MODEL
156

157
LISREL ESTIMATES (MAXIMUM LIKELIHOOD)
LAMBDA Y STRESS ATT-FORM ATT-INFM RUFI
STRESSl STRESS2 STRESS3 AFl AF2 AF3 AF4 AF5 AF6 AF7 AF8 All AI2 AI3 AI4 AI5 AI6 AI7 AI8 RUFIl RUFI2 RUFI3 RUFI4
1.000 0.715 0.966 0.0 0.0 0.0 0.0 0.0 0.0 0.0 0.0 0.0 0.0 0.0 0.0 0.0 0.0 0.0 0.0 0.0 0.0 0.0 0.0
0 0 0 1 1 1 0, 1, 0, 1. 0. 0. 0. 0. 0. 0. 0. 0. 0. 0. 0. 0. 0.
.0
.0
.0
.000
.159 ,271 ,845 ,012 337 156 433 0 0 0 0 0 0 0 0 0 0 0 0
0 0 0 0 0 0 0, 0, 0, 0. 0. 1. 0. 1. 0. 0. 0. 1. 0. 0. 0. 0. 0.
.0
.0
.0
.0
.0
.0
.0 ,0 ,0 0 0 000 951 310 972 996 508 189 443 0 0 0 0
0 0 0 0 0 0 0 0 0, 0, 0. 0 . 0 . 0 . 0 . 0 . 0 . 0 . 0 . 1 . 0 . 0 . 0 .
. 0
. 0
. 0
. 0
. 0
. 0
. 0
. 0
. 0
.0
.0
.0 ,0 ,0 0 0 0 0 0 000 852 824 736
LAMBDA X LOCUS STRUCT CONSID
LOCI LOC 2 LOC 3 LOC 4 LOC 5 STRUCTl STRUCT2 CONSIDl C0NSID2
1 0 1 1 1 0 0 0 0
000 854 223 134 177 0 0 0 0
0.0 0.0 0.0 0.0 0.0 1.000 0.541 0.0 0.0
0.0 0.0 0.0 0.0 0.0 0.0 0.0 1.000 0.748
BETA STRESS
STRESS ATT-FORM ATT-INFM RUFI
0.0 -0.682 -0.141 0.0
ATT-FORM
oTo 0.0 0.434
-1.083
ATT-INFM
oTo 0.0 0.0 1.192
RUFI
0.0 0.0 0.0 0.0

158
STRESS ATT-FORN ATT-INFN RUFI
LOCUS STRUCT CONSID
GAMMA LOCUS
-1.007 I 0.0 1 0.0
0.0
PHI LOCUS
0.207 0.222 0.207
PSI STRESS
STRUCT
-0.225 0.0 0.0 0.0
STRUCT
0.989 0.761
ATT-FORM
CONSID
0.0 0.0 0.0 0.0
CONSID
0.786
ATT-INFM RUFI
0.019 0.702 0.439 1.548
TOTAL COEFFICIENT OF DETERMINATION FOR Y - VARIABLES IS 0.977
TOTAL COEFFICIENT OF DETERMINATION FOR X - VARIABLES IS 0.997
SQUARED MULTIPLE CORRELATIONS FOR STRUCTURAL EQUATIONS STRESS ATT-FORM ATT-INFM RUFI
0 . 9 5 1 0 . 2 0 1 0 .319 0 .359
TOTAL COEFFICIENT OF DETERMINATION FOR STRUCTURAL EQUATIONS IS 0.951
MEASURES OF GOODNESS OF FIT FOR THE WHOLE MODEL CHI-SQUARE WITH 454 DEGREES OF FREEDOM IS 848.54
(PROB. LEVEL = 0.000) GOODNESS OF FIT INDEX IS 0.799 ADJUSTED GOODNESS OF FIT INDEX IS 0.766 ROOT MEAN SQUARE RESIDUAL IS 0.127
Top Related
Copyright © 2022 FDOKUMEN

