


Bahasa
Halaman
Hukum

Mouna & Anis, Cogent Economics & Finance (2015), 3: 1057923http://dx.doi.org/10.1080/23322039.2015.1057923
FINANCIAL ECONOMICS | RESEARCH ARTICLE
The factors forming investor’s failure: Is financial literacy a matter? Viewing test by cognitive mapping techniqueAmari Mouna1* and Jarboui Anis2
Abstract: The objective of this paper is to apply cognitive map-related techniques to extract causal knowledge from a specific problem domain. This paper proposes to draw an average cognitive map in order to identify the failure factors of the Tunisian small investors. Our paper extends traditional and behavioral finance and previous research by proposing a new approach to building an average cognitive map for the explanation of small investors’ failure in the stock market.
Subjects: Economics; Finance; Business & Industry; Education; Psychological Science
Keywords: individual investor; failure; behavior; cognitive mapping
1. IntroductionUnderstanding investors’ behavior starts from the analysis of its forming factors. Recognizing that economic behavior is limited not only to qualitative examination of market actions and quantitative analysis of data, but also that it reflects the understanding and evaluation of these events as well as data awareness of economic participants, at the same time the importance of subjectivity in making investment decisions, is noted.
Global financial markets pose new challenges for investors and activities of all investors are based on continuous decision-making, which is not always rational, and, as a result, unexplained by the traditional economic theory, assuming that all investors operating in the market are rational, and the capital market is efficient.
*Corresponding author: Amari Mouna, Faculté des Sciences Economiques et de Gestion de Sfax, Sfax, TunisiaE-mail: [email protected]
Reviewing editor:David McMillan, University of Stirling, UK
Additional information is available at the end of the article
ABOUT THE AUTHORSAmari Mouna, PhD, is an associate researcher at LARTIGE (laboratory of research) in the University of Sfax, Tunisia. She is the corresponding author and her research interests are in financial literacy, economics education, behavioral finance, and corporate governance.
Jarboui Anis, PhD, is a professor of finance and accounting at the University of Sfax, Tunisia. His research interests are in corporate governance, financial literacy, and behavioral finance.
PUBLIC INTEREST STATEMENTActually, for the sake of improving the explanatory power of financial literacy, the authors’ goals consist in highlighting the role played by behavioral factors as cognitive errors affecting the financial decision-making. The current study is considered the first of its kind conducted in the Tunisian context. To the best of our knowledge, no such studies have been conducted regarding measuring financial literacy in Tunisia or the relationship between cognitive abilities, trading failure, and financial literacy.
Financial literacy studies around the world incite governments to establish training programs aimed to develop the individual investor’s financial literacy and competency.
Financial literacy will help you achieve your goals whether they are to own your own business or raise a family.
Received: 05 November 2014Accepted: 27 March 2015
© 2015 The Author(s). This open access article is distributed under a Creative Commons Attribution (CC-BY) 4.0 license.
Page 1 of 16
Jarboui Anis

Page 2 of 16
Mouna & Anis, Cogent Economics & Finance (2015), 3: 1057923http://dx.doi.org/10.1080/23322039.2015.1057923
That is why behavioral finance theory, contrary to traditional financial theories in their core provi-sions, was started to be actively developed. It holds that prediction of investment decisions cannot be based only on rationality, as far as significant influence on the investor’s decision is made by his/her provisions and subjective assessment of the situation.
By studying investors’ characteristics, individual investment behavior, and its consequences for finan-cial markets, scientists from various countries come to the conclusion that irrational factors affect the behavior of investors. The global financial crisis of recent years has underlined the necessity to research investor behavior and its determinants as well as the consequences of irrational investor decisions on financial markets more widely.
According to economic theorists, investors think and behave “rationally” when buying and selling stocks. Specifically, investors are presumed to use all available information to form “rational expec-tations” about the future in determining the value of companies and the general health of the economy.
Consequently, stock prices should accurately reflect fundamental values and will only move up and down when there is unexpected positive or negative news, respectively. Thus, economists have concluded that financial markets are stable and efficient, stock prices follow a “random walk,” and the overall economy tends toward “general equilibrium.”
In reality, however, according to Shiller (2002), investors do not think and behave rationally. To the contrary, driven by greed and fear, investors speculate stocks between unrealistic highs and lows. In other words, investors are misled by extremes of emotion and subjective thinking, and the whims of the crowd consistently form irrational expectations for the future performance of companies and the overall economy such that stock prices swing above and below fundamental values and follow a somewhat predictable, wave-like path.
Investors’ behavior is part of academic discipline known as “behavioral finance” which explains how emotions and cognitive errors influence investors and the decision-making process.
Behavior of the individual investor (small investor who manages his/her portfolio by himself/her-self) has long been the interest of academics and portfolio managers but not the investors them-selves since the herd mentality sometimes dominates over reasons. Human herding behavior results from impulsive mental activity in individuals responding to signals from the behavior of others (Prechter, 1999).
Currently, researchers from various countries are interested in the analysis of problems of behav-ioral finance, market uncertainty and inefficiency, market anomalies, and influence of investor psy-chology on their decisions with regard to different aspects. The researchers of financial behavior (Campbell & Sharpe, 2007) state that real investor behavior deviates from rational behavior under the influence of various subjective factors such as information, awareness and assessment, risk tolerance and understanding, personal qualities and investor emotions, mood, and expectations. Jordan and Miller (2008) assume that markets are not efficient, and they prove this assumption.
Thus, one of the basic financial theory concepts—the efficient market hypothesis (EMH) of Fama (1970), defining a market as being efficient when prices of financial instruments reflect all available information and instantly change depending on new information—faces a challenge. However, the classical theory, invoking the assumption about efficient market (where it is impossible to earn more than the market’s average because of rational, profit-maximizing investors), does not reflect the real market situation.
It should be noted that researchers’ interest in irrational investor behavior and its consequences for financial markets is constantly growing. It could be illustrated by numerous studies dealing with
Dow
nloa
ded
by [
Am
ari M
ouna
] at
12:
56 1
7 Ju
ly 2
015

Page 3 of 16
Mouna & Anis, Cogent Economics & Finance (2015), 3: 1057923http://dx.doi.org/10.1080/23322039.2015.1057923
one or more factors influencing investors’ behavior, investors’ personal characteristics, the impact of cognitive or emotional biases on their behavior and investment decisions (Barber & Odean, 2001; Campbell & Sharpe, 2007; Beshears, Choi, Laibson & Madrian, 2008; Lim, 2006; Park & Sabourian, 2011, etc.).
Analyzing the problematic issues of the studies of the last decade, we can note that the influence of investors’ personal characteristics on their behavior and decisions has been investigated more thoroughly.
Our main objective is to identify the factors of trading failure at the level of small individual inves-tors through drawing their collective cognitive map. Cognitive mapping is a technique now well established which captures the minds of the players about a problem or situation. A cognitive map allows you to view certain ideas and beliefs of an individual on a complex area such as trading fail-ure. A cognitive map is usually defined as the graphical representation of a person’s beliefs about a particular field. A map is not a scientific model based on an objective reality, but a representation of a part of stock market experience as seen by an individual investor. Our paper extends traditional literature and previous studies such as Smida and Khelil (2010) by proposing a new approach to building an average cognitive map for the explanation of the small individual investor’s failure in the stock market. As the title of this research suggests, the overall objective is to better understand the ways of conceptualizing the individual investor’s failure vis-à-vis the trading failure in the stock market.
The goal goes beyond the mere recognition of the relevance of the study of behavioral finance and is to explore representations of the individual investors on their beliefs about their failure in the stock market. The intention here is not to provide a statistical analysis, but rather to paint a picture of the beliefs of the individual investor about the factors of trading failure.
The study is structured as follows: previous studies are discussed in Section 2. Section 3 contains data sources and methodology. The results of this research are in Section 4, while the conclusions and implications are in Section 5.
2. Literature and conceptual review
2.1. Traditional financeThe proposal that has overpowered finance for more than 30 years is efficient market hypothesis (EMH). There are three basic theoretical arguments that structure the base of EMH. The first and most considerable is that investors are rational and by implication securities are appreciated ration-ally. The second argument is based on the suggestion that every household takes careful account of all accessible information before making their investment decisions. It is related to internal consist-ency. Each decision has to be made in a systematic way such that it is in agreement with one another whatever the subject is.
The third principle is that the decision-maker always pursues self-interest. Most widely applied in finance is the expected utility model of choice under risk, proposed by von Neumann and Morgenstern (1947). Its rationality is based on axioms underlying expected utility maximization as the optimal rule. The accumulation and processing of information and the formation of expectations occur effi-ciently, yielding possible outcomes (of total wealth) and corresponding possibilities. In the case of new information, the probability distribution is adjusted in conformity with Bayes’ rule.
2.2. Behavioral financeBehavioral finance is a study of markets that draws on psychology, throwing more light on why peo-ple buy or sell stocks and even why they do not buy stocks at all. This research on investor behavior helps to explain the various “market anomalies” that challenge standard theory (Muradoglu & Harvey, 2012; Riaz, Hunjra, & Azam, 2012; Taylor, Jenkins, & Sacker, 2011).
Dow
nloa
ded
by [
Am
ari M
ouna
] at
12:
56 1
7 Ju
ly 2
015
Page 4 of 16
Mouna & Anis, Cogent Economics & Finance (2015), 3: 1057923http://dx.doi.org/10.1080/23322039.2015.1057923
This is because this anomaly is persistent. Therefore, this behavior exists. Behavioral finance encompasses research that drops the traditional assumptions of expected utility maximization with rational investors in efficient market. The two building blocks of behavioral finance are cognitive psychology and the limits to arbitrage (Ritter, 2003). Cognitive psychology refers to how people think and the limit to arbitrage when a market is inefficient (Heath, Huddart, & Lang, 1999; Kartasova, 2013; Kumar & Lee, 2006; von Gaudeker, 2011).
There is a vast psychology literature documenting that people make systematic errors in the way they think: they always make decisions easier (heuristics), overconfident, put too much weight on recent experience (representativeness), separate decisions that should be combined (mental accounting), wrong presenting the individual matters (framing), tend to be slow to pick up the changes (conservatism), and their preferences may also create distortion when they avoid realizing study losses and seek to realize study gains (disposition effect). Behavioral finance uses models in which some agents are not fully rational, either because of preferences or because of mistaken beliefs. An example of an assumption about preferences is that people are loss averse (Furnham & Boo, 2011; Ingmar, 2012; Kaustia & Torstila, 2011; Riaz et al., 2012; Shefrin, 2000).
Much of the basic theories of behavioral finance concern with a series of new concepts under the general heading of “bounded rationality,” a term associated with Simon. It relates to cognitive limi-tations on decision-making. As a result, human behavior is made on the basis of simplified proce-dures or heuristics (Tversky & Kahnemann, 1974). This is consistent with the study done by Slavic (1972) on investment risk-taking behavior. He found that man has limitations as a processor of infor-mation perception and shows some judgmental biases which lead people to overweight informa-tion. People also tend to be overreacting to information (De Bondt & Thaler, 1985; Furnham & Boo, 2011).
Shiller (2002) surveyed some of the key ideas in behavioral finance, including prospect theory, regret theory, anchoring, and over-and under-reaction. Prospect theory introduced by Kahneman and Tversky (1979) and Tversky and Kahneman (1981, 1986) suggests that people respond differ-ently to equivalent situations depending on whether it is presented in the context of a loss or a gain.
Investors typically become distressed at the prospect of losses and are pleased by possible gains: even faced with sure gain, most investors are risk-averse but faced with sure loss, they become risk-takers. Thus, according to Kahneman, investors are “loss averse” (Ingmar, 2012; Riaz et al., 2012).
Hypothesis: The failure of individual investors resulting from the combination of internal factors (individuals’ differences, financial literacy, knowledge, experience, cognitive biases, etc.) and external factors (environmental factors, competition, political problems, etc.).
3. Methodology and data
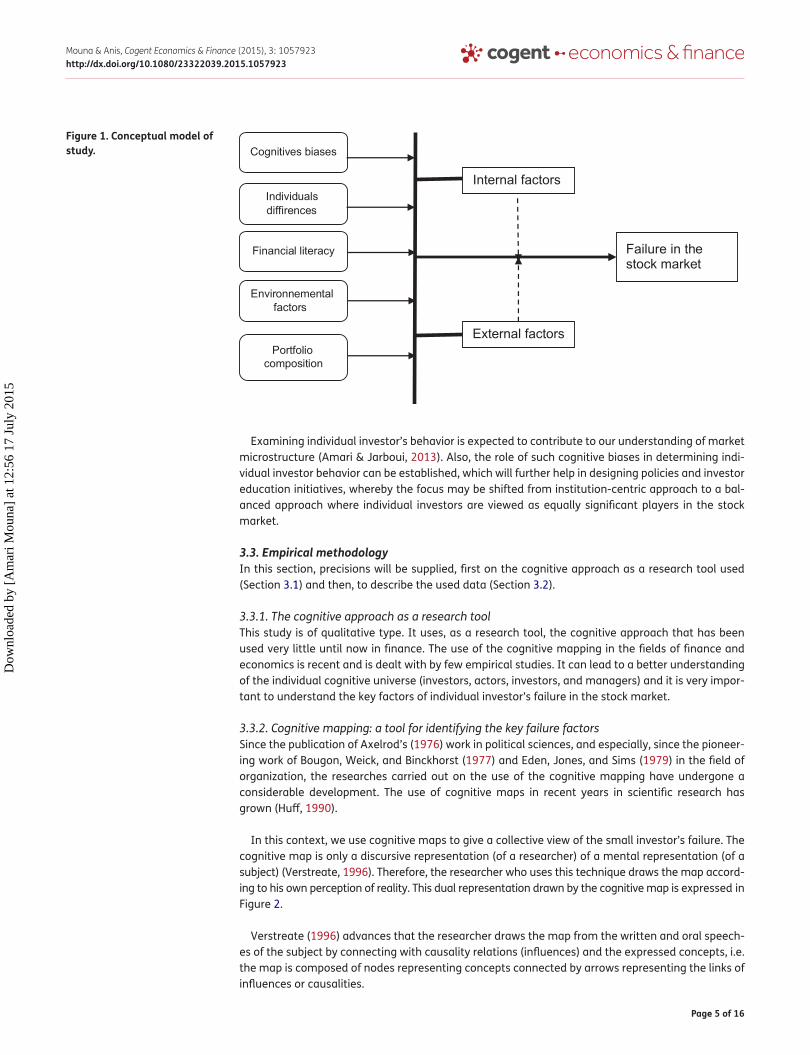
3.1. Conceptual frameworkBased on the arguments presented above, the conceptual model proposed in this study is presented in Figure 1.
3.2. Research questionOverall, the poor performance by individual investors can largely be explained by this tendency to hold value stocks during advancing markets and high risk stocks during declining markets. These behavioral patterns revealed at the market level also represent important findings, and, hence, become one of the important motivations for our study of individual investors in Tunisia.
Specifically, we try to identify and confirm psychological heuristics and biases prevailing among the Tunisian individual investors. This is an important issue in order to understand the nature of local individual investors.
Dow
nloa
ded
by [
Am
ari M
ouna
] at
12:
56 1
7 Ju
ly 2
015
Page 5 of 16
Mouna & Anis, Cogent Economics & Finance (2015), 3: 1057923http://dx.doi.org/10.1080/23322039.2015.1057923
Examining individual investor’s behavior is expected to contribute to our understanding of market microstructure (Amari & Jarboui, 2013). Also, the role of such cognitive biases in determining indi-vidual investor behavior can be established, which will further help in designing policies and investor education initiatives, whereby the focus may be shifted from institution-centric approach to a bal-anced approach where individual investors are viewed as equally significant players in the stock market.
3.3. Empirical methodologyIn this section, precisions will be supplied, first on the cognitive approach as a research tool used (Section 3.1) and then, to describe the used data (Section 3.2).
3.3.1. The cognitive approach as a research toolThis study is of qualitative type. It uses, as a research tool, the cognitive approach that has been used very little until now in finance. The use of the cognitive mapping in the fields of finance and economics is recent and is dealt with by few empirical studies. It can lead to a better understanding of the individual cognitive universe (investors, actors, investors, and managers) and it is very impor-tant to understand the key factors of individual investor’s failure in the stock market.
3.3.2. Cognitive mapping: a tool for identifying the key failure factorsSince the publication of Axelrod’s (1976) work in political sciences, and especially, since the pioneer-ing work of Bougon, Weick, and Binckhorst (1977) and Eden, Jones, and Sims (1979) in the field of organization, the researches carried out on the use of the cognitive mapping have undergone a considerable development. The use of cognitive maps in recent years in scientific research has grown (Huff, 1990).
In this context, we use cognitive maps to give a collective view of the small investor’s failure. The cognitive map is only a discursive representation (of a researcher) of a mental representation (of a subject) (Verstreate, 1996). Therefore, the researcher who uses this technique draws the map accord-ing to his own perception of reality. This dual representation drawn by the cognitive map is expressed in Figure 2.
Verstreate (1996) advances that the researcher draws the map from the written and oral speech-es of the subject by connecting with causality relations (influences) and the expressed concepts, i.e. the map is composed of nodes representing concepts connected by arrows representing the links of influences or causalities.
Figure 1. Conceptual model of study.
Internal factors
External factors
Failure in thestock market
Individuals diffirences
Cognitives biases
Financial literacy
Environnemental factors
Portfolio composition
Dow
nloa
ded
by [
Am
ari M
ouna
] at
12:
56 1
7 Ju
ly 2
015

Page 6 of 16
Mouna & Anis, Cogent Economics & Finance (2015), 3: 1057923http://dx.doi.org/10.1080/23322039.2015.1057923
3.4. Construction phases of collective cognitive mapThe drawing of a collective map is made through the aggregation (assembly) of individual cognitive maps (Ozesmi & Ozesmi, 2004).
A cognitive map, whether collective or individual, is composed of two essential elements: concepts and links. Concepts are considered as variables and links explain the relationships between these variables. A concept can be influenced by other concepts according to their degree on the map.
Thus, a concept (variable) is said to be important if it possesses numerous links with other con-cepts (variable) on the map.
For this reason, Weick (1979) suggests that the more a concept has entries or exits, the more it is important. Although the individual map is constructed from individual experiences, the collective cognitive map defines the group as all the individuals who compose it. Its construction is made through the construction of individual maps, followed by a stage of aggregation (addition) of these last ones (Garoui, Sessi, & Jarboui, 2013; Ozesmi & Ozesmi, 2004).
Our main purpose in this study is to analyze the collective mental representation of the Tunisian individual investors concerning the factors which have, according to their beliefs, an impact on their stock market failure.
To achieve this objective, we propose a gait of three phases to build a collective cognitive map (Table 1). This gait relies on the alternation of two phases of conceptions: individual and collective (Table 2).
This approach combines, through these three stages, qualitative and quantitative measures in order to construct the collective cognitive map (aggregated map).
In the phase below, and after having elaborated the individual matrices of interviewees (individu-als investors), we are going to construct a collective matrix where we find all the concepts and com-mon weights of all the respondents.
The construction of this one is from aggregation (addition) of matrices collected during the second phase. Studies, like those of Ozesmi and Ozesmi (2004), suggest that it is possible to aggregate the individual maps. Also, Damart (2006) notes that the individual cards with individual interviews can be aggregated. This technique allows us to construct a collective matrix where there are all the com-mon concepts of all respondents and an aggregate weighted causal relationship between these concepts (Omri & Frikha, 2014).
Figure 2. Cognitive mapping: a representation of a representation.
Source: Verstreate (1996, p. 9). Subject representation
Real
Research representation
Communicates his interpretation in discursive way
Discursive statement interpretation of subject by the researcher
Cognitive state of researcher
Subject representation
Dow
nloa
ded
by [
Am
ari M
ouna
] at
12:
56 1
7 Ju
ly 2
015

Page 7 of 16
Mouna & Anis, Cogent Economics & Finance (2015), 3: 1057923http://dx.doi.org/10.1080/23322039.2015.1057923
Thus, we can trace a collective cognitive map with a processing data program “MIC-MAC” to use it as tool of analysis and identification of the individual investor’s failure factors.
3.5. Data
3.5.1. Description of the empirical investigationTo meet the research objectives mentioned above, a survey was conducted among individual inves-tors in the Tunisian stock market. The data consist in establishing a survey on a sample of individual investors actively trading on the Tunisian stock market who have failed. The output is an average
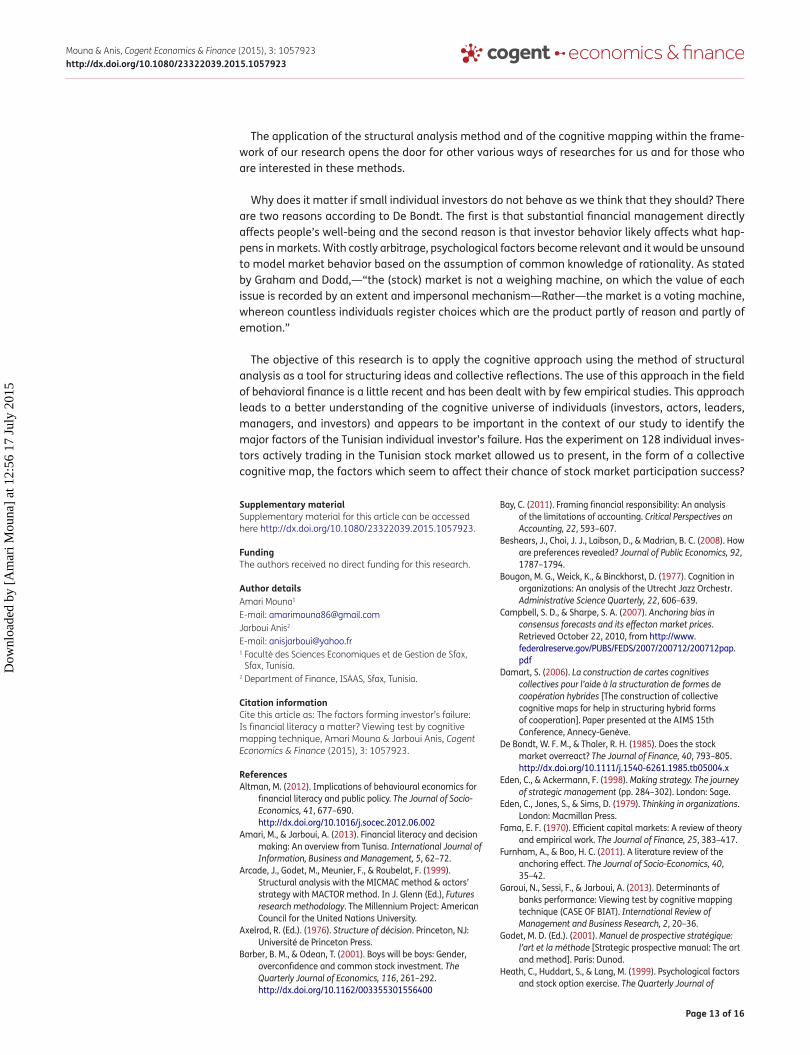
Figure 3. The structural analysis matrix and its graphs.
7
V1
V3V2
V4
1
2
1
34
1
V1 V2 V3 V4
V1 0 0 0 3
V2 1 0 4 0
V3 1 0 0 0
V4 1 2 0 0
Table 1. The three construction phases of “aggregate” cognitive mapFirst phaseThe identification of concepts (variables)
(a) Collect the individual perception of respondents about their portfolio failure through semi-structural interviews.
(b) Clear through these interviews, different concepts, ideas, or examples related to this question.
(c) Creation of a concept (variable) list to be used in the second stage.
Second phaseThe description of relationships between concepts.
(a) Every interviewee will assess the strength links between these concepts (the concepts identified during the first stage) by building a cross-impact matrix for each of them which contains only the common concepts (Figure 3).
Third phaseThe construction of the collective cognitive map
(a) Building a collective matrix in which one finds all the common concepts of the respon-dents and “an aggregated causal intensity.”
(b) Construction of the cognitive collective map through the (MIC-MAC) program.
Table 2. Matrix tableTotal
Motricité (Σ de la i-ième ligne) 3 5 1 3 12
Dépendance (Σ de la j-ième colonne) 3 2 4 3 12
Source: Khelil and Smida (2008).
Dow
nloa
ded
by [
Am
ari M
ouna
] at
12:
56 1
7 Ju
ly 2
015

Page 8 of 16
Mouna & Anis, Cogent Economics & Finance (2015), 3: 1057923http://dx.doi.org/10.1080/23322039.2015.1057923
collective map for individual investors reflecting their perception vis-à-vis their trading failure. The method used to create cognitive maps is the questionnaire.
3.5.2. Presentation of the questionnaireThe questionnaire is divided into two parts: the first identifies the investor characteristics and the second relating to trading failure. We interview the investor about their stock market experience and trading failure. One hundred and twenty-eight individual investors are interviewed over a period of four months. Each interview lasted between 20 and 30 min. Participants were asked about the fac-tors that affected the stock returns on their portfolio. This technique has mainly been used until now to make connections that exist between concepts previously determined.
Each investor is encouraged to explore his/her own ideas or cognitive representations in relation to its strategic vision. The respondent is asked to identify important factors that he said will have an impact on the key concept related to a trading failure in the stock market, such as “In your opinion, what are the factors that have affected your portfolio return rate?” In our study, trading failure meant that the investor has experienced a lower portfolio return rate during the past year.
3.5.3. SampleOur empirical study is based on qualitative research. We use a questionnaire as a method of data collection. Data include over 250 individual (small) Tunisian investors currently trading and manag-ing directly their investments in the Tunisian stock exchange.
The surveyed respondents had to be over 18 years of age. In terms of response rates, a traditional response rate measure could not be computed because online surveys are administrated in a differ-ent manner from standard telephone and paper surveys. Only 128 individual investors fully com-pleted the questionnaire.
One hundred and twenty-eight interviews were carried out one-off, for which we have constructed individual causal (cognitive) maps. These interviews allowed us to identify a list of 28 common con-cepts. These concepts will be structured using the individual and collective cross-impact matrices.
The construction and analysis of the collective cognitive map were made by the program (MIC-MAC). This program was chosen for its conviviality and its analytical skills. This program allows iden-tifying the explanatory variables from the cross-impact matrix (matrix structural analysis). It can also classify these variables according to their sensibility to the environment (dependence variables) and to their impact on other variables (motricity variables) (Figure 4). It also allows treating the infor-mation collected in the form of graphs and plans configuring the mental representation of interviewees.
4. Results analysisIndependently of its construction process, the cognitive map constitutes in itself an interesting product to be analyzed because it is a decisive tool to evaluate and provide alternatives to solve a problem.
Our average cognitive map of investors is based on the structural analysis matrix, on the influ-ence-dependence graph, and on the influence-dependence chart and the essential categories of trading failure.
4.1. The structural analysis matrixAccording to Arcade, Godet, Meunier, and Roubelat (1999), structural analysis is a tool designed to link up ideas. It allows describing the system thanks to a matrix which links up all its constitutive ele-ments. The method enables, by studying these relations, to underline the variables that are essential to the system’s evolution. It has the advantage of stimulating reflection within the group, and lead-ing it to think about certain aspects, which are sometimes counterintuitive. It applies to the qualita-tive study of extremely different systems.
Dow
nloa
ded
by [
Am
ari M
ouna
] at
12:
56 1
7 Ju
ly 2
015

Page 9 of 16
Mouna & Anis, Cogent Economics & Finance (2015), 3: 1057923http://dx.doi.org/10.1080/23322039.2015.1057923
According to Smida and Khelil (2010), the structural analysis matrix allows identifying directly the key variables from the total, on line and in column, weight influences between each couple of vari-ables. It is used to measure the influence (lines sum) and the sensibility (columns sum) of each vari-able on the failure or success of individual investors.
We have succeeded with the MICMAC software developed by Godet (2001), a classification of these holding variables according to their order of motricity and sensibility to sort out the 15 critical factors of stock market participation failure of the Tunisian individual investors (Table 3) was succeeded.
Looking closely at these two tables, we can conclude that our hypothesis has been proved.
It seems essential that the cognitive biases and the indicators of the financial literacy such as the “familiarity with the assets, the anchoring to the past failure”, and the difficulties in understanding the financial concepts and the lower level of the financial education are leading the pack. These vari-ables or factors are both very influent and little sensitive. They represent the explanatory elements of stock market participation failure at the level of Tunisian small investors.
4.2. The influence-dependence graphAccording to Smida and Khelil (2010), the cognitive map can have the form of an influence-depend-ence graph (Figure 5).The analysis of our average cognitive map puts clearly two categories of fac-tors. The first category includes the sensitive factors, known as influenced factors or “consequences” because they are influenced by other factors (this category is placed in the center of the map), while in the second category, we find the motricity factors, also known as the influencing factors or “expla-nation,” which exert a direct influence on many others. This second category of the influencing fac-tors directly relates the strong influence of factors related to the cognitive biases and financial literacy (see especially variables familiar with the assets, anchoring to the past failure, and lower level of financial education) on the lower portfolio rate return.
4.3. The influence-dependence planThe variables characterizing the system under study and its environment can be projected on the influence × dependence chart. In this chart, we distinguish between four categories of variables (influent, relay, excluded, and depending), allowing legibility perfect of individual investor failure phenomenon. These categories distinguish one another depending on the specific role that the vari-ables can play in the failure of investors in the stock market.
Figure 4. Classification of variables, according to the motricity and dependency criteria.
************
************
Variables
Motricity scale
(Lines total)
Dependent scale (column total)
Dependence variables
Motricity
Dow
nloa
ded
by [
Am
ari M
ouna
] at
12:
56 1
7 Ju
ly 2
015

Page 10 of 16
Mouna & Anis, Cogent Economics & Finance (2015), 3: 1057923http://dx.doi.org/10.1080/23322039.2015.1057923
4.3.1. Zone A: “influent” variablesThese are variables which have a high index of motricity and a low index of dependence, i.e. they are altogether very influential and little dependent on the rest of the variables.
The motrice/influent variables are the most important elements because they can act on the sys-tem depending on how much we can control them as a key factor either of movement or inertia. These variables are settled “explanations” because they are the elements enplaning of failure.
Zone A of the most influential factors clearly shows two categories of failure factors. The first category refers directly to the importance of the factors related to the cognitive biases underlying the individual investor behavior on the explanation of the stock market failure (such as the familiar-ity with the assets, the anchoring to the past failure, and overconfidence). Then, we can say that the influence of variables related to the financial literacy (such as the difficulties of understanding the financial concepts and lower level of the financial education) will for success are major factors of individual investor’s failure.
Table 3. The top 13 critical failure factors in order to influence and dependenceRank Variable1 Familiarity with the assets
2 Anchoring to the past failure
3 Age
4 Lower level of financial education
5 Difficulties in understanding financial concepts
6 Gender
7 Optimism
8 Lower economic education level
9 Impulsive decisions
10 Loss aversion
11 Mood
12 Portfolio size
13 Employment
Figure 5. The influences × dependences chart.
Source: Arcade et al. (1999).
Gravity centre of cloud points of variables DC
A B
Influent variables
Relay variables
Excluded variables
Depending variables
Influence scale
Dependence scale
Average dependence
Average influence
Dow
nloa
ded
by [
Am
ari M
ouna
] at
12:
56 1
7 Ju
ly 2
015

Page 11 of 16
Mouna & Anis, Cogent Economics & Finance (2015), 3: 1057923http://dx.doi.org/10.1080/23322039.2015.1057923
4.3.2. Zone B: “relay” variablesIntermediate or relay variables are at the same time very influent and very dependent (highly influ-ent and highly dependent). These variables are situated in the northeast frame of the chart. They are, by nature, factors of instability because any effect on them will have an affect on others and on themselves. They also constitute the turning point between success and failure. Looking closely at Figure 6 (Appendix 1), which synthesizes the influence-dependence plan, one can observe that these variables are situated on the top right.
These variables, which are related to the individual investor’s behavior, such as the impulsive deci-sions, mood, and the lower level of financial knowledge, are factors that affect the individual inves-tor’s success.
4.3.3. Zone C: “excluded” variablesThe excluded or autonomous variables are those which have, at the same time, weak influence and little dependence. These variables are positioned in the southwest casing, and appear quite out of line with the system because they permit neither to stop a major evolution undergone by the system nor to really take benefit of it. Their development is relatively autonomous: they have no serious influ-ence on investor’s failure. Considering the influence-dependence plan (Figure 7, Appendix 2), we can single out certain “excluded” variables, namely the income, information asymmetry, portfolio size, etc.
4.3.4. Zone D: “depending” variablesResult or depending variables, or rather, the dependent variable, located in the southeast frame of the chart, are a little influential and very dependent. Thus, they are particularly sensitive to the evo-lution of motrice and/or relay variables. They are exit variables from the system. These variables, which can be explained by their acting on the influent and relay variables, are conditioned by too many factors. The variable lower portfolio rate return is considered as the result of other failure fac-tors of the Zones A and B (Table 4).
The determination of individual visions, their grouping, under the form of an aggregation, and their detailed analysis using the MICMAC program constitute practically crucial steps of a successful approach in tracing a common vision of reality.
The analysis of aggregated cognitive map of individual investor’s failure factors using the MICMAC programme revealed certain characteristics that would have been difficult, if not impossible, to iden-tify/detect otherwise.
This analysis is based on the following three aspects: the matrix structural analysis (allows to measure the influence or the sensibility of each factor on the failure or success of the micro-enter-prise), the influence graph (allows us to reveal the influencing and influenced factors) and, finally, the influence-dependence plan (allows to group the variables into four groups allowing a perfect understanding the problem of stock market participation failure.
To sum up, we can say that the study of these three aspects has highlighted the dimensions of stock market participation failure of the Tunisian individual investors and their associated factors.
5. Conclusion and implicationsThe obtained results show that mainly the low level of financial literacy (such as lower level of finan-cial education and difficulties in understanding financial concepts) and higher level of cognitive biases (such as familiarity and anchoring) of individual investors represent the main obstacles which limit-ed the success opportunity of their stock market participation. This verifies our initial hypotheses, i.e. the effect of the financial literacy, the cognitive biases, and errors constitute the key factors of the individual investor’s failure.
Dow
nloa
ded
by [
Am
ari M
ouna
] at
12:
56 1
7 Ju
ly 2
015

Page 12 of 16
Mouna & Anis, Cogent Economics & Finance (2015), 3: 1057923http://dx.doi.org/10.1080/23322039.2015.1057923
These results give us an idea, essentially, about the importance of the financial education, and human capital (the investor behavior) in the success of stock market participation. In the same line, several studies, such as of Altman (2012), Bay (2011), Riaz et al. (2012), Scholnick, Massoud, and Saunders (2013) and, von Gaudeker (2011), also insist on the importance of the attribution of the human and social resources (including education, experience, knowledge and skills, social networks, family, etc.) as critical resources for the success of individual business.
Following this contribution, the most important question that can be posed is about the privileges, recommendations, and actions that we can come out with after studying the stock market participa-tion failure.
Nevertheless, it is necessary to learn from the failure factors to support a possible success (Minniti & Bygrave, 2001). For these authors, failure can be perceived as a step to success, which constitutes an important source of learning because the individual is forced to conduct a post-mortem to com-prehend what led to the failure, aiding the improvement of an individual’s schema.
On the other hand, the stock market participation failure remains a phenomenon little dealt with by the traditional and the behavioral finance literature since the point was particularly put on the success factors.
Nevertheless, failure, even if it is almost always unpleasant, can become, in several occasions, a tool to discover new opportunities, skills, and motivation for success, and this shows the essence of stock market participation.
At the end of the present research, our main wishes are to have a methodological contribution, during the elaboration and analysis of the collective cognitive map, in the field of finance, and to confirm the cognitive mapping utility (Eden & Ackermann, 1998), mainly in situations where the analysis of the map’s structure and continuity are important to understand the problem studied.
Table 4. The small business failure categoriesFailure categories Associated factorsCognitive biases* • Familiarity
• Anchoring
• Optimism
• Loss aversionFinancial literacy* • Difficulties in understanding the financial concepts;
• Lower level of financial education;
• Lower level of economic education level;Individuals differences* • Age
• Gender
• EmploymentPortfolio composition* • lower rate of portfolio diversification.
• Portfolio sizeIndividual investor behavior** • Impulsive decisions
• Mood;
*Dimension of motrice variables.**Dimension of dependent variables.
Dow
nloa
ded
by [
Am
ari M
ouna
] at
12:
56 1
7 Ju
ly 2
015
Page 13 of 16
Mouna & Anis, Cogent Economics & Finance (2015), 3: 1057923http://dx.doi.org/10.1080/23322039.2015.1057923
The application of the structural analysis method and of the cognitive mapping within the frame-work of our research opens the door for other various ways of researches for us and for those who are interested in these methods.
Why does it matter if small individual investors do not behave as we think that they should? There are two reasons according to De Bondt. The first is that substantial financial management directly affects people’s well-being and the second reason is that investor behavior likely affects what hap-pens in markets. With costly arbitrage, psychological factors become relevant and it would be unsound to model market behavior based on the assumption of common knowledge of rationality. As stated by Graham and Dodd,—“the (stock) market is not a weighing machine, on which the value of each issue is recorded by an extent and impersonal mechanism—Rather—the market is a voting machine, whereon countless individuals register choices which are the product partly of reason and partly of emotion.”
The objective of this research is to apply the cognitive approach using the method of structural analysis as a tool for structuring ideas and collective reflections. The use of this approach in the field of behavioral finance is a little recent and has been dealt with by few empirical studies. This approach leads to a better understanding of the cognitive universe of individuals (investors, actors, leaders, managers, and investors) and appears to be important in the context of our study to identify the major factors of the Tunisian individual investor’s failure. Has the experiment on 128 individual inves-tors actively trading in the Tunisian stock market allowed us to present, in the form of a collective cognitive map, the factors which seem to affect their chance of stock market participation success?
Supplementary materialSupplementary material for this article can be accessed here http://dx.doi.org/10.1080/23322039.2015.1057923.
FundingThe authors received no direct funding for this research.
Author detailsAmari Mouna1
E-mail: [email protected] Anis2
E-mail: [email protected] Faculté des Sciences Economiques et de Gestion de Sfax,
Sfax, Tunisia.2 Department of Finance, ISAAS, Sfax, Tunisia.
Citation informationCite this article as: The factors forming investor’s failure: Is financial literacy a matter? Viewing test by cognitive mapping technique, Amari Mouna & Jarboui Anis, Cogent Economics & Finance (2015), 3: 1057923.
ReferencesAltman, M. (2012). Implications of behavioural economics for
financial literacy and public policy. The Journal of Socio-Economics, 41, 677–690. http://dx.doi.org/10.1016/j.socec.2012.06.002
Amari, M., & Jarboui, A. (2013). Financial literacy and decision making: An overview from Tunisa. International Journal of Information, Business and Management, 5, 62–72.
Arcade, J., Godet, M., Meunier, F., & Roubelat, F. (1999). Structural analysis with the MICMAC method & actors’ strategy with MACTOR method. In J. Glenn (Ed.), Futures research methodology. The Millennium Project: American Council for the United Nations University.
Axelrod, R. (Ed.). (1976). Structure of décision. Princeton, NJ: Université de Princeton Press.
Barber, B. M., & Odean, T. (2001). Boys will be boys: Gender, overconfidence and common stock investment. The Quarterly Journal of Economics, 116, 261–292. http://dx.doi.org/10.1162/003355301556400
Bay, C. (2011). Framing financial responsibility: An analysis of the limitations of accounting. Critical Perspectives on Accounting, 22, 593–607.
Beshears, J., Choi, J. J., Laibson, D., & Madrian, B. C. (2008). How are preferences revealed? Journal of Public Economics, 92, 1787–1794.
Bougon, M. G., Weick, K., & Binckhorst, D. (1977). Cognition in organizations: An analysis of the Utrecht Jazz Orchestr. Administrative Science Quarterly, 22, 606–639.
Campbell, S. D., & Sharpe, S. A. (2007). Anchoring bias in consensus forecasts and its effecton market prices. Retrieved October 22, 2010, from http://www.federalreserve.gov/PUBS/FEDS/2007/200712/200712pap.pdf
Damart, S. (2006). La construction de cartes cognitives collectives pour l’aide à la structuration de formes de coopération hybrides [The construction of collective cognitive maps for help in structuring hybrid forms of cooperation]. Paper presented at the AIMS 15th Conference, Annecy-Genève.
De Bondt, W. F. M., & Thaler, R. H. (1985). Does the stock market overreact? The Journal of Finance, 40, 793–805. http://dx.doi.org/10.1111/j.1540-6261.1985.tb05004.x
Eden, C., & Ackermann, F. (1998). Making strategy. The journey of strategic management (pp. 284–302). London: Sage.
Eden, C., Jones, S., & Sims, D. (1979). Thinking in organizations. London: Macmillan Press.
Fama, E. F. (1970). Efficient capital markets: A review of theory and empirical work. The Journal of Finance, 25, 383–417.
Furnham, A., & Boo, H. C. (2011). A literature review of the anchoring effect. The Journal of Socio-Economics, 40, 35–42.
Garoui, N., Sessi, F., & Jarboui, A. (2013). Determinants of banks performance: Viewing test by cognitive mapping technique (CASE OF BIAT). International Review of Management and Business Research, 2, 20–36.
Godet, M. D. (Ed.). (2001). Manuel de prospective stratégique: l’art et la méthode [Strategic prospective manual: The art and method]. Paris: Dunod.
Heath, C., Huddart, S., & Lang, M. (1999). Psychological factors and stock option exercise. The Quarterly Journal of
Dow
nloa
ded
by [
Am
ari M
ouna
] at
12:
56 1
7 Ju
ly 2
015

Page 14 of 16
Mouna & Anis, Cogent Economics & Finance (2015), 3: 1057923http://dx.doi.org/10.1080/23322039.2015.1057923
Economics, 114, 601–627. http://dx.doi.org/10.1162/003355399556089
Huff, A. S. (1990). Mapping strategic thought. In A. S. Huff (Ed.), Mapping strategic thought (pp. 11–49). New York, NY: Wiley.
Ingmar, N. (2012). A detailed investigation of the disposition effect and individual trading behavior. The European Journal of Finance, 18, 885–919.
Jordan, B., & Miller, T. (2008). Fundamentals of investments: Valuation and management. New York, NY: McGraw-Hill Higher Education.
Kahneman, D., & Tversky, A. (1979). Prospect theory: An analysis of decision under risk. Econometrica, 47, 263–292.
http://dx.doi.org/10.2307/1914185Kartasova, J. (2013). Factors forming irrational Lithuniainaian
individual investors’ behavior. Business Systems and Economics, 3, 69–78.
Kaustia, M., & Torstila, S. (2011). Stock market aversion? Political preferences and stock market participation. The Journal of Financial Economics, 100, 98–112.
Khelil, N., & Smida, A. (2008). Une investigation des facteurs d'échec d'une enterprise récemment créé: Utlisation de l'analyse structurelle pour étudier la carte cognitive du fondatur [An investigation of the failure factors of a newly created enterprise: Utlisation of structural analysis to study the cognitive map of fondatur]. Retrieved from http://www.dissertationsgratuites.com/dissertations/Facteur-d'Echec-d'Une-Entreprise/49358.html
Kumar, A., & Lee, C. M. C. (2006). Retail investor sentiment and return comovements. The Journal of Finance, 61, 2451–2486. http://dx.doi.org/10.1111/jofi.2006.61.issue-5
Lim, S. S. (2006). Do investors integrate losses and segregate gains? Mental accounting and investor trading decisions. Journal of Business, 79, 2539–2573.
Minniti, M., & Bygrave, W. A. (2001). Dynamic model of entrepreneurial learning. Entrepreneurship Theory and Practice, 25, 5–16.
Muradoglu, G., & Harvey, N. (2012). Behavioral finance: The role of psychological factors in financial decision. Review of Behavioral Finance, 4, 68–80.
Omri, A., & Frikha, M. (2014). How small business fail in Tunisia? International Journal of Economics and Accounting, 5, 126–144.
Ozesmi, U., & Ozesmi, S. L. (2004). Ecological models based on people’s knowledge: A multistep fuzzy cognitive approach. Ecological Modelling, 176, 43–64.
Park, A., & Sabourian, H. (2011). Herding and contrarian behavior in financial markets. Econometrica, Econometric Society, 79, 973–1026, 07.
Prechter, Jr., R. R. (1999). The wave principle of human social behavior and the new science of socionomics. Gainesville, GA: New Classics Library.
Riaz, L., Hunjra, A. I., & Azam, R.-i. (2012). Impact of psychological factors on investment decision making mediating by risk perception: A conceptual study. Middle-East Journal of Scientific Research, 12, 789–795.
Ritter, J. (2003). Behavioral finance. Pacific-Basin Finance Journal, 11, 429–437.
Scholnick, B., Massoud, N., & Saunders, A. (2013). The impact of wealth on financial mistakes: Evidence from credit card non-payment. Journal of Financial Stability, 9, 26–37. http://dx.doi.org/10.1016/j.jfs.2012.11.005
Shefrin, H. (2000). Behavioral portfolio theory. The Journal of Financial and Quantitative Analysis, 35, 127–151. http://dx.doi.org/10.2307/2676187
Shiller, R. J. (2002). From efficient markets theory to behavioral finance. Journal of Economic Perspectives, 17, 83–104.
Slavic, P. (1972). From Shakespeare to Simon: Speculations-and some evidence-about man’s ability to process information (Research Monograph, 12:12). Eugene, OR: Oregon Research Institute, University of Oregon.
Smida, A., & Khelil, N. (2010). Repenser l’échec entrepreneurial des petites entreprises émergentes Proposition d’une typologie s’appuyant sur une approche intégrative [Rethinking entrepreneurial failure of small emerging companies Proposal of a typology based on an integrative approach]. Revue internationale PME: économie et gestion de la petite et moyenne entreprise, 23, 65–106.
Taylor, M., Jenkins, S., & Sacker, A. (2011). Financial capability and psychological health. Journal of Economic Psychology, 32, 710–723.
Tversky, A., & Kahneman, D. (1981). The framing of decisions and the psychology of choice. Science, 211, 453–458. http://dx.doi.org/10.1126/science.7455683
Tversky, A., & Kahneman, D. (1986). Part 2: The behavioral foundations of economic theory. The Journal of Business, 59, S251–S278.
Tversky, A., & Kahnemann, D. (1974). Judgment under uncertainty: Heuristics and biases. Science, 185, 1124–1131.
Verstreate, T. (1996). La cartographie cognitive: Outil pour une démarche d’essence heuristique d’identification des Facteurs Clés de Succès [Cognitive mapping: A heuristic tool for gasoline process of identifying key success factors]. In Actes de la 5 ème Conférence de l’Association Internationale de Management Stratégique. Lille.
von Gaudeker, H.-M. (2011). How does household portfolio diversification vary with financial sophistication and advice? Munich: Mannheim Research Institute for the Economics of Aging.
von Neumann, J., & Morgenstern, O. (1947). Theory of games and economic behavior (2nd ed.). Princeton, NJ: Princeton University Press.
Weick, K. E. (1979). The social psychology of organizing (2nd ed.). Reading, MA: Addison Wesley.
Dow
nloa
ded
by [
Am
ari M
ouna
] at
12:
56 1
7 Ju
ly 2
015

Page 15 of 16
Mouna & Anis, Cogent Economics & Finance (2015), 3: 1057923http://dx.doi.org/10.1080/23322039.2015.1057923
Appendix 2
Appendix 1
Figure 6. Directs influences’ graph.
Figure 7. Direct dependency influence plan.
Dow
nloa
ded
by [
Am
ari M
ouna
] at
12:
56 1
7 Ju
ly 2
015
Page 16 of 16
Mouna & Anis, Cogent Economics & Finance (2015), 3: 1057923http://dx.doi.org/10.1080/23322039.2015.1057923
© 2015 The Author(s). This open access article is distributed under a Creative Commons Attribution (CC-BY) 4.0 license.You are free to: Share — copy and redistribute the material in any medium or format Adapt — remix, transform, and build upon the material for any purpose, even commercially.The licensor cannot revoke these freedoms as long as you follow the license terms.
Under the following terms:Attribution — You must give appropriate credit, provide a link to the license, and indicate if changes were made. You may do so in any reasonable manner, but not in any way that suggests the licensor endorses you or your use. No additional restrictions You may not apply legal terms or technological measures that legally restrict others from doing anything the license permits.
Cogent Economics & Finance (ISSN: 2332-2039) is published by Cogent OA, part of Taylor & Francis Group. Publishing with Cogent OA ensures:• Immediate, universal access to your article on publication• High visibility and discoverability via the Cogent OA website as well as Taylor & Francis Online• Download and citation statistics for your article• Rapid online publication• Input from, and dialog with, expert editors and editorial boards• Retention of full copyright of your article• Guaranteed legacy preservation of your article• Discounts and waivers for authors in developing regionsSubmit your manuscript to a Cogent OA journal at www.CogentOA.com
Dow
nloa
ded
by [
Am
ari M
ouna
] at
12:
56 1
7 Ju
ly 2
015
Copyright © 2022 FDOKUMEN

