


Bahasa
Halaman
Hukum


Faculty of Biotechnology
The Effect of Different Parameters on Fermentation of Neisseria
Meningitidis to Produce Polysaccharide "A" Vaccine
By:
Zaid Mohamed Wasfi Hisham El-Husseini
125457
Under supervision of:
Internal supervisor:
Dr. Ahmed M. K. Nada
Associate Prof. in MSA University
External supervisor:
Dr. Lamiaa Salah ElDin Shaker
Manager of Pilot Plant unit-VACSERA
Spring 2015

Table of Content:
Subject Page No.
Acknowledgement 7
List of figures 8
List of tables 9
List of Abbreviations 10
Abstract 14
Introduction 15
1. Historical background 15
2. Description of meningococcal disease 16
3. Neisseria meningitidis bacteria 18
4. Pathology of Neisseria meningitidis 20
5. Symptoms of meningococcal disease 21
6. Epidemiology of meningococcal disease 22

7. Diagnosis of meningococcal disease 24
7.1. Imaging 24
7.2. Lumbar puncture 24
7.3. Other laboratory tests 24
8. Transmission of meningococcal disease 28
9. Immunization of meningococcal disease 28
10. Meningococcal vaccines 30
10.1. Meningococcal Quadrivalent
Polysaccharide Vaccine 30
10.2. Quadrivalent Meningococcal
Conjugate Vaccines 31
10.2.1. MenACWY-D 31
10.2.2. MenACWY-CRM 31
10.3. Hib-MenCY-TT 32
11. Fermentation 32
11.1. Batch Cultures: 33
11.2. Continuous Cultures 33

11.3. Fed-Batch Cultures 34
12. Phases of bacterial growth 34
12.1. Lag phase 35
12.2. Log phase 35
12.3. Stationary phase 35
12.4. Death phase 36
Materials 37
1. Biological materials 37
1.1. Strain 37
1.2. Chemicals and Reagents 37
1.3. Buffers 39
1.4. Media 39
1.4.1. Preparation of solid media 39
A. GC agar base medium 39
B. Hemoglobin 40

1.4.2. preparation of liquid medium 40
A. Frantz media 40
B. Preparation of solution A 40
C. Preparation of solution B 41
D. Preparation of Yeast Extract 41
E. Preparation of the medium 41
1.5. Equipments 41
1.6. Disposable 42
Methods 44
1. Organism and growth 44
2. Seed Preparation 44
3. Inoculums Preparation 44
primary inoculum 44
secondary inoculum 45
4. Fermentation 45
A. Installation 45
A.1. Vessel Assembly 45

A.2. Impellers insertion 45
A.3. Retention rings installation 46
A.4. Sparger installation 46
A.5. Harvest tube installation 46
A.6. Thermowell insertion 46
A.7. Sampler installation 46
A.8. Head plate installation on vessel 46
A.9. pH probe installation 47
A.10. DO probe installation 47
A.11. Vessel installation 47
A.12. Probe preparation and calibration 47
1- DO probe 47
2- pH calibration 48
B. Sterilization 48
C. Vessel reinstallation 49
D. Fermentation Data Sheet 50
E. DO cascade system 51

F. Inoculation 51
G. Sampling 52
5. Harvesting 52
6. Estimation of cell mass 53
Results 54
1-Seed preparation 54
2- Inoculums preparation 55
Primary inoculums 55
Secondary inoculums 55
3-Fermentation 56
3.1. Estimation of bacterial growth 57
3.2. Estimation of pH 58
3.3. Determination of dissolved oxygen 59
3.4. Cell mass estimation 60
Discussion 61
References 66
Acknowledgement:
I would like to take the opportunity to extend my deepest appreciation to
everyone who has made this project possible. I would like to thank VACSERA and
my supervisor Dr. Lamiaa Salah El Din for her endless guidance,
I have sincerely benefited from her experience and have been truly educated
these past 3 months. I could have never completed this write up without the endless
support of my internal supervisor Prof. Dr.Ahmed Nada whose meticulous character
has enabled the completion of the dissertation.
I would like to thank the University, its owner Prof. Dr. Nawal El Degwi and
Dr. Khairy our university president. Our beloved Dean Prof. Dr. Ayman Diab and
Prof. Dr. Gehan Safwat our course coordinator who enabled the allocation into this
venue and has always organized this unique experience, Prof. Dr. Osama Saad who
has been a mentor to us all. And all the other staff members for their continuous
support and efforts they are partly responsible for the individual I am today.
Finally I would like to extend the deepest appreciation for my family specially
my father Eng.Mohammed Wasfi El-Husseini and my gorgeous mother Mrs. Rafah
Al-Rayyes who have both been my back bone and friends and in particular Mr. Alaa
Al-Nomrosi, Ms. Gihan Hammad, Ms. Nancy Karem and Ms Rama Azhari have
always been The people that keep me on the positive end especially when things have
seemed darker, I thank you all and I could not have done this without you.

List of figures:
Figure # Description Page number
Figure (1) Meningitis cases statistics 17
Figure (2) Meninges layers 17
Figure (3) Neisseria meningitidis cell
structure 19
Figure (4) The appendages and cell envelope
of Neisseria meningitidis 19
Figure (5) Illustration of the invasion of
Neisseria meningitidis 21
Figure (6) Epidemiology of Neisseria
meningitidis 22
Figure (7) Neisseria meningitis sero-groups
around the world. 23
Figure (8) Flow chart of a N. meningitidis identification
25
Figure (9) Oxidase test 27
Figure (10) Phases of bacterial growth 36
Figure (11) Gram staining of N. meningitidis 45
Figure (12) Inoculums preparation of N.
meningitidis 55
Figure (13) Optical density 57
Figure (14) pH value 58
Figure (15) Dissolved oxygen percentage 59
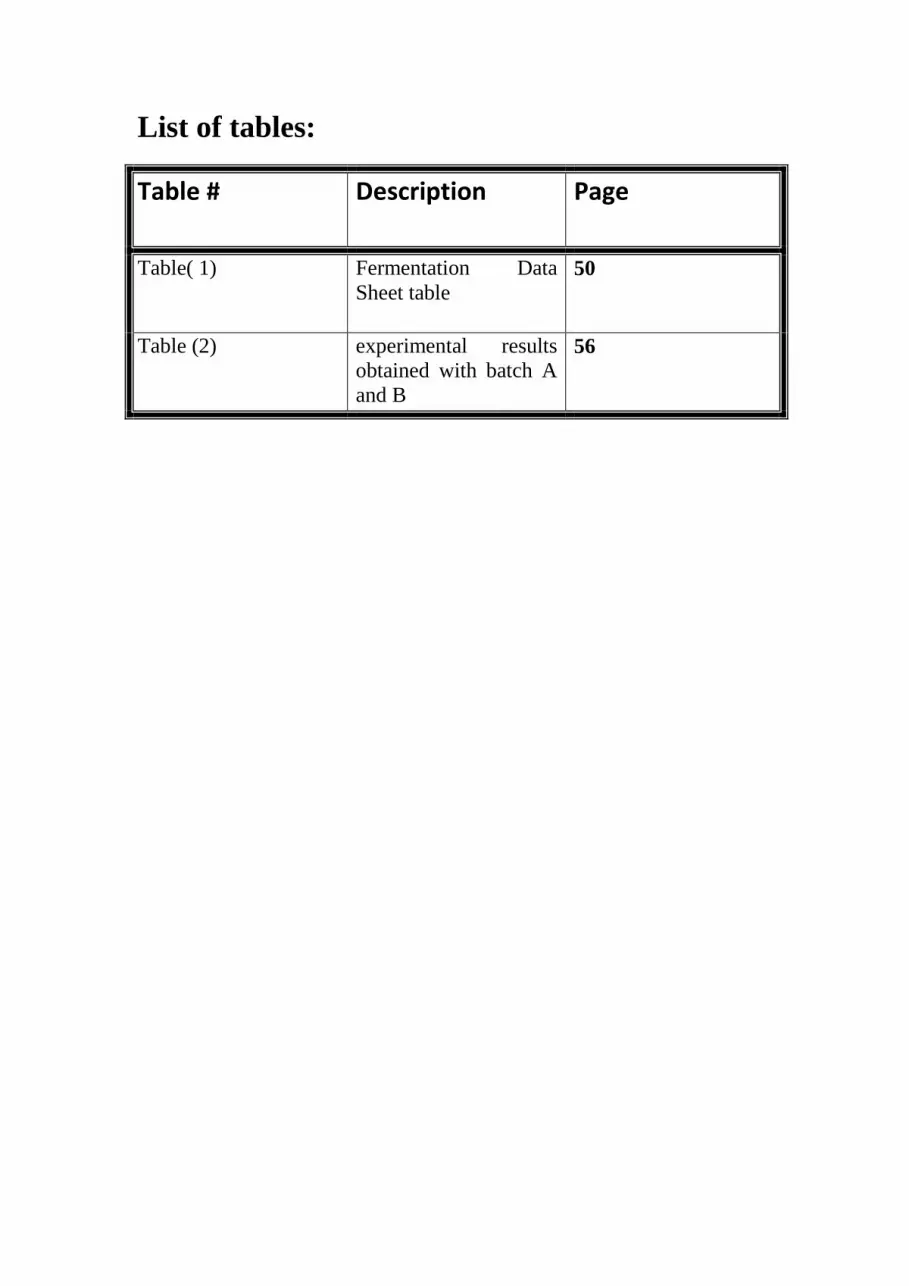
List of tables:
Table # Description Page
Table( 1) Fermentation Data
Sheet table
50
Table (2) experimental results
obtained with batch A
and B
56

List of abbreviations:
Acronym Definition
Ab Anti-bodies
BAP Blood Agar Plate
CAP Chocolate Agar Plate
CDC Centers for Disease Control
Conc. Concentration
CPS Capsular polysaccharide
CSF Cerebrospinal fluid
CT Computerized tomography
CTA Cystine Trypticase Agar
d.H2O Distilled Water
DIC Disseminated intravascular coagulation
DNA Deoxyribonucleic Acid
DO Dissolved oxygen

Acronym Definition
FDA Food and Drug Administration
g/L Gram per liter
GMT Geometric mean titres
H. influenzae Haemophilius influenzae
Hib Haemophilus influenzae type-b
IgG immunoglobulin G
IgM immunoglobulin M
Kg Kilogram
L Liter
LOS Lipooligosaccharide
LPS Lipopolysaccharide
M Molar
MC Meningococcus
MCPSA Meningococcal capsular polysaccharide sero-group A

Acronym Definition
MenACWY
CRM
Meningococcal Quadravalent ACWY sero-groups
conjugated with non-toxic mutant diphtheria
Mg Milligram
min. minutes
Ml Milliliter
MPSV4 Meningococcal Quadravalent polysaccharide vaccine
M. wt. molecular weight
Nm Nanometer
N.
meningitidis
Neisseria meningitidis
OD Optical Density
pH potential hydrogen
Rpm revolutions per minute
SASG Slide Agglutination Sero-Grouping
T cell Thymus cell
U/L Unit per liter

Acronym Definition
WFC Waterhouse-Friderichsen Syndrome
WHO World Health Organization
YE Yeast Extract
4vMenCV Quadrivalent meningococcal conjugate vaccines
µg Microgram
µl Microliter
µm Micrometer
°C degrees Celsius
% Percent

Abstract:
Meningococcal disease is rare but severe disease that causes meningitis,
septicemia or both of them, Egypt is one of the high risk regions of epidemic of this
disease which is caused by the bacteria Neisseria meningiditis that contains 13 sero-
groups. Neisseria meningitidis serogroup A constitutes the antigen for the vaccine
against meningitis disease. The goal of this work was to show the effect of some
different parameters as pH and dissolved oxygen on the growth curve and cell mass.
These kinetic parameters were carried out in two batches three litters of Frantz media
in 5 L fermentor (New Brunswick) the first batch (A) was at 36 ºC, air flow 2 L/min,
agitation frequency 200 rpm, dissolved oxygen reached to 10% and adjustment pH.
Another batch(B) was carried out under different conditions the pH not adjusted, DO
cascade system was applied maximum set points of agitation was 400 rpm, air flow
4L/min and DO was arrived to 40%. The highest cell mass (0.85 g/L) was obtained in
batch A when the pH was adjustment and DO was 10% while, another batch was low
cell mass (0.46 g/L). An empirical relation is proposed to relate the specific cell mass
rate during stationary growth phase of the batch A. pH parameter was the main factor
that affect fermentation process, even it increase airflow and agitation.
Key words:
N. meningitidis, culture medium, batch cultivation, meningococcal vaccine sero-group
A.

Introduction:
1. Historical background:
Scientists and Physicians were very curiosity about the meningococcus and
meningococcal disease for more than 100 years.
Meningococcal disease was first described by Vieusseux in 1805. After his
report by two years, an epidemic of "spotted fever" was raged through New England,
and there was a large loss that sustained in the Prussian Army from the same disease
in the same year. After the characterization of these outbreaks, the disease has become
well-known in Europe, Asia, and America. Steiner's book on military diseases during
the American Civil War was referring to several reports whose characterization very
close to meningococcal disease. However, Weichselbaum was first one described the
meningococcus in detail that was not until 1887, and Councilman In 1898 found
meningococci in 31 of 34 cases of meningitis, firmly established that this organism as
the etiological agent of epidemic cerebrospinal meningitis. (DeVoe, 1982)
Although a lot has been written about this gram-negative pathogen and an
assortment of clinical manifestations of meningococcal disease, In fact not too much
is known about the direct relationship between the biochemistry and the physiology of
the microbe, on one hand, and the pathogenesis of disease on the other hand. (DeVoe,
1982)

2. Description of meningococcal disease:
Meningococcal disease was described by Vieusseux in 1805 is rare but severe
disease that causes meningitis and septicemia or both of them, this disease is caused
by the bacteria Neisseria meningiditis that have 13 sero-groups (A, B, C, D, H, I, K,
L, W135, X, Y, Z, and 29E (Z')) the most lethal are sero-group (A,B,C,Y and W135),
taking in consideration that 5-10 % survive after being infected and from 10-30%
suffer from acute side effect like deafness, skin damaging and neurological problems
(NCIRS, 2014). Luckily this disease has various vaccines according to the type of
microorganism and the age of the recipient.
Meningitis develops fast between new born (0-4) and young people (15-24).
The disease becomes more morbidity and may lead to death, as it claim its' peak in
1980s and then declined (Cohn, 2013) as it shown in figure (1).
Meningitis is one of the common manifestations that are caused by the
meningococcal disease that form an inflammation in the layers around the brain
(meninges) shown in figure (2) and spinal cord. Meningitis can be caused by bacteria,
viruses, parasites or fungi, the virus infection is the most common one but the bacteria
is more serious. The most common bacteria that cause meningitis are Neisseria
meningiditis, Haemophilus influenza and Streptococcus pneumonia (Liorens and
George, 2013).

Figure (1): In the left side Statistics shows increase and decline of the disease in the
past 40 years showing that it reached the highest number of cases in 1980 and in the
right side another statistics show that according to age cases between 15-24 years
have the greatest percentage.
adapted from: http://www.nbcnews.com/id/7994214/ns/health-childrens_health/t/new-meningitis-
shots-urged-kids/
Figure (2): diagram showing the layers of meninges protecting the brain and
spinal cord. Meninges consist of Dura mater, Arachnoid mater and Pia mater.
Adapted from: https://embryology.med.unsw.edu.au/embryology/images/f/f3/Meninges_cartoon.jpg

Septicemia is another manifestation caused by meningococcal disease that has
other names like bacteremia or blood poisoning. if septicemia remained untreated it
can cause sepsis that leads to inflammation all over the body that can result in organ
failure and even death. The main cause of Septicemia is a bacterial infection in lung,
urinary track or abdomen that can penetrate in to the blood stream. (O'Connell, 2012)
3. Neisseria meningitidis bacteria:
Higher order taxonomy:
Bacteria>Proteobacteria>Betaproteobacteria>Neisseriales>Neisseriaceae>Neisseria.
(NCBI taxonomy)
Neisseria meningitidis is a Gram negative bacteria that is found normally in 10
to 30 percent from the population considered as carriers, commensal in the
nasopharynx within the respiratory path of healthy persons, that have a spherical
shape range from (0.6-1µm) aerobic, non-motile found in pairs, and considered the
leading cause of meningitis in children, Neisseria meningitidis strains are categorized
in to 13 sero-groups varies in there outer membrane capsule of polysaccharide and the
most invasive are sero-groups A,B,C,Y and W125 varies in there distribution around
the world (Darryl et al, 2010). Neisseria meningitides as other capsulated bacteria
contains polysaccharide capsule, cell wall, cell membrane, cytoplasm, ribosomes and
the genetic information are held on its DNA as shown in figure (3) below.

Figure (3): Neisseria meningitidis cell structure.
adapted from: https://www.pinterest.com/meningitidis/neisseria-meningitidis/
As Hill, (2010) mentioned too Neisseria meningitidis considered to be an
immunogenic difficult not just because of the variant of the polysaccharide but there
is another virulence factors like lipopolysaccharide and other proteins that assist in the
adherent of the bacteria on a surface as can be seen in figure (4).
Figure (4): The appendages and cell envelope of Neisseria meningitidis.
Adapted from: http://www.chori.org/Principal_Investigators/Moe_Gregory_R/moe_research.html

4. Pathology of Neisseria meningitidis:
Neisseria meningitidis transfer throw respiratory system and humans are the
only host of it by sneeze, coughs, kissing and nearby breathing. The infection begins
with the adhesion of the bacteria on the muscosal membrane surface in the
nasopharynx aria using its pilli as you can see in figure (5). And then they make their
own way throw until they reach the blood stream and from here they find their way to
the meninges around the brain, three characteristics make this bacteria one of the most
dangerous pathogens (Lappann., 2006).
Sero-group (A,B,C,W135 and Y) from the 13 sero-groups how have a
polysaccharide capsular coat protecting them from phagocytes, secondly the coding
genes of the pelus are very flexible making it more pathogen and finally the highly
production of endotoxin lipopolysaccharide (LPS) throw the exponential phase
(DeVoe I. 1982). The metabolism of Neisseria meningitidis based on the reduction of
iron that can be found in the human heme iron with other nutrients in the blood make
it as a growth media (Lappann., 2006).

Figure (5): An illustration of the invasion of Neisseria meningitidis inside the blood
stream.
Adapted from: http://guillaumedumenillab.weebly.com/neisseria-meningitidis.html
5. Symptoms of meningococcal disease:
The symptoms of meningitis and septicemia caused by meningococcal disease
might not be typical but in general and as Dr.Ferguson says that it begins with normal
flu symptoms with fever, rash, vomiting, tiredness, hallucination. And may develop
over few hours in to purpura (which is a purple or red spots on surface of the skin)
disseminated intravascular coagulation (DIC), coma, shudder and then death as a
result of the Fulminant meningococcemia known as water-house-friderichsen
syndrome(WFS). (Frguson, 2002)

6. Epidemiology of meningococcal disease:
Many of individuals from 10-25% of the population are holding Neisseria
meningitides in their noses and throats, but those hosts do not develop the disease
because of their immune defenses that rejects the bacteria from interring the body, and
in some cases it can overcome the defense mechanisms and develop the disease
(WHO, 2015).
Epidemic meningococcal disease can be found in all countries as seen in
figure (6), as the most category infected are children younger than 5 years, this cases
can be estimated from 1 to 3 every 100,000 annually (WHO, 2015).
Figure (6): This map shows the meningitis belt in red, the high risk regions of
epidemic in brown and in gray is all places that has a sporadic cases only (2004).
Adapted from: http://www3.chu-rouen.fr/Internet/services/sante_voyages/pathologies/meningite/

Some developing countries are showing an epidemic of meningitis frequently,
the most groups found are A,B,C,W135 and Y. and as can be seen in figure (7), sero-
group B and C are most common in Europe and the Americas , also A and W135 can
be found mostly in Africa meningitis belt and Far East (WHO, 2015).
Figure (7): The distribution of Neisseria meningitis sero-groups around the
world.
Adapted from: http://www.phac-aspc.gc.ca/publicat/ccdr-rmtc/09vol35/acs-dcc-4/gfx/figure1-eng.jpg

7. Diagnosis of meningococcal disease:
Diagnosis begins with searching for medical history and then there are some physical
exams and certain diagnostic tests. Those tests include checking some parts of the
body like head, throat and skin alongside the spine (CLINIC, 2013).
7.1. Imaging:
Taking an X-rays or computerized tomography (CT) that will show if there is an
inflammation in the brain tissue, or may help in checking the rest of the organs that is
associated with meningitis (CLINIC, 2013).
7.2. Lumbar puncture:
This test has another name as spinal tap. This test is vital because it looks in the
cerebrospinal fluid (CSF) for the level of glucose, protein and white blood cells, the
meningitis patient low glucose but an increase in protein and white blood cells
(CLINIC, 2013).
7.3. Other laboratory tests:
A laboratory tests are performed to determine the existence of Neisseria Meningitides
and the type of sero-group. Those tests are inexpensive and save time compared with
others (CDC, 2012). Those test are preformed according to the chart in figure (8).

Figure (8): Flow chart for identification and characterization of a N. meningitidis
isolate.
Adapted from: http://www.cdc.gov/meningitis/lab-manual/chpt07-id-characterization-nm.html
The first step is by culturing the bacteria in a Blood Agar Plate (BAP) or
Chocolate Agar Plate (CAP) and its ideal conditions with a temperature about 35-37oc
and 5% CO2 or placed in a candle jar. After 18-24 hours the morphology of the culture
can be observed as smooth, rounded, glistening and moist. To make sure that these
bacteria cultured are Neisseria meningitides an oxidase test is done if it is positive, a
carbohydrate utilization test is taking place, and then to know which sero-group of
bacteria is dealt with, a Slide agglutination sero-grouping (SASG) test is performed
(CDC, 2012).

Kovac's oxidase test, is a test done to detect the presence of cytochrome
oxidase. If it is present the Kovac's oxidase reagent which is tetramethyl-p-
phenylenediamine dihydrochloride will turn in to purple, this reaction happen if the
microorganism contains a cytochrome c in there respiratory chain. The problem is that
Neisseria meningitides is not the only one that gives positive reaction result but
Neisseria genus and other bacteria may give false positive. This test maybe used as
detergents or filter paper method (CDC, 2012).
If the oxidase test is positive, carbohydrate utilization (CTA) test is done to
insure that the bacteria is Neisseria meningitides. This test is performed by adding 4
different carbohydrates which are (glucose, maltose, sucrose, and lactose) into 4 tubes
containing cystine trypticase agar and phenol red as a sensitive indicator that will give
a yellow color in the presence of acid in pH less than 6.8 as can be seen in figure (9).
Neisseria meningitidis is the only one that oxidase just maltose and glucose from
Neisseria species, and that could be the key to identify it (CDC, 2012).

Figure (9): cystine trypticase agar oxidase test showing the positive of Neisseria
meningitides in tube the first and second tube that contain maltose and dextrose
(glucose).
Adapted from: http://www.cdc.gov/meningitis/lab-manual/chpt07-id-characterization-nm.html
The last test is to identify which sero-group of Neisseria meningitides by
performing (SASG) test. There are 13 sero-groups for Neisseria meningitides and
there are commercial antisera for them. But not all antisera are tested practically, just
the ones that is more likely to be within that geographic region. For example, if it was
in Africa antisera A and W135 are used. In this test using saline as a control is essential
to detect nonspecific autoagglutination (CDC, 2012).

8. Transmission of meningococcal disease:
Neisseria meningitis transmitted through respiratory droplets or throat
secretions form person to person (human), knowing that it does not infect animals.
The transmission can be done by close contact like coughing, kissing or sneezing, or
being around the infected person or the carrier such living in the same dormancy, or
being in crowded places as in some religious ritual (alHajj) (WHO, 2015).
As this bacteria (Neisseria meningitis) infects humans only, it can be found in
the throat and for not fully understood reasons it can penetrate the defenses and infect
the blood stream continuing to the brain causing inflammation on its layers. And it is
believed that from 10 to 20 percent of the population are carriers, but this rate can be
higher in the epidemic regions (WHO, 2015).
9. Immunization of meningococcal disease:
The body is exposed to many external influences like harmful radiation,
mechanical and chemical factors causing burns and wounds, other than that it is
exposed to microorganisms like bacteria, viruses and many others that can cause
diseases, the body in return uses alternative defensive mechanisms to protect himself
against those external influences (NIAID, 2003) .

Many host defense mechanisms occurring during meningococcal infection are
driven by anti-bodies (Ab), being complement activation by bacterial Ab as the most
important in terms of protection (Sanchez et al., 2002). The efficiency of anti-
meningococcal serum in the reducing mortality during the pre-antibiotic era provided
evidence supporting the importance of humeral immunity in resistance to
meningococcal disease (Flexner, 1913). Humeral immunity to N. meningitidis sero-
groups occurs between 2-12 years of age. However, there is a progressive annual
increase of approximately 5% in the proportion of children with Ab against
meningococcal sero-groups. Moreover, marked decrease in the incidence of disease
occurred at 6 to 8 years of age and more than 90% of children have Ab to sero-group
C (Goldschneider et al., 1969).
Antibody voracity has been used as an alternate marker of immunological
memory, because T cell-dependent antigens are normally change in affinity over time
after vaccination and there is rapid production of high-affinity responses after
increasing with such antigens (Borrow et al., 2002).
Children less than 2 years old and young infants are the major group that can
be infected with N. meningitidis knowing that polysaccharide vaccines are poorly
immunogenic in this group and this type of vaccines does not have the ability to
induce immunological memory that is because they stimulate the production of IgM
and IgG2 antibodies which are weak activators for complements more over they fail
induce antibody avidity maturation and isotype switching (Girard et al., 2006).
Changes in the ratio of IgG1/IgG2 after vaccination can indicate the activation
of cellular control mechanisms typical of a T cell-dependent response (Findlow et al.,
2006).

Polysaccharide vaccines have restricted effect on asymptomatic carriage and if
there is an effect on immunity in general it would not last long. Polysaccharide
vaccines can induce hypo-responsiveness such that repeated dosages of
polysaccharide vaccines do not achieve geometric mean titres (GMT) as high as those
achieved after the first dosage. That raises worries that the individuals who have been
vaccinated would not show the optimal immune response when they exposed to N.
meningitides increasing the possibility of the infection and susceptibility to disease
specially in children between 3 to 5 (Canada communicable disease report, 2007).
Immunogenicity studies can predict the short-term effectiveness as for the
long term effectiveness cannot be predictable always, and those studies do not predict
the effect of vaccination on carriage and herd immunity (Canada communicable
disease report, 2007).
10. Meningococcal vaccines:
There are two types of meningococcal vaccines either purified capsular
polysaccharide vaccines or conjugated vaccines, for each type there are deferent
vaccines with deferent age target but all of these vaccines are used for the prevention
from meningococcal disease sero-groups A, C, W and Y (CDC, 2012).
10.1. Meningococcal Quadrivalent Polysaccharide Vaccine (MPSV4):
MPSV4 is a purified polysaccharide vaccine that was licensed in 1981. This
vaccine is for sero-groups A, C, W135 and Y, and for individuals who are more than 2
years. This type of vaccine is taken as a single dose each dose consist of 50 µl for
each of the four sero-groups purified polysaccharide (CDC, 2012).

10.2. Quadrivalent Meningococcal Conjugate Vaccines (4vMenCV)
4vMenCV are type of vaccines with purified capsular polysaccharide that is
conjugated to a protein carrier contains T-lymphocyte epitopes that convert the
immune response from T-lymphocyte–independent to T-lymphocyte–dependent.
These types of conjugated vaccines have improved the immune primary response to
the antigen, mainly in children and tough immunogenic memory (CDC, 2012).
And there are two types of (4vMenCV).
10.2.1. MenACWY-D
MenACWY-D was licensed in January 2005 by FDA, this vaccine is taken as
a single dose for people between 2 and 55 years and 2 dose for infants between 9 and
23 months. This 0.5ml single dose contains 4 µg of each capsular polysaccharide from
the 4 sero-groups conjugated to nearly 48 µg of diphtheria toxoid. MenACWY-D is in
the market in single dose vessels and taken as an intramuscular injection(CDC, 2012).
10.2.2. MenACWY-CRM
MenACWY-CRM this vaccine is taken as a single dose for individuals
between 2 and 55 years. The 0.5 ml single dose consists of 10 µg of purified capsular
polysaccharide of sero-group A and 5 µg purified capsular polysaccharide of sero-
group C, Y and W that is conjugated to 33-64 µg of CRM197 which is a non-toxic
form of diphtheria toxin obtained from Corynebacterium diphtheriae. This vaccine is

prepared by reconstructing the lyophilized serogroup A conjugate with the liquid
serogroups C, W, and Y conjugate components (CDC, 2012).
10.3. Hib-MenCY-TT
Hib-MenCY-TT was licensed and approved in june 2012 by FDA. This
vacscine is taken as 4 dose series for infants between 6 weeks and 18 months. And it
is consist of a lyophilized, sterile powder reconstructed with saline diluent for
intramuscular injection. The components of 0.5 ml vaccine are 5 µg of polysaccharide
sero-group Y conjugated with 6.5 µg of tetanus toxoid, 5 µg of polysaccharide sero-
group C conjugated to 5 µg of tetanus toxoid and 2.5 µg capsular polysaccharide of
Haemophilus influenzae type b conjugated to 6.25 µg of tetanus toxoid (CDC, 2012).
11. Fermentation:
Fermentation starts under anaerobic conditions with no presence of light and
absence of electron acceptors. The bacteria goes under this situation are anaerobic or
facultative anaerobic that gain the ability to catabolize the organic compound by the
concept of oxidation-reduction reactions, by this concept the organic compound is
served as electron donor and acceptor, as the adenosine triphosphate is synthesized by
the process of phosphorylation. Taking in consideration in modern fermentation
processes aerobic conditions are taking place and maintained in a closed fermenter with
submerged cultures, the contents of the fermenter are agitated with an impeller and
aerated by forcing sterilized air (Muller, 2001).

There are three methods for fermentation according to the addition and
harvesting which are batch culture, fed-batch culture and continuous culture.
11.1. Batch Cultures:
The batch operation is about a closed system, means that the medium
components and row materials are added in the beginning of the fermentation and not
during the process, the same thing for the outcome product either it was extracellular
or intracellular it has to be harvested after the end of the process. For the parameters
which are temperature, pH and dissolved oxygen (DO), those parameters are held
constant throw the operation in the batch reactor. The only optimization parameters
are the initial medium composition. The initial medium composition has been the only
optimization parameters. While, the pH and temperature of the profile optimization
may cause an improvement in the performance over the operation that may carried out
at constant pH and temperature (Henry and Sung Shin, 2011).
11.2. Continuous Cultures
The fed in the continuous operation are continuously, in which the nutrients
can be feed more than one. On the other hand, the effluent stream removes the cells,
residuals, and products continuously. Also the steady state is done by preserving the
volumetric flow rate equally for the effluent streams and feeding. And thus at the
steady state values, nutrient concentration and volume will stay constant. Other
industries like chemical industry the continuous reactor is preferred, as the production
of certain beer, single cell protein, and waste treatment procedures. But the

continuous cultures are not commonly used as a major culture for the industries,
because of its complexity in the protection of attacking phages or mutation, and
maintaining sterile condition. Studies say that the dynamic operation has more yield
than the steady state operation, because of unknown reason (Henry and Sung Shin,
2011).
11.3. Fed-Batch Cultures
In fed batch culture or semi-batch operation the media that is necessary for the
cell growth and production is added continuously or in separated time to the culture in
two or more feed streams. But like the batch culture the product are harvested in the
end of the process as full harvest or it can be partially harvested. The fed batch culture
can be repeated a number of times if the bacteria were fully viable and can produce
more product. Sources of phosphates, nitrogen, carbon, nutrients or inducers are fed
either in continuous or discontinuous way into the culture by operating the feed
amounts during the run (Henry and Sung Shin, 2011).
12. Phases of bacterial growth:
Bacteria goes throw 4 phases which are Lag phase, exponential (Log) phase,
stationary phase and death phase, as seen in figure (10), depends on the number of
bacteria and factors that affect the growth. They're

12.1. Lag phase:
The growth of the inoculated bacteria does not occur immediately but takes a little
while, during this time the bacteria are introduced and adapted to the medium and
break down the substances in the growth medium by the enzymes that the bacteria
have synthesized. The cells in this time are very active metabolically, but the number
of cells changes very slowly.(Todar, 2008)
12.2. Log phase:
The growth rate of the bacteria steadily increases and reproduces very quickly at the
same time the bacteria introduced and adapted to the new medium. The population
doubles every generation and there is a rapid cell growth. A plot of the log number of
cells is against the time gives a linear relationship; in this phase the cells are at their
greatest activity. The cells can be maintained active by transferring cultures to the
fresh medium at regular period of time. An active culture can quickly control any new
environment easily (Todar, 2008).
12.3. Stationary phase:
After certain time of log phase, the growth rate of bacteria slow down, due to
continuously reducing the nutrients concentration, or increasing the accumulation of
toxic waste products. At the same time, the cells are dying off: A state of equilibrium
is achieved between the formation of new cells and the death of the old cells. So that
the death rate equals the rate of reproduction, resulting the cells number remain
constant. This phase is called the stationary phase (Todar, 2008).

12.4. Death phase:
After the stationary phase, the formation of new cells ceases and the culture enters a
steady state. The biomass remains constant, except when definite accumulated
chemicals in the culture lyse the cells. So that the death rate equals the rate of
reproduction, due to the limiting factors in the environment. This is called the death
phase (Todar, 2008).
Figure (10): this graph is showing a classical growth curve of bacteria with its phases,
Adapted from:
http://upload.wikimedia.org/wikipedia/commons/thumb/c/c0/Bacterial_growth_en.svg/2000px-
Bacterial_growth_en.svg.png

Materials:
1. Biological materials
1.1. Strain:
Neisseria meningitidis strain number M1027 serotype A was kindly obtained
from American Type Culture Collection number 13077 (ATCC). The strain used is
recommended by the WHO, for polysaccharide production (Branham, 1958).
1.2. Chemicals and Reagents:
Reagents and
chemicals
Company
Ammonium chloride Riedel-de Haën, M wt 53.49
Antifoam 204 Sigma
Crystal violet Sigma, M wt 408
Dextrose Difco (USA)
Ethanol 95% Panreac, M wt 46.67
GC medium Difco (USA)
Glycerine Reidel-deHaën, M wt 92.09
Hemoglobin freeze
dried
Difco (USA)

Reagents and
chemicals
Company
Hexadecyl - trimethyl-
ammonium bromide
(Cetavlon)
Sigma, USA , M wt 364.46
Iodine Panreac
IsoVitalex Becton, Dickinson and Company (BD, BBL, USA)
L- Cysteine
hydrochloride
BDH, M wt 157.62
L-Glutamic acid Sigma, M wt 147.1
Magnesium sulphate
dehydrat
Reidel-deHaën, M wt 246.47
O2 electrolyte Mettler –Toledo GmbH
Potassium chloride BDH, M wt 74.55
Potassium iodide Adwic,- M wt 166
Safranin Sigma
Sodium chloride Riedel-de Haën, M wt 58.44
Sodium hydroxide Fisher scientific company M wt 40.0
Sodium phosphate
diabasic
Riedel-de Haën M wt 177.99
Yeast extract Difco (USA)

1.3. Buffers:
Buffer solution pH 7 Sigma, (USA)
Buffer solution pH 4 Sigma, (USA)
Buffer solution pH 10 Sigma, (USA)
1.4. Media:
1. Preparation of solid media
A. GC agar base medium
7.2 g of the powder was suspended in 100 ml distilled water (d. H2O), mix thoroughly
and heated with frequent agitation then boiled for 1 min to completely dissolve the
powder. The media was sterilized by autoclaving at 121ºC for 15 min. Cooled to 45 to
50 ºC. 100 ml was added aseptically to sterile hemoglobin solution and 2ml
supplement isovitalex mix well, and poured in plates to the thickness of
approximately 4mm.the plates were allowed to be completely cooled and dried. They
were stored in plastic bags at +4ºC. A sterility test was done for the media plates by
putting a plate in the incubator overnight.

B. Hemoglobin
10 g of hemoglobin was dissolved in 1 litter of medium. The hemoglobin was
sterilized by autoclaving at 121ºC for 15 min. while it still hot, the solution was
combined with GC base medium and mix thoroughly before dispensing into
appropriate containers.
2. preparation of liquid medium
A. Frantz media
The modified Frantz medium was supplemented with yeast extract and solution B.
The medium contains neither high molecular components, nor components that will
form a precipitate upon the addition of the cationic detergent hexadecyl –trimethyl-
ammonium bromide (Cetavlon) (Frantz, 1942).
B. Preparation of solution A:
1.3 g. of L-Glutamic acid, 0.02g of L-Cysteine-HCl, 2.5g of Na2PO4.H2O, 0.09g of
KCL , 6.0g of NaCl , 1.25g of NH4Cl needed for 1L , were dissolved in the
desirable amount of d. H2O, the pH was then adjusted to 8.2 using 5N NaOH, and
completed to 1L of the d. H2O. The media was sterilized by autoclaving at 121ºC for
20 min.

C. Preparation of solution B:
0.06g of MgSO4.7 H2O and 5.0g of dextrose were dissolved in 20ml of d. H2O, the
solution was filtered by 0.2 µm membrane filter, and kept at +4°C for two days at the
maximum.
D. Preparation of Yeast Extract:
80 g of Bacto-yeast extract was dissolved in 400ml of d.H2O. It was ultrafiltered by
utrafilteration device vacuum sterilized using 0.2 µm membrane filter.
E. Preparation of the medium:
970 ml of solution A was added just prior to inoculation, 20ml of solution B, and 10
ml YE was taken place and the pH was then adjusted to 7.6 using 5N NaOH.
1.5. Equipments:
Equipment Company
Fermentors BioFlo3000 (New Brunswick scientific USA)
5 Litters
Freeze dryer Ilshin- Korea
CO2 Incubator NAPCO, USA
Stirrer Thermolyne Nuova II ,USA

Equipment Company
Centrifuge Kendro , Sorvall super T21, USA
Spectrophotometer Perkin Elmer- EZ301, USA
pH meter Jenway -3510, UK
Light Microscope CETI- Belgium
Refrigerator Kriazi (No Frost),EGYPT
Balance Sartorius - CP2245, Germany
Biological Safety
Cabinet
NUAIRE - Class II, Japan
Oven Bourdon, USA
Autoclave Consolidated, USA
Shaker incubator New Brunswick, USA
Pippet aid Jencons, UK
1.6. Disposable:
Disposable Tools Company
Disposable serological
pipette (1-5-10-25 ml)
Corning incorporated Costar
sterile pasteur pipettes LP Italiana SPA
Petri dish ISO LAB GMBH
Surgical gloves Femto Trade CO.Egypt

Disposable Tools Company
Examination gloves Grinener-Germany
Face mask Winice
Syringe (3-5-10ml) BRiMO
Screw cap (15ml) Corning incorporated Costar
Sterile tubes (50ml) Corning incorporated Costar
Syringes (1ml) Euromed
Stericup&steritop 0.2
µm (250-500ml-1L)
Millipore
Cotton Teba company
Methods:
1. Organism and growth
Neisseria meningitidis is a pathogenic organism; appropriate precaution
should be taken to minimize the potential for laboratory acquired infection. Transfer
of cultures should be done in a laminar flow hood and care should be taken to
minimize the generation of aerosols (WHO, 1976).
2. Seed Preparation:
An ampoule of lyophilized Neisseria meningitidis serotype A is reconstituted
and streaked on GC Agar. The plates were incubated overnight at 36°C in CO2
incubator (5% CO2 atmosphere), (Gotschlich et al., 1969), cell growth and purity
were checked by Gram stain and colony morphology.
3. Inoculums Preparation:
Primary inoculum
A loopful from the overnight growth was transferred to 150 ml liquid medium
and was incubated at 36°C with vigorous shaking (150 rpm) for 18 h, cell growth was
checked by measuring optical density (OD) of the culture at absorbance 650 nm and
purity checked by Gram stain.

Secondary inoculum
A 5% inoculum from this culture was added to 300ml of medium which was
incubated under the same condition for 4-6 h only. This young culture was used as the
inoculum (5% still) for cultivation in large volumes. Smears Gram-stained
(Cruicksbank et al., 1975) and cell growth was checked by measuring OD of the
culture at absorbance 650 nm and purity checked by Gram stain.
4.Fermentation
A. Installation
A.1. Vessel Assembly:
Baffle was installed insertion, the baffle was assemblied inside the glass vessel
by gently compressing the baffle ring at its ends and then sliding the assembly into the
vessels.
A.2. Impellers insertion
The impellers were slided onto the agitation drive shaft, the lower impeller
should be positioned about 1/4 inch above the bottom of the battle. The upper
impeller should be one to one- and one- half impeller diameters above the lower
impeller. The impeller was clamped down in place.

A.3. Retention rings installation
The head plate was lubricated the head plate o-ring and the lower retention ring
o-ring with a light coat of silicon grease. Clamping screw was tightening firmly.
A.4. Sparger installation
Sparger tube was inserted into the sparger port. The lock nut was finger tighten
on the sparger.
A.5. Harvest tube installation
The harvest tube was inserted and finger tighten the lock nut.
A.6. Thermowell insertion
Thermowell tube was inserted; thermocouple was inserted and connecting to
the temperature control port.
A.7. Sampler installation
Sampler was inserted assembly into the sample port.
A.8. Head plate installation on vessel
The head plate was installed on the vessel flange and was secured to the upper
retention ring. The clamping screws were tighten.

A.9. pH probe installation
pH probe was coated with glycerol. The probe was gently inserted into the
appropriate port.
A.10. DO probe installation
DO probe was coated with glycerol and was inserted gently into its adaptor.
A.11. Vessel installation
Motor assembly installation, the motor assembly was positioned on top of the
bearing housing. Motor cable was connected to its place. All cables were connected
from all probes to their respective sockets on the face of the console. The exhaust
condenser was connected to the exhaust filter using flexible tubing to the top of the
condenser, and was secured with tubing ties. The water lines were connected to the
heat exchanger in the vessel base and to the exhaust condenser using the quick
connects.
A.12. Probe preparation and calibration
1- DO probe
Set to zero: The DO cable was removed from the DO electrode. The DO
function was set to zero. The DO cable was reconnected to the DO electrode. Set the
span: The DO function was set to span. The display was set to read 100 by setting the
DO span column to 100.

2- pH calibration
pH probe was connected with cable. The pH probe was calibrated using two
external buffer solution of known pH usually 7.00 and 4.00. The pH calibration was
checked after autoclaving, immediately prior to inoculation. Sample was taken from
the vessel and was compared by an external pH meter.
B. Sterilization:
The motor was removed from the top of the vessel and was placed it on the
motor mount at the top of the console. The air line was disconnected from the inlet
filter. All probes were disconnected and the probe cables were removed, the sampler
rubber bulb was removed, cotton was inserted into sampler port, and sampler valve
was closed. Just before placing the vessel into the autoclave, the glass sample bottle
was loosen by 1/2 turn. The media for fed batch fermentation was inserted into the
vessel. The entire vessel assembly (consisting of glass jar, headplate and headplate
components) was inserted into an autoclave and sterilized for 25 min at 121°C.
During autoclaving, the glass vessel was vented at all times, electrolyte in pH probe
was not allowed to boil.

C. Vessel reinstallation
Vessel was returned to console, water lines to the heat exchanger and the
exhaust was connected. The motor was placed on the bearing house, on top of the
vessel assembly. DO and pH short cap were removed, pH cable and DO were
connected. Liquid addition system was installed a sterile (0.2 µm) filter in one of the
two penetration on the addition bottle cap was aseptically installed. The harvest tube
was connected aseptically land threaded the tubing through the desired peristaltic feed
pump. The tubing was connected and securing it with a plastic tie to the appropriate
addition port on the head plate clamp was removed. Temperature probe was installed,
glycerin was added to the thermowell and temperature probe was inserted, and
temperature cable was connected.

D- Fermentation Data Sheet table:
Item Culture A Culture B
Seed Volume 200 ml 200 ml
Agitation 200 rpm 200-400 rpm
Temperature 36◦C 36◦C
Air Flow 2 L /min 2 L /min
Dissolved Oxygen
(DO)
Air saturation by
automatic adjustment
of the impeller speed
and air flow.
Air saturation by
automatic adjustment
of range impeller
speed from 200-400
rpm.
pH 7.6 was adjusted by
using 5 N NaOH
Not adjusted
Antifoam 0.5 ml/l was added of
antifoam.
0.5 ml/l was added of
antifoam.
Duration 18 h 18 h
DO/Air Cascade No cascade Cascade with air flow
range 2-3 l/h

E- DO cascade system
Cascading brings several systems together to work jointly to achieve goal.
Cascade was designed to control DO through controlled agitation speed and oxygen
output. When the actual DO value rises above the DO set point the agitation speed
will automatically decrease until DO set point is reached. Conversely, when the actual
DO value drops below the set points, the cascade system acts to bring it back up. If
DO value rises above the set point, agitation and airflow rate will remain at their
minimum value. If DO drops below the set point, first agitation speed will gradually
increase to its maximum set point, then airflow rate will gradually increase to its
maximum set point.
F- Inoculation
The plug was removed from the inoculation port. The inoculum was removed
aseptically from its flask with the inoculation syringe. The inoculum was injected
through the septum in the inoculation port. The plug was reinstalled in the port.
When the whole lot of the liquid media is ready about three L for each
fermentors), i.e, solution A supplemented with solution B and YE and the pH adjusted
to 7.6 and add a 5% inoculum (purity testing of the inoculum is examined by gram
stain). The growth of the cultures takes place at 36°C with shaking incubator 200 rpm
for fermentor 1 and 400 for fermentor 2 for 18 hrs.

G- Sampling
The sample bottle was checked to be slightly loose, not tight against
the gasket. The valve on the sampler tube was closed. The bulb was
squeezed and holding it compressed, the sample bottle was tightened
against the gasket. The valve was opened and the rubber bulb was let go
gradually to obtain the desired sample volume. When the desire volume
was obtained, the valve was closed. The sample bottle was unscrewed
from the sampler, the cap was taken from a new bottle and placed on the
sampler-filled bottle. The new bottle was installed in the sampler and
made sure that the sample bottle was sealed firmly against the sampler
gasket and sampling intervals was 2 h.
5. Harvesting
The culture had been harvested from late stationary phase culture grown for 18
h at 36°C, The culture was harvested after killing the organism by heating to 56 °C for
30 min. The cultures are harvested after purity testing of the inoculum is examined by
gram stain) from each container of two fermentors and centrifuged at 3000 for 45
minutes for clarification. The supernatant is collected. The cells, on the other hand,
are pooled and kept frozen (Gotschlich et al., 1969).

6. Estimation of cell mass:
Cell concentration was expressed as dry biomass weight per liter (g/l) after
centrifugation of 3 L culture, followed by pellet drying at 60 °C for 48 h (Barugue-
Ramos et al., 2005)
Results:
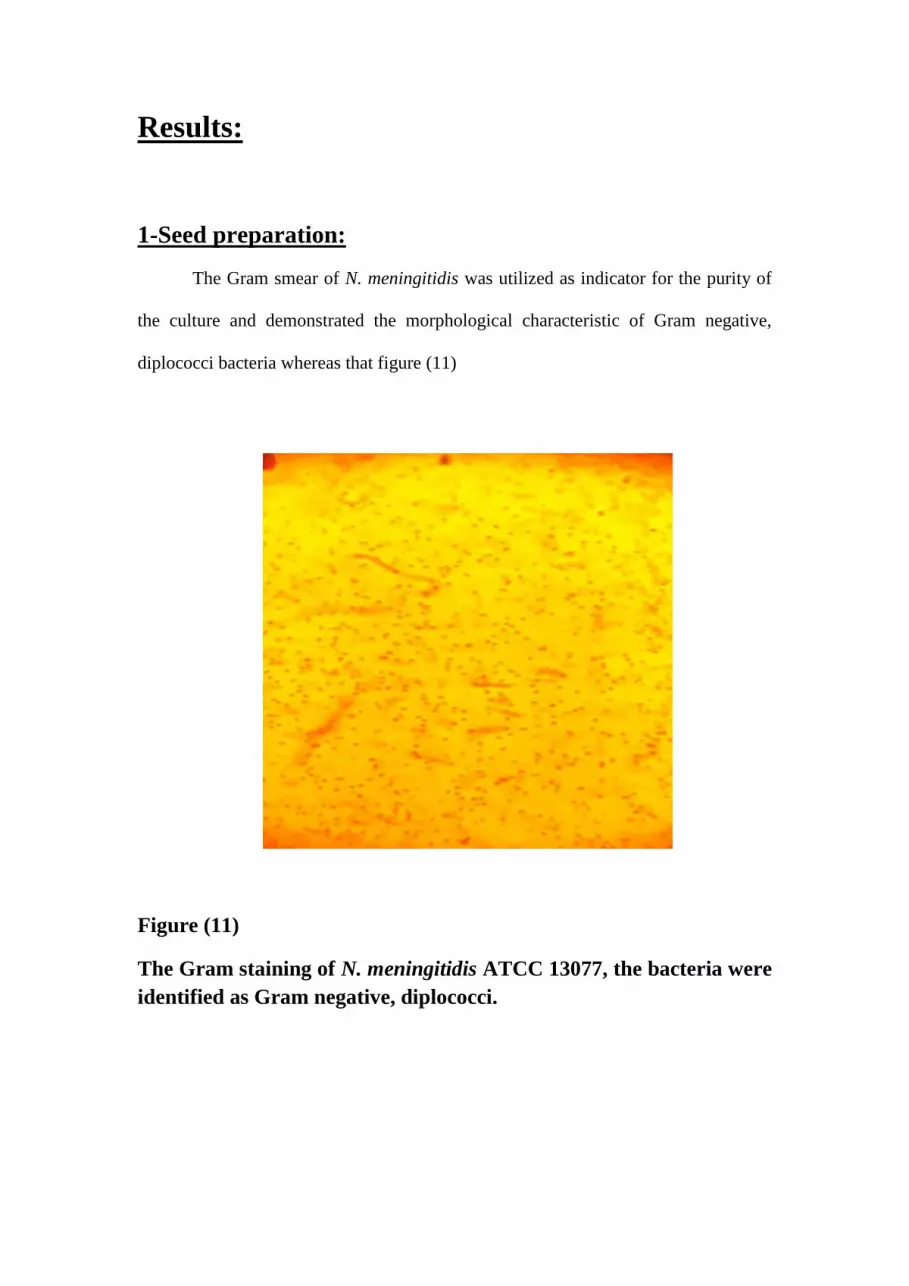
1-Seed preparation:
The Gram smear of N. meningitidis was utilized as indicator for the purity of
the culture and demonstrated the morphological characteristic of Gram negative,
diplococci bacteria whereas that figure (11)
Figure (11)
The Gram staining of N. meningitidis ATCC 13077, the bacteria were
identified as Gram negative, diplococci.

2- Inoculums preparation:
Primary inoculums
Three 250 ml flasks of primary inoculums were examined by Gram stain and
optical density. The highest optical density was 1.038 and pH was 6, this culture was
chosen for secondary inoculums and showed identical Gram negative diplococci.
Secondary inoculums
Three 500 ml flasks of secondary inoculums were examined by Gram stain
and optical density. The highest optical density was 0.9 and pH was 6.4, smear of
culture showed pure identical Gram negative diplococcic as shown in figure (12), this
culture was taken for seed two batches fermentation with different parameters.
Figure (12)
Inoculums preparation Gram negative diplococcic of N. meningitidis .

3-Fermentation:
Two batches of N. meningitidis were cultivated in BioFlo 3000 fermentor
sterilized and calibrated, fermentation of 3 L culture and 200 ml of bacterial seed at
36 ºC for 18 h, the summary of results obtained were described in table below.
Summary of experimental results obtained with batch A and B table
Culture
duration
(h)
Agitation pH Dissolved
oxygen
Temp Dry cell
mass
g/L
Supernatant
of culture
Batch
A
18 h 200 rpm 7.6 10% 36 ºC 0.85 g/L 2720 ml
Batch
B
18 h 400 rpm 5.4 40% 36 ºC 0.46 g/L 2800 ml
Batch A pH was adjusted using 24 ml N NaOH, agitation was fixed at 200
rpm, air flow was about 2 L/min at all culture time, dissolved oxygen was measured
automatically decreased by time and reached to min/ value 10%. Batch B pH was not
adjusted, agitation/ oxygen/ DO cascade system was applied maximum set points of
agitation was 400 rpm, air flow 4 L/min was arrived after 12 h . DO was at fix point
40%.

3.1. Estimation of bacterial growth:
Comparison of bacterial growth for batch A and B were estimated, 5 ml
samples were taken every two hours and measure optical density using
spectrophotometer at 650 nm, growth curve was drawn using optical density versus
time. Batch A showed higher optical density than batch B shown in figure (13).
Figure (13):
Growth curve comparison of N. meningitidis fermentation for Batch
A and B.
0
0.2
0.4
0.6
0.8
1
1.2
1.4
0 2 4 6 8 10 12 14 16 18 20 22
Op
tica
l De
nis
ty
Time/h
Batch A Batch B

3.2. Estimation of pH
pH value of batch A and B were estimated automatically and the curve for
comparison between two batches were drawn. Batch A was linear adjusted pH while
batch B, pH was decreased graduating by time will reached finally to 5.4 as shown in
figure (14).
Figure (14)
The effect of pH on the growth of N. meningitidis showing the growth
occurred from pH 7.6 to 5.4 during the exponential growth.
4
4.5
5
5.5
6
6.5
7
7.5
8
0 2 4 6 8 10 12 14 16 18 20 22
pH
val
ue
Time/ h
Batch A Batch B

3.3. Determination of dissolved oxygen:
Dissolved oxygen was determined automatically during culture, a curve
compared between batch A and batch B was drawn. Batch B was higher DO than
batch A as agitation /O₂/ DO cascade increase final DO to 40% as shown in figure
(15).
Figure (15)
The effect of agitation/ O₂/ DO cascade on DO% during and at the
end of batch A and B.
0
20
40
60
80
100
120
0 2 4 6 8 10 12 14 16 18 20 22
Dis
solv
ed
Oxy
gen
Pe
rce
nta
ge
Time/ h
Batch A Batch B
3.4. Cell mass estimation:
After 18h fermentation, the culture were harvested and centrifuged and pellets
of culture A and B were dried at 60 ºC for 48 h and dry cell mass of culture A was
0.85 g/L, supernatant of culture was 2720 ml, while cell mass of culture B was 0.46
g/L and supernatant was 2800 ml.

Discussion:
Meningococcal disease is rare but severe disease that causes meningitis,
septicemia or both of them, Egypt is one of the high risk regions of epidemic of this
disease which is caused by the bacteria Neisseria meningiditis that contains 13 sero-
groups. Neisseria meningitidis sero-group A constitutes the antigen for the vaccine
against meningitis disease. The goal of this work was to show the effect of some
different parameters as pH and dissolved oxygen on the growth curve and cell mass.
These kinetic parameters were carried out in two batches three litters of Frantz media
in 5 L fermentor (New Brunswick) the first batch (A) was at 36 ºC, air flow 2 L/min,
agitation frequency 200 rpm, dissolved oxygen reached to 10% and adjustment pH.
Another batch(B) was carried out under different conditions the pH not adjusted, DO
cascade system was applied maximum set points of agitation was 400 rpm, air flow
4L/min and DO was arrived to 40%. The highest cell mass (0.85 g/L) was obtained in
batch A when the pH was adjustment and DO was 10% while, another batch was low
cell mass (0.46 g/L). An empirical relation is proposed to relate the specific cell mass
rate during stationary growth phase of the batch A. pH parameter was the main factor
that affect fermentation process, even it increase airflow and agitation.
Many trials and experiments of extracting the polysaccharide capsule from the
bacteria Neisseria meningitidis are done all over the world in research labs to produce
an efficient and effective vaccine for meningitis disease, these experiments are
searching for the best way to get the heist yield of bacterial culture, further more they
are testing the effects of different parameters as pH, temperature, agitation and
dissolved oxygen, and nitrogen and glucose source found in the medium.
In the present study, we have the inoculum of N. meningitidis was prepared
according to Gotschlich (Gotschlich, 1969). The strain was streaked out on GC
medium and incubated at 36°C for 18- 20 h in a candle jar (5-10 % CO2). The cells
from each plate were resuspended in the liquid Frantz medium and then transferred to
conical flasks, each containing 100 ml of Frantz medium and incubated at 36 °C on a
rotary shaker 150 rpm. Microscopic examinations were carried out using the Gram
technique. These results were agreement with (Baruque, 2005) and (WHO, 1976).
In 2003 da-Paz did an experiment which is culturing Neisseria meningitides
sero-group C for the production of polysaccharide. This experiment was done by
using three different cultivation media and those are Frantz, modified Frantz and
Cartlin 6. Starting with the Frantz media which is the same media used in the present
study but in different concentration of compounds as L-Glutamic acid 1.6 g\L and
1.23 MgSO4.7H2O and in this experiment media the concentration for L-Glutamic
acid 1.3 g\L and 0.06 for MgSO4.7H2O, other components as L-Cystine-HCl, KCl,
NaCl, NH4Cl and glucose where the same as 0.02 g\L, 0.09 g\L, 6.0 g\L, 1.25 g\L and
5.0 g\L. in this culturing media Paz used deferent parameters than parameters used in
this study like temperature 35ºC while it was 36ºC in this study for both batch A and
B, agitation was 120 rpm unlike both of the present study batches (200-400 rpm), air
flow of 5 L\min while it was 2 L\min in both batches and the pH was not adjusted and
reached 5 as in batch B, adding that Paz used 80 L Brunswick bioreactor with 42 L of
culture media while in this study the bioreactors used were two 5 L Brunswick
fermentors with 3 L of culture media. These differences resulted that the dry biomass
produced was 1.11 g\L after 18 h which is higher than the present experiment results
0.85 g\L in batch A and 0.46 g\L in batch B (da-Paz, 2003).

In the same experiment, Paz used modified Frantz media with different
compounds as glycerol instead of glucose as a carbon source in the same
concentration 5.0 g\L and different concentration of compounds as L-Glutamic acid
1.6 g\L and 1.23 MgSO4.7H2O while in the current experiment the concentration L-
Glutamic acid 1.3 g\L and 0.06 for MgSO4.7H2O and with the same other compounds
concentrations L-Cystine-HCl, KCl, NaCl and NH4Cl 0.02 g\L, 0.09 g\L, 6.0 g\L and
1.25 g\L, with almost the same parameters as the first one; temperature which is 35ºC,
air flow 5 L\min and agitation 120 rpm, but the pH were adjusted at 7.5, and the result
of dry biomass which is 1.2 was higher than the current result. The last media Paz
used that is Cartlin 6 which was different than this study media (Frantz media), the
carbon scores of this media was glucose with a concentration of 10.0 g\L with 0.04
g\L Fe(III).Citrate with no MgSO4.7H2O nor KCl instead of that K2HPO4 and K2SO4
were added in a concentration of 4.0 g\L and 1.0 g\L, more than that a variations in
the concentration of L-Glutamic acid, L-Cystine-HCl ,NaCl and NH4Cl as 3.9 g\L, 0.1
g\L, 5.8 g\L and 1.0 g\L, as for the parameters the same temperature was used as the
two experiments before (35ºC) with the same agitation (120 rpm) and the same air
flow (5 L\min), the pH was not adjusted and the result was higher than all of them
which is 1.4 g\L. Pazs results demonstrate higher efficiency than the present study
because these experiments were handled in a large scale bioreactor and more than one
experiment on the same media taking the average of it, which gave an advantage in
the results, and in the Cartlin 6 media where the highest result observed, there were
many alterations but the most significant one was adding 10 g\L of glucose with 0.04
g\L Fe(III).Citrate (da-Paz, 2003).

Another experiment done by Henriques studding the process of capsular
polysaccharide production by Neisseria meningitidis sero-group C, the medium used
for cultivation was Frantz medium composed of 6.0 g/L of NaCl, 2.5 g/L of Na2HPO4,
1.25 g/L of NH4Cl, 0.09 g/L of KCl, 2.0 g/L of yeast extract and 5.0 g/L of glucose
the same concentration were used in this current experiment, but there is some
variances in L-Glutamic acid 1.6 g/L as the concentration used in the experiment was
1.3 g/L , MgSO4.7H2O and L-cysteine hydrochloride concentration are also different
0.02 g/L, 0.12 g/L while in the current experiment were 0.06 g\L and 0.02 g\L. some
of the parameters Henriques used for the bioreactor were also dissimilar to the current
experiment like 37ºC temperature, 7 pH, 0.8 L\min airflow and agitation of 130 rpm
while in the current experiment the parameters used in the fermentor 36ºC
temperature,7.6 pH in batch A and not adjusted pH in batch B, 2 L/min airflow and
200 rpm agitation in batch A and 200-400 agitation in batch B. adding that the
experiment was run in 1.0 L glass-vessel bioreactors (BIOSTAT Q,B. Braun Biotech
International Diessel GmbH,Germany) with 0.5 L of culture media. That result a dry
biomass of 0.84 g/L which is lower than the current experiment that is 0.85 g/L in
batch A, that different is insignificant but higher than batch B that is 0.46 g/L
(Henriques, 2005).
Baruque did an experiment in 2001 which aim to detect the nitrogen
consumption of Neisseria meningitidis sero-group C, in this experiment Baruque used
Frantz media which contains the same components as the Frantz media used in this
current research used but in different concentrations like 1.6 g/L L-Glutamic acid,
4.67 g/L Na2PO4 and 1.23 g/L MgSO4 while in the current experiment the
concentration of L-Glutamic acid was 1.3 g/L, Na2PO4 2.5 g/L and MgSO4 0.06.
However, there are some concentrations that match the concentrations used in the

recent experiment like 0.02 g/L of L-Cysteine-HCl, 0.09 g\L of KCL, 6.0 g\L of
NaCl, 1.25 g\L of NH4Cl and 5.0 g\L of glucose. After that the pH was corrected to
7.4 while in this experiment it was adjusted to 8.2 with 5N NaOH. In the parameters
Baruque used for the bioreactor - 35 ºC temperature, 120 rpm agitation, 5L\min
airflow and not adjusted pH starting with 7.4 – where completely different than the
parameters used for the current experiment which was 200 rpm agitation, 36 º C
temperature, 5 L/min airflow and 7.6 adjusted pH in batch A and not adjusted pH in
batch B starting with 7.6. other than that, the bioreactor Baruque used was New
Brunswick model MPP 80 that has a total capacity of 80 L and media volume used
was 40 L unlike the bioreactor used in the current experiment which is New
Brunswick BioFlo3000 with 10,5 capacity and 3 L of Frantz media (Baruque, 2001).
The result of Baruque was higher than the result achieved in the present
experiment, as Baruque produced 1.15 g/L dry cell mass after 18 hour with a
significant different than the current experiment obtained in batch B which was 0.46
g/L and last result was poorer might be due to the agitation used which was 200-400
rpm comparing to the agitation used by Baruque 120 rpm, noticing that Baruque used
a much larger bioreactor that help in the cultivation of bacteria. Comparing Baroques'
result with batch A the results was very close as batch A biomass result .85 and
Baruque has a result of 1.1 despite the differences in the culture media with was in
batch A 3L while Baruque was 40L. (Baruque, 2001).

References:
Barugue-Ramos J., Hiss H., Arauz L., Mota R., Ricci-silva M., da Paz M.,
Tanizaki M., Raw I. (2005). Polysaccharise production of Neisseria
menengitidis (Serogroup C) in batch and fed batch cultivations. Biochemical
engeneering Journal. 23:231-241.
Baruque R.; Hiss J.; Haroldo; Vicentin; Alberto M.; da Paz M.; Argélia P.;
Batista M.;, Akio R, Macedo U. & Isaías R. (2005). Nitrogen consumption
during batch cultivation of Neisseria meningitidis (serogroup C) in Frantz
medium. Brazilian Journal of Microbiology, 32(4), 305-310. Retrieved May
19, 2015
Borrow, R.; Goldblatt, D.; Andrews, N.; Southern, J.; Ashton, L.; Deane, S.;
Morris, R.; Cartwright, K. and Miller, E. (2002): Antibody persistence and
immunological memory at age 4 years after meningococcal group c conjugate
vaccination in children in the United Kingdom. J Infect. Dis. 186: 1353-1357.
Branham, E.S. (1958). Reference strains or the serologic groups of meningococcus
(Neisseria meningitidis). Int. Bull Bacteriol. Nomencl. Taxon. 8:1-15.
Canada Communicable Disease Report (2007): Statement on conjugate
meningococcal vaccine for serogroups A, C, Y and W135.Volume 33,
Advisory Committee Statement (ACS)-3

CDC, (2012). Laboratory Methods for the Diagnosis of Meningitis from https://www.
eg/url?sa=t&rct=j&q=&esrc=s&source=web&cd=1&ved=0CCEQFjAA&url=
http%3A%2F%2Fwww.cdc.gov%2Fmeningitis%2Flabmanual%2F&ei=ysJfV
Y9Jz9btBvyrgtgC&usg=AFQjCNHgjGZHbD6ZoCJWr6xj1VLNZ5651w&sig
2=F15mdpoBU_Wmpi_D0dklZg&bvm=bv.93990622,d.ZGU&cad=rja
Cohn A.; MacNeil J.; Clark T.; Ismael R.; Sanchez O.; Briere E; Meissner H.;
Baker C. and Messonnier N. (2013). Prevention and Control of
Meningococcal Disease, Advisory Committee on Immunization Practices
ACIP. 62 (2).
CLINIC, (2013). Diseases and Conditions Meningitis, Diagnosis from
http://www.mayoclinic.org/diseases-
conditions/meningitis/basics/diagnosis/con-20019713
Cruicksbanket R.; Duguid J.; Marmion B. and Swain R. (1975). Stainning
method, tests or identification of bacteria. In the practice of medical
microbiology, Cruicksbank R.; Duguid J.; Marmion B. and Swain R. (eds).
Twelveth edition. Volume 2, Churchill living stone, Edinburg, London, new
York, pp 31-157, 170-189 and 444-448.
Da-Paz M.; Baruque-Ramos, Júlia, Hiss, Haroldo, Vicentin, Márcio Alberto,
Leal, Maria Betania Batista, & Raw, Isaías. (2003). Polysaccharide
production in batch process of Neisseria meningitidis serogroup C comparing
Frantz, modified Frantz and Cartlin 6 cultivation media. Brazilian Journal of
Microbiology, 34(1), 27-32. Retrieved May 17, 2015.

DeVoe, I. W. (1982). The meningococcus and mechanisms of pathogenicity.
Microbiological Reviews, 46(2), 162–190.
Findlowet, H.; Southrn, J.; Maby, L.; Balmer, P.; Heydermn, R.; Auckland, C.;
Morris, R.; Miller, E. and Borrow, R. (2006): Immunoglobulin G subclass
response to a meningococcal quadrivalent polysaccharide-diphtheria toxoid
conjugate vaccine. Clin Vaccine Immunol.13: 507-10.
Franntz, I. (1942). Growth requirements of the meningococcus. J. Bacteriol. 73:757-
761.
Frguson L.; Hormann M.; Parks D. and Robert J. (2002). Neisseria meningitidis:
Presentation, Treatment, and Prevention. Yetman Pediatr Health Care PHC,
16, 119-124.
Girard, M.; Preziosi, M.; Aguado, M. and Kieny, M. (2006):A review of vaccine
research and development: meningococcal disease.Vaccine 24: 4692-700.
Goldschneider I.; Gotschlich E. and Artenstein, M. (1969): Human immunity to
the meningococcus. II. The development of natural immunity. J. Exp. Med.,
129: 1367-1384.
Gotschlich E.; Liu T. and Artenstein M. (1969). Human immunity to the
meningococcus. III. Preparation and immunochemical properties of the group
A , group B and group C meningococcal polysaccharides. J. Exp. Med.
129:1349-1365.
Henry C. Lim and Hwa Sung Shin. (2011). Fed-Batch Cultures: Principles and
Applications of Semi-Batch Bioreactors, Cambridge University Press

Henriques E.; Jessouroun E.; Lima L. and Alves T. (2005). Mathematical
modeling of capsular polysaccharide production by Neisseria meningitidis
serogroup C in bioreactors. Brazilian Journal of Chemical Engineering. 22(4):
585 – 592.
Hill D.; Griffiths N.; Borodina E.; and Virji M. (2010). Cellular and molecular
biology of Neisseria meningitidis colonization and invasive disease.118 (9):
547–564. Feb 9. doi: 10.1042/CS20090513
Lappann B.; Marin K.; Janus A.; Haagensen J; Claus H.; Vogel U and Molin S.
(2006) .Meningococcal biofilm formation: structure, development, and
phenotypes in a standardized continuous flow system” Molecular
Microbiology. 62 (5) 1292-1298.
Muller V. (2001). Bacterial Fermentation. ENCYCLOPEDIA OF LIFE SCIENCES
Nature Publishing Group.
NCIRS. (2014). Meningococcal disease: Meningococcal vaccines for Australians.
NIAID, (2003). Understanding the Immune System How It Works
O'Connell K. (2012). Septicemia. Reviewed by George Krucik. Health line.
Liorens S.; George H. (2013) .Bacterial meningitis in children, The lancet , 361(2) .
2139-2140.
Darryl, S.; Troncoso, G.; Criado, M.and Ferreirós, C. (2010): In vitro induction of
memory-driven responses against Neisseria meningitidis by priming with
Neisseria lactamica. Vaccine 20: 2957-2963.

Todar K. (2008). The growth of bacterial population. Todar's online textbook of
bacteriology. from http://www.textbookofbacteriology.net/growth_3.html.
WHO, (1976). Technical report WHO expert committi on biological standardization,
twenty seventh report. Series No. 594.
WHO, (2015) Meningitis Vaccine Project, Meningococcal disease (Neisseria
meningitidis)
Top Related
Copyright © 2022 FDOKUMEN

