


Bahasa
Halaman
Hukum


i
The design, development and application
of novel, screen-printed amperometric
glutamate biosensors
Gareth Hughes BSc (Hons)
A thesis submitted in part fulfilment of the requirements of the University of the West
of England, for the degree of Doctor of Philosophy
Faculty of Health and Applied Sciences
University of the West of England, Bristol
September 2015

Abstract
ii
Abstract
The aim of the studies presented in this thesis was to develop a screen-printed
electrochemical biosensor for the measurement of glutamate and to apply this device to the
determination of the analyte in food, serum and toxicity studies.
Chapter 1 serves as an introduction to both the physiological significance of glutamate and
the fundamental principles underpinning the electrochemical techniques used throughout
this thesis.
Chapter 2 is a review chapter, separated into two main sections. The first section details
glutamate biosensors fabricated with glutamate oxidase (GluOx), the second section details
biosensors fabricated with glutamate dehydrogenase (GLDH). The immobilization
techniques, ease of fabrication and sample preparation techniques employed are compared.
Biosensor characteristics such as sensitivity, limit of detection and linear range are
summarised within a table.
The studies described in Chapter 3 focus on the development of a non-reagentless glutamate
biosensor. A Meldola’s Blue screen-printed carbon electrode (MB-SPCE) was employed as
the base transducer. The biosensor was constructed by drop coating the biopolymer chitosan
(CHIT) and GLDH onto the surface of the MB-SPCE. For this study, NAD+ was present in
free solution. Meldola’s Blue served as the electrocatalyst, whereby NADH produced by the
GLDH/NAD+ reaction, was electrocatalytically oxidised at a low operating potential (+0.1V
(vs. Ag/AgCl)). The applied potential, temperature, pH and concentration of the co-factors
required for the biosensor operation were optimised in this study. The assay exhibited a
linear range of 12.5 µM to 150 µM, limit of detection of 1.5 µM, response time of 2s and a
sensitivity of 0.44 nA/ µM. The optimised biosensor was subsequently applied to the
determination of endogenous and fortified concentrations of glutamate in both serum and
food samples (OXO cubes). The serum was fortified with and the resulting mean recovery
Abstract
iii
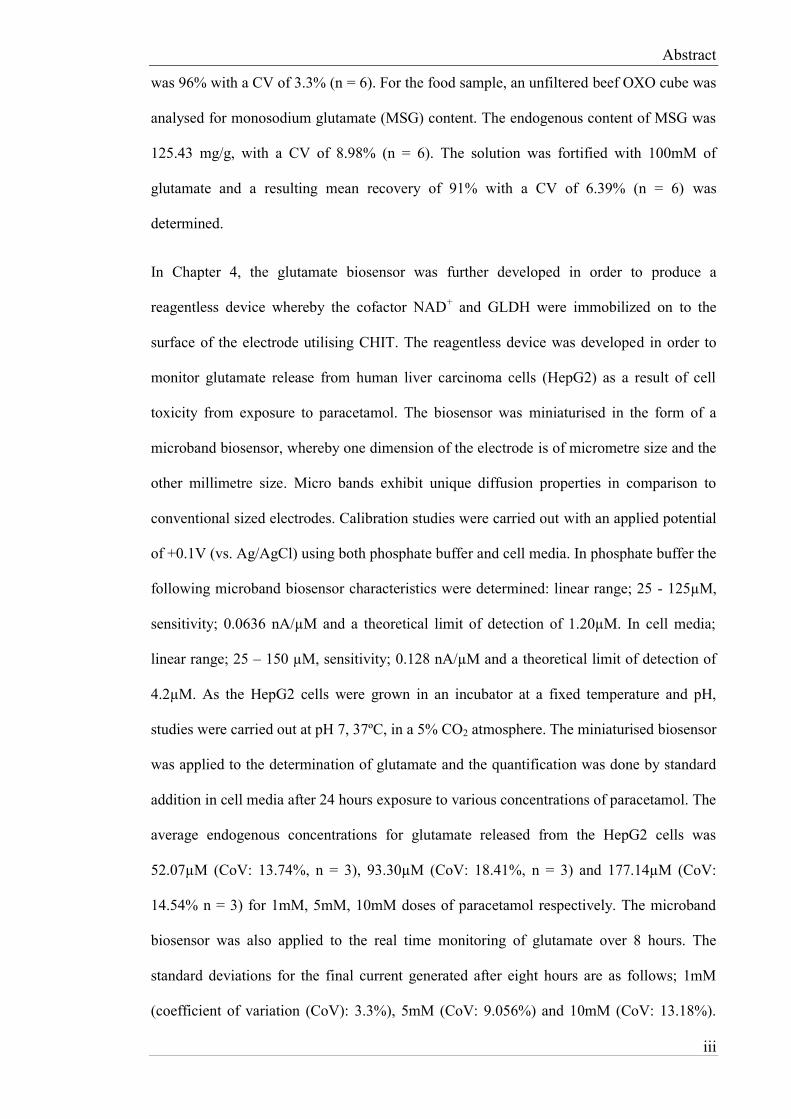
was 96% with a CV of 3.3% (n = 6). For the food sample, an unfiltered beef OXO cube was
analysed for monosodium glutamate (MSG) content. The endogenous content of MSG was
125.43 mg/g, with a CV of 8.98% (n = 6). The solution was fortified with 100mM of
glutamate and a resulting mean recovery of 91% with a CV of 6.39% (n = 6) was
determined.
In Chapter 4, the glutamate biosensor was further developed in order to produce a
reagentless device whereby the cofactor NAD+ and GLDH were immobilized on to the
surface of the electrode utilising CHIT. The reagentless device was developed in order to
monitor glutamate release from human liver carcinoma cells (HepG2) as a result of cell
toxicity from exposure to paracetamol. The biosensor was miniaturised in the form of a
microband biosensor, whereby one dimension of the electrode is of micrometre size and the
other millimetre size. Micro bands exhibit unique diffusion properties in comparison to
conventional sized electrodes. Calibration studies were carried out with an applied potential
of +0.1V (vs. Ag/AgCl) using both phosphate buffer and cell media. In phosphate buffer the
following microband biosensor characteristics were determined: linear range; 25 - 125µM,
sensitivity; 0.0636 nA/µM and a theoretical limit of detection of 1.20µM. In cell media;
linear range; 25 – 150 µM, sensitivity; 0.128 nA/µM and a theoretical limit of detection of
4.2µM. As the HepG2 cells were grown in an incubator at a fixed temperature and pH,
studies were carried out at pH 7, 37ºC, in a 5% CO2 atmosphere. The miniaturised biosensor
was applied to the determination of glutamate and the quantification was done by standard
addition in cell media after 24 hours exposure to various concentrations of paracetamol. The
average endogenous concentrations for glutamate released from the HepG2 cells was
52.07µM (CoV: 13.74%, n = 3), 93.30µM (CoV: 18.41%, n = 3) and 177.14µM (CoV:
14.54% n = 3) for 1mM, 5mM, 10mM doses of paracetamol respectively. The microband
biosensor was also applied to the real time monitoring of glutamate over 8 hours. The
standard deviations for the final current generated after eight hours are as follows; 1mM
(coefficient of variation (CoV): 3.3%), 5mM (CoV: 9.056%) and 10mM (CoV: 13.18%).

Abstract
iv
The study showed that the magnitudes of the steady state currents increased in proportion to
the concentration of added paracetamol. The study also demonstrated the possibility of
applying microband biosensors, over extended time periods, for toxicity studies; there is no
significant removal of analyte owning to the small biosensor dimensions.
Chapter 5 describes the development of a reagentless conventional sized glutamate
biosensor whereby the cofactor NAD+ and GLDH were immobilized using a combination of
multi-walled carbon nanotubes (MWCNT), CHIT and additional water based MB in a
layer-by-layer fashion. The MWCNT/CHIT/MB combination facilitates electron transfer to
the surface of working electrode. The MWCNT/CHIT also entraps GLDH and the NAD+ on
the surface of the electrode. The pH, temperature, optimum applied potential,
concentrations of NAD+, CHIT and the addition of water-based MB were optimised. The
electrocatalyst MB allowed a operating potential of +0.1V (vs. Ag/AgCl) to be utilised. The
biosensor was examined with standard glutamate solutions and the following biosensor
characteristics were determined; linear range; 7 - 105µM, LOD; 3 µM, sensitivity; 0.39
nA/µM, response time 20-30s. A food sample was analysed for MSG and found to contain
90.56 mg/g with a CV of 7.52% (n = 5). The reagentless biosensor was also applied to the
determination of glutamate in serum. The endogenous concentration was found to be
1.44mM (n = 5), CV: 8.54%. The recovery of glutamate in fortified serum was 104% (n =
5), CV of 2.91%. The results indicate that the new biosensor holds promise for food and
biomedical studies.

Acknowledgements
v
Acknowledgements
Firstly I would like to express my gratitude to Prof. John Hart, who provided endless
enthusiasm and support throughout my studies. Our scientific and musical discussions over
morning coffee (latte’s) was a source of invaluable guidance.
I would also like to thank Dr. Roy Pemberton for his excellent support, advice and
enthusiasm throughout the PhD.
My thanks also go to Prof. Peter Fielden, for his support. Gwent Electronic Materials must
also be mentioned and thanked for their provision of the screen-printed carbon electrodes.
I’m extremely grateful to Dr. Adrian Crew and Dr. Kevin Honeychurch for putting up with
me in the lab, providing answers to my questions and for all the laughs over the past three
years.
Thanks to all the support from all my friends at UWE!
Friends beyond UWE, many thanks for the support and nodding politely when I’ve
attempted to explain my work after a few ciders.
Huge thanks go my family: Robert, Llinos, Tadcu James, Tadcu Hughes, Mamgu Hughes
and Scooby providing endless support.

Copyright Disclaimer
vi
Copyright Disclaimer
This copy has been supplied on the understanding that it is copyright material and that no
quotation from the thesis maybe published without proper acknowledgement.
Abbreviations
vii
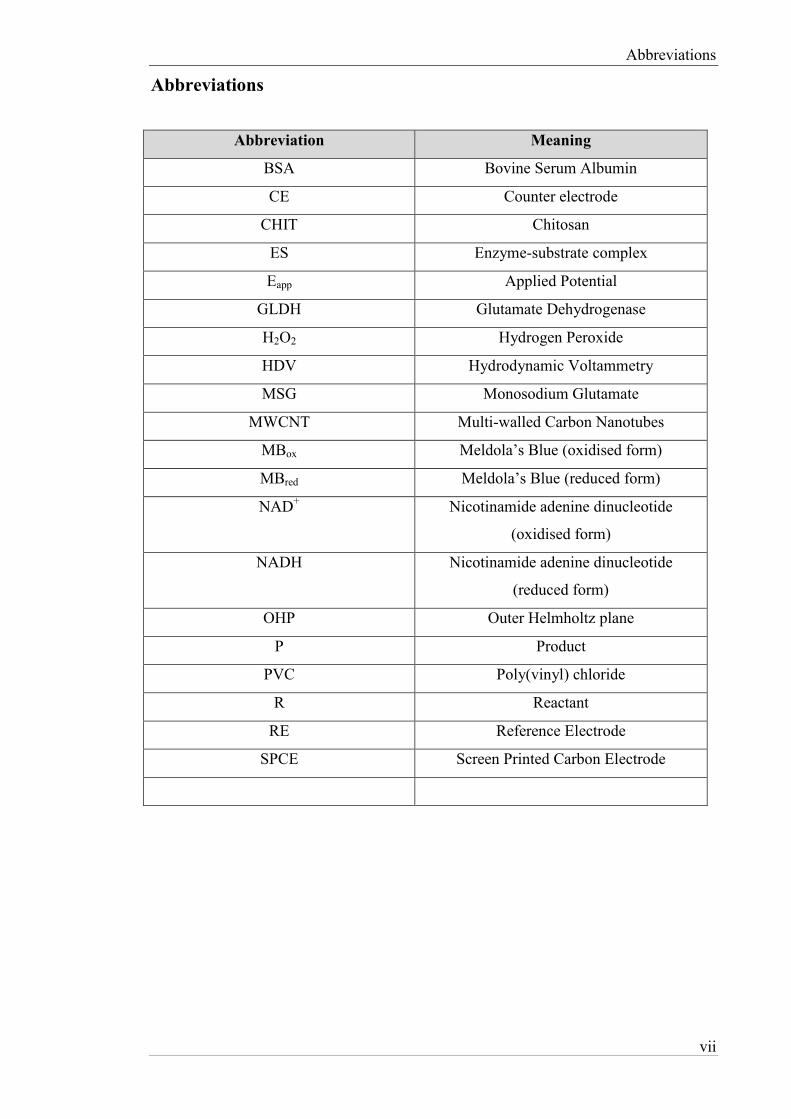
Abbreviations
Abbreviation Meaning
BSA Bovine Serum Albumin
CE Counter electrode
CHIT Chitosan
ES Enzyme-substrate complex
Eapp Applied Potential
GLDH Glutamate Dehydrogenase
H2O2 Hydrogen Peroxide
HDV Hydrodynamic Voltammetry
MSG Monosodium Glutamate
MWCNT Multi-walled Carbon Nanotubes
MBox Meldola’s Blue (oxidised form)
MBred Meldola’s Blue (reduced form)
NAD+ Nicotinamide adenine dinucleotide
(oxidised form)
NADH Nicotinamide adenine dinucleotide
(reduced form)
OHP Outer Helmholtz plane
P Product
PVC Poly(vinyl) chloride
R Reactant
RE Reference Electrode
SPCE Screen Printed Carbon Electrode

Presentations and Publications
vii
Oral Presentations
9th Post Graduate Research Topics Meeting in Electroanalysis and Sensing.
Studies towards the development of a disposable screen-printed amperometric biosensor
and its possible applications. 4th December 2014, Birkbeck, University of London
CRIB Seminar
Studies towards the development of a disposable screen-printed amperometric biosensor
and its possible applications. 5th December, 2014, University of the West of England,
Bristol
Great Western Electrochemistry Meeting
Studies towards the development of a disposable screen-printed amperometric biosensor
and its possible applications. 22nd of June 2015, University of Bath, Bath.
Publications
G. Hughes, R.M. Pemberton, P.R. Fielden, J.P. Hart, Development of a Disposable
Screen Printed Amperometric Biosensor Based on Glutamate Dehydrogenase, for the
Determination of Glutamate in Clinical and Food Applications, Anal. Bioanal.
Electrochem. 6 (2014) 435–449. http://abechem.com/No. 4-2014/2014,6_4_,435-
449.pdf.
G. Hughes, R.M. Pemberton, P.R. Fielden, J.P. Hart, Development of a novel
reagentless, screen–printed amperometric biosensor based on glutamate
dehydrogenase and NAD+, integrated with multi–walled carbon nanotubes for the
determination of glutamate in food and clinical applications, Sensors Actuators B
Chem. (2015). doi:10.1016/j.snb.2015.04.066.
P. Kanyong, G. Hughes, R. M. Pemberton, S. K. Jackson and J. P.Hart, (2015)
“Amperometric Screen-Printed Galactose Biosensor for Cell Toxicity Applications,”
Analytical Letters. 49, 2, 1–9.
G. Hughes, R. M. Pemberton, P. R. Fielden, and J. P. Hart. “The design, development
and application of electrochemical glutamate biosensors, (Review)”. Trends in
Analytical Chemistry, accepted for publication
G. Hughes, R. M. Pemberton, P. R. Fielden, and J. P. Hart. “A reagentless, screen–
printed amperometric biosensor for the determination of glutamate in food and clinical
applications, (Book Chapter)”. Methods in Molecular Biology (Springer), submitted
Chapter One
1
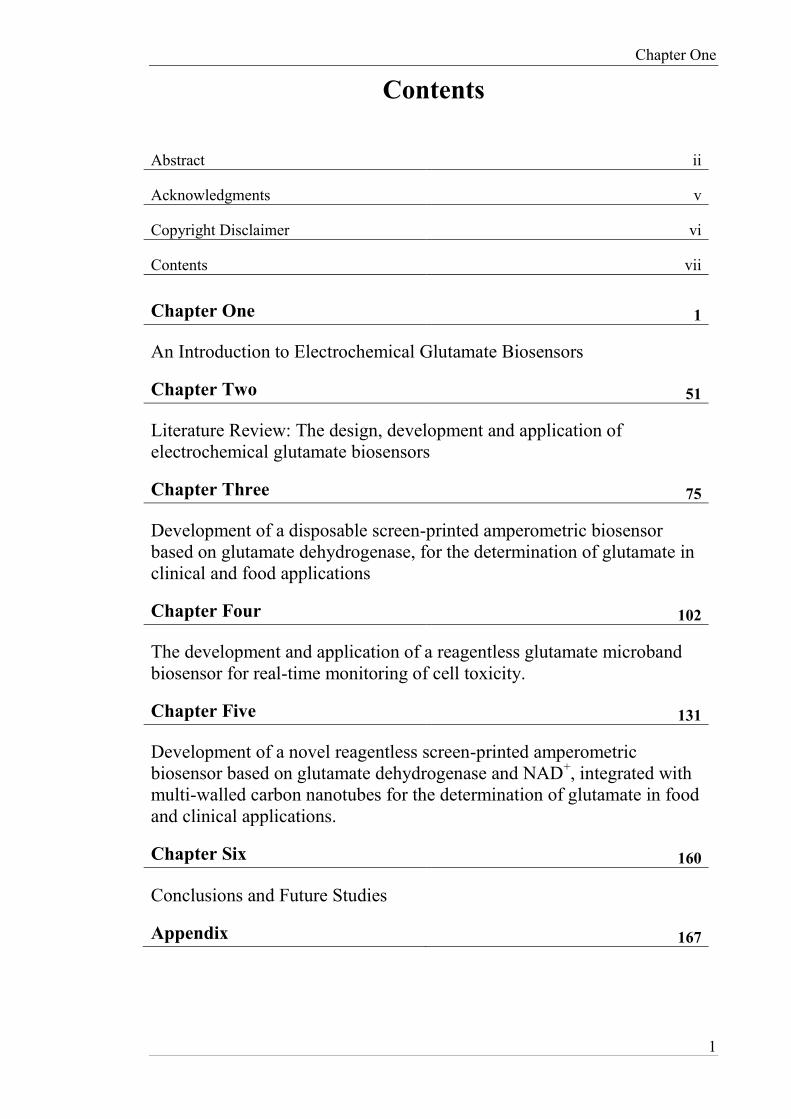
Contents
Abstract ii
Acknowledgments v
Copyright Disclaimer vi
Contents vii
Chapter One 1
An Introduction to Electrochemical Glutamate Biosensors
Chapter Two 51
Literature Review: The design, development and application of
electrochemical glutamate biosensors
Chapter Three 75
Development of a disposable screen-printed amperometric biosensor
based on glutamate dehydrogenase, for the determination of glutamate in
clinical and food applications
Chapter Four 102
The development and application of a reagentless glutamate microband
biosensor for real-time monitoring of cell toxicity.
Chapter Five 131
Development of a novel reagentless screen-printed amperometric
biosensor based on glutamate dehydrogenase and NAD+, integrated with
multi-walled carbon nanotubes for the determination of glutamate in food
and clinical applications.
Chapter Six 160
Conclusions and Future Studies
Appendix 167
Chapter One
2
CHAPTER ONE
An Introduction to Electrochemical Glutamate
Biosensors
Chapter One
3
1. Contents
1.1 Introduction ....................................................................................................... 5
1.1.1 Glutamate .................................................................................................... 5
1.1.2 Drug Development and Toxicology ............................................................ 6
1.1.3 HepG2 ......................................................................................................... 7
1.2 Biosensor Principles and Applications.............................................................. 8
1.2.1 Biosensor Fabrication................................................................................ 10
1.3 Electrode Modification.................................................................................... 11
1.3.1 Electrocatalysts ......................................................................................... 11
1.3.2 Biological Modification of Electrodes ...................................................... 14
1.3.3 Immobilization Techniques ....................................................................... 14
1.3.3.1 Covalent Bonding .............................................................................. 14
1.3.3.2 Entrapment ......................................................................................... 15
1.3.3.3 Adsorption ......................................................................................... 15
1.3.3.3.1 Chitosan ......................................................................................... 16
1.3.4 Enzymology .............................................................................................. 16
1.3.4.1 Enzyme Function ............................................................................... 16
1.3.4.2 Enzyme Kinetics ................................................................................ 18
1.3.5 Dehydrogenase Enzymes .......................................................................... 21
1.3.6 Cofactors ................................................................................................... 22
1.4 Equipment utilised for electrochemical techniques ........................................ 23
1.4.1 Electrochemical Cell ................................................................................. 23
Chapter One
4
1.4.2 Working Electrode (WE) .......................................................................... 24
1.4.3 Reference Electrode .................................................................................. 24
1.4.4 Counter Electrode...................................................................................... 25
1.4.5 Potentiostat ................................................................................................ 25
1.4.6 Fundamentals of Electrochemistry ............................................................ 26
1.4.6.1 Faradaic currents ................................................................................ 26
1.4.6.2 Charging currents and the Electrical Double Layer ........................... 26
1.4.6.3 Mass Transport .................................................................................. 28
1.5 Electro-analytical Techniques ......................................................................... 28
1.5.1 Stirred Solution Techniques ...................................................................... 29
1.5.1.1 Nernst Diffusion Layer ...................................................................... 29
1.5.1.2 Hydrodynamic Voltammetry ............................................................. 30
1.5.1.3 Amperometry ..................................................................................... 31
1.5.2 Quiescent Solution Techniques ................................................................. 32
1.5.2.1 Cyclic Voltammetry ........................................................................... 32
1.5.2.2 Chronoamperometry .......................................................................... 36
1.5.3 Electrochemical Behaviour using Miniaturized Electrodes ...................... 37
1.6 Aims and Objectives ....................................................................................... 40
1.7 References ....................................................................................................... 41

Chapter One
5
1.1 Introduction
1.1.1 Glutamate
Glutamate is considered to be the primary neurotransmitter in the mammalian brain and
facilitates normal brain function [1]. It is a non-essential endogenous excitatory amino acid
that is synthesised in neurons, from precursors such as glutamine and 2-oxoglutarate. Along
with aspartate and homocysteine, glutamate contributes to excitatory neurotransmission in
the central nervous system (CNS), whilst its immediate precursor gamma-aminobutyric acid
(GABA) acts as an endogenous inhibitory neurotransmitter [2]. Neurotoxicity, which causes
damage to brain tissue, can induced by glutamate at high concentrations. The accumulation
of high concentrations of glutamate leads to the over activation of NMDA and AMPA
receptors [3], which may link it to a number of neurodegenerative disorders such as
Parkinson’s disease, multiple sclerosis [4] and Alzheimer’s disease [5].
In cellular metabolism, glutamate also contributes to the urea cycle and tricarboxylic acid
cycle (TCA)/Krebs cycle. It plays a vital role in the assimilation of NH4+ [6]. Glutamate is
synthesised from NH4+ and alpha-ketoglutarate by glutamate dehydrogenase (GLDH). The
process is a reversible reaction, whereby glutamate can also be converted to alpha-
ketoglutarate by oxidative deamination. The reaction can only occur in the presence of the
coenzyme nicotine adenine dinucleotide (NAD+). The direction of the reaction is primarily
dependent on the relative concentrations of glutamate, alpha-ketoglutarate, ammonia and the
ratio of oxidized to reduced coenzymes.
Intracellular glutamate levels outside of the brain are typically 2–5 mmol/L, whilst
extracellular concentrations are ~0.05 mmol/L [7] and is present in high concentrations
throughout the liver, brain, kidney and skeletal muscle [8]. Glutamate has a significant role
in the disposal of ammonia, which is typically produced from the digestion of dietary amino
acids, protein and the ammonia produced by intestinal tract bacteria. Glutamate can also
dispose of ammonia by being converted to glutamine by glutamine synthase.
Chapter One
6
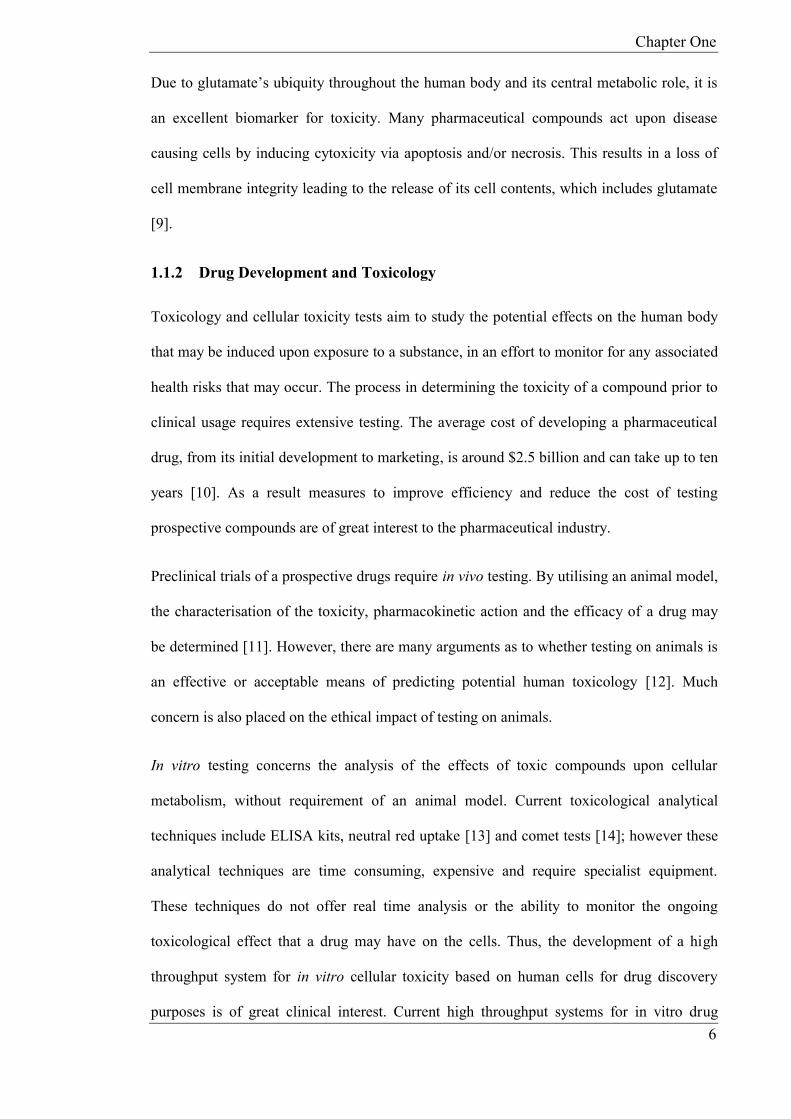
Due to glutamate’s ubiquity throughout the human body and its central metabolic role, it is
an excellent biomarker for toxicity. Many pharmaceutical compounds act upon disease
causing cells by inducing cytoxicity via apoptosis and/or necrosis. This results in a loss of
cell membrane integrity leading to the release of its cell contents, which includes glutamate
[9].
1.1.2 Drug Development and Toxicology
Toxicology and cellular toxicity tests aim to study the potential effects on the human body
that may be induced upon exposure to a substance, in an effort to monitor for any associated
health risks that may occur. The process in determining the toxicity of a compound prior to
clinical usage requires extensive testing. The average cost of developing a pharmaceutical
drug, from its initial development to marketing, is around $2.5 billion and can take up to ten
years [10]. As a result measures to improve efficiency and reduce the cost of testing
prospective compounds are of great interest to the pharmaceutical industry.
Preclinical trials of a prospective drugs require in vivo testing. By utilising an animal model,
the characterisation of the toxicity, pharmacokinetic action and the efficacy of a drug may
be determined [11]. However, there are many arguments as to whether testing on animals is
an effective or acceptable means of predicting potential human toxicology [12]. Much
concern is also placed on the ethical impact of testing on animals.
In vitro testing concerns the analysis of the effects of toxic compounds upon cellular
metabolism, without requirement of an animal model. Current toxicological analytical
techniques include ELISA kits, neutral red uptake [13] and comet tests [14]; however these
analytical techniques are time consuming, expensive and require specialist equipment.
These techniques do not offer real time analysis or the ability to monitor the ongoing
toxicological effect that a drug may have on the cells. Thus, the development of a high
throughput system for in vitro cellular toxicity based on human cells for drug discovery
purposes is of great clinical interest. Current high throughput systems for in vitro drug

Chapter One
7
toxicity screening include CellTiterGlow, ToxiLight, lactate dehydrogenase assay, CyQuant
and Trypan Blue assays. These assays evaluate the effects of the anti-metabolic effects by
utilising luminescent assays, fluorescent assays, the ability for the cell to uptake a reagent or
by monitoring the release of an enzyme [15].
The development of electrochemical biosensors in order to monitor the effects of
toxicological challenge upon cells offers promising advantages over existing toxicological
techniques. Biosensors offer specificity for biologically relevant analytes due to their
utilisation of an enzyme as part of their sensing system [16].
1.1.3 HepG2
The in vitro toxicity tests described later in the thesis utilise HepG2 as the cell culture
model. HepG2 cells are immortalized human liver carcinoma cells. This cell line has been
previously used to determine the cytotoxicity of compounds [17]–[20]. Indicators of HepG2
cytotoxicity include glucose secretion, LDH leakage and elevated levels of gamma-glutamyl
transferase [18]. The HepG2 cell line expresses many of the enzymes associated with
cytochrome (CYP), in particular, phase I and phase II metabolic enzymes [21], [22].
HepG2 cells may also be cultured into 3D aggregates known as spheroids, which behave
like “mini-livers”. However, the drug toxicity interactions for 3D HepG2 cells are less
established than monolayer interactions. In addition, other difficulties such as increased
culturing complexity, significantly slower maturation of the cell line and inability to
accurately count the number of cells due to aggregation may arise [23]. Thus, based on
current in vitro toxicological methods currently utilised by pharmaceutical compounds, 3D-
cells lines are currently unsuited.

Chapter One
8
1.2 Biosensor Principles and Applications
The first biosensor concept was proposed by Clark and Lyons from the Children Hospital in
Cincinnati in 1962 [24]. The biosensor measured the depletion of oxygen generated by the
oxidation of glucose in a thin layer of glucose oxidase over the gas permeable membrane of
the sensor. The glucose oxidase biosensor has been developed enormously since its initial
conception [25]. The analysis of glucose is considered vital to the management of blood
glucose levels in diabetic patients [26] by the use of small glucose meters. The meters, both
in the size and ease of use, have progressed vastly since the 1970’s, with particular
breakthroughs occurring in the 1990’s, with the reduction in the volume of blood required to
take a measurement and an increase in the accuracy in both high and low concentrations of
glucose [27].
A biosensor is a chemical sensing device that relies on two basic components connected in
series – a biochemical mechanism recognition system and a physio-chemical transducer.
These provide a mean to convert chemical information such as the concentration of a
sample into a useful signal which can be analysed [28]. The biological component of a
biosensor can be split into two classifications; catalytic and non-catalytic. Catalytic
components consist of micro-organisms, tissues and enzymes, whilst non-catalytic
components comprise of antibodies, receptors and nucleic acids.
The transduction technique will be dependent on the biological component in use. Examples
of transduction techniques include:
Potentiometric – The measurement of the potential at zero current. The potential is
proportional to the logarithm of the concentration of the substance being determined.
Voltammetric – Increasing or decrease the potential that is applied to a cell until the
oxidation or reduction of the analyte occurs. This generates a rise in current that is
proportional to the concentration of the electroactive potential. Once the desired stable

Chapter One
9
oxidation/reduction potential is known, stepping the potential directly to that value and
observing the current is known as amperometry.
Conductiometric – Observing changes in electrical conductivity of the solution. [29]
The most commonly used type of biosensor both in commercial production and research are
enzyme based systems, coupled with amperometric transduction. Biosensors such as those
produced by Clark and Lyons are described as being “first generation” devices. The
generation was originally denoted to describe the level at which the biosensor was
integrated. “First generation” biosensors are devices where the signals generated from the
detection of the analyte of interest are as a result of membrane entrapped or bound
biocomponents. “Second generation” biosensors entrap the biocomponents onto the surface
of the electrode, as a result direct electron transfer occurs between the enzyme active
surface and transducer surface, shuttled by the mediator. “Third generation” biosensors
differ from “second generation” biosensors by the lack of mediator required as direct
electron transfer between the electrode surface and the active site of the enzyme occurs [30].
“Third generation” glucose biosensors have been developed [31], [32].

Chapter One
10
1.2.1 Biosensor Fabrication
Biosensors may be fabricated by the low cost method of screen printing. Other methods of
fabrication such as ink-jet printing [33] and solid state technology [34] have been utilised to
fabricate biosensors. Screen printing may be done by hand or by utilising an automated
screen-printing machine.
Figure 1-1. A diagram illustrating the screen-printing process. Used with permission
from GEM.
The principle of screen printing is the graphic reproduction of an image by use of ink or
other viscous compound which is deposited as a film of controlled pattern and thickness. To
do so, the ink is squeezed using a squeegee through a mesh which is tightly stretched over a
frame. The ink is then deposited onto a substrate to produce a screen-printed electrode,
which can be utilised once dried. Typically, polyester, PVC or ceramic substrates are used.
The screen printing process is illustrated in Figure 1-1.
Chapter One
11
Figure 1-2: Diagram of a Screen-Printed Carbon electrode with the working area
defined by insulating tape.
The electrodes are then cut out from the card using scissors. An insulating dielectric layer,
comprising a nonconductive ink, may then be applied to the electrode to define the working
area if necessary, as demonstrated in Figure 1-2. Ag/AgCl reference electrodes may be also
be produced by screen-printing methods.
1.3 Electrode Modification
1.3.1 Electrocatalysts
Commonly used working electrode materials include carbon, gold, mercury or platinum.
The material should allow for the application of wide potential windows whilst exhibiting
favourable redox behaviour and reproducible electron transfer, in order to effectively
characterise the species of interest.
However, these materials require the use of large over-potentials to oxidize or reduce the
electroactive species of interest. The over potential is the potential difference between the
half-reaction reduction potential and the potential at which the redox reaction is observed.
This presents some difficulties when analysing complex solutions and real samples as other
compounds may also be electrocatalytically active at or around a similar potential as the
analyte of interest. As a result, this may produce undesired interferences which reduce the
signal-to-noise ratio, selectivity and sensitivity of the biosensor. By modifying the working
Chapter One
12
electrode by incorporating an electrocatalyst such as Meldola’s Blue, the potential required
to determine the electroactive species can be significantly lowered.
Meldola’s Blue (8-dimethylamino-2,3-benzophenoxazine; designated MB) is an electron
mediator that has been utilised as an electrocatalyst in numerous biosensors. MB increases
the charge transfer between the analyte and the electrode. It also eliminates the interaction
between the electrode and the analyte itself. This leads to a decrease in the formal potential
required to be applied to the electrode to produce an analytical response and an increase in
current density [35]. This also leads to a reduction in the likelihood of interferences directly
interacting with the working electrode and being oxidised/reduced, leading to undesired
amperometric signals. At high overpotentials, an increased likelihood of electrode fouling
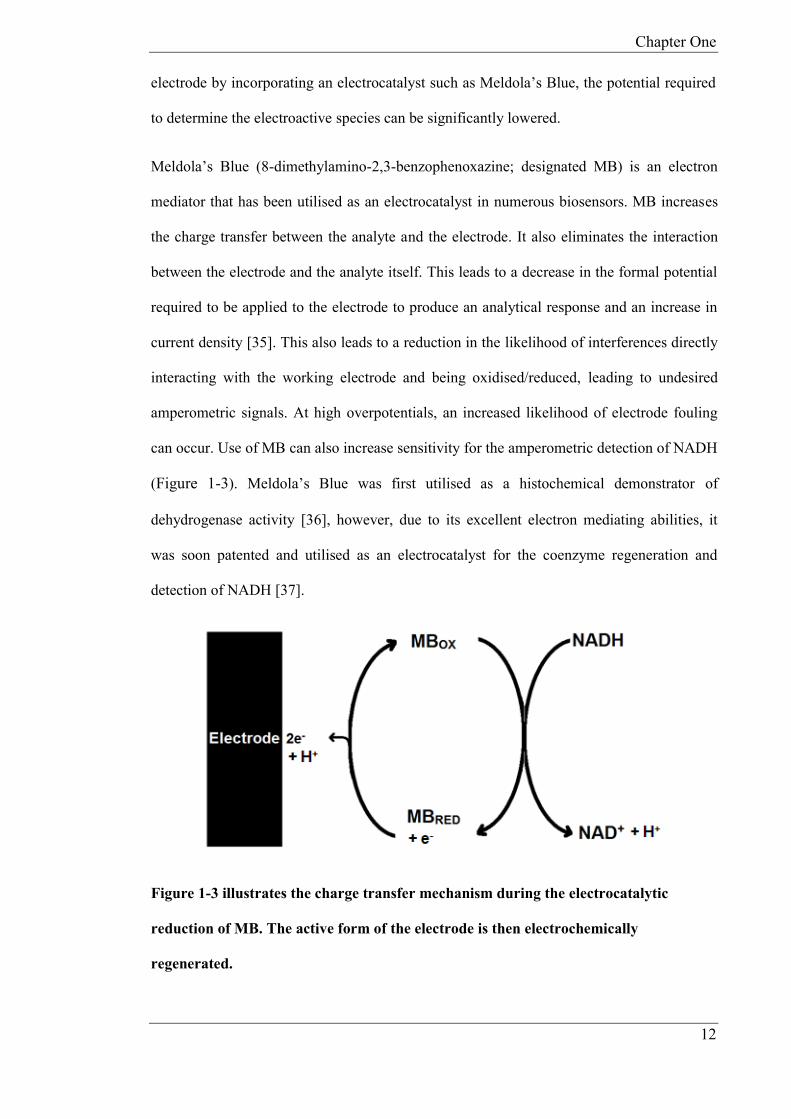
can occur. Use of MB can also increase sensitivity for the amperometric detection of NADH
(Figure 1-3). Meldola’s Blue was first utilised as a histochemical demonstrator of
dehydrogenase activity [36], however, due to its excellent electron mediating abilities, it
was soon patented and utilised as an electrocatalyst for the coenzyme regeneration and
detection of NADH [37].
Figure 1-3 illustrates the charge transfer mechanism during the electrocatalytic
reduction of MB. The active form of the electrode is then electrochemically
regenerated.
Chapter One
13
The use of the mediator led to a 500mV reduction in potential required to
electrocatalytically oxidise NADH, in comparison to an unmodified electrode [38]. At an
unmodified screen-printed carbon electrode (SPCE), the anodic peak potential for NADH
occurs at +0.500mV; with a modified MB-SPCE, the NADH oxidation occurs at -50mV
[39].
In order to immobilise the Meldola’s Blue to the surface of the electrode, various strategies
have been used. Silica coated with niobium oxide was used to immobilize MB on a
modified carbon paste electrode with well-defined electrochemical responses for NADH
[40]. Functionalized carbon nanotubes, combined with MB, to form a nanocomposite film,
have been used to non-covalently bind MB onto the surface of a glassy carbon electrode to
detect NADH [41]. This method leads to excellent sensor characteristics such as low signal-
to-noise, low detection limits and a wide linear range. Titanium phosphate was also used to
immobilize Meldola’s Blue onto a silica gel surface and subsequently incorporated into a
carbon paste electrode [42]. Such immobilization techniques are often complex and time
consuming. By incorporating Meldola’s Blue into a screen-printed carbon electrode
fabrication costs can be reduced due to the increased potential for mass production, thereby
rendering it more suitable for commercial purposes. Incorporating the mediator within the
ink allows for further modification of the electrode surface with biological components such
as enzymes and/or cofactors.
In addition to the determination of NADH, biological compounds such as glucose [43],
lactate [44][45], ammonia [46], glutamate [47], ethanol [48], fructose [49] and ascorbic acid
[50] have also been determined utilising Meldola’s Blue as a mediator in conjunction with a
variety of different enzymes.
The biosensor described in this thesis will utilise the enzyme glutamate dehydrogenase
(GLDH) and the coenzyme NAD+ with a MB-SPCE to detect glutamate, by following the
production and subsequent oxidation of the enzymatically generated NADH.
Chapter One
14
1.3.2 Biological Modification of Electrodes
Biosensors function by the coupling of a molecular recognition component with a physio-
chemical detector in close proximity [51]. Enzymes are typically used due to their high
specificity, robustness and ability to bind to the surface of the transducer. By reducing the
distance between the active site of the enzyme and the transducer surface, an increase in the
electron transfer efficiency occurs, and the target analyte analysis can facilitated [52]. This
can be achieved by immobilizing enzymes on the surface of the transducer.
Enzymes can be immobilized using a variety of techniques, however it is important to select
the appropriate method in order to retain as much of the enzyme activity as possible. Factors
influencing the performance of an immobilized enzyme include the micro-environment of
the carrier, diffusion constraints and the physical structure of the carrier [53].
Immobilisation may also result in the increased stability of the enzyme, resulting in
potentially longer storage or operational times.
1.3.3 Immobilization Techniques
1.3.3.1 Covalent Bonding
Covalent bonding as an immobilization technique involves the formation of covalent bonds
between the enzyme and the support matrix. Enzymes possess side chain amino acids such
as aspartic acid, histidine and arginine and thus may bind to amino, thiol, carboxyl and
phenolic groups present within the support matrix. Ideally, the groups associated with the
binding must not be electrocatalytically active. Covalent bonds are extremely strong, but
this approach suffers from the disadvantage of irreversibly altering the structure of the
enzyme, thereby resulting in a loss of activity or its deactivation [54].
Chapter One
15
1.3.3.2 Entrapment
Entrapment is the caging of an enzyme within a gel or fibre by covalent or non-covalent
interactions. Initial work in the entrapment of enzymes investigated the entrapment of
glucose oxidase within conducting polypyrroles. The method involved the application of a
potential to the working electrode immersed in a solution containing the enzyme and
monomer. The enzymes near the working electrode were entrapped as the polymer grew
[55]. However, due to the formation of a dense matrix upon the surface of the electrode, less
substrate can diffuse deep into the matrix to reach the electrode surface. The enzyme may
also leak into the surrounding solution.
1.3.3.3 Adsorption
Adsorption of an enzyme results from weak non-specific physical interactions such as Van
Der Waals forces, ionic interactions and hydrogen bonding between the enzyme protein and
the binding matrix utilised [56]. Adsorption results in little to no conformational change of
the enzyme which thereby retains its original activity. The immobilization matrix employed
is termed the “carrier”. It is worth noting that not every enzyme will be successfully
immobilized with every carrier, so it is important that the appropriate carrier, with the
relevant functional groups, is selected.
Enzyme carriers can be divided into both organic and inorganic origin. Inorganic agents
such as silica, silica gel, metal oxides and organic natural carriers such as chitin, chitosan,
cellulose and alginate are often utilised as enzyme immobilization agents. In particular,
chitosan has been utilised extensively throughout this thesis as the primary enzyme carrier.
Chapter One
16
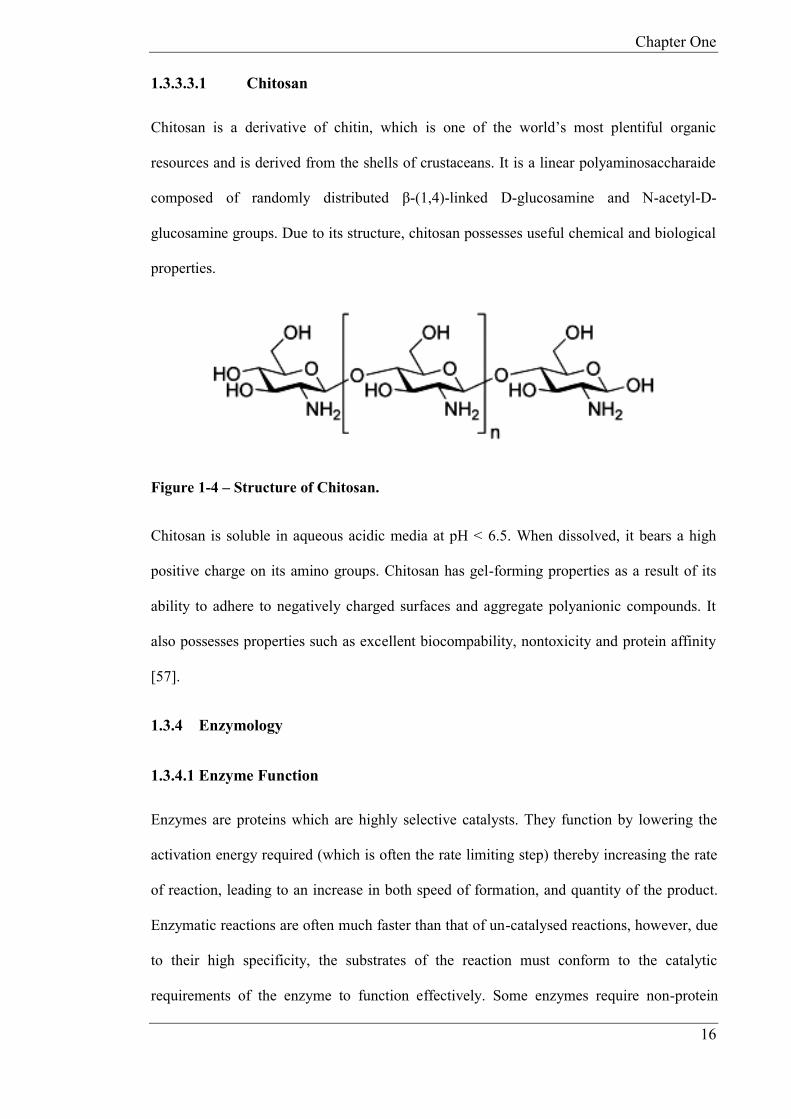
1.3.3.3.1 Chitosan
Chitosan is a derivative of chitin, which is one of the world’s most plentiful organic
resources and is derived from the shells of crustaceans. It is a linear polyaminosaccharaide
composed of randomly distributed β-(1,4)-linked D-glucosamine and N-acetyl-D-
glucosamine groups. Due to its structure, chitosan possesses useful chemical and biological
properties.
Figure 1-4 – Structure of Chitosan.
Chitosan is soluble in aqueous acidic media at pH < 6.5. When dissolved, it bears a high
positive charge on its amino groups. Chitosan has gel-forming properties as a result of its
ability to adhere to negatively charged surfaces and aggregate polyanionic compounds. It
also possesses properties such as excellent biocompability, nontoxicity and protein affinity
[57].
1.3.4 Enzymology
1.3.4.1 Enzyme Function
Enzymes are proteins which are highly selective catalysts. They function by lowering the
activation energy required (which is often the rate limiting step) thereby increasing the rate
of reaction, leading to an increase in both speed of formation, and quantity of the product.
Enzymatic reactions are often much faster than that of un-catalysed reactions, however, due
to their high specificity, the substrates of the reaction must conform to the catalytic
requirements of the enzyme to function effectively. Some enzymes require non-protein
Chapter One
17
cofactors that allow them to increase their functionality or to function at all. Enzymes are
not consumed during a chemical reaction nor do they alter the equilibrium of the reaction.
The specificity of an enzyme is dictated by its structure, charge and
hydrophilic/hydrophobic characteristics. The specificity of an enzyme can be broken down
into four types; absolute, group, linkage and stereochemical specificity. Absolute specificity
restricts the enzyme to catalysing a single reaction, whilst group specificity only allows the
enzyme to catalyse a specific functional group. Linkage specificity allows the enzyme to
catalyse a reaction dependent on the presence of a specific type of chemical bond, whilst
stereochemical specificity requires the enzyme to act on a specific stereoisomer which is
dictated by the chirality of the enzyme active site [58].
The theories upon which the interactions of enzymes and substrates are based are known as
the lock-and-key or induced fit hypothesis. The lock-and-key hypothesis, pictured in Figure
1-5a), states that only a specific substrate can correctly fit the active site of the enzyme. The
induced fit hypothesis, proposed by Koshland and pictured in Figure 1-5b), suggests that a
specific substrate can cause a three dimensional change in the enzyme, aligning the enzyme
and substrate leading to the formation of a substrate-enzyme complex and consequently
generating a product [59].

Chapter One
18
Figure 1-5: Schematic diagram of the a) lock and key model and (b) induced fit
hypothesis. This illustrates substrate-active site interaction.
In the context of biosensors, the specificity of an enzyme can be a useful tool in fabricating
biosensors that are selective for particular molecules.
1.3.4.2 Enzyme Kinetics
Enzyme kinetics is the study of reactions that are catalysed by enzymes. Specifically it
investigates the rate of the reaction and how this is affected by varying the conditions of the
reaction. The kinetics of an enzyme can reveal its mode of action and potential methods of
inhibition.
Single substrate reactions are the simplest enzymatic conversions possible. As illustrated in
Figure 1-5. The formation of an enzyme-substrate complex leads to an increase in the rate
of reaction due to the lowering of the activation energy required for the reaction.
Enzymatic reactions based on a single substrate obey the Michaelis-Menten model of
enzyme kinetics. The rate of an enzyme-catalysed reaction is dependent on the

Chapter One
19
concentration of the substrate (S). Low concentrations of the substrate result in an initial
rate that is proportional to the enzyme velocity (V0) resulting in the linear part of the
Michaelis-Menten plot illustrated in Figure 1-6, therefore first-order kinetics apply. Once
the substrate has occupied all available enzyme sites and is forming enzyme-substrate
complexes in equilibrium, the Vmax has been reached, and zero-order kinetics apply [60].
Figure 1-6: How the reaction rate is altered by the substrate concentration in the
presence of constant enzyme concentration.
Figure 1-7: Enzyme substrate catalysis pathway.
Figure 1-7 describes the kinetic properties of many enzymes, whereby the enzyme (E),
combines with S to form a ES complex, at a rate of dictated by the rate constant k1. The
complex can then either 1) dissociate to E + S by k-1 or 2) form the product (P) by k2 [61].
Chapter One
20
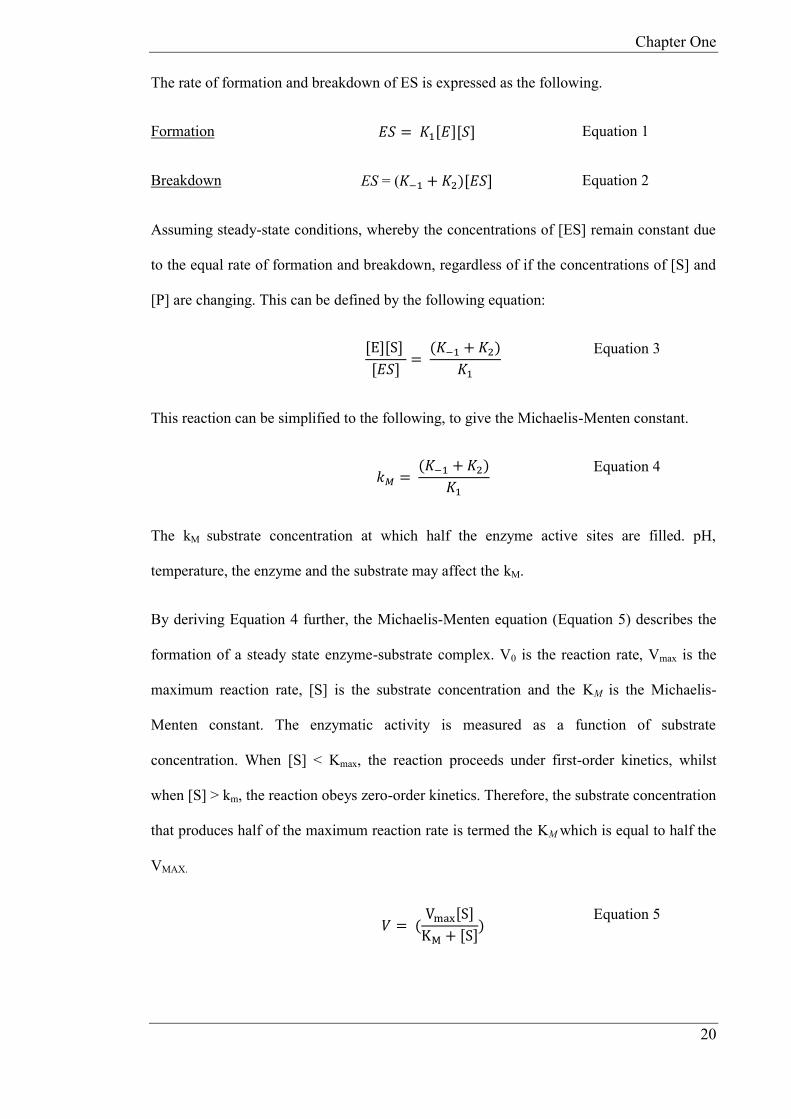
The rate of formation and breakdown of ES is expressed as the following.
Formation 𝐸𝑆 = 𝐾1[𝐸][𝑆] Equation 1
Breakdown ES = (𝐾−1 + 𝐾2)[𝐸𝑆] Equation 2
Assuming steady-state conditions, whereby the concentrations of [ES] remain constant due
to the equal rate of formation and breakdown, regardless of if the concentrations of [S] and
[P] are changing. This can be defined by the following equation:
[E][S]
[𝐸𝑆]=
(𝐾−1 + 𝐾2)
𝐾1
Equation 3
This reaction can be simplified to the following, to give the Michaelis-Menten constant.
𝑘𝑀 =
(𝐾−1 + 𝐾2)
𝐾1
Equation 4
The kM substrate concentration at which half the enzyme active sites are filled. pH,
temperature, the enzyme and the substrate may affect the kM.
By deriving Equation 4 further, the Michaelis-Menten equation (Equation 5) describes the
formation of a steady state enzyme-substrate complex. V0 is the reaction rate, Vmax is the
maximum reaction rate, [S] is the substrate concentration and the KM is the Michaelis-
Menten constant. The enzymatic activity is measured as a function of substrate
concentration. When [S] < Kmax, the reaction proceeds under first-order kinetics, whilst
when [S] > km, the reaction obeys zero-order kinetics. Therefore, the substrate concentration
that produces half of the maximum reaction rate is termed the KM which is equal to half the
VMAX.
𝑉 = (
Vmax[S]
KM + [S])
Equation 5

Chapter One
21
It is worth noting that some enzymes, such as dehydrogenases, require the presence of a
cofactor, therefore in addition to the kinetics regarding the formation of an enzyme-
substrate complex, the formation of an enzyme-cofactor complex (EC) must be also
considered. Slow enzyme kinetics may arise if the cofactor concentration is not in excess of
the enzyme concentration. By supplementing the mixture with an fixed excess
concentration of the relevant cofactor, these issues can be overcome [62].
1.3.5 Dehydrogenase Enzymes
The enzyme utilised in this thesis to produce biosensors is glutamate dehydrogenase
(GLDH). Dehydrogenases are a class of enzymes that oxidize a substrate by a reduction
reaction. The reaction results in the transfer of one or more hydrides (H-) to an electron
acceptor, such as NAD+. GLDH is a mitochondrial enzyme that is present in the liver, heart,
muscle and kidneys. It is a hexameric enzyme composed of ~500 residues in the animal
kingdom [63] and a molecular weight of 49.2kD [64]. The enzyme has a glutamate binding
domain and two-coenzyme binding sites, one for NAD+/NAD(P)+ and one for ADP, NAD+
and NADH. It catalyses the conversion of the amino group present on glutamate into a
ammonium ion, by oxidative deamination. The reaction is a multi-step processes. The first
step begins with the dehydrogenation of the carbon-nitrogen bond which leads to a Schiff-
base intermediate; this is catalysed by glutamate dehydrogenase and the co-factor NAD+,
which is reduced to NADH. The hydrolysis of the Schiff base leads to the formation of α-
ketoglutarate [65].
Chapter One
22
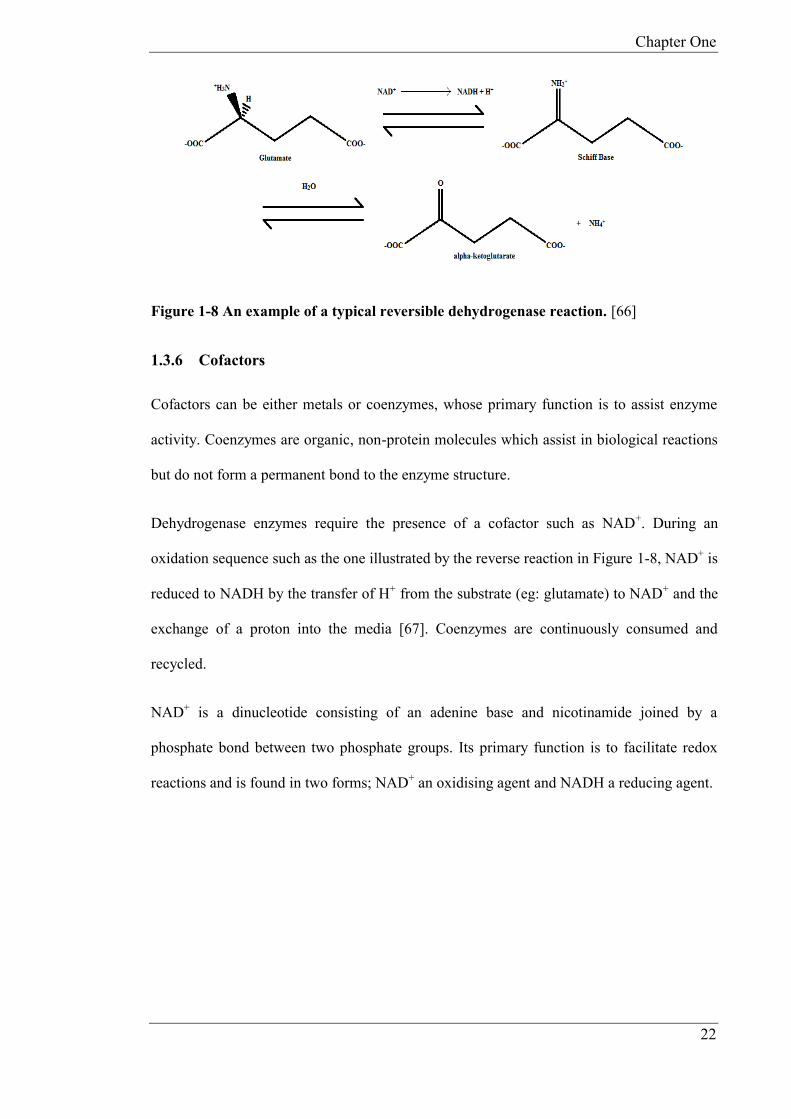
Figure 1-8 An example of a typical reversible dehydrogenase reaction. [66]
1.3.6 Cofactors
Cofactors can be either metals or coenzymes, whose primary function is to assist enzyme
activity. Coenzymes are organic, non-protein molecules which assist in biological reactions
but do not form a permanent bond to the enzyme structure.
Dehydrogenase enzymes require the presence of a cofactor such as NAD+. During an
oxidation sequence such as the one illustrated by the reverse reaction in Figure 1-8, NAD+ is
reduced to NADH by the transfer of H+ from the substrate (eg: glutamate) to NAD+ and the
exchange of a proton into the media [67]. Coenzymes are continuously consumed and
recycled.
NAD+ is a dinucleotide consisting of an adenine base and nicotinamide joined by a
phosphate bond between two phosphate groups. Its primary function is to facilitate redox
reactions and is found in two forms; NAD+ an oxidising agent and NADH a reducing agent.

Chapter One
23
1.4 Equipment utilised for electrochemical techniques
1.4.1 Electrochemical Cell
Typically electrochemical reactions take place in an electrochemical cell (Figure 1-9) which
is made from quartz or glass, into which the sample solution is added. The sample solution
must be of sufficient depth to cover the two or three electrodes utilised. Variables such as
temperature can be controlled by utilising a water-jacket cell, which is connected to a
thermostatically controlled water bath. Experiments such as amperometry require stirring,
thus a magnetic stirrer bar can sit at the bottom of the solution, which is controlled by a
magnetic stirrer that sits underneath the electrochemical cell. The stirrer geometry should
allow for consistent stirring.
Figure 1-9 Schematic Diagram of a voltammetric cell based on a three electrode
system. CE: counter electrode, WE: Working electrode, RE: Reference electrode. This
is an example of a three electrode uncovered cell.

Chapter One
24
1.4.2 Working Electrode (WE)
The working electrode (WE) is the location at which the reaction of interest takes place. The
working electrode must be made of a material that is stable in the electrolyte medium
utilised during the experiment, eg: carbon. This is to ensure that the electrode does not
corrode or become fouled, thereby altering the surface area, and to prevent other compounds
reducing in the potential range of interest. Working electrodes should have high surface
reproducibility with a uniform distribution of potential across the surface to prevent IR drop.
The background current within the potential region of interest should be low. The cost,
availability and toxicity of the material should also be considered.
1.4.3 Reference Electrode
A reference electrode acts as a half-cell which has a stable and accurately maintained
potential which is used a reference for the measurement of voltage applied by the counter
electrode (CE). It is potentiometric and thus has zero current flowing through it. The
potentiostat compensates if a difference in voltage is detected between the AE and WE and
adjusts the output accordingly until the difference is zero, this action is known as feedback
[68]. An example of a commonly used reference electrode the silver-silver chloride
(Ag/AgCl) which is frequently used with screen printed carbon electrodes [69]. For
applications such as chromoamperometry where small currents are flowing for short time
periods, two electrode systems may be used, where the counter electrode assumes the role of
RE and WE. Since current flowing through the reference electrode may alter its stability
over time [70], three electrode systems with a counter electrode are often utilised in
experimental situations, and for amperometric applications over prolonged time periods.
Chapter One
25
1.4.4 Counter Electrode
The function of the counter electrode (CE) is to complete the circuit by applying a voltage
difference respectively to the WE, thereby allowing charge to flow. The CE is composed of
an inert material such as carbon or platinum.
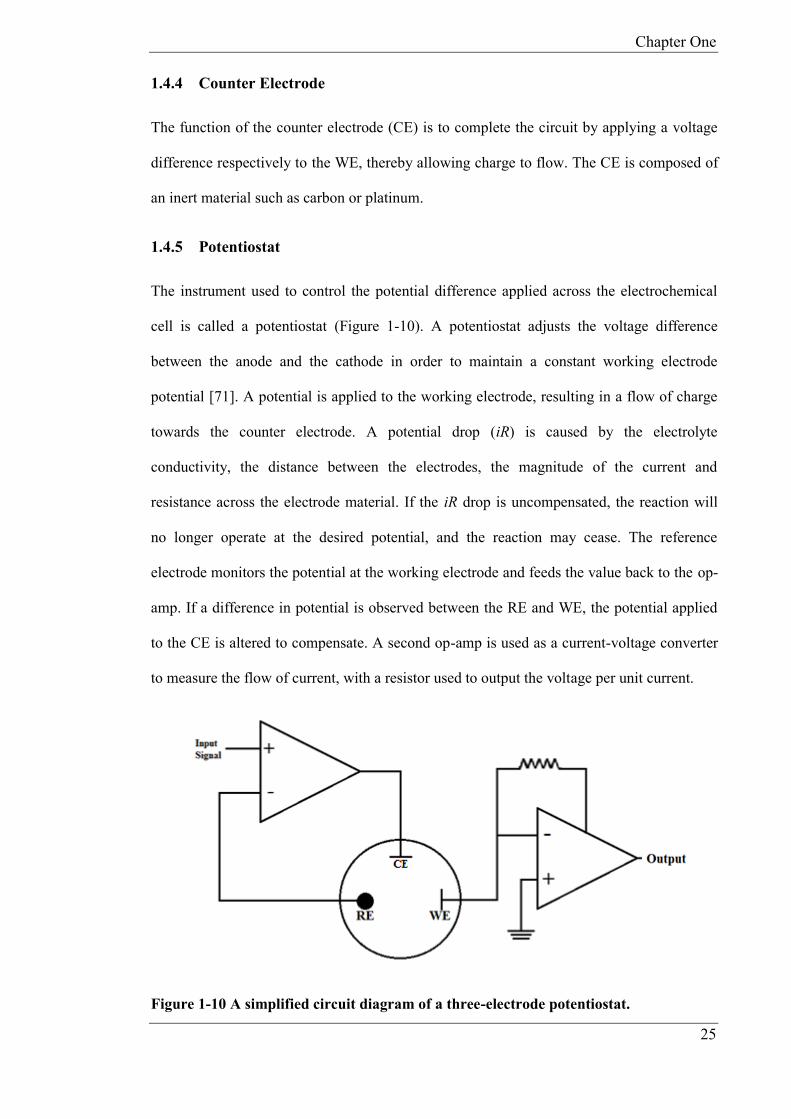
1.4.5 Potentiostat
The instrument used to control the potential difference applied across the electrochemical
cell is called a potentiostat (Figure 1-10). A potentiostat adjusts the voltage difference
between the anode and the cathode in order to maintain a constant working electrode
potential [71]. A potential is applied to the working electrode, resulting in a flow of charge
towards the counter electrode. A potential drop (iR) is caused by the electrolyte
conductivity, the distance between the electrodes, the magnitude of the current and
resistance across the electrode material. If the iR drop is uncompensated, the reaction will
no longer operate at the desired potential, and the reaction may cease. The reference
electrode monitors the potential at the working electrode and feeds the value back to the op-
amp. If a difference in potential is observed between the RE and WE, the potential applied
to the CE is altered to compensate. A second op-amp is used as a current-voltage converter
to measure the flow of current, with a resistor used to output the voltage per unit current.
Figure 1-10 A simplified circuit diagram of a three-electrode potentiostat.

Chapter One
26
1.4.6 Fundamentals of Electrochemistry
1.4.6.1 Faradaic currents
The Faradaic current is the current that flows through an electrochemical cell that is
generated by the change in oxidation state of the electroactive species occurring at the
electrode surface, combined with the current contribution due to the charge transfer between
the electrode and the background analyte present in solution. The faradaic current obeys
Faraday’s law.
1.4.6.2 Charging currents and the Electrical Double Layer
The application of a potential to the electrode surface causes ions near the electrode surface
to migrate towards or away from the electrode depending on the respective charge of the
electrode and the ions. This forms an electrical double layer, comprised of the electrical
charge at the surface of the electrode and the charge of the ions in the solution near the
electrode. This double layer leads to the generation of a non-faradaic charging current.
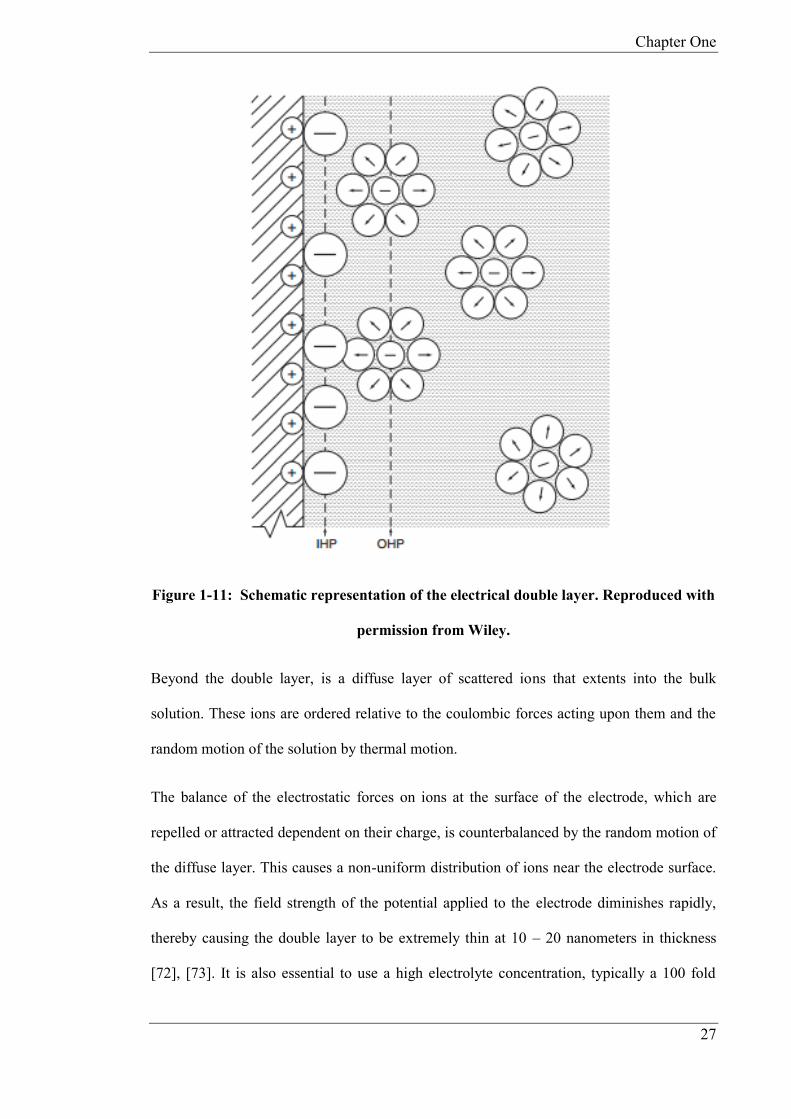
The electrical double layer is an array of charged particles and orientated dipoles. It is
composed of two layers; the layer closest to the electrode is known as the inner Helmholtz
plane (IHP) and the outer Helmholtz plane (OHP) (Figure 1-11). The planes were
discovered by Hermann von Helmholtz in 1853. The IHP is composed of solvent molecules
and specifically adsorbed ions, whilst the OHP represents the imagined outer layer closest
to the electrode that passes through the centre of solvated ions, but is separated by the
molecules at the IHP [35]. These layers are both held at the surface of the electrode. The
behaviour of the interface between the electrode and the solution is similar to that of a
capacitor.
Chapter One
27
Figure 1-11: Schematic representation of the electrical double layer. Reproduced with
permission from Wiley.
Beyond the double layer, is a diffuse layer of scattered ions that extents into the bulk
solution. These ions are ordered relative to the coulombic forces acting upon them and the
random motion of the solution by thermal motion.
The balance of the electrostatic forces on ions at the surface of the electrode, which are
repelled or attracted dependent on their charge, is counterbalanced by the random motion of
the diffuse layer. This causes a non-uniform distribution of ions near the electrode surface.
As a result, the field strength of the potential applied to the electrode diminishes rapidly,
thereby causing the double layer to be extremely thin at 10 – 20 nanometers in thickness
[72], [73]. It is also essential to use a high electrolyte concentration, typically a 100 fold
Chapter One
28
greater than that of the analyte, as this concentrates the charge at the Helmholtz planes,
therefore ensuring that diffusion is the dominant mechanism for mass transport [74].
1.4.6.3 Mass Transport
Mass transport occurs by three different modes:
Diffusion: The spontaneous movement of particles as a result of a concentration gradient.
Regions of high concentration move to regions of low concentration until equilibrium is
established.
Convection: The transport of particles to the electrode by an external mechanical energy
such as stirring or flowing the solution, rotating or vibrating the electrode.
Migration: The movement of charged particles along an electrical field.
1.5 Electro-analytical Techniques
The electrochemical techniques employed in this thesis study the current response of a
biosensor by applying a potential (E) to a working electrode and measuring the resulting
changes in current. The currents resulting from the interaction between the biosensor and
the analyte can be used to quantify the analyte concentration. The technique employed will
vary depending on what aspects of the cell are controlled and which are being measured.
Common techniques include amperometry, chronoamperometry, cyclic voltammetry and
hydrodynamic voltammetry. These techniques differ in the type of potential waveform
utilised, the time that the potential is applied and wherever the measurements are conducted
in a quiescent or stirred (forced convection) solution. The fundamental principles of these
techniques will be discussed in this section.

Chapter One
29
1.5.1 Stirred Solution Techniques
Electrochemical techniques utilising forced convection obey Fick’s first law of diffusion.
Fick’s first law describes the diffusional flux (J) in relation to the diffusion coefficient (D)
and the concentration gradient (C(x)).
𝐽(𝑥,𝑡) = −𝐷𝜕𝐶(𝑥, 𝑡)
𝜕𝑥
Equation 6
1.5.1.1 Nernst Diffusion Layer
At the surface of the electrode, a thin layer of stagnant solution known as the Nernst
diffusion layer (δ) is formed. The equation for the Nernst diffusion layer is given below
(Equation 7), whereby A is the electrode area, n represents the number of electrons, D is the
diffusion layer constant and CB is the concentration in bulk solution.
By deriving from Fick first law (Equation 6), an equation determining the relationship
between the concentration gradient and diffusion flux within the δ. Therefore, any further
increase in current is dependent on concentration in the bulk solution (CB) [75]. The Nernst
diffusion layer remains constant at a fixed stirring rate. The optimum applied potential is
regarded as where the limiting current has been reached, resulting in no further increase in
sensitivity. At this optimum potential, the current is limited by the diffusion of the
electroactive species to the electrode surface through the δ, in accordance with Equation 7.
𝑖𝐿𝐼𝑀 =
𝑛𝐹𝐴𝐷𝐶𝐵
𝛅
Equation 7

Chapter One
30
1.5.1.2 Hydrodynamic Voltammetry
Hydrodynamic techniques are employed to determine the optimum applied potential (Eapp)
to achieve maximum sensitivity in fixed potential techniques. HDV is based on controlled
convective mass transport which is achieved by stirring the solution or by rotating or
vibrating of the electrode. Amperometry in stirred solution is the most commonly used
HDV technique; however other techniques such as flow wall jet and rotating disc techniques
are also used. The solution is stirred and the Eapp is increased in sequential steps (Figure
1-12), until a current plateau is achieved (Figure 1-13). The steady state reached after each
Eapp increase is plotted to determine the limiting current (iL) and therefore the optimum
applied potential to be used for amperometric determinations.
Figure 1-12 Typical electrode potential increases
Figure 1-13 Corresponding current output from potential increases
Chapter One
31
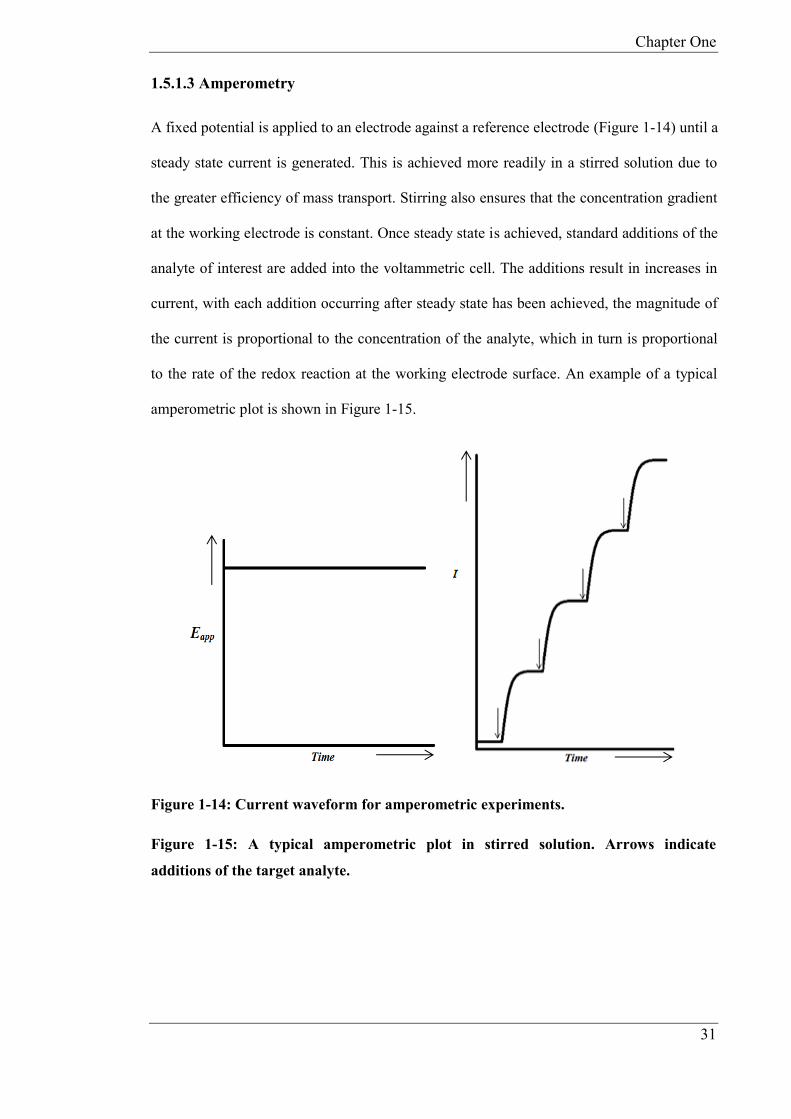
1.5.1.3 Amperometry
A fixed potential is applied to an electrode against a reference electrode (Figure 1-14) until a
steady state current is generated. This is achieved more readily in a stirred solution due to
the greater efficiency of mass transport. Stirring also ensures that the concentration gradient
at the working electrode is constant. Once steady state is achieved, standard additions of the
analyte of interest are added into the voltammetric cell. The additions result in increases in
current, with each addition occurring after steady state has been achieved, the magnitude of
the current is proportional to the concentration of the analyte, which in turn is proportional
to the rate of the redox reaction at the working electrode surface. An example of a typical
amperometric plot is shown in Figure 1-15.
Figure 1-14: Current waveform for amperometric experiments.
Figure 1-15: A typical amperometric plot in stirred solution. Arrows indicate
additions of the target analyte.
Chapter One
32
1.5.2 Quiescent Solution Techniques
In unstirred solutions, the diffusion layer (δ) is fixed. The magnitude of the current
generated is derived from Ficks second law, which describes the rate of change of
concentration with time, which is described in Equation 8 [76].
𝑑𝐶
𝑑𝑡= 𝐷(
𝑑2𝐶
𝑑𝑥2)
Equation 8
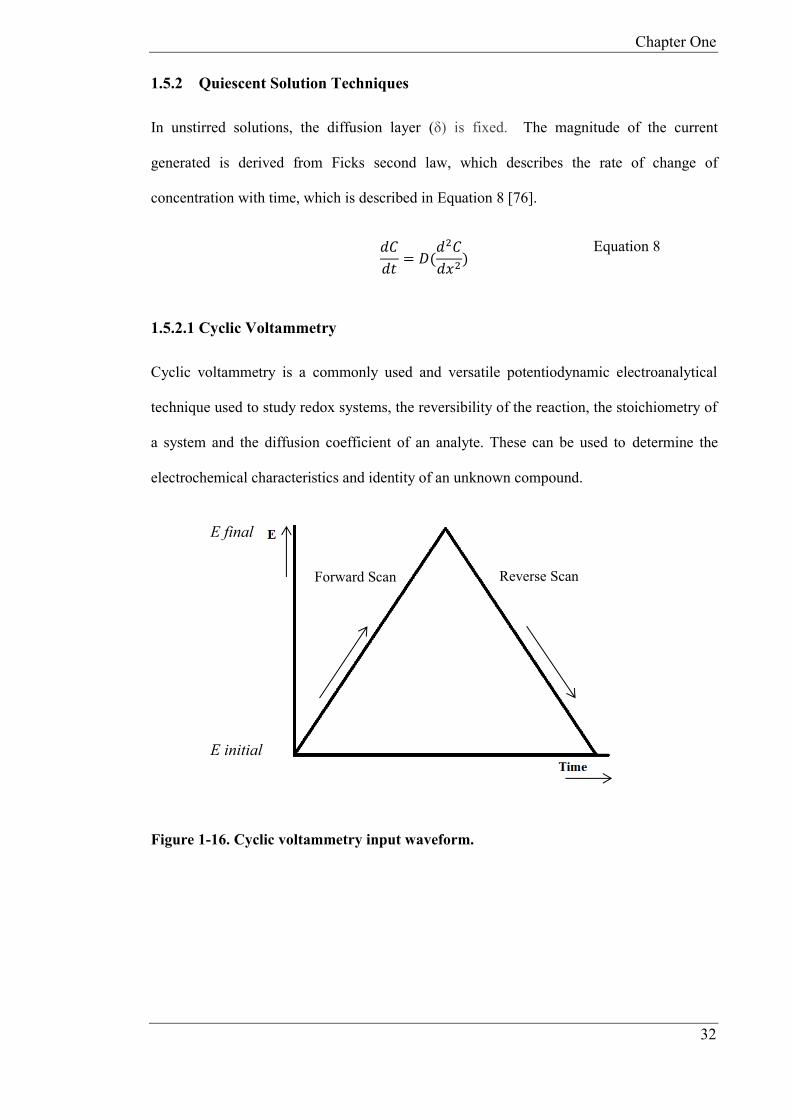
1.5.2.1 Cyclic Voltammetry
Cyclic voltammetry is a commonly used and versatile potentiodynamic electroanalytical
technique used to study redox systems, the reversibility of the reaction, the stoichiometry of
a system and the diffusion coefficient of an analyte. These can be used to determine the
electrochemical characteristics and identity of an unknown compound.
Figure 1-16. Cyclic voltammetry input waveform.
E final
E initial
Forward Scan Reverse Scan

Chapter One
33
Figure 1-17 Typical Cyclic Voltammogram response for a reversible redox couple. [77]
Cyclic voltammograms are characterized by six important parameters.
The cathodic (Epc) and anodic (Epa) peak potentials
The cathodic (ipc) and anodic (ipa) peak currents
The cathodic half-peak potential (Ep/2)
The half wave potential (E1/2)
Cyclic voltammetry linearly applies a triangular potential ramp to the working electrode at a
defined scan rate (V/s)/(vt) until it has reached a set switching potential as shown in Figure
1-16. Once the switching potential on the triangular excitation potential ramp is reached, it
begins a scan in the reverse direction. During the potential sweep, the current is measured
resulting from the potential applied. The resulting plot of current vs. potential is known as a
cyclic voltammogram, as illustrated in Figure 1-17.
ipc
Epc Epa
ipa
Potential
Current
Scan Direction

Chapter One
34
The two peak currents (ipc/ipa) and two peak potentials (Epc/Epa) form the basis for the
analysis of the cyclic voltammetric response to the analyte. The shape of the voltammogram
is due to the concentration of the reactant (R) or product (P) at the electrode surface during
the scan. Ideally, the scan begins at a potential of negligible current flow whereby the
analyte is neither oxidized nor reduced. As the potential is ramped linearly, electron transfer
between the electrode and the analyte in the solution begins to occur; this leads to an
accumulation of product and a depletion of the reactant. The ramp increases in accordance
to the Nernst Equation.
The Nernst equation relates the reduction potential of the half cell (Eo) with respect to the
ratio of the concentrations of oxidized/reduced species at the surface of the electrode. This
equation allows us to calculate to cell potential for any concentration. The Nernst equation
is given in equation 9.
𝐸 = 𝐸0 ∓
𝑅𝑇
𝑛𝐹𝑙𝑜𝑔10
[𝑂𝑥]
[𝑅𝑒𝑑]
Equation 9
Whereby, E represents the half-cell reduction potential, E0 represents the standard half-cell
reduction potential, R; the universal gas constant (8.314 J K-1 mol-1), T; absolute
temperature, n; number of electrons, F; Faraday constant, number of coulombs per mole of
electrons (9.x 104 C mol-1).
At the peak of the anodic wave the reaction becomes diffusion controlled, as the diffusion
layer has grown sufficiently from the electrode that the flux of the product to the electrode is
too slow to satisfy the Nernst equation. As a result, the concentration of the reactant at the
surface reaches zero. Subsequently, the rate of diffusion then decreases, reducing the current
flow, in accordance with the Cottrell equation. Once the potential ramp has reached the
switching potential, the potential is ramped in the opposite direction resulting in a cathodic
potential being applied.
Chapter One
35
The peak current for a reversible system is described by the Randles-Sevcik equation [72].
The current is directly proportional to the concentration and increases in respect to the
square root of the scan rate. This dependence on scan rate implies the reaction at the
electrode is controlled by mass transport. The equation applies at standard temperatures.
(25°C, n = number of electrons involved, A = electrode area, D = diffusion co-efficient, CB
= bulk electrode concentration and v = scan rate).
𝑖𝑝 = (2.69 ∗ 105)𝑛
32𝐴𝐷
12𝐶𝐵𝑣
12
Equation 10
The reversibility of a electrochemically reversible couple can be identified by the
measurement of the potential difference the two peak potentials. An electrochemically
reversible system based on a one electron transfer process is denoted in equation A fast one
electron transfer exhibits a ∆Ep of 59mV.
∆𝐸𝑝 = 𝐸𝑝𝑎 − 𝐸𝑝𝑐 =
59
𝑛𝑚𝑉
Equation 11
Chapter One
36
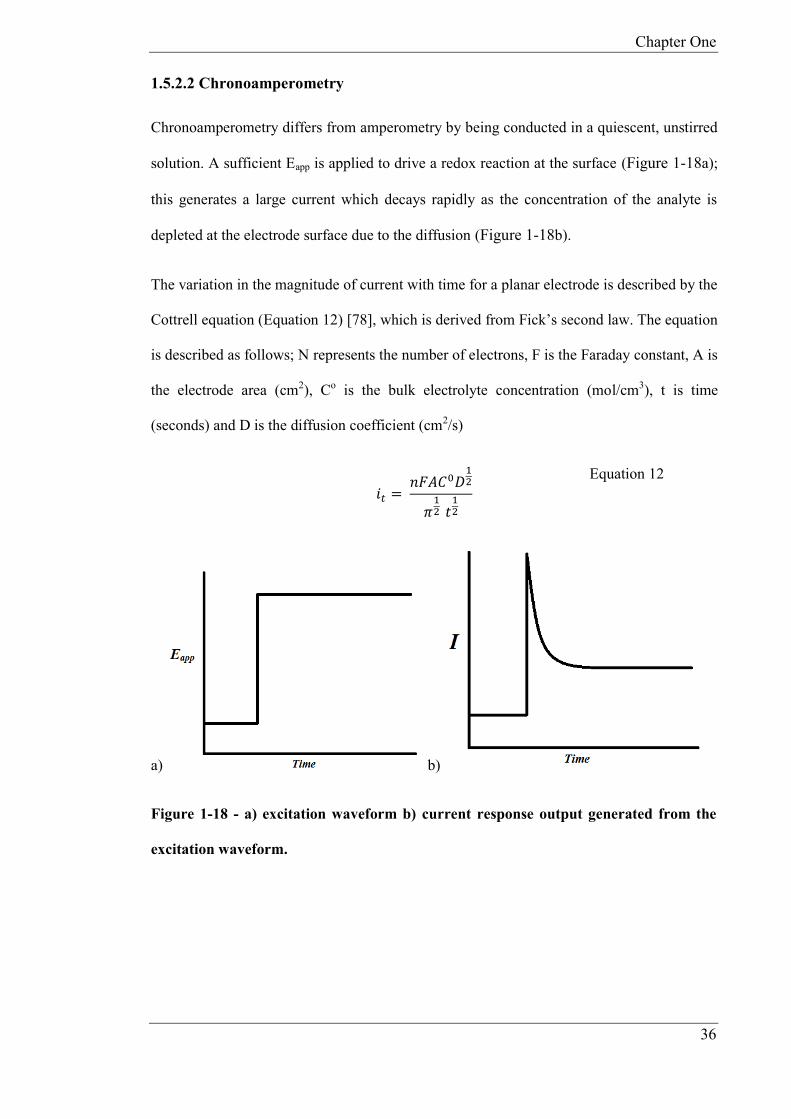
1.5.2.2 Chronoamperometry
Chronoamperometry differs from amperometry by being conducted in a quiescent, unstirred
solution. A sufficient Eapp is applied to drive a redox reaction at the surface (Figure 1-18a);
this generates a large current which decays rapidly as the concentration of the analyte is
depleted at the electrode surface due to the diffusion (Figure 1-18b).
The variation in the magnitude of current with time for a planar electrode is described by the
Cottrell equation (Equation 12) [78], which is derived from Fick’s second law. The equation
is described as follows; N represents the number of electrons, F is the Faraday constant, A is
the electrode area (cm2), Co is the bulk electrolyte concentration (mol/cm3), t is time
(seconds) and D is the diffusion coefficient (cm2/s)
𝑖𝑡 = 𝑛𝐹𝐴𝐶0𝐷
12
𝜋12
𝑡12
Equation 12
a) b)
Figure 1-18 - a) excitation waveform b) current response output generated from the
excitation waveform.
Chapter One
37
1.5.3 Electrochemical Behaviour using Miniaturized Electrodes
In this section, a brief description of the types of voltammetric signals achieved at
microelectrodes together with some important diagnostic equations to elucidate
microelectrode behaviour will be discussed.
Microelectrodes differ from traditional conventional sized macroelectrodes by possessing
one dimension that does not exceed 25 micrometers [79]. Microelectrodes possess the
following properties: high current densities, the generation of small currents (typically on
the picoamp / nanoamp scale), fast establishment of steady state signals, resistance to ohmic
drop and short response times [80].
During short experimental timescales, for example, when conducting cyclic voltammetry
with fast scan rates (>50 mV/s), planar diffusion occurs, thus the current will decay in
accordance with the Cottrell equation (Equation 12). This only occurs in the short time in
which the diffusion layer (δ), is smaller than the radius (r) of the electrode.
During long experimental timescales, when δ > r, radial (nonplanar) diffusion dominates
mass transport, thus under these conditions the current density becomes steady state as
given by Equation 13, whereby r is the microelectrode radius, n is number of electrons in
the reaction, D is the diffusion coefficient in cm2/s, C is the bulk concentration of the
electroactive species in mol/cm3, and r is the radius of the microelectrode in cm.
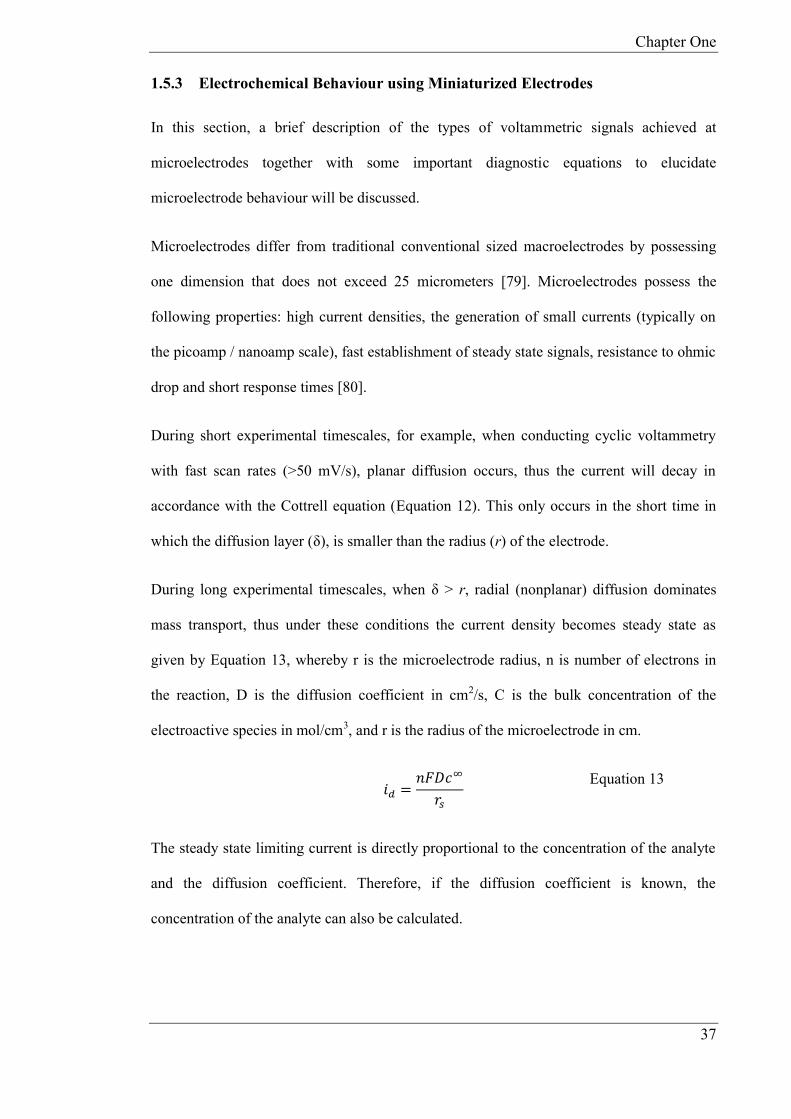
𝑖𝑑 =
𝑛𝐹𝐷𝑐∞
𝑟𝑠
Equation 13
The steady state limiting current is directly proportional to the concentration of the analyte
and the diffusion coefficient. Therefore, if the diffusion coefficient is known, the
concentration of the analyte can also be calculated.
Chapter One
38
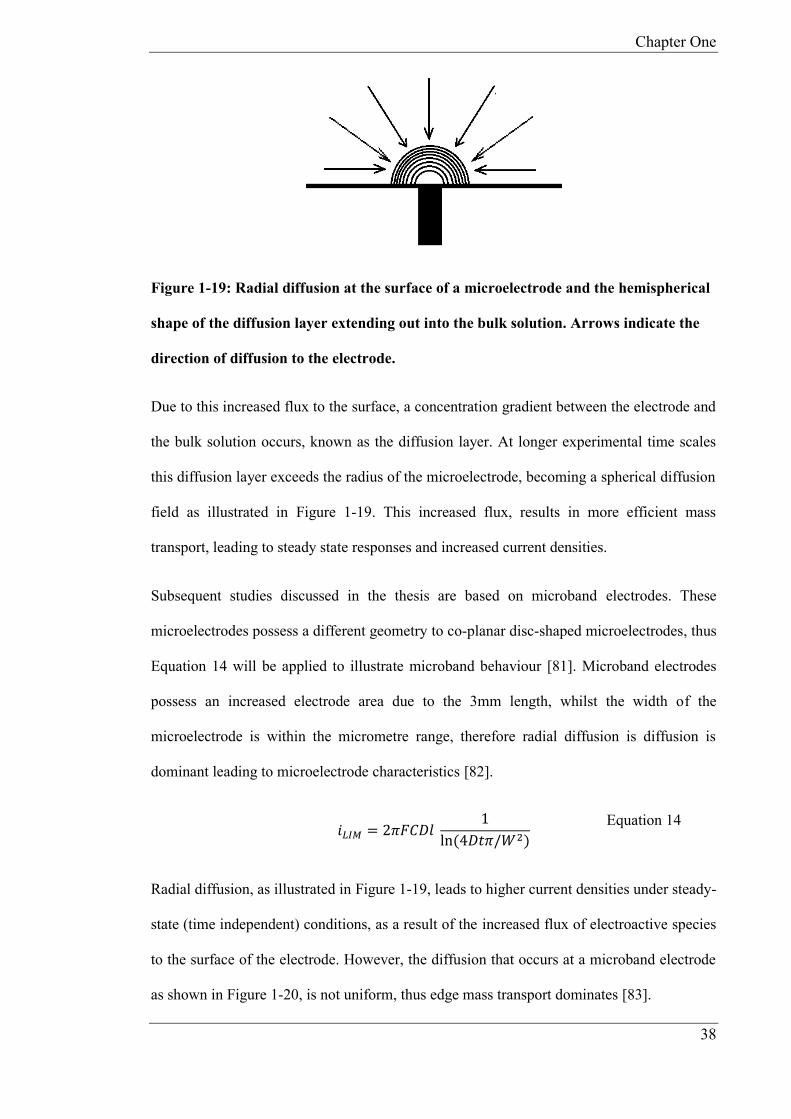
Figure 1-19: Radial diffusion at the surface of a microelectrode and the hemispherical
shape of the diffusion layer extending out into the bulk solution. Arrows indicate the
direction of diffusion to the electrode.
Due to this increased flux to the surface, a concentration gradient between the electrode and
the bulk solution occurs, known as the diffusion layer. At longer experimental time scales
this diffusion layer exceeds the radius of the microelectrode, becoming a spherical diffusion
field as illustrated in Figure 1-19. This increased flux, results in more efficient mass
transport, leading to steady state responses and increased current densities.
Subsequent studies discussed in the thesis are based on microband electrodes. These
microelectrodes possess a different geometry to co-planar disc-shaped microelectrodes, thus
Equation 14 will be applied to illustrate microband behaviour [81]. Microband electrodes
possess an increased electrode area due to the 3mm length, whilst the width of the
microelectrode is within the micrometre range, therefore radial diffusion is diffusion is
dominant leading to microelectrode characteristics [82].
𝑖𝐿𝐼𝑀 = 2𝜋𝐹𝐶𝐷𝑙
1
ln(4𝐷𝑡𝜋/𝑊2)
Equation 14
Radial diffusion, as illustrated in Figure 1-19, leads to higher current densities under steady-
state (time independent) conditions, as a result of the increased flux of electroactive species
to the surface of the electrode. However, the diffusion that occurs at a microband electrode
as shown in Figure 1-20, is not uniform, thus edge mass transport dominates [83].
Chapter One
39
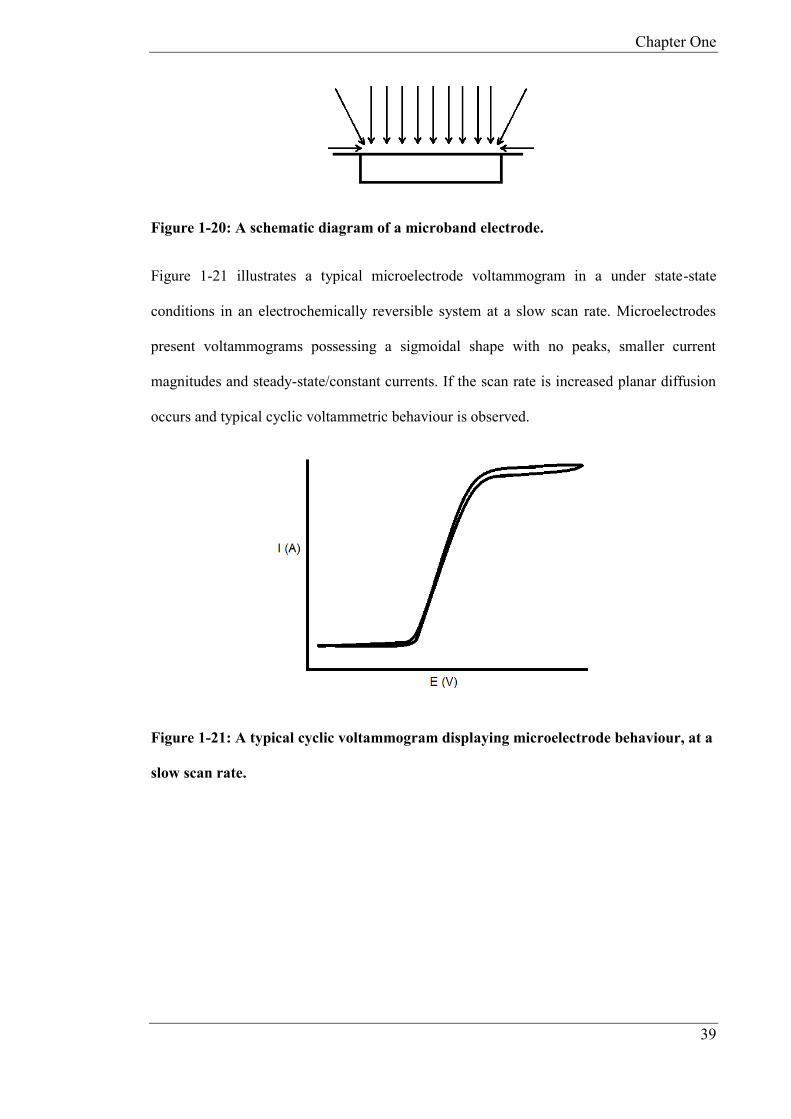
Figure 1-20: A schematic diagram of a microband electrode.
Figure 1-21 illustrates a typical microelectrode voltammogram in a under state-state
conditions in an electrochemically reversible system at a slow scan rate. Microelectrodes
present voltammograms possessing a sigmoidal shape with no peaks, smaller current
magnitudes and steady-state/constant currents. If the scan rate is increased planar diffusion
occurs and typical cyclic voltammetric behaviour is observed.
Figure 1-21: A typical cyclic voltammogram displaying microelectrode behaviour, at a
slow scan rate.

Chapter One
40
1.6 Aims and Objectives
The aim of the work described in this thesis was to develop amperometric, screen printed
glutamate biosensors and to apply these devices for the determination of glutamate in
clinical and food studies, as well as to toxicity studies. For the latter the intention was to
monitor, glutamate released by HepG2 cells in response to toxic challenge from
paracetamol. The objectives were;
Development of a glutamate biosensor utilising glutamate dehydrogenase, NAD+
based on Meldola’s Blue screen printed carbon electrodes.
Immobilisation of the enzyme glutamate dehydrogenase to the surface of the
working electrode the MB-SPCE to produce glutamate biosensors.
Optimisation of the biosensor working conditions and the determination of the
glutamate content of food and clinical samples utilising standard addition.
Further development of the biosensor to immobilize the cofactor NAD+ onto the
surface of the screen-printed carbon electrode.
The miniaturisation of the biosensor in order to develop microband biosensors for
the determination of glutamate released by HepG2 cells in response to toxic challenge.
Development of an electrode holder to simultaneously immerse the biosensor within
the cell media solution for the interrogation of the cells, whilst reducing evaporation and
allowing for gas exchange between the cell media and atmosphere.
Development of a conventional sized reagentless glutamate biosensor.
Optimisation of the biosensor components and working conditions, in order to apply
the reagentless biosensor to the determination of glutamate in complex samples.
Chapter One
41
1.7 References
[1] D. Purves, G. J. Augustine, D. Fitzpatrick, L. C. Katz, A.-S. LaMantia, J. O.
McNamara, and S. M. Williams, “Glutamate.” Sinauer Associates, (2001).
[2] E. M. Tsapakis, (2002), “Glutamate and psychiatric disorders,” Adv. Psychiatr.
Treat., 8, 189–197.
[3] J. J. Vornov, R. C. Tasker, and J. Park, (1995), “Neurotoxicity of acute glutamate
transport blockade depends on coactivation of both NMDA and AMPA/Kainate
receptors in organotypic hippocampal cultures.,” Exp. Neurol., 133, 7–17.
[4] A. Lau and M. Tymianski, (2010), “Glutamate receptors, neurotoxicity and
neurodegeneration.,” Pflugers Arch., 460, 525–42.
[5] D. A. Butterfield and C. B. Pocernich, (2003), “The glutamatergic system and
Alzheimer’s disease: therapeutic implications.,” CNS Drugs, 17, 641–52.
[6] J. M. Berg, J. L. Tymoczko, and L. Stryer, “The First Step in Amino Acid
Degradation Is the Removal of Nitrogen.” W H Freeman, (2002).
[7] J. T. Brosnan, (2000), “Glutamate, at the interface between amino acid and
carbohydrate metabolism.,” J. Nutr., 130, 988S–90S.
[8] J. T. Brosnan, K. C. Man, D. E. Hall, S. A. Colbourne, and M. E. Brosnan,
(1983), “Interorgan metabolism of amino acids in streptozotocin-diabetic
ketoacidotic rat.,” Am. J. Physiol., 244, E151–8.
[9] S. L. Fink and B. T. Cookson, (2005), “Apoptosis, pyroptosis, and necrosis:
mechanistic description of dead and dying eukaryotic cells.,” Infect. Immun., 73,
1907–16.

Chapter One
42
[10] “Cost to Develop New Pharmaceutical Drug Now Exceeds $2.5B - Scientific
American.” [Online]. Available: http://www.scientificamerican.com/article/cost-
to-develop-new-pharmaceutical-drug-now-exceeds-2-5b/. [Accessed: 08-Apr-
2015].
[11] M. R. Fielden and K. L. Kolaja, (2008), “The role of early in vivo toxicity testing
in drug discovery toxicology.,” Expert Opin. Drug Saf., 7, 107–10.
[12] M. B. Bracken, (2009), “Why animal studies are often poor predictors of human
reactions to exposure.,” J. R. Soc. Med., 102, 120–2.
[13] G. Repetto, A. del Peso, and J. L. Zurita, (2008), “Neutral red uptake assay for
the estimation of cell viability/cytotoxicity.,” Nat. Protoc., 3, 1125–31.
[14] R. R. Tice, E. Agurell, D. Anderson, B. Burlinson, A. Hartmann, H. Kobayashi,
Y. Miyamae, E. Rojas, J. C. Ryu, and Y. F. Sasaki, (2000), “Single cell gel/comet
assay: guidelines for in vitro and in vivo genetic toxicology testing.,” Environ.
Mol. Mutagen., 35, 206–21.
[15] A. Astashkina, B. Mann, and D. W. Grainger, (2012), “A critical evaluation of in
vitro cell culture models for high-throughput drug screening and toxicity.,”
Pharmacol. Ther., 134, 82–106.
[16] R. C. Alkire, D. M. Kolb, and J. Lipkowski, Eds., Advances in Electrochemical
Science and Engineering. Weinheim, Germany: Wiley-VCH Verlag GmbH &
Co. KGaA, (2011).
[17] W. G. E. J. Schoonen, J. A. D. M. de Roos, W. M. A. Westerink, and E. Débiton,
(2005), “Cytotoxic effects of 110 reference compounds on HepG2 cells and for

Chapter One
43
60 compounds on HeLa, ECC-1 and CHO cells. II mechanistic assays on
NAD(P)H, ATP and DNA contents.,” Toxicol. In Vitro, 19, 491–503.
[18] J. Xu, M. Ma, and W. M. Purcell, (2003), “Characterisation of some cytotoxic
endpoints using rat liver and HepG2 spheroids as in vitro models and their
application in hepatotoxicity studies. I. Glucose metabolism and enzyme release
as cytotoxic markers,” Toxicol. Appl. Pharmacol., 189, 100–111.
[19] R. M. Pemberton, F. J. Rawson, J. Xu, R. Pittson, G. A. Drago, J. Griffiths, S. K.
Jackson, and J. P. Hart, (2010), “Application of screen-printed microband
biosensors incorporated with cells to monitor metabolic effects of potential
environmental toxins,” Microchim. Acta, 170, 321–330.
[20] S. Knasmüller, V. Mersch-Sundermann, S. Kevekordes, F. Darroudi, W. W.
Huber, C. Hoelzl, J. Bichler, and B. J. Majer, (2004), “Use of human-derived
liver cell lines for the detection of environmental and dietary genotoxicants;
current state of knowledge.,” Toxicology, 198, 315–28.
[21] J. V. Castell and M. José Gómez-Lechón, In Vitro Methods in Pharmaceutical
Research. Academic Press, (1996).
[22] S. Wilkening, F. Stahl, and A. Bader, (2003), “Comparison of primary human
hepatocytes and hepatoma cell line Hepg2 with regard to their biotransformation
properties.,” Drug Metab. Dispos., 31, 1035–42.
[23] S. J. Fey and K. Wrzesinski, (2012), “Determination of drug toxicity using 3D
spheroids constructed from an immortal human hepatocyte cell line.,” Toxicol.
Sci., 127, 403–11.

Chapter One
44
[24] L. C. CLARK and C. LYONS, (1962), “Electrode systems for continuous
monitoring in cardiovascular surgery.,” Ann. N. Y. Acad. Sci., 102, 29–45.
[25] J. Wang, (2001), “Glucose Biosensors: 40 Years of Advances and Challenges,”
Electroanalysis, 13, 983–988.
[26] J. Wang, (2008), “Electrochemical glucose biosensors.,” Chem. Rev., 108, 814–
25.
[27] S. F. Clarke and J. R. Foster, (2012), “A history of blood glucose meters and their
role in self-monitoring of diabetes mellitus.,” Br. J. Biomed. Sci., 69, 83–93.
[28] D. Thévenot, K. Toth, R. Durst, and G. Wilson, (2001), “Electrochemical
biosensors: recommended definitions and classification,” Biosens. Bioelectron.,
16, 121–131.
[29] B. R. Eggins, Chemical Sensors and Biosensors (Google eBook). John Wiley &
Sons, (2008).
[30] L. Gorton, Biosensors and Modern Biospecific Analytical Techniques. Elsevier,
(2005).
[31] F. Tasca, M. N. Zafar, W. Harreither, G. Nöll, R. Ludwig, and L. Gorton, (2011),
“A third generation glucose biosensor based on cellobiose dehydrogenase from
Corynascus thermophilus and single-walled carbon nanotubes.,” Analyst, 136,
2033–6.
[32] M. N. Zafar, G. Safina, R. Ludwig, and L. Gorton, (2012), “Characteristics of
third-generation glucose biosensors based on Corynascus thermophilus cellobiose
Chapter One
45
dehydrogenase immobilized on commercially available screen-printed electrodes
working under physiological conditions.,” Anal. Biochem., 425, 36–42.
[33] J. D. Newman, A. P. F. Turner, and G. Marrazza, (1992), “Ink-jet printing for the
fabrication of amperometric glucose biosensors,” Anal. Chim. Acta, 262, 13–17.
[34] I. Takatsu and T. Moriizumi, (1987), “Solid state biosensors using thin-film
electrodes,” Sensors and Actuators, 11, 309–317.
[35] J. Wang., Analytical electrochemistry. Wiley-VCH.
[36] P. Kugler and K. H. Wrobel, (1978), “Meldola blue: a new electron carrier for the
histochemical demonstration of dehydrogenases (SDH, LDH, G-6-PDH).,”
Histochemistry, 59, 97–109.
[37] “Electrode for the electrochemical regeneration of coenzyme, a method of
making said electrode, and the use thereof.” (25-Dec-1984).
[38] L. Gorton, A. Torstensson, H. Jaegfeldt, and G. Johansson, (1984),
“Electrocatalytic oxidation of reduced nicotinamide coenzymes by graphite
electrodes modified with an adsorbed phenoxazinium salt, meldola blue,” J.
Electroanal. Chem. Interfacial Electrochem., 161, 103–120.
[39] S. D. Sprules, J. P. Hart, S. A. Wring, and R. Pittson, (1994), “Development of a
disposable amperometric sensor for reduced nicotinamide adenine dinucleotide
based on a chemically modified screen-printed carbon electrode,” Analyst, 119,
253.

Chapter One
46
[40] A. S. Santos, R. S. Freire, and L. T. Kubota, (2003), “Highly stable amperometric
biosensor for ethanol based on Meldola’s blue adsorbed on silica gel modified
with niobium oxide,” J. Electroanal. Chem., 547, 135–142.
[41] L. Zhu, J. Zhai, R. Yang, C. Tian, and L. Guo, (2007), “Electrocatalytic oxidation
of NADH with Meldola’s blue functionalized carbon nanotubes electrodes.”
[42] L. T. Kubota, F. Gouvea, A. N. Andrade, B. G. Milagres, and G. De Oliveira
Neto, (1996), “Electrochemical sensor for NADH based on Meldola’s blue
immobilized on silica gel modified with titanium phosphate,” Electrochim. Acta,
41, 1465–1469.
[43] G. Marko-Varga, R. Appelqvist, and L. Gorton, (1986), “A glucose sensor based
on glucose dehydrogenase adsorbed on a modified carbon electrode,” Anal.
Chim. Acta, 179, 371–379.
[44] S. D. Sprules, J. P. Hart, S. A. Wring, and R. Pittson, (1995), “A reagentless,
disposable biosensor for lactic acid based on a screen-printed carbon electrode
containing Meldola’s Blue and coated with lactate dehydrogenase, NAD+ and
cellulose acetate,” Anal. Chim. Acta, 304, 17–24.
[45] M. Piano, S. Serban, R. Pittson, G. a Drago, and J. P. Hart, (2010),
“Amperometric lactate biosensor for flow injection analysis based on a screen-
printed carbon electrode containing Meldola’s Blue-Reinecke salt, coated with
lactate dehydrogenase and NAD+.,” Talanta, 82, 34–7.
[46] A. K. Abass, J. P. Hart, D. C. Cowell, and A. Chappell, (1998), “Development of
an amperometric assay for NH+4 based on a chemically modified screen-printed
NADH sensor,” Anal. Chim. Acta, 373, 1–8.
Chapter One
47
[47] R. Doaga, T. McCormac, and E. Dempsey, (2009), “Electrochemical Sensing of
NADH and Glutamate Based on Meldola Blue in 1,2-Diaminobenzene and 3,4-
Ethylenedioxythiophene Polymer Films,” Electroanalysis, 21, 2099–2108.
[48] S. D. Sprules, I. C. Hartley, R. Wedge, J. P. Hart, and R. Pittson, (1996), “A
disposable reagentless screen-printed amperometric biosensor for the
measurement of alcohol in beverages,” Anal. Chim. Acta, 329, 215–221.
[49] C. A. B. Garcia, G. de Oliveira Neto, L. T. Kubota, and L. A. Grandin, (1996),
“A new amperometric biosensor for fructose using a carbon paste electrode
modified with silica gel coated with Meldola’s Blue and fructose 5-
dehydrogenase,” J. Electroanal. Chem., 418, 147–151.
[50] R. F. de Castilho, E. B. R. de Souza, R. V. da Silva Alfaya, and A. A. da Silva
Alfaya, (2008), “Meldola’s Blue Immobilized on a SiO2/SnO2/Phosphate
Xerogel, a New Sensor for Determination of Ascorbic Acid in Medicine and
Commercial Fruit Juice,” Electroanalysis, 20, 157–162.
[51] F. Scheller and F. Schubert, Biosensors, 21. Elsevier, (1991).
[52] R. C. Alkire, D. M. Kolb, J. Lipkowski, and P. N. Ross, Bioelectrochemistry:
Fundamentals, Applications and Recent Developments. John Wiley & Sons,
(2013).
[53] S. Datta, L. R. Christena, and Y. R. S. Rajaram, (2012), “Enzyme
immobilization: an overview on techniques and support materials,” 3 Biotech, 3,
1–9.
Chapter One
48
[54] R. A. Sheldon, (2007), “Enzyme Immobilization: The Quest for Optimum
Performance,” Adv. Synth. Catal., 349, 1289–1307.
[55] N. C. Foulds and C. R. Lowe, (1986), “Enzyme entrapment in electrically
conducting polymers. Immobilisation of glucose oxidase in polypyrrole and its
application in amperometric glucose sensors,” J. Chem. Soc. Faraday Trans. 1
Phys. Chem. Condens. Phases, 82, 1259.
[56] T. Jesionowski, J. Zdarta, and B. Krajewska, (2014), “Enzyme immobilization by
adsorption: a review,” Adsorption, 20, 801–821.
[57] B. Krajewska, (2004), “Application of chitin- and chitosan-based materials for
enzyme immobilizations: a review,” Enzyme Microb. Technol., 35, 126–139.
[58] H. S. Stoker, Organic and Biological Chemistry. Cengage Learning, (2012).
[59] D. E. Koshland, (1995), “The Key–Lock Theory and the Induced Fit Theory,”
Angew. Chemie Int. Ed. English, 33, 2375–2378.
[60] R. B. Silverman, The Organic Chemistry of Enzyme-catalyzed Reactions.
Academic Press, (2002).
[61] J. M. Berg, J. L. Tymoczko, and L. Stryer, “The Michaelis-Menten Model
Accounts for the Kinetic Properties of Many Enzymes.” W H Freeman, (2002).
[62] R. A. Copeland, Enzymes: A Practical Introduction to Structure, Mechanism, and
Data Analysis. John Wiley & Sons, (2004).

Chapter One
49
[63] M. Li, C. Li, A. Allen, C. A. Stanley, and T. J. Smith, (2012), “The structure and
allosteric regulation of mammalian glutamate dehydrogenase.,” Arch. Biochem.
Biophys., 519, 69–80.
[64] T. J. . B. P. J. . B. K. L. . R. D. W. Stillman, (1993), “Conformational flexibility
in glutamate dehydrogenase. Role of water in substrate recognition and
catalysis.,” J.Mol.Biol., 234, 1131–1139.
[65] R. A. H. P. D., R. A. Harvey, and D. R. Ferrier, Biochemistry. Lippincott
Williams & Wilkins, (2011).
[66] M. W. King, “Nitrogen Metabolism and the Urea Cycle,” The Medical
Biochemistry Page, (2013). [Online]. Available:
http://themedicalbiochemistrypage.org/nitrogen-metabolism.php. [Accessed: 15-
Nov-2013].
[67] M. J. Lobo, A. J. Miranda, and P. Tuñón, (1997), “Amperometric biosensors
based on NAD(P)-dependent dehydrogenase enzymes,” Electroanalysis, 9, 191–
202.
[68] V. S. Bagotsky, Fundamentals of Electrochemistry. John Wiley & Sons, (2005).
[69] J. Wang, B. Tian, V. B. Nascimento, and L. Angnes, (1998), “Performance of
screen-printed carbon electrodes fabricated from different carbon inks,”
Electrochim. Acta, 43, 3459–3465.
[70] Electroanalytical Methods: Guide to Experiments and Applications, 28. Springer
Science & Business Media, (2009).
[71] A. J. Fry, Synthetic Organic Electrochemistry. John Wiley & Sons, (1989).
Chapter One
50
[72] P. T. Kissinger and W. R. Heineman, (1983), “Cyclic voltammetry,” J. Chem.
Educ., 60, 702.
[73] P. T. Kissinger and W. R. Heineman, Laboratory Techniques in Electroanalytical
Chemistry, Second Edition, Revised and Expanded. CRC Press, (1996).
[74] A. C. Fisher, Electrode Dynamics. Oxford University Press, (1996).
[75] T. Kuwana, Physical Methods in Modern Chemical Analysis, Volume 3. Elsevier,
(1983).
[76] J. Cooper and T. Cass, Biosensors. Oxford University Press, USA, (2004).
[77] R. A. Marusak, K. Doan, and S. D. Cummings, Integrated Approach to
Coordination Chemistry. Hoboken, NJ, USA: John Wiley & Sons, Inc., (2007).
[78] J. O. Bockris, A. K. N. Reddy, and M. Gamboa-Aldeco, Modern
Electrochemistry, Volume 2. Springer, (2000).
[79] J. Wang, Analytical Electrochemistry. John Wiley & Sons, (2004).
[80] R. J. Forster, (1994), “Microelectrodes: new dimensions in electrochemistry,”
Chem. Soc. Rev., 23, 289.
[81] J. P. Metters, R. O. Kadara, and C. E. Banks, (2012), “Electroanalytical
properties of screen printed graphite microband electrodes,” Sensors Actuators B
Chem., 169, 136–143.
[82] J. P. Metters, R. O. Kadara, and C. E. Banks, (2013), “Fabrication of co-planar
screen printed microband electrodes.,” Analyst, 138, 2516–21.

Chapter One
51
[83] A. M. Bond, Broadening Electrochemical Horizons: Principles and Illustration
of Voltammetric and Related Techniques. Oxford University Press, (2002).
Chapter Two
52
CHAPTER TWO
Literature Review: The design, development and
application of electrochemical glutamate biosensors

Chapter Two
53
2. Contents
2.1 Introduction ......................................................................................................... 54
2.2 Biosensors based on glutamate oxidase .......................................................... 54
2.2.1 Entrapment ...................................................................................................... 54
2.2.2 Covalent-bonding ............................................................................................ 56
2.2.3 Cross-linking ................................................................................................... 57
2.3 Biosensors based on glutamate dehydrogenase .............................................. 59
2.3.1 Entrapment ...................................................................................................... 60
2.3.2 Covalent Bonding ........................................................................................... 64
2.3.3 Crosslinking .................................................................................................... 65
2.4 Conclusions ..................................................................................................... 66
2.5 References ....................................................................................................... 71
Chapter Two
54
2.1 Introduction
This review discusses electrochemical biosensors fabricated based on glutamate oxidase or
glutamate dehydrogenase. The method of enzyme immobilization and, where applicable,
the application of glutamate biosensors to biological and food samples.
2.2 Biosensors based on glutamate oxidase
In this section, the fabrication methods are sub-divided according to the technique of
enzyme immobilization. The electrochemical response can generally be described by the
following equations:
Glutamate + O2 GluOx
H2O2 + α-ketoglutarate (1)
H2O2
2H+ + O2 + 2e
- (2)
Equation 1 represents the enzymatic oxidation of the glutamate to form α-ketoglutarate and
H2O2. Equation 2 describes the electrochemical detection of hydrogen peroxide at the base
transducer which generates the analytical response.
2.2.1 Entrapment
The entrapment of enzymes is defined as the integration of an enzyme within the lattice of a
polymer matrix or a membrane, whilst retaining the protein structure of the enzyme [10]. In
addition to the immobilization of enzymes, membranes can also eliminate potential
interfering species that may be present in complex media such as serum and food.
A selective biosensor for the determination of glutamate in food seasoning was developed
by incorporating glutamate oxidase into a poly(carbamoyl) sulfonate (PCS) hydrogel. The
GluOx-PCS mixture was then drop-coated onto the surface of a thick-film platinum
electrode [11]. Liquid samples (1, 10 and 100µL) were diluted to 10mL with phosphate
buffer. The biosensor was then utilised to determine the glutamate recovery from different
concentrations of the sample. The results generated correlated favourably with a L-
glutamate colorimetric test kit.
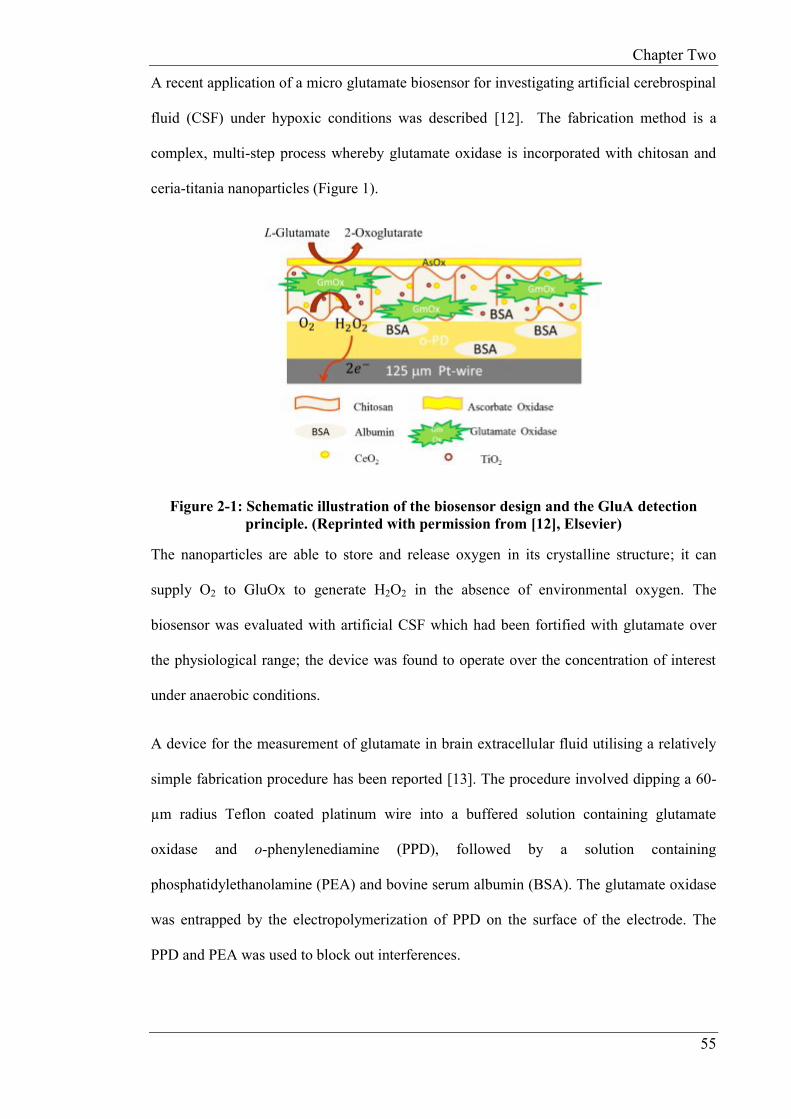
Chapter Two
55
A recent application of a micro glutamate biosensor for investigating artificial cerebrospinal
fluid (CSF) under hypoxic conditions was described [12]. The fabrication method is a
complex, multi-step process whereby glutamate oxidase is incorporated with chitosan and
ceria-titania nanoparticles (Figure 1).
Figure 2-1: Schematic illustration of the biosensor design and the GluA detection
principle. (Reprinted with permission from [12], Elsevier)
The nanoparticles are able to store and release oxygen in its crystalline structure; it can
supply O2 to GluOx to generate H2O2 in the absence of environmental oxygen. The
biosensor was evaluated with artificial CSF which had been fortified with glutamate over
the physiological range; the device was found to operate over the concentration of interest
under anaerobic conditions.
A device for the measurement of glutamate in brain extracellular fluid utilising a relatively
simple fabrication procedure has been reported [13]. The procedure involved dipping a 60-
µm radius Teflon coated platinum wire into a buffered solution containing glutamate
oxidase and o-phenylenediamine (PPD), followed by a solution containing
phosphatidylethanolamine (PEA) and bovine serum albumin (BSA). The glutamate oxidase
was entrapped by the electropolymerization of PPD on the surface of the electrode. The
PPD and PEA was used to block out interferences.
Chapter Two
56
An interesting entrapment approach employing polymers to encapsulate GluOx onto a gold
electrode has been reported [14]. The first step involved the immersion of a gold disc
electrode in 3-mercaptopropionic acid (MPA) solution, followed by drop-coating layers of
poly-L-lysine and poly(4-styrenesulfonate). Once dry, a mixture of GluOx and
glutaraldehyde was drop-coated on to the surface to form a bilayer. The authors suggested
that MPA increases the adhesion of the polyion complex to the gold surface by the
electrostatic interaction between the carboxyl groups present on the MPA and the amino
groups present on the poly-L-lysine. A response time of only 3 seconds was achieved after
an addition of 20nM glutamic acid, which gave a current of 0.037 nA (1.85 nA/µM). A
linear response was observed between 20µM and 200µM. Both the response time and limit
of detection are superior to previously discussed biosensors. It was suggested that the rapid
response was due to the close proximity of the enzymatic reaction to the surface of the
electrode. For this method of fabrication of glutamate oxidase based biosensors, the latter
approach leads to the lowest limit of detection.
The increased interest in glutamate measurement has led to the commercial development of
an in vivo glutamate biosensor by Pinnacle Technology Inc. [15]; this has been successfully
used for monitoring of real-time changes of glutamate concentrations in rodent brain. The
biosensor employs an enzyme layer composed of GluOx and an “inner-selective”
membrane, composed of an undisclosed material that eliminates interferences. The
enzymatically generated hydrogen peroxide is monitored using a platinum-iridium
electrode. The biosensor possesses a linear-range up to 50µM. The manufacturers indicate
that the miniaturised biosensor requires calibration upon completion of an experiment in
order to ensure the selectivity and integrity of the sensors.
2.2.2 Covalent-bonding
The application of a glutamate oxidase based biosensor for the measurement of glutamate in
the serum of healthy and epileptic patients has been described [16]. The fabrication method

Chapter Two
57
consists of electrodepositing chitosan (CHIT), gold nanoparticles (AuNP) and multiwalled
carbon nanotubes (MWCNTs) on the surface of a gold electrode.
The serum sample was diluted with phosphate buffer solution (PBS) before analysis. The
concentration of the glutamate in the sample was determined using a standard calibration
curve constructed from the amperometric responses obtained with glutamate in PBS. The
results compared favourably with a colorimetric test kit. A low operating potential of
+0.135 V vs. Ag/AgCl for measuring the enzymatically generated H2O2 was significantly
lower than other biosensors based on GluOx [13,17], The time taken to reach 95% of the
maximum steady state response was 2 seconds after the initial injection. This method of
fabrication whilst complex, possesses a significantly lower operating potential when
compared to other biosensors fabricated using entrapment techniques.
2.2.3 Cross-linking
Enzyme immobilization can be achieved by intermolecular cross-linking of the protein
structure of the enzyme to other protein molecules or within an insoluble support matrix.
Jamal et. al. [17] have described a complex entrapment method which consisted of drop-
coating a 10µL mixture of GluOx (25U in 205µL), 2mg of BSA, 20µL of glutaraldehyde
(2.5% w/v) and 10µL of Nafion (0.5%) onto a platinum nanoparticle modified gold
nanowire array (PtNP-NAE) and allowing it to dry overnight under ambient conditions. The
fabrication technique is illustrated in Figure 2-2. The analytical response results from the
oxidation of H2O2 at the gold nanowire electrode as illustrated in Equation 2.
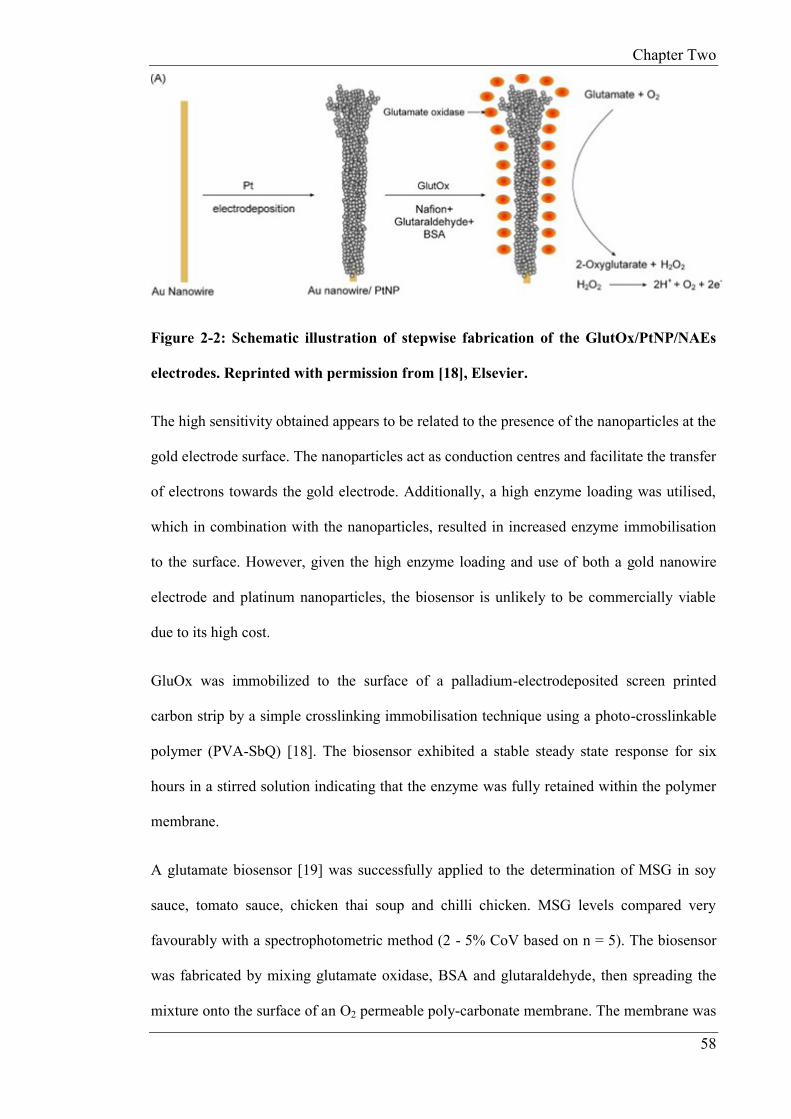
Chapter Two
58
Figure 2-2: Schematic illustration of stepwise fabrication of the GlutOx/PtNP/NAEs
electrodes. Reprinted with permission from [18], Elsevier.
The high sensitivity obtained appears to be related to the presence of the nanoparticles at the
gold electrode surface. The nanoparticles act as conduction centres and facilitate the transfer
of electrons towards the gold electrode. Additionally, a high enzyme loading was utilised,
which in combination with the nanoparticles, resulted in increased enzyme immobilisation
to the surface. However, given the high enzyme loading and use of both a gold nanowire
electrode and platinum nanoparticles, the biosensor is unlikely to be commercially viable
due to its high cost.
GluOx was immobilized to the surface of a palladium-electrodeposited screen printed
carbon strip by a simple crosslinking immobilisation technique using a photo-crosslinkable
polymer (PVA-SbQ) [18]. The biosensor exhibited a stable steady state response for six
hours in a stirred solution indicating that the enzyme was fully retained within the polymer
membrane.
A glutamate biosensor [19] was successfully applied to the determination of MSG in soy
sauce, tomato sauce, chicken thai soup and chilli chicken. MSG levels compared very
favourably with a spectrophotometric method (2 - 5% CoV based on n = 5). The biosensor
was fabricated by mixing glutamate oxidase, BSA and glutaraldehyde, then spreading the
mixture onto the surface of an O2 permeable poly-carbonate membrane. The membrane was
Chapter Two
59
then attached to an oxygen probe using a push cap system and oxygen consumption was
measured at an applied potential of -0.7 V; this is a considerably more negative operating
potential compared to previously discussed biosensors. In this case, the response is a result
of the reduction reaction shown in Equation 3.
O2 + 2e- + 2H+ H2O2 (3)
The lowest limit of detection achieved with a glutamate biosensor was fabricated by
covalently immobilizing glutamate oxidase onto polypyrrole nanoparticles and polyaniline
composite film (PPyNPs/PANI) [20]. Cyclic voltammetry was used to co-electropolymerize
the compounds onto the surface. The PPyNPs act as an electron transfer mediator which
allows a low operating potential to be employed (+85 mVs), that reduces the likelihood of
oxidising interferences. The authors also claim that this leads to an increase in the
sensitivity of the biosensor. The biosensor was successfully applied to the determination of
glutamate in food samples including tomato soup and noodles. High recoveries of 95% -
97% were achieved which compares favourably with values attained by previously
discussed biosensors [19].
2.3 Biosensors based on glutamate dehydrogenase
This section is subdivided in a similar way to section 2, ie: according to the method of
immobilization. The electrochemical response can generally be described by the following
equations:
Glutamate + NAD+ GLDH
NADH + α-ketoglutarate (4)
NADH + Mediatorox
NAD+ + Mediatorred (5)
Mediatorred
ne- + mH
+ + Mediatorox (6)
Equation 4 represents the enzymatic reduction of the cofactor NAD+ to NADH and the
oxidation of glutamate to α-ketoglutarate. Equation 5 represents the electrochemical
reduction of the oxidised mediator to the reduced form (Mediatorred). Equation 6 describes
the electrochemical oxidation of Mediatorred at the base transducer which generates the
Chapter Two
60
analytical response; the regenerated mediator ox, can then undergo further reactions with
NADH. Equations 4 and 5 represent the electrocatalytic oxidation of NADH, which occurs
at lower applied potentials than obtained by the direct electrochemical oxidation of NADH
at an unmodified electrode.
2.3.1 Entrapment
A simple fabrication method based on the integration of a liver mitochondrial fraction
containing glutamate dehydrogenase was employed for the fabrication of a novel glutamate
biosensor. The liver mitochondrial fraction was utilised in an attempt to reduce the cost of
the biosensor, however, the activity of the biosensor appeared to be compromised in
comparison to the biosensor incorporating purified glutamate dehydrogenase. The
biological recognition element was mixed with a carbon paste, packed into an tube, and
used in the determination of MSG in chicken bouillon cubes [21]. The enzymatically
generated NADH was oxidised using ferricyanide as a electrochemical mediator. High
recoveries of MSG were achieved. Several amino acids, commonly found in food products,
did not interfere with the determination. Extensive pre-treatment of the food sample,
consisting of dissolving, vacuum-filtering, washing and then further diluting the sample in
buffer, was required before analysis, in contrast to simpler food preparation methods
previously discussed [19].
A novel biosensor fabrication technique was developed by Tang et. al. [22] which consisted
of entrapping GLDH between layers of alternating poly(amidoamine) dendrimer-
encapsulated platinum nanoparticles (Pt-PAMAM) with multi-walled carbon nanotubes.
PAMAM’s were used to modify the surface of the glassy carbon electrode due to their
excellent biocompatibility and chemical fixation properties. The procedure was repeated
using positively charged Pt-PAMAM and negatively charged GLDH which were
alternatively adsorbed onto the CNTs in a layer-by-layer process. The assembly process and
enzyme immobilisation process is illustrated in Figure 2-3.

Chapter Two
61
Figure 2-3: Schematic showing the procedure of immobilizing Pt-PAMAM onto CNTs
(a) and the layer-by-layer self-assembly of GLDH and Pt-PAMAM onto CNTs (b). Pt-
PAMAM/CNTs heterostructures were attached covalently via EDC, Pt-PAMAM and
GLDH were alternately deposited. Reprinted with permission from [24], Elsevier.
Whilst the fabrication procedure is complex, the biosensor possesses superior sensitivity to
previously discussed biosensors.
In contrast to the above, a simpler and less time consuming method of fabricating a
glutamate biosensor has been described [23] which involved incorporating GLDH and
NAD+ into carbon paste. The mixture was inserted in a holder, placed in to a solution
containing O-phenylenediamine and subsequently electropolymerized. The o-
phenylenediamine film is simultaneously able to prevent interferences and facilitate the
amperometric detection of NADH at low applied potentials by acting as an electron
mediator. The biosensor was used to determine glutamate in chicken bouillon cubes; the
results compared favourably to those obtained using a spectrophotometric method (12.6 ±
0.3% (n = 5) and 12.3% respectively). Despite the simpler fabrication method, the linear

Chapter Two
62
range and sensitivity of the biosensor was lower than the sensor described by Tang et. al.
[22].
In recent years, the biopolymer known as chitosan has been investigated in a variety of
studies as a method of entrapping enzymes for biosensor construction [24]. CHIT appears to
offer improved enzyme stability and is easy to immobilize onto a variety of materials. A
biosensor for glutamate [25] has been constructed by depositing a mixture of purified
CNTs, CHIT and MB onto a glassy carbon electrode and dried. The surface was then
treated with an aliquot of GLDH in PBS, and dried at 4ºC. The cofactor was present in free
solution at a concentration of 4mM. The selectivity of the biosensor was determined by the
addition of interferences (AA, UA), with no apparent amperometric responses being
generated. However, the application of the biosensor to clinical and food samples was not
described in this paper.
Screen-printing technology has offered the possibility of the mass production at low cost of
glutamate biosensors; these have been successfully applied to the measurement of glutamate
in serum and food samples [26]. As screen-printed devices are inexpensive to manufacture
they can be considered disposable, in comparison to glassy carbon electrodes, which are
expensive and are not considered disposable devices. Consequently, the former are much
convenient devices for fabricating biosensors and have become a popular route to
commercialisation. The fabrication method involved drop-coating CHIT (0.05%) onto the
surface of a Meldola’s Blue (MB) SPCE (MB-SPCE), followed by an aliquot of glutamate
dehydrogenase (3U/µL). This device is designated GLDH-CHIT-MB-SPCE. The biosensor
was then left to dry under vacuum at 4ºC overnight. NAD+ was present in free solution at a
concentration of 4mM.
The electro-catalyst Meldola’s Blue allowed an operating potential of only +100mV to be
employed; the response occurred as a result of the electrocatalytic oxidation of
enzymatically generated NADH. The biosensor was successfully applied to the
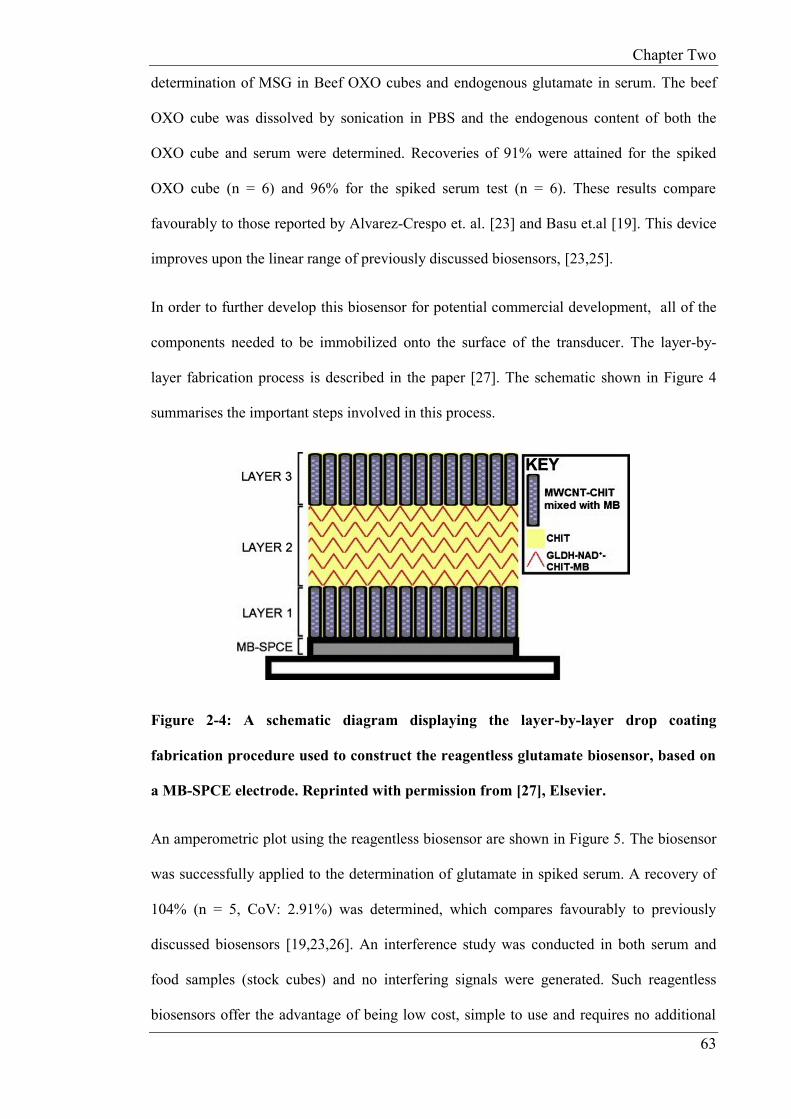
Chapter Two
63
determination of MSG in Beef OXO cubes and endogenous glutamate in serum. The beef
OXO cube was dissolved by sonication in PBS and the endogenous content of both the
OXO cube and serum were determined. Recoveries of 91% were attained for the spiked
OXO cube (n = 6) and 96% for the spiked serum test (n = 6). These results compare
favourably to those reported by Alvarez-Crespo et. al. [23] and Basu et.al [19]. This device
improves upon the linear range of previously discussed biosensors, [23,25].
In order to further develop this biosensor for potential commercial development, all of the
components needed to be immobilized onto the surface of the transducer. The layer-by-
layer fabrication process is described in the paper [27]. The schematic shown in Figure 4
summarises the important steps involved in this process.
Figure 2-4: A schematic diagram displaying the layer-by-layer drop coating
fabrication procedure used to construct the reagentless glutamate biosensor, based on
a MB-SPCE electrode. Reprinted with permission from [27], Elsevier.
An amperometric plot using the reagentless biosensor are shown in Figure 5. The biosensor
was successfully applied to the determination of glutamate in spiked serum. A recovery of
104% (n = 5, CoV: 2.91%) was determined, which compares favourably to previously
discussed biosensors [19,23,26]. An interference study was conducted in both serum and
food samples (stock cubes) and no interfering signals were generated. Such reagentless
biosensors offer the advantage of being low cost, simple to use and requires no additional
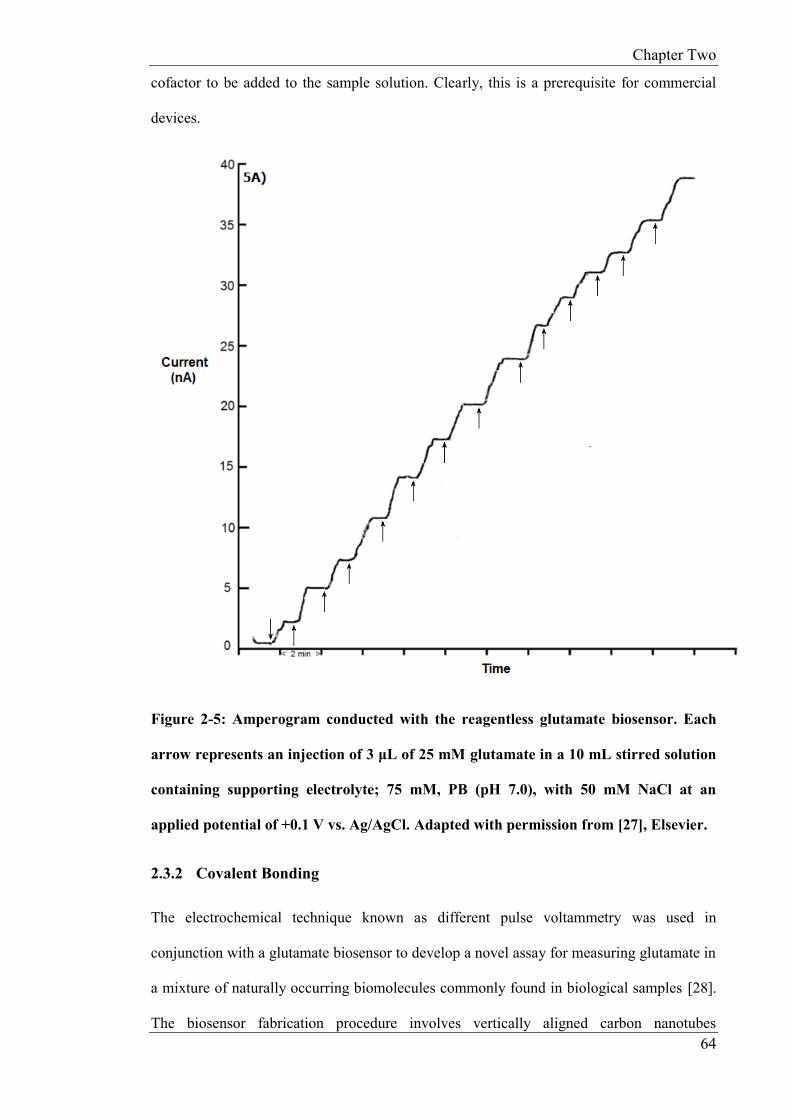
Chapter Two
64
cofactor to be added to the sample solution. Clearly, this is a prerequisite for commercial
devices.
Figure 2-5: Amperogram conducted with the reagentless glutamate biosensor. Each
arrow represents an injection of 3 μL of 25 mM glutamate in a 10 mL stirred solution
containing supporting electrolyte; 75 mM, PB (pH 7.0), with 50 mM NaCl at an
applied potential of +0.1 V vs. Ag/AgCl. Adapted with permission from [27], Elsevier.
2.3.2 Covalent Bonding
The electrochemical technique known as different pulse voltammetry was used in
conjunction with a glutamate biosensor to develop a novel assay for measuring glutamate in
a mixture of naturally occurring biomolecules commonly found in biological samples [28].
The biosensor fabrication procedure involves vertically aligned carbon nanotubes

Chapter Two
65
(VACNTs) which are treated in order to convert the tips of the CNTs into carboxylic acid
groups, in order to covalently bind the enzyme. GLDH was bound to the CNTs using 1-(3-
dimethylamino propyl)-3-ethylcarbondiimide hydrochloride (EDC) and hydroxyl-
sulfosuccinimide sodium salt (sulfo-NHS) to promote amide linkages between the
carboxylic tips of the CNTs and the lysine residue present on the enzyme. This was
achieved by immersing the electrode in a solution containing EDC/sulfo-NHS and mixed.
Once dried, the enzyme was drop-coated onto the electrode, dried for 2 hours and washed
with PBS/BSA mixture. The DPV obtained with the synthetic samples indicated that over
the concentration range studied, no significant interferences should be expected. However,
the biosensor was not applied to a real sample.
2.3.3 Crosslinking
Carbon nanotubes have been successfully employed to produce cross linking matrixes.
Single wall carbon nanotubes have been treated with thionine (Th) to produce a Th-
SWCNT nanocomposite on the surface of a glassy carbon electrode [29]. The
nanocomposite acts as both an electron mediator and enzyme immobilization matrix. The
GLDH was mixed with BSA and crossed linked with glutaraldehyde and coated onto the
Th-SWCNT layer. An applied potential of +190mV was utilised for amperometric
measurements. The linear range was found to superior to that which was achieved by
Gholiazadeh et. al. [28] and Tang et. al. [22]. Ascorbic acid, uric acid and 4-
acetamidophenol were examined as possible interferents; no discernible current responses
were seen.
Chapter Two
66
2.4 Conclusions
The review has highlighted some novel approaches to the fabrication of electrochemical
glutamate biosensors. The performance characteristics of the glutamate biosensors
discussed are summarised within Table 1. The most commonly reported method for the
immobilization of both glutamate oxidase and dehydrogenase is entrapment.
The utilisation of glutamate oxidase offers an advantage over glutamate dehydrogenase as
the latter requires the cofactor NAD+ to be co-immobilised onto the appropriate transducer.
In addition the response times are also generally shorter for glutamate oxidase based
biosensors. However, there are several drawbacks with the use of these biosensors.
Significantly higher applied potentials must be utilised in order to generate an amperometric
response from the enzymatic generation of H2O2. In contrast low operational potentials of
around 0 V can be applied with dehydrogenase based biosensors; which is advantageous
when measuring glutamate in complex media.
Expensive electrode materials such as gold and platinum are often used in the development
of glutamate biosensors utilising glutamate oxidase. In contrast, three glutamate biosensors
employing GLDH immobilized onto SPCE’s as the electrode material have been described.
SPCE’s offer an inexpensive approach to fabricating glutamate biosensors which is clearly
an important consideration in the commercialisation of such devices.
Finally, the cost of glutamate dehydrogenase is far lower than that of glutamate oxidase (as
of August 2015). 100mg (20U per mg) of glutamate dehydrogenase costs £175. By contrast,
glutamate oxidase is sold by Sigma for £88.20 per 1U. This is clearly an important
consideration for commercialisation.

Chapter Two
67
Table 2-1: Details of the enzyme immobilisation technique and performance characteristics of amperometric
glutamate biosensors based on glutamate oxidase and glutamate dehydrogenase
Legend: NS – Not specified, N/A – Not applicable * - Voltametric Measurement, ~ - Polarographic Measurement
Glutamate Oxidase based single enzyme systems
Immobilisation Technique Type Ref LOD Optimum
pH
V (vs.
Ag/AgCl) Sensitivity
Linear
Range Stability
Response
Time
Poly(carbamoylsulphonate)
(PCS) hydrogel mixed with
GluOx
Entrapment [11] 1.01µM 6.86 +400mV 1.94 nA/µM 100 -
5000µM
90% of activity
retained after 2
weeks.
NS
Mixed ceria and titania
nanoparticles for the detection
of glutamate in hypoxic
environments
Entrapment [12] 0.594µ
M 7.4
+600mV
0.7937
nA/µM 5 – 50µM
75% of signal
after 70 assays
in aerobic
environment.
Anaerobic
enviroment,
stable for 8
assays.
~5
Biosensor for Neurotransmitter
L-Glutamic Acid Designed for
Efficient Use of L-Glutamate
Oxidase and Effective
Rejection of Interferences
Entrapment [13] 0.27 µM 7.4 +700 mV
3.8 ± 1.3 nA
cm-2 mmol-1
L
0 - 100µM NS <10s

Chapter Two
68
Polyion complex-bilayer
membrane
Entrapment [14] 0.2 nM 7.0 +800 mV 1.85 nA/µM 3 – 500 µM
Stable over 4
weeks with
daily usage.
NS
Carboxylated multiwalled
carbon nanotubes/gold
nanoparticles/chitosan
composite film modified Au
electrode
Covalent-
bonding [16] 1.6µM 7.4 +135mV
155
nA/µM/cm2 5 – 500 μM
4 months, no
data shown. 2s
Pt nanoparticles modified Au
nanowire array electrode
Entrapment [17] 14µM 7.4 +650mV 194.6 µA
mM-1 cm-2
200 - 800
µM
98% of its
initial response
retained after 2
weeks.
4.8s
Photo-crosslinkable polymer
membrane on a palladium-
deposited screen-printed
carbon electrode
Cross linking [18] 0.05µM 7.0 +400mV 12.8 nA/µM 0.05µM -
100µM
Stored dry – 5
months, no
change in
response.
30 – 50s
Not stated.
Cross linking with
Glutaraldehyde and BSA as a
spacing agent. ~
Cross linking [19] N/A 7.0 -700mV NS NS
84% of initial
signal after 48
days of use
every 3 days.
120s
Polypyrrole
nanoparticles/polyaniline
modified gold electrode.
Cross linking [20] 0.1nM 7.5 -130mV 533 nA/
µM/cm2
0.02 -
400µm 60 days at 4ºC 3s

Chapter Two
69
Glutamate Dehydrogenase based single enzyme systems
Immobilisation Technique Type Ref LOD pH
V (vs.
Ag/AgCl
)
[NAD
+/NA
D(P)+]
Sensitivity Linear
Range Stability
Response
Time
A mixture of carbon paste,
octadecylamine and
mitochondria fraction, packed
into the working electrode.
Entrapment
[21]
100µM
7.5
+350mV
1mM
0.189µA/mM
0.4 –
10mM
60% after
10 days
of use.
N/A
Alternatively assembling layers
of glutamate dehydrogenase
and Pt-PAMAM.
Entrapment [22] 100 µM 7.4 +200mV 0.1mM 433 µA/mM-1
cm2
0.2 - 250
µM
85% after
four
weeks
3s
Unmodified carbon paste
mixed with lyophilized enzyme
and coenzyme, packed into the
well of a working electrode.
Entrapment [23] 3.8µM 8.0 +150 mV N/A 4·6×105 nA l
mol−1
5 - 78
µM
Signal
decrease
by 50%
after 3
days
120s
GLDH dropcoated onto the
surface of a CNT-CHIT-MDB
modified GC electrode.
Entrapment [25] 2 µM 7.0 -140mV 4mM 0.71 ± 0.08
nA/μM
25 – 100
µM NS NS
Immobilisation of GLDH with
CHIT, drop coated onto the
surface of a SPCE.
Entrapment [26] 1.5 µM 7.0 +100mV 4mM 0.44nA/µM 12.5 -
150µM NS 2s

Chapter Two
70
Reagentless biosensor.
Immobilisation of both NAD+
and GLDH by utilising a
mixture CHIT/MWCNT/MB
dropcoated onto the surface of
a SPCE in a layer by layer
fashion.
Entrapment [27] 3µM 7.0 +100mV N/A 0.39 nA/µM 7.5 -
105µM
100% of
original
response
retained
after 2
weeks
20 – 30s
GLDH attached to CNTs
utilising EDC and sulfo-NHS,
by immersing electrode in PBS
containing both compounds
then dropcoating GLDH. *
Covalent
bonding [28] 0.57
µM 7.4 NS 2mM
With
mediator:
1.17 mA
mM−1 cm−2 /
0.153 mA
mM−1 cm−2
Without
mediator:
0.976 mA
mM−1 cm−2 /
0.182 mA
mM−1 cm−2
With
mediator:
0.1 -
20µM /
20 -
500µM
Without
mediator
0.1 -
20µM /
20 -
300µM
80.5% of
original
response
after two
weeks of
use.
NS
GLDH is mixed with BSA then
coated onto the surface of a Th-
SWNTs/GC electrode, then
followed by glutaraldehyde.
Crosslinking [29] 0.1 µM 8.3 +190mV
vs NHE 0.1µM
137.3 µA
mM-1
0.5 –
400µM
93% after
2 weeks 5s
Chapter Two
71
2.5 References
[1] D. Purves, G.J. Augustine, D. Fitzpatrick, L.C. Katz, A.-S. LaMantia, J.O.
McNamara, et al., Glutamate, (2001).
http://www.ncbi.nlm.nih.gov/books/NBK10807/ (accessed October 15, 2014).
[2] A. Lau, M. Tymianski, Glutamate receptors, neurotoxicity and neurodegeneration.,
Pflugers Arch. 460 (2010) 525–42. doi:10.1007/s00424-010-0809-1.
[3] D.A. Butterfield, C.B. Pocernich, The glutamatergic system and Alzheimer’s
disease: therapeutic implications., CNS Drugs. 17 (2003) 641–52.
http://www.ncbi.nlm.nih.gov/pubmed/12828500 (accessed June 15, 2015).
[4] J.M. Berg, J.L. Tymoczko, L. Stryer, The First Step in Amino Acid Degradation Is
the Removal of Nitrogen, (2002). http://www.ncbi.nlm.nih.gov/books/NBK22475/
(accessed April 9, 2015).
[5] J.T. Brosnan, Glutamate, at the interface between amino acid and carbohydrate
metabolism., J. Nutr. 130 (2000) 988S–90S.
http://www.ncbi.nlm.nih.gov/pubmed/10736367 (accessed April 2, 2015).
[6] J.T. Brosnan, K.C. Man, D.E. Hall, S.A. Colbourne, M.E. Brosnan, Interorgan
metabolism of amino acids in streptozotocin-diabetic ketoacidotic rat., Am. J.
Physiol. 244 (1983) E151–8. http://www.ncbi.nlm.nih.gov/pubmed/6401931
(accessed April 2, 2015).
[7] M. Mutlu, Biosensors in Food Processing, Safety, and Quality Control, CRC Press,
2010. https://books.google.com/books?id=4KQWKOFodAgC&pgis=1 (accessed
September 8, 2015).

Chapter Two
72
[8] T. POPULIN, S. MORET, S. TRUANT, L. CONTE, A survey on the presence of
free glutamic acid in foodstuffs, with and without added monosodium glutamate,
Food Chem. 104 (2007) 1712–1717. doi:10.1016/j.foodchem.2007.03.034.
[9] R. Liu, Q. Zhou, L. Zhang, H. Guo, Toxic effects of wastewater from various phases
of monosodium glutamate production on seed germination and root elongation of
crops, Front. Environ. Sci. Eng. China. 1 (2007) 114–119. doi:10.1007/s11783-007-
0021-5.
[10] L. Cao, Carrier-bound Immobilized Enzymes: Principles, Application and Design,
John Wiley & Sons, 2006. https://books.google.com/books?id=h_78o7-
0hrQC&pgis=1 (accessed June 16, 2015).
[11] A.W.K. Kwong, B. Gründig, J. Hu, R. Renneberg, Comparative study of hydrogel-
immobilized l-glutamate oxidases for a novel thick-film biosensor and its application
in food samples, Biotechnol. Lett. 22 (n.d.) 267–272.
doi:10.1023/A:1005694704872.
[12] R.E. Özel, C. Ispas, M. Ganesana, J.C. Leiter, S. Andreescu, Glutamate oxidase
biosensor based on mixed ceria and titania nanoparticles for the detection of
glutamate in hypoxic environments, Biosens. Bioelectron. 52 (2014) 397–402.
http://www.sciencedirect.com/science/article/pii/S0956566313006039 (accessed
October 9, 2013).
[13] M.R. Ryan, J.P. Lowry, R.D. O’Neill, Biosensor for neurotransmitter L-glutamic
acid designed for efficient use of L-glutamate oxidase and effective rejection of
interference., Analyst. 122 (1997) 1419–24.
http://www.ncbi.nlm.nih.gov/pubmed/9474818 (accessed May 20, 2015).
Chapter Two
73
[14] F. Mizutani, Y. Sato, T. Sawaguchi, S. Yabuki, S. Iijima, Rapid measurement of
transaminase activities using an amperometric l-glutamate-sensing electrode based
on a glutamate oxidase–polyion complex-bilayer membrane, Sensors Actuators B
Chem. 52 (1998) 23–29. doi:10.1016/S0925-4005(98)00251-2.
[15] Pinnacle Glutamate Biosensor for Mice and Rats, (n.d.).
http://www.pinnaclet.com/glutamate.html (accessed April 22, 2015).
[16] B. Batra, C.S. Pundir, An amperometric glutamate biosensor based on
immobilization of glutamate oxidase onto carboxylated multiwalled carbon
nanotubes/gold nanoparticles/chitosan composite film modified Au electrode,
Biosens. Bioelectron. 47 (2013) 496–501.
http://www.sciencedirect.com/science/article/pii/S0956566313002339 (accessed
October 9, 2013).
[17] M. Jamal, J. Xu, K.M. Razeeb, Disposable biosensor based on immobilisation of
glutamate oxidase on Pt nanoparticles modified Au nanowire array electrode.,
Biosens. Bioelectron. 26 (2010) 1420–4. doi:10.1016/j.bios.2010.07.071.
[18] K.-S. Chang, W.-L. Hsu, H.-Y. Chen, C.-K. Chang, C.-Y. Chen, Determination of
glutamate pyruvate transaminase activity in clinical specimens using a biosensor
composed of immobilized l-glutamate oxidase in a photo-crosslinkable polymer
membrane on a palladium-deposited screen-printed carbon electrode, Anal. Chim.
Acta. 481 (2003) 199–208. doi:10.1016/S0003-2670(03)00093-X.
[19] A.K. Basu, P. Chattopadhyay, U. Roychudhuri, R. Chakraborty, Development of
biosensor based on immobilized L-glutamate oxidase for determination of
monosodium glutamate in food., Indian J. Exp. Biol. 44 (2006) 392–8.
http://www.ncbi.nlm.nih.gov/pubmed/16708893 (accessed May 22, 2015).
Chapter Two
74
[20] B. Batra, S. Kumari, C.S. Pundir, Construction of glutamate biosensor based on
covalent immobilization of glutamate oxidase on polypyrrole
nanoparticles/polyaniline modified gold electrode., Enzyme Microb. Technol. 57
(2014) 69–77. doi:10.1016/j.enzmictec.2014.02.001.
[21] S.T. Girousi, A.A. Pantazaki, A.N. Voulgaropoulos, Mitochondria-Based
Amperometric Biosensor for the Determination ofL-Glutamic Acid, Electroanalysis.
13 (2001) 243–245. doi:10.1002/1521-4109(200103)13:3<243::AID-
ELAN243>3.0.CO;2-J.
[22] L. Tang, Y. Zhu, L. Xu, X. Yang, C. Li, Amperometric glutamate biosensor based on
self-assembling glutamate dehydrogenase and dendrimer-encapsulated platinum
nanoparticles onto carbon nanotubes., Talanta. 73 (2007) 438–43.
doi:10.1016/j.talanta.2007.04.008.
[23] S.L. Alvarez-Crespo, M.J. Lobo-Castañón, A.J. Miranda-Ordieres, P. Tuñón-Blanco,
Amperometric glutamate biosensor based on poly(o-phenylenediamine) film
electrogenerated onto modified carbon paste electrodes, Biosens. Bioelectron. 12
(1997) 739–747. doi:10.1016/S0956-5663(97)00041-9.
[24] B. Krajewska, Application of chitin- and chitosan-based materials for enzyme
immobilizations: a review, Enzyme Microb. Technol. 35 (2004) 126–139.
http://www.sciencedirect.com/science/article/pii/S0141022904001231 (accessed
October 9, 2013).
[25] S. Chakraborty, C. Retna Raj, Amperometric biosensing of glutamate using carbon
nanotube based electrode, Electrochem. Commun. 9 (2007) 1323–1330.
doi:10.1016/j.elecom.2007.01.039.

Chapter Two
75
[26] G. Hughes, R.M. Pemberton, P.R. Fielden, J.P. Hart, Development of a Disposable
Screen Printed Amperometric Biosensor Based on Glutamate Dehydrogenase, for the
Determination of Glutamate in Clinical and Food Applications, Anal. Bioanal.
Electrochem. 6 (2014) 435–449. http://abechem.com/No. 4-2014/2014,6_4_,435-
449.pdf.
[27] G. Hughes, R.M. Pemberton, P.R. Fielden, J.P. Hart, Development of a novel
reagentless, screen–printed amperometric biosensor based on glutamate
dehydrogenase and NAD+, integrated with multi–walled carbon nanotubes for the
determination of glutamate in food and clinical applications, Sensors Actuators B
Chem. (2015). doi:10.1016/j.snb.2015.04.066.
[28] A. Gholizadeh, S. Shahrokhian, A.I. zad, S. Mohajerzadeh, M. Vosoughi, S. Darbari,
et al., Mediator-less highly sensitive voltammetric detection of glutamate using
glutamate dehydrogenase/vertically aligned CNTs grown on silicon substrate.,
Biosens. Bioelectron. 31 (2012) 110–5. doi:10.1016/j.bios.2011.10.002.
[29] L. Meng, P. Wu, G. Chen, C. Cai, Y. Sun, Z. Yuan, Low potential detection of
glutamate based on the electrocatalytic oxidation of NADH at thionine/single-walled
carbon nanotubes composite modified electrode., Biosens. Bioelectron. 24 (2009)
1751–6. doi:10.1016/j.bios.2008.09.001.

Chapter Three
76
CHAPTER THREE
Development of a disposable screen-printed
amperometric biosensor based on glutamate
dehydrogenase, for the determination of glutamate in
clinical and food applications
Chapter Three
77
3. Contents
3.1 Materials and Methods .................................................................................... 80
3.1.1 Chemicals and reagents ................................................................................... 80
3.1.2 Apparatus ........................................................................................................ 80
3.2 Procedures ....................................................................................................... 81
3.2.1 Fabrication of glutamate biosensor ................................................................. 81
3.2.2 Calibration studies of the biosensor using amperometry in stirred solution. .. 82
3.2.3 Application of optimised amperometric biosensor (GLDH-CHIT-MB-SPCE)
to the determination of glutamate in food. ...................................................................... 82
3.2.4 Application of optimised amperometric biosensor (GLDH-CHIT-MB-SPCE)
to the determination of glutamate in serum..................................................................... 83
3.3 Results and Discussion .................................................................................... 83
3.3.1 Principle of Operation of the Biosensor .......................................................... 83
3.3.2 Immobilisation of GLDH using chitosan ........................................................ 86
3.3.3 Optimisation Studies ....................................................................................... 86
3.3.4 Calibration Studies .......................................................................................... 88
3.3.5 Application of the optimum amperometric biosensor (GLDH-CHIT-MB-
SPCE) to the determination of glutamate in unspiked and spiked food. ........................ 89
3.3.6 Application of the optimum amperometric biosensor (GLDH-CHIT- MB-
SPCE) to the determination of glutamate in both unspiked and spiked serum. .............. 93
3.4 Conclusions ..................................................................................................... 98
3.5 References ....................................................................................................... 99
Introduction
Chapter Three
78
Glutamate is one of the most abundant excitatory neurotransmitters and is involved in
fundamental neurological processes such as the formation of memories and learning [1].
Deficiencies or abnormalities in the behaviour of neurological pathways that utilize
glutamate and its receptors are associated with neurological disorders such as Alzheimers
[2], schizophrenia [3] and depression [4].
Glutamate is also a key compound in nitrogen metabolism, protein synthesis and
degradation, and is of great physiological importance. It is the most abundant intracellular
amino acid with concentrations varying between 2 and 20 mM [5], whilst estimated
extracellular levels of L-glutamate are around of 150 µM in plasma and 10 µM in
cerebrospinal fluid [6][7].
Glutamate metabolism is linked with the citric acid cycle [8], GABA synthesis [9] and urea
cycle [10]. It is also linked to amino acid degradation as glutamate dehydrogenase (GLDH)
catalyses the elimination of amino groups from amino acids. GLDH catalyses the oxidative
deamination of glutamate to 2-oxoglutarate, using nicotinamide adenine dinucleotide
(NAD+) as a cofactor (Figure 1-8) [11]. It is a reversible reaction, which typically favours
glutamate formation in mammals [12].
Genetically expressed defects in glutamate metabolism have been recently discovered and
lead to hyperinsulinism/hypermmonemia syndrome. [13]
L-glutamate, in the form of monosodium glutamate (MSG), also has widespread use as a
flavour-enhancing food additive, commonly found in Chinese food and is linked to Chinese
Restaurant Syndrome (CRS) [14]. Thus the analysis and determination of L-glutamate is
important for both food and clinical applications.
The measurement of glutamate has been carried out using various analytical techniques
such as HPLC [15], [16], capillary electrophoresis [17] and enzyme recycling in
conjunction with microfluidic [18] and spectrophotometric [19] techniques. In the present
Chapter Three
79
study we wished to explore the possibility of developing an amperometric biosensor for
glutamate measurements. This device would offer reliability, convenience and low cost,
particularly when fabrication was performed using screen-printing technology. We
previously reported on the development of amperometric biosensors based on
dehydrogenase enzymes, for lactate [20][21], alcohol [22], glucose [23] and NH4+ [24],
[25]. These devices were based on a screen printed carbon electrode (SPCE) incorporating
the electrocatalyst Meldola’s Blue (MB-SPCE). MB reduces the overpotential for the
detection of NADH, which is formed during the operation of the biosensor. Applied
potentials close to 0 V vs. Ag/AgCl are possible. In a previous chapter [25] we reported on
a electrochemical NH4+ biosensor based on the reaction of this species with 2-oxoglutarate
and NADH in the presence of the enzyme GLDH. Consequently, we considered that the
development of a glutamate biosensor should be feasible by immobilizing GLDH onto the
surface of a MB-SPCE and driving the overall reaction in the opposite direction by
incorporating the oxidised cofactor (NAD+) with the enzyme.
In this study we have investigated an immobilising procedure involving chitosan (CHIT).
As discussed in Chapter One, Section 1.3.3.3.1, chitosan is a linear hydrophilic
polysaccharide composed of n-acetyl-D-glucosamine and D-glucosamine units which are
linked with a ß-(1-4) glycosidic bonds. It is a biocompantible, inexpensive, non-toxic
biopolymer with excellent film forming properties [26] and can therefore be employed for
enzyme immobilisation. The application of chitosan as an enzyme immobilization matrix
has been reported previously for many different enzymes [27].
In the present chapter we describe the development and application of a GLDH-CHIT-MB-
SPCE biosensor for the determination of glutamate in serum and of glutamate as MSG in
food (OXO cubes).
Chapter Three
80
3.1 Materials and Methods
3.1.1 Chemicals and reagents
All chemicals were of analytical grade, purchased from Sigma Aldrich, UK, except
glutamate dehydrogenase (CAT: 10197734001) which was purchased from Roche, UK. The
75 mM phosphate buffer (PB) was prepared by combining appropriate volumes of tri-
sodium phosphate dodecahydrate, sodium dihydrogen orthophosphate dehydrate and
disodium hydrogen orthophosphate dehydrate solutions to yield the desired pH. Glutamate
and NADH/NAD+ solutions were prepared in 75 mM PB. 0.05% of chitosan was dissolved
in 0.05 M HCl following up to 10 minutes sonication. Bovine serum albumin (BSA)
(obtained from AbD Serotec) was used to produce dummy electrodes by drop-coating the
same equivalent protein mass as glutamate dehydrogenase. Fetal bovine serum (FBS)
(South American Origin, CAT: S1810-500) obtained from Labtech Int. Ltd, was used for
serum analysis. Food samples (Beef OXO cubes) were obtained from a local supermarket.
3.1.2 Apparatus
All electrochemical experiments were conducted with a three-electrode system consisting of
a carbon working electrode containing MB-SPCE (Gwent Electronic Materials Ltd; Ink
Code: C2030519P5), Ag/AgCl reference electrode (GEM Product Code C61003P7):
printed onto PVC, and a separate Pt counter electrode. The area of the working electrode
was defined using insulating tape, into a 3 x 3 mm square area. The electrodes were then
connected to the potentiostat using gold clips. Solutions, when required, were stirred using a
circular magnetic stirring disk and stirrer (IKA® C-MAG HS IKAMAG, Germany) at a
fixed speed. A µAutolab II electrochemical analyser with general purpose electrochemical
software GPES 4.9 was used to acquire data and experimentally control the voltage applied
to the SPCE in the 10 ml electrochemical cell. An AMEL Model 466 polarographic
analyser combined with a GOULD BS-271 chart recorder was used for some amperometric
studies. Measurement and monitoring of the pH was conducted with a Fisherbrand Hydrus

Chapter Three
81
400 pH meter (Orion Research Inc., USA). Sonications were performed with a Devon
FS100 sonicator (Ultrasonics, Hove, Sussex, UK).
3.2 Procedures
3.2.1 Fabrication of glutamate biosensor
A 0.05% HCl solution containing CHIT was drop-coated onto the surface of the unmodified
MB-SPCE 9mm2 working electrode and left to dry under vacuum. Once dried the enzyme
GLDH with the appropriate quantity of units was drop-coated directly onto the CHIT layer.
The same procedure was used to obtain dummy biosensors by using CHIT and the same
mass of BSA as that of the enzyme. Figure 3-1 illustrates the proposed GLDH-CHIT-MB-
SPCE biosensor. The biosensors were stored in a desiccator, shielded from light at 4ºC
overnight to allow the enzyme layer to dry.
Figure 3-1) Diagram of proposed biosensor strip. The insulating tape defines both the
WE and RE. CHIT is then drop-coated and allowed to dry, followed by GLDH. All
studies were conducted using a separate Pt wire counter electrode.
Serum and food samples were analysed (n = 3) for interferences using dummy biosensors.
If interferences were detected, the average signal generated was deducted from the enzyme
biosensor response.
Ag/AgCl RE
Insulating tape
CHIT
GLDH
PVC MB-SPCE
Chapter Three
82
3.2.2 Calibration studies of the biosensor using amperometry in stirred
solution.
All amperometric measurements were performed in stirred solutions using an applied
potential of +0.1 V vs. Ag/AgCl. Measurements of glutamate were conducted in 75 mM PB
(pH 7.0) containing 4 mM of NAD+ and 50 mM NaCl using the GLDH-CHIT-MB-SPCE.
The biosensor was immersed into a stirred 10 mL buffer solution, the potential applied and
sufficient time was allowed for allowed a steady-state current to be obtained. The
amperometric responses to additions of known concentrations of glutamate were then
recorded. Amperometry was used to determine the effects of pH (5 – 9) and temperature (25
- 40°C) by examining the performance characteristics over the concentration range of 25
µM to 300 µM glutamate.
3.2.3 Application of optimised amperometric biosensor (GLDH-CHIT-MB-
SPCE) to the determination of glutamate in food.
OXO cubes (5.9g, average mass of three OXO cubes) were prepared by dissolving one cube
in 50 mL of PB and sonicating for 15 minutes. The endogenous concentration of MSG was
determined by using the method of standard addition. An initial 10µl volume of the
dissolved OXO cube was added to the stirred buffered solution (10 mL) in the voltammetric
cell containing the biosensor, operated at +0.1 V (vs. Ag/AgCl) with subsequent standard
additions of 10µL of 25 mM glutamate.
The reproducibility of the biosensor assay for MSG analysis in OXO cubes was determined
by repeating the whole procedure six times with six individual biosensors. The effects of
interferences from the OXO cube were established by using a dummy BSA biosensor and
deducted from the enzyme biosensor signal.
The recovery of MSG added to OXO cubes was investigated by fortifying the solution
containing one OXO cube with 100 mM of glutamate. The analysis of this solution was
Chapter Three
83
performed in a similar manner to that described for the unfortified solution. In this case, an
aliquot of only 2µL of the fortified OXO solution was added to 10mL volumes of buffer
solution. Standard additions of 2.5uL of 100 mM glutamate were added to this mixture.
3.2.4 Application of optimised amperometric biosensor (GLDH-CHIT-MB-
SPCE) to the determination of glutamate in serum.
To determine the original glutamate concentration, an initial volume of 100 µL of serum
was added to 9.9mL of buffered solution. The serum solution was subjected to amperometry
in stirred solution using an applied potential of + 0.1 V vs. Ag/AgCl. This was followed by
additions of 10 µL aliquots of 25 mM standard glutamate solution to the voltammetric cell.
The currents resulting from the enzymatic generation of NADH were used to construct
standard addition plots, from which the endogenous concentration of glutamate was
determined. The reproducibility of the biosensor was deduced by repeating the studies six
times with six individual biosensors.
The procedure was repeated using serum spiked with 2 mM glutamate (n = 6) to determine
to the recovery of the assay. The effects of the interference from serum were established by
using a dummy BSA biosensor. A dummy biosensor was constructed by drop coating the
equivalent weight of the enzyme with BSA.
3.3 Results and Discussion
3.3.1 Principle of Operation of the Biosensor
The overall principle of operation of the biosensor is shown in Figure 3-2. Glutamate in
solution is oxidised to form 2-oxoglutarate in the presence of the immobilized enzyme
glutamate dehydrogenase (GLDH) and NAD+; the product NADH and NH4+ are formed
during this reaction. The NADH diffuses through the CHIT layer to reach the electrode
(Fig. 3-1), where it undergoes oxidation by the MBox which is reduced to MBred. The
electrochemical oxidation of MBred to MBox occurs at an applied potential of +0.1 V vs.
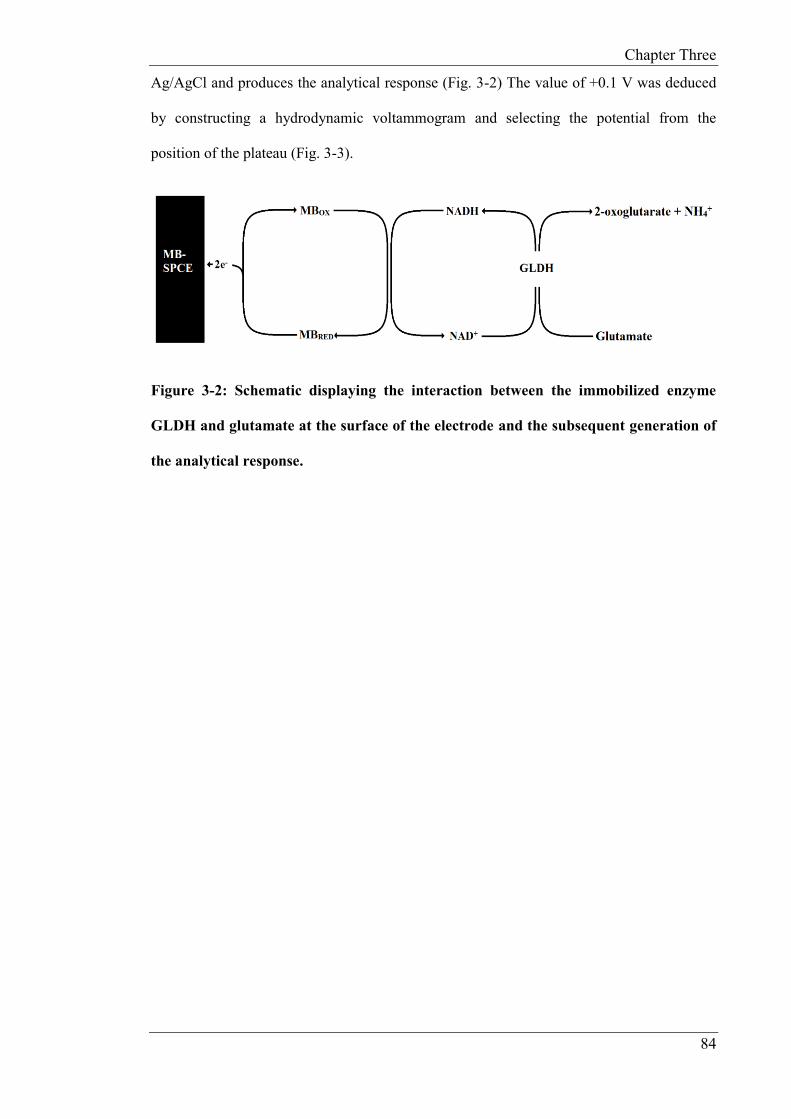
Chapter Three
84
Ag/AgCl and produces the analytical response (Fig. 3-2) The value of +0.1 V was deduced
by constructing a hydrodynamic voltammogram and selecting the potential from the
position of the plateau (Fig. 3-3).
Figure 3-2: Schematic displaying the interaction between the immobilized enzyme
GLDH and glutamate at the surface of the electrode and the subsequent generation of
the analytical response.
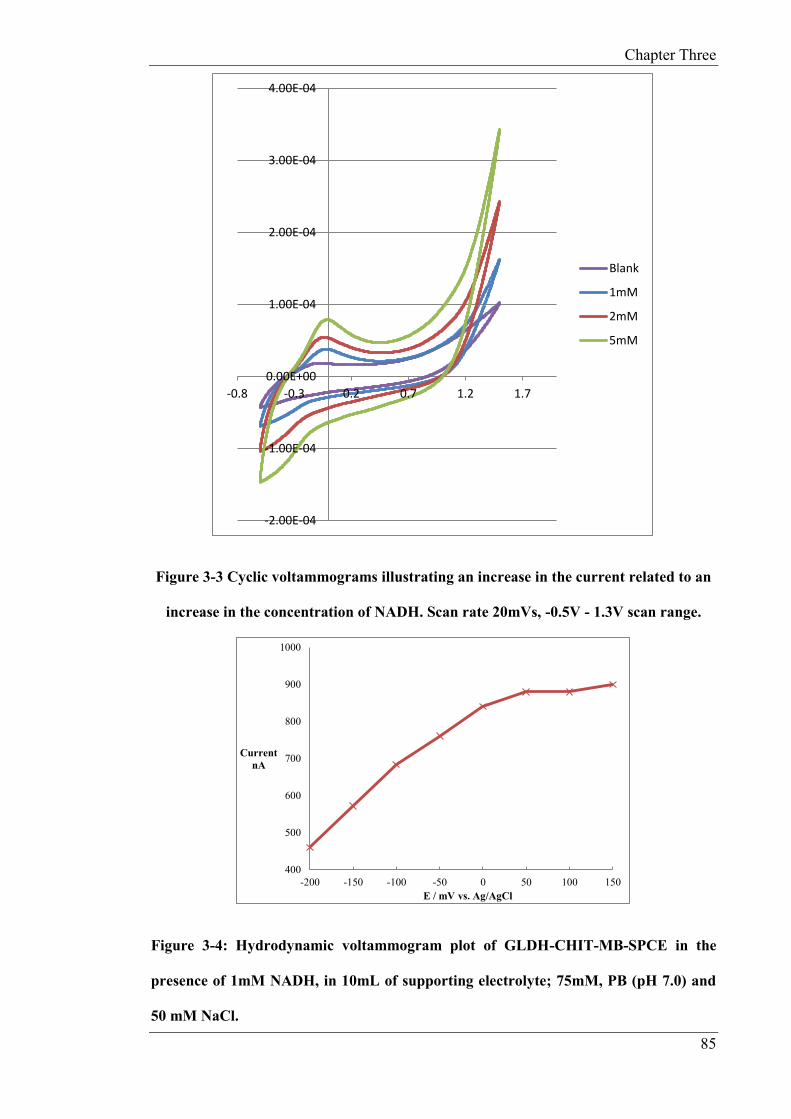
Chapter Three
85
Figure 3-3 Cyclic voltammograms illustrating an increase in the current related to an
increase in the concentration of NADH. Scan rate 20mVs, -0.5V - 1.3V scan range.
Figure 3-4: Hydrodynamic voltammogram plot of GLDH-CHIT-MB-SPCE in the
presence of 1mM NADH, in 10mL of supporting electrolyte; 75mM, PB (pH 7.0) and
50 mM NaCl.
-2.00E-04
-1.00E-04
0.00E+00
1.00E-04
2.00E-04
3.00E-04
4.00E-04
-0.8 -0.3 0.2 0.7 1.2 1.7
Blank
1mM
2mM
5mM
400
500
600
700
800
900
1000
-200 -150 -100 -50 0 50 100 150
Current
nA
E / mV vs. Ag/AgCl
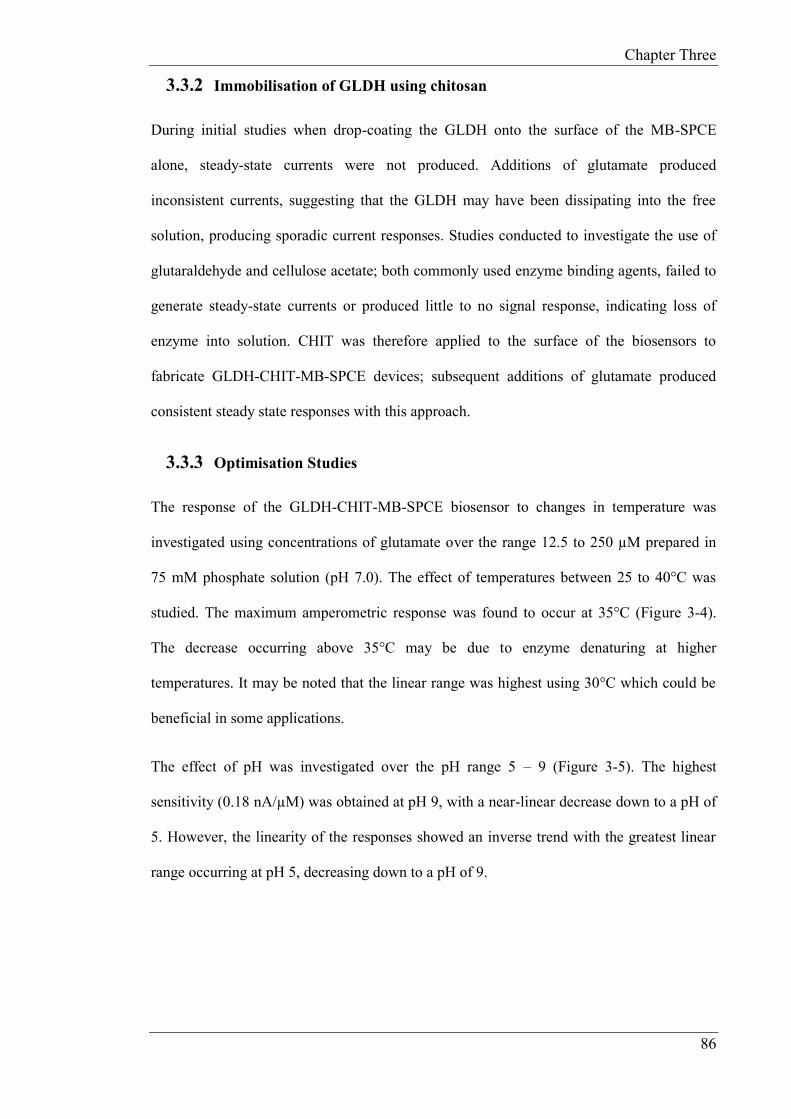
Chapter Three
86
3.3.2 Immobilisation of GLDH using chitosan
During initial studies when drop-coating the GLDH onto the surface of the MB-SPCE
alone, steady-state currents were not produced. Additions of glutamate produced
inconsistent currents, suggesting that the GLDH may have been dissipating into the free
solution, producing sporadic current responses. Studies conducted to investigate the use of
glutaraldehyde and cellulose acetate; both commonly used enzyme binding agents, failed to
generate steady-state currents or produced little to no signal response, indicating loss of
enzyme into solution. CHIT was therefore applied to the surface of the biosensors to
fabricate GLDH-CHIT-MB-SPCE devices; subsequent additions of glutamate produced
consistent steady state responses with this approach.
3.3.3 Optimisation Studies
The response of the GLDH-CHIT-MB-SPCE biosensor to changes in temperature was
investigated using concentrations of glutamate over the range 12.5 to 250 µM prepared in
75 mM phosphate solution (pH 7.0). The effect of temperatures between 25 to 40°C was
studied. The maximum amperometric response was found to occur at 35°C (Figure 3-4).
The decrease occurring above 35°C may be due to enzyme denaturing at higher
temperatures. It may be noted that the linear range was highest using 30°C which could be
beneficial in some applications.
The effect of pH was investigated over the pH range 5 – 9 (Figure 3-5). The highest
sensitivity (0.18 nA/µM) was obtained at pH 9, with a near-linear decrease down to a pH of
5. However, the linearity of the responses showed an inverse trend with the greatest linear
range occurring at pH 5, decreasing down to a pH of 9.
B
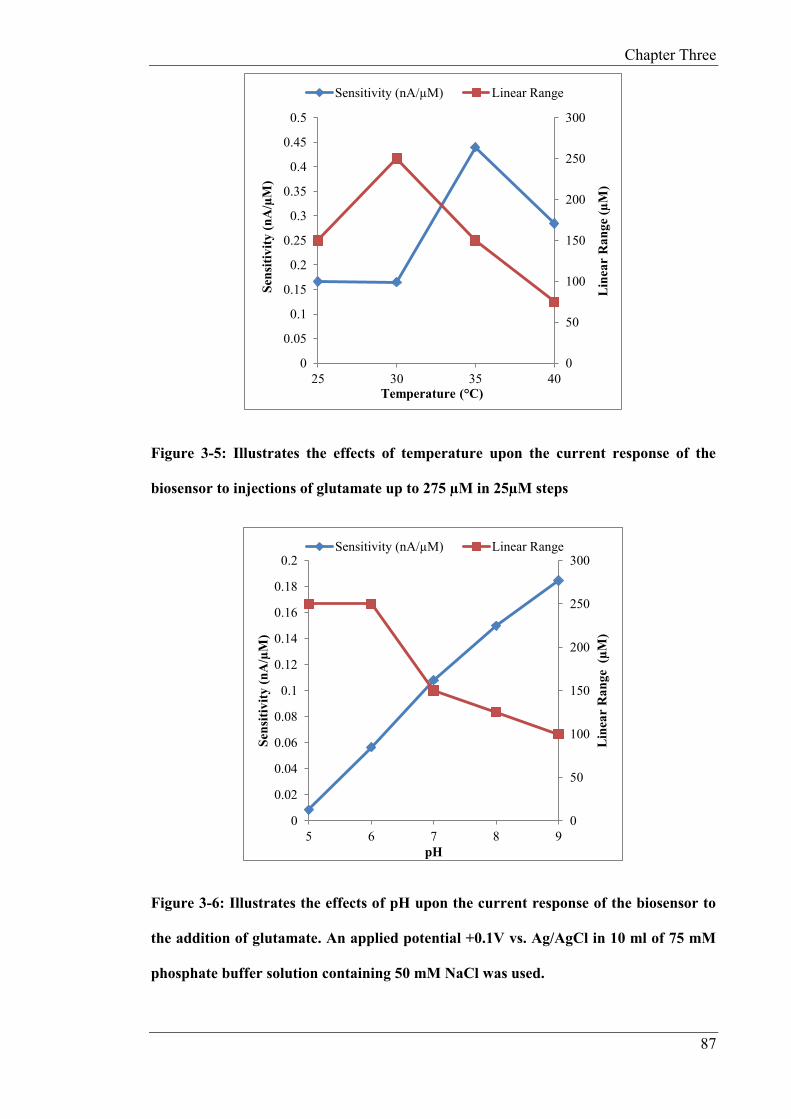
Chapter Three
87
Figure 3-5: Illustrates the effects of temperature upon the current response of the
biosensor to injections of glutamate up to 275 µM in 25µM steps
Figure 3-6: Illustrates the effects of pH upon the current response of the biosensor to
the addition of glutamate. An applied potential +0.1V vs. Ag/AgCl in 10 ml of 75 mM
phosphate buffer solution containing 50 mM NaCl was used.
0
50
100
150
200
250
300
0
0.05
0.1
0.15
0.2
0.25
0.3
0.35
0.4
0.45
0.5
25 30 35 40
Lin
ear
Ra
ng
e (µ
M)
Sen
siti
vit
y (
nA
/µM
)
Temperature (°C)
Sensitivity (nA/µM) Linear Range
0
50
100
150
200
250
300
0
0.02
0.04
0.06
0.08
0.1
0.12
0.14
0.16
0.18
0.2
5 6 7 8 9
Lin
ear
Ra
ng
e (
µM
)
Sen
siti
vit
y (
nA
/µM
)
pH
Sensitivity (nA/µM) Linear Range
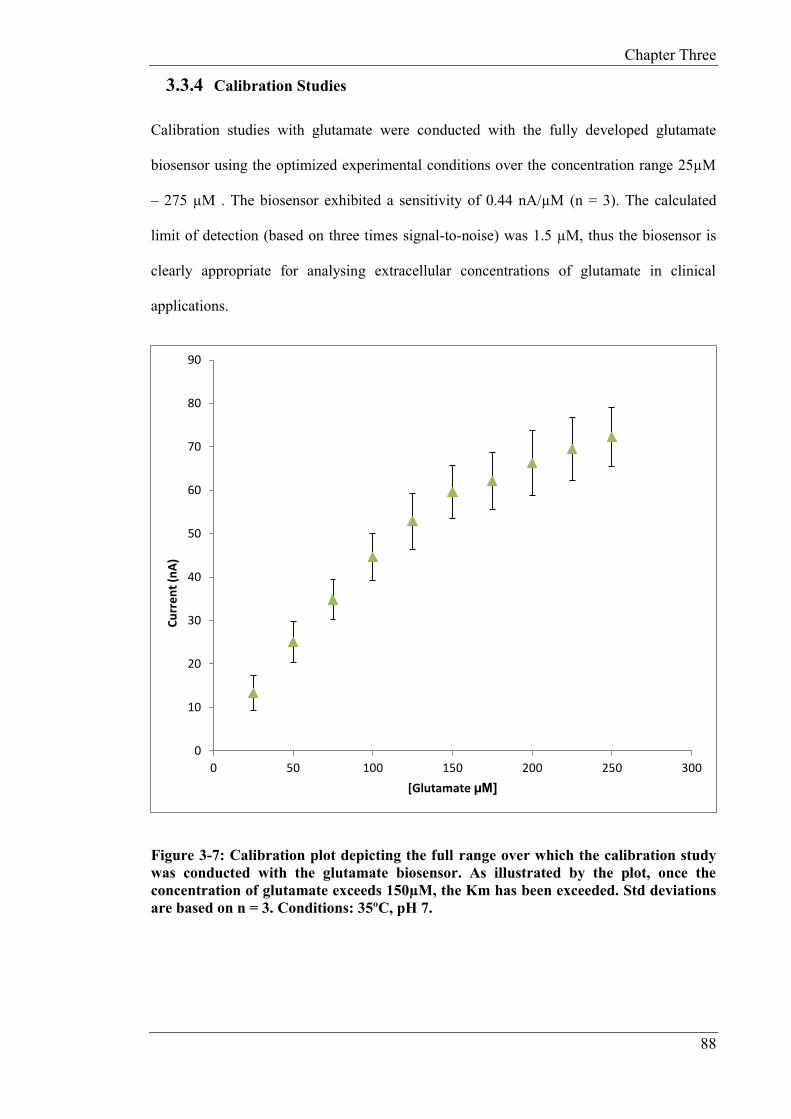
Chapter Three
88
3.3.4 Calibration Studies
Calibration studies with glutamate were conducted with the fully developed glutamate
biosensor using the optimized experimental conditions over the concentration range 25µM
– 275 µM . The biosensor exhibited a sensitivity of 0.44 nA/µM (n = 3). The calculated
limit of detection (based on three times signal-to-noise) was 1.5 µM, thus the biosensor is
clearly appropriate for analysing extracellular concentrations of glutamate in clinical
applications.
Figure 3-7: Calibration plot depicting the full range over which the calibration study
was conducted with the glutamate biosensor. As illustrated by the plot, once the
concentration of glutamate exceeds 150µM, the Km has been exceeded. Std deviations
are based on n = 3. Conditions: 35ºC, pH 7.
0
10
20
30
40
50
60
70
80
90
0 50 100 150 200 250 300
Cu
rre
nt
(nA
)
[Glutamate µM]
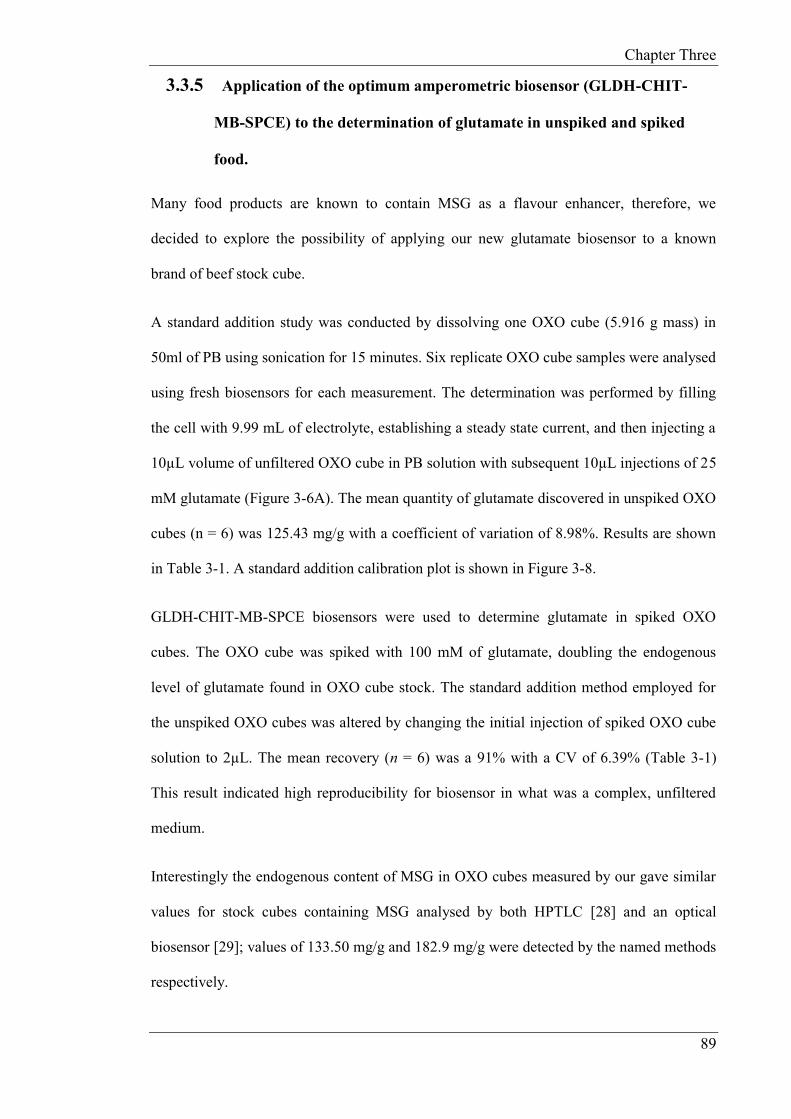
Chapter Three
89
3.3.5 Application of the optimum amperometric biosensor (GLDH-CHIT-
MB-SPCE) to the determination of glutamate in unspiked and spiked
food.
Many food products are known to contain MSG as a flavour enhancer, therefore, we
decided to explore the possibility of applying our new glutamate biosensor to a known
brand of beef stock cube.
A standard addition study was conducted by dissolving one OXO cube (5.916 g mass) in
50ml of PB using sonication for 15 minutes. Six replicate OXO cube samples were analysed
using fresh biosensors for each measurement. The determination was performed by filling
the cell with 9.99 mL of electrolyte, establishing a steady state current, and then injecting a
10µL volume of unfiltered OXO cube in PB solution with subsequent 10µL injections of 25
mM glutamate (Figure 3-6A). The mean quantity of glutamate discovered in unspiked OXO
cubes (n = 6) was 125.43 mg/g with a coefficient of variation of 8.98%. Results are shown
in Table 3-1. A standard addition calibration plot is shown in Figure 3-8.
GLDH-CHIT-MB-SPCE biosensors were used to determine glutamate in spiked OXO
cubes. The OXO cube was spiked with 100 mM of glutamate, doubling the endogenous
level of glutamate found in OXO cube stock. The standard addition method employed for
the unspiked OXO cubes was altered by changing the initial injection of spiked OXO cube
solution to 2µL. The mean recovery (n = 6) was a 91% with a CV of 6.39% (Table 3-1)
This result indicated high reproducibility for biosensor in what was a complex, unfiltered
medium.
Interestingly the endogenous content of MSG in OXO cubes measured by our gave similar
values for stock cubes containing MSG analysed by both HPTLC [28] and an optical
biosensor [29]; values of 133.50 mg/g and 182.9 mg/g were detected by the named methods
respectively.
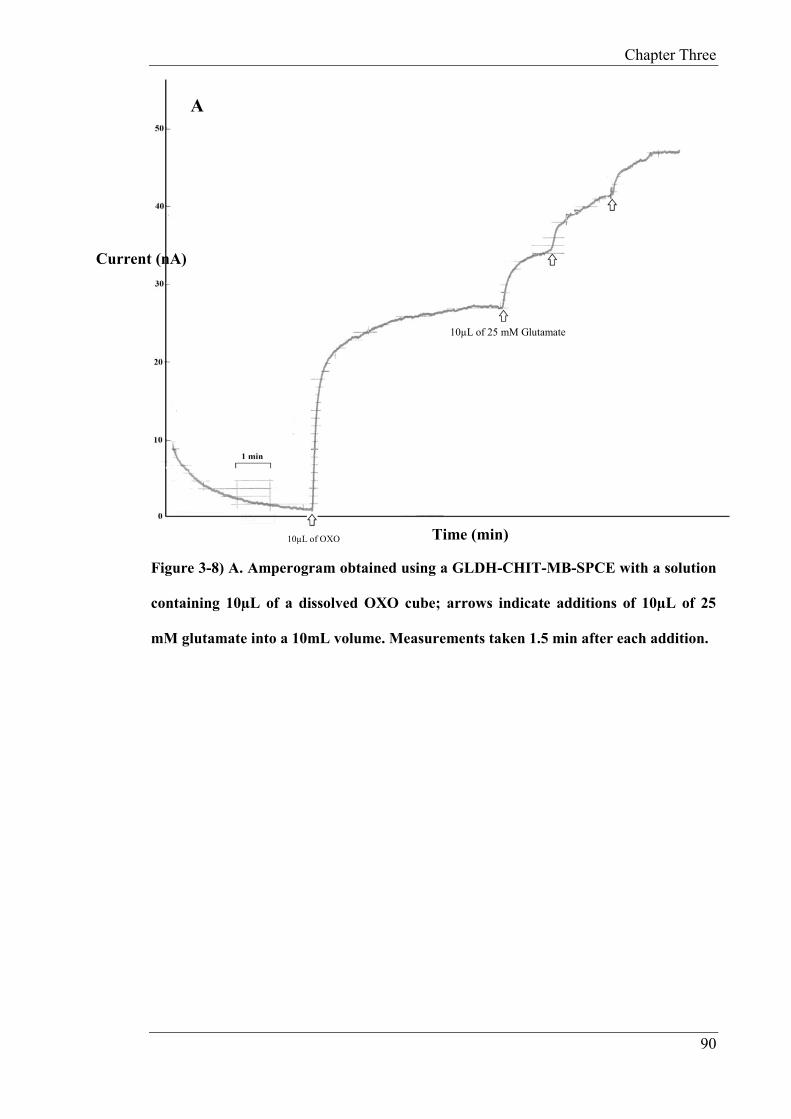
Chapter Three
90
Figure 3-8) A. Amperogram obtained using a GLDH-CHIT-MB-SPCE with a solution
containing 10µL of a dissolved OXO cube; arrows indicate additions of 10µL of 25
mM glutamate into a 10mL volume. Measurements taken 1.5 min after each addition.
Current (nA)
Time (min)
A
10µL of OXO
10µL of 25 mM Glutamate
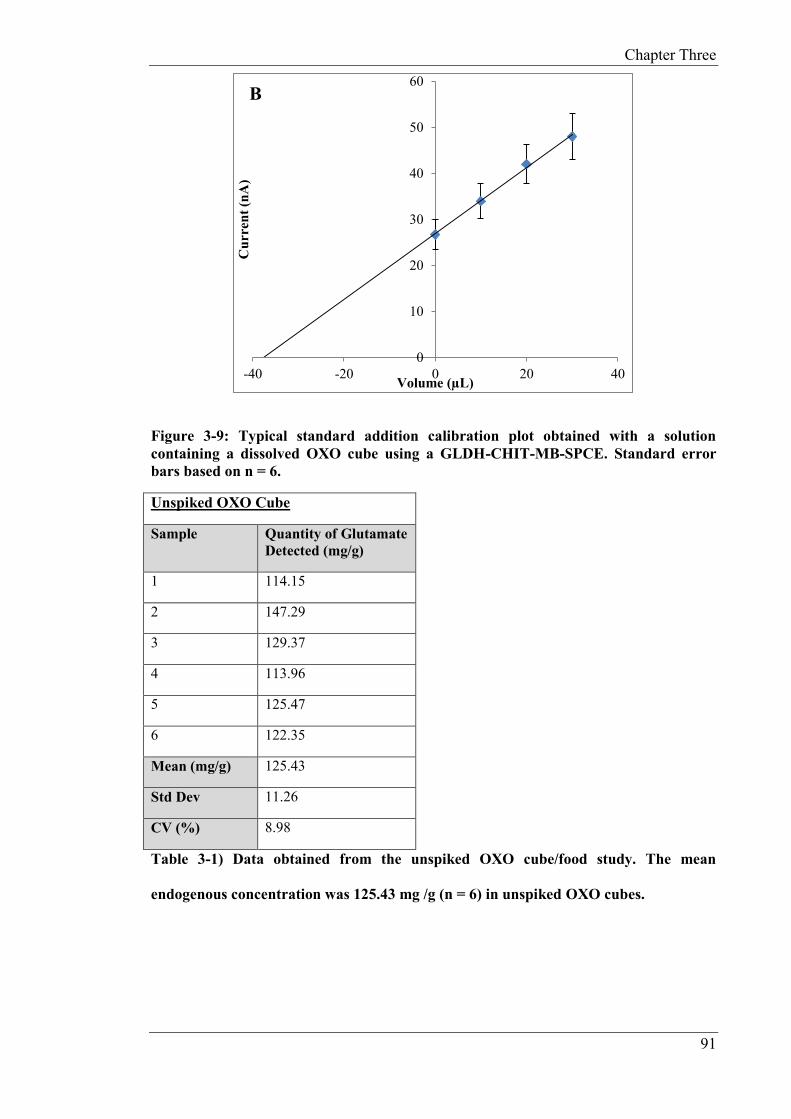
Chapter Three
91
Figure 3-9: Typical standard addition calibration plot obtained with a solution
containing a dissolved OXO cube using a GLDH-CHIT-MB-SPCE. Standard error
bars based on n = 6.
Unspiked OXO Cube
Sample Quantity of Glutamate
Detected (mg/g)
1 114.15
2 147.29
3 129.37
4 113.96
5 125.47
6 122.35
Mean (mg/g) 125.43
Std Dev 11.26
CV (%) 8.98
Table 3-1) Data obtained from the unspiked OXO cube/food study. The mean
endogenous concentration was 125.43 mg /g (n = 6) in unspiked OXO cubes.
0
10
20
30
40
50
60
-40 -20 0 20 40
Cu
rren
t (n
A)
Volume (µL)
B
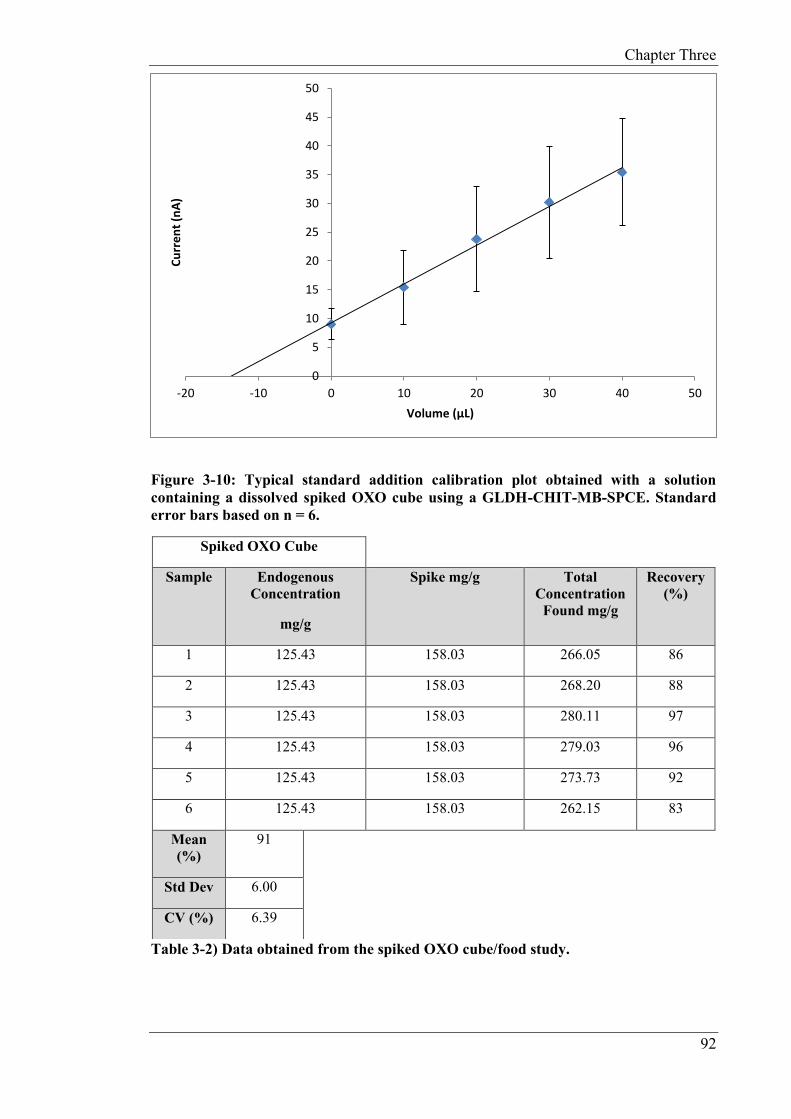
Chapter Three
92
Figure 3-10: Typical standard addition calibration plot obtained with a solution
containing a dissolved spiked OXO cube using a GLDH-CHIT-MB-SPCE. Standard
error bars based on n = 6.
Table 3-2) Data obtained from the spiked OXO cube/food study.
0
5
10
15
20
25
30
35
40
45
50
-20 -10 0 10 20 30 40 50
Cu
rre
nt
(nA
)
Volume (µL)
Spiked OXO Cube
Sample Endogenous
Concentration
mg/g
Spike mg/g Total
Concentration
Found mg/g
Recovery
(%)
1 125.43 158.03 266.05 86
2 125.43 158.03 268.20 88
3 125.43 158.03 280.11 97
4 125.43 158.03 279.03 96
5 125.43 158.03 273.73 92
6 125.43 158.03 262.15 83
Mean
(%)
91
Std Dev 6.00
CV (%) 6.39
Chapter Three
93
3.3.6 Application of the optimum amperometric biosensor (GLDH-CHIT- MB-
SPCE) to the determination of glutamate in both unspiked and spiked
serum.
Amperometry, in conjunction with the method of multiple standard additions was
conducted to determine the endogenous levels of glutamate and the recovery for serum
spiked with additional glutamate. The replicate serum samples were analysed using a fresh
biosensor for each measurement.
The data obtained on serum samples using the glutamate biosensor are shown in Table 3-2.
The endogenous levels of glutamate detected were 1.68 mM for the unspiked samples. The
coefficient of variation was 4.09% for the six individual samples. This concentration is
above that discovered by Ye and Sontheimer in 1998 [30] who discovered concentrations
ranging from 808.2 μM to 1195.7 μM in fetal bovine (calf) sera (FBS) using a
bioluminescence detection method. However, this study did not include the provider of
serum nor the South American variety used in studies conducted using the GLDH-CHIT-
MB-SPCE biosensor, thus glutamate concentrations may potentially be higher in different
batches given the variation displayed. These results show promise due to the low coefficient
of variation, small amount of serum required to carry out analysis and the lack of
preparation steps.
The GLDH-CHIT-MB-SPCE biosensors were then used to determine glutamate in spiked
serum. The serum was spiked with 2.00 mM glutamate so as to roughly double the
endogenous levels of glutamate and to allow a distinction between the spike and
endogenous levels. The results are shown in Table 3-3. The mean recovery (n = 6) was 96%
with a CV of 3.29% indicating high reproducibility in serum. This method offers an
economical and simple approach for the screening of glutamate levels in serum. It should
be mentioned that the biosensors were stored in a desiccator in a refrigerator at 4°C before
use; under these conditions they were found to be stable for at least one week.
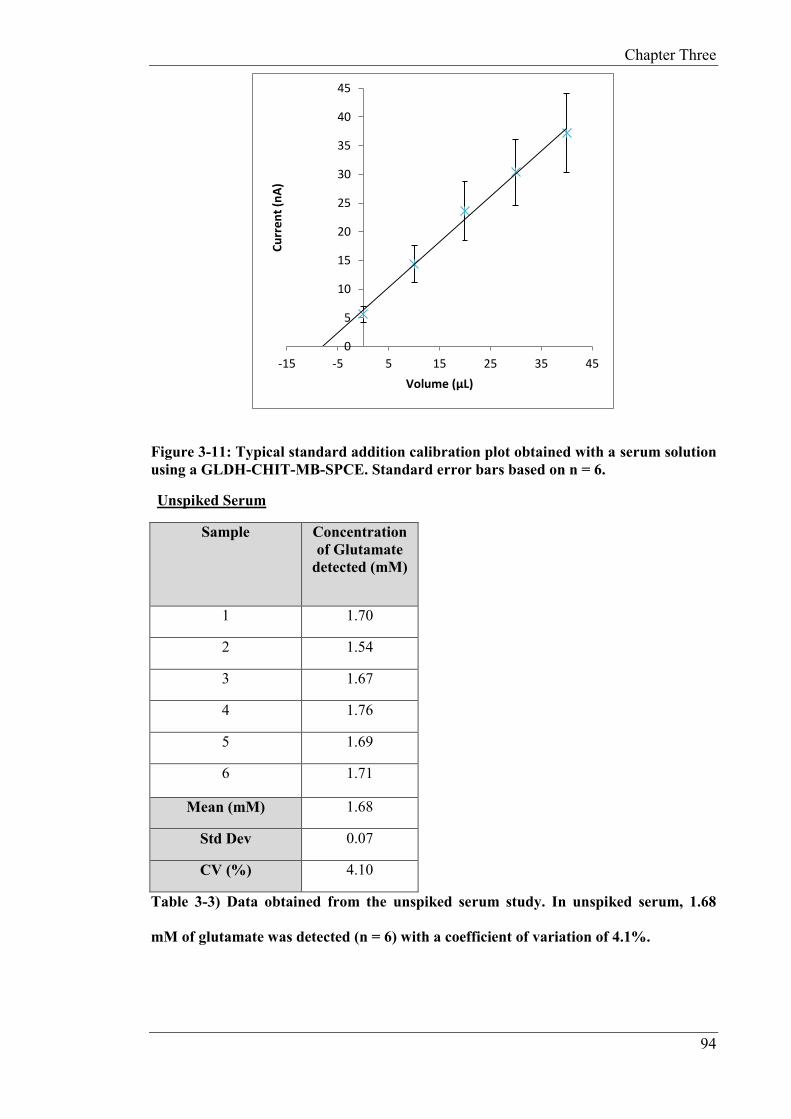
Chapter Three
94
Figure 3-11: Typical standard addition calibration plot obtained with a serum solution
using a GLDH-CHIT-MB-SPCE. Standard error bars based on n = 6.
Unspiked Serum
Sample Concentration
of Glutamate
detected (mM)
1 1.70
2 1.54
3 1.67
4 1.76
5 1.69
6 1.71
Mean (mM) 1.68
Std Dev 0.07
CV (%) 4.10
Table 3-3) Data obtained from the unspiked serum study. In unspiked serum, 1.68
mM of glutamate was detected (n = 6) with a coefficient of variation of 4.1%.
0
5
10
15
20
25
30
35
40
45
-15 -5 5 15 25 35 45
Cu
rre
nt
(nA
)
Volume (µL)

Chapter Three
95
Figure 3-12: Typical standard addition calibration plot obtained with a serum solution
using a GLDH-CHIT-MB-SPCE. Standard error bars based on n = 6.
Spiked Serum
Sample Spike
mM
Endogenous
Concentration
mM
Total
Concentration
Found mM
Recovery
(%)
1 2.00 1.68 3.52 92
2 2.00 1.68 3.65 98
3 2.00 1.68 3.62 97
4 2.00 1.68 3.65 99
5 2.00 1.68 3.62 97
6 2.00 1.68 3.49 90
Mean (%) 96
Std Dev 3.14
CV (%) 3.29
Table 3-4) In spiked serum, the mean recovery was 96%, coefficient of variation 3.29
% (n = 6).
0
10
20
30
40
50
60
-20 -10 0 10 20 30 40 50
Cu
rre
nt
(nA
)
Volume (µL)
Chapter Three
96
The GLDH-CHIT-MB-SPCE biosensor described in this chapter possesses a superior limit
of detection by comparison to other biosensors utilising glutamate dehydrogenase and can
be fabricated simply in comparison to those reported previously (Table 3-5). Consequently,
these devices hold promise for application quality control in clinical laboratories. It is
interesting to note that a biosensor based on glutamate oxidase [31] has been reported for
the determination of glutamate in soy sauce; a detection limit of 10nM was achieved.
However, it should be mentioned that the operating potential required to detect H2O2 was
+950mV, as a result the selectivity of the device may not be sufficient for the analysis of
glutamate in serum.
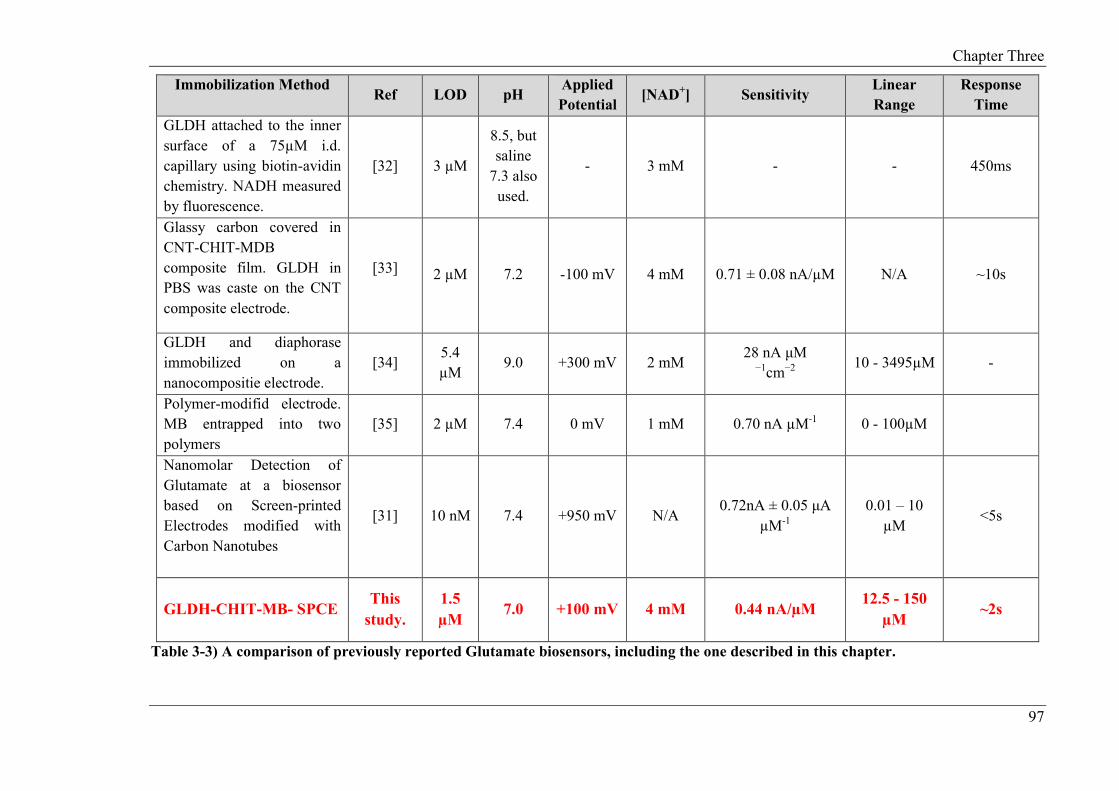
Chapter Three
97
Immobilization Method
Ref LOD pH
Applied
Potential [NAD+] Sensitivity
Linear
Range
Response
Time
GLDH attached to the inner
surface of a 75µM i.d.
capillary using biotin-avidin
chemistry. NADH measured
by fluorescence.
[32] 3 µM
8.5, but
saline
7.3 also
used.
- 3 mM - - 450ms
Glassy carbon covered in
CNT-CHIT-MDB
composite film. GLDH in
PBS was caste on the CNT
composite electrode.
[33] 2 µM 7.2 -100 mV 4 mM 0.71 ± 0.08 nA/µM N/A ~10s
GLDH and diaphorase
immobilized on a
nanocompositie electrode.
[34] 5.4
µM 9.0 +300 mV 2 mM
28 nA μM −1cm−2
10 - 3495µM -
Polymer-modifid electrode.
MB entrapped into two
polymers
[35] 2 µM 7.4 0 mV 1 mM 0.70 nA µM-1 0 - 100µM
Nanomolar Detection of
Glutamate at a biosensor
based on Screen-printed
Electrodes modified with
Carbon Nanotubes
[31] 10 nM 7.4 +950 mV N/A 0.72nA ± 0.05 μA
µM-1
0.01 – 10
µM <5s
GLDH-CHIT-MB- SPCE
This
study.
1.5
µM 7.0 +100 mV 4 mM 0.44 nA/µM
12.5 - 150
µM ~2s
Table 3-3) A comparison of previously reported Glutamate biosensors, including the one described in this chapter.

Chapter Three
98
3.4 Conclusions
This chapter has demonstrated the effective use of CHIT to immobilise GLDH onto the
surface of a MB-SPCE for the fabrication of a glutamate biosensor and the successful
application of the biosensor to the determination of glutamate, in both serum and food
samples, without any sample pre-treatment, other than dilution.
This simple approach is attractive as it is based on an electrochemical biosensor fabricated
by incorporating biological compounds with a chemically modified screen printed carbon
electrode. SPCE’s can be mass produced at low cost so biosensors based on this technology
can be considered disposable. This latter feature may be of significance in biological fluid
analysis where contamination may be an issue.
In summary our proposed biosensor approach offers the advantages of good selectivity
owning to the combination of an enzyme integrated with a transducer operated at a low
potential of only +100mV, coupled with the simplicity of fabrication and analytical
operation.

Chapter Three
99
3.5 References
[1] G. Riedel, B. Platt, and J. Micheau, (2003), “Glutamate receptor function in
learning and memory,” Behav Brain Res, 140, 1–47.
[2] R. Rupsingh, M. Borrie, M. Smith, J. L. Wells, and R. Bartha, (2011), “Reduced
hippocampal glutamate in Alzheimer disease.,” Neurobiol. Aging, 32, 802–10.
[3] J. R. Field, A. G. Walker, and P. J. Conn, (2011), “Targeting glutamate synapses
in schizophrenia.,” Trends Mol. Med., 17, 689–98.
[4] I. A. Paul and P. Skolnick, (2003), “Glutamate and depression: clinical and
preclinical studies.,” Ann. N. Y. Acad. Sci., 1003, 250–72.
[5] P. Newsholme, J. Procopio, M. M. R. Lima, T. C. Pithon-Curi, and R. Curi,
(2003), “Glutamine and glutamate--their central role in cell metabolism and
function.,” Cell Biochem. Funct., 21, 1–9.
[6] N. C. Danbolt, (2001), “Glutamate uptake.,” Prog. Neurobiol., 65, 1–105.
[7] D. E. Featherstone and S. A. Shippy, (2008), “Regulation of synaptic
transmission by ambient extracellular glutamate.,” Neuroscientist, 14, 171–81.
[8] O. E. Owen, S. C. Kalhan, and R. W. Hanson, (2002), “The key role of
anaplerosis and cataplerosis for citric acid cycle function.,” J. Biol. Chem., 277,
30409–12.
[9] G. C. Mathews and J. S. Diamond, (2003), “Neuronal Glutamate Uptake
Contributes to GABA Synthesis and Inhibitory Synaptic Strength,” J. Neurosci.,
23, 2040–2048.

Chapter Three
100
[10] H. A. Krebs, R. Hems, P. Lund, D. Halliday, and W. W. Read, (1978), “Sources
of ammonia for mammalian urea synthesis.,” Biochem. J., 176, 733–7.
[11] E. Santero, I. Canosa, F. Govantes, and A. B. Hervás, Dehydrogenases. InTech,
(2012).
[12] R. C. Hudson and R. M. Daniel, (1993), “L-glutamate dehydrogenases:
distribution, properties and mechanism.,” Comp. Biochem. Physiol. B., 106, 767–
92.
[13] A. Kelly and C. Stanley, (2001), “Disorders of glutamate metabolism,” Ment.
Retard. Dev. …, 295, 287–295.
[14] I. Mosby, (2008), “‘That Won-Ton Soup Headache’: The Chinese Restaurant
Syndrome, MSG and the Making of American Food, 1968-1980,” Soc. Hist.
Med., 22, 133–151.
[15] T. P. Piepponen and A. Skujins, (2001), “Rapid and sensitive step gradient assays
of glutamate, glycine, taurine and gamma-aminobutyric acid by high-
performance liquid chromatography-fluorescence detection with o-
phthalaldehyde-mercaptoethanol derivatization with an emphasis on
microdialysis sam,” J. Chromatogr. B. Biomed. Sci. Appl., 757, 277–83.
[16] K. Buck, P. Voehringer, and B. Ferger, (2009), “Rapid analysis of GABA and
glutamate in microdialysis samples using high performance liquid
chromatography and tandem mass spectrometry.,” J. Neurosci. Methods, 182,
78–84.
[17] L. A. Dawson, J. M. Stow, and A. M. Palmer, (1997), “Improved method for the
measurement of glutamate and aspartate using capillary electrophoresis with laser
Chapter Three
101
induced fluorescence detection and its application to brain microdialysis.,” J.
Chromatogr. B. Biomed. Sci. Appl., 694, 455–60.
[18] W. Laiwattanapaisal and J. Yakovleva, (2009), “On-chip microfluidic systems
for determination of L-glutamate based on enzymatic recycling of substrate,”
Biomicrofluidics, 3, 14104.
[19] W. Khampha, V. Meevootisom, and S. Wiyakrutta, (2004), “Spectrophotometric
enzymatic cycling method using l-glutamate dehydrogenase and d-phenylglycine
aminotransferase for determination of l-glutamate in foods,” Anal. Chim. Acta,
520, 133–139.
[20] S. D. Sprules, J. P. Hart, R. Pittson, and S. a Wring, (1996), “Evaluation of a new
disposable screen-printed sensor strip for the measurement of NADH and its
modification to produce a lactate biosensor employing microliter volumes,”
Electroanalysis, 8, 539–543.
[21] S. D. Sprules, J. P. Hart, S. A. Wring, and R. Pittson, (1995), “A reagentless,
disposable biosensor for lactic acid based on a screen-printed carbon electrode
containing Meldola’s Blue and coated with lactate dehydrogenase, NAD+ and
cellulose acetate,” Anal. Chim. Acta, 304, 17–24.
[22] M. Boujtita, J. P. Hart, and R. Pittson, (2000), “Development of a disposable
ethanol biosensor based on a chemically modified screen-printed electrode coated
with alcohol oxidase for the analysis of beer.,” Biosens. Bioelectron., 15, 257–63.
[23] R. M. Pemberton, T. Cox, R. Tuffin, I. Sage, G. a Drago, N. Biddle, J. Griffiths,
R. Pittson, G. Johnson, J. Xu, S. K. Jackson, G. Kenna, R. Luxton, and J. P. Hart,

Chapter Three
102
(2013), “Microfabricated glucose biosensor for culture welloperation,” Biosens
Bioelectron, 42, 668–677.
[24] J. P. Hart, S. Serban, L. J. Jones, N. Biddle, R. Pittson, and G. A. Drago, (2006),
“Selective and Rapid Biosensor Integrated into a Commercial Hand‐ Held
Instrument for the Measurement of Ammonium Ion in Sewage Effluent,” Anal.
Lett., 39, 1657–1667.
[25] J. P. Hart, A. K. Abass, D. C. Cowell, and A. Chappell, (1999), “Development of
a Disposable Amperometric NH Biosensor Based on a Chemically Modified
Screen-Printed Carbon Electrode Coated with Glutamate Dehydrogenase, 2-
Oxoglutarate, and NADH,” Electroanalysis, 11, 406–411.
[26] B. Krajewska, (2004), “Application of chitin- and chitosan-based materials for
enzyme immobilizations: a review,” Enzyme Microb. Technol., 35, 126–139.
[27] M. N. . Ravi Kumar, (2000), “A review of chitin and chitosan applications,”
React. Funct. Polym., 46, 1–27.
[28] V. N. Krishna, D. Karthika, D. M. Surya, M. Rubini, M. Vishalini, and Y.
Pradeepa, (2010), “Analysis of Monosodium l-Glutamate in Food Products by
High-Performance Thin Layer Chromatography.,” J. Young Pharm., 2, 297–300.
[29] N. Z. Md Muslim, M. Ahmad, L. Y. Heng, and B. Saad, (2012), “Optical
biosensor test strip for the screening and direct determination of l-glutamate in
food samples,” Sensors Actuators B Chem., 161, 493–497.
[30] Z. C. Ye and H. Sontheimer, (1998), “Astrocytes protect neurons from
neurotoxic injury by serum glutamate.,” Glia, 22, 237–48.
Chapter Three
103
[31] R. Khan, W. Gorski, and C. D. Garcia, (2011), “Nanomolar Detection of
Glutamate at a Biosensor Based on Screen-Printed Electrodes Modified with
Carbon Nanotubes.,” Electroanalysis, 23, 2357–2363.
[32] R. J. Cosford and W. G. Kuhr, (1996), “Capillary biosensor for glutamate.,”
Anal. Chem., 68, 2164–2169.
[33] S. Chakraborty and C. Retna Raj, (2007), “Amperometric biosensing of
glutamate using carbon nanotube based electrode,” Electrochem. commun., 9,
1323–1330.
[34] R. Monošík, M. Streďanský, and E. Šturdík, (2013), “A Biosensor Utilizing l-
Glutamate Dehydrogenase and Diaphorase Immobilized on Nanocomposite
Electrode for Determination of l-Glutamate in Food Samples,” Food Anal.
Methods, 6, 521–527.
[35] R. Doaga, T. McCormac, and E. Dempsey, (2009), “Electrochemical Sensing of
NADH and Glutamate Based on Meldola Blue in 1,2-Diaminobenzene and 3,4-
Ethylenedioxythiophene Polymer Films,” Electroanalysis, 21, 2099–2108.
Chapter Four
104
CHAPTER FOUR
The development and application of a reagentless
glutamate microband biosensor for real-time
monitoring of cell toxicity.
Chapter Four
105
4. Contents
4.1. Introduction ................................................................................................... 106
4.2. Materials and Methods .................................................................................. 108
4.2.1. Chemicals and Reagents ............................................................................... 108
4.2.2. Apparatus ...................................................................................................... 108
4.2.3. Biosensor Fabrication.................................................................................... 109
4.2.4. Electron Microscopy ..................................................................................... 110
4.2.5. Voltammetry and amperometry .................................................................... 110
4.2.6. HepG2 cell culture ........................................................................................ 111
4.2.7. Real time monitoring of glutamate in cell culture media in the
presence/absence of cells and toxic compounds. .......................................................... 112
4.3. Results and discussion .................................................................................. 113
4.3.1. Microband biosensors ................................................................................... 113
4.3.2. Electrochemical Characterisation in NADH utilising Cyclic Voltammetry . 114
4.3.3. Calibration studies of glutamate in phosphate buffer solution...................... 115
4.3.4. Amperometric studies of glutamate in cell media......................................... 115
4.4. Real-time monitoring of glutamate release from HepG2 cells exposed to
various concentrations of paracetamol. ......................................................................... 121
4.5. Conclusions ................................................................................................... 128
4.6. References ..................................................................................................... 129
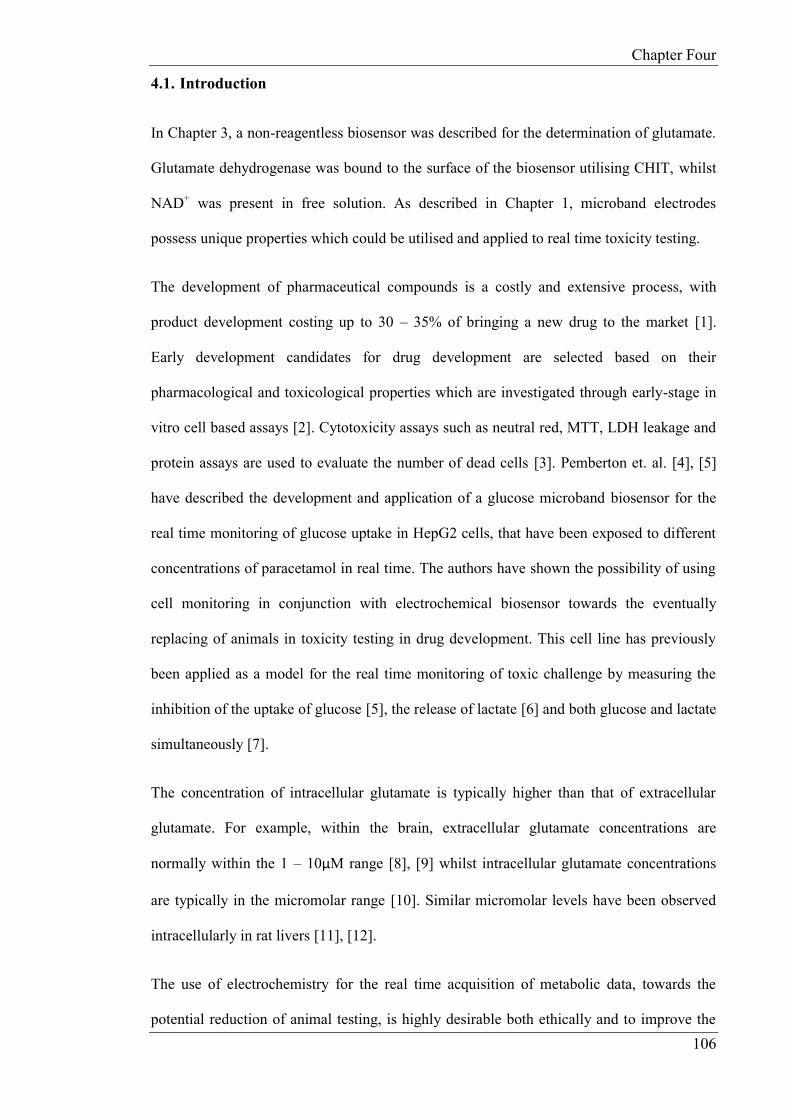
Chapter Four
106
4.1. Introduction
In Chapter 3, a non-reagentless biosensor was described for the determination of glutamate.
Glutamate dehydrogenase was bound to the surface of the biosensor utilising CHIT, whilst
NAD+ was present in free solution. As described in Chapter 1, microband electrodes
possess unique properties which could be utilised and applied to real time toxicity testing.
The development of pharmaceutical compounds is a costly and extensive process, with
product development costing up to 30 – 35% of bringing a new drug to the market [1].
Early development candidates for drug development are selected based on their
pharmacological and toxicological properties which are investigated through early-stage in
vitro cell based assays [2]. Cytotoxicity assays such as neutral red, MTT, LDH leakage and
protein assays are used to evaluate the number of dead cells [3]. Pemberton et. al. [4], [5]
have described the development and application of a glucose microband biosensor for the
real time monitoring of glucose uptake in HepG2 cells, that have been exposed to different
concentrations of paracetamol in real time. The authors have shown the possibility of using
cell monitoring in conjunction with electrochemical biosensor towards the eventually
replacing of animals in toxicity testing in drug development. This cell line has previously
been applied as a model for the real time monitoring of toxic challenge by measuring the
inhibition of the uptake of glucose [5], the release of lactate [6] and both glucose and lactate
simultaneously [7].
The concentration of intracellular glutamate is typically higher than that of extracellular
glutamate. For example, within the brain, extracellular glutamate concentrations are
normally within the 1 – 10µM range [8], [9] whilst intracellular glutamate concentrations
are typically in the micromolar range [10]. Similar micromolar levels have been observed
intracellularly in rat livers [11], [12].
The use of electrochemistry for the real time acquisition of metabolic data, towards the
potential reduction of animal testing, is highly desirable both ethically and to improve the
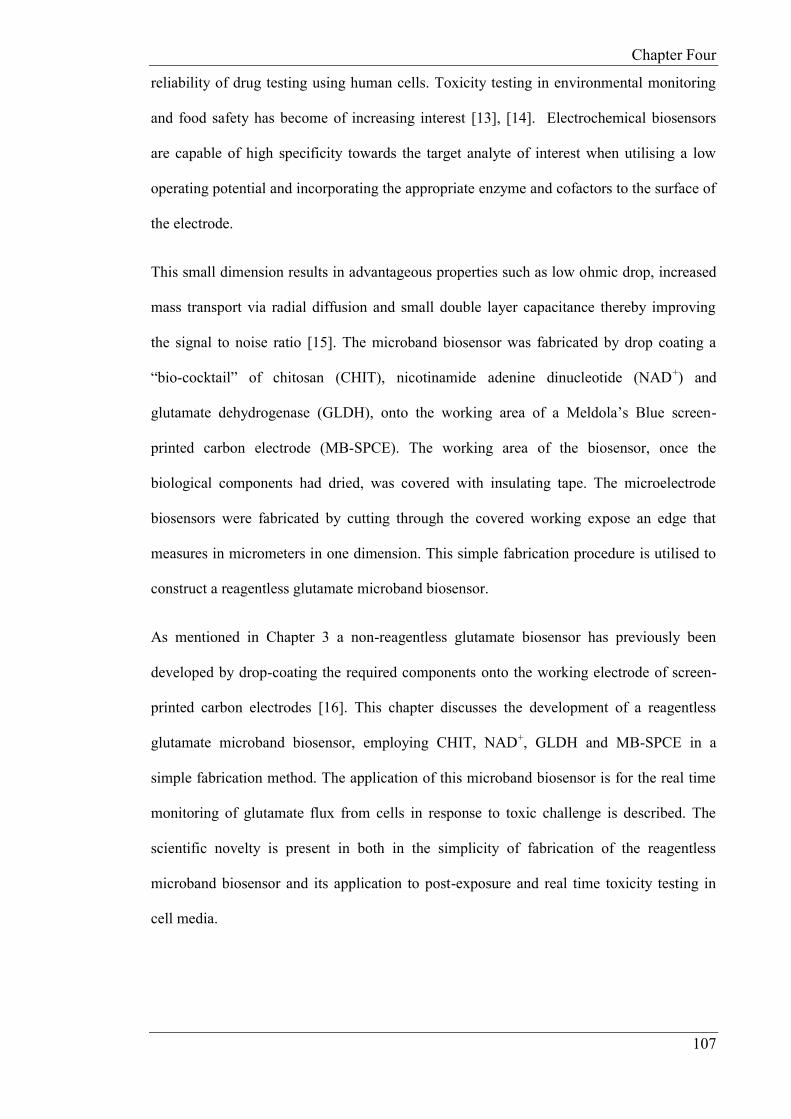
Chapter Four
107
reliability of drug testing using human cells. Toxicity testing in environmental monitoring
and food safety has become of increasing interest [13], [14]. Electrochemical biosensors
are capable of high specificity towards the target analyte of interest when utilising a low
operating potential and incorporating the appropriate enzyme and cofactors to the surface of
the electrode.
This small dimension results in advantageous properties such as low ohmic drop, increased
mass transport via radial diffusion and small double layer capacitance thereby improving
the signal to noise ratio [15]. The microband biosensor was fabricated by drop coating a
“bio-cocktail” of chitosan (CHIT), nicotinamide adenine dinucleotide (NAD+) and
glutamate dehydrogenase (GLDH), onto the working area of a Meldola’s Blue screen-
printed carbon electrode (MB-SPCE). The working area of the biosensor, once the
biological components had dried, was covered with insulating tape. The microelectrode
biosensors were fabricated by cutting through the covered working expose an edge that
measures in micrometers in one dimension. This simple fabrication procedure is utilised to
construct a reagentless glutamate microband biosensor.
As mentioned in Chapter 3 a non-reagentless glutamate biosensor has previously been
developed by drop-coating the required components onto the working electrode of screen-
printed carbon electrodes [16]. This chapter discusses the development of a reagentless
glutamate microband biosensor, employing CHIT, NAD+, GLDH and MB-SPCE in a
simple fabrication method. The application of this microband biosensor is for the real time
monitoring of glutamate flux from cells in response to toxic challenge is described. The
scientific novelty is present in both in the simplicity of fabrication of the reagentless
microband biosensor and its application to post-exposure and real time toxicity testing in
cell media.
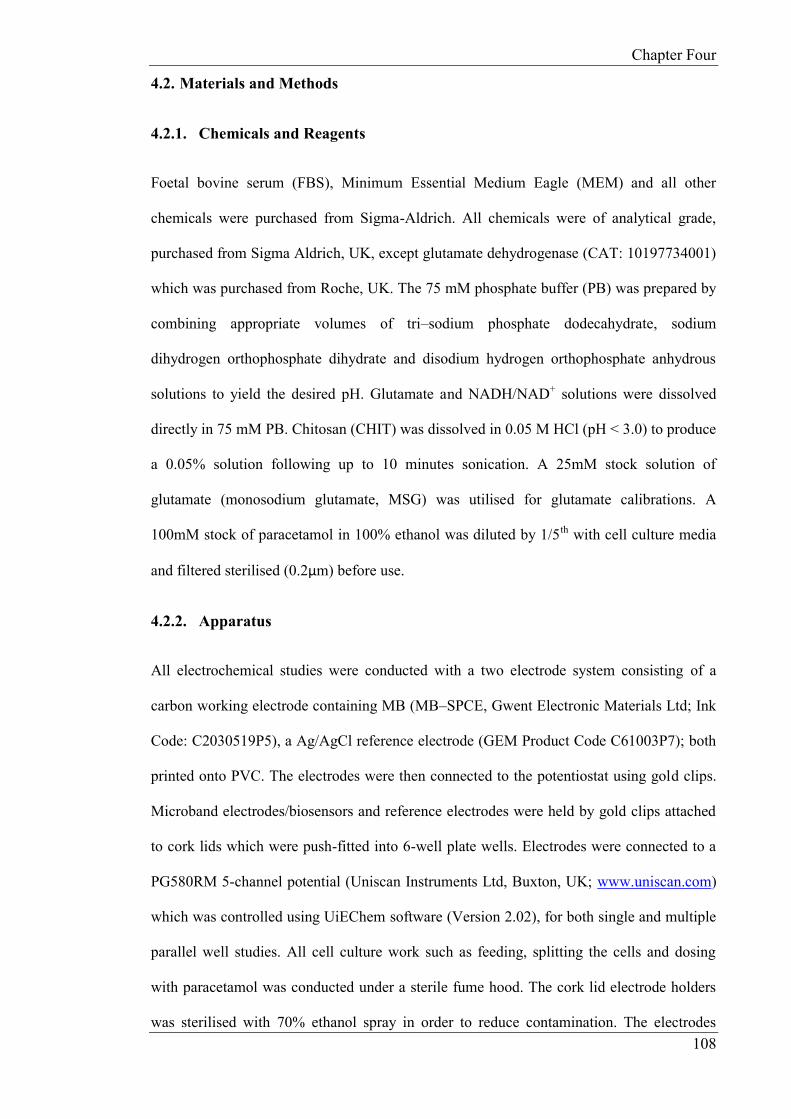
Chapter Four
108
4.2. Materials and Methods
4.2.1. Chemicals and Reagents
Foetal bovine serum (FBS), Minimum Essential Medium Eagle (MEM) and all other
chemicals were purchased from Sigma-Aldrich. All chemicals were of analytical grade,
purchased from Sigma Aldrich, UK, except glutamate dehydrogenase (CAT: 10197734001)
which was purchased from Roche, UK. The 75 mM phosphate buffer (PB) was prepared by
combining appropriate volumes of tri–sodium phosphate dodecahydrate, sodium
dihydrogen orthophosphate dihydrate and disodium hydrogen orthophosphate anhydrous
solutions to yield the desired pH. Glutamate and NADH/NAD+ solutions were dissolved
directly in 75 mM PB. Chitosan (CHIT) was dissolved in 0.05 M HCl (pH < 3.0) to produce
a 0.05% solution following up to 10 minutes sonication. A 25mM stock solution of
glutamate (monosodium glutamate, MSG) was utilised for glutamate calibrations. A
100mM stock of paracetamol in 100% ethanol was diluted by 1/5th with cell culture media
and filtered sterilised (0.2µm) before use.
4.2.2. Apparatus
All electrochemical studies were conducted with a two electrode system consisting of a
carbon working electrode containing MB (MB–SPCE, Gwent Electronic Materials Ltd; Ink
Code: C2030519P5), a Ag/AgCl reference electrode (GEM Product Code C61003P7); both
printed onto PVC. The electrodes were then connected to the potentiostat using gold clips.
Microband electrodes/biosensors and reference electrodes were held by gold clips attached
to cork lids which were push-fitted into 6-well plate wells. Electrodes were connected to a
PG580RM 5-channel potential (Uniscan Instruments Ltd, Buxton, UK; www.uniscan.com)
which was controlled using UiEChem software (Version 2.02), for both single and multiple
parallel well studies. All cell culture work such as feeding, splitting the cells and dosing
with paracetamol was conducted under a sterile fume hood. The cork lid electrode holders
was sterilised with 70% ethanol spray in order to reduce contamination. The electrodes

Chapter Four
109
themselves were not sterilised as the ethanol would potentially damage the enzyme and
cofactor. Studies utilising MEM and HepG2 cells were carried out in an incubator with a
5% CO2 atmosphere at 37ºC in order to maintain the pH of the cell media. Solutions, when
required, were stirred using a IKA MS 1 Minishaker. Measurement and monitoring of the
pH was conducted with a Fisherbrand Hydrus 400 pH meter (Orion Research Inc., USA).
Sonications were performed with a Devon FS100 sonicator (Ultrasonics, Hove, Sussex,
UK).
4.2.3. Biosensor Fabrication
The biosensor fabrication procedure is illustrated in Figure 4-1 (a-e). Briefly, microband
biosensors were fabricated by drop coating (a) 5µL of CHIT (0.05% in 0.05M HCl) onto the
surface of a 3mm2 working electrode, followed by (b) 9µL of GLDH (3U/µL) and 1µL of
NAD+ (106µg). (c) The biosensor was then left to dry overnight at 4ºC. (d) Once dried,
insulating tape was used to cover the working area and some of the electrode track. (e) The
covered area of the working electrode was cut through using a scissors to expose a 3mm-
long working electrode edge. The technique has previously been utilised to successfully
fabricate microband electrodes for the measurement of glucose [17] and hydrogen peroxide
[6].
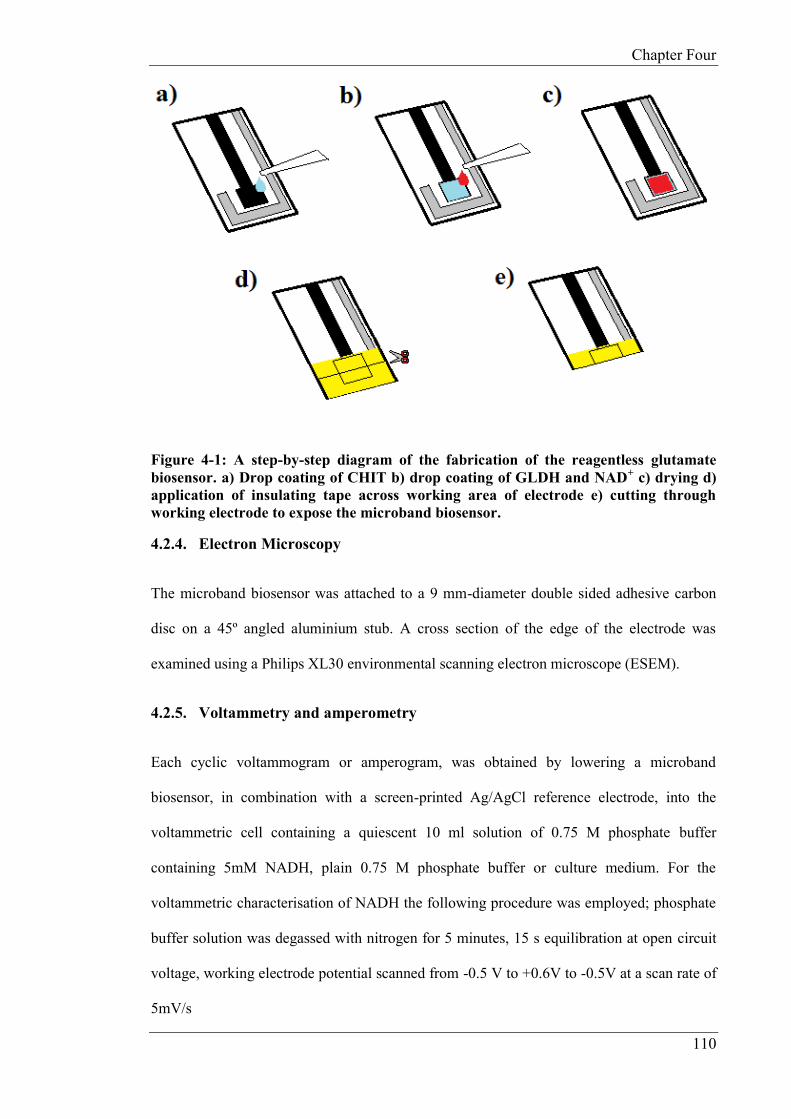
Chapter Four
110
Figure 4-1: A step-by-step diagram of the fabrication of the reagentless glutamate
biosensor. a) Drop coating of CHIT b) drop coating of GLDH and NAD+ c) drying d)
application of insulating tape across working area of electrode e) cutting through
working electrode to expose the microband biosensor.
4.2.4. Electron Microscopy
The microband biosensor was attached to a 9 mm-diameter double sided adhesive carbon
disc on a 45º angled aluminium stub. A cross section of the edge of the electrode was
examined using a Philips XL30 environmental scanning electron microscope (ESEM).
4.2.5. Voltammetry and amperometry
Each cyclic voltammogram or amperogram, was obtained by lowering a microband
biosensor, in combination with a screen-printed Ag/AgCl reference electrode, into the
voltammetric cell containing a quiescent 10 ml solution of 0.75 M phosphate buffer
containing 5mM NADH, plain 0.75 M phosphate buffer or culture medium. For the
voltammetric characterisation of NADH the following procedure was employed; phosphate
buffer solution was degassed with nitrogen for 5 minutes, 15 s equilibration at open circuit
voltage, working electrode potential scanned from -0.5 V to +0.6V to -0.5V at a scan rate of
5mV/s
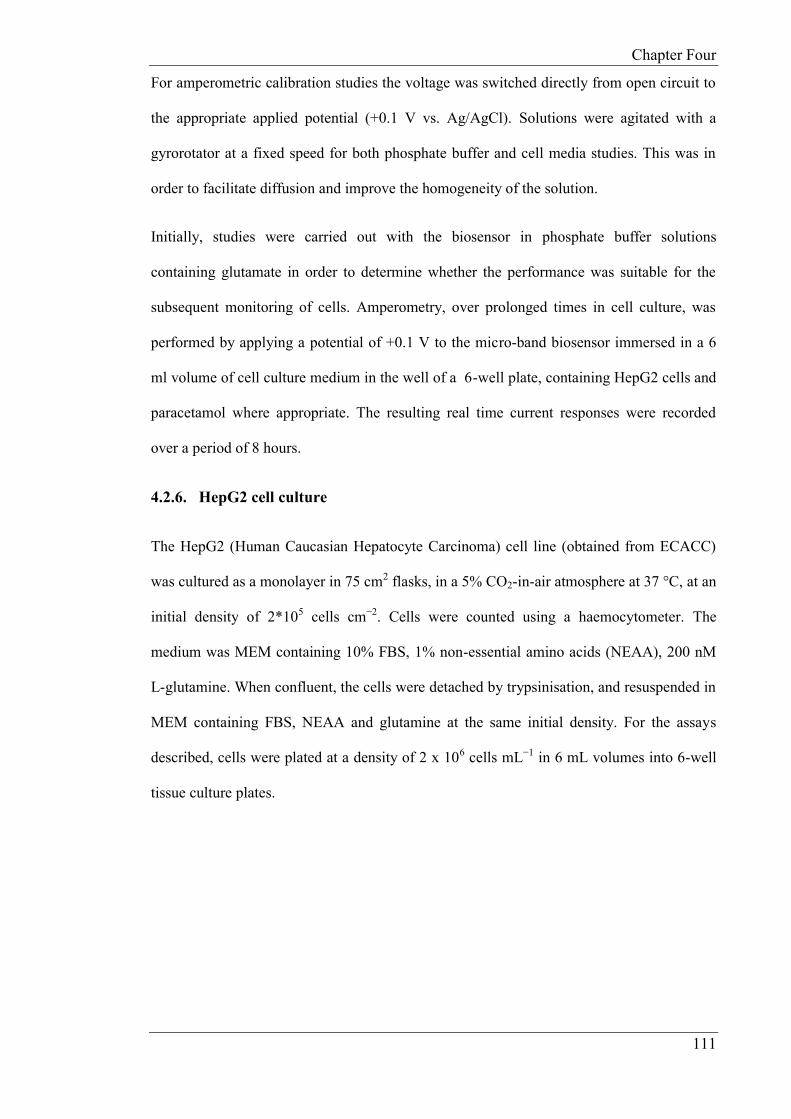
Chapter Four
111
For amperometric calibration studies the voltage was switched directly from open circuit to
the appropriate applied potential (+0.1 V vs. Ag/AgCl). Solutions were agitated with a
gyrorotator at a fixed speed for both phosphate buffer and cell media studies. This was in
order to facilitate diffusion and improve the homogeneity of the solution.
Initially, studies were carried out with the biosensor in phosphate buffer solutions
containing glutamate in order to determine whether the performance was suitable for the
subsequent monitoring of cells. Amperometry, over prolonged times in cell culture, was
performed by applying a potential of +0.1 V to the micro-band biosensor immersed in a 6
ml volume of cell culture medium in the well of a 6-well plate, containing HepG2 cells and
paracetamol where appropriate. The resulting real time current responses were recorded
over a period of 8 hours.
4.2.6. HepG2 cell culture
The HepG2 (Human Caucasian Hepatocyte Carcinoma) cell line (obtained from ECACC)
was cultured as a monolayer in 75 cm2 flasks, in a 5% CO2-in-air atmosphere at 37 °C, at an
initial density of 2*105 cells cm−2. Cells were counted using a haemocytometer. The
medium was MEM containing 10% FBS, 1% non-essential amino acids (NEAA), 200 nM
L-glutamine. When confluent, the cells were detached by trypsinisation, and resuspended in
MEM containing FBS, NEAA and glutamine at the same initial density. For the assays
described, cells were plated at a density of 2 x 10⁶ cells mL−1 in 6 mL volumes into 6-well
tissue culture plates.

Chapter Four
112
4.2.7. Real time monitoring of glutamate in cell culture media in the
presence/absence of cells and toxic compounds.
HepG2 cells grown in T75 flasks, once 80% confluent were trypsinized and transferred to
six well tissue culture plates, along with 6mls of cell media under sterile conditions. 24
hours were allowed to pass to allow the cells to fully adhere to the bottom of the cell well.
Once adhered, appropriate aliquots of paracetamol (100mM in 20% ethanol, diluted with
cell culture medium) were added to the wells in order to achieve the desired concentration.
The cork lids carrying a microband glutamate biosensor and reference electrode were push-
fitted into each well. A small (1 mm diameter) hole in the top surface of each sensor cork
lid allowed air to escape, avoided pressure build-up during the push-fitting step and allowed
for gaseous exchange to maintain the pH of the media. The non-essential amino acids
(NEAA) added to the cell culture media was found to contain a small concentration of
glutamate (0.31µM) which may have contributed to the background current.
Electrical contact was made through the temperature seal of the incubator and connected to
respective channels of the multichannel potentiostat. The 6-well plate was rotated utilising a
mini-shaker within an incubator at 37 °C, 5% CO2 in the air atmosphere. An operating
potential of +0.1 V vs Ag/AgCl was applied to each working electrode, and the instrument
was run in amperometric mode 8 hours for the real time studies. The resulting data were
exported into Microsoft Excel and plotted as current-versus time graphs.

Chapter Four
113
4.3. Results and discussion
4.3.1. Microband biosensors
An SEM image of the edge of the microband electrodes based on MB-SPCE are shown in
Figure 4-2. Each layer of the biosensor is labelled, with each layer visible. The thickness of
the original MB-SPCE working electrode is about 20 µm, thus the sensor is defined as a
microband biosensor. The exposed edge of the microband electrode possesses an area of
60,000 square µm (3mm x 20µm).
Figure 4-2. SEM image of the cross section of the microband biosensor electrode.

Chapter Four
114
4.3.2. Electrochemical Characterisation in NADH utilising Cyclic Voltammetry
The cyclic voltammogram for the Meldola’s Blue microband electrode in a solution
containing 0.75mM PBS, 0.50 mM NaCl, pH 7 and 5mM NADH, the resulting cyclic
voltammogram (Figure 4-3A) showed sigmoidal behaviour, with an increased current
response, which confirms that the response is due to the electro-catalytic oxidation using the
MB-SPCE [18]. This electrocatalytic response for NADH is a prerequisite for the operation
of the amperometric glutamate microband biosensor. The blank carried out in the same
solution in the absence of NADH showed a peak shape response indicative of a surface
confined layer of Meldola’s Blue (Figure 4-3, B, C).
Figure 4-3: Cyclic voltammograms of a reagentless glutamate biosensor in the
presence (A) and absence of 2.5 (B) and 5mM NADH (C) (PBS, pH 7.0). Scan rate at
5mVs.
-2.00E-06
-1.50E-06
-1.00E-06
-5.00E-07
0.00E+00
5.00E-07
1.00E-06
1.50E-06
-0.6 -0.4 -0.2 0 0.2 0.4 0.6 0.8
Cu
rren
t (A
)
Potential (V)
PBS
2.5 mM
5 mM
C
B
A

Chapter Four
115
4.3.3. Calibration studies of glutamate in phosphate buffer solution.
Amperograms obtained with the microband biosensors in agitated phosphate buffer
solutions (0.75mM with additional 0.5mM NaCl) at an applied potential +0.1V (Ag/AgCl)
are shown in Figure 4-4. The corresponding calibration plot is shown in Figure 4-5. Arrows
indicate aliquots of 6µL of a 25mM glutamate stock solution into 6mLs of buffer. The
standard deviations represented are based on n = 5. The biosensor, operating in phosphate
buffer possessed the following characteristics; linear range; 25 - 125µM, sensitivity; 0.0636
nA/µM and a theoretical limit of detection of 1.20µM (based on 3*S/N). All studies were
carried out at 37ºC, pH 7.0. We considered that these characteristics were suitable for
further studies with cell media. The current density for the biosensor in phosphate solution
was calculated to be 5µA/cm2, which is quite low for a microband biosensor. A study
investigating the voltammetric behaviour of the microband biosensor in the presence of
5mM ferricyanide resulted in a current density of 740µA/cm2, indicating that the Meldola’s
Blue is the rate limiting step.
4.3.4. Amperometric studies of glutamate in cell media.
Amperograms obtained with the microband biosensors in agitated MEM cell media at an
applied potential +0.1V (Ag/AgCl) are shown in Figure 4-6. The arrows indicate aliquots of
6µL of a 25mM glutamate stock solution into 6mLs of buffer The corresponding calibration
plot is shown in Figure 4-7. The standard deviations rare based on n = 3. The biosensor,
functioning in cell media, possessed the following characteristics; linear range; 25 – 150
µM, sensitivity; 0.128 nA/µM and a theoretical limit of detection of 4.2µM (based on
3*S/N). All studies were carried out 37ºC, pH 7.0, in-air-atmosphere of 5% CO2. At this
point the biosensor assay appeared to be suitable for our proposed real time cell toxicity
studies.
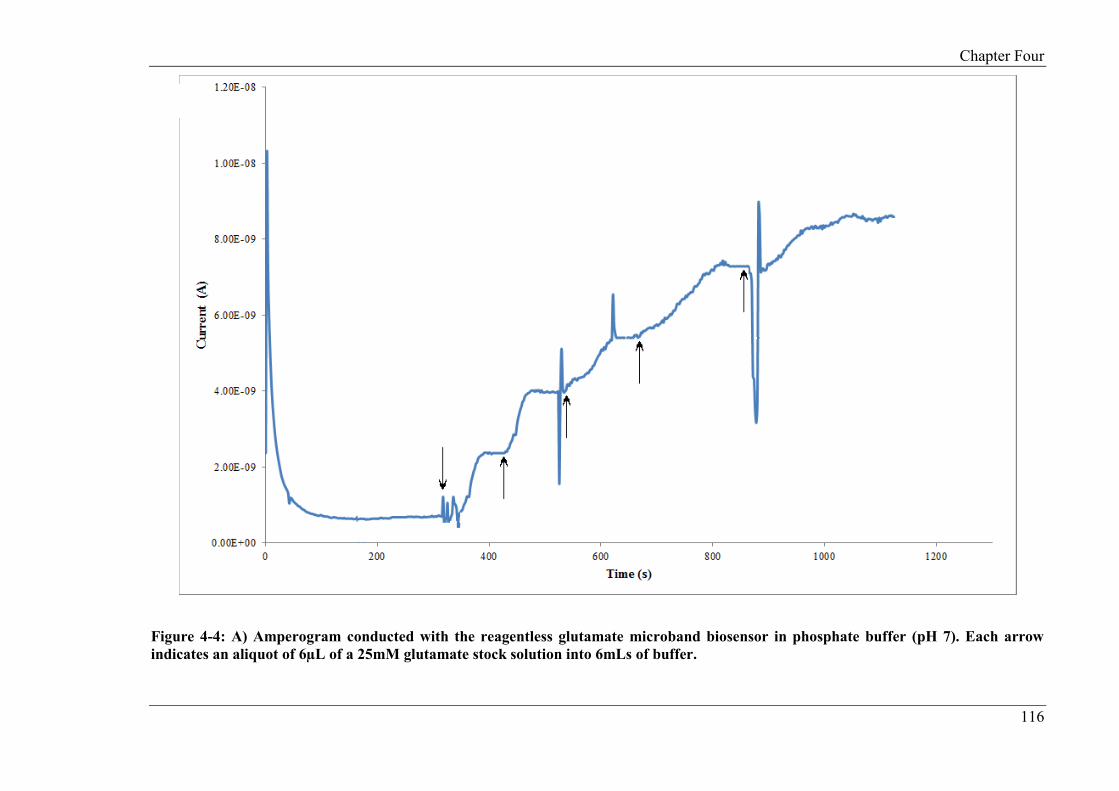
Chapter Four
116
Figure 4-4: A) Amperogram conducted with the reagentless glutamate microband biosensor in phosphate buffer (pH 7). Each arrow
indicates an aliquot of 6µL of a 25mM glutamate stock solution into 6mLs of buffer.
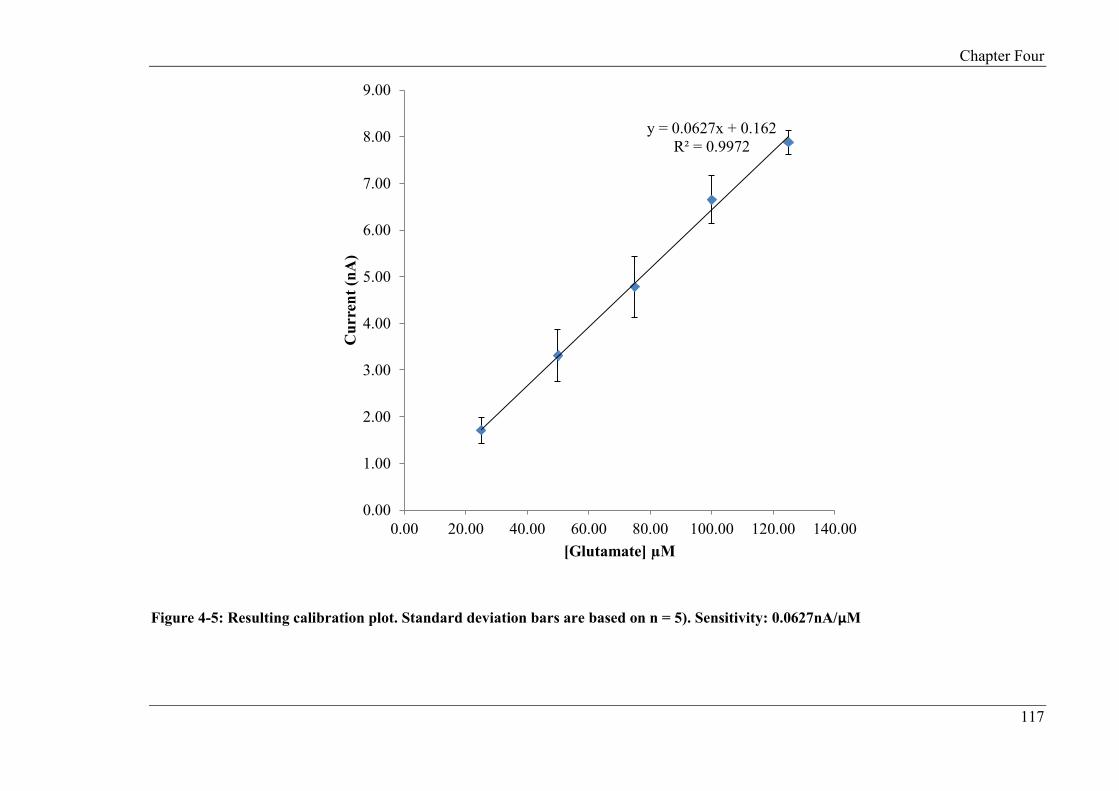
Chapter Four
117
Figure 4-5: Resulting calibration plot. Standard deviation bars are based on n = 5). Sensitivity: 0.0627nA/µM
y = 0.0627x + 0.162
R² = 0.9972
0.00
1.00
2.00
3.00
4.00
5.00
6.00
7.00
8.00
9.00
0.00 20.00 40.00 60.00 80.00 100.00 120.00 140.00
Cu
rren
t (n
A)
[Glutamate] µM
Chapter Four
118
Figure 4-6: A) Amperogram conducted with the reagentless glutamate microband biosensor in cell media. Each arrows indicate an
aliquot of 6µL of a 25mM glutamate stock solution into 6mLs of cell media.

Chapter Four
119
Figure 4-7: Resulting calibration plot. Standard deviation bars are based on n = 5. Sensitivity: 0.1298nA/µM
y = 0.1298x + 0.74
R² = 0.9991
0
5
10
15
20
25
30
0 25 50 75 100 125 150 175
Cu
rren
t (n
A)
[Glutamate] µM
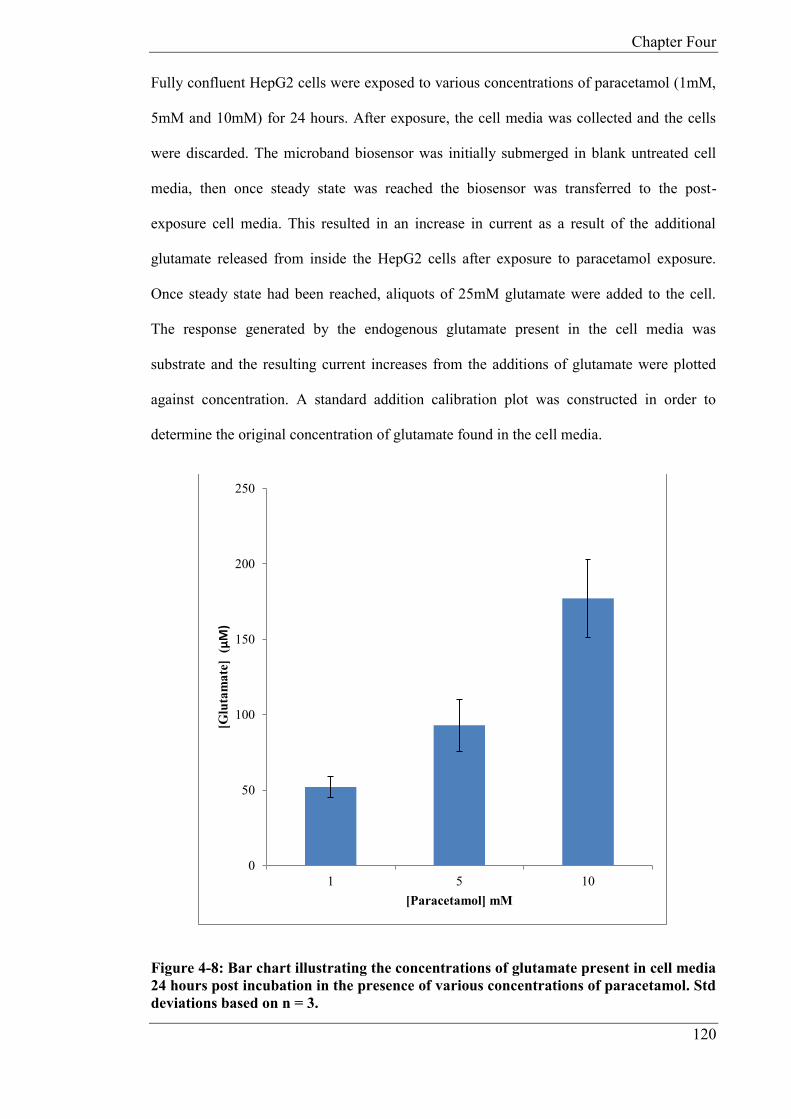
Chapter Four
120
Fully confluent HepG2 cells were exposed to various concentrations of paracetamol (1mM,
5mM and 10mM) for 24 hours. After exposure, the cell media was collected and the cells
were discarded. The microband biosensor was initially submerged in blank untreated cell
media, then once steady state was reached the biosensor was transferred to the post-
exposure cell media. This resulted in an increase in current as a result of the additional
glutamate released from inside the HepG2 cells after exposure to paracetamol exposure.
Once steady state had been reached, aliquots of 25mM glutamate were added to the cell.
The response generated by the endogenous glutamate present in the cell media was
substrate and the resulting current increases from the additions of glutamate were plotted
against concentration. A standard addition calibration plot was constructed in order to
determine the original concentration of glutamate found in the cell media.
Figure 4-8: Bar chart illustrating the concentrations of glutamate present in cell media
24 hours post incubation in the presence of various concentrations of paracetamol. Std
deviations based on n = 3.
0
50
100
150
200
250
1 5 10
[Glu
tam
ate
] (
µM
)
[Paracetamol] mM

Chapter Four
121
The average endogenous concentrations for glutamate released from the HepG2 cells was
52.07µM (CoV: 13.74%, n = 3), 93.30µM (CoV: 18.41%, n = 3) and 177.14µM (CoV:
14.54% n = 3) for 1mM, 5mM, 10mM doses of paracetamol respectively. A t-test to analyse
the significance of the values for 1mM and 5mM doses of paracetamol. A p value of less
than 0.05 was generated, implying the difference between the two values is significant
(Appendix Table 1). The resulting dose response plot is shown in Figure 4-8. The standard
deviations shown are based on n = 3. Typical intracellular glutamate levels are 2 – 5 mM/L
[19][20].
4.4. Real-time monitoring of glutamate release from HepG2 cells exposed to
various concentrations of paracetamol.
Microband biosensors were placed into six-well plates containing fully confluent HepG2
cells exposed to various concentrations of paracetamol (1mM, 5mM and 10mM) for 8
hours. Microband biosensors were placed into the wells which monitored the release of
glutamate and other constituents from the cells in real time by amperometry. Figure 4-9
illustrates the electrode holder, six well plate and minishaker setup within an incubator for
the real time studies. The minishaker was utilised in order to assist diffusion and decrease
the response time. The electrode holder consists of a cork lid which has been pierced with
gold electrode clips. The exposed ends of the gold clips are connected to a “chocolate”
block connector, which is wired directly one of the ports on the potentiostat. This enables
the biosensor to be attached to the gold clips on the underside of the cork lid and be
submerged in the cell media solution.
This method offers numerous advantages over a typical electrode holder setup. Firstly, the
cork-lids reduce the evaporation of the cell media, thereby reducing potential drifts in
current due to a false increase in concentration. Secondly, the lid is porous allowing for
gaseous exchange, thereby maintaining the cell media pH. A pipette lid is also inserted
through the cork, to assist gaseous exchange and allow for an entry port for the addition of

Chapter Four
122
aliquots of glutamate. Thirdly, the cork lids allow for the real time analysis of multiple
wells simultaneously, as they fit securely into the six well plates. Finally, it reduces the
likelihood of shorting as the connections to the potentiostat are separated from the cell
media solution.
Figure 4-9: Image depicting the experimental setup used for the real time studies.
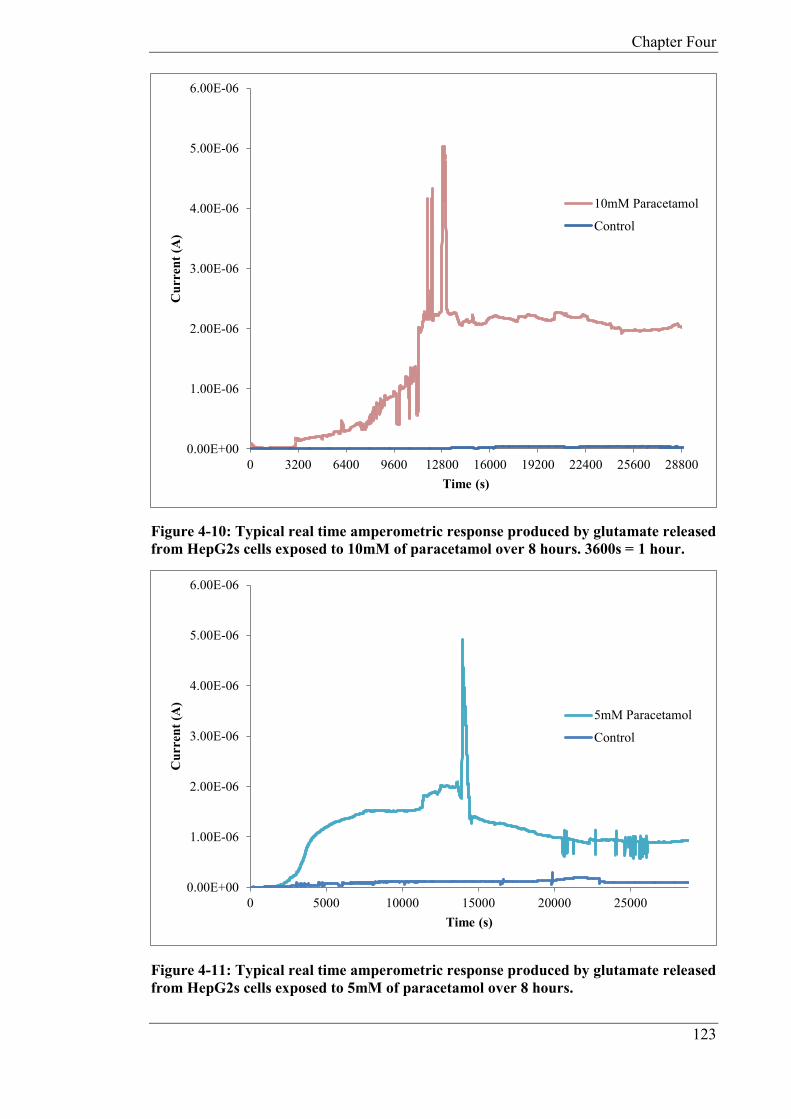
Chapter Four
123
Figure 4-10: Typical real time amperometric response produced by glutamate released
from HepG2s cells exposed to 10mM of paracetamol over 8 hours. 3600s = 1 hour.
Figure 4-11: Typical real time amperometric response produced by glutamate released
from HepG2s cells exposed to 5mM of paracetamol over 8 hours.
0.00E+00
1.00E-06
2.00E-06
3.00E-06
4.00E-06
5.00E-06
6.00E-06
0 3200 6400 9600 12800 16000 19200 22400 25600 28800
Cu
rren
t (A
)
Time (s)
10mM Paracetamol
Control
0.00E+00
1.00E-06
2.00E-06
3.00E-06
4.00E-06
5.00E-06
6.00E-06
0 5000 10000 15000 20000 25000
Cu
rren
t (A
)
Time (s)
5mM Paracetamol
Control
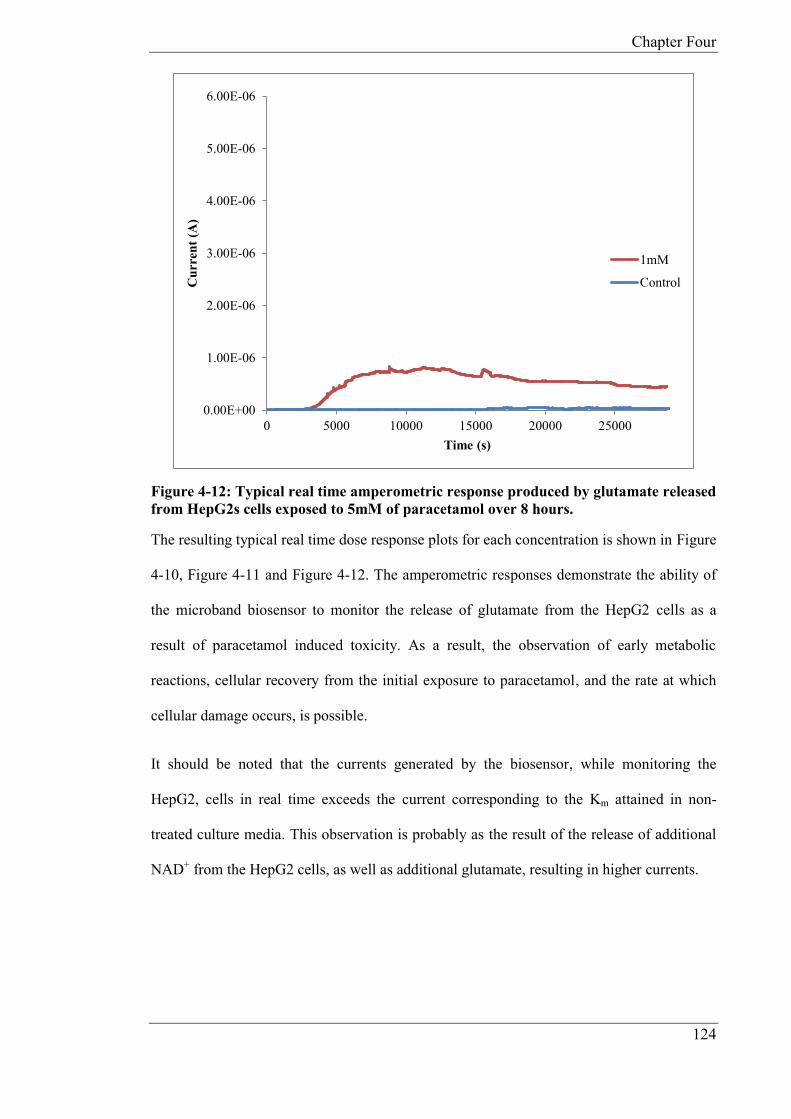
Chapter Four
124
Figure 4-12: Typical real time amperometric response produced by glutamate released
from HepG2s cells exposed to 5mM of paracetamol over 8 hours.
The resulting typical real time dose response plots for each concentration is shown in Figure
4-10, Figure 4-11 and Figure 4-12. The amperometric responses demonstrate the ability of
the microband biosensor to monitor the release of glutamate from the HepG2 cells as a
result of paracetamol induced toxicity. As a result, the observation of early metabolic
reactions, cellular recovery from the initial exposure to paracetamol, and the rate at which
cellular damage occurs, is possible.
It should be noted that the currents generated by the biosensor, while monitoring the
HepG2, cells in real time exceeds the current corresponding to the Km attained in non-
treated culture media. This observation is probably as the result of the release of additional
NAD+ from the HepG2 cells, as well as additional glutamate, resulting in higher currents.
0.00E+00
1.00E-06
2.00E-06
3.00E-06
4.00E-06
5.00E-06
6.00E-06
0 5000 10000 15000 20000 25000
Cu
rren
t (A
)
Time (s)
1mM
Control
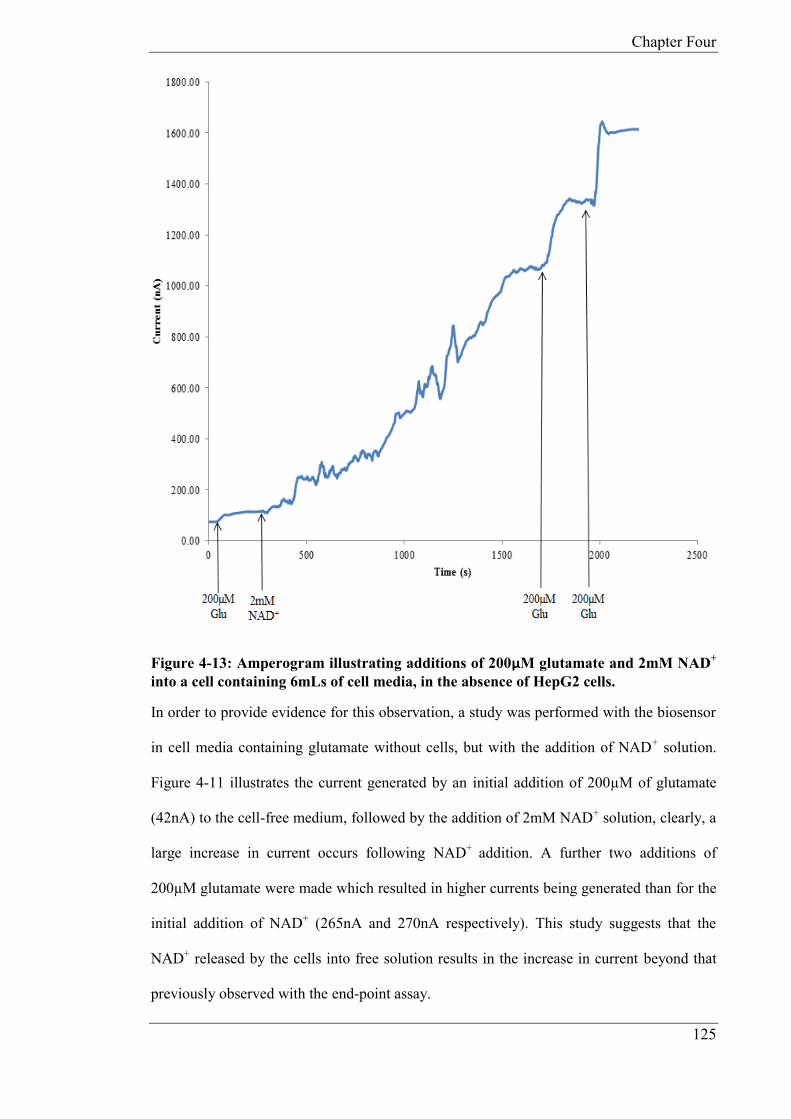
Chapter Four
125
Figure 4-13: Amperogram illustrating additions of 200µM glutamate and 2mM NAD+
into a cell containing 6mLs of cell media, in the absence of HepG2 cells.
In order to provide evidence for this observation, a study was performed with the biosensor
in cell media containing glutamate without cells, but with the addition of NAD+ solution.
Figure 4-11 illustrates the current generated by an initial addition of 200µM of glutamate
(42nA) to the cell-free medium, followed by the addition of 2mM NAD+ solution, clearly, a
large increase in current occurs following NAD+ addition. A further two additions of
200µM glutamate were made which resulted in higher currents being generated than for the
initial addition of NAD+ (265nA and 270nA respectively). This study suggests that the
NAD+ released by the cells into free solution results in the increase in current beyond that
previously observed with the end-point assay.

Chapter Four
126
An explanation for this effect is as follows. Paracetamol (I) in sub-lethal concentrations is
typically processed in the liver through Phase I and Phase II metabolism by CYP450
enzymes, whereby paracetamol is converted to n-acetyl-p-benzoquinone imine (NAPQI)
(II). Subsequently, glutathione conjugates the NAPQI to form a non-harmful product (III)
under small doses, however, at higher concentrations the glutathione is unable to regenerate
at a sufficient rapid rate to sequester the NAPQI [21]. The excess NAPQI subsequently
binds to membrane proteins (IV) [22][23], resulting in hepatic necrosis, which leads to the
rupture of the cell membrane and release of its contents.
Figure 4-14: Mechanism of Action for Paracetamol and the conjugation of NAPQI.
Glutamate dehydrogenase is found in high concentrations in rat liver [24] and adult human
liver [25] due to its association with amino acid metabolism. As a result, increased
concentrations of paracetamol are likely to lead to increased hepatic necrosis, subsequently
leading to an increase in glutamate concentration, which together with glutamate
dehydrogenase and NAD+ are released from the cells. The currents generated scale
accordingly with the increasing concentrations of paracetamol utilised, highlighting that the
biosensor is continuously monitoring changes in glutamate released by the cells.

Chapter Four
127
Figure 4-15: Bar chart illustrating the currents generated as a result of glutamate
released by the HepG2 cells after 8 hours of incubation in the presence of various
concentrations of paracetamol. Std deviations based on n = 3.
Figure 4-15 illustrates the currents generated with respect to the concentration of
paracetamol. The standard deviations shown are as follows; 1mM (coefficient of variation
(CoV): 3.3%), 5mM (CoV: 9.056%) and 10mM (CoV: 13.18%). It should be mentioned
that the effect of paracetamol monitored in real time agrees closely with the end point assay
described in section 4.3.5.
0.00E+00
5.00E-07
1.00E-06
1.50E-06
2.00E-06
2.50E-06
1mM 5mM 10mM
Cu
rren
t (A
)
[Paracetamol] mM
Chapter Four
128
4.5. Conclusions
Based on the findings presented in this chapter, it appears that the application of a
reagentless glutamate biosensor to both real-time monitoring and post-exposure of
mammalian cells in response to toxic challenge from various concentrations of paracetamol
can provide a means of assessing metabolic activity.
In repeat studies, the toxicity induced release of glutamate from the HepG2 cells resulted in
currents which corresponded with the concentrations of paracetamol utilised. By
standardising the experimental setup (37ºC in an incubator with a 5% CO2 atmosphere, all
studies carried out in cell media) reduced the potential for error by maintaining a favourable
environment for the cell media/cells. This ensures all metabolic effects are caused by the
addition of paracetamol.
Electrochemical microband biosensor monitoring in real time for metabolic events holds
great potential for further development. The simple drop coating fabrication procedure and
the simple cutting technique to fabricate the microband biosensor, could be a potential
platform for developing other microband biosensors based on dehydrogenase enzymes.
Future studies towards incorporating a series of reagentless microband biosensors based on
screen printed carbon electrodes into a multi-well array system for the simultaneous
monitoring of multiple analytes released from mammalian cells in response to toxic
challenge for the reduction or replacement of animal testing is currently ongoing.

Chapter Four
129
4.6. References
[1] P. Suresh and P. K. Basu, (2008), “Improving Pharmaceutical Product
Development and Manufacturing: Impact on Cost of Drug Development and Cost
of Goods Sold of Pharmaceuticals,” J. Pharm. Innov., 3, 175–187.
[2] A. Astashkina, B. Mann, and D. W. Grainger, (2012), “A critical evaluation of in
vitro cell culture models for high-throughput drug screening and toxicity.,”
Pharmacol. Ther., 134, 82–106.
[3] G. Fotakis and J. A. Timbrell, (2006), “In vitro cytotoxicity assays: comparison
of LDH, neutral red, MTT and protein assay in hepatoma cell lines following
exposure to cadmium chloride.,” Toxicol. Lett., 160, 171–7.
[4] R. Pemberton, T. Cox, R. Tuffin, I. Sage, G. Drago, N. Biddle, J. Griffiths, R.
Pittson, G. Johnson, J. Xu, S. Jackson, G. Kenna, R. W. Luxton, and J. P. Hart,
“Microfabricated glucose biosensor for culture well operation,” Biosensors and
Bioelectronics. Elsevier, (15-Apr-2013).
[5] R. M. Pemberton, J. Xu, R. Pittson, G. A. Drago, J. Griffiths, S. K. Jackson, and
J. P. Hart, (2011), “A screen-printed microband glucose biosensor system for
real-time monitoring of toxicity in cell culture.,” Biosens. Bioelectron., 26, 2448–
53.
[6] R. M. Pemberton, F. J. Rawson, J. Xu, R. Pittson, G. A. Drago, J. Griffiths, S. K.
Jackson, and J. P. Hart, (2010), “Application of screen-printed microband
biosensors incorporated with cells to monitor metabolic effects of potential
environmental toxins,” Microchim. Acta, 170, 321–330.
Chapter Four
130
[7] R. Pemberton, T. Cox, R. Tuffin, G. Drago, J. Griffiths, R. Pittson, G. Johnson, J.
Xu, I. Sage, R. Davies, S. K. Jackson, G. Kenna, R. W. Luxton, and J. P. Hart,
“Fabrication and evaluation of a micro(bio)sensor array chip for multiple parallel
measurements of important cell biomarkers,” Sensors. (01-Nov-2014).
[8] N. C. Danbolt, (2001), “Glutamate uptake.,” Prog. Neurobiol., 65, 1–105.
[9] C. F. Zorumski, S. Mennerick, and J. Que, (1996), “Modulation of excitatory
synaptic transmission by low concentrations of glutamate in cultured rat
hippocampal neurons.,” J. Physiol., 494, 465–477.
[10] R. Dingledine and P. J. Conn, (2000), “Peripheral glutamate receptors: molecular
biology and role in taste sensation.,” J. Nutr., 130, 1039S–42S.
[11] W. J. C. Geerts, A. Jonker, L. Boon, A. J. Meijer, R. Charles, C. J. F. Van
Noorden, and W. H. Lamers, (1997), “In Situ Measurement of Glutamate
Concentrations in the Periportal, Intermediate, and Pericentral Zones of Rat
Liver,” J. Histochem. Cytochem., 45, 1217–1229.
[12] R. Hems, M. Stubbs, and H. A. Krebs, (1968), “Restricted permeability of rat
liver for glutamate and succinate.,” Biochem. J., 107, 807–15.
[13] F. Botrè, E. Podestà, B. Silvestrini, and C. Botrè, (2001), “Toxicity testing in
environmental monitoring: the role of enzymatic biosensors.,” Ann. Ist. Super.
Sanita, 37, 607–13.
[14] M. Campàs, B. Prieto-Simón, and J.-L. Marty, (2007), “Biosensors to detect
marine toxins: Assessing seafood safety.,” Talanta, 72, 884–95.
Chapter Four
131
[15] M. I. Montenegro, M. A. Queirós, and J. L. Daschbach, Eds., Microelectrodes:
Theory and Applications. Dordrecht: Springer Netherlands, (1991).
[16] G. Hughes, R. M. Pemberton, P. R. Fielden, and J. P. Hart, (2014),
“Development of a Disposable Screen Printed Amperometric Biosensor Based on
Glutamate Dehydrogenase, for the Determination of Glutamate in Clinical and
Food Applications,” Anal. Bioanal. Electrochem., 6, 435–449.
[17] R. M. Pemberton, R. Pittson, N. Biddle, and J. P. Hart, (2009), “Fabrication of
microband glucose biosensors using a screen-printing water-based carbon ink and
their application in serum analysis.,” Biosens. Bioelectron., 24, 1246–52.
[18] S. D. Sprules, J. P. Hart, R. Pittson, and S. a Wring, (1996), “Evaluation of a new
disposable screen-printed sensor strip for the measurement of NADH and its
modification to produce a lactate biosensor employing microliter volumes,”
Electroanalysis, 8, 539–543.
[19] J. T. Brosnan, (2000), “Glutamate, at the interface between amino acid and
carbohydrate metabolism.,” J. Nutr., 130, 988S–90S.
[20] J. T. Brosnan, K. C. Man, D. E. Hall, S. A. Colbourne, and M. E. Brosnan,
(1983), “Interorgan metabolism of amino acids in streptozotocin-diabetic
ketoacidotic rat.,” Am. J. Physiol., 244, E151–8.
[21] J. R. Mitchell, D. J. Jollow, W. Z. Potter, J. R. Gillette, and B. B. Brodie, (1973),
“Acetaminophen-induced hepatic necrosis. IV. Protective role of glutathione.,” J.
Pharmacol. Exp. Ther., 187, 211–7.
Chapter Four
132
[22] M. Moore, H. Thor, G. Moore, S. Nelson, P. Moldéus, and S. Orrenius, (1985),
“The toxicity of acetaminophen and N-acetyl-p-benzoquinone imine in isolated
hepatocytes is associated with thiol depletion and increased cytosolic Ca2+.,” J.
Biol. Chem., 260, 13035–40.
[23] Y. Dai and A. I. Cederbaum, (1995), “Cytotoxicity of acetaminophen in human
cytochrome P4502E1-transfected HepG2 cells.,” J. Pharmacol. Exp. Ther., 273,
1497–505.
[24] D. H. Williamson, P. Lund, and H. A. Krebs, (1967), “The redox state of free
nicotinamide-adenine dinucleotide in the cytoplasm and mitochondria of rat
liver.,” Biochem. J., 103, 514–27.
[25] A. Herzfeld, V. M. Rosenoer, and S. M. Raper, (1976), “Glutamate
dehydrogenase, alanine aminotransferase, thymidine kinase, and arginase in fetal
and adult human and rat liver.,” Pediatr. Res., 10, 960–4.

Chapter Five
133
CHAPTER FIVE
Development of a novel reagentless, screen–printed
amperometric biosensor based on glutamate
dehydrogenase and NAD+, integrated with multi–
walled carbon nanotubes for the determination of
glutamate in food and clinical applications.
Chapter Five
134
5. Contents
5. Contents ............................................................................................................ 134
5.1. Introduction ....................................................................................................... 136
5.2. Materials and Methods ...................................................................................... 138
5.2.1. Chemicals and reagents ..................................................................................... 138
5.2.2. Apparatus .......................................................................................................... 138
5.3. Procedures ......................................................................................................... 139
5.3.1. Fabrication of the reagentless MWCNT–CHIT–MB/GLDH–NAD+–
CHIT/MWCNT–CHIT biosensor. ................................................................................ 139
5.3.2. Hydrodynamic Voltammetry ............................................................................ 141
5.3.3. Optimisation studies with the proposed biosensor using amperometry in stirred
solution. ......................................................................................................................... 142
5.3.4. Application of optimised amperometric biosensor to the determination of
glutamate in food........................................................................................................... 144
5.3.5. Application of optimised amperometric biosensor to the determination of
glutamate in serum. ....................................................................................................... 144
5.4. Results and Discussion ...................................................................................... 145
5.4.1. Characterisation of the biosensor using scanning electron microcroscopy (SEM)
and amperometry ........................................................................................................... 145
5.4.2. Hydrodynamic Voltammetry ............................................................................ 146
5.4.3. Optimisation Studies ......................................................................................... 147
5.4.4. Linear Range, Sensitivity, Detection Limit and Lifetime of Biosensor ............ 148
Chapter Five
135
5.4.5. Optimisation of Temperature and pH ............................................................... 150
5.4.6. Application of the optimum amperometric biosensor (MWCNT–CHIT–
MB/GLDH–NAD–CHIT–MB/MWCNT–CHIT–MB) to the determination of glutamate
in unspiked food. ........................................................................................................... 150
5.4.7. Application of the optimum amperometric biosensor (MWCNT–CHIT–
MB/GLDH–NAD–CHIT–MB/MWCNT–CHIT–MB) to the determination of glutamate
in both unspiked and spiked serum. .............................................................................. 153
5.5. Conclusion ........................................................................................................ 155
5.6. References ......................................................................................................... 157

Chapter Five
136
5.1. Introduction
In chapter 3 we have reported on an approach to glutamate biosensor development, based
on a screen–printed biosensor incorporating a redox mediator and glutamate dehydrogenase
(GLDH). In that approach the required enzyme cofactor, nicotinamide adenine dinucleotide
(NAD+), was added into the analyte solution containing glutamate; the disposable biosensor
was successfully applied to the analysis of serum and stock cubes [1]. While successful, the
main drawback of this approach for a commercial biosensor is the requirement to add the
cofactor into the sample solution. In chapter 4, a reagentless microband biosensor was
fabricated and applied to both post-exposure and real time toxicity studies. The fabrication
process consisted of utilising CHIT, NAD+ and GLDH, dropcoated onto the surface of the
working electrode of the MB-SPCE. Once dried, the surface was covered with insulating
tape and the microband was defined by cutting through the WE with scissors. In this
chapter, the fabrication of a conventional sized biosensor utilising a layer-by-layer drop
coating procedure is described.
Carbon nanotubes (CNTs) are renowned for their unique electronic and mechanical
properties [2]. They possess a high active surface area, excellent biocompatibility [3] and
the ability to facilitate redox reactions with fast electron–transfer rates [4]. These abilities
have popularised CNTs in the development of electrochemical biosensors.
Two forms of CNT exist; single walled CNT (SWCNTs) and multi–walled CNT
(MWCNTs). SWCNTs possess a singular graphite sheet rolled into a tube to produce a
cylindrical nanostructure, whereas MWCNT consist of several shells of cylindrical tubes.
Integration of redox dyes such as Meldola’s Blue (MB) into MWCNT matrices, has been
previously demonstrated with well–defined voltammetric responses [5]–[7]. It should be
mentioned that the electrocatalyst MB greatly reduces the over-potential for the oxidation of
NADH [8].

Chapter Five
137
The low solubility of unmodified MWCNTs leads to poor homogenous dispersion, thus in
the present study the MWCNTs were suspended in a solution containing chitosan (CHIT).
CHIT is a natural polysaccharide derived from crustaceans, which enhances enzyme
stability and possesses good film forming properties [9], [10]. The dispersion of CNTs was
possible due to the low pH required to solubilise the CHIT (pH < 3.0) [11], which was
achieved using HCl. It was reported that the dispersion of MWCNTs in CHIT/HCl
compared with other solvents gave the smallest particle sizes and resulted in the formation
of a greater surface area without the need for functionalization.
It has previously been reported that NAD+ was readily integrated into a glucose
dehydrogenase biosensor and did not leach from the MWCNT matrix when coated onto the
surface of a glassy carbon electrode [12]. This was achieved utilising a layer-by-layer
assembly procedure. Other researchers have reported on the layer-by-layer immobilisation
method using modified CNTs to immobilise glutamate oxidase [13], [14] and horse radish
peroxidase [15]. This procedure is regarded as a simple, inexpensive and highly versatile
method for the incorporation of components into film structures [16]. The advantages of a
reagentless device fabricated using this approach is that it leads to a low cost biosensor
which is convenient to use as no additional cofactor is required to be added to the sample
solution [17], [18].
This chapter describes the steps involved in the layer-by-layer development of a fully
reagentless amperometric biosensor for glutamate. The strategy employed to achieve this
goal has involved the integration of the biological components (enzyme and cofactor) with
multi–walled carbon nanotubes (MWCNTs) on the surface of a Meldola’s Blue screen–
printed carbon electrode (MB–SPCE). The biosensor has been applied to the determination
of glutamate in serum sample and stock cubes.

Chapter Five
138
Based on the literature, it is believed that this is the first report on the development and
application of a reagentless amperometric glutamate biosensor, based on GLDH and NAD+
integrated with a disposable screen-printed electrode.
5.2. Materials and Methods
5.2.1. Chemicals and reagents
All chemicals were of analytical grade, purchased from Sigma Aldrich, UK, except
glutamate dehydrogenase (CAT: 10197734001) which was purchased from Roche, UK. The
75 mM phosphate buffer (PB) was prepared by combining appropriate volumes of tri–
sodium phosphate dodecahydrate, sodium dihydrogen orthophosphate dihydrate and
disodium hydrogen orthophosphate anhydrous solutions to yield the desired pH. Glutamate
and NADH/NAD+ solutions were dissolved directly in 75 mM PB. Chitosan (CHIT) was
dissolved in 0.05 M HCl (pH < 3.0) to produce a 0.05% solution following up to 10 minutes
sonication. The multi-walled carbon nanotubes (MWCNT)/CHIT solution was prepared by
mixing 0.6 mg of MWCNT into 300 µL solution of 0.05% of CHIT, with 15 minutes of
sonication and stirring for 24 hours. Meldola’s Blue (MB) in solution was prepared by
dissolving the appropriate weight in distilled water. Fetal bovine serum (FBS) (South
American Origin, CAT: S1810–500) obtained from Labtech Int. Ltd, was used for serum
analysis. Food samples (Beef OXO cubes) were obtained from a local supermarket.
5.2.2. Apparatus
All electrochemical experiments were conducted with a three–electrode system consisting
of a carbon working electrode containing MB, (MB–SPCE, Gwent Electronic Materials
Ltd; Ink Code: C2030519P5), a Ag/AgCl reference electrode (GEM Product Code
C61003P7); both printed onto PVC, and a separate Pt counter electrode. The area of the
working electrode was defined using insulating tape, into a 3 x 3 mm square area. The
electrodes were then connected to the potentiostat using gold clips. Solutions, when
required, were stirred using a circular magnetic stirring disk and stirrer (IKA® C–MAG HS
Chapter Five
139
IKAMAG, Germany) at a uniform rate. A µAutolab II electrochemical analyser with
general purpose electrochemical software GPES 4.9 was used to acquire data and
experimentally control the voltage applied to the SPCE in the 10 ml electrochemical cell
which was used for hydrodynamic voltammetry. An AMEL Model 466 polarographic
analyser combined with a GOULD BS–271 chart recorder was used for all amperometric
studies. Measurement and monitoring of the pH was conducted with a Fisherbrand Hydrus
400 pH meter (Orion Research Inc., USA). Sonications were performed with a Devon
FS100 sonicator (Ultrasonics, Hove, Sussex, UK).
5.3. Procedures
5.3.1. Fabrication of the reagentless MWCNT–CHIT–MB/GLDH–NAD+–
CHIT/MWCNT–CHIT biosensor.
Fabrication was carried out using a layer-by-layer approach to produce a total of three
layers. Solutions were drop-coated onto the 3mm2 carbon working electrode. Initial studies
were performed to deduce the composition of layers 1 and 3. Figure 5-1 represents the
layer-by-layer biosensor.

Chapter Five
140
Figure 5-1: A schematic diagram displaying the layer-by-layer drop coating
fabrication procedure used to construct the reagentless glutamate biosensor, based on
a MB-SPCE electrode.
Layer 1 was formed by drop coating a 10µL mixture of MWCNTs suspended in a solution
containing 0.05% CHIT in a 0.05M HCl solution. This layer was allowed to partially dry at
4°C under vacuum for 10 minutes.
Layer 2 was optimised by carrying out amperometric studies with biosensors constructed
using different mass combinations of CHIT, NAD+ with a fixed GLDH content of 27U
(Table 1). This layer was allowed to dry at 4°C under vacuum for 3 hours.
Layer 3 was formed in the same manner as Layer 1. This layer was allowed to dry at 4°C
under vacuum for 2 hours.
A further study into the effect of including additional MB was also performed. This was
done by mixing in 1 µL of 0.01M MB in H2O with the MWCNTs in layers 1 and 3. For
layer 2, an additional 1 µL of 0.01M MB in H2O was deposited at the composite surface.
Biosensors were stored under a vacuum at 4°C when not in use. A photograph of the final
biosensor is provided (Figure 5-2).
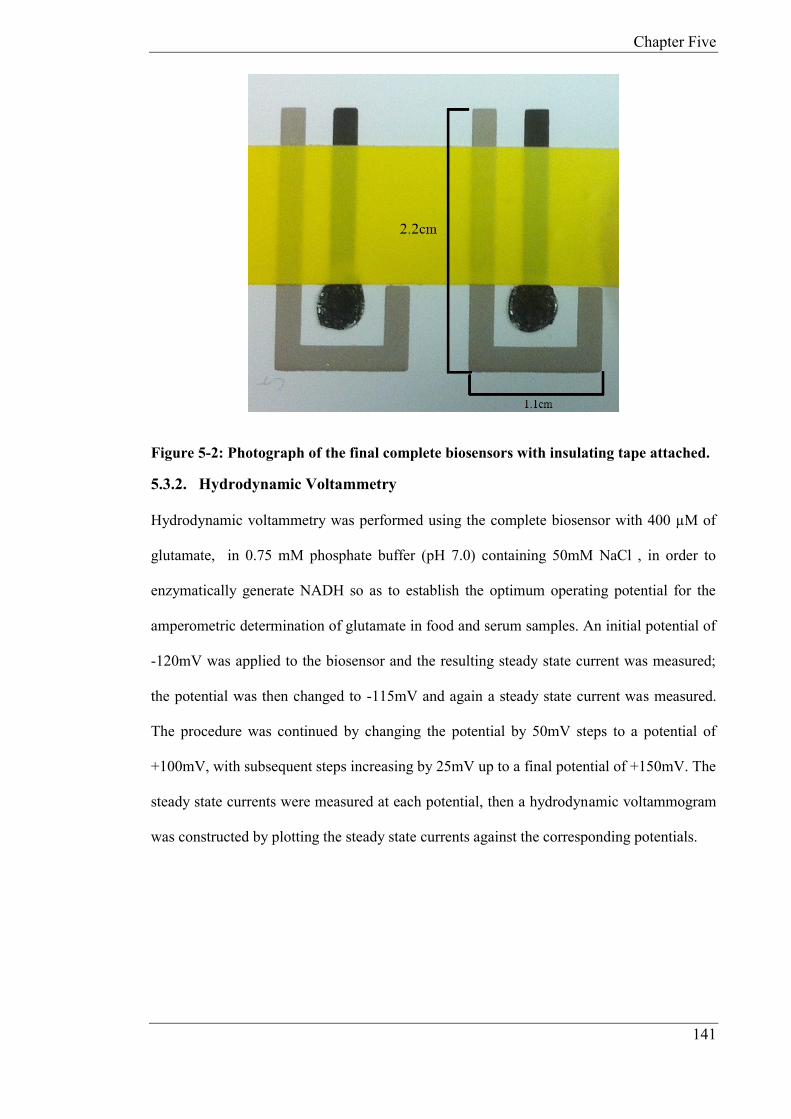
Chapter Five
141
Figure 5-2: Photograph of the final complete biosensors with insulating tape attached.
5.3.2. Hydrodynamic Voltammetry
Hydrodynamic voltammetry was performed using the complete biosensor with 400 µM of
glutamate, in 0.75 mM phosphate buffer (pH 7.0) containing 50mM NaCl , in order to
enzymatically generate NADH so as to establish the optimum operating potential for the
amperometric determination of glutamate in food and serum samples. An initial potential of
-120mV was applied to the biosensor and the resulting steady state current was measured;
the potential was then changed to -115mV and again a steady state current was measured.
The procedure was continued by changing the potential by 50mV steps to a potential of
+100mV, with subsequent steps increasing by 25mV up to a final potential of +150mV. The
steady state currents were measured at each potential, then a hydrodynamic voltammogram
was constructed by plotting the steady state currents against the corresponding potentials.

Chapter Five
142
5.3.3. Optimisation studies with the proposed biosensor using amperometry in
stirred solution.
All amperometric measurements were performed with stirred 10mL solutions of 75mM PB
pH 7.0 with 50mM NaCl (PBS), using an applied potential of +0.1 V vs. Ag/AgCl. In order
to optimise the conditions the biosensor was immersed in a stirred buffer solution, the
potential applied and sufficient time was allowed for a steady–state current to be obtained.
The optimisation of each component in layer 2 was performed by measuring the
amperometric response to the additions of glutamate over the concentration range of 7.5 µM
to 100 µM glutamate. The variations in the quantities of the components are shown in Table
5-1.
GLDH (Units) NAD+ (µg) CHIT (µg)
27 13.5 5
27 27 5
27 54 5
27 106 5
27 214 5
27 106 5
27 106 10
27 106 15
27 106 20
Table 5-1: This table displays the combination of components found in layer 2.
After the optimisation of the NAD+ and CHIT components, the integration of additional
0.01M Meldola’s Blue into each layer of the biosensor was investigated by amperometry.
Following optimisation of the individual biosensor components, studies into the effects of
temperature and pH on the biosensor response were investigated. Optimum pH was

Chapter Five
143
determined by carrying out calibration studies over the pH range 5 – 9 (Figure 5-3). A
separate study was conducted to determine the optimum temperature (Figure 5-4). The
temperature was varied over the range 25 – 40°C with the pH fixed at 7.
Figure 5-3: pH study conducted over the range of pH 5 to 9. n = 3
Figure 5-4: Temperature study conducted over the range of 25 to 40°C. n = 3
0
0.05
0.1
0.15
0.2
0.25
0.3
0.35
0.4
0.45
5 6 7 8 9
Sen
sit
ivit
y (
nA
/µA
)
pH
0
0.05
0.1
0.15
0.2
0.25
0.3
0.35
0.4
0.45
25 30 35 40
Sen
sit
ivit
y (
nA
/µM
)
Temperature °C
Chapter Five
144
5.3.4. Application of optimised amperometric biosensor to the determination of
glutamate in food.
An OXO cube was prepared by dissolving one cube in 50 mL of phosphate buffer and
sonicating for 15 minutes. The endogenous concentration of MSG was determined by using
the method of standard addition. An initial 5µl volume of the dissolved OXO cube was
added to the stirred buffered solution (10 mL) in the voltammetric cell containing the
biosensor, operated at +0.1 V (vs. Ag/AgCl) with subsequent standard additions of 3 µL of
25 mM glutamate.
The reproducibility of the biosensor assay for MSG analysis in OXO cubes was determined
by repeating the whole procedure five times with five individual biosensors.
5.3.5. Application of optimised amperometric biosensor to the determination of
glutamate in serum.
The endogenous glutamate concentration of serum was determined by injecting an initial
volume of 150 µL of serum into 9.85mL of buffer solution. Amperometry in stirred solution
using an applied potential of +0.1V vs. (Ag/AgCl) was conducted with the serum solution.
This was followed by additions of 3 µL aliquots of 25 mM standard glutamate solution to
the voltammetric cell. The currents resulting from the enzymatic generation of NADH were
used to construct standard addition plots, from which the endogenous concentration of
glutamate was determined (n = 5). The reproducibility of the biosensor measurement was
deduced by repeating the studies five times on a freshly diluted solution of the same serum
with a fresh biosensor for each measurement.
The procedure was repeated using 50µL of serum spiked with 1.5 mM glutamate (n = 5) to
determine to the recovery of the assay.
Due to the complex nature of the samples investigated, interferences such as ascorbic acid,
sugars and other amino acids may be present. The possible effects of naturally occurring
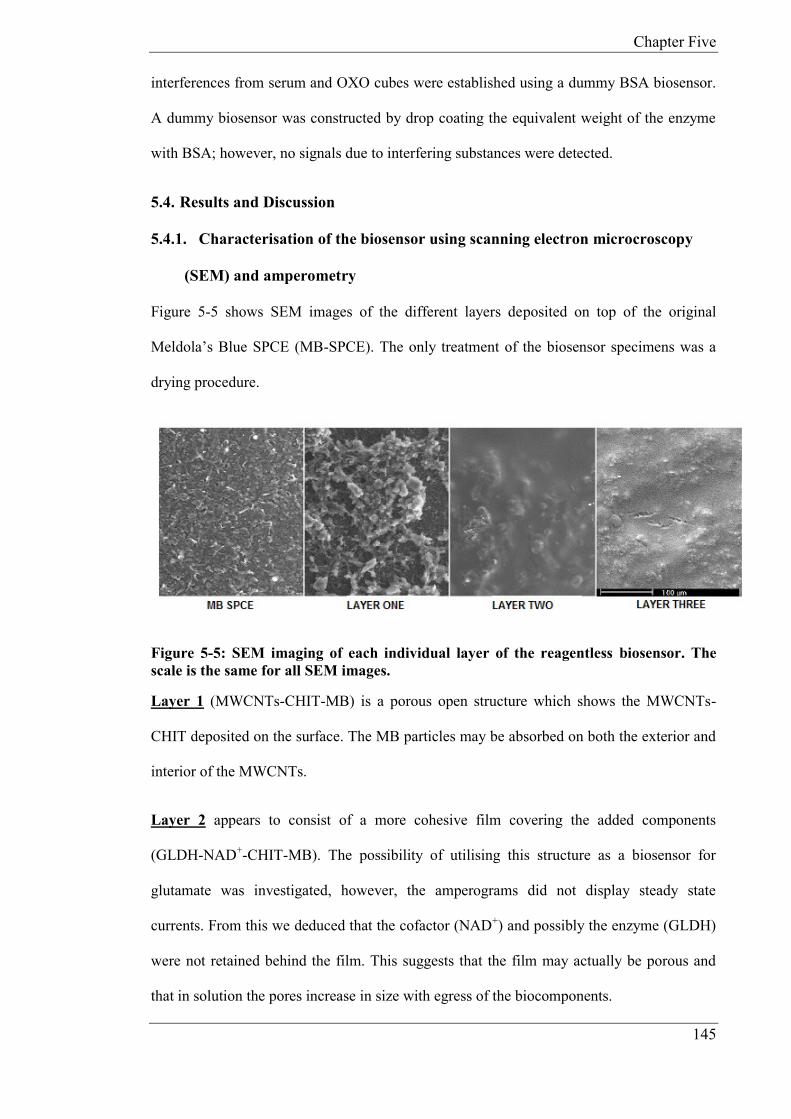
Chapter Five
145
interferences from serum and OXO cubes were established using a dummy BSA biosensor.
A dummy biosensor was constructed by drop coating the equivalent weight of the enzyme
with BSA; however, no signals due to interfering substances were detected.
5.4. Results and Discussion
5.4.1. Characterisation of the biosensor using scanning electron microcroscopy
(SEM) and amperometry
Figure 5-5 shows SEM images of the different layers deposited on top of the original
Meldola’s Blue SPCE (MB-SPCE). The only treatment of the biosensor specimens was a
drying procedure.
Figure 5-5: SEM imaging of each individual layer of the reagentless biosensor. The
scale is the same for all SEM images.
Layer 1 (MWCNTs-CHIT-MB) is a porous open structure which shows the MWCNTs-
CHIT deposited on the surface. The MB particles may be absorbed on both the exterior and
interior of the MWCNTs.
Layer 2 appears to consist of a more cohesive film covering the added components
(GLDH-NAD+-CHIT-MB). The possibility of utilising this structure as a biosensor for
glutamate was investigated, however, the amperograms did not display steady state
currents. From this we deduced that the cofactor (NAD+) and possibly the enzyme (GLDH)
were not retained behind the film. This suggests that the film may actually be porous and
that in solution the pores increase in size with egress of the biocomponents.

Chapter Five
146
Layer 3 shows a more compact structure and the underlying biosensor components are less
visible than in layer 2. The biosensor comprising all 3 layers produced steady state
responses to the addition of glutamate, indicating successful immbolisation of all the
components.
5.4.2. Hydrodynamic Voltammetry
Hydrodynamic voltammetry was performed using the reagentless biosensor with 400 µM of
glutamate in 0.75mM phosphate buffer (pH 7.0) containing 50mM NaCl. The optimum
potential was considered to be +0.1V vs. Ag/AgCl (Figure 5-6) as this potential was
situated on the plateau of the voltammetric wave.
Figure 5-6: Hydrodynamic voltammograms obtained using MB-SPCE/MWCNT-
CHIT-MB/GLDH-NAD+-CHIT-MB/MWCNT-CHIT-MB biosensor in the presence of
400µM glutamate in 75mM phosphate buffer (pH 7.0) containing 50 mM NaCl.

Chapter Five
147
5.4.3. Optimisation Studies
GLDH
(Units)
NAD+ (µg) CHIT (µg) Linear
Range (µM)
Sensitivity
(nA/µM)
27 13.5 5 25 – 50 0.035
27 27 5 25 – 100 0.230
27 54 5 25 – 75 0.238
27 106 5 25 – 100 0.307
27 214 5 25 – 50 0.238
27 106 5 25 – 100 0.305
27 106 10 7.5 – 105 0.315
27 106 15 25 – 50 0.261
27 106 20 Steady states
not achieved.
N/A
Table 5-2: Performance characteristics of the glutamate biosensor fabricated with
different masses of NAD+ and CHIT using a fixed quantity of GLDH.
Table 5-2 displays that the best performance for the glutamate biosensor was achieved with
106 µg NAD+ and 10 µg of CHIT, together with 27U of GLDH in layer 2, in the absence of
MB.
It has been noted by [19], that with increasing concentrations of CHIT, the particle size of
untreated MWCNT’s in aqueous solution is increased; consequently the larger particle size
leads to increasingly entangled molecules of CNT/CHIT resulting in higher visocities. This
change in visoscity would lead to a smaller diffusion coefficient, therefore leading to a
decrease in the signal. This might explain why loadings of 15µg and 20µg resulted in less
sensitivity than 10µg in the present study. This also suggests that 5µg may not have

Chapter Five
148
sufficiently bound the biological components, in comparison to 10µg of CHIT.
Consequently, a CHIT loading of 10µg was selected for further studies.
In order to asses the possibility of enchancing the effectiveness of the electron shuttling
through the MWCNTs to the underlying MB electrode, the effect of adding additional MB
into these layers was investigated. It was found that the sensitivity was increased from
0.315 nA/µM to 0.396 nA/µM and the linear range was unaltered. Consequently MB was
incorporated into all layers of the biosensor for all further studies.
5.4.4. Linear Range, Sensitivity, Detection Limit and Lifetime of Biosensor
Figure 5-7A, shows a typical amperogram obtained with the optimised biosensor for
different concentrations of glutamate. The resulting calibration plots (Appendix Figure 1)
are linear over the range 7.5 – 105µM, the first calibration plot depicts Fig 5A; the detection
limit was 3µM (based on n = 5, the coefficient of variation (CV) was 8.5%), based on three
times the signal to noise, and the sensitivity was 0.39 nA/µM (based on n =5, the CV was
6.37%). It should be noted that the biosensor possesses sensitivity relative to surface area of
4.3µA/mM/cm2. This behaviour demonstrates the possibility of applying this device to food
and biological samples.

Chapter Five
149
Figure 5-7 A) Amperogram conducted with the proposed final biosensor. Each arrow
represents an injection of 3µL of 25mM glutamate in a 10mL stirred solution
containing supporting electrolyte; 75mM, PB (pH 7.0), with 50mM NaCl at an applied
potential of +0.1V vs. Ag/AgCl
The life time of the biosensor in continuous operation is 2 hours, whilst the shelf lifetime is
at least 2 weeks without any change in sensitivity (Appendix Figure 2). For the latter study,
biosensors were stored in a desiccator which was stored in a fridge at 4°C. It should be
mentioned that biosensors based on the cofactor NAD+ can be readily stabilised for over six
months using commercially available enzyme stabilisers [20]. The life time of the biosensor
was determined by calibration studies with known additions of glutamate in buffer (pH 7,
35°C). The sensitivity was then determined based on the slope of the subsequent calibration
plots (n = 3).
Chapter Five
150
5.4.5. Optimisation of Temperature and pH
The optimum pH was determined by carrying out calibration studies over the pH range 5 –
9 at a temperature of 25°C. The optimum pH was determined to be pH 7 as biosensors
achieved the greatest sensitivity at this pH. A neutral pH also ensures that further studies
investigating food and serum will not require the pH to be changed to achieve maximum
sensitivity, thereby reducing sample preparation steps. A separate study was carried out to
determine the optimum temperature. The temperature was varied over the range 25 – 40°C
with the pH fixed at 7. The optimum temperature was determined to be 35°C.
5.4.6. Application of the optimum amperometric biosensor (MWCNT–CHIT–
MB/GLDH–NAD–CHIT–MB/MWCNT–CHIT–MB) to the determination of
glutamate in unspiked food.
Many food products are known to contain MSG as a flavour enhancer, therefore, we
decided to apply our new reagentless biosensor to determine glutamate in a known brand of
beef stock cube.
Standard addition was conducted by dissolving one OXO cube (5.9 g mass) in 50ml of PB
and sonicating for 15 minutes until fully dissolved. Five replicate aliquots from this solution
were analysed using fresh reagentless biosensors for each measurement. The determination
was performed by adding an aliquot of PBS (9.95 mL) to the voltammetric cell, establishing
a steady state current, and then injecting a 5µL volume of the OXO cube/PB solution into
the cell. Sequential 3µL injections of 25 mM glutamate were then added to the cell,
standard addition plots were constructed and from these the endogenous glutamate
concentration was determined (n = 5). The mean quantity of glutamate recovered in
unspiked OXO Cubes was 90.6 mg/g, with a CV of 7.52%; results are shown in Table 5-3.
A typical amperogram obtained from the analysis of an OXO cube utilising the reagentless
biosensor is shown in Figure 5-8.
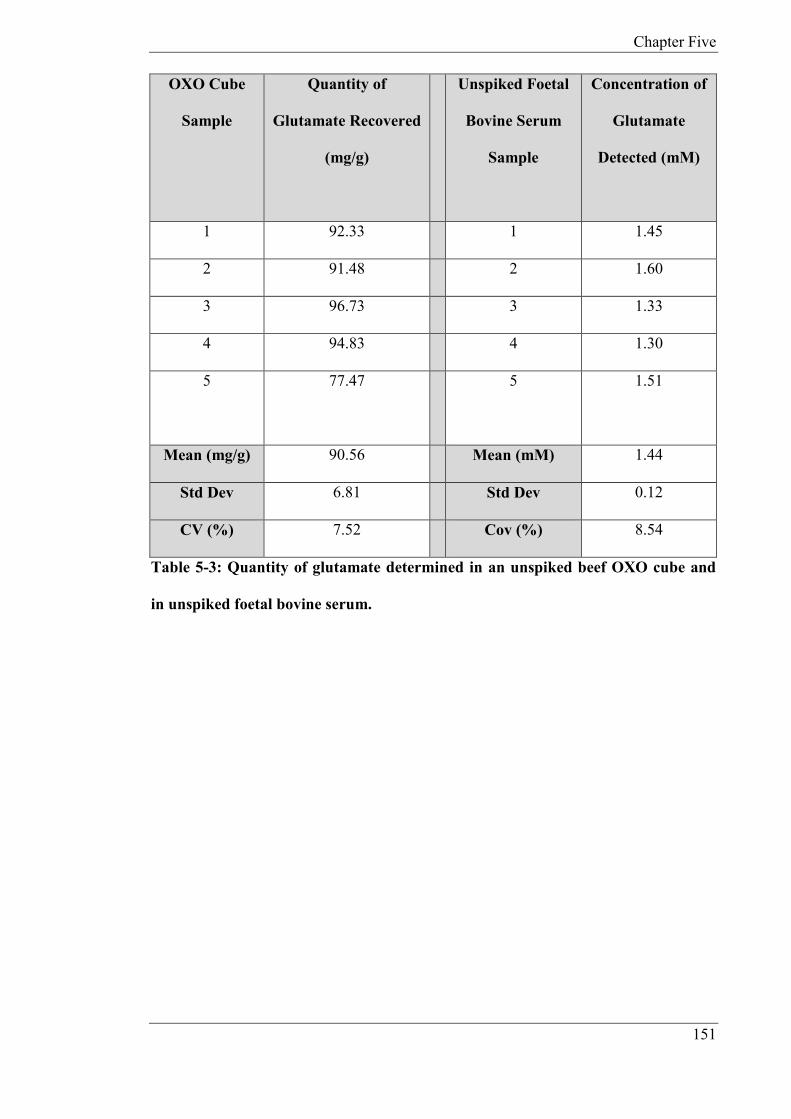
Chapter Five
151
OXO Cube
Sample
Quantity of
Glutamate Recovered
(mg/g)
Unspiked Foetal
Bovine Serum
Sample
Concentration of
Glutamate
Detected (mM)
1 92.33 1 1.45
2 91.48 2 1.60
3 96.73 3 1.33
4 94.83 4 1.30
5 77.47
5 1.51
Mean (mg/g) 90.56 Mean (mM) 1.44
Std Dev 6.81 Std Dev 0.12
CV (%) 7.52 Cov (%) 8.54
Table 5-3: Quantity of glutamate determined in an unspiked beef OXO cube and
in unspiked foetal bovine serum.

Chapter Five
152
Figure 5-8: Amperogram displaying the determination by standard addition of an
unspiked OXO cube, utilising the proposed final biosensor. 75mM, PB (pH 7.0),
with 50mM NaCl at an applied potential of +0.1V vs. Ag/AgCl.
The average percentage of glutamate was calculated relative to the mass of an OXO cube
and was found to be 18.1% (± 1.36%, n = 5). This compares favourably with a previously
published value for MSG content in OXO cubes [1]. The quantity of glutamate recovered
from the stock cube compares favourably with levels calculated with an optical biosensor,
validated with HPLC [21] and utilising high performance thin layer chromatography [22].
The optical biosensor and HPLC analysis determined an L-glutamate level of 18.29% (±
0.66%) and 17.70% (± 0.34%) based on n = 3, whilst the high performance thin layer
chromatography technique determined a level of 133.50 mg/g (± 0.84%, n = 3). These
values compare favourably to the values we have determined utilising the reagentless
biosensor.
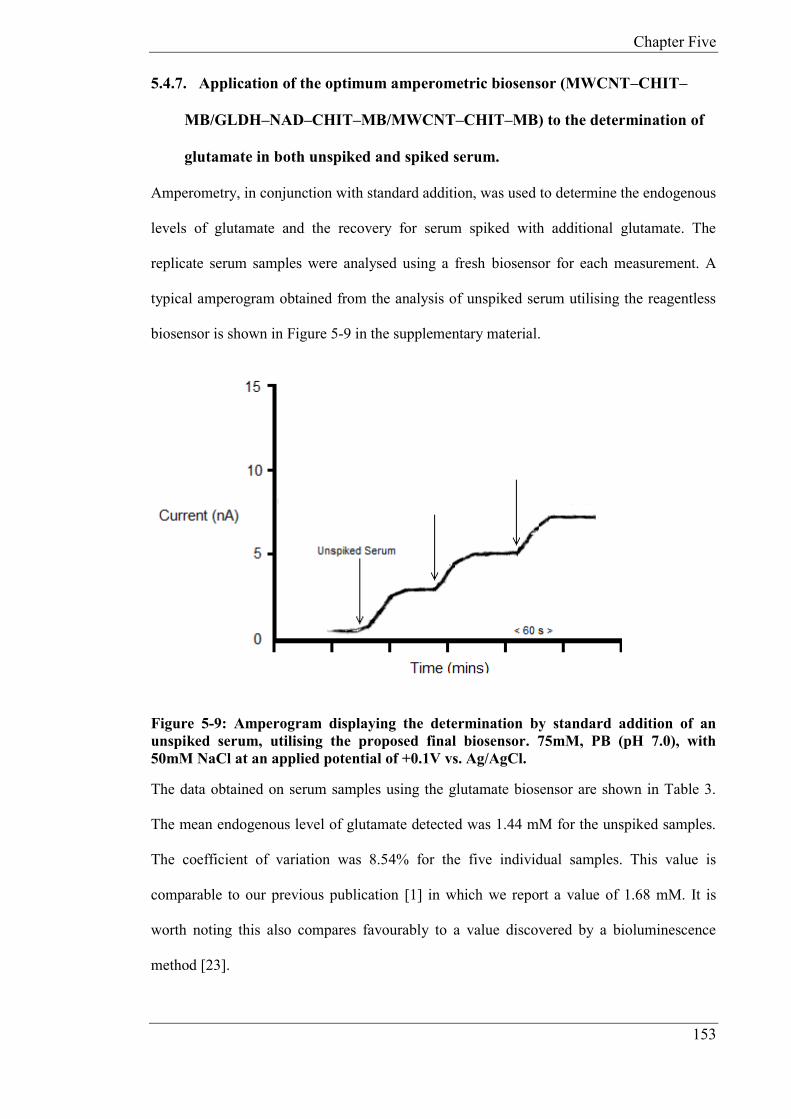
Chapter Five
153
5.4.7. Application of the optimum amperometric biosensor (MWCNT–CHIT–
MB/GLDH–NAD–CHIT–MB/MWCNT–CHIT–MB) to the determination of
glutamate in both unspiked and spiked serum.
Amperometry, in conjunction with standard addition, was used to determine the endogenous
levels of glutamate and the recovery for serum spiked with additional glutamate. The
replicate serum samples were analysed using a fresh biosensor for each measurement. A
typical amperogram obtained from the analysis of unspiked serum utilising the reagentless
biosensor is shown in Figure 5-9 in the supplementary material.
Figure 5-9: Amperogram displaying the determination by standard addition of an
unspiked serum, utilising the proposed final biosensor. 75mM, PB (pH 7.0), with
50mM NaCl at an applied potential of +0.1V vs. Ag/AgCl.
The data obtained on serum samples using the glutamate biosensor are shown in Table 3.
The mean endogenous level of glutamate detected was 1.44 mM for the unspiked samples.
The coefficient of variation was 8.54% for the five individual samples. This value is
comparable to our previous publication [1] in which we report a value of 1.68 mM. It is
worth noting this also compares favourably to a value discovered by a bioluminescence
method [23].

Chapter Five
154
The biosensors were then used to determine glutamate in spiked serum by fortifying with
1.50 mM of glutamate. The results are shown in Table 5-4. The mean recovery (n = 5) was
104% with a CV of 2.91%.
Sample Fortified
Glutamate
(mM)
Endogenous
Concentration
(mM)
Concentration of
Glutamate Detected
(mM)
Recovery
(%)
1 1.50 1.44 2.96 101
2 1.50 1.44 3.01 105
3 1.50 1.44 3.02 105
4 1.50 1.44 2.97 102
5 1.50 1.44 3.07 109
Mean recovery (%) 104
Std Dev 3
Cov (%) 2.91
Table 5-4: Recovery of glutamate detected in spiked serum fortified with
additional glutamate.

Chapter Five
155
5.5. Conclusion
This chapter has described the development of a reagentless amperometric glutamate
biosensor. This was achieved by incorporating the biocomponents using a layer-by-layer
procedure involving chitosan and MWCNTs. The device produced well defined steady state
currents over extended operating times indicating that the bio-components are securely
immobilised onto the base transducer.
The reagentless glutamate biosensor, fabricated in this study, is to date the first of its kind;
our biosensor detection limit compares favourably to those previously reported for non-
reagentless glutamate sensors. The limit of detection of our biosensor is 3 µM, whereas
detection limits of [24]–[33], respectively.
The device and its components have been fully optimised to produce a reproducible
reagentless biosensor which has been applied to the analysis of glutamate in clinical and
food samples. Notably, the samples required no pre-treatment, other than dilution. The
content of glutamate determined in OXO cubes and in serum compares favourably to that
determined with our previous glutamate biosensor [1].
This novel layer-by-layer approach to biosensor fabrication may hold promise as a generic
platform for future biosensors based on dehydrogenase systems.
It should be mentioned that the analysis of neuronal cells for changes in glutamate flux is of
significant biomedical interest. High levels of glutamate leads to excitotoxicity, which is
associated with diseases previously mentioned in the introduction. For potential future
studies and applications, it is of value to consider how our biosensor compares to previously
reported sensors which determine neuronal glutamate.
Previously reported microelectrodes have been used to measure glutamate in vivo in rodent
studies; these were fabricated by coating microelectrodes with glutamate oxidase [34]–[41].
These required high operating potentials (+600 - 700mV vs. Ag/AgCl), as the detection
Chapter Five
156
system involved the measurement of hydrogen peroxide. High operating potentials can lead
to the oxidisation of interferences such as ascorbic acid, which can interfere the
measurement of glutamate. It is worth noting that Oldenziel et al., 2006, utilised a lower
operating potential of +150mV vs. Ag/AgCl, by utilising the electron mediator horseradish
peroxidase; which increased the complexity of biosensor fabrication.
Microelectrodes coated with glutamate dehydrogenase are uncommon; this is likely due to
the requirement of integrating the cofactor NAD+ onto the surface of the microelectrode
without leeching, as mentioned previously. By miniaturizing our reagentless biosensor, the
lower operating potential required to generate an analytical response would prove beneficial
for the analysis of glutamate in real time, in neuronal cells. Our approach would negate the
requirement for additional enzymes or use of charged membranes such as Nafion, to block
out potential interferences. It should be feasible to incorporate the approach described in
this chapter into an implantable system by dip coating a carbon fibre electrode (10µM
diameter) into the formulation described in this chapter.
Chapter Five
157
5.6. References
[1] G. Hughes, R. M. Pemberton, P. R. Fielden, and J. P. Hart, (2014),
“Development of a Disposable Screen Printed Amperometric Biosensor Based on
Glutamate Dehydrogenase, for the Determination of Glutamate in Clinical and
Food Applications,” Anal. Bioanal. Electrochem., 6, 435–449.
[2] J. Wang, (2005), “Carbon-Nanotube Based Electrochemical Biosensors: A
Review,” Electroanalysis, 17, 7–14.
[3] M. Zhang, A. Smith, and W. Gorski, (2004), “Carbon nanotube-chitosan system
for electrochemical sensing based on dehydrogenase enzymes.,” Anal. Chem., 76,
5045–50.
[4] J. M. Nugent, K. S. V. Santhanam, A. Rubio, and P. M. Ajayan, (2001), “Fast
Electron Transfer Kinetics on Multiwalled Carbon Nanotube Microbundle
Electrodes,” Nano Lett., 1, 87–91.
[5] L. Zhu, J. Zhai, R. Yang, C. Tian, and L. Guo, (2007), “Electrocatalytic oxidation
of NADH with Meldola’s blue functionalized carbon nanotubes electrodes.”
[6] M. Boujtita, J. P. Hart, and R. Pittson, (2000), “Development of a disposable
ethanol biosensor based on a chemically modified screen-printed electrode coated
with alcohol oxidase for the analysis of beer.,” Biosens. Bioelectron., 15, 257–63.
[7] A. C. Pereira, M. R. Aguiar, A. Kisner, D. V. Macedo, and L. T. Kubota, (2007),
“Amperometric biosensor for lactate based on lactate dehydrogenase and
Meldola Blue coimmobilized on multi-wall carbon-nanotube,” Sensors Actuators
B Chem., 124, 269–276.
[8] S. D. Sprules, J. P. Hart, S. A. Wring, and R. Pittson, (1994), “Development of a
disposable amperometric sensor for reduced nicotinamide adenine dinucleotide
based on a chemically modified screen-printed carbon electrode,” Analyst, 119,
253.
Chapter Five
158
[9] L. Qian and X. Yang, (2006), “Composite film of carbon nanotubes and chitosan
for preparation of amperometric hydrogen peroxide biosensor.,” Talanta, 68,
721–7.
[10] H. J. Malmiri, M. Ali, G. Jahanian, and A. Berenjian, (2012), “Potential
Applications of Chitosan Nanoparticles As Novel Support in Enzyme
Immobilization,” Am. J. Biochem. Biotechnol., 8, 203–219.
[11] O. V. Kharissova, B. I. Kharisov, and E. G. de Casas Ortiz, (2013), “Dispersion
of carbon nanotubes in water and non-aqueous solvents,” RSC Adv., 3, 24812.
[12] M. Zhang, C. Mullens, and W. Gorski, (2007), “Coimmobilization of
Dehydrogenases and Their Cofactors in Electrochemical Biosensors,” Anal.
Chem., 79, 2446–2450.
[13] B.-Y. Wu, S.-H. Hou, F. Yin, J. Li, Z.-X. Zhao, J.-D. Huang, and Q. Chen,
(2007), “Amperometric glucose biosensor based on layer-by-layer assembly of
multilayer films composed of chitosan, gold nanoparticles and glucose oxidase
modified Pt electrode.,” Biosens. Bioelectron., 22, 838–44.
[14] H. Zhao and H. Ju, (2006), “Multilayer membranes for glucose biosensing via
layer-by-layer assembly of multiwall carbon nanotubes and glucose oxidase.,”
Anal. Biochem., 350, 138–44.
[15] X. Zhou, F. Xi, Y. Zhang, and X. Lin, (2011), “Reagentless biosensor based on
layer-by-layer assembly of functional multiwall carbon nanotubes and enzyme-
mediator biocomposite,” J. Zhejiang Univ. Sci. B, 12, 468–476.
[16] K. Ariga, J. P. Hill, and Q. Ji, (2007), “Layer-by-layer assembly as a versatile
bottom-up nanofabrication technique for exploratory research and realistic
application.,” Phys. Chem. Chem. Phys., 9, 2319–40.
[17] E. J. Cho, J.-W. Lee, M. Rajdendran, and A. D. Ellington, Optical Biosensors:
Today and Tomorrow. Elsevier, (2011).
Chapter Five
159
[18] R. C. Alkire, D. M. Kolb, and J. Lipkowski, Eds., Advances in Electrochemical
Science and Engineering. Weinheim, Germany: Wiley-VCH Verlag GmbH &
Co. KGaA, (2011).
[19] Y.-T. Shieh, H.-M. Wu, Y.-K. Twu, and Y.-C. Chung, (2009), “An investigation
on dispersion of carbon nanotubes in chitosan aqueous solutions,” Colloid Polym.
Sci., 288, 377–385.
[20] M. Piano, S. Serban, N. Biddle, R. Pittson, G. A. Drago, and J. P. Hart, (2010),
“A flow injection system, comprising a biosensor based on a screen-printed
carbon electrode containing Meldola’s Blue-Reinecke salt coated with glucose
dehydrogenase, for the measurement of glucose.,” Anal. Biochem., 396, 269–74.
[21] N. Z. Md Muslim, M. Ahmad, L. Y. Heng, and B. Saad, (2012), “Optical
biosensor test strip for the screening and direct determination of l-glutamate in
food samples,” Sensors Actuators B Chem., 161, 493–497.
[22] V. N. Krishna, D. Karthika, D. M. Surya, M. Rubini, M. Vishalini, and Y.
Pradeepa, (2010), “Analysis of Monosodium l-Glutamate in Food Products by
High-Performance Thin Layer Chromatography.,” J. Young Pharm., 2, 297–300.
[23] Z. C. Ye and H. Sontheimer, (1998), “Astrocytes protect neurons from
neurotoxic injury by serum glutamate.,” Glia, 22, 237–48.
[24] F. Mizutani, Y. Sato, Y. Hirata, and S. Yabuki, (1998), “High-throughput flow-
injection analysis of glucose and glutamate in food and biological samples by
using enzyme/polyion complex-bilayer membrane-based electrodes as the
detectors,” Biosens. Bioelectron., 13, 809–815.
[25] N. Pasco, C. Jeffries, Q. Davies, A. J. Downard, A. D. Roddick-Lanzilotta, and
L. Gorton, (1999), “Characterisation of a thermophilic L-glutamate
dehydrogenase biosensor for amperometric determination of L-glutamate by flow
injection analysis,” Biosens. Bioelectron., 14, 171–178.
[26] R. J. Cosford and W. G. Kuhr, (1996), “Capillary biosensor for glutamate.,”
Anal. Chem., 68, 2164–2169.
Chapter Five
160
[27] W. Laiwattanapaisal and J. Yakovleva, (2009), “On-chip microfluidic systems
for determination of L-glutamate based on enzymatic recycling of substrate,”
Biomicrofluidics, 3, 14104.
[28] O. M. Schuvailo, S. Gáspár, A. P. Soldatkin, and E. Csöregi, (2007),
“Ultramicrobiosensor for the Selective Detection of Glutamate,” Electroanalysis,
19, 71–78.
[29] B.-C. Ye, Q.-S. Li, Y.-R. Li, X.-B. Li, and J.-T. Yu, (1995), “l-Glutamate
biosensor using a novel l-glutamate oxidase and its application to flow injection
analysis system,” J. Biotechnol., 42, 45–52.
[30] T. Tsukatani and K. Matsumoto, (2005), “Sequential fluorometric quantification
of γ-aminobutyrate and l-glutamate using a single line flow-injection system with
immobilized-enzyme reactors,” Anal. Chim. Acta, 546, 154–160.
[31] S. L. Alvarez-Crespo, M. J. Lobo-Castañón, A. J. Miranda-Ordieres, and P.
Tuñón-Blanco, (1997), “Amperometric glutamate biosensor based on poly(o-
phenylenediamine) film electrogenerated onto modified carbon paste electrodes,”
Biosens. Bioelectron., 12, 739–747.
[32] R. Monošík, M. Streďanský, and E. Šturdík, (2013), “A Biosensor Utilizing l-
Glutamate Dehydrogenase and Diaphorase Immobilized on Nanocomposite
Electrode for Determination of l-Glutamate in Food Samples,” Food Anal.
Methods, 6, 521–527.
[33] R. Doaga, T. McCormac, and E. Dempsey, (2009), “Electrochemical Sensing of
NADH and Glutamate Based on Meldola Blue in 1,2-Diaminobenzene and 3,4-
Ethylenedioxythiophene Polymer Films,” Electroanalysis, 21, 2099–2108.
[34] J. J. Burmeister and G. A. Gerhardt, (2003), “Ceramic-based multisite
microelectrode arrays for in vivo electrochemical recordings of glutamate and
other neurochemicals,” TrAC Trends Anal. Chem., 22, 498–502.
[35] O. Frey, T. Holtzman, R. M. McNamara, D. E. H. Theobald, P. D. van der Wal,
N. F. de Rooij, J. W. Dalley, and M. Koudelka-Hep, (2010), “Enzyme-based
Chapter Five
161
choline and L-glutamate biosensor electrodes on silicon microprobe arrays.,”
Biosens. Bioelectron., 26, 477–84.
[36] E. S. McLamore, S. Mohanty, J. Shi, J. Claussen, S. S. Jedlicka, J. L. Rickus, and
D. M. Porterfield, (2010), “A self-referencing glutamate biosensor for measuring
real time neuronal glutamate flux.,” J. Neurosci. Methods, 189, 14–22.
[37] W. H. Oldenziel, G. Dijkstra, T. I. F. H. Cremers, and B. H. C. Westerink,
(2006), “In vivo monitoring of extracellular glutamate in the brain with a
microsensor.,” Brain Res., 1118, 34–42.
[38] S. Qin, M. van der Zeyden, W. H. Oldenziel, T. I. F. H. Cremers, and B. H. C.
Westerink, (2008), “Microsensors for in vivo Measurement of Glutamate in
Brain Tissue,” Sensors, 8, 6860–6884.
[39] K. M. Wassum, V. M. Tolosa, J. Wang, E. Walker, H. G. Monbouquette, and N.
T. Maidment, (2008), “Silicon Wafer-Based Platinum Microelectrode Array
Biosensor for Near Real-Time Measurement of Glutamate in Vivo,” Sensors, 8,
5023–5036.
[40] Y. Hu, K. M. Mitchell, F. N. Albahadily, E. K. Michaelis, and G. S. Wilson,
(1994), “Direct measurement of glutamate release in the brain using a dual
enzyme-based electrochemical sensor,” Brain Res., 659, 117–125.
[41] F. Tian, A. V Gourine, R. T. R. Huckstepp, and N. Dale, (2009), “A
microelectrode biosensor for real time monitoring of L-glutamate release.,” Anal.
Chim. Acta, 645, 86–91.

Chapter Six
162
CHAPTER SIX
Conclusions and Future Studies
Chapter Six
163
6. Conclusions
6.1. Fabrication of a Non-Reagentless Glutamate Biosensor
As described in Chapter 3, the non-reagentless glutamate biosensor based on MB-SPCE
was successfully fabricated by drop coating the biopolymer CHIT, followed by GLDH,
onto the surface of the working electrode. The utilisation of the electrocatalyst MB
transducer, present within the ink, greatly reduced the potential required to
electrocatalytically oxidize the NADH, in comparison to a plain carbon screen printed
electrode. As a result, a low applied potential of only +100mV (vs. Ag/AgCl) resulted in the
maximum response; this potential was ascertained using hydrodynamic voltammetry in the
presence of NADH and was subsequently used for all amperometric studies. The low
applied potential and the presence of CHIT on the WE, reduced the likelihood of
interferences directly oxidising at the electrode surface resulting in unwanted current
responses. The use of dummy biosensors fabricated using BSA measured any response
generated by interfering compounds present in OXO cubes and serum such as ascorbic acid.
The biopolymer CHIT was used to successfully immobilize GLDH onto the surface of the
transducer, without denaturing the enzyme and successfully retaining the enzyme within the
biosensor matrix without leeching into free solution. This ensured that during amperometric
studies, steady state currents were achieved.
The operating conditions such as the temperature and pH were optimised. The optimal
conditions were 35ºC and pH 7 respectively. These conditions also ensured that a minimal
amount of sample preparation was required to analyse both serum and food.
The amperometric biosensor was successfully applied to the determination of endogenous
concentrations of glutamate present in both OXO cube and serum solutions. Sample
preparations consisted of simply diluting the serum in phosphate buffer, whilst the OXO
cube was dissolved in 50mLs of phosphate buffer and further diluted. Subsequent recovery

Chapter Six
164
studies yielded high recoveries with low coefficients of variation, indicating that the
biosensor fabrication technique was rapid, convenient and resulted in highly reproducible
and simple to fabricate.
In relation to the objectives stated in Chapter 1, Section 1.8, we have successfully
completed the following objectives in this section;
Development of a glutamate biosensor utilising glutamate dehydrogenase, NAD+
based on Meldola’s Blue screen printed carbon electrodes.
Immobilisation of the enzyme glutamate dehydrogenase to the surface of the
working electrode the MB-SPCE to produce glutamate biosensors.
Optimisation of the biosensor working conditions and the determination of the
glutamate content of food and clinical samples utilising standard addition.
The limitation of the biosensor is the requirement of the cofactor to be present in free
solution, however, immobilization of the cofactor was a novel aspect of later studies and is
demonstrated within Chapters 4 and 5. In comparison to previously reported glutamate
biosensors, the LOD compares favourably to other glutamate dehydrogenase biosensors and
possesses a superior response time of 2s.

Chapter Six
165
6.2. Fabrication of a Reagentless Microband Glutamate Biosensor
The biosensor described in Chapter 3 was further developed in order to fully integrate the
cofactor NAD+ onto the surface of the electrode in order to produce a reagentless device.
The main advantage of a reagentless device is that this simplifies the fabrication process
and utilisation of the device as all components of are immobilized on the surface.
Reagentless devices are also of commercial interest. In the real time analysis of cells, in
response to toxic effect, this is vital as additional cofactors added into free solution may
disrupt the cells or reduce sterility.
The fabrication process was relatively simple and similar to that described in Chapter 3. The
enzyme and co-factor were immobilised onto the surface of the MB-SPCE by drop-coating
a mixture of GLDH-NAD+-CHIT. Once dried the working electrode was covered with
insulating tape and cut through laterally in order to define the microband edge. It is likely
that the presence of the insulating tape and the absence of stirring the solution ensured that
the biosensor components were retained on the surface of the electrode. The biosensor
demonstrated a longer linear range and increased sensitivity in cell media compared with a
phosphate buffer. This is likely due to enzyme promoters present in the cell media solution
that may be enhancing the enzyme activity.
The biosensor was first successfully applied to toxicity testing using an end-point assay;
whereby standard addition was used to quantify glutamate in cell media which had been in
the presence of HepG2 cells exposed to various concentrations of paracetamol. Secondly, it
was successfully applied to real time studies, whereby the glutamate released from cells was
monitored over 8 hours. The results for both methods suggested that with increasing
concentrations of paracetamol, increased concentrations of glutamate were released by
cells, suggesting greater levels of toxicity.

Chapter Six
166
In relation to the objectives stated in Chapter 1, Section 1.8, we have successfully
completed the following objectives in this section;
Further development of the biosensor to immobilize the cofactor NAD+ onto the
surface of the screen-printed carbon electrode.
The miniaturisation of the biosensor in order to develop micro-band biosensors for
the determination of glutamate released by HepG2 cells in response to toxic
challenge.
Development of an electrode holder to simultaneously immerse the biosensor within
the cell media solution for the interrogation of the cells, whilst reducing evaporation
and allowing for gas exchange between the cell media and atmosphere.
6.3. Fabrication of a Reagentless Macro Glutamate Biosensor utilising Carbon
Nanotubes
In order to fabricate a conventional (macro) sized reagentless biosensors, the enzyme and
cofactor must be fully immobilized to the surface of the biosensor, without leeching into
free solution. This was achieved by utilising a mixture of multi-walled carbon nanotubes
and chitosan, drop coated in a layer-by-layer procedure. The presence of additional water-
based Meldola’s Blue throughout the reaction layer resulted in an increase in sensitivity,
which coupled with the MWCNT’s, is considered to increase the electron shuttling rate
from the outer layers of the biosensor, to the working electrode.
Although the layer-by-layer procedure is a little more complex, than that described earlier,
the resulting biosensor produces steady state currents, over prolonged analysis times,
indicating that all bio-components are strongly retained on the transducer surface.
Consequently, this novel approach could be adapted to the fabrication of biosensors for the
measurement of many different analytes.

Chapter Six
167
The shelf life time of the proposed biosensor was at least 2 weeks without any change in
sensitivity. This could be improved by utilising commercially available enzyme stabilisers.
In relation to the objectives stated in Chapter 1, Section 1.8, we have successfully
completed the following objectives in this section;
Development of a conventional sized reagentless glutamate biosensor.
Optimisation of the biosensor components and working conditions, in order to apply
the reagentless biosensor to the determination of glutamate in complex samples.
6.4. Overall conclusions
Enzyme-based biosensors for the determination of glutamate have been developed utilising
three different fabrication techniques and for two different electrode dimensions. Non-
reagentless and reagentless devices have also been developed. It has been shown that the
biosensors in an amperometric assay, can be applied to the determination of glutamate in
serum and food samples. Recovery studies were also carried out it was demonstrated that
with high recovery values and low coefficients of variation could be obtained.
A biosensor was successfully applied to toxicity testing by incorporating the device into
wells containing live HepG2 cells for continuous measurements. The same biosensor could
also be used for toxicity testing using an end-point assay.
Chapter Six
168
6.5. Future Studies
In order to increase the operating time for continuous monitoring of the glutamate released
by cells, several modifications to the fabrication method could be investigated. The sterility
of the biosensors and the culture medium containing cells could be improved. The biosensor
could be sterilised by gamma radiation, without significantly affecting the enzyme, cofactor
and the electrode material. Autoclaving is also possible but could result in the denaturing of
the enzyme, cofactor and possibly damage the electrode material. The electrode holder, in
addition to being cleaned by ethanol, could also be exposed to gamma radiation. By
sterilising these components, this would increase the duration over which the real time
studies can take place in the absence of bacterial or fungal infection. The microband
biosensor could be further developed and integrated into a biosensor array for multiple
analyte monitoring in real time. Multiple human cells lines could also be utilised in a multi-
well format order to replicate in vivo responses in vitro. Additional applications include
environmental toxicity monitoring and food safety.

Appendices
169
Appendices

Appendices
170
Appendix Figure 1) Five typical standard addition calibration plots obtained with five
individual MWCNT-CHIT-GLDH-NAD+-MB-SPCE.
Appendix Figure 2) MWCNT-CHIT-GLDH-NAD+-MB-SPCE biosensor stability
study.
y = 0.4314x - 0.1495 R² = 0.9972
0
5
10
15
20
25
30
35
40
45
50
0 15 30 45 60 75 90 105
Cu
rren
t (n
A)
[Glutamate] µM
y = 0.3981x - 0.4374 R² = 0.9973
0
5
10
15
20
25
30
35
40
45
0 50 100
Cu
rren
t (n
A)
[Glutamate] µM
y = 0.3676x - 0.2055 R² = 0.9974
0
5
10
15
20
25
30
35
40
0 50 100
Cu
rren
t (n
A)
[Glutamate] µM
y = 0.4002x - 0.2385 R² = 0.9955
0
5
10
15
20
25
30
35
40
45
0 15 30 45 60 75 90 105
Cu
rren
t (n
A)
[Glutamate] µM
y = 0.37x + 0.1538 R² = 0.9925
0
5
10
15
20
25
30
35
40
0 15 30 45 60 75 90 105C
urr
en
t (n
A)
[Glutamate] µM
0
0.05
0.1
0.15
0.2
0.25
0.3
0.35
0.4
0 1 2 3 4
Sen
siti
vit
y (
nA
/µA
)
Time (Weeks)
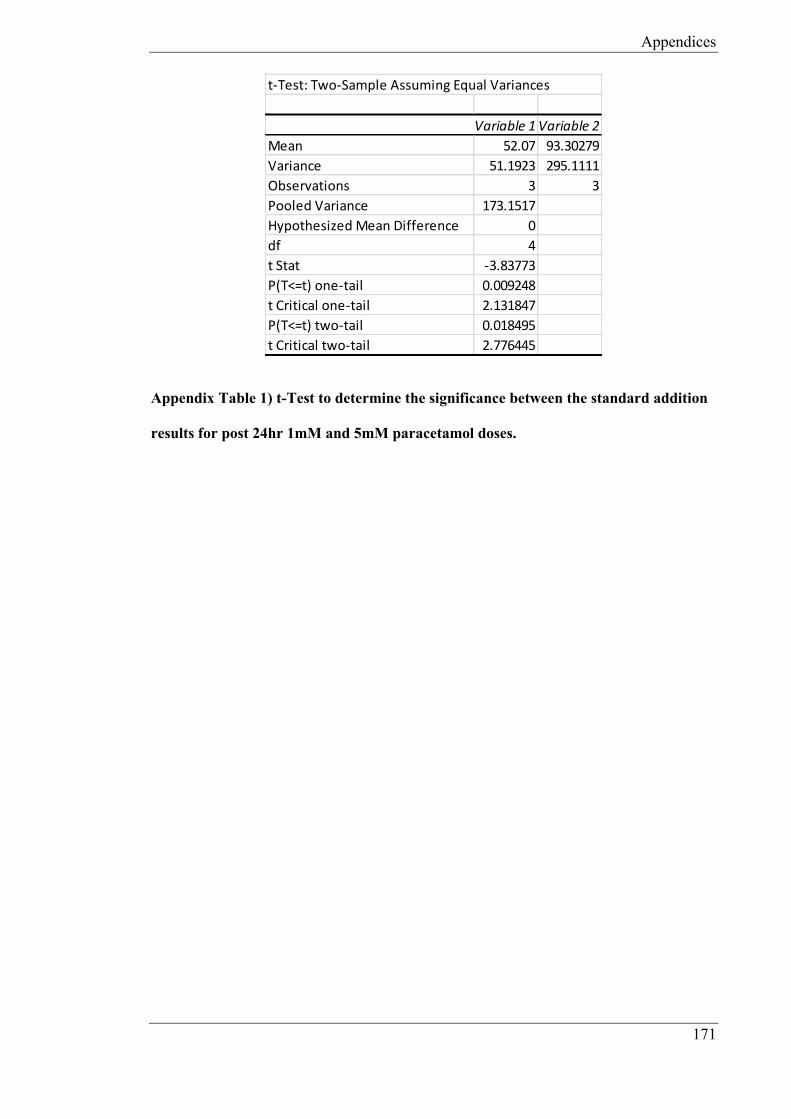
Appendices
171
Appendix Table 1) t-Test to determine the significance between the standard addition
results for post 24hr 1mM and 5mM paracetamol doses.
t-Test: Two-Sample Assuming Equal Variances
Variable 1 Variable 2
Mean 52.07 93.30279
Variance 51.1923 295.1111
Observations 3 3
Pooled Variance 173.1517
Hypothesized Mean Difference 0
df 4
t Stat -3.83773
P(T<=t) one-tail 0.009248
t Critical one-tail 2.131847
P(T<=t) two-tail 0.018495
t Critical two-tail 2.776445
Top Related
Copyright © 2022 FDOKUMEN

