


Bahasa
Halaman
Hukum

THE DAIRY INDUSTRY IN KENYA: THE POST-LIBERALIZATION AGENDA�
By
Andrew M. Karanja
2003
Support for this study was provided under Tegemeo Agricultural Monitoring and Policy Analysis (TAMPA II) Project, by the United States Agency for International Development (USAID) , Nairobi. The Author thank Wilson Nguyo, Gem Argwings-Kodhek, Mutuku Kavoi and Francis Karin for their assistance in this study.
At the time of the study Andrew M. Karanja was a Research Fellow at Tegemeo Institute/ Egerton University.
♣ Paper presented at a dairy industry stakeholders workshop held in Nairobi, Kenya (27th August 2002)

The Dairy Industry in Kenya: The Post Liberalization Agenda
Working Paper No.1, 2003 ii
Table of Contents
LIST OF TABLES....................................................................................................................................IV
LIST OF FIGURES..................................................................................................................................IV
ACRONYMS AND ABBREVIATIONS.................................................................................................. V
1.0 SUMMARY.........................................................................................................................................VI
2.0 INTRODUCTION ................................................................................................................................ 1
3.0 CONCEPTUAL FRAMEWORK AND METHODOLOGY............................................................ 2
3.1 Conceptual framework .............................................................................................................. 2
3.2 Methodology.............................................................................................................................. 4
3.3 Data............................................................................................................................................ 4
4.0 DAIRY PRODUCTION....................................................................................................................... 5
4.1 National milk production and demand ...................................................................................... 5
4.2 Production Systems and their Output ........................................................................................ 6
4.3 Cost and competitiveness of milk production ......................................................................... 10
5.0 PROVISION OF DAIRY CATTLE GENETICS............................................................................ 12
6.0 MILK COLLECTION, PROCESSING AND MARKETING ....................................................... 17
6.1 Milk collection and rural markets............................................................................................ 17
6.2 Raw Milk Transport................................................................................................................. 19
6.3 Urban milk markets ................................................................................................................. 22
7.0 DAIRY PRODUCTS EXPORTS AND IMPORTS ......................................................................... 36
The Dairy Industry in Kenya: The Post Liberalization Agenda
Working Paper No.1, 2003 iii
8.0 INTERNATIONAL TRENDS IN DAIRY INDUSTRY AND LESSONS FOR KENYA ............ 39
8.1 Production and trade............................................................................................................... 39
8.2 Formulation of a Dairy Export Strategy ................................................................................. 41
9.0 INSTITUTIONAL AND REGULATORY ENVIRONMENT ....................................................... 44
10. CONCLUSIONS AND POLICY IMPLICATIONS........................................................................ 45
10.1 Conclusions ........................................................................................................................... 45
10.2 Policy Implications ................................................................................................................ 45
REFERENCES ......................................................................................................................................... 48
APPENDICES........................................................................................................................................... 50

The Dairy Industry in Kenya: The Post Liberalization Agenda
Working Paper No.1, 2003 iv
LIST OF TABLES
Table 1: Average farm production characteristics....................................................................................... 8
Table 2: Proportion of milk sold in various AEZs in Kenya. ....................................................................... 9
Table 3: Summary of cost of milk production............................................................................................ 11
Table 4: Use of AI and natural service across various regions, 2002......................................................... 13
Table 5: Rural milk marketing channels and prices ................................................................................... 17
Table 6: Co-operatives milk collection and sales ....................................................................................... 19
Table 7: Private transporters operating costs and profit ............................................................................. 21
Table 8: Types and number of licensed milk traders.................................................................................. 23
Table 9: Characteristics of milk bars in Nairobi and other upcountry towns ............................................. 25
Table 10: Range of dairy products and their pricing in Supermarkets ....................................................... 34
Table 11: Volume and value of dairy products exports and imports.......................................................... 36
Table 12: Type, quantities and value of dairy products imported into Kenya, 2001/02............................. 37
Table 13: Import parity price for milk powder, 2002 ................................................................................. 38
Table 14: Global milk production 1999-2001 ............................................................................................ 39
Table 15: Estimated milk producer prices among producer countries, 1999/2000 season......................... 41
Table 16: Structure of dairy processing in selected countries .................................................................... 42
LIST OF FIGURES
Figure 1: National milk production trends and projections ......................................................................... 6
Figure 2: Milk production costs and producer prices, Kenya, New Zealand and Australia, 2000/01 ........ 12
Figure 3: Distribution farm gate cost per dose of imported semen............................................................. 15
Figure 4: Conventional growth model for dairy informal sector................................................................ 27
Figure 5: Volume of processed milk in Kenya, 1986-2001........................................................................ 29
Figure 6: Concentration ratios for milk processing market, 2001 .............................................................. 30
Figure 7: Real producer and consumer milk prices, 1985-2001................................................................. 32
Figure 8: Producer share of packaged milk consumer price....................................................................... 33
Figure 9: Distribution of processed milk margins (% of consumer Price) ................................................. 35
The Dairy Industry in Kenya: The Post Liberalization Agenda
Working Paper No.1, 2003 v
Acronyms and Abbreviations
A.I Artificial Insemination
KCC Kenya Co-operative Creameries
NIE New Institutional Economics
SCP Structure Conduct and Performance
MoARD Ministry of Agriculture and Rural Development
CBS Central Bureau of Statistics
KRA Kenya Revenue Authority
KDB Kenya Dairy Board
ILRI International Livestock Research Institute
KARI Kenya Agricultural Research Institute
GDP Gross Domestic Product
KEBS Kenya Bureau of Standards
AEZ Agro Ecological Zone
CAIS Central Artificial Insemination Station
KNAIS Kenya National Artificial Insemination Service
COMESA Common Market for Eastern and Southern Africa
EU European Union
ABS American Breeders Society
GoK Government of Kenya
BF Butter Fat
DWMP Dried Whole Milk Powder
DSMP Dried Skimmed Milk Powder
FAO Food and Agriculture Organisation
NCPB National Cereals and Produce Board
DRC Democratic Republic of Congo
CAP Common Agricultural Policy
NZ New Zealand
The Dairy Industry in Kenya: The Post Liberalization Agenda
Working Paper No.1, 2003 vi
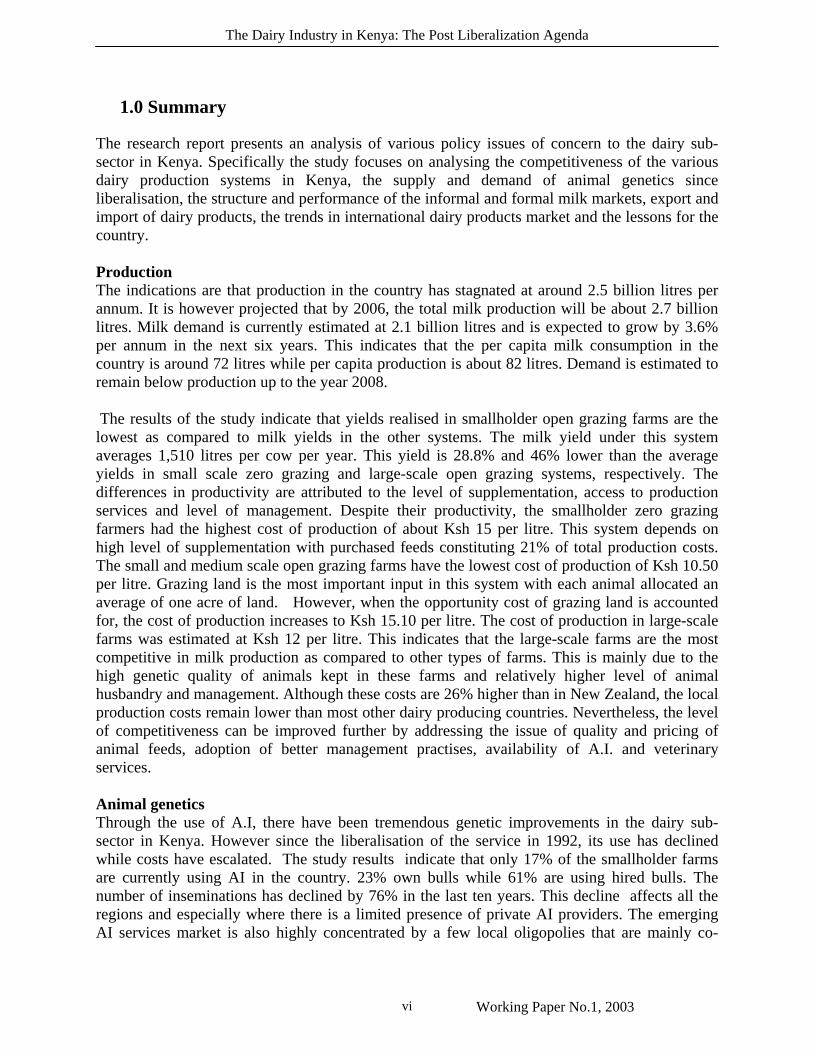
1.0 Summary
The research report presents an analysis of various policy issues of concern to the dairy sub-sector in Kenya. Specifically the study focuses on analysing the competitiveness of the various dairy production systems in Kenya, the supply and demand of animal genetics since liberalisation, the structure and performance of the informal and formal milk markets, export and import of dairy products, the trends in international dairy products market and the lessons for the country. Production The indications are that production in the country has stagnated at around 2.5 billion litres per annum. It is however projected that by 2006, the total milk production will be about 2.7 billion litres. Milk demand is currently estimated at 2.1 billion litres and is expected to grow by 3.6% per annum in the next six years. This indicates that the per capita milk consumption in the country is around 72 litres while per capita production is about 82 litres. Demand is estimated to remain below production up to the year 2008. The results of the study indicate that yields realised in smallholder open grazing farms are the lowest as compared to milk yields in the other systems. The milk yield under this system averages 1,510 litres per cow per year. This yield is 28.8% and 46% lower than the average yields in small scale zero grazing and large-scale open grazing systems, respectively. The differences in productivity are attributed to the level of supplementation, access to production services and level of management. Despite their productivity, the smallholder zero grazing farmers had the highest cost of production of about Ksh 15 per litre. This system depends on high level of supplementation with purchased feeds constituting 21% of total production costs. The small and medium scale open grazing farms have the lowest cost of production of Ksh 10.50 per litre. Grazing land is the most important input in this system with each animal allocated an average of one acre of land. However, when the opportunity cost of grazing land is accounted for, the cost of production increases to Ksh 15.10 per litre. The cost of production in large-scale farms was estimated at Ksh 12 per litre. This indicates that the large-scale farms are the most competitive in milk production as compared to other types of farms. This is mainly due to the high genetic quality of animals kept in these farms and relatively higher level of animal husbandry and management. Although these costs are 26% higher than in New Zealand, the local production costs remain lower than most other dairy producing countries. Nevertheless, the level of competitiveness can be improved further by addressing the issue of quality and pricing of animal feeds, adoption of better management practises, availability of A.I. and veterinary services. Animal genetics Through the use of A.I, there have been tremendous genetic improvements in the dairy sub-sector in Kenya. However since the liberalisation of the service in 1992, its use has declined while costs have escalated. The study results indicate that only 17% of the smallholder farms are currently using AI in the country. 23% own bulls while 61% are using hired bulls. The number of inseminations has declined by 76% in the last ten years. This decline affects all the regions and especially where there is a limited presence of private AI providers. The emerging AI services market is also highly concentrated by a few local oligopolies that are mainly co-
The Dairy Industry in Kenya: The Post Liberalization Agenda
Working Paper No.1, 2003 vii
operatives or socio-organisations. The market is characterised by thin markets, which are not conducive to private sector investments. This has led to social exclusion of some areas from receiving the service. The cost of insemination using local semen average Ksh 600 while that of imported semen averages Ksh 1200. The imported semen is estimated to have a market share of 22%. The need for better co-ordination, restructuring of CAIS, greater involvement of breeders’ societies and KDB are identified. Furthermore the need to promote and assist farmer organisations to reduce the social exclusion is identified. Milk marketing Informal milk outlets are shown to absorb most of the milk from smallholder farmers accounting for over 80% of the total milk sold. Brokers, traders/hawkers, transporters, co-operatives and farmer groups are identified as the most important participants at the rural markets. The farm-gate milk prices in informal markets are 22% higher than in the formal marketing channel. Co-operatives remain the main channel for collecting milk destined to the formal market. Analyses of marketing margins indicate that players in informal market have lower marketing margins as compared to the formal channel. As such, the informal channel out-competes the formal channel by charging prices that are 48% lower per litre of milk. Furthermore the players in informal markets have devised various methods of assessing milk quality and for screening suppliers. The throughput of processed milk has continued to decline to the extent that by 2001, only 152 million litres was processed. This represents a decline of over 58% as compared to the amount processed in 1993. Equally, only 22% of the installed milk processing capacity is currently being utilised. Furthermore as more firms exit from the market, the milk processing industry is becoming more concentrated with the largest four firms having a market share of 80% in 2001. Despite these structural changes, the real consumer prices have continued to increase while producer prices and their share of consumer prices has declined. Estimates also indicate that milk-processing costs are escalating and by 2002 they accounted for about 57% of the price paid per litre by consumers. The cost of packaging material remains one of the major concerns. Import and export of dairy products Analysis of dairy product imports and exports over the last ten years gives the indication that the country has become a net importer. Even after taking into account the drought conditions in 1999 and 2000, the exports remain lower than early 1990s. This means that the country has lost a sizeable export market for dairy products thereby further shrinking the outlets for Kenyan dairy products. The volume and value of dry milk powder imports has at the same time increased four folds. This is mainly attributed to the drought in 1999/00 and the non-availability of locally manufactured milk powder due to the problems facing KCC. Despite these recent increases in imports, the volumes imported in 2001 and 2002 still account for a small percentage of the national production and total milk processed. Furthermore, with the current level of suspended duty, milk powder imports for reconstitution into milk are unprofitable with the estimated parity price per litre of milk of Ksh 66. The study identifies the need for formulating an appropriate milk powder trade policy to cater for both operational and strategic stocks. Dairy export strategy Kenya is shown to have the potential to export dairy products having the largest and well-developed dairy herd in Sub-Saharan Africa. Indeed, Kenya and Sudan are the largest Sub-
The Dairy Industry in Kenya: The Post Liberalization Agenda
Working Paper No.1, 2003 viii
Saharan Africa dairy producers accounting for 47% of the total cow milk produced, with Kenya having a market share of 24 percent. However, the study shows that the propensity and capacity for export has declined in the recent past. Although the country can produce milk competitively, this advantage is lost due to inefficiencies in milk collection, marketing and processing. In line with global trends in milk producing countries, the country should promote policies that enhance the use of economies of scale and size while streamlining the delivery of inputs and services to farmers. Policy issues and the way forward The study identifies a number of policy and institutional issues that need to be addressed by various stakeholders in the dairy industry in charting the way forward. Some of these issues include:
1. Measures to enhance productivity and competitiveness of dairy production. These include supply of the genetic input, costs and quality of animal feeds and adoption of better management practices.
2. Institutional framework to safeguard and improve the hygienic standards of raw milk while charting a suitable development path for the informal milk market.
3. The emerging structure of dairy processing industry and its implication on efficiency, marketing costs, consumer prices and international trade.
4. Policies and measures to reduce the cost of processed milk. 5. Creation of domestic capacity to produce milk powder both for operational and
strategic stocks and the financing of these stocks. 6. Formulation of a dairy export strategy to expand milk markets. 7. Reforms of the KDB to play a more developmental role.
The Dairy Industry in Kenya: The Post Liberalization Agenda
Working Paper No.1, 2003 1
2.0 INTRODUCTION Dairy production is a major activity in the livestock sector and an important source of livelihood for about 600,000 small-scale farmers. Apart from milk, dairy animals also provide manure, other marketed products such as calves and cullings as well as other intangible benefits such as insurance and status symbol. In 1995, the value of dairy production was estimated at Ksh 23.1 billion equivalent to 14% of total value of agricultural production (Kodhek, 1999). In 2000 milk production was estimated at 2.3 billion litres of which 63% was marketed, 30% was consumed at home and the rest 7% fed to calves (Republic of Kenya, 2002). The value of this production is estimated at Ksh 35.2 billion equivalent to 25% of gross agricultural output recorded in 20001. Despite this significant contribution to the national economy and households incomes, the dairy industry is besieged by a number of technical, economic and institutional problems, which seems to have escalated in the recent past. Although smallholder dairy production contribute over 56% and 70% of total and marketed milk production, respectively Omore et al, 1999), the productivity per animal in these farms remains low. Erratic payments, low farm gate prices and low sales as a proportion of total production especially evening milk, unreliable market outlets and limited access to veterinary and A.I services are all factors that negatively affect productivity and performance of the dairy sub-sector. However, the potential for increasing dairy productivity in the country and especially the smallholder dairy remains great. For instance, the average yield per cow in smallholder farms is as low as 1,300litres per year as compared to the best world practice of 4000-6000 litres. Increased productivity in the dairy sector will not only enhance farm incomes, nutrition, reduce poverty but will also supply dairy products to the growing urban populations. According to the current development plan, Kenya’s population was approximately 30.4 million people in 2001 and it is estimated that in 2008 the population will be 35.4 million (Republic of Kenya, 2002). By then, it is estimated that the country’s milk demand will be around 2.6 billion litres as compared to the current demand of around 2.1 billion litres. This calls for not only higher production but also better organisation of the marketing chain. Since the liberalisation of the dairy industry in 1992, new institutional arrangements in milk collection, processing and marketing have emerged. At the farm gate level, informal marketing channels dominate with most farmers using this channel. These channels include hawkers, brokers, self-help groups as well as neighbours and business establishments like hotels. In total, the informal market channel is estimated to control 60% of the total marketed milk. Dairy co-operatives, which used to be an integral part of the formal milk collection and marketing, have been relegated to buyers of last resort. Furthermore, the co-operatives are also marketing a big proportion of their milk directly to urban markets. The 45 licensed milk processors with an estimated daily intake of 600,000 litres handle the rest of the market share. This is as compared to over one million litres per day, which Kenya Co-operative Creameries (KCC) used to handle during its peak. Inasmuch as these new institutional arrangements in milk marketing have offered expanded business opportunities and enhanced competition, they do offer major challenges to the growth and development of the dairy industry. The informal marketing channels not only expose the public to heath and hygiene related risks but also continues to stifle the growth of the formal milk sector. For instance, out of the installed milk processing capacity of 2.2 million litres per day only about 26% of this capacity is currently being utilised. This has limited value addition in the milk chain while contributing towards increasing consumer prices for packaged milk. 1 Based on an average price of Ksh 15/lt
The Dairy Industry in Kenya: The Post Liberalization Agenda
Working Paper No.1, 2003 2
The internal production, processing and marketing constraints have also played a major role in diminishing the competitiveness of the dairy sector in Kenya. This has occurred to the extent where milk powder imports are said to out-compete locally produced milk. This development not only constrains the domestic milk market but also closes opportunities for expanding export market. This paper re-evaluates some of the aforementioned issues. The objective is to identify areas of relevance to public policy, which can be used to increase productivity and efficiency along the milk supply chain. Specifically, this paper first reviews the supply and demand situation in the country. It is followed by an evaluation of milk production (supply) issues ranging from cost of production and competitiveness of the various production systems. A hybrid of the structure-conduct performance and new institutional economics is then applied to analyse the various milk-marketing channels. Of special interest are the levels of market concentration, marketing margins, investments along the milk marketing chain and the co-ordination of the chain. The paper also evaluates the international trends in dairy production, processing and marketing. The evaluation is aimed at identifying challenges and opportunities for development of a dairy export strategy in Kenya. The final section highlights some of the challenges that confront the dairy industry in the post-liberalisation era. 3.0 CONCEPTUAL FRAMEWORK AND METHODOLOGY 3.1 Conceptual framework In the neo-classical economic model formalised by Arrow and Debreu (1954), the market system performs the role of rationing goods and services while determining both allocation of resources in production and final mix of output. In essence this has been the rationale behind market liberalisation and structural adjustment reforms aimed at getting the ‘prices right’. The decentralised mode of operations of a private sector based market system, emphasised in market liberalisation, is expected to be more flexible and therefore more responsive to changes in supply and demand conditions as opposed to a regulated market system. The analysis of agricultural markets has traditionally focused on assessing the market structure using the Structure-Conduct- Performance (SCP) approach. The SCP approach is premised on the notion that, a relationship exist between structural characteristics of a market and the behaviour (conduct) of market participants, which in turn influence the market performance (Bain, 1968; Koch, 1980). Analysis of market structure is mainly concerned with the degree of seller and buyer concentration, entry conditions, and the extent of agent and product differentiation. These factors are postulated to influence the level and nature of competition and pricing within a market. Market conduct represents the pattern of behaviour followed by enterprises in adapting or adjusting to the markets in which they participate. Market performance is primarily concerned with the relationships between distributive margins and costs. The SCP model, while emphasising the concepts of market integration, competition and efficiency, has a number of limitations. Firstly, the criteria of establishing the level of market competition based on the number of firms in a market is based on the neo-classical perfect market assumptions. However, the neo-classical paradigm embodies powerful assumptions about perfect and complete markets, absence of transaction costs and full availability of information to all market participants. These conditions are hardly fulfilled especially in developing economies. The second criterion that observed marketing margins should be consistent with costs tells very little on the whether the marketing system is performing adequately. Furthermore, the assessment of market performance based on costs and margins fail to incorporate the long-run dynamic issues of how incentives
The Dairy Industry in Kenya: The Post Liberalization Agenda
Working Paper No.1, 2003 3
can be structured within the rules of economic exchange so as to reduce the costs at the various production and marketing stages (Harris, 1993; Nyoro et al, 1999). These limitations have led to the current focus on New Institutional Economics (NIE) as a more robust approach to the analysis of agricultural markets particularly those in developing countries. Within the NIE framework, emphasis is placed on analysing market co-ordination and control as important aspects of market structure (Jaffee & Morton, 1995). The framework also highlights the importance of transaction costs as important determinates of market size and occurrence of the exchange process (Hoff et al, 1995). Co-ordination is arranging interdependent activities that require linking the decisions and actions of different production, technical and marketing aspects and ownership units. A major challenge in agricultural commodity systems is enhancing vertical co-ordination that can reduce the risks associated with transactions. Vertical co-ordination, therefore, involves a process of harmonising the decisions and actions of farmers, input suppliers, processors and traders in an effort to match conditions of supply and demand. The process may also facilitate the flow of information and other resources necessary to define and shift the incentives of various market participants. The absence of an effective vertical co-ordination process in any commodity system is therefore likely to result in resource mis-allocation, economic inefficiencies and the enhancement of production and marketing risks. In a well vertically co-ordinated market chain, risks and transaction costs are minimised resulting into expansion of the available production capacity. This expansion may occur without necessarily requiring any incremental investments. A case in point is the low dairy productivity and utilisation of processing capacity currently characterising dairy sector in Kenya. The ability to exercise influence over key variables in a commodity system, be it in production, processing or marketing, is also an important institutional issue usually referred to as market control (Jaffee & Morton, 1995). Both vertical and horizontal controls are important factors and influence the scale economies as well as exchange of property rights of market participants. Vertical control mainly deals with the right or ability to make strategic decisions that influence the activities and welfare of participants at different stages in a commodity system. Horizontal control is mainly the ability to influence prices, incomes and other results in a particular market that arise from one’s market share and/or product differentiation. In real-world situations, individuals (agents) have also limited ability to acquire and process the information necessary to make decisions, a situation associated with imperfect information. Imperfect information may create room for an economic agent involved in a contractual arrangement to be dishonest and in so doing increase his or her benefits at the expense of the other party. This dishonest behaviour creates room for opportunism or what Williamson (1979) refers to as “self-seeking with guile”. In order to overcome information asymmetries and opportunism in contractual arrangements, agents incur transaction costs in their endeavour to maximise their benefits. Transaction costs therefore include the cost of searching for a trade partner; screening; bargaining with potential trading partners to reach an exchange contract; product transfer involving the transport, processing, packaging and change of title to goods; monitoring the contract to ensure conditions are fulfilled, and finally enforcing the exchange contract to ensure compliance (Bardhan, 1989). In a dairy commodity system, therefore, transaction costs are those costs associated with buying, selling and transferring the ownership of dairy products and services. These types of costs can be expected to have escalated in the recent past following the liberalisation of the milk markets. It is therefore important to determine the level and sources of such costs with a view of identifying appropriate policy interventions, which can allow a greater degree of specialisation and exchange.

The Dairy Industry in Kenya: The Post Liberalization Agenda
Working Paper No.1, 2003 4
In this study, a hybrid of the SCP and the NIE model is applied to analyse the milk supply chain in Kenya. Each stage of the milk supply chain is analysed with a view of identifying major constraints, opportunities and the impact on dairy sub-sector competitiveness. 3.2 Methodology The main methodological approach is based on supply chain analysis within the system framework. Specifically the study focuses on analysing; 1. Competitiveness of milk production in Kenya. This is done by estimating the cost of milk production
and returns across the three main production systems. These are compared to costs in other producer countries with similar production systems. An evaluation of animal genetics supply and the structure of the genetics market are also undertaken.
2. The structure and performance of domestic milk market. ♦ A review of the various milk marketing channels and their respective market share ♦ Estimation of milk marketing margins at wholesale, processing and retail levels. ♦ Comparison of prices paid by consumer and to producer is undertaken to access the economic
benefits to the two groups. ♦ Estimation of transaction costs and risks through-out the milk supply chain. ♦ The level of co-ordination and control in the milk supply chain.
3. A review of the international dairy market and the lessons for Kenya 4. A review of the emerging policy and legal environment 3.3 Data Between February and March 2002, a total of 33 small, medium and large dairy farmers were interviewed in 8 districts. The districts visited were Kiambu (Githunguri division), Nyeri (Mathira), Nakuru (Bahati and Njoro), Nyandarua (Ol Kalau), Machakos (central), Embu (central), Kericho (Londiani) and Uasin Gishu. During these farm visits data was collected on various aspects of dairy production mainly geared towards establishing dairy output and cost of milk production. Data was also collected on milk marketing channels and prices. Interviews were also held with the Ministry of Agriculture officials at the district level in relation to milk production and marketing. The data on milk marketing channels collected during the farm visits was supplemented by data collected through a nation-wide household survey undertaken by Tegemeo Institute in May and June 2002. The household survey covered a wide range of topics of which milk production and marketing was a small component. The survey covered a total of 1,540 households in 24 districts of which 18 can be regarded as important in dairy production. The districts are grouped into nine Zones as shown in appendix 1. Interviews were also held with milk co-operatives in some of the districts regarding their role in milk collection and marketing. The visited co-operatives included Githunguri, Limuru both in Kiambu, Bahati in Nakuru, Tulaga, Aberdare and Njabini in Nyandarua district, Cepsir in Kericho and Singiroi in Bomet district.. To get more insight on informal milk marketing channel, interviews were held with milk transporters, hawkers and milk bar owners in Nairobi and its environs. The estates visited in Nairobi were Kawangw’are, Githurai, Kibera, Buruburu, Huruma and Komorock. Other areas visited were Thika,
The Dairy Industry in Kenya: The Post Liberalization Agenda
Working Paper No.1, 2003 5
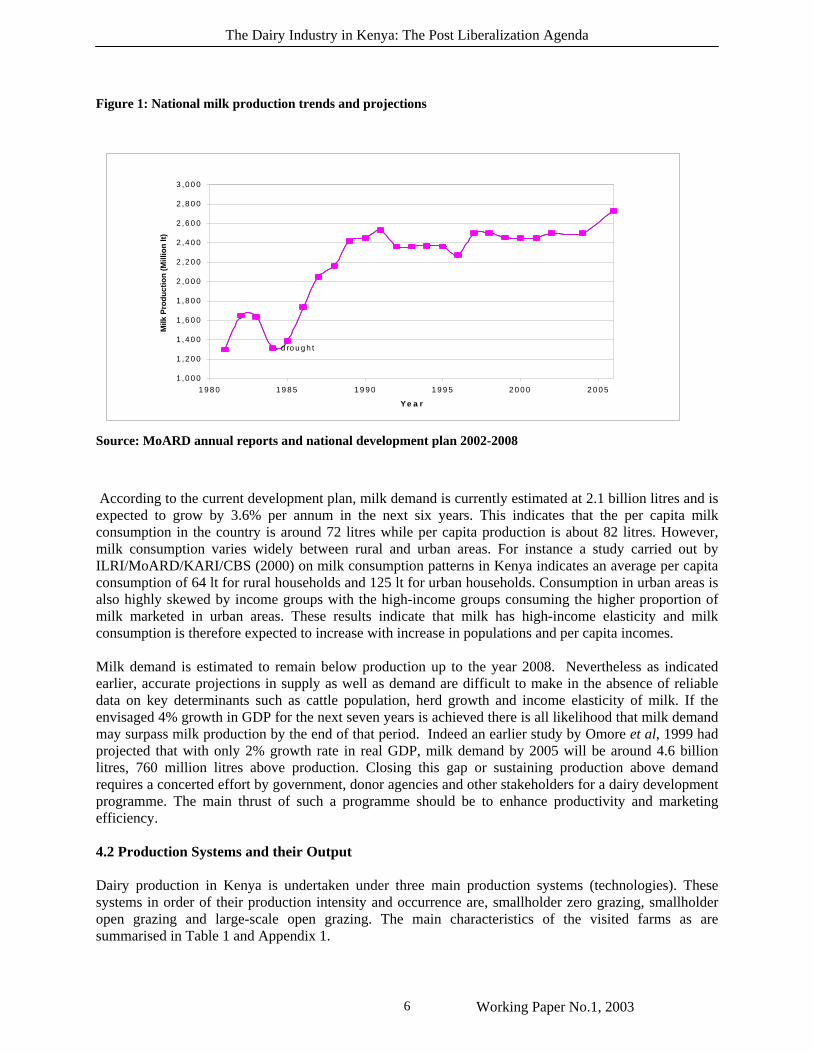
Kiteng’ela, Nakuru, Kericho, Kisumu, Eldolet and Busia. Information collected was mainly on milk procurement, trade volumes, costs, investments, pricing, competition and issues of milk quality. The formal marketing channel was also covered by visiting various supermarkets, stores and retail shops in Nairobi city centre and in Estates. The supermarkets visited included the main chain stores like Uchumi and Nukumatt. The other supermarkets were located in high class areas such as Karen and, middle class areas (Buruburu, Komorock) and low class areas (Kawangware, Huruma, Kitengera). Up-country supermarkets in Nakuru, Kericho, Eldoret, Kisumu and Busia towns were also visited. Information was gathered on products sold prices, origin and packaging. However, there was a major difficulty in getting information on sales volumes, as most managers could not divulge such information citing maintaince of business secrets as the main reason. Attempts to get information from milk processors on their cost structure and margins was also not very successful as most invoked the maintaince of business secrets clause. Secondary data on various aspects of the dairy sub-sector was gathered from the Kenya Dairy Board (KDB), MoARD, Central Bureau of Statistics (CBS) and Kenya Revenue Authority (KRA). Data from various publications was also used. 4.0 DAIRY PRODUCTION 4.1 National milk production and demand In Kenya, two main types of cattle are kept for milk production and other purposes. These are the exotic breeds and their crosses, collectively referred to as dairy cattle and indigenous zebu cattle. It is estimated that dairy cattle contribute about 60% of the national milk production while the other indigenous breeds contribute the rest 40%. Rift Valley and Central Provinces are the main dairy zones accounting over 80% of the total dairy cattle population in the country. The Zebu cattle are widely distributed across all provinces and agro-ecological zones and are estimated to constitute about 70% of the total cattle population. Figure 1 shows the trends and projections of milk production in the country. The figure indicates that MoARD milk production estimates have stagnated at around 2.5 billion litres per annum. According to MoARD the apparent stagnation in dairy production can be attributed to lack of a census report on which to base cattle population and growth rate. Thus, the production estimates are based on more or less the same figures over the last two decades. The projections indicate that by 2006, the total milk production will be about 2.7 billion litres. These estimates seem unlikely given that in the recent past there has been positive herd growth rate especially for the dairy herd as farmers diversify from cash crops such as coffee and maize. Moreover, milk production estimates have been based on an average yield of 1,300lt/cow/year. Results from this report and others (see Omore, 1999) suggest that yields in all the production systems are significantly higher than 1300lts. Indeed, the average yield per cow per year is in the range of 1,500 to 3,000 lts/cow/year. There is therefore course to belief that milk production in the country is higher than reported in official statistics. This may explain the observation shared by many in the dairy industry that the country is increasingly faced by milk glut situations.
The Dairy Industry in Kenya: The Post Liberalization Agenda
Working Paper No.1, 2003 6
Figure 1: National milk production trends and projections
Source: MoARD annual reports and national development plan 2002-2008
According to the current development plan, milk demand is currently estimated at 2.1 billion litres and is expected to grow by 3.6% per annum in the next six years. This indicates that the per capita milk consumption in the country is around 72 litres while per capita production is about 82 litres. However, milk consumption varies widely between rural and urban areas. For instance a study carried out by ILRI/MoARD/KARI/CBS (2000) on milk consumption patterns in Kenya indicates an average per capita consumption of 64 lt for rural households and 125 lt for urban households. Consumption in urban areas is also highly skewed by income groups with the high-income groups consuming the higher proportion of milk marketed in urban areas. These results indicate that milk has high-income elasticity and milk consumption is therefore expected to increase with increase in populations and per capita incomes. Milk demand is estimated to remain below production up to the year 2008. Nevertheless as indicated earlier, accurate projections in supply as well as demand are difficult to make in the absence of reliable data on key determinants such as cattle population, herd growth and income elasticity of milk. If the envisaged 4% growth in GDP for the next seven years is achieved there is all likelihood that milk demand may surpass milk production by the end of that period. Indeed an earlier study by Omore et al, 1999 had projected that with only 2% growth rate in real GDP, milk demand by 2005 will be around 4.6 billion litres, 760 million litres above production. Closing this gap or sustaining production above demand requires a concerted effort by government, donor agencies and other stakeholders for a dairy development programme. The main thrust of such a programme should be to enhance productivity and marketing efficiency. 4.2 Production Systems and their Output Dairy production in Kenya is undertaken under three main production systems (technologies). These systems in order of their production intensity and occurrence are, smallholder zero grazing, smallholder open grazing and large-scale open grazing. The main characteristics of the visited farms as are summarised in Table 1 and Appendix 1.
d ro u g h t
1 ,0 0 0
1 ,2 0 0
1 ,4 0 0
1 ,6 0 0
1 ,8 0 0
2 ,0 0 0
2 ,2 0 0
2 ,4 0 0
2 ,6 0 0
2 ,8 0 0
3 ,0 0 0
1 9 8 0 1 9 8 5 1 9 9 0 1 9 9 5 2 0 0 0 2 0 0 5
Y e a r
Milk
Pro
du
ctio
n (
Mill
ion
lt)
The Dairy Industry in Kenya: The Post Liberalization Agenda
Working Paper No.1, 2003 7
4.2.1 Zero-grazing system The zero-grazing farms visited had an average of 2 milking cows with an annual production of about 2,122 litres per cow. The highest milk yield under zero grazing was recorded in the high intensive system in Kiambu district. The lowest yield under this system was recorded in Machakos district. The milk yields realised are mainly related to the level of supplementation and availability of nappier grass. The supplements are dairy meal, bran and mineral salts, which were mainly fed to the animals during milking time. As such the productivity and competitiveness of this production system in inextricably linked to the performance of the animal feed industry. While most farmers have good access to manufactured feeds there was, however, general complains about the quality of the feeds. The feeds were either under-weight or not up to the required standards. Informal discussions with animal feed dealers and manufacturers confirmed these allegations. Most animal feed merchants had back-room operations where feeds were opened and re-packed after reducing the weight by 5 to 10 kg per bag. Some manufactures especially the small ones were also said to add all sorts of ingredients such as sawdust, rice and wheat husks. Furthermore, most manufacturers claimed that there was a problem of securing protein components locally. The locally available protein components such as Omena and cotton seed cake were also said to be more expensive as compared to the ones imported from Tanzania. For Instance, the cost of Omena at Thika from Tanzania in June 2002 was Ksh 28 per kg as compared to the locally available one that was costing Ksh 36. No good reason was forthcoming for the big margin of Ksh 8 per kg. There is therefore need for a further study to establish the structure, performance and conduct of the animal feed industry with a view of enhancing competitiveness and efficiency. Secondly and a matter of urgency, the government and its agencies (especially KBS and Weight and Measures Department) need to intensify its regulatory role in the feed industry to minimise the moral hazards that currently besiege the industry. A system for monitoring and testing of manufactured feeds should be introduced and the information gathered used for regulation and self-regulation of the feeds industry. This is an important area where the KDB should have a direct involvement. Most households interviewed identified the availability of milk for home consumption, mainly for their children, availability of manure as the main reasons for keeping dairy animals. Income from milk sales was nevertheless considered very critical especially due to the poor performance of other farm enterprises. Furthermore, most households were of the opinion that dairy has a comparative advantage in as far as it helps to ease their cash flow constraints. Zero grazing farmers received the highest price per litre, which in March-April 2002 was averaging Ksh 16 per litre. The farmers were also able to market 62% of their milk with only 1% being retained in the farm for lack of a ready market (Table 1). However, milk revenue only represented 43% of the total value of dairy production with revenue from sale of calves, bulls and cullings accounting for 31% of total revenue. The importance of this secondary revenue from daily production was evident across all the systems. This indicates that the dairy development strategy needs to take into account the institutional frameworks that can enhance the marketing of dairy industry by-products at farm level.
The Dairy Industry in Kenya: The Post Liberalization Agenda
Working Paper No.1, 2003 8
Table 1: Average farm production characteristics
Item Small scale Zero grazing
MS open grazing LS open grazing
Cows 3 12 146 Milking Cows 2 4 33 Acres under dairy 1 25 160 Marketed milk 2,014 3,180 73,700 Milk Home consumption 661 1,261 6,717 Milk fed to calves 517 1,480 13,522 Milk Unsold 45 194 2,733 Total milk (lt/year) 3,224 7,519 103,077 Milk per cow per yr 2,159 1,654 3,187 Milk price (Ksh/lt) 16 12 15 Milk Revenue (Ksh) 32,267 54,067 1,201,575 Other Revenues 22,966 34,667 657,833 TOTAL REVENUE(TR) 74,282 127,379 2,203,983 Marketed Output(MO) 55,232 88,734 1,859,408 % milk marketed 62 42 72
% milk home consumed 20 17 7 % milk fed to calves 16 20 13 % milk unsold 1 3 3
% milk revenue 43 42 55 % other revenue 31 27 30 % un-marketed production 26 30 16
TR/cow 26,529 10,841 15,061 MO/cow 19,726 7,552 12,707
TR/Milking cow 49,521 30,571 67,469 MO/milking cow 36,821 21,296 56,921
MO/acre N/A 3,549 11,621 Source: Household survey, 2002 The farm survey results are confirmed by the national household survey results which indicate that 63% of all the milk produced by smallholder farms during peak production is sold. This is as compared to 34% of the milk marketed during the low production period (Table 2). Farmers in coastal lowlands have the highest sales followed by those in the central highlands. The high proportion of sales in the coastal lowlands of Kilifi and Kwale can be mainly attributed to scarcity of milk in the region and the ready market in coastal urban centres. The sales in central could be attributed to proximity to Nairobi and other urban centres. The two zones also maintain the lead in proportion of milk sold during the low production season. The lowest sales in the peak production period were in eastern lowlands, which are mainly semi-arid.
The Dairy Industry in Kenya: The Post Liberalization Agenda
Working Paper No.1, 2003 9
Table 2: Proportion of milk sold in various AEZs in Kenya.
Zone Peak season sales Low season sales % of Milk Produced Coastal Lowland 76.0 45.8 Eastern lowlands 57.0 20.0 Western Lowlands 65.2 19.4 Western Transitional 61.5 26.1 High potential Maize 62.1 36.6 Western Highlands 59.5 21.5 Central Highlands 69.2 48.3 Marginal rain Shadow 59.9 33.3 Total 63.3 34.0 Source: Tegemeo household survey, 2002 4.2.2 Medium open grazing The yields realised in smallholder open grazing farms in Nyandarua, Kericho and Nakuru districts were the lowest as compared to milk yields in the other systems. The milk yield under this system averaged 1,510 litres per cow per year. This yield is 28.8% and 46% lower than the average yields in small scale zero grazing and large-scale open grazing systems, respectively. Low levels of supplementation characterise this production system. Indeed, most of the farmers visited only used mineral salts as supplements. Land is the main factor of production with every cow allocated an average of 1 acre of unimproved natural pasture. As such, this production system can mainly be categorised as low-input low-output. Most of the animals kept are mainly crossbreeds with most of the farmers using natural breeding method. Due to the open grazing system the farmers are not able to collect manure for application in the rest of the farm. Where possible, the farmers rotate the paddocks after a period of five to six years as a means through which to benefit from the manure. Farms under medium open grazing system only sold 42% of their milk production with the rest 58% retained in the farm for home consumption and feeding to the calves. The farms had an extra 3% (256 litres per year) of their milk that was regarded as waste as it could not find a market. The unsold milk arose due to quotas and non-collection of milk by processors. Milk collection in most of the areas was limited to 4-5 days a week forcing farmers to search for other alternative milk markets during the rest of the days. As such these farms had about 30% of their dairy produce which was un-marketed. Farmers under this system were also paid the lowest prices ranging from Ksh 9 to 12 per litre. Productivity per cow, and per acre was also the lowest as compared to the other production systems. There is therefore great potential for improving productivity under this system if only to match the levels already attained in other production system. Most of the districts e.g. Kericho and Nyandarua where medium scale open grazing systems are common have very poor access roads that are impassable during the rainy season. This may in a way explain the limited market access available to farms in these districts. The upgrading of roads would therefore contribute significantly to the competitiveness of the dairy production in these districts. Given also the big volumes which are formally marketed from these regions investments in road infrastructure would also be beneficial to processors and urban milk consumers.
The Dairy Industry in Kenya: The Post Liberalization Agenda
Working Paper No.1, 2003 10
4.2.3 Large scale open grazing system The Large-scale farms in Usian-Gishu district had the highest yield per cow averaging 2,775 litres per year. Like smallholder open grazing system the breeds kept are both pure and crossbreeds the only difference is the feeding regime. Furthermore, these farms have higher commercial orientation than any other production system, a fact attested by the high percentage of milk marketed (see Table 1). Apart from milk, these farms also derive over 30% of their total annual revenue from sale of dairy stock. The farms mainly use imported semen or well-reared bulls in a well co-ordinated breeding program. Heifers from these farms are in high demand by NGOs and progressive peri-uban farmers. Some of the farms were also exporting the animals to neighbouring countries. A heifer from some of the farms was selling at an average price of Ksh 50,000. Most of the farms in U/Gishu district were using home made maize-based rations as supplements. Ground maize was mixed with mineral salts and fishmeal. The extensive use of ground maize was attributed to the glut in the maize market with most farmers using dairy to add value to their maize. Other supplements included wheat and maize bran, dairy meal, maize silage and molasses. Most of the farms have improved pastures planted with Rhodes grass. Although this system is in the minority, it has however high animal and land productivity. This is particularly the case when compared to the medium open grazing system. 4.3 Cost and competitiveness of milk production
The cost of milk production varies dramatically across various production systems and within the systems. The cost of milk production based on data collected during the field surveys is as shown in Table 3 and Appendix 3. Despite the high intensity nature and high productivity, the smallholder zero grazing farmers had the highest cost of production of about Ksh 15 per litre. This system depends on high levels of supplementation with purchased feeds accounting for 21% of the total production costs. As indicated earlier, the quality of animal feeds has been deteriorating in the recent past. Poor quality feeds that are underweight have the double effect of increasing costs as well as lowering productivity per animal. There is therefore an urgent need to adopt policies that can enhance the quality of animal feeds while minimising unfair trade practices in the industry. The smallholder farmers also use high labour input for cutting nappier grass and other fodder. This makes labour the most important cost item in zero-grazing system. The third important element is milk fed to calves, which accounted for 16% of the cost. The small and medium scale open grazing farms in Nyandarua, Kericho and Nakuru had the lowest cost of production of Ksh 10.50 per litre. Grazing land is the most important input in this system. Taking this into consideration and assuming that the opportunity cost of grazing land in these districts is about Ksh 2,000 per annum2, the cost of milk production increases to an average of Ksh 15.10 per litre(see Appendix 3). Thus, although the production system may seem more competitive than smallholder farms, this is only because the farmers disregard the opportunity cost of grazing land. The cost of production in large-scale farms is estimated at Ksh 12 per litre without considering land opportunity cost and Ksh 12.30 with land rent. This indicates that the large-scale farms are the most competitive in milk production as compared to other types of farms. This can be expected given the high genetic quality of animals in these farms, the relatively higher level of animal husbandry and management.
2 The opportunity cost is based on the average land rent rates in the three districts.
The Dairy Industry in Kenya: The Post Liberalization Agenda
Working Paper No.1, 2003 11
Table 3: Summary of cost of milk production
Zero grazing Small scale open grazing
Large scale open grazing
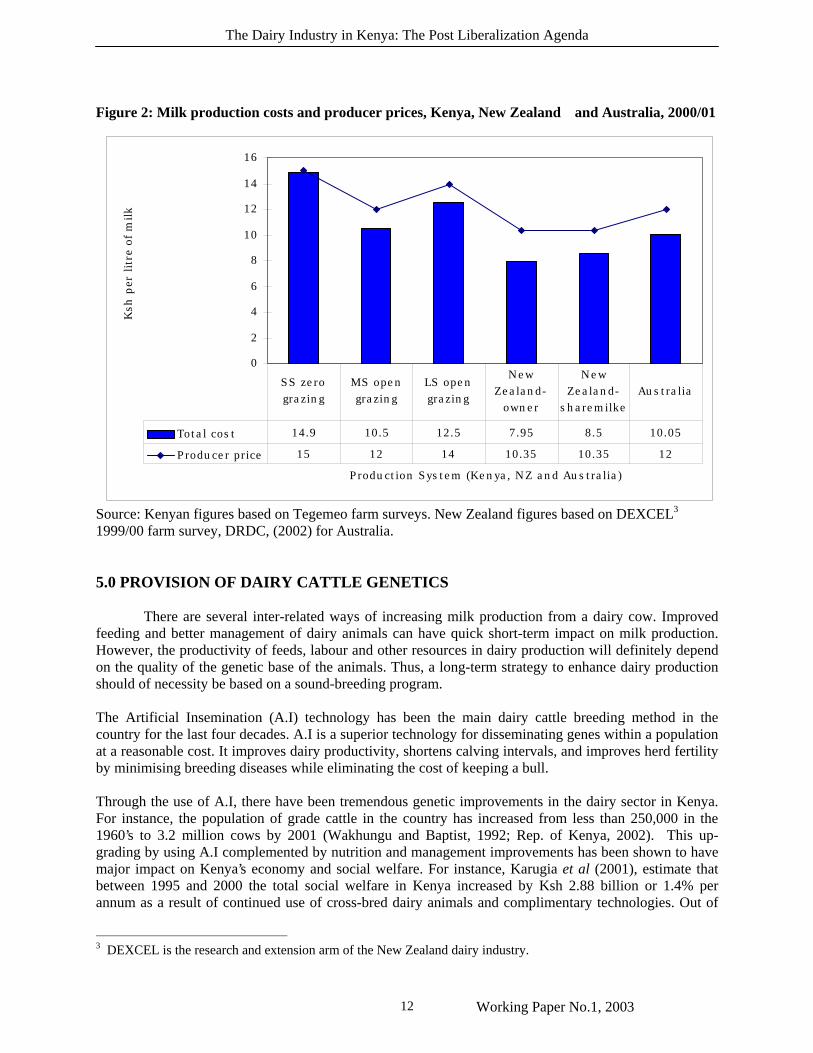
Variable costs 8.60 (57%) 6.20 ( 59%) 8.50 (68%) Labour 4.90 (33%) 3.10 (29%) 2.70 (21%) Fixed cost 1.45 (10%) 1.20 (11%) 1.30 (10%) Total 14.95 10.50 12.50 Source: survey data Comparison of the local production costs with those attained in New Zealand indicates that on average the Kenyan production costs are at least 27% higher than in New Zealand (Figure 2). However, the Kenyan production cost are comparable to Australian costs which range from Ksh 8.50 to Ksh 12.60 per litre (DRDC, 2002). This indicates measures aimed at reducing the milk production costs will go along way in increasing the competitiveness of Kenyan dairy products in the international market. Furthermore, Figure 2 shows that the profitability (gross margins) of dairy production is higher in New Zealand than in Kenya. New Zealand farmers receives about Ksh 2 per litre of milk above their production cost as compared to the average margin of Ksh 1 per litre for their Kenyan counterparts. The margin is even narrower for the smallholder farms in Kenya.
The Dairy Industry in Kenya: The Post Liberalization Agenda
Working Paper No.1, 2003 12
Figure 2: Milk production costs and producer prices, Kenya, New Zealand and Australia, 2000/01
Source: Kenyan figures based on Tegemeo farm surveys. New Zealand figures based on DEXCEL3 1999/00 farm survey, DRDC, (2002) for Australia. 5.0 PROVISION OF DAIRY CATTLE GENETICS
There are several inter-related ways of increasing milk production from a dairy cow. Improved feeding and better management of dairy animals can have quick short-term impact on milk production. However, the productivity of feeds, labour and other resources in dairy production will definitely depend on the quality of the genetic base of the animals. Thus, a long-term strategy to enhance dairy production should of necessity be based on a sound-breeding program.
The Artificial Insemination (A.I) technology has been the main dairy cattle breeding method in the country for the last four decades. A.I is a superior technology for disseminating genes within a population at a reasonable cost. It improves dairy productivity, shortens calving intervals, and improves herd fertility by minimising breeding diseases while eliminating the cost of keeping a bull. Through the use of A.I, there have been tremendous genetic improvements in the dairy sector in Kenya. For instance, the population of grade cattle in the country has increased from less than 250,000 in the 1960’s to 3.2 million cows by 2001 (Wakhungu and Baptist, 1992; Rep. of Kenya, 2002). This up-grading by using A.I complemented by nutrition and management improvements has been shown to have major impact on Kenya’s economy and social welfare. For instance, Karugia et al (2001), estimate that between 1995 and 2000 the total social welfare in Kenya increased by Ksh 2.88 billion or 1.4% per annum as a result of continued use of cross-bred dairy animals and complimentary technologies. Out of
3 DEXCEL is the research and extension arm of the New Zealand dairy industry.
0
2
4
6
8
10
12
14
16
Production System (Kenya, NZ and Australia)
Ksh
per
lit
re o
f m
ilk
Total cost 14.9 10.5 12.5 7.95 8.5 10.05
Producer price 15 12 14 10.35 10.35 12
SS zero grazing
MS open grazing
LS open grazing
New Zealand-
owner
New Zealand-
sharemilkeAustralia
The Dairy Industry in Kenya: The Post Liberalization Agenda
Working Paper No.1, 2003 13
this total sum, Ksh 500 million was in form of producers’ surplus, Ksh 2.2 billion in reduced home consumption expenditure, Ksh 458 million in consumers’ surplus and Ksh 318 million as foreign exchange surplus.
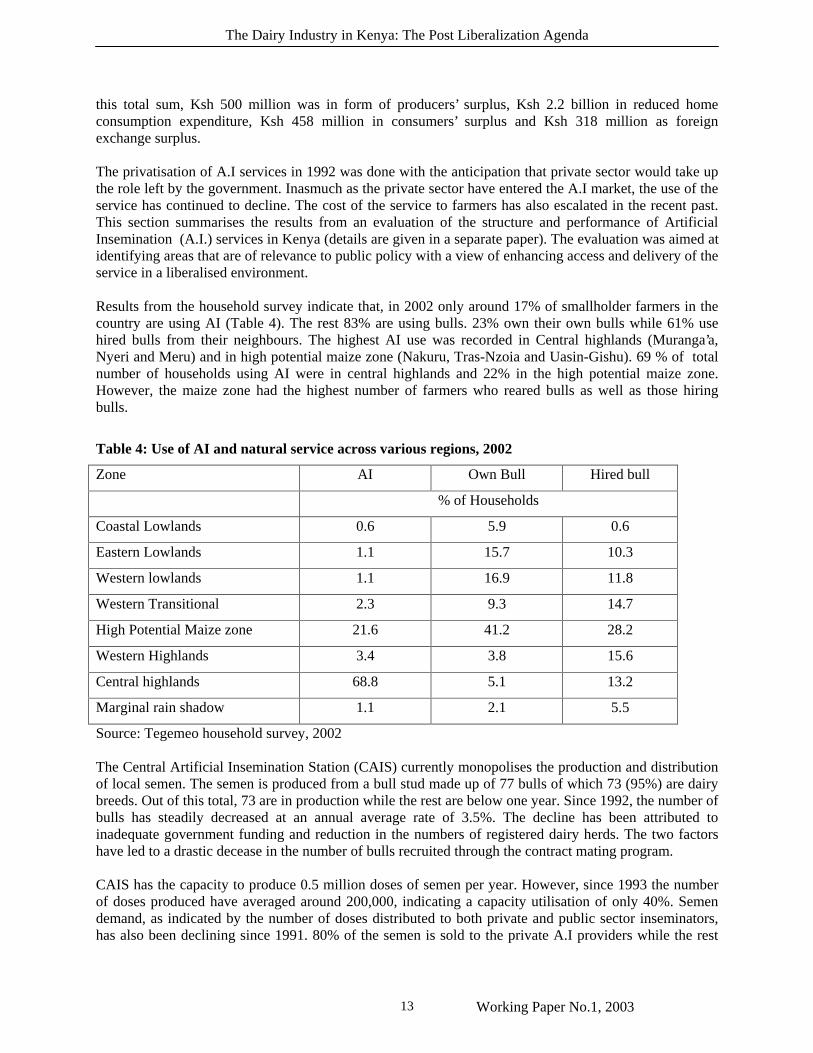
The privatisation of A.I services in 1992 was done with the anticipation that private sector would take up the role left by the government. Inasmuch as the private sector have entered the A.I market, the use of the service has continued to decline. The cost of the service to farmers has also escalated in the recent past. This section summarises the results from an evaluation of the structure and performance of Artificial Insemination (A.I.) services in Kenya (details are given in a separate paper). The evaluation was aimed at identifying areas that are of relevance to public policy with a view of enhancing access and delivery of the service in a liberalised environment. Results from the household survey indicate that, in 2002 only around 17% of smallholder farmers in the country are using AI (Table 4). The rest 83% are using bulls. 23% own their own bulls while 61% use hired bulls from their neighbours. The highest AI use was recorded in Central highlands (Muranga’a, Nyeri and Meru) and in high potential maize zone (Nakuru, Tras-Nzoia and Uasin-Gishu). 69 % of total number of households using AI were in central highlands and 22% in the high potential maize zone. However, the maize zone had the highest number of farmers who reared bulls as well as those hiring bulls.
Table 4: Use of AI and natural service across various regions, 2002
Zone AI Own Bull Hired bull
% of Households
Coastal Lowlands 0.6 5.9 0.6
Eastern Lowlands 1.1 15.7 10.3
Western lowlands 1.1 16.9 11.8
Western Transitional 2.3 9.3 14.7
High Potential Maize zone 21.6 41.2 28.2
Western Highlands 3.4 3.8 15.6
Central highlands 68.8 5.1 13.2
Marginal rain shadow 1.1 2.1 5.5
Source: Tegemeo household survey, 2002 The Central Artificial Insemination Station (CAIS) currently monopolises the production and distribution of local semen. The semen is produced from a bull stud made up of 77 bulls of which 73 (95%) are dairy breeds. Out of this total, 73 are in production while the rest are below one year. Since 1992, the number of bulls has steadily decreased at an annual average rate of 3.5%. The decline has been attributed to inadequate government funding and reduction in the numbers of registered dairy herds. The two factors have led to a drastic decease in the number of bulls recruited through the contract mating program. CAIS has the capacity to produce 0.5 million doses of semen per year. However, since 1993 the number of doses produced have averaged around 200,000, indicating a capacity utilisation of only 40%. Semen demand, as indicated by the number of doses distributed to both private and public sector inseminators, has also been declining since 1991. 80% of the semen is sold to the private A.I providers while the rest
The Dairy Industry in Kenya: The Post Liberalization Agenda
Working Paper No.1, 2003 14
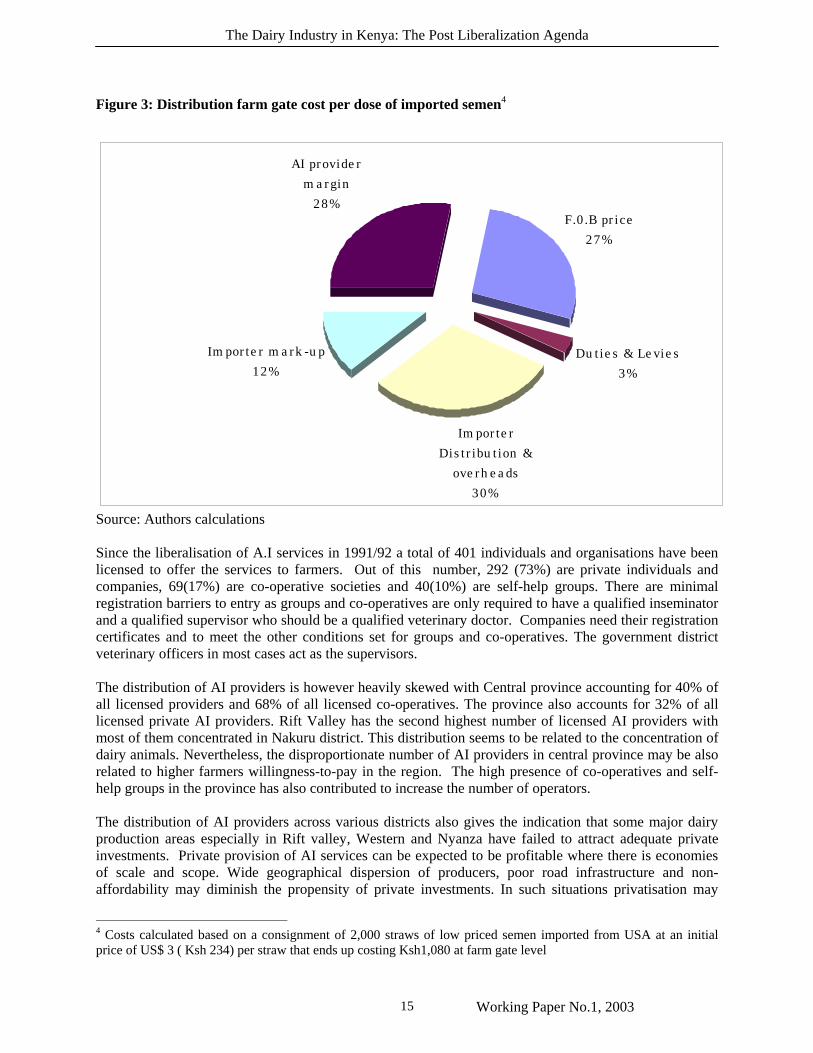
20% is given to KNAIS, free of charge. Almost all the distributed semen goes to the local market. Semen exports have been generally low or non-existent except in 1996 when a total of 20,800 doses were exported to Uganda and Malaysia. There is however great export potential in the COMESA region, the rest of Africa, Middle East and South East Asia that remain un-exploited despite the low capacity utilisation. Lack of an effective marketing and promotion strategy has been cited as one of the reasons behind low export volumes. Apart from promotion, the issue of the quality of semen produced at CAIS could also be a major factor for the low export volumes. The cost per dose of semen produced by CAIS over the last five years have increased steadily from Ksh 93.80 in 1995/96 to about Ksh 118.80 in 2000/01. However, the actual cost could be higher after taking into account the other fixed costs such as the opportunity cost of the land used in hay production and other utilities which covers a total of 345 acres. Nevertheless, the current costs indicate that CAIS can be able to produce semen at a cost below US$ 1.5 per dose as compared to the prevailing international prices of about US$2. This gives the indication that with better management, semen quality and marketing, CAIS can compete in the regional and international semen markets. Prior to 1992, only a few large-scale farms were getting access to imported semen. Since then there has been an increase in the use of imported semen even among the small-scale dairy farmers. Currently it is estimated that about 50,000 doses of semen are imported into the country. This represents around 22% of all the semen distributed in the county in 2001. About four main companies import the semen mainly from USA, EU and Ocenia. The importing companies have distribution networks in the country that sells the semen in bulk to A.I providers and individual farms. Unlike the local semen that is centrally distributed from CAIS at Kabete, the imported semen is readily available in major towns in high potential districts. Most of the semen importers also use the storage facilities at CAIS at a fee. This way the importers have avoided the heavy investments in semen storage facilities. Some of the semen importers e.g. ABS have endeavoured to vertically integrate their market operations by linking semen supply, distribution, training of inseminators and supply of equipment to inseminators and community based organisations. However, the government is yet to recognise the training offered by ABS arguing that the curriculum has not been approved. The technical and policy issues surrounding the training of inseminators need therefore to be resolved with a view of attracting the much-needed private sector investments. The breeding value of imported semen is well established unlike that of local semen. This way the farmers are assured of high quality semen. Nevertheless the main concern in regard to imported semen has been on its cost. From the field surveys, the cheapest cost per insemination using imported semen was Ksh700 charged by the community based A.I service under the Catholic diocese of Embu. The charges however had a wide range from Ksh700 to Ksh 6,000. This is as compared to charges of local semen that averaged Ksh 520 per insemination. The imported semen charges are mainly based on the breeding value of each particular bull. Figure 3 shows the distribution of the farm gate price of imported semen among the various cost items. The importers overheads takes the lion share followed by the A.I provider margin and the f.o.b. price. While there is limited room to manoeuvre as far as the f.o.b. price is concerned, the same is not the case for both the importer and AI provider margins. The high importer margin may be arising from lack of competition in the market or high overheads per unit due to thinness of the market i.e. low trade volumes. The small-scale farmers who used imported semen tended to be mainly concerned with cost rather than on the breeding value of the bulls used. This situation can create room for opportunism by dishonest A.I providers and needs to be redressed through farmer education.
The Dairy Industry in Kenya: The Post Liberalization Agenda
Working Paper No.1, 2003 15
Figure 3: Distribution farm gate cost per dose of imported semen4
Source: Authors calculations Since the liberalisation of A.I services in 1991/92 a total of 401 individuals and organisations have been licensed to offer the services to farmers. Out of this number, 292 (73%) are private individuals and companies, 69(17%) are co-operative societies and 40(10%) are self-help groups. There are minimal registration barriers to entry as groups and co-operatives are only required to have a qualified inseminator and a qualified supervisor who should be a qualified veterinary doctor. Companies need their registration certificates and to meet the other conditions set for groups and co-operatives. The government district veterinary officers in most cases act as the supervisors. The distribution of AI providers is however heavily skewed with Central province accounting for 40% of all licensed providers and 68% of all licensed co-operatives. The province also accounts for 32% of all licensed private AI providers. Rift Valley has the second highest number of licensed AI providers with most of them concentrated in Nakuru district. This distribution seems to be related to the concentration of dairy animals. Nevertheless, the disproportionate number of AI providers in central province may be also related to higher farmers willingness-to-pay in the region. The high presence of co-operatives and self-help groups in the province has also contributed to increase the number of operators. The distribution of AI providers across various districts also gives the indication that some major dairy production areas especially in Rift valley, Western and Nyanza have failed to attract adequate private investments. Private provision of AI services can be expected to be profitable where there is economies of scale and scope. Wide geographical dispersion of producers, poor road infrastructure and non-affordability may diminish the propensity of private investments. In such situations privatisation may
4 Costs calculated based on a consignment of 2,000 straws of low priced semen imported from USA at an initial price of US$ 3 ( Ksh 234) per straw that ends up costing Ksh1,080 at farm gate level
F.0.B price
27%
Duties & Levies
3%
Importer
Distribution &
overheads
30%
Importer mark-up
12%
AI provider
margin
28%
The Dairy Industry in Kenya: The Post Liberalization Agenda
Working Paper No.1, 2003 16
have a negative impact on the affected producers as they suffer from the exclusion effect. In such situations farmers are forced to use natural service (bull) with all its inherent risks. The social cost from such an exclusion need therefore to be taken into account and addressed through appropriate policies.
The total number of inseminations undertaken by private providers have steadily risen from about 3,400 in 1990 to around 100,000 in 1999. This has increased their market share from 2% in 1991 to over 86% in 1999. Nevertheless, the services provided by the private sector and GoK in 1999 represented only 26% of the total inseminations undertaken in 1990. Firstly, this figure indicates that the AI service in the country has declined by almost 76%, a sorry state indeed. Secondly, the figure shows the great potential and challenge that faces the private sector AI providers. The decline in the number of inseminations affects all the regions and especially areas where there is limited presence of private AI providers. In Rift Valley, the province with the highest number of dairy animals, the number of inseminations has declined by almost 79%. The decline is even more in districts that have high dairy cattle concentration. For instance, in Nakuru district only 10% of the mature dairy cows were inseminated in 2001.
The A.I services market is also highly concentrated being dominated by a few local oligopolies, which are mainly co-operatives or producer groups. For example, in Embu, Machakos and Kiambu districts the 4-firm concentration ratio was higher than 74%. It was only in Nakuru district where the 4-firm concentration ratio was less than 31%. In all the four districts the farmer groups and co-operatives had the highest market share with co-operatives in Kiambu district controlling over 88% of the market. For instance, in 2001, the number of inseminations offered by Githunguri and Limuru dairy co-operative societies accounted for 29% and 23% of the total inseminations in the district, respectively. The best performing private AI provider had a market share of only 5% equivalent to 1320 inseminations In summary the animal genetics market in Kenya is shown to be characterised by ♦ Low public financing and lack of proper co-ordination among the various players in the industry ♦ Declining number of AI inseminations and an increase in the use of natural service ♦ Under-capacity utilisation of available infrastructure for semen production at CAIS ♦ Thin AI market that is not conducive to private sector investments ♦ Skewed distribution of AI providers leading to exclusion of important dairy producing areas ♦ Dominance of socio-organisations in AI service provision ♦ Low levels of animal registration and recording ♦ Unsatisfactory involvement of farmers, breeders and other stakeholders in the management of
institutions in the industry

The Dairy Industry in Kenya: The Post Liberalization Agenda
Working Paper No.1, 2003 17
6.0 MILK COLLECTION, PROCESSING AND MARKETING 6.1 Milk collection and rural markets In most of the dairy producing areas, milk collection is organised along collection routes. Individual farmers deliver the milk to the pick-up point or marketing agents collect the milk directly from the farms. At the milk collection stage, both aluminium and plastic containers are used. Smallholder farmers prefer to use plastic containers citing their low cost and convenience. However, in large-scale areas, where large quantities of milk are handled, most farmers use the aluminium cans. Five major milk outlets were identified during the field surveys. These are Brokers, Traders/hawkers, Transporters, Co-operatives and Farmer groups and Processors. In the smallholder zones covered by the nation-wide survey, the main milk outlet at the farm level for both the morning and evening milk was local sales to neighbours and business establishments. (Table 5). The informal market outlets are the most dominant, accounting for over 76% of the total milk sold. The co-operatives, self-help groups and direct sales to processors were the formal milk marketing channels, which absorbed around 24% of the milk sold. As shown elsewhere in this paper, 30% of the milk collected by co-operatives and self-help groups is sold in the informal market. Taking this into consideration it is estimated that the informal market absorbs at least 80% of all the milk sold by smallholder farmers in the country. The farm-gate milk prices in informal markets are higher than that offered by the formal marketing channels. Milk sold to neighbours and the one hawked by the farmers had the highest price while milk sold directly to processors was paid the least price. These price differentials may explain why most smallholder farmers prefer the informal marketing channels.
Table 5: Rural milk marketing channels and prices
Channel Morning milk Evening milk Average
sales (lt) % Average
sales(lt) % Average
price(Ksh/lt) Broker 8.1 6.5 6.9 3.1 15.10 Hawker 7.3 14.2 4.7 5.9 14.20 Self-hawking 5.5 11.2 3.0 7.0 19.50 Neighbours 2.7 39.1 2.5 72.0 22.90 Co-operative 6.7 12.6 3.1 3.7 13.80 Self-help group 11.9 0.6 0 0 13.0 Processors 15.9 11.0 4.7 0.6 12.30 Other 3.8 4.7 3.8 7.6 19.0 Source. Tegemeo Household survey, 2002 6.1.1 Brokers and hawkers Brokers appointed either by trasporters and other informal market traders play a major role in milk collection in most of the study areas. The brokers collect milk from farmers mainly using bicycles and deliver to their principals. In most of the areas especially in Nyandurua, Nakuru and Kericho, the brokers are paid a margin ranging from 60 cents to one shilling per litre delivered. The brokers are expected to check milk quality from each farmer before delivery. To do this they use lactometers, sight and smell. The transporters and other traders also expect the brokers to mark the source of milk through the use of marked containers for ease of follow-up, in case of quality related problems. This way the brokers are able to screen farmers who consistently market poor quality milk.
The Dairy Industry in Kenya: The Post Liberalization Agenda
Working Paper No.1, 2003 18
Milk hawking is also a common phenomenon in rural areas and small urban centres. As shown in Table 3, milk hawking is undertaken by traders who buy from the farms or by farmers themselves. These two channels account for 25% and 14% of the morning and evening milk sold, respectively. Self-hawking of milk is mainly driven by the desire of farmers to get a higher price for their milk. Compared to milk sold to brokers and hawkers the self-hawked milk fetched an extra Ksh 4 per litre. So long as this significant price differential remains, the propensity for farmers to be involved in milk hawking will remain. 6.1.2 Co-operatives and self-help groups As shown in the preceding section, the co-operatives and self-help groups control around 13% of the total milk marketed by smallholder farmers. Currently there are over 332 dairy coo-operative societies in the country, which in 2001 marketed milk worth Ksh 1.26 billion. However, their market share has been declining over the last ten years mainly due to competition from informal market operators. Some of the co-operatives have also suffered from mis-management thereby making farmers to loose confidence in them. Nevertheless, collective milk marketing through co-operatives and farmer groups still appeals to farmers. Collective milk marketing channels enjoy economies of scale and also offer farmers monthly payments that enable them to meet their obligations. This is unlike the informal marketing channels where cash and weekly payments are prevalent. Co-operatives also offer input credit as well as other dairy related services such as A.I.. The co-operatives and self-help groups also offer a reliable market outlet that can be depended upon by both the farmers and other milk market participants. Dairy co-operatives, once integral parts of the formal milk collection system are marketing a larger proportion of their raw milk directly to urban markets (Owango et al., 1996; Ngigi, 1995). However the sales to urban centres that were witnessed immediately after liberalisation seems to have declined. Among the dairy co-operatives visited during the field surveys in May and June 2002, only Githunguri Dairy Co-operative was marketing raw milk to urban centres (Table 6). The logistics of dealing with urban centres, transport costs and competition from informal market trades were cited as some of the reasons for the exit of co-operatives from the urban raw markets. However, most of the co-operatives visited still sell some of their milk locally, mainly to informal traders. The price received from these informal sales was 20% higher than the price offered by processors. The only exception was Limuru co-operative whose local sales price was lower than the price paid by Limuru dairy processing plant. Most of the milk collected by co-operatives was channelled to the processors. Limuru and Muki co-operatives have vertically integrated their operations by establishing a processing plant and a cooling plant respectively. This could explain why these two societies had almost 100% sales to the processors. Kule Dairy co--operative in Kitengela had also a milk cooling plant but resulted to local sales after most processors abandoned it. Most processors issued unilateral milk quota restrictions to co-operatives dictating the quantities and ex-factory price. The societies were in turn forced to impose the same quotas to farmers thereby restricting milk delivery to certain days in a week. These contractual arrangements are inconveniencing most co-operatives in their planning and adding unnecessary cost to milk collection due to wastage. For instance, one dairy co-operative in Kiambu had 28,000 litres of milk worth Ksh 450, 000 going to waste in a month due to rejection by one of the processors. The story was the same all over the country. Cases of milk delivered and not paid by processors were also rampant. Some processors have gone under with millions of shillings belonging to dairy co-operative while others processors just refuse to pay. These are pure cases of contract enforcement problems and trade opportunism.
The Dairy Industry in Kenya: The Post Liberalization Agenda
Working Paper No.1, 2003 19
Table 6: Co-operatives milk collection and sales
market shares (%)
Sales price Ksh/lt
Co-op margin Co-operative District Monthly Intake (
lt) processor local Processor Local Sales
Av. price
Farmer payout
Ksh/lt
Ksh/lt %*
Githunguri Kiambu 1,228,605 51.3 48.7 16 20 17.95 14.00 3.95 22
Limuru Kiambu 981,777 80.5 19.5 19 17 18.60 17.20 1.41 7.6
Aberdare Nyandarua 510,000 100 0 12 - 12 9 3.00 25
Tulaga Nyandarua 120,000 75 25 12 10 11.50 8 3.50 30.4
Muki Nyandarua 156,995 100 0 12 - 12. 8 4.00 33.3
Kule Kajiando 12,000 0 100 - 22 21.90 18 3.88 17.7
Chepsir Kericho 20,833 76.8 23.2 13 18 14.20 10 4.16 29.4
Singiroi Bomet 280,206 100 0 13 - 13. 10.80 2.18 16.8
Bahati Nakuru 17,005 56.9 43 12 14 12.90 8.80 4.06 31.6
Average 369,713 71.2 28.8 12 14.40 14.90 11.50 3.35 23.8
*% of average sales price Source: Field survey, 2002 Given the role co-operatives play in milk collection, the processors should aim at developing long term contractual arrangement based on mutual trust and understanding. This way the concerns of the societies as well as the long-term business interests of processors can be safeguarded. Furthermore, the industry regulator and the milk processor’s association should take more interest and device methods to minimise or eliminate contractual related problems. The co-operative milk pricing structure is mainly determined by transport and other overhead costs. Most co-operatives deducted an average of Ksh 2 per litre (about 15% of sales price) as milk collection and delivery costs. The same margin prevailed among the processors with ex-factory prices averaging Ksh 14 per litre as compared to Ksh 12 for milk collected by the processor. Between Ksh 1.50 to 2 (15% of sales price) was retained by the co-operatives to cater for their operational overheads. In total therefore co-operatives involved in milk collection and distribution had an average marketing margin of Ksh 3.40 equivalent to 24% of the average sales price. 6.2 Raw Milk Transport Raw milk transport is a critical service as it links production areas with processors, rural and urban markets. This service is highly dependent on the road infrastructure. A few co-operatives societies have their own means of transport in form of pick-ups, lorries and tractors. However, due to the reduced intake by most co-operatives most of the vehicles are under-utilised and in poor condition. The majority of the farmer groups do not have their own transport and therefore rely on hired transport. Indeed in most of the districts visited, the practice is for societies and groups to hire transport through formal agreements. The contract specifies charges per litre of milk. The same case applies to large-scale farms that do not own transport. Some transporters are contracted by the processors to deliver milk to their factories or cooling plants. In such cases the transport charges are deducted before payments are made. In most areas the transport cost was around Ksh 2 per litre.
The Dairy Industry in Kenya: The Post Liberalization Agenda
Working Paper No.1, 2003 20
With the increasing share of milk going to the informal market, the private transporters are ruling the roost in most producing areas. The private transporters have their agents who collect the milk for them at particular areas. After collection, milk is transported for sale in urban centres. Most transporters are vertically integrated, as they own milk outlets where they dispose the milk in wholesale and retail basis. Table 6 presents a summary of the budget and characteristics of the private milk transporters. Most private transporters operated one tonne pickups covering an average distance of 100km per day. The quantity of milk handled per month is around 40,500 litres (1,400lt per day) procured at an average price of Ksh12 and sold at Ksh 18 per litre. The transport cost per litre was Ksh 2 with the major cost components being labour, fuel and vehicle maintenance. Although the profit margin varied widely, a private transporter realised an average profit of Ksh 3 per litre (17% of consumer price). This translated to an average monthly income of Ksh130, 000. Given that most of the transporters main investment was a vehicle with an average price of Ksh 600,000, then the return to their investment was around 260%. This indicates that milk transport is very lucrative business that can be expected to attract more competition.
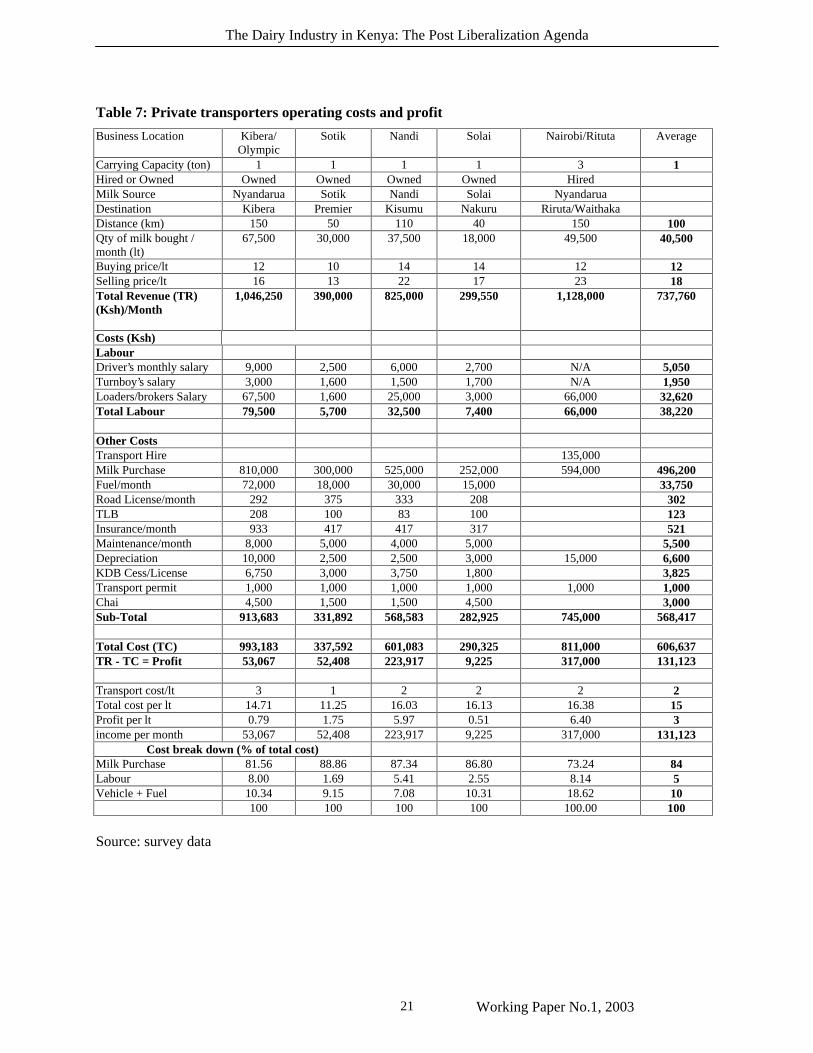
The Dairy Industry in Kenya: The Post Liberalization Agenda
Working Paper No.1, 2003 21
Table 7: Private transporters operating costs and profit
Business Location Kibera/ Olympic
Sotik Nandi Solai Nairobi/Rituta Average
Carrying Capacity (ton) 1 1 1 1 3 1 Hired or Owned Owned Owned Owned Owned Hired Milk Source Nyandarua Sotik Nandi Solai Nyandarua Destination Kibera Premier Kisumu Nakuru Riruta/Waithaka Distance (km) 150 50 110 40 150 100 Qty of milk bought / month (lt)
67,500 30,000 37,500 18,000 49,500 40,500
Buying price/lt 12 10 14 14 12 12 Selling price/lt 16 13 22 17 23 18 Total Revenue (TR) (Ksh)/Month
1,046,250 390,000 825,000 299,550 1,128,000 737,760
Costs (Ksh) Labour Driver’s monthly salary 9,000 2,500 6,000 2,700 N/A 5,050 Turnboy’s salary 3,000 1,600 1,500 1,700 N/A 1,950 Loaders/brokers Salary 67,500 1,600 25,000 3,000 66,000 32,620 Total Labour 79,500 5,700 32,500 7,400 66,000 38,220
Other Costs Transport Hire 135,000 Milk Purchase 810,000 300,000 525,000 252,000 594,000 496,200 Fuel/month 72,000 18,000 30,000 15,000 33,750 Road License/month 292 375 333 208 302 TLB 208 100 83 100 123 Insurance/month 933 417 417 317 521 Maintenance/month 8,000 5,000 4,000 5,000 5,500 Depreciation 10,000 2,500 2,500 3,000 15,000 6,600 KDB Cess/License 6,750 3,000 3,750 1,800 3,825 Transport permit 1,000 1,000 1,000 1,000 1,000 1,000 Chai 4,500 1,500 1,500 4,500 3,000 Sub-Total 913,683 331,892 568,583 282,925 745,000 568,417
Total Cost (TC) 993,183 337,592 601,083 290,325 811,000 606,637 TR - TC = Profit 53,067 52,408 223,917 9,225 317,000 131,123
Transport cost/lt 3 1 2 2 2 2 Total cost per lt 14.71 11.25 16.03 16.13 16.38 15 Profit per lt 0.79 1.75 5.97 0.51 6.40 3 income per month 53,067 52,408 223,917 9,225 317,000 131,123
Cost break down (% of total cost) Milk Purchase 81.56 88.86 87.34 86.80 73.24 84 Labour 8.00 1.69 5.41 2.55 8.14 5 Vehicle + Fuel 10.34 9.15 7.08 10.31 18.62 10
100 100 100 100 100.00 100 Source: survey data
The Dairy Industry in Kenya: The Post Liberalization Agenda
Working Paper No.1, 2003 22
6.3 Urban milk markets 6.3.1 The informal market As shown in section 3.2, over 80% of all milk marketed by smallholder farmers is channelled through the informal market. An equally large amount from large and medium farms also end up in the same channel. Most of the informal milk channels target urban centres where there is high demand. Convenient delivery and lower prices (reflecting lower processing and handling costs) are the principal benefits to the poor consumers (due to downturn in the economy). The key players in this informal market include many small-scale milk traders often referred to as hawkers. Farmers from both rural and peri-urban areas also hawk milk from their own farms. There is also a distinct category of milk vendors who operate as milk bars and cottages. The common feature of all these informal players is that they sell un-pasteurised milk that in most cases is not packaged. This fact has generated public concern on the likely public health risks posed by the informal milk market. It is however important to evaluate the trade-offs that the dairy industry in Kenya should settle for in terms of quality assurance on one hand and restrictions on genuine business opportunities on the other. Although the public health risks posed by un-pasteurised milk may be genuine, it is however important to note that most households in Kenya do boil milk prior to consumption (Omore et al, 2002). This greatly reduces the pathogen load in milk5. However, there are other market risks associated with adulteration, use of non-food plastic containers, handling of milk un- hygienically which may lead to the danger of exposure to communicable diseases. Furthermore, most informal milk traders incur heavy loses due to poor milk quality. For instance 70% of the milk bars owners visited during the course of this study indicated they loose an average of 40lt of milk per month despite using various quality assessment methods. 6. Among The visited milk bars, the following technologies were largely being used in testing the quality of milk 1. Organoleptic test - This method was the most common and simplest as it entailed developing a sense
of smell and sight for high quality milk. A skilled worker can detect adulteration or spoilage by sight and smell and use other tests simply to confirm.
2. Lactometer – The instrument was also widely used and claimed be quite an effective method of
determining possible adulteration of milk especially with water and in some cases with milk powder which was said to be rampant in some urban areas. The price of the lactometer ranged between Kshs 300 – Kshs 650 in the market.
3. Alcohol Clot Tests- This is particularly in use by the Yoghurt producing milk bars which in most
cases had somebody trained in milk handling. This reagent cost between Kshs 800 – Kshs 1000 for a 2½ liters of 72% alcohol and is enough to do almost 500 samples. Unlike co-operatives which use the more expensive and automated alcohol guns, milk bars used a simple but effective system. This test provides an indication of the bacterial load of the milk and the potential for spoilage.
4. Clot Boiling Method -In the absence of these other tests, most milk bars simply boil small samples
and observe whether it would cuddle.
5 Pasteurisation of milk gives the highest temperature required to kill all pathogens at 890 C for one second or 720C for 15 seconds. Boiling attains a higher temperature and duration thereby destroying all pathogens although this compromises milk flavour and the nutritive value of milk due to loss of soluble vitamins 6 Peter Fellows and Jane Hampton ( 1997) - Small Scale Food Processing – A guide to appropriate equipment - page 46
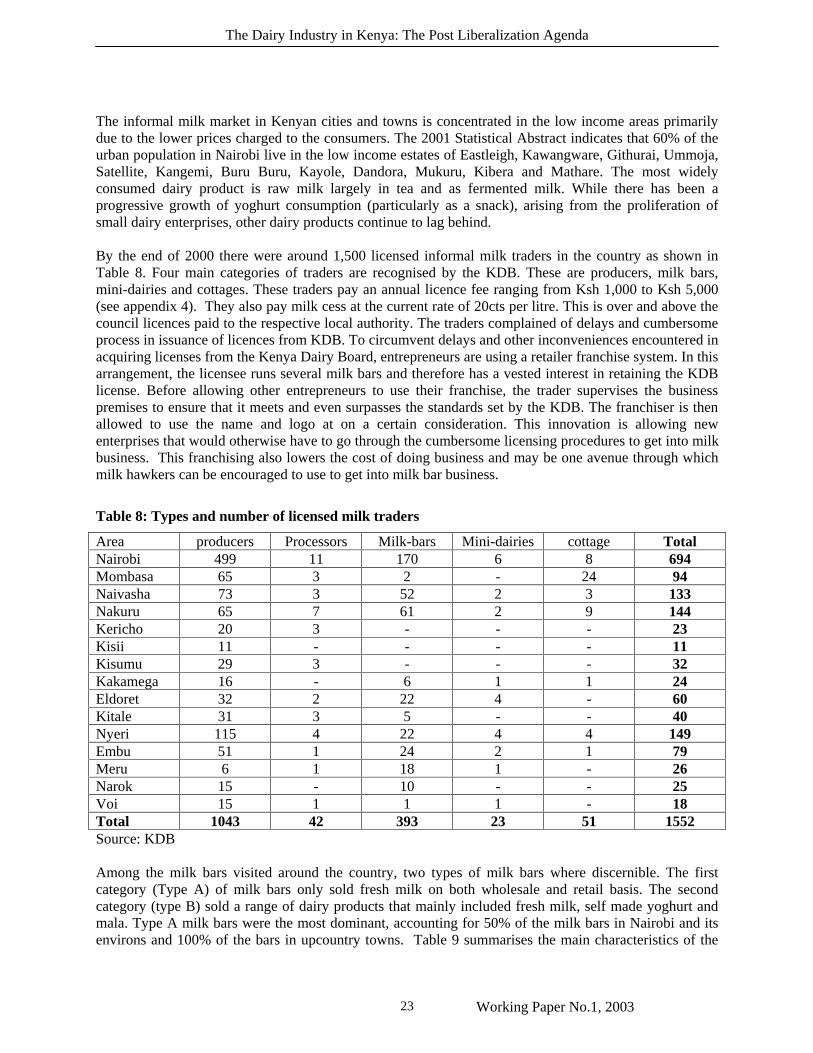
The Dairy Industry in Kenya: The Post Liberalization Agenda
Working Paper No.1, 2003 23
The informal milk market in Kenyan cities and towns is concentrated in the low income areas primarily due to the lower prices charged to the consumers. The 2001 Statistical Abstract indicates that 60% of the urban population in Nairobi live in the low income estates of Eastleigh, Kawangware, Githurai, Ummoja, Satellite, Kangemi, Buru Buru, Kayole, Dandora, Mukuru, Kibera and Mathare. The most widely consumed dairy product is raw milk largely in tea and as fermented milk. While there has been a progressive growth of yoghurt consumption (particularly as a snack), arising from the proliferation of small dairy enterprises, other dairy products continue to lag behind. By the end of 2000 there were around 1,500 licensed informal milk traders in the country as shown in Table 8. Four main categories of traders are recognised by the KDB. These are producers, milk bars, mini-dairies and cottages. These traders pay an annual licence fee ranging from Ksh 1,000 to Ksh 5,000 (see appendix 4). They also pay milk cess at the current rate of 20cts per litre. This is over and above the council licences paid to the respective local authority. The traders complained of delays and cumbersome process in issuance of licences from KDB. To circumvent delays and other inconveniences encountered in acquiring licenses from the Kenya Dairy Board, entrepreneurs are using a retailer franchise system. In this arrangement, the licensee runs several milk bars and therefore has a vested interest in retaining the KDB license. Before allowing other entrepreneurs to use their franchise, the trader supervises the business premises to ensure that it meets and even surpasses the standards set by the KDB. The franchiser is then allowed to use the name and logo at on a certain consideration. This innovation is allowing new enterprises that would otherwise have to go through the cumbersome licensing procedures to get into milk business. This franchising also lowers the cost of doing business and may be one avenue through which milk hawkers can be encouraged to use to get into milk bar business.
Table 8: Types and number of licensed milk traders
Area producers Processors Milk-bars Mini-dairies cottage Total Nairobi 499 11 170 6 8 694 Mombasa 65 3 2 - 24 94 Naivasha 73 3 52 2 3 133 Nakuru 65 7 61 2 9 144 Kericho 20 3 - - - 23 Kisii 11 - - - - 11 Kisumu 29 3 - - - 32 Kakamega 16 - 6 1 1 24 Eldoret 32 2 22 4 - 60 Kitale 31 3 5 - - 40 Nyeri 115 4 22 4 4 149 Embu 51 1 24 2 1 79 Meru 6 1 18 1 - 26 Narok 15 - 10 - - 25 Voi 15 1 1 1 - 18 Total 1043 42 393 23 51 1552 Source: KDB Among the milk bars visited around the country, two types of milk bars where discernible. The first category (Type A) of milk bars only sold fresh milk on both wholesale and retail basis. The second category (type B) sold a range of dairy products that mainly included fresh milk, self made yoghurt and mala. Type A milk bars were the most dominant, accounting for 50% of the milk bars in Nairobi and its environs and 100% of the bars in upcountry towns. Table 9 summarises the main characteristics of the
The Dairy Industry in Kenya: The Post Liberalization Agenda
Working Paper No.1, 2003 24
two types of milk bars. Type A milk bars in Nairobi handled an average of 260litres of milk daily of which 32% was wholesaled and rest sold on retail basis. The intake volumes were only 108litres per day in upcountry milk bars. The type B milk bar sold an average of 377 litres of milk daily of which 92 % was sold as fresh milk and rest converted into mala and yoghurt. The differences in intake and sales were reflected in the cost structure and margins. Type A milk bars in Nairobi had overhead costs amounting to Ksh 2.52 per litre as compared to Ksh 3.25 per litre for the up-country milk bars. The difference in cost was mainly attributed to the total quantity handled and the proportions sold on wholesale. The type B milk bar incurred Ksh 4.65 per litre as overhead and milk handling costs. Despite the high handling costs per litres, type B milk bar had the highest profit margin of about Ksh 6.20 per litre as compared to Ksh 3 per litre for type A milk bar in the same environment. This gives the indication that adoption of technologies that add value to raw milk can increase profits and returns to milk traders and should therefore be promoted. Furthermore this can be used as an avenue through which to promote informal dairy processing capacity. Depending on the profit levels, the monthly income for milk bar operators’ ranges from Ksh 23,300 to Ksh 70,000 per month in Nairobi and Ksh 10,300 in the upcountry. This is a good income level especially given the prevailing poverty levels in the country. Type B milk bars also have high investment levels averaging Ksh 343,000 as compared Ksh 240,000 and Ksh 162,00 for the type A milk bars in Nairobi and upcountry respectively. These are substantial investment levels that should be encouraged and protected as means of creating more employment and income. Thus the hostile policy environment under which most of these informal milk traders operate should change for the better. The traders should be viewed more of an asset rather than an impediment to the growth of the formal sector. Figure 4 summarises a growth model the dairy industry can adopt for the growth of the informal and formal sector. This growth vision is currently lacking in the dairy sub-sector policies and development initiatives. This remains the single most challenge to the future prosperity of the industry in Kenya. A number of policy and technological interventions need to be made for this growth model to become a reality as shown in the bottom part of Figure 4.
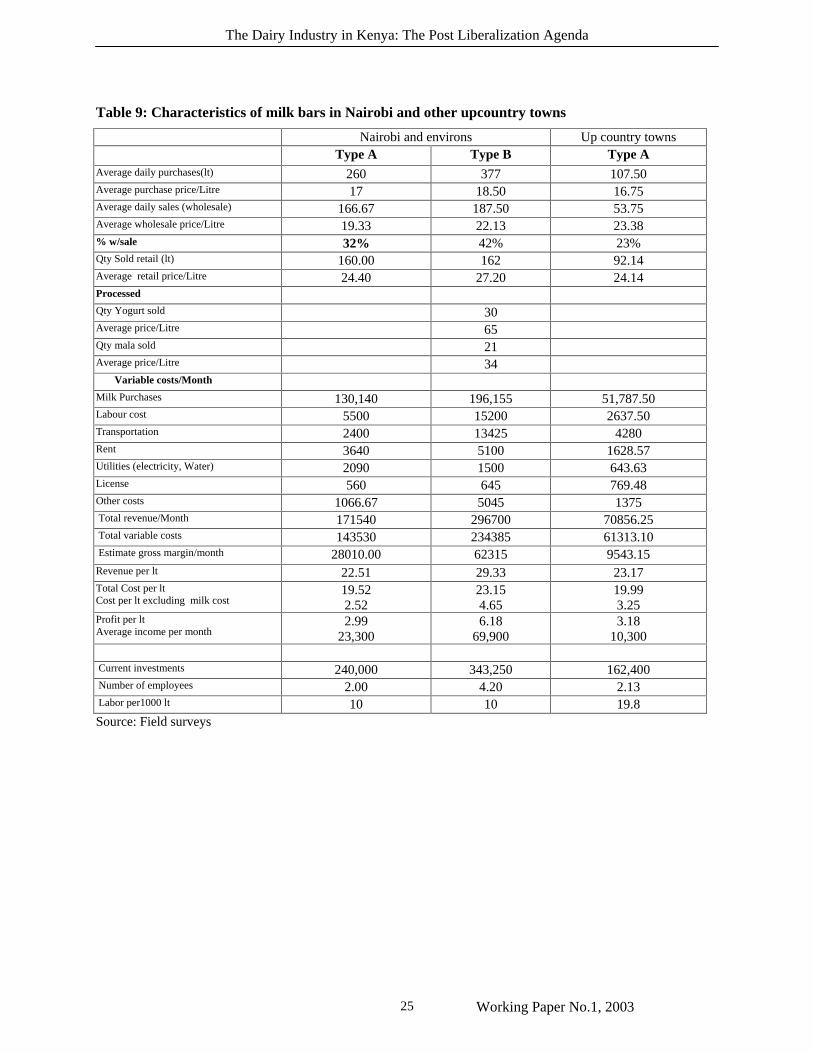
The Dairy Industry in Kenya: The Post Liberalization Agenda
Working Paper No.1, 2003 25
Table 9: Characteristics of milk bars in Nairobi and other upcountry towns
Nairobi and environs Up country towns Type A Type B Type A Average daily purchases(lt) 260 377 107.50 Average purchase price/Litre 17 18.50 16.75 Average daily sales (wholesale) 166.67 187.50 53.75 Average wholesale price/Litre 19.33 22.13 23.38 % w/sale 32% 42% 23% Qty Sold retail (lt) 160.00 162 92.14 Average retail price/Litre 24.40 27.20 24.14 Processed Qty Yogurt sold 30 Average price/Litre 65 Qty mala sold 21 Average price/Litre 34 Variable costs/Month Milk Purchases 130,140 196,155 51,787.50 Labour cost 5500 15200 2637.50 Transportation 2400 13425 4280 Rent 3640 5100 1628.57 Utilities (electricity, Water) 2090 1500 643.63 License 560 645 769.48 Other costs 1066.67 5045 1375 Total revenue/Month 171540 296700 70856.25 Total variable costs 143530 234385 61313.10 Estimate gross margin/month 28010.00 62315 9543.15 Revenue per lt 22.51 29.33 23.17 Total Cost per lt Cost per lt excluding milk cost
19.52 2.52
23.15 4.65
19.99 3.25
Profit per lt Average income per month
2.99 23,300
6.18 69,900
3.18 10,300
Current investments 240,000 343,250 162,400 Number of employees 2.00 4.20 2.13 Labor per1000 lt 10 10 19.8 Source: Field surveys
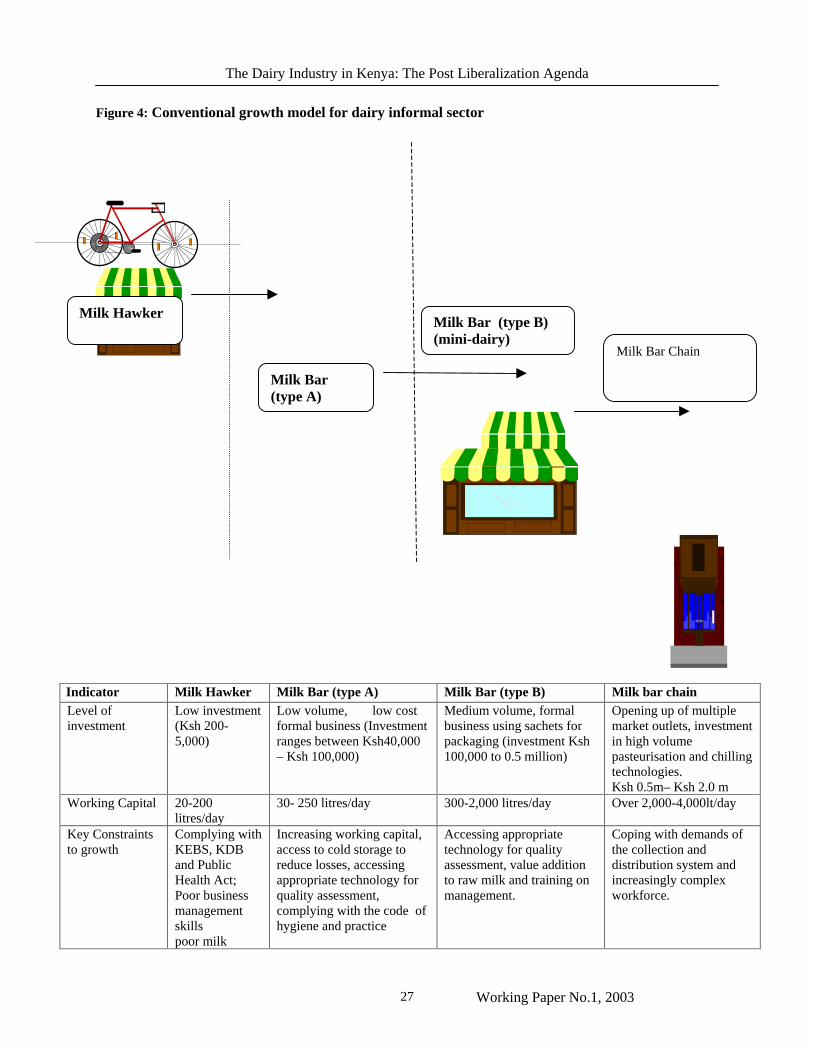
The Dairy Industry in Kenya: The Post Liberalization Agenda
Working Paper No.1, 2003 27
Figure 4: Conventional growth model for dairy informal sector
Indicator Milk Hawker Milk Bar (type A) Milk Bar (type B) Milk bar chain Level of investment
Low investment (Ksh 200-5,000)
Low volume, low cost formal business (Investment ranges between Ksh40,000 – Ksh 100,000)
Medium volume, formal business using sachets for packaging (investment Ksh 100,000 to 0.5 million)
Opening up of multiple market outlets, investment in high volume pasteurisation and chilling technologies. Ksh 0.5m– Ksh 2.0 m
Working Capital 20-200 litres/day
30- 250 litres/day 300-2,000 litres/day Over 2,000-4,000lt/day
Key Constraints to growth
Complying with KEBS, KDB and Public Health Act; Poor business management skills poor milk
Increasing working capital, access to cold storage to reduce losses, accessing appropriate technology for quality assessment, complying with the code of hygiene and practice
Accessing appropriate technology for quality assessment, value addition to raw milk and training on management.
Coping with demands of the collection and distribution system and increasingly complex workforce.
Milk Hawker
Milk Bar (type A)
Milk Bar (type B) (mini-dairy)
Milk Bar Chain
The Dairy Industry in Kenya: The Post Liberalization Agenda
Working Paper No.1, 2003 28
Indicator Milk Hawker Milk Bar (type A) Milk Bar (type B) Milk bar chain handling skills and high cost of packaging.
Training needs Milk handling and hygiene
Training on customer care, quality assessment methods and book keeping.
Training on customer care and quality assessment
Training on customer care labour relationships.
Main products Raw milk and Sour Milk
Raw Milk, Mala Raw milk, Yoghurt, Mala, Butter and Ghee
Pasteurised Milk, Yoghurt, Butter and Ghee
Technological Constraints
Highly labour intensive. Funds to increase working capital are the key constraint.
Cold storage and working capital
Equipment and skills to process various dairy products
Equipment and skills, appropriate and cheap packaging technology
Synergy
Can be integrated with the formal marketing system by being outlets of bulk pasteurised milk
6.3.2 Processed milk market Milk market liberalisation policies announced in 1992 opened up the processed milk market, which hitherto was monopolised by KCC. The objective of the reform was to (1) encourage private investments (including co-operatives) in milk processing and marketing and (2) deregulation of both producer and consumer prices. The underlying argument was that enhanced competition would improve efficiency in milk procurement, processing and distribution, which in turn would result into regular and more remunerative prices to the farmers. It was also hoped that the efficiency gains would translate into higher quality milk products and lower consumer prices. It is now ten years since the introduction of these reforms and it is good time to take stock on what has been achieved during that period. Market structure Since 1992, a total of 42 milk processors have been licensed by KDB. In 1999, 34 of these processors were operational with the rest having closed down. Data from KDB indicate that by the end of 2001, only 22 of the processors were in operation. Some of the processors have completely exited from the milk business due to severe competition while others such as Ilara dairy has been taken over. These trends indicate that, the milk processing market is tending towards consolidation. As indicated elsewhere in this paper this consolidation is not only expected but also welcome for the milk processing industry to enjoy economies of scale and size. Before milk market liberalisation in 1992, processed milk had risen to an annual average of 350 million litres (Figure 5). In spite of the entry of other milk processors (in addition to KCC, Kitinda and Meru dairies), the throughput of processed milk has continued to decline to the extent that by 2001, only 152 million litres was processed (see Figure 5). This represents a decline of over 58% as compared to the 1993 figure. The installed processing capacity in the country is estimated at 680 million litres per year (2.2 million per day), but only 22% is currently being utilised. Nevertheless, it is important to note that 55% of the installed capacity is with KCC plants which are utilising only 10% of their capacity.
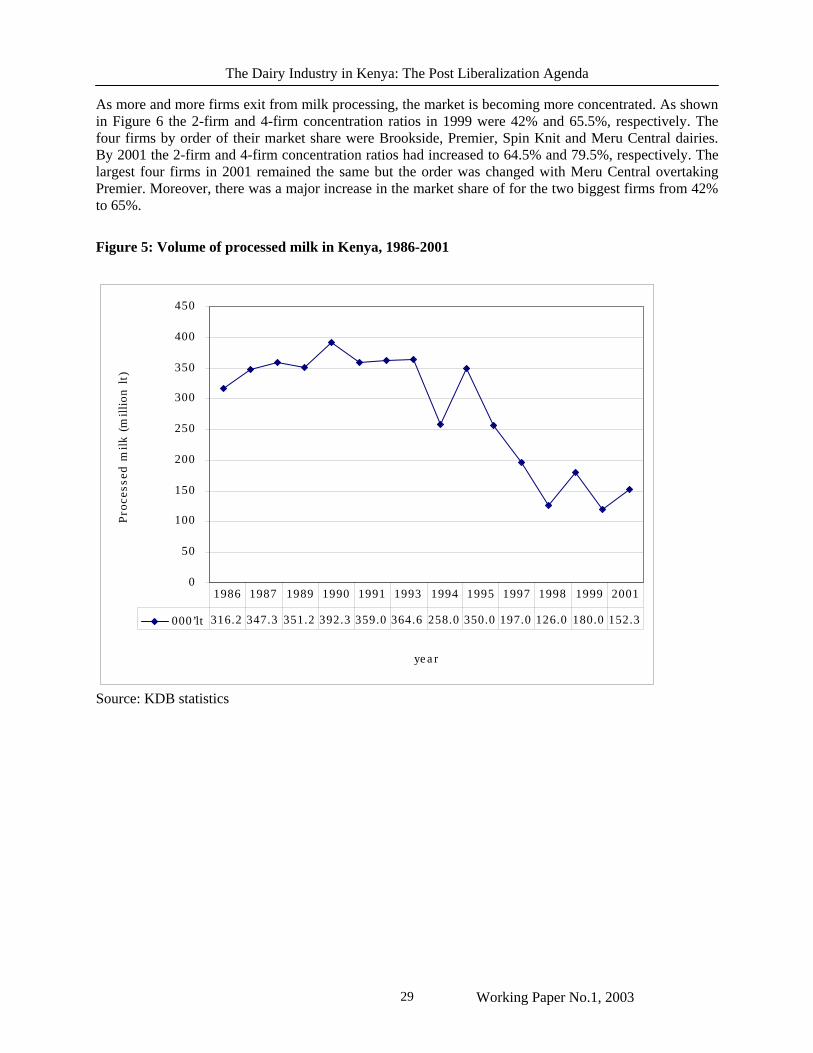
The Dairy Industry in Kenya: The Post Liberalization Agenda
Working Paper No.1, 2003 29
As more and more firms exit from milk processing, the market is becoming more concentrated. As shown in Figure 6 the 2-firm and 4-firm concentration ratios in 1999 were 42% and 65.5%, respectively. The four firms by order of their market share were Brookside, Premier, Spin Knit and Meru Central dairies. By 2001 the 2-firm and 4-firm concentration ratios had increased to 64.5% and 79.5%, respectively. The largest four firms in 2001 remained the same but the order was changed with Meru Central overtaking Premier. Moreover, there was a major increase in the market share of for the two biggest firms from 42% to 65%.
Figure 5: Volume of processed milk in Kenya, 1986-2001
Source: KDB statistics
0
50
100
150
200
250
300
350
400
450
year
Pro
cess
ed m
ilk (m
illion
lt)
000’lt 316.2 347.3 351.2 392.3 359.0 364.6 258.0 350.0 197.0 126.0 180.0 152.3
1986 1987 1989 1990 1991 1993 1994 1995 1997 1998 1999 2001
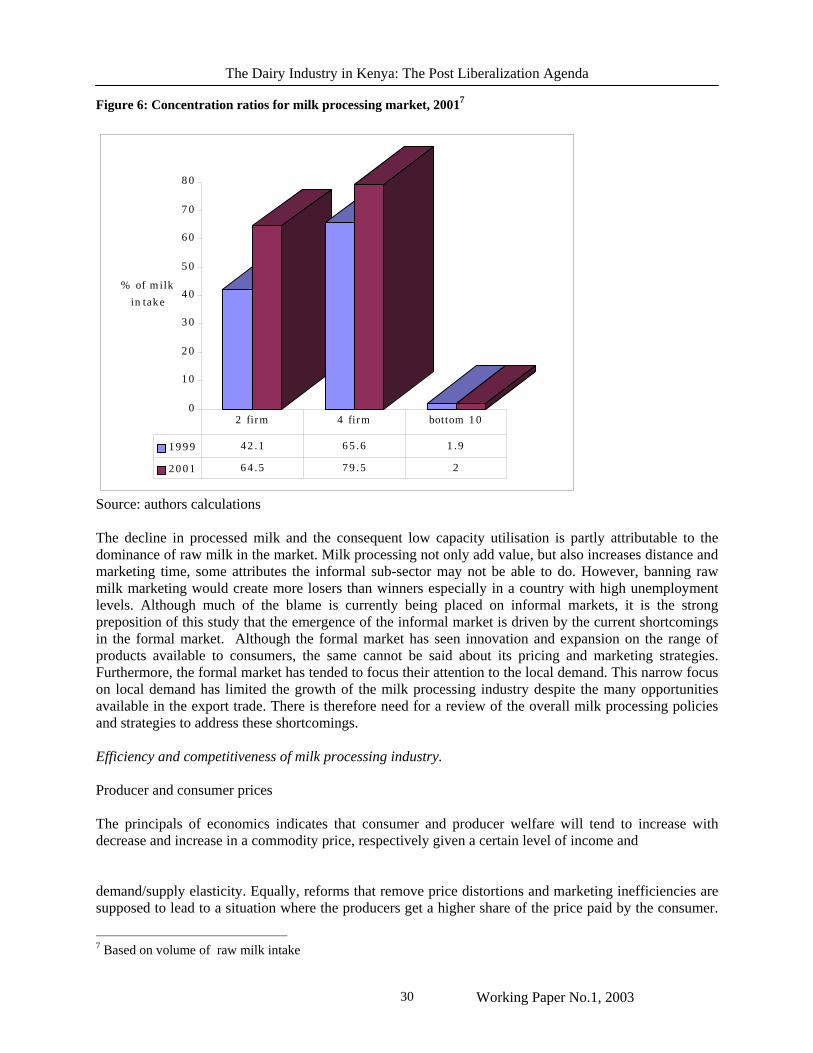
The Dairy Industry in Kenya: The Post Liberalization Agenda
Working Paper No.1, 2003 30
Figure 6: Concentration ratios for milk processing market, 20017
Source: authors calculations The decline in processed milk and the consequent low capacity utilisation is partly attributable to the dominance of raw milk in the market. Milk processing not only add value, but also increases distance and marketing time, some attributes the informal sub-sector may not be able to do. However, banning raw milk marketing would create more losers than winners especially in a country with high unemployment levels. Although much of the blame is currently being placed on informal markets, it is the strong preposition of this study that the emergence of the informal market is driven by the current shortcomings in the formal market. Although the formal market has seen innovation and expansion on the range of products available to consumers, the same cannot be said about its pricing and marketing strategies. Furthermore, the formal market has tended to focus their attention to the local demand. This narrow focus on local demand has limited the growth of the milk processing industry despite the many opportunities available in the export trade. There is therefore need for a review of the overall milk processing policies and strategies to address these shortcomings. Efficiency and competitiveness of milk processing industry. Producer and consumer prices The principals of economics indicates that consumer and producer welfare will tend to increase with decrease and increase in a commodity price, respectively given a certain level of income and demand/supply elasticity. Equally, reforms that remove price distortions and marketing inefficiencies are supposed to lead to a situation where the producers get a higher share of the price paid by the consumer.
7 Based on volume of raw milk intake
0
10
20
30
40
50
60
70
80
% of milk
intake
1999 42.1 65.6 1.9
2001 64.5 79.5 2
2 firm 4 firm bottom 10
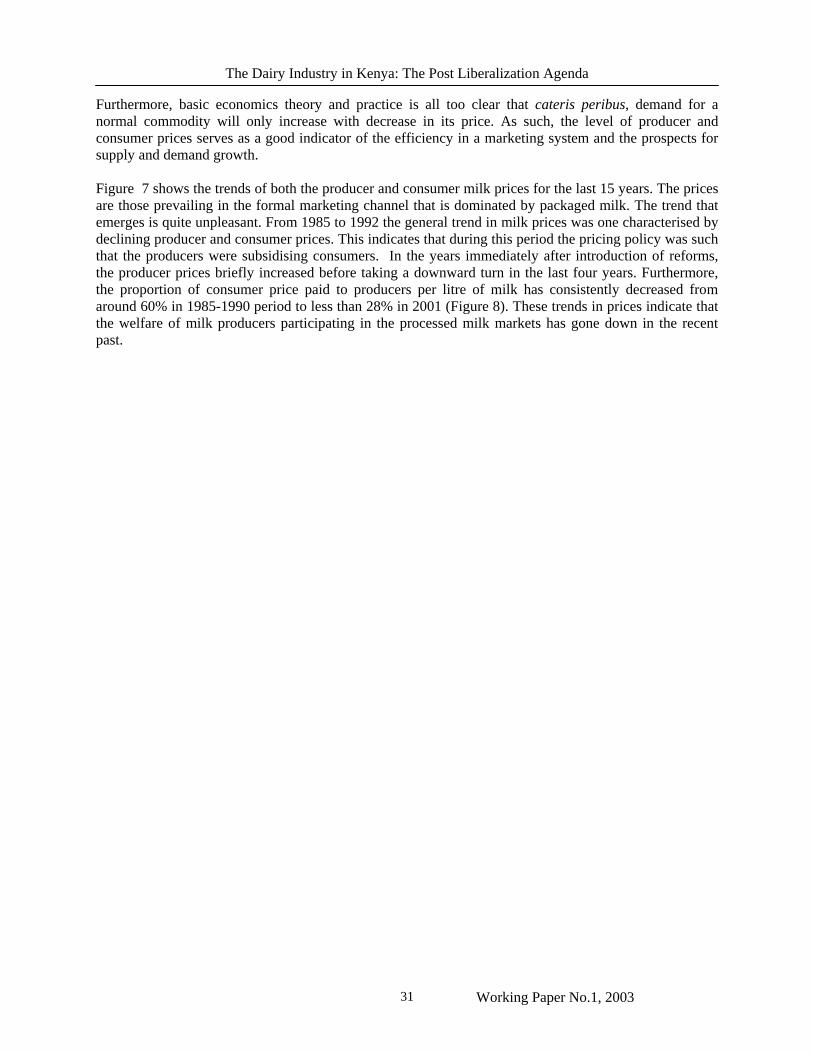
The Dairy Industry in Kenya: The Post Liberalization Agenda
Working Paper No.1, 2003 31
Furthermore, basic economics theory and practice is all too clear that cateris peribus, demand for a normal commodity will only increase with decrease in its price. As such, the level of producer and consumer prices serves as a good indicator of the efficiency in a marketing system and the prospects for supply and demand growth. Figure 7 shows the trends of both the producer and consumer milk prices for the last 15 years. The prices are those prevailing in the formal marketing channel that is dominated by packaged milk. The trend that emerges is quite unpleasant. From 1985 to 1992 the general trend in milk prices was one characterised by declining producer and consumer prices. This indicates that during this period the pricing policy was such that the producers were subsidising consumers. In the years immediately after introduction of reforms, the producer prices briefly increased before taking a downward turn in the last four years. Furthermore, the proportion of consumer price paid to producers per litre of milk has consistently decreased from around 60% in 1985-1990 period to less than 28% in 2001 (Figure 8). These trends in prices indicate that the welfare of milk producers participating in the processed milk markets has gone down in the recent past.
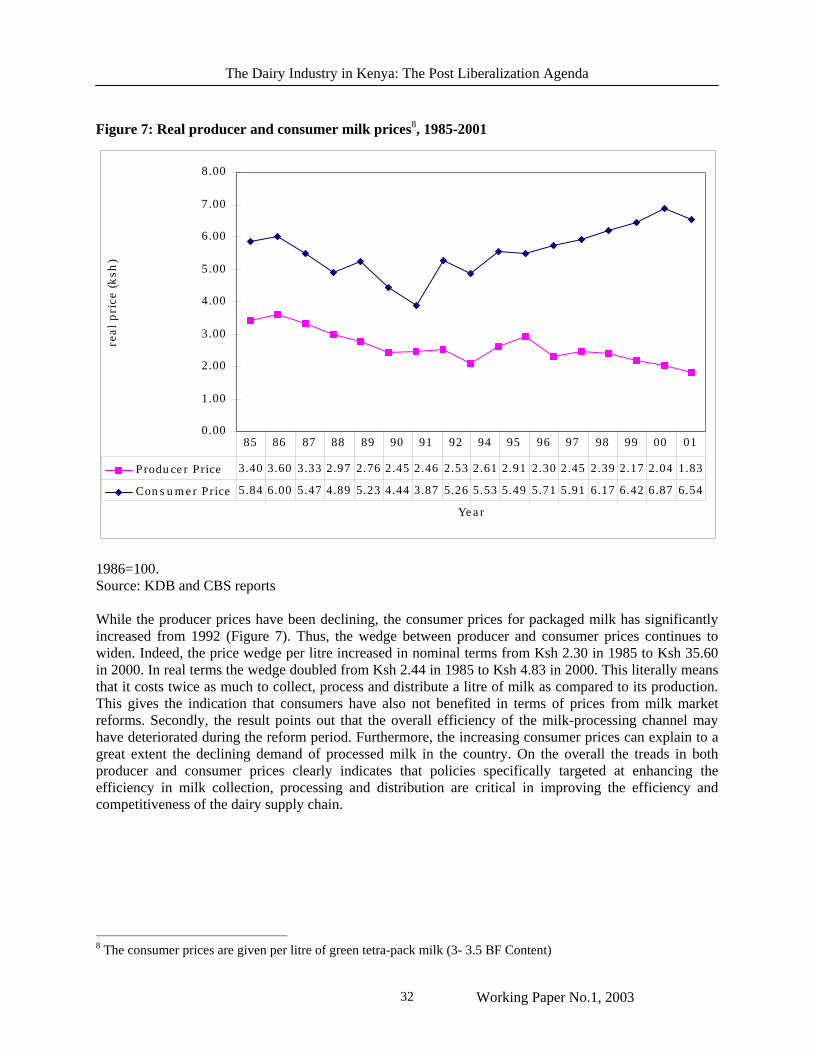
The Dairy Industry in Kenya: The Post Liberalization Agenda
Working Paper No.1, 2003 32
Figure 7: Real producer and consumer milk prices8, 1985-2001
1986=100. Source: KDB and CBS reports While the producer prices have been declining, the consumer prices for packaged milk has significantly increased from 1992 (Figure 7). Thus, the wedge between producer and consumer prices continues to widen. Indeed, the price wedge per litre increased in nominal terms from Ksh 2.30 in 1985 to Ksh 35.60 in 2000. In real terms the wedge doubled from Ksh 2.44 in 1985 to Ksh 4.83 in 2000. This literally means that it costs twice as much to collect, process and distribute a litre of milk as compared to its production. This gives the indication that consumers have also not benefited in terms of prices from milk market reforms. Secondly, the result points out that the overall efficiency of the milk-processing channel may have deteriorated during the reform period. Furthermore, the increasing consumer prices can explain to a great extent the declining demand of processed milk in the country. On the overall the treads in both producer and consumer prices clearly indicates that policies specifically targeted at enhancing the efficiency in milk collection, processing and distribution are critical in improving the efficiency and competitiveness of the dairy supply chain.
8 The consumer prices are given per litre of green tetra-pack milk (3- 3.5 BF Content)
0.00
1.00
2.00
3.00
4.00
5.00
6.00
7.00
8.00
Year
real pri
ce (ksh
)
Producer Price 3.40 3.60 3.33 2.97 2.76 2.45 2.46 2.53 2.61 2.91 2.30 2.45 2.39 2.17 2.04 1.83
Consumer Price 5.84 6.00 5.47 4.89 5.23 4.44 3.87 5.26 5.53 5.49 5.71 5.91 6.17 6.42 6.87 6.54
85 86 87 88 89 90 91 92 94 95 96 97 98 99 00 01
The Dairy Industry in Kenya: The Post Liberalization Agenda
Working Paper No.1, 2003 33
Figure 8: Producer share of packaged milk consumer price
Although reliable information on the cost of milk collection, processing and distribution is not readily available, there is cause to believe that the main cost centre is in milk processing. Data collected during the course of this study indicates that milk processor or their contracted milk transporter charge an average of Ksh 2 per litre as transport cost. This is also the cost incurred per litre by transporters in the informal sector as shown in section 5.2. Brokers who come in between farmers and the transporters add another Ksh 1 per litre. This was found to be the case for major milk producing areas such as Nyandarua, Nyeri and districts in the Rift Valley. Thus, the total milk procurement and transport costs average Ksh 3 per litre. This is as compared to 1993/94, when the cost of milk transport per litre was estimated at Ksh 2.16 (Ngigi 1995). Most milk processing plants are located in urban centres as a strategy to minimise their milk distribution costs. As such the milk distribution costs are normally expected to be lower than collection costs. The distributor margin was therefore estimated at Ksh1.50 per litre for distributors in Nairobi and its environs. This distributor margin represents 3% of consumer price. The distributors supply milk to Kiosks, shops, supermarkets and other outlets. From the survey done in Nairobi and its environs it apparent that there was minimal price competition for processed milk across the various retail outlets. Most of the kiosks and shops bought a packet of milk at Ksh 23 (Ksh 46/litre) and retailed the same for Ksh 25 (Ksh 50/litre), indicating a retail margin of Ksh4 per litre. The nine supermarkets visited in Nairobi and its environs had a wide range of dairy products both local and imported (Table 10). The price for the ordinary tetra-pack of milk was Ksh 50/litre, the same as in
0.00
10.00
20.00
30.00
40.00
50.00
60.00
70.00
85 86 87 88 89 90 91 92 93 94 95 96 97 98 99 00 01
Year
Pro
duce
r sh
are
(%)
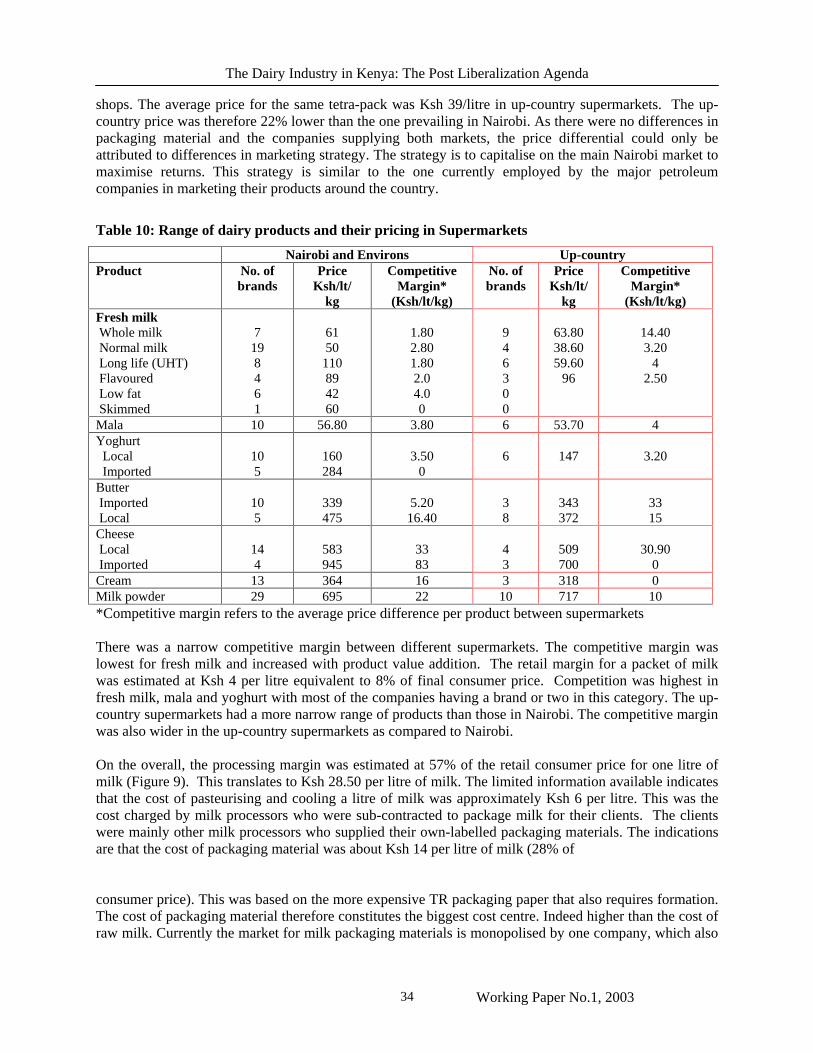
The Dairy Industry in Kenya: The Post Liberalization Agenda
Working Paper No.1, 2003 34
shops. The average price for the same tetra-pack was Ksh 39/litre in up-country supermarkets. The up-country price was therefore 22% lower than the one prevailing in Nairobi. As there were no differences in packaging material and the companies supplying both markets, the price differential could only be attributed to differences in marketing strategy. The strategy is to capitalise on the main Nairobi market to maximise returns. This strategy is similar to the one currently employed by the major petroleum companies in marketing their products around the country.
Table 10: Range of dairy products and their pricing in Supermarkets
Nairobi and Environs Up-country Product No. of
brands Price
Ksh/lt/ kg
Competitive Margin*
(Ksh/lt/kg)
No. of brands
Price Ksh/lt/
kg
Competitive Margin*
(Ksh/lt/kg) Fresh milk Whole milk Normal milk Long life (UHT) Flavoured Low fat Skimmed
7
19 8 4 6 1
61 50 110 89 42 60
1.80 2.80 1.80 2.0 4.0 0
9 4 6 3 0 0
63.80 38.60 59.60
96
14.40 3.20
4 2.50
Mala 10 56.80 3.80 6 53.70 4 Yoghurt Local Imported
10 5
160 284
3.50
0
6
147
3.20
Butter Imported Local
10 5
339 475
5.20
16.40
3 8
343 372
33 15
Cheese Local Imported
14 4
583 945
33 83
4 3
509 700
30.90
0 Cream 13 364 16 3 318 0 Milk powder 29 695 22 10 717 10 *Competitive margin refers to the average price difference per product between supermarkets There was a narrow competitive margin between different supermarkets. The competitive margin was lowest for fresh milk and increased with product value addition. The retail margin for a packet of milk was estimated at Ksh 4 per litre equivalent to 8% of final consumer price. Competition was highest in fresh milk, mala and yoghurt with most of the companies having a brand or two in this category. The up-country supermarkets had a more narrow range of products than those in Nairobi. The competitive margin was also wider in the up-country supermarkets as compared to Nairobi. On the overall, the processing margin was estimated at 57% of the retail consumer price for one litre of milk (Figure 9). This translates to Ksh 28.50 per litre of milk. The limited information available indicates that the cost of pasteurising and cooling a litre of milk was approximately Ksh 6 per litre. This was the cost charged by milk processors who were sub-contracted to package milk for their clients. The clients were mainly other milk processors who supplied their own-labelled packaging materials. The indications are that the cost of packaging material was about Ksh 14 per litre of milk (28% of consumer price). This was based on the more expensive TR packaging paper that also requires formation. The cost of packaging material therefore constitutes the biggest cost centre. Indeed higher than the cost of raw milk. Currently the market for milk packaging materials is monopolised by one company, which also
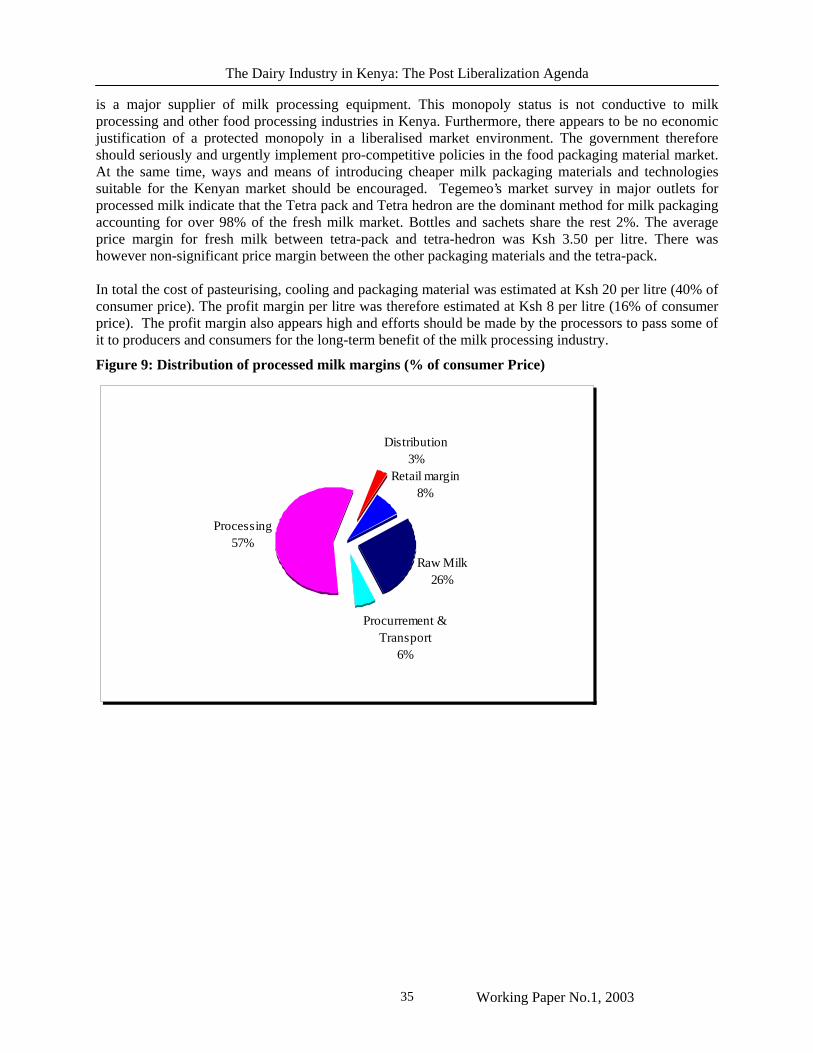
The Dairy Industry in Kenya: The Post Liberalization Agenda
Working Paper No.1, 2003 35
is a major supplier of milk processing equipment. This monopoly status is not conductive to milk processing and other food processing industries in Kenya. Furthermore, there appears to be no economic justification of a protected monopoly in a liberalised market environment. The government therefore should seriously and urgently implement pro-competitive policies in the food packaging material market. At the same time, ways and means of introducing cheaper milk packaging materials and technologies suitable for the Kenyan market should be encouraged. Tegemeo’s market survey in major outlets for processed milk indicate that the Tetra pack and Tetra hedron are the dominant method for milk packaging accounting for over 98% of the fresh milk market. Bottles and sachets share the rest 2%. The average price margin for fresh milk between tetra-pack and tetra-hedron was Ksh 3.50 per litre. There was however non-significant price margin between the other packaging materials and the tetra-pack. In total the cost of pasteurising, cooling and packaging material was estimated at Ksh 20 per litre (40% of consumer price). The profit margin per litre was therefore estimated at Ksh 8 per litre (16% of consumer price). The profit margin also appears high and efforts should be made by the processors to pass some of it to producers and consumers for the long-term benefit of the milk processing industry.
Figure 9: Distribution of processed milk margins (% of consumer Price)
Raw Milk26%
Procurrement & Transport
6%
Processing57%
Distribution3%
Retail margin8%
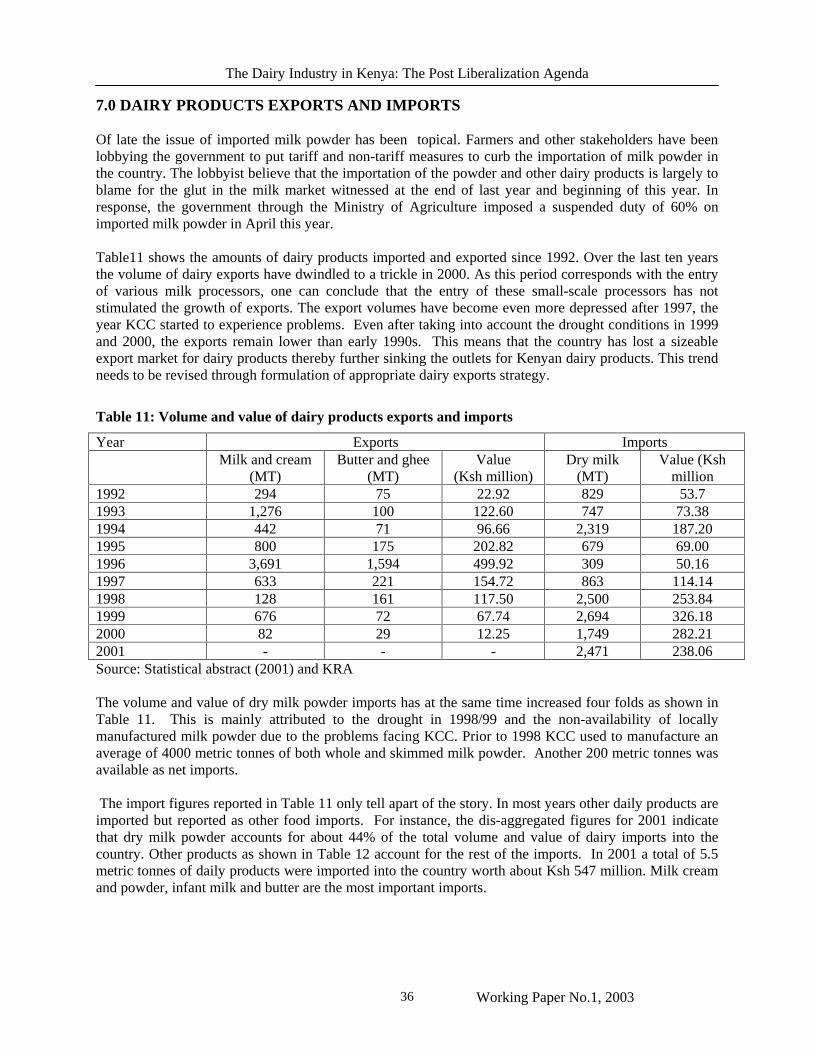
The Dairy Industry in Kenya: The Post Liberalization Agenda
Working Paper No.1, 2003 36
7.0 DAIRY PRODUCTS EXPORTS AND IMPORTS Of late the issue of imported milk powder has been topical. Farmers and other stakeholders have been lobbying the government to put tariff and non-tariff measures to curb the importation of milk powder in the country. The lobbyist believe that the importation of the powder and other dairy products is largely to blame for the glut in the milk market witnessed at the end of last year and beginning of this year. In response, the government through the Ministry of Agriculture imposed a suspended duty of 60% on imported milk powder in April this year. Table11 shows the amounts of dairy products imported and exported since 1992. Over the last ten years the volume of dairy exports have dwindled to a trickle in 2000. As this period corresponds with the entry of various milk processors, one can conclude that the entry of these small-scale processors has not stimulated the growth of exports. The export volumes have become even more depressed after 1997, the year KCC started to experience problems. Even after taking into account the drought conditions in 1999 and 2000, the exports remain lower than early 1990s. This means that the country has lost a sizeable export market for dairy products thereby further sinking the outlets for Kenyan dairy products. This trend needs to be revised through formulation of appropriate dairy exports strategy.
Table 11: Volume and value of dairy products exports and imports
Year Exports Imports Milk and cream
(MT) Butter and ghee
(MT) Value
(Ksh million) Dry milk
(MT) Value (Ksh
million 1992 294 75 22.92 829 53.7 1993 1,276 100 122.60 747 73.38 1994 442 71 96.66 2,319 187.20 1995 800 175 202.82 679 69.00 1996 3,691 1,594 499.92 309 50.16 1997 633 221 154.72 863 114.14 1998 128 161 117.50 2,500 253.84 1999 676 72 67.74 2,694 326.18 2000 82 29 12.25 1,749 282.21 2001 - - - 2,471 238.06 Source: Statistical abstract (2001) and KRA The volume and value of dry milk powder imports has at the same time increased four folds as shown in Table 11. This is mainly attributed to the drought in 1998/99 and the non-availability of locally manufactured milk powder due to the problems facing KCC. Prior to 1998 KCC used to manufacture an average of 4000 metric tonnes of both whole and skimmed milk powder. Another 200 metric tonnes was available as net imports. The import figures reported in Table 11 only tell apart of the story. In most years other daily products are imported but reported as other food imports. For instance, the dis-aggregated figures for 2001 indicate that dry milk powder accounts for about 44% of the total volume and value of dairy imports into the country. Other products as shown in Table 12 account for the rest of the imports. In 2001 a total of 5.5 metric tonnes of daily products were imported into the country worth about Ksh 547 million. Milk cream and powder, infant milk and butter are the most important imports.
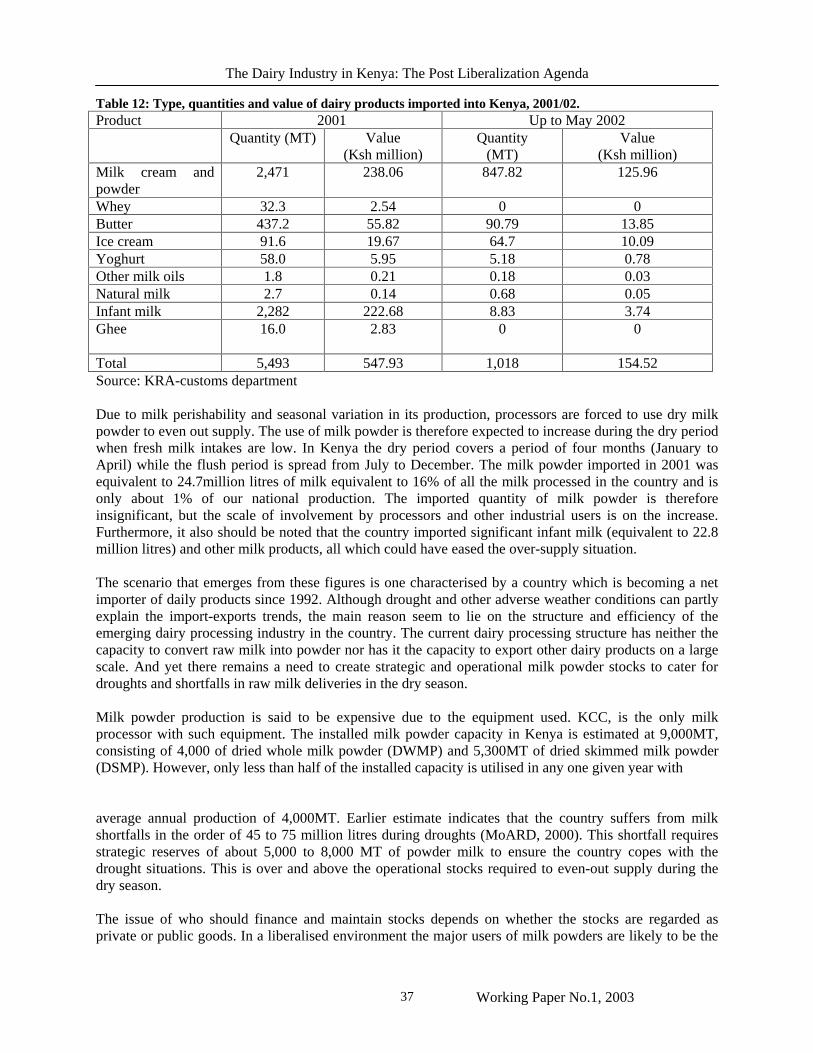
The Dairy Industry in Kenya: The Post Liberalization Agenda
Working Paper No.1, 2003 37
Table 12: Type, quantities and value of dairy products imported into Kenya, 2001/02. Product 2001 Up to May 2002 Quantity (MT) Value
(Ksh million) Quantity
(MT) Value
(Ksh million) Milk cream and powder
2,471 238.06 847.82 125.96
Whey 32.3 2.54 0 0 Butter 437.2 55.82 90.79 13.85 Ice cream 91.6 19.67 64.7 10.09 Yoghurt 58.0 5.95 5.18 0.78 Other milk oils 1.8 0.21 0.18 0.03 Natural milk 2.7 0.14 0.68 0.05 Infant milk 2,282 222.68 8.83 3.74 Ghee 16.0 2.83 0 0
Total 5,493 547.93 1,018 154.52 Source: KRA-customs department Due to milk perishability and seasonal variation in its production, processors are forced to use dry milk powder to even out supply. The use of milk powder is therefore expected to increase during the dry period when fresh milk intakes are low. In Kenya the dry period covers a period of four months (January to April) while the flush period is spread from July to December. The milk powder imported in 2001 was equivalent to 24.7million litres of milk equivalent to 16% of all the milk processed in the country and is only about 1% of our national production. The imported quantity of milk powder is therefore insignificant, but the scale of involvement by processors and other industrial users is on the increase. Furthermore, it also should be noted that the country imported significant infant milk (equivalent to 22.8 million litres) and other milk products, all which could have eased the over-supply situation. The scenario that emerges from these figures is one characterised by a country which is becoming a net importer of daily products since 1992. Although drought and other adverse weather conditions can partly explain the import-exports trends, the main reason seem to lie on the structure and efficiency of the emerging dairy processing industry in the country. The current dairy processing structure has neither the capacity to convert raw milk into powder nor has it the capacity to export other dairy products on a large scale. And yet there remains a need to create strategic and operational milk powder stocks to cater for droughts and shortfalls in raw milk deliveries in the dry season. Milk powder production is said to be expensive due to the equipment used. KCC, is the only milk processor with such equipment. The installed milk powder capacity in Kenya is estimated at 9,000MT, consisting of 4,000 of dried whole milk powder (DWMP) and 5,300MT of dried skimmed milk powder (DSMP). However, only less than half of the installed capacity is utilised in any one given year with average annual production of 4,000MT. Earlier estimate indicates that the country suffers from milk shortfalls in the order of 45 to 75 million litres during droughts (MoARD, 2000). This shortfall requires strategic reserves of about 5,000 to 8,000 MT of powder milk to ensure the country copes with the drought situations. This is over and above the operational stocks required to even-out supply during the dry season. The issue of who should finance and maintain stocks depends on whether the stocks are regarded as private or public goods. In a liberalised environment the major users of milk powders are likely to be the
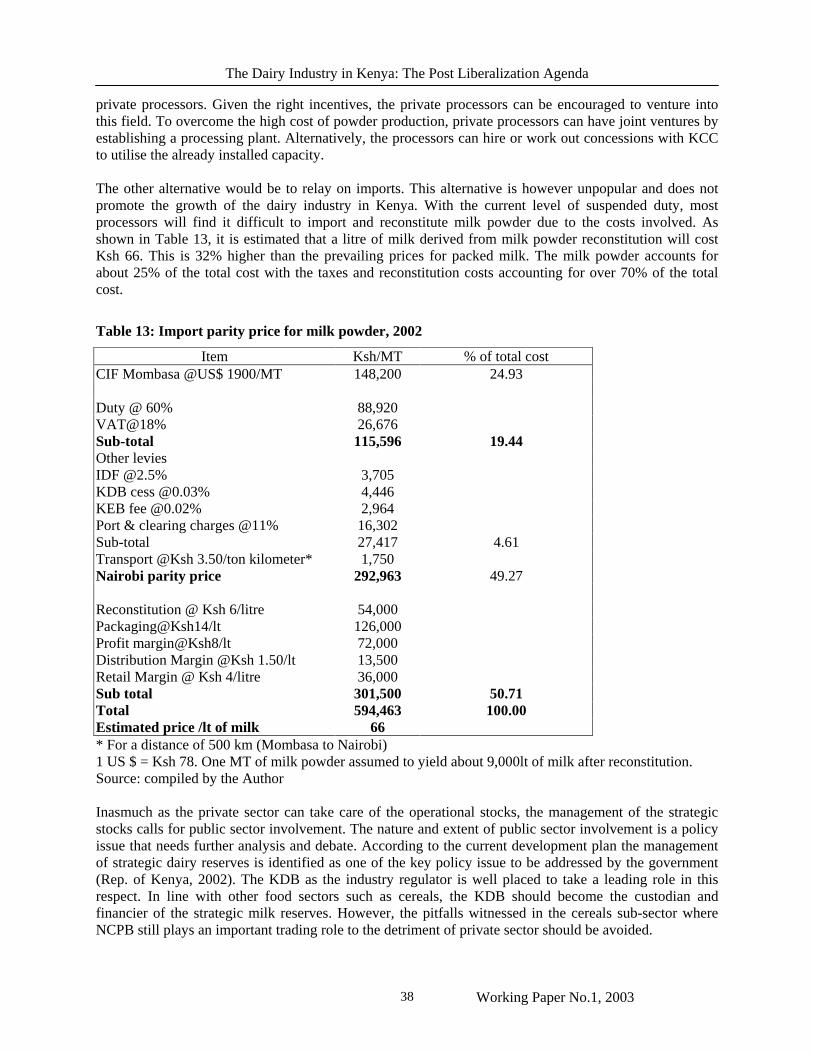
The Dairy Industry in Kenya: The Post Liberalization Agenda
Working Paper No.1, 2003 38
private processors. Given the right incentives, the private processors can be encouraged to venture into this field. To overcome the high cost of powder production, private processors can have joint ventures by establishing a processing plant. Alternatively, the processors can hire or work out concessions with KCC to utilise the already installed capacity. The other alternative would be to relay on imports. This alternative is however unpopular and does not promote the growth of the dairy industry in Kenya. With the current level of suspended duty, most processors will find it difficult to import and reconstitute milk powder due to the costs involved. As shown in Table 13, it is estimated that a litre of milk derived from milk powder reconstitution will cost Ksh 66. This is 32% higher than the prevailing prices for packed milk. The milk powder accounts for about 25% of the total cost with the taxes and reconstitution costs accounting for over 70% of the total cost.
Table 13: Import parity price for milk powder, 2002
Item Ksh/MT % of total cost CIF Mombasa @US$ 1900/MT 148,200 24.93
Duty @ 60% 88,920 VAT@18% 26,676 Sub-total 115,596 19.44 Other levies IDF @2.5% 3,705 KDB cess @0.03% 4,446 KEB fee @0.02% 2,964 Port & clearing charges @11% 16,302 Sub-total 27,417 4.61 Transport @Ksh 3.50/ton kilometer* 1,750 Nairobi parity price 292,963 49.27
Reconstitution @ Ksh 6/litre 54,000 Packaging@Ksh14/lt 126,000 Profit margin@Ksh8/lt 72,000 Distribution Margin @Ksh 1.50/lt 13,500 Retail Margin @ Ksh 4/litre 36,000 Sub total 301,500 50.71 Total 594,463 100.00 Estimated price /lt of milk 66 * For a distance of 500 km (Mombasa to Nairobi) 1 US $ = Ksh 78. One MT of milk powder assumed to yield about 9,000lt of milk after reconstitution. Source: compiled by the Author Inasmuch as the private sector can take care of the operational stocks, the management of the strategic stocks calls for public sector involvement. The nature and extent of public sector involvement is a policy issue that needs further analysis and debate. According to the current development plan the management of strategic dairy reserves is identified as one of the key policy issue to be addressed by the government (Rep. of Kenya, 2002). The KDB as the industry regulator is well placed to take a leading role in this respect. In line with other food sectors such as cereals, the KDB should become the custodian and financier of the strategic milk reserves. However, the pitfalls witnessed in the cereals sub-sector where NCPB still plays an important trading role to the detriment of private sector should be avoided.
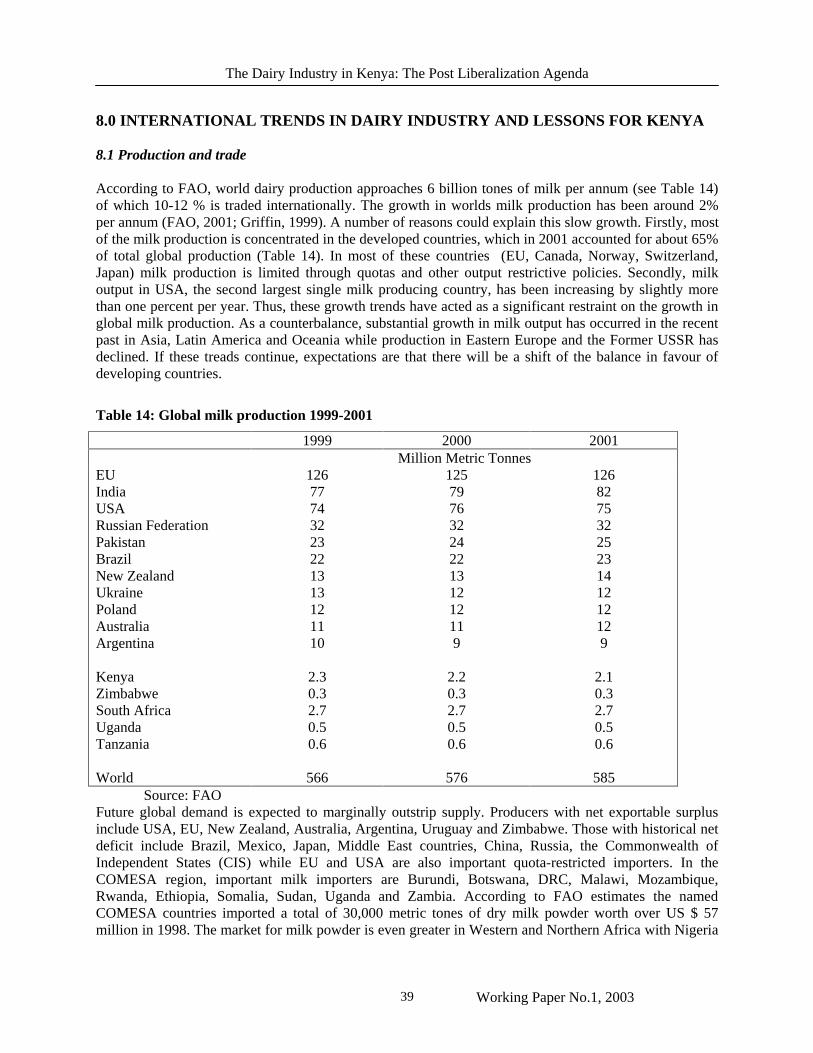
The Dairy Industry in Kenya: The Post Liberalization Agenda
Working Paper No.1, 2003 39
8.0 INTERNATIONAL TRENDS IN DAIRY INDUSTRY AND LESSONS FOR KENYA
8.1 Production and trade
According to FAO, world dairy production approaches 6 billion tones of milk per annum (see Table 14) of which 10-12 % is traded internationally. The growth in worlds milk production has been around 2% per annum (FAO, 2001; Griffin, 1999). A number of reasons could explain this slow growth. Firstly, most of the milk production is concentrated in the developed countries, which in 2001 accounted for about 65% of total global production (Table 14). In most of these countries (EU, Canada, Norway, Switzerland, Japan) milk production is limited through quotas and other output restrictive policies. Secondly, milk output in USA, the second largest single milk producing country, has been increasing by slightly more than one percent per year. Thus, these growth trends have acted as a significant restraint on the growth in global milk production. As a counterbalance, substantial growth in milk output has occurred in the recent past in Asia, Latin America and Oceania while production in Eastern Europe and the Former USSR has declined. If these treads continue, expectations are that there will be a shift of the balance in favour of developing countries.
Table 14: Global milk production 1999-2001
1999 2000 2001 Million Metric Tonnes EU India USA Russian Federation Pakistan Brazil New Zealand Ukraine Poland Australia Argentina Kenya Zimbabwe South Africa Uganda Tanzania World
126 77 74 32 23 22 13 13 12 11 10
2.3 0.3 2.7 0.5 0.6
566
125 79 76 32 24 22 13 12 12 11 9
2.2 0.3 2.7 0.5 0.6
576
126 82 75 32 25 23 14 12 12 12 9
2.1 0.3 2.7 0.5 0.6
585
Source: FAO Future global demand is expected to marginally outstrip supply. Producers with net exportable surplus include USA, EU, New Zealand, Australia, Argentina, Uruguay and Zimbabwe. Those with historical net deficit include Brazil, Mexico, Japan, Middle East countries, China, Russia, the Commonwealth of Independent States (CIS) while EU and USA are also important quota-restricted importers. In the COMESA region, important milk importers are Burundi, Botswana, DRC, Malawi, Mozambique, Rwanda, Ethiopia, Somalia, Sudan, Uganda and Zambia. According to FAO estimates the named COMESA countries imported a total of 30,000 metric tones of dry milk powder worth over US $ 57 million in 1998. The market for milk powder is even greater in Western and Northern Africa with Nigeria
The Dairy Industry in Kenya: The Post Liberalization Agenda
Working Paper No.1, 2003 40
alone importing more than 120,000 tones a year. It is therefore apparent that Kenyan dairy products can easily find markets in the region and in the wider world so long as they remain competitive. The international trade in dairy products is, however, heavily distorted by tariff and protection mechanisms of the major consuming nations in North America and Europe. Indeed, these issues feature prominently in WTO and Agenda 2000 agreement9. Progress in resolving these issues is slow and is unlikely to have a major impact within the next 5-10 years. This is especially the case after the sighing of the USA farm security and rural investments Act 2002 in May this year.
The Cairns group of Nations (Australia, Argentina and New Zealand)10 is the benchmark producer. The producer prices in these nations in 1999/2000 were as low as 15-20 US cents per litre as shown in Table 15. At current market prices it is estimated that, producer prices of less than US $ 0.20 (Ksh15.60) per litre would be the dividing line between those countries that can export dairy products without use of subsidies and those which cannot (Griffin, 1999; FAO, 2002). With the producer prices of around Ksh 15 prevailing in most parts of the country in 2002, Kenya can be placed in the second low-cost category. Indeed, most of the open grazing systems in Nyandarua and Rift Valley were able to produce milk at around Ksh 10-12 per litre as shown earlier in section 3.3. This places Kenya in tandem with the lowest producers in the world such as Australia. This therefore means that Kenya is in the league of nations that have been able to create a thriving dairy export industry. The country has the production capacity having the largest and well-developed dairy herd in Sub-Saharan Africa. According to FAO statistics, Kenya and Sudan are the largest Sub-Saharan Africa dairy producers accounting for 47% of the total cow milk produced, with Kenya having a market share of 24 percent. Given this prognosis, then one cannot but wonder why this potential has not been recognised and exploited. The answer seems to lie in efficiency of internal production, processing and marketing systems. The next section evaluates how this potential can be exploited. To do this, a review of the structures and performance of some of the best known dairy exporting nations are reviewed and in particular New Zealand. The purpose of is exercise is to identify areas where Kenya has comparative advantage as well as areas that hinder an effective dairy export strategy.
9 Agenda 2000 agreement seeks to set the framework for the future of EU’s Common Agricultural Policy (CAP). The most fundamental anticipated change is the freezing of the CAP budget at 1999 level of Euro 40.5 billion (US $ 44 billion) with an annual increase of 2% to cater for inflation. For dairy, the agreement comprises of proposals to cut by 15% the intervention prices paid for butter and skimmed milk and increase of 1.5 % in milk quotas, all to be begin in 2005. 10 The Cairns group represents major farming countries and its members include Brazil, Australia, New Zealand, South Africa, Argentina, Bolivia, Colombia, Costa Rica, Fiji, Guatemala, Indonesia, Paraguay, Philippines, Thailand and Uruguay.
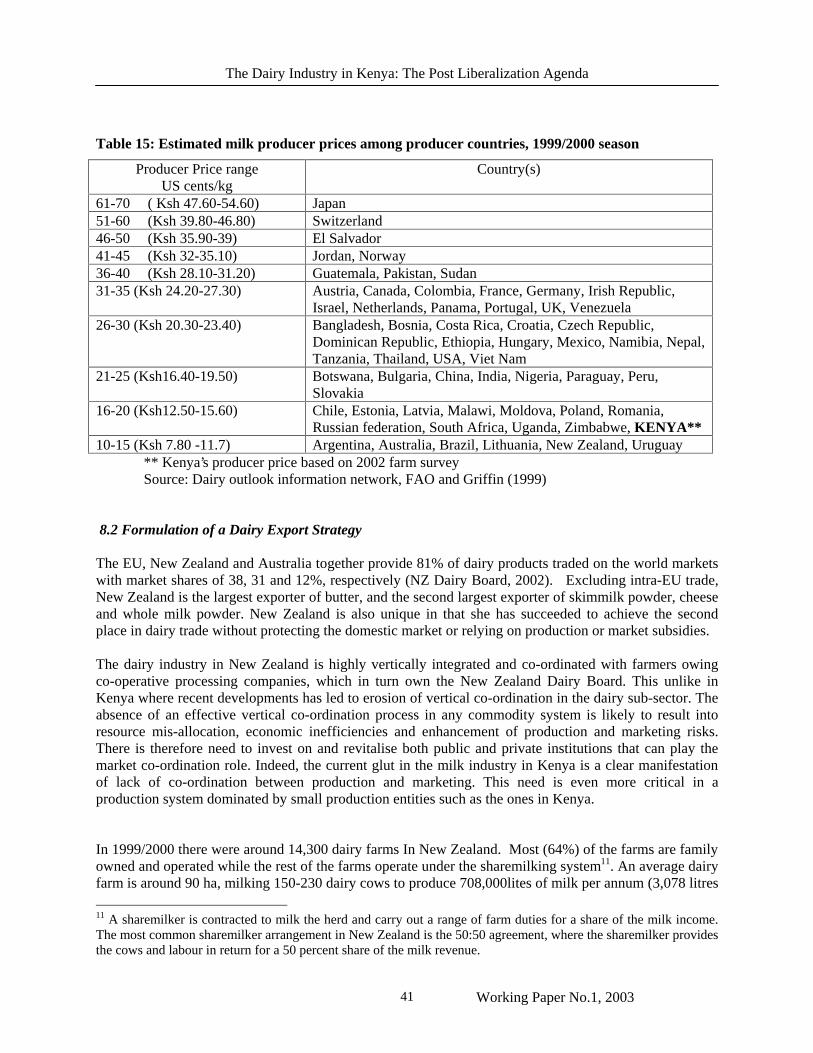
The Dairy Industry in Kenya: The Post Liberalization Agenda
Working Paper No.1, 2003 41
Table 15: Estimated milk producer prices among producer countries, 1999/2000 season
Producer Price range US cents/kg
Country(s)
61-70 ( Ksh 47.60-54.60) Japan 51-60 (Ksh 39.80-46.80) Switzerland 46-50 (Ksh 35.90-39) El Salvador 41-45 (Ksh 32-35.10) Jordan, Norway 36-40 (Ksh 28.10-31.20) Guatemala, Pakistan, Sudan 31-35 (Ksh 24.20-27.30) Austria, Canada, Colombia, France, Germany, Irish Republic,
Israel, Netherlands, Panama, Portugal, UK, Venezuela 26-30 (Ksh 20.30-23.40) Bangladesh, Bosnia, Costa Rica, Croatia, Czech Republic,
Dominican Republic, Ethiopia, Hungary, Mexico, Namibia, Nepal, Tanzania, Thailand, USA, Viet Nam
21-25 (Ksh16.40-19.50) Botswana, Bulgaria, China, India, Nigeria, Paraguay, Peru, Slovakia
16-20 (Ksh12.50-15.60) Chile, Estonia, Latvia, Malawi, Moldova, Poland, Romania, Russian federation, South Africa, Uganda, Zimbabwe, KENYA**
10-15 (Ksh 7.80 -11.7) Argentina, Australia, Brazil, Lithuania, New Zealand, Uruguay ** Kenya’s producer price based on 2002 farm survey Source: Dairy outlook information network, FAO and Griffin (1999)
8.2 Formulation of a Dairy Export Strategy
The EU, New Zealand and Australia together provide 81% of dairy products traded on the world markets with market shares of 38, 31 and 12%, respectively (NZ Dairy Board, 2002). Excluding intra-EU trade, New Zealand is the largest exporter of butter, and the second largest exporter of skimmilk powder, cheese and whole milk powder. New Zealand is also unique in that she has succeeded to achieve the second place in dairy trade without protecting the domestic market or relying on production or market subsidies.
The dairy industry in New Zealand is highly vertically integrated and co-ordinated with farmers owing co-operative processing companies, which in turn own the New Zealand Dairy Board. This unlike in Kenya where recent developments has led to erosion of vertical co-ordination in the dairy sub-sector. The absence of an effective vertical co-ordination process in any commodity system is likely to result into resource mis-allocation, economic inefficiencies and enhancement of production and marketing risks. There is therefore need to invest on and revitalise both public and private institutions that can play the market co-ordination role. Indeed, the current glut in the milk industry in Kenya is a clear manifestation of lack of co-ordination between production and marketing. This need is even more critical in a production system dominated by small production entities such as the ones in Kenya.
In 1999/2000 there were around 14,300 dairy farms In New Zealand. Most (64%) of the farms are family owned and operated while the rest of the farms operate under the sharemilking system11. An average dairy farm is around 90 ha, milking 150-230 dairy cows to produce 708,000lites of milk per annum (3,078 litres
11 A sharemilker is contracted to milk the herd and carry out a range of farm duties for a share of the milk income. The most common sharemilker arrangement in New Zealand is the 50:50 agreement, where the sharemilker provides the cows and labour in return for a 50 percent share of the milk revenue.
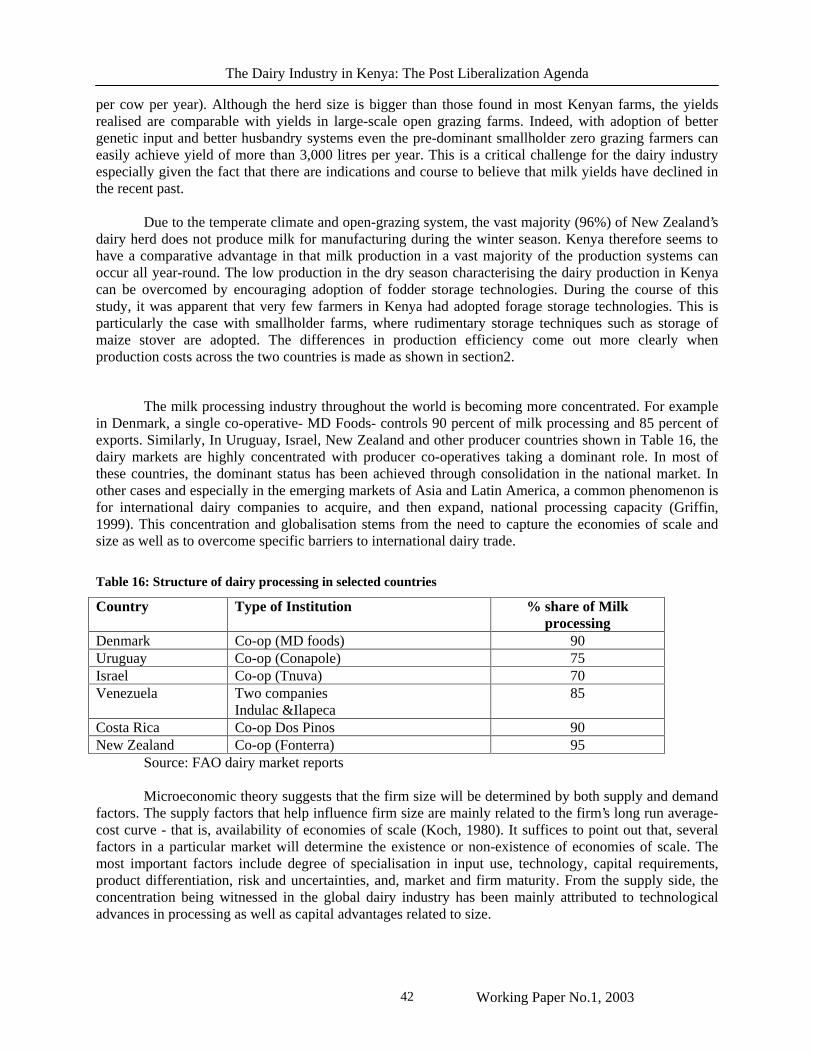
The Dairy Industry in Kenya: The Post Liberalization Agenda
Working Paper No.1, 2003 42
per cow per year). Although the herd size is bigger than those found in most Kenyan farms, the yields realised are comparable with yields in large-scale open grazing farms. Indeed, with adoption of better genetic input and better husbandry systems even the pre-dominant smallholder zero grazing farmers can easily achieve yield of more than 3,000 litres per year. This is a critical challenge for the dairy industry especially given the fact that there are indications and course to believe that milk yields have declined in the recent past.
Due to the temperate climate and open-grazing system, the vast majority (96%) of New Zealand’s
dairy herd does not produce milk for manufacturing during the winter season. Kenya therefore seems to have a comparative advantage in that milk production in a vast majority of the production systems can occur all year-round. The low production in the dry season characterising the dairy production in Kenya can be overcomed by encouraging adoption of fodder storage technologies. During the course of this study, it was apparent that very few farmers in Kenya had adopted forage storage technologies. This is particularly the case with smallholder farms, where rudimentary storage techniques such as storage of maize stover are adopted. The differences in production efficiency come out more clearly when production costs across the two countries is made as shown in section2.
The milk processing industry throughout the world is becoming more concentrated. For example in Denmark, a single co-operative- MD Foods- controls 90 percent of milk processing and 85 percent of exports. Similarly, In Uruguay, Israel, New Zealand and other producer countries shown in Table 16, the dairy markets are highly concentrated with producer co-operatives taking a dominant role. In most of these countries, the dominant status has been achieved through consolidation in the national market. In other cases and especially in the emerging markets of Asia and Latin America, a common phenomenon is for international dairy companies to acquire, and then expand, national processing capacity (Griffin, 1999). This concentration and globalisation stems from the need to capture the economies of scale and size as well as to overcome specific barriers to international dairy trade.
Table 16: Structure of dairy processing in selected countries
Country Type of Institution % share of Milk processing
Denmark Co-op (MD foods) 90 Uruguay Co-op (Conapole) 75 Israel Co-op (Tnuva) 70 Venezuela Two companies
Indulac &Ilapeca 85
Costa Rica Co-op Dos Pinos 90 New Zealand Co-op (Fonterra) 95
Source: FAO dairy market reports Microeconomic theory suggests that the firm size will be determined by both supply and demand
factors. The supply factors that help influence firm size are mainly related to the firm’s long run average-cost curve - that is, availability of economies of scale (Koch, 1980). It suffices to point out that, several factors in a particular market will determine the existence or non-existence of economies of scale. The most important factors include degree of specialisation in input use, technology, capital requirements, product differentiation, risk and uncertainties, and, market and firm maturity. From the supply side, the concentration being witnessed in the global dairy industry has been mainly attributed to technological advances in processing as well as capital advantages related to size.

The Dairy Industry in Kenya: The Post Liberalization Agenda
Working Paper No.1, 2003 43
Demand factors overshadow the supply factors in explaining the consolidation of the dairy industry. The absolute size of demand is an important determinant of a firm size. An insufficient-demand scenario, like the one being witnessed in the Kenyan dairy market, can totally cancel any tendency towards large firms and exploitation of economies of scale. It is altogether obvious that, the size of demand will clearly be limited by geographical area considered, time horizon, the degree of product differentiation and the price elasticity of demand. The consolidation of the dairy industry has enabled the emerging firms to expand the demand for their products outside their domestic markets. The involvement of international dairy companies has also facilitated widespread use of internationally known brand names and distribution channels. Indeed, the ’globalisation’ of products through brand names have become an increasingly important facet on the international market place as in confers recognition, coverage and premier market position to a product. However, it needs to be remembered that at the level international trade, dairy products with the partial exception of cheese are traded in bulk for reprocessing. Nevertheless, the dairy products market is also changing towards niche markets that are geared towards specific markets or group of consumers. For example, 25 percent of the value of new Zealand’s exports are in form of branded consumer packs mainly in form of calcium enriched or low-lactose milk powder for Southeast Asia markets (Griffin, 1999). Even within localised domestic market, the consolidation of dairy processing has enabled the emerging large firms to expand demand through product differentiation and promotion. A visit to a dairy counter in a city supermarket is sufficient to show the vast array of brands and forms in which milk is presented. Although differentiation of dairy products helps to penetrate and expand dairy products markets it however can act as a major barrier to entry for new firms thereby resulting in large firms. An earlier study done by Bigsten et al (1997) examined changes in export orientation in a group of African countries 12by exploring possible shifts in the behaviour of exporting enterprises. Two potential causes of such shifts were found. Changes in the macro environment was the first cause while changes in either the amounts exported or the overall enterprises propensity to export, was the second cause. In the four countries studied, exporting was associated with large firms, greater capital intensity and location in the capital city where there are better support services and infrastructure. Similarly, Kimuyu (1999) has shown that in the Kenyan manufacturing sector, the propensity to export and the proportion of output exported is higher in large firms as compared to micro-enterprises. Thus, the lessons for the dairy industry in Kenya are clear, to effectively participate in export trade the industry need to consolidate. The current structure of dairy processing that is fragmented is not ideal for export trade and also domestic trade as earlier indicated. Several relevant public policy issues arise from this position. Foremost, is the issue of firm size versus market structure. The pursuance of economies of size may lead to higher market concentration that may induce some welfare losses especially to domestic consumers. Nevertheless, evidence adduced in section 5.3.2 indicates that this has not happened in the immediate past despite the enhanced competition in dairy processing industry. As such, future dairy processing policies should refrain from being too enthusiastic about the assumption that pure competition is always the most satisfactory form of market development. Furthermore public policy that encourages consolidation should also come up specific policies to promote both enterprise and export growth. This view is a major departure from the current dairy development policy and should therefore be given more thought and analysis.
12 Countries included in the study were Ghana, Cameroon, Kenya and Zimbabwe
The Dairy Industry in Kenya: The Post Liberalization Agenda
Working Paper No.1, 2003 44
9.0 INSTITUTIONAL AND REGULATORY ENVIRONMENT
There are several institutions involved in the regulation of the dairy sub-sector in the country. The main regulatory body is the Kenya Dairy Board (KDB) established under the Dairy Industry Act, Cap 336 of the Laws of Kenya. KDB has the responsibility of developing, promoting and regulating the dairy Industry. This is a parastatal in which the large scale dairy producers, processors and the Ministry of Agriculture sit in the Board of Directors. The main functions of KDB are the enforcement of National Standards for the Dairy Industry, training for the industry; facilitation of stakeholders activities; maintenance of a databank for the dairy industry and regulation of imports. In practice, KDB has largely been a reactive institution that has concentrated its efforts in policing the activities of milk hawkers and other unlicensed operators in the industry. This is to safeguard the cess, which provides nearly 80% of its revenue rather than acting in the interests of consumers. Given its staff establishment and operational resources, it is doubtful whether KDB has the capacity to undertake the roles as envisaged. The continued focus of KDB on the milk marketing issues has reduced its developmental role in the industry. Indeed most farmers, traders and other stakeholders interviewed during the course of this study associated KDB with little else other than licensing and harassment of milk traders. Furthermore, most traders complained that KDB just collects money in form of fees and cess without offering any services such as training and farmer education. Thus the on-going restructuring of KDB and the review of the dairy Act should as a matter of necessity address the issue of how KDB can play a more co-ordinating and developmental role in the industry apart from regulation. Recent events surrounding the importation of milk powder in the country only serves to illustrate what can happen when there is poor co-ordination in an industry. The other institutions which have a major role in the regulation of the dairy industry are the Kenya Bureau of Standards which is the statutory body involved in the enforcement of standards and certification of quality standards of all products and services in the country. Its role is largely confined to the large processors and importers of dairy products since most of the smaller dairy enterprises do not even have labels against which they can be traced. In practice, KEBS resources are largely applied in following up compliance by more lucrative sectors such as the petroleum and other large industries and only occasionally are they applied in the dairy sub-sector. To confuse the regulatory environment further, traders in dairy products are also required to comply with the licensing regulations of the local authorities in their areas of operations and regulations of the Public Health Departments of the Ministry of Health. These latter institutions main role appears to be collection of local taxes and maintenance of hygiene. As noted by the “Program for Small Scale Jua Kali Enterprises Development” the licensing fees are usually set arbitrarily and vary greatly. Many of the by-laws contain many restrictive conditions especially in the conduct of milk trade, initially intended to protect the monopolistic conditions of the Kenya Co-operative Creameries13. The participation and involvement of various dairy stakeholders in the formulation and enforcement of regulatory environment remains one of the greatest barriers to entry and growth of especially the small and medium business enterprises. For instance the well intentioned code of hygienic practice for production, handling and distribution of milk and milk products introduced recently, did not include key players such as co-operatives, milk bar owners, transporters and other key players in its formulation. Yet the code if applied to the letter contains codes which can severely restrict the entry and growth of both formal and informal sectors. Some of these conditions relate to the conditions set for milk collection centres, use of insulated vehicles for milk transport, transport time, registration of farmers by KDB, conditions for bulk dispensing of milk products and record keeping at retail outlets.
13 Ministry of Planning and National Development (1997) Improving The Legal And Regulatory Environment Through Trade Licensing Reforms page 8.
The Dairy Industry in Kenya: The Post Liberalization Agenda
Working Paper No.1, 2003 45
10. CONCLUSIONS AND POLICY IMPLICATIONS 10.1 Conclusions Through the supply chain analysis, the study concludes that the emerging structure of post-liberalisation dairy sector in Kenya is characterised by lack of co-ordination between production, processing and marketing. This lack of vertical co-ordination continues to impact negatively on the performance and efficiency of the sub-sector. At production level, farmers find themselves with milk that they cannot find dependable market outlets. The dominant informal milk traders who have emerged after market liberalisation are also found to be ill equipped to handle milk as a perishable commodity. This has led to heavy and unnecessary losses along the marketing chain. Milk hygiene continues to be compromised due to lack of proper handling and transport facilities. There is therefore real danger of milk consumers being exposed to public health risks. Nevertheless, most consumers continue to depend on raw milk mainly due to its low price as compared to the pasteurised milk. The market innovations of the informal milk traders has led to shrinkage of the pasteurised milk market which seems to lack market innovatiness to capture higher market share. The decline in the formal milk market has led to increased consumer, overhead costs as well as loss of competitiveness of the processed milk. The current dairy processing structure is not only found to be fragmented but also not ideal for export trade as well as domestic trade. 10.2 Policy Implications In order for the dairy industry to thrive and prosper, the private sector has to play a more meaningful role while the public sector has to play the co-ordination role. A platform for private sector investments have to be created and nurtured. Thus, the role of state remains critical at all levels of the milk supply chain. Specifically a number of areas listed below need to be addressed. 10.2.1 Production
1. Lack of reliable data on livestock numbers, composition, yields and growth trends. This need to be addressed through a comprehensive livestock census to aid in planning and estimation of supply patterns.
2. Streamlining the operations and minimisation of unethical business practices in the animal feed
industry. As a matter of urgency, the government and its agencies (especially KEBS and Weight and Measures Department) need to intensify its regulatory role to minimise the moral hazards that currently besiege the animal feed industry. A system for monitoring and testing of manufactured feeds should be introduced and the information gathered used for regulation and self-regulation of the feeds industry. This is an important area where the KDB should have a direct involvement. A detailed study to establish the structure, performance and conduct of the animal feed industry with a view of enhancing competitiveness and efficiency should also be undertaken.
3. Low adoption of appropriate dairy production technologies particularly on feed conservation and
appropriate feeding regimes. Although most of these technologies have been researched on and are simple to apply, they remain unutilised at farm level mainly due to poor dissemination,
The Dairy Industry in Kenya: The Post Liberalization Agenda
Working Paper No.1, 2003 46
limited extension coverage, extension bias towards crop production as well as limited access to credit.
4. Limited access, high costs of animal genetics and lack of effective co-ordination. a) Need to have an active national animal improvement and breeding co-ordinating body (Kenya
National Livestock Breeders Association?) with the government providing the necessary initial financial and technical support.
b) Better financing, co-ordination and promotion of dairy breeding records. The KDB should invest more of the cess funds in this area and take a more active role.
c) CAIS should be made more autonomous (de-linked from MoARD) with a view of making it an autonomous commercial entity controlled by a board of management appointed from various stakeholders in the industry. The station has the potential to be financially self-sustaining.
d) CAIS should establish sub-stations and semen collection points across the major dairy producing areas to decentralise the bull stud and to reduce semen transport cost.
e) Due exclusion of some areas with thin AI markets, the government through KNAIS should maintain its presence in these areas while creating the necessary investment platform for private and socio- organisations.
f) More competition should be encouraged in the semen importation and distribution with the hope of reducing the cost of imported semen.
g) Need to attract private investments in training of inseminators by streamlining issues related to curriculum.
10.2.2 Milk collection
1. Given the prominent role played by brokers in milk collection and marketing, there is need for the industry to assist them to play a more effective role. Education on milk hygiene and quality assessment would greatly help the brokers and the entire informal milk marketing chain.
2. The widespread use of non-food plastic containers during milk collection/delivery and transportation and the promotion of alternative suitable plastic containers.
3. Development of long term contractual relationships between processors and co-operatives /Large-scale farmers for sustainable and cost-effective milk collection systems which also can be used to channel extension, inputs and other services to farmers. I.e. co-ordination and vertical integration of the milk production and marketing.
10.2.3 Milk processing and marketing
1. To develop a growth model to streamline and improve the informal milk channel that currently absorbs over 80% of the total milk sold. Challenges remain on policy environment and guidelines, improvement of milk hygiene and quality, training and provision of appropriate technologies for cold storage, milk processing and packaging.
2. To integrate and exploit the synergies between the informal and formal milk marketing channels
to enhance milk consumption and marketing. 3. To increase consumer benefits for packaged milk as means of increasing consumption. The main
issues of concern are in regard to the high cost of processing and packaging milk, appropriateness and cost-effectiveness of packaging materials.
4. Marketing and promotion of milk consumption in the country and use of emerging distribution
channels such as supermarkets and mini-markets. Increasing market segmentation to target
The Dairy Industry in Kenya: The Post Liberalization Agenda
Working Paper No.1, 2003 47
specific consumers such as children and tailoring of milk products to the changing eating habits e.g. having smaller milk packs to be taken with outdoor snacks or vended at snacks outlets.
10.2.4 International dairy trade
1. Means to increase competitiveness of dairy products and the propensity to export. Review of the cost structure, processing efficiency, utilisation of economies of scale and size.
2. Establishment of domestic capacity to manufacture milk powder both for operational and strategic stocks
3. Financing and management of strategic milk powder stocks 10.2.5 Institutions and regulation
Identification of key developmental and industry co-ordination roles of the KDB. Emphasises on self-regulation and investment in basic needs of the industry such as improvement of the dairy herd, development of appropriate milk processing technologies, training and promotion.
The Dairy Industry in Kenya: The Post Liberalization Agenda
Working Paper No.1, 2003 48
REFERENCES
Arrow, K. and G. Debreu (1954). Existence of an equilibrium for a comparative economy.
Econometrica 22: 265-90 Bardhan, P. (1989). The economic theory of agrarian institutions. Oxford University Press, New
York. Bain, J.S. (1968). Industrial organisation. Wiley, New York. Bigsten, A.P. et al (1997) Exports of African Manufactures: Macro Policy and Firm Behaviour.
Gothenburg University. DRDC, (2002). Australia’s expanding dairy industry- productivity and profit. Dairy Research
and Development Corporation (DRDC). FAO (2001). Dairy commodity notes. Commodities and Trade Division, Food and Agriculture
Organisation of the United Nations, Rome. Griffin, M (1999). Overview of developments in the world dairy market. Paper presented at the 5th
Holstein Congress of the Americas, Santiago, Chile.
Harries, B (1993). There is method in my madness: or is it vice versa? Measuring agricultural market performance. In Abbott, J. (eds.) Agricultural and food marketing in developing countries; selected readings. CTA And CABI
Hoff, K., Braverman A. & Stiglitz J.E. (1993). The economics of rural organisation, theory,
practice, and policy. Oxford University Press, New York, 590p. Jaffee, S. & J.Morton (1995). Marketing Africa’s high value crops. Kendall, Aowa. Karugia, J.T. et al (2001). Economic analysis of cross-breeding programmes in sub-Saharan Africa: A
conceptual framework and Kenyan case study. Animal Genetic Resources Research 2. ILRI, Nairobi. 55p
Koch, J.V. (1980). Industrial organisation and prices. Prentice-Hall, London. Kimuyu et al.(eds.) (1999). Kenya’s strategic policies for the 21st century. IPAR, Nairobi. Kodhek, A.G. (1999). Report on revitalising the dairy industry in Kenya. Tegemeo institute, Nairobi. MoARD, (2000). Draft dairy industry Bill 2000 and Dairy development Policy, Ministry of Agriculture
and Rural development (MoARD), Nairobi. Ngigi, M.W. (1995). Liberalisation of the dairy industry. In conference proceedings on Towards
2000: Improving agricultural Performance. PAM, Nairobi.
Nyoro, J.K, Kiiru,M.W & Jayne, T.S (1999). Evolution of Kenya’s maize marketing systems in the post- liberalisation era. Workshop paper on agricultural transformation in Africa, held in June, Nairobi Kenya.

The Dairy Industry in Kenya: The Post Liberalization Agenda
Working Paper No.1, 2003 49
Omore A. et al (1999). The Kenyan Dairy Sub-sector: A rapid Appraisal. MoARD/KARI/ILRI smallholder Dairy project, Kenya
Omore, A. et al (2002). Assessing and managing milk-borne heath risks for the benefit of consumers in Kenya. Smallholder Dairy (R&D) project, Nairobi.
Owango, M, Lukuyu B., Stall S. J., Kinyanjui M., Njubi D. & Thupe W. (1998). Dairy co-
operatives and policy reforms in Kenya: effects of livelihood and market liberalisation. Food Policy 23(2): 173 - 85.
Rep. of Kenya (2002). National Development Plan 2002-2008: Effective management for sustainable
economic growth and poverty reduction. Govt. Printer, Nairobi. Wakhungu, J.W and Baptist, R (1992). Kenya AI policy issues beyond rehabilitation and breeding
program consolidation. The Kenya Vet. 16:33 Williamson , O.E. (1979). Transaction-costs economics: the governance of contractual relations.
Journal of Law and Economics 22: 233-61.
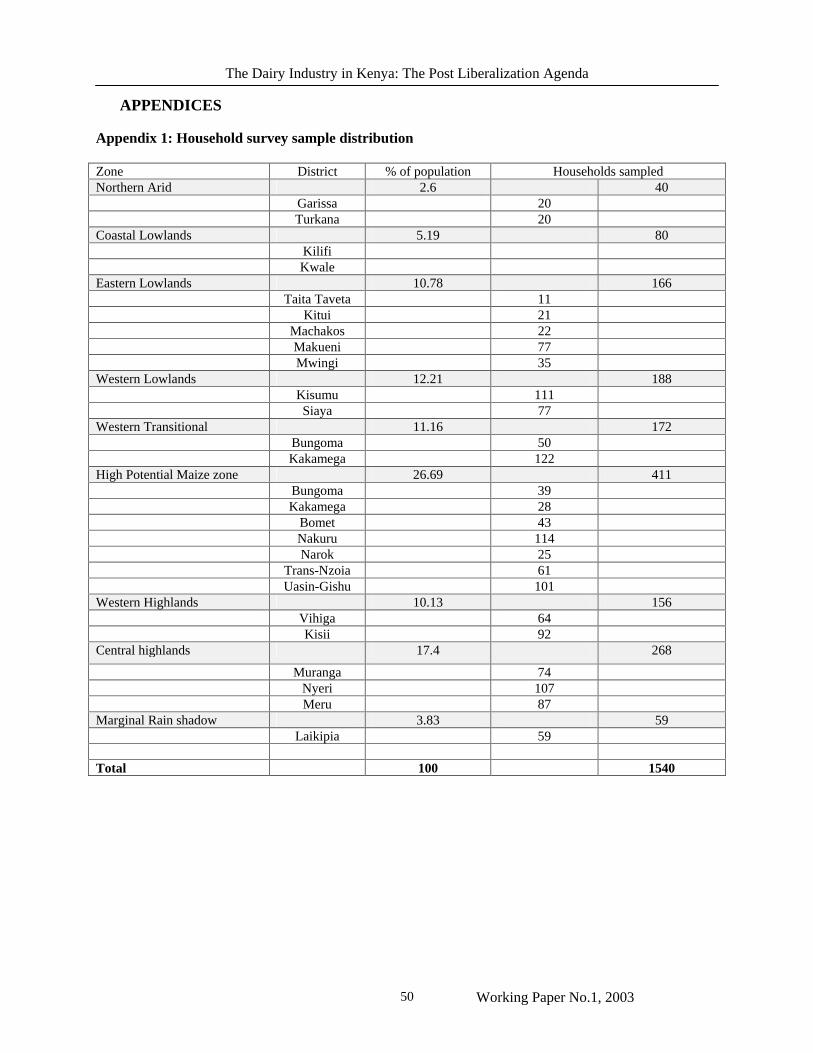
The Dairy Industry in Kenya: The Post Liberalization Agenda
Working Paper No.1, 2003 50
APPENDICES Appendix 1: Household survey sample distribution Zone District % of population Households sampled Northern Arid 2.6 40 Garissa 20 Turkana 20 Coastal Lowlands 5.19 80 Kilifi Kwale Eastern Lowlands 10.78 166 Taita Taveta 11 Kitui 21 Machakos 22 Makueni 77 Mwingi 35 Western Lowlands 12.21 188 Kisumu 111 Siaya 77 Western Transitional 11.16 172 Bungoma 50 Kakamega 122 High Potential Maize zone 26.69 411 Bungoma 39 Kakamega 28 Bomet 43 Nakuru 114 Narok 25 Trans-Nzoia 61 Uasin-Gishu 101 Western Highlands 10.13 156 Vihiga 64 Kisii 92 Central highlands 17.4 268
Muranga 74 Nyeri 107 Meru 87 Marginal Rain shadow 3.83 59 Laikipia 59 Total 100 1540
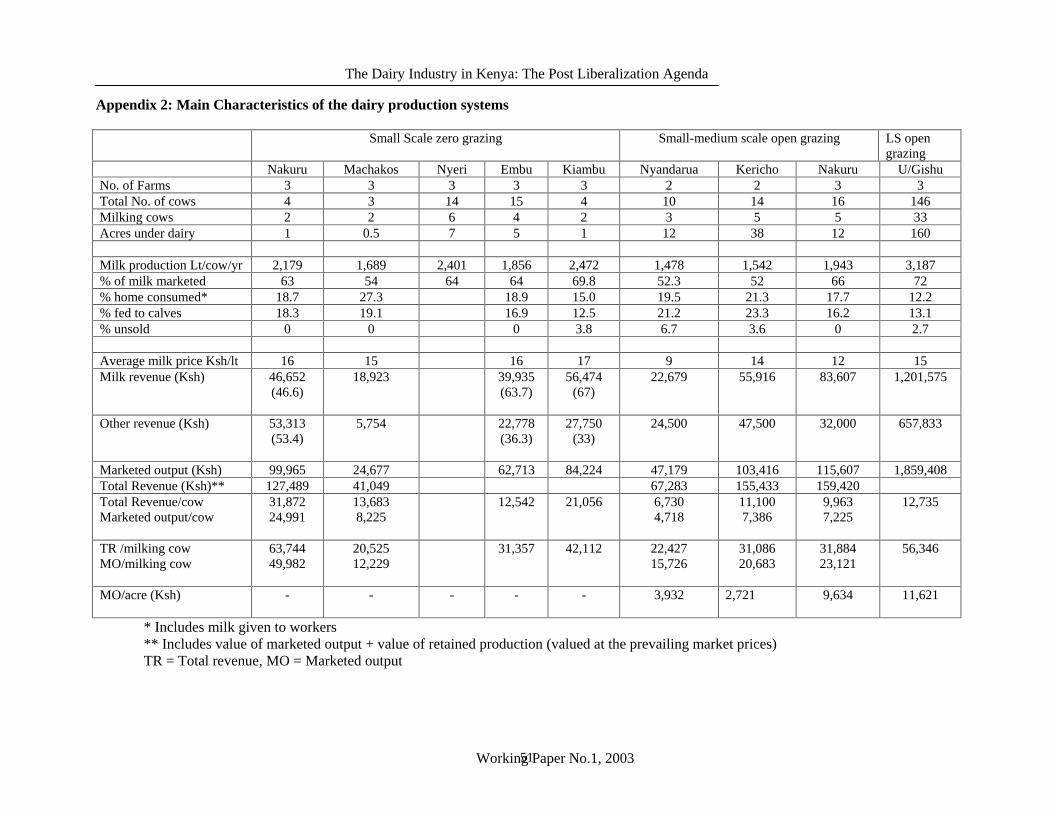
The Dairy Industry in Kenya: The Post Liberalization Agenda
Working Paper No.1, 2003 51
Appendix 2: Main Characteristics of the dairy production systems Small Scale zero grazing Small-medium scale open grazing LS open
grazing Nakuru Machakos Nyeri Embu Kiambu Nyandarua Kericho Nakuru U/Gishu No. of Farms 3 3 3 3 3 2 2 3 3 Total No. of cows 4 3 14 15 4 10 14 16 146 Milking cows 2 2 6 4 2 3 5 5 33 Acres under dairy 1 0.5 7 5 1 12 38 12 160 Milk production Lt/cow/yr 2,179 1,689 2,401 1,856 2,472 1,478 1,542 1,943 3,187 % of milk marketed 63 54 64 64 69.8 52.3 52 66 72 % home consumed* 18.7 27.3 18.9 15.0 19.5 21.3 17.7 12.2 % fed to calves 18.3 19.1 16.9 12.5 21.2 23.3 16.2 13.1 % unsold 0 0 0 3.8 6.7 3.6 0 2.7 Average milk price Ksh/lt 16 15 16 17 9 14 12 15 Milk revenue (Ksh) 46,652
(46.6)
18,923 39,935 (63.7)
56,474 (67)
22,679 55,916 83,607 1,201,575
Other revenue (Ksh) 53,313 (53.4)
5,754 22,778 (36.3)
27,750 (33)
24,500 47,500 32,000 657,833
Marketed output (Ksh) 99,965 24,677 62,713 84,224 47,179 103,416 115,607 1,859,408 Total Revenue (Ksh)** 127,489 41,049 67,283 155,433 159,420 Total Revenue/cow Marketed output/cow
31,872 24,991
13,683 8,225
12,542 21,056 6,730 4,718
11,100 7,386
9,963 7,225
12,735
TR /milking cow MO/milking cow
63,744 49,982
20,525 12,229
31,357 42,112 22,427 15,726
31,086 20,683
31,884 23,121
56,346
MO/acre (Ksh) -
- - - - 3,932 2,721 9,634 11,621
* Includes milk given to workers ** Includes value of marketed output + value of retained production (valued at the prevailing market prices) TR = Total revenue, MO = Marketed output
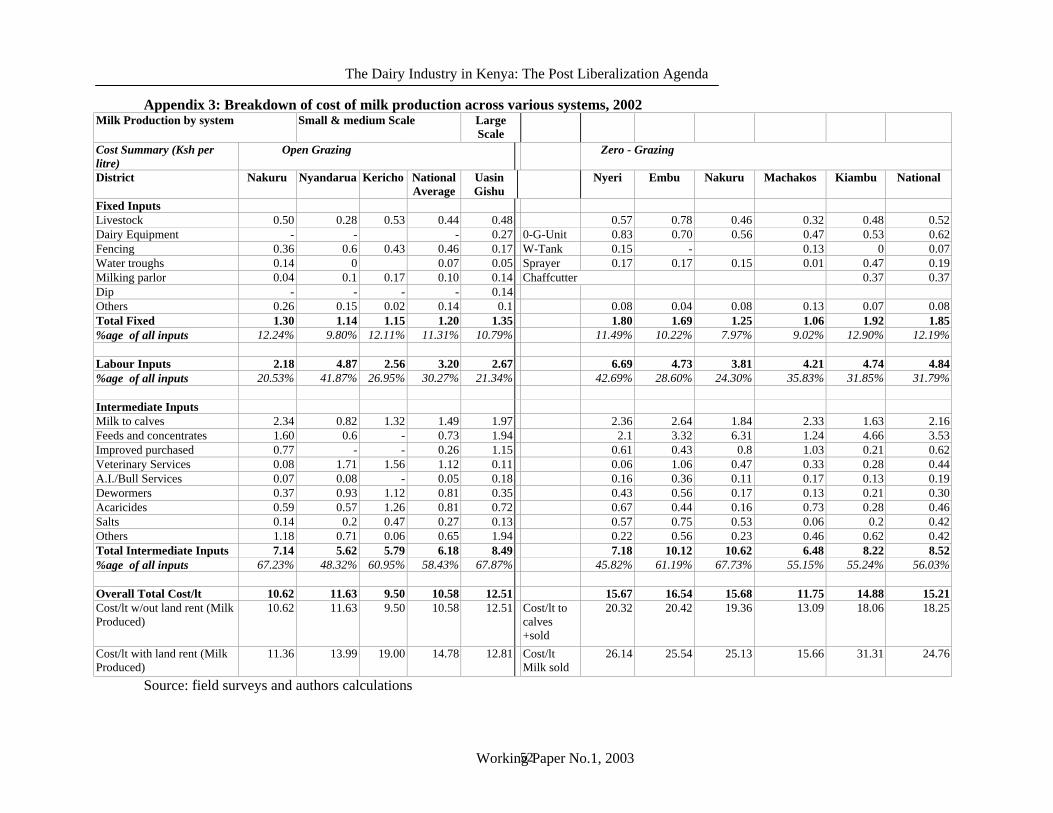
The Dairy Industry in Kenya: The Post Liberalization Agenda
Working Paper No.1, 2003 52
Appendix 3: Breakdown of cost of milk production across various systems, 2002 Milk Production by system Small & medium Scale Large
Scale
Cost Summary (Ksh per litre)
Open Grazing Zero - Grazing
District Nakuru Nyandarua Kericho National Average
Uasin Gishu
Nyeri Embu Nakuru Machakos Kiambu National
Fixed Inputs Livestock 0.50 0.28 0.53 0.44 0.48 0.57 0.78 0.46 0.32 0.48 0.52 Dairy Equipment - - - 0.27 0-G-Unit 0.83 0.70 0.56 0.47 0.53 0.62 Fencing 0.36 0.6 0.43 0.46 0.17 W-Tank 0.15 - 0.13 0 0.07 Water troughs 0.14 0 0.07 0.05 Sprayer 0.17 0.17 0.15 0.01 0.47 0.19 Milking parlor 0.04 0.1 0.17 0.10 0.14 Chaffcutter 0.37 0.37 Dip - - - - 0.14 Others 0.26 0.15 0.02 0.14 0.1 0.08 0.04 0.08 0.13 0.07 0.08 Total Fixed 1.30 1.14 1.15 1.20 1.35 1.80 1.69 1.25 1.06 1.92 1.85 %age of all inputs 12.24% 9.80% 12.11% 11.31% 10.79% 11.49% 10.22% 7.97% 9.02% 12.90% 12.19%
Labour Inputs 2.18 4.87 2.56 3.20 2.67 6.69 4.73 3.81 4.21 4.74 4.84 %age of all inputs 20.53% 41.87% 26.95% 30.27% 21.34% 42.69% 28.60% 24.30% 35.83% 31.85% 31.79%
Intermediate Inputs Milk to calves 2.34 0.82 1.32 1.49 1.97 2.36 2.64 1.84 2.33 1.63 2.16 Feeds and concentrates 1.60 0.6 - 0.73 1.94 2.1 3.32 6.31 1.24 4.66 3.53 Improved purchased 0.77 - - 0.26 1.15 0.61 0.43 0.8 1.03 0.21 0.62 Veterinary Services 0.08 1.71 1.56 1.12 0.11 0.06 1.06 0.47 0.33 0.28 0.44 A.I./Bull Services 0.07 0.08 - 0.05 0.18 0.16 0.36 0.11 0.17 0.13 0.19 Dewormers 0.37 0.93 1.12 0.81 0.35 0.43 0.56 0.17 0.13 0.21 0.30 Acaricides 0.59 0.57 1.26 0.81 0.72 0.67 0.44 0.16 0.73 0.28 0.46 Salts 0.14 0.2 0.47 0.27 0.13 0.57 0.75 0.53 0.06 0.2 0.42 Others 1.18 0.71 0.06 0.65 1.94 0.22 0.56 0.23 0.46 0.62 0.42 Total Intermediate Inputs 7.14 5.62 5.79 6.18 8.49 7.18 10.12 10.62 6.48 8.22 8.52 %age of all inputs 67.23% 48.32% 60.95% 58.43% 67.87% 45.82% 61.19% 67.73% 55.15% 55.24% 56.03%
Overall Total Cost/lt 10.62 11.63 9.50 10.58 12.51 15.67 16.54 15.68 11.75 14.88 15.21 Cost/lt w/out land rent (Milk Produced)
10.62 11.63 9.50 10.58 12.51 Cost/lt to calves +sold
20.32 20.42 19.36 13.09 18.06 18.25
Cost/lt with land rent (Milk Produced)
11.36 13.99 19.00 14.78 12.81 Cost/lt Milk sold
26.14 25.54 25.13 15.66 31.31 24.76
Source: field surveys and authors calculations
The Dairy Industry in Kenya: The Post Liberalization Agenda
Working Paper No.1, 2003 54
Appendix 4: Types of milk trade licences and their fees, 1998 compared to 2002
Licence Fee (Ksh) -1998 Fee (Ksh) -2002 Remark
Application form 200 500 Producer- bulk delivery 1,000 1,000 Movement permit 200 1,000 Transport to specific point Milk bar 2,000 2,000 Less than 400lt, with premises Assurance letter 2,000 2,000 After milk bar inspection Cottage industry 2,000 3,000 Farm level with simple machines Mini dairy 3,000 5,000 500l to 3,000l/day Processor 5,000 20,000 Dairy manager licence 1,000 Ghee licence per debe 200 Retail licence 200
All licences are renewable annually. Cess is charged at 20 cts per lt on all commercial milk Source: Kenya Dairy Board
Top Related
Copyright © 2022 FDOKUMEN

