


Bahasa
Halaman
Hukum

Seediscussions,stats,andauthorprofilesforthispublicationat:https://www.researchgate.net/publication/6506850
Thecontributionofpsychosocialandhomeenvironmentalfactorsinexplainingeatingbehaviorsinadolescents
ARTICLEinEUROPEANJOURNALOFCLINICALNUTRITION·FEBRUARY2008
ImpactFactor:2.71·DOI:10.1038/sj.ejcn.1602681·Source:PubMed
CITATIONS
80
READS
26
6AUTHORS,INCLUDING:
LeenHaerens
GhentUniversity
74PUBLICATIONS1,338CITATIONS
SEEPROFILE
LeaMaes
GhentUniversity
224PUBLICATIONS5,227CITATIONS
SEEPROFILE
GreetCardon
GhentUniversity
247PUBLICATIONS4,108CITATIONS
SEEPROFILE
Availablefrom:LeenHaerens
Retrievedon:10March2016
FACULTY OF MEDICINE AND
HEALTH SCIENCES
Department of Movement and Sport Sciences
Faculty of Medicine and Health Sciences – Department of Movement and Sport Sciences
Promoting healthy eating and physical activity among
adolescents
Leen Haerens
Thesis submitted in fulfilment of the requirements for the degree of Doctor in Physical Education
Ghent 2006

Supervisor Prof. Dr. I. De Bourdeaudhuij (Ugent) Co-supervisor: Prof. Dr. L. Maes (Ugent) Supervisory board Prof. Dr. I. De Bourdeaudhuij (Ugent) Prof. Dr. L. Maes (Ugent) Prof. Dr. G. Cardon (Ugent) Dr. B. Deforche (Ugent) Dr. V. Stevens (VIG) Examination board Prof. Dr. D. De Bacquer (UGent)
Prof. Dr. J-M. Oppert (UPMC) Prof. Dr. S. De Henauw (Ugent)
Prof. Dr. F. Boen (KULeuven) Prof. Dr. J. Bouckaert (UGent)
Prof. Dr. G. Cardon (Ugent) Dr. B. Deforche (Ugent) Dr. V. Stevens (VIG)
Prof. Dr. I. De Bourdeaudhuij (Ugent) Prof. Dr. L. Maes (Ugent)
This thesis was part of a broader research project entitled Sport, Physical activity and Health, carried out by the Policy Research Centre, and funded by the Flemish Government. Dit proefschrift kwam tot stand als onderdeel van de opdracht van het Steunpunt Sport, Beweging en Gezondheid, verricht met de steun van de Vlaamse Gemeenschap.
© 2006 Ghent University, Faculty of Medicine and Health Sciences, Department of Movement and Sports Sciences, Watersportlaan 2, 9000 Ghent ISBN 9080908482 All rights reserved. No part of this book may be reproduced, or published, in any form or in any way, by print, photo print, microfilm, or any other means without prior permission from the publisher.

3
CONTENTS SAMENVATTING p 4 GENERAL INTRODUCTION p 5 ORIGINAL RESEARCH p 53 Part 1: Cross-sectional studies Chapter 1.1 Physical activity and running capacity in normal weight
versus overweight boys and girls p 57
Chapter 1.2 The contribution of psychosocial and home environmental
factors in explaining eating behaviors in adolescents p 69
Chapter 1.3 The contribution of home and school environmental factors
in explaining physical activity in adolescents p 87
Part 2: Intervention evaluations Chapter 2.1 The effects of a middle school healthy eating intervention
on adolescents’ fat and fruit intake and soft-drink consumption
p 100
Chapter 2.2 School Based Randomized Controlled Trial of a Physical
Activity Intervention among adolescents p 113
Chapter 2.3 Evaluation of a two-year physical activity and healthy
eating intervention in middle school children p 127
Chapter 2.4 Body Mass Effects of a Physical Activity and Healthy Food
Intervention in Middle Schools p 139
Chapter 2.5 Explaining the effect of a 1-year intervention promoting
physical activity in middle schools: a mediation analysis p 149
Chapter 2.6 A Computer-tailored Fat Intake Intervention among
Adolescents: Results of a Randomized Controlled Trial p 163
GENERAL DISCUSSION p 179 APPENDIX p 213 DANKWOORD p 215
4
SAMENVATTING
Tijdens de adolescentieperiode worden voedings- en bewegingsgewoontes vaak ongezonder. Jongeren
die ongezond eten of onvoldoende bewegen behouden deze ongezonde gewoonten vaak tot op
volwassen leeftijd. Een ongezond voedingspatroon en een tekort aan lichaamsbeweging worden
geassocieerd met een verhoogd risico op het ontwikkelen van overgewicht en op het ontwikkelen van
aandoeningen als diabetes, hypertensie, kanker en hart- en vaatziekten. Daarom is er een dringende
noodzaak aan effectieve voedings- en bewegingsprogramma’s voor adolescenten.
De eerste studie van deze thesis bevestigt dat jongeren met overgewicht duidelijk minder fysiek actief
zijn dan jongeren met een normaal gewicht. Deze studie toonde ook aan dat het percentage jongeren
met overgewicht hoger ligt bij jongeren uit het TSO en BSO dan bij jongeren uit het ASO. In een
tweede en derde studie werd nagegaan hoe omgevingsfactoren het eet- en bewegingsgedrag van
jongeren kunnen beïnvloeden. Uit de resultaten bleek dat de beschikbaarheid van gezonde en
ongezonde voedingswaren, de aanwezigheid van afspraken, en blootstelling aan commerciële tv-
programma’s het voedingspatroon van jongeren kunnen beïnvloeden. De activiteitsgraad van jongens
was geassocieerd met de beschikbaarheid van sportmateriaal en met de frequentie van
extracurriculaire activiteiten op school. Voor meisjes was de aanwezigheid van supervisie ook
belangrijk.
Het hoofddoel van deze thesis was het nagaan van de effectiviteit van een 2-jaar durende
schoolinterventie ter promotie van gezonde voeding en beweging. De schoolinterventie had als doel
jongeren aan te zetten om minder vet te eten, meer fruit te eten, meer water in plaats van frisdrank te
drinken en meer te bewegen, zowel op school als in de vrije tijd. Enerzijds werd getracht om een
gezonde schoolomgeving te creëren door water aan te bieden als alternatief voor frisdrank, door een
wekelijkse fruitverkoop te organiseren, door extra bewegingsactiviteiten te organiseren, door
sportmateriaal aan te bieden tijdens de pauzes en door actief transport naar school te promoten.
Anderzijds werd gezondheidseducatie verschaft onder de vorm van een vet- en bewegingsadvies op
maat via het Internet. De evaluatie van de tweejarige interventie toonde aan dat de interventie een
positief effect had op de BMI bij meisjes, op de vetinname bij meisjes en op de activiteitsgraad van
jongens. De interventie resulteerde echter niet in positieve veranderingen in de fruitinname, water- en
frisdrankconsumptie.
Aangezien de promotie van gezonde voeding en een actieve levensstijl bij adolescenten dringend
nodig is, moet de verspreiding van dergelijke voedings- en bewegingsprogramma’s worden
aangemoedigd. Er is daarnaast nood aan onderzoek waarin nagegaan wordt hoe de effectiviteit van
voedings- en bewegingsprogramma verder kan verhoogd worden.

5
GENERAL INTRODUCTION
General Introduction
6
Recent research within the field of health promotion has focused attention on the epidemic of
overweight and its association with unhealthy diets and lack of physical activity. This thesis
provides original research about eating and physical activity behaviours in younger
adolescents (11 to 15 years old), about important determinants for these behaviours and about
the effectiveness of interventions targeting eating and physical activity behaviours.
In accordance with the focus of the original research, the introduction of this thesis highlights
studies including 11 to 15 year olds. Although eating behaviours other than fat, fruit and soft-
drink intake may be important to consider for improved health, special attention was given to
these three eating behaviours throughout the introduction and the original research of this
thesis.
The first part of the introduction focuses on younger adolescents’ eating and physical activity
behaviours and health related issues. This is followed by a description of influencing factors
for eating and physical activity behaviours in adolescents are discussed. School-based and
computer-tailored intervention strategies promoting a healthy diet and a physically active
lifestyle are reviewed next. Finally, the outline of the thesis is described.
ADOLESCENTS, HEALTH AND HEALTH PROMOTION
Although the terms adolescents, health and health promotion are commonly used, a clear
definition of these relevant key terms seems necessary.
1. Key definitions: Adolescence, health, health promotion
The World Health Organization (WHO) defines ‘adolescence’ as the age between 10-19 years
old (WHO, 1997). In the same line, the Centers for Disease Control and Prevention
General Introduction
7
(www.cdc.gov) define adolescence as 12-19 years old, but they often group adolescents and
young adults (20-24 years old) together (NCHS, 2005). Independent from the definition used,
adolescence should be considered as a transitional phase that begins at the onset of puberty
and continues into early adulthood, rather than as a fixed age group (WHO, 1997). The
samples used in the original research of this thesis only included the youngest students of
secondary schools (7th and 8th graders). Since these students were between 11 and 15 years
old they can be considered as adolescents.
‘Health’ is often negatively defined as ‘absence of disease’. In 1940, the WHO formulated a
positive definition of health: ‘state of complete physical, emotional, and social well-being, not
merely the absence of disease or infirmity’ (WHO, 1948). This widely accepted definition was
expanded in the 1970's and 1980's as other components were included: intellectual,
environmental, and spiritual health. At the 1988 Consensus Conference ‘health’ was defined
as ‘a human condition with physical, social and psychological dimensions, each characterized
on a continuum with positive and negative poles.’ Positive health is associated with the
capacity to enjoy life and to withstand challenges. It is not only the absence of disease.
Negative health is associated with morbidity and in the extreme, with premature mortality
(Bouchard, et al., 1994).
The definition of ‘health promotion’ provided in the Ottawa Charter is the most widely
accepted. Health promotion is defined as: ‘the process of enabling people to increase control
over, and to improve, their health’ (WHO, Ottawa Charter for Health Promotion, 1986).
However, it is not the only definition of health promotion. For example, The American
Journal of Health Promotion (AJHP, 1989) offers another definition. ‘Health promotion is the
science and art of helping people change their lifestyle to move toward a state of optimal
health.’ Optimal health is defined as ‘a balance of physical, emotional, social, spiritual and
General Introduction
8
intellectual health.’ Lifestyle changes can be facilitated through a combination of efforts to
enhance awareness, change behaviour and create environments that support good health
practices. Supportive environments will probably have the greatest impact in producing
lasting change (O'Donnell, 1989).
Green and Kreuter (1990) define health promotion as the combination of educational and
environmental supports for actions and conditions of living conducive to health.
2. Why promote physical activity and healthy eating in adolescents?
From a health perspective there are three main reasons to promote healthy eating and physical
activity in adolescents: 1) to optimise current health, growth and development, 2) to develop
healthy lifestyles that can be maintained throughout adult life and 3) to reduce risks for
chronic diseases during adulthood.
Adolescence is a time when physiological need for consumption of a diet with good
nutritional quality is particularly important (Dwyer, 1993). During this period, adolescents
achieve the final 15-20% of adult height, gain 50% of adult weight, and accumulate up to
45% of their skeletal mass (Gong & Heald, 1994). Adolescence is a vulnerable period for
developing unhealthy eating habits as well as a physically inactive lifestyle. While the family
remains important, adolescence is an age characterized by increased mobility, independence
from home and greater financial autonomy (WHO, 2005), which enables youngsters to
purchase and consume their favourite food items and to spend their leisure time in many
different ways. For example, during adolescence eating out of home becomes more frequent
(Rolland-Cachera, et al., 2000).
General Introduction
9
A healthy diet as well as a physically active lifestyle has been associated with the prevention
of a number of health problems during adolescence and adulthood, including cardio-vascular
diseases, hypertension, diabetes, cancer, asthma, depression, osteoporosis and dental caries
(EURODIET group, 2001a&b; Biddle, et al., 2004; Penedo and Dahn, 2005; Strong, et al.,
2005). In addition, unhealthy eating behaviours often come together with physical inactivity
increasing the risk for developing health problems (Kvaavik, et al., 2004).
Tracking can be defined as ‘the stability of health-related behaviours over time or as stability
in rank at the group level’ (Kelder, et al., 1994). If dietary and physical activity behaviours
track into adulthood, the lifestyle we adopt in adolescence can have important impact on our
health and well-being as an adult. Although, it is plausible that behavioural patterns developed
during adolescence will affect behavioural patterns as adult, evidence supporting this is
equivocal. Results vary according to gender, study duration and age groups (Boreham and
Riddoch, 2001; Kvaavik, et al., 2004; Telama, et al., 2005). However, findings from several
studies somewhat support the hypothesis that dietary (Kelder, et al., 1994; Kemper, et al.,
1999; Lien, et al., 2001; Post, et al., 2001) and physical activity habits (Anderssen, et al.,
1996; Malina, 1996; Janz, et al., 2000; De Bourdeaudhuij, et al., 2002; Telama, et al., 2005)
are tracking into adulthood.
If promotion of a healthy diet and a physical active lifestyle among adolescents is assumed to
improve adult health, healthy changes in dietary and physical activity behaviours must also
track into adulthood. To our knowledge, no studies have investigated tracking of behavioural
changes from adolescence into adulthood. Nader and colleagues (1999) reported on the 3-year
persistence of intervention effects on dietary and physical activity behaviours among 8th grade
students, who were exposed to a 3-year long intervention from 2th to 5th grade. Intervention
effects on dietary and physical activity behaviour were maintained 3 years after intervention,
General Introduction
10
but narrowed over time. These findings suggest that health promotion should probably
continue from elementary school into secondary and high school to be able to affect
behavioural patterns as an adult.
Adolescents are often not concerned about health problems they may develop later in life and
although they may have notion of health related benefits of healthy eating and physical
activity, evidence suggests that this is not being translated into action (WHO, 1997). The
following sections provide evidence that adolescents eating (fat, fruit, soft drinks) and
physical activity behaviours do not meet recommendations. Although eating behaviours other
than fat, fruit and soft drink consumption (e.g. vegetable intake) may be worth targeting
during early adolescence, these three specific eating behaviours are further discussed, as these
are the eating behaviours targeted in the orginal research.
2.1 Current intake of fat, fruit and soft drinks in adolescents
According to guidelines published by the National Council on Nutrition, total energy from fat
should not exceed 30% of total energy intake (Nationale Council on Nutrition, 2003).
Guidelines formulated by the Flemish Institute for Health Promotion state that adolescents
should consume at least 2 pieces of fruit daily, whereas soft drink consumption should be
restricted to maximum one glass per day (www.vig.be).
Lambert, et al. (2004) reviewed studies reporting dietary behaviours of children and
adolescents in Europe. They mainly concluded that there is a need for standardisations of the
methods used to measure dietary intake, in order to make comparison between countries
possible. There are furthermore few reliable and valid instruments to measure dietary intake
in adolescents as especially adolescents are prone to reporting bias (Livingstone, et al., 2000
General Introduction
11
& 2004; Rockett, et al., 2003). Hence, when comparing adolescents eating behaviours with
recommended guidelines methodological issues need to be considered.
Although methodological issues should be kept in mind, studies have shown that fat intake
exceeds recommendations in most American (Lytle & Kubik, 2003), European (Cruz, 2000)
and Flemish (Matthys, et al., 2003) adolescents.
The international ‘Health Behaviour in School-aged Children study’ (HBSC) (2001-2002),
organized in 32 European and North-American countries indicated that low consumption of
fruit and high consumption of soft drinks is common among adolescents. Although this study
also included older adolescents, only the data on younger adolescents are further described.
About 70% of the 13 year olds did not eat fruit on a daily basis and about 30% consumed soft
drinks every day (Currie, et al., 2004). In Flemish 13 year olds, patterns were even worse with
about 74% of 13 year olds not consuming fruit daily and almost 40% consuming soft drinks
once or more per day (Currie, et al., 2004; Vereecken, et al., 2005).
2.2 Current physical activity levels in adolescents
Recommendation for appropriate amounts of physical activity, have been developed by
several organisations (Fulton, et al., 2004). Early criteria were generally based on the amount
of physical activity required for the development of cardiovascular physical fitness (Boreham
& Riddoch, 2001). However, these criteria were very stringent to achieve for most
adolescents (Boreham & Riddoch, 2001). From a behavioural perspective, physical activity
needs to be seen as an achievable and positive experience and adult fitness training guidelines,
emphasizing continuous bouts of vigorous exercise do not fulfil this. The more recently
formulated guidelines incorporate issues of activity adoption and maintenance.
General Introduction
12
In 1994 the ‘International Consensus Conference on Physical Activity Guidelines for
Adolescents’ recommended that adolescents should be physically active daily and participate
in moderate to vigorous physical activity three or more times a week for at least twenty
minutes. Moderate to vigorous activities were defined as those that require at least as much
effort as brisk walking (Sallis & Patrick, 1994). This guideline was later revised during the
‘Consensus Conferences on Physical Activity and Cardiovascular Health’ (1996) and
recommendations were reformulated into ‘at least 30 minutes or more of moderate-intensity
physical activity on most, or preferably all, days of the week’. Although several studies
showed that the majority of adolescents met the 30 minutes criterion, health related problems
such as overweight (Chinn & Rona, 1994) and coronary heart disease risk factors
(Baranowski, et al., 1992) were still rising. This was the rationale to advocate a new
recommendation, first formulated in 1998 by the ‘UK Expert Consensus group’ (Biddle, et
al., 1998). Engagement in physical activity of moderate to vigorous intensity for at least 60
minutes and up to several hours daily was recommended (Pate, et al., 2002; Fulton, et al.,
2004; Strong, et al., 2005). This latter guideline is consistent with the recommendations of the
‘Health Enhancing Physical Activity Group of Belgium’ (Beunen, et al., 2001).
When comparing adolescents’ physical activity levels with the recommendations,
measurement issues need to be considered. Physical activity is not simple to measure, since it
takes place in a variety of domains (e.g. transportation, school, recreation) and intensity,
frequency, duration and type of activity need to be considered (Wareham & Rennie, 1998).
Most representative data on physical activity levels in adolescents are based on self-reports
(Wareham et al, 1998). Even though most questionnaires are constructed with attention to the
different domains of activity, self-reports often result in overestimation, which makes
comparisons with physical activity guidelines difficult (Wareham et al, 1998).
General Introduction
13
Although in previous research there was a large variation in recommendations, definitions and
measurements used, boys were consistently found to be more active than girls (Stone, et al.,
1998; Pate, et al., 2002; Biddle, et al., 2004; Currie, et al., 2004), adolescence was
consistently found to be a period of steep decline in physical activity and adolescents were
consistently found not to be sufficiently active (Stone, et al., 1998; Sallis, 2000; Kimm, et al.,
2002; Biddle, et al., 2004). Most recently conducted studies in American (Pate, et al., 2002);
European (Currie, et al., 2004) and Flemish (Currie, et al., 2004; De Bourdeaudhuij, et al.,
2005) adolescents showed that considerable proportions of adolescents do not meet the
physical activity guideline of 60 minutes of moderate to vigorous physical activity daily. In
the same line, findings from the international HBSC-study indicated that on average 66% of
the younger adolescents did not meet the current recommended guidelines (Currie, et al.,
2004). ‘Not meeting the current guidelines’ was defined as an average score of less than 5 on
the following questions ‘Over the 7 past days how many days were you physically active for a
total of at least 60 minutes per day’ and ‘Over a typical or usual week, on how many days are
you physically active for a total of at least 60 minutes per day’. About 80% of 13 year-old
Flemish adolescents did not meet these physical activity guidelines. According to data from
the same study, Flemish adolescents reported to participate in 60 minutes of moderate-
intensity activities on average on 3 days per week, however averages of 2 days per week were
found in another study (De Bourdeaudhuij, et al., 2005). Pate and colleagues (2002)
objectively measured physical activity with accelerometers in US adolescents and found that
37.5% of adolescent boys and 45.8% of adolescent girls between 10 to 12 years old did not
comply with physical activity guidelines of 60 minutes of moderate to vigorous physical
activity daily. Moderate to vigorous intensity was defined as > 1952 counts per minute
General Introduction
14
according to Freedson and colleagues (1998), which may have led to an overestimation of the
time spent in moderate to vigorous physical activity.
Previous sections (2.1, 2.2) provided evidence that eating and physical activity behaviours do
not meet recommendations in adolescents. The relationships between unhealthy eating and
physical activity behaviours and the increased prevalence rates of overweight and obesity are
discussed below (3.3). But first information regarding overweight related health issues (3.1)
and overweight prevalence rates (3.2) is provided.
3. Unhealthy eating and physical activity habits and overweight in adolescents
3.1 Introduction
Overweight can be defined as ‘an excess in weight, regardless of the composition of the
weight’. Obesity can be defined as ‘an excess in body fat such that health is endangered’.
Overweight adolescents are at risk for becoming obese and obesity in children and
adolescents has several short term health consequences (Reilly, 2005). It is now well
established that obesity has adverse effects on the cardiovascular system, since it is
consistently associated with cardiovascular risk factors such as high blood pressure,
hyperlipidemia or elevated insulin levels (Freedman, et al., 1999; Reilly, 2005). In addition
obese adolescents are more likely to develop asthma (Castro-Rodriguez, et al., 2001), type I
(Hypponen, et al., 2000) and type II diabetes (Dietz, 1998 a&b; Deckelbaum & Williams,
2001; Arslanian, 2002), orthopaedic problems (Deckelbaum & Williams, 2001) and
psychological problems such as a low self esteem and depression (Strauss, 2000). Obesity is
further associated with a reduced capacity for being physically active (Molnar & Livingstone,
2000). However, the greatest problems will be seen in the next generation of adults as obesity
during adolescence tends to persist into adulthood (Guo & Chumlea, 1999; Hulens, et al.,
General Introduction
15
2001). Furthermore, negative cardiovascular effects persist and represent a strong link
between obesity and adult morbidity and mortality (Freedman, et al., 1999; Guo & Chumlea,
1999; Reilly, 2005; Wyatt, et al., 2006).
3.2 Prevalence of overweight and obesity
There is a lack of comparable representative overweight prevalence data for different
countries, due to the varying definitions and measurement of overweight or obesity (Reilly,
2005). Recently, the ‘International Obesity Task Force’ (IOTF) recommended age- and sex
specific body mass index cut-off points for overweight and obesity in children and
adolescents (Cole, et al., 2000). To get such cut-off points, centile curves that passed through
adult cut-off points of body mass index for overweight (25 kg/m2) and obesity (30 kg/m2) at
age 18 years were derived (Cole, et al., 2000).
Based on the IOTF reference, prevalence rates of overweight and obesity were determined in
different countries (Lobstein, et al. 2004, Janssen, et al., 2005). Available data suggest that the
prevalence of overweight is unequally distributed and that overweight prevalence is rapidly
rising (Lobstein, et al. 2004).
Ten percent of the world’s children and adolescents (age 5-17 years) were estimated to be
overweight or obese (Lobstein, et al., 2004). The prevalence of overweight was found to be
dramatically higher in more developed regions. The highest prevalence rates of overweight
were consistently found in US adolescents, with prevalence rates averaging above 30%
(Wang, et al., 2002; Lobstein, et al., 2004). Also in Europe, prevalence rates were found to be
very high and average above 20% (Lobstein, et al., 2003 & 2004). In Africa and Asia
General Introduction
16
prevalence rates were much lower and average below 10% (Wang, et al., 2002; Lobstein, et
al., 2004).
In Flanders, the prevalence of overweight and obesity in 3 to 18 year old Flemish children
was estimated at 14 % in 1996-1997, with higher prevalence rates in girls (Roelants &
Hoppenbrouwers, 2001). Recently, overweight prevalence rates were estimated at 8.5% in 11
to 18 year olds (De Bourdeaudhuij, et al., 2005) and at 10.2% in 10 to 16 year olds (Janssen,
et al., 2005) based on IOTF recommendations. However, the latter data were based on self-
reported data which could have lead to underestimation of prevalence rates (Janssen, et al.,
2005).
Overweight prevalence rates are still increasing. In North America and Europe prevalence
rates are increasing at approximately 0.5-1% per year (Wang, et al., 2002; Lobstein, 2004).
Also in Belgium, prevalence rates of overweight or obesity have increased between 1969 and
1993, with the most overweight children becoming even more overweight (Hulens, et al.,
2001).
3.3 Energy balance and overweight in adolescents
In more developed countries overweight prevalence is increasing at such dramatic rates that
genetic factors can no longer account for this change (Hulens, et al., 2001; Lobstein, et al.,
2004; Stamatakis, et al., 2005). Hence, an imbalance of the energy balance equation is causing
the rising prevalence of overweight and obesity (Reilly & Dorosty, 1999; Lobstein, 2004).
Energy intake is one side of the energy balance equation, making unhealthy eating behaviours
one of the risk factors for the development of overweight or obesity. Unhealthy eating
patterns have been associated with prevalence of overweight and obesity in children and
adolescents in cross-sectional studies (Garaulet, et al., 2000; Stockman, et al., 2005).
General Introduction
17
However, findings from longitudinal studies were less clear (Lobstein, 2004) and findings
were more consistent for fat intake than for total energy intake (Davison & Birch, 2001;
Sarnblad, et al., 2006). Positive associations between consumption of soft drinks and
overweight or obesity in adolescents were also found, however soft drink consumption was
associated with other unhealthy dietary habits and the association may not have been related
to soft drink consumption per se (Ludwig, et al., 2001). Although it seems logical that the rise
in overweight or obesity prevalence might be partially due to a higher energy intake, some
studies in US adolescents point out that while overweight prevalence rates have doubled,
energy intakes have decreased (Whitehead, et al., 1982; Cavadini, et al., 2000). However,
other data suggest that energy intake increased over time, while self-reported energy intakes
decreased (Harnack, et al., 2000) and several studies point towards an increase in
consumption of food items with a higher energy density (Harnack, et al., 2000; Prentice &
Jebb, 2004).
Energy expenditure is the other side of the energy balance equation. However, the influence
of activity related energy expenditure on adolescents’ body weight is still controversial. Most
previously conducted studies were cross-sectional studies and found no differences in activity
related energy expenditure between obese and normal weight adolescents, after adjustment for
differences in body composition (Bandini et al., 1990; Threuth et al., 1998; Ekelund et al,
2002). Conversely, studies have found lower levels of physical activity in overweight than in
normal weight youngsters (Trost, et al., 2001; Ekelund et al., 2002, Mota, et al., 2002;
Deforche, et al., 2003). The discrepancy between the findings for physical activity and
activity related energy expenditure are explained by the increased energy cost of moving a
larger body mass in overweight or obese adolescents (Ekelund et al., 2002).
General Introduction
18
Results from longitudinal studies differ according to age-group, study duration and
measurements (Wareham, et al., 2005), but low levels of physical activity have been
associated with increased weight gain or increased risk for developing overweight or obesity
(Wareham, et al., 2005). Hence, the decline in physical activity levels observed during the
past decades is often linked to the rise in overweight prevalence (Biddle, et al., 2004;
Dollman, et al., 2005).
3.4 Challenge for health promotion
Obesity is increasingly recognized as a threat to public health and it is therefore important to
develop and evaluate effective interventions that can counter these worrying trends. Several
studies suggest that most children and adolescents are at risk for weight gain, thus strategies
to prevent obesity will benefit the health of all children and adolescents (Lobstein, et al.,
2004). In order to counter the rise in overweight prevalence, effective interventions to
promote healthy eating and physical activity should be developed. Since behaviour can not be
changed directly, it is important to get insight into important influencing factors or
behavioural determinants for healthy eating and physical activity.
INFLUENCING FACTORS FOR (UN)HEALTHY EATING HABITS AND PHYSICAL (IN)ACTIVITY IN
ADOLESCENTS
1. Introduction
Behavioural determinants are ‘causal factors that induce an individual to engage in a
particular behaviour’ (Evans, 2004). The relationships between determinants and health
behaviour have led to the construction of several health behaviour theories. These theories can
be placed along a continuum of personal level theories on one end of the continuum and
General Introduction
19
environmental theories on the other end. Personal or social psychological determinants focus
primarily on cognitions that determine behaviour; whereas environmental determinants are
related to the physical, social or institutional environment. An overview of the most relevant
health promotion theories at the individual and environmental level that were applied within
the nutrition and physical activity literature is given below. This is followed by a description
of studies investigating the influence of factors derived from one or multiple theories on
eating and physical activity behaviours.
2. Personal-level theories
In recent years there has been a gradual development of models to explain and modify
behaviour. The most prominent theories that focus primarily on intrapersonal processes are
The Health Belief Model (Janz & Becker, 1984), the Theory of Reasoned Action/Planned
Behaviour (Ajzen, 1985); the Social Learning Theory (Bandura 1977 & 1986), the Attitude,
Social influence and self-Efficacy (ASE) model (De Vries, et al., 1995 & 1998) and the
Transtheoretical Model (Prochaska, et al., 1992).
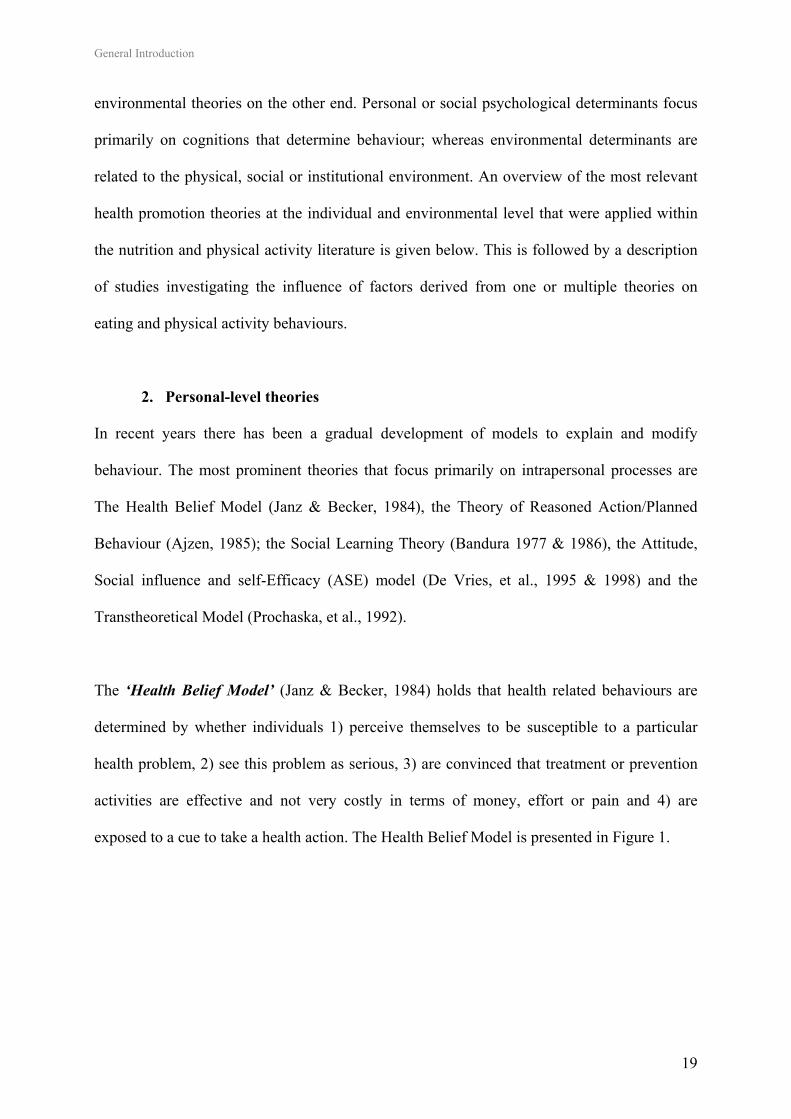
The ‘Health Belief Model’ (Janz & Becker, 1984) holds that health related behaviours are
determined by whether individuals 1) perceive themselves to be susceptible to a particular
health problem, 2) see this problem as serious, 3) are convinced that treatment or prevention
activities are effective and not very costly in terms of money, effort or pain and 4) are
exposed to a cue to take a health action. The Health Belief Model is presented in Figure 1.
General Introduction
20
Figure 1: The Health Belief Model
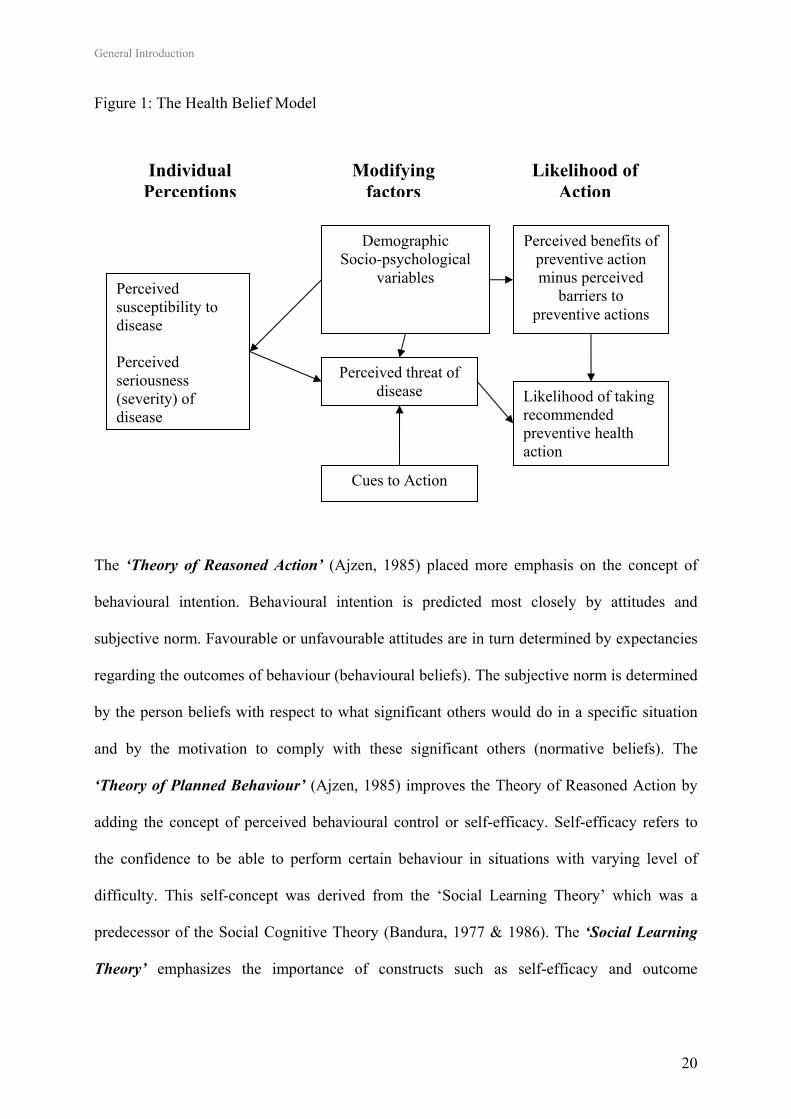
The ‘Theory of Reasoned Action’ (Ajzen, 1985) placed more emphasis on the concept of
behavioural intention. Behavioural intention is predicted most closely by attitudes and
subjective norm. Favourable or unfavourable attitudes are in turn determined by expectancies
regarding the outcomes of behaviour (behavioural beliefs). The subjective norm is determined
by the person beliefs with respect to what significant others would do in a specific situation
and by the motivation to comply with these significant others (normative beliefs). The
‘Theory of Planned Behaviour’ (Ajzen, 1985) improves the Theory of Reasoned Action by
adding the concept of perceived behavioural control or self-efficacy. Self-efficacy refers to
the confidence to be able to perform certain behaviour in situations with varying level of
difficulty. This self-concept was derived from the ‘Social Learning Theory’ which was a
predecessor of the Social Cognitive Theory (Bandura, 1977 & 1986). The ‘Social Learning
Theory’ emphasizes the importance of constructs such as self-efficacy and outcome
Perceived susceptibility to disease Perceived seriousness (severity) of disease
Individual Perceptions
Modifying factors
Likelihood of Action
Perceived threat of disease Likelihood of taking
recommended preventive health action
Cues to Action
Demographic Socio-psychological
variables
Perceived benefits of preventive action minus perceived
barriers to preventive actions
General Introduction
21
expectances in influencing interactions between cognitions and behaviour. The Theory of
Reasoned Action and Planned Behavior are presented in Figure 2.
Figure 2: Theory of Reasoned Action and Planned Behavior
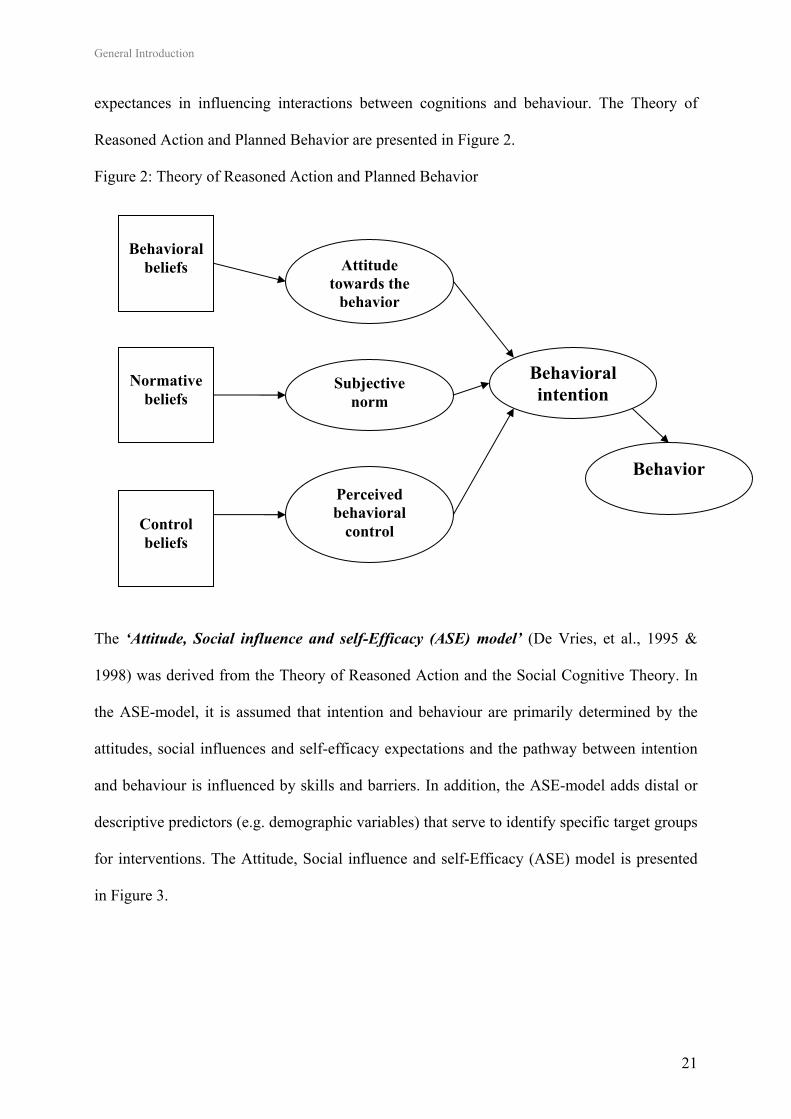
The ‘Attitude, Social influence and self-Efficacy (ASE) model’ (De Vries, et al., 1995 &
1998) was derived from the Theory of Reasoned Action and the Social Cognitive Theory. In
the ASE-model, it is assumed that intention and behaviour are primarily determined by the
attitudes, social influences and self-efficacy expectations and the pathway between intention
and behaviour is influenced by skills and barriers. In addition, the ASE-model adds distal or
descriptive predictors (e.g. demographic variables) that serve to identify specific target groups
for interventions. The Attitude, Social influence and self-Efficacy (ASE) model is presented
in Figure 3.
Attitude towards the
behavior
Subjective norm
Perceived behavioral
control
Behavioral intention
Behavior
Behavioral
beliefs
Normative
beliefs
Control beliefs
General Introduction
22
Figure 3: The Attitude, Social influence and self-Efficacy (ASE) model
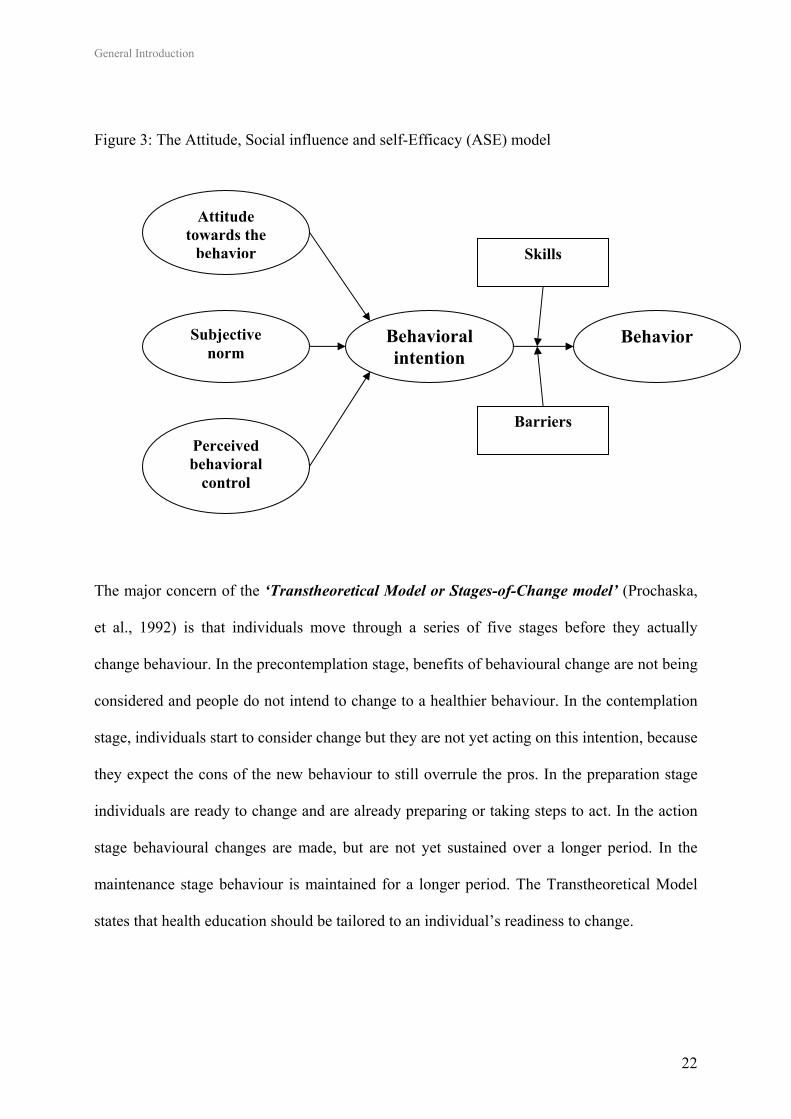
The major concern of the ‘Transtheoretical Model or Stages-of-Change model’ (Prochaska,
et al., 1992) is that individuals move through a series of five stages before they actually
change behaviour. In the precontemplation stage, benefits of behavioural change are not being
considered and people do not intend to change to a healthier behaviour. In the contemplation
stage, individuals start to consider change but they are not yet acting on this intention, because
they expect the cons of the new behaviour to still overrule the pros. In the preparation stage
individuals are ready to change and are already preparing or taking steps to act. In the action
stage behavioural changes are made, but are not yet sustained over a longer period. In the
maintenance stage behaviour is maintained for a longer period. The Transtheoretical Model
states that health education should be tailored to an individual’s readiness to change.
Attitude towards the
behavior
Subjective norm
Perceived behavioral
control
Behavioral intention
Behavior
Skills
Barriers
General Introduction
23
3. Role of the health environment, social-ecological and social-cognitive theories
Ecological models such as the Social Ecological (Green, et al., 1996) and Social Cognitive
Theory (Bandura, 1977 & 1986) provided theoretical insights into the role of the environment
in shaping behaviours. The Social Ecological Theory posits that ‘the environment controls or
limits the behaviour that occurs within it’ (Green, et al., 1996). Within the Social Cognitive
Theory, the key concept states that ‘behaviours are influenced by personal, environmental
and behavioural factors that are dynamic and constantly interacting’ (Bandura, 1986). In
addition to the previously mentioned personal-level theories that have emphasized the
dynamic interaction between individual factors and behaviour, ecological models hence
recognize interactions between individual factors and environment (Sallis & Owen, 2002).
A distinction is made between socio-cultural, institutional, and physical environmental factors
(Bandura, 1986; Green, et al., 1996; Sallis & Owen, 2002). The social environment includes
social support, role modelling, persuasion and social norms from e.g. peers, family and mass
media. The institutional environment includes rules of policies established by institutions to
which individuals belong such as schools and clubs. The physical environment includes
factors such as climate, facilities and services.
Based on the ecological models, the health environment can be defined as ‘all environmental
factors that facilitate or hinder an individual’s health-related behaviour’ (Sallis & Owen,
2002).
4. Correlates of eating behaviours in adolescents
The research field regarding correlates of eating behaviours in adolescents is still mainly
based on cross-sectional studies. Although dependent variables often differed across studies,
gender, age and socio-demographic factors were consistently found to be descriptive or distal
General Introduction
24
predictors important to consider. When compared to boys, girls were more likely to eat a low-
fat (French, et al., 1999; Lien, et al., 2002), low-sugar diet (Lien, et al., 2002) and girls were
also found to be more receptive to healthy eating messages (McVey, et al., 2005). Dietary
habits tend to become less healthy with increasing age, studies found that fruit intake
decreased with age (Lien, et al., 2002, Vereecken, et al., 2005), whereas the consumption of
soft drink consumption increased (Vereecken, et al., 2005). Lower income and lower
educational status of parents and adolescents were also associated with lower levels of fruit
intake and higher levels of sugar and soft drink consumption (Lien, et al., 2002; Vereecken, et
al., 2004 & 2005). Lower income parents have less money to spend and foods that are high in
sugar and fat are more often among the least expensive sources of dietary energy (Taylor, et
al., 2005). Thus boys, older youngsters, and lower-income adolescents can be considered at
higher risk for unhealthy eating habits.
Psychosocial influences such as attitudes (De Bourdeaudhuij & Van Oost, 2000), beliefs
(French, et al., 1999), perceived benefits (Neumark-Sztainer, et al., 1999), and self-efficacy
(French, et al., 1999), were also associated with eating behaviours in adolescents. For
example positive beliefs about low fat snacks, self-efficacy to choose a low-fat snack, desire
to choose a healthy snack and interest in body weight were all related to higher consumption
of low fat snacks (French, et al., 1999). In Flemish adolescents attitudes and self-efficacy
were related to fat, fruit and soft drink consumptions, on the other hand correlations with
social support were less pronounced (De Bourdeaudhuij & Van Oost, 2000). Findings from
focus groups in US adolescents revealed that convenience and the amount of time they want
to spend on food are among the most important factors influencing adolescents’ food choices
(Neumark-Sztainer, et al., 1999). Taste preference was also found to be an important correlate
for several eating behaviours such as low-fat snacking (French, et al., 1999), fruit intake
General Introduction
25
(Neumark-Sztainer, et al., 2003; Bere & Klepp, 2004) and soft drink consumption (Grimm, et
al., 2004). Personal preferences for eating fast food or vending machine snacks have been
identified as barriers to eat healthy (French, et al., 1999).
Within the social environment, family and friends were found to exert considerable influence
on adolescents’ eating behaviours (Taylor, et al., 2005). For example soft drink consumption
of parents and friends were strongly associated with soft drink consumption in children and
adolescents (Grimm, et al., 2004). Fewer family meals resulted in lower fruit (Gillman, et al.,
2000; Videon & Manning, 2003) and higher soft drink consumption among adolescents
(Gillman, et al., 2000). Adolescents themselves associated healthy eating with eating family
meals (Neumark-Sztainer, et al., 1999). Better family relationships were also associated with
higher fruit and lower soft drink consumption (Lien, et al., 2002). Authoritative parenting
styles combining higher levels of parental control with involvement were associated with
higher fruit intake (Kremers, et al., 2003). On the other hand permissive parenting giving
adolescents more decision-making power about food was associated with less healthy eating
behaviours (De Bourdeaudhuij & Van Oost, 2000). Taylor, et al. (2005) reviewed the
literature regarding determinants of healthy eating and one of their conclusions was that an
authoritarian parenting style, characterized by restricting unhealthy food items and using
healthy food items as a reward, was found to increase intake of unhealthy food items once
restriction was removed.
Next to the social environment, multiple aspects of the physical environment were found to be
influential for eating behaviours. Availability (Neumark-Sztainer, et al., 1999 & 2003;
Hanson, et al., 2005; Vereecken, et al., 2005) and accessibility (Bere & Klepp, 2004) of
healthy and unhealthy food items at home or at school were identified as important
General Introduction
26
determinants of consumption of these products (Taylor, et al., 2005). For example soft drink
consumption was influenced by availability at home and by the presence of vending machines
at school (Grimm, et al., 2004). Exposure to food advertising was another important
influencing factor of the physical environment. Food advertisements promote more frequently
consumption of less healthy foods, including high fat and energy dense snacks and rarely
feature healthy choices such as fruits (Taylor, et al., 2005). This is a concern, since children
are more likely to request, purchase and consume food items that they have seen on television.
For example television viewing, used as a proxy measure of exposure to advertisement, was
found to be associated with soft drink consumption in US children (Grimm, et al., 2004). In
Flemish adolescents TV viewing was generally found to be accompanied with the intake of
food and snacks (Van den Bulck & Van Mierlo, 2004; Vereecken, et al., 2006).
In conclusion, although the investigated eating behaviours differed across studies, several
demographic (gender, age, SES), psychosocial (attitudes, beliefs, benefits, self-efficacy),
social-environmental (family, friends) and physical-environmental factors (availability,
accessibility, advertisement) were found to be influential for fat, fruit or soft drink
consumption. In order to develop effective interventions, it is important to get more insight
into the influencing factors for these behaviours among Flemish adolescents.
5. Correlates of physical activity in adolescents
The research field regarding correlates of physical activity in adolescents is also mainly based
on cross-sectional studies and is still growing. As with correlates of eating behaviours,
gender, age and socio-demographic factors are also important descriptive or distal predictors
for physical activity. Boys were consistently found to be more active than girls (Sallis, et al.,
2000; Pate, et al., 2002; Trost, et al., 2002; Biddle, et al., 2004; Currie, et al., 2004) and
General Introduction
27
physical activity levels decline dramatically with age in both boys and girls with the steepest
decline in adolescence (Sallis, 2000; Pate, et al., 2002; Currie, et al., 2004). Physical activity
levels were found to be unrelated to socioeconomic status, when SES was defined as a
composite of education, income and occupational status (Sallis, et al., 2000). However, higher
parents’ and adolescents’ education levels per se were found to be related to increased
physical activity levels (Schmitz, et al., 2002; De Bruijn, et al., 2005). Thus, girls, older
youngsters and lower-educated adolescents can be considered at higher risk for inactivity.
The relationships between psychosocial variables and physical activity were reviewed by
Sallis and colleagues (2000) and it was concluded that results regarding self-efficacy,
attitudes, perceived benefits and barriers were inconsistent (Sallis, et al., 2000). On the other
hand achievement orientation, perceived competence and intention to be active were more
consistently related to physical activity in adolescents (Biddle & Goudas, 1996; Sallis, et al.,
2000).
Most of the recently conducted studies in adolescents found associations between some of the
psychosocial determinants and physical activity levels in adolescents (Fein, et al., 2004; De
Bourdeaudhuij, et al., 2005; De Bruijn, et al., 2005 & 2006; Motl, et al., 2005). In Flemish
adolescents a better attitude, higher self-efficacy, more support from family and friends, the
perception of more competition benefits and of less barriers such as lack of time or interest
were all associated with higher physical activity levels (De Bourdeaudhuij, et al., 2005). Self-
efficacy was a significant predictor of energy expenditure in Canadian adolescents (Fein, et
al., 2004) and of physical activity in American (DiLorenzo, et al., 1998) and Dutch
adolescents (De Bruijn, et al., 2005 & 2006). In addition, intention, attitude, self-efficacy and
subjective norm were associated with bicycle use in Dutch adolescents (De Bruijn, et al.,
General Introduction
28
2005). Self-efficacy for overcoming barriers was also a mediator of the effect of perceived
equipment accessibility in the home (e.g. bicycles, balls, skates) and the community (e.g.
playgrounds, parks, gyms) on physical activity in US girls (Motl, et al., 2005). In a recent
study in American adolescents self-regulation (e.g. goal setting, self-monitoring, self-reward),
was the most important construct in explaining daily participation in moderate to vigorous
physical activity (Petosa, et al., 2005). In American girls, higher physical activity levels were
further associated with girls placing a higher value on health, appearance and achievement
(Schmitz, et al., 2002).
With regard to the social environment, correlates of adolescents’ physical activity were most
widely investigated in the family or home environment. Modelling of physical activity from
parents, siblings and friends was extensively investigated and no relevant associations with
physical activity were found (Brug, & Van Lenthe, 2005). However, several studies found
that adolescents’ physical activity levels were influenced by parental and peer support for
physical activity (DiLorenzo, et al., 1998; Sallis, et al., 2000; Trost, et al., 2003; Frenn, et al.,
2005). Parental support consisted of providing transportation, observing and encouraging
(Trost, et al., 2003). One study showed that like in eating behaviours, non-authoritative
parenting style was also positively associated with physical activity in adolescents (Schmitz,
et al., 2002).
The physical environment may play especially an important role for physical activity, because
physical activity occurs in specific settings (Sallis, et al., 1998). Studies investigating
environmental correlates of physical activity in adolescents are still scarce. Environmental
characteristics associated with adolescents’ physical activity levels were availability of
recreational facilities (Mota, et al., 2005), opportunities to be physically active (Gordon-
General Introduction
29
Larsen, 2000, Sallis, et al., 2000), neighbourhood safety (Gordon-Larsen, 2000), sidewalk
characteristics (Jago, et al., 2005) and perceived importance of the school environment (Fein,
et al., 2004).
In conclusion, several demographic factors (gender, age, education) were important in
explaining physical activity. No general conclusion can be drawn regarding psychosocial
determinants. Although recent studies showed associations between some of the psychosocial
determinants and physical activity, results were still inconsistent and more studies are
required. Within the social environment parental en peer support were found to be influential,
whereas modelling from parents was not. Although studies regarding physical-environmental
variables were still scarce, recent research provided evidence for the important role of these
factors.
When reading the above sections regarding correlates of eating and physical activity
behaviours, readers may have become aware that school-related variables were not yet
discussed. These factors are further outlined in the following part of the introduction that
starts with a brief description of the role of the school in shaping eating and physical activity
behaviours, to continue with an overwiew of school-based healthy eating and physical activity
interventions.
USING THE SCHOOL AS A SETTING TO PROMOTE HEALTHY EATING AND PHYSICAL ACTIVITY
1. Introduction: role of the school
Ideally health promoting interventions should combine both educational and environmental
support as defined earlier (Green & Kreuter, 1990). The school is one of the most important
General Introduction
30
environments for adolescents’ health (Shepard, et al., 2002) and that the school is as an ideal
setting for health education is self-evident. The school’s nutrition and physical activity
environment can be conceptualized as any external factor that could influence eating and
physical activity behaviours of its students (Wechsler, et al., 2000). Influencing factors for
eating behaviours are food and beverages offered during meals, food and beverages available
at school outside meals (e.g. vending machines and school stores) and nutrition education
classes. Influencing factors for physical activity are recess periods, intramural sports and
physical activity programs, facilities that support physical activity (e.g. accommodation, sport
materials) and physical education classes (Wechsler, et al., 2000). Policies, audiovisual cues,
qualified staff; role modelling of teachers and incentives in the school’s physical environment
are important factors for both behaviours (Wechsler, et al., 2000; Kubik, et al., 2003).
2. School-based healthy eating and physical activity interventions in adolescents
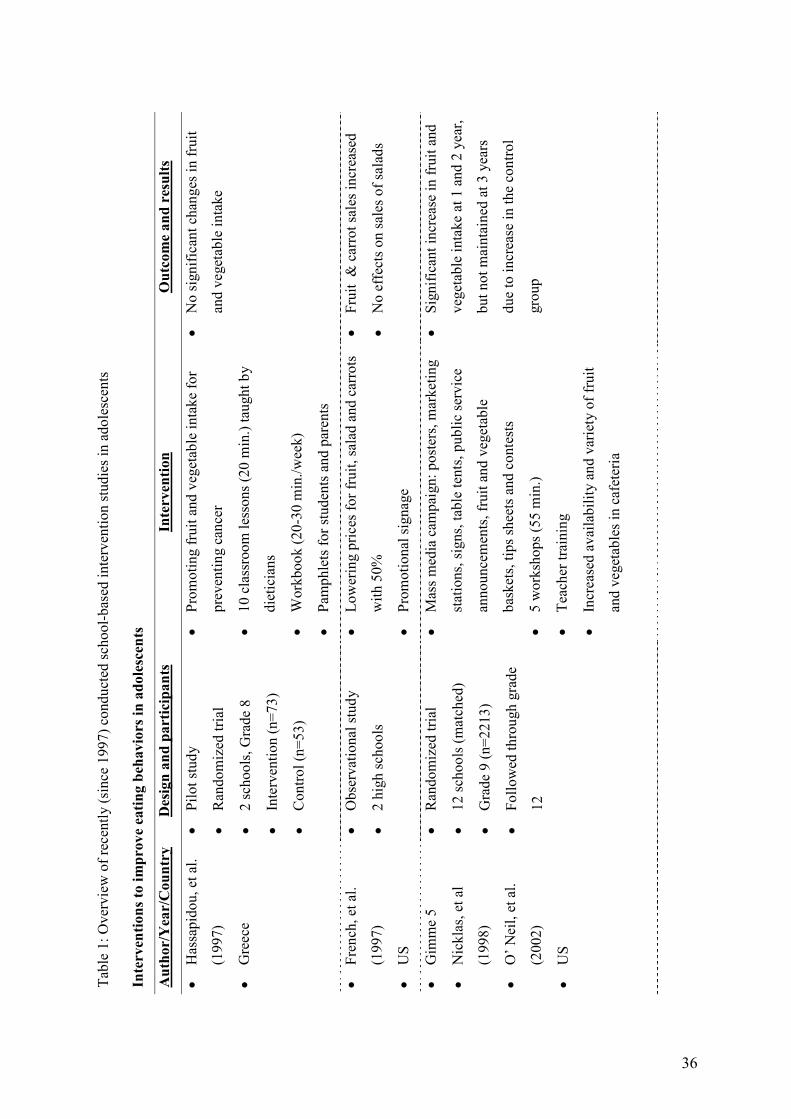
Table 1 gives an overview of recently conducted intervention studies in adolescents.
2.1 Interventions to improve eating behaviours in adolescents
Thomas, et al. (2004) reviewed school-based interventions and concluded that most
interventions targeting eating behaviours consisted of classroom curricula and were only
effective in improving knowledge; actual food intake was more resistant to change. Most
interventions were conducted in elementary school children and most successful interventions
consisted of at least 10 sessions, involving cafeteria choices and parental support. For
example, The ‘Know your body’ intervention that started in elementary school and lasted for
five years (Walter, 1989), featuring classroom education and parental involvement, was
effective in changing fat intake.
General Introduction
31
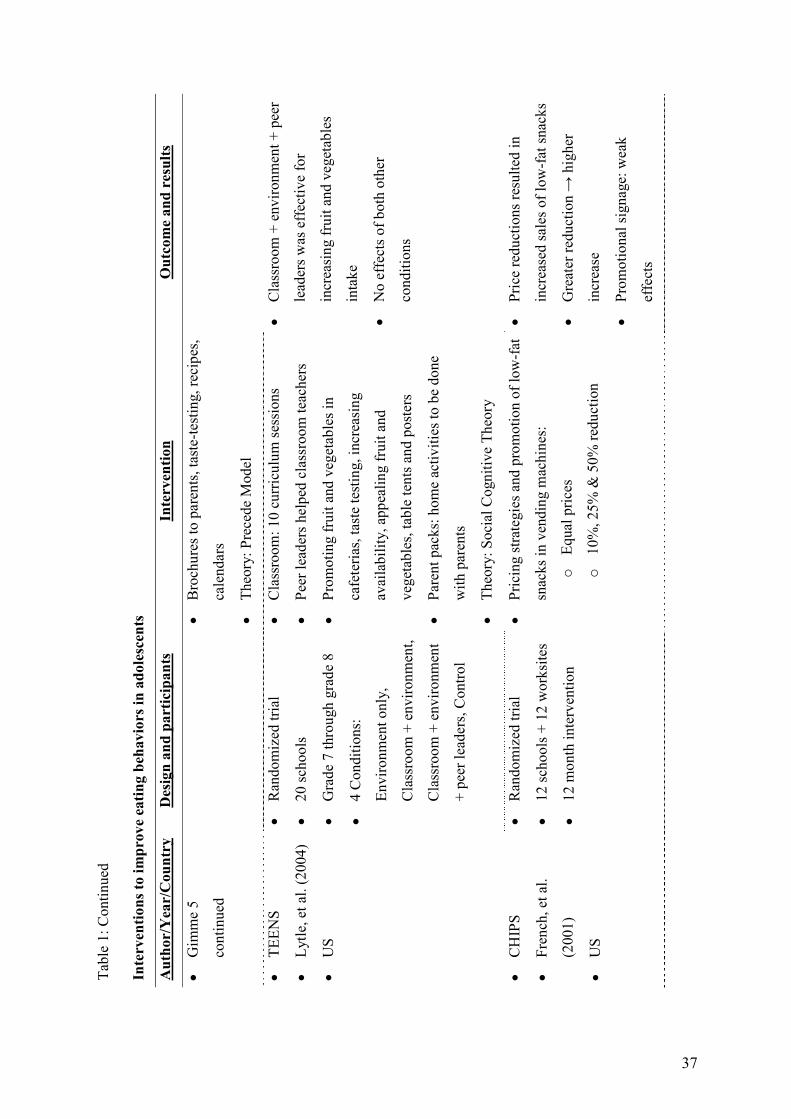
The combination of classroom curricula with environmental interventions also seems
promising to target fruit, vegetable and fat intake in adolescents (O'Neil & Nicklas, 2002;
Lytle, et al., 2004), whereas curricula per se have led to less positive results (Hassapidou, et
al., 1997). The “Gimme 5” intervention consisted of a curriculum of five one-hour workshops
regarding knowledge, attitude and skills. The intervention further focused on increasing fruit
and vegetable availability in cafeterias, involving parents through mailing and providing
information brochures (O'Neil & Nicklas, 2002). The intervention lasted for three school
years and was effective for increasing fruit and vegetable consumption with over 2.5 servings
a day. The Teens Eating for Energy and Nutrition at Schools (TEENS) study was a 2-year
intervention study conducted in American middle schools (Lytle, et al., 2004). The
intervention included 10 classroom sessions, cafeteria promotion of fruit and vegetables and
lower fat foods, and newsletters and home activities included in parent packs. At the end of
the first intervention year, fruit and vegetable intake as well as food-choice scores (choice of
lower fat versus higher fat foods) were improved as a result of the multi-component
intervention (environmental + classroom + peer-support). However, after 2 school years
positive intervention effects were only seen for food choice score, but no effects on food
intake were found (Lytle, et al., 2004). A pilot study conducted among high school students in
Greece, promoting fruit and vegetable intake by providing ten 20-minute classroom sessions
and by providing workbooks and information for parents, was not effective for increasing
fruit and vegetable intake (Hassapidou, 1997).
Some of the above mentioned interventions (O'Neil & Nicklas, 2002; Lytle, et al., 2004)
included passive environmental components such as increasing availability of healthy food
products in canteens. Active environmental approaches such as lowering the price of fruit and
General Introduction
32
vegetables (French, et al., 1997) or low-fat snacks in vending machines (French, et al., 2001)
were also found to be effective to increase the consumption of these food items.
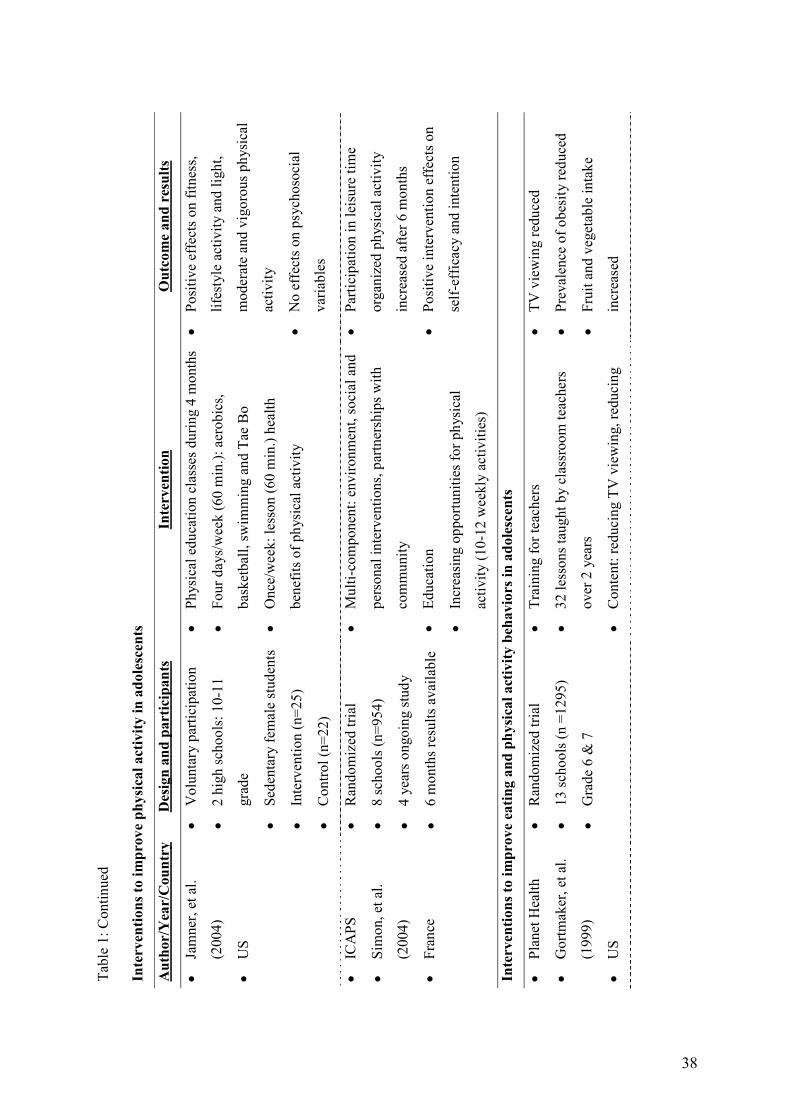
2.2 Interventions to increase physical activity in adolescents
Most studies promoting physical activity were conducted in US elementary school children
(Thomas, et al., 2004). Classroom health education curricula per se were in general not
effective for increasing physical activity (Kahn, et al., 2002). On the other hand, physical
education interventions with a focus on increasing moderate to vigorous physical activity
levels during physical educations classes did show promising results (Sallis, et al., 1997;
Kahn, et al., 2002). Recently a physical education program was evaluated as a part of the
middle school physical activity and nutrition (M-SPAN) program, and was found to result in
an increase in physical activity levels during physical education classes by 20%, without
increasing time in physical education classes (Mckenzie, et al., 2004). In other studies short-
term effects of offering extra physical activities were investigated (Eliakim et al., 1997;
Jamner, et al., 2004). For example, the combination of a weekly one-hour health education
lesson with four weekly one-hour physical education classes was effective for preventing
declines in physical activity in sedentary unfit adolescents girls (Jamner, et al., 2004).
The studies that incorporated whole-of-school approaches including curriculum, policy and
environmental strategies appeared to be the most effective (Timperio, et al., 2004). The
“Intervention Centred on Adolescents’ Physical activity and Sedentary behaviour” (ICAPS) is
a four year (2002-2006) intervention program conducted in French middle schools (Simon, et
al., 2004). This intervention was not limited to the school setting alone, it was a multilevel
program directed at affecting intrapersonal, social and environmental determinants of physical
activity. It involved multiple partners with three objectives: 1) changing knowledge, attitudes,
General Introduction
33
beliefs and motivation towards physical activity by means of information and debates and also
by offering activities during breaks and after-school hours, 2) encouraging social support by
parents, peers, teachers and physical activity instructors and 3) providing environmental
conditions that enable physical activity. After six months, increases in leisure time physical
activity were found in the intervention groups.
2.3 Interventions targeting eating and physical activity behaviours in
adolescents
Shepard, et al. (2002) discussed findings from middle school interventions promoting both
healthy eating and physical activity. Again the results from interventions using health
education curricula were mixed, results were different between studies and within studies
intervention effects were different in boys and girls (Gortmaker, et al., 1999; Neumark-
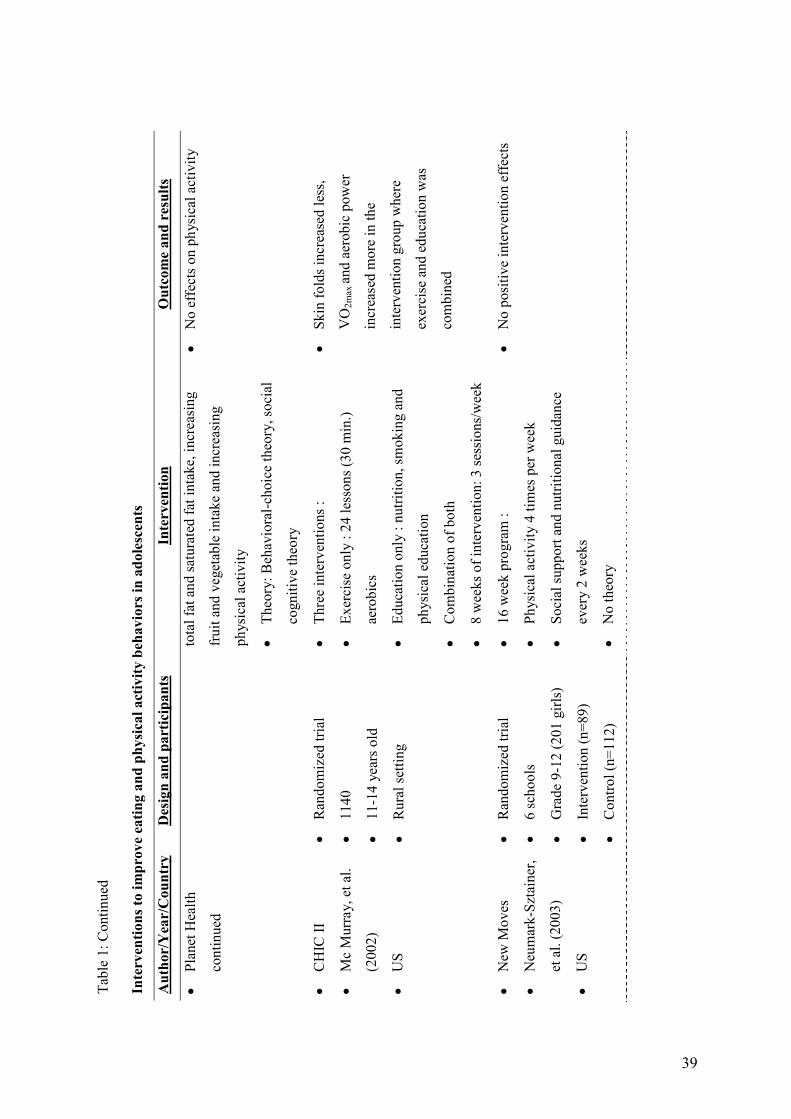
Sztainer, et al., 2003). Planet Health (Gortmaker, et al., 1999) was a 2 year physical activity
and nutrition curriculum (33 lessons) for middle school students that also included
components to reduce sedentary behaviours. Teachers in interventions schools received
training workshops, lessons and physical education materials. The primary goal was to
prevent unhealthy weight gain among adolescents and hence the most promising finding of
this study was evidence of obesity reduction among intervention girls. Secondary goals were
to increase moderate to vigorous physical activity, improve diet and reduce television
viewing. The intervention resulted in a reduction in television hours among both girls and
boys. Reductions in television viewing mediated the intervention effect on obesity. In girls,
the intervention was effective for increasing fruit and vegetable consumption. The program
was not effective for increasing physical activity.
General Introduction
34
New-moves is one of the few recently-published interventions that targeted eating and
physical activity behaviours in adolescent’ girls by offering a curriculum based program
(Neumark-Sztainer, et al., 2003). During a 16-week semester physical activity was offered
four times a week and nutrition and social support sessions were offered every other week.
The intervention had no effects on physical activity, eating behaviours or BMI. In the
Cardiovascular Health in Children (CHIC) study (McMurray, et al., 2002), one intervention
group received three weekly 30-minute session of aerobic exercise for eight weeks, another
intervention group received two weekly education classes on exercise and nutrition during
eight weeks, and the last intervention group received half of both sessions. Effects on
behaviour were not investigated, but physical fitness improved in the combined exercise
education intervention group. Although there were no effects on BMI, the sum of skin folds
increased less in both of the exercise intervention groups.
To our knowledge, there is only one randomized controlled trial that investigated an
environmental intervention targeting both nutrition and physical activity in adolescents
(Sallis, et al., 2003). The middle school physical activity and nutrition multi-component
program, “M-SPAN”, combined policy and environmental interventions to increase physical
activity and reduce dietary fat intake in middle school adolescents (Sallis, et al., 2003). In
addition to the physical education intervention (described above), health policy and student
health committees were created at school, parental education was provided, funds were
provided to purchase kitchen equipment and to provide physical activity programs or
equipment (Sallis, et al., 2003). The total intervention led to decreases in BMI and increases
in physical activity in boys, but not in girls. There were no intervention effects on total or
saturated dietary fat purchased at, or brought to school. The investigators reported that a
major challenge was that the school food services had to be financially self-supporting,
General Introduction
35
thereby making them reluctant to replace the availability of unhealthy popular food items by
more healthy products (Sallis, et al., 2003).
2.4 Conclusions
The differences in study design, evaluation procedures, duration and follow-up periods, make
comparison of the effectiveness of different intervention types almost impossible. Despite
this, overall results suggest that well-designed and well-implemented school-based programs
seem to be able to improve eating and physical activity behaviours of adolescents. However,
there are still few trials aimed at primary prevention of overweight and the few conducted
interventions showed limited impact on weight status of adolescents (Summerbell, et al.,
2005; Wareham, et al., 2005).
Although some studies sought to increase parental support, the effectiveness of increasing
parental support is not clear since few studies made comparisons between the same
interventions with or without parental participation (Wareham, et al., 2005). Evidence
supporting the usefulness of environmental strategies in adolescents is still limited, especially
for physical activity (Summerbell, et al., 2005). Classroom health education curricula per se
were mostly not effective in changing behaviour. In the following part of the introduction, a
relatively new health education strategy is discussed, namely computer tailored education.
Computer tailored interventions can be easily implemented in the classroom and may be more
effective to change behaviours, when compared to general health education curricula.
36
Ta
ble
1: O
verv
iew
of r
ecen
tly (s
ince
199
7) c
ondu
cted
scho
ol-b
ased
inte
rven
tion
stud
ies i
n ad
oles
cent
s
Inte
rven
tions
to im
prov
e ea
ting
beha
vior
s in
adol
esce
nts
Aut
hor/
Yea
r/C
ount
ry
Des
ign
and
part
icip
ants
In
terv
entio
n O
utco
me
and
resu
lts
• H
assa
pido
u, e
t al.
(199
7)
• G
reec
e
• Pi
lot s
tudy
• R
ando
miz
ed tr
ial
• 2
scho
ols,
Gra
de 8
• In
terv
entio
n (n
=73)
• C
ontro
l (n=
53)
• Pr
omot
ing
frui
t and
veg
etab
le in
take
for
prev
entin
g ca
ncer
• 10
cla
ssro
om le
sson
s (20
min
.) ta
ught
by
diet
icia
ns
• W
orkb
ook
(20-
30 m
in./w
eek)
• Pa
mph
lets
for s
tude
nts a
nd p
aren
ts
• N
o si
gnifi
cant
cha
nges
in fr
uit
and
vege
tabl
e in
take
• Fr
ench
, et a
l.
(199
7)
• U
S
• O
bser
vatio
nal s
tudy
• 2
high
scho
ols
• Lo
wer
ing
pric
es fo
r fru
it, sa
lad
and
carr
ots
with
50%
• Pr
omot
iona
l sig
nage
• Fr
uit
& c
arro
t sal
es in
crea
sed
• N
o ef
fect
s on
sale
s of s
alad
s
• G
imm
e 5
• N
ickl
as, e
t al
(199
8)
• O
’ Nei
l, et
al.
(200
2)
• U
S
• R
ando
miz
ed tr
ial
• 12
scho
ols (
mat
ched
)
• G
rade
9 (n
=221
3)
• Fo
llow
ed th
roug
h gr
ade
12
• M
ass m
edia
cam
paig
n: p
oste
rs, m
arke
ting
stat
ions
, sig
ns, t
able
tent
s, pu
blic
serv
ice
anno
unce
men
ts, f
ruit
and
vege
tabl
e
bask
ets,
tips s
heet
s and
con
test
s
• 5
wor
ksho
ps (5
5 m
in.)
• Te
ache
r tra
inin
g
• In
crea
sed
avai
labi
lity
and
varie
ty o
f fru
it
and
vege
tabl
es in
caf
eter
ia
• Si
gnifi
cant
incr
ease
in fr
uit a
nd
vege
tabl
e in
take
at 1
and
2 y
ear,
but n
ot m
aint
aine
d at
3 y
ears
due
to in
crea
se in
the
cont
rol
grou
p
37
Tabl
e 1:
Con
tinue
d
Inte
rven
tions
to im
prov
e ea
ting
beha
vior
s in
adol
esce
nts
Aut
hor/
Yea
r/C
ount
ry
Des
ign
and
part
icip
ants
In
terv
entio
n O
utco
me
and
resu
lts
• G
imm
e 5
cont
inue
d
•
Bro
chur
es to
par
ents
, tas
te-te
stin
g, re
cipe
s,
cale
ndar
s
• Th
eory
: Pre
cede
Mod
el
• TE
ENS
• Ly
tle, e
t al.
(200
4)
• U
S
• R
ando
miz
ed tr
ial
• 20
scho
ols
• G
rade
7 th
roug
h gr
ade
8
• 4
Con
ditio
ns:
Envi
ronm
ent o
nly,
Cla
ssro
om +
env
ironm
ent,
Cla
ssro
om +
env
ironm
ent
+ pe
er le
ader
s, C
ontro
l
• C
lass
room
: 10
curr
icul
um se
ssio
ns
• Pe
er le
ader
s hel
ped
clas
sroo
m te
ache
rs
• Pr
omot
ing
frui
t and
veg
etab
les i
n
cafe
teria
s, ta
ste
test
ing,
incr
easi
ng
avai
labi
lity,
app
ealin
g fr
uit a
nd
vege
tabl
es, t
able
tent
s and
pos
ters
• Pa
rent
pac
ks: h
ome
activ
ities
to b
e do
ne
with
par
ents
• Th
eory
: Soc
ial C
ogni
tive
Theo
ry
• C
lass
room
+ e
nviro
nmen
t + p
eer
lead
ers w
as e
ffec
tive
for
incr
easi
ng fr
uit a
nd v
eget
able
s
inta
ke
• N
o ef
fect
s of b
oth
othe
r
cond
ition
s
• C
HIP
S
• Fr
ench
, et a
l.
(200
1)
• U
S
• R
ando
miz
ed tr
ial
• 12
scho
ols +
12
wor
ksite
s
• 12
mon
th in
terv
entio
n
• Pr
icin
g st
rate
gies
and
pro
mot
ion
of lo
w-f
at
snac
ks in
ven
ding
mac
hine
s:
o Eq
ual p
rices
o 10
%, 2
5% &
50%
redu
ctio
n
• Pr
ice
redu
ctio
ns re
sulte
d in
incr
ease
d sa
les o
f low
-fat
snac
ks
• G
reat
er re
duct
ion →
hig
her
incr
ease
• Pr
omot
iona
l sig
nage
: wea
k
effe
cts
38
Ta
ble
1: C
ontin
ued
Inte
rven
tions
to im
prov
e ph
ysic
al a
ctiv
ity in
ado
lesc
ents
Aut
hor/
Yea
r/C
ount
ry
Des
ign
and
part
icip
ants
In
terv
entio
n O
utco
me
and
resu
lts
• Ja
mne
r, et
al.
(200
4)
• U
S
• V
olun
tary
par
ticip
atio
n
• 2
high
scho
ols:
10-
11
grad
e
• Se
dent
ary
fem
ale
stud
ents
• In
terv
entio
n (n
=25)
• C
ontro
l (n=
22)
• Ph
ysic
al e
duca
tion
clas
ses d
urin
g 4
mon
ths
• Fo
ur d
ays/
wee
k (6
0 m
in.):
aer
obic
s,
bask
etba
ll, sw
imm
ing
and
Tae
Bo
• O
nce/
wee
k: le
sson
(60
min
.) he
alth
bene
fits o
f phy
sica
l act
ivity
• Po
sitiv
e ef
fect
s on
fitne
ss,
lifes
tyle
act
ivity
and
ligh
t,
mod
erat
e an
d vi
goro
us p
hysi
cal
activ
ity
• N
o ef
fect
s on
psyc
hoso
cial
varia
bles
• IC
APS
• Si
mon
, et a
l.
(200
4)
• Fr
ance
• R
ando
miz
ed tr
ial
• 8
scho
ols (
n=95
4)
• 4
year
s ong
oing
stud
y
• 6
mon
ths r
esul
ts a
vaila
ble
• M
ulti-
com
pone
nt: e
nviro
nmen
t, so
cial
and
pers
onal
inte
rven
tions
, par
tner
ship
s with
com
mun
ity
• Ed
ucat
ion
• In
crea
sing
opp
ortu
nitie
s for
phy
sica
l
activ
ity (1
0-12
wee
kly
activ
ities
)
• Pa
rtici
patio
n in
leis
ure
time
orga
nize
d ph
ysic
al a
ctiv
ity
incr
ease
d af
ter 6
mon
ths
• Po
sitiv
e in
terv
entio
n ef
fect
s on
self-
effic
acy
and
inte
ntio
n
Inte
rven
tions
to im
prov
e ea
ting
and
phys
ical
act
ivity
beh
avio
rs in
ado
lesc
ents
• Pl
anet
Hea
lth
• G
ortm
aker
, et a
l.
(199
9)
• U
S
• R
ando
miz
ed tr
ial
• 13
scho
ols (
n =1
295)
• G
rade
6 &
7
• Tr
aini
ng fo
r tea
cher
s
• 32
less
ons t
augh
t by
clas
sroo
m te
ache
rs
over
2 y
ears
• C
onte
nt: r
educ
ing
TV v
iew
ing,
redu
cing
• TV
vie
win
g re
duce
d
• Pr
eval
ence
of o
besi
ty re
duce
d
• Fr
uit a
nd v
eget
able
inta
ke
incr
ease
d
39
Tabl
e 1:
Con
tinue
d
Inte
rven
tions
to im
prov
e ea
ting
and
phys
ical
act
ivity
beh
avio
rs in
ado
lesc
ents
Aut
hor/
Yea
r/C
ount
ry
Des
ign
and
part
icip
ants
In
terv
entio
n O
utco
me
and
resu
lts
• Pl
anet
Hea
lth
cont
inue
d
to
tal f
at a
nd sa
tura
ted
fat i
ntak
e, in
crea
sing
frui
t and
veg
etab
le in
take
and
incr
easi
ng
phys
ical
act
ivity
• Th
eory
: Beh
avio
ral-c
hoic
e th
eory
, soc
ial
cogn
itive
theo
ry
• N
o ef
fect
s on
phys
ical
act
ivity
• C
HIC
II
• M
c M
urra
y, e
t al.
(200
2)
• U
S
• R
ando
miz
ed tr
ial
• 11
40
• 11
-14
year
s old
• R
ural
setti
ng
• Th
ree
inte
rven
tions
:
• Ex
erci
se o
nly
: 24
less
ons (
30 m
in.)
aero
bics
• Ed
ucat
ion
only
: nu
tritio
n, sm
okin
g an
d
phys
ical
edu
catio
n
• C
ombi
natio
n of
bot
h
• 8
wee
ks o
f int
erve
ntio
n: 3
sess
ions
/wee
k
• Sk
in fo
lds i
ncre
ased
less
,
VO
2max
and
aero
bic
pow
er
incr
ease
d m
ore
in th
e
inte
rven
tion
grou
p w
here
exer
cise
and
edu
catio
n w
as
com
bine
d
• N
ew M
oves
• N
eum
ark-
Szta
iner
,
et a
l. (2
003)
• U
S
• R
ando
miz
ed tr
ial
• 6
scho
ols
• G
rade
9-1
2 (2
01 g
irls)
• In
terv
entio
n (n
=89)
• C
ontro
l (n=
112)
• 16
wee
k pr
ogra
m :
• Ph
ysic
al a
ctiv
ity 4
tim
es p
er w
eek
• So
cial
supp
ort a
nd n
utrit
iona
l gui
danc
e
ever
y 2
wee
ks
• N
o th
eory
• N
o po
sitiv
e in
terv
entio
n ef
fect
s
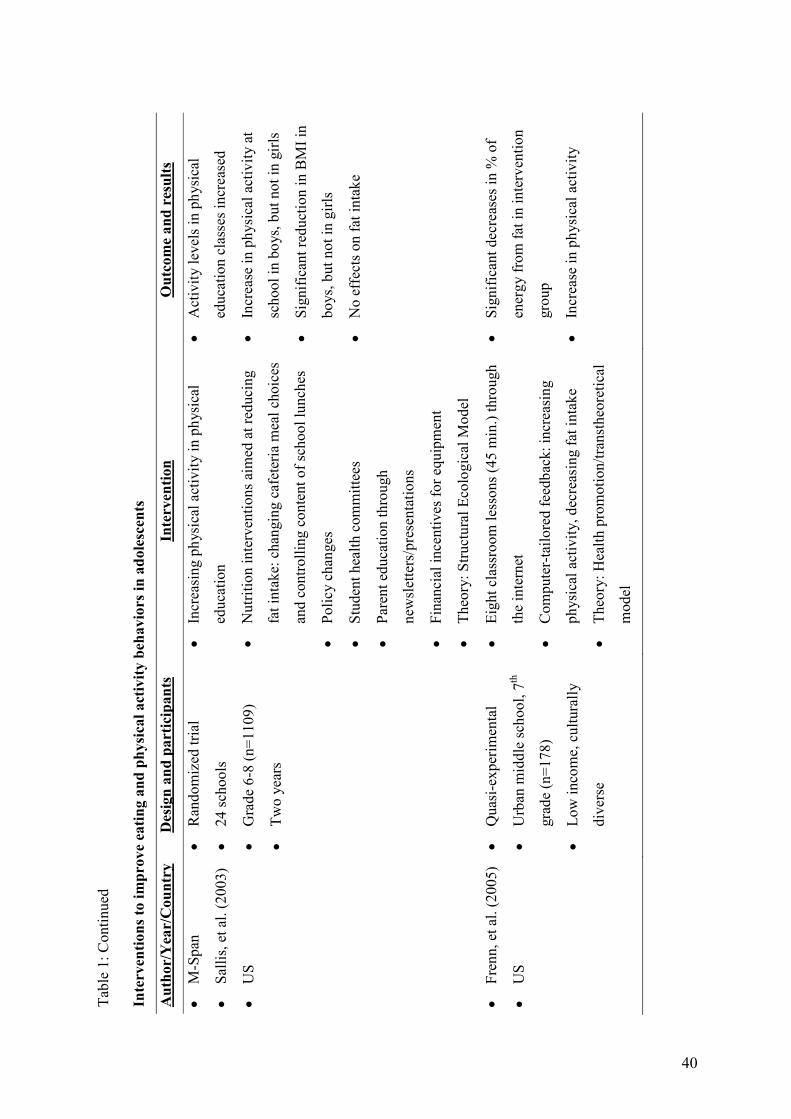
40
Ta
ble
1: C
ontin
ued
Inte
rven
tions
to im
prov
e ea
ting
and
phys
ical
act
ivity
beh
avio
rs in
ado
lesc
ents
Aut
hor/
Yea
r/C
ount
ry
Des
ign
and
part
icip
ants
In
terv
entio
n O
utco
me
and
resu
lts
• M
-Spa
n
• Sa
llis,
et a
l. (2
003)
• U
S
• R
ando
miz
ed tr
ial
• 24
scho
ols
• G
rade
6-8
(n=1
109)
• Tw
o ye
ars
• In
crea
sing
phy
sica
l act
ivity
in p
hysi
cal
educ
atio
n
• N
utrit
ion
inte
rven
tions
aim
ed a
t red
ucin
g
fat i
ntak
e: c
hang
ing
cafe
teria
mea
l cho
ices
and
cont
rolli
ng c
onte
nt o
f sch
ool l
unch
es
• Po
licy
chan
ges
• St
uden
t hea
lth c
omm
ittee
s
• Pa
rent
edu
catio
n th
roug
h
new
slet
ters
/pre
sent
atio
ns
• Fi
nanc
ial i
ncen
tives
for e
quip
men
t
• Th
eory
: Stru
ctur
al E
colo
gica
l Mod
el
• A
ctiv
ity le
vels
in p
hysi
cal
educ
atio
n cl
asse
s inc
reas
ed
• In
crea
se in
phy
sica
l act
ivity
at
scho
ol in
boy
s, bu
t not
in g
irls
• Si
gnifi
cant
redu
ctio
n in
BM
I in
boys
, but
not
in g
irls
• N
o ef
fect
s on
fat i
ntak
e
• Fr
enn,
et a
l. (2
005)
• U
S
• Q
uasi
-exp
erim
enta
l
• U
rban
mid
dle
scho
ol, 7
th
grad
e (n
=178
)
• Lo
w in
com
e, c
ultu
rally
dive
rse
• Ei
ght c
lass
room
less
ons (
45 m
in.)
thro
ugh
the
inte
rnet
• C
ompu
ter-
tailo
red
feed
back
: inc
reas
ing
phys
ical
act
ivity
, dec
reas
ing
fat i
ntak
e
• Th
eory
: Hea
lth p
rom
otio
n/tra
nsth
eore
tical
mod
el
• Si
gnifi
cant
dec
reas
es in
% o
f
ener
gy fr
om fa
t in
inte
rven
tion
grou
p
• In
crea
se in
phy
sica
l act
ivity
General Introduction
41
COMPUTER TAILORED INTERVENTIONS
Computer-tailoring is a theory driven health education strategy that has become more popular
in the past decade and can be defined as the adaptation of health education to a specific person
through a computerized process (De Vries & Brug, 1999). Computer-tailored interventions
are usually built upon four major components. The first component consists of questionnaires
to assess behaviour, and important determinants of behavioural change. The second
component is a message library that contains all health education messages that may be
needed. The third component is a set of decision rules that evaluate the answers on the
questionnaires and generate the messages tailored to the specific answers. The final part is the
channel to deliver the message in an understandable, clear and attractive way; for example
through a personal letter on the computer screen (Brug, et al., 1996). The delivered
information is thus adapted to personal diagnostic, behavioural and motivational
characteristics (De Vries & Brug, 1999). To tailor feedback to the individual motivational
stage, the Transtheoretical Model (Prochaska, et al., 1992) is the most frequently used
(Kroeze, et al., 2006). Computer-tailored interventions can serve as a cheap way to provide
personal information to large amounts of people.
Several reviews have shown that computer tailored messages are more appreciated when
compared to general messages (Brug, et al., 1999; Skinner, et al., 1999). Tailored messages
were more likely to be read entirely, remembered, saved and discussed with others and were
more often perceived as interesting and personally relevant (Brug, et al., 1996; Kreuter, et al.,
2000; Vandelanotte, et al., 2003 & 2004).
The evidence for short- and medium-term effectiveness of computer tailored interventions on
nutrition behaviours is quite strong, especially for fat intake (Brug, et al., 1999; Kroeze, et al.,
General Introduction
42
2006). For physical activity promotion through tailored feedback, results were mixed, with
interventions using detailed feedback being more effective (Kroeze, et al., 2006).
Till now, only 2 studies investigated the effects of computer tailored feedback in adolescents
(De Bourdeaudhuij, et al., 2002; Frenn, et al., 2005). In the first study (De Bourdeaudhuij, et
al., 2002), effectiveness of a tailored intervention to reduce fat intake was investigated in both
adolescents and their family. After four weeks, there was a reduction in percent energy from
fat, but only in those adolescents with high baseline fat intake. In a second study, fat intake
and physical activity was targeted through a tailored intervention offered during eight 45-
minutes lessons in low income, culturally diverse students. The intervention was effective for
reducing percentage of energy from fat and for increasing physical activity (Frenn, et al.,
2005). Although the use of computer tailored feedback as a new health education strategy
seems promising in adolescents (De Bourdeaudhuij, et al., 2002; Frenn, et al., 2005), no
studies incorporated such interventions in a more comprehensive school-based program.
PROBLEM ANALYSES & OUTLINE OF THE THESIS
This thesis consists of a collection of articles that are in press, under editorial review or
submitted for publication. All original research can be divided into two parts: Part 1,
consisting of three cross-sectional studies looking at differences in physical activity levels in
overweight children and influencing factors for eating and physical activity in adolescents
(Chapter 1.1-1.3) and Part 2 describing intervention evaluations. Part 2 is the most essential
part of this thesis; it consists of the evaluation of a multi-component intervention aimed at
improving physical activity and dietary behaviours in the context of primary prevention of
overweight (Chapter 2.1-2.5) and a computer-tailored intervention aimed at reducing dietary
fat intake (Chapter 2.6). As primary prevention of overweight is aimed at preventing the
General Introduction
43
development of overweight in the healthy population, intervention effects were studied in the
entire sample and not in the at risk groups.
In the general discussion of the thesis, general conclusions, strengths and limitations,
directions for future research and practical implications are formulated.
The first study of part 1 (Chapter 1.1) highlights measurements issues when comparing
prevalence rates of overweight and obesity. Levels of agreement between the international
accepted BMI-based cut-offs (Cole, et al., 2000) and fat-based cut-off points (Taylor, et al.,
2003) used to define overweight were studied. Based on both classifications, differences in
physical activity levels in overweight and healthy weight adolescents were investigated.
Although several studies already looked at differences in physical activity levels between
overweight and healthy weight children, the study described in chapter 1.1 added to the
literature in combining two objective measures of overweight (BMI + %fat) with both an
objective (accelerometers) and more subjective measure (questionnaires) of physical activity
in the same sample of adolescents.
Literature revealed that unhealthy eating behaviours like high fat intake, high soft drink
consumption and low fruit intakes are very common among Flemish adolescents (Matthys, et
al., 2003; Currie, et al., 2004). In addition large proportions of Flemish adolescents are not
meeting the current physical activity guidelines of 60 minutes of moderate to vigorous
physical activities daily (Currie, et al., 2004; De Bourdeaudhuij, et al., 2005). Dietary patterns
(Lien, et al., 2002; Vereecken, et al., 2004 & 2005) and physical activity behaviours (Schmitz,
et al., 2002; De Bruijn, et al., 2005) were found to be less healthy in lower lower-educated
groups, making this group at greater risk for developing overweight and health problems.
Hence, there is a strong need for interventions encouraging healthy eating and physical
General Introduction
44
activity in lower-educated adolescents in the belief that the increase in overweight prevalence
will be prevented (Lobstein, et al., 2004), that these adolescents will benefit from short and
long term health consequences (Biddle, et al., 2004; Penedo & Dahn, 2005; Strong, et al.,
2005) and that healthy behaviours (Kelder, et al., 1994; Anderssen, et al., 1996; Kemper, et
al., 1999; Janz, et al., 2000; Lien, et al., 2001; Post, et al., 2001; De Bourdeaudhuij, et al.,
2002; Telama, et al., 2005) or behavioural changes (Nader et al., 1999) will persist in later
life.
To design effective interventions that promote healthy eating and physical activity behaviours
in adolescents (Sallis, 2000), insight in influencing factors for these behaviours is required.
Ecological models emphasize the importance of interactions between the individual and the
environment in shaping behaviour (Sallis & Owen, 2002). Till now however, few studies
investigated the combination of individual and environmental factors in explaining behaviours
in adolescents. In the second and third study of Part 1 the relative influence of environmental
factors over and above the influence of psychosocial factors was investigated for dietary
(Chapter 1.2) and physical activity behaviours (Chapter 1.3).
Adolescents spend high amounts of time at school and schools have the opportunity to
incorporate health education programs in the classroom curriculum. The school environment
is further recognized as having a powerful influence on eating and physical activity
behaviours and through schools a direct link can also be established with the home
environment (Wechsler, et al., 2000, Story, 2002, Vereecken, et al., 2005). School-based
interventions are thus assumed to have positive effects on adolescents’ eating and physical
activity behaviours. Although adolescence is a vulnerable period for developing unhealthy
eating and physical activity behaviours, most of the previously conducted school-based
General Introduction
45
interventions were delivered through elementary schools (Kahn, et al., 2002; Summerbell, et
al., 2005; Wareham, et al., 2005). Some studies in middle schools targeting either eating or
physical activity behaviours showed promising effects of incorporating health education
curricula (Gortmaker, et al., 1999; Sallis, et al., 2003; Simon, et al., 2004). However, till now,
few studies looked at the effect of combining educational and environmental strategies and no
studies investigated the surplus effects of involving parents in interventions in adolescents.
Although the use of computer tailored feedback as a new health education strategy seems
promising (De Bourdeaudhuij, et al., 2002; Frenn & Malin, 2003 & 2005), no studies
incorporated such interventions in a more comprehensive school-based intervention in
adolescents.
Hence, the first five chapters of part 2 are related to the evaluation of a two-year
comprehensive healthy eating and physical activity intervention, combining computer-tailored
health education with environmental strategies in Flemish middle schools. As the healthy
school principle is aimed at creating a healthy learning environment for all students,
intervention effects were consistently reported for the total sample and no special attention
was given to those students at risk.
The content and formulation of the computer tailored health education messages was tailored
to the adolescents’ stages of change and information related to constructs such as attitudes,
self-efficacy, social support, perceived benefits and barriers derived from the personal level
theories (p. 19-22) was provided in the feedback. Based on the insights of social ecological
and social cognitive theories environmental strategies such as increasing availability of
healthy food products and opportunities for physical activity were included.
The first two studies of part 2 describe one year post-intervention effects on dietary intake
(Chapter 2.1) and physical activity (Chapter 2.2). Two year post intervention effects on
General Introduction
46
eating and physical activity behaviours are described in Chapter 2.3. One and two year post-
intervention effects on Body Mass Index (BMI) are described in Chapter 2.4. The purpose of
the study described in Chapter 2.5 was to look at possible mediators of one year post
intervention effects on physical activity.
From the results of the multi-component intervention described in Chapter 2.1-2.3 it appeared
that using computer-tailored interventions in adolescents could be a promising intervention
strategy. Classroom computer-tailored health education could have lots of potential, since
little time, few resources and costs would be needed to implement such interventions, given
the opportunities to provide tailored interventions through the internet. So far however, only
one study (Frenn & Malin, 2003) reported isolated effects of a classroom-delivered
personalized computer-tailored intervention for eating and physical activity behaviours in
adolescents. Hence, the final study of part 2 focuses on the acceptability, feasibility and
effectiveness of a classroom-delivered computer-tailored intervention to reduce fat intake
(Chapter 2.6) in adolescents.
REFERENCES
Ajzen, I. (1985). From intentions to actions: a theory of planned behavior. In: Kuhl, J., Beckman, J., (eds). Action-control: From cognition to behavior. Springer, Heidelberg, 11-39.
Anderssen, N., Jacobs, D. R., Sidney, S., Bild, D. E., Sternfeld, B., Slattery, M. L., & Hannan, P. (1996). Change and secular trends in physical activity patterns in young adults: A seven-year longitudinal follow-up in the coronary artery risk development in young adults study (CARDIA). American Journal of Epidemiology, 143(4), 351-362.
Arslanian, S. (2002). Type 2 diabetes in children: Clinical aspects and risk factors. Hormone Research, 57, 19-28.
Bandura, A. (1977a). Social Learning Theory. Englewood Cliffs, N.J., Prentice Hall.
Bandura, A. (1986). Social Foundations of Thought and Action. Englewood Cliffs, N.J., Prentice Hall.
Baranowski, T., Bouchard, C., Baror, O., Bricker, T., Heath, G., Kimm, S. Y. S., Malina, R., Obarzanek, E., Pate, R., Strong, W. B., Truman, B., & Washington, R. (1992). Assessment, Prevalence, and Cardiovascular Benefits of Physical-Activity and Fitness in Youth. Medicine and Science in Sports and Exercise, 24(6), S237-S247.
Bere, E., & Klepp, K. I. (2004). Correlates of fruit and vegetable intake among Norwegian
References
47
schoolchildren: parental and self-reports. Public Health Nutrition, 7(8), 991-998.
Beunen, G., De Bourdeaudhuij, I., Vanden Auweele, Y., and Borms, J. (2001). Fysieke activiteit, fitheid and gezondheid (Physical Activity, Fitness and Health). Vlaams Tijdschrift voor Sportgeneeskunde en Sportwetenschappen, Speciale Edition, 103-107.
Biddle, S. J. H., Gorely, T., & Stensel, D. J. (2004). Health-enhancing physical activity and sedentary behaviour in children and adolescents. Journal of Sports Sciences, 22(8), 679-701.
Biddle, S. J. H., Sallis, J., Cavill, N. (1998). Young and Active? Young people and health-enhancing physical activity-evidence and implications. London, Health Education Authority.
Biddle, S., & Goudas, M. (1996). Analysis of children's physical activity and its association with adult encouragement and social cognitive variables. Journal of School Health, 66(2), 75-78.
Boreham, C., & Riddoch, C. (2001). The physical activity, fitness and health of children. Journal of Sports Sciences, 19(12), 915-929.
Bouchard, C., Shepard, R., & Stephens, T. (1994). Physical activity, fitness and health: interventional proceedings and consensus statement. Champaign, IL: Human Kinetics.
Brug J, van Lenthe F. (2005). Environmental determinants and interventions for physical activity, diet and smoking: a review. Rotterdam, The Netherlands, Erasmus MC.
Brug, J., Campbell, M., & van Assema, P. (1999). The application and impact of computer-generated personalized nutrition education: A review of the literature. Patient Education and Counseling, 36(2), 145-156.
Brug, J., Steenhuis, I., vanAssema, P., & deVries, H. (1996). The impact of a computer-tailored nutrition intervention. Preventive Medicine, 25(3), 236-242.
Castro-Rodriguez, L. A., Holberg, C. J., Morgan, W. J., Wright, A. L., & Martinez, F. D. (2001). Increased incidence of asthmalike symptoms in girls who become overweight or obese during the school years. American Journal of
Respiratory and Critical Care Medicine, 163(6), 1344-1349.
Cavadini, C., Siega-Riz, A. M., & Popkin, B. M. (2000). US adolescent food intake trends from 1965 to 1996. Western Journal of Medicine, 173(6), 378-383.
Chinn, S., & Rona, R. J. (1994). Trends in Weight-for-Height and Triceps Skinfold Thickness for English and Scottish Children, 1972-1982 and 1982-1990. Paediatric and Perinatal Epidemiology, 8(1), 90-106.
Cole, T. J., Bellizzi, M. C., Flegal, K. M., & Dietz, W. H. (2000). Establishing a standard definition for child overweight and obesity worldwide: international survey. British Medical Journal, 320(7244), 1240-1243.
Cruz, J. A. A. (2000). Dietary habits and nutritional status in adolescents over Europe - Southern Europe. European Journal of Clinical Nutrition, 54, S29-S35.
Currie, C., Roberts, C., Morgan, A., Smith, R., Settertobulte, W., Samdal, O., & Barnekow Rasmussen, V. (2004). Health Behaviour in School-Aged children (HBSC) study: international report from the 2001/2002 survey (No. 4). Copenhagen: World Health Organization.
Davison, K. K., & Birch, L. L. (2001). Child and parent characteristics as predictors of change in girls' body mass index. International Journal of Obesity, 25(12), 1834-1842.
De Bourdeaudhuij, I., & Van Oost, P. (2000). Personal and family determinants of dietary behaviour in adolescents and their parents. Psychology and health, 15, 751-770.
De Bourdeaudhuij, I., Brug, J., Vandelanotte, C., & Van Oost, P. (2002). Differences in impact between a family- versus an individual-based tailored intervention to reduce fat intake. Health Education Research, 17(4), 435-449.
De Bourdeaudhuij, I., Lefevre, J., Deforche, B., Wijndaele, K., Matton, L., & Philippaerts, R. (2005). Physical activity and psychosocial correlates in normal weight and overweight 11 to 19 year olds. Obesity Research, 13(6), 1097-1105.
De Bourdeaudhuij, I., Sallis, J., & Vandelanotte, C. (2002). Tracking and explanation of physical activity from adolescence to young adulthood.
References
48
A 7-year prospective study. Research Quarterly for Exercise and Sport, 73, 376-385.
De Bruijn, G. J., Kremers, S. P. J., Lensvelt-Mulders, G., de Vries, H., van Mechelen, W., & Brug, J. (2006). Modeling individual and physical environmental factors with adolescent physical activity. American Journal of Preventive Medicine, 30(6), 507-512.
De Bruijn, G. J., Kremers, S. P. J., Schaalma, H., van Mechelen, W., & Brug, J. (2005). Determinants of adolescent bicycle use for transportation and snacking behavior. Preventive Medicine, 40(6), 658-667.
De Vries, H., & Brug, J. (1999). Computer-tailored interventions motivating people to adopt health promoting behaviours: Introduction to a new approach. Patient Education and Counseling, 36(2), 99-105.
De Vries, H., Backbier, E., Kok, G., & Dijkstra, M. (1995). The Impact of Social Influences in the Context of Attitude, Self-Efficacy, Intention, and Previous Behavior as Predictors of Smoking Onset. Journal of Applied Social Psychology. 25, 237-257.
De Vries, H., Dijkstra, M., Kuhlman, P. (1998). Self-efficacy: third factor besides attitude and subjective norm as a predictor of behavioral intentions. Health Education Research. 3, 273–282.
Deckelbaum, R. J., & Williams, C. L. (2001). Childhood obesity: The health issue. Obesity Research, 9, 239S-243S.
Deforche, B., Lefevre, J., De Bourdeaudhuij, I., Hills, A. P., Duquet, W., & Bouckaert, J. (2003). Physical fitness and physical activity in obese and nonobese Flemish youth. Obesity Research, 11(3), 434-441.
Dietz, W. H. (1998a). Childhood weight affects adult morbidity and mortality. Journal of Nutrition, 128(2), 411S-414S.
Dietz, W. H. (1998b). Health consequences of obesity in youth: Childhood predictors of adult disease. Pediatrics, 101(3), 518-525.
DiLorenzo, T. M., Stucky-Ropp, R. C., Vander Wal, J. S., & Gotham, H. J. (1998). Determinants of exercise among children. II. A longitudinal analysis. Preventive Medicine, 27(3), 470-477.
Dollman, J., Norton, K., & Norton, L. (2005). Evidence for secular trends in children's
physical activity behaviour. British Journal of Sports Medicine, 39(12), 892-897.
Dwyer, J. T. (1993). Diet and Nutritional Strategies for Cancer Risk Reduction - Focus on the 21St-Century. Cancer, 72(3), 1024-1031.
Eliakim, A., Burke, G. S., & Cooper, D. M. (1997). Fitness, fatness, and the effect of training assessed by magnetic resonance imaging and skin fold-thickness mmeasurments in health adolescent females. American Journal of Clinical Nutrition, 66, 223-231.
EURODIET group (2001a). EURODIET report and proceedings. Public Health Nutrition, 4(2A).
EURODIET group (2001b). Nutrition and Diet for Healthy Lifestyles in Europe: the EURODIET evidence. Public Health Nutrition, 4(2B).
Evans, C. (2004). Assessing and applying community based research. In: Blumenthal, D. S. & DeClimente R.J. (ed.) Community-based Health Research: Issues and Methods. New York, Springer Publishing Company, 32.
Fein, A. J., Plotnikoff, R. C., Wild, T. C., & Spence, J. C. (2004). Perceived environment and physical activity in youth. International Journal of Behavioral Medicine, 11(3), 135-142.
Freedman, D. S., Dietz, W. H., Srinivasan, S. R., & Berenson, G. S. (1999). The relation of overweight to cardiovascular risk factors among children and adolescents: The Bogalusa heart study. Pediatrics, 103(6), 1175-1182.
French, S. A., Jeffery, R. W., Story, M., Breitlow, K. K., Baxter, J. S., Hannan, P., & Snyder, M. P. (2001). Pricing and promotion effects on low-fat vending snack purchases: The CHIPS study. American Journal of Public Health, 91(1), 112-117.
French, S. A., Story, M., Hannan, P., Breitlow, K. K., Jeffery, R. W., Baxter, J. S., & Snyder, M. P. (1999). Cognitive and demographic correlates of low-fat vending snack choices among adolescents and adults. Journal of the American Dietetic Association, 99(4), 471-475.
French, S. A., Story, M., Jeffery, R. W., Snyder, P., Eisenberg, M., Sidebottom, A., & Murray, D. (1997). Pricing strategy to promote fruit and vegetable purchase in high school cafeterias. Journal of the American Dietetic Association, 97(9), 1008-1010.
References
49
Frenn, M., & Malin, S. (2003). Diet and exercise in low-income culturally diverse middle school students. Public Health Nursing, 20(5), 361-368.
Frenn, M., Malin, S., Brown, R. L., Greer, Y., Fox, J., Greer, J., & Smyczek, S. (2005). Changing the tide: an Internet/video exercise and low-fat diet intervention with middle-school students. Applied Nursing Research, 18(1), 13-21.
Frenn, M., Malin, S., Villarruel, A. M., Slaikeu, K., McCarthy, S., Freeman, J., & Nee, E. (2005). Determinants of physical activity and low-fat diet among low income African American and Hispanic middle school students. Public Health Nursing, 22(2), 89-97.
Fulton, J. E., Garg, M., Galuska, D. A., Rattay, K. T., & Caspersen, C. J. (2004). Public health and clinical recommendations for physical activity and physical fitness - Special focus on overweight youth. Sports Medicine, 34(9), 581-599.
Freedson P.S., Melanson E., Sirard J. (1998). Calibration of the Computer Science and Applications, Inc. accelerometer. Med Sci Sports Exerc, 30(5):777-81.
Garaulet, M., Martinez, A., Victoria, F., Perez-Llamas, F., Ortega, R. M., & Zamora, S. (2000). Difference in dietary intake and activity level between normal-weight and overweight or obese adolescents. Journal of Pediatric Gastroenterology and Nutrition, 30(3), 253-258.
Gillman, M. W., Rifas-Shiman, S. L., Frazier, A. L., Rockett, H. R. H., Camargo, C. A., Field, A. E., Berkey, C. S., & Colditz, G. A. (2000). Family dinner and diet quality among older children and adolescents. Archives of Family Medicine, 9(3), 235-240.
Gong, E., & Heald, F. (1994). Diet, nutrition, and adolescence. In: Shils, M., Olsen, J., Shike, M. (eds), Modern Nutrition in Health and Disease. Philadelphia, Lea & Febiger, 7759, 7769.
Gordon-Larsen, P., McMurray, R. G., Popkin, B. M. (2000). Determinants of adolescent physical activity and inactivity patterns. Pediatrics. 105(6), e83.
Gortmaker, S. L., Peterson, K., Wiecha, J., Sobol, A. M., Dixit, S., Fox, M. K., & Laird, N. (1999). Reducing obesity via a school-based
interdisciplinary intervention among youth - Planet health. Archives of Pediatrics & Adolescent Medicine, 153(4), 409-418.
Green L. W., Richard, L., & Potvin, L. (1996). Ecological foundations of health promotion. American Journal of Health Promotion, 10, 270-281.
Green, L. W., & Kreuter, M. W. (1990). Health Promotion as a Public-Health Strategy for the 1990S. Annual Review of Public Health, 11, 319-334.
Grimm, G. C., Harnack, L., & Story, M. (2004). Factors associated with soft drink consumption in school-aged children. Journal of the American Dietetic Association, 104(8), 1244-1249.
Guo, S. S., & Chumlea, W. C. (1999). Tracking of body mass index in children in relation to overweight in adulthood. American Journal of Clinical Nutrition, 70(1), 145S-148S.
Hanson, N. I., Neumark-Sztainer, D., Eisenberg, M. E., Story, M., & Wall, M. (2005). Associations between parental report of the home food environment and adolescent intakes of fruits, vegetables and dairy foods. Public Health Nutrition, 8(1), 77-85.
Harnack, L. J., Jeffery, R. W., & Boutelle, K. N. (2000). Temporal trends in energy intake in the United States: an ecologic perspective. American Journal of Clinical Nutrition, 71(6), 1478-1484.
Hassapidou, M. N., Fotiadou, E., & Maglara, E. (1997). A nutrition intervention programme for lower secondary schools in Greece. Health Education Journal, 56, 134-144.
Hulens, M., Beunen, G., Claessens, A. L., Lefevre, J., Thomis, M., Philippaerts, R., Borms, J., Vrijens, J., Lysens, R., & Vansant, G. (2001). Trends in BMI among Belgian children, adolescents and adults from 1969 to 1996. International Journal of Obesity, 25(3), 395-399.
Hypponen, E., Virtanen, S. M., Kenward, M. G., Knip, M., Akerblom, H. K., Study, C. D. F., & (2000). Obesity, increased linear growth, and risk of type 1 diabetes in children. Diabetes Care, 23(12), 1755-1760.
Jago, R., Baranowski, T., Zakeri, I., & Harris, M. (2005). Observed environmental features and the physical activity of adolescent males.
References
50
American Journal of Preventive Medicine, 29(2), 98-104.
Jamner, M. S., Spruijt-Metz, D., Bassin, S., & Cooper, D. M. (2004). A controlled evaluation of a school-based intervention to promote physical activity among sedentary adolescent females: Project FAB. Journal of Adolescent Health, 34(4), 279-289.
Janssen, I., Katzmarzyk, P. T., Boyce, W. F., Vereecken, C., Mulvihill, C., Roberts, C., Currie, C., Pickett, W., Grp, H. B. S.-A. C. O. W., & (2005). Comparison of overweight and obesity prevalence in school-aged youth from 34 countries and their relationships with physical activity and dietary patterns. Obesity Reviews, 6(2), 123-132.
Janz, K. F., Dawson, J. D., & Mahoney, L. T. (2000). Tracking physical fitness and physical activity from childhood to adolescence: the Muscatine study. Medicine and Science in Sports and Exercise, 32(7), 1250-1257.
Janz, N. K., & Becker, M. H. (1984). The Health Belief Model: A decade later. Health Education Quarterly, 11(1): 1-47.
Kahn, E. B., Ramsey, L. T., Brownson, R. C., Heath, G. W., Howze, E. H., Powell, K. E., Stone, E. J., Rajab, M. W., Corso, P., & Briss, P. A.(2002). The effectiveness of interventions to increase physical activity - A systematic review. American Journal of Preventive Medicine, 22(4), 73-108.
Kelder, S. H., Perry, C. L., Klepp, K. I., & Lytle, L. L. (1994). Longitudinal Tracking of Adolescent Smoking, Physical-Activity, and Food Choice Behaviors. American Journal of Public Health, 84(7), 1121-1126.
Kemper, H. C. G., Post, G. B., Twisk, J. W. R., & van Mechelen, W. (1999). Lifestyle and obesity in adolescence and young adulthood: results from the Amsterdam Growth And Health Longitudinal Study (AGAHLS). International Journal of Obesity, 23, S34-S40.
Kimm, S. Y. S., Glynn, N. W., Kriska, A. M., Barton, B. A., Kronsberg, S. S., Daniels, S. R., Crawford, P. B., Sabry, Z. I., & Liu, K. (2002). Decline in physical activity in black girls and white girls during adolescence. New England Journal of Medicine, 347(10), 709-715.
Kremers, S. P., Brug, J., de Vries, H., & Engels, R. C. M. E. (2003). Parenting style and adolescent fruit consumption. Appetite, 41(1), 43-50.
Kreuter, M. W., Oswald, D. L., Bull, F. C., & Clark, E. M. (2000). Are tailored health education materials always move effective than non-tailored materials? Health Education Research, 15(3), 305-315.
Kroeze, W., Werkman, A., & Brug, J. (2006). A systematic review of randomized trials on the effectiveness of computer-tailored education on physical activity and dietary behaviors. Annals of Behavioral Medicine, 31(3), 205-223.
Kubik, M. Y., Lytle, L. A., Hannan, P. J., Perry, C. L., & Story, M. (2003). The association of the school food environment with dietary behaviors of young adolescents. American Journal of Public Health, 93(7), 1168-1173.
Kvaavik, E., Student, P. D., Meyer, H. E., & Tverdal, A. (2004). Food habits, physical activity and body mass index in relation to smoking status in 40-42 year old Norwegian women and men. Preventive Medicine, 38(1), 1-5.
Lambert, J., Agostoni, C., Elmadfa, I., Hulshof, K., Krause, E., Livingstone, B., Socha, P., Pannemans, D., & Samartin, S. (2004). Dietary intake and nutritional status of children and adolescents in Europe. British Journal of Nutrition, 92, S147-S211.
Lien, N., Jacobs, D. R., & Klepp, K. I. (2002). Exploring predictors of eating behaviour among adolescents by gender and socio-economic status. Public Health Nutrition, 5(5), 671-681.
Lien, N., Lytle, L. A., & Klepp, K. I. (2001). Stability in consumption of fruit, vegetables, and sugary foods in a cohort from age 14 to age 21. Preventive Medicine, 33(3), 217-226.
Livingstone, M. B. E., Robson, P. J. (2000). Measurement of dietary intake in children. Proceedings of the Nutrition Society, 59, 279-293.
Livingstone, M. B. E., Robson, P. J., Wallace, J. M. W. (2004). Issues in dietary intake assessment of children and adolescents. British Journal of Nutrition, 92(2), S213-S222.
Lobstein, T. J., & Frelut, M. L. (2003). Prevalence of overweight among children in Europe. Obesity Reviews, 4,195-200.
References
51
Lobstein, T. J., Baur, L., and Uauy, R. for the IASO International Obesity TaskForce (2004). Obesity in children and young people: a crisis in public health. 5(S1), S4-S85.
Ludwig, D. S., Peterson, K. E., & Gortmaker, S. L. (2001). Relation between consumption of sugar-sweetened drinks and childhood obesity: a prospective, observational analysis. Lancet, 357(9255), 505-508.
Lytle, L. A., & Kubik, M. Y. (2003). Nutritional issues for adolescents. Best Practice & Research Clinical Endocrinology & Metabolism, 17(2), 177-189.
Lytle, L. A., Murray, D. M., Perry, C. L., Story, M., Birnbaum, A. S., Kubik, M. Y., & Varnell, S. (2004). School-based approaches to affect adolescents' diets: Results from the TEENS study. Health Education & Behavior, 31(2), 270-287.
Malina, R. M. (1996). Tracking of physical activity and physical fitness across the lifespan. Research Quarterly for Exercise and Sport, 67(3), S48-S57.
Matthys, C., De Henauw, S., Devos, C., & De Backer, G. (2003). Estimated energy intake, macronutrient intake and meal pattern of Flemish adolescents. European Journal of Clinical Nutrition, 57(2), 366-375.
Mckenzie, T. L., Sallis, J. F., Prochaska, J. J., Conway, T. L., Marshall, S. J., & Rosengard, P. (2004). Evaluation of a two-year middle-school physical education intervention: M-SPAN. Medicine and Science in Sports and Exercise, 36(8), 1382-1388.
McMurray, R. G., Harrell, J. S., Bangdiwala, S. I., Bradley, C. B., Deng, S. B., & Levine, A. (2002). A school-based intervention can reduce body fat and blood pressure in young adolescents. Journal of Adolescent Health, 31(2), 125-132.
McVey, G., Tweed, S., & Blackmore, E. (2005). Correlates of weight loss and muscle-gaining behavior in 10-to 14-year-old males and females. Preventive Medicine, 40(1), 1-9.
Molnar, D., & Livingstone, B. (2000). Physical activity in relation to overweight and obesity in children and adolescents. European Journal of Pediatrics, 159, S45-S55.
Mota, J., Almeida, M., Santos, P., & Ribeiro, J. C. (2005). Perceived Neighborhood Environments
and physical activity in adolescents. Preventive Medicine, 41(5-6), 834-836.
Mota, J., Santos, P., Guerra, S., Ribeiro, J. C., & Duarte, J. A. (2002). Differences of daily physical activity levels of children according to body mass index. Pediatric Exercise Science, 14(4), 442-452.
Motl, R. W., Dishman, R. K., Ward, D. S., Saunders, R. P., Dowda, M., Felton, G., & Pate, R. R. (2005). Perceived physical environment and physical activity across one year among adolescent girls: self-efficacy as a possible mediator? Journal of Adolescent Health, 37(5), 403-408.
Nader P. R., Stone E. J., Lytle L. A., Perry C. L., Osganian S. K., Kelder S., Webber L. S., Elder J. P., Montgomery D., Feldman H. A., Wu M., Johnson C., Parcel G. S., Luepker R. V. (1999). Three-year maintenance of improved diet and physical activity. Archives of Pediatics and Adolescence Medicine, 153, 695-704.
National Center for Health Statistics (2005). Health, United States, 2005 With Chartbook on Trends in the Health of Americans (Report online). Available at: http://www.cdc.gov/nchs/hus.htm. Accessed June 4, 2006
National Council on Nutrition (2003). Dietary recommendations for Belgium. Brussels: Ministry of Social Affairs, Public Health and Environment.
Neumark-Sztainer, D., Story, M., Hannan, P. J., & Rex, J. (2003). New Moves: a school-based obesity prevention program for adolescent girls. Preventive Medicine, 37(1), 41-51.
Neumark-Sztainer, D., Story, M., Perry, C., & Casey, M. A. (1999). Factors influencing food choices of adolescents: Findings from focus-group discussions with adolescents. Journal of the American Dietetic Association, 99(8), 929-937.
Neumark-Sztainer, D., Wall, M. M., Story, M., & Perry, C. L. (2003). Correlates of unhealthy weight-control behaviors among adolescents: Implications for prevention programs. Health Psychology, 22(1), 88-98.
Neumark-Sztainer, D., Wall, M., Perry, C., & Story, M. (2003). Correlates of fruit and vegetable intake among adolescents - Findings
References
52
from Project EAT. Preventive Medicine, 37(3), 198-208.
O'Donnell, M. (1989). Definition of health promotion: Part III: Expanding the definition. American Journal of Health Promotion, 3(3), 5.
O'Neil, C. E., & Nicklas, T. A. (2002). Gimme 5: An innovative, school-based nutrition intervention for high school students. Journal of the American Dietetic Association, 102(3), S93-S96.
Pate, R. R., Freedson, P. S., Sallis, J. F., Taylor, W. C., Sirard, J., Trost, S. G., & Dowda, M. (2002). Compliance with physical activity guidelines: Prevalence in a population of children and youth. Annals of Epidemiology, 12(5), 303-308.
Penedo, F. J., & Dahn, J. R. (2005). Exercise and well-being: a review of mental and physical health benefits associated with physical activity. Current Opinion in Psychiatry, 18(2), 189-193.
Petosa, R. L., Hortz, B. V., Cardina, C. E., & Suminski, R. R. (2005). Social Cognitive Theory variables associated with physical activity among high school students. International Journal of Sports Medicine, 26(2), 158-163.
Post, G. B., de Vente, W., Kemper, H. C. G., & Twisk, J. W. R. (2001). Longitudinal trends in and tracking of energy and nutrient intake over 20 years in a Dutch cohort of men and women between 13 and 33 years of age: The Amsterdam growth and health longitudinal study. British Journal of Nutrition, 85(3), 375-385.
Prentice, A., & Jebb, S. (2004). Energy intake/physical activity interactions in the homeostasis of body weight regulation. Nutrition Reviews, 62(7), S98-S104.
Prochaska, J. O., DiClimente, C. C., Norcross, J. C. (1992). In search how people change. Applications to addictive behaviors. The American Psychologist. 47, 1102-1114.
Reilly, J. J. (2005). Descriptive epidemiology and health consequences of childhood obesity. Best Practice & Research Clinical Endocrinology & Metabolism, 19(3), 327-341.
Reilly, J. J., & Dorosty, A. R. (1999). Epidemic of obesity in UK children. Lancet, 354(9193), 1874-1875.
Rockett, H. R. H., Berkey, C. S., & Colditz, G. A. (2003). Evaluation of dietary assessment instruments in adolescents. Current Opinion in Clinical Nutrition and Metabolic Care, 6(5), 557-562.
Roelants, M., & Hoppenbrouwers, K. (2001). Epidemiologie van obesitas bij kinderen en jongeren in Vlaanderen en Nederland. In: Braet, C., Van Winkel, M. (eds). Behandelingsstrategieën bij kinderen met overgewicht. Houten, Bohn Stafleu Van Loghum (Care & Cure), 1-10.
Rolland-Cachera, M. F., Bellisle, F., & Deheeger, M. (2000). Nutritional status and food intake in adolescents living in Western Europe. European Journal of Clinical Nutrition, 54, S41-S46.
Sallis, J. F. (2000). Age-related decline in physical activity: a synthesis of human and animal studies. Medicine and Science in Sports and Exercise, 32(9), 1598-1600.
Sallis, J. F., & Owen, N. (2002). Ecological Models of Health Behavior. In: Glanz, K., Rimer B. K., & Lewis, F. M. (eds) Health Behavior and Health Education. San Francisco, Jossey-Bass, 462-484.
Sallis, J. F., & Patrick, K. (1994). Physical activity guidelines for adolescents: consensus statement. Pediatric Exercise Science, 6, 302-314.
Sallis, J. F., Bauman, A, Pratt, M. (1998). Environmental and policy interventions to promote physical activity. American Journal of Preventive Medicine. 15(4):379-397.
Sallis, J. F., McKenzie, T. L., Alcaraz, J. E., Kolody, B., Faucette, N., & Hovell, M. F. (1997). The effects of a 2-year physical education program (SPARK) on physical activity and fitness in elementary school students. American Journal of Public Health, 87(8), 1328-1334.
Sallis, J. F., McKenzie, T. L., Conway, T. L., Elder, J. P., Prochaska, J. J., Brown, M., Zive, M. M., Marshall, S. J., & Alcaraz, J. E. (2003). Environmental interventions for eating and physical activity - A randomized controlled
References
53
trial in middle schools. American Journal of Preventive Medicine, 24(3), 209-217.
Sallis, J. F., Prochaska, J. J., & Taylor, W. C. (2000). A review of correlates of physical activity of children and adolescents. Medicine and Science in Sports and Exercise, 32(5), 963-975.
Sarnblad, S., Ekelund, U., & Aman, J. (2006). Dietary fat intake predicts 1-year change in body fat in adolescent girls with type 1 diabetes. Diabetes Care, 29(6), 1227-1230.
Schmitz, K. H., Lytle, L. A., Phillips, G. A., Murray, D. M., Birnbaum, A. S., & Kubik, M. Y. (2002). Psychosocial correlates of physical activity and sedentary leisure habits in young adolescents: The teens eating for energy and nutrition at school study. Preventive Medicine, 34(2), 266-278.
Sheperd, J., Garcio, J., Oliver, S., Harden, A., Rees, R., Brunton, G., Oakley, A. (2002). Barriers to, and facilitators of the health of young people: a systematic review of evidience on young people’s views and on interventions in mental health, physical activity and healthy eating. Volume 2: Complete Report, Londen, EPPI-Centre, Social Science Research Unit, Institute of Education, University of London.
Simon, C., Wagner, A., DiVita, C., Rauscher, E., Klein-Platat, C., Arveiler, D., Schweitzer, B., & Triby, E. (2004). Intervention centred on adolescents' physical activity and sedentary behaviour (ICAPS): concept and 6-month results. International Journal of Obesity, 28, S96-S103.
Skinner, C., Campbell, M., Rimer, B., Curry, S., & Prochaska, J. (1999). How effective is tailored print communication? Annals of Behavioral Medicine, 21(4), 290-298.
Stamatakis, E., Primatesta, P., Chinn, S., Rona, R., & Falascheti, E. (2005). Overweight and obesity trends from 1974 to 2003 in English children: what is the role of socioeconomic factors? Archives of Disease in Childhood, 90(10), 999-1004.
Stockman, N. K. A., Schenkel, T. C., Brown, J. N., & Duncan, A. M. (2005). Comparison of energy and nutrient intakes among meals and snacks of adolescent males. Preventive Medicine, 41(1), 203-210.
Stone, E. J., McKenzie, T. L., Welk, G. J., & Booth, M. L. (1998). Effects of physical activity interventions in youth - Review and synthesis. American Journal of Preventive Medicine, 15(4), 298-315.
Story, M., Neumark-Sztainer, D., French, S. (2002). Individual and environmental influences on adolescent eating behaviours. Journal of the American Dietetic Association. 102(3), S40-51.
Strauss, R. S. (2000). Childhood obesity and self-esteem. Pediatrics, 105(1), e15.
Strong, W. B., Malina, R. M., Blimkie, C. J. R., Daniels, S. R., Dishman, R. K., Gutin, B., Hergenroeder, A. C., Must, A., Nixon, P. A., Pivarnik, J. M., Rowland, T., Trost, S., & Trudeau, F. O. (2005). Evidence based physical activity for school-age youth. Journal of Pediatrics, 146(6), 732-737.
Summerbell, C. D., Waters, E., Edmunds, L. D., Kelly, S., Brown, T., & Campbell, K. J. (2005). Interventions for preventing obesity in children. The Cochrane Database of Systematic Reviews, 3, Art. No.: CD001871.pub2. DOI: 10.1002/1465858. CD001871.pub2.
Taylor, J. P., Evers, S., & McKenna, M. (2005). Determinants of healthy eating in children and youth. Canadian Journal of Public Health-Revue Canadienne De Sante Publique, 96, S20-S26.
Taylor, R. W., Falorni, A., Jones, I. E., & Goulding, A. (2003). Identifying adolescents with high percentage body fat: a comparison of BMI cutoffs using age and stage of pubertal development compared with BMI cutoffs using age alone. European Journal of Clinical Nutrition, 57(6), 764-769.
Telama, R., Yang, X. L., Viikari, J., Valimaki, I., Wanne, O., & Raitakari, O. (2005). Physical activity from childhood to adulthood - A 21-year tracking study. American Journal of Preventive Medicine, 28(3), 267-273.
Thomas, H., Ciliska, D., Micucci, S., Wilson-Abra, J., & Dobbin, M. (2004). Effectiveness of physical activity enhancement and obesity prevention programs in children and youth. Online available at: http://old.hamilton.ca/phcs/ephpp/ReviewsPortal.asp., Accessed June 10, 2006.
References
54
Timperio, A., Salmon, J., & Ball, K. (2004). Evidence-based strategies to promote physical activity among children, adolescents and young adults: review and update. Journal of Science and Medicine in Sports, 7(1), S20-29.
Trost, S. G., Kerr, L. M., Ward, D. S., & Pate, R. R. (2001). Physical activity and determinants of physical activity in obese and non-obese children. International Journal of Obesity, 25(6), 822-829.
Trost, S. G., Pate, R. R., Sallis, J. F., Freedson, P. S., Taylor, W. C., Dowda, M., & Sirard, J. (2002). Age and gender differences in objectively measured physical activity in youth. Medicine and Science in Sports and Exercise, 34(2), 350-355.
Trost, S. G., Sallis, J. F., Pate, R. R., Freedson, P. S., Taylor, W. C., & Dowda, M. (2003). Evaluating a model of parental influence on youth physical activity. American Journal of Preventive Medicine, 25(4), 277-282.
Van den Bulck, J., & Van Mierlo, J. (2004). Energy intake associated with television viewing in adolescents, a cross sectional study. Appetite, 43(2), 181-184.
Vandelanotte, C., & De Bourdeaudhuij, I. (2003). Acceptability and feasibility of a computer-tailored physical activity intervention using stages of change: project FAITH. Health Education Research, 18(3), 304-317.
Vandelanotte, C., De Bourdeaudhuij, I., & Brug, J. (2004). Acceptability and feasibility of an interactive computer-tailored fat intake intervention in Belgium. Health Promotion International, 19(4), 463-470.
Vereecken, C. A., Bobelijn, K., & Maes, L. (2005). School food policy at primary and secondary schools in Belgium-Flanders: does it influence young people's food habits? European Journal of Clinical Nutrition, 59(2), 271-277.
Vereecken, C. A., De Henauw, S., & Maes, L. (2005). Adolescents' food habits: Results of the health behaviour in school-aged children survey. British Journal of Nutrition, 94(3), 423-431.
Vereecken, C. A., Inchley, J., Subramanian, S. V., Hublet, A., & Maes, L. (2005). The relative influence of individual and contextual socio-economic status on consumption of fruit and soft drinks among adolescents in Europe.
European Journal of Public Health, 15(3), 224-232.
Vereecken, C. A., Keukelier, E., & Maes, L. (2004). Influence of mother's educational level on food parenting practices and food habits of young children. Appetite, 43(1), 93-103.
Vereecken, C. A., Maes, L., & De Bacquer, D. (2004). The influence of parental occupation and the pupils' educational level on lifestyle behaviors among adolescents in Belgium. Journal of Adolescent Health, 34(4), 330-338.
Vereecken, C. A., Todd, J., Roberts, C., Mulvihill, C., & Maes, L. (2006). Television viewing behaviour and associations with food habits in different countries. Public Health Nutrition, 9(2), 244-250.
Videon, T. M., & Manning, C. K. (2003). Influences on adolescent eating patterns: The importance of family meals. Journal of Adolescent Health, 32(5), 365-373.
Walter, H. J. (1989). Primary Prevention of Chronic Disease among Children - the School-Based Know Your Body Intervention Trials. Health Education Quarterly, 16(2), 201-214.
Wang, Y. F., Monteiro, C., & Popkin, B. M. (2002). Trends of obesity and underweight in older children and adolescents in the United States, Brazil, China, and Russia. American Journal of Clinical Nutrition, 75(6), 971-977.
Wareham, N. J., & Rennie, K. L. (1998). The assessment of physical activity in individuals and populations: Why try to be more precise about how physical activity is assessed? International Journal of Obesity, 22, S30-S38.
Wareham, N. J., Van Sluijs, E. M. F., & Ekelund, U. (2005). Physical activity and obesity prevention: a review of the current evidence. Proceedings of the Nutrition Society, 64(2), 229-247.
Wechsler, H., Devereaux, R. S., Davis, M., & Collins, J. (2000). Using the school environment to promote physical activity and healthy eating. Preventive Medicine, 31(2), S121-S137.
Whitehead, R. G., Paul, A. A., & Cole, T. J. (1982). Trends in Food-Energy Intakes Throughout Childhood from One to 18 Years. Human Nutrition-Applied Nutrition, 36(1), 57-62.
World Health Organization. Action for Adolescent Health. Geneva, 1997.
References
55
World Health Organization. European Strategy for Child and Adolescent Health and development. WHO Regional Committee for Europe. Copenhagen, 2005.
World Health Organization. Ottawa Charter for health promotion. In: Proceedings of the First International Conference on Health Promotion. Ottawa, 21 November 1986.
World Health Organization. Preamble to the Constitution of the World Health Organization as adopted by the International Health Conference. New York, 19-22 June 1946, and entered into force on 7 April 1948.
Wyatt, S. B., Winters, K. P., & Dubbert, P. M. (2006). Overweight and obesity: Prevalence, consequences, and causes of a growing public health problem. American Journal of the Medical Sciences, 331(4), 166-174.

Original Research: Part 1
Leen Haerens, Benedicte Deforche, Lea Maes, Greet Cardon, Ilse De Bourdeaudhuij
Journal of Sports Medicine and Physical Fitness, Submitted
CHAPTER 1.1
PHYSICAL ACTIVITY AND RUNNING CAPACITY IN NORMAL
WEIGHT VERSUS OVERWEIGHT BOYS AND GIRLS
Chapter 1.1 Original Research
58
Physical activity and running capacity in normal weight versus overweight boys and
girls
Abstract Background: Some studies found lower levels of physical activity and fitness in overweight children, compared to normal weight children, while others have failed to observe any difference. Therefore the purpose of the present study was to reinvestigate differences in physical activity and running capacity between overweight and normal weight children. Methods: A random sample of 121 boys and 101 girls of 11 to 13 years old was selected. Children were divided into overweight/fat and normal weight/fat groups based on measures of body mass index and percentage of body fat. Physical activity level was assessed by accelerometers and a Physical Activity Questionnaire. Running capacity was measured by the Cooper Test. Results: Accelerometer data revealed that overweight/fat children were less moderate to vigorous physically active when compared to normal weight/fat children. They also performed worse on the running capacity test (p<0.001). Overweight children reported to be less active in leisure time (p<0.05) compared to normal weight children. Overfat girls reported to participate less in sports activities compared to normal fat girls (p<0.05). Conclusion: The present study found clear differences in physical activity and running capacity between overweight/fat and normal weight/fat 11 to 13 year olds. A major strength of the present study is that similar results were shown based on different estimates of overweight and activity in a relatively large sample of children. Key Words: Physical Fitness, Body Mass Index, Child Introduction It is clear that childhood overweight has reached epidemic proportions in all industrialized countries. In Flanders the prevalence of overweight is 16% [1]. Childhood overweight is associated with immediate negative health consequences [2]. In addition, overweight children often become overweight adults [3], who are at higher risk for cardiovascular problems [4]. One of the factors contributing to the increasing adiposity in children and adolescents may be a reduction in energy expenditure caused by a decrease in physical activity [5]. Studies investigating differences in physical activity levels between overweight and normal weight
children, at different ages, can be useful to design effective physical activity interventions. When comparing overweight and normal weight children with regard to physical activity levels or fitness, investigators used various measurements and categorisations to define overweight and physical activity. Body mass index (BMI) is often used as an index of body fat [4]. Different studies found high correlations (0.58 < r< 0.93) between BMI and adiposity in children [6-7] and the sex- and age specific cut-off points for BMI are internationally accepted [7]. Using BMI as a criterion to define overweight, most studies have found lower levels of physical activity in overweight than in normal weight youngsters [8-9]. In
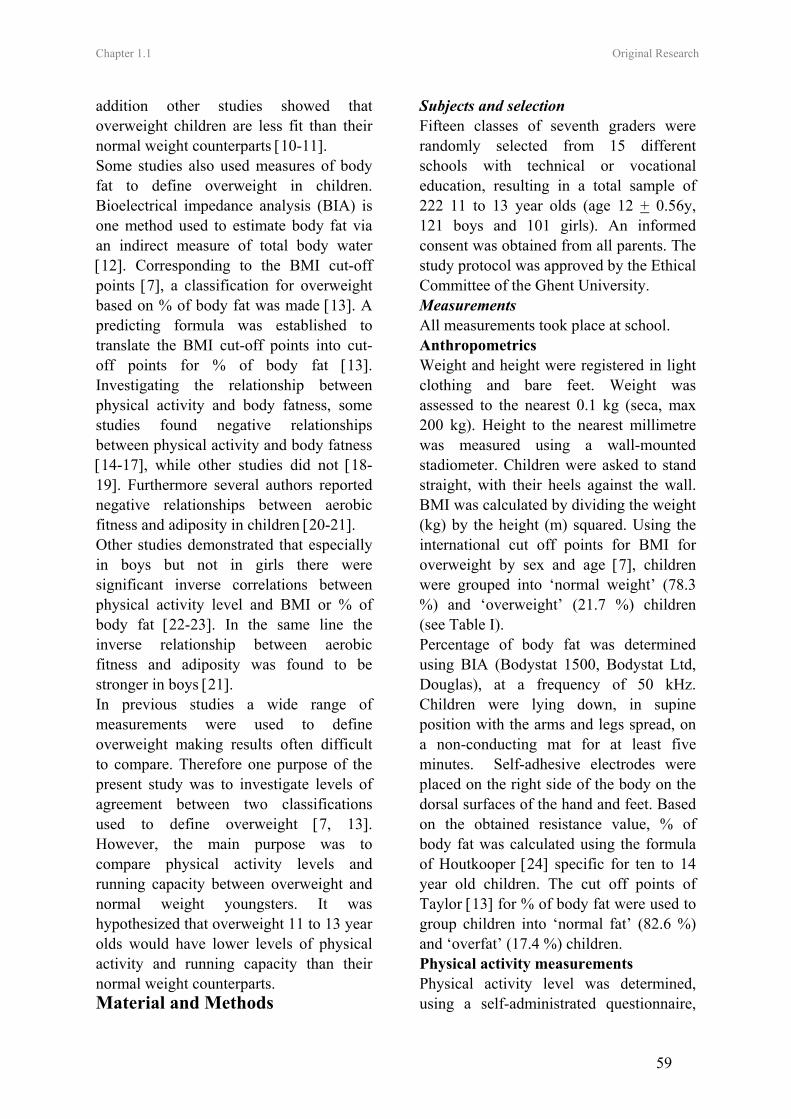
Chapter 1.1 Original Research
59
addition other studies showed that overweight children are less fit than their normal weight counterparts [10-11]. Some studies also used measures of body fat to define overweight in children. Bioelectrical impedance analysis (BIA) is one method used to estimate body fat via an indirect measure of total body water [12]. Corresponding to the BMI cut-off points [7], a classification for overweight based on % of body fat was made [13]. A predicting formula was established to translate the BMI cut-off points into cut-off points for % of body fat [13]. Investigating the relationship between physical activity and body fatness, some studies found negative relationships between physical activity and body fatness [14-17], while other studies did not [18-19]. Furthermore several authors reported negative relationships between aerobic fitness and adiposity in children [20-21]. Other studies demonstrated that especially in boys but not in girls there were significant inverse correlations between physical activity level and BMI or % of body fat [22-23]. In the same line the inverse relationship between aerobic fitness and adiposity was found to be stronger in boys [21]. In previous studies a wide range of measurements were used to define overweight making results often difficult to compare. Therefore one purpose of the present study was to investigate levels of agreement between two classifications used to define overweight [7, 13]. However, the main purpose was to compare physical activity levels and running capacity between overweight and normal weight youngsters. It was hypothesized that overweight 11 to 13 year olds would have lower levels of physical activity and running capacity than their normal weight counterparts. Material and Methods
Subjects and selection Fifteen classes of seventh graders were randomly selected from 15 different schools with technical or vocational education, resulting in a total sample of 222 11 to 13 year olds (age 12 + 0.56y, 121 boys and 101 girls). An informed consent was obtained from all parents. The study protocol was approved by the Ethical Committee of the Ghent University. Measurements All measurements took place at school. Anthropometrics Weight and height were registered in light clothing and bare feet. Weight was assessed to the nearest 0.1 kg (seca, max 200 kg). Height to the nearest millimetre was measured using a wall-mounted stadiometer. Children were asked to stand straight, with their heels against the wall. BMI was calculated by dividing the weight (kg) by the height (m) squared. Using the international cut off points for BMI for overweight by sex and age [7], children were grouped into ‘normal weight’ (78.3 %) and ‘overweight’ (21.7 %) children (see Table I). Percentage of body fat was determined using BIA (Bodystat 1500, Bodystat Ltd, Douglas), at a frequency of 50 kHz. Children were lying down, in supine position with the arms and legs spread, on a non-conducting mat for at least five minutes. Self-adhesive electrodes were placed on the right side of the body on the dorsal surfaces of the hand and feet. Based on the obtained resistance value, % of body fat was calculated using the formula of Houtkooper [24] specific for ten to 14 year old children. The cut off points of Taylor [13] for % of body fat were used to group children into ‘normal fat’ (82.6 %) and ‘overfat’ (17.4 %) children. Physical activity measurements Physical activity level was determined, using a self-administrated questionnaire,
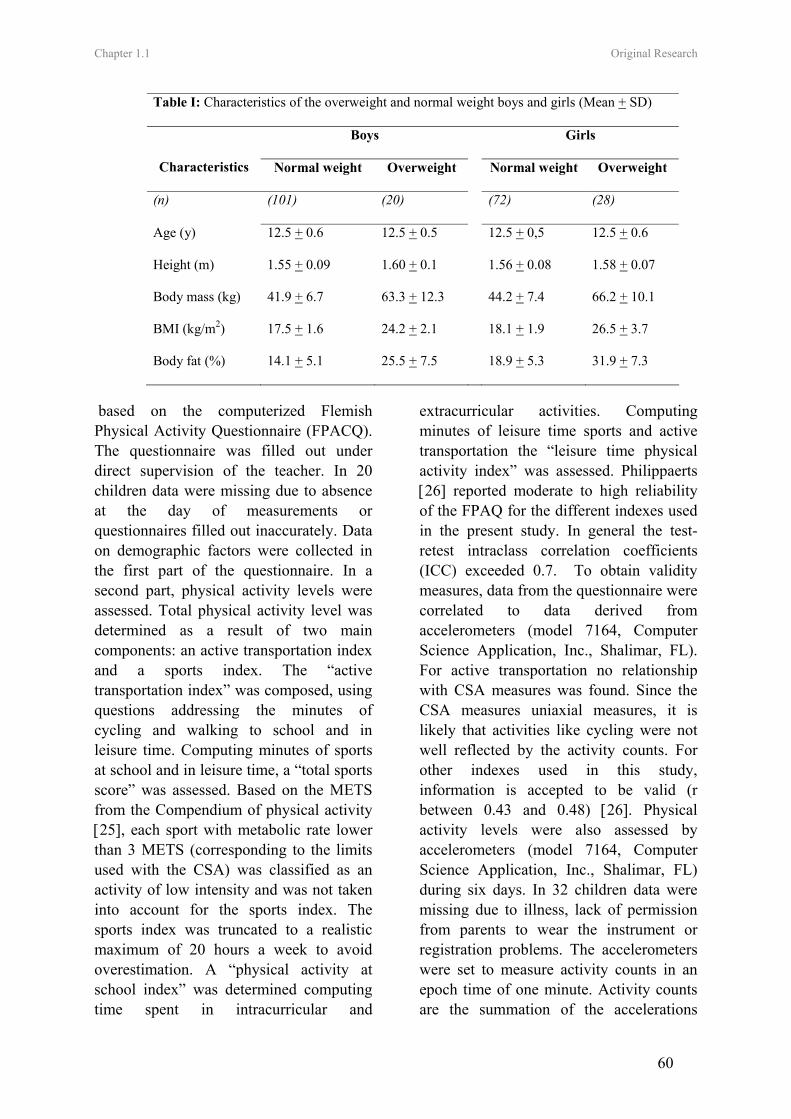
Chapter 1.1 Original Research
60
based on the computerized Flemish Physical Activity Questionnaire (FPACQ). The questionnaire was filled out under direct supervision of the teacher. In 20 children data were missing due to absence at the day of measurements or questionnaires filled out inaccurately. Data on demographic factors were collected in the first part of the questionnaire. In a second part, physical activity levels were assessed. Total physical activity level was determined as a result of two main components: an active transportation index and a sports index. The “active transportation index” was composed, using questions addressing the minutes of cycling and walking to school and in leisure time. Computing minutes of sports at school and in leisure time, a “total sports score” was assessed. Based on the METS from the Compendium of physical activity [25], each sport with metabolic rate lower than 3 METS (corresponding to the limits used with the CSA) was classified as an activity of low intensity and was not taken into account for the sports index. The sports index was truncated to a realistic maximum of 20 hours a week to avoid overestimation. A “physical activity at school index” was determined computing time spent in intracurricular and
extracurricular activities. Computing minutes of leisure time sports and active transportation the “leisure time physical activity index” was assessed. Philippaerts [26] reported moderate to high reliability of the FPAQ for the different indexes used in the present study. In general the test-retest intraclass correlation coefficients (ICC) exceeded 0.7. To obtain validity measures, data from the questionnaire were correlated to data derived from accelerometers (model 7164, Computer Science Application, Inc., Shalimar, FL). For active transportation no relationship with CSA measures was found. Since the CSA measures uniaxial measures, it is likely that activities like cycling were not well reflected by the activity counts. For other indexes used in this study, information is accepted to be valid (r between 0.43 and 0.48) [26]. Physical activity levels were also assessed by accelerometers (model 7164, Computer Science Application, Inc., Shalimar, FL) during six days. In 32 children data were missing due to illness, lack of permission from parents to wear the instrument or registration problems. The accelerometers were set to measure activity counts in an epoch time of one minute. Activity counts are the summation of the accelerations
Table I: Characteristics of the overweight and normal weight boys and girls (Mean + SD)
Boys Girls
Characteristics Normal weight Overweight Normal weight Overweight
(n) (101) (20) (72) (28)
Age (y) 12.5 + 0.6 12.5 + 0.5 12.5 + 0,5 12.5 + 0.6
Height (m) 1.55 + 0.09 1.60 + 0.1 1.56 + 0.08 1.58 + 0.07
Body mass (kg) 41.9 + 6.7 63.3 + 12.3 44.2 + 7.4 66.2 + 10.1
BMI (kg/m2) 17.5 + 1.6 24.2 + 2.1 18.1 + 1.9 26.5 + 3.7
Body fat (%) 14.1 + 5.1 25.5 + 7.5 18.9 + 5.3 31.9 + 7.3
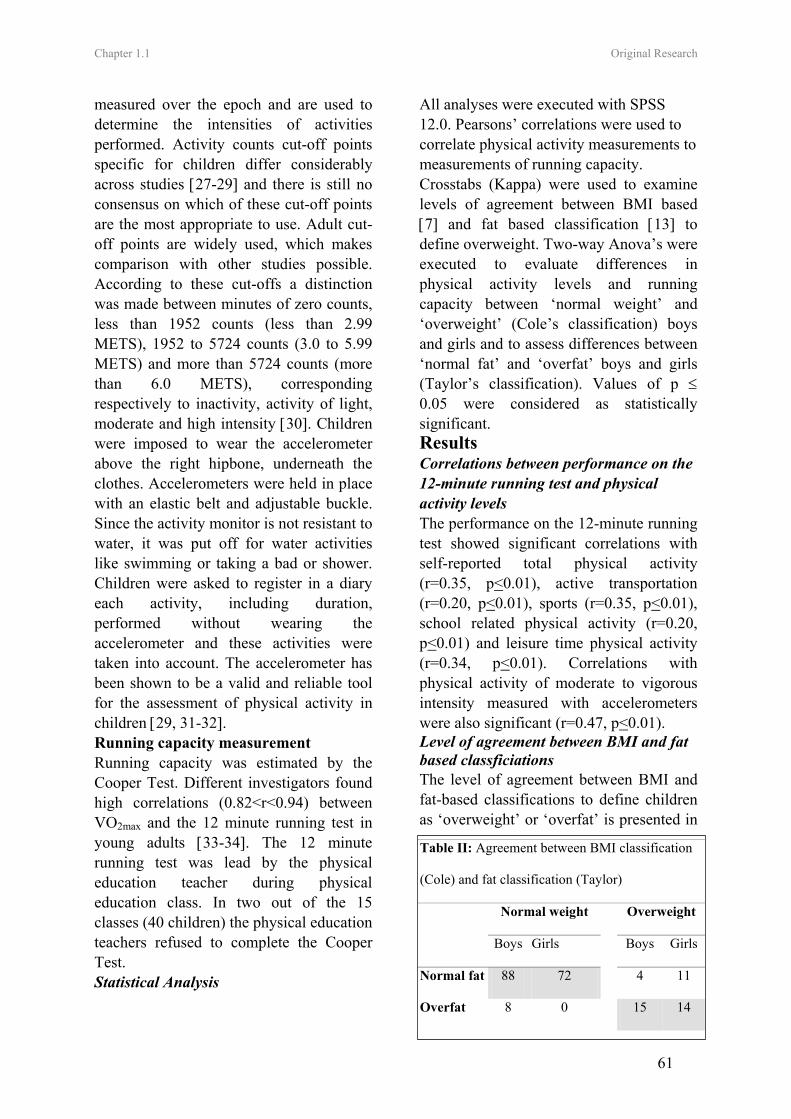
Chapter 1.1 Original Research
61
measured over the epoch and are used to determine the intensities of activities performed. Activity counts cut-off points specific for children differ considerably across studies [27-29] and there is still no consensus on which of these cut-off points are the most appropriate to use. Adult cut-off points are widely used, which makes comparison with other studies possible. According to these cut-offs a distinction was made between minutes of zero counts, less than 1952 counts (less than 2.99 METS), 1952 to 5724 counts (3.0 to 5.99 METS) and more than 5724 counts (more than 6.0 METS), corresponding respectively to inactivity, activity of light, moderate and high intensity [30]. Children were imposed to wear the accelerometer above the right hipbone, underneath the clothes. Accelerometers were held in place with an elastic belt and adjustable buckle. Since the activity monitor is not resistant to water, it was put off for water activities like swimming or taking a bad or shower. Children were asked to register in a diary each activity, including duration, performed without wearing the accelerometer and these activities were taken into account. The accelerometer has been shown to be a valid and reliable tool for the assessment of physical activity in children [29, 31-32]. Running capacity measurement Running capacity was estimated by the Cooper Test. Different investigators found high correlations (0.82<r<0.94) between VO2max and the 12 minute running test in young adults [33-34]. The 12 minute running test was lead by the physical education teacher during physical education class. In two out of the 15 classes (40 children) the physical education teachers refused to complete the Cooper Test. Statistical Analysis
All analyses were executed with SPSS 12.0. Pearsons’ correlations were used to correlate physical activity measurements to measurements of running capacity. Crosstabs (Kappa) were used to examine levels of agreement between BMI based [7] and fat based classification [13] to define overweight. Two-way Anova’s were executed to evaluate differences in physical activity levels and running capacity between ‘normal weight’ and ‘overweight’ (Cole’s classification) boys and girls and to assess differences between ‘normal fat’ and ‘overfat’ boys and girls (Taylor’s classification). Values of p ≤ 0.05 were considered as statistically significant. Results Correlations between performance on the 12-minute running test and physical activity levels The performance on the 12-minute running test showed significant correlations with self-reported total physical activity (r=0.35, p<0.01), active transportation (r=0.20, p<0.01), sports (r=0.35, p<0.01), school related physical activity (r=0.20, p<0.01) and leisure time physical activity (r=0.34, p<0.01). Correlations with physical activity of moderate to vigorous intensity measured with accelerometers were also significant (r=0.47, p<0.01). Level of agreement between BMI and fat based classficiations The level of agreement between BMI and fat-based classifications to define children as ‘overweight’ or ‘overfat’ is presented in
Table II: Agreement between BMI classification
(Cole) and fat classification (Taylor)
Normal weight Overweight
Boys Girls Boys Girls
Normal fat 88 72 4 11
Overfat 8 0
15 14
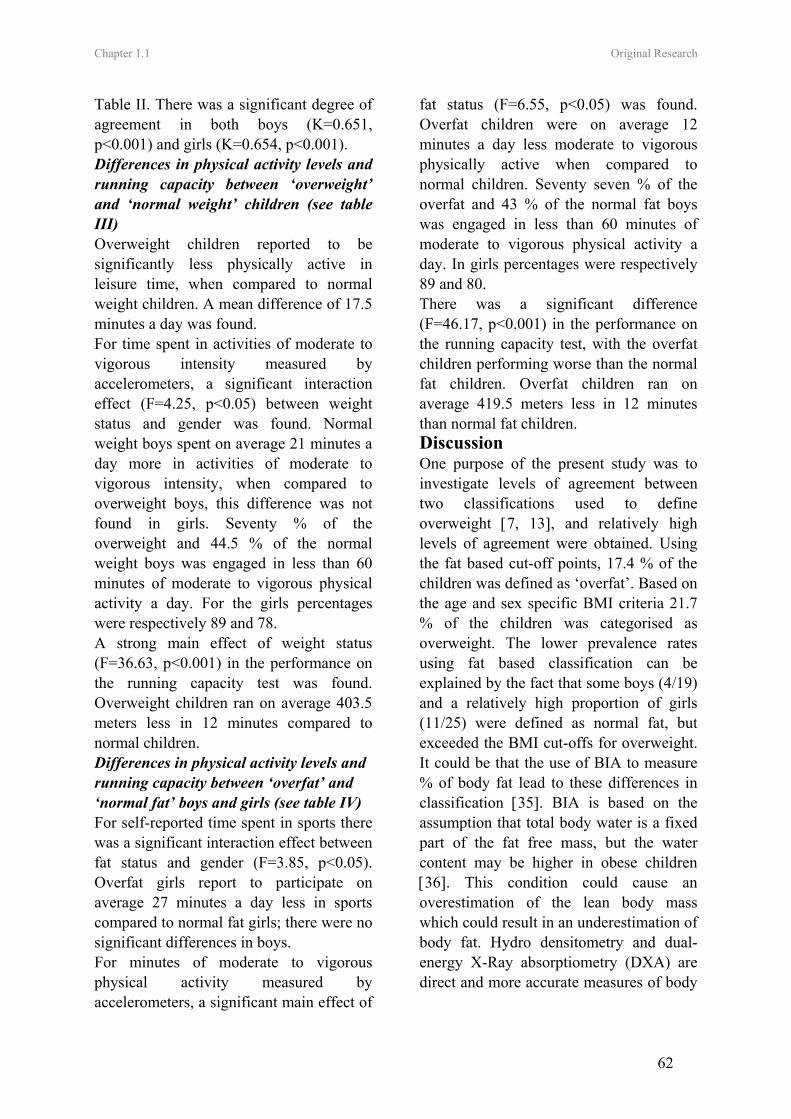
Chapter 1.1 Original Research
62
Table II. There was a significant degree of agreement in both boys (K=0.651, p<0.001) and girls (K=0.654, p<0.001). Differences in physical activity levels and running capacity between ‘overweight’ and ‘normal weight’ children (see table III) Overweight children reported to be significantly less physically active in leisure time, when compared to normal weight children. A mean difference of 17.5 minutes a day was found. For time spent in activities of moderate to vigorous intensity measured by accelerometers, a significant interaction effect (F=4.25, p<0.05) between weight status and gender was found. Normal weight boys spent on average 21 minutes a day more in activities of moderate to vigorous intensity, when compared to overweight boys, this difference was not found in girls. Seventy % of the overweight and 44.5 % of the normal weight boys was engaged in less than 60 minutes of moderate to vigorous physical activity a day. For the girls percentages were respectively 89 and 78. A strong main effect of weight status (F=36.63, p<0.001) in the performance on the running capacity test was found. Overweight children ran on average 403.5 meters less in 12 minutes compared to normal children. Differences in physical activity levels and running capacity between ‘overfat’ and ‘normal fat’ boys and girls (see table IV) For self-reported time spent in sports there was a significant interaction effect between fat status and gender (F=3.85, p<0.05). Overfat girls report to participate on average 27 minutes a day less in sports compared to normal fat girls; there were no significant differences in boys. For minutes of moderate to vigorous physical activity measured by accelerometers, a significant main effect of
fat status (F=6.55, p<0.05) was found. Overfat children were on average 12 minutes a day less moderate to vigorous physically active when compared to normal children. Seventy seven % of the overfat and 43 % of the normal fat boys was engaged in less than 60 minutes of moderate to vigorous physical activity a day. In girls percentages were respectively 89 and 80. There was a significant difference (F=46.17, p<0.001) in the performance on the running capacity test, with the overfat children performing worse than the normal fat children. Overfat children ran on average 419.5 meters less in 12 minutes than normal fat children. Discussion One purpose of the present study was to investigate levels of agreement between two classifications used to define overweight [7, 13], and relatively high levels of agreement were obtained. Using the fat based cut-off points, 17.4 % of the children was defined as ‘overfat’. Based on the age and sex specific BMI criteria 21.7 % of the children was categorised as overweight. The lower prevalence rates using fat based classification can be explained by the fact that some boys (4/19) and a relatively high proportion of girls (11/25) were defined as normal fat, but exceeded the BMI cut-offs for overweight. It could be that the use of BIA to measure % of body fat lead to these differences in classification [35]. BIA is based on the assumption that total body water is a fixed part of the fat free mass, but the water content may be higher in obese children [36]. This condition could cause an overestimation of the lean body mass which could result in an underestimation of body fat. Hydro densitometry and dual-energy X-Ray absorptiometry (DXA) are direct and more accurate measures of body
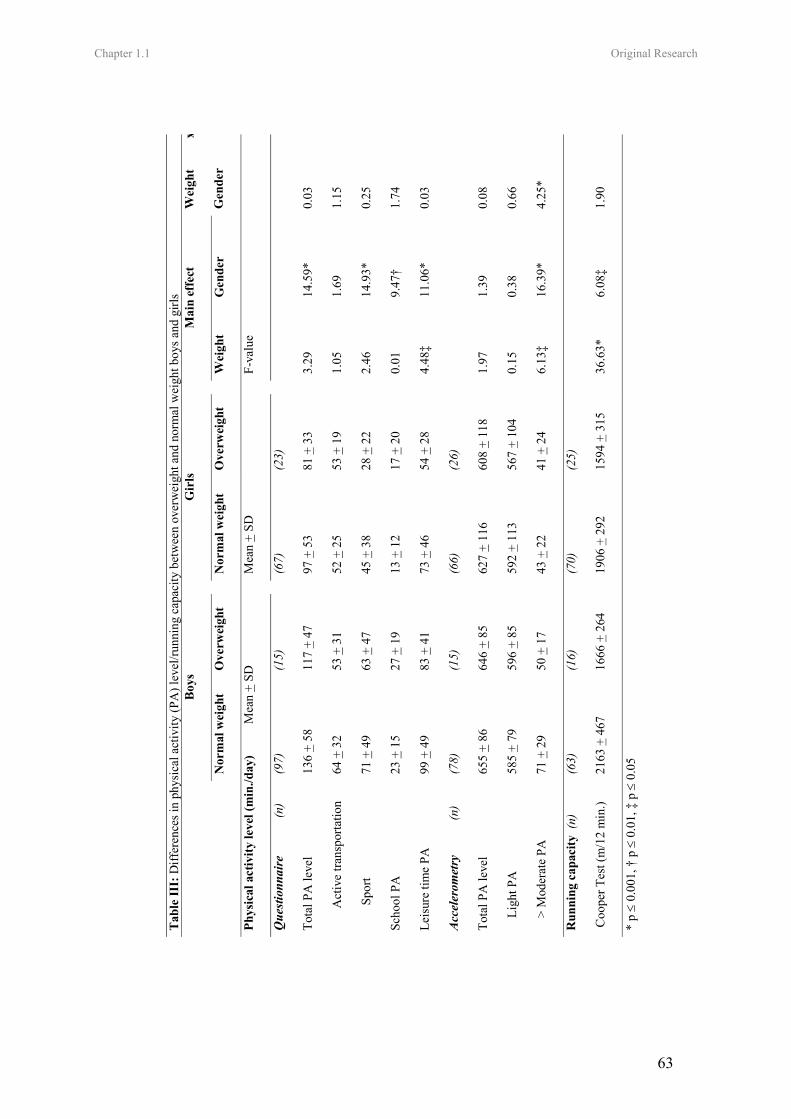
Chapter 1.1 Original Research
63
Tab
le II
I: D
iffer
ence
s in
phys
ical
act
ivity
(PA
) lev
el/ru
nnin
g ca
paci
ty b
etw
een
over
wei
ght a
nd n
orm
al w
eigh
t boy
s and
girl
s
Boy
s G
irls
Mai
n ef
fect
N
orm
al w
eigh
t O
verw
eigh
t
Nor
mal
wei
ght
Ove
rwei
ght
W
eigh
t G
ende
r
Wei
ght
x
Gen
der
Phys
ical
act
ivity
leve
l (m
in./d
ay)
Mea
n +
SD
M
ean
+ SD
F-va
lue
Que
stion
nair
e
(n)
(9
7)
(15)
(67)
(2
3)
Tota
l PA
leve
l 13
6 +
58
117
+ 47
97 +
53
81 +
33
3.
29
14.5
9*
0.03
Act
ive
trans
porta
tion
64 +
32
53 +
31
52
+ 2
5 53
+ 1
9
1.05
1.
69
1.15
Spo
rt
71 +
49
63 +
47
45
+ 3
8 28
+ 2
2
2.46
14
.93*
0.
25
Scho
ol P
A
23 +
15
27 +
19
13
+ 1
2 17
+ 2
0
0.01
9.
47†
1.74
Leis
ure
time
PA
99 +
49
83 +
41
73
+ 4
6 54
+ 2
8
4.48
‡ 11
.06*
0.
03
Acc
eler
omet
ry
(n)
(7
8)
(15)
(66)
(2
6)
Tota
l PA
leve
l 65
5 +
86
646
+ 85
627
+ 11
6 60
8 +
118
1.
97
1.39
0.
08
L
ight
PA
58
5 +
79
596
+ 85
592
+ 11
3 56
7 +
104
0.
15
0.38
0.
66
>
Mod
erat
e PA
71
+ 2
9 50
+ 1
7
43 +
22
41 +
24
6.
13‡
16.3
9*
4.25
*
Run
ning
cap
acity
(n)
(6
3)
(16)
(70)
(2
5)
Coo
per T
est (
m/1
2 m
in.)
2163
+ 4
67
1666
+ 2
64
19
06 +
292
15
94 +
315
36.6
3*
6.08
‡ 1.
90
* p ≤
0.00
1, †
p ≤
0.0
1, ‡
p ≤
0.0
5
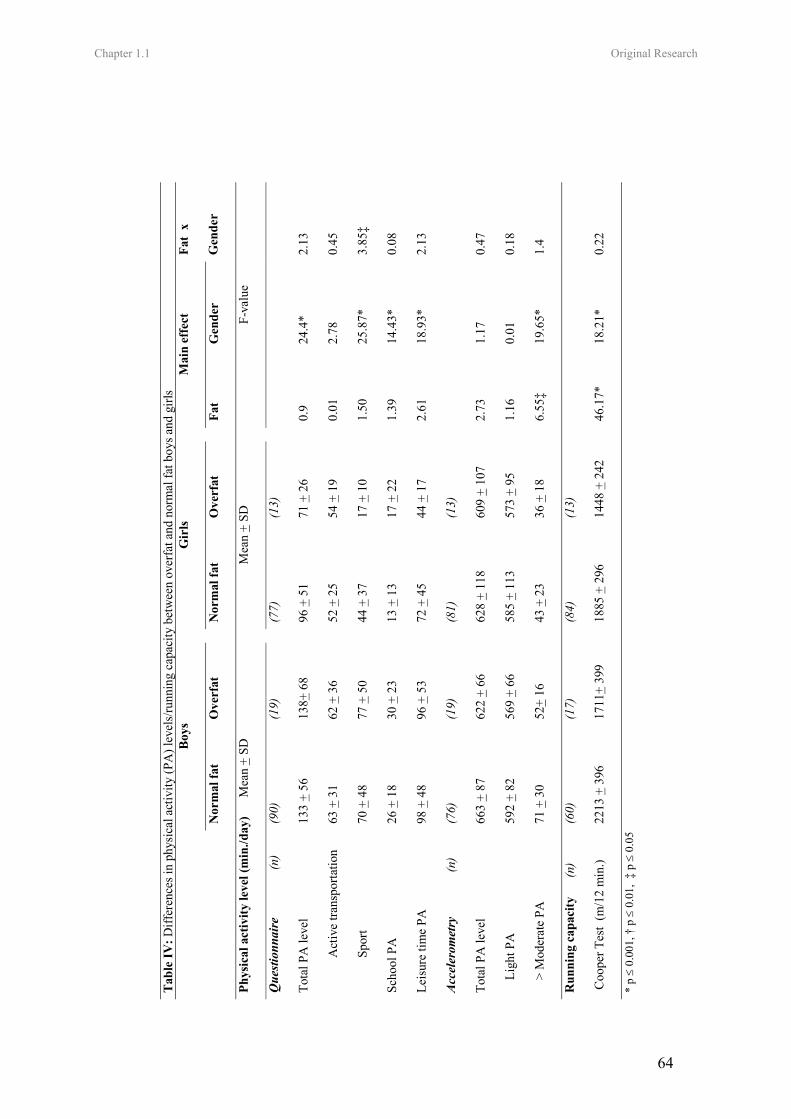
Chapter 1.1 Original Research
64
Tab
le IV
: Diff
eren
ces i
n ph
ysic
al a
ctiv
ity (P
A) l
evel
s/ru
nnin
g ca
paci
ty b
etw
een
over
fat a
nd n
orm
al fa
t boy
s and
girl
s
Boy
s
Gir
ls
M
ain
effe
ct
N
orm
al fa
t O
verf
at
N
orm
al fa
t O
verf
at
Fa
t G
ende
r
Fat
x
Gen
der
Phys
ical
act
ivity
leve
l (m
in./d
ay)
M
ean
+ SD
Mea
n +
SD
F-
valu
e
Que
stion
nair
e
(
n)
(90)
(1
9)
(7
7)
(13)
Tota
l PA
leve
l 13
3 +
56
138+
68
96
+ 5
1 71
+ 2
6
0.9
24.4
* 2.
13
A
ctiv
e tra
nspo
rtatio
n
63 +
31
62 +
36
52
+ 2
5 54
+ 1
9
0.01
2.
78
0.45
S
port
70
+ 4
8 77
+ 5
0
44 +
37
17 +
10
1.
50
25.8
7*
3.85
‡
Scho
ol P
A
26 +
18
30 +
23
13
+ 1
3 17
+ 2
2
1.39
14
.43*
0.
08
Leis
ure
time
PA
98 +
48
96 +
53
72
+ 4
5 44
+ 1
7
2.61
18
.93*
2.
13
Acc
eler
omet
ry
(
n)
(76)
(1
9)
(8
1)
(13)
Tota
l PA
leve
l 66
3 +
87
622
+ 66
628
+ 11
8 60
9 +
107
2.
73
1.17
0.
47
L
ight
PA
59
2 +
82
569
+ 66
585
+ 11
3 57
3 +
95
1.
16
0.01
0.
18
>
Mod
erat
e PA
71
+ 3
0 52
+ 16
43 +
23
36 +
18
6.
55‡
19.6
5*
1.4
Run
ning
cap
acity
(n)
(60)
(1
7)
(8
4)
(13)
Coo
per T
est
(m/1
2 m
in.)
2213
+ 3
96
1711
+ 39
9
1885
+ 2
96
1448
+ 2
42
46
.17*
18
.21*
0.
22
* p ≤
0.00
1, †
p ≤
0.0
1, ‡
p ≤
0.0
5
65
fat, but these methods are expensive and not easy to use in the field [37]. However, independent of criteria used, prevalence rates were higher than population reference values (16%) in our subgroup of Flemish children [1]. Also this could be a measurement issue, since self-reported height and weight were used to assess population prevalence rates, which could have caused an underestimation of BMI [38]. Another explanation for the higher prevalence rates is the lower level of education in our sample. Lower educated children often have lower educated parents with lower social status [39]. A negative association between parental social status and the prevalence of overweight has been demonstrated [40]. The main purpose of this study was to investigate differences in physical activity levels and running capacity between overweight and normal weight children. In line with the hypothesis, clear differences were demonstrated. For physical activity measured by accelerometers, differences between groups varied by intensity. No differences between groups were found for physical activity of light intensity, whereas there were differences for time spent in moderate to vigorous physical activity. Normal weight boys had higher levels of moderate to vigorous physical activity compared to overweight boys, but in girls time spent in moderate to vigorous physical activity was comparable. However results with fat based standards were slightly different. Overfat boys, but also girls were less moderate to vigorous physically active compared to normal fat boys and girls. Few studies have looked at differences between overweight and normal weight children according to quantity and intensity of the activities objectively measured by accelerometers. Supportive to our results, Trost et al [8] found that obese 11 year old children were
on average 22 minutes a day less moderate to vigorous physically active compared to non-obese children, but gender differences were not analysed. Mota et al [9] found a mean difference of 19 minutes a day between overweight and normal weight girls aged 8-15 year for time spent in activities of moderate to vigorous intensity, contradictory to our results no differences were found in boys. Other studies found inverse correlations between time spent in moderate to vigorous physical activity and % of body fat [16-17]. Guidelines for physical activity in youth [41] recommend involvement in moderate to vigorous physical activities for at least 60 minutes a day from a health promotion [42] as well as from a weight control perspective [14]. In the present study very high percentages of children did not meet these guidelines. Differences between groups for self-reported physical activity level were partly dependent on the context of the activities. Overweight boys and girls were less engaged in leisure time physical activity compared to normal weight boys and girls. These differences were not found when using the fat based criteria. Overweight children spent on average 18 minutes a day less in leisure time physical activities than normal weight children. There were no differences in sports participation between overweight and normal weight boys and girls, when using the BMI standards. When using fat based criteria no differences in sports participation were found in boys. However, girls defined as ‘overfat’ engaged on average 27 minutes a day less in sports when compared to normal fat girls. In contrast to these findings, other studies found lower levels of sports participation in overweight or obese adolescent boys versus normal weight boys, but not in girls [11, 43]. In line with other studies where a negative relationship between aerobic fitness and
66
body fat or increasing body fatness was found [20-21], there were large differences in performance on the running capacity test between overweight and normal weight boys and girls. The differences in physical activity found between overweight and normal weight youngsters may explain the differences found in running capacity as lower levels of physical activity were related to lower levels of running capacity in the present sample. Another explanation may be that overweight children were less motivated than normal weight children to run as much as possible during the 12-minute running test, but were rather focused on continuing with running during 12 minutes. Furthermore, a weight-bearing task was used to assess running capacity, since in daily life time activities overweight youngsters also have to carry their extra body weight. Of course, results might look different when using a non-weight bearing physical fitness test. This study was cross-sectional. It described physical activity patterns of a group of children at one point in time, therefore questions about development or aetiology of overweight can not be answered. It was demonstrated that the variation in measurements and cut-off points used to define overweight should be taken into account when interpreting results of different studies. Therefore a major strength of the present study is that similar results were shown based on different estimates of body fat (BMI and BIA) and activity (physical activity questionnaire, accelerometers and running capacity). Using accelerometers, it was more objectively demonstrated that physical activity levels differed between overweight and normal weight children. Not surprisingly, differences in self-reported levels were less clear; since it is known that obese subjects tend to over report there physical activity levels [44-45].
Conclusions It can be concluded that already in early adolescence overweight youngsters are less active and less fit than their normal weight counterparts and that prevention but also treatment is very urgent in this lower educated group. High percentages of overweight but also normal weight children are not engaged in adequate levels of moderate to vigorous physical activity and this is already the case in children of 11 to 13 years old. References 1. Lissau I, Overpeck MD, Ruan WJ, et al. Body Mass Index and Overweight in Adolescents in 13 European Countries, Israel, and the United States. Arch Pediatr Adolesc Med. 2004;158:27-33. 2. Must A, Strauss RS. Risk and consequences of childhood and adolescent obesity. Int J Obes. 1999;23(S2):S2-S11. 3. Biddle SJH, Gorely T, Stensel DJ. Health-enhancing physical activity and sedentary behaviours in children and adolescents. J Sports Sci. 2004; 19(12):915-29. 4. Kiess W, Galler A, Reich A, et al. Clinical aspects of obesity in childhood and adolescence. Obes Rev. 2001;2:29-36. 5. Boreham C, Riddoch C. The physical activity, fitness and health of children. J Sports Sci. 2001;19:915-29. 6. Dietz WH, Robinson TN. Use of the body mass index (BMI) as a measure of overweight in children and adolescents. J Pediatr. 1998;132(2):S191-3. 7. Cole TJ, Bellizzi MC, Flegal KM, Dietz WH. Establishing a standard definition for child overweight and obesity worldwide: international survey. BMJ. 2000;320:1-6. 8. Trost SG, Kerr LM, Ward DS, Pate RR. Physical activity and determinants of physical activity in obese and non-obese children. Int J Obes. 2001;25:822-9. 9. Mota J, Santos P, Guerra S, Ribeiro JC, Duarte JA. Differences in daily physical activity levels of children according to body mass index. Pediatr Exerc Sci. 2002;14:442-52.
67
10. Grund A, Dilba B, Forberger K, et al. Relationships between physical activity, physical fitness, muscle strength and nutritional state in 5-to11-year old children. Eur J Appl Physiol. 2000;82:425-38. 11. Deforche B, Lefevre J, De Bourdeaudhuij I, Hills AP, Duquet W, Bouckaert J. Physical activity and health-related physical fitness in obese and non-obese Flemish youth. Obes Res. 2003;11:434-41. 12. Fors H, Gelander L, Bjarnason K, Albertsson-Wikland K, Bosaeus I. Body composition, as assessed by bioelectrical impedance spectroscopy and dual-energy X-ray absorptiometry, in a healthy paediatric population. Acta Paediatr. 2002;91:755-60. 13. Taylor RW, Jones IE, Williams SM, Goulding A. Body fat percentages measured by dual-energy X-ray absorbtiometry corresponding to recently recommended body mass index cut-offs for overweight and obesity in children and adolescents aged 3-18 y. Am J Clin Nutr. 2002;76:1416-21. 14. Steinbeck KS. The importance of physical activity in the prevention of overweight and obesity in childhood: a review and an opinion. Obes Rev. 2001;2:117-30. 15. Saris WHM, Blair, SN, Baak MA, et al. How much physical activity is enough to prevent unhealthy weight gain? Outcome of the IASO 1st Stock Conference and consensus statement. Obes Rev. 2003;4:101-14. 16. Rowlands AV, Eston RG, Lobo L, Ingledew DK, Kwok KT, Fu FH. Physical activity levels of Hong Kong Chinese Children: Relationship with Body Fat. Pediatr Exerc Sci. 2002;14:286-96. 17. Janz KF, Levy SM, Burns TL, Torner JC, Willing MC, Warren JJ. Fatness, physical activity, and television viewing in children during the adiposity rebound period: The Iowa bone development study. Prev Med. 2002;35:563-571. 18. Ekelund U, Poortvliet E, Nilsson A, Yngve A, Holmberg A, Sjöström M. Physical activity in relation to aerobic fitness and body fat in 14- to 15-year-old boys and girls. Eur J Appl Physiol. 2001;85:195-201.
19. Katzmarzyk PT, Malina RM, Song TMK, Bouchard C. Physical activity and health-related fitness in youth: a multivariate analysis. Med Sci Sports Exerc. 1998; 30(5):709-14. 20. Johnson MS, Figueroa-Colon R, Herd SL, et al. Aerobic fitness, not energy expenditure, influences subsequent increase in adiposity in black and white children. Pediatrics. 2000;106(4):e50. 21. Gonzalez-Gross M, Ruiz JR, Moreno LA. Body composition and physical performance of Spanish adolescents: the AVENA pilot study. Acta Diabetol. 2003;40:S299-301. 22. Benefice E. Physical fitness and body composition in relation to physical activity in prepubescent Senegalese children. Am J Hum Biol. 1998;10(3):385-96. 23. Ball EJ, O’Connor J, Abbott R, et al. Total energy expenditure, body fatness and physical activity in children aged 6-9 year. Am J Clin Nutr. 2001;74(4):524-28. 24. Houtkooper LB, Lohman TG, Going SB, Howell WH. Why bioelectrical impedance analysis should be used for estimating adiposity. Am J Clin Nutr. 1996; 64:S436-48. 25. Ainsworth BE, Haskell WL, Whitt Mc, et al. Compendium of physical activities: an update of activity codes and MET intensities. Med Sci Sports Exerc. 2000;32:S498-S516. 26. Philippaerts RM, Matton L, Wijndaele K, Balduck A, De Bourdeaudhuij I, Lefevre J. Validity of a physical activity computer questionnaire in 12- to 18 year old boys and girls. Int J Sports Med. In press. 27. Trost SG, Pate RR, Sallis JF et al. Age and gender differences in objectively measured physical activity in youth. Med Sci Sports Exerc. 2002;34(2):350-5. 28. Threuth MS, Schmitz K, Catellier DJ et al. Defining accelerometer thresholds for activities intensities in adolescent girls. Med Sci Sports Exerc. 2004;36(7):1259-66. 29. Puyau MR, Adolph AL, Vohra FA, Butte NF. Validation and calibration of physical activity monitors in children. Obes Res. 2002;10(3):150-7. 30. Freedson PS, Melanson E, Sirard J. Calibration of the Computer Science and
68
Applications, Inc. accelerometer. Med Sci Sports Exerc. 1998;30(5):777-81. 31. Janz KF. Validation of the CSA accelerometer for assessing children’s physical activity. Med Sci Sports Exerc. 1994;26:369-75. 32. Trost SG, Ward DS, Moorehead SM, Watson PD, Riner W, Burke JR. Validity of the computer science and applications (CSA) activity monitor in children. Med Sci Sports Exerc. 1998;30:629-33. 33. Mccutcheon MC, Sticha SA, Giese MD, Nagle FJ. A further analysis of the 12-minute run prediction of maximal aerobic power. Res Q. 1990;61(3):280-3. 34. McNaughton L, Hall P, Cooley D. Validation of several methods estimating maximal oxygen uptake in young men. Percept Mot Skills. 1998;87(2):575-84. 35. Eisenkölbl J, Kartasurya M, Widhalm K. Underestimation of percentage fat mass measured by bioelectrical impedance analysis compared to dual energy X-ray absorptiometry method in obese children. Eur J Clin Nutr. 2001;55:423-9. 36. Haroun S, Wells JCK, Williams JE, Fuller, NJ, Fewtrell MS, Lawson MS. Composition of the fat-free mass in obese and nonobese children: matched case-control analyse. Int J Obes. 2005; 29-36. 37. Deurenberg P. Limitations of the bioelectrical impedance method for the assessment of body fat in severe obesity. Am J Clin Nutr. 1996;64:S449-S52. 38. Brener ND, Mcmanus T, Galuska DA, Lowry R, Wechsler H. Reliability and validity of
self-reported height and weight among high school students. J Adolesc Health. 2003;32(4):281-7. 39. Van Damme J, De Troy A, Meyer J et al. Succesvol doorstromen in de aanvangsjaren van het secundair onderwijs. [Successful flow through in the inceptions years of the middle school education]. Leuven: Acco. 1997. 40. Stam-Moraga MC, Kolanowski J, Dramaix M, De Backer G, Kortnitzer MD. Sociodemographic and nutritional determinants of obesity in Belgium. Int J Obes. 1999;23 (S1):1-9. 41. Cavill NA, Biddle S, Sallis JF. Health enhancing physical activity for young people: Statement of the United Kingdom Expert Consensus Conference. Pediatr Exerc Sci. 2001;13:12-25. 42. Rippe JM, Hess S. The role of physical activity in the prevention and management of obesity. J Am Diet Assoc. 1998; 98(S2):S31-8. 43. Garaulet M, Martinez A, Vicotoria F, Perez-Llamas F, Ortega RM, Zamora S. Differences in dietary intake and activity level between normal-weight and overweight or obese adolescents. J Pediatr Gastroenterol Nutr. 2000;30(3):253-8. 44. Forbes GB. Diet and exercise in obese subjects: self-report versus controlled measurements. Nutr Rev. 1993;51:296-300. 45. Epstein LH, Paluch RA, Coleman KJ, Vito D, Anderson K. Determinants of physical activity in obese children assessed by accelerometer and self-report. Med Sci Sports Exerc. 1996;28(9):1157-64.
Leen Haerens, Mietje Craeynest, Benedicte Deforche, Lea Maes, Greet Cardon, Ilse
De Bourdeaudhuij
European Journal of Clinical Nutrition, Accepted
CHAPTER 1.2
THE CONTRIBUTION OF PSYCHOSOCIAL AND HOME
ENVIRONMENTAL FACTORS IN EXPLAINING EATING
BEHAVIORS IN ADOLESCENTS
Chapter 1.2 Original Research.
70
The contribution of psychosocial and home environmental factors in explaining eating behaviors in adolescents.
Abstract Objective: The present study aimed at investigating the influence of food availability, rules and television viewing habits on eating behaviours in adolescents. Design: Cross-sectional study. Setting: Four randomly selected middle schools. Subjects: A sample of 534 7th and 8th graders. Interventions: Validated questionnaires were used to measure the family environment and fat, soft drink and fruit consumption. Hierarchical regression analyses on fat, soft drink and fruit consumption, with demographic and psychosocial variables entered as the first and environmental factors as the second block were conducted in boys and girls. Results: Boys with more unhealthy products available at home consumed more fat (p<0.001, 95% CI: 8.2 to 29.4) and more soft drinks (p<0.01, 95% CI: 0.2 to 1.4). Boys who reported better television viewing habits ate more fruit (p<0.001, 95% CI: -1.7 to -0.5). Girls who reported better television viewing habits consumed less fat (p<0.01, 95% CI: 1.4 to 9.0) and more fruit (p<0.05, 95% CI: -1.0 to -0.1). Girls who reported higher availability of healthy products at home (p<0.05, 95% CI: 0.3 to 3.1) and more food rules (p<0.001, 95% CI: -1.8 to -0.5), consumed more fruit. Environmental factors were poor predictors of soft drink consumption among girls. Conclusion: Availability of (un) healthy food products, family food rules and TV viewing habits were related to one or more eating behaviours in boys or girls. Although home environmental factors can play an important role in influencing adolescents’ eating behaviours, these factors were generally less predictive than demographic and psychosocial variables.
Key Words: Environment, Family, Dietary Fats, Fruit, Drinking Behavior, Adolescent Introduction In the past years dietary behaviours have moved in an unhealthy direction in US youth (Story et al, 2002; Lytle & Kubik, 2003). Also in Europe children and adolescents have poor dietary habits (Cruz, 2000; Currie et al, 2004; Lambert et al 2004). The transition from childhood into adolescence often results in diets becoming less healthy (Lytle, 2000). Previous research in European adolescents revealed that saturated fat intake is far above recommendations, fruit intake is less than desirable and soft drink consumption is too high (Currie et al, 2004). An unhealthy diet during adolescence can negatively affect growth and development (CDC, 1997) and is likely to persist into adulthood (Kelder et
al, 1994; Lien et al, 2001). Moreover high energy and fat intake, low fruit intake and excessive soft-drink consumption have been associated with higher risk for becoming overweight and obese and for diabetes, hypertension, cancer and cardiovascular diseases (Willet, 1994; CDC, 1997; Reilly & Dorosty, 1999; Van Duyn & Pivonka, 2000; Ludwig et al, 2001; Lytle & Kubik, 2003; Matthys et al, 2003). Hence, there is an urgent need for effective interventions aimed at improving dietary behaviours in adolescents. However, to design effective interventions it is necessary to understand factors that influence adolescents’ eating behaviours. Different health behavioural theories such as the Social Cognitive Theory (Bandura, 1986) and the Theory of Planned
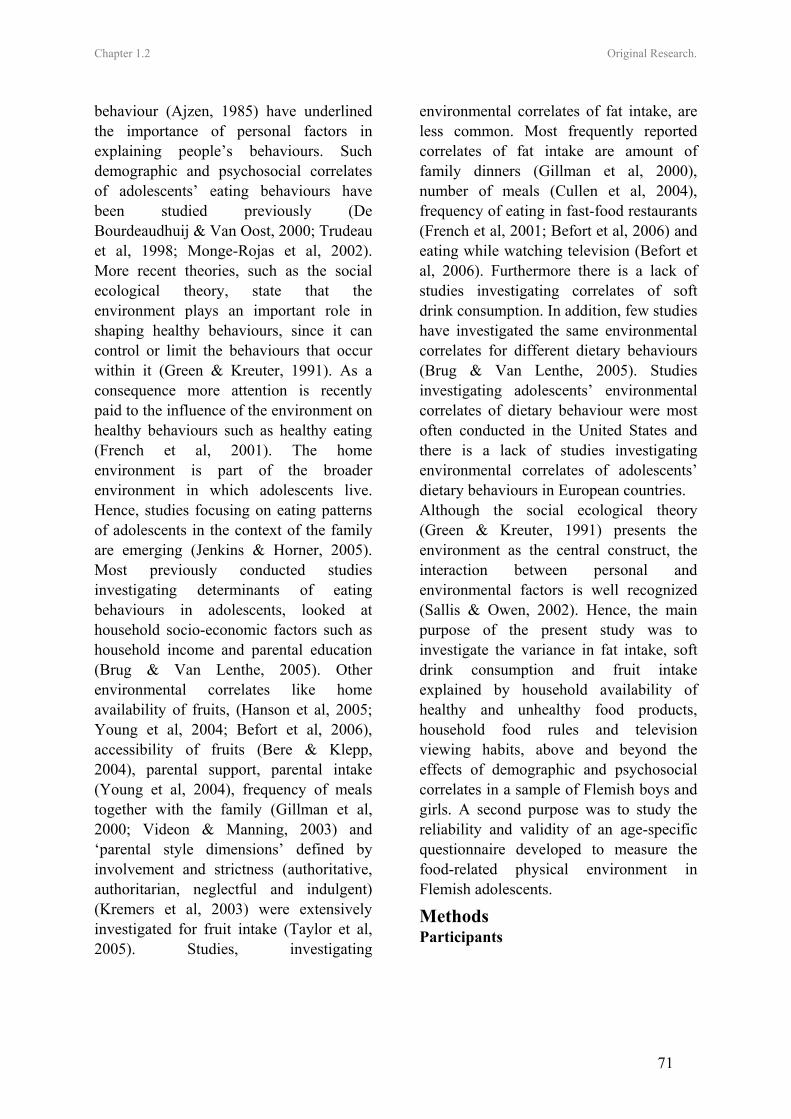
Chapter 1.2 Original Research.
71
behaviour (Ajzen, 1985) have underlined the importance of personal factors in explaining people’s behaviours. Such demographic and psychosocial correlates of adolescents’ eating behaviours have been studied previously (De Bourdeaudhuij & Van Oost, 2000; Trudeau et al, 1998; Monge-Rojas et al, 2002). More recent theories, such as the social ecological theory, state that the environment plays an important role in shaping healthy behaviours, since it can control or limit the behaviours that occur within it (Green & Kreuter, 1991). As a consequence more attention is recently paid to the influence of the environment on healthy behaviours such as healthy eating (French et al, 2001). The home environment is part of the broader environment in which adolescents live. Hence, studies focusing on eating patterns of adolescents in the context of the family are emerging (Jenkins & Horner, 2005). Most previously conducted studies investigating determinants of eating behaviours in adolescents, looked at household socio-economic factors such as household income and parental education (Brug & Van Lenthe, 2005). Other environmental correlates like home availability of fruits, (Hanson et al, 2005; Young et al, 2004; Befort et al, 2006), accessibility of fruits (Bere & Klepp, 2004), parental support, parental intake (Young et al, 2004), frequency of meals together with the family (Gillman et al, 2000; Videon & Manning, 2003) and ‘parental style dimensions’ defined by involvement and strictness (authoritative, authoritarian, neglectful and indulgent) (Kremers et al, 2003) were extensively investigated for fruit intake (Taylor et al, 2005). Studies, investigating
environmental correlates of fat intake, are less common. Most frequently reported correlates of fat intake are amount of family dinners (Gillman et al, 2000), number of meals (Cullen et al, 2004), frequency of eating in fast-food restaurants (French et al, 2001; Befort et al, 2006) and eating while watching television (Befort et al, 2006). Furthermore there is a lack of studies investigating correlates of soft drink consumption. In addition, few studies have investigated the same environmental correlates for different dietary behaviours (Brug & Van Lenthe, 2005). Studies investigating adolescents’ environmental correlates of dietary behaviour were most often conducted in the United States and there is a lack of studies investigating environmental correlates of adolescents’ dietary behaviours in European countries. Although the social ecological theory (Green & Kreuter, 1991) presents the environment as the central construct, the interaction between personal and environmental factors is well recognized (Sallis & Owen, 2002). Hence, the main purpose of the present study was to investigate the variance in fat intake, soft drink consumption and fruit intake explained by household availability of healthy and unhealthy food products, household food rules and television viewing habits, above and beyond the effects of demographic and psychosocial correlates in a sample of Flemish boys and girls. A second purpose was to study the reliability and validity of an age-specific questionnaire developed to measure the food-related physical environment in Flemish adolescents.
Methods Participants
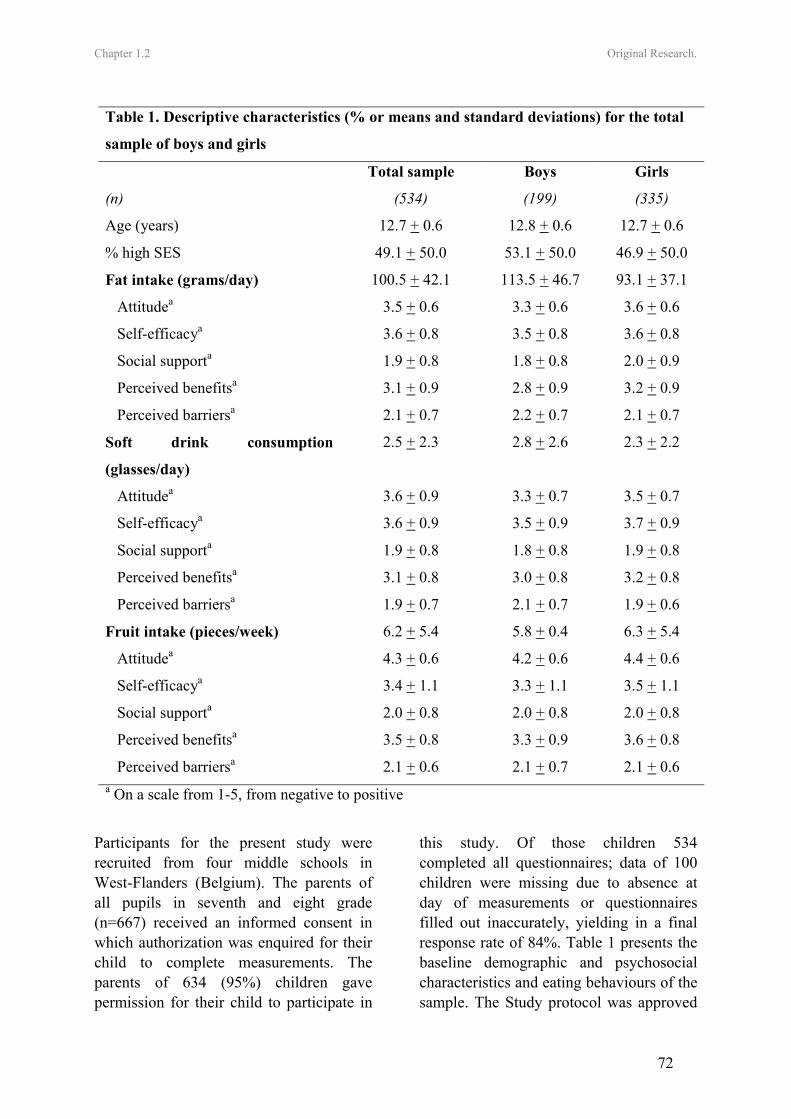
Chapter 1.2 Original Research.
72
Participants for the present study were recruited from four middle schools in West-Flanders (Belgium). The parents of all pupils in seventh and eight grade (n=667) received an informed consent in which authorization was enquired for their child to complete measurements. The parents of 634 (95%) children gave permission for their child to participate in
this study. Of those children 534 completed all questionnaires; data of 100 children were missing due to absence at day of measurements or questionnaires filled out inaccurately, yielding in a final response rate of 84%. Table 1 presents the baseline demographic and psychosocial characteristics and eating behaviours of the sample. The Study protocol was approved
Table 1. Descriptive characteristics (% or means and standard deviations) for the total
sample of boys and girls
Total sample Boys Girls
(n) (534) (199) (335)
Age (years) 12.7 + 0.6 12.8 + 0.6 12.7 + 0.6
% high SES 49.1 + 50.0 53.1 + 50.0 46.9 + 50.0
Fat intake (grams/day) 100.5 + 42.1 113.5 + 46.7 93.1 + 37.1
Attitudea 3.5 + 0.6 3.3 + 0.6 3.6 + 0.6
Self-efficacya 3.6 + 0.8 3.5 + 0.8 3.6 + 0.8
Social supporta 1.9 + 0.8 1.8 + 0.8 2.0 + 0.9
Perceived benefitsa 3.1 + 0.9 2.8 + 0.9 3.2 + 0.9
Perceived barriersa 2.1 + 0.7 2.2 + 0.7 2.1 + 0.7
Soft drink consumption
(glasses/day)
2.5 + 2.3 2.8 + 2.6 2.3 + 2.2
Attitudea 3.6 + 0.9 3.3 + 0.7 3.5 + 0.7
Self-efficacya 3.6 + 0.9 3.5 + 0.9 3.7 + 0.9
Social supporta 1.9 + 0.8 1.8 + 0.8 1.9 + 0.8
Perceived benefitsa 3.1 + 0.8 3.0 + 0.8 3.2 + 0.8
Perceived barriersa 1.9 + 0.7 2.1 + 0.7 1.9 + 0.6
Fruit intake (pieces/week) 6.2 + 5.4 5.8 + 0.4 6.3 + 5.4
Attitudea 4.3 + 0.6 4.2 + 0.6 4.4 + 0.6
Self-efficacya 3.4 + 1.1 3.3 + 1.1 3.5 + 1.1
Social supporta 2.0 + 0.8 2.0 + 0.8 2.0 + 0.8
Perceived benefitsa 3.5 + 0.8 3.3 + 0.9 3.6 + 0.8
Perceived barriersa 2.1 + 0.6 2.1 + 0.7 2.1 + 0.6 a On a scale from 1-5, from negative to positive
Chapter 1.2 Original Research.
73
by the Ethical Committee of the Ghent University. Measures Field work took place in June 2004. Questionnaire assessing home environment related to eating behaviours To measure potential environmental correlates of eating behaviours in adolescents, a new questionnaire was developed based on the results found in previous studies (Hanson et al, 2005; Young et al, 2004; Befort et al, 2006; Bere & Klepp, 2004; Taylor et al, 2005). Environmental factors included were availability of healthy and unhealthy products, family food rules and television viewing habits. The scale composition, scale items and response categories are represented in Table 2. The questionnaire was completed by all pupils during classes, under supervision of a teacher. The first part of the questionnaire dealt with availability of healthy and unhealthy food products in the home environment. A second part of the questionnaire asked for food rules according to unhealthy food products. Both availability of food products and food rules were rated on a four point scale from never to always. The number of hours exposed to commercial television was measured by asking for the number of hours pupils watch commercial television channels during a regular school day. The same question was repeated for the weekend days. An additional question asked for the frequency of eating while watching television, again a four point scale from never to always was used (see Table 2). Reliability and relative validity testing of the home environment questionnaire A separate study was executed to assess the reliability and relative validity of the environmental questionnaire for adolescents. Reliability and relative validity results are presented in Table 2.
Twenty seven pupils randomly selected out of all seventh graders from ten different schools participated in the survey. Test-retest reliability was analyzed by subjects completing the questionnaires twice within a 2-week interval. Single-measure intraclass correlation coefficients (ICC’s) were used as a measure of reliability. All test-retest reliability intraclass correlation (ICC) coefficients were significant and ranged between 0.78 and 0.89, indicating very good reliability. To test relative validity, all parents of participating pupils were contacted by telephone to verbally answer the same questionnaire as their child. Data from pupils’ questionnaires were then correlated (Spearman r) to data derived from telephone interviews with the parents. Validity coefficients significantly ranged between 0.53 and 0.72, indicating acceptable validity of the instrument. Food frequency questionnaires Fat intake was measured with a self-administered questionnaire developed at the Ghent University together with the Flemish Institute for Public Health (Vandelanotte et al, 2004). The questionnaire was validated in a separate study and was found to be sufficiently reliable and valid as compared to a 7 day dietary record method (Vandelanotte et al, 2004). The questionnaire consisted of 48 items, representing all important sources of fat in the Belgian diet. Pupils were asked how often they consumed these products during a usual day, week or month. A coefficient was calculated, representing the fat content and portion size of each product. This coefficient was multiplied by the frequency of consumption, leading to a fat intake score for each food item. A validated food frequency questionnaire (Vereecken et al, 2003), adapted from the questionnaire used in the HBSC study (Health Behaviour in School-aged
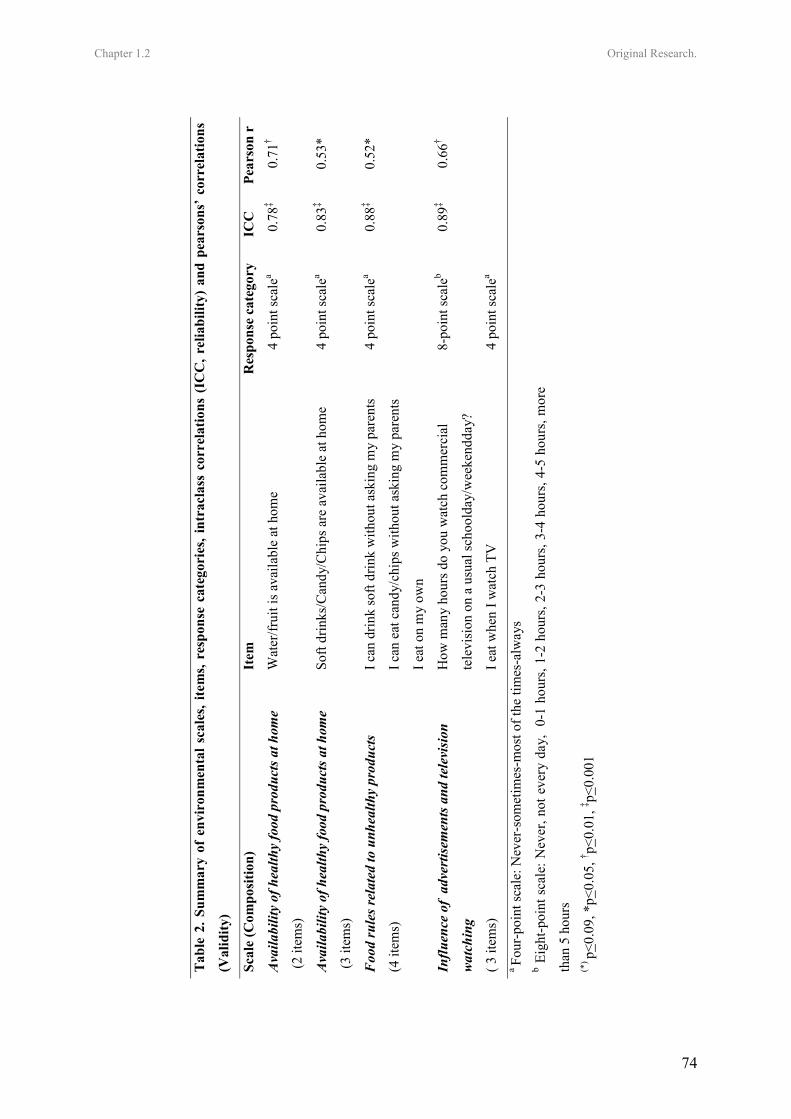
Chapter 1.2 Original Research.
74
Tab
le 2
. Sum
mar
y of
env
iron
men
tal s
cale
s, ite
ms,
resp
onse
cat
egor
ies,
intr
acla
ss c
orre
latio
ns (
ICC
, rel
iabi
lity)
and
pea
rson
s’ c
orre
latio
ns
(Val
idity
)
Scal
e (C
ompo
sitio
n)
Item
R
espo
nse
cate
gory
IC
C
Pear
son
r
Ava
ilabi
lity
of h
ealth
y fo
od p
rodu
cts a
t hom
e
(2 it
ems)
Wat
er/fr
uit i
s ava
ilabl
e at
hom
e
4 po
int s
cale
a
0.78
‡ 0.
71†
Ava
ilabi
lity
of h
ealth
y fo
od p
rodu
cts a
t hom
e
(3 it
ems)
Soft
drin
ks/C
andy
/Chi
ps a
re a
vaila
ble
at h
ome
4 po
int s
cale
a
0.83
‡ 0.
53*
Foo
d ru
les r
elat
ed to
unh
ealth
y pr
oduc
ts
(4 it
ems)
I can
drin
k so
ft dr
ink
with
out a
skin
g m
y pa
rent
s
I can
eat
can
dy/c
hips
with
out a
skin
g m
y pa
rent
s
I eat
on
my
own
4 po
int s
cale
a
0.88
‡ 0.
52*
Influ
ence
of
adve
rtis
emen
ts a
nd te
levi
sion
wat
chin
g
( 3 it
ems)
How
man
y ho
urs d
o yo
u w
atch
com
mer
cial
tele
visi
on o
n a
usua
l sch
oold
ay/w
eeke
ndda
y?
I eat
whe
n I w
atch
TV
8-po
int s
cale
b
4 po
int s
cale
a
0.89
‡ 0.
66†
a Fo
ur-p
oint
scal
e: N
ever
-som
etim
es-m
ost o
f the
tim
es-a
lway
s b E
ight
-poi
nt s
cale
: Nev
er, n
ot e
very
day
, 0-
1 ho
urs,
1-2
hour
s, 2-
3 ho
urs,
3-4
hour
s, 4-
5 ho
urs,
mor
e
than
5 h
ours
(*
) p<0.
09, *
p<0.
05, † p<
0.01
, ‡ p<0.
001
Chapter 1.2 Original Research.
75
Children), was used to assess fruit intake. The question for fruit intake was: ‘How many pieces of fresh fruit do you usually eat?’ A separate food frequency questionnaire was used to assess soft drink and water consumption. The questions asked for soft drink and water consumption were: ‘How many glasses of soft drinks do you drink during a regular school day’ and ‘How many glasses of soft drink do you drink during a regular weekend day?’ Demographics and psychosocial determinants Each of the food frequency questions ended with a three pages long survey asking for psychosocial determinants of healthy eating behaviours. Based on the social cognitive theory (Bandura, 1986) and the Theory of Planned behaviour (Ajzen, 1985) and previous research in adolescents (De Bourdeaudhuij, 2000), the following groups of determinants were included in the study: attitude (4 items), self-efficacy (2 items), social support (4 items), perceived benefits (6 items), and perceived barriers (12 items). Attitudes towards the three different eating behaviours (a low fat diet, eating more fruit and drinking less soft drinks) were rated on a five point scale from “certainly not pleasant” (good/tasty/healthy) “to certainly pleasant” (good/tasty/healthy). Cronbach α’s ranged between 0.80 and 0.87. To measure self-efficacy pupils were asked to rate on a five point scale how difficult it was to comply with the guidelines for each of the eating behaviours at home or at school. For these two items Cronbach α’s ranged between 0.38 and 0.46. To measure social support, pupils were asked to rate on a five point scale how frequently significant others (parents, brothers and sisters, friends, teachers) supported the healthy eating behaviours. Cronbach α’s ranged between 0.70 and 0. 75. For perceived benefits (e.g.
health, taste, losing weight) and barriers (e.g. lack of time, not available, not accessible, expensive) a five point scale from totally disagree to totally agree was used. Cronbach α’s ranged between 0.76 and 0.85 for perceived benefits and between 0.84 and 0.87 for perceived barriers. Demographic factors like birth date, gender, occupation of father and mother, number of computers at home, were assessed using a separate self-administered questionnaire. An estimate of social economical status of the family was obtained by classifying occupation of the father and mother into white and blue collar (Hollingshead, 1957). All questionnaires were filled out at school, during class hours under direct supervision of the teachers. Statistical analyses All analyses were conducted with SPSS 12.0. Pearsons’ correlations were executed to investigate relations between environmental variables and food intake. Before running analyses all environmental variables with low (p>0.10) bivariate correlations with the specific dependent variable were omitted from further analyses. The alpha value op 0.10 was chosen rather than the more stringent 0.05 because from a health promotion perspective, all variables that might have some influence on eating behaviours are reasonable to include in the regression analyses. To avoid multicollinearity, if environmental variables correlated highly with other environmental variables (r≥0.80), the variable with the lowest correlation with the dependent variable was also omitted from further analyses. In order to examine the contribution of environmental variables taking into account the effects of demographic and psychosocial predictors, hierarchical regression analyses were conducted with
Chapter 1.2 Original Research.
76
fat intake, fruit intake and soft drink consumption as dependent variables in boys and girls separately. Age, SES, attitude, self-efficacy, social support, perceived benefits and perceived barriers were entered into the first block. Three dummy variables identifying the 4 different schools were also entered into the first block of variables to take into account possible clustering within schools. Environmental variables (availability of healthy/unhealthy food products, food rules, and TV viewing habits) were entered into the second block. Values of p<0.05 were considered as statistically significant. Values of p<0.09 were considered as trends. Results Fat intake Because of the low correlation with the dependent variable ‘fat intake’, the variables social support and availability of healthy products at home were omitted from further analyses in boys. For the same reason social support, self-efficacy and availability of healthy products at home were omitted from further analyses in girls. Hierarchical regression analyses on self-reported fat intake, presented in Table 3, revealed that the entire model accounted for 19% of the variance in boys and 14% of the variance in girls. In boys, 10% was predicted by the first block [F=2.2, p<0.05] and 10% by the second block [Fchange=7.1, p<0.001]. Boys who had better attitudes towards a low fat diet reported to have less fat in their diet (β=-0.27, p<0.01). Adding the second block of variables revealed that boys with more unhealthy food products at home were more likely to have more fat in their diet (β=0.27, p<0.001). There was a trend for boys who perceived less food rules related to unhealthy food products to eat more fat in their diet (β=0.14, p<0.09). In girls, 10% of the variance in fat intake was explained
by the first block [F=4.4, p<0.001] and 4% by the second block [Fchange=4.5, p<0.01]. Girls with better attitudes towards a diet with less fat (β=-0.16, p<0.01) and who perceived more benefits of eating less fat (β=-0.16, p<0.01), were more likely to eat less fat. Girls with better television viewing habits (β=0.15, p<0.01) were more likely to have a diet with less fat. Soft drink consumption Because of the low correlation with the dependent variable ‘soft drink consumption’ the variable “availability of healthy products at home” was omitted from further analyses in boys. For the same reason social support, availability of unhealthy products at home and TV viewing habits were omitted from further analyses in girls. Hierarchical regression analyses on self-reported soft drink consumption, presented in Table 4, revealed that the entire model accounted for 22% of the variance in boys and 7% of the variance in girls. In boys, 13% was predicted by the first block [F=3.0, p<0.01] and 9% by the second block [Fchange=6.8, p<0.001]. Within the first block both higher SES (β=-0.18, p<0.01) and more perceived benefits (β=-0.17, p<0.01) were negatively related to soft drink consumption in boys. Adding the second block of variables revealed that boys who reported to have more unhealthy food products at home (β=0.20, p<0.01) and to have worse television viewing habits (β=0.14, p<0.09) were more likely to consume more soft drinks. In girls, 6% of the variance in soft drink consumption was explained by the first block [F=2.5, p<0.05] and 1% by the second block [Fchange=1.3, n.s.]. There were no variables of the first and second block that significantly explained variance in soft drink consumption in girls. Fruit intake
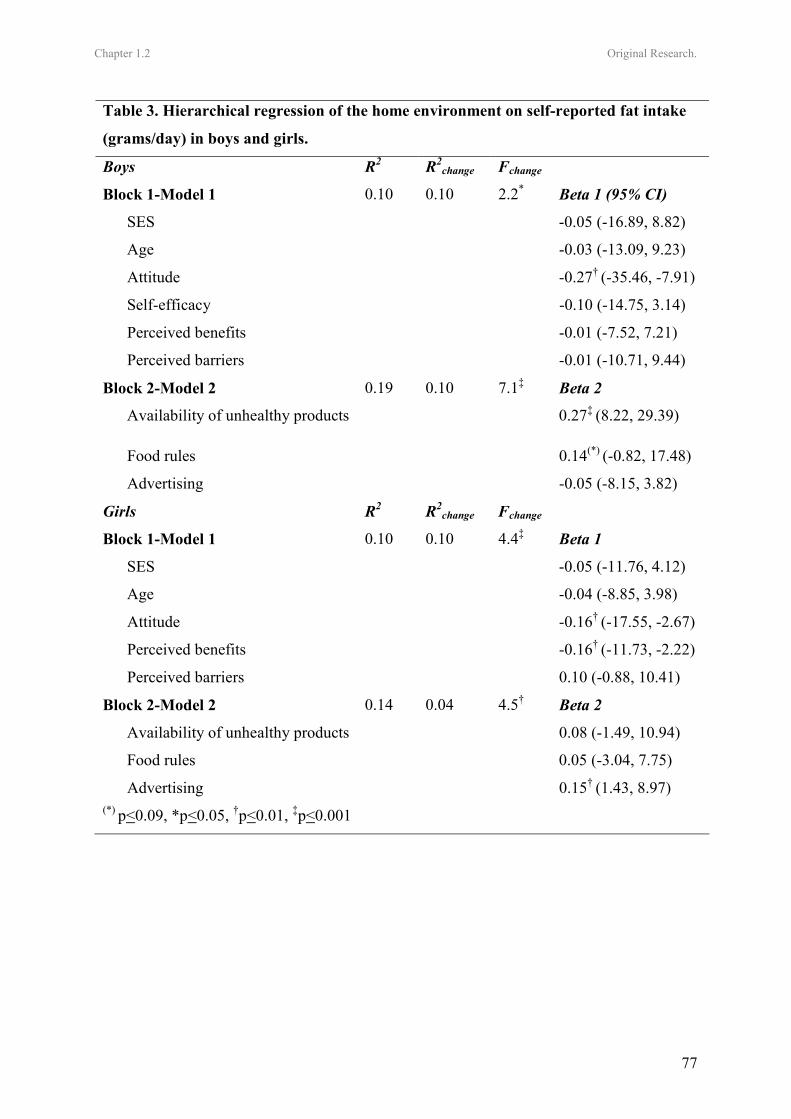
Chapter 1.2 Original Research.
77
Table 3. Hierarchical regression of the home environment on self-reported fat intake
(grams/day) in boys and girls.
Boys R2 R2change Fchange
Block 1-Model 1 0.10 0.10 2.2* Beta 1 (95% CI)
SES -0.05 (-16.89, 8.82)
Age -0.03 (-13.09, 9.23)
Attitude -0.27† (-35.46, -7.91)
Self-efficacy -0.10 (-14.75, 3.14)
Perceived benefits -0.01 (-7.52, 7.21)
Perceived barriers -0.01 (-10.71, 9.44)
Block 2-Model 2 0.19 0.10 7.1‡ Beta 2
Availability of unhealthy products 0.27‡ (8.22, 29.39)
Food rules 0.14(*) (-0.82, 17.48)
Advertising -0.05 (-8.15, 3.82)
Girls R2 R2change Fchange
Block 1-Model 1 0.10 0.10 4.4‡ Beta 1
SES -0.05 (-11.76, 4.12)
Age -0.04 (-8.85, 3.98)
Attitude -0.16† (-17.55, -2.67)
Perceived benefits -0.16† (-11.73, -2.22)
Perceived barriers 0.10 (-0.88, 10.41)
Block 2-Model 2 0.14 0.04 4.5† Beta 2
Availability of unhealthy products 0.08 (-1.49, 10.94)
Food rules 0.05 (-3.04, 7.75)
Advertising 0.15† (1.43, 8.97) (*) p<0.09, *p<0.05, †p<0.01, ‡p<0.001
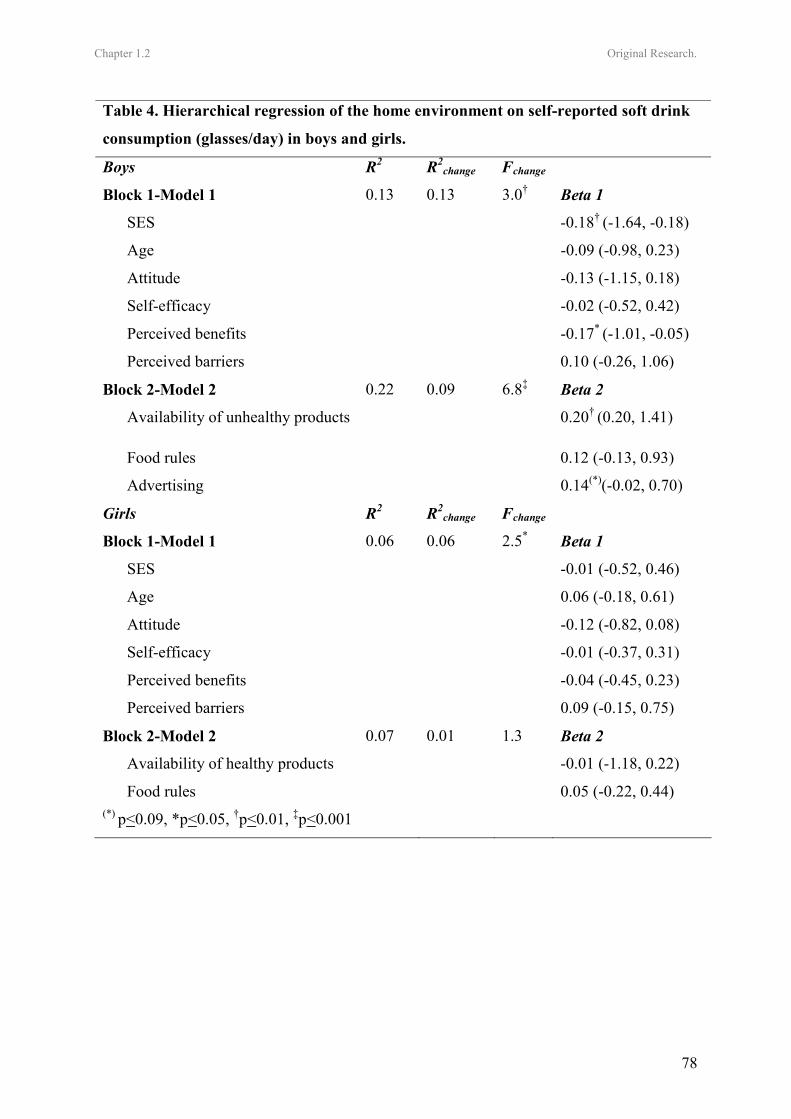
Chapter 1.2 Original Research.
78
Table 4. Hierarchical regression of the home environment on self-reported soft drink
consumption (glasses/day) in boys and girls.
Boys R2 R2change Fchange
Block 1-Model 1 0.13 0.13 3.0† Beta 1
SES -0.18† (-1.64, -0.18)
Age -0.09 (-0.98, 0.23)
Attitude -0.13 (-1.15, 0.18)
Self-efficacy -0.02 (-0.52, 0.42)
Perceived benefits -0.17* (-1.01, -0.05)
Perceived barriers 0.10 (-0.26, 1.06)
Block 2-Model 2 0.22 0.09 6.8‡ Beta 2
Availability of unhealthy products 0.20† (0.20, 1.41)
Food rules 0.12 (-0.13, 0.93)
Advertising 0.14(*)(-0.02, 0.70)
Girls R2 R2change Fchange
Block 1-Model 1 0.06 0.06 2.5* Beta 1
SES -0.01 (-0.52, 0.46)
Age 0.06 (-0.18, 0.61)
Attitude -0.12 (-0.82, 0.08)
Self-efficacy -0.01 (-0.37, 0.31)
Perceived benefits -0.04 (-0.45, 0.23)
Perceived barriers 0.09 (-0.15, 0.75)
Block 2-Model 2 0.07 0.01 1.3 Beta 2
Availability of healthy products -0.01 (-1.18, 0.22)
Food rules 0.05 (-0.22, 0.44) (*) p<0.09, *p<0.05, †p<0.01, ‡p<0.001
Chapter 1.2 Original Research.
79
Because of the low correlation with the dependent variable ‘fruit intake’ the variable social support was omitted from further analyses in boys. For the same reason social support and perceived benefits were omitted from further analyses in girls. Hierarchical regression analyses on self-reported fruit intake, presented in Table 5, revealed that the entire model accounted for 47% of the variance in boys and 41% of the variance in girls. In boys, 42% was predicted by the first block [F=14.7, p<0.001] and 5% by the second block [Fchange=4.2, p<0.01]. Boys who had better attitudes (β=0.18, p<0.05) and higher levels of self-efficacy (β=0.48, p<0.001) were more likely to consume more fruits. Adding the second block of variables revealed that boys who reported to have worse television viewing habits (β=-0.22, p<0.001) consumed less fruits. In girls, 35% of the variance in fruit intake was explained by the first block [F=21.0, p<0.001] and 6% by the second block [Fchange=8.4, p<0.001]. Girls who reported better attitudes (β=0.20, p<0.001), higher levels of self-efficacy (β=0.37, p<0.001) and less barriers (β=-0.13, p<0.01) were more likely to consume more fruits. Adding the second block of variables revealed that girls who reported to have more healthy food products at home (β=0.12, p<0.01) and to have better television viewing habits (β=-0.10, p<0.05) were more likely to consume more fruit. Girls who perceived less food rules related to unhealthy food products (β=-0.16, p<0.001) were more likely to eat less fruit. Discussion For the present study a questionnaire was developed to measure four potential home environmental factors, namely availability of healthy and unhealthy food products, food rules and television viewing habits. Although more objective measurements
may be recommended, questionnaires can be good instruments for measuring the perceived environment in larger samples of adolescents. The questionnaire used in the present study was a valid and reliable tool for measuring the environmental factors availability, food rules and television viewing habits in Flemish adolescents. However, a valid and reliable questionnaire to measure the overall family food environment including more factors such as parental support, parental intake, parental style and amount of family dinners should be developed in the future. The main purpose of the present study was to investigate the variance in fat, soft drink and fruit consumption explained by home-environmental factors. In line with findings from another study (Lien et al, 2002) both psychosocial and environmental variables contributed to the variance in eating behaviours. Literature revealed that there is a lack of studies investigating environmental correlates of adolescents’ fat intake. The environmental correlates included in the present study explained 10% of the variance in fat intake in boys and 4% in girls. In boys, lack of family food rules and higher availability of unhealthy food products at home were both associated with higher fat intake. In a recently conducted study in American adolescents, household eating rules related to healthful foods were inversely related to dietary fat intake in boys, while no association was found for food rules related to unhealthy products (Zabinski et al, 2006). Future research should investigate, if interventions that change family food rules and availability of unhealthy food products are effective in decreasing fat intake in Flemish boys. In girls other than in boys, having worse television viewing habits was the only environmental factor associated with higher levels of fat intake. These
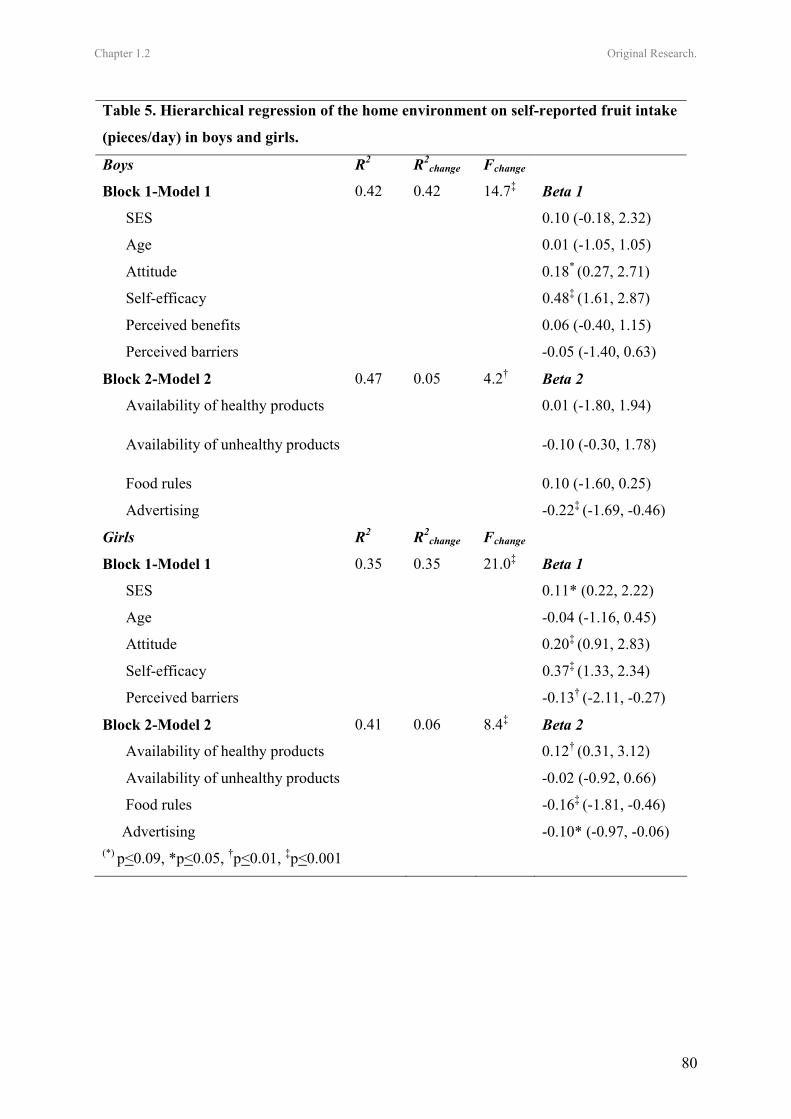
Chapter 1.2 Original Research.
80
Table 5. Hierarchical regression of the home environment on self-reported fruit intake
(pieces/day) in boys and girls.
Boys R2 R2change Fchange
Block 1-Model 1 0.42 0.42 14.7‡ Beta 1
SES 0.10 (-0.18, 2.32)
Age 0.01 (-1.05, 1.05)
Attitude 0.18* (0.27, 2.71)
Self-efficacy 0.48‡ (1.61, 2.87)
Perceived benefits 0.06 (-0.40, 1.15)
Perceived barriers -0.05 (-1.40, 0.63)
Block 2-Model 2 0.47 0.05 4.2† Beta 2
Availability of healthy products 0.01 (-1.80, 1.94)
Availability of unhealthy products -0.10 (-0.30, 1.78)
Food rules 0.10 (-1.60, 0.25)
Advertising -0.22‡ (-1.69, -0.46)
Girls R2 R2change Fchange
Block 1-Model 1 0.35 0.35 21.0‡ Beta 1
SES 0.11* (0.22, 2.22)
Age -0.04 (-1.16, 0.45)
Attitude 0.20‡ (0.91, 2.83)
Self-efficacy 0.37‡ (1.33, 2.34)
Perceived barriers -0.13† (-2.11, -0.27)
Block 2-Model 2 0.41 0.06 8.4‡ Beta 2
Availability of healthy products 0.12† (0.31, 3.12)
Availability of unhealthy products -0.02 (-0.92, 0.66)
Food rules -0.16‡ (-1.81, -0.46)
Advertising -0.10* (-0.97, -0.06) (*) p<0.09, *p<0.05, †p<0.01, ‡p<0.001
Chapter 1.2 Original Research.
81
findings in girls are in line with findings from other studies that revealed that energy intake (Van den Bulck & Van Mierlo, 2004) and percentage of energy from fat (Befort et al, 2006) increased if time spent in commercial television watching increased. There is a lack of studies investigating influencing factors for soft drink consumption, although such studies are required to effectively target the high soft drink consumption in Flemish adolescents. In boys, 9% of the variance in soft drink consumption was explained by family environmental factors. Increased availability of unhealthy food products and bad television habits were associated with higher soft drink consumption in boys. While watching television, boys are probably more exposed to advertisements promoting unhealthy food items such as soft drinks (Hastings et al, 2003) and are possibly consuming more soft drinks (Van den Bulck & Van Mierlo, 2004). Further research should investigate the effect of interventions aimed at decreasing availability of soft drinks at home and improving television viewing habits in boys. In girls, none of the psychosocial or family-related factors were associated with soft drink consumption; the entire model explained only 6% of the variance in soft drink consumption. To effectively target soft drink consumption in girls, further research that explores new models including other possible influencing environmental factors such as school related factors is required. One study in Flemish secondary schools already revealed that pupils were more likely to consume soft drinks every day, if soft drinks are available at school and if there are no school rules regarding soft drink consumption (Vereecken et al, 2005). The psychosocial-environmental model explained most of the variance in fruit
intake in both boys (47%) and girls (42%). In most previous conducted studies explained variances of less than 30% were found (Baranowski et al, 1999; Neumark-Sztainer et al, 2003). Differences in results can be caused by differences in measures and analyzing methods. In the study of Neumark-Sztainer and colleagues (2003) self-efficacy, which was the strongest predictor for fruit intake in both boys and girls in the present study, was not included in the model. Furthermore, in the present study behaviour specific measures of psychosocial determinants were used. It is also possible that attitudes, social support, self-efficacy, barriers and benefits vary across different eating behaviours and that the behaviour specific measurements resulted in the larger amount of variance explained. In line with our finding in adolescents, Wind en colleagues (2006) also found that a large amount of the variance (34%) in fruit intake was explained by a comprehensive model of demographic, psychosocial and environmental factors in Belgian en Dutch elementary school children. Having worse television viewing habits was the only environmental factor associated with lower fruit intakes in both boys and girls. Most studies have documented the negative influence of television viewing on intake of unhealthy eating products (Hastings, 2003; Van den Bulck & Van Mierlo, 2004; Befort et al, 2006), the relationship with fruit intake was not so often investigated. However, data from the Health Behaviour in School Aged Children (HBSC) study also showed that increased television viewing time was associated with lower fruit intakes in adolescents of nineteen different countries (Vereecken, et al, 2006). In girls, decreased availability of healthy products and lack of food rules related to unhealthy products were further related to lower
Chapter 1.2 Original Research.
82
levels of fruit intake. It is possible that the importance of availability of healthy products was tied to the relationship between perceived barriers and fruit intake among girls. When fruit is less often available at home, adolescents may perceive more barriers to eat fruit and may consume less fruit. In support of our findings in girls, Neumark-Sztainer and colleagues (2003) also found that fruit intake was associated with home availability of fruit. The gender differences related to the influence of home availability of fruit are in line with findings from another study in adolescents (Hanson et al, 2005) where fruit availability at home was a predictor of fruit intake in adolescent girls, but not in boys. In contrast to our findings related to family food rules, two other research groups found no relationship between adolescents’ autonomy (Videon et al, 2003) or family food rules (Zabinski et al, 2006) and fruit intake. The results of this study demonstrated the complexity of home environmental influences on eating behaviours, given that different environmental factors were related to different eating behaviours and that correlates were different in boys and girls. From the results it appeared that gender might be an important factor to consider when designing healthy eating interventions. Setting rules according to unhealthy products and improving television viewing habits may be effective for both genders. For changing boys’ eating behaviours decreasing availability of unhealthy products may be effective, whereas for girls increasing availability of healthy products seems more important. In the present study food rules related to healthy food products were not measured. However, results from a recently conducted study (Zabinski et al, 2006) suggest that household eating rules related
to healthful foods might also be important to consider for adolescents. Although both psychosocial and environmental variables contributed to the explained variance in eating behaviours, most of the variance was explained by demographic-psychosocial factors. However, the variance explained by environmental factors could have been underestimated, since any shared variance between demographic-psychosocial and environmental variables was assigned to the first block of demographic and psychosocial variables in the hierarchical regression. Several limitations of the present study need to be addressed. Conclusions in the present study were based on self-reported measures of environmental factors and eating behaviours and although validated questionnaires were used, this can be seen as a limitation of the study. To better understand the relationship between the family environment and eating behaviours in adolescents, it is essential to develop and use objective environmental measures. Furthermore, given the cross-sectional design of the present study, no causal conclusions can be drawn. Although cross-sectional studies are necessary to understand the relation between the environment and eating behaviours in adolescents, prospective studies are needed. The influence of parents on adolescents’ eating behaviours is often questioned, given the increased autonomy and independency associated with this age. However, our findings suggest that parents can play an important role in influencing adolescents’ eating behaviours. Although the family environment is not limited to the correlates investigated in the present study, the investigated correlates can be useful for generating hypothesis to be tested in future studies. However, the home environment is
Chapter 1.2 Original Research.
83
just one part of the broader environment in which adolescents live. Other important environmental influences for adolescents positioned outside the home such as the influences from peers, schools, neighbourhoods and media need to be explored in future research. Prospective studies are needed, to determine causal relationships between the change in environmental factors and the change in eating behaviours in adolescents.
Acknowledgments This study was supported by the Policy Research Centre Sport, Physical Activity and Health funded by the Flemish Government.
References • Ajzen I (1985): From intentions to actions: a
theory of planned behavior. In: Action-control: From cognition to behaviour, Ed. J. Kuhl, J Beckman, pp 11-39, Heidelberg: Springer.
• Bandura A (1986): Social Foundations of Thought and Action: A Social Cognitive Theory. Englewood Cliffs, New Jersey: Prentice-Hall.
• Baranowski T, Cullen KW and Baranowski J (1999): Psychosocial correlates of dietary intake: advancing dietary intervention. Annu. Rev. Nutr. 19, 17-40.
• Befort C, Kaur H, Nollen N, Sullivan DK, Nazir N, Shoi WS, et al. (2006): Fruit, vegetable and fat intake among non-Hispanic black and non-Hispanic white adolescents: associations with home availability and food consumption settings. J. Am. Diet. Assoc.106, 367-373.
• Bere E and Klepp KI (2004): Correlates of fruit and vegetable intake among Norwegian schoolchildren: parental and self-reports. Public Health Nutr. 7, 991-998.
• Brug J and Van Lenthe F (2005): Environmental determinants and interventions for physical activity, nutrition and smoking: A review. Rotterdam, Zoetermeer: Speed-Print.
• Centers of Disease Control and Prevention (1997): Guidelines for school health programs to promote lifelong healthy eating. J. Sch. Health. 67, 9-26.
• Cruz JAA (2000): Dietary habits and nutritional status in adolescents over Europe-Southern Europe. Eur. J. Clin. Nutr. 54, Suppl, 1 S29-S35.
• Cullen KW, Baranowski T, Klesges LM, Watson K, Sherwood NE, Story M, et al. (2004): Anthropometric, parental and psychosocial correlates of dietary intake of African-American girls. Obes. Res. 12, Suppl, 1 S20-S31.
• Currie C, Roberts C, Morgan A, Smith R, Settertobulte W, Samdal O, et al. (2004): Young People's Health in Context: international report from the HBSC 2001/02 survey. WHO Policy Series: Health policy for children and adolescents Issue 4, WHO Regional Office for Europe, Copenhagen.
• De Bourdeaudhuij I and Van Oost, P (2000): Personal and family determinants of dietary behaviour in adolescents and their parents. Psychol.Health. 15, 751-770.
• French SA, Story M, Neumark-Sztainer D, Fulkerson JA and Hannan P (2001): Fast food restaurant use among adolescents: associations wit nutrient intake, food choices and behavioural and psychosocial variables. Int. J. Obes. 25, 1823-1833.
• Gillman MW, Rifa-Shiman SL, Frazier LA, Rockett HRH, Camargo CA, et al. (2000): Family Dinner and Diet Quality Among Older Children and Adolescents. Arch. Fam. Med. 9, 235-240.
• Green LW and Kreuter MW (1991): Health promotion planning: an educational and environmental approach. Mountain View, California: Mayfield.
• Hanson NI, Neumark-Sztainer D, Eisenberg ME, Story M and Wall M (2005): Associations between parental report of the home food environment and adolescent intakes of fruit, vegetables and dairy foods. Public Health Nutr. 8, 77-85.
Chapter 1.2 Original Research.
84
• Hastings G, Stead M, McDermott L, Fosyth A, MacKintosh AM, et al (2003): Review of the effects of food promotion on children. Food Standard Agency. Prepared by the Centre for Social Marketing, University of Strathclyde, UK.
• Hollingshead AB (1957): Two-factor index of social position. New Haven, CT: Yale University Press.
• Jenkins S and Horner SD (2005): Barriers that influence eating behaviours in adolescents. J. Pediatr. Nurs. 20, 258-267.
• Kelder SH, Perry CL, Klepp K-I and Lytle LL (1994): Longitudinal tracking of adolescent smoking, physical activity, and food choice behaviours. Am. J. Public Health. 84, 1121-1126.
• Kremers SPJ, Brug J, De Vries H and Engels RC (2003): Parenting style and adolescent fruit consumption. Appetite. 41, 43-50.
• Kubik MY, Lytle LA, Hannan PJ, Perry CL and Story M (2003): The association of the school food environment with dietary behaviours of young adolescents. Am. J. Public Health. 93,1168-1173.
• Lambert J, Agostoni C, Elmadfa I, Hulshof K, Krause E, Livingstone B, et al. (2004): Dietary intake and nutritional status of children and adolescents in Europe. Br. J. Nutr. 92, Suppl, 2 S147-S211.
• Lien N, Jacobs DR and Klepp KI (2002): Exploring predictors of eating behaviour among adolescents by gender and socio-economic status. Public Health Nutr. 5, 671-681.
• Lien N, Lytle LA and Klepp K-I (2001): Stability in Consumption of fruit, vegetables and sugary food in a cohort from age 14 to age 21. Prev. Med. 33, 217-226.
• Ludwig DC, Peterson KE and Gortmaker SL (2001): Relation between consumption of sugar-sweetened drinks and childhood obesity: a prospective, observational analysis. Lancet. 357, 505-508.
• Lytle LA (2000): In defence of a low-fat diet for healthy children. J. Am. Diet. Assoc. 100, 39-41.
• Lytle LA and Kubik MY (2003): Nutritional issues for adolescents. Best Pract. Res. Clin. Endocrinol. Metab. 17, 177-89.
• Matthys C, de Henauw S, Devos C and de Backer G (2003): Estimated energy intake, macronutrient intake and meal pattern of Flemish adolescents. Eur. J. Clin. Nutr. 57, 366-375.
• Monge-Rojas R, Nunez HP, Garita C and Chen-Mok M (2002): Psychosocial aspects of costa Rican adolescents eating and physical activity patterns. J. Adolesc. Health. 31, 212-219.
• Neumark-Sztainer D, Wall M, Perry C and Story M (2003): Correlates of fruit and vegetable intake among adolescents. Findings from Project EAT. Prev. Med. 37, 198-208.
• Reilly JJ and Dorosty AR (1999): Epidemic of obesity in UK children. Lancet. 354, 1874-75.
• Sallis JF and Owen N (2002): Ecological models of health behavior. In: Health Behavior and Health Education: Theory, Research, and Practice, ed. K Glanz, BK Rimer, FM Lewis, pp 153-165, San Francisco: Jossey-Bass.
• Story M, Neumark-Sztainer D and French S (2002): Individual and environmental influences on adolescent eating behaviours. J. Am. Diet. Assoc. 102, Suppl, 3 S40-S51.
• Taylor JP, Evers S and McKenna M (2005): Determinants of healthy eating in children and youth. Can. J. Public Health. 96, Suppl, 3 S20-S26.
• Trudeau E, Kristal AR, Li S and Patterson RE (1998): Demographic and psychosocial predictors of fruit and vegetable intakes differ: implications for dietary interventions. J. Am. Diet. Assoc. 98, 1412-1417.
• Van den Bulck J and Van Mierlo J (2004): Energy intake associated with television viewing in adolescents, a cross sectional study. Appetite. 43, 181-184.
• Van Duyn MA and Pivonka E (2000): Overview of the health benefits of fruit and
Chapter 1.2 Original Research.
85
vegetable consumption for the dietetics professional: Selected literature. J. Am. Diet. Assoc. 100,1511-1521.
• Vandelanotte C, Matthys C and De Bourdeaudhuij I (2004): Reliability and validity of a computerized questionnaire to measure fat intake in Belgium. Nutr. Res. 24, 621-631.
• Vereecken CA and Maes LA (2003): Belgian study on the reliability and relative validity of the health behaviour in school-aged children food-frequency questionnaire. Public Health Nutr. 6, 581-588.
• Vereecken CA, Bobelijn K and Maes L (2004): School food policy at primary and secondary schools in Belgium-Flanders: does it influence people’s food habits. Eur. J. Clin. Nutr. 59, 271-277.
• Vereecken CA, Inchley J, Subramanian SV, Hublet A and Maes L (2005): The relative influence of individual and contextual socio-economic status on consumption of fruit and soft drinks among adolescents in Europe. Eur. J. Public Health. 15, 224-232.
• Vereecken CA, Todd J, Roberts C, Mulvihill C and Maes L (2006): Television viewing behaviour and associations with food habits in different countries. Public Health Nutr. 9, 244-250.
• Videon TM and Manning CK (2003): Influences on adolescent eating patterns: the importance of family meals. J. Adolesc. Health. 32, 365-373.
• Willet WC (1994): Diet and health? What should we eat? Sci. 264, 532-537.
• Wind M, De Bourdeaudhuij I, Te Velde S, Sandvik C, Due P, Klepp KI, et al. (2006): Correlates of fruit and vegetable consumption among 11-year-old Belgian-Flemish and Dutch schoolchildren. J. Nutr. Educ. Behav. 38, 211-221.
• Young EM, Fors SW and Hayes DM (2004): Associations between perceived parent behaviours and middle school student fruit and vegetable consumption. J. Nutr. Educ. Behav. 36, 2-8.
• Zabinski MF, Daly T, Norman GJ, Rupp JW, Calfas KJ, Sallis JF, et al. (2006): Psychosocial correlates of fruit, vegetable and dietary fat intake among adolescent boys and girls. J. Am. Diet. Assoc. 106, 814-821.

86
Leen Haerens, Mietje Craeynest, Benedicte Deforche, Lea Maes, Greet Cardon, Ilse
De Bourdeaudhuij
Health Promotion International, Submitted
CHAPTER 1.3
THE CONTRIBUTION OF HOME AND SCHOOL ENVIRONMENTAL
FACTORS IN EXPLAINING PHYSICAL ACTIVITY IN
ADOLESCENTS
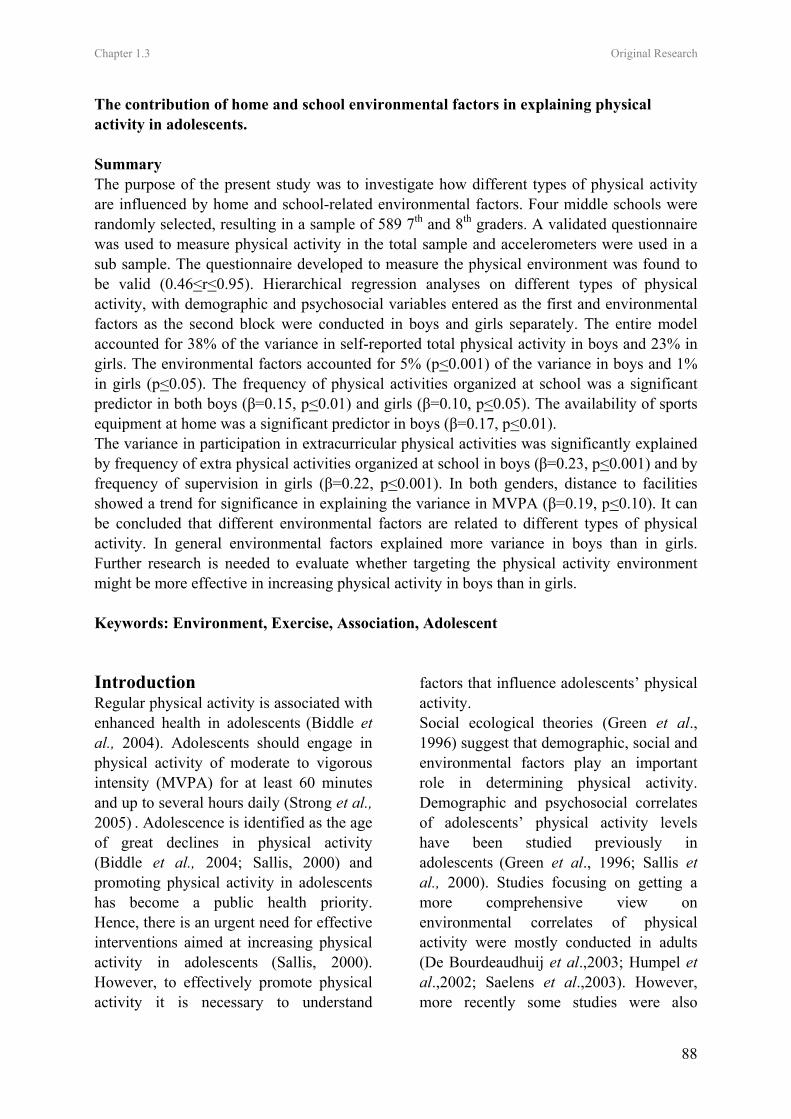
Chapter 1.3 Original Research
88
The contribution of home and school environmental factors in explaining physical activity in adolescents. Summary The purpose of the present study was to investigate how different types of physical activity are influenced by home and school-related environmental factors. Four middle schools were randomly selected, resulting in a sample of 589 7th and 8th graders. A validated questionnaire was used to measure physical activity in the total sample and accelerometers were used in a sub sample. The questionnaire developed to measure the physical environment was found to be valid (0.46<r<0.95). Hierarchical regression analyses on different types of physical activity, with demographic and psychosocial variables entered as the first and environmental factors as the second block were conducted in boys and girls separately. The entire model accounted for 38% of the variance in self-reported total physical activity in boys and 23% in girls. The environmental factors accounted for 5% (p<0.001) of the variance in boys and 1% in girls (p<0.05). The frequency of physical activities organized at school was a significant predictor in both boys (β=0.15, p<0.01) and girls (β=0.10, p<0.05). The availability of sports equipment at home was a significant predictor in boys (β=0.17, p<0.01). The variance in participation in extracurricular physical activities was significantly explained by frequency of extra physical activities organized at school in boys (β=0.23, p<0.001) and by frequency of supervision in girls (β=0.22, p<0.001). In both genders, distance to facilities showed a trend for significance in explaining the variance in MVPA (β=0.19, p<0.10). It can be concluded that different environmental factors are related to different types of physical activity. In general environmental factors explained more variance in boys than in girls. Further research is needed to evaluate whether targeting the physical activity environment might be more effective in increasing physical activity in boys than in girls. Keywords: Environment, Exercise, Association, Adolescent
Introduction Regular physical activity is associated with enhanced health in adolescents (Biddle et al., 2004). Adolescents should engage in physical activity of moderate to vigorous intensity (MVPA) for at least 60 minutes and up to several hours daily (Strong et al., 2005) . Adolescence is identified as the age of great declines in physical activity (Biddle et al., 2004; Sallis, 2000) and promoting physical activity in adolescents has become a public health priority. Hence, there is an urgent need for effective interventions aimed at increasing physical activity in adolescents (Sallis, 2000). However, to effectively promote physical activity it is necessary to understand
factors that influence adolescents’ physical activity. Social ecological theories (Green et al., 1996) suggest that demographic, social and environmental factors play an important role in determining physical activity. Demographic and psychosocial correlates of adolescents’ physical activity levels have been studied previously in adolescents (Green et al., 1996; Sallis et al., 2000). Studies focusing on getting a more comprehensive view on environmental correlates of physical activity were mostly conducted in adults (De Bourdeaudhuij et al.,2003; Humpel et al.,2002; Saelens et al.,2003). However, more recently some studies were also
Chapter 1.3 Original Research
89
conducted in adolescents (Fein et al.,2004; Jago et al.,2005; Molnar et al.,2004; Sallis et al., 2001). The environmental factor ‘availability of opportunities to exercise’ was consistently found to be associated with physical activity in adolescents in previous research (Sallis et al., 2000). As adolescents spend high amounts of time at school, the school is an environment important to investigate in adolescents. Previous research (Sallis et al., 2003) in American middle schools pointed out that the objectively-measured school environment (area type, area size, supervision, equipment, improvements) explains the largest amounts of variance in the number of boys and girls engaging in MVPA at school (Sallis et al., 2003). Results also indicated that the frequency of organized activities at school was a significant predictor in boys. Boys were most active on outdoor courts with high levels of supervision or when both equipment and supervision were provided. Both boys and girls were more active when schools had improvements (e.g. basketball hoops, volleyball nets, tennis courts) and high levels of supervision. Next to the school, the home and neighbourhood are environmental factors possibly influencing adolescents’ physical activity. One Canadian study (Fein et al., 2004) found that availability of home, neighbourhood and school resources significantly explained 5% of the variance in energy expenditure, but this relationship was no longer significant when controlling for demographic and psychosocial variables. Another study investigated associations between activity levels of adolescents and access to safe recreation areas (Molnar et al., 2003). Lower neighbourhood safety was associated with lower levels of leisure time physical activity. One study using objective measures of both neighbourhood and
physical activity found that only one environmental factor, namely characteristics of sidewalks, was associated with light-intensity physical activities in adolescent boys. In that study no environmental correlates of MVPA were found (Jago et al., 2003). The few studies investigating adolescents’ environmental correlates of physical activity have been conducted in the United States (US) and there is a lack of studies investigating environmental correlates in European countries. Previous research suggested that associations between environmental factors and health behaviours are more pronounced in the US than in other countries (Cummins et al., 2006), limiting the external validity of US studies. In addition, few previous studies have investigated the combination of individual and environmental factors in explaining physical activity in adolescents. Therefore, the present study aimed at investigating the variance in total physical activity, time spent in extracurricular physical activities and MVPA explained by home and school-related environmental factors, above and beyond the effects of demographic and psychosocial variables. A second purpose was to study the reliability and validity of the age-specific questionnaire developed to measure the physical environment in Flemish adolescents. Participants Participants were recruited from four randomly selected middle schools in West-Flanders (Belgium). Parents of all students in seventh and eight grade (n=667) received an informed consent letter in which authorization was enquired for their child to complete measurements. Parents of 634 (95%) adolescents gave permission for their child to participate in this study. Of those adolescents 589 completed all questionnaires; data of 45 adolescents were
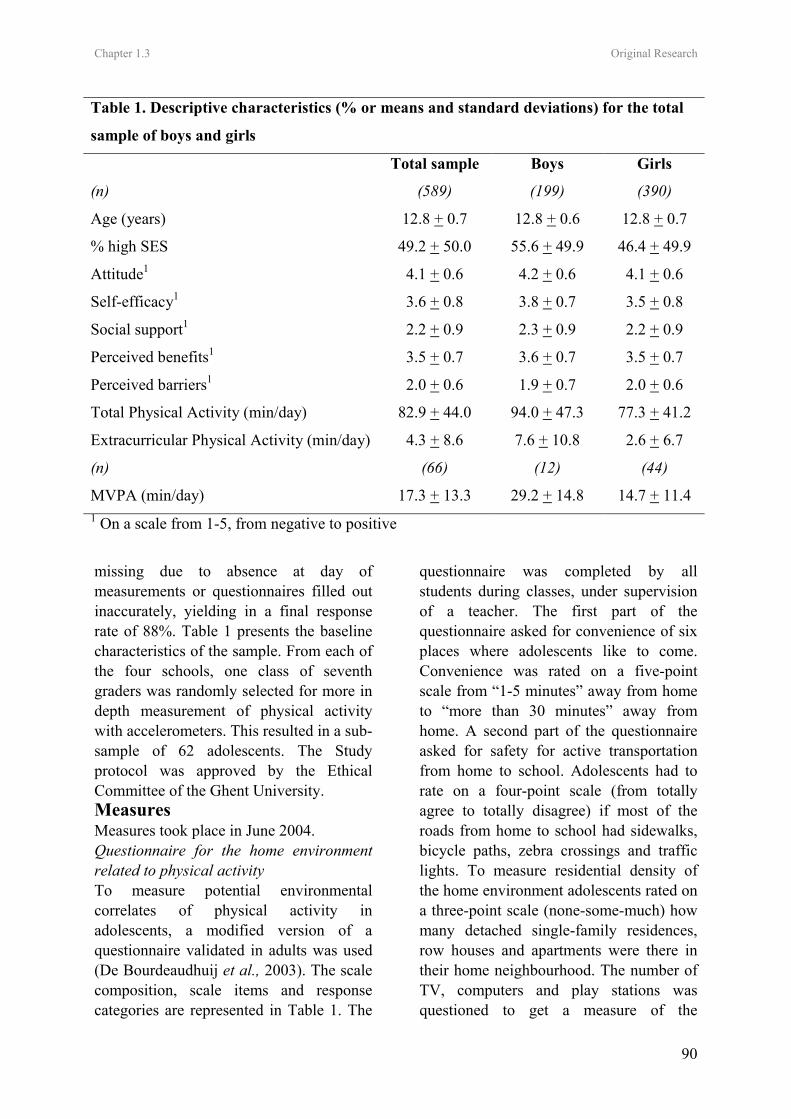
Chapter 1.3 Original Research
90
missing due to absence at day of measurements or questionnaires filled out inaccurately, yielding in a final response rate of 88%. Table 1 presents the baseline characteristics of the sample. From each of the four schools, one class of seventh graders was randomly selected for more in depth measurement of physical activity with accelerometers. This resulted in a sub-sample of 62 adolescents. The Study protocol was approved by the Ethical Committee of the Ghent University. Measures Measures took place in June 2004. Questionnaire for the home environment related to physical activity To measure potential environmental correlates of physical activity in adolescents, a modified version of a questionnaire validated in adults was used
(De Bourdeaudhuij et al., 2003). The scale composition, scale items and response categories are represented in Table 1. The
questionnaire was completed by all students during classes, under supervision of a teacher. The first part of the questionnaire asked for convenience of six places where adolescents like to come. Convenience was rated on a five-point scale from “1-5 minutes” away from home to “more than 30 minutes” away from home. A second part of the questionnaire asked for safety for active transportation from home to school. Adolescents had to rate on a four-point scale (from totally agree to totally disagree) if most of the roads from home to school had sidewalks, bicycle paths, zebra crossings and traffic lights. To measure residential density of the home environment adolescents rated on a three-point scale (none-some-much) how many detached single-family residences, row houses and apartments were there in their home neighbourhood. The number of TV, computers and play stations was questioned to get a measure of the
Table 1. Descriptive characteristics (% or means and standard deviations) for the total
sample of boys and girls
Total sample Boys Girls
(n) (589) (199) (390)
Age (years) 12.8 + 0.7 12.8 + 0.6 12.8 + 0.7
% high SES 49.2 + 50.0 55.6 + 49.9 46.4 + 49.9
Attitude1 4.1 + 0.6 4.2 + 0.6 4.1 + 0.6
Self-efficacy1 3.6 + 0.8 3.8 + 0.7 3.5 + 0.8
Social support1 2.2 + 0.9 2.3 + 0.9 2.2 + 0.9
Perceived benefits1 3.5 + 0.7 3.6 + 0.7 3.5 + 0.7
Perceived barriers1 2.0 + 0.6 1.9 + 0.7 2.0 + 0.6
Total Physical Activity (min/day) 82.9 + 44.0 94.0 + 47.3 77.3 + 41.2
Extracurricular Physical Activity (min/day) 4.3 + 8.6 7.6 + 10.8 2.6 + 6.7
(n) (66) (12) (44)
MVPA (min/day) 17.3 + 13.3 29.2 + 14.8 14.7 + 11.4 1 On a scale from 1-5, from negative to positive
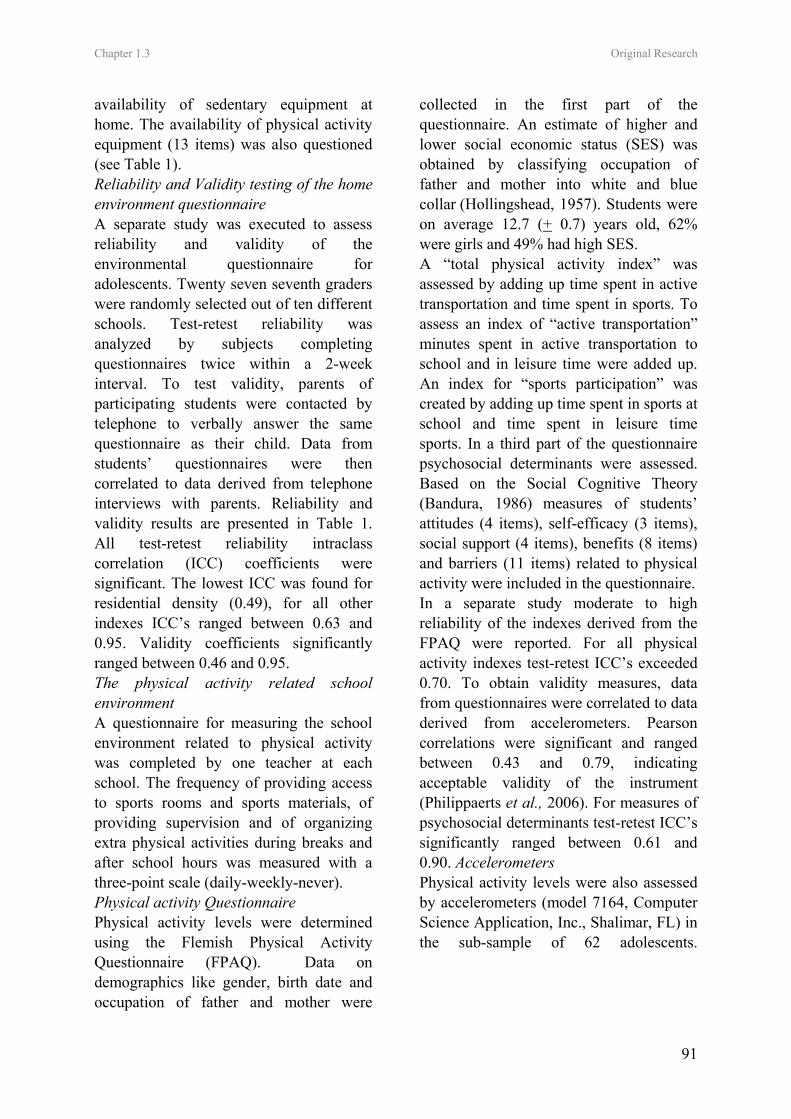
Chapter 1.3 Original Research
91
availability of sedentary equipment at home. The availability of physical activity equipment (13 items) was also questioned (see Table 1). Reliability and Validity testing of the home environment questionnaire A separate study was executed to assess reliability and validity of the environmental questionnaire for adolescents. Twenty seven seventh graders were randomly selected out of ten different schools. Test-retest reliability was analyzed by subjects completing questionnaires twice within a 2-week interval. To test validity, parents of participating students were contacted by telephone to verbally answer the same questionnaire as their child. Data from students’ questionnaires were then correlated to data derived from telephone interviews with parents. Reliability and validity results are presented in Table 1. All test-retest reliability intraclass correlation (ICC) coefficients were significant. The lowest ICC was found for residential density (0.49), for all other indexes ICC’s ranged between 0.63 and 0.95. Validity coefficients significantly ranged between 0.46 and 0.95. The physical activity related school environment A questionnaire for measuring the school environment related to physical activity was completed by one teacher at each school. The frequency of providing access to sports rooms and sports materials, of providing supervision and of organizing extra physical activities during breaks and after school hours was measured with a three-point scale (daily-weekly-never). Physical activity Questionnaire Physical activity levels were determined using the Flemish Physical Activity Questionnaire (FPAQ). Data on demographics like gender, birth date and occupation of father and mother were
collected in the first part of the questionnaire. An estimate of higher and lower social economic status (SES) was obtained by classifying occupation of father and mother into white and blue collar (Hollingshead, 1957). Students were on average 12.7 (+ 0.7) years old, 62% were girls and 49% had high SES. A “total physical activity index” was assessed by adding up time spent in active transportation and time spent in sports. To assess an index of “active transportation” minutes spent in active transportation to school and in leisure time were added up. An index for “sports participation” was created by adding up time spent in sports at school and time spent in leisure time sports. In a third part of the questionnaire psychosocial determinants were assessed. Based on the Social Cognitive Theory (Bandura, 1986) measures of students’ attitudes (4 items), self-efficacy (3 items), social support (4 items), benefits (8 items) and barriers (11 items) related to physical activity were included in the questionnaire. In a separate study moderate to high reliability of the indexes derived from the FPAQ were reported. For all physical activity indexes test-retest ICC’s exceeded 0.70. To obtain validity measures, data from questionnaires were correlated to data derived from accelerometers. Pearson correlations were significant and ranged between 0.43 and 0.79, indicating acceptable validity of the instrument (Philippaerts et al., 2006). For measures of psychosocial determinants test-retest ICC’s significantly ranged between 0.61 and 0.90. Accelerometers Physical activity levels were also assessed by accelerometers (model 7164, Computer Science Application, Inc., Shalimar, FL) in the sub-sample of 62 adolescents.
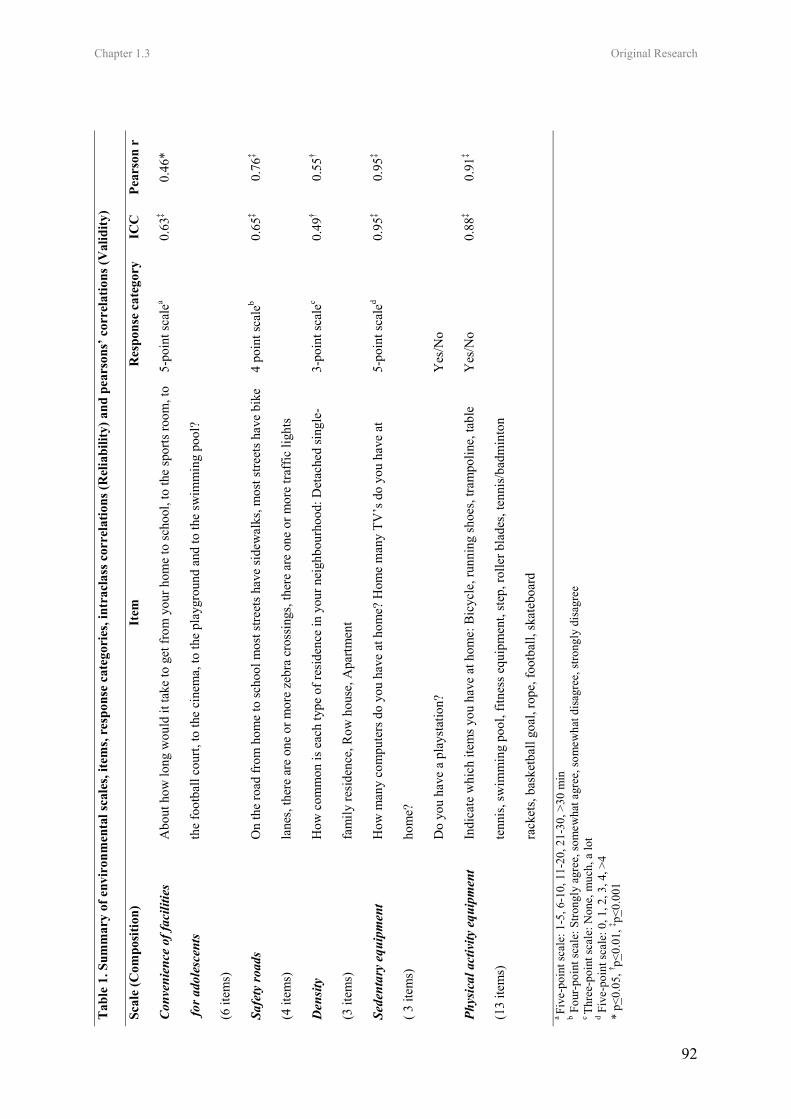
Chapter 1.3 Original Research
92
Tab
le 1
. Sum
mar
y of
env
iron
men
tal s
cale
s, ite
ms,
resp
onse
cat
egor
ies,
intr
acla
ss c
orre
latio
ns (R
elia
bilit
y) a
nd p
ears
ons’
cor
rela
tions
(Val
idity
)
Scal
e (C
ompo
sitio
n)
Item
R
espo
nse
cate
gory
IC
C
Pear
son
r
Con
veni
ence
of f
acili
ties
for a
dole
scen
ts
(6 it
ems)
Abo
ut h
ow lo
ng w
ould
it ta
ke to
get
from
you
r hom
e to
scho
ol, t
o th
e sp
orts
room
, to
the
foot
ball
cour
t, to
the
cine
ma,
to th
e pl
aygr
ound
and
to th
e sw
imm
ing
pool
?
5-po
int s
cale
a
0.63
‡ 0.
46*
Safe
ty ro
ads
(4 it
ems)
On
the
road
from
hom
e to
scho
ol m
ost s
treet
s hav
e si
dew
alks
, mos
t stre
ets h
ave
bike
lane
s, th
ere
are
one
or m
ore
zebr
a cr
ossi
ngs,
ther
e ar
e on
e or
mor
e tra
ffic
ligh
ts
4 po
int s
cale
b
0.65
‡ 0.
76‡
Den
sity
(3 it
ems)
How
com
mon
is e
ach
type
of r
esid
ence
in y
our n
eigh
bour
hood
: Det
ache
d si
ngle
-
fam
ily re
side
nce,
Row
hou
se, A
partm
ent
3-po
int s
cale
c
0.49
† 0.
55†
Sede
ntar
y eq
uipm
ent
( 3 it
ems)
How
man
y co
mpu
ters
do
you
have
at h
ome?
Hom
e m
any
TV’s
do
you
have
at
hom
e?
Do
you
have
a p
lays
tatio
n?
5-po
int s
cale
d
Yes
/No
0.95
‡ 0.
95‡
Phys
ical
act
ivity
equ
ipm
ent
(13
item
s)
Indi
cate
whi
ch it
ems y
ou h
ave
at h
ome:
Bic
ycle
, run
ning
shoe
s, tra
mpo
line,
tabl
e
tenn
is, s
wim
min
g po
ol, f
itnes
s equ
ipm
ent,
step
, rol
ler b
lade
s, te
nnis
/bad
min
ton
rack
ets,
bask
etba
ll go
al, r
ope,
foot
ball,
skat
eboa
rd
Yes
/No
0.88
‡ 0.
91‡
a Fi
ve-p
oint
scal
e: 1
-5, 6
-10,
11-
20, 2
1-30
, >30
min
b F
our-
poin
t sca
le: S
trong
ly a
gree
, som
ewha
t agr
ee, s
omew
hat d
isag
ree,
stro
ngly
dis
agre
e
c Th
ree-
poin
t sca
le: N
one,
muc
h, a
lot
d Fiv
e-po
int s
cale
: 0, 1
, 2, 3
, 4, >
4 *
p<0.
05, † p<
0.01
, ‡ p<0.
001
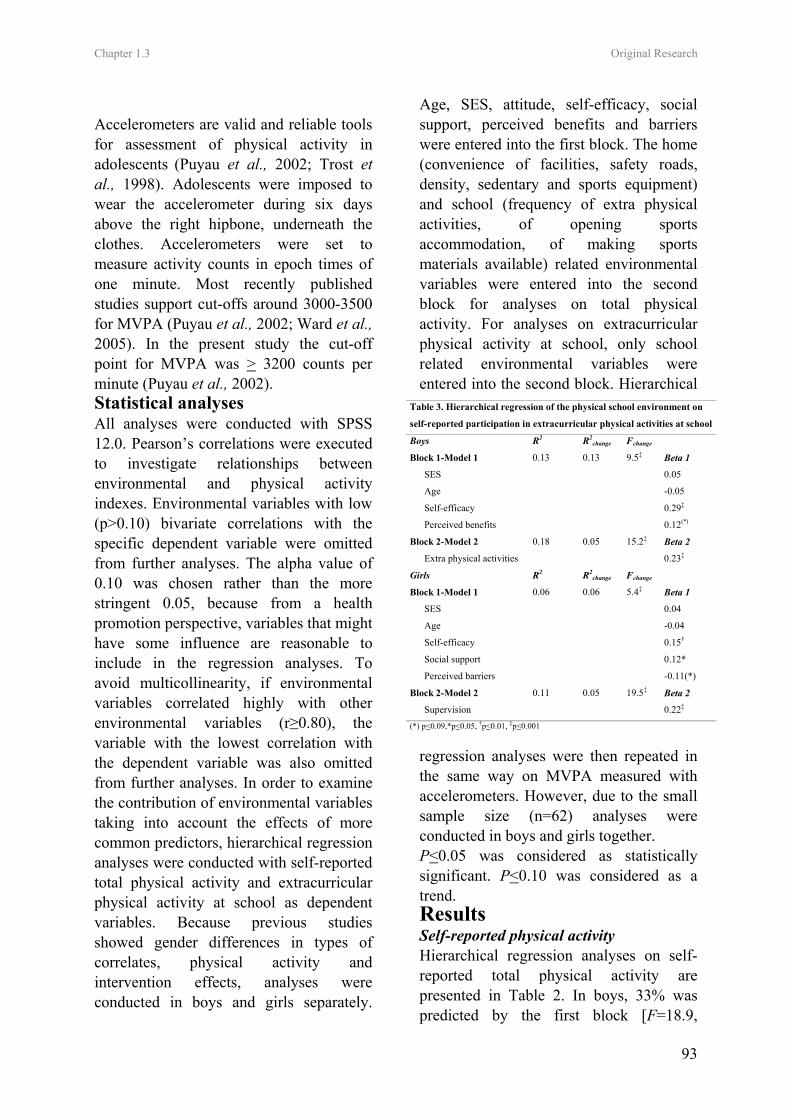
Chapter 1.3 Original Research
93
Accelerometers are valid and reliable tools for assessment of physical activity in adolescents (Puyau et al., 2002; Trost et al., 1998). Adolescents were imposed to wear the accelerometer during six days above the right hipbone, underneath the clothes. Accelerometers were set to measure activity counts in epoch times of one minute. Most recently published studies support cut-offs around 3000-3500 for MVPA (Puyau et al., 2002; Ward et al., 2005). In the present study the cut-off point for MVPA was > 3200 counts per minute (Puyau et al., 2002). Statistical analyses All analyses were conducted with SPSS 12.0. Pearson’s correlations were executed to investigate relationships between environmental and physical activity indexes. Environmental variables with low (p>0.10) bivariate correlations with the specific dependent variable were omitted from further analyses. The alpha value of 0.10 was chosen rather than the more stringent 0.05, because from a health promotion perspective, variables that might have some influence are reasonable to include in the regression analyses. To avoid multicollinearity, if environmental variables correlated highly with other environmental variables (r≥0.80), the variable with the lowest correlation with the dependent variable was also omitted from further analyses. In order to examine the contribution of environmental variables taking into account the effects of more common predictors, hierarchical regression analyses were conducted with self-reported total physical activity and extracurricular physical activity at school as dependent variables. Because previous studies showed gender differences in types of correlates, physical activity and intervention effects, analyses were conducted in boys and girls separately.
Age, SES, attitude, self-efficacy, social support, perceived benefits and barriers were entered into the first block. The home (convenience of facilities, safety roads, density, sedentary and sports equipment) and school (frequency of extra physical activities, of opening sports accommodation, of making sports materials available) related environmental variables were entered into the second block for analyses on total physical activity. For analyses on extracurricular physical activity at school, only school related environmental variables were entered into the second block. Hierarchical
regression analyses were then repeated in the same way on MVPA measured with accelerometers. However, due to the small sample size (n=62) analyses were conducted in boys and girls together. P<0.05 was considered as statistically significant. P<0.10 was considered as a trend. Results Self-reported physical activity Hierarchical regression analyses on self-reported total physical activity are presented in Table 2. In boys, 33% was predicted by the first block [F=18.9,
Table 3. Hierarchical regression of the physical school environment on
self-reported participation in extracurricular physical activities at school
Boys R2 R2change Fchange
Block 1-Model 1 0.13 0.13 9.5‡ Beta 1
SES 0.05
Age -0.05
Self-efficacy 0.29‡
Perceived benefits 0.12(*)
Block 2-Model 2 0.18 0.05 15.2‡ Beta 2
Extra physical activities 0.23‡
Girls R2 R2change Fchange
Block 1-Model 1 0.06 0.06 5.4‡ Beta 1
SES 0.04
Age -0.04
Self-efficacy 0.15†
Social support 0.12*
Perceived barriers -0.11(*)
Block 2-Model 2 0.11 0.05 19.5‡ Beta 2
Supervision 0.22‡ (*) p<0.09,*p<0.05, †p<0.01, ‡p<0.001
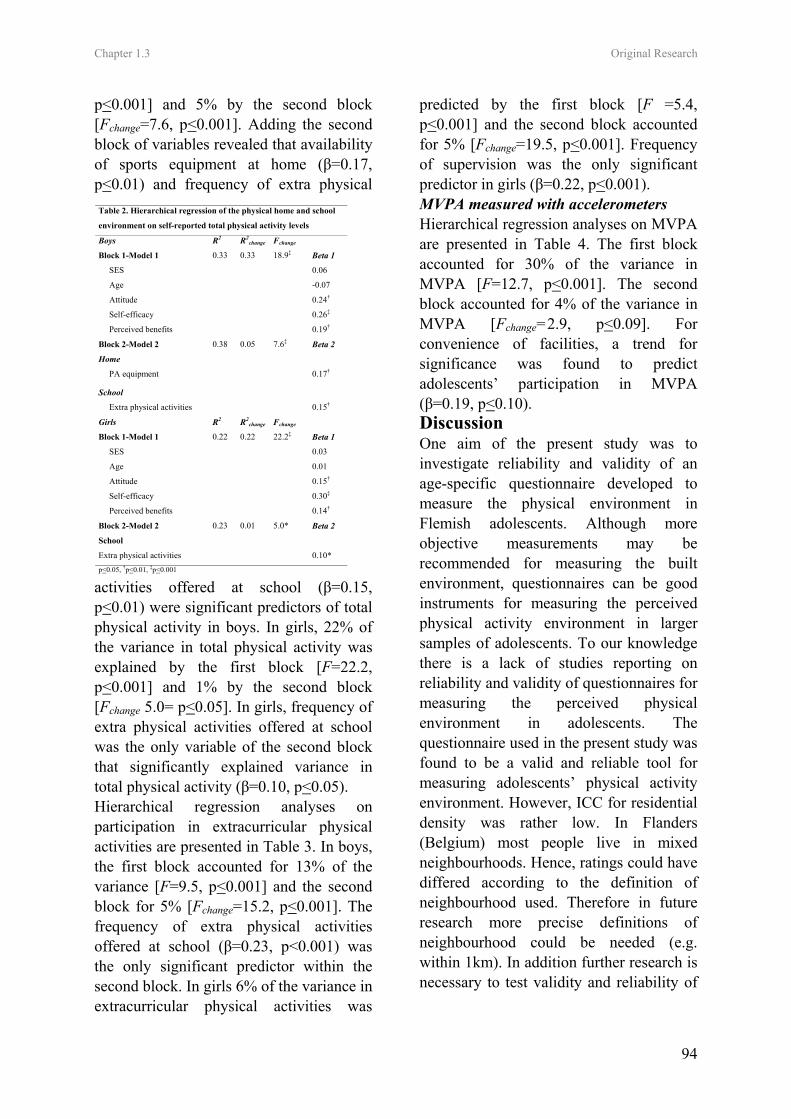
Chapter 1.3 Original Research
94
p<0.001] and 5% by the second block [Fchange=7.6, p<0.001]. Adding the second block of variables revealed that availability of sports equipment at home (β=0.17, p<0.01) and frequency of extra physical
activities offered at school (β=0.15, p<0.01) were significant predictors of total physical activity in boys. In girls, 22% of the variance in total physical activity was explained by the first block [F=22.2, p<0.001] and 1% by the second block [Fchange 5.0= p<0.05]. In girls, frequency of extra physical activities offered at school was the only variable of the second block that significantly explained variance in total physical activity (β=0.10, p<0.05). Hierarchical regression analyses on participation in extracurricular physical activities are presented in Table 3. In boys, the first block accounted for 13% of the variance [F=9.5, p<0.001] and the second block for 5% [Fchange=15.2, p<0.001]. The frequency of extra physical activities offered at school (β=0.23, p<0.001) was the only significant predictor within the second block. In girls 6% of the variance in extracurricular physical activities was
predicted by the first block [F =5.4, p<0.001] and the second block accounted for 5% [Fchange=19.5, p<0.001]. Frequency of supervision was the only significant predictor in girls (β=0.22, p<0.001). MVPA measured with accelerometers Hierarchical regression analyses on MVPA are presented in Table 4. The first block accounted for 30% of the variance in MVPA [F=12.7, p<0.001]. The second block accounted for 4% of the variance in MVPA [Fchange=2.9, p<0.09]. For convenience of facilities, a trend for significance was found to predict adolescents’ participation in MVPA (β=0.19, p<0.10). Discussion One aim of the present study was to investigate reliability and validity of an age-specific questionnaire developed to measure the physical environment in Flemish adolescents. Although more objective measurements may be recommended for measuring the built environment, questionnaires can be good instruments for measuring the perceived physical activity environment in larger samples of adolescents. To our knowledge there is a lack of studies reporting on reliability and validity of questionnaires for measuring the perceived physical environment in adolescents. The questionnaire used in the present study was found to be a valid and reliable tool for measuring adolescents’ physical activity environment. However, ICC for residential density was rather low. In Flanders (Belgium) most people live in mixed neighbourhoods. Hence, ratings could have differed according to the definition of neighbourhood used. Therefore in future research more precise definitions of neighbourhood could be needed (e.g. within 1km). In addition further research is necessary to test validity and reliability of
Table 2. Hierarchical regression of the physical home and school
environment on self-reported total physical activity levels
Boys R2 R2change Fchange
Block 1-Model 1 0.33 0.33 18.9‡ Beta 1
SES 0.06
Age -0.07
Attitude 0.24†
Self-efficacy 0.26‡
Perceived benefits 0.19†
Block 2-Model 2 0.38 0.05 7.6‡ Beta 2
Home
PA equipment 0.17†
School
Extra physical activities 0.15†
Girls R2 R2change Fchange
Block 1-Model 1 0.22 0.22 22.2‡ Beta 1
SES 0.03
Age 0.01
Attitude 0.15†
Self-efficacy 0.30‡
Perceived benefits 0.14†
Block 2-Model 2 0.23 0.01 5.0* Beta 2
School
Extra physical activities 0.10* p<0.05, †p<0.01, ‡p<0.001
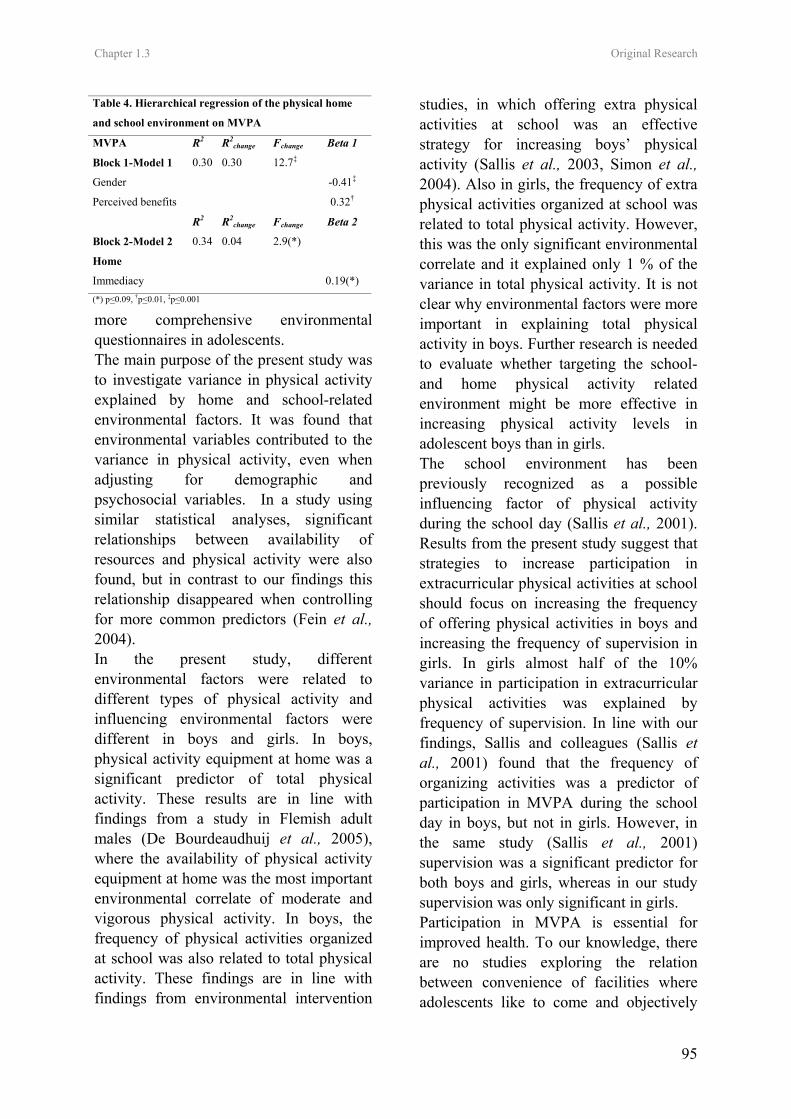
Chapter 1.3 Original Research
95
more comprehensive environmental questionnaires in adolescents. The main purpose of the present study was to investigate variance in physical activity explained by home and school-related environmental factors. It was found that environmental variables contributed to the variance in physical activity, even when adjusting for demographic and psychosocial variables. In a study using similar statistical analyses, significant relationships between availability of resources and physical activity were also found, but in contrast to our findings this relationship disappeared when controlling for more common predictors (Fein et al., 2004). In the present study, different environmental factors were related to different types of physical activity and influencing environmental factors were different in boys and girls. In boys, physical activity equipment at home was a significant predictor of total physical activity. These results are in line with findings from a study in Flemish adult males (De Bourdeaudhuij et al., 2005), where the availability of physical activity equipment at home was the most important environmental correlate of moderate and vigorous physical activity. In boys, the frequency of physical activities organized at school was also related to total physical activity. These findings are in line with findings from environmental intervention
studies, in which offering extra physical activities at school was an effective strategy for increasing boys’ physical activity (Sallis et al., 2003, Simon et al., 2004). Also in girls, the frequency of extra physical activities organized at school was related to total physical activity. However, this was the only significant environmental correlate and it explained only 1 % of the variance in total physical activity. It is not clear why environmental factors were more important in explaining total physical activity in boys. Further research is needed to evaluate whether targeting the school- and home physical activity related environment might be more effective in increasing physical activity levels in adolescent boys than in girls. The school environment has been previously recognized as a possible influencing factor of physical activity during the school day (Sallis et al., 2001). Results from the present study suggest that strategies to increase participation in extracurricular physical activities at school should focus on increasing the frequency of offering physical activities in boys and increasing the frequency of supervision in girls. In girls almost half of the 10% variance in participation in extracurricular physical activities was explained by frequency of supervision. In line with our findings, Sallis and colleagues (Sallis et al., 2001) found that the frequency of organizing activities was a predictor of participation in MVPA during the school day in boys, but not in girls. However, in the same study (Sallis et al., 2001) supervision was a significant predictor for both boys and girls, whereas in our study supervision was only significant in girls. Participation in MVPA is essential for improved health. To our knowledge, there are no studies exploring the relation between convenience of facilities where adolescents like to come and objectively
Table 4. Hierarchical regression of the physical home
and school environment on MVPA
MVPA R2 R2change Fchange Beta 1
Block 1-Model 1 0.30 0.30 12.7‡
Gender -0.41‡
Perceived benefits 0.32†
R2 R2change Fchange Beta 2
Block 2-Model 2 0.34 0.04 2.9(*)
Home
Immediacy 0.19(*) (*) p<0.09, †p<0.01, ‡p<0.001
Chapter 1.3 Original Research
96
measured MVPA. In contrast to the expectations, results of the present study seemed to indicate that participation in MVPA was higher in students living further away from facilities where adolescents like to come. In line with the findings from Jago and colleagues (Jago et al., 2001), no other environmental factors were found to be associated with participation in MVPA. Research that further investigates the relationship between environmental factors and objectively measured MVPA in larger samples is needed. Several limitations of the present study need to be addressed. First, the questionnaire to measure school level variables was not validated yet; therefore conclusions concerning school environmental factors should be treated with considerable caution. The development of a valid and reliable questionnaire to measure school environmental factors by use of self-reports is a priority for future research. Although it is a strength of the present study that physical activity was also measured more objectively with accelerometers, the sub sample in which these measurements occurred was relatively small. Hence, most of the conclusions in the present study were based on self-reported measures and although validated questionnaires were used, this is as a limitation of the study. Furthermore, given the cross-sectional design of the present study, no causal conclusions can be drawn. Although cross-sectional studies are necessary to understand the relationships between environment and physical activity, prospective studies that further explore the causal relationships between the change in environmental factors and the change in physical activity levels are needed.
This study provided initial insight into specific environmental factors that are related to different types of physical activity in adolescents. The findings suggest that different environmental factors are related to different types of physical activity and influencing factors are different in boys and girls.
Acknowledgments This study was supported by the Policy Research Centre Sport, Physical Activity and Health funded by the Flemish Government.
References o Ainsworth, B.E., Haskell, W.L., Whitt, M.C.,
Irwin, M.L., Swartz, A.M., Strath, S.J., O'Brien, W.L., Bassett, D.R., Schmitz, K.H., Emplaincourt, P.O., Jacobs, D.R. and Leon, A.S. (2000) Compendium of physical activities: an update of activity codes and MET intensities. Medicine and Science in Sports Exercise, S32, 498-516.
o Bandura, A. (1986) Social Foundations of Thought and Action: A Social Cognitive Theory. Prentice-Hall, Englewood Cliffs, New Jersey.
o Biddle, S.J.H., Gorely, T. and Stensel, D. (2004) Health-enhancing physical activity and sedentary behaviour in children and adolescents. Journal of Sports Sciences, 22, 679-701.
o Cummings S and Macintyre S. (2006) Food environments and obesity-neighbourhood or nation? International Journal of Epidemiology. 35, 100-104.
o De Bourdeaudhuij, I., Sallis, J.F. and Saelens, B.E. Environmental correlates of physical activity in a sample of Belgian adults. (2003) American Journal of Health Promotion. 18, 83-92.
o De Bourdeaudhuij, I., Lefevre, J., Deforche, B., Wijndaele, K., Matton, L. and Philippaerts R. (2005) Physical activity and psychosocial correlates in normal weight and overweight 11
Chapter 1.3 Original Research
97
to 19 year olds. Obesity Research, 13, 1097-1105.
o Fein, A.J., Plotnikoff, R.C., Wild, T.C. and Spence, J.C. (2004) Perceived environment and physical activity in youth. International Journal of Behavioral Medicine, 11, 135-142.
o Green, L.W., Richard, L. and Potvin L. (1996) Ecological foundations of health promotion. American Journal of Health Promotion. 10, 270-281.
o Hollingshead, A.B. (1957) Two-factor index of social position. Yale University Press, New Haven, CT.
o Humpel, N., Owen, N. and Leslie, E. (2002) Environmental factors associated with adults’ participation in physical activity: a review. American Journal of Preventive Medicine. 22, 188-199.
o Jago, R., Baranowski, T., Zakeri, I. and Harris, M. (2005) Observed environmental features and the physical activity of adolescent males. American Journal of Preventive Medicine. 29, 98-104.
o Molnar, B.E., Gortmaker, S.L., Bull, F.C. and Buka, S.L. (2004) Unsafe to play? Neighbourhood disorder and lack of safety predict reduced physical activity among urban children and adolescents. American Journal of Health Promotion. 18, 378-386.
o Philippaerts, R.M., Matton, L., Wijndaele, K., Balduck, A.L., De Bourdeaudhuij, I. and Lefevre, J. (2006) Validity of a physical activity computer questionnaire in 12- to 18 year old boys and girls. International Journal of Sports Medicine. 27,131-136.
o Puyau, M.R., Adolph, A.L., Vohra, F.A. and Butte, N.F. (2002) Validation and calibration of physical activity monitors in children. Obesity Research. 10, 150-157.
o Saelens, B.E., Sallis, J.F. and Frank, L.D. (2003) Environmental correlates of walking and cycling: findings from the transportation, urban design, and planning literatures. Annals of Behavioral Medicine. 25, 80-91.
o Sallis, J.F. (2000) Age-related decline in physical activity: a synthesis of human and
animal studies. Medicine and Science in Sports and Exercise. 23, 1598-1600.
o Sallis, J.F., Porchaska, J.J. and Taylor, W.C. A review of correlates of physical activity of children and adolescents. Medicine and Science in Sports and Exercise. 32, 963-975.
o Sallis, J.F., Conway, T.L., Prochaska, J.J., Mc Kenzie, T.L., Marshall, S.J. and Brown, M. (2001) The association of school environments with youth physical activity. American Journal of Public Health. 91, 618-620.
o Sallis, J.F., McKenzie, T.L., Conway, T.L., Elder, J.P., Prochaska, J.J, Bronw M, Zive, M.M, Marshall, S.J. and Alcarez, J.E. (2003) Environmental interventions for eating and physical activity. A randomized controlled trial in middle schools. American Journal of Preventive Medicine. 24, 209-217.
o Simon, C., Wagner, A., DiVita, D., Rauscher, E., Klein-Platat, C., Arveiler, D., Schweitzer, B. and Triby, E. (2004) Intervention centered on adolescents’ physical activity and sedentary behaviour (ICAPS): concept and 6-month results. International Journal of Obesity. S28, 96-103.
o Strong, W.B., Malina, R.M., Blimkie, C.J., Daniels, S.R., Dishman, R.K., Gutin, B., Hergenroeder, A.C., Must, A., Nixon, P.A., Pivarnik, J.M., Rowland, T., Trost, S. and Trudeau F. (2005) Evidence based physical activity for school-age youth. Journal of Pediatrics. 146, 732-737.
o Trost, S.G., Ward, D.S., Moorehead, S.M., Watson, P.D., Riner, W. and Burke, J.R. (1998) Validity of the computer science and applications (CSA) activity monitor in children. Medicine and Science in Sports and Exercise. 30, 629-633.
o Ward, D.S., Evenson, K., Vaughn, A., Rodgers, A.B. and Troiano, R.P. (2005) Accelerometer use in physical activity: best practices and research recommendations. Medicine and Science in Sports and Exercise. S37, 582-588.

Chapter 1.3 Original Research
98

Original Research: Part 2
Leen Haerens, Ilse De Bourdeaudhuij, Lea Maes, Carine Vereecken, Johannes Brug,
Benedicte Deforche
Public Health Nutrition, In press
CHAPTER 2.1
THE EFFECTS OF A MIDDLE SCHOOL HEALTHY EATING
INTERVENTION ON ADOLESCENTS’ FAT AND FRUIT INTAKE AND
SOFT-DRINK CONSUMPTION
Chapter 2.1 Original Research
101
The effects of a middle school healthy eating intervention on adolescents’ fat and fruit intake and soft-drink consumption
Abstract
Objectives: To evaluate the effects of a middle school healthy eating promotion intervention, combining environmental changes and computer-tailored feedback, with and without an explicit parent involvement component Design: Clustered-randomized controlled trial. Setting: Fifteen West-Flemish (Belgian) middle schools. Subjects: A random sample of 15 schools with 2991 7th and 8th graders was randomly assigned to an intervention group with parental support (n=5), an intervention group without parental support (n=5) and a control group (n=5). In these 15 schools an intervention, combining environmental changes with computer-tailored feedback was implemented. Fat intake, fruit, water and soft-drink consumption were measured with food frequency questionnaires in the total sample of children. Results: In girls, fat intake and % energy from fat decreased significantly more in the intervention group with parental support, when compared to the intervention alone group (all > F=3.9, p<0.05) and the control group (all > F=16.7, p<0.001). In boys, there were no significant decreases in fat intake (F=1.4, ns) or percentage of energy from fat (F=0.7, ns) as a result of the intervention. No intervention effects were found in boys or in girls for fruit (F=0.5, ns), soft drink (F=2.6, ns) and water consumption (F=0.3, ns). Conclusions: Combining physical and social environmental changes with computer-tailored feedback in girls and their parents can induce lower fat intake in middle school girls. Keywords: tailored advice, environment, children Introduction In the past years dietary behaviours have moved in an unhealthy direction in US youth (1-2). Also in Europe, children and adolescents have poor dietary habits (3-5). The transition from childhood into adolescence often results in diets becoming less healthy (6). Previous research in adolescents revealed that saturated fat intake is far above recommendations, fruit intake is less than desirable (3) and soft drink consumption is too high (3). An unhealthy diet during adolescence can negatively affect growth and development (7) and is likely to persist into adulthood (8-9). High energy and fat intake, low fruit intake and excessive soft-drink consumption have been associated with higher risk for becoming overweight and obese and for diabetes, hypertension,
cancer and cardiovascular diseases (2, 7, 10-14). The immediate and long-term health of adolescents can be improved by effective promotion of healthy eating in young people (1, 7, 14). Schools are preferred settings to promote healthy eating in adolescents (15), since schools offer the opportunity to combine nutrition education with changes in the school environment, and via school-based programs parents may also be involved. Existing evidence indicates that adolescents’ food choices are influenced by the food offered in vending machines, shops or at events at schools (1, 16-17). Therefore changes in school policies affecting the school environment can improve the opportunities for health-enhancing food choices (15,17-18). Nutrition education can be offered repeatedly in class aiming to influence
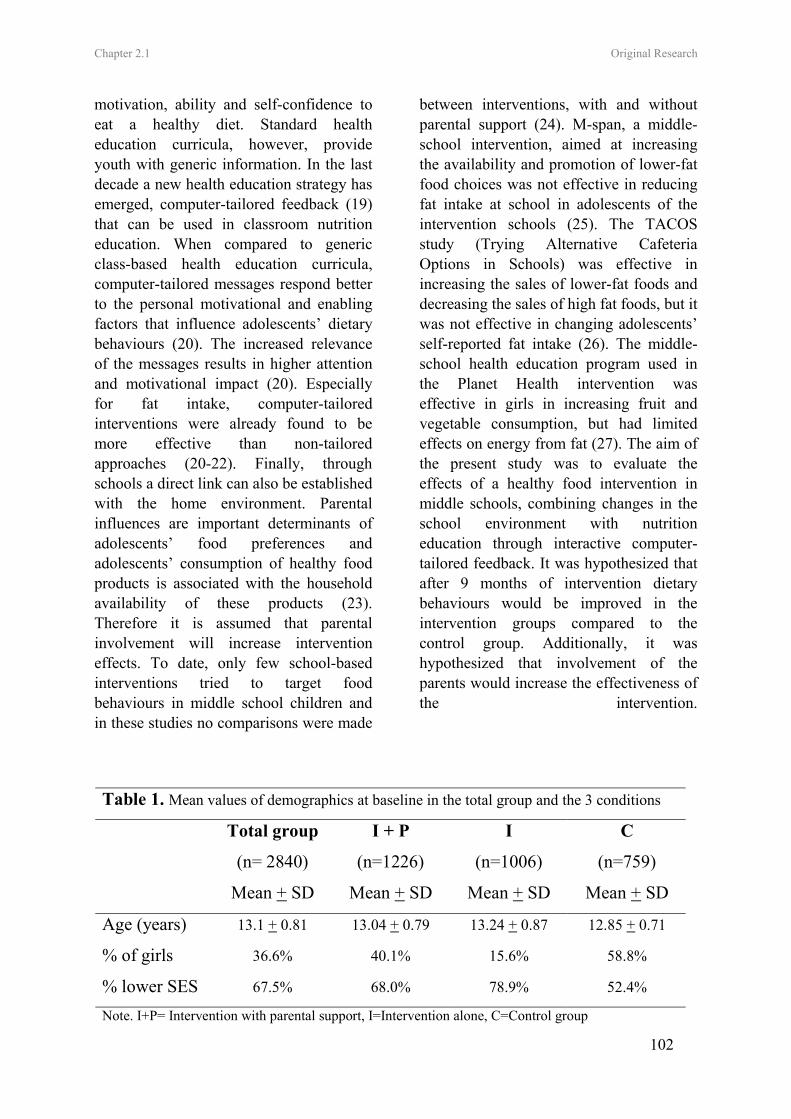
Chapter 2.1 Original Research
102
motivation, ability and self-confidence to eat a healthy diet. Standard health education curricula, however, provide youth with generic information. In the last decade a new health education strategy has emerged, computer-tailored feedback (19) that can be used in classroom nutrition education. When compared to generic class-based health education curricula, computer-tailored messages respond better to the personal motivational and enabling factors that influence adolescents’ dietary behaviours (20). The increased relevance of the messages results in higher attention and motivational impact (20). Especially for fat intake, computer-tailored interventions were already found to be more effective than non-tailored approaches (20-22). Finally, through schools a direct link can also be established with the home environment. Parental influences are important determinants of adolescents’ food preferences and adolescents’ consumption of healthy food products is associated with the household availability of these products (23). Therefore it is assumed that parental involvement will increase intervention effects. To date, only few school-based interventions tried to target food behaviours in middle school children and in these studies no comparisons were made
between interventions, with and without parental support (24). M-span, a middle-school intervention, aimed at increasing the availability and promotion of lower-fat food choices was not effective in reducing fat intake at school in adolescents of the intervention schools (25). The TACOS study (Trying Alternative Cafeteria Options in Schools) was effective in increasing the sales of lower-fat foods and decreasing the sales of high fat foods, but it was not effective in changing adolescents’ self-reported fat intake (26). The middle-school health education program used in the Planet Health intervention was effective in girls in increasing fruit and vegetable consumption, but had limited effects on energy from fat (27). The aim of the present study was to evaluate the effects of a healthy food intervention in middle schools, combining changes in the school environment with nutrition education through interactive computer-tailored feedback. It was hypothesized that after 9 months of intervention dietary behaviours would be improved in the intervention groups compared to the control group. Additionally, it was hypothesized that involvement of the parents would increase the effectiveness of the intervention.
Table 1. Mean values of demographics at baseline in the total group and the 3 conditions
Total group I + P I C
(n= 2840) (n=1226) (n=1006) (n=759)
Mean + SD Mean + SD Mean + SD Mean + SD
Age (years) 13.1 + 0.81 13.04 + 0.79 13.24 + 0.87 12.85 + 0.71
% of girls 36.6% 40.1% 15.6% 58.8%
% lower SES 67.5% 68.0% 78.9% 52.4%
Note. I+P= Intervention with parental support, I=Intervention alone, C=Control group
Chapter 2.1 Original Research
103
Methods Subjects The present study is a clustered randomized controlled trial. Because of the higher prevalence of overweight and obesity in schools offering technical or vocational training, a random sample of 15 schools out of the 65 schools with technical and vocational education in West-Flanders (Belgium) was selected to participate in this study. The 15 schools were randomly assigned to the intervention or control conditions: intervention with parental support (n=5, 1226 pupils), intervention alone (n=5, 1006 pupils) and a control condition (n=5, 759 pupils). The parents of all 2991 pupils in 7th and 8th grade received an informed consent in which authorization was enquired for their child to complete measurements. The parents of 151 (5%) children did not give permission for their child to participate in this study. This resulted in a sample of 2840 11 to 15 year old boys and girls within 15 schools. Table 1 presents the baseline data of the sample according to condition. The Study protocol was approved by the Ethical Committee of the Ghent University. Measurements Measures were assessed at the beginning (September 2003) and repeated at the end of the school year (June 2004). Fat intake was measured with a self-administered questionnaire developed at the Ghent University together with the Flemish Institute for Health Promotion (28). The questionnaire was validated in a separate study and was found to be sufficiently reliable and valid as compared to a dietary record method (28). The questionnaire consisted of 48 items, representing all important sources of fat in the Belgian diet. Pupils were asked how often they consumed these products during a usual day, week or month. A coefficient
was calculated, representing the fat content and portion size of each product. This coefficient was multiplied by the frequency of consumption, leading to a fat intake score for each food item. The summation of all food items’ fat intake scores lead to the total fat intake score (27). Individual recommended energy intake was calculated from standard recommended energy intake tables based on height, weight, sex, age and activity level (29-32). This allowed expression of reported fat intake as a percentage of total energy intakes. The percentage of children exceeding fat intake recommendations of maximum 30 % energy from fat was calculated (32). A validated food frequency questionnaire (33), adapted from the questionnaire used in the HBSC study (Health Behaviour in School-aged Children), was used to assess fruit intake. The question for fruit intake was: ‘How many pieces of fresh fruit do you usually eat?’ The percentage of children not meeting fruit intake recommendations (2 pieces a day) was calculated. A separate food frequency questionnaire was used to assess soft drink and water consumption. The questions asked for soft drink and water consumption were: ‘How many glasses of soft drinks do you drink during a regular school day’ and ‘How many glasses of soft drink do you drink during a regular weekend day?’ The same questions were repeated for water. Demographic factors like birth date, gender, occupation of father and mother, number of computers at home, were assessed using another self-administered questionnaire. An estimate of social economical status of the family was obtained by classifying occupation of the father and mother according to the “white collar” and “blue collar” method (34). All questionnaires were filled out at school, during class hours under direct
Chapter 2.1 Original Research
104
supervision of the teachers. At baseline 166 children did not fill out the fruit intake questionnaire, 182 children did not fill out the questionnaire for water and soft drink consumption and 203 did not fill out the fat intake questionnaire, due to absent at the day of measurement or children changing schools. There were 176 fruit intake questionnaires, 162 water and soft-drink intake questionnaires and 74 fat intake questionnaires missing at the 1 year post measurements. The Intervention The school-based intervention program was developed to promote healthy food choices and physical activity engagement in order to prevent the increasing prevalence of overweight in children. The intervention was implemented over one school year, beginning in October 2003 and ending in June 2004. Only the healthy food intervention is described below. The effects of the intervention on adiposity indexes (submitted) and children’s physical activity levels (submitted) were reported elsewhere. Working group. The healthy food intervention was designed for implementation by the school staff itself. Therefore a working group was composed out of the principal, the physical education teacher(s) and other involved teachers. The working group received background information and guidelines on how to address the intervention topics. They received an intervention manual and educational material. Every three months a one hour meeting with the working group and the research team was held to evaluate the implementation and to plan further actions. Nutrition interventions. The food-intervention focused on 3 behavioural changes that were supported by environmental changes: 1) increasing fruit consumption to at least 2 pieces a day, 2)
reducing soft-drink consumption and increasing water consumption and 3) reducing fat intake. Environmental strategies were aimed at increasing the availability of healthy food products and decreasing the availability of unhealthy food items at school. Hence, policies concerning the availability of unhealthy and healthy food products in 7th and 8th graders were tackled. The number of Flemish secondary schools offering fresh fruit is limited and it is not convenient for adolescents to take fruit with them from home to school (17). Therefore, to facilitate fruit consumption, fruit was sold once a week at school at low cost or provided for free to all 7th and 8th graders. It was also suggested to offer fruit as a dessert of the school lunch. Most of the Flemish secondary schools have stores or vending machines selling soft drinks. Hence, soft drinks are often consumed during breaks and at noon. In addition soft drinks are often available as a part of the school lunches. Since pupils are more likely to consume soft-drinks every day if soft drinks are available at school (17), the intervention was aimed at changing the availability and accessibility of soft drinks. Furthermore, schools tried to promote drinking water as opposed to soft drinks, by offering it for free by means of drinking fountains or at lower price than soft drinks in shops or vending machines. Children received information about the improved health consequences of eating fruit as opposed to snacks and drinking water rather than soft drinks. During classes children got the computer tailored intervention for fat intake (22) and fruit intake. Questionnaires concerning demographics, food intake and psychosocial determinants of food choices lead to a tailored fat and fruit advice. After completing the questionnaire tailored feedback was displayed immediately on
Chapter 2.1 Original Research
105
the screen. Both the fat and the fruit advice started with a general introduction, followed by normative feedback, which related their intakes to the recommended intakes. The fat advice indicated the sources of fat in the diet and tips were given on how to replace fatty foods. The Transtheoretical Model (35) was used to define the content and approach of the feedback in the fat advice. Based on the theory of planned behaviour (36) children got tailored feedback about their intentions, attitudes, self-efficacy, social support, knowledge, benefits and barriers related to their fat intake. In the same way as in the fat advice the approach of the fruit advice was also based on the Transtheoretical model. Overall a healthy diet was promoted in an advice of about 5 to 6 pages. Children could either save the advice on the computer or in some cases immediately print the feedback. Afterwards they had to complete a task with questions concerning their advice. Teachers were also encouraged to organize activities like healthy breakfast and educational games, as suggested in the intervention manual. In addition schools were encouraged to develop extra activities supportive to the intervention program. Parental involvement. The goal of the parent-involvement was to also create a supportive environment for healthy behaviours away from school. An invitation for an interactive meeting on food habits and the relationship with health was sent to all parents. It is known that parental involvement declines as children move from elementary school through middle schools (37-38) and it is often difficult to get parents to participate in meetings at school (39). Hence, in order to reach all parents the information was also communicated in the school paper and newsletters for the parents and was send to
their home addresses. In these materials parents were made aware of their important role in influencing their children’s dietary behaviours. Most children (97%) reported to have one or more computers at home. Hence, the CD with the adult computer-tailored intervention for fat intake (22) was given to all parents to use and complete at home. Parents were thus made aware of their own fat intake and its consequences for health. The advice gave personalized information on how to make changes towards a more healthy diet. Through a brochure parents were informed that their child also used a similar computer-tailored tool, at school in class. They were asked to discuss the feedback that they both received together and to support their child in making the healthy changes suggested in the feedback. Statistical Analyses Data were analyzed using SPSS 12.0. Preliminary analyses consisted of descriptive statistics of sample characteristics. Linear mixed models on one year post-intervention measures was used to test intervention effects of the school based healthy diet promotion intervention. Condition and gender were entered as factors in the model. School was nested within condition to take into account school variance. All analyses were adjusted for baseline values, age and social economical status. Pre to post analysis on percentage of energy from fat were also adjusted for pre to post differences in physical activity levels. Since these differences could have caused differences in energy requirements between intervention and control groups. Post hoc tests analyses were conducted to determine the direction of differences between the conditions. P-values < 0.05 were considered as statistically significant.
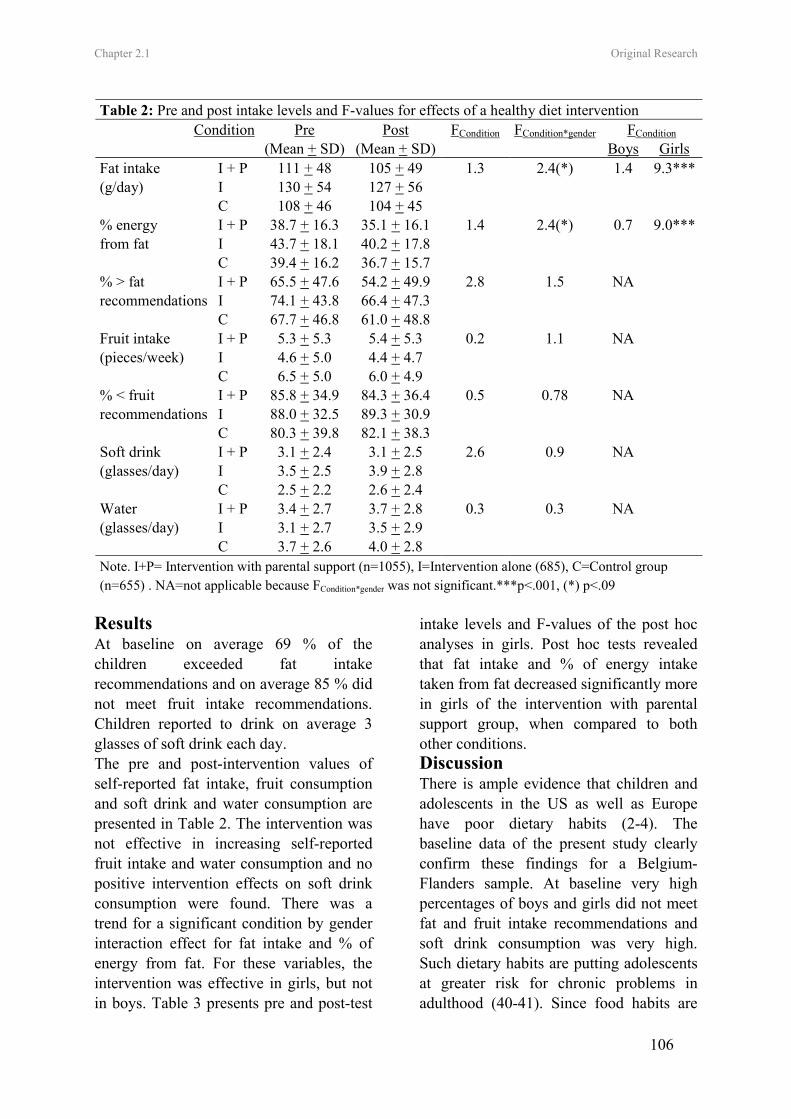
Chapter 2.1 Original Research
106
Results At baseline on average 69 % of the children exceeded fat intake recommendations and on average 85 % did not meet fruit intake recommendations. Children reported to drink on average 3 glasses of soft drink each day. The pre and post-intervention values of self-reported fat intake, fruit consumption and soft drink and water consumption are presented in Table 2. The intervention was not effective in increasing self-reported fruit intake and water consumption and no positive intervention effects on soft drink consumption were found. There was a trend for a significant condition by gender interaction effect for fat intake and % of energy from fat. For these variables, the intervention was effective in girls, but not in boys. Table 3 presents pre and post-test
intake levels and F-values of the post hoc analyses in girls. Post hoc tests revealed that fat intake and % of energy intake taken from fat decreased significantly more in girls of the intervention with parental support group, when compared to both other conditions. Discussion There is ample evidence that children and adolescents in the US as well as Europe have poor dietary habits (2-4). The baseline data of the present study clearly confirm these findings for a Belgium-Flanders sample. At baseline very high percentages of boys and girls did not meet fat and fruit intake recommendations and soft drink consumption was very high. Such dietary habits are putting adolescents at greater risk for chronic problems in adulthood (40-41). Since food habits are
Table 2: Pre and post intake levels and F-values for effects of a healthy diet intervention Condition Pre Post FCondition FCondition*gender FCondition
(Mean + SD) (Mean + SD) Boys Girls I + P 111 + 48 105 + 49 1.3 2.4(*) 1.4 9.3***Fat intake
(g/day) I 130 + 54 127 + 56 C 108 + 46 104 + 45
I + P 38.7 + 16.3 35.1 + 16.1 1.4 2.4(*) 0.7 9.0***% energy from fat I 43.7 + 18.1 40.2 + 17.8 C 39.4 + 16.2 36.7 + 15.7
I + P 65.5 + 47.6 54.2 + 49.9 2.8 1.5 NA % > fat recommendations I 74.1 + 43.8 66.4 + 47.3 C 67.7 + 46.8 61.0 + 48.8
I + P 5.3 + 5.3 5.4 + 5.3 0.2 1.1 NA Fruit intake (pieces/week) I 4.6 + 5.0 4.4 + 4.7 C 6.5 + 5.0 6.0 + 4.9
I + P 85.8 + 34.9 84.3 + 36.4 0.5 0.78 NA % < fruit recommendations I 88.0 + 32.5 89.3 + 30.9 C 80.3 + 39.8 82.1 + 38.3
I + P 3.1 + 2.4 3.1 + 2.5 2.6 0.9 NA Soft drink (glasses/day) I 3.5 + 2.5 3.9 + 2.8 C 2.5 + 2.2 2.6 + 2.4
I + P 3.4 + 2.7 3.7 + 2.8 0.3 0.3 NA Water (glasses/day) I 3.1 + 2.7 3.5 + 2.9 C 3.7 + 2.6 4.0 + 2.8 Note. I+P= Intervention with parental support (n=1055), I=Intervention alone (685), C=Control group (n=655) . NA=not applicable because FCondition*gender was not significant.***p<.001, (*) p<.09
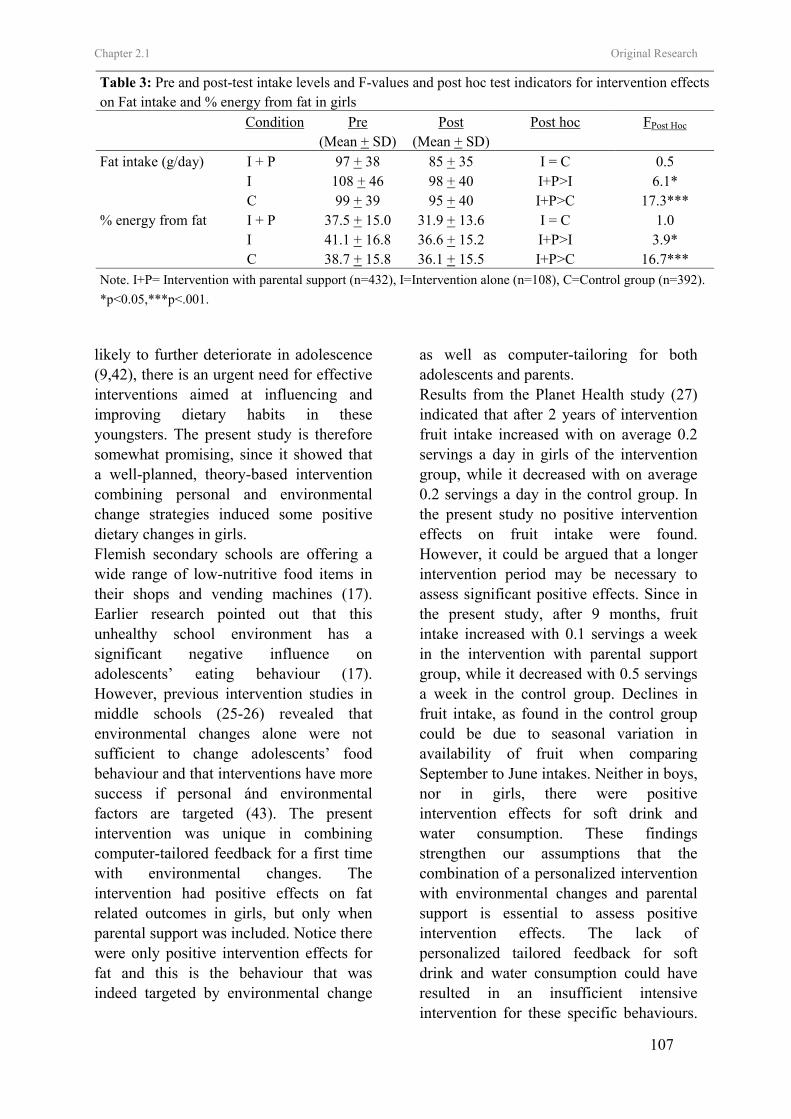
Chapter 2.1 Original Research
107
likely to further deteriorate in adolescence (9,42), there is an urgent need for effective interventions aimed at influencing and improving dietary habits in these youngsters. The present study is therefore somewhat promising, since it showed that a well-planned, theory-based intervention combining personal and environmental change strategies induced some positive dietary changes in girls. Flemish secondary schools are offering a wide range of low-nutritive food items in their shops and vending machines (17). Earlier research pointed out that this unhealthy school environment has a significant negative influence on adolescents’ eating behaviour (17). However, previous intervention studies in middle schools (25-26) revealed that environmental changes alone were not sufficient to change adolescents’ food behaviour and that interventions have more success if personal ánd environmental factors are targeted (43). The present intervention was unique in combining computer-tailored feedback for a first time with environmental changes. The intervention had positive effects on fat related outcomes in girls, but only when parental support was included. Notice there were only positive intervention effects for fat and this is the behaviour that was indeed targeted by environmental change
as well as computer-tailoring for both adolescents and parents. Results from the Planet Health study (27) indicated that after 2 years of intervention fruit intake increased with on average 0.2 servings a day in girls of the intervention group, while it decreased with on average 0.2 servings a day in the control group. In the present study no positive intervention effects on fruit intake were found. However, it could be argued that a longer intervention period may be necessary to assess significant positive effects. Since in the present study, after 9 months, fruit intake increased with 0.1 servings a week in the intervention with parental support group, while it decreased with 0.5 servings a week in the control group. Declines in fruit intake, as found in the control group could be due to seasonal variation in availability of fruit when comparing September to June intakes. Neither in boys, nor in girls, there were positive intervention effects for soft drink and water consumption. These findings strengthen our assumptions that the combination of a personalized intervention with environmental changes and parental support is essential to assess positive intervention effects. The lack of personalized tailored feedback for soft drink and water consumption could have resulted in an insufficient intensive intervention for these specific behaviours.
Table 3: Pre and post-test intake levels and F-values and post hoc test indicators for intervention effects on Fat intake and % energy from fat in girls
Condition Pre Post Post hoc FPost Hoc (Mean + SD) (Mean + SD)
Fat intake (g/day) I + P 97 + 38 85 + 35 I = C 0.5 I 108 + 46 98 + 40 I+P>I 6.1* C 99 + 39 95 + 40 I+P>C 17.3*** % energy from fat I + P 37.5 + 15.0 31.9 + 13.6 I = C 1.0 I 41.1 + 16.8 36.6 + 15.2 I+P>I 3.9* C 38.7 + 15.8 36.1 + 15.5 I+P>C 16.7*** Note. I+P= Intervention with parental support (n=432), I=Intervention alone (n=108), C=Control group (n=392). *p<0.05,***p<.001.
Chapter 2.1 Original Research
108
Additionally our experiences were in line with previous research in Flemish secondary schools revealing that financial interests are making school boards resistant to eliminate or reduce the sale of soft-drinks during breaks or at lunch (17). The increasing consumption of sugar-sweetened drinks is considered to contribute to the increasing prevalence of overweight and obesity (13). Therefore research evaluating the effects of combining personalized interventions with environmental changes on soft drink and water consumption should be a priority. Furthermore the huge incomes secondary schools receive from shops and vending machines results in school boards neglecting the importance of a healthy school environment. Therefore one possibility is the restriction of low-nutritive food at school by governmental laws. However, only limited research exist showing that restricting the sale of soft drinks in schools would improve dietary habits in youth (44). It is possible that adolescents would compensate the lack of soft drinks at school by the consumption of other sweetened products or by drinking more soft drinks outside school (44). In the present study there were clear gender differences in the results. The intervention was only effective in girls and not in boys. These gender differences are in line with the findings from the Planet Health study (27). In that study (27) a health education program was used and limited effects on total energy from fat were only found in girls. Previous research revealed that adult women compared to men were more positive towards the computer tailored intervention for fat intake (45). It is probable that girls were more responsive to the messages of the tailored intervention, since in general girls are more attuned to issues of diet (46). This indicates that combining changes in the
school environment, with personalized tailored feedback and increasing parental support is the most promising intervention strategy to address fat intake in adolescent girls. However, more research needs to be done on how to address boys. Strengths of the present study were the clustered randomized design with a high participation rate and the combination of a new intervention type, namely a computerized tailored intervention with environmental changes which was used for the first time in adolescents. A limitation of the present study is the self-reported character of the measurements. Self-reported measures used to assess dietary intakes of adolescents tend to result in reporting errors (47) and limited data are available to understand the reporting bias in this age group. Therefore the data in the present study should be treated with considerable caution. In the present study the effect of the whole school intervention was evaluated. It is also important to study the effects of each component. No studies are available to date now, documenting the effects of personalized tailored food interventions in adolescents. Additional priorities for future research include improving dietary interventions for boys and assessing long-term intervention effects in boys and girls. In conclusion, the present study provided evidence that the use of school environmental changes to increase the availability of healthy foods at school, together with the use of tailored interventions to motivate en enable healthy choices in girls and their parents can have positive effects on girls’ diets. Acknowledgments This study was supported by the Policy Research Centre Sport, Physical Activity and Health funded by the Flemish Government. References
Chapter 2.1 Original Research
109
1. Story M, Neumark-Sztainer D, French S. Individual and environmental influences on adolescent eating behaviours. Journal of the American Dietetic Association. 2002;102(3):S40-51. 2. Lytle LA, Kubik MY. Nutritional issues for adolescents. Best Practice and research clinical endocrinology and metabolism. 2003; 17(2):177-89. 3. World Health Organization. Young people’s health in context. Health Behavior in School-aged Children (HBSC) study: international report from 2001/2002 survey. Health Policy for Children and Adolescents. 2004;4. 4. Cruz JAA. Dietary habits and nutritional status in adolescents over Europe-Southern Europe. European Journal of Clinical Nutrition. 2000; 54(1):S29-35. 5. Lambert J, Agostoni C, Elmadfa I, Hulshof K, Krause E, Livingstone B, Socha P, Pannemans D, Samartin S. Dietary intake and nutritional status of children and adolescents in Europe. British Journal of Nutrition. 2004;92(2):S147-211. 6. Lytle LA. In defence of a low-fat diet for healthy children. Journal of the American Dietetic Association. 2000; 100(1):39-41. 7. Centers of Disease Control and Prevention. Guidelines for school health programs to promote lifelong healthy eating. Journal of School Health. 1997;67:9-26. 8. Kelder SH, Perry CL, Klepp K-I, Lytle LL. Longitudinal tracking of adolescent smoking, physical activity, and food choice behaviours. American Journal of Public Health. 1994; 84(7):1121-6. 9. Lien N, Lytle LA, Klepp K-I. Stability in Consumption of fruit, vegetables and sugary food in a cohort from age 14 to age 21. Preventive medicine. 2001;33:217-26. 10. Willet WC. Diet and health? What should we eat? Science. 1994; 264:532-7. 11. Reilly JJ, Dorosty AR. Epidemic of obesity in UK children. Lancet. 1999;354:1874-75. 12. Van Duyn MA, Pivonka E. Overview of the health benefits of fruit and vegetable consumption for the dietetics professional: Selected literature.
Journal of the American Dietetic Association. 2000;100 (12):1511-21. 13. Ludwig DC, Peterson KE, Gortmaker SL. Relation between consumption of sugar-sweetened drinks and childhood obesity: a prospective, observational analysis. Lancet. 2001;357:505-8. 14. Matthys C, de Henauw S, Devos C, de Backer G. Estimated energy intake, macronutrient intake and meal pattern of Flemish adolescents. European journal of Clinical Nutrition. 2003;57:366-75. 15. Wechsler H, Devereaux RS, Davis M, Collins J. Using the school environment to promote physical activity and healthy eating. Preventive Medicine. 2000; 31:S121-37. 16. Story M. School-based approaches for preventing and treating obesity. International Journal of Obesity. 1999;23 (S2):S43-51. 17. Vereecken CA, Bobelijn K and Maes L. School food policy at primary and secondary schools in Belgium-Flanders: does it influence people’s food habits. European Journal of Clinical Nutrition. 2004; 1-7. 18. Kubik MY, Lytle LA, Hannan PJ, Perry CL, Story M. The association of the school food environment with dietary behaviours of young adolescents. American Journal of Public Health. 2003;93(7):1168-73. 19. White MA, Martin PD, Newton RL. Mediators of weight loss in a family-based intervention presented over the internet. Obes Res. 2004;12(7):1050-9. 20. Brug J, Campbell M, Van Assema P. The application and impact of computer-generated personalized nutrition education: A review of the literature. Patient Education and Counseling. 1999;36:145-56. 21. Oenema A, Brug J. Feedback strategies to raise awareness of personal dietary intake: results of a randomized controlled trial. Preventive medicine. 2003;36:429-39. 22. Vandelanotte C, De Bourdeaudhuij I, Sallis JF, Spittaels H, Brug J. Efficacy of sequential or simultaneous interactive computer-tailored interventions for increasing physical activity and decreasing fat intake. Annals of Behavioral Medicine. 2005;29(2):138-46.
Chapter 2.1 Original Research
110
23. Hanson NI, Neumark-Sztainer, Eisenberg ME, story M, Wall M. Associations between parental report of the home food environment and adolescent intakes of fruits, vegetables and dairy foods. Public Health Nutrition. 2005;8(1)77-85. 24. Bautista-Castano I, Doreste J, Serra-Majm l. Effectiveness of intervention in the prevention of childhood obesity. Eur J Epidemiol. 2004;19:617-22. 25. Sallis JF, McKenzie TL, Conway TL, et al. Environmental interventions for eating and physical activity. A randomized controlled trial in middle schools. American Journal of Preventive Medicine. 2003;24(3):209-17. 26. French SA, Story M, Fulkerson JA, Hannan P. An environmental intervention to promote lower-fat food choices in secondary schools: outcomes of the Tacos study. American Journal of Public Health. 2004; 94(9):1507-12. 27. Gortmaker SL, Peterson K, Wiecha J. Reducing obesity via a school-based interdisciplinary intervention among youth. Archives of Pediatrics and Adolescent Medicine. 1999;153:409-18. 28. Vandelanotte C, Matthys C, De Bourdeaudhuij I. Reliability and validity of a computerized questionnaire to measure fat intake in Belgium. Nutrition Research. 2004;24:621-31. 29. World Health Organisation. Energy and Protein Requirements. Technical Report Series 724, Report of a Joint FAO/WHO/UNU Expert Consultation. Geneva: WHO, 1985. 30. Schofield WN, Schofield & James WPT. Basal metabolic rate: Review and prediction. Human nutrition. Clinical nutrition. 1985; 39: (S1): 1-96. 31. Commission of the European Communities, food, science and techniques. Proposed nutrient and energy intakes for the European Community: a report of the Scientific Committee for Food of the European community. Nutrition Reviews. 1993; 51(7):209-12. 32. National Council on Nutrition. Dietary recommendations for Belgium. Brussels: Ministry of Social Affairs, Public Health and Environment, 2000 33. Vereecken CA, Maes L. A Belgian study on the reliability and relative validity of the health
behaviour in school-aged children food-frequency questionnaire. Public Health Nutrition. 2003;6(6):581-8. 34. Hollingshead AB. Two-factor index of social position. New Haven, CT:Yale University Press, 1957. 35. Prochaska JO, DiClimente CC, Norcross JC. In search how people change. Applications to addictive behaviors. The American Psychologist. 1992;47:1102-14. 36. Ajzen I. From intentions to actions: a theory of planned behavior. In: Kuhl J, Beckman J, editors. Action-control: From cognition to behavior. 1985; Springer, Heidelberg.p.11-39. 37. Eccles JS, Harold RD. Parent-School Involvement during the early adolescent years. Teachers College Record. 1993;94(3):568-87. 38. Paulson SE, Sputa CL. Patterns of parenting during adolescence: perceptions of adolescents and parents. Adolescence. 1996;31:369-81. 39. Nader PR, Sallis JF, Abramson IS, et al. Family-based cardiovascular risk reduction education among Mexican- and Anglo-Americans. Family and Community Health. 1992;15(1):57-74. 40. World Health Organisation. Diet, nutrition and the prevention of chronic diseases. (2003) World Health Organisation, Geneva, Switzerland. 41. Licence K. Promoting and protecting the health of children and young people. Health and development. 2004;30(6):623-35. 42. Post B, de Vente W, Kemper HC, Twisk JW. Longitudinal trends in and tracking of energy and nutrient intake over 20 years in a Dutch cohort of mean and women between 13 and 33 years of age: the Amsterdam growth and health longitudinal study. British Journal of Nutrition. 2001;85:375-85. 43. Hoelscher DM, Evans A, Parcel G, Kelder S. Designing effective nutrition interventions for adolescents. Journal of The American Dietetic Association. 2002; 102(3):S52-63. 44. Finkelstein E, French S, Variyam JN, Haines PS. Pros and cons of proposed interventions to promote healthy eating. American Journal of Preventive Medicine. 2004;27(3S): 163-71. 45. Vandelanotte C, De Bourdeaudhuij I, Brug J. Acceptability and feasibility of an interactive
Chapter 2.1 Original Research
111
computer-tailored fat intake intervention in Belgium. Health promotion international. 2004; 19(4): 463-70. 46. McVey G, Tweed S, Blackmore E. Correlates of weight loss and muscle-gaining behaviour in 10- to 14-year old males and females. Preventive Medicine. 2005;40:1-9. 47. Livingstone MB, Robson PJ, Wallace JM. Issues in dietary intake assessment of children and adolescents. The British Journal of Nutrition. 2004; 92 (S2):S213-22.

112
Leen Haerens, Ilse De Bourdeaudhuij , Lea Maes, Greet Cardon, Benedicte Deforche
Journal of Adolescent Health, Accepted
CHAPTER 2.2
SCHOOL BASED RANDOMIZED CONTROLLED TRIAL OF A
PHYSICAL ACTIVITY INTERVENTION AMONG ADOLESCENTS
Chapter 2.2 Original Research
114
School Based Randomized Controlled Trial of a Physical Activity Intervention among adolescents
Abstract Purpose: To evaluate the effects of a middle school physical activity intervention, new in combining an environmental and computer tailored component. To evaluate the effects of parental involvement. Methods: A clustered randomized controlled design was used. A random sample of 15 schools with 7th and 8th graders was randomly assigned to 1 of 3 conditions: (a) intervention with parental support, (b) intervention alone and (c) control group. The intervention was new in combining environmental strategies with computer tailored feedback to increase levels of moderate to vigorous physical activity. It was implemented by the school staff itself. Physical activity was measured through a questionnaire in the total sample and with accelerometers in a sub sample of adolescents. Results: The intervention with parental support led to an increase in self-reported school related physical activity with on average 6.4 minutes per day (p<0.05, d=0.40). Physical activity of light intensity measured with accelerometers decreased with on average 36 minutes per day less as a result of the intervention with parental support (p<0.05, d=0.54). Physical activity of moderate to vigorous intensity measured with accelerometers significantly increased with on average 4 minutes per day in the intervention group with parental support, while it decreased with almost 7 minutes per day in the control group (p <0.05, d=0.46). Conclusions: The physical activity intervention, implemented by the school staff, resulted in enhanced physical activity behaviors in both middle school boys and girls. The combination of environmental approaches with computer tailored interventions seemed promising. Keywords: Adolescent, Physical Activity, Middle School, Intervention, Environment Introduction Adolescents should engage in physical activity of moderate to vigorous intensity (MVPA) for at least 60 minutes and up to several hours daily for enhanced health and weight control [1-3]. During the last 20 years physical activity has declined [1, 4] and adolescence is identified as the age of greatest declines [1, 5]. Hence, there is a strong need for effective interventions that promote physical activity among adolescents.
Schools are considered as preferred environments for promoting physical activity [6, 7]. Schools offer opportunities to intervene through health or physical education classes [8] and promotion of
active transportation is possible [9]. Finally, through schools parents may be reached. Although parental support is considered as important [10-12], the effect of parental involvement in physical activity interventions has not been well studied in adolescents. Previously conducted intervention studies targeting physical activity were mainly delivered through elementary schools and focused on health education lessons or physical education curricula [13-14]. Three intervention studies promoting physical activity were recently conducted in middle schools [15-17]. The Planet Health study, a multidisciplinary intervention to reduce obesity, made use of a physical activity classroom curriculum and was not
Chapter 2.2 Original Research
115
effective for increasing levels of MVPA [15]. M-span was aimed at increasing physical activity during physical education classes and leisure time periods by making environmental and policy changes. Physical activity was assessed by systematic observations (SOFIT, SOPLAY) during physical education classes, before school, and after school on school grounds. After two years of intervention, daily energy expenditure from MVPA increased with on average 41 kilocalories (kcal) per day in boys of the intervention group, while it increased with only 12 kcal in the control group. The intervention was not effective among girls. [16]. More recently ICAPS (Intervention Centered on Adolescents’ Physical activity and Sedentary behaviour], a 4 year ongoing middle school intervention study in France combined an educational component with environmental changes [17]. This was the only multi-component intervention study that was effective for increasing the proportion of adolescent boys (+12%) and girls (+24%) that participated in leisure organized physical activity leisure organized physical activities. However, it is possible that better outcomes in the intervention group were due to the desirability to give answers compliant with the intervention messages. In the last decade a new health education strategy has emerged, namely computer tailored feedback that can be used within the classroom. Previous studies in adults have shown that computer tailored messages better respond to personal, motivational and enabling factors that influence physical activity behaviors and are more likely to be perceived as interesting and personally relevant [18]. More recently, two studies in adolescents have shown that stage-based computer-tailored interventions can be effective for
increasing physical activity levels in adolescents [19-20]. A tailored intervention offered during eight 45-minutes lessons in low income, culturally diverse students resulted in increases in self-reported MVPA with on average 7 minutes daily in students of the intervention group, while among students from the control group decreases with on average 15 minutes daily were found [19]. A second tailored intervention [20] was not effective for increasing MVPA measured with both 7 day recalls and accelerometers. However, the number of active days per week increased with 7.3 percent among boys of the intervention group, while no changes were found in the control group. The results from the above mentioned intervention studies [16-17] suggested that targeting the environment is a potential effective intervention strategy, in addition personalized computer-tailored physical activity intervention also led to positive effects [19-20]. Hence, it could be argued that combining computer-tailored with environmental interventions may be an effective strategy for increasing physical among adolescents. The present study was an effectiveness trial aimed at evaluating the effects of a physical activity intervention in middle schools, new in combining environmental strategies with education through interactive computer tailored feedback. It was hypothesized that after 9 months of intervention, decreases in physical activity would be prevented or at best circumstances that physical activity levels would be increased. Additionally, it was hypothesized that parental involvement would increase the intervention effects. Methods Participants and Procedure The present study is a clustered randomized controlled trial. A Priori power analyses revealed that an n = 300 in each
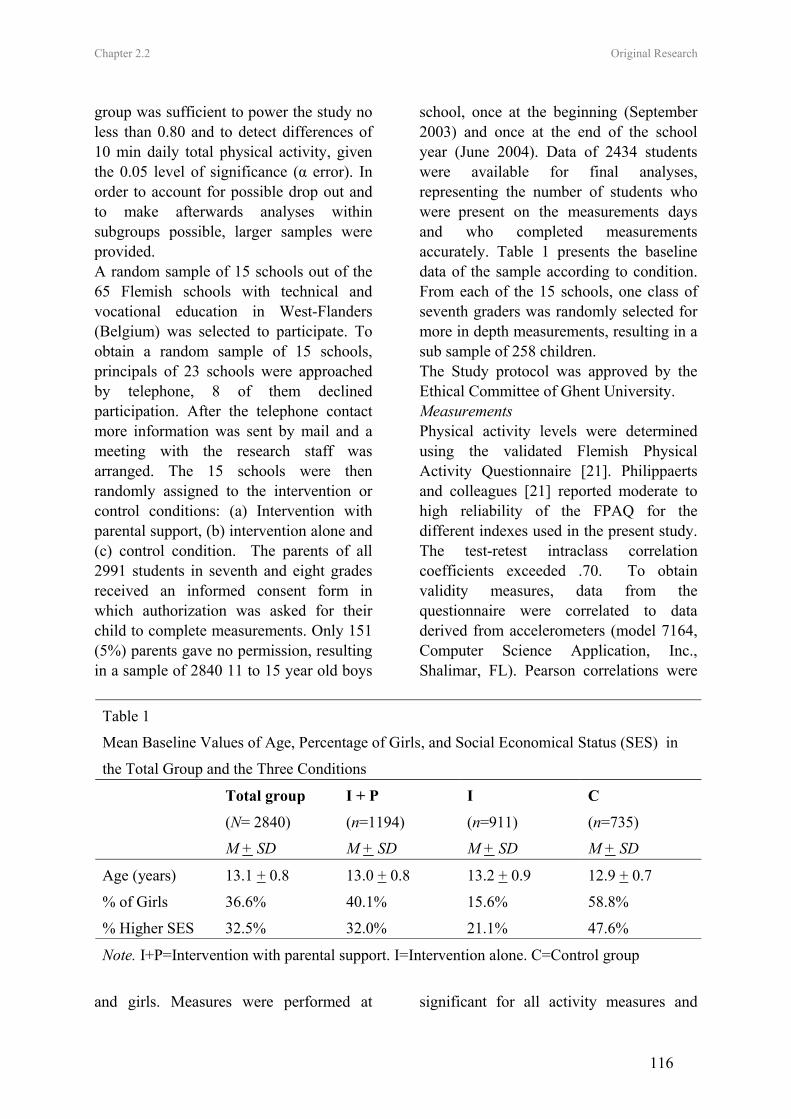
Chapter 2.2 Original Research
116
group was sufficient to power the study no less than 0.80 and to detect differences of 10 min daily total physical activity, given the 0.05 level of significance (α error). In order to account for possible drop out and to make afterwards analyses within subgroups possible, larger samples were provided. A random sample of 15 schools out of the 65 Flemish schools with technical and vocational education in West-Flanders (Belgium) was selected to participate. To obtain a random sample of 15 schools, principals of 23 schools were approached by telephone, 8 of them declined participation. After the telephone contact more information was sent by mail and a meeting with the research staff was arranged. The 15 schools were then randomly assigned to the intervention or control conditions: (a) Intervention with parental support, (b) intervention alone and (c) control condition. The parents of all 2991 students in seventh and eight grades received an informed consent form in which authorization was asked for their child to complete measurements. Only 151 (5%) parents gave no permission, resulting in a sample of 2840 11 to 15 year old boys
and girls. Measures were performed at
school, once at the beginning (September 2003) and once at the end of the school year (June 2004). Data of 2434 students were available for final analyses, representing the number of students who were present on the measurements days and who completed measurements accurately. Table 1 presents the baseline data of the sample according to condition. From each of the 15 schools, one class of seventh graders was randomly selected for more in depth measurements, resulting in a sub sample of 258 children. The Study protocol was approved by the Ethical Committee of Ghent University. Measurements Physical activity levels were determined using the validated Flemish Physical Activity Questionnaire [21]. Philippaerts and colleagues [21] reported moderate to high reliability of the FPAQ for the different indexes used in the present study. The test-retest intraclass correlation coefficients exceeded .70. To obtain validity measures, data from the questionnaire were correlated to data derived from accelerometers (model 7164, Computer Science Application, Inc., Shalimar, FL). Pearson correlations were
significant for all activity measures and
Table 1
Mean Baseline Values of Age, Percentage of Girls, and Social Economical Status (SES) in
the Total Group and the Three Conditions
Total group I + P I C
(N= 2840) (n=1194) (n=911) (n=735)
M + SD M + SD M + SD M + SD
Age (years) 13.1 + 0.8 13.0 + 0.8 13.2 + 0.9 12.9 + 0.7
% of Girls 36.6% 40.1% 15.6% 58.8%
% Higher SES 32.5% 32.0% 21.1% 47.6%
Note. I+P=Intervention with parental support. I=Intervention alone. C=Control group
Chapter 2.2 Original Research
117
ranged between .43 and .79, indicating acceptable validity of the instrument [21]. Data on demographic factors were collected in the first part of the questionnaire. An estimate of social economical status of the family was obtained by classifying the occupation of the father and mother into white and blue collar [22]. The second part evaluated the physical activity levels of the children. Total physical activity level (min/day) was determined as a result of three components: (a) school related physical activity, (b) leisure time sports and (c) leisure time active transportation. The “school related physical activity index” was determined adding up time spent in active transportation to school and extracurricular activities at school. To assess measures of active transportation to school, questions addressing frequency and duration of the trip to school and the main mean of transportation were included. To assess a measure of time spent in extracurricular physical activity, questions were added on the participation in physically activities during playtime, lunch break, after school hours or at class or school tournaments. The “leisure time active transportation index” was assessed, using questions addressing the minutes of cycling and walking in leisure time. The “leisure time sports index” was assessed using questions addressing time spent in sports outside school. Based on the METS from the Compendium of physical activity [23], each sport with a metabolic rate lower than 3 METS was classified as an activity of low intensity and was not taken into account for the leisure time sports index. Physical activity levels were also assessed by accelerometers (model 7164, Computer Science Application, Inc., Shalimar, FL) in the sub sample of 258 students. Parents of
22 students gave no permission for their child to wear the accelerometer. Data were missing in 24 students at pretest and in 21 students at posttest due to illness, unwillingness of the child to wear the instrument or registration problems. Finally, data of both pre and posttest were available for 89 boys and 94 girls. The accelerometer has shown to be a valid and reliable tool for the assessment of physical activity in adolescents [24-26]. Students were instructed to wear the accelerometer above the right hipbone and underneath the clothes for four weekdays and two weekend days. The accelerometers were held in place with an elastic belt and an adjustable buckle. Students were asked to take the accelerometer off in situations where they could hurt themselves or for water activities like swimming or taking a bath or a shower. Activity counts cut-off points specific for adolescents differ considerably across studies and there is still no consensus on which cut-off points are the most appropriate to use [27]. Most recently published studies support a cut-off around 3000-3500 for MVPA [28]. Cut-off points used in the present study were 0, <3200 and > 3200 for inactive, light and moderate to vigorous minutes respectively [24]. These minutes were summed for the total registration period and divided by the number of days of registration. This resulted in a physical activity index of light and moderate to vigorous intensity, expressed in minutes per day. Days with less than 960 min of registered activity were considered as invalid. Students were asked to register in a diary each activity performed without wearing the accelerometer. If students participated in a certain sports without wearing the accelerometer (e.g. swimming), time spent in that sport was noted in a diary. Registered minutes of participation in
Chapter 2.2 Original Research
118
sports of > 3MET [23] were calculated per day. These minutes were afterwards taken into account in the index of MVPA. Diaries were coded blind to the intervention group status. The Intervention The intervention was implemented during one school year, beginning in October 2003 and ending in June 2004. The program was developed to promote healthy food choices and physical activity engagement in order to prevent the increasing prevalence of overweight among adolescents. The intervention description was published before, together with the intervention effects on adiposity indexes [29]. Hence, only a brief summary of the physical activity intervention is given below. Schools changed their physical environment by creating more opportunities to be physically active during breaks, at noon or after school hours. The content of the physical activities varied and noncompetitive activities were included in order to reach less skilled students. Extra physical activities were often organized at noon (7/10 schools), at Wednesday afternoons (10/10 schools) and after school hours (4/10 schools). Additionally, extra sports materials were made available. Every school received an intervention box with sports materials like ropes, frisbees, balls, and beach ball sets. Sports materials were most often made available at noon (6/10 schools), in some schools it was made available after school hours (3/10 schools) and in one school sports materials were also made available during breaks. During classes students received an adaptation of the adult computer tailored intervention for physical activity [30]. They received a personal physical activity advice in which an active lifestyle was promoted.
In five of the ten intervention schools, additional efforts aimed at creating a supportive social environment for healthy behaviors outside school through parental involvement. Parents were invited for an interactive meeting on physical activity and the relationship with health. Information was also communicated through home correspondence and all parents received a free CD with the adult computer tailored intervention for physical activity [30] to complete at home. Statistical Analyses Data were analyzed using SPSS 12.0. Preliminary analyses consisted of descriptive statistics of sample characteristics. Linear mixed models with group (participating and not participating at follow-up) entered as a factor on baseline demographics and physical activity indexes and χ2-analyses were used to conduct drop out analyses. Linear mixed models on post values of physical activity were conducted with condition entered as a factor in the model to evaluate intervention effects. Because of the gender disparity across conditions, gender and “gender by condition” interactions were entered as factors in the model. School was nested within condition to take into account possible variance at the school level. All analyses were adjusted for baseline values, age and social economical status. Since intention-to-treat analyses preserve baseline comparability between groups achieved by randomization and drop out was higher in the intervention alone group, intention-to-treat analyses were conducted by carrying the last observation forward. Post hoc tests analyses were conducted to determine differences in physical activity changes between the conditions. Effect sizes (d) were calculated by subtracting the change in control schools from the change in intervention schools and dividing by the pooled standard
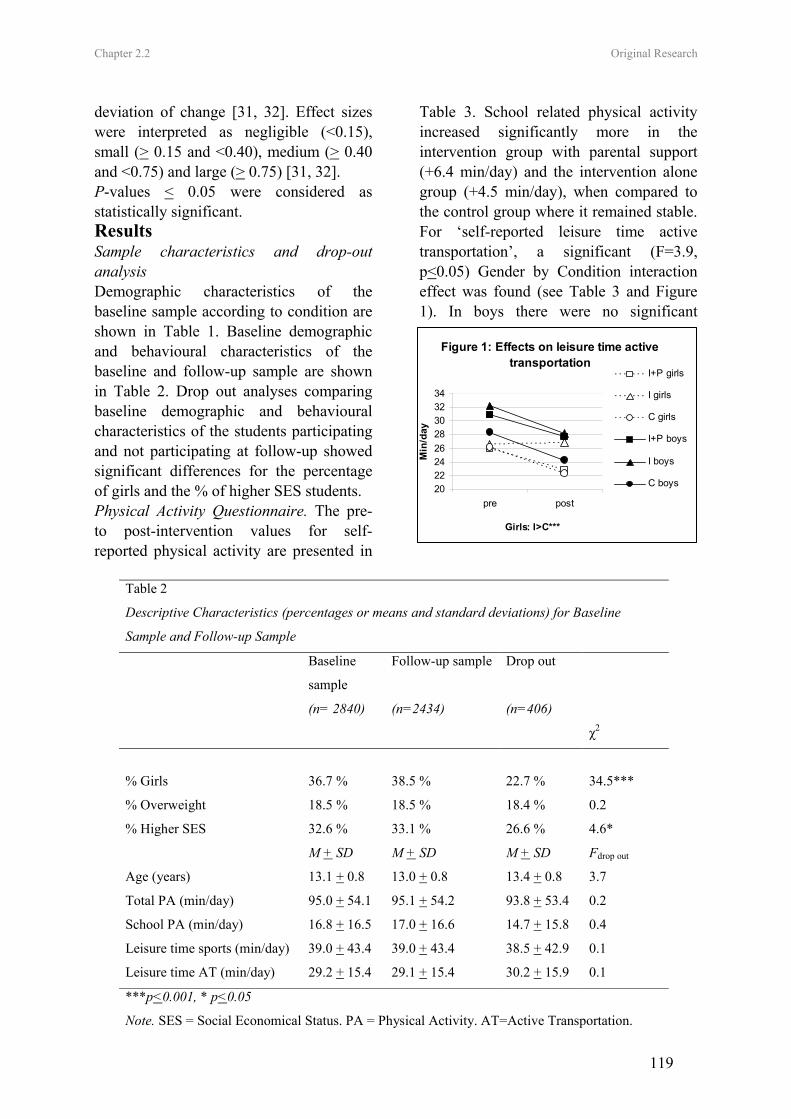
Chapter 2.2 Original Research
119
deviation of change [31, 32]. Effect sizes were interpreted as negligible (<0.15), small (> 0.15 and <0.40), medium (> 0.40 and <0.75) and large (> 0.75) [31, 32]. P-values < 0.05 were considered as statistically significant. Results Sample characteristics and drop-out analysis Demographic characteristics of the baseline sample according to condition are shown in Table 1. Baseline demographic and behavioural characteristics of the baseline and follow-up sample are shown in Table 2. Drop out analyses comparing baseline demographic and behavioural characteristics of the students participating and not participating at follow-up showed significant differences for the percentage of girls and the % of higher SES students. Physical Activity Questionnaire. The pre- to post-intervention values for self-reported physical activity are presented in
Table 3. School related physical activity increased significantly more in the intervention group with parental support (+6.4 min/day) and the intervention alone group (+4.5 min/day), when compared to the control group where it remained stable. For ‘self-reported leisure time active transportation’, a significant (F=3.9, p<0.05) Gender by Condition interaction effect was found (see Table 3 and Figure 1). In boys there were no significant
Figure 1: Effects on leisure time active transportation
2022242628303234
pre post
Girls: I>C***
Min
/day
I+P girls
I girls
C girls
I+P boys
I boys
C boys
Table 2
Descriptive Characteristics (percentages or means and standard deviations) for Baseline
Sample and Follow-up Sample
Baseline
sample
Follow-up sample Drop out
(n= 2840) (n=2434) (n=406)
χ2
% Girls 36.7 % 38.5 % 22.7 % 34.5***
% Overweight 18.5 % 18.5 % 18.4 % 0.2
% Higher SES 32.6 % 33.1 % 26.6 % 4.6*
M + SD M + SD M + SD Fdrop out
Age (years) 13.1 + 0.8 13.0 + 0.8 13.4 + 0.8 3.7
Total PA (min/day) 95.0 + 54.1 95.1 + 54.2 93.8 + 53.4 0.2
School PA (min/day) 16.8 + 16.5 17.0 + 16.6 14.7 + 15.8 0.4
Leisure time sports (min/day) 39.0 + 43.4 39.0 + 43.4 38.5 + 42.9 0.1
Leisure time AT (min/day) 29.2 + 15.4 29.1 + 15.4 30.2 + 15.9 0.1
***p<0.001, * p<0.05
Note. SES = Social Economical Status. PA = Physical Activity. AT=Active Transportation.
Chapter 2.2 Original Research
120
differences (all F<1.2, ns). Among girls, leisure time active transportation remained stable in the intervention alone group while it significantly decreased with on average 4 min daily in the control group (F=12.1, p<0.001, d=0.28). Accelerometers. The pre- to post-intervention values of physical activity levels measured by accelerometers are presented in Table 4. Physical activity of light intensity significantly decreased with on average 21 min daily in the intervention group with parental support, while it decreased with on average 57 min daily in the control group (F=5.1, p<0.05, d=0.54). For MVPA, there was a significant difference between the intervention group with parental support and the control group (F=5.1, p <0.05, d=0.46). MVPA increased with on average 4 min daily in the intervention group with parental support, while it decreased with almost 7 min daily in the control group. Discussion The main purpose of this study was to evaluate the effects of an intervention unique in combining environmental changes with personalized stage-based computer tailored feedback, for promoting physical activity in middle school boys and girls. After 9 months, the intervention seemed effective in enhancing healthy physical activity behaviors. The self-reported physical activity measurements showed that the intervention effects differed according to the context (at school/leisure time) of the activities. It appeared that combining environmental changes with computer tailored interventions may be effective to increase adolescents’ engagement in school-related physical activity, but not leisure time physical activity. Students in the intervention conditions increased their time spent in school related physical activities with on average 36 min a week, while no
increases were found in the control condition. As the multi-component intervention was implemented as a whole it is not possible to determine which intervention component was responsible for the increases in school related physical activity. The environmental component mainly focused on increasing time, space, material, and opportunities to be active, and the individual component provided a personalized physical activity advice. It could be argued that making the school environment more ‘activity friendly’ had a direct impact upon physical activity at school. Participation in physical activities at school may specifically be enhanced through successful experiences as special attention was given in the program to varying the content of the physical activities offered in order to reach all students. The computer-tailoring part of the intervention also included specific feedback on how to be active with friends at school. In addition, the parental support intervention may have led to more support from family members to be active at school. In the same way as with our intervention, the M-Span intervention [16] included parental education and was aimed at increasing physical activity during leisure periods throughout the school day by increasing supervision, equipment and organized activities. After the second intervention year very large effect sizes were found among boys (d=1.1). In contrast to our findings, the M-Span intervention did not result in increases in physical activity after one year of intervention and no effects were found among girls. However, the size of the 2-year post intervention effects among boys was considerably larger when compared to the effect-sizes found in the present study. The more intensive nature of the intervention including an additional
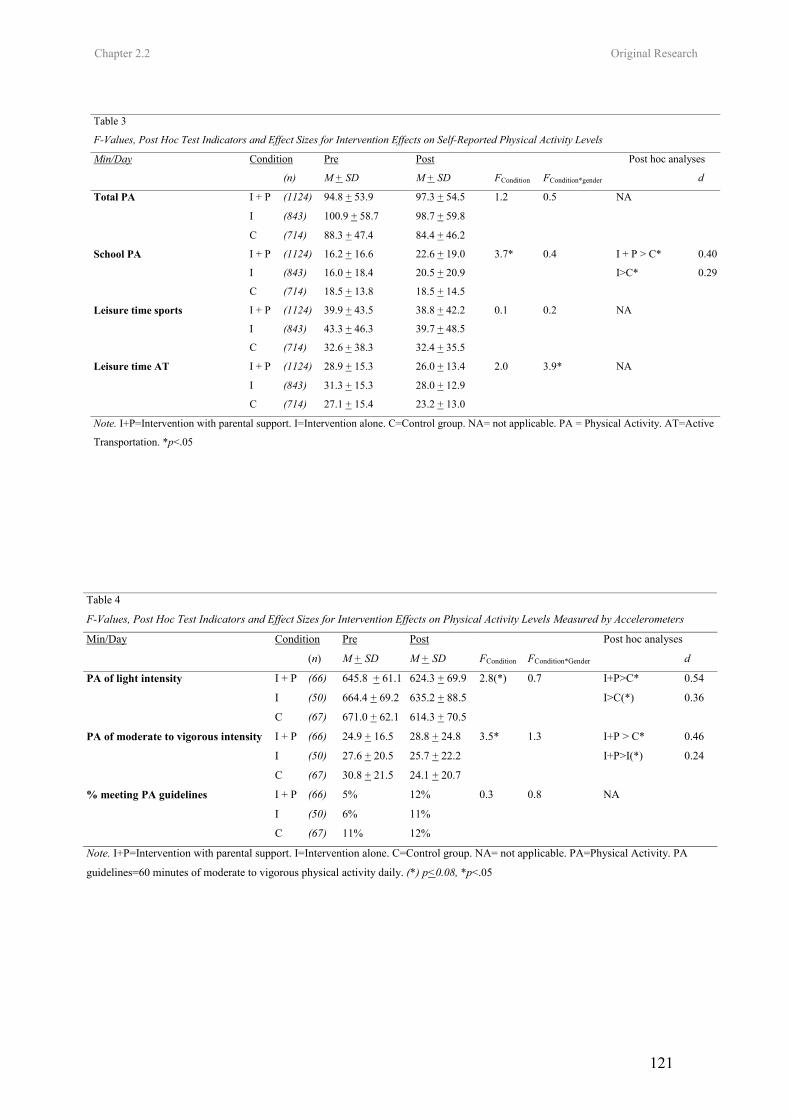
Chapter 2.2 Original Research
121
Table 4
F-Values, Post Hoc Test Indicators and Effect Sizes for Intervention Effects on Physical Activity Levels Measured by Accelerometers
Min/Day Condition Pre Post Post hoc analyses
(n) M + SD M + SD FCondition FCondition*Gender d
PA of light intensity I + P (66) 645.8 + 61.1 624.3 + 69.9 2.8(*) 0.7 I+P>C*
I (50) 664.4 + 69.2 635.2 + 88.5 I>C(*)
C (67) 671.0 + 62.1 614.3 + 70.5
0.54
0.36
I + P (66) 24.9 + 16.5 28.8 + 24.8 3.5* 1.3 I+P > C* PA of moderate to vigorous intensity
I (50) 27.6 + 20.5 25.7 + 22.2 I+P>I(*)
C (67) 30.8 + 21.5 24.1 + 20.7
0.46
0.24
% meeting PA guidelines I + P (66) 5% 12% 0.3 0.8 NA
I (50) 6% 11%
C (67) 11% 12%
Note. I+P=Intervention with parental support. I=Intervention alone. C=Control group. NA= not applicable. PA=Physical Activity. PA
guidelines=60 minutes of moderate to vigorous physical activity daily. (*) p<0.08, *p<.05
Table 3
F-Values, Post Hoc Test Indicators and Effect Sizes for Intervention Effects on Self-Reported Physical Activity Levels
Min/Day Condition Pre Post Post hoc analyses
(n) M + SD M + SD FCondition FCondition*gender d
Total PA I + P (1124) 94.8 + 53.9 97.3 + 54.5 1.2 0.5
I (843) 100.9 + 58.7 98.7 + 59.8
C (714) 88.3 + 47.4 84.4 + 46.2
NA
School PA I + P (1124) 16.2 + 16.6 22.6 + 19.0 3.7* 0.4 0.40
I (843) 16.0 + 18.4 20.5 + 20.9 0.29
C (714) 18.5 + 13.8 18.5 + 14.5
I + P > C*
I>C*
Leisure time sports I + P (1124) 39.9 + 43.5 38.8 + 42.2 0.1 0.2
I (843) 43.3 + 46.3 39.7 + 48.5
C (714) 32.6 + 38.3 32.4 + 35.5
NA
I + P (1124) 28.9 + 15.3 26.0 + 13.4 2.0 3.9* Leisure time AT
I (843) 31.3 + 15.3 28.0 + 12.9
C (714) 27.1 + 15.4 23.2 + 13.0
NA
Note. I+P=Intervention with parental support. I=Intervention alone. C=Control group. NA= not applicable. PA = Physical Activity. AT=Active
Transportation. *p<.05
Chapter 2.2 Original Research
122
component that was aimed at increasing physical activity during physical education classes and including large incentives (around 3000$) to buy equipment and to organize physical activities [16] may have caused these larger intervention effects. The lack of positive effects on leisure time sports could be due to the timing of the intervention. As the intervention started in October and subscriptions in most sports clubs take place in August or September. Although the intervention was not effective for increasing leisure time active transportation, decreases in time spent in leisure time active transportation were prevented in girls of the intervention alone group. Engagement in leisure time active transportation is a lifetime physical activity behavior and changing such behaviors is essential in a long term perspective. Although, in the present study, an extra intervention condition was created, in which intensive involvement of the parents was aspired, this was not sufficient for increasing leisure time physical activity. Perhaps interventions designed to target leisure time sports and active transportation should be more community- rather than school-based. The short-term results from the ICAPS study [17] indeed indicated promising effects on leisure time physical activity, when intervening in a broader context. The ICAPS intervention [17] also included an educational, environmental and parental component. The intervention further focused on involving club educators and community agencies and in addition recreational areas and transportation infrastructures were targeted. In contrast to our findings, the intervention did result in increases in participation in leisure organized activities, already after six months. However, no distinction was made between participation in leisure organized activities at school and
outside school and the magnitude of the effects was not reported. It is known that parental involvement declines as children move from elementary school through middle schools [33-35] and it is often difficult to get parents to participate in meetings at school [35]. Therefore parents were mainly involved at home through articles in school papers and newsletters. Parents were made aware of the importance of physical activity for their child’s health. Information was provided on how to support the child in becoming more active. Moreover every parent received a free CD with the adult computer tailored intervention for physical activity to complete at home. Notice that the combination of environmental changes and computer tailored feedback in both adolescents and their parents was necessary to obtain medium effect sizes. The intervention without parental support only resulted in small effect sizes. Trost and colleagues [12] concluded that parental support such as financial support, transportation, observation and encouragement is related to adolescents’ physical activity levels. These instrumental parental support behaviors could indeed be critical for increasing participation in school-related physical activity and MVPA. Health related physical activity guidelines in adolescents recommend engagement in MVPA for at least 60 min daily [2-3]. The intervention was not effective for increasing the proportion of students that meets these guidelines. Most adolescents did not comply with the physical activity guidelines and among insufficiently active adolescents every increase in MVPA may have been important to produce health benefits. Hence, it is relevant that the intervention plus parental support was effective for increasing time spent in MVPA in both boys and girls.
Chapter 2.2 Original Research
123
Previous studies [1] showed that girls are less active than boys and increasing physical activity in girls requires intervention strategies that are tailored for girls [16]. Only one previously conducted intervention was effective for increasing physical activity in middle school girls [17]. However, in that study physical activity was only measured with questionnaires which may have increased the risk for social desirable answers [17]. An additional value of the present study is that by using accelerometers, it was more objectively demonstrated that environmental changes supported by personal tailored interventions lead to positive intervention effects in both boys and girls. The intervention was designed in such way that future implementation in all Flemish schools would be feasible. Finding positive outcomes, given that the intervention was fully implemented by the school staff themselves is a strength of the study. The results give a realistic view on how effective the intervention would be, if implemented on a larger scale. Some limitations of the study need to be addressed. First, the randomization of students took place at the school level resulting in a higher risk for clustering of outcome variables within schools. By using multilevel analyses and controlling for baseline characteristics this issue was addressed. Second in order to increase the external validity of the results, schools were not matched on key characteristics such as gender or SES. As a result of this there was a considerable gender disparity across conditions. To deal with these limitations, “gender by condition” interactions and covariates were added into the statistical analyses. Third, the intervention period was relatively short and further research is needed to evaluate the extent to which positive effects persist. A
fourth limitation concerns the use of accelerometers only in a sub sample of 7th graders and not in 8th graders. In Flanders, most students stay in the same school as they move from 7th to 8th grade, whereas students more often change schools as they move from 8th grade to 9th grade. In order to be able to measure as much students as possible during the 1 year follow-up period, accelerometers were only used in 7th graders. A fifth limitation is the lack of objective process evaluation data on the level of implementation and parental involvement. Finally, it is not possible to determine which specific component of the intervention had significant effects. Although it is hypothesized that it is the multi-component nature of the intervention that caused its effectiveness, more research is needed to find out which is the independent effect of the computer tailored physical activity intervention. In conclusion, school based intervention strategies combining environmental approaches with computer tailored interventions seemed promising for increasing physical activity in adolescent boys and girls. References
1. Biddle SJH, Gorely T, Stensel D. Health-enhancing physical activity and sedentary behaviour in children and adolescents. J Sports Sci 2004; 22:679-701.
2. Cavill NA, Biddle S, Sallis JF. Health enhancing physical activity for young people: Statement of the United Kingdom Expert Consensus Conference. Pediatr Exerc Sci 2001; 13:12-25.
3. Strong BW, Malina RM, Blimkie CJR, et al. Evidence based physical activity for school-age youth. J Pediatr 2005; 146: 732-737.
4. Boreham C, Riddoch C. The physical activity, fitness and health of children. J Sports Sci 2001; 19: 915-929.
5. Sallis JF. Age-related decline in physical
Chapter 2.2 Original Research
124
activity: a synthesis of human and animal studies. Med Sci Sports Exerc 2000; 23: 1598-1600.
6. Wechsler H, Devereaux RS, Davis M, et al. Using the school environment to promote physical activity and healthy eating. Prev Med Suppl 2000; 31: 121-137.
7. Sallis JF, Conway TL, Prochaska JJ, et al. The association of school environments with youth physical activity. Am J Public Health 2001; 91: 618-620.
8. Sallis JF, McKenzie TL. Physical education in public health. Res Q Exerc Sport 1991; 62: 124-137.
9. Jago R, Baranowski T. Non-curricular approaches for increasing physical activity in youth: a review. Prev Med 2004; 39: 157-163.
10. Sallis JF, Porchaska JJ, Taylor WC. A review of correlates of physical activity of children and adolescents. Med Sci Sports Exerc 2000; 32: 963-975.
11. Davison KK, Cutting TM, Birch LL. Parents’ activity-related parenting practices predict girls’ physical activity. Med Sci Sports Exerc 2003; 35: 1589-1595.
12. Trost SG, Sallis JF, Pate RR, et al. Evaluating a model of parental influence on youth physical activity. Am J Prev Med 2003; 25: 277-282.
13. Kahn EB, Ramsey LT, Brownson RC, et al. The effectiveness of interventions to increase physical activity. Am J Prev Med Suppl 2002; 22/4: 73-107.
14. Wareham JN, Van Sluijs EMF, Ekeleund U. Physical activity and obesity prevention: a review of the current evidence. Proc Nutr Soc 2005; 64: 229-247.
15. Gortmaker SL, Peterson K, Wiecha J. Reducing obesity via a school-based interdisciplinary intervention among youth. Arch Pediatr Adolesc Med 1999; 153: 409-418.
16. Sallis JF, McKenzie TL, Conway TL, et al. Environmental interventions for eating and physical activity. A randomized controlled
trial in middle schools. Am J Prev Med 2003; 24: 209-217.
17. Simon C, Wagner A, DiVita C, et al. Intervention centered on adolescents’ physical activity and sedentary behaviour (ICAPS): concept and 6-month results. Int J Obes Suppl 2004; 28: 96-103.
18. Skinner CS, Campbell MK, Rimer BK, et al. How effective is tailored print communication? Ann Behav Med 1999; 21: 290-298.
19. Frenn M, Malin S, Brown RL, et al. Changing the tide: an Internet/video exercise and low-fat diet intervention with middle school students. Appl Nurs Res 2005; 18: 13-21.
20. Patrick K, Calfas KJ, Norman GJ, et al. Randomized controlled trial of primary care and home-based intervention for physical activity and nutrition behaviours. Arch Pediatr Adolesc Med 2006; 160: 128-136.
21. Philippaerts RM, Matton L, Wijndaele K, et al. Validity of a physical activity computer questionnaire in 12- to 18 year old boys and girls. Int J Sports Med 2006; 27: 131-136.
22. Hollingshead AB, ed. Two-factor index of social position. New Haven, CT Yale, University Press, 1957.
23. Ainsworth BE, Haskell WL, Whitt MC, et al. Compendium of physical activities: an update of activity codes and MET intensities. Med Sci Sports Exerc Suppl 2000; 32: 498-516.
24. Puyau MR, Adolph AL, Vohra FA, et al. Validation and calibration of physical activity monitors in children. Obes Res 2002; 10:150-157.
25. Janz KF. Validation of the CSA accelerometer for assessing children’s physical activity. Med Sci Sports Exerc 1994; 26: 369-375.
26. Trost SG, Ward DS, Moorehead SM, et al. Validity of the computer science and applications (CSA) activity monitor in children. Med Sci Sports Exerc 1998; 30: 629-633.
Chapter 2.2 Original Research
125
27. Freedson PS, Pober D, Janz K. Calibration of accelerometer output for children. Med Sci Sports Exerc 2005; 37/11: 523-530.
28. Ward DS, Evenson K, Vaughn A, et al. Accelerometer use in physical activity: best practices and research recommendations. Med Sci Sports Exerc Suppl 2005; 37/11: 582-588.
29. Haerens L, Deforche B, Maes L, et al. Body mass effects of a physical activity and healthy food intervention in middle schools. Obes Res 2006, 14/5: 847-854.
30. Vandelanotte C, De Bourdeaudhuij I. Acceptability and feasibility of a computer-tailored physical activity intervention using stages of change: project FAITH. Health Educ Res 2003; 18: 304-317.
31. Thalheimer W, Cook S. How to calculate effect sizes from published research articles: A simplified methodology [online]. Available at: http://work-learning.com/effect_sizes.htm. Accessed September 15, 2006.
32. Cohen J, ed. Statistical power for the behavioral sciences. Hillsdale, NJ, Erlbaum, 1988.
33. Eccles JS, Harold RD. Parent-School Involvement during the early adolescent years. Teach Coll Rec1993; 94: 568-587.
34. Paulson SE, Sputa CL. Patterns of parenting during adolescence: perceptions of adolescents and parents. Adolescence 1996; 31: 369-381.
35. Nader PR, Sallis JF, Abramson IS, et al.: Family-based cardiovascular risk reduction education among Mexican- and Anglo-Americans. Family and Community Health. 1992, 15/1:57-74.

126
Leen Haerens, Benedicte Deforche, Lea Maes, Greet Cardon, Veerle Stevens, Ilse De
Bourdeaudhuij
Health Education Research 2006 21(6):911-921.
CHAPTER 2.3
EVALUATION OF A TWO-YEAR PHYSICAL ACTIVITY AND HEALTHY
EATING INTERVENTION IN MIDDLE SCHOOL CHILDREN
Chapter 2.3 Original Research
128
Evaluation of a 2-year physical activity and healthyeating intervention in middle school children
Leen Haerens1*, Benedicte Deforche1, Lea Maes2, Greet Cardon1,Veerle Stevens3 and Ilse De Bourdeaudhuij1
Abstract
The aim of the present study was to evaluate theeffects of a middle school physical activity andhealthy eating intervention, including an envi-ronmental and computer-tailored component,and to investigate the effects of parental in-volvement. A random sample of 15 schools withseventh and eight graders was randomly as-signed to one of three conditions: (i) interven-tion with parental involvement, (ii) interventionalone and (iii) control group. In 10 schools, anintervention, combining environmental changeswith computer-tailored feedback, was imple-mented over 2 school years. In five interventionschools, increased parental support was added.Physical activity was measured with ques-tionnaires in the total sample and with accel-erometers in a sub-sample of children. Fatintake, fruit, water and soft drink consumptionwere measured using food-frequency question-naires. Results showed significant positive in-tervention effects on physical activity in bothgenders and on fat intake in girls. Parentalinvolvement did not increase intervention ef-fects. It can be concluded that physical activityand eating behaviours of middle school childrencan be improved by school-based strategies
combining environmental and personal inter-ventions. The use of personalized computer-tailored interventions seems to be a promisingtool for targeting adolescents but needs to befurther explored.
Introduction
Overweight and obesity among children and ado-
lescents has increased alarmingly and has become
a serious public health problem [1]. Factors nega-
tively affecting the energy balance, such as low
levels of physical activity [2] and unhealthy eating
behaviours [3], are associated with a higher prev-
alence of overweight or obesity. Therefore, there is
a need for effective intervention programmes pro-
moting physical activity and healthy eating in
children and adolescents.
Children and adolescents spend high amounts of
time at school and the school environment is
recognized as having a powerful influence on their
physical activity [4, 5] and eating [6, 7] behaviours.
Through schools, a direct link can also be estab-
lished with the home environment. Parental influ-
ences are important determinants of adolescents’
physical activity behaviours [8–10] and their con-
sumption of healthy food products [11].
To date, many interventions have been delivered
through elementary schools [2, 12] and only few
through middle schools. In these studies the surplus
effects of involving the parents have not been
investigated [12]. However, declines in physical
activity and unhealthy eating patterns are especially
clear during adolescence and are likely to persist
into adulthood [13–16].
1Department of Movement and Sports Sciences and2Department of Public Health, Ghent University,
Watersportlaan 2, 9000 Ghent, Belgium and 3Flemish
Institute For Health Promotion, 1020 Brussels, Belgium
*Correspondence to: L. Haerens.
E-mail: [email protected]
HEALTH EDUCATION RESEARCH Vol.21 no.6 2006
Theory & Practice Pages 911–921
Advance Access publication 10 October 2006
� The Author 2006. Published by Oxford University Press. All rights reserved.For permissions, please email: [email protected]
doi:10.1093/her/cyl115
Chapter 2.3 Original Research
129
The health education programme ‘Planet
Health’, a 2-year intervention targeting both phys-
ical activity and healthy eating in middle school
children, was not effective in increasing physical
activity in boys and girls. However, this programme
was effective in increasing fruit and vegetable
consumption in girls, but not in boys [17]. M-
span was aimed at increasing physical activity and
increasing lower fat food choices by using envi-
ronmental, policy and social interventions [18].
This intervention resulted in increased physical
activity in boys, but no effects on fat intake at
school were found [18].
The present intervention was unique in com-
bining changes in the school environment with
education through interactive computer-tailored
feedback. Computer-tailored feedback is a new
health education strategy and was found to be
effective in increasing physical activity and de-
creasing fat intake in adults [19]. Additionally, one
study in middle school pupils already demonstrated
the positive effects of an Internet/video-tailored
intervention for increasing physical activity and
decreasing fat intake [20]. Due to the increased
personal relevance of tailored feedback, these
interventions are supposed to be more effective
than general classroom curricula.
The purpose of this study was to evaluate the 2-
year effects of an intervention, targeting physical
activity and healthy eating in middle schools. The
intervention was designed in such a way that later
implementation in all Flemish schools would be
feasible. This implicates that the intervention was
designed to be implemented by the school staff
themselves without external financial, material or
organizational support. However, during the first
intervention year, guidance and support was pro-
vided to help schools getting started. The results
after the first intervention year were promising with
increased physical activity levels in both boys and
girls (L. Haerens, B. Deforche, L. Maes et al., inpreparation) and decreased fat intake in girls [21].
The second year of intervention was aimed at
continuation, external guidance was minimized
and schools had to implement the intervention
topics independently. Therefore, it was hypothe-
sized that the second intervention year per se wouldnot lead to additional intervention effects but that
positive intervention effects found after 1 year of
intervention would be maintained after 2 years of
intervention. Additionally, it was hypothesized that
involvement of the parents would remain important
for intervention effects on fat intake in girls, as was
found after 1 year of intervention.
Methods
Procedure and sample
A random sample of 15 schools out of the 65
schools with technical and vocational education in
West Flanders (Belgium) was selected to participate
in this study. The 15 schools were randomly
assigned to one of the intervention or control
conditions: intervention with parental involvement
(n = 5, 1226 pupils), intervention alone (n = 5, 1006
pupils) and control condition (n = 5, 759 pupils).
The parents of 2840 (95%) of the 2991 pupils in
seventh and eight grades signed an informed
consent in which authorization was provided for
their child to complete measurements. Data of 704
children were lost through follow-up due to absence
at measurements, children changing school or
questionnaires filled out inaccurately. Table I
presents the baseline and follow-up data of the
sample.
From each of the 15 schools, one class of seventh
graders was randomly selected for more in-depth
measurement of physical activity with accelerom-
eters. This resulted in a sub-sample of 258 children.
The study protocol was approved by the Ethical
Committee of the Ghent University.
Measurements
Measures were assessed at the beginning of the first
school year (Pre-test: September 2003), assessed at
the end of the first school year (Post 1: May–June
2004) and repeated at the end of the second school
year (Post 2: May–June 2005). All measurements
took place at school and questionnaires were filled
out under supervision of teachers.
L. Haerens et al.
912
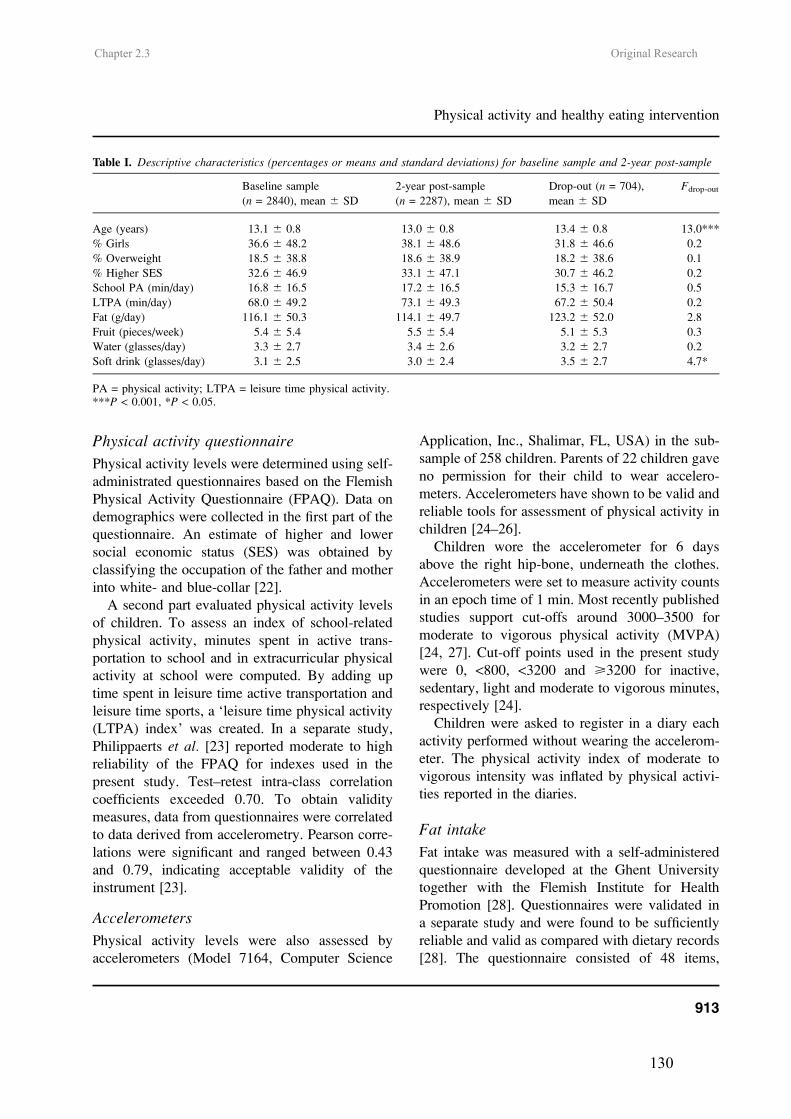
Chapter 2.3 Original Research
130
Physical activity questionnaire
Physical activity levels were determined using self-
administrated questionnaires based on the Flemish
Physical Activity Questionnaire (FPAQ). Data on
demographics were collected in the first part of the
questionnaire. An estimate of higher and lower
social economic status (SES) was obtained by
classifying the occupation of the father and mother
into white- and blue-collar [22].
A second part evaluated physical activity levels
of children. To assess an index of school-related
physical activity, minutes spent in active trans-
portation to school and in extracurricular physical
activity at school were computed. By adding up
time spent in leisure time active transportation and
leisure time sports, a ‘leisure time physical activity
(LTPA) index’ was created. In a separate study,
Philippaerts et al. [23] reported moderate to high
reliability of the FPAQ for indexes used in the
present study. Test–retest intra-class correlation
coefficients exceeded 0.70. To obtain validity
measures, data from questionnaires were correlated
to data derived from accelerometry. Pearson corre-
lations were significant and ranged between 0.43
and 0.79, indicating acceptable validity of the
instrument [23].
Accelerometers
Physical activity levels were also assessed by
accelerometers (Model 7164, Computer Science
Application, Inc., Shalimar, FL, USA) in the sub-
sample of 258 children. Parents of 22 children gave
no permission for their child to wear accelero-
meters. Accelerometers have shown to be valid and
reliable tools for assessment of physical activity in
children [24–26].
Children wore the accelerometer for 6 days
above the right hip-bone, underneath the clothes.
Accelerometers were set to measure activity counts
in an epoch time of 1 min. Most recently published
studies support cut-offs around 3000–3500 for
moderate to vigorous physical activity (MVPA)
[24, 27]. Cut-off points used in the present study
were 0, <800, <3200 and >3200 for inactive,
sedentary, light and moderate to vigorous minutes,
respectively [24].
Children were asked to register in a diary each
activity performed without wearing the accelerom-
eter. The physical activity index of moderate to
vigorous intensity was inflated by physical activi-
ties reported in the diaries.
Fat intake
Fat intake was measured with a self-administered
questionnaire developed at the Ghent University
together with the Flemish Institute for Health
Promotion [28]. Questionnaires were validated in
a separate study and were found to be sufficiently
reliable and valid as compared with dietary records
[28]. The questionnaire consisted of 48 items,
Table I. Descriptive characteristics (percentages or means and standard deviations) for baseline sample and 2-year post-sample
Baseline sample
(n = 2840), mean 6 SD
2-year post-sample
(n = 2287), mean 6 SD
Drop-out (n = 704),
mean 6 SD
Fdrop-out
Age (years) 13.1 6 0.8 13.0 6 0.8 13.4 6 0.8 13.0***
% Girls 36.6 6 48.2 38.1 6 48.6 31.8 6 46.6 0.2
% Overweight 18.5 6 38.8 18.6 6 38.9 18.2 6 38.6 0.1
% Higher SES 32.6 6 46.9 33.1 6 47.1 30.7 6 46.2 0.2
School PA (min/day) 16.8 6 16.5 17.2 6 16.5 15.3 6 16.7 0.5
LTPA (min/day) 68.0 6 49.2 73.1 6 49.3 67.2 6 50.4 0.2
Fat (g/day) 116.1 6 50.3 114.1 6 49.7 123.2 6 52.0 2.8
Fruit (pieces/week) 5.4 6 5.4 5.5 6 5.4 5.1 6 5.3 0.3
Water (glasses/day) 3.3 6 2.7 3.4 6 2.6 3.2 6 2.7 0.2
Soft drink (glasses/day) 3.1 6 2.5 3.0 6 2.4 3.5 6 2.7 4.7*
PA = physical activity; LTPA = leisure time physical activity.***P < 0.001, *P < 0.05.
Physical activity and healthy eating intervention
913
Chapter 2.3 Original Research
131
representing all important sources of fat in the
Belgian diet. Pupils were asked how often they
consumed these products during usual days, weeks
or months. A coefficient was calculated, represent-
ing fat content and portion size of each product.
This coefficient was multiplied by the frequency of
consumption, leading to fat intake score for each
food item. Summation of all food items’ fat intake
scores lead to the total fat intake score and this was
expressed in percent energy from fat [28].
Fruit, water and soft drinks
Food-frequency questionnaires adapted from the
validated questionnaire used in the Health Behav-
iour in School-aged Children study [29] were used
to assess fruit, water and soft drink consumption.
Intervention
A school-based intervention programme to promote
healthy food and physical activity over 2 school
years (October 2003–June 2005) was developed.
The intervention was designed to be implemented
by the school staff itself with only minimal external
support to make later implementation in all Flemish
schools feasible. During the first intervention year,
schools were guided and supported by the research
staff to get started; during the second intervention
year, schools had to continue with implementation
more independently.
Work group
In each of the intervention schools, a work group
was set up. At the beginning of the first intervention
year, work group members received background
information and guidelines on how to address
intervention topics. An intervention manual and
educational material were made available. Every 3
months, a 1-hour work group meeting was planned
to evaluate implementation and plan further actions.
Physical activity
The physical activity intervention focused on in-
creasing levels of MVPA to at least 60 min a day
[30]. In the present study, schools were encouraged
to create more opportunities to be physically active
during breaks, at noon or during after school hours.
Schools were encouraged to vary content of
physical activities offered in order to reach all
pupils. Organization of non-competitive activities
was encouraged to increase engagement of less
talented children.
Additionally, extra sports materials were made
available. Every school received an intervention
box with sports materials like ropes, balls and beach
ball sets. Schools were encouraged to make these
sports materials available during breaks, at noon
and during after school hours. Schools were also
stimulated to encourage active transportation.
At the personal level, children received a physical
fitness test and an adaptation of the adult computer-
tailored intervention for physical activity [31]. The
physical fitness test took place once, at the begin-
ning of the second intervention year. During
classes, all children had to cycle for 10 min on
a computerized cycle ergometer. By means of
folders, information was given on their fitness
levels and possible ways to improve it.
By using CDs, the computer-tailored interven-
tion was completed once each school year during
one class hour. First children had to fill out
questions on the computer screen. The first part of
questions concerned demographic factors. The
second part consisted of a school-based adaptation
of the International Physical Activity Questionnaire
[31] to measure physical activity. Final questions
concerned psychosocial determinants of physical
activity behaviours. After completing all questions,
tailored feedback was displayed immediately on the
screen. First, a general introduction and normative
feedback was presented. Normative feedback re-
lated children’s activity levels to current physical
activity recommendations for adolescents [30].
Based on the theory of planned behaviour [32],
children got tailored feedback about their inten-
tions, attitudes, self-efficacy, social support, knowl-
edge, benefits and barriers related to physical
activity. The transtheoretical model [33] was used
for matching content and approach of this feedback
to the stages of changes in the same way as with the
adult version [31]. Overall, an active lifestyle and
participation in sports activities was promoted in an
advice of five to six pages. Children could either
L. Haerens et al.
914
Chapter 2.3 Original Research
132
save the advice on the computer or in some cases
immediately print feedback. Afterwards, they had
to complete a task with questions concerning their
advice.
Food
In the same way as in the physical activity in-
tervention, eating habits were targeted by both
environmental and personal approaches. The food
intervention focused on three behavioural changes:
(i) increasing fruit consumption to at least two
pieces a day, (ii) reducing soft drink consumption
and increasing water consumption to 1.5 l a day and
(iii) reducing fat intake. To facilitate fruit consump-
tion, schools were asked to sell fruit at school at
very low price or for free at least once a week. It
was also suggested to offer fruit for dessert during
lunch break. Furthermore, schools tried to promote
drinking water as opposed to soft drinks, by
offering it for free by means of drinking fountains
or at lower price than soft drinks in shops or
vending machines. Children received additional
information about health consequences of eating
fruit as opposed to snacks and of drinking water
rather than soft drinks by means of folders and
posters.
Every school year, children got an adaptation of
the adult computer-tailored intervention for fat
intake during one class hour [28]. Questionnaires
concerning demographics, fat intake [28], fruit
intake [29] and psychosocial determinants of fat
intake lead to a tailored fat advice and normative
feedback for fruit intake. In the same way as in the
physical activity advice, feedback was based on the
theory of planned behaviour [32] and the trans-
theoretical model [33].
Parent involvement
The goal of parent involvement was to create
a supportive environment for healthy behaviours
outside school. Schools were asked to invite parents
at school for an interactive meeting on healthy food,
physical activity and the relationship with over-
weight and health. Three times a year, information
on healthy food and physical activity was published
in school papers and newsletters for parents. In
addition, parents received a free CD with the adult
computer-tailored intervention for fat intake and
physical activity [28, 31] for use at home. Through
an informative folder, parents were informed that
their child completed the same computer-tailored
programme. They were asked to discuss results
together and to give their child support to create
a healthier lifestyle, if necessary.
Statistical analyses
Data were analysed using SPSS 12.0. Preliminary
analyses consisted of descriptive statistics of sam-
ple characteristics. Linear mixed models on base-
line demographics and behaviours were used to
conduct drop-out analyses with group (participating
and not participating at follow-up) entered as
a factor.
To assess effects of the second intervention year
per se, linear mixed models were applied on 2-year
post-measures of physical activity and eating
behaviours, co-varying for 1-year post-measurements
(Post 1–Post 2). To assess 2-year post-intervention
effects, linear mixed models were then repeated,
co-varying for pre-test values (Pre–Post 2). Since
1-year post-intervention effects showed clear gen-
der differences, all analyses were applied in boys
and girls separately. Condition (intervention–
control) was entered as a factor into the models.
Schools were nested within condition to take into
account possible school variance. All analyses were
adjusted for age and SES. To assess specific
differences in effects between intervention with
parental involvement and intervention without
parental involvement, linear mixed models analyses
were repeated. P values <0.05 were considered as
statistically significant.
Results
Sample characteristics and drop-outanalysis
Drop-out analyses comparing baseline demo-
graphic and behavioural characteristics of pupils
participating and not participating at follow-up
showed few significant differences (see Table I).
Physical activity and healthy eating intervention
915
Chapter 2.3 Original Research
133
Pupils not participating at follow-up were signifi-
cantly older and consumed significantly more soft
drinks then pupils participating at follow-up.
Intervention effects
Effects of the second intervention year (FPost 1–Post 2)on physical activity and eating behaviours are
presented in Table II for boys and Table III for
girls. No significant increase or decrease of the
intervention effects on physical activity and eating
behaviours was found as a result of the second
intervention year per se (FPost 1–Post 2). Further
analyses exploring effects of parental involvement
on fat intake in girls showed that there were no
significant differences between the intervention
with parental support and that without parental
support (F = 0.4, P = 0.6).
Two-year post-intervention effects (FPre–Post 2)
are also presented in Table II for boys and Table III
for girls. In boys, significant 2-year post-baseline
intervention effects on levels of physical activity,
but not on eating behaviours, were found. School-
related physical activity increased significantly
more in the intervention groups compared with
the control group (P < 0.05). Accelerometer data
revealed a trend for significant lower decreases in
physical activity of light intensity in the interven-
tion groups (�6 min/day) compared with the
control group (�39 min/day, P < 0.001). Where
time spent in MVPA remained stable in the in-
tervention group, it significantly decreased (�18
min/day) in the control group (P < 0.05).
In girls, significant 2-year post-baseline inter-
vention effects were found for both physical
activity and eating behaviours. In girls, the physical
activity intervention was effective in preventing
decreases in physical activity of light intensity.
Time spent in physical activity of light intensity
decreased significantly less in the intervention
groups (�2 min/day) compared with the control
group (�20 min/day, P < 0.05). Decreases in fat
intake and percent energy from fat were signifi-
cantly higher in the intervention groups (�20 g/
day) when compared with the control group (�10
g/day, P < 0.05). In the same line, percentage of
energy taken from fat significantly decreased with
9% in the intervention group and with 5% in the
control group (P < 0.001).
Discussion
The purpose of the present study was to evaluate 2-
year post-intervention effects of a middle school
physical activity and healthy eating intervention.
After 1 year of intervention, positive effects on
self-reported school-related physical activity and
physical activity measured with accelerometers
were found in both boys and girls (L. Haerens,
B. Deforche, L. Maes et al., in preparation) and in
girls fat intake was significantly decreased [21].
The goal of the second intervention year was the
continuation of initiatives which were implemented
during the first school year. During this second
year, more autonomy was given to the schools. This
increase in autonomy and decrease in external
guidance and support from research staff were
aimed at creating a ‘real-life situation’ in which
schools can take over the intervention themselves
after 1 year of support. Hence, it was hypothesized
that the second intervention year would not lead
to additional positive outcomes but we hoped that
positive intervention effects on physical activity
and fat intake would be sustained. In line with the
hypotheses, positive effects found after 1 year of
intervention were sustained after 2 years of in-
tervention and the second intervention year did not
result in an increase or decrease of intervention
effects.
After 2 years of intervention, positive effects on
physical activity levels measured with accelerom-
eters were found. The intervention remained effec-
tive in preventing decreases in physical activity of
light intensity in both genders. Even more impor-
tant is that positive effects on MVPA in boys
remained, since participation in MVPA is more
essential for improved health and weight control
[13]. In boys of the intervention group, participa-
tion in MVPA remained stable over 2 school years,
while in boys of the control group, time spent in
MVPA gradually decreased. Also in girls, time
spent in MVPA increased after 2 school years of
L. Haerens et al.
916
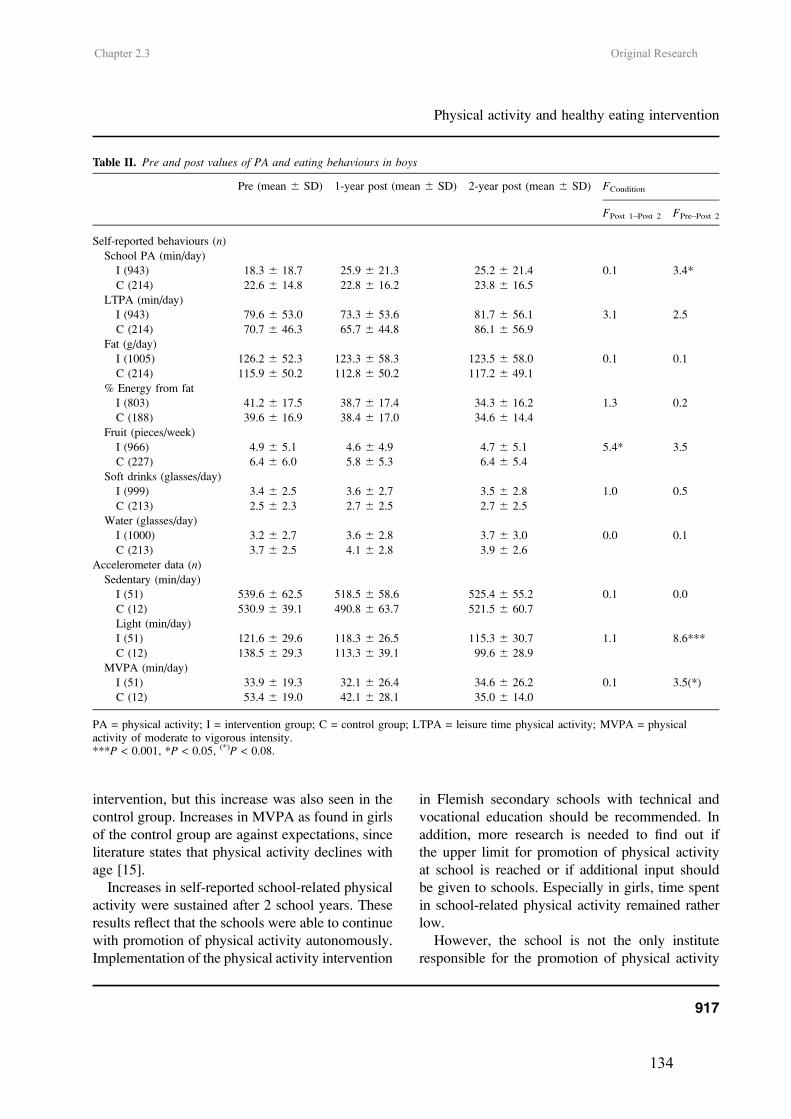
Chapter 2.3 Original Research
134
intervention, but this increase was also seen in the
control group. Increases in MVPA as found in girls
of the control group are against expectations, since
literature states that physical activity declines with
age [15].
Increases in self-reported school-related physical
activity were sustained after 2 school years. These
results reflect that the schools were able to continue
with promotion of physical activity autonomously.
Implementation of the physical activity intervention
in Flemish secondary schools with technical and
vocational education should be recommended. In
addition, more research is needed to find out if
the upper limit for promotion of physical activity
at school is reached or if additional input should
be given to schools. Especially in girls, time spent
in school-related physical activity remained rather
low.
However, the school is not the only institute
responsible for the promotion of physical activity
Table II. Pre and post values of PA and eating behaviours in boys
Pre (mean 6 SD) 1-year post (mean 6 SD) 2-year post (mean 6 SD) FCondition
FPost 1–Post 2 FPre–Post 2
Self-reported behaviours (n)
School PA (min/day)
I (943) 18.3 6 18.7 25.9 6 21.3 25.2 6 21.4 0.1 3.4*
C (214) 22.6 6 14.8 22.8 6 16.2 23.8 6 16.5
LTPA (min/day)
I (943) 79.6 6 53.0 73.3 6 53.6 81.7 6 56.1 3.1 2.5
C (214) 70.7 6 46.3 65.7 6 44.8 86.1 6 56.9
Fat (g/day)
I (1005) 126.2 6 52.3 123.3 6 58.3 123.5 6 58.0 0.1 0.1
C (214) 115.9 6 50.2 112.8 6 50.2 117.2 6 49.1
% Energy from fat
I (803) 41.2 6 17.5 38.7 6 17.4 34.3 6 16.2 1.3 0.2
C (188) 39.6 6 16.9 38.4 6 17.0 34.6 6 14.4
Fruit (pieces/week)
I (966) 4.9 6 5.1 4.6 6 4.9 4.7 6 5.1 5.4* 3.5
C (227) 6.4 6 6.0 5.8 6 5.3 6.4 6 5.4
Soft drinks (glasses/day)
I (999) 3.4 6 2.5 3.6 6 2.7 3.5 6 2.8 1.0 0.5
C (213) 2.5 6 2.3 2.7 6 2.5 2.7 6 2.5
Water (glasses/day)
I (1000) 3.2 6 2.7 3.6 6 2.8 3.7 6 3.0 0.0 0.1
C (213) 3.7 6 2.5 4.1 6 2.8 3.9 6 2.6
Accelerometer data (n)
Sedentary (min/day)
I (51) 539.6 6 62.5 518.5 6 58.6 525.4 6 55.2 0.1 0.0
C (12) 530.9 6 39.1 490.8 6 63.7 521.5 6 60.7
Light (min/day)
I (51) 121.6 6 29.6 118.3 6 26.5 115.3 6 30.7 1.1 8.6***
C (12) 138.5 6 29.3 113.3 6 39.1 99.6 6 28.9
MVPA (min/day)
I (51) 33.9 6 19.3 32.1 6 26.4 34.6 6 26.2 0.1 3.5(*)
C (12) 53.4 6 19.0 42.1 6 28.1 35.0 6 14.0
PA = physical activity; I = intervention group; C = control group; LTPA = leisure time physical activity; MVPA = physicalactivity of moderate to vigorous intensity.***P < 0.001, *P < 0.05, (*)P < 0.08.
Physical activity and healthy eating intervention
917
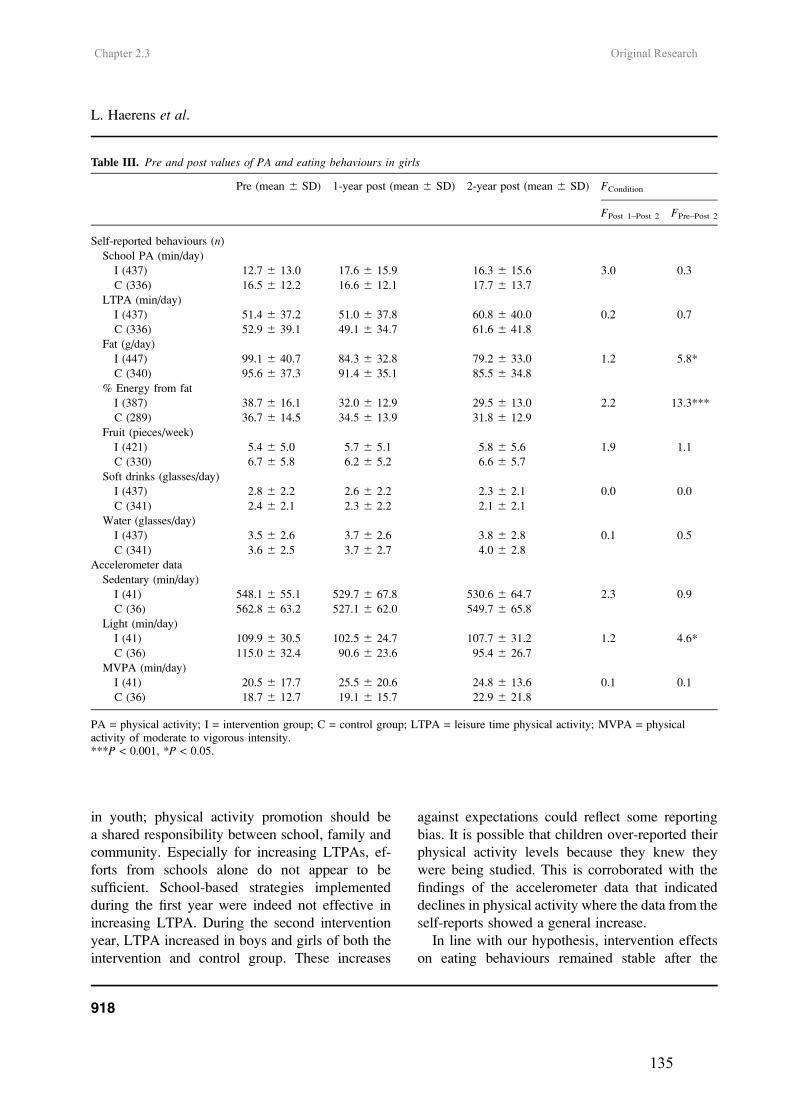
Chapter 2.3 Original Research
135
in youth; physical activity promotion should be
a shared responsibility between school, family and
community. Especially for increasing LTPAs, ef-
forts from schools alone do not appear to be
sufficient. School-based strategies implemented
during the first year were indeed not effective in
increasing LTPA. During the second intervention
year, LTPA increased in boys and girls of both the
intervention and control group. These increases
against expectations could reflect some reporting
bias. It is possible that children over-reported their
physical activity levels because they knew they
were being studied. This is corroborated with the
findings of the accelerometer data that indicated
declines in physical activity where the data from the
self-reports showed a general increase.
In line with our hypothesis, intervention effects
on eating behaviours remained stable after the
Table III. Pre and post values of PA and eating behaviours in girls
Pre (mean 6 SD) 1-year post (mean 6 SD) 2-year post (mean 6 SD) FCondition
FPost 1–Post 2 FPre–Post 2
Self-reported behaviours (n)
School PA (min/day)
I (437) 12.7 6 13.0 17.6 6 15.9 16.3 6 15.6 3.0 0.3
C (336) 16.5 6 12.2 16.6 6 12.1 17.7 6 13.7
LTPA (min/day)
I (437) 51.4 6 37.2 51.0 6 37.8 60.8 6 40.0 0.2 0.7
C (336) 52.9 6 39.1 49.1 6 34.7 61.6 6 41.8
Fat (g/day)
I (447) 99.1 6 40.7 84.3 6 32.8 79.2 6 33.0 1.2 5.8*
C (340) 95.6 6 37.3 91.4 6 35.1 85.5 6 34.8
% Energy from fat
I (387) 38.7 6 16.1 32.0 6 12.9 29.5 6 13.0 2.2 13.3***
C (289) 36.7 6 14.5 34.5 6 13.9 31.8 6 12.9
Fruit (pieces/week)
I (421) 5.4 6 5.0 5.7 6 5.1 5.8 6 5.6 1.9 1.1
C (330) 6.7 6 5.8 6.2 6 5.2 6.6 6 5.7
Soft drinks (glasses/day)
I (437) 2.8 6 2.2 2.6 6 2.2 2.3 6 2.1 0.0 0.0
C (341) 2.4 6 2.1 2.3 6 2.2 2.1 6 2.1
Water (glasses/day)
I (437) 3.5 6 2.6 3.7 6 2.6 3.8 6 2.8 0.1 0.5
C (341) 3.6 6 2.5 3.7 6 2.7 4.0 6 2.8
Accelerometer data
Sedentary (min/day)
I (41) 548.1 6 55.1 529.7 6 67.8 530.6 6 64.7 2.3 0.9
C (36) 562.8 6 63.2 527.1 6 62.0 549.7 6 65.8
Light (min/day)
I (41) 109.9 6 30.5 102.5 6 24.7 107.7 6 31.2 1.2 4.6*
C (36) 115.0 6 32.4 90.6 6 23.6 95.4 6 26.7
MVPA (min/day)
I (41) 20.5 6 17.7 25.5 6 20.6 24.8 6 13.6 0.1 0.1
C (36) 18.7 6 12.7 19.1 6 15.7 22.9 6 21.8
PA = physical activity; I = intervention group; C = control group; LTPA = leisure time physical activity; MVPA = physicalactivity of moderate to vigorous intensity.***P < 0.001, *P < 0.05.
L. Haerens et al.
918
Chapter 2.3 Original Research
136
second year of intervention. The intervention was
still not effective in decreasing fat intake in boys. In
both the intervention and control group, absolute fat
intake remained stable over 2 school years. De-
signing effective interventions to target fat intake
in boys is a challenge for the future.
In girls, positive 1-year post-intervention effects
on fat intake were sustained after 2 years of in-
tervention. During the second intervention year, fat
intake further decreased, and after 2 years of in-
tervention, mean fat intake decreased with an aver-
age decrease of 20 g/day. Fat intake decreased
with, on average, 10 g/day less in the control group.
Fat intake was the only eating behaviour that was
targeted by personalized computer-tailored feed-
back. It is therefore assumed that the personalized
computer-tailored feedback was an indispensable
intervention component for addressing fat intake in
girls. Computer-tailored interventions are easy to im-
plement: pupils can work through the programme
independently and no prior teacher training is re-
quired. Hence, investigating the independent effect
of the computer-tailored intervention is a priority for
future research.
There were no positive intervention effects on
fruit, soft drink and water consumption. These
findings were in line with expectations, since the
same intervention strategies used during the first
intervention year were maintained during the second
intervention year. Results suggests that creating
a real-life situation in which both unhealthy and
healthy alternatives are available is not sufficient to
promote the consumption of fruit and water. Pre-
vious studies indeed revealed that pupils are more
likely to consume soft drinks every day if soft drinks
are available at school [7]. Our experiences learned
that the huge incomes secondary schools receive
from shops and vending machines were used as a
motive for school boards to neglect the importance
of a healthy school environment. Governmental
laws restricting availability of unhealthy food prod-
ucts within school environments could be required
to create healthy school environments.
Next to the school, the home is a fundamental
part of adolescents’ living environment. Parents are
influencing adolescents’ physical activity and eating
behaviours considerably [9–11]. In the present study,
an extra intervention condition was created in which
home-based involvement of parents was aimed at.
During the first intervention year, parents received
a free CD with the adult computer-tailored interven-
tion for physical activity and fat intake to complete
at home. One-year post-results showed that parental
support was important to find decreases in fat intake
in girls. In contrast to the hypothesis, after 2 years
of intervention, fat intake decreased similarly in girls
of the intervention group with and without parental
support. The lack of process evaluation data on levels
of parental involvement, which is a limitation of
the present study, makes it hard to draw conclusions.
It is not clear whether there were no additional ef-
fects of increased parental support or whether par-
ental support was not sufficiently increased during
the second intervention year. The adult computer-
tailored intervention was provided during the first
intervention year, and during the second intervention
year, parents were only involved through correspon-
dence in school papers and newsletters.
Some additional study limitations need to be
addressed. After 2 school years, therewas a relatively
high percentage (25%) of drop-outs. However, these
drop-outs were not selective for this study, as all
students present at the moment of data gathering did
participate. Moreover, drop-outs did not differ from
follow-up participants for most baseline character-
istics: they were only somewhat older and consumed
more soft drinks at baseline. A second limitation is
the self-reported character of the measurements of
dietary intake and physical activity, resulting in
possible reporting errors [34]. Finally, in the present
study, effects of the whole-school intervention were
evaluated. Isolated effects of personalized tailored
interventions for physical activity and eating behav-
iours used in the present study were not yet docu-
mented in adolescents. Since it is assumed that the
computer-tailored feedback was an indispensable
part of the intervention certainly for fat intake, this is
a priority for future research.
Strengths of the present study are the randomized
controlled design and the fact that the intervention
was implemented by the school staff itself which
makes implementation in all Flemish schools feasible.
Physical activity and healthy eating intervention
919
Chapter 2.3 Original Research
137
In conclusion, physical activity and eating be-
haviours of middle school children can be improved
by school-based strategies combining environmen-
tal and personal interventions, implemented by the
school staff itself.
Acknowledgements
This study was supported by the Policy Research
Centre Sport, Physical Activity and Health funded
by the Flemish Government. The authors would
like to thank the 15 schools participating in this
study.
Conflict of interest statement
None declared.
References
1. Lobstein T, Frelut ML. Prevalence of overweight amongchildren in Europe. Obes Rev 2003; 4: 195–200.
2. Wareham JN, Van Sluijs EMF, Ekeleund U. Physicalactivity and obesity prevention: a review of the currentevidence. Proc Nutr Soc 2005; 64: 229–47.
3. Sun M, Schutz Y, Maffeis C. Substrate metabolism, nutrient
balance and obesity development in children and adoles-cents: a target for intervention? Obes Rev 2004; 5: 183–8.
4. Wechsler H, Devereaux RS, Davis M et al. Using the schoolenvironment to promote physical activity and healthy eating.
Prev Med 2000; 31: S121–37.5. Sallis JF, Conway TL, Prochaska JJ et al. The association of
school environments with youth physical activity. Am JPublic Health 2001; 91: 618–20.
6. Story M, Neumark-Sztainer D, French S. Individual and
environmental influences on adolescent eating behaviours.J Am Diet Assoc 2002; 102: S40–51.
7. Vereecken CA, Bobelijn K, Maes L. School food policy atprimary and secondary schools in Belgium-Flanders: does it
influence people’s food habits. Eur J Clin Nutr 2005; 59:271–7.
8. Sallis JF, Porchaska JJ, Taylor WC. A review of correlatesof physical activity of children and adolescents. Med SciSports Exerc 2000; 32: 963–75.
9. Davison KK, Cutting TM, Birch LL. Parents’ activity-related parenting practices predict girls’ physical activity.Med Sci Sports Exerc 2003; 35: 1589–95.
10. Trost SG, Sallis JF, Pate RR et al. Evaluating a model ofparental influence on youth physical activity. Am J Prev Med2003; 25: 277–82.
11. Hanson NI, Neumark-Sztainer D, Eisenberg ME et al.Associations between parental report of the home foodenvironment and adolescent intakes of fruits, vegetables anddairy foods. Public Health Nutr 2005; 8: 77–85.
12. Bautista-Castano I, Doreste J, Serra-Majm l. Effectiveness ofintervention in the prevention of childhood obesity. Eur JEpidemiol 2004; 19: 617–22.
13. Biddle SJH, Gorely T, Stensel D. Health-enhancing physicalactivity and sedentary behaviour in children and adolescents.J Sports Sci 2004; 22: 679–701.
14. Kelder SH, Perry CL, Klepp K-I et al. Longitudinaltracking of adolescent smoking, physical activity, and foodchoice behaviours. Am J Public Health 1994; 84: 1121–6.
15. Sallis JF. Age-related decline in physical activity: a synthesisof human and animal studies. Med Sci Sports Exerc 2000;23: 1598–600.
16. Lien N, Lytle LA, Klepp K-I. Stability in consumption offruit, vegetables and sugary food in a cohort from age 14 toage 21. Prev Med 2001; 33: 217–26.
17. Gortmaker SL, Peterson K, Wiecha J. Reducing obesity viaa school-based interdisciplinary intervention among youth.Arch Pediatr Adolesc Med 1999; 153: 409–18.
18. Sallis JF, McKenzie TL, Conway TL et al. Environmentalinterventions for eating and physical activity. A randomizedcontrolled trial in middle schools. Am J Prev Med 2003;24: 209–17.
19. Vandelanotte C, De Bourdeaudhuij I, Sa llis JF et al.Efficacy of sequential or simultaneous interactive com-puter-tailored interventions for increasing physical activityand decreasing fat intake. Ann Behav Med 2005; 29: 138–46.
20. Frenn M, Malin S, Brown RL et al. Changing the tide:an Internet/video exercise and low-fat diet interventionwith middle school students. Appl Nurs Res 2005;18: 13–21.
21. Haerens L, De Bourdeaudhuij I, Maes L et al. The effects ofa middle school healthy eating intervention on adolescents’fat and fruit intake and soft-drink consumption. PublicHealth Nutr, in press.
22. Hollingshead AB. Two-factor index of social position. NewHaven, CT: Yale University Press, 1957.
23. Philippaerts RM, Matton L, Wijndaele K et al. Validityof a physical activity computer questionnaire in 12- to 18-year-old boys and girls. Int J Sports Med 2006; 27: 131–6.
24. Puyau MR, Adolph AL, Vohra FA et al. Validation andcalibration of physical activity monitors in children. ObesRes 2002; 10: 150–7.
25. Janz KF. Validation of the CSA accelerometer for assessingchildren’s physical activity. Med Sci Sports Exerc 1994; 26:369–75.
26. Trost SG, Ward DS, Moorehead SM et al. Validity of thecomputer science and applications (CSA) activity monitor inchildren. Med Sci Sports Exerc 1998; 30: 629–33.
27. Ward DS, Evenson KL, Vaughn A et al. Accelerometer usein physical activity: best practices and research recommen-dations. Med Sci Sports Exerc 2005; 37: S582–8.
28. Vandelanotte C, Matthys C, De Bourdeaudhuij I. Reliabilityand validity of a computerized questionnaire to measure fatintake in Belgium. Nutr Res 2004; 24: 621–31.
L. Haerens et al.
920
Chapter 2.3 Original Research
138
29. Vereecken CA, Maes L. A Belgian study on the reliability
and relative validity of the health behaviour in school-aged
children food-frequency questionnaire. Public Health Nutr2003; 6: 581–8.
30. Cavill NA, Biddle S, Sallis JF. Health enhancing physical
activity for young people: Statement of the United Kingdom
Expert Consensus Conference. Pediatr Exerc Sci 2001; 13:
12–25.31. Vandelanotte C, De Bourdeaudhuij I. Acceptability and
feasibility of a computer-tailored physical activity interven-
tion using stages of change: project FAITH. Health Educ
Res 2003; 18: 304–17.
32. Ajzen I. From intentions to actions: a theory of planned
behavior. In: Kuhl J, Beckman J (eds). Action-Control:
From Cognition to Behaviour. Heidelberg, Germany:
Springer, 1985, 11–39.33. Prochaska JO, DiClimente CC, Norcross JC. In search how
people change. Applications to addictive behaviours. Am
Psychol 1992; 47: 1102–14.34. Livingstone MB, Robson PJ, Wallace JM. Issues in dietary
intake assessment of children and adolescents. Br J Nutr
2004; 92(Suppl. 2): S213–22.
Received on February 13, 2006; accepted on August 24, 2006
Physical activity and healthy eating intervention
921
Leen Haerens, Benedicte Deforche, Lea Maes, Veerle Stevens, Greet Cardon, Ilse De
Bourdeaudhuij
Obesity Research, 2006 14(5):847-854.
CHAPTER 2.4
BODY MASS EFFECTS OF A PHYSICAL ACTIVITY AND HEALTHY
FOOD INTERVENTION IN MIDDLE SCHOOLS
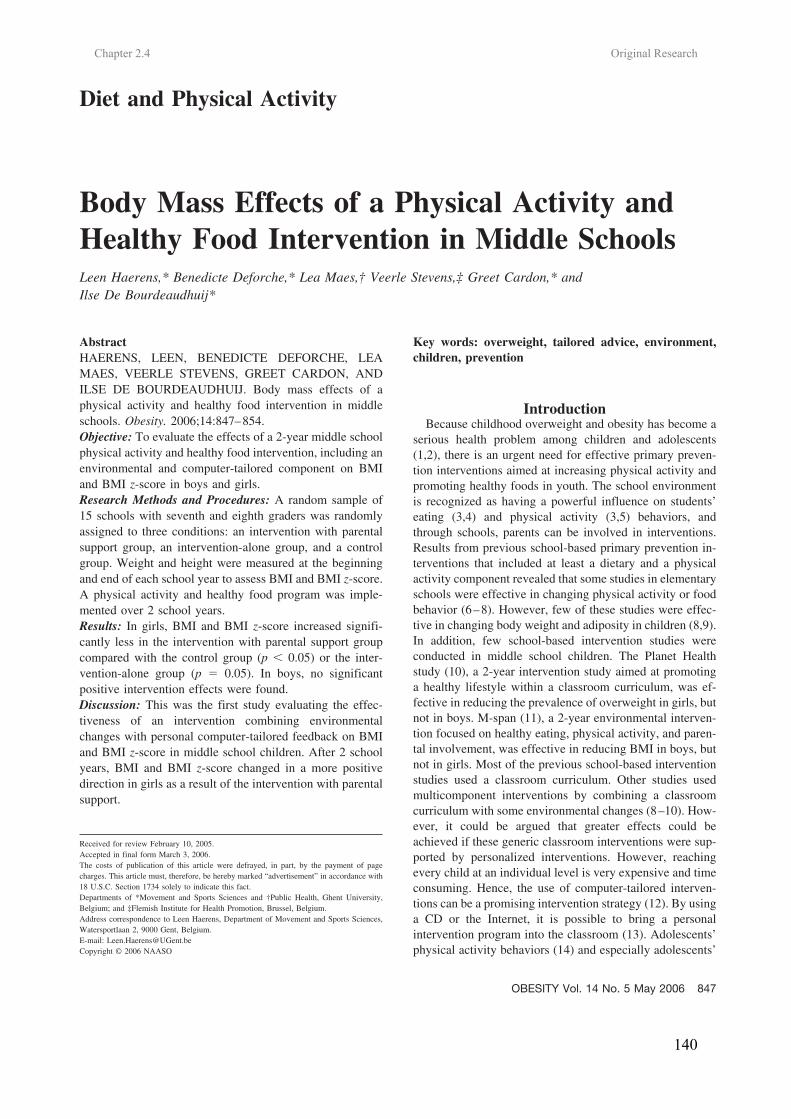
Chapter 2.4 Original Research
140
Diet and Physical Activity
Body Mass Effects of a Physical Activity andHealthy Food Intervention in Middle SchoolsLeen Haerens,* Benedicte Deforche,* Lea Maes,† Veerle Stevens,‡ Greet Cardon,* andIlse De Bourdeaudhuij*
AbstractHAERENS, LEEN, BENEDICTE DEFORCHE, LEAMAES, VEERLE STEVENS, GREET CARDON, ANDILSE DE BOURDEAUDHUIJ. Body mass effects of aphysical activity and healthy food intervention in middleschools. Obesity. 2006;14:847–854.Objective: To evaluate the effects of a 2-year middle schoolphysical activity and healthy food intervention, including anenvironmental and computer-tailored component on BMIand BMI z-score in boys and girls.Research Methods and Procedures: A random sample of15 schools with seventh and eighth graders was randomlyassigned to three conditions: an intervention with parentalsupport group, an intervention-alone group, and a controlgroup. Weight and height were measured at the beginningand end of each school year to assess BMI and BMI z-score.A physical activity and healthy food program was imple-mented over 2 school years.Results: In girls, BMI and BMI z-score increased signifi-cantly less in the intervention with parental support groupcompared with the control group (p � 0.05) or the inter-vention-alone group (p � 0.05). In boys, no significantpositive intervention effects were found.Discussion: This was the first study evaluating the effec-tiveness of an intervention combining environmentalchanges with personal computer-tailored feedback on BMIand BMI z-score in middle school children. After 2 schoolyears, BMI and BMI z-score changed in a more positivedirection in girls as a result of the intervention with parentalsupport.
Key words: overweight, tailored advice, environment,children, prevention
IntroductionBecause childhood overweight and obesity has become a
serious health problem among children and adolescents(1,2), there is an urgent need for effective primary preven-tion interventions aimed at increasing physical activity andpromoting healthy foods in youth. The school environmentis recognized as having a powerful influence on students’eating (3,4) and physical activity (3,5) behaviors, andthrough schools, parents can be involved in interventions.Results from previous school-based primary prevention in-terventions that included at least a dietary and a physicalactivity component revealed that some studies in elementaryschools were effective in changing physical activity or foodbehavior (6–8). However, few of these studies were effec-tive in changing body weight and adiposity in children (8,9).In addition, few school-based intervention studies wereconducted in middle school children. The Planet Healthstudy (10), a 2-year intervention study aimed at promotinga healthy lifestyle within a classroom curriculum, was ef-fective in reducing the prevalence of overweight in girls, butnot in boys. M-span (11), a 2-year environmental interven-tion focused on healthy eating, physical activity, and paren-tal involvement, was effective in reducing BMI in boys, butnot in girls. Most of the previous school-based interventionstudies used a classroom curriculum. Other studies usedmulticomponent interventions by combining a classroomcurriculum with some environmental changes (8–10). How-ever, it could be argued that greater effects could beachieved if these generic classroom interventions were sup-ported by personalized interventions. However, reachingevery child at an individual level is very expensive and timeconsuming. Hence, the use of computer-tailored interven-tions can be a promising intervention strategy (12). By usinga CD or the Internet, it is possible to bring a personalintervention program into the classroom (13). Adolescents’physical activity behaviors (14) and especially adolescents’
Received for review February 10, 2005.Accepted in final form March 3, 2006.The costs of publication of this article were defrayed, in part, by the payment of pagecharges. This article must, therefore, be hereby marked “advertisement” in accordance with18 U.S.C. Section 1734 solely to indicate this fact.Departments of *Movement and Sports Sciences and †Public Health, Ghent University,Belgium; and ‡Flemish Institute for Health Promotion, Brussel, Belgium.Address correspondence to Leen Haerens, Department of Movement and Sports Sciences,Watersportlaan 2, 9000 Gent, Belgium.E-mail: [email protected] © 2006 NAASO
OBESITY Vol. 14 No. 5 May 2006 847
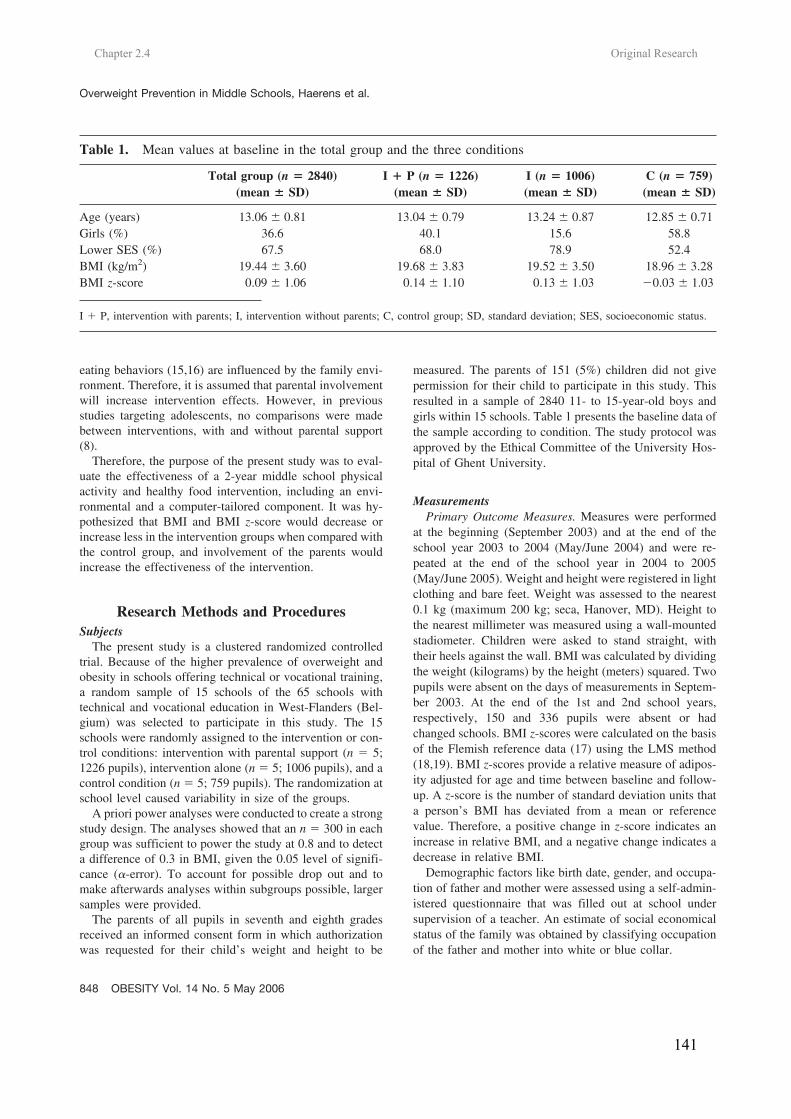
Chapter 2.4 Original Research
141
eating behaviors (15,16) are influenced by the family envi-ronment. Therefore, it is assumed that parental involvementwill increase intervention effects. However, in previousstudies targeting adolescents, no comparisons were madebetween interventions, with and without parental support(8).
Therefore, the purpose of the present study was to eval-uate the effectiveness of a 2-year middle school physicalactivity and healthy food intervention, including an envi-ronmental and a computer-tailored component. It was hy-pothesized that BMI and BMI z-score would decrease orincrease less in the intervention groups when compared withthe control group, and involvement of the parents wouldincrease the effectiveness of the intervention.
Research Methods and ProceduresSubjects
The present study is a clustered randomized controlledtrial. Because of the higher prevalence of overweight andobesity in schools offering technical or vocational training,a random sample of 15 schools of the 65 schools withtechnical and vocational education in West-Flanders (Bel-gium) was selected to participate in this study. The 15schools were randomly assigned to the intervention or con-trol conditions: intervention with parental support (n � 5;1226 pupils), intervention alone (n � 5; 1006 pupils), and acontrol condition (n � 5; 759 pupils). The randomization atschool level caused variability in size of the groups.
A priori power analyses were conducted to create a strongstudy design. The analyses showed that an n � 300 in eachgroup was sufficient to power the study at 0.8 and to detecta difference of 0.3 in BMI, given the 0.05 level of signifi-cance (�-error). To account for possible drop out and tomake afterwards analyses within subgroups possible, largersamples were provided.
The parents of all pupils in seventh and eighth gradesreceived an informed consent form in which authorizationwas requested for their child’s weight and height to be
measured. The parents of 151 (5%) children did not givepermission for their child to participate in this study. Thisresulted in a sample of 2840 11- to 15-year-old boys andgirls within 15 schools. Table 1 presents the baseline data ofthe sample according to condition. The study protocol wasapproved by the Ethical Committee of the University Hos-pital of Ghent University.
MeasurementsPrimary Outcome Measures. Measures were performed
at the beginning (September 2003) and at the end of theschool year 2003 to 2004 (May/June 2004) and were re-peated at the end of the school year in 2004 to 2005(May/June 2005). Weight and height were registered in lightclothing and bare feet. Weight was assessed to the nearest0.1 kg (maximum 200 kg; seca, Hanover, MD). Height tothe nearest millimeter was measured using a wall-mountedstadiometer. Children were asked to stand straight, withtheir heels against the wall. BMI was calculated by dividingthe weight (kilograms) by the height (meters) squared. Twopupils were absent on the days of measurements in Septem-ber 2003. At the end of the 1st and 2nd school years,respectively, 150 and 336 pupils were absent or hadchanged schools. BMI z-scores were calculated on the basisof the Flemish reference data (17) using the LMS method(18,19). BMI z-scores provide a relative measure of adipos-ity adjusted for age and time between baseline and follow-up. A z-score is the number of standard deviation units thata person’s BMI has deviated from a mean or referencevalue. Therefore, a positive change in z-score indicates anincrease in relative BMI, and a negative change indicates adecrease in relative BMI.
Demographic factors like birth date, gender, and occupa-tion of father and mother were assessed using a self-admin-istered questionnaire that was filled out at school undersupervision of a teacher. An estimate of social economicalstatus of the family was obtained by classifying occupationof the father and mother into white or blue collar.
Table 1. Mean values at baseline in the total group and the three conditions
Total group (n � 2840)(mean � SD)
I � P (n � 1226)(mean � SD)
I (n � 1006)(mean � SD)
C (n � 759)(mean � SD)
Age (years) 13.06 � 0.81 13.04 � 0.79 13.24 � 0.87 12.85 � 0.71Girls (%) 36.6 40.1 15.6 58.8Lower SES (%) 67.5 68.0 78.9 52.4BMI (kg/m2) 19.44 � 3.60 19.68 � 3.83 19.52 � 3.50 18.96 � 3.28BMI z-score 0.09 � 1.06 0.14 � 1.10 0.13 � 1.03 �0.03 � 1.03
I � P, intervention with parents; I, intervention without parents; C, control group; SD, standard deviation; SES, socioeconomic status.
Overweight Prevention in Middle Schools, Haerens et al.
848 OBESITY Vol. 14 No. 5 May 2006
Chapter 2.4 Original Research
142
Process Evaluation Measures. At the end of the 2-yearintervention period, one workgroup member from each in-tervention school completed a self-administered implemen-tation questionnaire. The questionnaire was aimed at gath-ering information about the level of implementation of theintervention. Teachers were asked to rate, on a five-pointscale, how much effort was made for each of the interven-tion issues (from nothing has been done to very much hasbeen done). Based on these ratings, a mean total implemen-tation score per school was calculated. Three schools werecategorized as schools with low levels of implementation(score � 3), four schools with medium levels of implemen-tation (3.0 � score � 3.5), and three schools had high levelsof implementation (scores � 3.5).
The InterventionA school-based intervention program to promote healthy
food and physical activity was developed to prevent theincreasing prevalence of overweight in children. In five ofthe 10 intervention schools, additional efforts were made toinvolve and inform parents. The intervention was imple-mented over 2 school years, beginning in October 2003 andending in June 2005. Because obesity has a multifactorialetiology (20), the program included environmental modifi-cations (3) and interventions on personal and social levelsrelated to food choices and physical activity behavior. Theaim of the intervention was to help children to create aphysically active lifestyle, together with a healthy diet.
WorkgroupIn each of the intervention schools, a workgroup was
created. The members of the workgroup received back-ground information and guidelines on how to address theintervention topics from the intervention staff. They re-ceived an intervention manual and educational material.Over the 2 school years, a total of 8 contact hours betweenworkgroup and research staff were achieved, starting withone meeting at the beginning of each school year and thenone meeting every 3 months. In those meetings, furtheractions were planned, and prior implementation was evalu-ated.
Physical ActivityThe physical activity environmental intervention focused
on increasing levels of moderate to vigorous physical ac-tivity to at least 60 min/d (21). Schools were encouraged tocreate more opportunities to be physically active duringbreaks, at noon, or after school hours. This resulted in aweekly organization of an average 4.7 (�2.66) hours ofextra physical activities.
Schools were encouraged to vary the content of thephysical activities offered to reach all pupils. The organi-zation of non-competitive activities was encouraged to in-
crease the engagement of less skilled children. On average,56% (18% to 100%) of all children participated in theseactivities.
Additionally, extra sports materials were made available.Every school received an intervention box with sports ma-terials such as ropes, Frisbees, balls, beach ball sets, etc.Sports materials were made available during breaks (1 of 10schools), at noon (6 of 10 schools), and during after schoolhours (3 of 10 schools). Schools were also asked to encour-age active participation.
Over the 2 school years, a total of 4 class hours was spenton the promotion of physical activity at the personal level.Children received a physical fitness test and a computer-tailored intervention for physical activity (22). Duringclasses, all children had to cycle for 10 minutes on acomputerized cycle ergometer. By means of a folder, infor-mation was given on their own physical fitness level andpossible ways to improve it. The computer-tailored inter-vention for physical activity was completed once eachschool year, during 1 class hour. First, children had to fillout questions on the computer screen. The first part of thesurvey concerned demographic factors. The second partconsisted of a school-based adaptation of the InternationalPhysical Activity Questionnaire (22) and was used to mea-sure physical activity. The final questions concerned psy-chosocial determinants of physical activity behavior. Aftercompleting all questions, tailored feedback was displayedimmediately on the screen. First, a general introduction andnormative feedback were presented. The normative feed-back related the children’s activity levels to the currentphysical activity recommendations (21). Based on the the-ory of planned behavior (23), children got tailored feedbackabout their intentions, attitudes, self-efficacy, social sup-port, knowledge, benefits, and barriers related to physicalactivity. For example, information was given on how to joina sports club, how to increase self-efficacy, and how toovercome their personal barriers associated with physicalactivity. The Transtheoretical Model (24) was used to matchcontent and approach of this feedback to the stages ofchanges. Pre-contemplators and contemplators receivedgeneral information. Children in the preparation stage re-ceived more specific information on physical activity andhealth and were motivated to become more active. In theaction stage, children were motivated to stay active, and inthe maintenance stage, children were told that they weredoing fine and should carry on with their healthy behavior.Overall, an active lifestyle and participation in sports activ-ities were promoted in an advice sheet of approximately fiveto six pages. Children could either save the advice on thecomputer or, in some cases, immediately print the feed-back. Afterwards, they had to complete a task with ques-tions concerning the advice. During the implementationof the physical activity intervention, schools were en-
Overweight Prevention in Middle Schools, Haerens et al.
OBESITY Vol. 14 No. 5 May 2006 849
Chapter 2.4 Original Research
143
couraged to organize extra supportive activities beyondthose planned in the intervention manual.
FoodThe food intervention focused on three behavioral
changes that were supported by environmental changes:increasing fruit consumption to at least two pieces a day,reducing soft drink consumption and increasing water con-sumption to 1.5 L/d, and reducing fat intake. To facilitatefruit consumption, schools were asked to sell fruit at schoolat very low prices or for free at least once a week. Onaverage, 69% (11% to 100%) of the pupils subscribed to theschool fruit program. It was also suggested to offer fruit asa dessert during lunch break. Schools tried to promotedrinking water by offering it for free or at a lower price thansoft drinks. All children received a free water can to makeit possible to bring water to school. Children received ad-ditional information through folders and posters about theimproved health consequences of eating fruit as opposed tosnacks and drinking water rather than soft drinks.
Over the 2 school years, a total of 2 class hours was spenton the promotion of healthy eating at the personal level.Every school year, children got the computer-tailored inter-vention for fat intake and fruit intake during 1 class hour(25). Questionnaires concerning demographics, fat intake(26), fruit intake (27), and psychosocial determinants offood choices lead to tailored fat and fruit advice. Aftercompleting the questionnaire, tailored feedback was dis-played immediately on the screen. Both the fat and the fruitadvice started with a general introduction, followed bynormative feedback, which related their intakes to the rec-ommended intakes. The fat advice indicated the sources offat in the diet and tips were given on how to replace fattyfoods. In the same way as in the physical activity advice,feedback was based on the Theory of Planned Behavior (23)and the Transtheoretical Model (24). Teachers were encour-aged to organize extra supportive activities like healthybreakfasts, an educational game concerning the food pyra-mid, and a poster design competition as suggested in theintervention manual.
Parent InvolvementThe goal of the parent involvement was to create a
supportive environment for healthy behaviors outsideschool. Schools were asked to set up an interactive meetingon healthy food, physical activity, and the relationship withoverweight and health. Three times a year, information onhealthy food and physical activity was published in theschool paper and newsletters for the parents. In addition, allparents received a free CD-ROM with the adult computer-tailored intervention for fat intake and physical activity(22,25) to complete at home. Through an informationfolder, parents were informed that their child accomplishedthe same computer-tailored program at school. They were
asked to discuss the results together and to give their childsupport to create a healthier lifestyle, if necessary.
Statistical AnalysesData were analyzed using the SPSS/PC statistical pro-
gram (version 12.0 for Windows; SPSS, Inc., Chicago, IL).Preliminary analyses consisted of descriptive statistics ofsample characteristics. �2 analyses were used to assess thedifferences in levels of implementation according to thepercentage of boys and girls in the schools. Linear mixedmodels on 1- and 2-year post-intervention values of weight,height, BMI, and BMI z-score, with condition and genderentered as factors, were used to evaluate the interventioneffects. School was nested within condition to take intoaccount school variance. Linear mixed models were alsoused to assess difference in increase in BMI z-score accord-ing to the levels of implementation in the 10 interventionschools. All analyses were adjusted for baseline values, age,and social economical status. Post hoc tests analyses wereconducted to determine differences in BMI (z-score)changes between the conditions. p � 0.05 was considered asstatistically significant.
ResultsPrimary Outcome Measures
For all analyses, variance at the school level was notsignificant (all z � 1.59). For the 1-year pre- to post-differences in BMI (F � 3.75, p � 0.05), the 2-year pre- topost-differences in BMI (F � 6.39, p � 0.01), and BMIz-score (F � 5.70, p � 0.01), a significant gender-by-condition interaction was found. Therefore, results are pre-sented separately in Table 2 for boys and in Table 3 forgirls. In boys, no significant positive intervention effectswere found. In girls, after 1 year of intervention, there wasa trend for a significant lower increase in BMI in theintervention with parental support group when comparedwith the control group (F � 3.04, p � 0.08). After 2 yearsof intervention, there was a significant lower increase inBMI (F � 12.52, p � 0.05) and BMI z-score (F � 8.61, p �0.05) in the intervention with parental support group whencompared with the control group. In addition, there was asignificantly lower increase in BMI z-score (F � 2.68, p �0.05) and a trend for a significantly lower increase in BMI(F � 3.42, p � 0.08) in the intervention with parentalsupport group when compared with the intervention-alonegroup.
Process MeasuresBMI z-score increased significantly more in schools with
low levels of implementation, when compared with schoolswith medium (F � 5.03, p � 0.05) and high (F � 2.80, p �0.05) levels of implementation. After 2 years of interven-tion, BMI z-score increased with 0.12 units in the schools
Overweight Prevention in Middle Schools, Haerens et al.
850 OBESITY Vol. 14 No. 5 May 2006
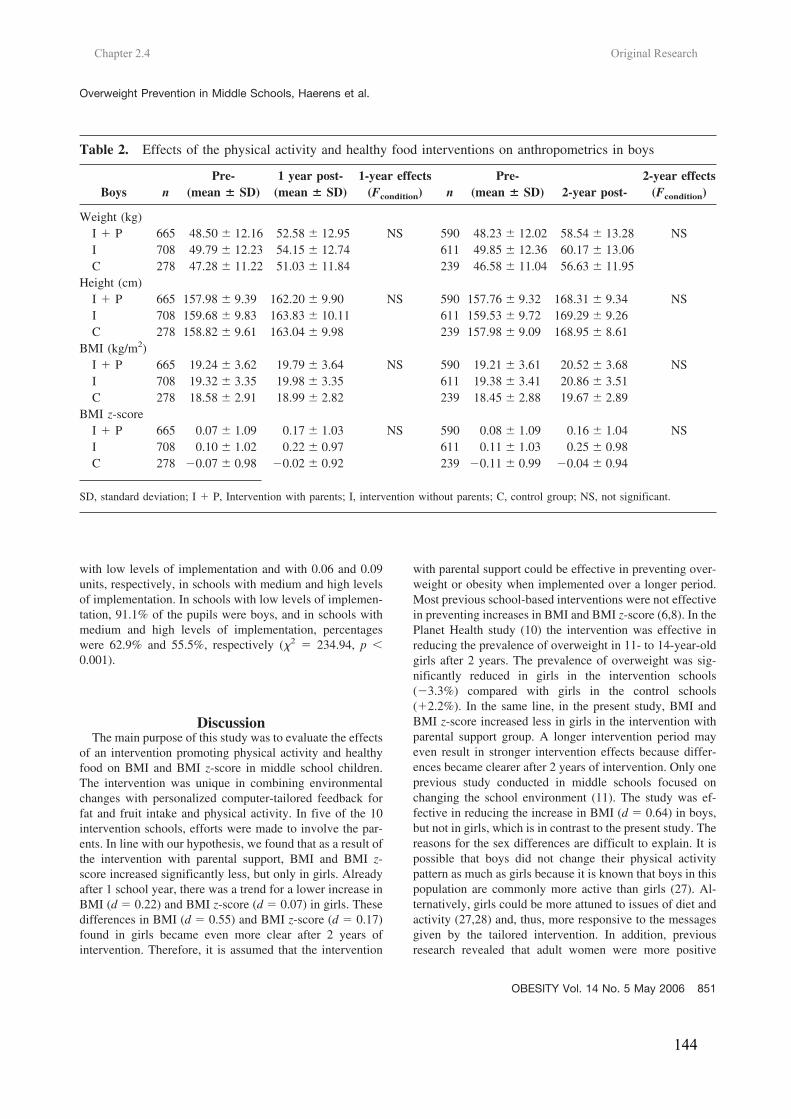
Chapter 2.4 Original Research
144
with low levels of implementation and with 0.06 and 0.09units, respectively, in schools with medium and high levelsof implementation. In schools with low levels of implemen-tation, 91.1% of the pupils were boys, and in schools withmedium and high levels of implementation, percentageswere 62.9% and 55.5%, respectively (�2 � 234.94, p �0.001).
DiscussionThe main purpose of this study was to evaluate the effects
of an intervention promoting physical activity and healthyfood on BMI and BMI z-score in middle school children.The intervention was unique in combining environmentalchanges with personalized computer-tailored feedback forfat and fruit intake and physical activity. In five of the 10intervention schools, efforts were made to involve the par-ents. In line with our hypothesis, we found that as a result ofthe intervention with parental support, BMI and BMI z-score increased significantly less, but only in girls. Alreadyafter 1 school year, there was a trend for a lower increase inBMI (d � 0.22) and BMI z-score (d � 0.07) in girls. Thesedifferences in BMI (d � 0.55) and BMI z-score (d � 0.17)found in girls became even more clear after 2 years ofintervention. Therefore, it is assumed that the intervention
with parental support could be effective in preventing over-weight or obesity when implemented over a longer period.Most previous school-based interventions were not effectivein preventing increases in BMI and BMI z-score (6,8). In thePlanet Health study (10) the intervention was effective inreducing the prevalence of overweight in 11- to 14-year-oldgirls after 2 years. The prevalence of overweight was sig-nificantly reduced in girls in the intervention schools(�3.3%) compared with girls in the control schools(�2.2%). In the same line, in the present study, BMI andBMI z-score increased less in girls in the intervention withparental support group. A longer intervention period mayeven result in stronger intervention effects because differ-ences became clearer after 2 years of intervention. Only oneprevious study conducted in middle schools focused onchanging the school environment (11). The study was ef-fective in reducing the increase in BMI (d � 0.64) in boys,but not in girls, which is in contrast to the present study. Thereasons for the sex differences are difficult to explain. It ispossible that boys did not change their physical activitypattern as much as girls because it is known that boys in thispopulation are commonly more active than girls (27). Al-ternatively, girls could be more attuned to issues of diet andactivity (27,28) and, thus, more responsive to the messagesgiven by the tailored intervention. In addition, previousresearch revealed that adult women were more positive
Table 2. Effects of the physical activity and healthy food interventions on anthropometrics in boys
Boys nPre-
(mean � SD)1 year post-
(mean � SD)1-year effects
(Fcondition) nPre-
(mean � SD) 2-year post-2-year effects
(Fcondition)
Weight (kg)I � P 665 48.50 � 12.16 52.58 � 12.95 NS 590 48.23 � 12.02 58.54 � 13.28 NSI 708 49.79 � 12.23 54.15 � 12.74 611 49.85 � 12.36 60.17 � 13.06C 278 47.28 � 11.22 51.03 � 11.84 239 46.58 � 11.04 56.63 � 11.95
Height (cm)I � P 665 157.98 � 9.39 162.20 � 9.90 NS 590 157.76 � 9.32 168.31 � 9.34 NSI 708 159.68 � 9.83 163.83 � 10.11 611 159.53 � 9.72 169.29 � 9.26C 278 158.82 � 9.61 163.04 � 9.98 239 157.98 � 9.09 168.95 � 8.61
BMI (kg/m2)I � P 665 19.24 � 3.62 19.79 � 3.64 NS 590 19.21 � 3.61 20.52 � 3.68 NSI 708 19.32 � 3.35 19.98 � 3.35 611 19.38 � 3.41 20.86 � 3.51C 278 18.58 � 2.91 18.99 � 2.82 239 18.45 � 2.88 19.67 � 2.89
BMI z-scoreI � P 665 0.07 � 1.09 0.17 � 1.03 NS 590 0.08 � 1.09 0.16 � 1.04 NSI 708 0.10 � 1.02 0.22 � 0.97 611 0.11 � 1.03 0.25 � 0.98C 278 �0.07 � 0.98 �0.02 � 0.92 239 �0.11 � 0.99 �0.04 � 0.94
SD, standard deviation; I � P, Intervention with parents; I, intervention without parents; C, control group; NS, not significant.
Overweight Prevention in Middle Schools, Haerens et al.
OBESITY Vol. 14 No. 5 May 2006 851
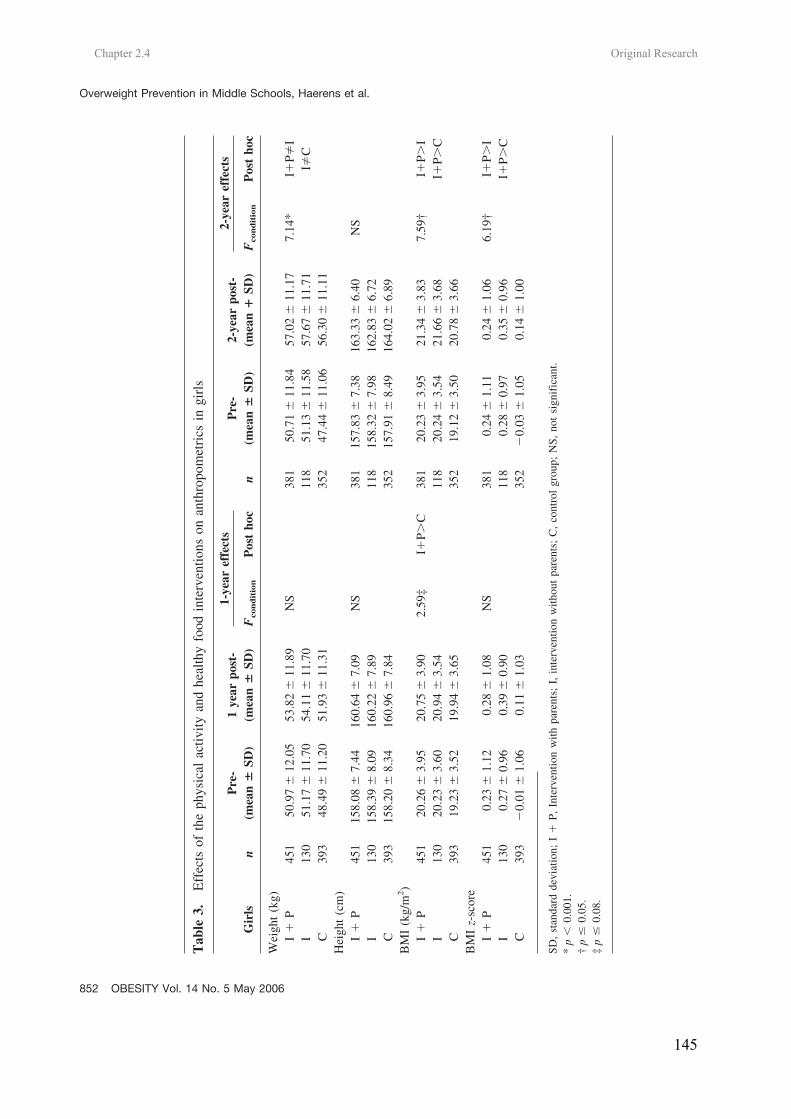
Chapter 2.4 Original Research
145
Tab
le3.
Eff
ects
ofth
eph
ysic
alac
tivity
and
heal
thy
food
inte
rven
tions
onan
thro
pom
etri
csin
girl
s
Gir
lsn
Pre
-(m
ean
�SD
)1
year
post
-(m
ean
�SD
)
1-ye
aref
fect
s
nP
re-
(mea
n�
SD)
2-ye
arpo
st-
(mea
n�
SD)
2-ye
aref
fect
s
Fco
nd
itio
nP
ost
hoc
Fco
nd
itio
nP
ost
hoc
Wei
ght
(kg)
I�
P45
150
.97
�12
.05
53.8
2�
11.8
9N
S38
150
.71
�11
.84
57.0
2�
11.1
77.
14*
I�P�
II
130
51.1
7�
11.7
054
.11
�11
.70
118
51.1
3�
11.5
857
.67
�11
.71
I�C
C39
348
.49
�11
.20
51.9
3�
11.3
135
247
.44
�11
.06
56.3
0�
11.1
1H
eigh
t(c
m)
I�
P45
115
8.08
�7.
4416
0.64
�7.
09N
S38
115
7.83
�7.
3816
3.33
�6.
40N
SI
130
158.
39�
8.09
160.
22�
7.89
118
158.
32�
7.98
162.
83�
6.72
C39
315
8.20
�8.
3416
0.96
�7.
8435
215
7.91
�8.
4916
4.02
�6.
89B
MI
(kg/
m2)
I�
P45
120
.26
�3.
9520
.75
�3.
902.
59‡
I�P�
C38
120
.23
�3.
9521
.34
�3.
837.
59†
I�P�
II
130
20.2
3�
3.60
20.9
4�
3.54
118
20.2
4�
3.54
21.6
6�
3.68
I�P�
CC
393
19.2
3�
3.52
19.9
4�
3.65
352
19.1
2�
3.50
20.7
8�
3.66
BM
Iz-
scor
eI
�P
451
0.23
�1.
120.
28�
1.08
NS
381
0.24
�1.
110.
24�
1.06
6.19
†I�
P�I
I13
00.
27�
0.96
0.39
�0.
9011
80.
28�
0.97
0.35
�0.
96I�
P�C
C39
3�
0.01
�1.
060.
11�
1.03
352
�0.
03�
1.05
0.14
�1.
00
SD,
stan
dard
devi
atio
n;I
�P,
Inte
rven
tion
with
pare
nts;
I,in
terv
entio
nw
ithou
tpa
rent
s;C
,co
ntro
lgr
oup;
NS,
not
sign
ific
ant.
*p
�0.
001.
†p
�0.
05.
‡p
�0.
08.
Overweight Prevention in Middle Schools, Haerens et al.
852 OBESITY Vol. 14 No. 5 May 2006
Chapter 2.4 Original Research
146
toward the interactive computer-tailored fat intake interven-tion compared with men (25). The differences betweensexes suggest that different causal factors may operateamong boys and girls. Additionally, data on process mea-sures revealed that BMI z-score increased significantly lessin schools with medium and high levels of implementation.In schools with medium to high levels of implementation,the percentage of boys was significantly lower than inschools with lower levels of implementation. Therefore, themoderating effect of sex may be a result of differences inlevels of implementation in typical boy- and girl-orientedschools. The intervention topics could, indeed, be moreclosely related to the curriculum in typical girl-orientedschools (offering education in nursing, cooking, etc.) than intypical boy-oriented schools (offering education in mechan-ics, engineering, etc.).
Parents are supposed to be important role models forhealth behaviors (14–16). However, in previous studiestargeting adolescents, no comparisons were made betweeninterventions with and without parental support (8). It isknown that parental involvement declines substantially aschildren move from elementary schools through middle andhigh schools (29), and it is often difficult to get parents toparticipate in meetings at school. In the present study,parents were involved at home through articles in schoolpapers and newsletters. Moreover, every parent received afree CD-ROM with the adult computer-tailored interventionfor physical activity and fat intake to complete at home.Results of the present study suggest that the involvement ofthe parents was necessary for the effectiveness of the inter-vention on adiposity indices in girls.
The present study is a clustered randomized controlledtrial, with a high participation rate (95%), that followedchildren for 2 school years. In this study, an objectiveweight-related outcome measure was included. To ourknowledge, this is the first study aimed at changing foodand physical activity behavior by changing the school en-vironment combined with the use of a computerized tailoredintervention that was effective in reducing the increase inBMI and BMI z-score in girls. Based on the results of thisstudy, we can conclude that environmental and personalinterventions to promote healthy food and physical activityin middle schools had a positive effect on adiposity indicesin girls, but not in boys. There was already a trend forsignificant intervention effects after 1 school year, and thesepositive effects became significant after 2 school years.Involvement and support of the parents was necessary to seeeffects in girls. Further studies are necessary to determinewhich components of the intervention are crucial in yieldingsignificant effects, although it is hypothesized that it is themulticomponent nature of the intervention that caused itseffectiveness. Designing interventions that are effective inboys is a challenge for the future.
AcknowledgmentsThis work was supported by the Policy Research Centre
Sport, Physical Activity, and Health funded by the FlemishGovernment.
References1. Reilly JJ, Dorotsy AR. Epidemic of obesity in UK children.
Lancet. 1999;354:1874–75.2. Strauss RS, Pollack HA. Epidemic increase in childhood
overweight, 1986–1998. JAMA. 2001;286:2845–8.3. Wechsler H, Devereaux RS, Davis M, Collins J. Using the
school environment to promote physical activity and healthyeating. Prev Med. 2000;31:S121–37.
4. Kubik MY, Lytle LA, Hannan PJ, Perry CL, Story M. Theassociation of the school food environment with dietary be-haviors of young adolescents. Am J Public Health. 2003;93:1168–73.
5. Sallis JF, Conway TL, Prochaska JJ, McKenzie TL, Mar-shall SJ, Brown M. The association of school environmentswith youth physical activity. Am J Public Health. 2001;91:618–20.
6. Fulton JE, McGuire MT, Caspersen CJ, Dietz WH. Inter-ventions for weight loss and weight gain prevention amongyouth. Sports Med. 2001;31:153–65.
7. Kahn EB, Ramsey LT, Brownson RC, et al. The effective-ness of interventions to increase physical activity. Am J PrevMed. 2002;22:73–107.
8. Bautista-Castano I, Doreste J, Serra-Majm l. Effectivenessof intervention in the prevention of childhood obesity. Eur JEpidemiol. 2004;19:617–22.
9. The International Association for the Study of Obesity.Comparison of controlled trials undertaken to prevent obesityamong children and adolescents. Obes Rev. 2004;5(Suppl1):98–104.
10. Gortmaker SL, Peterson K, Wiecha J. Reducing obesity viaa school-based interdisciplinary intervention among youth.Arch Pediatr Adolesc Med. 1999;153:409–18.
11. Sallis JF, McKenzie TL, Conway TL, et al. Environmentalinterventions for eating and physical activity: a randomizedcontrolled trial in middle schools. Am J Prev Med. 2003;24:209–17.
12. De Vries H, Brug J. Computer-tailored interventions moti-vating people to adopt health promoting behaviors: intro-duction to a new approach. Patient Educ Couns. 1999;36:99–105.
13. White MA, Martin PD, Newton RL. Mediators of weightloss in a family-based intervention presented over the internet.Obes Res. 2004;12:1050–9.
14. Sallis JF, Porchaska JJ, Taylor WC. A review of correlatesof physical activity of children and adolescents. Med SciSports Exerc. 2000;32:963–75.
15. Hanson NI, Neumark-Sztainer D, Eisenberg ME, Story M,Wall M. Associations between parental report of the homefood environment and adolescent intakes of fruits, vegetablesand dairy foods. Public Health Nutr. 2005;8:77–85.
Overweight Prevention in Middle Schools, Haerens et al.
OBESITY Vol. 14 No. 5 May 2006 853
Chapter 2.4 Original Research
147
16. De Bourdeaudhuij I. Perceived family members’ influenceon introducing healthy food into the family. Health Educ Res.1997;12:77–90.
17. Roelants M, Hauspie R. Growth Charts 2–20 Years,Flanders 2004. http://www.vub.ac.be/groeicurven (AccessedJuly 5, 2004).
18. Cole TJ. The LMS method for constructing normalizedgrowth standards. Eur J Clin Nutr. 1990;44:45–60.
19. Cole TJ, Green PJ. Smoothing reference centile curves: theLMS method and penalized likelihood. Stat Med. 1992;11:1305–19.
20. Baranowski T, Mendlein J, Resnicow K. Physical activityand nutrition in children and youth: an overview of obesityprevention. Prev Med. 2000;31:S1–10.
21. Cavill NA, Biddle S, Sallis JF. Health enhancing physicalactivity for young people: statement of the United KingdomExpert Consensus Conference. Pediatr Exerc Sci. 2001;13:12–25.
22. Vandelanotte C, De Bourdeaudhuij I. Acceptability andfeasibility of a computer-tailored physical activity interventionusing stages of change: project FAITH. Health Educ Res.2003;18:304–17.
23. Ajzen I. From intentions to actions: a theory of plannedbehavior. In: Kuhl J, Beckman J, ed. Action-Control: FromCognition to Behaviour. Heidelberg, Germany: Springer;1985, p. 11–39.
24. Prochaska JO, DiClimente CC, Norcross JC. In search howpeople change: applications to addictive behaviours. Am Psy-chol. 1992;47:1102–14.
25. Vandelanotte C, De Bourdeaudhuij I, Brug J. Acceptabilityand feasibility of an interactive computer-tailored fat intakeintervention in Belgium. Health Promot Int. 2004;19:463–70.
26. Vandelanotte C, Matthys C, De Bourdeaudhuij I. Reliabil-ity and validity of a computerized questionnaire to measure fatintake in Belgium. Nutr Res. 2004;24:621–31.
27. World Health Organization. Young people’s health in con-text. Health Behavior in School-Aged Children (HBSC) study:international report from 2001/2002 survey. Health PolicyChild Adolesc. 2004;4.
28. McVey G, Tweed S, Blackmore E. Correlates of weight lossand muscle-gaining behaviour in 10- to 14-year old males andfemales. Prev Med. 2005;40:1–9.
29. Eccles JS, Harold RD. Parent-School Involvement during theearly adolescent years. Teach Coll Rec. 1993;94:568–87.
Overweight Prevention in Middle Schools, Haerens et al.
854 OBESITY Vol. 14 No. 5 May 2006

148
Ilse De Bourdeaudhuij, Leen Haerens, Greet Cardon, Benedicte Deforche, Lea Maes
Public Health Nutrition, In revision.
CHAPTER 2.5
EXPLAINING THE EFFECT OF A 1-YEAR INTERVENTION
PROMOTING PHYSICAL ACTIVITY IN MIDDLE SCHOOLS: A
MEDIATION ANALYSIS
Chapter 2.5 Original Research
150
Explaining the effect of a 1-year intervention promoting physical activity in middle schools: a mediation analysis. Abstract Objective: The aim of the present study was to examine the mediation effect of changes in psychosocial determinants of physical activity (attitude, social support, self-efficacy, perceived benefits and barriers) on changes in physical activity. Design: One-year intervention study with baseline and one year post measures of physical activity habits and psychosocial correlates. Setting: 15 middle schools Subjects: 2840 11 to 15 year old boys and girls completed the validated questionnaires during class hours. Results: The Freedman-Schatzkin difference-in-coefficients test was used to asses the mediating effect. The first series of regressions showed that the intervention was effective on all 5 physical activity indexes (p<0.01). The second series of regressions revealed a significant mediation effect of self-efficacy (p>0.01) and of social support (p<0.01) for all physical activity indexes. As this mediation was partial, this means that the physical activity intervention resulted in a direct effect on physical activity patterns, as well as in an indirect effect through changing self-efficacy and social support. No mediation effect was found for affective attitudes, perceived benefits and perceived barriers. Even a suppressor effect was found for attitudes. Conclusions: Positive changes in physical activity in adolescents could partly be explained by increases in self-efficacy and social support through a physical activity intervention in middle schools. As this is one of the first true mediation analyses in this age group, further research is needed to replicate the importance of these mediators. Keywords: physical activity, adolescents, promotion, mediation, psycho-social correlates Introduction In all age groups health benefits of regular physical activity are well documented (1). Nevertheless a sedentary lifestyle among adolescents, adults and older persons is prevalent in almost all parts of the Western world (2, 3). Especially, in adolescence a steep decline in activity levels occurs (4). Therefore, adolescents seem to be an important group to promote maintenance of adequate physical activity levels or to encourage inactive adolescents to become more active. As interventions to encourage physical activity have to be based upon the most important processes or determinants of physical activity in adolescents, studying physical activity determinants in this age group is the first step to be taken. Most studies investigated these determinants
based on generic theories or models such as Operant and Social Learning Theories and social-psychological theories such as the Theory of Planned Behavior (5, 6). Results of these studies showed that physical activity in adolescence was best predicted by self-efficacy, attitudes or beliefs, family or friend support, and perceived benefits and barriers (7-9). Once there is enough knowledge on the determinants of physical activity in this age group, a second step can be taken: the development and evaluation of physical activity interventions. Till now, intervention studies promoting physical activity in adolescents are relatively scarce (10, 11). The school environment is often considered to be the ideal setting for implementing these interventions as all students can easily be
Chapter 2.5 Original Research
151
reached, education can be included in the regular curriculum and in physical education courses, and schools often have the facilities and accommodation to provide opportunities for adolescents to be physically active (12-14). In the US, two intervention studies promoting physical activity in middle schools were executed: the Planet Health Study (15) and the M-Span study (16). Results were mixed and often different for boys and girls. In Europe, good results were recently found in the ICAPS-study (Intervention Centered on Adolescents’ Physical activity and Sedentary behaviour) showing increases in activity levels in boys and girls in France (17). Positive results were also found in our own Belgian study, aimed at increasing activity levels in adolescents through middle schools (18). Results showed significant increases in physical activity levels in the intervention conditions, when compared to the control group in both boys and girls. All these interventions were developed based on health promotion planning models (19, 20). They are based on theories that assume that the intervention succeeds in changing physical activity behavior through changes in the theoretical constructs or the determinants that precede this behavior. However, this assumption is rarely tested. Very few studies already examined possible mediators in effective physical activity interventions (21). The question asked here is about the mechanisms underlying behavioral change: ‘how’ does the intervention work? From the review of Lewis et al. (22) on psychosocial mediators of physical activity behavior among adults and children, it was concluded that only 2 studies executed a complete mediator analyses, both were in adults. A possible explanation of this lack of studies is that a full mediation analysis can only be executed if a true control group is
available, if physical activity differences are found between the intervention and control groups, and if a prospective design is used (changes in mediators effect changes in outcome). All three requirements were met in our own Belgian intervention study in middle schools. By examining several potential mediators in this intervention study, we may learn which mediators are most effective for increasing physical activity in adolescents. In other words, it may clarify how the intervention worked but also it may reveal if the intervention was unsuccessful in changing potential important mediators of physical activity change. The aim of the present study was to examine mediation effects of changes in psychosocial determinants of physical activity (attitude, social support, self-efficacy, perceived benefits and barriers) on changes in physical activity, using a 1 year prospective intervention study in middle schools. As the intervention was developed to change all these underlying constructs, it was hypothesized that changes in these constructs would act as a mediator in predicting changes in physical activity from baseline to one year follow-up. Methods Procedure and participants In the present study a random sample of 15 schools out of the 65 Flemish schools with technical and vocational education in West-Flanders (Belgium) was selected. Principals of 23 schools were approached by telephone to obtain 15 who agreed to participate in the study. The 15 schools willing to participate were then randomly assigned to the intervention or control conditions, each with 5 schools: (a) Intervention with parental support, (b) intervention alone and (c) control condition. The parents of all 2991 students in seventh and eight grades received an
Chapter 2.5 Original Research
152
informed consent form in which the authorization was asked for their child to complete measurements. The parents of 151 (5%) students gave no permission for their child to participate in this study. This resulted in a sample of 2840 11 to 15 year old boys and girls within 15 schools. Power analyses showed that this sample was sufficiently large to power the study no less than .80 given the .05 level of significance. The Study protocol was approved by the Ethical Committee of Ghent University. A more detailed description of the sample and procedure was reported elsewhere (18, 23). Measures Measures were performed at the beginning (September 2003) and at the end of the school year (June 2004). Physical activity. Physical activity levels were determined, using a self-administrated questionnaire at school, based on the Flemish Physical Activity Questionnaire (FPAQ). This questionnaire asked for minutes of activity of different types (sports, transport) and within different contexts (leisure time, school). Five indexes were computed: two type dependent indexes (sport, transport), two context dependent indexes (leisure time, school) and a total physical activity index. The ‘sport index’ was computed summing time spent in sports at school and in leisure time. Based on the MET values from the Compendium of physical activity (24), each sport with a metabolic rate lower than 3 MET was classified as an activity of low intensity and was not taken into account for the sports index. The ‘active transportation index’ was computed summing time spent in leisure time active transportation and in walking and cycling to and from school. The ‘leisure time physical activity index’ was computed including leisure time sports and active transportation. The ‘school physical
activity index’ was determined adding up time spent in active transportation to school and extracurricular activities at school. For the ‘total physical activity index’ all minutes of activity were computed. Philippaerts and colleagues (25) reported moderate to high reliability of the FPAQ for the different indexes used in the present study. The test-retest intraclass correlation coefficients exceeded .70. To obtain validity measures, data from the questionnaire were correlated to data derived from accelerometers (model 7164, Computer Science Application, Inc., Shalimar, FL). Pearson correlations were significant for all activity measures and ranged between .43 and .79, indicating acceptable validity of the instrument. Physical activity determinants. General-affective attitudes, social influences, self-efficacy, perceived benefits and barriers, were assessed by 30 items with a 5-point scale. Questions were selected and adopted from previous studies with adolescents and adults (9, 26). General-affective attitudes (4 items) towards physical activity were assessed using bipolar adjectives. Participants were asked whether sports and physical activity are ‘not pleasant – pleasant’, ‘bad – good’, ‘healthy – unhealthy’, and ‘dangerous – save’. Social support (4 items) was assessed by asking respondents how frequently their parents, brothers & sisters, friends, and teachers encouraged them to be physically active. Self-efficacy (3 items) was measured by asking how easy or difficult it was to continue with sports or physical activity for 1 hour per day in general, and more specific to be active at their school or at their home. Perceived benefits and barriers with regard to physical activity were investigated by asking respondents to rate their agreement with possible effects of sports and physical activity (8 items:
Chapter 2.5 Original Research
153
weight and physical appearance, health and fitness, social interaction, pleasure, competition, stress and depression, admiration of others, relaxation from (school)work) and the frequency with which barriers prevented them from exercising (11 items: lack of time, lack of discipline, lack of interest, health problems, personal problems, not skilled enough, too expensive, no transportation, not liking to sweat, fear of being laughed at, lack of facilities at school). Intervention The school based intervention program was developed to promote healthy food choices and physical activity engagement in order to prevent the increasing prevalence of overweight in adolescents. The effects of the intervention on adiposity indexes (23) adolescents’ diet (27) and physical activity (18) are beyond the scope of the present study and are published elsewhere. The intervention was designed to be implemented by the school staff itself with only minimal external support to make later implementation feasible. It was coordinated by a working group of school personnel that received background information, an intervention manual and educational material from the researchers. The physical activity intervention had two main components: an environmental part and an individual-based part. The physical activity environmental intervention focused on increasing levels of moderate to vigorous physical activity to at least 60 min a day (1) by creating more opportunities to be physically active during breaks, at noon or after school hours and by varying the content of the physical activities offered in order to reach all students, (2) by providing extra sports materials at noon, after school hours and during breaks, and (3) by encouraging active transportation (walking and cycling)
to school. At the personal level students completed once the adaptation for adolescents of the computer tailored physical activity intervention (28, 29) during one class hour which resulted in immediate personal feedback about physical activity and sports for each student. A thorough description of the physical activity intervention is reported elsewhere (18, 23). Statistical Analyses Data were analyzed using SPSS 12.0. As suggested by Cerin et al. (30), the Freedman-Schatzkin difference-in-coefficients test was used to asses the mediating effect. In the physical activity behavior domain, the most commonly used method of mediation analysis is the Baron-Kenny causal steps approach. However, the Baron-Kenny approach has lower statistical power especially if the effect size of the intervention is small to moderate in size, which is mostly the case in public health intervention studies on physical activity in uncontrolled settings (such as the school). In that case the Baron-Kenny approach may fail to detect as statistically significant a mediation effect that would be of practical importance (30). The Freedman-Schatzkin difference-in-coefficients test assesses a mediating effect by comparing the relation between the independent variable (the intervention) and the dependent variable (physical activity indexes) before and after adjustment for the mediator (psychosocial determinants). It tests the null hypothesis that the difference between the unadjusted and adjusted regression coefficients of the independent variable (τ - τ´) is zero. A measure of change of physical activity between pre and posttest free of auto-correlated error was recreated by regressing physical activity measures at posttest onto physical activity measures at baseline. Residuals were then computed
Chapter 2.5 Original Research
154
for all dependent variables as the measures of change in physical activity. The resulting residualized scores can be interpreted as the amount of increase or decrease in physical activity between baseline and posttest, independent of baseline activity. In the same line, a measure of change of psychosocial determinants was recreated by regressing each psychosocial determinant score at posttest onto the baseline scores. These measures of change in psychosocial variables are independent of baseline determinants scores, and can be considered to be dynamic variables that covary with changes in physical activity (see Sallis et al., (31) for a further explanation of the use of residualized change scores). A first series of regression analyses were executed looking at the impact of the intervention condition (dummy variable) on the residualized change scores for the physical activity indexes. These first regressions provided an estimate for τ (relationship between intervention condition and change in physical activity before adjusting for the mediator). A second series of regressions analyzed the effect of the intervention on residualized change scores for physical activity after controlling for residualized change scores for the psychosocial determinants (an estimate for τ´). This τ´ represents the independent effect of the intervention condition on changes in physical activity. The significance test of the mediating effect is computed by dividing (τ - τ´) by the standard error and comparing the obtained value to a t distribution with N – 2 degrees of freedom (30). If the t-value > 2.576 there is a significant mediation effect at the 1% level. Results Changes in five psychosocial determinants of physical activity were studied as potential mediators of the intervention
effect: general-affective attitude, social influences, self-efficacy, perceived benefits and perceived barriers. The first series of regressions executed to study the impact of the intervention condition (dummy variable) on the residualized change scores for the physical activity indexes provided the estimate for τ (relationship between intervention condition and change in physical activity before adjusting for the mediator). The unstandardized regression coefficients are reported in table 1a. The intervention was effective on all 5 physical activity indexes: sport index (t=2.99, p<0.01), active transport index (t=5.05, p<0.001), physical activity in leisure time (t=2.63, p<0.01), school related physical activity (t=7.45, p<0.001), and the total physical activity index (t=4.41, p<0.001). The second series of regressions provided us with the estimate for τ´. The unstandardized regression coefficients of the effect of the intervention on residualized change scores for physical activity after controlling for the residualized change scores for the five psychosocial determinants are also reported in table 1a (self-efficacy and social support) and in table 1b (attitude, perceived benefits and barriers). A significant mediation effect of self-efficacy and social support was found for all physical activity indexes. In addition a mediation effect of perceived benefits was found on the total physical activity index and of perceived barriers on the active transportation index. The mediation effect was always partial; this means that the impact of the intervention on the residualized change scores for physical activity remained significant when the mediator was included in the analyses. Surprisingly, an effect opposite to the expectations was found for general affective attitudes. A negative effect of the intervention on changes in attitudes
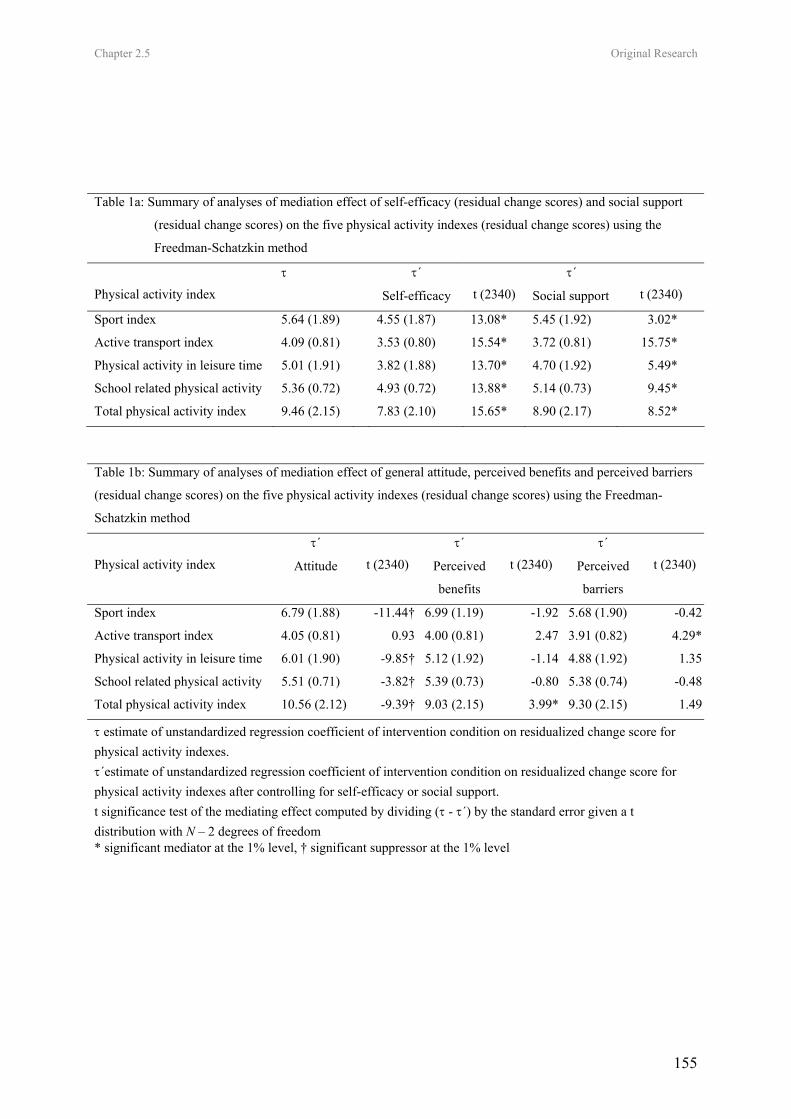
Chapter 2.5 Original Research
155
Table 1a: Summary of analyses of mediation effect of self-efficacy (residual change scores) and social support
(residual change scores) on the five physical activity indexes (residual change scores) using the
Freedman-Schatzkin method
Physical activity index τ τ´
Self-efficacy
t (2340)
τ´
Social support
t (2340)
Sport index 5.64 (1.89) 4.55 (1.87) 13.08* 5.45 (1.92) 3.02*
Active transport index 4.09 (0.81) 3.53 (0.80) 15.54* 3.72 (0.81) 15.75*
Physical activity in leisure time 5.01 (1.91) 3.82 (1.88) 13.70* 4.70 (1.92) 5.49*
School related physical activity 5.36 (0.72) 4.93 (0.72) 13.88* 5.14 (0.73) 9.45*
Total physical activity index 9.46 (2.15) 7.83 (2.10) 15.65* 8.90 (2.17) 8.52*
Table 1b: Summary of analyses of mediation effect of general attitude, perceived benefits and perceived barriers
(residual change scores) on the five physical activity indexes (residual change scores) using the Freedman-
Schatzkin method
Physical activity index
τ´
Attitude
t (2340)
τ´
Perceived
benefits
t (2340)
τ´
Perceived
barriers
t (2340)
Sport index 6.79 (1.88) -11.44† 6.99 (1.19) -1.92 5.68 (1.90) -0.42
Active transport index 4.05 (0.81) 0.93 4.00 (0.81) 2.47 3.91 (0.82) 4.29*
Physical activity in leisure time 6.01 (1.90) -9.85† 5.12 (1.92) -1.14 4.88 (1.92) 1.35
School related physical activity 5.51 (0.71) -3.82† 5.39 (0.73) -0.80 5.38 (0.74) -0.48
Total physical activity index 10.56 (2.12) -9.39† 9.03 (2.15) 3.99* 9.30 (2.15) 1.49
τ estimate of unstandardized regression coefficient of intervention condition on residualized change score for physical activity indexes. τ´estimate of unstandardized regression coefficient of intervention condition on residualized change score for physical activity indexes after controlling for self-efficacy or social support. t significance test of the mediating effect computed by dividing (τ - τ´) by the standard error given a t distribution with N – 2 degrees of freedom * significant mediator at the 1% level, † significant suppressor at the 1% level
Chapter 2.5 Original Research
156
towards physical activity resulted in a suppression effect instead of a mediation effect for changes in the sport index, the physical activity in leisure time index, the school related physical activity index and the total physical activity index. The more conservative Barron-Kenny procedure would only have shown the significant mediation effect of self-efficacy as the intervention only succeeded in resulting in significant positive changes in self-efficacy (t=2.09, p<0.05). The effect of the intervention on social support did not reach significance (t=1.42, p=0.15). The intervention had a negative effect for attitudes (t=-2.60, p<0.01), perceived benefits (t=-2.19, p<0.05) and perceived barriers (t=2.22, p<0.05). Discussion The aim of the analyses presented here was to study the mechanisms through which a physical activity intervention in middle schools yielded effects, using mediation analyses of change in psychosocial determinants on change in physical activity over a 1 year period. The findings suggested that self-efficacy and social support are mediators for physical activity change in this school-based physical activity program in adolescents. The mediation effect of both constructs was partial, which means that two pathways were revealed through which the intervention worked. First, the significant mediation effect showed that the intervention succeeded in changing self-efficacy and social support in a positive way, what on their turn resulted in positive changes in physical activity. This mediation effect was found for all 5 physical activity indexes. This suggests that this path through self-efficacy and social support is important to change different types of physical activity habits (sports, transportation) as well as activities within different contexts (school, leisure
time). Second, as the mediation effect was only partial, the intervention also resulted in a direct effect on physical activity in adolescents. The intervention consisted of two main components: an environmental component mainly focusing at increasing time, space, material, and opportunities to be active, and an individual component based on personal feedback through online computer tailoring. As this multi-component intervention was implemented as a whole it is not possible to determine which intervention component worked through which pathway. From a theoretical perspective it could be argued that making the school environment more ‘activity friendly’ has a direct impact upon physical activity behavior (32), but also increases self-efficacy and social support. By increasing physical activity opportunities at school, students may feel more confident that they can continue with sports or physical activity for 1 hour per day in general, or more specifically they may feel more confident to be active regularly at their school. Physical activity self-efficacy may specifically be enhanced through successful experiences as special attention was given in the program to varying the content of the physical activities offered in order to reach all students (non-competitive activities). Because emotional or physiological arousal also influences self-efficacy expectations, experiences such as fatigue, muscular strain, discomfort or pain caused by physical activity may be associated with poor performance and perceived incompetence (33). These aversive emotional states threatening self-efficacy were also avoided in the program by offering physical activities at different levels of intensity and giving students a lot of freedom to choose. In addition, the comprehensive school intervention led to more support from family members, friends and teachers to be active at school
Chapter 2.5 Original Research
157
and in leisure time. The environmental component of the intervention was meant to increase the support from friends and teachers at school. This friends’ support could also be transferred into leisure time as many adolescents also keep in contact with their school mates outside school and school hours. Our efforts to engage parents into the intervention may have resulted into more support for their youngsters to be active. In general those results show that environmental changes do not only have a direct, but also an indirect effect, through psychosocial determinants, on physical activity behavior. The computer-tailoring part of the intervention also included specific feedback on all the psychosocial determinants. Specific for self-efficacy it focused on explaining how being active could be ‘more easy’ by incorporating it in daily activities, by including active transport, by explaining the difference between sports and physical activity. For social support the personalised feedback advised to look for a sports partner, to be active with friends at school, or to plan physical activity in leisure time with family members or friends. We can conclude that these results are consistent with the social ecological view of health behaviour that suggests that a comprehensive strategy is required to increase activity levels, not only by changing the environment, but also by creating a supportive social environment and by active encouraging of physical activity to increase self-efficacy (32, 34). Three potential mediators did not significantly mediate the intervention effect on most physical activity indexes as they were not positively affected by the physical activity program: it were attitudes, perceived benefits and perceived barriers. In contrast, even a suppressor effect was
found for general affective attitudes towards physical activity. Perceived benefits and barriers can be considered to reveal the specific pros and cons of a behavior, the beliefs, which means that they are equivalent with the attitude concept, but on a more specific level and focusing more on the cognitive aspect (35). The intervention did not succeed in increasing the perceived benefits or in decreasing the perceived barriers related to physical activity. Hence, the two smaller mediation effects found for perceived barriers and benefits are not as relevant. In the intervention, it was assumed that a positive effect would be created through the computer-tailored program which focused specifically on the benefits of physical activity and gave guidelines how students could solve their most important barriers. Apparently this did not work well. However, this might not be too surprising as also studies on physical activity computer-tailoring in adults showed very minimal effects on attitudes, perceived benefits and barriers (36). Two strategies can be followed here in the future. The first possibility is to give more attention in the intervention to change perceived benefits and barriers in a positive way, so that these changes can result in a more effective intervention. A second possibility is to delete the elements from the intervention that were assumed to produce these positive effects but did not, to make the intervention more parsimonious. Special attention should be given to the suppressor effect that was found for general attitudes towards physical activity. In some way the intervention led to a negative impact upon affective attitudes in the intervention group, diminishing the effect of the intervention. However, it is unclear why and how this effect could occur. In general very high baseline scores were found for the attitude measure, leading to the typical
Chapter 2.5 Original Research
158
decrease with age one year later in both groups. The intervention did not succeed in reducing this decline; it even resulted in a somewhat steeper decline in the intervention group compared to the controls. It is possible that the adolescents were tired hearing about physical activity and its positive effects after this 1 year intensive intervention at their school and that this resulted in the decline in attitudes and benefits, and the increase in barriers. Future research should look further into this effect. There are no studies to compare these results with, as to our knowledge no physical activity intervention studies executed a full mediation analysis in children or adolescents (21, 22). In adults some support was found for self-efficacy and social support to be a mediator among mothers with young children (37). In the CATCH study, some evidence was also found for the importance of self-efficacy and social support to be a possible mediator of physical activity change in elementary school children (38). However, not all recommendations were satisfied to complete a full mediation analysis. In the present study, the Freedman–Schatzkin method was used instead of the more conservative Barron-Kenny method. As suggested by Cerin et al., (30) the Freedman–Schatzkin method had more power to detect mediation effects compared to the Barron-Kenny method. With the Barron-Kenny method, only self-efficacy would have been detected as a mediator. With the Freedman-Schatzkin method, social support was also found to be a mediator for all activity indexes. By using this more powerful method there is a smaller risk of failing to identify significant mechanisms leading to changes in physical activity behaviour. Some limitations of the study need to be mentioned. First, only self-reports of
physical activity and of related determinants were included in the present study. Although previous studies have shown that the physical activity and psychosocial measures have a good reliability and an acceptable validity (9, 24), they could suffer from social desirability. Second, the psychosocial determinants included as potential mediators in the present study, were measured in a very general way. As suggested by Baranowski et al. (21), perhaps more specific mediation models, including specific items, should be tested for example for active transport, sport at school or physical activity in leisure time. On the other hand other possible relevant mediating variables such as intentions should be included. This would allow us to tailor interventions more to the appropriate mediating variables. Finally, the comprehensive nature of our intervention does not allow conclusions about which intervention parts are responsible for which effects through which pathways (39). Further research has to disentangle the relative importance of these pathways in the efficacy of physical activity interventions. The strength of the present study is that its longitudinal design, the presence of a control group, and its overall effectiveness on physical activity indexes allowed one of the first true mediation analyses in an adolescent sample. Changes in physical activity self-efficacy and social support were found to be mediators of changes in physical activity. Replication of the mediating properties of these variables will be needed before we can conclude that it is a consistent mediator of physical activity intervention in adolescents. References 1. Bouchard C, Shepard R, Stephens T.
Physical activity, fitness and health: interventional proceedings and consensus
Chapter 2.5 Original Research
159
statement. Champaign, IL: Human Kinetics, 1994.
2. Caspersen CJ, Merrit RK, Stephens, T. International physical activity patterns: a methodological perspective. In: Dishman R, eds. Advances in Exercise Adherence. Champaign, IL: Human Kinetis; 1994: 73.
3. Steptoe A, Wardle J, Fuller R, Holte A, Justo J, Sanderman R, et al. Leisure-time physical exercise: Prevalence, attitudinal correlates, and behavioral correlates among young Europeans from 21 countries. Preventive Medicine. 1997; 26(6): 845-54.
4. Sallis JF. Age-related decline in physical activity: a synthesis of human and animal studies. Medicine and Science in Sports and Exercise. 2000; 32(9): 1598-600.
5. Ajzen IM, TJ. Prediction of goal-directed behavior: attitudes, intentions and perceived behavioral control. Journal of Experimental Social Psychology. 1986;22 (5): 453-74.
6. Bandura A. Social Foundations of Thought and Action: A Social Cognitive Theory. Englewood Cliffs, New Jersey: Prentice-Hall, 1986.
7. Sallis JF, Prochaska JJ, Taylor WC. A review of correlates of physical activity of children and adolescents. Medicine and Science in Sports and Exercise. 2000; 32(5): 963-75.
8. De Bourdeaudhuij I. Behavioural factors associated with physical activity in youth. In: Biddle S, Sallis J, Cavill N, eds. Young and Active. Young people and health-enhancing physical activity-evidence and implications. London: Health Education Authority; 1998:98-118.
9. De Bourdeaudhuij I, Sallis J. Relative contribution of psychosocial variables to the explanation of physical activity in three population-based adult samples. Preventive Medicine. 2002; 34(2): 279-88.
10. Timperio A, Salmon J, Ball K. Evidence-based strategies to promote physical
activity among children, adolescents and young adults: review and update. Journal of Science and Medicine in Sports. 2004; 7(1): S20-S9.
11. Stone EJ, McKenzie TL, Welk GJ, Booth ML. Effects of physical activity interventions in youth - Review and synthesis. American Journal of Preventive Medicine. 1998; 15(4): 298-315.
12. Sallis JF, Mckenzie TL. Physical Educations Role in Public-Health. Research Quarterly for Exercise and Sport. 1991; 62(2): 124-37.
13. Sallis JF, Conway TL, Prochaska JJ, McKenzie TL, Marshall SJ, Brown M. The association of school environments with youth physical activity. American Journal of Public Health. 2001; 91(4): 618-20.
14. Story M. School-based approaches for preventing and treating obesity. International Journal of Obesity. 1999; 23(2): S43-S51.
15. Gortmaker SL, Peterson K, Wiecha J, Sobol AM, Dixit S, Fox MK, et al. Reducing obesity via a school-based interdisciplinary intervention among youth - Planet health. Archives of Pediatrics & Adolescent Medicine. 1999; 153(4): 409-18.
16. Sallis JF, McKenzie TL, Conway TL, Elder JP, Prochaska JJ, Brown M, et al. Environmental interventions for eating and physical activity - A randomized controlled trial in middle schools. American Journal of Preventive Medicine. 2003; 24(3): 209-17.
17. Simon C, Wagner A, DiVita C, Rauscher E, Klein-Platat C, Arveiler D, et al. Intervention centred on adolescents' physical activity and sedentary behaviour (ICAPS): concept and 6-month results. International Journal of Obesity. 2004; 28: S96-S103.
18. Haerens L, De Bourdeaudhuij I, Maes L, Cardon G, Deforche B. School based randomized controlled trial of a physical
Chapter 2.5 Original Research
160
activity intervention in 11 to 15 year olds. Submitted.
19. Green L, Kreuter M. Health promotion planning: an educational and ecological approach. Mountain View: Mayfield, 1999.
20. McKenzie TL, Smeltzer JL. Planning, implementing and evaluating health promotion programs: a primer. Boston: Allyn and Bacon, 2001.
21. Baranowski T, Anderson C, Carmack C. Mediating variable framework in physical activity interventions - How are we doing? How might we do better? American Journal of Preventive Medicine. 1998; 15(4): 266-97.
22. Lewis BA, Marcus BH, Pate RR, Dunn AL. Psychosocial mediators of physical activity behavior among adults and children. American Journal of Preventive Medicine. 2002; 23(2): 26-35.
23. Haerens L, Deforche B, Maes L, Stevens V, Cardon G, De Bourdeaudhuij I. Body mass effects of a physical activity and health food intervention in middle schools. Obesity Research. 2006; 14(5):847-54.
24. Ainsworth BE, Haskell WL, Whitt MC, Irwin ML, Swartz AM, Strath SJ, et al. Compendium of Physical Activities: an update of activity codes and MET intensities. Medicine and Science in Sports and Exercise. 2000; 32(9): S498-S516.
25. Philippaerts RM, Matton L, Wijndaele K, Balduck AL, De Bourdeaudhuij I, Lefevre J. Validity of a physical activity computer questionnaire in 12-to 18-year-old boys and girls. International Journal of Sports Medicine. 2006; 27(2): 131-6.
26. De Bourdeaudhuij I, Philippaerts R, Crombez G, Matton L, Wijndaele K, Balduck AL, et al. Stages of change for physical activity in a community sample of adolescents. Health Education Research. 2005; 20(3): 357-66.
27. Haerens L, De Bourdeaudhuij I, Maes L, Vereecken C, Brug J, Deforche B. The
effects of a middle school healthy eating intervention on adolescents’ fat and fruit intake and soft-drink consumption. Public Health Nutrition. In press.
28. Vandelanotte C, De Bourdeaudhuij I. Acceptability and feasibility of a computer-tailored physical activity intervention using stages of change: project FAITH. Health Education Research. 2003; 18(3): 304-17.
29. Vandelanotte C, De Bourdeaudhuij I, Sallis JF, Spittaels H, Brug J. Efficacy of sequential or simultaneous interactive computer-tailored interventions for increasing physical activity and decreasing fat intake. Annals of Behavioral Medicine. 2005; 29(2): 138-46.
30. Cerin E, Taylor LM, Leslie E, Owen N. Small-scale randomized controlled trials need more powerful methods of mediational analysis than the Baron-Kenny method. Journal of Clinical Epidemiology. 2006; 59(5): 457-64.
31. Sallis JF, Hovell MF, Hofstetter CR, Barrington E. Explanation of Vigorous Physical-Activity during 2 Years Using Social-Learning Variables. Social Science & Medicine. 1992; 34(1): 25-32.
32. Sallis JF, Owen N. Ecological models of health behavior. San Francisco: Jossey-Bass; 2002.
33. Duncan TE, Mcauley E. Social Support and Efficacy Cognitions in Exercise Adherence - a Latent Growth Curve Analysis. Journal of Behavioral Medicine. 1993; 16(2): 199-218.
34. Giles-Corti B, Donovan RJ. The relative influence of individual, social and physical environment determinants of physical activity. Social Science & Medicine. 2002; 54(12): 1793-812.
35. Connor M, Norman P. Predicting health behavior: research and practice with social cognition models. Buckingham: Open University Press, 1996.
Chapter 2.5 Original Research
161
36. Spittaels H, De Bourdeaudhuij I, Brug J, Vandelanotte C. Effectiveness of an online computer-tailored physical activity intervention in a real-life setting. Health Education Research. 2006; doi:10.1093/her/cy1096.
37. Miller YD, Trost SG, Brown WJ. Mediators of physical activity behavior change among women with young children. American Journal of Preventive Medicine. 2002; 23(2): 98-103.
38. Edmundson E, Parcel GS, Feldman HA, Elder J, Perry CL, Johnson C, et al. The effects of the child and adolescent trial for cardiovascular health upon psychosocial determinants of diet and physical activity behavior. Preventive Medicine. 1996; 25(4): 442-54.
39. Baranowski T, Jago R. Understanding the mechanisms of change in children's physical activity programs. Exercise and Sport Sciences Reviews. 2005; 33(4): 163-8.

162
Leen Haerens, Benedicte Deforche, Lea Maes, Johannes Brug, Corneel
Vandelanotte, Ilse De Bourdeaudhuij
Annals of Behavioral Medicine, In revision
CHAPTER 2.6
A COMPUTER-TAILORED FAT INTAKE INTERVENTION AMONG
ADOLESCENTS: RESULTS OF A RANDOMIZED CONTROLLED TRIAL
Chapter 2.6 Original Research
164
A Computer-tailored Fat Intake Intervention among Adolescents: Results of a Randomized Controlled Trial Abstract Background: The positive effects of computer-tailored interventions to target fat intake were demonstrated in adults, but few studies investigated the impact in adolescents. Purpose: To evaluate acceptability, feasibility and effectiveness of computer-tailored fat intake education among adolescents. Methods: A random sample of 10 schools, 5 with general and 5 with technical-vocational education were selected to participate. In each of the 10 schools, 2 classes of 7th graders were randomly assigned to intervention (computer-tailored intervention, n=153) or control (no-intervention, n=151) condition. Questionnaires were completed, 1 week before (fat intake) and 3 months after (process evaluation + fat intake) the intervention. Results: About one third of the students evaluated the tailored intervention as interesting (34%), novel (38%), personally relevant (26%), credible (34%) and correct (38%). Half of the students evaluated the advice as too long and one fourth of the students did not read the advice. No significant intervention effects on fat intake were detected for the total sample. Effectiveness was only shown in girls following technical-vocational education (F=3.5, p<.05) and in boys and girls following general education who reported to have read the advice (F=3.6, p<.05). Conclusions: Further improvements of the computer tailored intervention for use in adolescents should be evaluated. Given that a positive impact was shown in most adolescents and that computer tailored fat intake education has the capability of reaching large groups at low cost, this study shows that using such interventions in adolescents has potential. Key Words: Tailoring, Computer, Fat intake, Nutrition, Intervention, Adolescent Introduction Dietary behaviours among most youth in both the US and Europe do not meet dietary recommendations (1-6). The transition from childhood into adolescence often results in diets becoming less healthy (7) and an unhealthy diet during adolescence can negatively affect growth and development (8). In addition, unhealthy eating behaviours developed during adolescence are likely to persist to some extend into adulthood (9, 10) and have been associated with higher risk for becoming overweight and obese, for developing diabetes, hypertension, cardiovascular diseases and cancer (2, 8, 11-13). Hence, there is a need for effective interventions aimed at improving dietary behaviors in adolescents. Behavioral theories assume that interventions aimed at improving
adolescents’ diet should try to change behavioral determinants and mediators (14). During the past decade computer-tailored interventions emerged as a new form of theory-driven nutrition education. Computer-tailored interventions provide respondents with personally adapted feedback about their present health behaviour and with personally adapted suggestions to change behaviours through an automated system which takes personal demographic, behavioural and psychosocial characteristics into consideration (15, 16). Compared with non-tailored messages, tailored messages are more likely to be read and remembered, saved and discussed with others, perceived as interesting, personally relevant and written especially for them (17, 18).
Chapter 2.6 Original Research
165
The behavioural effects of computer-tailored interventions have been mainly investigated in adults (19-23) and effectiveness was demonstrated, especially for reducing fat intake (19-20, 23-24). Fat intake is a complex behaviour involving consumption of various food items. Large proportions of populations have misconceptions about their own fat intake and people who think they are already eating a low-fat diet are not likely to make efforts to decrease their fat intake (25-26). Computer-tailored interventions may reduce misconceptions, by providing personalized feedback about one’s fat intake and important sources of fat intake. Few studies investigated the potential benefits of using computer-tailored interventions to target fat intake in adolescents (27-29). Most nutrition interventions aimed at adolescents used schools in order to reach large amounts of adolescents (30). These school-based interventions used general nutrition education classes (31), but in most of these studies effects on fat intake were limited. Based on the results from studies in adults, it could be hypothesized that using computer-tailored feedback in adolescents could have better effects than using generic nutrition education classes. To date, only one study demonstrated promising effects of using classroom stage-based computer-tailored education to target fat intake in adolescents (29). The computer-generated tailored feedback, offered during eight 45-minutes lessons, was effective among low income, culturally diverse students who completed more than half of the sessions (29). The first purpose of the present study was to describe acceptability and feasibility of a computer-tailored intervention to target fat intake in adolescents. The computer-tailored intervention used in this study, was a youth-based adaptation of the adult
computer-tailored intervention primarily developed by Brug and colleagues (18, 24, 32) and further adapted for use in Flemish adults (23, 33). Earlier research showed that the computer-tailored intervention was an acceptable, feasible and effective tool for reducing fat intake in a general population of adults (23, 33). A second purpose was to investigate the short-term impact of this computerized tailored fat intake intervention (compared to a no-intervention group) in a random sample of adolescents. It was hypothesized that fat intake would change in a more favourable direction in the intervention group, when compared to the no-intervention group. Methods Participants and Procedure The present study is a clustered randomized controlled trial. All secondary schools out of 2 cities in Belgium, with at least 2 classes of 7th graders, were eligible for participation in the present study. Ten schools, 5 with general education (focus on theoretical expertise) and 5 with technical-vocational education (focus on practical skills), were randomly selected out of the 52 eligible secondary schools. In each of the 10 schools 2 classes of 7th graders were randomly selected out of all classes of 7th graders and assigned to intervention or control condition (no intervention). The parents of 333 of the 339 students out of the 20 classes signed an informed consent form in which they gave approval for their child to participate in the study. A priori power analyses revealed that to have an 80% change of detecting a difference of 10g/day at the 5% significance level, at least 110 students in each group were required. The Study protocol was approved by the Ethical Committee of Ghent University. Measures were assessed in November 2005 one week before intervention and repeated 3 months later in February 2006. Self-

Chapter 2.6 Original Research
166
Table 1
Mean Baseline Values of Age, Gender, Educational Levels, Stages of Change and Fat Intake
in the Total Group and the Intervention and Control Condition
Total group Intervention Control
(N= 304) (n=153) (n=151)
M + SD M + SD M + SD
Age (years) 13.1 + 0.8 13.3 + 0.5 13.2 + 0.5 t = -1.0, ns
Gender χ 2= 1.4, ns
% of Girls 70.4% 67.3% 73.5%
% of Boys 29.6% 32.7% 26.5%
Education χ2 = 0.3, ns
% General 57.2% 58.8% 55.6%
% Technical-Vocational 42.8% 41.2% 44.4%
Stages of change χ2 = 3.5, ns
% Precontemplation 26.5% 28.2% 24.8%
% Contemplation 4.1% 2.7% 5.5%
% Preparation 7.8% 7.4% 8.3%
% Action 26.5% 29.5% 23.4%
% Maintenance 35.0% 32.2% 37.9%
Fat intake (g/day) 115.1 + 48.2 116.3 + 50.1 113.9 + 46.3 t = 0.4, ns
Note. ns = not significant
administered paper questionnaires were completed at school, during class hours under direct supervision of the teachers and researchers. The computer-tailored intervention to reduce fat intake, provided on CD’s, was implemented during classes hours and the researcher and teachers guided the students through the computer-tailored program. The tailored feedback was presented immediately on screen, after completing the diagnostic questionnaires, and could mount up to 5 to 6 pages if printed on A-4 paper. After reading the advice it could be saved on the computer. Students in the control group got the opportunity to complete the computer tailored
intervention after the three months post-test measurements. Intervention The intervention consisted of an adaptation of the adult computer-tailored intervention for fat intake (23) that was aimed at encouraging a reduction in fat intake in those who did not meet the guidelines for fat intake and at encouraging those who did meet the guidelines to keep up with their healthy dietary habits. When compared to the adult version, formulation and content of questions and feedback was simplified. In addition figures were added to the program to make it more attractive and to avoid that students get bored.
Chapter 2.6 Original Research
167
The computer-tailored program consisted of three major parts: (a) An introduction page, (b) A diagnostic tool and (c) An advice. All parts were interactive on-screen. The introduction page provided some general information about the diagnostic tool to get the students started. The questionnaire used in the diagnostic tool was filled out on the computer screen and consisted of three major parts. The first part concerned demographic questions. The second part of the survey consisted of the questionnaire for fat intake (34). In the third part of the survey, psychosocial determinants (attitudes, self-efficacy, social support, perceived benefits, perceived barriers) related to fat intake were questioned (35-37). Once the questionnaires were completed, feedback was selected out of a database with messages for each possible combination of answers. The fat advice started with a general introduction, followed by normative feedback, which related students’ intakes to the recommended intakes. The fat advice indicated the most important sources of fat in the students’ diet and tips were given on how to replace fatty foods by more healthy alternatives. Readiness to change (38) was used to define the content and approach of the feedback in the fat advice. Students’ who were in the precontemplation stage got general information about a healthy diet and this information was provided in a non-personal way to avoid resistance. Contemplators got additional information on benefits and barriers of a healthy diet. Contemplators were addressed in a more personal way. In the preparation stage information was given on how to eat less fat and information was given in a more personal direct way. In the action stage maintenance of the healthy diet was emphasized and students’ were addressed in a more supporting way. In the
maintenance stage students’ were encouraged to maintain their healthy diet and they were also addressed in a supporting way. Based on the theory of planned behaviour (39), the social cognitive theory (40) and the attitude, social influence and self-efficacy model (41-42), students got tailored feedback about their attitudes, self-efficacy, social support, knowledge, perceived benefits and barriers related to their fat intake in the final part of the advice. Measurements Fat intake. Fat intake was measured with a self-administered food frequency questionnaire developed at the Ghent University together with the Flemish Institute for Health Promotion (34). The questionnaire consisted of 48 items, representing all important sources of fat in the diet of Flemish adolescents in seven categories: (a) bread and cereals, (b) spreads, fillings and butter (c) milk and milk products, (d) prepared meals (e) meat, fish and eggs, (f) sauces, gravy and dressings (g) snacks, cakes and biscuits (34). Students were asked how often they consumed these products during a usual day, week or month. A coefficient was calculated, representing the fat content and portion size of each product (43-44). This coefficient was multiplied by the frequency of consumption, leading to a fat intake score for each food item. The summation of all food items’ fat intake scores lead to the total fat intake score (34). The questionnaire was validated in a separate study and was found to be sufficiently reliable and valid as compared to a dietary record method (34). To assess adolescents’ readiness to change three questions, similar to questions used in previous studies, were included (28). The first question was ‘Is your present diet too high in fat? (yes/no)’. If the answer on the first question was ‘yes’, the second
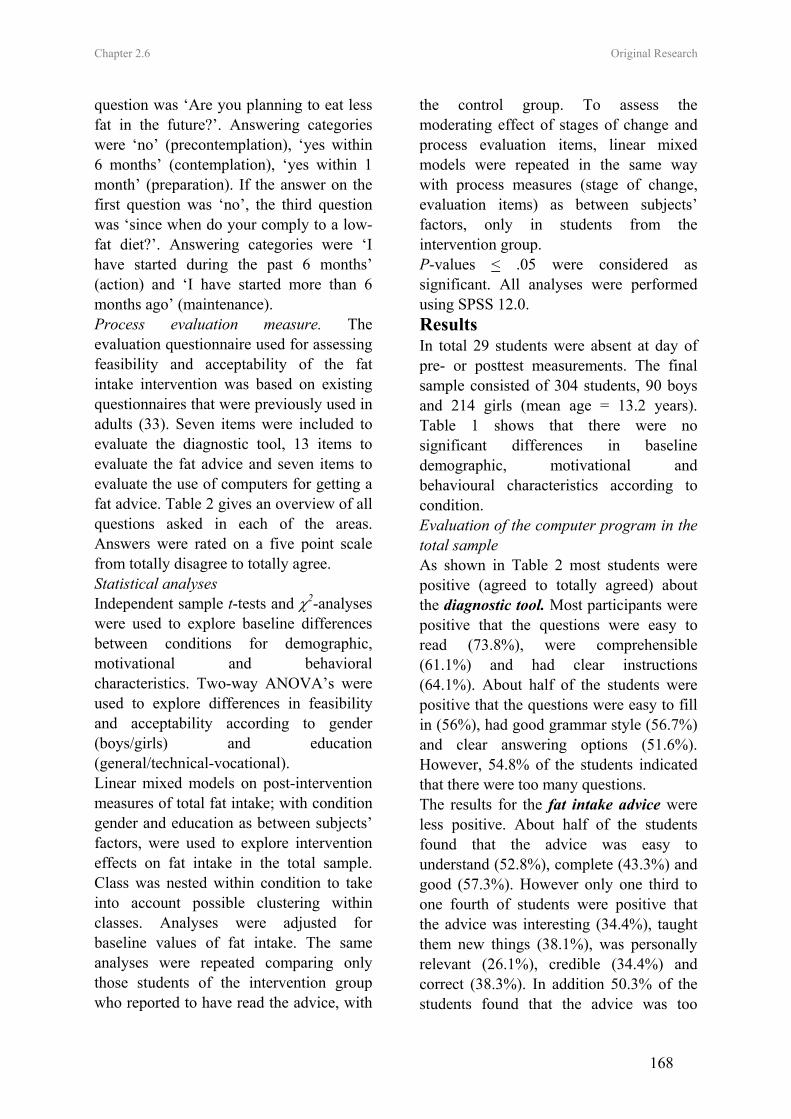
Chapter 2.6 Original Research
168
question was ‘Are you planning to eat less fat in the future?’. Answering categories were ‘no’ (precontemplation), ‘yes within 6 months’ (contemplation), ‘yes within 1 month’ (preparation). If the answer on the first question was ‘no’, the third question was ‘since when do your comply to a low-fat diet?’. Answering categories were ‘I have started during the past 6 months’ (action) and ‘I have started more than 6 months ago’ (maintenance). Process evaluation measure. The evaluation questionnaire used for assessing feasibility and acceptability of the fat intake intervention was based on existing questionnaires that were previously used in adults (33). Seven items were included to evaluate the diagnostic tool, 13 items to evaluate the fat advice and seven items to evaluate the use of computers for getting a fat advice. Table 2 gives an overview of all questions asked in each of the areas. Answers were rated on a five point scale from totally disagree to totally agree. Statistical analyses Independent sample t-tests and χ2-analyses were used to explore baseline differences between conditions for demographic, motivational and behavioral characteristics. Two-way ANOVA’s were used to explore differences in feasibility and acceptability according to gender (boys/girls) and education (general/technical-vocational). Linear mixed models on post-intervention measures of total fat intake; with condition gender and education as between subjects’ factors, were used to explore intervention effects on fat intake in the total sample. Class was nested within condition to take into account possible clustering within classes. Analyses were adjusted for baseline values of fat intake. The same analyses were repeated comparing only those students of the intervention group who reported to have read the advice, with
the control group. To assess the moderating effect of stages of change and process evaluation items, linear mixed models were repeated in the same way with process measures (stage of change, evaluation items) as between subjects’ factors, only in students from the intervention group. P-values < .05 were considered as significant. All analyses were performed using SPSS 12.0. Results In total 29 students were absent at day of pre- or posttest measurements. The final sample consisted of 304 students, 90 boys and 214 girls (mean age = 13.2 years). Table 1 shows that there were no significant differences in baseline demographic, motivational and behavioural characteristics according to condition. Evaluation of the computer program in the total sample As shown in Table 2 most students were positive (agreed to totally agreed) about the diagnostic tool. Most participants were positive that the questions were easy to read (73.8%), were comprehensible (61.1%) and had clear instructions (64.1%). About half of the students were positive that the questions were easy to fill in (56%), had good grammar style (56.7%) and clear answering options (51.6%). However, 54.8% of the students indicated that there were too many questions. The results for the fat intake advice were less positive. About half of the students found that the advice was easy to understand (52.8%), complete (43.3%) and good (57.3%). However only one third to one fourth of students were positive that the advice was interesting (34.4%), taught them new things (38.1%), was personally relevant (26.1%), credible (34.4%) and correct (38.3%). In addition 50.3% of the students found that the advice was too
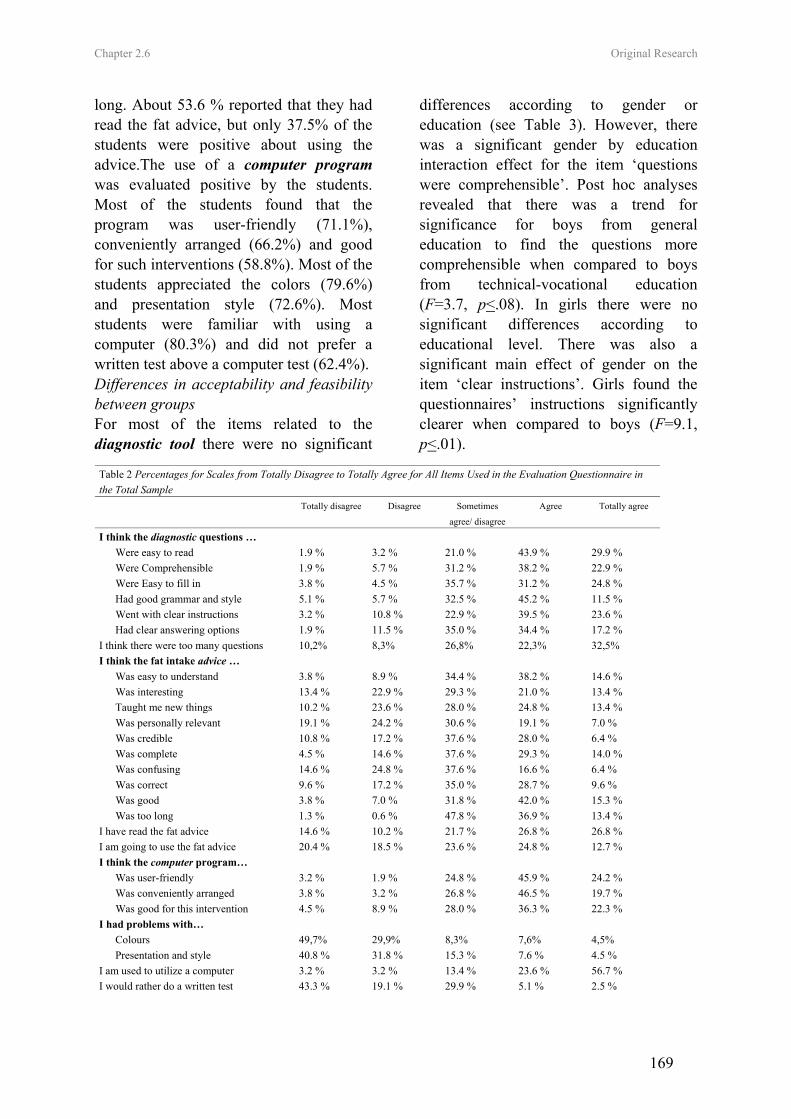
Chapter 2.6 Original Research
169
long. About 53.6 % reported that they had read the fat advice, but only 37.5% of the students were positive about using the advice.The use of a computer program was evaluated positive by the students. Most of the students found that the program was user-friendly (71.1%), conveniently arranged (66.2%) and good for such interventions (58.8%). Most of the students appreciated the colors (79.6%) and presentation style (72.6%). Most students were familiar with using a computer (80.3%) and did not prefer a written test above a computer test (62.4%). Differences in acceptability and feasibility between groups For most of the items related to the diagnostic tool there were no significant
differences according to gender or education (see Table 3). However, there was a significant gender by education interaction effect for the item ‘questions were comprehensible’. Post hoc analyses revealed that there was a trend for significance for boys from general education to find the questions more comprehensible when compared to boys from technical-vocational education (F=3.7, p<.08). In girls there were no significant differences according to educational level. There was also a significant main effect of gender on the item ‘clear instructions’. Girls found the questionnaires’ instructions significantly clearer when compared to boys (F=9.1, p<.01).
Table 2 Percentages for Scales from Totally Disagree to Totally Agree for All Items Used in the Evaluation Questionnaire in the Total Sample Totally disagree Disagree Sometimes
agree/ disagree
Agree Totally agree
I think the diagnostic questions … Were easy to read 1.9 % 3.2 % 21.0 % 43.9 % 29.9 % Were Comprehensible 1.9 % 5.7 % 31.2 % 38.2 % 22.9 % Were Easy to fill in 3.8 % 4.5 % 35.7 % 31.2 % 24.8 % Had good grammar and style 5.1 % 5.7 % 32.5 % 45.2 % 11.5 % Went with clear instructions 3.2 % 10.8 % 22.9 % 39.5 % 23.6 % Had clear answering options 1.9 % 11.5 % 35.0 % 34.4 % 17.2 % I think there were too many questions 10,2% 8,3% 26,8% 22,3% 32,5% I think the fat intake advice … Was easy to understand 3.8 % 8.9 % 34.4 % 38.2 % 14.6 % Was interesting 13.4 % 22.9 % 29.3 % 21.0 % 13.4 % Taught me new things 10.2 % 23.6 % 28.0 % 24.8 % 13.4 % Was personally relevant 19.1 % 24.2 % 30.6 % 19.1 % 7.0 % Was credible 10.8 % 17.2 % 37.6 % 28.0 % 6.4 % Was complete 4.5 % 14.6 % 37.6 % 29.3 % 14.0 % Was confusing 14.6 % 24.8 % 37.6 % 16.6 % 6.4 % Was correct 9.6 % 17.2 % 35.0 % 28.7 % 9.6 % Was good 3.8 % 7.0 % 31.8 % 42.0 % 15.3 % Was too long 1.3 % 0.6 % 47.8 % 36.9 % 13.4 % I have read the fat advice 14.6 % 10.2 % 21.7 % 26.8 % 26.8 % I am going to use the fat advice 20.4 % 18.5 % 23.6 % 24.8 % 12.7 % I think the computer program… Was user-friendly 3.2 % 1.9 % 24.8 % 45.9 % 24.2 % Was conveniently arranged 3.8 % 3.2 % 26.8 % 46.5 % 19.7 % Was good for this intervention 4.5 % 8.9 % 28.0 % 36.3 % 22.3 % I had problems with… Colours 49,7% 29,9% 8,3% 7,6% 4,5% Presentation and style 40.8 % 31.8 % 15.3 % 7.6 % 4.5 % I am used to utilize a computer 3.2 % 3.2 % 13.4 % 23.6 % 56.7 % I would rather do a written test 43.3 % 19.1 % 29.9 % 5.1 % 2.5 %
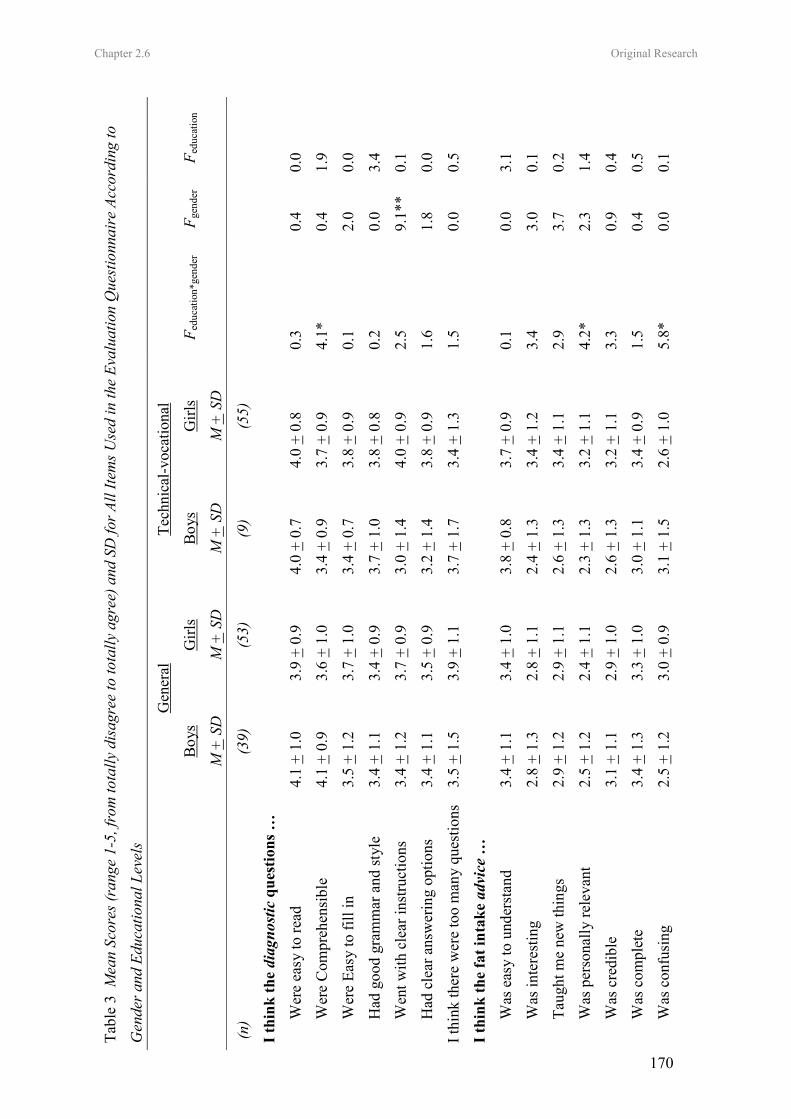
Chapter 2.6 Original Research
170
Tabl
e 3
Mea
n Sc
ores
(ran
ge 1
-5, f
rom
tota
lly d
isag
ree
to to
tally
agr
ee) a
nd S
D fo
r All
Item
s Use
d in
the
Eval
uatio
n Q
uest
ionn
aire
Acc
ordi
ng to
Gen
der a
nd E
duca
tiona
l Lev
els
G
ener
al
Tech
nica
l-voc
atio
nal
B
oys
Girl
s B
oys
Girl
s F e
duca
tion*
gend
er
F gen
der
F edu
catio
n
M
+ S
D
M +
SD
M
+ S
D
M +
SD
(n)
(39)
(5
3)
(9)
(55)
I thi
nk th
e di
agno
stic
que
stio
ns …
Wer
e ea
sy to
read
4.
1 +
1.0
3.9
+ 0.
9 4.
0 +
0.7
4.0
+ 0.
8 0.
3 0.
4 0.
0
Wer
e C
ompr
ehen
sibl
e 4.
1 +
0.9
3.6
+ 1.
0 3.
4 +
0.9
3.7
+ 0.
9 4.
1*
0.4
1.9
Wer
e Ea
sy to
fill
in
3.5
+ 1.
2 3.
7 +
1.0
3.4
+ 0.
7 3.
8 +
0.9
0.1
2.0
0.0
Had
goo
d gr
amm
ar a
nd st
yle
3.4
+ 1.
1 3.
4 +
0.9
3.7
+ 1.
0 3.
8 +
0.8
0.2
0.0
3.4
Wen
t with
cle
ar in
stru
ctio
ns
3.4
+ 1.
2 3.
7 +
0.9
3.0
+ 1.
4 4.
0 +
0.9
2.5
9.1*
* 0.
1
Had
cle
ar a
nsw
erin
g op
tions
3.
4 +
1.1
3.5
+ 0.
9 3.
2 +
1.4
3.8
+ 0.
9 1.
6 1.
8 0.
0
I thi
nk th
ere
wer
e to
o m
any
ques
tions
3.
5 +
1.5
3.9
+ 1.
1 3.
7 +
1.7
3.4
+ 1.
3 1.
5 0.
0 0.
5
I thi
nk th
e fa
t int
ake
advi
ce …
Was
eas
y to
und
erst
and
3.4
+ 1.
1 3.
4 +
1.0
3.8
+ 0.
8 3.
7 +
0.9
0.1
0.0
3.1
Was
inte
rest
ing
2.8
+ 1.
3 2.
8 +
1.1
2.4
+ 1.
3 3.
4 +
1.2
3.4
3.0
0.1
Taug
ht m
e ne
w th
ings
2.
9 +
1.2
2.9
+ 1.
1 2.
6 +
1.3
3.4
+ 1.
1 2.
9 3.
7 0.
2
Was
per
sona
lly re
leva
nt
2.5
+ 1.
2 2.
4 +
1.1
2.3
+ 1.
3 3.
2 +
1.1
4.2*
2.
3 1.
4
Was
cre
dibl
e 3.
1 +
1.1
2.9
+ 1.
0 2.
6 +
1.3
3.2
+ 1.
1 3.
3 0.
9 0.
4
Was
com
plet
e 3.
4 +
1.3
3.3
+ 1.
0 3.
0 +
1.1
3.4
+ 0.
9 1.
5 0.
4 0.
5
Was
con
fusi
ng
2.5
+ 1.
2 3.
0 +
0.9
3.1
+ 1.
5 2.
6 +
1.0
5.8*
0.
0 0.
1
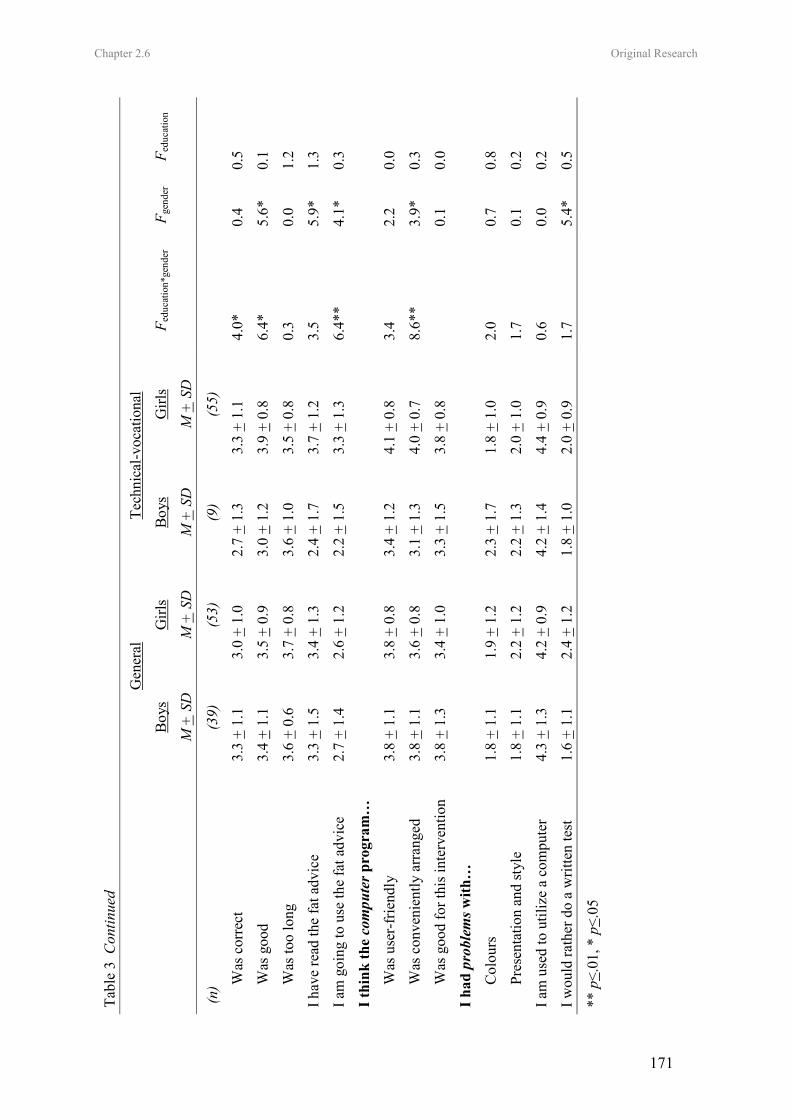
Chapter 2.6 Original Research
171
Tabl
e 3
Con
tinue
d
G
ener
al
Tech
nica
l-voc
atio
nal
B
oys
Girl
s B
oys
Girl
s F e
duca
tion*
gend
er
F gen
der
F edu
catio
n
M
+ S
D
M +
SD
M
+ S
D
M +
SD
(n)
(39)
(5
3)
(9)
(55)
Was
cor
rect
3.
3 +
1.1
3.0
+ 1.
0 2.
7 +
1.3
3.3
+ 1.
1 4.
0*
0.4
0.5
Was
goo
d 3.
4 +
1.1
3.5
+ 0.
9 3.
0 +
1.2
3.9
+ 0.
8 6.
4*
5.6*
0.
1
Was
too
long
3.
6 +
0.6
3.7
+ 0.
8 3.
6 +
1.0
3.5
+ 0.
8 0.
3 0.
0 1.
2
I hav
e re
ad th
e fa
t adv
ice
3.3
+ 1.
5 3.
4 +
1.3
2.4
+ 1.
7 3.
7 +
1.2
3.5
5.9*
1.
3
I am
goi
ng to
use
the
fat a
dvic
e
2.7
+ 1.
4 2.
6 +
1.2
2.2
+ 1.
5 3.
3 +
1.3
6.4*
* 4.
1*
0.3
I thi
nk th
e co
mpu
ter p
rogr
am…
Was
use
r-fr
iend
ly
3.8
+ 1.
1 3.
8 +
0.8
3.4
+ 1.
2 4.
1 +
0.8
3.4
2.2
0.0
Was
con
veni
ently
arr
ange
d 3.
8 +
1.1
3.6
+ 0.
8 3.
1 +
1.3
4.0
+ 0.
7 8.
6**
3.9*
0.
3
Was
goo
d fo
r thi
s int
erve
ntio
n 3.
8 +
1.3
3.4
+ 1.
0 3.
3 +
1.5
3.8
+ 0.
8
0.1
0.0
I had
pro
blem
s with
…
Col
ours
1.
8 +
1.1
1.9
+ 1.
2 2.
3 +
1.7
1.8
+ 1.
0 2.
0 0.
7 0.
8
Pres
enta
tion
and
styl
e 1.
8 +
1.1
2.2
+ 1.
2 2.
2 +
1.3
2.0
+ 1.
0 1.
7 0.
1 0.
2
I am
use
d to
util
ize
a co
mpu
ter
4.3
+ 1.
3 4.
2 +
0.9
4.2
+ 1.
4 4.
4 +
0.9
0.6
0.0
0.2
I wou
ld ra
ther
do
a w
ritte
n te
st
1.6
+ 1.
1 2.
4 +
1.2
1.8
+ 1.
0 2.
0 +
0.9
1.7
5.4*
0.
5
** p
< .01
, * p
<.05
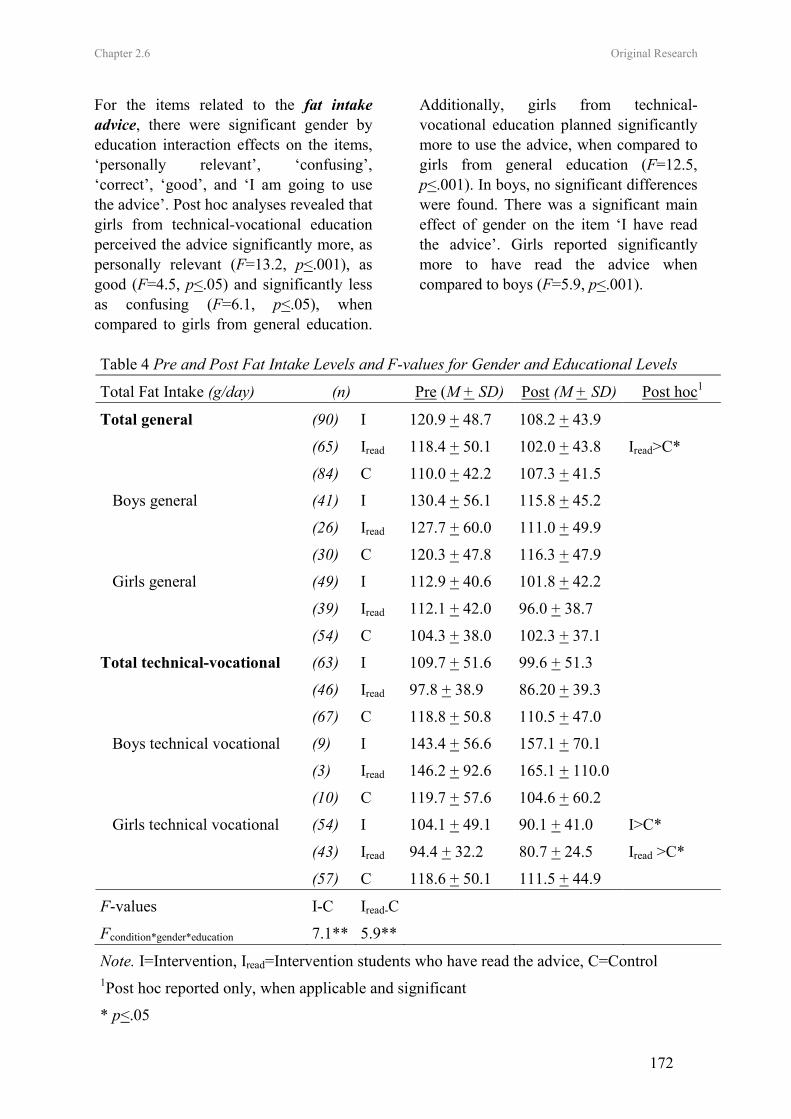
Chapter 2.6 Original Research
172
For the items related to the fat intake advice, there were significant gender by education interaction effects on the items, ‘personally relevant’, ‘confusing’, ‘correct’, ‘good’, and ‘I am going to use the advice’. Post hoc analyses revealed that girls from technical-vocational education perceived the advice significantly more, as personally relevant (F=13.2, p<.001), as good (F=4.5, p<.05) and significantly less as confusing (F=6.1, p<.05), when compared to girls from general education.
Additionally, girls from technical-vocational education planned significantly more to use the advice, when compared to girls from general education (F=12.5, p<.001). In boys, no significant differences were found. There was a significant main effect of gender on the item ‘I have read the advice’. Girls reported significantly more to have read the advice when compared to boys (F=5.9, p<.001).
Table 4 Pre and Post Fat Intake Levels and F-values for Gender and Educational Levels
Total Fat Intake (g/day) (n) Pre (M + SD) Post (M + SD) Post hoc1
Total general (90) I 120.9 + 48.7 108.2 + 43.9
(65) Iread 118.4 + 50.1 102.0 + 43.8 Iread>C*
(84) C 110.0 + 42.2 107.3 + 41.5
Boys general (41) I 130.4 + 56.1 115.8 + 45.2
(26) Iread 127.7 + 60.0 111.0 + 49.9
(30) C 120.3 + 47.8 116.3 + 47.9
Girls general (49) I 112.9 + 40.6 101.8 + 42.2
(39) Iread 112.1 + 42.0 96.0 + 38.7
(54) C 104.3 + 38.0 102.3 + 37.1
Total technical-vocational (63) I 109.7 + 51.6 99.6 + 51.3
(46) Iread 97.8 + 38.9 86.20 + 39.3
(67) C 118.8 + 50.8 110.5 + 47.0
Boys technical vocational (9) I 143.4 + 56.6 157.1 + 70.1
(3) Iread 146.2 + 92.6 165.1 + 110.0
(10) C 119.7 + 57.6 104.6 + 60.2
Girls technical vocational (54) I 104.1 + 49.1 90.1 + 41.0 I>C*
(43) Iread 94.4 + 32.2 80.7 + 24.5 Iread >C*
(57) C 118.6 + 50.1 111.5 + 44.9
F-values I-C Iread-C
Fcondition*gender*education 7.1** 5.9**
Note. I=Intervention, Iread=Intervention students who have read the advice, C=Control 1Post hoc reported only, when applicable and significant
* p<.05
Chapter 2.6 Original Research
173
For the evaluation of the computer program there was a significant gender by education interaction effect for the item ‘conveniently arranged’. Girls from technical-vocational education agreed significantly more that the advice was conveniently arranged (F=5.5, p<.01), when compared to girls from general education. There were no significant differences in boys. There was a significant main effect of gender on the item ‘I would rather do a written test’. Girls reported significantly more to prefer a written test, when compared to boys (F=5.4, p<.05). Effects on fat intake The pre and post-intervention values of self-reported total fat intake are presented in Table 4. For the total sample, there was a significant condition by gender by education interaction effect (F=7.1, p<.01). Among students from general education, there were no significant gender by condition (F=0.0, ns) or condition effects (F=1.6, ns), whereas among students from technical and vocation education, there was a significant gender by education interaction effect (F=8.6, p<.01). In girls (F=3.5, p<.05) -but not in boys (F=2.2, ns) - following technical-vocational education, there was a significant main effect of condition. In those girls, fat intake decreased with on average 14.0 g/day in the intervention group, whereas it decreased with only 7.1 g/day in the control group. Secondary analyses, including only those intervention students who reported to have read the advice, revealed positive effects among students from general education (F=3.6, p<.05) and among girls following technical-vocational education (F=4.7, p<.05). Among students from general education, fat intake significantly decreased with on average 16.2 g/day in the intervention group, whereas it decreased with only 2.7 g/day in the
control group. Among girls from technical-vocational education, fat intake significantly decreased with on average 13.7 g/day in the intervention group, whereas it decreased with only 7.1 g/day in the control group. Moderating effects There was a significant main effect of baseline self-rated ‘stage of change’ on change in total dietary fat intake (F=3.3, p<.05) among students from the intervention group. Dietary fat intake decreased with on average 10.1 grams per day among precontemplators (n=42), with on average 6.2 grams per day among contemplators (n=4), with on average 33.7 grams per day among preparators (n=11), with on average 12.3 grams per day among actors (n=44) and with on average 6.4 grams per day among maintainers (n=48). The intervention effects were similar in students with a positive attitude as compared to students with a negative attitude towards each of the process evaluation items (all F<2.9, ns), except for the evaluation of the item ‘I have read the advice’ (F=8.1, p<.01). Students who reported to have read the intervention messages decreased their dietary fat intake with on average 14.4 grams per day, while students who reported not to have read the intervention messages decreased their dietary fat intake with only 4.6 grams per day. Discussion The present study is one of the first studies in which a computer-tailored intervention to reduce fat intake was adapted and aimed at adolescents. The first purpose of the present study was to test feasibility and acceptability of such tailored fat intake intervention in adolescents. In line with the acceptability and feasibility testing in adults (33), adolescents had few problems with the diagnostic tool, although most adolescents criticized that there were too
Chapter 2.6 Original Research
174
many questions. Also the use of a computer was evaluated as feasible and acceptable, since most adolescents were familiar with using a computer. With regard to the tailored advice, studies in adults have shown that respondents who received tailored feedback as compared to general information, more often read the letter completely, kept it, discussed it with others and perceived information as personally relevant and new (19, 27, 45). However, results of the present study showed that most adolescents did not perceive the advice as interesting, new, personally relevant, and correct. In addition half of the students indicated that the advice was too long. This contrast with the studies in adults (20) could be caused by the difference between the self-selected adult samples and the randomly selected sample of adolescents. More than 60% of the students placed themselves in the action or maintenance phase. Large proportions of these students were probably precontemplators, being unaware of their high fat intake (25-26). Given that those students may think that the tailored intervention is not applicable to them, they were probably less likely to evaluate the advice as positive and to make efforts to read the advice or to decrease their fat intake. Another 28% of the students may have been less positive as they placed themselves in the precontemplation stage, meaning that they reported to have a high fat intake, but not to have any intention to change their diet. A second purpose of the present study was to investigate short-term impact of the computerized tailored fat intake intervention in adolescents. In general, the computer-tailored fat reduction education that has been found to be effective among adults (20), and which has been adapted for adolescents, did not show effects in a randomly selected adolescent population.
The data only showed a positive impact of the tailored intervention among girls following technical-vocational education, which may have several explanations. The major difference between all previous computer-tailored interventions in adults and the present study in adolescents is that all adolescents participated in the classroom-led computer-tailored sessions. Previous research showed that tailored feedback is especially effective among people who are highly motivated to change (19). All adult studies recruited volunteers, which were of course mostly highly motivated people choosing for themselves that they wanted to participate in a study. Due to the classroom led instruction motivation levels in adolescents might have varied. Indeed, one fourth of the adolescents reported not to have read the tailored feedback, with girls reporting more often that they had read the advice, when compared to boys. In line with these findings, women and girls were found to have greater health consciousness, to be more attuned to issues of diet and more concerned with their appearance (46-47). Also, in self-selected adult samples, women are mostly overrepresented (21, 23). When compared to girls from general education, girls from technical-vocational education more often evaluated the advice personally relevant, good and less often as confusing. In addition this group more often planned to use the advice. One explanation for the differences in effectiveness according to education could be that higher educated girls are usually more informed about health related dietary issues (48, 49) and that the advice was not challenging enough for some of them. In line with our findings, tailored interventions in adults were found to be more appreciated by those with the lowest education (50).
Chapter 2.6 Original Research
175
Since one fourth of the students reported not to have read the advice, the lack of impact in the total sample is not so surprising. Hence, the question rose whether the intervention was more effective among those adolescents who reported to have read the advice. Secondary analyses revealed that the tailored feedback also had a positive impact on fat intake of boys and girls following general education, who had read the advice. Only in boys following technical and vocational education effectiveness was not shown. However, in that group only 3 students reported to have read the advice. There are several important limitations to consider in interpreting the results of this study. As a result of the randomization, boys were underrepresented in the present study. There were only 19 boys from technical-vocational education; this small sample resulted in a lack of power to detect possible intervention effects. In addition the small sample may not be representative for all boys of technical-vocational education. Since power analyses revealed that at least 110 students in each group were required to detect intervention effects, further research in larger samples of adolescents is necessary. The present study only investigated short-term effectiveness of the computer-tailored intervention. It remains uncertain whether effects would sustain over a longer period. In contrast, a three month period may have been too short to make substantial changes in some of the adolescents’ diet. A further limitation is the use of self-reports to assess tailoring effects, that could have resulted in a reporting bias. More objective criteria such as bio-markers would give more verifiable results (51). While most studies on computer-tailored nutrition education were conducted in rather controlled settings, it is a strength of
the present study that the computer-tailored intervention was implemented in a real-life setting, which increased the external validity of the results. Since large proportions of students reported that the computer tailored intervention contains too many questions and that the advice is too long, future research directions should aim at investigating the impact of a shorter version of the same intervention. Other adaptations to increase personal relevance, interestingness and novelty for adolescents should be tested. Critical hours of exposure should be determined and long-term impact of the intervention should be investigated. In conclusion, if the intervention would be implemented in the classroom curriculum, at least one fourth of the adolescents would not make efforts to read the advice, resulting in a lack of impact in that group. However, the positive impact of the tailored intervention was demonstrated among students who made the effort to read the advice. Given that its positive impact was shown and that computer tailored fat intake education has the capability of reaching large groups at low cost and with little time, this research shows that using such interventions in adolescents has potential. References (1) Story M, Neumark-Sztainer D, French
S: Individual and environmental influences on adolescent eating behaviors. Journal of the American Dietetic Association. 2002, 102:S40-S51.
(2) Lytle LA, Kubik MY: Nutritional issues for adolescents. Best Practice & Research Clinical Endocrinology & Metabolism. 2003, 17:177-189.
(3) Currie C, Roberts C, Morgan A, et al. Health Behaviour in School-Aged children (HBSC) study: international
Chapter 2.6 Original Research
176
report from the 2001/2002 survey, Report No. 4. Copenhagen: Denmark. World Health Organization, 2004.
(4) Cruz JAA: Dietary habits and nutritional status in adolescents over Europe - Southern Europe. European Journal of Clinical Nutrition. 2000, 54:S29-S35.
(5) Lambert J, Agostoni C, Elmadfa I, et al.: Dietary intake and nutritional status of children and adolescents in Europe. British Journal of Nutrition. 2004, 92:S147-S211.
(6) Vereecken CA, De Henauw S, Maes L: Adolescents' food habits: Results of the health behaviour in school-aged children survey. British Journal of Nutrition. 2005, 94:423-431.
(7) Lytle LA: In defense of a low-fat diet for healthy children. Journal of the American Dietetic Association. 2000, 100:39-41.
(8) Centers of Disease Control and Prevention. Guidelines for school health programs to promote lifelong healthy eating. Journal of School Health. 1997, 67:9-26.
(9) Kelder SH, Perry CL, Klepp KI, Lytle LL: Longitudinal Tracking of Adolescent Smoking, Physical-Activity, and Food Choice Behaviors. American Journal of Public Health. 1994, 84:1121-1126.
(10) Lien N, Lytle LA, Klepp KI: Stability in consumption of fruit, vegetables, and sugary foods in a cohort from age 14 to age 21. Preventive Medicine. 2001, 33:217-226.
(11) Willet W: Diet and health? What should we eat? Science. 1994, 264:532-537.
(12) Reilly JJ, Dorosty AR: Epidemic of obesity in UK children. Lancet. 1999, 354:1874-1875.
(13) Dagnelie PC, Schuurman AG, Goldbohm RA, Van den Brandt PA:
Diet, anthropometric measures and prostate cancer risk: a review of prospective cohort and intervention studies. BJU International. 2004, 93:1139-1150.
(14) Baranowski T, Weber Cullen K, Baranowski J. Psychosocial correlates of dietary intake: Advancing dietary intervention. Annual Review of Nutrition. 1999, 19:17-40.
(15) de Vries H, Brug J: Computer-tailored interventions motivating people to adopt health promoting behaviours: Introduction to a new approach. Patient Education and Counseling. 1999, 36:99-105.
(16) Kreuter MW, Skinner CS: Tailoring: what's in a name? Health Education Research. 2000, 15:1-4.
(17) Skinner, C., Campbell, M., Rimer, B., Curry, S., & Prochaska, J. (1999). How effective is tailored print communication? Annals of Behavioral Medicine, 21(4), 290-298.
(18) Brug J, Steenhuis I, vanAssema P, deVries H: The impact of a computer-tailored nutrition intervention. Preventive Medicine. 1996, 25:236-242.
(19) Brug J, Campbell M, van Assema P: The application and impact of computer-generated personalized nutrition education: A review of the literature. Patient Education and Counseling. 1999, 36:145-156.
(20) Kroeze W, Werkman A, Brug J: A systematic review of randomized trials on the effectiveness of computer-tailored education on physical activity and dietary behaviors. Annals of Behavioral Medicine. 2006, 31:205-223.
(21) Oenema A, Tan F, Brug J: Short-term efficacy of a web-based computer-tailored nutrition intervention: Main
Chapter 2.6 Original Research
177
effects and mediators. Annals of Behavioral Medicine. 2005, 29:54-63.
(22) De Bourdeaudhuij I, Stevens V, Vandelanotte C, Brug J: Evaluation of an interactive computer-tailored nutrition intervention in a real-life setting. Annals of Behavioral Medicine. 2006.
(23) Vandelanotte C, De Bourdeaudhuij I, Sallis JF, et al.: Efficacy of sequential or simultaneous interactive computer-tailored interventions for increasing physical activity and decreasing fat intake. Annals of Behavioral Medicine. 2005, 29:138-146.
(24) Oenema A, Brug J: Feedback strategies to raise awareness of personal dietary intake: results of a randomized controlled trial. Preventive Medicine. 2003, 36:429-439.
(25) Brug J, Vanassema P, Kok G, et al.: Self-Rated Dietary-Fat Intake - Association with Objective Assessment of Fat, Psychosocial Factors, and Intention to Change. Journal of Nutrition Education. 1994, 26:218-223.
(26) Lechner L, Brug J, De Vries H, et al.: Stages of change for fruit, vegetable and fat intake: consequences of misconception. Health Education Research. 1998, 13:1-11.
(27) De Bourdeaudhuij I, Brug J: Tailoring dietary feedback to reduce fat intake: an intervention at the family level. Health Education Research. 2000, 15:449-462.
(28) De Bourdeaudhuij I, Brug J, Vandelanotte C, Van Oost P: Differences in impact between a family- versus an individual-based tailored intervention to reduce fat intake. Health Education Research. 2002, 17:435-449.
(29) Frenn M, Malin S, Brown RL, et al.: Changing the tide: an Internet/video
exercise and low-fat diet intervention with middle-school students. Applied Nursing Research. 2005, 18:13-21.
(30) Wechsler H, Devereaux RS, Davis M, Collins J: Using the school environment to promote physical activity and healthy eating. Preventive Medicine. 2000, 31:S121-S137.
(31) Bautista-Castano I, Doreste J, Serra-Majem L: Effectiveness of interventions in the prevention of childhood obesity. European Journal of Epidemiology. 2004, 19:617-622.
(32) Brug J, Steenhuis I, van Assema P, et al.: Computer-tailored nutrition education: differences between two interventions. Health Education Research. 1999, 14:249-256.
(33) Vandelanotte C, De Bourdeaudhuij I, Brug J: Acceptability and feasibility of an interactive computer-tailored fat intake intervention in Belgium. Health Promotion International. 2004, 19:463-470.
(34) Vandelanotte C, Matthys C, De Bourdeaudhuij I: Reliability and validity of a computerized questionnaire to measure fat intake in Belgium. Nutrition Research. 2004, 24:621-631.
(35) Hagler AS, Norman GJ, Radick LR, et al.: Comparability and reliability of paper- and computer-based measures of psychosocial constructs for adolescent fruit and vegetable and dietary fat intake. Journal of the American Dietetic Association. 2005, 105:1758-1764.
(36) Sallis J, Pinski R, Grossman RM, et al.: The development of self-efficacy scales for health-related diet and exercise behaviors. Health Education Research. 1988, 3:283-292.
(37) Rossi S, Greene G, Rossi J, et al.: Validation of decisional balance and situational temptations measures for
Chapter 2.6 Original Research
178
dietary fat reduction in a large school-based population of adolescents. Eating Behavior. 2001, 2:1-18.
(38) Prochaska JO, Diclemente CC, Norcross JC: In Search of How People Change - Applications to Addictive Behaviors. American Psychologist. 1992, 47:1102-1114.
(39) Bandura A: Social Foundations of Thought and Action: A Social Cognitive Theory. Englewood Cliffs, New Jersey: Prentice-Hall, 1986.
(40) Ajzen I: From intentions to actions: a theory of planned behavior. Heidelberg: Springer, 1985.
(41) De Vries H, Backbier E, Kok G, Dijkstra M: The Impact of Social Influences in the Context of Attitude, Self-Efficacy, Intention, and Previous Behavior as Predictors of Smoking Onset. Journal of Applied Social Psychology. 1995, 25:237-257.
(42) De Vries H, Dijkstra M, Kuhlman P: Self-efficacy: third factor besides attitude and subjective norm as a predictor of behavioral intentions. Health Education Research. 1988, 3:273–282.
(43) Belgian Food Composition Table, 3th ed (Nubel). Brussels: Ministry of Public Health, 1999.
(44) Dutch Food Compositions Table 1996 (NEVO). Den Haag: Stichting Wevo, 1998.
(45) Brug J: Dutch research into the development and impact of computer-tailored nutrition education. European Journal of Clinical Nutrition. 1999, 53:S78-S82.
(46) Roos E, Lahelma E, Virtanen M, et al.: Gender, socioeconomic status and family status as determinants of food behaviour. Social Science & Medicine. 1998, 46:1519-1529.
(47) McVey G, Tweed S, Blackmore E: Correlates of weight loss and muscle-
gaining behavior in 10-to 14-year-old males and females. Preventive Medicine. 2005, 40:1-9.
(48) Hart KH, Bishop JA, Truby H: An investigation into school children's knowledge and awareness of food and nutrition. Journal of Human Nutrition and Dietetics. 2002, 15:129-140.
(49) Hupkens CLH, Knibbe RA, Van Otterloo AH, Drop MJ: Class differences in the food rules mothers impose on their children: A cross-national study. Social Science & Medicine. 1998, 47:1331-1339.
(50) Brug J, van Assema P: Differences in use and impact of computer-tailored dietary fat-feedback according to stage of change and education. Appetite. 2000, 34:285-293.
(51) Kaaks RJ: Biochemical markers as additional measurements in studies of the accuracy of dietary questionnaire measurements: Conceptual issues. American Journal of Clinical Nutrition. 1997, 65:S1232-S1239.

179
GENERAL DISCUSSION
General discussion
180
The main purpose of this thesis was to evaluate the combined effects of a multi-component
school based healthy eating and physical activity intervention. The multi-component
intervention was developed to promote healthy eating and physical activity behaviours in
order to prevent the increase in overweight and obesity prevalence among adolescents
following technical and vocational education. As suggested by Green and Kreuter’s definition
of health promotion (1990) environmental and educational support for healthy eating and
physical activity behaviour were combined. To get more insight into which components of the
intervention were effective, the mechanisms through which the physical activity intervention
worked and the isolated effects of the nutrition-education component were also evaluated.
The goal of the healthy eating environmental component was to increase the availability of
healthy products like fruit and water and to limit access to unhealthy food items like soft
drinks offered in vending machines and school stores. The educational component consisted
of a youth-based adaptation of a computer tailored intervention to reduce fat intake, which
was found to be effective among adults (Vandelanotte, et al., 2005). The computer tailored
feedback provided students with personalized normative feedback about their current levels of
fat intake. The fat advice indicated the most important sources of fat in the students’ diet and
tips were given on how to replace fatty foods by more healthy alternatives. The final part of
the computer tailored intervention was aimed at providing normative feedback regarding
students’ fruit intake.
The goal of the physical activity environmental component was to provide more opportunities
to be physically active by offering extra-curricular physical activities and by providing game
equipment during recess periods and lunch breaks. The educational component consisted of a
youth-based adaptation of a computer tailored physical activity intervention, which was found
to be effective among adults (Vandelanotte, et al., 2005). The computer tailored feedback
General discussion
181
provided students with personalized normative feedback about their current physical activity
levels and tips on how to develop a more physically active lifestyle. Through the tailored
feedback adolescents were encouraged to use active transportation, to participate in extra-
curricular physical activities at school and to be more physically active in leisure time.
The parental support intervention was aimed at home based involvement of parents. During
the first intervention year parents received a free CD-rom with the adult computer tailored
intervention for physical activity and fat intake to complete at home. Parents were
furthermore involved through correspondence in school papers and newsletters.
The general discussion of this thesis starts with a short description of the results of three
preliminary cross-sectional studies. Findings from the first study, that focused on
measurements issues when comparing physical activity levels in normal weight and
overweight adolescents, are primary discussed. This is followed by a presentation of the main
findings related to influencing factors for nutrition and physical activity among adolescents.
The general discussion further provides an overview of the combined effects of the multi-
component intervention followed by the isolated effects of the computer tailored
interventions. Finally, limitations, strengths, recommendations for further research and
practical implications are formulated.
1. Differences in physical activity between normal weight and overweight adolescents
Several cross-sectional studies have found lower levels of physical activity in
overweight/obese than in normal weight youngsters (Trost, et al., 2001; Mota, et al., 2002;
Deforche, et al., 2003). However results from both cross-sectional and longitudinal studies
differ according to the definition of overweight, age-group, and applied measurements
(Wareham, et al., 2005). The study presented in Chapter 1.1, provided evidence that
methodological issues are important to consider when interpreting results from previously
General discussion
182
conducted studies. Although BMI-based (Cole, et al. 2000) and fat-based classifications
(Taylor, et al., 2003) within the same sample of adolescents showed relatively high levels of
agreement, prevalence rates of overweight differed with more than 4% dependent on
categorisation used. Using fat based cut-off points (Taylor, et al., 2003), 17.4 % was defined
as ‘overfat’, whereas based on the age and sex specific BMI criteria (Cole, et al. 2000) 21.7 %
was categorised as ‘overweight’. Hence, comparing overweight prevalence rates between
different groups or within the same groups over time is only justified when the same
measurements and categorisations were used. This highlighted the importance of using
internationally accepted cut-off points for overweight and obesity to make different study
results comparable.
The results of this study further confirmed findings of the literature that large proportions of
overweight and normal weight adolescents do not meet physical activity recommendations
(Stone, et al., 1998; Sallis, 2000; Kimm, et al., 2002; Biddle, et al., 2004) and that boys are
generally more physically active than girls (Stone, et al., 1998; Pate, et al., 2002; Biddle, et
al., 2004; Currie, et al., 2004).
Although both the BMI-based (Cole, et al. 2000) and fat-based classification (Taylor, et al.,
2003) of overweight provided evidence for differences in physical activity levels between
overweight and normal weight students, results were slightly different for both
categorisations. For example, according to the BMI-based classification (Cole, et al. 2000)
overweight boys and girls were less active in leisure time, whereas according to the fat-based
classification there were no differences for leisure time physical activity. On the other hand,
fat-based classifications (Taylor, et al., 2003) revealed lower levels of sport participation in
overweight girls, whereas these differences were not found using BMI-based classifications
General discussion
183
(Cole, et al., 2000). However, both classifications did agree in finding no differences in time
spent in physical activity of light intensity, active transportation and school related physical
activity. In contrast to our findings, De Bourdeaudhuij, et al. (2005) provided evidence for
lower levels of sport participation and active transportation (to school) among overweight
adolescents. Here again, the methodological differences (broader age range, larger sample
including different educational levels, other methods of analyses) may explain conflicting
findings between our study and the previously conducted study (De Bourdeaudhuij, et al.,
2005).
In conclusion, this study confirmed that physical activity levels are lower in girls when
compared to boys. It also demonstrated that high percentages of overweight and normal
weight children are not engaged in adequate levels of moderate to vigorous physical activity
and this is already the case in 11 to 13 year olds.
Although this study provided some evidence for differences in physical activity levels between
overweight and normal weight adolescents, there were conflicting results dependent on
categorisations used to define overweight. It was demonstrated that methodological issues
(age range, sample sizes, methods of analyses, and definition of overweight) may be largely
responsible for conflicting findings between studies and it highlighted the importance of using
internationally accepted cut-off points for overweight and obesity to make different study
results comparable.
General discussion
184
2. Environmental and psychosocial correlates of eating and physical activity
behaviours in adolescents
The study results presented under Chapter 1.2 and 1.3 showed the importance of considering
environmental next to demographic and psychosocial factors when explaining eating and
physical activity behaviours in 11 to 15 year old adolescents.
The results of the first study provided insight into how different demographic, psychosocial
and family-related factors are related to different eating behaviours (fat, soft drink and fruit)
in adolescents. The results demonstrated the complexity of the relationship between these
factors and eating behaviours, given that different factors were related to different eating
behaviours and that correlates were different in boys and girls.
The entire model explained large proportions of variance in fruit consumption in both boys
(49%) and girls (41%), while explained variances for fat intake (♂=19%; ♀=14%) and soft
drink consumption (♂=21%; ♀=7%) were much lower. Environmental factors added 5% to
the explained variance in fruit intake among boys and 6% among girls. For fat intake and soft
drink consumption among boys, environmental factors increased the explained variance with
10%. Among girls environmental factors contributed less to the explained variance in fat
intake (4%) and soft drink consumption (1%).
Age and socio-economic status were the only demographic factors that were included in the
model. In general, our findings did not support findings from the literature that dietary habits
tend to become less healthy with increasing age (Lien, et al., 2002, Vereecken, et al., 2005).
This was not so surprising because there was a narrow age-range; the age range was 11 to 15
years. In contrast to findings from other studies, there were no overall influences of socio-
General discussion
185
economic status. Since our study was conducted among lower educated adolescents who often
have lower educated parents with lower social status (Van Damme et al., 1997), the limited
variance in socio-economic status could explain why no overall influences of socio-economic
status were found. A lower socio-economic status was only associated with higher soft drink
consumption among boys and lower fruit intake among girls.
The results regarding the psychosocial determinants were inconsistent. For example, a better
attitude was associated with a higher fruit intake and lower fat intake in both genders, but it
was not related to soft drink consumption. Self-efficacy was important for explaining fruit
intake in both genders, but not for explaining soft drink and fat intake. Perceiving more
benefits was important for fruit intake in boys, but not in girls; whereas it was important for
explaining fat intake in girls, but not in boys. The results were only consistent in finding no
associations between social supports and eating behaviour, which is in agreement with
findings from a previous study among Flemish adolescents (De Bourdeaudhuij & Van Oost,
2000).
The main purpose of the study was to look at the influence of environmental factors. Based on
findings from the literature (Hanson et al, 2005; Bere & Klepp, 2004; Taylor et al, 2005) four
environmental factors were included: 1) availability of healthy products, 2) availability of
unhealthy products, 3) family food rules and 4) influence of television. These environmental
factors were all related to one or more eating behaviours, but relationships were again
inconsistent according to the specific eating behaviour and gender. Gender might be an
important factor to consider when designing interventions to enhance eating behaviours in
adolescents. Boys’ fat and soft drink consumption increased when availability of unhealthy
products increased. Among girls, fruit intake increased when availability of healthy food
General discussion
186
products increased. Hence, decreasing availability of unhealthy products may be more
important for boys, whereas increasing availability of healthy products may be a more
effective strategy among girls. Setting rules that restrict the consumption of unhealthy
products and limit the time spent in commercial television watching may be important for
both genders. Although social support defined as encouragement from family, friends and
teachers was not associated with eating behaviours, the findings above suggest that parents
can play an important role in influencing adolescents’ eating behaviours, indirectly through
their influence within the family environment. Direct parental support in forms of
encouragement could be more important in younger children as compared to adolescents, as
adolescence is typically characterized by increased independency from home (WHO, 2005).
The entire model, including demographic, psychosocial and environmental factors, was not
predictive for soft drink consumption among adolescent girls. This implies that other factors
should be considered for this behaviour. The home environment is just one small part of the
broader environment in which adolescents live. Other environments like the school
environment might be more influential for soft drink consumption. One study in Flemish
secondary schools already revealed that pupils were more likely to consume soft drinks every
day, if soft drinks were available at school and if there were no school rules regarding soft
drink consumption (Vereecken, et al., 2005).
The results of the second study (Chapter 1.3) provided insight into how demographic,
psychosocial and environmental (home, school) factors are related to physical activity among
adolescents.
In agreement with the literature (Sallis, 2000; Pate, et al., 2002; Currie, et al., 2004), a
negative relationship between age and physical activity was generally found, however not so
surprisingly this was not significant given the relative narrow age range of 11 to 15 years old.
General discussion
187
Physical activity levels were furthermore found to be unrelated to socio-economic status,
defined as a composite of occupation, which is also in accordance with findings from
previous studies (Sallis, et al., 2000).
With regard to the psychosocial determinants, a better attitude, higher self-efficacy and more
perceived benefits were predictive of higher total physical activity levels, whereas increased
social support and perceived barriers were not. In contrast, De Bourdeaudhuij, et al (2005) did
find that specific forms of social support (family and friends) and specific barriers (lack of
time and interest) were important while others were less imperative.
Till now, only one study (Fein et al., 2004) investigated the additional value of including
environmental determinants next to psychosocial determinants in order to explain physical
activity levels of adolescents. In that study significant relationships between availability of
resources and physical activity disappeared when controlling for more common predictors
(Fein et al., 2004). Our results, however, showed that environmental factors added to the
explained variance in total physical activity. In boys, 33% of the variance in total physical
activity was explained by demographic and psychosocial determinants, environmental factors
increased the explained variance with 5%, whereas in girls 22% was explained by
demographic and psychosocial determinants and environmental factors only added 1%. It is
not clear why environmental factors were more important in explaining total physical activity
in boys, but our findings suggested that boys are more influenced by school- and home
physical activity related environmental factors than girls.
For boys the presence of physical activity equipment at home was a significant predictor of
total physical activity and this is in line with findings from a similar study in Flemish adult
General discussion
188
males (De Bourdeaudhuij et al., 2003). The frequency of physical activities organized at
school was an important factor for both boys’ and girls’ total physical activity levels.
The influence of school-environmental factors on participation in extracurricular physical
activities was also investigated. For participation in extracurricular physical activity at school,
environmental factors were equally important in boys and girls, explaining 5% of the
variance. Whereas the frequency of organized physical activities at school was important for
boys’ levels of physical activity at school, the presence of supervision was more important for
girls.
In conclusion, the first study provided insight into how family related environmental factors
are related to different eating behaviours in adolescents, the second study into how home and
school environmental factors are related to physical activity in adolescents. The findings of
both studies suggested that different environmental factors are related to different eating
behaviours or types of physical activity and that influencing factors are different in boys and
girls. Although environmental factors contributed to the explained variance in eating and
physical activity behaviours, a considerable proportion of the variance in behaviour
remained unexplained. A more comprehensive environmental questionnaire should be
developed to find out if other environmental factors (e.g. costs to participate in activities in
the neighbourhood) can explain more of the variance in behaviour.
3. Main findings of the multi-component healthy eating and physical activity
intervention
The main effects of the multi-component healthy eating and physical activity intervention
were evaluated under Chapter 2.1-2.4.
General discussion
189
In Chapter 2.1 the one year post intervention effects on eating behaviours were evaluated, the
two year post intervention effects on eating behaviours were presented under Chapter 2.3.
Adolescents eating behaviours were evaluated using validated food frequency questionnaires
for fat, fruit and soft drink consumption. At baseline very high percentages of boys and girls
did not meet fat and fruit intake recommendations and soft drink consumption was very high.
Such unhealthy dietary habits are putting adolescents at greater risk for immediate and also
chronic problems (WHO, 2003; License, et al., 2004) and since eating habits are likely to
further deteriorate in adolescence (Lien, et al., 2001), finding successful ways to promote a
healthy diet among adolescents was an essential objective of this thesis.
Most previously conducted interventions were not so successful at targeting eating behaviours
among adolescents (Thomas, et al., 2004) and they were more likely to be effective if
classroom curricula were combined with environmental strategies and parental involvement
was included (O'Neil & Nicklas, 2002; Lytle, et al., 2004).
Within the present study, a multi-component approach lead to mixed effects on eating
behaviours. No positive effects on fruit and soft drink consumption were found and although
the intervention showed potential to effectively target fat intake among adolescent girls, no
effects were found in boys.
Among girls, there were positive one year post intervention effects on fat intake that were
sustained after two years of intervention. After the first intervention year, fat intake decreased
with on average 12 grams per day in the intervention with parental support group, with on
average 10 grams per day in the intervention group and with only 4 grams per day in the
control group. Although after the first intervention year, effects were only present in the
intervention group with parental support, after the second intervention year positive effects
were present in both intervention groups. During the second intervention year fat intake
General discussion
190
further decreased in both intervention groups, and after two years an average decrease of 20
grams/day was found in the intervention groups, while in the control group fat intake
decreased with on average 10 grams/day less. The multi-component intervention combined
computer-tailored feedback with environmental changes. Fat intake was mainly targeted by
the personalized computer tailored intervention. It was therefore assumed that the
personalized computer tailored feedback was an indispensable intervention component for
addressing fat intake in girls. The isolated effects of the computer tailored fat intake
intervention were investigated in a separate study and are further discussed.
The lack of intervention effects on fruit intake was somewhat disappointing. After the first
intervention year results were fairly hopeful, as fruit intake remained stable in the intervention
groups, while it decreased with 0.5 servings a week in the control group. However, students in
the control group recuperated their baseline fruit intake levels after the second intervention
year, while fruit intake still remained stable in the intervention groups. There might be several
reasons why the intervention was not effective for increasing fruit intake among adolescents.
First of all, fruit was offered to the students during lessons or breaks, just once a week, which
may not have been frequent enough. However, ordering, picking up and distributing the fruit
once a week required a lot of extra efforts from teachers, and it is questionable if it would be
feasible to offer fruit more frequently. A second reason for the lack of positive effects on fruit
intake could be that the computer tailored feedback for fruit intake was delivered together
with the computer tailored feedback for fat intake. It consisted only of normative feedback
that was presented after the fat intake advice. From the study presented in Chapter 2.6, it
became clear that most adolescents evaluated the computer tailored fat advice as too long.
One forth reported not to have read the advice and an additional 22% reported not to have
General discussion
191
read the advice entirely. Therefore it is also possible that large proportions of students did not
read the additional information related to their fruit intake that was presented at the very end.
Although we also focused on parental involvement, more intensive interventions combining
parental involvement with multiple classroom sessions and cafeteria promotion of fruit intake
were more successful in increasing fruit intake among adolescents (O’Neil, et al., 2002; Lytle,
et al., 2004). The Planet Health (Gortmaker, et al., 1999) intervention that consisted of 33
nutrition lessons spread over two school years was also effective for increasing fruit intake,
but only among girls.
The intervention was also not effective for decreasing soft drink consumption, which is
probably due to an ineffective implementation. Only when an intervention is implemented as
intended, intervention effects are expected. During the process evaluation interviews with the
principals and other members of the working group, it became clear that the huge incomes
schools receive from selling soft drinks in shops and vending machines were a motive for
neglecting the importance of removing these unhealthy products from the school
environment. Although water was made available at lower price or for free, this was not
sufficient to increase water consumption or decrease soft drink consumption. As there was
also no computer tailored intervention for soft drink consumption, not so surprisingly there
were no intervention effects for this behaviour.
To our knowledge, there is only one previously conducted intervention study that was aimed
at increasing water consumption and decreasing soft drink consumption among adolescents
(Loughridge & Barratt, 2005). In that study water cooler sites were introduced in the school
cafeteria and water promotion lessons were provided. The intervention resulted in increased
water consumption, but soft drinks consumption remained static.
General discussion
192
From the results presented in Chapter 1.2 it appeared that boys’ soft drink consumption is
related to the influence of television and advertisements. It is possible that intervention
strategies to reduce soft drinks will not be able to compete with the advertisements and strong
image build by the soft drink producers.
Further research should point out if such water promoting intervention (Loughridge & Barratt,
2005) combined with a soft drink restriction intervention (decreasing availability of soft
drinks and lessons about the importance of reduced soft drink consumption) might be
successful for reducing soft drink consumption of adolescents. However, our study results
suggest that governmental laws may be necessary to convince principals to restrict the
availability of soft drinks within the school environment.
Chapter 2.2 presented the one year post intervention effects on physical activity. The two year
post intervention effects on physical activity behaviours were evaluated under Chapter 2.3.
Adolescents physical activity behaviours were evaluated using a validated questionnaire in
the total sample and using accelerometers in a sub sample of adolescents.
Self-reported data allowed evaluation according to the context of the activities. It appeared
that combining environmental changes with computer tailored interventions can be an
effective strategy to increase adolescents’ engagement in school-related physical activity.
After the first intervention year, school related physical activity increased with on average 47
minutes per week in the intervention group with parental support, with on average 32 minutes
per week in the intervention alone group, while it remained stable in the control group. These
intervention effects were sustained after two years, but only in boys. These results reflected
that more efforts should be undertaken to keep girls motivated to participate in school related
General discussion
193
physical activities. Activities that are non-competitive and appealing to girls such as dancing
and rope skipping should be more frequently offered. It is furthermore very important for girls
to provide supervision during the physical activity sessions (see Chapter 1.3).
The mechanisms through which the physical activity intervention yielded effects on school
related physical activity were evaluated under Chapter 2.5. In that study mediation analyses of
change in psychosocial determinants on change in physical activity over a 1 year period
showed that intervention effects were partially mediated through changes in self-efficacy and
social support. By increasing physical activity opportunities at school, students may have felt
more confident that they could be active regularly at their school. Physical activity self-
efficacy may specifically be enhanced through successful experiences as special attention was
given in the program to varying the content of the physical activities offered in order to reach
all students. In addition, the comprehensive school intervention could have led to more
perceived support from family members, friends and teachers to be active at school. The
computer-tailoring part of the intervention also included specific feedback on all the
psychosocial determinants. Specific for self-efficacy it focused on explaining how being
active could be ‘easier’ by using active transportation to school and by participating in
extracurricular physical activities. For social support the personalised feedback gave the
advice to be active with friends at school.
Consistent with these longitudinal findings, self-efficacy was the strongest psychosocial
predictor of total physical activity and participation in extracurricular physical activities
among boys and girls, in the cross-sectional study presented under Chapter 1.3. However, in
that study social support was related to total physical activity and it was only related to
participation in extracurricular physical activities among girls.
General discussion
194
The intervention was not effective in increasing leisure time physical activity. One
explanation for the lack of positive effects on leisure time physical activity after the first year
could be the timing of the intervention period. The intervention started in October and
subscriptions in most sports clubs take place in August or September. However, after two
intervention years there were still no positive intervention effects on leisure time physical
activity. Therefore, a more reasonable explanation is that the intervention was primarily
school-based. Perhaps interventions designed to target leisure time physical activities, should
be community- rather than school-based. The short-term results of ICAPS (Intervention
Centred on Adolescents' Physical Activity and Sedentary behaviour) (Simon, et al., 2003),
that was aimed at targeting the community (club educators, community agencies, recreational
areas and transportation infrastructures) showed promising effects of intervening in a broader
context. Although in the present study efforts were made to increase parental support,
intervening in a broader social context than the school and home environment seems to be
required to assess positive intervention effects on leisure time physical activities.
After the first intervention year, there were clear positive intervention effects on time spent in
moderate to vigorous physical activity measured by accelerometers in both boys and girls, but
only when parental support was included. In the intervention group with parental support time
spent in physical activity of moderate to vigorous intensity increased with on average 28
minutes per week, in the intervention alone group and the control group mean decreases with
respectively 14 and 47 minutes per week were found. These results suggested that
instrumental parental support behaviors such as providing transportation, financial support
and encouragements could be critical for increasing participation in physical activity of
moderate to vigorous intensity among 11 to 15 year old adolescents. The results after two
years of intervention were slightly different. Again, intervention effects only sustained among
General discussion
195
boys. However, these results are not further discussed, as there were only 12 boys left in the
control group and it is questionable if this group was representative, as they were clearly more
physically active at baseline.
From a public health perspective, the one year post intervention effects on school related
physical activity and physical activity of moderate to vigorous intensity found in both boys
and girls were very encouraging. The goal of the second intervention year was the
continuation of initiatives which were implemented during the first school year. During this
second year more autonomy was given to the schools. This increase in autonomy and
decrease in external guidance and support from research staff was aimed at creating a ‘real
life situation’ in which schools can take over the intervention themselves after one year of
support. Hence it was hypothesized that the second intervention year would not lead to
additional positive outcomes but we hoped that positive intervention effects on physical
activity and fat intake would be sustained. However, the two year post intervention effects
revealed that intervention effects on school related physical activity and physical activity of
moderate to vigorous intensity did not sustain among girls. These results were somewhat
disappointing, as especially girls are typically at risk for low levels of physical activity (Sallis,
et al., 2000; Pate, et al., 2002; Trost, et al., 2002; Biddle, et al., 2004; Currie, et al., 2004).
However, the positive one-year post effects for preventing decreases in physical activity of
light intensity were sustained after two years in both genders. The declines in physical activity
of light intensity, as seen in the control group, support previous findings that physical activity
declines during adolescence (Sallis, 2000).
Till now, few intervention trials were aimed at primary prevention of overweight and few
showed impact on weight status of adolescents (Summerbell, et al., 2005; Wareham, et al.,
General discussion
196
2005). The results presented in Chapter 2.4 showed that our multi-component intervention
was effective for preventing increases in BMI among girls, but not among boys. The results
after the first intervention year already pointed towards a less steep increase in BMI and these
positive effects became even clearer after the second intervention year. However positive
effects on BMI among girls were only obtained when environmental changes and computer
tailored feedback was aimed at both adolescents and their parents.
The gender differences in results may have been caused by a combination of several factors.
First, effects may have been more pronounced in girls as a result of the better implementation
in typical girl-schools (Chapter 2.4). Secondly, girls have changed there eating behaviours in
a more healthy direction when compared to boys, as the findings discussed above showed that
the intervention was effective for decreasing fat intake only among girls.
Next to the school, the home is a fundamental part of adolescents’ living environment. Parents
are influencing adolescents’ physical activity and eating behaviours considerably.
Parental support seemed to be required to assess positive intervention effects on BMI after
one and two years. BMI increases as a result of an imbalance of the energy balance (Reilly &
Dorosty, 1999; Lobstein, 2004). One side of the energy balance is energy intake. After one
year of intervention, fat intake decreased among girls but only in the intervention group with
parental support. Although, at first sight the results suggested that parental support was
essential to prevent increases in BMI, it is hard to draw straightforward conclusions. In the
intervention group with parental support 40% of the students were girls, whereas in the
intervention alone group only 16% were girls. This may have biased the results in several
ways. Combining the fact that process evaluation measures showed that the intervention was
better implemented in typical girls’ schools and that the dietary intervention was only
General discussion
197
effective among girls, it is not clear whether the higher percentage of girls in the intervention
group with parental support or the parental intervention component itself caused the
differences in effectiveness for overweight prevention between the intervention with and
without parental support.
Differences in BMI between girls in the intervention group with parental support and the
control group were significant, but were relatively small and are not supposed to lead to
immediate or long term health benefits. It is however unrealistic to expect dramatic changes
in BMI, given the level of intensity of the primary prevention program targeted at a
population that has a relatively healthy weight. The relevance of the intervention effects on
BMI is that the increases in prevalence rates of overweight (as were found in the control
group) were prevented in the intervention group with parental support. In the control group
prevalence rates increased with on average 1.7% over 2 school years, while in the intervention
group with parents a decrease with 3.1% was found.
Among girls positive intervention effects were found for fat intake, whereas among boys
intervention effects were especially clear for physical activity. Changes in energy intake (fat
intake) were probably required to assess intervention effects on BMI, as these were only
present in girls. Among boys, the intervention only succeeded in the energy expenditure side
of the energy balance, which was insufficient to prevent increases in BMI. Regarding the
importance of involving parents it was impossible to draw straightforward conclusions.
As all intervention effects were studied in the total sample and not in those students at risk for
unhealthy behaviours or overweight, no insight was provided into which subgroups of
students changed their behaviour.
General discussion
198
4. Evaluation of the computer tailored fat intake intervention
From the results of the multi-component intervention described in Chapter 2.1-2.3 it appeared
that using computer-tailored interventions in adolescents could be a promising intervention
strategy. Classroom computer-tailored health education could have lots of potential, since
little time, few resources and costs are needed to implement such interventions, given the
opportunities to provide tailored interventions through the internet. So far however, only one
study (Frenn & Malin, 2003) reported positive effects of a classroom-delivered personalized
computer-tailored intervention to target fat intake among adolescents.
A separate study was set up to evaluate the isolated effects of the computer tailored fat intake
intervention. The study was described under Chapter 2.6 and it was one of the first studies in
which a computer-tailored intervention to reduce fat intake was adapted and evaluated in
adolescents. Both acceptability/feasibility and effectiveness were investigated in both students
of technical/vocational education and of general education. The results showed that
adolescents liked the use of a computer and they had no problems with the diagnostic tool,
except that there were too many questions. However, they were less positive about the
tailored advice. Most adolescents did not perceive the advice as interesting, new, personally
relevant, and correct. In addition half of the students indicated that the advice was too long
and one fourth of the students reported not having read the advice. Hence, not so surprisingly
there were no overall intervention effects. In accordance with the findings from the multi-
component intervention, the data only showed a positive impact among girls following
technical-vocational education, which may have had several explanations. Girls reported more
often that they had read the advice, when compared to boys. When compared to girls from
general education, girls from technical-vocational education more often evaluated the advice
personally relevant, good and less often as confusing. In addition this group more often
planned to use the advice. Secondary analyses revealed that the tailored feedback also had a
General discussion
199
positive impact on fat intake in boys and girls following general education, on the condition
that they had read the advice. Only in boys following technical and vocational education
effectiveness was not shown. Although this is in line with the findings of the multi-
component intervention, results should be interpreted with caution. The group of lower
educated boys only consisted of 9 students of whom 3 students reported to have read the
advice.
In conclusion, the positive impact of the tailored intervention was demonstrated among
adolescents who made the effort to read the advice. Within the multi-component intervention
students were obliged to read the advice during lessons. They also had to complete a task
with questions related to their personal advice. However, when students had to read the
advice independently most of them felt that there was too much information.
Although further adaptations may improve the acceptability and feasibility of the computer
tailored intervention for adolescents, the positive impact of the computer tailored was shown
in two different studies. Given that computer tailored fat intake education has the capability
of reaching large groups at low cost and with little time, this research shows that using such
interventions in adolescents has potential.
5. Strengths and limitations, directions for future research and practical implications
5.1 Strengths and limitations
The studies described within this doctoral thesis have several strength and limitations that
relate to the measurements, the study designs and implementation of the interventions.
With regard to the measurements, it is a strength of the studies presented in this thesis, that
height and weight were measured in a large sample of 2840 adolescents and that physical
activity was measured more objectively through accelerometers in a relatively large
General discussion
200
subsample of 258 adolescents. Although, accelerometers are objective and re-useable tools for
assessing physical activity, accelerometers only measure movements in the vertical plane and
are limited in their ability to assess activities with limited upper body movement like cycling.
Another problem with the use of accelerometers in an adolescent sample is the lack of
consensus on which epoch times and cut-off points are the most appropriate to use (Freedson,
et al., 2005, Puyau, et al., 2002, Ward, et al., 2005).
Other measurement limitations relate to the use of self-reported data to measure
environmental factors and dietary and physical activity behaviours. Although self-reports may
be used as a measure of the perceived environment, other measures such as geographical
information systems (GIS) may give the opportunity to measure the actual environment
(Porter et al, 2004). Self-reported behavioural data are more often biased by social desirability
and inaccurate responses. This may have resulted in an overestimation of healthy behaviours
(fruit intake, physical activity) and an underestimation of unhealthy behaviours (fat and soft
drink consumption). And although all questionnaires were evaluated as valid and reliable
measurement tools, this may have biased the results regarding the effectiveness of our
intervention.
Biomarkers may be used to measure eating behaviours more objectively. However, in larger
field trials it is hardly impossible to use such complex and expensive methods that increase
the burden of participants. Alternatives to food frequency questionnaires are food diaries, 24-
hour recalls and diet history methods. In our studies 7 day diaries were also used. Diaries
were delivered during classes and instructions on how to complete the diaries were given once
at the beginning of the week. However, many students did not follow the instructions and
most diaries were completed inaccurately. A daily visit of the researchers to the classroom
could have solved this problem (Vereecken & Maes, 2003). However, due to financial and
time constraints this was not realizable.
General discussion
201
The first three studies were cross-sectional. Although these studies were important for
understanding relationships between factors that influence eating and physical activity
behaviours, longitudinal or prospective studies are required to draw causal conclusions. As in
the studies presented in this thesis, adolescents were measured at three points in time; data
sets to explore these longitudinal relationships are already available.
Strengths of the intervention studies were the quasi randomized controlled experimental
designs with high participation rates.
Randomization is assumed to create equal study groups which should ascertain internal
validity. Randomization at the class level, applied to evaluate the intervention effects of the
computer tailored fat intake intervention, was successful in ruling out baseline differences
between intervention and control group. However, the randomization at the school level, used
in the studies evaluating the multi-component intervention, was less successful in ruling out
baseline differences conditions. For example, the percentage of boys and girls was not equally
distributed across conditions. The differences in percentage of boys and girls between
conditions were due to the unequal distribution of typical boys’ and girls’ schools across
conditions. Boys’ oriented schools offer education in engineering, mechanics,…, where as
girls’ oriented schools offer education in nursing, cooking,… To deal with the unequal
distribution of gender across conditions, interaction terms (e.g. “Gender by condition”) and
baseline values (e.g. age, baseline physical activity levels) were entered as covariates and
school was nested within condition into the statistical analyses. However, these baseline
differences made straight forward conclusions regarding the parental support condition
impossible.
General discussion
202
Most of the studies presented in this thesis were conducted among students following
technical and vocational education. Lower educated adolescents often have lower educated
parents with lower social status (Van Damme et al., 1997) and a lower social status is often
associated with unhealthy behaviours. It is therefore a strong point of the studies presented in
this thesis that they were conducted among a population at risk for unhealthy behaviours.
Although most studies presented in this thesis had relative large sample sizes, significant
interaction effects often required secondary analyses in smaller subgroups. This may have
resulted in less representative samples but also in insufficient power to detect intervention
effects. For example, the results presented in Chapter 2.2 and 2.5 were conflicting regarding
the presence of intervention effects on leisure time physical activity. However, in the second
study both intervention conditions were taken together (as this is required to perform
mediation analyses) and interactions with gender were not investigated, which may have
resulted in a larger power to detect intervention effects.
Effective implementation of an intervention is essential for an intervention to be effective.
Only when the interventions were implemented and students were exposed to it, the effects
can be subscribed to the intervention. Insufficient implementation may cause lack of
intervention effects.
Implementation of a multi-component healthy eating and physical activity intervention in a
middle school setting was difficult to optimize for several reasons. First of all, in order to
increase fidelity to the intervention, principals and teachers needed to be convinced of the
importance of their role in promoting healthy eating and physical activity. They often felt that
it was not their responsibility to devote some of their time to the implementation of the
intervention. Some teachers also argued that other health-related issues such as sexuality,
General discussion
203
alcohol and drug use prevention should receive a higher priority. Although, in every school a
select group of teachers was enthusiastic about implementing the intervention, they were
often discouraged by the limited interest from teachers and staff that were not directly
involved. Secondly, every school had its specific school context. Unchangeable factors within
the school environment enhanced or limited opportunities for promoting healthy eating and
physical activity. To avoid resistance, it was important to give principals and teachers
sufficient freedom to work within their own possibilities.
The interventions were fully implemented by the school staff. Thus the results of the
intervention studies give a realistic view on how effective the intervention would be, if
implemented on a larger scale. However, this strength may also have resulted in large
variability of implementation between schools.
To explain how implementation levels influenced intervention effects, processes of
implementation were measured through questionnaires. Despite this, the lack of objective
process evaluation data is a limitation of the present study.
The results presented under Chapter 2.3 suggested that intervention effects sustained as a
result of the continuation of the intervention during the second intervention year. It is not
clear if the second intervention year per se was responsible for these sustained improvements.
The first year of the intervention per se, may have been sufficient to result in sustained
behavioural changes. To get more insights into the isolated effects of the second intervention
year, an additional control group would have been needed, in which students were only
exposed to the first intervention year and not to the second intervention year.
Another strong point is the use of a new intervention type, namely a computerized tailored
intervention which was used for the first time in adolescents. For the evaluation of the
General discussion
204
computer tailored fat intake intervention (Chapter 1.9) a more controlled setting was used,
since it was delivered through classes under supervision of the researcher. However, also in
that study, self-reported process evaluation measures were used to assess if the information
was read.
5.2 Directions for future research
Further research that has been planned based on the results of the studies presented in this
thesis is briefly described. Further, some suggestions or possibilities for future research are
formulated.
To get a better understanding of the relationships between environmental factors that are
important for adolescents eating and physical activity behaviours, it is first necessary to
develop a valid and reliable comprehensive environmental questionnaire. Next, longitudinal
studies are required to predict the impact of environmental factors on eating and physical
activity behaviours. Longitudinal data are also required to predict how environmental changes
may predict changes in behaviour.
Although multi-component interventions are assumed to be more effective, more controlled
efficacy trials are needed to examine what intervention components, implemented under
optimal conditions, are more or less effective to achieve behaviour change among
adolescents. For example, the isolated effects of offering fruit more than once per week, of
removing soft drinks from the school environment and of offering the computer tailored
physical activity intervention would be worth investigating.
General discussion
205
As from the study under Chapter 2.6 it appeared that large proportions of students reported
that the computer tailored fat intake intervention contained too much information, future
research directions should aim at investigating the impact of a shorter version of the same
intervention.
Mediation analyses may provide insight in the mechanism through which the computer
tailored interventions worked. The study presented under Chapter 2.5 showed that messages
related to self-efficacy and social support may be very important for the physical activity
tailored advice. For the fat intake tailored advice, further research should make it possible to
select the most important pieces of information and to determine which blocks of information
were redundant. Adaptations to the content of the information that might increase personal
relevance, interestingness and novelty for adolescents should be tested. Critical hours of
exposure should be determined and long-term impact of the intervention should be
investigated.
Interventions that are not implemented as intended are not likely to be effective. Hence, future
research directions should move one step forward towards the development of strategies to
get the whole community (parents, schools, policy makers,…) involved. For example,
removing soft drinks out of the school environment may be effective, but how do we advocate
this to the schools? Similar challenges exist within the community at large.
5.3 Practical Implications
The practical implications of this thesis relate most of all to the findings of the intervention
studies. The multi-component intervention promoting healthy eating and physical activity was
found to be effective for improving eating and physical activity behaviours in middle school
General discussion
206
adolescents. The intervention was designed with one eye towards dissemination and
favourable effects of larger scale implementation may thus be expected.
The implementers of the intervention were principals and classroom teachers. The
intervention was built to make flexible adaptation to every school context possible and the
intervention manual gave clear and precise information on how the intervention should be
implemented. The computer tailored interventions were provided on CD-rom and were self-
explanatory. Thus the intervention program was ready to use.
By the end of the research study, promotion of healthy eating and physical activity through
schools received higher priority at the national level, as four ministers signed a consensus
statement regarding health promotion at school. Hence, health promoting organizations were
also more interested in implementing these issues. All intervention materials were turned over
to the Flemish Institute for Health Promotion (VIG) and the ‘Stichting Vlaamse Schoolsport’
(SVS) for dissemination and it was made available over the internet (www.fitteschool.be). At
the same time, workshops and training sessions for teachers were organized in five Flemish
provinces. Some suggestions for increasing the effectiveness of the healthy eating and
physical activity intervention are given below:
• Results of the two studies in which the computer tailored fat intake intervention was
evaluated, suggested the need for effective strategies to motivate students to read the
tailored fat intake advice. Within the multi-component intervention students were
obliged to read the computer tailored feedback as they had to complete a task in which
questions related to their personal advice were asked. Shortening the length of the
questions and messages of the tailored advice could also increase the likelihood that
students will make the effort to read the entire advice.
• Offering fruit during breaks just once a week appeared to be insufficient to increase
adolescents’ fruit intake. Results from previous intervention studies (O’Neil, et al.,
General discussion
207
2002; Lytle, et al., 2004) suggested that the combination of parental involvement,
multiple classroom session and cafeteria promotion of fruit intake might be more
effective. The cafeteria may well be the most convenient place to offer fruit. In the
cafeteria, a large variety of fruits can be offered, whereas on the other hand some fruits
are not ready to eat during breaks. Another advantage of offering fruits in the cafeteria
is that catering staff can be involved for ordering, distributing and promoting fruit
intake. On the other hand, by promoting fruit in the cafeteria, some students may not
be reached as not all students consume their meals at school.
• Making water available at lower price or for free, was not sufficient to increase water
consumption or decrease soft drink consumption. To decrease soft drink consumption
among adolescents the combination of restricting the availability with lessons about
the importance of drinking water in stead of soft drinks may be more effective. The
use of point-of-decision prompts, such as labels to indicate healthy and unhealthy
beverages should also be evaluated as a strategy to decrease soft drink consumption.
• Secondary schools should be encouraged to make sports materials available during
breaks and to organize extra physical activities during and after school hours.
Especially among boys these strategies appeared to be effective to increase physical
activity at school. Special attention should be given to keep girls motivated to use the
sports materials and to participate in school related physical activities by providing
activities that are enjoyable for girls (e.g. dancing or rope skipping).
Providing extracurricular activities is not part of the job description of physical
education or other teachers and these activities are mainly organized by volunteers. To
encourage every secondary school to organize extra physical activities for their
students it might be necessary to provide physical education teachers with an
additional valorised function to promote physical activity at school.
General discussion
208
• Providing teachers with didactical guidelines that promote high activity levels during
physical education lessons may be an effective strategy to increase participation in
MVPA during physical education classes. The effects of applying health-related
didactical guidelines should be investigated in Flemish secondary schools, as
including such component could further increase the intervention effects on physical
activity.
• To increase leisure time physical activity more attention should be paid to the
promotion of a physically active lifestyle.
The computer-tailored physical activity intervention may serve as a health education
tool to promote lifelong physical activity. The physical activity advice provides
information on the importance of being active and tips on how to create an active
lifestyle. However, it could be more important to involve actors at the community
level to increase participation in leisure time physical activity.
• Social-ecological and social-cognitive theories emphasized the importance of the
interaction between the individual and environmental factors in influencing health
behaviours. Within the present healthy eating and physical activity intervention, the
responsibility of the individual was targeted through the computer tailored
interventions. However the choice of the individual to go for health was supported by
the environmental changes. For example: the tailored physical activity advice
encouraged students to participate in physical activities at school and at the same time
more extracurricular physical activities were organized. Modern public health
promoters that strive for maximizing the health benefits for the highest number of
people should take into consideration both the individual and higher level
responsibilities, and health promoting actions should be undertaken at different levels.
It is of no use to motivate people to cycle to work, if there are no safe roads to cycle
General discussion
209
on. On the other hand, it may not be sufficient to provide safe cycle roads, if people
have no intention to cycle to work and education on health promotion is not provided.
Therefore, it might be important to get all actors at different levels involved. The
school can not be the only institute responsible for the promotion of health behaviours
among adolescents; healthy eating and physical activity promotion should be a shared
responsibility between school, family and community. Intervening in the broader
environment by involving parents, club educators and community agencies and by
targeting recreational and transportation infrastructures might be more promising. We
will never be able to create an environment in which healthy choices are the only and
obligated option. Hence, it will always remain important to appeal to the individuals’
responsibilities.
All studies presented in this thesis were carried out by the Policy Research Centre for Sport,
Physical Activity and Health, a consortium of researchers from KULeuven, Ghent University
and VUBrussel funded by the Flemish Government.
General discussion References
210
REFERENCES Bere, E., & Klepp, K. I. (2004). Correlates of fruit
and vegetable intake among Norwegian schoolchildren: parental and self-reports. Public Health Nutrition, 7(8), 991-998.
Biddle, S. J. H., Gorely, T., & Stensel, D. J. (2004). Health-enhancing physical activity and sedentary behaviour in children and adolescents. Journal of Sports Sciences, 22(8), 679-701.
Cole, T. J., Bellizzi, M. C., Flegal, K. M., & Dietz, W. H. (2000). Establishing a standard definition for child overweight and obesity worldwide: international survey. British Medical Journal, 320(7244), 1240-1243.
Currie, C., Roberts, C., Morgan, A., Smith, R., Settertobulte, W., Samdal, O., & Barnekow Rasmussen, V. (2004). Health Behaviour in School-Aged children (HBSC) study: international report from the 2001/2002 survey (No. 4). Copenhagen: World Health Organization.
De Bourdeaudhuij, I., Lefevre, J., Deforche, B., Wijndaele, K., Matton, L., & Philippaerts, R. (2005). Physical activity and psychosocial correlates in normal weight and overweight 11 to 19 year olds. Obesity Research, 13(6), 1097-1105.
De Bourdeaudhuij, I., Sallis, J.F., & Saelens, B.E. Environmental correlates of physical activity in a sample of Belgian adults. (2003) American Journal of Health Promotion. 18, 83-92.
De Bourdeaudhuij, I., & Van Oost, P. (2000). Personal and family determinants of dietary behaviour in adolescents and their parents. Psychology and health, 15, 751-770.
Deforche, B., Lefevre, J., De Bourdeaudhuij, I., Hills, A. P., Duquet, W., & Bouckaert, J. (2003). Physical fitness and physical activity in obese and nonobese Flemish youth. Obesity Research, 11(3), 434-441.
Fein, A. J., Plotnikoff, R. C., Wild, T. C., & Spence, J. C. (2004). Perceived environment and physical activity in youth. International Journal of Behavioral Medicine, 11(3), 135-142.
Frenn, M., & Malin, S. (2003). Diet and exercise in low-income culturally diverse middle school students. Public Health Nursing, 20(5), 361-368.
Freedson, P. S., Pober, D., & Janz, K. (2005) Calibration of accelerometer output for children. Medicine and Science in Sports and Exercise, 37(11), 523-530.
Gortmaker, S. L., Peterson, K., Wiecha, J., Sobol, A. M., Dixit, S., Fox, M. K., & Laird, N. (1999). Reducing obesity via a school-based interdisciplinary intervention among youth - Planet health. Archives of Pediatrics & Adolescent Medicine, 153(4), 409-418.
Green, L. W., & Kreuter, M. W. (1990). Health Promotion as a Public-Health Strategy for the 1990S. Annual Review of Public Health, 11, 319-334.
Hanson, N. I., Neumark-Sztainer, D., Eisenberg, M. E., Story, M., & Wall, M. (2005). Associations between parental report of the home food environment and adolescent intakes of fruits, vegetables and dairy foods. Public Health Nutrition, 8(1), 77-85.
Kimm, S. Y. S., Glynn, N. W., Kriska, A. M., Barton, B. A., Kronsberg, S. S., Daniels, S. R., Crawford, P. B., Sabry, Z. I., & Liu, K. (2002). Decline in physical activity in black girls and white girls during adolescence. New England Journal of Medicine, 347(10), 709-715.
Licence K. (2004). Promoting and protecting the health of children and young people. Health and development, 30(6), 623-635.
Lien, N., Jacobs, D. R., & Klepp, K. I. (2002). Exploring predictors of eating behaviour among adolescents by gender and socio-economic status. Public Health Nutrition, 5(5), 671-681.
Lien, N., Lytle, L. A., & Klepp, K. I. (2001). Stability in consumption of fruit, vegetables, and sugary foods in a cohort from age 14 to age 21. Preventive Medicine, 33(3), 217-226.
Lobstein, T. J., Baur, L., and Uauy, R. for the IASO International Obesity Task Force (2004). Obesity in children and young people: a crisis in public health. 5(S1), S4-S85.
General discussion References
211
Loughridge J.L., and Barrat J. (2005). Does the provision of cooled filtered water in secondary school cafeterias increase water drinking and decrease the purchase of soft drinks? Journal of Human Nutrition and Dietetics, 18, 281-286.
Lytle, L. A., Murray, D. M., Perry, C. L., Story, M., Birnbaum, A. S., Kubik, M. Y., & Varnell, S. (2004). School-based approaches to affect adolescents' diets: Results from the TEENS study. Health Education & Behavior, 31(2), 270-287.
O'Neil, C. E., & Nicklas, T. A. (2002). Gimme 5: An innovative, school-based nutrition intervention for high school students. Journal of the American Dietetic Association, 102(3), S93-S96.
Pate, R. R., Freedson, P. S., Sallis, J. F., Taylor, W. C., Sirard, J., Trost, S. G., & Dowda, M. (2002). Compliance with physical activity guidelines: Prevalence in a population of children and youth. Annals of Epidemiology, 12(5), 303-308.
Porter, D. E., Kirtland, K. A., Neet, J. M., Williams, J. E., Ainsworth, B. E. (2004) Considerations for using a geographic information system to assess environmental supports for physical activity. Preventing Chronic Diseases, 1(4):A20.
Puyau, M. R., Adolph, A. L., Vohra, F. A., & Butte, N. F. (2002). Validation and calibration of physical activity monitors in children. Obesity Research, 10,150-157.
Mota, J., Santos, P., Guerra, S., Ribeiro, J. C., & Duarte, J. A. (2002). Differences of daily physical activity levels of children according to body mass index. Pediatric Exercise Science, 14(4), 442-452.
Reilly, J. J., & Dorosty, A. R. (1999). Epidemic of obesity in UK children. Lancet, 354(9193), 1874-1875.
Sallis, J. F. (2000). Age-related decline in physical activity: a synthesis of human and animal studies. Medicine and Science in Sports and Exercise, 32(9), 1598-1600.
Sallis, J. F., Prochaska, J. J., & Taylor, W. C. (2000). A review of correlates of physical
activity of children and adolescents. Medicine and Science in Sports and Exercise, 32(5), 963-975.
Simon, C., Wagner, A., DiVita, C., Rauscher, E., Klein-Platat, C., Arveiler, D., Schweitzer, B., & Triby, E. (2004). Intervention centred on adolescents' physical activity and sedentary behaviour (ICAPS): concept and 6-month results. International Journal of Obesity, 28, S96-S103.
Stone, E. J., McKenzie, T. L., Welk, G. J., & Booth, M. L. (1998). Effects of physical activity interventions in youth - Review and synthesis. American Journal of Preventive Medicine, 15(4), 298-315.
Summerbell, C. D., Waters, E., Edmunds, L. D., Kelly, S., Brown, T., & Campbell, K. J. (2005). Interventions for preventing obesity in children. The Cochrane Database of Systematic Reviews, 3, Art. No.: CD001871.pub2. DOI: 10.1002/1465858. CD001871.pub2.
Taylor, J. P., Evers, S., & McKenna, M. (2005). Determinants of healthy eating in children and youth. Canadian Journal of Public Health-Revue Canadienne De Sante Publique, 96, S20-S26.
Taylor, R. W., Falorni, A., Jones, I. E., & Goulding, A. (2003). Identifying adolescents with high percentage body fat: a comparison of BMI cutoffs using age and stage of pubertal development compared with BMI cutoffs using age alone. European Journal of Clinical Nutrition, 57(6), 764-769.
Thomas, H., Ciliska, D., Micucci, S., Wilson-Abra, J., & Dobbin, M. (2004). Effectiveness of physical activity enhancement and obesity prevention programs in children and youth. Online available at: http://old.hamilton.ca/phcs/ephpp/ReviewsPortal.asp., Accessed June 10, 2006.
Trost, S. G., Kerr, L. M., Ward, D. S., & Pate, R. R. (2001). Physical activity and determinants of physical activity in obese and non-obese children. International Journal of Obesity, 25(6), 822-829.
Van Damme J, De Troy A, Meyer J et al. Succesvol doorstromen in de aanvangsjaren van het
General discussion References
212
secundair onderwijs. [Successful flow through in the inceptions years of the middle school education]. Leuven: Acco. 1997.
Vandelanotte, C., De Bourdeaudhuij, I., Sallis, J. F., Spittaels, H., & Brug, J. (2005). Efficacy of sequential or simultaneous interactive computer-tailored interventions for increasing physical activity and decreasing fat intake. Annals of Behavioral Medicine, 29:138-146.
Vereecken, C. A., Bobelijn, K., & Maes, L. (2005). School food policy at primary and secondary schools in Belgium-Flanders: does it influence young people's food habits? European Journal of Clinical Nutrition, 59(2), 271-277.
Vereecken C.A., & Maes L. (2003). A Belgian study on the reliability and relative validity of the health behaviour in school-aged children food-frequency questionnaire. Public Health Nutrition, 6(6),581-588.
Vereecken, C. A., Inchley, J., Subramanian, S. V., Hublet, A., & Maes, L. (2005). The relative influence of individual and contextual socio-economic status on consumption of fruit and soft drinks among adolescents in Europe. European Journal of Public Health, 15(3), 224-232.
Ward D.S., Evenson K.L., Vaughn A., et al. (2005). Accelerometer use in physical activity: Best practices and research recommendations. Medicine and Science in Sports and Exercise, 37(11), S582-588.
Wareham, N. J., Van Sluijs, E. M. F., & Ekelund, U. (2005). Physical activity and obesity prevention: a review of the current evidence. Proceedings of the Nutrition Society, 64(2), 229-247.
World Health Organisation. (2003). Diet, nutrition and the prevention of chronic diseases. World Health Organisation, Geneva, Switzerland.
World Health Organization. European Strategy for Child and Adolescent Health and development. WHO Regional Committee for Europe. Copenhagen, 2005.
213
APPENDIX
Relevant publications by the author not presented in this thesis:
Leen Haerens, Benedicte Deforche, Corneel Vandelanotte, Lea Maes and Ilse De Bourdeaudhuij.
Acceptability, Feasibility and Effectiveness of a Computer-tailored Physical Activity Intervention
in Adolescents. Patient Education Counseling, 2007, Accepted
Leen Haerens, Benedicte Deforche, Lea Maes and Ilse De Bourdeaudhuij. Explaining the effects
of a 1-year intervention promoting a low fat diet in adolescent girls: a mediation analysis.
International Journal of Behavioral Nutrition and Physical Activity, 2006, In revision
Errata
• The conclusions regarding the decrease in percentage of energy from fat in Chapter
2.1 and 2.3 were incorrect. Percentage of energy from fat was calculated as the
proportion of measured fat intake compared to recommended energy intake. Total
energy intake was not measured and was estimated from standard recommended
intake tables. However, among students with a higher actual energy intake than
recommended, energy intake was underestimated and among students with a lower
actual energy than recommended, energy intake was overestimated. This has biased
the calculations of percentage of energy from fat. Among students with actual energy
intakes higher than recommended, percentage of energy from fat was underestimated.
On the other hand, among students with lower actual energy intake than
recommended, percentage of energy from fat was underestimated. Hence, such
calculations make it impossible to determine whether declines in absolute fat intake go
together with declines in actual energy intake or not. Conclusions regarding the
decreases in percentage of energy from fat should be ignored.
214
• In Chapter 2.1 and chapter 2.2 F-values were calculated with dummy variables as
dependent variables, which is incorrect. One-year post intervention effects on the
percentage of students meeting fat and fruit intake recommendations (Chapter 2.1) and
physical activity recommendations (Chapter 2.2) were recalculated using binary
logistic analyses. Analyses were adjusted for baseline compliance with fat, fruit and
physical activity recommendations. Students in the intervention with parental support
group when compared to the control group had 34% (OR=1.34) more change of
complying with fat intake recommendations (p<0.05, 95%CI: 1.06 to 1.69), there were
no differences for compliance with fruit intake recommendations (OR=1.01, 95%CI:
0.77 to 1.35) or for compliance with physical activity guidelines (OR=1.12, 95%CI:
0.38 to 3.27). Contrary to the expectations, students in the intervention group without
parental support when compared to the control group had a lower change of
complying with fruit intake recommendations (p<0.05, OR=0.66, 95%CI: 0.47 to
0.93), there were no differences for compliance with fat intake recommendations
(OR=0.83, 95%CI: 0.63 to 1.09) or for compliance with physical activity guidelines
(OR=0.91, 95%CI: 0.27 to 3.07).
215
DANKWOORD
Voor alle mensen die gedurende de voorbije vier jaar bijgedragen hebben tot het tot stand komen van dit proefschrift: bedankt! Allereerst wil ik mijn promotor Prof. Dr. I. De Bourdeaudhuij en mijn co-promotor Prof. Dr. L. Maes bedanken. Ilse, bedankt voor je motiverende en efficiënte
aanpak, ik had me geen betere promoter kunnen wensen. Jouw nuchtere en praktische instelling maakten van deze vrij ambitieuse interventiestudie een haalbare kaart. Ik kon steeds bij jou terecht en ik stond er telkens weer van versteld hoe vlot je de, voor mij onoverkomenlijke, problemen kon oplossen. Bedankt voor de steun en motivatie, je enthousiasme, het vertrouwen en de kansen die je me geeft en gegeven hebt. Ik heb veel van je geleerd en het was en is een plezier om met jou samen te werken.
Lea, ook jou wil ik bedanken. Bedankt voor de vele suggesties bij het uitwerken van de interventie, het kritisch nalezen van de artikels en alle waardevolle tips en opmerkingen. Ik kijk al uit naar de verdere samenwerking binnen het Ideefics project.
Bene, ook jij vervulde een erg bijzondere rol bij het tot stand komen van dit proefschrift. Je volgde alles op vanop de eerste rij. Ik wil je graag bedanken voor je erg nauwe betrokkenheid, je hulp en alle bemoedigende woordjes wanneer ik eens twijfelde. Ik heb veel van je geleerd en je relativeringsvermogen heeft me enorm geholpen.
Graag wil ik ook de andere leden van de begeleidingscommissie bedanken. Greet en Veerle, bedankt voor alle waardevolle suggesties en opbouwende kritiek.
I also want to thank Prof. Dr. J-M Oppert, Prof. Dr. J. Bouckaert, Prof. Dr. F. Boen and Prof. Dr. S. De Henauw for being part of the examination board. Thank you for
your interest in my work and all helpful comments and suggestions. I particularly want to thank Prof. Dr. J-M Oppert who especially made the trip from Paris to attend the presentation of this thesis.
Dit proefschrift kwam tot stand als onderdeel van de opdracht van het Steunpunt Sport, Beweging en Gezondheid en werd verricht met de steun van de Vlaamse regering, waarvoor mijn dank.
Bedankt aan iedereen die heeft bijgedragen aan
dit onderzoek. Eerst en vooral de directies, leerkrachten en leerlingen uit de vijftien scholen, die deelnamen aan het onderzoek: het VTI Brugge, KTA Brugge, VHSI Brugge, Koninklijk Werk Ibis Bredene, VTI Poperinge, VTI Veurne, VTI Ieper, Sint-Pauluscollege Wevelgem, Sint-Niklaasinstituut Kortrijk, Sint-Lutgartinstituut Roeselare, Instituut Heilige Kindsheid Ardooie, VTI Izegem, Middenschool-Instituut De Pélichy Izegem, Sint-Jozefscollege Izegem, Heilig Hart Instituut Harelbeke, Sint-Jan Berchmansmiddenschool en Sint-Jan Berchmanscollege Avelgem en het Sint-Vincentius Instituut Anzegem. Jullie allen kan ik niet genoeg bedanken! De talrijke metingen waren telkens een enorme organisatie, de ganse school stond vaak op stelten: vier verschillende vragenlijsten invullen, leerlingen meten en wegen,… en dit tot drie keer toe. Ook het uitwerken en uitvoeren van de interventie deden jullie volledig vrijwillig. Zonder jullie blijvend enthousiasme, inzet en vrijwillige hulp zou dit onderzoek niet mogelijk geweest zijn. Bedankt!
Verder wil ik ook mijn vrienden en alle jobstudenten, thesisstudenten en collega’s bedanken voor hun nauwgezetheid, inzet en goedgezindheid bij het uitvoeren van de talrijke metingen en het inscannen van de vragenlijsten.
216
Collega’s op het HILO, bedankt voor de vriendschap op en buiten het werk. De losse sfeer, leuke babbels tijdens de koffie- en middagpauzes, de toffe sfeer op congressen en talrijke randactiviteiten en uitstapjes maakten deel uit van vier aangename werkjaren.
Bedankt Mieke, mijn reisgenootje van Brugge
naar Gent. De fiets- en treinritjes waren altijd fun en meestal zelf te kort.
Bedankt Sara en Bart, met jullie talenknobbel
hebben jullie mijn teksten vaak heel wat verbeterd.
Vrienden, bedankt voor alle onvergetelijke
momenten! De ontspannende voetbaltrainingen, gezellige etentjes, 999-bijeenkomsten, supporteravondjes in de basket (DBB olé olé),…zijn voor mij onmisbaar.
Mama en papa, bedankt voor alle hulp als het
eens wat drukker was: de lekkere maaltijden, het strijken, de hulp bij het verhuizen, het installeren van de kinderkamer en zoveel meer. Niets is jullie teveel. Ik kan jullie niet genoeg bedanken voor jullie liefde en alle steun achter de schermen.
En ten slotte Koen, bedankt voor alles. Je zorg
tijdens die laatste drukke maanden, je rust en relativeringsvermogen geven me ongelooflijk veel kracht.
Leen Haerens December 2006
Top Related
Copyright © 2022 FDOKUMEN

