


Bahasa
Halaman
Hukum

1
TECHNICAL NOTE ON THE NEW METHODOLOGY USED TO LINK THE PISA-BASED
TEST FOR SCHOOLS WITH THE PISA TESTS
Executive Summary
The OECD has developed a separate test that allows schools to assess their performance on tasks that are
similar to those used in PISA. This is referred to as the PISA-based Test for Schools or as the OECD Test
for Schools.
Through the PISA-based Test for Schools, schools can measure the knowledge and skills of their students
on tasks that are similar to those in the Program for International Student Assessment (PISA), the world’s
global metric for comparing school systems around the world. High schools and educators are using it to
better understand student achievement, and inform their decision‐making on what can be done to improve
student outcomes.
This note concerns results from the school-based test, it does not concern results from PISA or any of the
results published in international reports published by the OECD.
Even though the school-based test is based on different tasks than those used in PISA, the OECD has tried
to make the results and methodologies from this test as comparable as possible to PISA. A special
‘equating’ methodology for this was developed by the Australian Council for Educational Research in
2012 and results from the school-based test have been published on the basis of this equating methodology.
During the school year 2014-15 ninety schools in Wales took part in the PISA-based test for schools,
which comprise a large proportion of the Welsh school system. This made it possible, for the first time, to
directly compare the performance of students on the PISA-based Test for Schools and PISA for a group of
overlapping schools. This comparison indicated a small but systematic underestimation of the results in the
PISA-based test when compared with PISA results. A review of the methodology used to equate results
from the PISA-based test to PISA that was subsequently undertaken showed that this difference could be
traced back to the way in which a correction factor for reduced difficulty had been estimated in the
equating methodology. As a result of this, the OECD and its contractors explored several alternative
linking methods that yield more consistent results between the two tests. One of these alternative equating
methods was finally chosen to replace the originally used equating method. The improved equating
methodology will be employed as of 5 November 2015. The OECD will re-estimate the performance of all
schools that have taken part in the school-based test.
When the OECD reported results to schools taking part in the school-based test it presented all
performance results with a confidence interval that reflected the measurement error associated with the
equating method. Analyses based on recalculations of school results from previous years in the United
States show that in more than 98% of cases, the recalculated results are not statistically significantly
different from the results included in the original reports.
2
Introduction
1. The PISA-based Test for Schools (PFS) is a student assessment tool geared for use by schools
and networks of schools to support research, international benchmarking and school improvement efforts.
In the United States, the assessment is known as the OECD Test for Schools (based on PISA). While this
assessment tool is not directly related to PISA, it emulates the PISA test and its methodologies in order to
yield as comparable results as possible. The assessment tool provides descriptive information and analyses
on the skills and creative application of knowledge of 15-year-old students in reading, mathematics, and
science, comparable to existing PISA scales.
2. This note describes the test design for the PFS and the processes by which the Australian Council
for Educational Research (ACER) developed the PFS tests for mathematics, reading and science and linked
them to the PISA tests. It then describes a new linking methodology to be implemented on 5 November
2015 which ensures enhanced comparability between the PISA-based Test for schools and PISA.
Design, scope and development of the PISA-based Test for schools
Test design
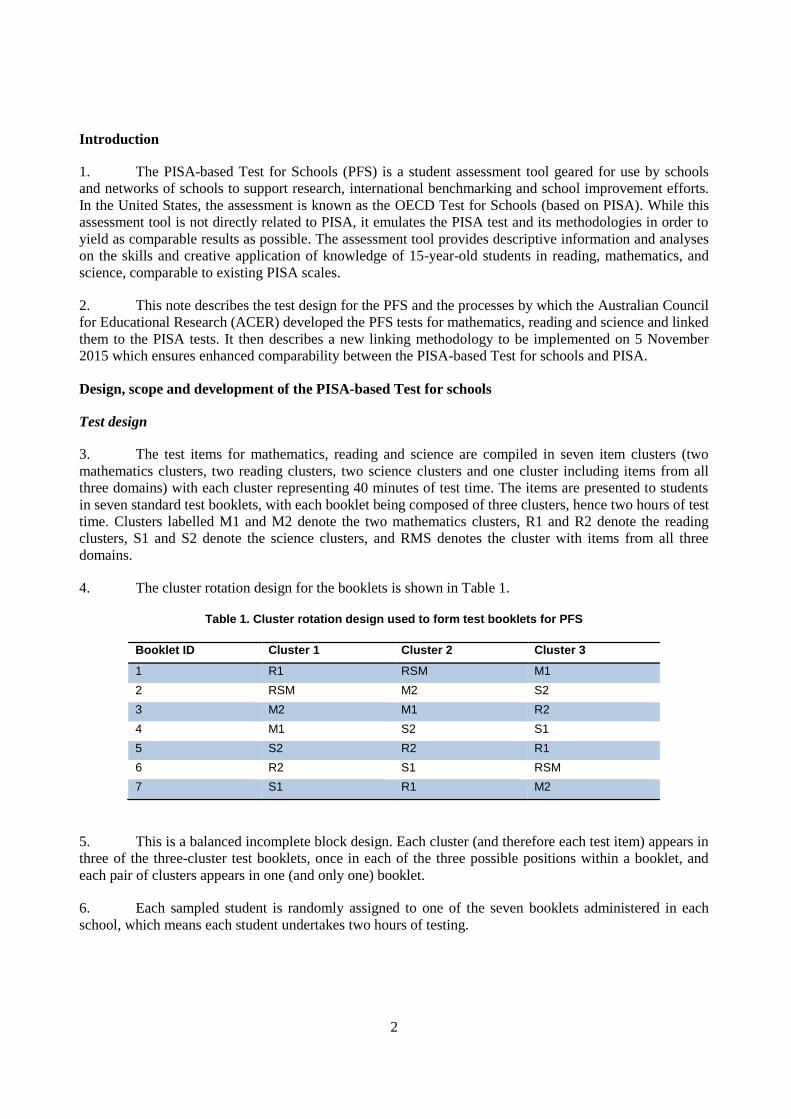
3. The test items for mathematics, reading and science are compiled in seven item clusters (two
mathematics clusters, two reading clusters, two science clusters and one cluster including items from all
three domains) with each cluster representing 40 minutes of test time. The items are presented to students
in seven standard test booklets, with each booklet being composed of three clusters, hence two hours of test
time. Clusters labelled M1 and M2 denote the two mathematics clusters, R1 and R2 denote the reading
clusters, S1 and S2 denote the science clusters, and RMS denotes the cluster with items from all three
domains.
4. The cluster rotation design for the booklets is shown in Table 1.
Table 1. Cluster rotation design used to form test booklets for PFS
Booklet ID Cluster 1 Cluster 2 Cluster 3
1 R1 RSM M1
2 RSM M2 S2
3 M2 M1 R2
4 M1 S2 S1
5 S2 R2 R1
6 R2 S1 RSM
7 S1 R1 M2
5. This is a balanced incomplete block design. Each cluster (and therefore each test item) appears in
three of the three-cluster test booklets, once in each of the three possible positions within a booklet, and
each pair of clusters appears in one (and only one) booklet.
6. Each sampled student is randomly assigned to one of the seven booklets administered in each
school, which means each student undertakes two hours of testing.
3
Test scope
7. PFS items are arranged in units based around a common stimulus. Many different types of
stimulus are used including passages of text, tables, graphs and diagrams, often in combination. Each unit
contains from one to five items assessing students’ competencies and knowledge. A complete PFS unit
consists of some stimulus material, one or more items (questions), and a guide to the coding of responses
to each question. Each coding guide comprises a list of response categories (full, partial and no credit),
each with its own scoring code, descriptions of the kinds of responses to be assigned each code, and
sample responses for each response category.
8. The mathematics assessment consists of 25 units comprising a total of 40 cognitive items, the
reading assessment consists of 47 items (13 units), and the science assessment consists of 54 items (25
units).
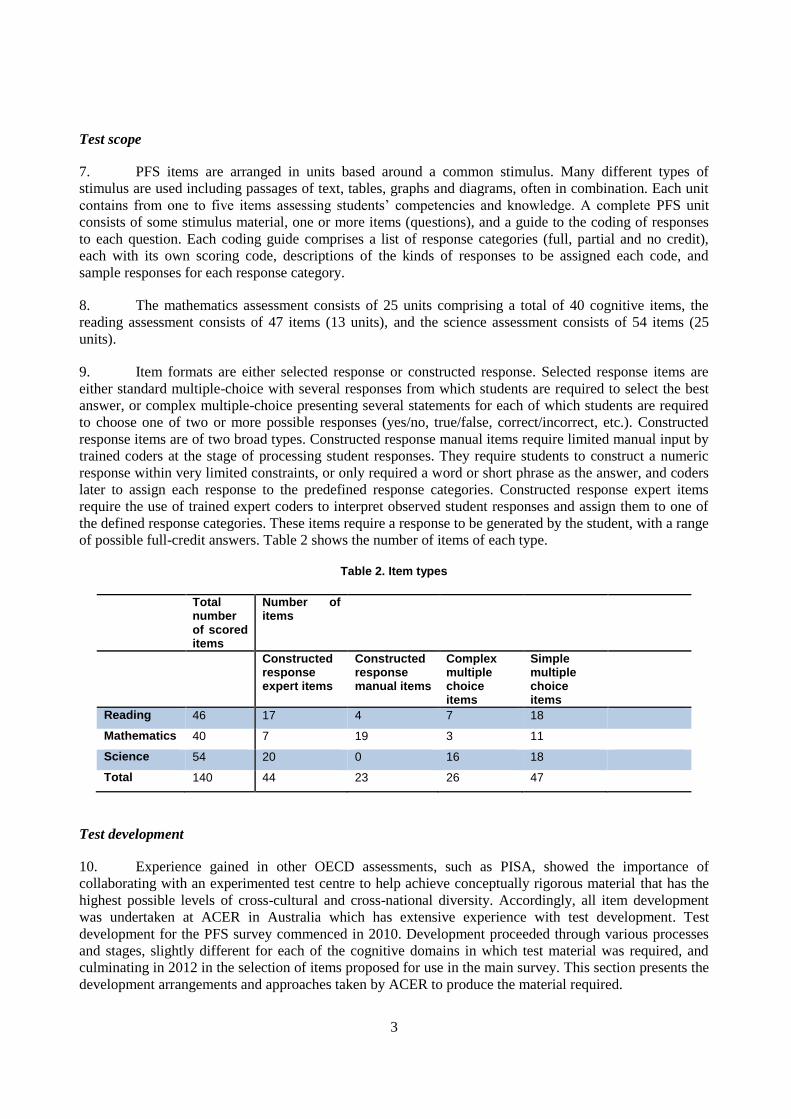
9. Item formats are either selected response or constructed response. Selected response items are
either standard multiple-choice with several responses from which students are required to select the best
answer, or complex multiple-choice presenting several statements for each of which students are required
to choose one of two or more possible responses (yes/no, true/false, correct/incorrect, etc.). Constructed
response items are of two broad types. Constructed response manual items require limited manual input by
trained coders at the stage of processing student responses. They require students to construct a numeric
response within very limited constraints, or only required a word or short phrase as the answer, and coders
later to assign each response to the predefined response categories. Constructed response expert items
require the use of trained expert coders to interpret observed student responses and assign them to one of
the defined response categories. These items require a response to be generated by the student, with a range
of possible full-credit answers. Table 2 shows the number of items of each type.
Table 2. Item types
Total number of scored items
Number of items
Constructed response expert items
Constructed response manual items
Complex multiple choice items
Simple multiple choice items
Reading 46 17 4 7 18
Mathematics 40 7 19 3 11
Science 54 20 0 16 18
Total 140 44 23 26 47
Test development
10. Experience gained in other OECD assessments, such as PISA, showed the importance of
collaborating with an experimented test centre to help achieve conceptually rigorous material that has the
highest possible levels of cross-cultural and cross-national diversity. Accordingly, all item development
was undertaken at ACER in Australia which has extensive experience with test development. Test
development for the PFS survey commenced in 2010. Development proceeded through various processes
and stages, slightly different for each of the cognitive domains in which test material was required, and
culminating in 2012 in the selection of items proposed for use in the main survey. This section presents the
development arrangements and approaches taken by ACER to produce the material required.
4
11. The material needed to fulfil the design requirements had to satisfy the domain definitions and
specifications within the relevant assessment framework. For each subject domain, the PISA assessment
framework was used to develop the PFS assessment. The framework defines the domain, describes the
scope of the assessment, specifies the structure of the test – including item format and the preferred
distribution of items according to important framework variables – and outlines the possibilities for
reporting results.
12. The test development teams of ACER conducted development of items, including cognitive
laboratory activities, in English. Each domain team included individuals who have been involved in the test
development for the main PISA surveys.
13. A total of 420 cognitive items were developed by ACER in two phases. All items were field trial
tested, along with 64 PISA link items, across students from schools in Australia, Ireland, the United
Kingdom and the United States. This field trial was conducted as a one-hour test. PISA link items are items
taken from the PISA main studies. 64 PISA link items were administered along with items developed for
the PFS study in order to link the PFS and the PISA assessments.
Data from the international field trial was analysed using standard item response techniques.
14. The 420 available items were evaluated by an expert group in terms of their substantive quality,
fit to framework, range of difficulty, psychometric quality, durability and interest level for 15-year-olds.
15. The selection of items to be proposed for inclusion in the main survey instruments had to satisfy
the following conditions:
The psychometric properties of all selected items had to be satisfactory.
There had to be an appropriate distribution of item difficulties, broad enough to generate useful
measurement data at both extremes of the anticipated ability distribution of sampled students
across all participating countries.
16. In selecting PISA link items, framework balance, range of difficulty, and a high level of
reliability were considered as prime criteria.
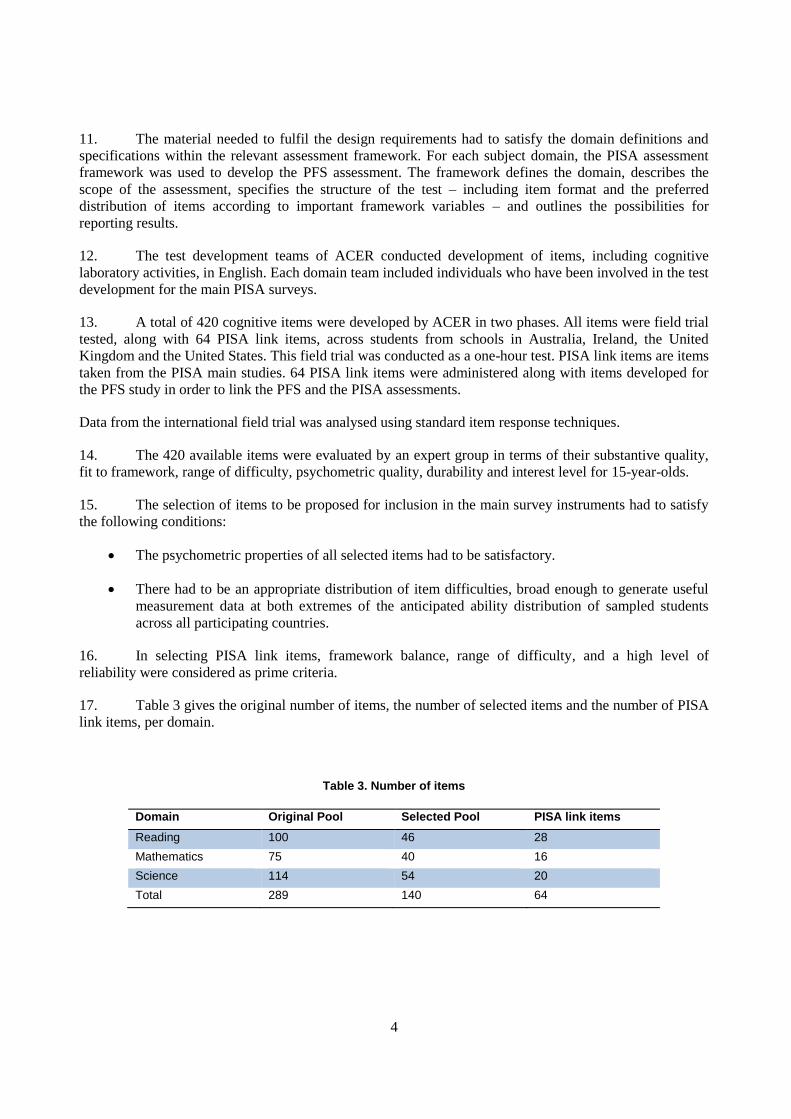
17. Table 3 gives the original number of items, the number of selected items and the number of PISA
link items, per domain.
Table 3. Number of items
Domain Original Pool Selected Pool PISA link items
Reading 100 46 28
Mathematics 75 40 16
Science 114 54 20
Total 289 140 64
5
Establishment of the PISA reference scales
18. The reporting PISA scale for reading was developed in PISA 2000, when reading was the major
domain of assessment. The scale was established so that the mean and standard deviation of the PISA 2000
scores was 500 and 100 respectively, for the equally weighted 27 OECD countries that participated in
PISA 2000 that had acceptable response rates (Adams and Wu, 2002). For PISA 2003, 2006, 2009 and
2012, the decision was made to report the reading scores on this previously developed scale, so the reading
reporting scales used for PISA 2000, 2003, 2006, 2009 and 2012 are directly comparable. The value of
500, for example, has the same meaning in any of these evaluations as it did in PISA 2000.
19. Mathematics, as the major domain, was the subject of major development work for PISA 2003.
For mathematics the reporting scale was determined such that the mean was 500 and standard deviation
100 for the 30 OECD countries that participated in PISA 2003. For PISA 2006, 2009 and 2012, the
decision was made to report the mathematics on this previously developed scale.
20. For science a new scale was established in 2006. The metric for that scale was set so that the
mean was 500 and standard deviation 100 for the 30 OECD countries that participated in PISA 2006. For
PISA 2009 and 2012, the decision was made to report the science scores on this previously developed
scale.
Former linking method used to report PFS scores onto the PISA reference scales
21. This section describes in details how the PFS cognitive items were mapped onto the PISA
reference scales. ACER conducted an equating study on data collected in two phases. In the first phase,
PISA link items and PFS items were administered in an hour-long test of two clusters per booklet. The test
was balanced in that all items appeared in both the first and the last cluster of the test. In the second phase,
only PFS items were administered but some of these also occurred in the first phase. All the cognitive data
was thus gathered into one dataset for the estimation of item response models.
22. Following several item analyses, some items were discarded from the field trial and equating sets
because of psychometric problems such as excessive Differential Item Functioning (DIF) or poor
discrimination. Also some parts of complex multiple-choice items were found to perform poorly and were
omitted, and some partial credit items were collapsed if there was insufficient differentiation between
student abilities on some categories or when an intermediate category was answered by very few students.
To ensure sufficient coverage of framework areas, some items with good psychometric properties were
deleted in favour of items with inferior psychometric properties, though this did not extend to retaining
items with clearly poor properties. Finally, some high-quality items were set aside because they were
excess to requirements.
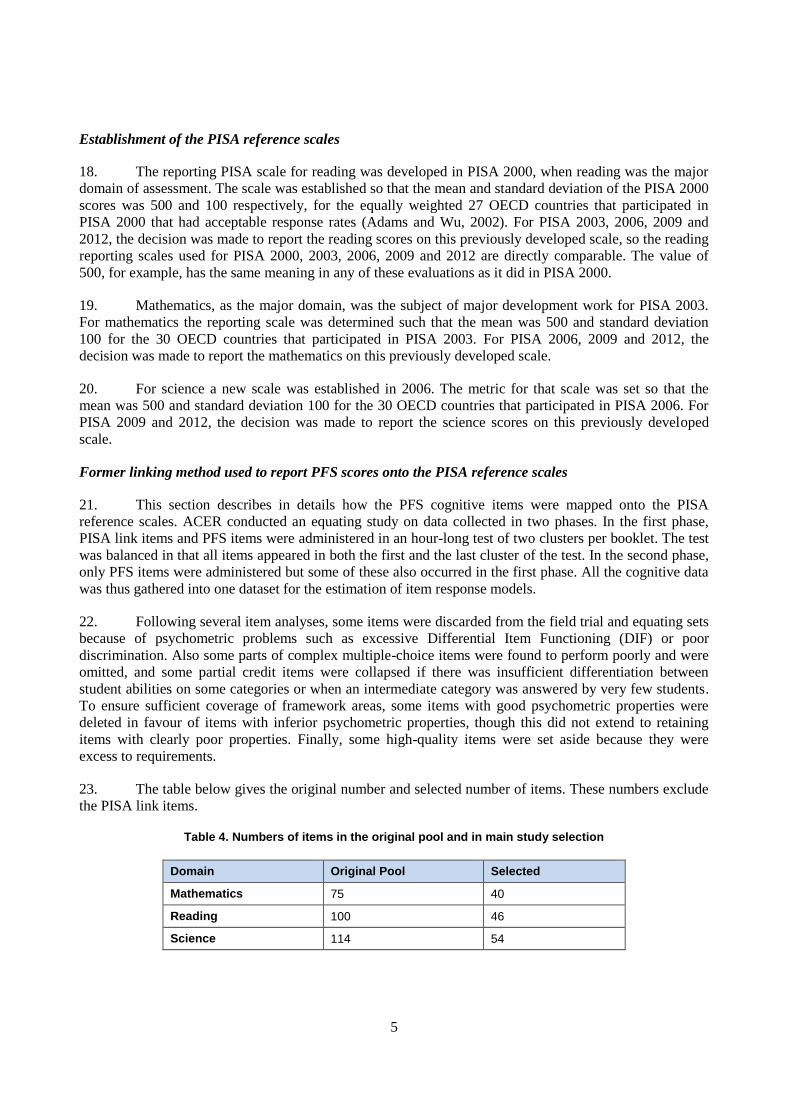
23. The table below gives the original number and selected number of items. These numbers exclude
the PISA link items.
Table 4. Numbers of items in the original pool and in main study selection
Domain Original Pool Selected
Mathematics 75 40
Reading 100 46
Science 114 54
6
24. The parameters of the PFS items were estimated separately for each domain using a mixed
coefficients multinomial logit model and by anchoring the PISA link item parameters at their PISA values.
The mathematics and science items were put on the current PISA scale (2003 and 2006 respectively) by
anchoring the PISA link items at their 2003 and 2006 item parameters. The reading items were mapped
onto the 2000 scale by adjusting the PISA 2009 item parameters by a linear transformation to the PISA
2000 scale. Details are given below.
25. It was noted that when the three domains were scaled without anchoring, the mean difficulties of
the PISA link items were lower for all three domains in the PFS linking study, which was conducted as a
one hour test, than in the original PISA items. It was suspected that at least some of this effect was due to
the PISA item parameters being estimated from a two-hour test, with the effect of low response in
particularly the last half hour of the test driving up the estimated difficulties. It was thus decided to re-
estimate the PFS item parameters by anchoring the PISA link item parameters at their PISA values
corrected for a reduced difficulty. For mathematics, PISA link item parameters were anchored at their
PISA 2003 value diminished by 0.152 of a logit (the estimated reduction in the mean difficulty of the link
items between PISA 2003 and the PFS linking study). For science, PISA link item parameters were
anchored at their PISA 2006 value diminished by 0.108 of a logit (the estimated reduction in the mean
difficulty of the link items between PISA 2006 and the PFS linking study). For reading, PISA link item
parameters were anchored at their PISA 2009 value diminished by 0.182 of a logit (the estimated reduction
in the mean difficulty of the link items between PISA 2009 and the PFS linking study).
26. The PFS items parameters obtained from these estimations were used to generate students’
performance scores at the PISA-based test for schools from the international pilot in 2012 until October
2015.
New method for reporting PFS results on the PISA reference scales
27. To increase the quality of the linking between the PFS and PISA tests, the OECD Secretariat
recently investigated new linking methods. This process was undertaken with the aim of increasing the
comparability of the PFS outcomes with the PISA results and consisted in carrying out new estimations of
item parameters on the data from the PFS linking study
28. The process was initiated after 90 schools in Wales took part in the test in 2014-2015. This
relatively large proportion of schools in Wales enabled – for the first time since the test was developed – a
direct comparison between results obtained for schools taking part in PFS with PISA results for a similar
group of schools. The comparison indicated a likely underestimation of the results in PFS when compared
with PISA results which could be related to the correction for reduced difficulty applied in the original
linking method. The OECD Secretariat applied an adjustment in the calculation of the results for Wales in
order to account for this likely underestimation. At the same time, it was decided to undertake a full review
of the linking methodology, together with ACER in Australia and supported by an external expert in
psychometrics.
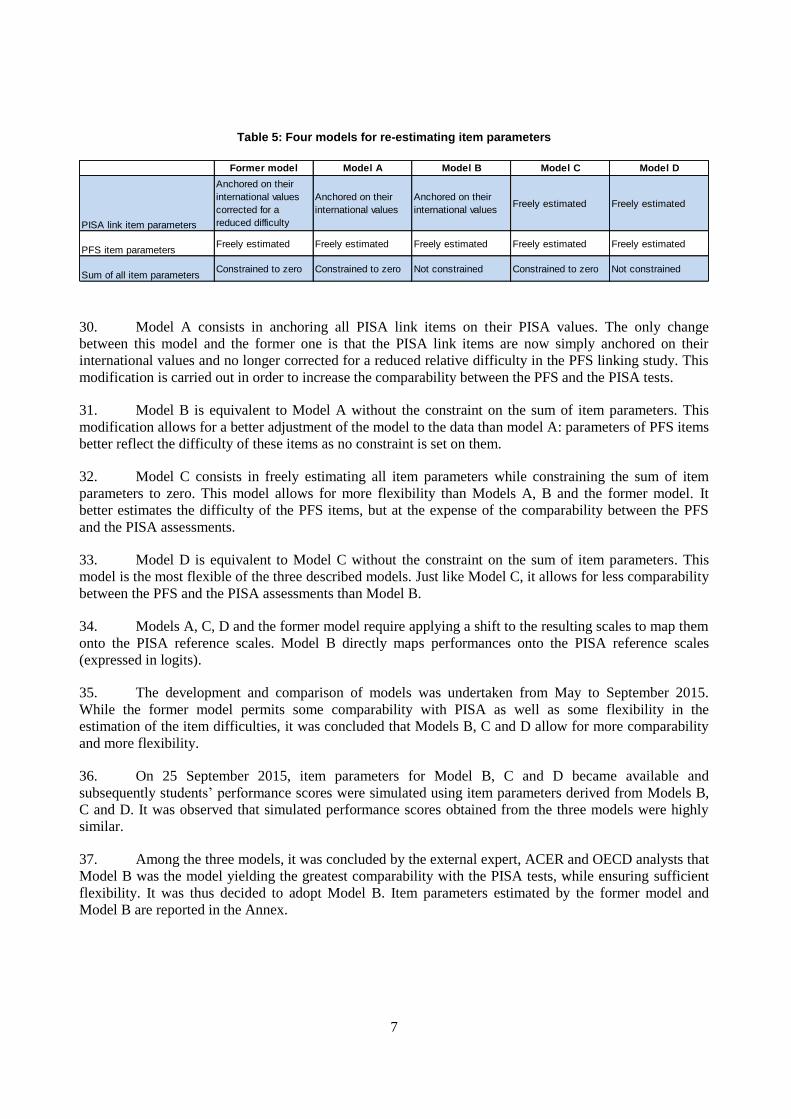
29. The table below describes the four mixed coefficients multinomial logit models considered in the
process as well as the former model by indicating how the estimation of the item parameters was
constrained for each model.
7
Table 5: Four models for re-estimating item parameters
30. Model A consists in anchoring all PISA link items on their PISA values. The only change
between this model and the former one is that the PISA link items are now simply anchored on their
international values and no longer corrected for a reduced relative difficulty in the PFS linking study. This
modification is carried out in order to increase the comparability between the PFS and the PISA tests.
31. Model B is equivalent to Model A without the constraint on the sum of item parameters. This
modification allows for a better adjustment of the model to the data than model A: parameters of PFS items
better reflect the difficulty of these items as no constraint is set on them.
32. Model C consists in freely estimating all item parameters while constraining the sum of item
parameters to zero. This model allows for more flexibility than Models A, B and the former model. It
better estimates the difficulty of the PFS items, but at the expense of the comparability between the PFS
and the PISA assessments.
33. Model D is equivalent to Model C without the constraint on the sum of item parameters. This
model is the most flexible of the three described models. Just like Model C, it allows for less comparability
between the PFS and the PISA assessments than Model B.
34. Models A, C, D and the former model require applying a shift to the resulting scales to map them
onto the PISA reference scales. Model B directly maps performances onto the PISA reference scales
(expressed in logits).
35. The development and comparison of models was undertaken from May to September 2015.
While the former model permits some comparability with PISA as well as some flexibility in the
estimation of the item difficulties, it was concluded that Models B, C and D allow for more comparability
and more flexibility.
36. On 25 September 2015, item parameters for Model B, C and D became available and
subsequently students’ performance scores were simulated using item parameters derived from Models B,
C and D. It was observed that simulated performance scores obtained from the three models were highly
similar.
37. Among the three models, it was concluded by the external expert, ACER and OECD analysts that
Model B was the model yielding the greatest comparability with the PISA tests, while ensuring sufficient
flexibility. It was thus decided to adopt Model B. Item parameters estimated by the former model and
Model B are reported in the Annex.
Former model Model A Model B Model C Model D
PISA link item parameters
Anchored on their
international values
corrected for a
reduced difficulty
Anchored on their
international values
Anchored on their
international valuesFreely estimated Freely estimated
PFS item parametersFreely estimated Freely estimated Freely estimated Freely estimated Freely estimated
Sum of all item parametersConstrained to zero Constrained to zero Not constrained Constrained to zero Not constrained
8
Difference between scores with old and new linking method
38. An impact study was carried out in October 2015. For schools in the United States, the new
linking methodology mainly yields performance scores that are higher than those formerly reported to
schools but in less than two per cent of the schools did this lead to changes beyond the confidence interval.
There is also a small proportion of schools for which the new methodology produces slightly lower results,
in all cases within the confidence intervals. The new methodology consists in calibrating the difficulty of
the test items differently. In other words, the marks attributed to each test item are slightly different. While
most of the items are given more credit with the new methodology, a few items are now given less credit.
39. As part of the validation of the new equating methodology, the new set of item parameters (i.e.
item parameters from Model B) was used to re-calculate student performance scores for all schools in the
United States that participated in the PFS test in 2013-2014 and 2014-2015. The average differences
between scores with the old and new methodology are 13 points in reading, 13 points in mathematics, and
11 points in science. For less than two per cent of the schools are the recalculated results outside of the
confidence interval of the reports in the original results report.
40. All schools in the United States that have taken the test on an on-demand basis in 2013-2014 and
2014-2015 have been directly contacted by the OECD and informed about the new methodology as well as
their results from previous tests recalculated with the new methodology.
OECD, 5 November 2015
9
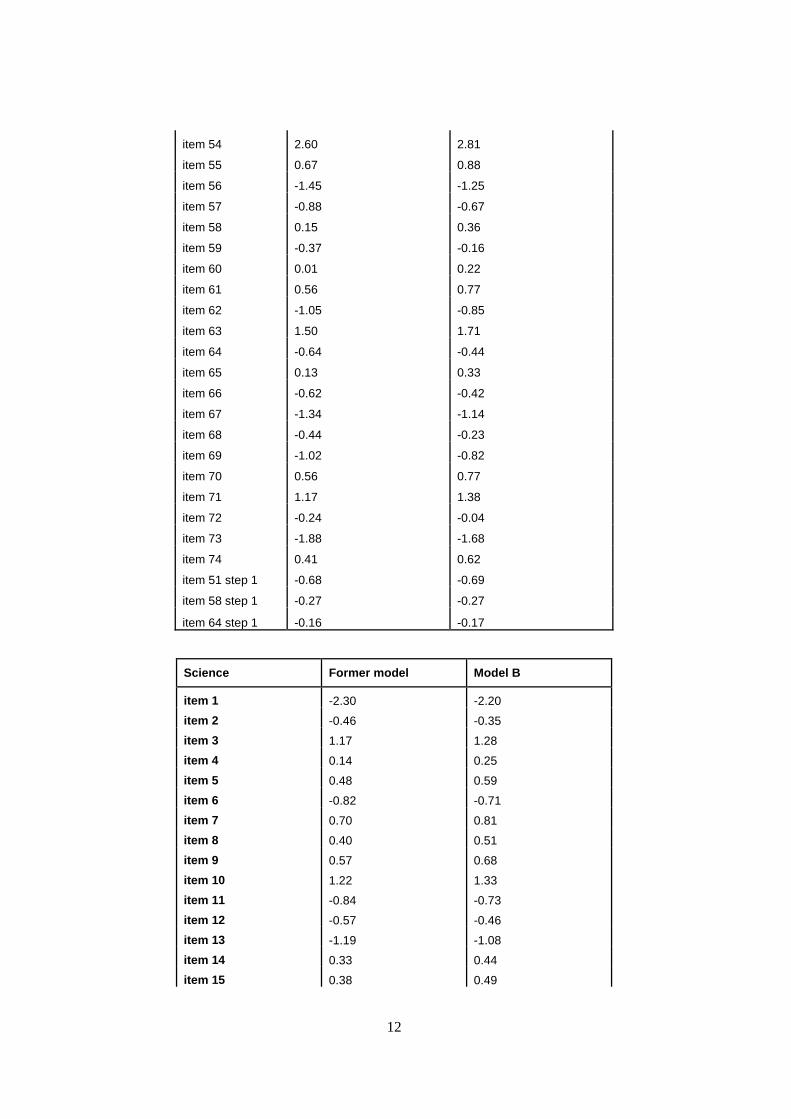
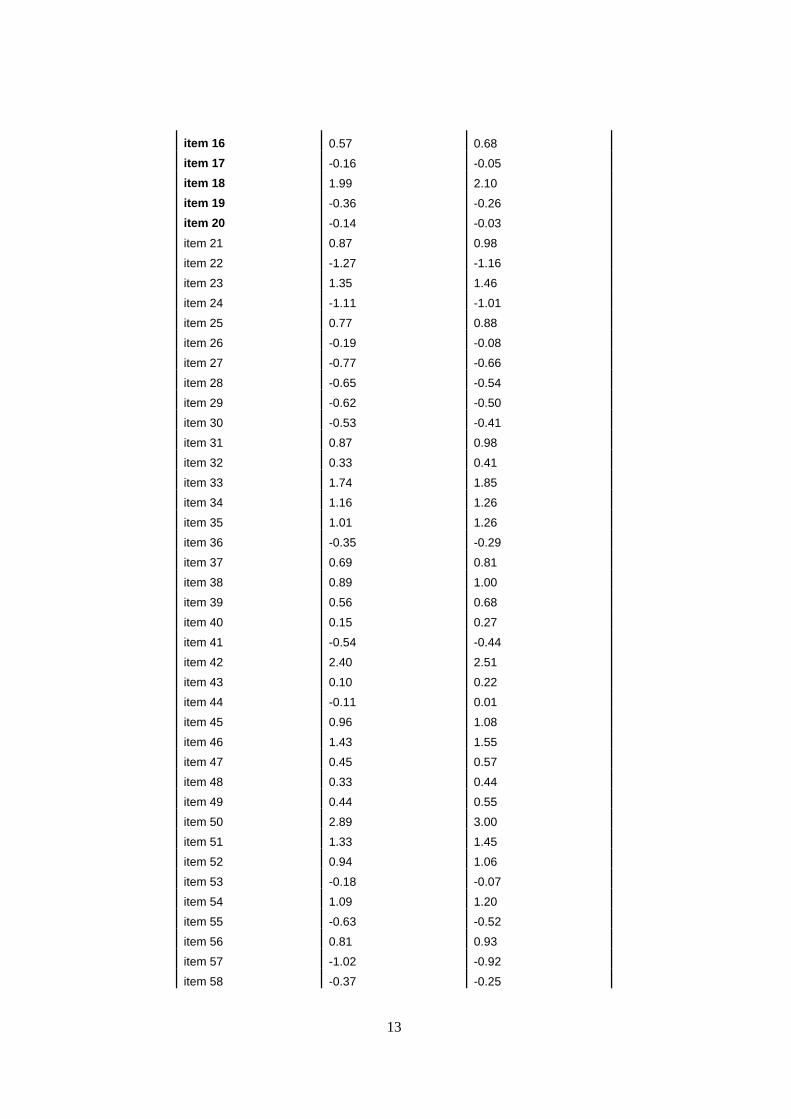
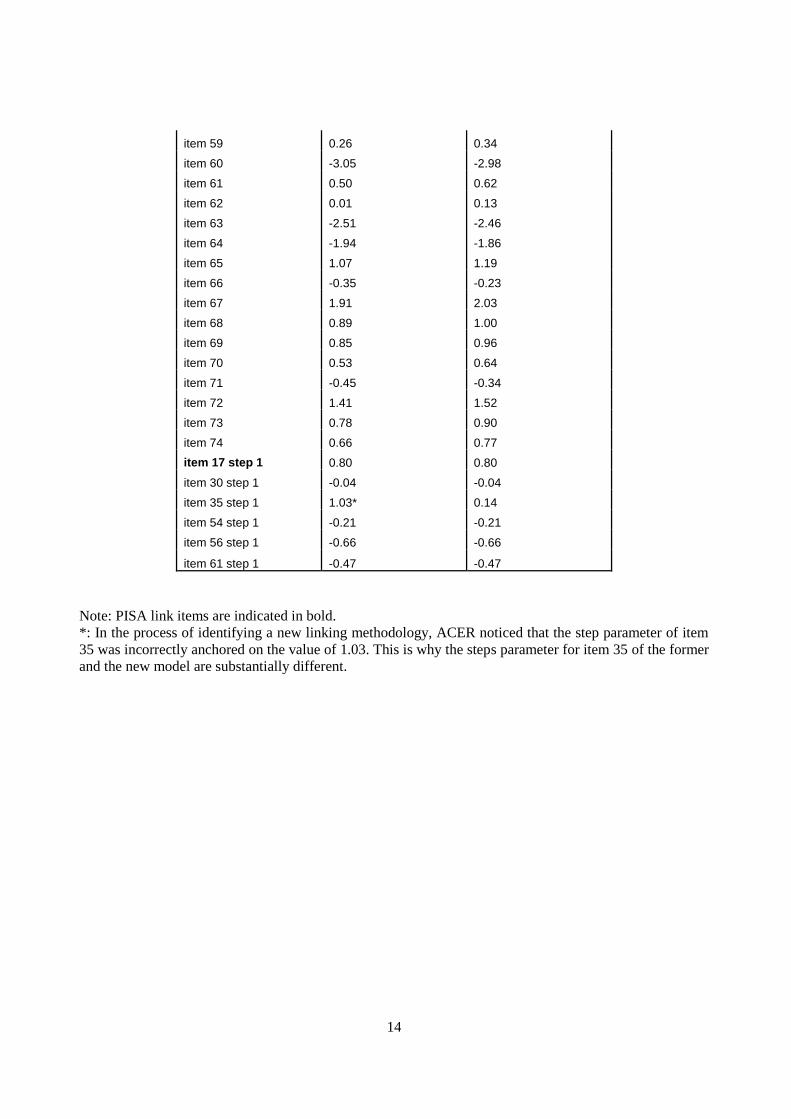
ANNEX
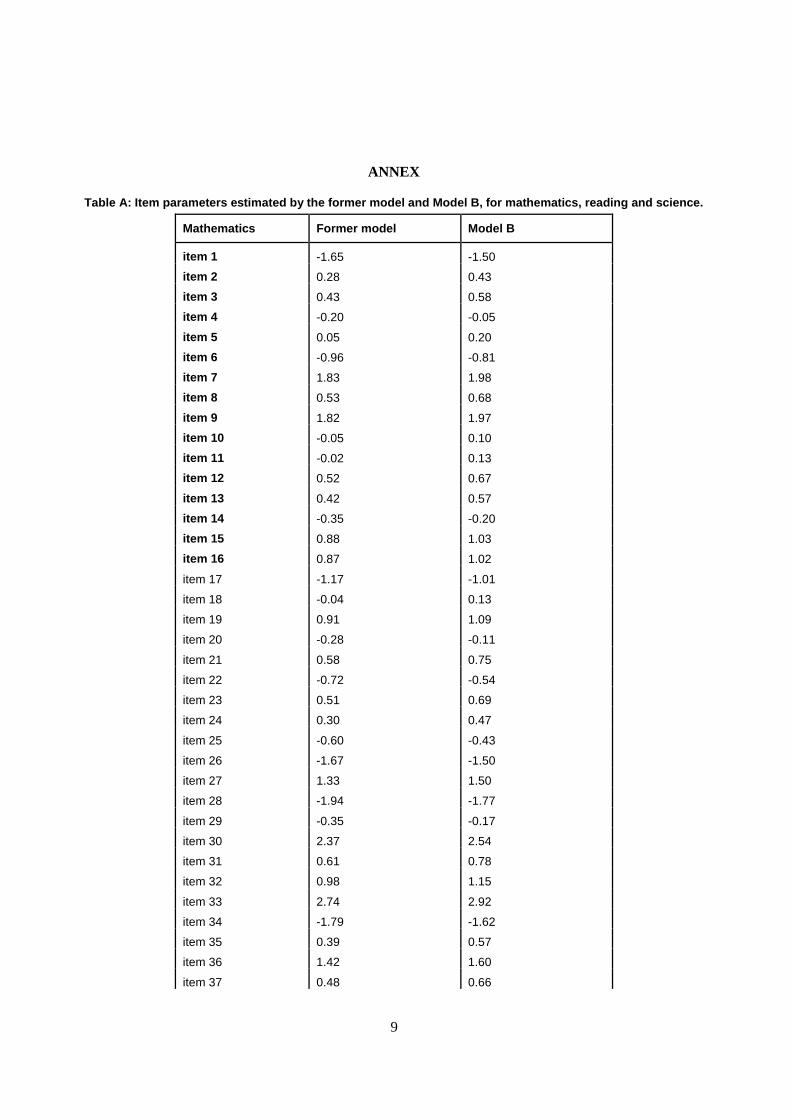
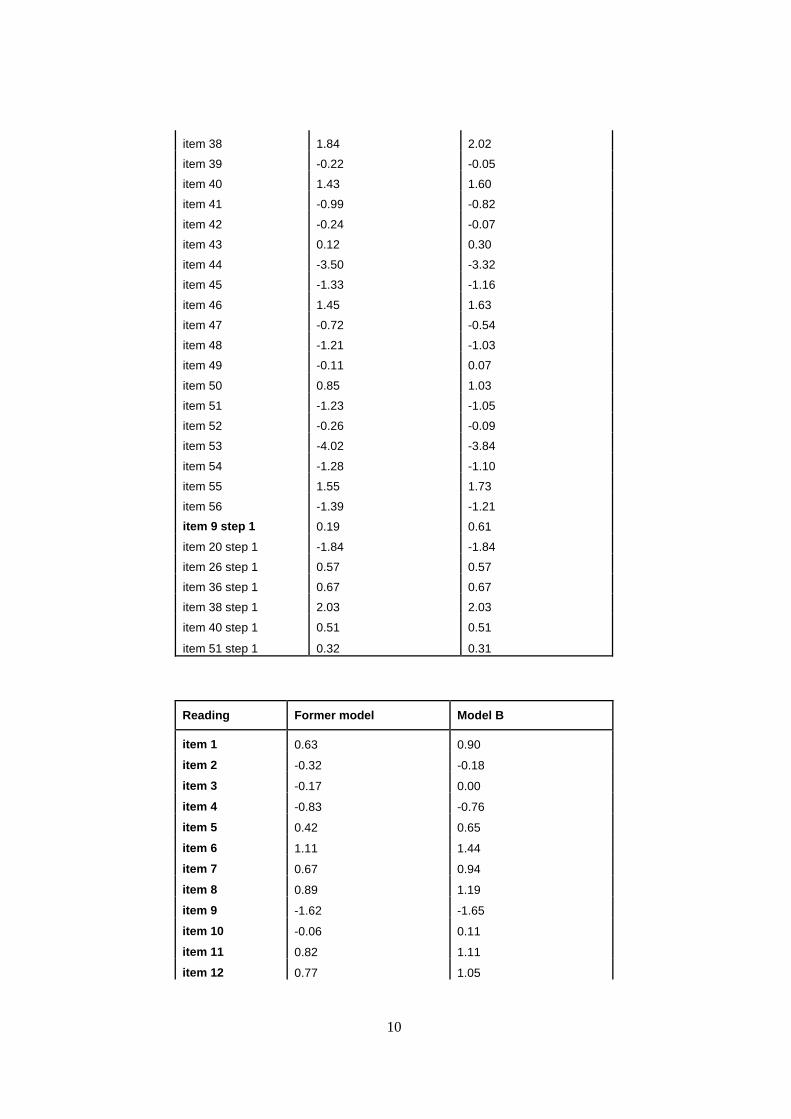
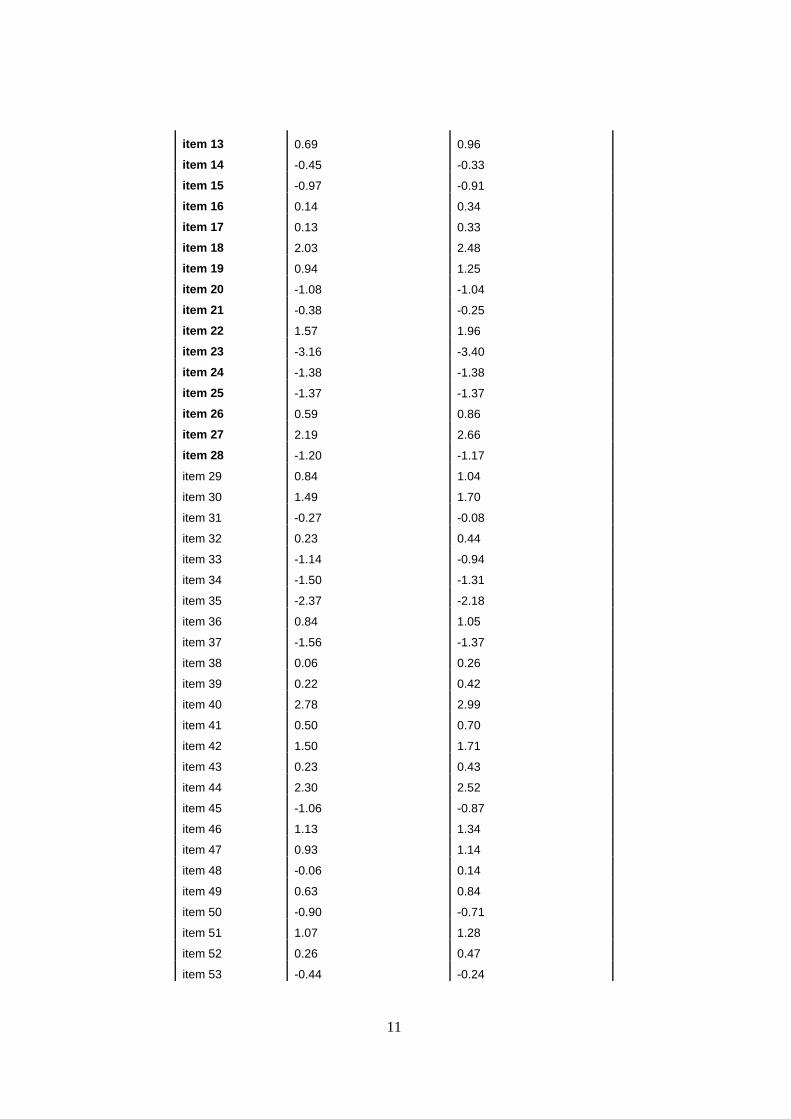
Table A: Item parameters estimated by the former model and Model B, for mathematics, reading and science.
Mathematics Former model Model B
item 1 -1.65 -1.50
item 2 0.28 0.43
item 3 0.43 0.58
item 4 -0.20 -0.05
item 5 0.05 0.20
item 6 -0.96 -0.81
item 7 1.83 1.98
item 8 0.53 0.68
item 9 1.82 1.97
item 10 -0.05 0.10
item 11 -0.02 0.13
item 12 0.52 0.67
item 13 0.42 0.57
item 14 -0.35 -0.20
item 15 0.88 1.03
item 16 0.87 1.02
item 17 -1.17 -1.01
item 18 -0.04 0.13
item 19 0.91 1.09
item 20 -0.28 -0.11
item 21 0.58 0.75
item 22 -0.72 -0.54
item 23 0.51 0.69
item 24 0.30 0.47
item 25 -0.60 -0.43
item 26 -1.67 -1.50
item 27 1.33 1.50
item 28 -1.94 -1.77
item 29 -0.35 -0.17
item 30 2.37 2.54
item 31 0.61 0.78
item 32 0.98 1.15
item 33 2.74 2.92
item 34 -1.79 -1.62
item 35 0.39 0.57
item 36 1.42 1.60
item 37 0.48 0.66
10
item 38 1.84 2.02
item 39 -0.22 -0.05
item 40 1.43 1.60
item 41 -0.99 -0.82
item 42 -0.24 -0.07
item 43 0.12 0.30
item 44 -3.50 -3.32
item 45 -1.33 -1.16
item 46 1.45 1.63
item 47 -0.72 -0.54
item 48 -1.21 -1.03
item 49 -0.11 0.07
item 50 0.85 1.03
item 51 -1.23 -1.05
item 52 -0.26 -0.09
item 53 -4.02 -3.84
item 54 -1.28 -1.10
item 55 1.55 1.73
item 56 -1.39 -1.21
item 9 step 1 0.19 0.61
item 20 step 1 -1.84 -1.84
item 26 step 1 0.57 0.57
item 36 step 1 0.67 0.67
item 38 step 1 2.03 2.03
item 40 step 1 0.51 0.51
item 51 step 1 0.32 0.31
Reading Former model Model B
item 1 0.63 0.90
item 2 -0.32 -0.18
item 3 -0.17 0.00
item 4 -0.83 -0.76
item 5 0.42 0.65
item 6 1.11 1.44
item 7 0.67 0.94
item 8 0.89 1.19
item 9 -1.62 -1.65
item 10 -0.06 0.11
item 11 0.82 1.11
item 12 0.77 1.05
11
item 13 0.69 0.96
item 14 -0.45 -0.33
item 15 -0.97 -0.91
item 16 0.14 0.34
item 17 0.13 0.33
item 18 2.03 2.48
item 19 0.94 1.25
item 20 -1.08 -1.04
item 21 -0.38 -0.25
item 22 1.57 1.96
item 23 -3.16 -3.40
item 24 -1.38 -1.38
item 25 -1.37 -1.37
item 26 0.59 0.86
item 27 2.19 2.66
item 28 -1.20 -1.17
item 29 0.84 1.04
item 30 1.49 1.70
item 31 -0.27 -0.08
item 32 0.23 0.44
item 33 -1.14 -0.94
item 34 -1.50 -1.31
item 35 -2.37 -2.18
item 36 0.84 1.05
item 37 -1.56 -1.37
item 38 0.06 0.26
item 39 0.22 0.42
item 40 2.78 2.99
item 41 0.50 0.70
item 42 1.50 1.71
item 43 0.23 0.43
item 44 2.30 2.52
item 45 -1.06 -0.87
item 46 1.13 1.34
item 47 0.93 1.14
item 48 -0.06 0.14
item 49 0.63 0.84
item 50 -0.90 -0.71
item 51 1.07 1.28
item 52 0.26 0.47
item 53 -0.44 -0.24
12
item 54 2.60 2.81
item 55 0.67 0.88
item 56 -1.45 -1.25
item 57 -0.88 -0.67
item 58 0.15 0.36
item 59 -0.37 -0.16
item 60 0.01 0.22
item 61 0.56 0.77
item 62 -1.05 -0.85
item 63 1.50 1.71
item 64 -0.64 -0.44
item 65 0.13 0.33
item 66 -0.62 -0.42
item 67 -1.34 -1.14
item 68 -0.44 -0.23
item 69 -1.02 -0.82
item 70 0.56 0.77
item 71 1.17 1.38
item 72 -0.24 -0.04
item 73 -1.88 -1.68
item 74 0.41 0.62
item 51 step 1 -0.68 -0.69
item 58 step 1 -0.27 -0.27
item 64 step 1 -0.16 -0.17
Science Former model Model B
item 1 -2.30 -2.20
item 2 -0.46 -0.35
item 3 1.17 1.28
item 4 0.14 0.25
item 5 0.48 0.59
item 6 -0.82 -0.71
item 7 0.70 0.81
item 8 0.40 0.51
item 9 0.57 0.68
item 10 1.22 1.33
item 11 -0.84 -0.73
item 12 -0.57 -0.46
item 13 -1.19 -1.08
item 14 0.33 0.44
item 15 0.38 0.49
13
item 16 0.57 0.68
item 17 -0.16 -0.05
item 18 1.99 2.10
item 19 -0.36 -0.26
item 20 -0.14 -0.03
item 21 0.87 0.98
item 22 -1.27 -1.16
item 23 1.35 1.46
item 24 -1.11 -1.01
item 25 0.77 0.88
item 26 -0.19 -0.08
item 27 -0.77 -0.66
item 28 -0.65 -0.54
item 29 -0.62 -0.50
item 30 -0.53 -0.41
item 31 0.87 0.98
item 32 0.33 0.41
item 33 1.74 1.85
item 34 1.16 1.26
item 35 1.01 1.26
item 36 -0.35 -0.29
item 37 0.69 0.81
item 38 0.89 1.00
item 39 0.56 0.68
item 40 0.15 0.27
item 41 -0.54 -0.44
item 42 2.40 2.51
item 43 0.10 0.22
item 44 -0.11 0.01
item 45 0.96 1.08
item 46 1.43 1.55
item 47 0.45 0.57
item 48 0.33 0.44
item 49 0.44 0.55
item 50 2.89 3.00
item 51 1.33 1.45
item 52 0.94 1.06
item 53 -0.18 -0.07
item 54 1.09 1.20
item 55 -0.63 -0.52
item 56 0.81 0.93
item 57 -1.02 -0.92
item 58 -0.37 -0.25
14
item 59 0.26 0.34
item 60 -3.05 -2.98
item 61 0.50 0.62
item 62 0.01 0.13
item 63 -2.51 -2.46
item 64 -1.94 -1.86
item 65 1.07 1.19
item 66 -0.35 -0.23
item 67 1.91 2.03
item 68 0.89 1.00
item 69 0.85 0.96
item 70 0.53 0.64
item 71 -0.45 -0.34
item 72 1.41 1.52
item 73 0.78 0.90
item 74 0.66 0.77
item 17 step 1 0.80 0.80
item 30 step 1 -0.04 -0.04
item 35 step 1 1.03* 0.14
item 54 step 1 -0.21 -0.21
item 56 step 1 -0.66 -0.66
item 61 step 1 -0.47 -0.47
Note: PISA link items are indicated in bold.
*: In the process of identifying a new linking methodology, ACER noticed that the step parameter of item
35 was incorrectly anchored on the value of 1.03. This is why the steps parameter for item 35 of the former
and the new model are substantially different.
Copyright © 2022 FDOKUMEN

