


Bahasa
Halaman
Hukum

European Journal of Sustainable Development Vol. 3 No 4, 2014. Pp 323- 338,
Doi: 10.14207/ejsd.2014.v3n4p323 ISSN: 2239-5938 (print) ISSN:2239-6101 (online) European Centre of Sustainable Development Page 1
Sustainable Campus: Indoor Environmental Quality (IEQ) Performance
Measurement for Malaysian Public Universities
Wan Zahari Wan Yusoff, PhD
Muhammad Azwan Sulaiman
Faculty of Technology Management & Business
University Tun Hussein Onn Malaysia
ABSTRACT
Indoor Environmental Quality (IEQ) for academic buildings is one of the key characteristics of a sustainable
campus. The low conditions of IEQ performance can contribute to the sick building syndrome and cause discomfort
to the building users. Furthermore, good performance of IEQ can contribute to a comfort and conducive learning and
working environment. The purpose of this paper is to discuss on the IEQ performance measurement of academic
buildings for public universities in Malaysia. This research involved scientific measurement of academic buildings
for public universities in Malaysia. The performance measurement focuses on the six key elements of IEQ; thermal
comfort, humidity, noise comfort, air movement, lighting and thickness of CO2. The results were compared to the
Malaysian Standard (MS 1525:2007) and UNESCO guideline. The findings showed that most universities are in the
standard set, while some universities under the standards set and still in need of improvement. This study is useful
for facilities managers in public universities in order to improve the IEQ on academic buildings in achieving
sustainable campus.
Keywords: Sustainable development, Sustainable environment, Sustainable campus, Indoor
Environmental Quality, Malaysian public universities.
INTRODUCTION
Indoor Environmental Quality (IEQ) is one of the main criteria in a sustainable campus
environment. IEQ becomes an important component in the assessment criteria of academic
buildings at Higher learning institutions. The evaluation criteria for the measurement of eco-
friendly building are Energy Efficiency, Indoor Environmental Quality, Sustainable Site
Planning & Management, Materials & Resources, Water Efficiency and Innovation (Wan Yusoff
& Wong Ru Wen (2014); GBI organization, 2010).
The concept of sustainability in the construction, development and management should be a
priority to create a sustainable environment in creating harmonious atmosphere in the HEI
campus. In addition, the sustainability of which is the construction and management of buildings
that feature green building. The concept of green building was first articulated in the early 1940s
in a conference setting up by the United Nations Environment Program aimed at reducing global
warming which was then ignited by the Industrial Revolution in Europe.
In Malaysia, the concept of green building is still new and still growing at an early stage,
especially in higher education institutions. However, with the establishment of a mechanism
European Journal of Sustainable Development Vol. 3 No 4, 2014. Pp 323- 338,
Doi: 10.14207/ejsd.2014.v3n4p323 ISSN: 2239-5938 (print) ISSN:2239-6101 (online) European Centre of Sustainable Development Page 2
called the Green Building Index (GBI) that an organization be evaluators, consultants and
advisors in creating environmentally friendly buildings in Malaysia, bringing the concept of
sustainability has been the main focus of the government. In GBI components, Indoor
Environmental Quality (IEQ) represents 21% for nonresidential building assessment such as
academic buildings (GBI Organization, 2010).
This means that the academic buildings need to be taken into account in the assessment of IEQ
because apart from the building became the focus of the public, it also as an institution that
educated generation and the succession to the leadership quality, it must begin from quality
classrooms.
Awareness of creating a conducive environment is growing concurrently with researches that
have been done. A good environment not only provides comfort, but also have a great impact on
the quality of health, productivity, psychology and occupational performance in a building. In
reality, IEQ rarely given priority in most development planning and management, However,
research shows that, over 80% of human life, spent in the building, whether at work, school,
recreational places and mostly in their homes.
In fact, according to a study by Yuan Hui (2005), there are certain number of people in the
United States who spend time in the building for 23 hours and 15 minutes, or 97.7% of his life.
However, only a small amount of knowledge and understanding about the importance of creating
a healthy indoor environment for building were occupied
To ensure that the environment in the building is in good condition it is necessary that the
occupants feel more comfortable and secure (Zainal, 2011). Unhealthy buildings, certainly
affects the health of the residents. Building-Related Illness exists and can be identified through
clinical studies (Ghodish, 1995). IEQ imbalance is to contribute to a Sick Building Syndrome,
i.e., the building is cannot be able to function well in terms of ventilation, relative humidity,
lighting, etc. (EPA, 1991)
This affects the quality of health of staff and students, the economic life of the building, and also
the equipment for the purpose of teaching and learning as described by Al-Sagoff, (1985) which
states that unfavorable IEQ threaten the quality of teaching and learning activities. Student’s
achievement and teacher performance are often linked to environmental conditions and
infrastructure available in a particular institution.
ISSUES
Most existing studies focused on single aspects of the environment. For example, previous
research focused on the study of single aspect such as lighting, acoustics, thermal comfort and air
quality. According to Ardeshir (2005), many studies linking environmental factors in qualitative
approach and quite general. While some studies are done so scientifically that raises questions
about the appropriateness of the study.
The scientific research on IEQ in HEI has not been widely discussed in the country. And IEQ is
rarely considered as a priority in most development planning and management (Sulaiman, MA et
al., (2013a). Conducted studies of IEQ in HEIs in Malaysia are considered new and this is in line
European Journal of Sustainable Development Vol. 3 No 4, 2014. Pp 323- 338,
Doi: 10.14207/ejsd.2014.v3n4p323 ISSN: 2239-5938 (print) ISSN:2239-6101 (online) European Centre of Sustainable Development Page 3
with the Strategic Plan for Development of Higher Education (PSPTN) towards the quality of
teaching and learning activities at creating facilities in IEQ which provide comfort to the user
and create conducive atmosphere. This is stated in the fifth PSPTN that improve the quality of
teaching and learning by providing adequate and a well-functioning infrastructure. Although the
responsibility to realize the importance of IEQ in academic buildings, especially on performance
and quality in teaching and learning activities as a core activity of the institution.
Therefore, the study of the IEQ in academic building is crucial with the aim to know at what
extent of IEQ in the campus university in Malaysia meeting the standards sets towards achieving
sustainable campus.
SUSTAINABLE DEVELOPMENT
The concept of sustainable development is a development model with an effort to proactively
addressing the imbalances between developing and maintaining the nature. However, this
concept is still not fully understood by the public, despite it was introduced since 20 years ago at
the Earth Summit in Rio de Janeiro, Brazil. Various definitions have been given by various
parties in differing perspectives and expertise (McManus, 1996). However, most definitions of
sustainable development is to follow what is contained in the report of the World Commission on
Environment and Development (WCED), which gives sustainable development as "a
development activities implemented without harmed the need of future generations". The need is
referring to the educational, economic, industrial and construction (Gedeon, 2005).
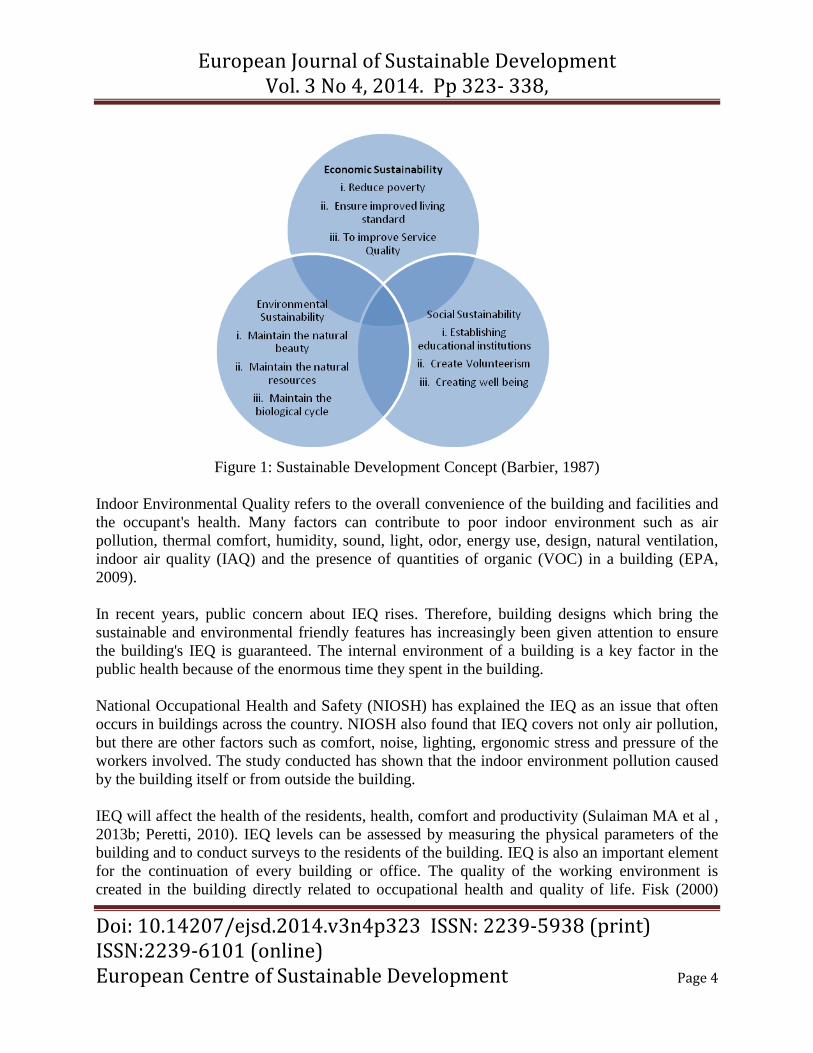
The definition of sustainable development encompasses three main ideas that mutually depend
on each other, namely environmental, economic and social. Barbier (1987) has developed three
ideas in the form of a circle to show the interdependence of each other. Figure 1 shows the main
idea of sustainable development. It clearly shows that a sustainable development must be
balanced according to the order of this idea.
European Journal of Sustainable Development Vol. 3 No 4, 2014. Pp 323- 338,
Doi: 10.14207/ejsd.2014.v3n4p323 ISSN: 2239-5938 (print) ISSN:2239-6101 (online) European Centre of Sustainable Development Page 4
Figure 1: Sustainable Development Concept (Barbier, 1987)
Indoor Environmental Quality refers to the overall convenience of the building and facilities and
the occupant's health. Many factors can contribute to poor indoor environment such as air
pollution, thermal comfort, humidity, sound, light, odor, energy use, design, natural ventilation,
indoor air quality (IAQ) and the presence of quantities of organic (VOC) in a building (EPA,
2009).
In recent years, public concern about IEQ rises. Therefore, building designs which bring the
sustainable and environmental friendly features has increasingly been given attention to ensure
the building's IEQ is guaranteed. The internal environment of a building is a key factor in the
public health because of the enormous time they spent in the building.
National Occupational Health and Safety (NIOSH) has explained the IEQ as an issue that often
occurs in buildings across the country. NIOSH also found that IEQ covers not only air pollution,
but there are other factors such as comfort, noise, lighting, ergonomic stress and pressure of the
workers involved. The study conducted has shown that the indoor environment pollution caused
by the building itself or from outside the building.
IEQ will affect the health of the residents, health, comfort and productivity (Sulaiman MA et al ,
2013b; Peretti, 2010). IEQ levels can be assessed by measuring the physical parameters of the
building and to conduct surveys to the residents of the building. IEQ is also an important element
for the continuation of every building or office. The quality of the working environment is
created in the building directly related to occupational health and quality of life. Fisk (2000)
European Journal of Sustainable Development Vol. 3 No 4, 2014. Pp 323- 338,
Doi: 10.14207/ejsd.2014.v3n4p323 ISSN: 2239-5938 (print) ISSN:2239-6101 (online) European Centre of Sustainable Development Page 5
pointed out that a building IEQ unhealthy level will affect and reduce the performance and
productivity of the occupants in the building.
This happens especially for people who spend most of their lives in the indoor environment.
Balancing a healthy indoor environment and comfort in buildings actually requires the
integration of various components. According to Edwin et al, (2008), the components are taken
into consideration in order to create a healthy indoor environment are as follows:
i) Indoor air quality refers to the level of freshness, health, comfort, and the quantity of
chemicals or the effects of toxic substances in the air.
ii) Ventilation either natural ventilation or mechanical aeration process.
iii) Thermal Comfort covers several aspects of the internal temperature, air speed and
relative humidity.
iv) Noise in connection with unwanted noise from either external or that could interfere with
human or animal.
METHODOLOGY
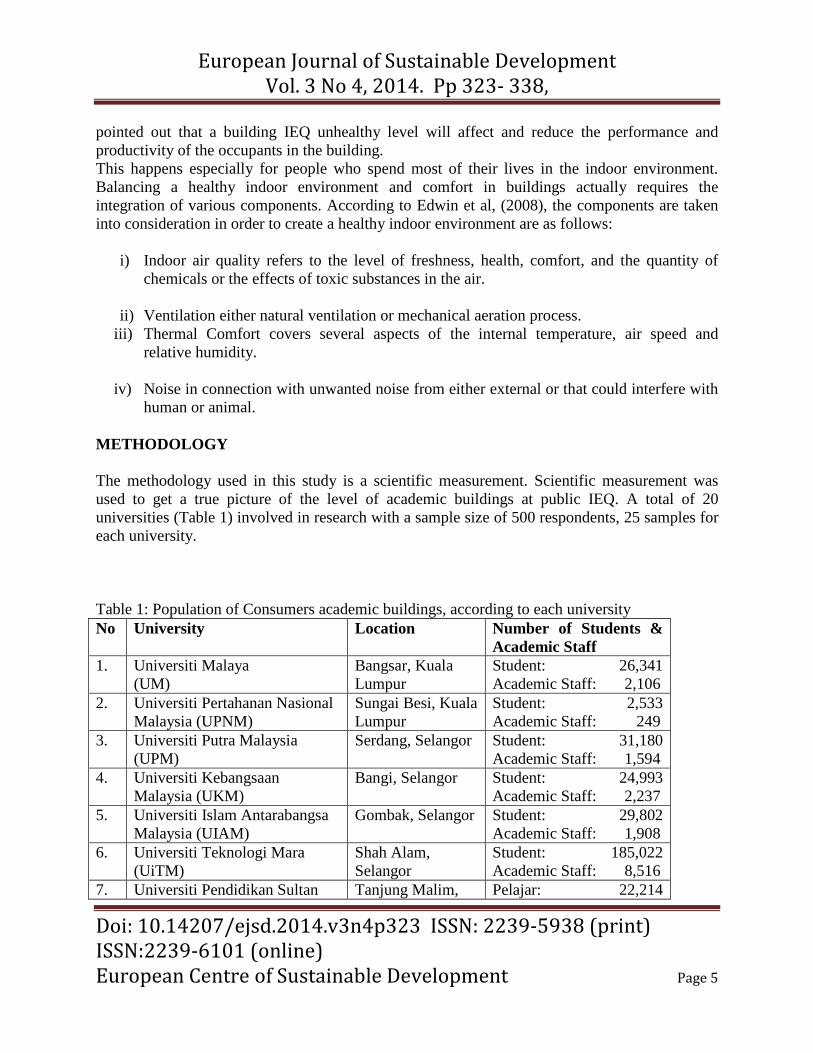
The methodology used in this study is a scientific measurement. Scientific measurement was
used to get a true picture of the level of academic buildings at public IEQ. A total of 20
universities (Table 1) involved in research with a sample size of 500 respondents, 25 samples for
each university.
Table 1: Population of Consumers academic buildings, according to each university
No University Location Number of Students &
Academic Staff
1. Universiti Malaya
(UM)
Bangsar, Kuala
Lumpur
Student: 26,341
Academic Staff: 2,106
2. Universiti Pertahanan Nasional
Malaysia (UPNM)
Sungai Besi, Kuala
Lumpur
Student: 2,533
Academic Staff: 249
3. Universiti Putra Malaysia
(UPM)
Serdang, Selangor Student: 31,180
Academic Staff: 1,594
4. Universiti Kebangsaan
Malaysia (UKM)
Bangi, Selangor Student: 24,993
Academic Staff: 2,237
5. Universiti Islam Antarabangsa
Malaysia (UIAM)
Gombak, Selangor Student: 29,802
Academic Staff: 1,908
6. Universiti Teknologi Mara
(UiTM)
Shah Alam,
Selangor
Student: 185,022
Academic Staff: 8,516
7. Universiti Pendidikan Sultan Tanjung Malim, Pelajar: 22,214
European Journal of Sustainable Development Vol. 3 No 4, 2014. Pp 323- 338,
Doi: 10.14207/ejsd.2014.v3n4p323 ISSN: 2239-5938 (print) ISSN:2239-6101 (online) European Centre of Sustainable Development Page 6
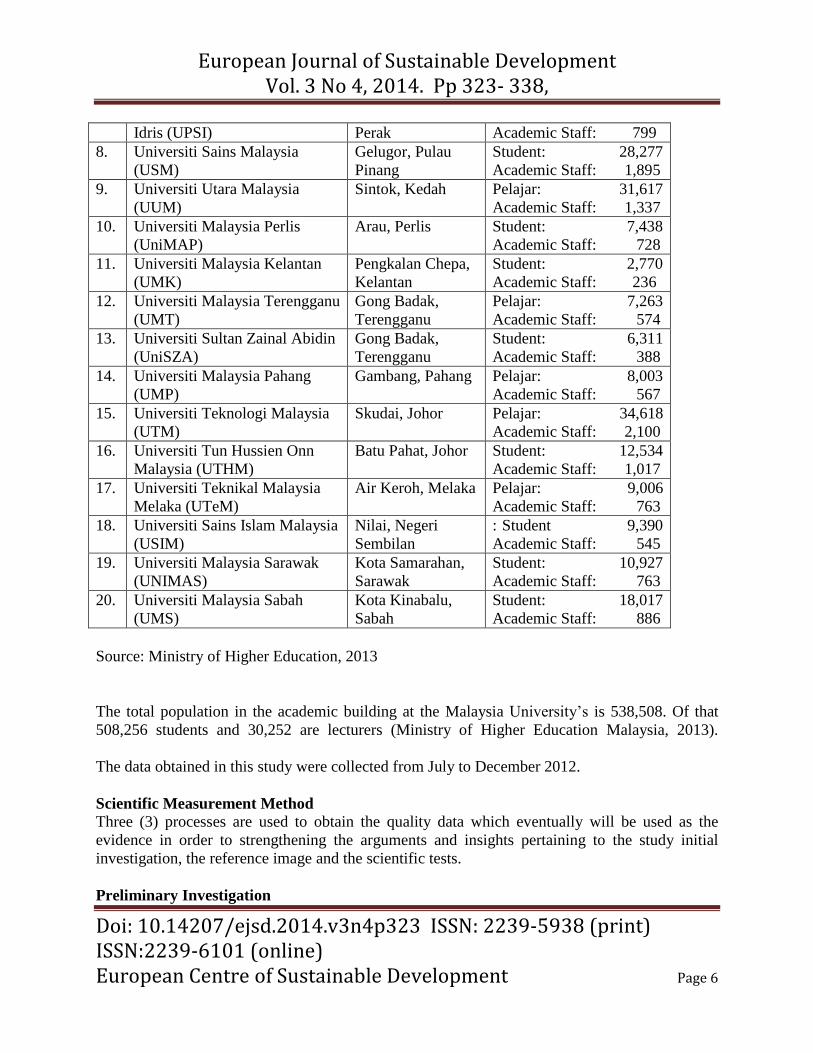
Idris (UPSI) Perak Academic Staff: 799
8. Universiti Sains Malaysia
(USM)
Gelugor, Pulau
Pinang
Student: 28,277
Academic Staff: 1,895
9. Universiti Utara Malaysia
(UUM)
Sintok, Kedah Pelajar: 31,617
Academic Staff: 1,337
10. Universiti Malaysia Perlis
(UniMAP)
Arau, Perlis Student: 7,438
Academic Staff: 728
11. Universiti Malaysia Kelantan
(UMK)
Pengkalan Chepa,
Kelantan
Student: 2,770
Academic Staff: 236
12. Universiti Malaysia Terengganu
(UMT)
Gong Badak,
Terengganu
Pelajar: 7,263
Academic Staff: 574
13. Universiti Sultan Zainal Abidin
(UniSZA)
Gong Badak,
Terengganu
Student: 6,311
Academic Staff: 388
14. Universiti Malaysia Pahang
(UMP)
Gambang, Pahang Pelajar: 8,003
Academic Staff: 567
15. Universiti Teknologi Malaysia
(UTM)
Skudai, Johor Pelajar: 34,618
Academic Staff: 2,100
16. Universiti Tun Hussien Onn
Malaysia (UTHM)
Batu Pahat, Johor Student: 12,534
Academic Staff: 1,017
17. Universiti Teknikal Malaysia
Melaka (UTeM)
Air Keroh, Melaka Pelajar: 9,006
Academic Staff: 763
18. Universiti Sains Islam Malaysia
(USIM)
Nilai, Negeri
Sembilan
: Student 9,390
Academic Staff: 545
19. Universiti Malaysia Sarawak
(UNIMAS)
Kota Samarahan,
Sarawak
Student: 10,927
Academic Staff: 763
20. Universiti Malaysia Sabah
(UMS)
Kota Kinabalu,
Sabah
Student: 18,017
Academic Staff: 886
Source: Ministry of Higher Education, 2013
The total population in the academic building at the Malaysia University’s is 538,508. Of that
508,256 students and 30,252 are lecturers (Ministry of Higher Education Malaysia, 2013).
The data obtained in this study were collected from July to December 2012.
Scientific Measurement Method
Three (3) processes are used to obtain the quality data which eventually will be used as the
evidence in order to strengthening the arguments and insights pertaining to the study initial
investigation, the reference image and the scientific tests.
Preliminary Investigation
European Journal of Sustainable Development Vol. 3 No 4, 2014. Pp 323- 338,
Doi: 10.14207/ejsd.2014.v3n4p323 ISSN: 2239-5938 (print) ISSN:2239-6101 (online) European Centre of Sustainable Development Page 7
Early inspection is done to get an overall idea of building complex designs in each university
academic. In this case, the whole building indoor environment can be identified and beneficial
when making a detailed examination later. It is important to ensure that no factors of unforeseen
circumstances in the measurement process, such as a building imperfection. In the event, it
cannot be used as a sample for the measurement performed.
Picture Reference Pictorial references refer to the relevant plans such as electrical and mechanical systems plan,
and the structure of the building. This is to provide an understanding of the technical procedures
such as ventilation, lighting or anything else element will be studied Advanced. Such preliminary
information is important to provide a better understanding of the building layout.
Scientific testing
This test is performed using specialized equipment to test the IEQ elements. The equipment used
is in the form of mobile. According to Health Canada (1995), brief measurement can be done by
someone who is not an expert for the purpose of viewing the situation. All data collected will be
recorded and analyzed. Figure 2 to Figure 6 shows the equipment used in the process of
scientific tests.
EQUPMENT FUNCTION
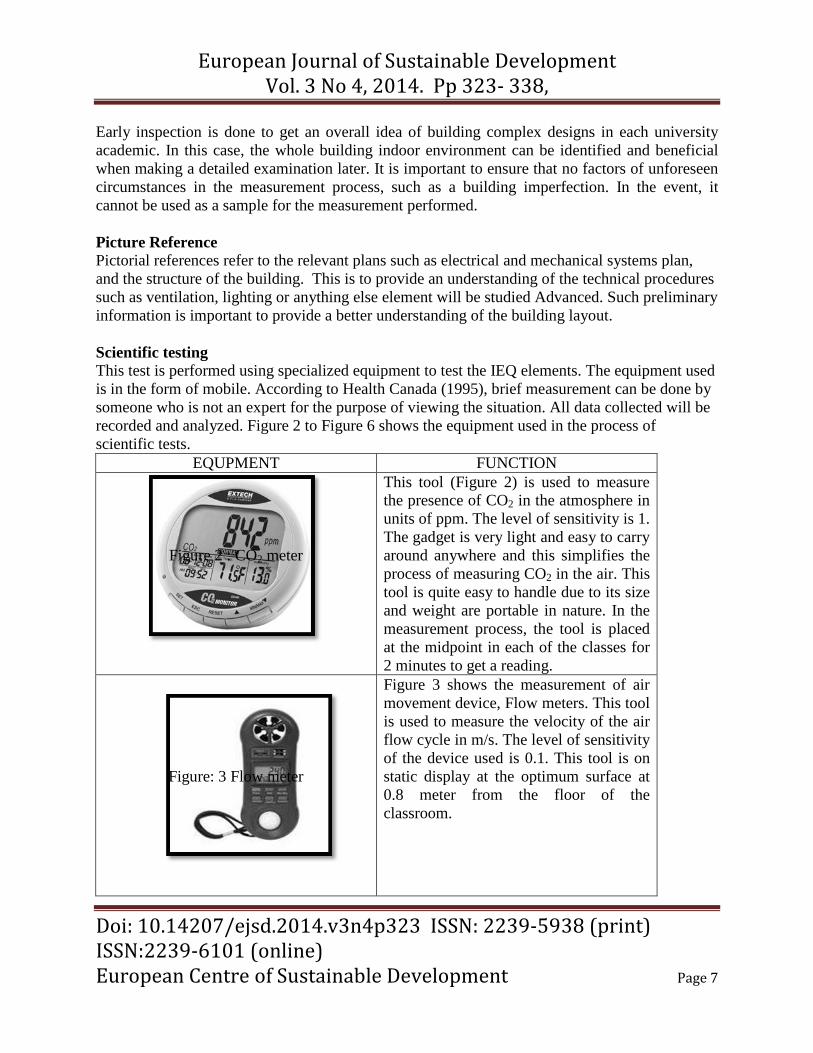
Figure 2 : CO2 meter
This tool (Figure 2) is used to measure
the presence of CO2 in the atmosphere in
units of ppm. The level of sensitivity is 1.
The gadget is very light and easy to carry
around anywhere and this simplifies the
process of measuring CO2 in the air. This
tool is quite easy to handle due to its size
and weight are portable in nature. In the
measurement process, the tool is placed
at the midpoint in each of the classes for
2 minutes to get a reading.
Figure: 3 Flow meter
Figure 3 shows the measurement of air
movement device, Flow meters. This tool
is used to measure the velocity of the air
flow cycle in m/s. The level of sensitivity
of the device used is 0.1. This tool is on
static display at the optimum surface at
0.8 meter from the floor of the
classroom.
European Journal of Sustainable Development Vol. 3 No 4, 2014. Pp 323- 338,
Doi: 10.14207/ejsd.2014.v3n4p323 ISSN: 2239-5938 (print) ISSN:2239-6101 (online) European Centre of Sustainable Development Page 8
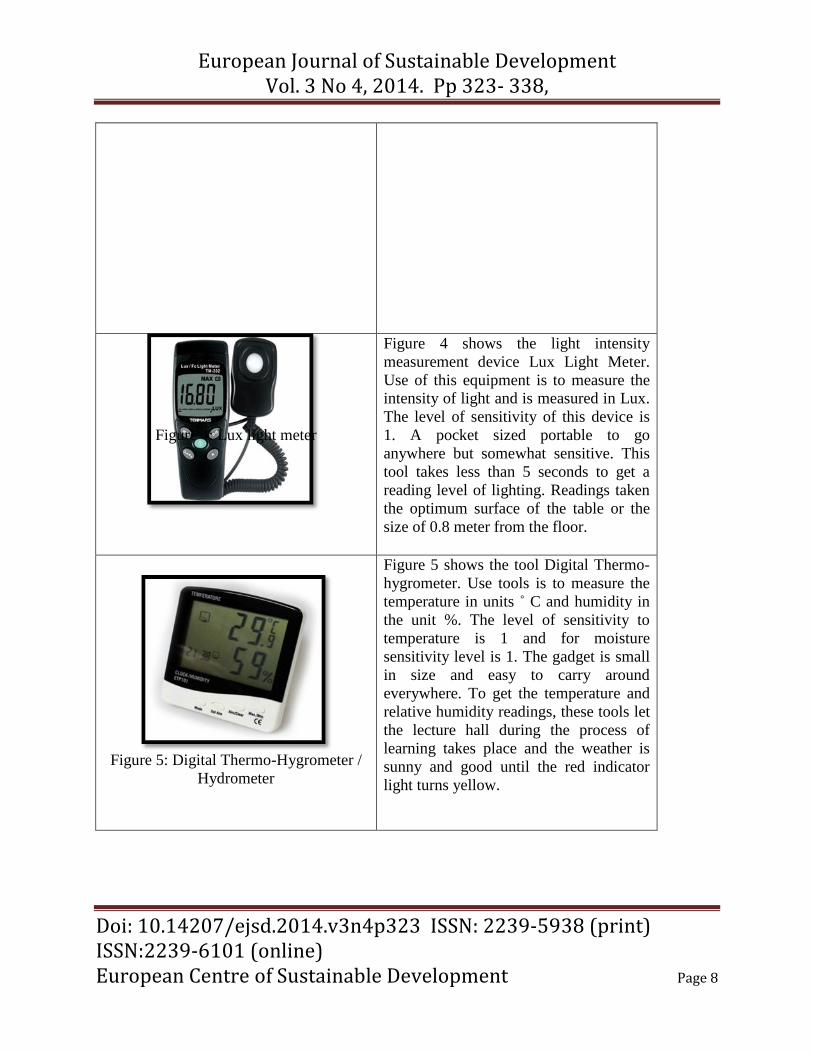
Figure 4: Lux light meter
Figure 4 shows the light intensity
measurement device Lux Light Meter.
Use of this equipment is to measure the
intensity of light and is measured in Lux.
The level of sensitivity of this device is
1. A pocket sized portable to go
anywhere but somewhat sensitive. This
tool takes less than 5 seconds to get a
reading level of lighting. Readings taken
the optimum surface of the table or the
size of 0.8 meter from the floor.
Figure 5: Digital Thermo-Hygrometer /
Hydrometer
Figure 5 shows the tool Digital Thermo-
hygrometer. Use tools is to measure the
temperature in units ˚ C and humidity in
the unit %. The level of sensitivity to
temperature is 1 and for moisture
sensitivity level is 1. The gadget is small
in size and easy to carry around
everywhere. To get the temperature and
relative humidity readings, these tools let
the lecture hall during the process of
learning takes place and the weather is
sunny and good until the red indicator
light turns yellow.
European Journal of Sustainable Development Vol. 3 No 4, 2014. Pp 323- 338,
Doi: 10.14207/ejsd.2014.v3n4p323 ISSN: 2239-5938 (print) ISSN:2239-6101 (online) European Centre of Sustainable Development Page 9
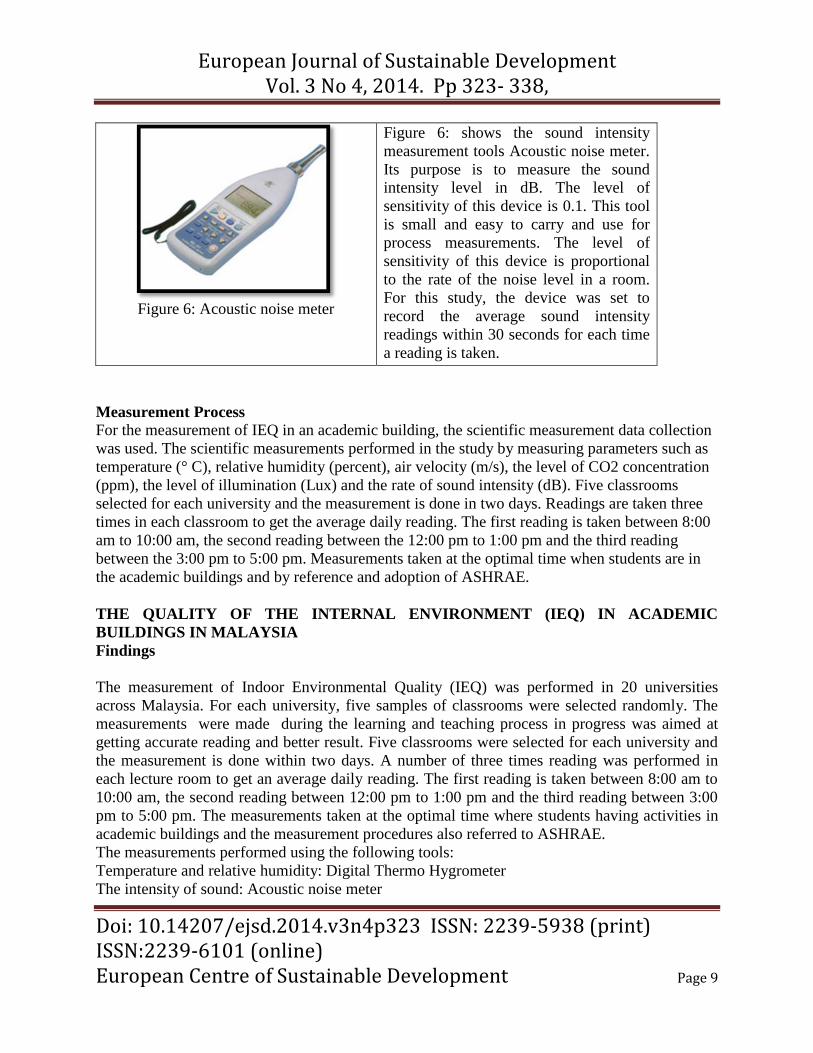
Figure 6: Acoustic noise meter
Figure 6: shows the sound intensity
measurement tools Acoustic noise meter.
Its purpose is to measure the sound
intensity level in dB. The level of
sensitivity of this device is 0.1. This tool
is small and easy to carry and use for
process measurements. The level of
sensitivity of this device is proportional
to the rate of the noise level in a room.
For this study, the device was set to
record the average sound intensity
readings within 30 seconds for each time
a reading is taken.
Measurement Process
For the measurement of IEQ in an academic building, the scientific measurement data collection
was used. The scientific measurements performed in the study by measuring parameters such as
temperature (° C), relative humidity (percent), air velocity (m/s), the level of CO2 concentration
(ppm), the level of illumination (Lux) and the rate of sound intensity (dB). Five classrooms
selected for each university and the measurement is done in two days. Readings are taken three
times in each classroom to get the average daily reading. The first reading is taken between 8:00
am to 10:00 am, the second reading between the 12:00 pm to 1:00 pm and the third reading
between the 3:00 pm to 5:00 pm. Measurements taken at the optimal time when students are in
the academic buildings and by reference and adoption of ASHRAE.
THE QUALITY OF THE INTERNAL ENVIRONMENT (IEQ) IN ACADEMIC
BUILDINGS IN MALAYSIA
Findings
The measurement of Indoor Environmental Quality (IEQ) was performed in 20 universities
across Malaysia. For each university, five samples of classrooms were selected randomly. The
measurements were made during the learning and teaching process in progress was aimed at
getting accurate reading and better result. Five classrooms were selected for each university and
the measurement is done within two days. A number of three times reading was performed in
each lecture room to get an average daily reading. The first reading is taken between 8:00 am to
10:00 am, the second reading between 12:00 pm to 1:00 pm and the third reading between 3:00
pm to 5:00 pm. The measurements taken at the optimal time where students having activities in
academic buildings and the measurement procedures also referred to ASHRAE.
The measurements performed using the following tools:
Temperature and relative humidity: Digital Thermo Hygrometer
The intensity of sound: Acoustic noise meter
European Journal of Sustainable Development Vol. 3 No 4, 2014. Pp 323- 338,
Doi: 10.14207/ejsd.2014.v3n4p323 ISSN: 2239-5938 (print) ISSN:2239-6101 (online) European Centre of Sustainable Development Page 10
The intensity of light: Lux light Meter
Air movement: Flow Meter
The concentration of CO2: CO2 Meter
Table 2 shows the standard benchmarks and standards set on the elements of IEQ in academics
buildings.
Table 2: The benchmark IEQ measurement elements of academic buildings
(Source: MS 1525:2007 and UNESCO)
IEQ Measurement Elements Reading Standard Set
Temperature 23 – 26 °C
Relative humidity 55 - 70 %
Sound 50 - 70 dB
Light 300 - 500 Lux
Air Movement 0.15 - 0.50 m/s
The concentration of CO2 Below 1000 ppm
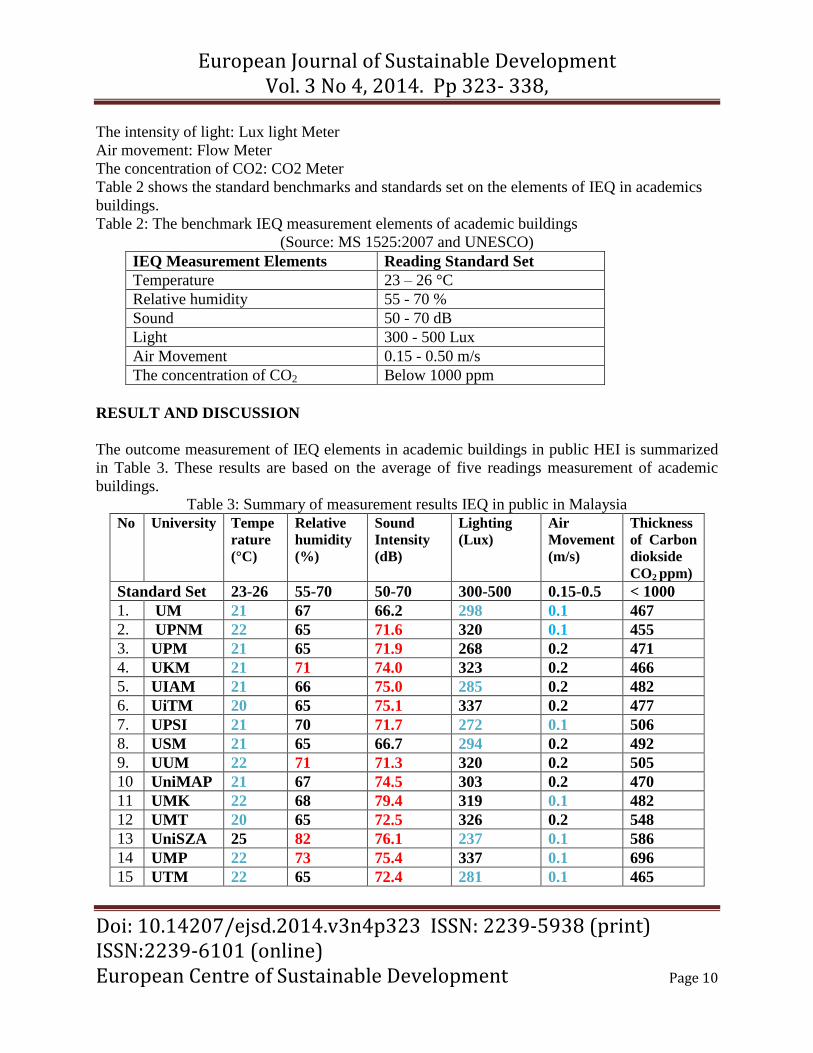
RESULT AND DISCUSSION
The outcome measurement of IEQ elements in academic buildings in public HEI is summarized
in Table 3. These results are based on the average of five readings measurement of academic
buildings.
Table 3: Summary of measurement results IEQ in public in Malaysia
No University Tempe
rature
(°C)
Relative
humidity
(%)
Sound
Intensity
(dB)
Lighting
(Lux)
Air
Movement
(m/s)
Thickness
of Carbon
diokside
CO2 ppm)
Standard Set 23-26 55-70 50-70 300-500 0.15-0.5 < 1000
1. UM 21 67 66.2 298 0.1 467
2. UPNM 22 65 71.6 320 0.1 455
3. UPM 21 65 71.9 268 0.2 471
4. UKM 21 71 74.0 323 0.2 466
5. UIAM 21 66 75.0 285 0.2 482
6. UiTM 20 65 75.1 337 0.2 477
7. UPSI 21 70 71.7 272 0.1 506
8. USM 21 65 66.7 294 0.2 492
9. UUM 22 71 71.3 320 0.2 505
10 UniMAP 21 67 74.5 303 0.2 470
11 UMK 22 68 79.4 319 0.1 482
12 UMT 20 65 72.5 326 0.2 548
13 UniSZA 25 82 76.1 237 0.1 586
14 UMP 22 73 75.4 337 0.1 696
15 UTM 22 65 72.4 281 0.1 465
European Journal of Sustainable Development Vol. 3 No 4, 2014. Pp 323- 338,
Doi: 10.14207/ejsd.2014.v3n4p323 ISSN: 2239-5938 (print) ISSN:2239-6101 (online) European Centre of Sustainable Development Page 11
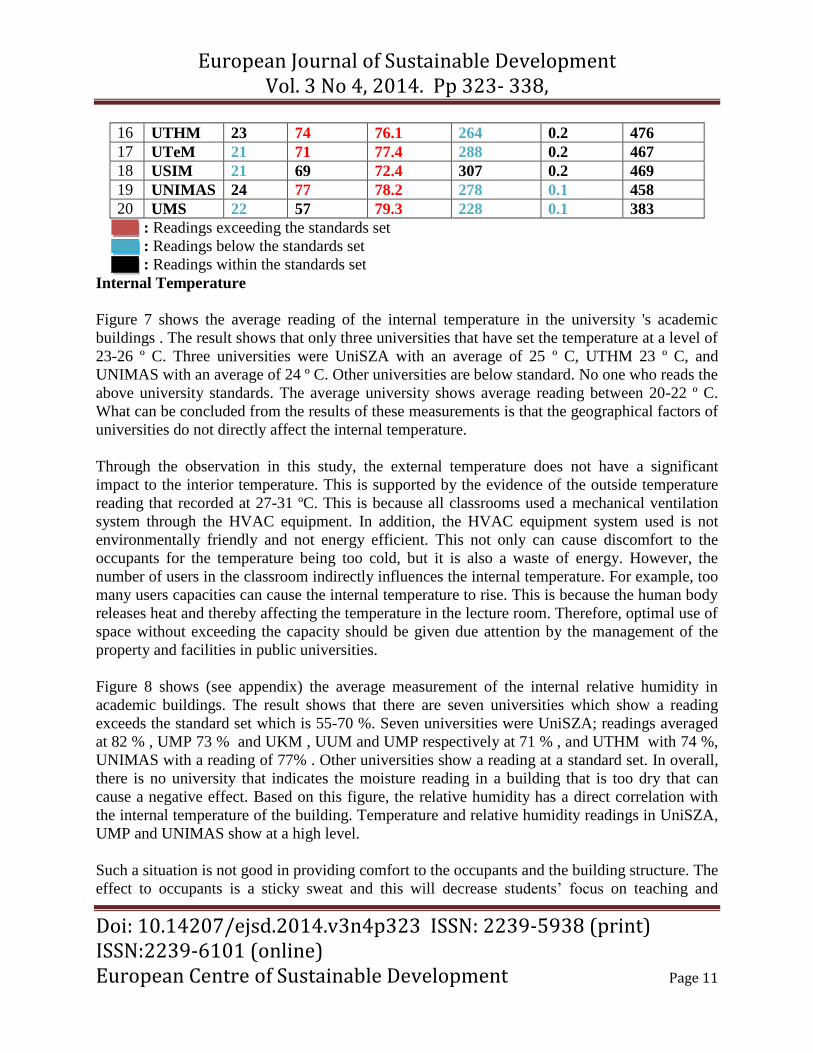
16 UTHM 23 74 76.1 264 0.2 476
17 UTeM 21 71 77.4 288 0.2 467
18 USIM 21 69 72.4 307 0.2 469
19 UNIMAS 24 77 78.2 278 0.1 458
20 UMS 22 57 79.3 228 0.1 383
: Readings exceeding the standards set
: Readings below the standards set
: Readings within the standards set
Internal Temperature
Figure 7 shows the average reading of the internal temperature in the university 's academic
buildings . The result shows that only three universities that have set the temperature at a level of
23-26 º C. Three universities were UniSZA with an average of 25 º C, UTHM 23 º C, and
UNIMAS with an average of 24 º C. Other universities are below standard. No one who reads the
above university standards. The average university shows average reading between 20-22 º C.
What can be concluded from the results of these measurements is that the geographical factors of
universities do not directly affect the internal temperature.
Through the observation in this study, the external temperature does not have a significant
impact to the interior temperature. This is supported by the evidence of the outside temperature
reading that recorded at 27-31 ºC. This is because all classrooms used a mechanical ventilation
system through the HVAC equipment. In addition, the HVAC equipment system used is not
environmentally friendly and not energy efficient. This not only can cause discomfort to the
occupants for the temperature being too cold, but it is also a waste of energy. However, the
number of users in the classroom indirectly influences the internal temperature. For example, too
many users capacities can cause the internal temperature to rise. This is because the human body
releases heat and thereby affecting the temperature in the lecture room. Therefore, optimal use of
space without exceeding the capacity should be given due attention by the management of the
property and facilities in public universities.
Figure 8 shows (see appendix) the average measurement of the internal relative humidity in
academic buildings. The result shows that there are seven universities which show a reading
exceeds the standard set which is 55-70 %. Seven universities were UniSZA; readings averaged
at 82 % , UMP 73 % and UKM , UUM and UMP respectively at 71 % , and UTHM with 74 %,
UNIMAS with a reading of 77% . Other universities show a reading at a standard set. In overall,
there is no university that indicates the moisture reading in a building that is too dry that can
cause a negative effect. Based on this figure, the relative humidity has a direct correlation with
the internal temperature of the building. Temperature and relative humidity readings in UniSZA,
UMP and UNIMAS show at a high level.
Such a situation is not good in providing comfort to the occupants and the building structure. The
effect to occupants is a sticky sweat and this will decrease students’ focus on teaching and
European Journal of Sustainable Development Vol. 3 No 4, 2014. Pp 323- 338,
Doi: 10.14207/ejsd.2014.v3n4p323 ISSN: 2239-5938 (print) ISSN:2239-6101 (online) European Centre of Sustainable Development Page 12
learning activities. This has been supported by Balaras (2007) in the previous studies which
states that things like this happen because of the increase of water content in the air. The impact
on the building structure and the material will make it easy to breed microbiology in damp
conditions that will subsequently damage the building structures. This also can shorten the
lifespan of a building structure (Kamaruzaman J. et al .,2009). In addition, the high humidity can
also affect the color of paint on the building texture and will cause mold. The electronic
equipments for R & D activities such as audio systems, transmission equipment screen (OHP )
and other related equipments in laboratories are very sensitive to humidity and shall be affected
when the indoor humidity is prolonged. This will directly increase the cost of maintenance and
hinder the quality of activities in the academic building.
Interior Lighting
Figure 9 (see appendix) shows the average reading for interior lighting in the university's
academic buildings. The result shows that, of 20 universities, there are only 9 universities which
show a reading within the standards of 300-500 Lux. The universities are, UMP (337 Lux),
UKM (323 Lux), UPNM (320 Lux), UiTM (337 Lux), UUM (320 Lux), UniMAP (303 Lux),
UMK (319 Lux), UMT (326 Lux), and USIM (307 Lux). The Other universities showed readings
below a standard set, however, no university shows excess in the level of the standard sets.
Based on the researchers’ observations, there are several factors that can cause the rate fall below
the level of prescribed slighting standards. Among them are bulbs that did not work and no
maintenance that has been done despite it has been going on for quite some time. From the
feedback of the interviews, this has went on for almost a month, even though reports have been
made to the management of assets and facilities, but no action taken. In addition, there are bulbs
not working properly. This is likely due to the life span of the bulb that is out of date but still in
use.
The building orientations that are difficult to justify the light passes position also give the
impression of a low lighting situation. Most happened to the old academic building that fostered
more than 30 years. This may give an impact to the residents with problems such as limited
vision, eye pain that may cause to lost in focus when the teaching and learning in progress. This
case needs to be given deep concern as it will decrease the students academic productivity. This
is supported by Lewy et al. (1982), which states adequate lighting, capable of improving
productivity, qualities, user spirit, and energy saving. In the context of the academic buildings as
well, Hakim et al. (2006), describes that, lighting system is an important factor in the provision
of facilities for the learning space.
Sound Intensity
European Journal of Sustainable Development Vol. 3 No 4, 2014. Pp 323- 338,
Doi: 10.14207/ejsd.2014.v3n4p323 ISSN: 2239-5938 (print) ISSN:2239-6101 (online) European Centre of Sustainable Development Page 13
Figure 10 (see appendix) shows the average intensity of internal noise in public academic
buildings . The result shows that only 2 universities indicate the reading at a specified level of
50-70 decibels (dB). The two universities are UM with an average reading of 66.2 dB and 66.7
USM. Other universities show the reading exceeds the standard set, but no university falls under
standard sets.
Noise pollution in buildings is caused by two main factors, namely, the noise from the outside
and the sound from within the building itself. Interference from external noise occurs in
attendance from surrounding areas such as vehicle noise, industrial, construction, natural sounds
such as the sound of the waves and the beach. This is true in some universities such as UMP,
UTHM, UMK, UMT, UniSZA, and UMS. In another situation, noise from the outside of the
building penetrates into the building through a window that is not functioning properly also
contributes to noise pollution.
Noise disturbance from the building occurs due to a mechanical ventilation system equipment
that emits high-pitched sounds that disrupt the occupants in the building. According to NIOSH,
the noise from mechanical equipment cannot be sustained for more than 8 hours. In addition, the
noise from the residents’ activities also contributes to the increase in the intensity of the noise in
the building.
This is supported by Prasher et al, (2003) who pointed out that the activities of the human
himself contributes to noise pollution. In overall, academic buildings do not have the
characteristics of a perfect sound distraction absorbent. Excessive noise can cause health effects
and performance of the occupants.
Such interference could result in lower acceptance of teaching activities presented by the
lecturers by the students. This is supported by Hakim et al. (2005) stating that the sound was
very influential in the learning process. Noisy conditions and reverberant sound during the
learning process will reduce the study concentration. In terms of health, it can cause an impact on
psychological health and consumer ear as pointed by Lebo and Oliphant (1968).
Air Movement
Figure 11 (see appendix) shows the average movement of indoor air in the academic building.
The standard reading was set at 0.15-0.5 m/s. The study shows that, only eleven universities
show readings at standard sets. The universities are UPM, UKM, IIUM, UiTM, USM, UUM,
UniMAP, UMT, UTHM, UTeM and USIM with all recorded readings of 0.2 m/s.
The Indoor air movement associated with ventilation systems and internal buildings in this
research involved a sample of all the mechanical ventilation systems through the HVAC
equipment.
European Journal of Sustainable Development Vol. 3 No 4, 2014. Pp 323- 338,
Doi: 10.14207/ejsd.2014.v3n4p323 ISSN: 2239-5938 (print) ISSN:2239-6101 (online) European Centre of Sustainable Development Page 14
Therefore, indoor air movement is influenced by the function performed by the air conditioner.
Failure of HVAC equipment functioning properly can affect the internal environment such as the
chemical composition of the atmosphere has not changed accretion spores and fungi that can
affect the structure of the building and increase the amount of moisture in the building.
Readings air movement is under prescribed standards can cause indoor air composition does not
change with the new air. The air exchange rate in mechanically ventilated buildings must occur
at a rate 12 to 15 times per hour.
Therefore, if the low air movement, indoor air is difficult to replace will cause the composition
of polluted air, especially carbon dioxide (CO2) and humidity caused by the inhabitants of the
water vapor through the process of respiration in the building. According to Sulaiman (1988), the
movement of air critical to the process to keep all the comfort temperature, humidity, and oxygen
in a space with clean air to enter the space to replace dirty or used air.
Concentrations of Carbon Dioxide
Figure 12 (see appendix) shows the average concentrations of carbon dioxide (CO2) in the
internal university academic building. The results showed that all universities set reads of 1000
ppm (part per million). This indicates an internal CO2 concentration in academic buildings are in
good condition showing the highest reading recorded was 696 ppm in the UMP and the lowest
reading recorded was 383 ppm in UMS.
The presence of CO2 concentrations in the air that is too high can affect bad to occupants of the
building. Based on observations, the number of users exceeds the capacity of classroom space
utilization has resulted in increased CO2 concentration readings. This is because, in the
respiratory system, human release of gases, especially CO2. While the concentration of CO2 in
university classrooms is still manageable, attention should be given, especially in the number of
user capacity in order for the classrooms to be well controlled and effective. Low concentrations
are better as it affects the health of building occupants and productivity. High concentrations of
CO2 can cause a person to feel sleepy due to lack of oxygen (O2) into the body, thus causing
residents to lose focus on the process of learning takes place in the lecture.
IEQ Influence on the Process of Teaching and Learning
A survey of 500 respondents was conducted to support scientific measurement. A total of 25
samples from each universities were chosen which representatives of occupants of academic
buildings i.e. students and lecturers.
European Journal of Sustainable Development Vol. 3 No 4, 2014. Pp 323- 338,
Doi: 10.14207/ejsd.2014.v3n4p323 ISSN: 2239-5938 (print) ISSN:2239-6101 (online) European Centre of Sustainable Development Page 15
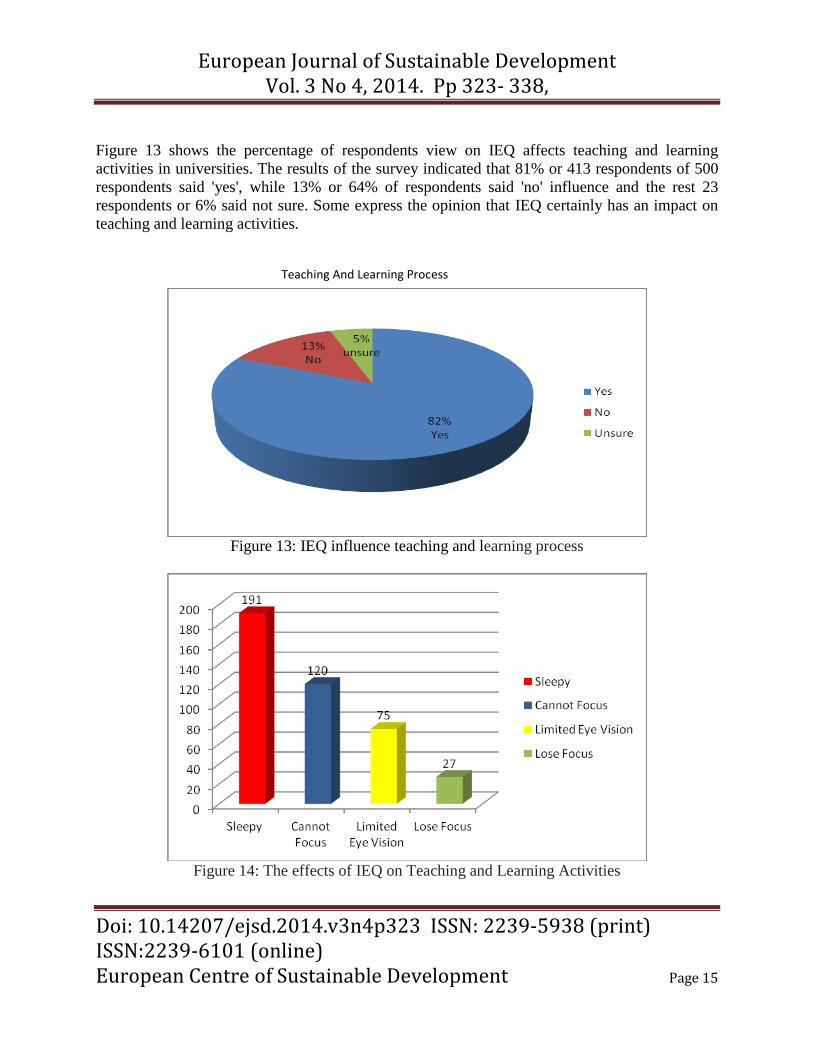
Figure 13 shows the percentage of respondents view on IEQ affects teaching and learning
activities in universities. The results of the survey indicated that 81% or 413 respondents of 500
respondents said 'yes', while 13% or 64% of respondents said 'no' influence and the rest 23
respondents or 6% said not sure. Some express the opinion that IEQ certainly has an impact on
teaching and learning activities.
Figure 13: IEQ influence teaching and learning process
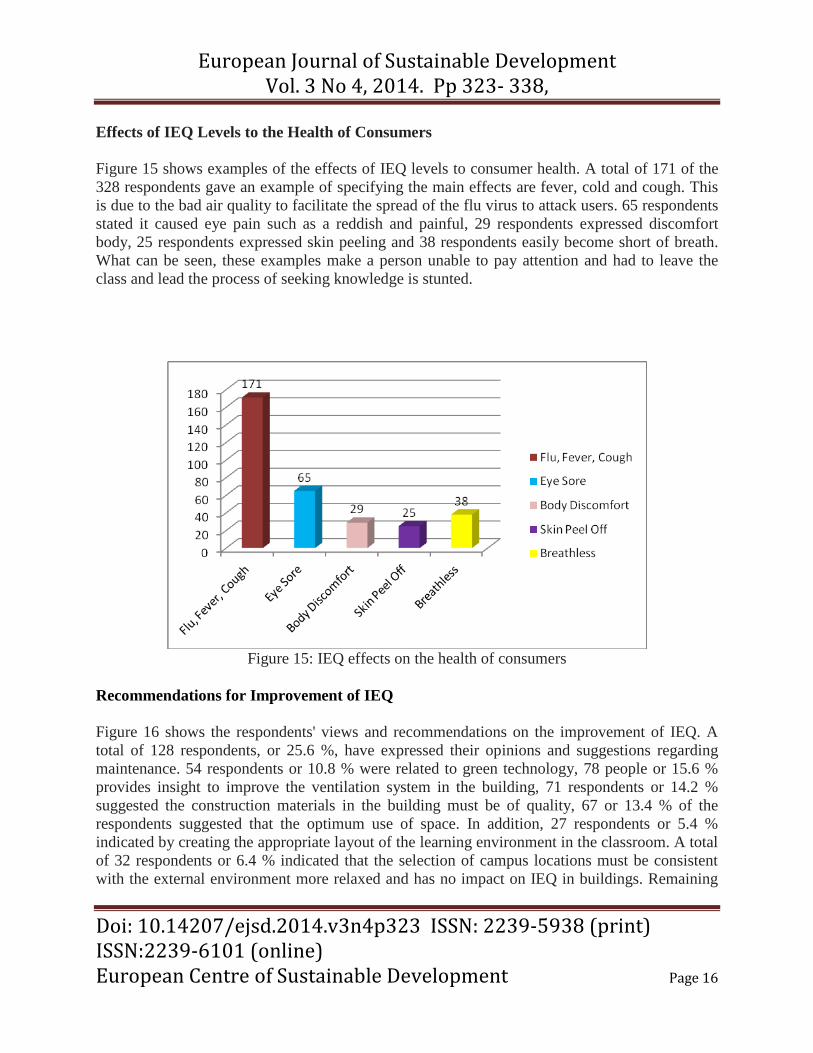
Figure 14: The effects of IEQ on Teaching and Learning Activities
Teaching And Learning Process
European Journal of Sustainable Development Vol. 3 No 4, 2014. Pp 323- 338,
Doi: 10.14207/ejsd.2014.v3n4p323 ISSN: 2239-5938 (print) ISSN:2239-6101 (online) European Centre of Sustainable Development Page 16
Effects of IEQ Levels to the Health of Consumers
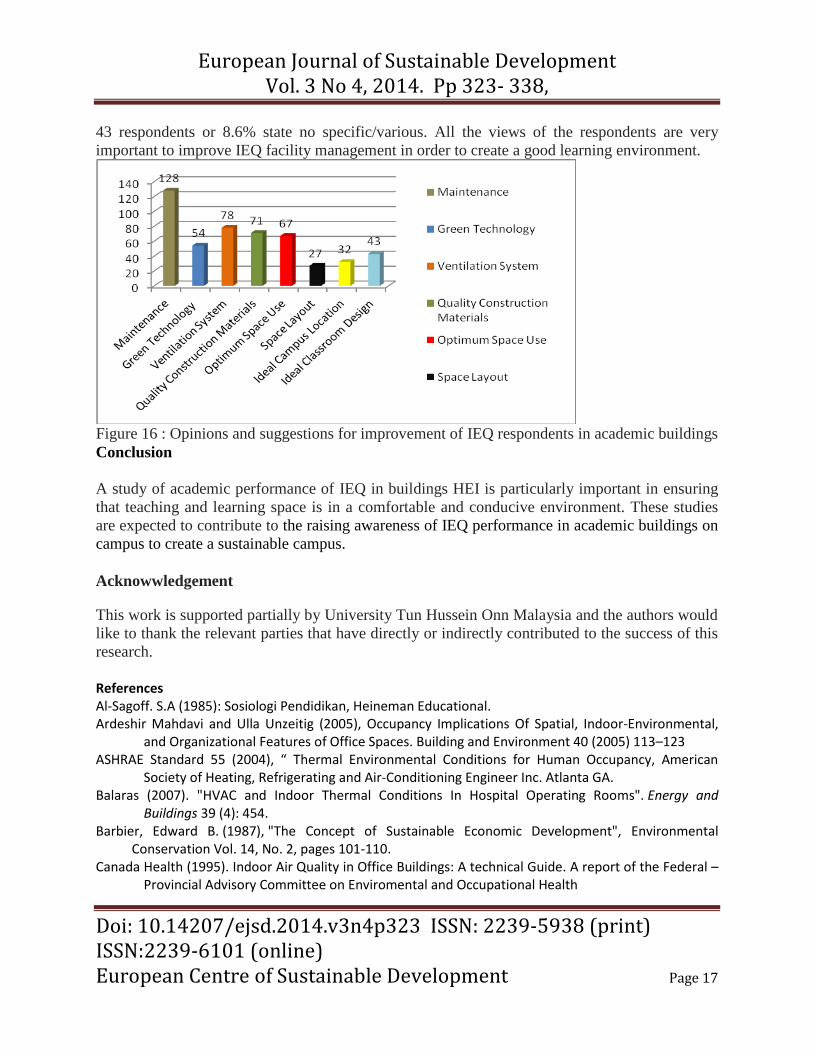
Figure 15 shows examples of the effects of IEQ levels to consumer health. A total of 171 of the
328 respondents gave an example of specifying the main effects are fever, cold and cough. This
is due to the bad air quality to facilitate the spread of the flu virus to attack users. 65 respondents
stated it caused eye pain such as a reddish and painful, 29 respondents expressed discomfort
body, 25 respondents expressed skin peeling and 38 respondents easily become short of breath.
What can be seen, these examples make a person unable to pay attention and had to leave the
class and lead the process of seeking knowledge is stunted.
Figure 15: IEQ effects on the health of consumers
Recommendations for Improvement of IEQ
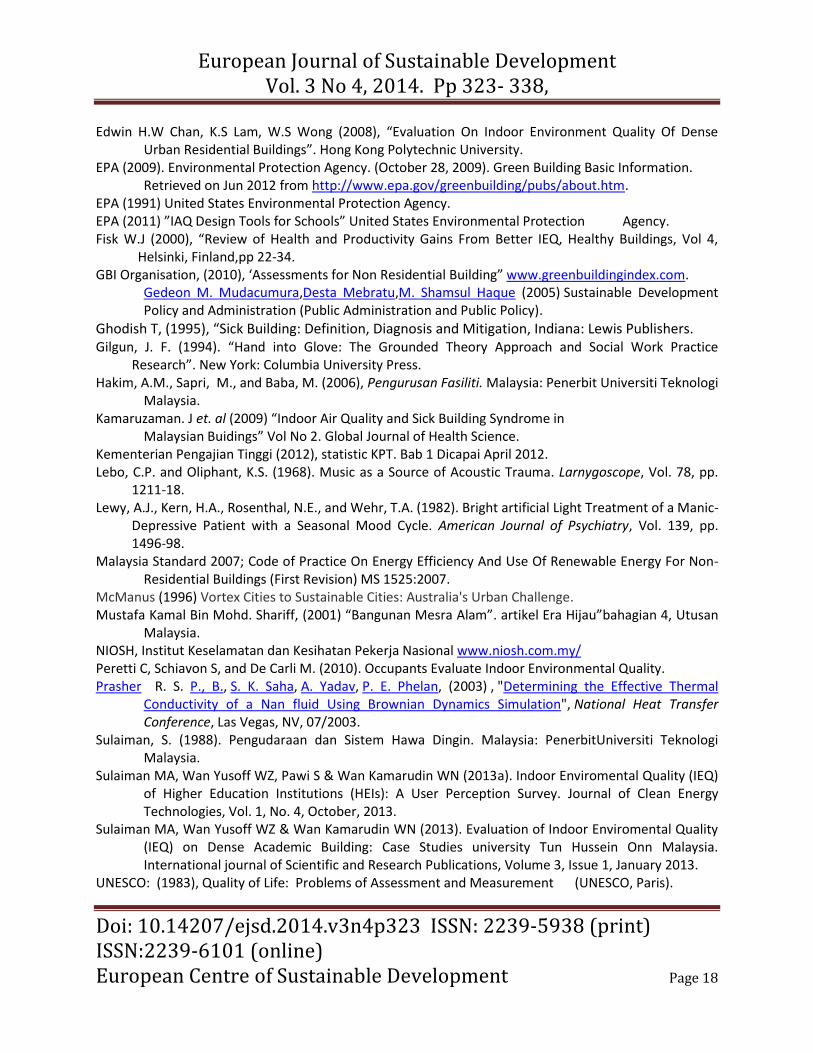
Figure 16 shows the respondents' views and recommendations on the improvement of IEQ. A
total of 128 respondents, or 25.6 %, have expressed their opinions and suggestions regarding
maintenance. 54 respondents or 10.8 % were related to green technology, 78 people or 15.6 %
provides insight to improve the ventilation system in the building, 71 respondents or 14.2 %
suggested the construction materials in the building must be of quality, 67 or 13.4 % of the
respondents suggested that the optimum use of space. In addition, 27 respondents or 5.4 %
indicated by creating the appropriate layout of the learning environment in the classroom. A total
of 32 respondents or 6.4 % indicated that the selection of campus locations must be consistent
with the external environment more relaxed and has no impact on IEQ in buildings. Remaining
European Journal of Sustainable Development Vol. 3 No 4, 2014. Pp 323- 338,
Doi: 10.14207/ejsd.2014.v3n4p323 ISSN: 2239-5938 (print) ISSN:2239-6101 (online) European Centre of Sustainable Development Page 17
43 respondents or 8.6% state no specific/various. All the views of the respondents are very
important to improve IEQ facility management in order to create a good learning environment.
Figure 16 : Opinions and suggestions for improvement of IEQ respondents in academic buildings
Conclusion
A study of academic performance of IEQ in buildings HEI is particularly important in ensuring
that teaching and learning space is in a comfortable and conducive environment. These studies
are expected to contribute to the raising awareness of IEQ performance in academic buildings on
campus to create a sustainable campus.
Acknowwledgement
This work is supported partially by University Tun Hussein Onn Malaysia and the authors would
like to thank the relevant parties that have directly or indirectly contributed to the success of this
research.
References Al-Sagoff. S.A (1985): Sosiologi Pendidikan, Heineman Educational. Ardeshir Mahdavi and Ulla Unzeitig (2005), Occupancy Implications Of Spatial, Indoor-Environmental,
and Organizational Features of Office Spaces. Building and Environment 40 (2005) 113–123 ASHRAE Standard 55 (2004), “ Thermal Environmental Conditions for Human Occupancy, American
Society of Heating, Refrigerating and Air-Conditioning Engineer Inc. Atlanta GA. Balaras (2007). "HVAC and Indoor Thermal Conditions In Hospital Operating Rooms". Energy and
Buildings 39 (4): 454. Barbier, Edward B. (1987), "The Concept of Sustainable Economic Development", Environmental
Conservation Vol. 14, No. 2, pages 101-110. Canada Health (1995). Indoor Air Quality in Office Buildings: A technical Guide. A report of the Federal –
Provincial Advisory Committee on Enviromental and Occupational Health
European Journal of Sustainable Development Vol. 3 No 4, 2014. Pp 323- 338,
Doi: 10.14207/ejsd.2014.v3n4p323 ISSN: 2239-5938 (print) ISSN:2239-6101 (online) European Centre of Sustainable Development Page 18
Edwin H.W Chan, K.S Lam, W.S Wong (2008), “Evaluation On Indoor Environment Quality Of Dense Urban Residential Buildings”. Hong Kong Polytechnic University.
EPA (2009). Environmental Protection Agency. (October 28, 2009). Green Building Basic Information. Retrieved on Jun 2012 from http://www.epa.gov/greenbuilding/pubs/about.htm.
EPA (1991) United States Environmental Protection Agency. EPA (2011) ”IAQ Design Tools for Schools” United States Environmental Protection Agency. Fisk W.J (2000), “Review of Health and Productivity Gains From Better IEQ, Healthy Buildings, Vol 4,
Helsinki, Finland,pp 22-34. GBI Organisation, (2010), ‘Assessments for Non Residential Building” www.greenbuildingindex.com.
Gedeon M. Mudacumura,Desta Mebratu,M. Shamsul Haque (2005) Sustainable Development Policy and Administration (Public Administration and Public Policy).
Ghodish T, (1995), “Sick Building: Definition, Diagnosis and Mitigation, Indiana: Lewis Publishers. Gilgun, J. F. (1994). “Hand into Glove: The Grounded Theory Approach and Social Work Practice
Research”. New York: Columbia University Press. Hakim, A.M., Sapri, M., and Baba, M. (2006), Pengurusan Fasiliti. Malaysia: Penerbit Universiti Teknologi
Malaysia. Kamaruzaman. J et. al (2009) “Indoor Air Quality and Sick Building Syndrome in
Malaysian Buidings” Vol No 2. Global Journal of Health Science. Kementerian Pengajian Tinggi (2012), statistic KPT. Bab 1 Dicapai April 2012. Lebo, C.P. and Oliphant, K.S. (1968). Music as a Source of Acoustic Trauma. Larnygoscope, Vol. 78, pp.
1211-18. Lewy, A.J., Kern, H.A., Rosenthal, N.E., and Wehr, T.A. (1982). Bright artificial Light Treatment of a Manic-
Depressive Patient with a Seasonal Mood Cycle. American Journal of Psychiatry, Vol. 139, pp. 1496-98.
Malaysia Standard 2007; Code of Practice On Energy Efficiency And Use Of Renewable Energy For Non-Residential Buildings (First Revision) MS 1525:2007.
McManus (1996) Vortex Cities to Sustainable Cities: Australia's Urban Challenge. Mustafa Kamal Bin Mohd. Shariff, (2001) “Bangunan Mesra Alam”. artikel Era Hijau”bahagian 4, Utusan
Malaysia. NIOSH, Institut Keselamatan dan Kesihatan Pekerja Nasional www.niosh.com.my/ Peretti C, Schiavon S, and De Carli M. (2010). Occupants Evaluate Indoor Environmental Quality. Prasher R. S. P., B., S. K. Saha, A. Yadav, P. E. Phelan, (2003) , "Determining the Effective Thermal
Conductivity of a Nan fluid Using Brownian Dynamics Simulation", National Heat Transfer Conference, Las Vegas, NV, 07/2003.
Sulaiman, S. (1988). Pengudaraan dan Sistem Hawa Dingin. Malaysia: PenerbitUniversiti Teknologi Malaysia.
Sulaiman MA, Wan Yusoff WZ, Pawi S & Wan Kamarudin WN (2013a). Indoor Enviromental Quality (IEQ) of Higher Education Institutions (HEIs): A User Perception Survey. Journal of Clean Energy Technologies, Vol. 1, No. 4, October, 2013.
Sulaiman MA, Wan Yusoff WZ & Wan Kamarudin WN (2013). Evaluation of Indoor Enviromental Quality (IEQ) on Dense Academic Building: Case Studies university Tun Hussein Onn Malaysia. International journal of Scientific and Research Publications, Volume 3, Issue 1, January 2013.
UNESCO: (1983), Quality of Life: Problems of Assessment and Measurement (UNESCO, Paris).
European Journal of Sustainable Development Vol. 3 No 4, 2014. Pp 323- 338,
Doi: 10.14207/ejsd.2014.v3n4p323 ISSN: 2239-5938 (print) ISSN:2239-6101 (online) European Centre of Sustainable Development Page 19
UNEP (1991) United Nation Environmental Program. www.unep.org/resources/gov/prev_docs/91_Gc16_proceeding_k9101200.pdf. dicapai september 2012.
Wan Yusoff, WZ & Wong Ru Wen (2014) Analysis of the International Sustainable building Rating Systems (SBRSs) for Sustainable Development with Special Focused on Green Building Index (GBI) Malaysia. Journal of Environmental Conservation Research
WHO | World Health Organization www.who.int dicapai Mei 2012. WCED, World Commission on Enviroment and Development (1987)
http://public.wsu.edu/~susdev/WCED87.html dicapai pada Oktober 2012-12-18. Yuan Hui Zhang (2005), Indoor Air Quality Engineering. CRC PressINC, 2005 Zainal. M Md Yusof, (2011) "Getting to Know Our Buildings Better: Ventilation, Thermal Comfort, Air
Freshness, Indoor Air Quality (IAQ), Sick Building Syndrome (SBS). Syarahan Perdana, Pejabat Penerbit, University Tun Hussein Onn Malaysia.
Top Related
Copyright © 2022 FDOKUMEN

