


Bahasa
Halaman
Hukum


Supporting Industries in the Age of Globalization and Regionalization:
State Aid in the European Union
Umut Aydin
Department of Political Science University of Washington
Gowen Hall 101, BOX 353530 Seattle, WA 98195-3530 [email protected]
Prepared for Presentation at the 2007 Biennial Conference of the
European Union Studies Association Montreal, Canada May 17-19, 2007

2
Increasing mobility of capital pressures governments around the world to remain attractive locations for
investment. In order to attract new firms or to maintain existing ones, governments at national and
subnational levels offer various forms of subsidies to firms including direct grants, tax breaks, worker
training credits and free land. Competition to attract footloose capital creates similar pressures for
governments around the world, resulting in subsidy races that lead governments to bid against one another
with growing subsidy packages. There is considerable variation, however, in the level and type of subsidies
governments offer. Among European countries which are similarly situated in the global economy, for
instance, Austria and the Netherlands provide subsidies for research and development, Portugal, France and
Ireland focus on aiding specific manufacturing sectors, and Belgium and Italy stress regional assistance.
What explains this variation in government support to businesses? In this paper, I argue that the mobility of
capital in the economy and the domestic institutions and politics influence the level and type of subsidies
offered by a government.
Subsidies are industrial policy tools that governments frequently use to respond to the pressures of
increasing integration into world markets. Existing research investigates the impact of a country’s openness
to international trade, the specificity of assets in the economy, the level of unemployment, the ideological
leaning of the party in power, fractionalization of the parliament and electoral competition on the level of
government support to industries (Alt et al. 1999; Blais, Desranleau, and Vanier 1986; Neven 1994; Verdier
1995; Zahariadis 1997; Zahariadis 2001; Zahariadis 2005). Some of this research addresses the effects of
domestic political institutions on the level and type of subsidy programs, however, there is no agreement
over which institutions matter and how. In order to address this gap in the literature, I draw on the growing
body of research in comparative political economy on the effect of political institutions on various economic
and social policies, ranging from macroeconomic and fiscal policies (Franzese 2002; Hallerberg and von
Hagen 1999; Milesi-Ferretti, Perotti, and Rostagno 2002) to pork barrel politics (Franzese and Nooruddin
2004; Lancaster and Patterson 1990) and corruption (Persson, Tabellini, and Trebbi 2003). I argue that
electoral and party politics has an impact on the level and type of subsidies that governments offer to
businesses. The extant literature on subsidies also fails to systematically examine the impact of geographical
mobility of capital on the level and types of subsidies governments offer. 1 Drawing on research on
globalization and domestic politics, I explore whether mobility influences the ability of asset holders to
receive subsidies from governments.
1 As an exception, see Thomas (2000), who presents a detailed case analysis of how mobility of capital influences subsidies granted by subnational governments in the US and Canada, and the member states of the European Union.

3
Empirically, this paper focuses on subsidies in the European Union (EU) member states. I explore the
impact of capital mobility and electoral institutions and party politics on the level and types of subsidies in
the EU members in the period 1992-2005. These cases maintain variation on the independent variables, while
also allowing for controls on some other factors such as the structure of the economies’ links to the global
markets. Furthermore, the EU policies create significant pressures for convergence of subsidy policies of the
member states. The EU rules on subsidies—called state aid in the EU—limit the level and types of member
state subsidies to business in an effort to create a level playing field in the single market. As a consequence,
the EU member states have tried to reduce their subsidy levels and redirect subsidy programs towards
objectives such as supporting R&D, worker retraining and the environment especially since the 1980s
(Commission of the European Communities various years; Smith 1998). If empirical analysis in this paper
demonstrates that significant differences in subsidy policies of the EU members remain despite these
pressures from the European Union, this would lend additional support for the argument that capital mobility
and electoral politics shape the subsidy policies of countries.
After defining subsidies and providing some background on trends in government support to business in
the EU in the following section, in the third section I outline my arguments about capital mobility, electoral
politics and subsidies. In the fourth section, I discuss the methodology and the data used to test these
arguments. I then present and discuss the empirical analyses in the fifth section, and conclude by situating the
empirical findings of this paper in broader context of the existing research on this topic.
Subsidies: background, trends and existing research
The OECD defines public support to business as any form of direct or indirect selective financial support,
such as grants, low-interest loans, and tax breaks (OECD 1998, 19). In the EU, the European Commission
adopts an even broader definition of subsidies based on the Treaty on European Union (TEU), which
includes any state measure that confers an economic advantage on the recipient and that is granted
selectively to certain firms or for the production of certain goods.2 It includes financial, fiscal, and in-kind
benefits to firms such as direct grants, tax breaks, tax deferrals, soft loans and loan guarantees (Thomas 2000,
55). In this study, I define subsidies as any form of state support to industry that is granted selectively to
certain firms, based on the definitions of the OECD and the EU.
Subsidies became important industrial policy tools in the 1960s, initially as a response to trade
liberalization (Trebilcock, Chandler, and Howse 1990, 104). As successive rounds of trade agreements
reduced tariff and non-tariff barriers to trade, subsidies became a major tool for protecting and promoting
industries. The nature and uses of subsidies have not remained constant over time, however. In the 1960s and
2 Article 87, Treaty on European Union.

4
1970s, subsidies were directed frequently towards aiding specific sectors in decline such as steel and
shipbuilding, and creating national champions in strategic sectors such as aerospace. This earlier strategy of
subsidizing industries has changed since the mid-1980s. While traditional justifications for subsidies
continue to be emphasized occasionally, increasingly, new policies and attitudes towards industrial policy
have emerged.
In the European Union, increasing policy entrepreneurship by the Commission and changing attitudes in
some of the member states led to a move away from subsidies to declining sectors and towards what are
called horizontal and regional subsidies (Pontusson 1992; Smith 1996). These include subsidies to promote
research and development (R&D), subsidies for small and medium sized enterprises (SMEs), for
employment, and subsidies that aim to narrow the gap between the poor and rich regions of the EU. The
Commission argues that these types of subsidies are less harmful for competition in the single market and
more appropriate for making European companies more viable internationally (Commission of the European
Communities 2001). The shift towards horizontal policies occurred gradually in the European countries,
starting with Britain in the late 1970s, Sweden and Denmark in the mid-1980s, and France, Italy, Portugal
and Spain in the 1990s.
There is a growing body of research which focuses on industrial support policies of developed countries.
Both the EU and the OECD collect and publish data on subsidies in the member countries, which facilitates
systematic comparative studies on subsidies.3 These comparative studies focus on the factors that lead
governments to provide support to particular industries. Verdier, for instance, explores the incentives of
governments to offer and social groups to seek subsidies in OECD countries (Verdier 1995). He argues that
governments use subsidies to increase their chances of staying in power and finds that left-leaning
governments offer subsidies directed to labor and right-leaning governments to capital. Zahariadis (1997)
finds that in the EU member states higher trade deficits and dominance of left parties in government lead to
higher levels of subsidies. In a study of OECD countries, Zahariadis (2001) finds that international
competition puts pressures on firms with specific assets and leads these groups to lobby more intensely for
subsidies. Alt, Carlsen, Heum and Johansen’s (1999) research on subsidies in Norway focuses on the demand
for industrial subsidies in Norway in 1988. They find that asset specificity influences a firm’s likelihood of
demanding subsidies, controlling for firm size and export dependence.
These studies highlight the demand side of subsidy policies, with a focus on the preferences of domestic
interest groups and coalitions and how these influence government policies. I draw on the insights of this
3 The European Commission publishes an annual Survey on State Aids in the European Community since 1989. Two publications of the OECD on state support to industry cover the period 1970-1988 and 1989-1995 (Ford and Suyker 1990, OECD 1998).

5
body of literature regarding politicians’ incentives for offering subsidies. However, there is little emphasis in
these studies on how political institutions such as electoral systems influence politicians’ incentives for
providing subsidies. In this paper, I explicitly model how electoral institutions and party politics influence
policy outcomes by drawing on a growing body of theoretical and empirical research in comparative political
economy linking electoral institutions to economic policies and outcomes (Franzese and Nooruddin 2004;
Lancaster and Patterson 1990; Persson and Tabellini 2005). Furthermore, I explore the impact of a specific
aspect of globalization, the geographical mobility of capital on governments’ subsidy policies in addition to
these domestic political variables.
Explaining the Choice of Level and Type of Subsidies
All governments provide support to business to some extent, but the financial commitment of
governments to subsidy programs vary. For instance, the level of subsidies accounted for 0.3% of
manufacturing GDP in Switzerland, 1.3% in Denmark, and 3.2% in Norway in 1995.4 What accounts for this
variation in the financial commitment of governments to subsidies? Governments also have a choice among
different tools for supporting industries. Among the European countries in the 1990s, some countries such as
Austria and the Netherlands provided subsidies for R&D, while others such as Belgium and Italy stressed
regional assistance. Some of these subsidy programs have a narrower focus than others. For example,
subsidies directed towards rescuing a firm in difficulty and subsidies towards specific sectors such as coal
and steel apply to a small number of firms, and can be targeted towards certain firms. I refer to these as
targeted subsidies. Subsidies to support R&D, and subsidies for SMEs and for employment training apply to
a broader range of firms, and hence I call these broad subsidies. What explains whether governments choose
targeted subsidy programs that apply to a few firms or broad programs that benefit a large number of firms?
This paper focuses on two major factors to explain the level and type of subsidies offered by
governments, capital mobility and electoral and party politics. One of the central questions in political
economy concerns the impact of international economic factors on domestic policy making (Frieden and
Rogowski 1996). The argument is that changes in the international economy, such as lower trade barriers and
easing of capital controls, influence the preferences of domestic socioeconomic actors and the opportunities
and constraints faced by governments, and therefore, the domestic politics and policies of countries (Frieden
1991; Rogowski 1989, Milner and Keohane 1996). Recent studies of internationalization differentiate
between different types of international factors, such as trade liberalization, FDI in and out-flows, and
portfolio capital. The effects of trade liberalization have been the most intensely studied, and the findings are
4 These are levels of state support to manufacturing industry as percentage of manufacturing GDP in 1995 (OECD
1998).
6
the most consistent across studies. Starting with Cameron (1978), scholars have found that trade
liberalization has not constrained government spending, or led to a retrenchment in welfare policies. On the
contrary, government compensation of the real and potential losers of trade liberalization has increased
spending on such policies (Cameron 1978; Rodrik 1998).
The theory and empirical evidence on the effects capital mobility on domestic policies are less unified.
The expectation is that mobile asset holders will move to jurisdictions where they get better returns on their
assets (Swank 2002; Swank and Steinmo 2002). We expect capital and labor to move to jurisdictions that
have their preferred tax rates, public services and regulatory policies, assuming that there are no barriers to
their movement, and there are no costs to moving (Sinn 1992; Tiebout 1956). These assumptions do not
always approximate the real world (Harrison 2006, 5). Nevertheless, as the barriers to and the costs of
moving decrease, we can expect capital and labor to move to jurisdictions with their preferred tax rates and
policies.5
How does asset mobility influence government policies?6 Scholars argue that “the availability of
multiple comparable destinations for investment, the increasing abilities of foreign and domestic capital to
relocate quickly, and the increasing privatization of capital flows (which are less politically motivated and
more market driven than public flows)” create powerful incentives for governments to promote policies that
foreign investors find favorable (Shambaugh 2004, 282-83). This results in jurisdictions competing against
one another for investment by adopting business friendly policies. As Cohen argues, at a minimum, this has
put governments distinctly on the defensive, eroding much of the authority of the contemporary sovereign
state (Cohen 1996, 270).
The consequences of interjurisdictional competition can be positive or negative depending on one’s
normative assessment of various societal objectives, “among them equality within jurisdictions, equality
across jurisdictions, and economic efficiency” (Harrison 2006, 3). Some who see the main role of the state in
the economy as securing property rights view such competition as a desirable force that enhances economic
efficiency (Sinn 1992; Weingast 1995). According to this view, competition among governments has positive
implications for economic performance; as it “could tend to tame Leviathan tendencies of governments”
(Sinn 1992, 179). Others argue that competition among governments can lead to undesirable consequences.
5 While there are some studies on the mobility of labor, the bulk of theorizing and empirical research on the mobility of assets concern capital mobility. Therefore, in the rest of this paper, I focus on capital mobility. 6 Some would argue that mobility only contributes to the structural dependence of the state on capital. Starting with Marxists, scholars argued that as long as capitalists pursue their narrow, private self-interests, they sharply restrict the options of governments. Therefore “under capitalism all governments must respect and protect the essential claims of those who own the productive wealth of the society” (Przeworski and Wallerstein 1988, 11).

7
According to this view, competition for mobile investment results in lower tax rates (Thomas 2001; Wilson
1986), the underprovision of public goods, retrenchment in welfare policies (Rom, Peterson, and Scheve
1999) and weak environmental and labor laws. Oates (1972), for instance, offers a model of interstate
competition as a result of which governments cannot deliver levels of social assistance benefits demanded by
their residents. Governments’ attempts to deliver the desired levels of benefits would result in an in-
migration of welfare recipients—making the states so-called “welfare magnets”—and out-migration of
wealthy taxpayers (Oates 1972; Peterson and Rom 1990).
How does the mobility of assets influence governments’ subsidy policies? We expect mobile asset
holders to benefit from competition among jurisdictions to attract investment. As a consequence of their real
or potential mobility, holders of mobile factors of production are in a good bargaining position vis-à-vis
regional governments to get their preferred levels of public goods, taxes and subsidy packages (Donahue
1997; Hirschman 1970; Winters 1996). Mobile firms can credibly threaten governments with leaving the
jurisdiction or not investing there in the first place if they do not receive subsidies. Firms or citizens that are
relatively immobile, however, are at a disadvantage when lobbying for subsidies. Since they cannot threaten
the governments with exit, their demands, even when loudly voiced, may be less effective. Immobile asset
holders may also face increased tax burdens or declining levels of public goods as governments try to finance
subsidy competition. I therefore expect immobile asset holders to oppose subsidies to mobile capital and
pressure their governments not to offer subsidies. We expect that in a country dominated by mobile factors,
then, spending on subsidies will be higher. In countries where immobile asset holders dominate the economy,
governments will tend to provide lower levels of subsidies. Moreover, with increased dominance of mobile
factors, we would expect to see more subsidy programs directed towards mobile capital.
H1: The lower the ratio of immobile to mobile capital in a country, the larger is the spending on subsidies.
H2: The lower the ratio of immobile to mobile capital in a country, the higher is the level of subsidy
programs targeted towards mobile capital.
A growing body of research on globalization has shown that despite the strong pressures associated with
the mobility of goods, people, production and capital, domestic policies have not converged to a neoliberal
bottom due to the effects of domestic politics and institutions. Basinger and Hallerberg (2004), for instance,
argue that mobility of capital does not lead to a race to the bottom in tax rates because of domestic politics
and institutions. Their empirical analysis of capital tax policies in the OECD members from 1980 to 1997
demonstrates that countries are sensitive to tax reforms in competitor countries. However, their responses to
reforms are mediated by the domestic costs to reform arising from veto players in the legislatures, and the
political costs of ideological opposition. Swank (2002) argues that domestic political institutions such as

8
social corporatism and proportional representation mitigate the effects of capital mobility on social policies.
Garrett (1995; 1998) argues that the combination of strong left parties and encompassing labor unions help
sustain more progressive taxation, high corporate taxes, and large government spending in developed
countries.
My argument is that electoral and party politics, in addition to asset mobility, constrain governments’
policy choice on subsidies. There is a large body of research on how electoral institutions, party and electoral
politics shape economic and fiscal policies and more specifically, the nature and amount of distributive
politics within in a political system (Lancaster and Patterson 1990; Stratmann and Baur 2002; Weingast,
Shepsle, and Johnsen 1981). My argument on subsidies draws on this research. I posit that subsidies to
business are a form of distributive politics. Politicians who wish to bolster their electoral support use
subsidies to target benefits to voters.
Distributive policies allow the concentration of benefits and the diffusion of costs (Franzese and
Nooruddin 2004; Lowi 1964). They are “characterized by the ease with which they can be disaggregated and
dispensed unit by small unit, each unit more or less in isolation from other units and from any general rules”
(Lowi 1964, 690). Pork barrel projects are the classic example in the US context, whereby the benefits are
concentrated in a single district and the costs spread across all districts (Cain, Ferejohn, and Fiorina 1987,
210). The beneficiaries of distributive policies are a narrow group of citizens. Thus, they differ from broad
programs in the form of general public goods such as defense or redistributive programs such as social
insurance or pensions, which provide benefits to many citizens (Persson and Tabellini 2001).
Subsidies are selective measures that provide financial or fiscal benefits to individual firms. They by
definition differ from broad redistributive measures such as social welfare policies, which are targeted
towards large constituencies. Politicians can selectively grant subsidies to support employment, to attract or
to maintain businesses in an electoral district in order to bolster their electoral support there. Defining
subsidies as a form of particularistic benefit, I examine how electoral politics and institutions shape the
preferences of politicians for providing particularistic benefits such as subsidies.
Certain electoral institutions and party structures generate incentives for politicians to pursue a “personal
vote” (Cain, Ferejohn, and Fiorina 1987). Under such institutions, politicians try to create a personal
reputation and distinguish themselves from other candidates of their own party as well as candidates from
rival parties. In order to create a personal support base, politicians deliver constituency service, pork barrel
projects and various distributive policies to their districts. I argue that subsidies to business are distributive
tools that politicians can use to create a personal support base. Thus, electoral and party politics in a country
will influence the level and types of subsidies. In particular, district magnitude, party unity and the

9
ideological distance between the major parties in the region will influence the incentives of politicians to
distribute subsidies, and will affect their choice of levels and types of subsidies they offer.
District magnitude refers to the number of legislators that acquire a seat in a typical voting district
(Persson and Tabellini 2001). The argument here is that as district magnitude increases, politicians’
incentives for providing targeted benefits decreases. There are two reasons for this. Persson and Tabellini
(2001, 2003) argue that larger voting districts diffuse electoral competition and induce governments to seek
support from broad coalitions in the population, the extreme case being one in which the whole country is
one electoral district, while smaller districts channel electoral competition towards narrower, geographical
constituencies. “With small electoral districts, typically a party is a sure winner in some districts and a sure
loser in others. Electoral competition is thus concentrated only in some pivotal districts, and both parties
have strong incentives to target redistribution towards such districts” (Persson and Tabellini 2001, 4-5).
Targeted programs are more effective in seeking such narrow support compared to broad programs. Thus,
when districts are small, we would expect politicians to have more incentives to provide narrow, targeted
benefits like subsidies. Conversely, “elections involving larger districts should thus be biased toward broad,
nontargeted programs, such as general public goods or broad transfer programs” (Persson and Tabellini
2003, 17).
The second reason why smaller districts are associated with narrow programs is offered by Lancaster
(1986) and Lancaster and Patterson (1990) in their research on pork barrel politics. Lancaster argues that the
closer an incumbent’s identity is tied to a territorial base, the greater the incentive to support territorially
based distributive policies (Lancaster 1986, 70). In single-member districts, the accountability linkage
between the incumbent and his constituency is the strongest. Political credit for project allocation is more
difficult when more than one individual represents a district. “Multi-member districts create a disincentive
for such territorially directed public policies because the electoral accountability link becomes confused”
(Lancaster 1986, 70). Lancaster and Patterson’s (1990) empirical research on perceptions of pork barrel in
the German Bundestag supports this argument. Similarly, Cain et al. (1986) argue that incentives to create a
personal vote are highest in single member districts, and tend to decline with an increase in district
magnitude. In single member districts the electoral connection between the representative and her constituent
are more direct and clear. As district magnitude increases, representatives tend to free ride on the efforts of
fellow party members in cultivating a reputation. This argument suggests that the smaller the district
magnitude, the greater will be the incentives for providing targeted benefits such as subsidies. Moreover, the
smaller the district magnitude in a country, the lower should be the level of broad subsidies.
H3: The smaller the average district magnitude in a country, the higher is the level of subsidies in that region.
10
H4: The smaller the average district magnitude in a country, the lower is the level of broad subsidies in that
region.
The second argument about electoral politics concerns party unity. Party unity refers to the cohesion of
political parties in two contexts, in elections and legislatures (Bowler, Farrell and Katz 1999, 5). Party unity
in the context of elections, which is of interest here, refers to whether candidates seek votes based on their
personal reputations or on party labels. In other words, it refers to the extent to which the electoral fates of
the candidates of the same party are tied together (Bawn, Cox, and Rosenbluth 1999). Scholars identify
various factors that encourage personal vote-seeking as opposed to relying on party labels, such as electoral
systems, in particular, the ballot structure (Carey and Shugart 1995, Mainwaring 1991), presidentialism, and
federalism (Boueck 2002). Party unity will be high, for instance, if the party leadership has control over
which candidate gets to be on the party list and their rank on the list. This increases the loyalty of the
candidates to the party line (Bowler, Farrel and Katz 1999, 8). If, on the other hand, voters can express their
choice over individual candidates, as in an open list system, then party unity tends to be low. This creates
intra-party competition and decreases the influence of party leaders on the individual candidates.
Seeking votes based on a personal reputation, in turn, influences how politicians will attempt to appeal to
voters. Franzese and Nooruddin argue that where individual politicians are relatively independent of the
party and party labels have less meaning, “individual MPs’ electoral districts become more relevant to them
and constituency service (including distributive projects) becomes more important to them and their
supporters” (2003, 11). Where party unity is low, individual politicians have incentives to cultivate a
personal reputation in the electoral district to differentiate themselves from other candidates, by offering
locally targeted programs. In contrast, high party unity decreases politicians’ incentives for distributive
politics. The more an individual politician’s behavior is given by her party label and voters choose party
labels than individual members of parliament, the fewer incentives politicians have to make localistic appeal
in their electoral districts. Therefore, the lower the party unity, the higher is the spending on subsidies and the
lower is the level of broad subsidies in the country.
H5: The lower the unity of parties in a country, the higher is the level of subsidies.
H6: The lower the unity of parties in a country, the lower is the level of broad subsidies.
Finally, I argue that ideological polarization—the distance between the major parties on a left-right
scale—influences politicians’ incentives for providing subsidies. Larger ideological distance between parties
decreases incentives for distributive politics, because under such conditions, electoral competition will based
more on ideology than particularistic benefits (Franzese and Nooruddin 2003, 12-13). Political parties will
differentiate themselves on the basis of ideology rather than their offers for particularistic benefits. In a
11
political system with more distinct party ideologies, parties are expected to appeal less to pork-barrel,
according to Franzese and Nouriddin, precisely because electoral competition in that system is more
ideological. Lacking a “broader team on which to base competition, distributive politics come forward” in a
system with less partisan polarization (Franzese and Nooruddin 2003, 13). Paddock (1998) similarly
proposes that there are differences between party systems with ideological parties and hierarchically
structured local parties. The latter system tends to be based on an incentive system of material, rather than
purposive benefits (Paddock 1998, 765-6). According to Lunch, parties organized around ideological goals
are more likely to pursue “ideas, causes and the moralization of public policy” than “jobs, contracts, and
advantages for supporters” (qtd. in Paddock 1998, 766). Applying this argument to subsidies as a form of
distributive politics, we expect to see that the smaller the ideological distance between the major parties, the
higher is the level of subsidies, and the more targeted are the subsidy programs.
H7: The smaller the ideological distance between the major parties in a country, the higher is the level of
subsidies.
H8: The smaller the ideological distance between the major parties, the lower is the level of broadsubsidies.
The argument, in brief, is that the extent of capital mobility in a country’s economy and the regional
electoral institutions and party politics influence the level and type of subsidies offered. The more the
country’s economy is dominated by mobile factors, the higher will be the level of subsidies, and the higher
the share of subsidies directed to mobile factors. The smaller the district size, the lower the party unity and
the smaller the ideological distance between the major parties in a country, the higher will be the level of
subsidies, and the more targeted the subsidy programs will be. In the rest of this paper, I explore these
arguments empirically with data on subsidies in the European Union member states for the period 1992-
2005.
In order to isolate the effects of the variables of interest, the analysis controls for some factors that other
scholars found to be influential on the level of subsidies. In particular, I include control variables for
unemployment, trade openness and asset specificity in the EU member states for the given time period.
Zahariadis (1997, 342) argues that governments pay attention to unemployment levels in making their
subsidy policies because unemployment can hurt their chances for reelection. The empirical evidence for the
effects of unemployment on subsidy levels has been mixed. Blais et al. (1986) find that in the 1980s
subsidies increased along with unemployment rates in OECD countries, while Zahariadis (1997, 351) does
not find any systematic relationship between unemployment and subsidies across EU countries in the 1980s.
Aydin (2007) finds a positive relationship between unemployment subsidies for the EU countries for the
early 1990s.

12
There are two contrasting arguments in the literature on the impact of trade openness on subsidies. The
compensation argument (Cameron 1978, Rodrik 1998, Ruggie 1982) suggests that trade openness would
increase the demands for compensation by the losers of liberalization. A second line of argument suggests
that increased openness will force domestic companies to adjust to international competition, and thus reduce
their dependence on subsidies. Aydin (2007) finds that subsidy levels decrease with increases in the
country’s openness to trade.
Finally, both Zahariadis (2001) and Alt et al (1999) argue that the specificity of assets, which refers to
the ease by which companies can shift production from one sector to another, influence the levels of
subsidies. The argument is that firms with highly specific assets have higher costs of switching production in
the face of competition, and thus they are likely to lobby more intensely for subsidies. Zahariadis (2001)
finds support for this argument for the EU member states for the period 1990-3, and Alt et al. (1999) find
support in the case of Norway in the early 1990s. I include control variables for unemployment, trade
openness and asset specificity in the following analyses when such data are available.7
Methodology
The two dependent variables in this paper are the level and the breadth of subsidies offered by
governments in the EU member states. In the European Union, the European Commission is the body
responsible for collecting and publishing data on subsidies in the member states. The Commission collects
data on both the overall level of subsidies in each state, and the specific objectives for which member states
grant subsidies. These data allow me to empirically examine the arguments about the level and type of
subsidies in the EU member states. Continuous and reliable data on subsidies exist for all countries from
1992 to 2005. As an indicator of the level of subsidies, I calculate and code spending on subsidies as a
7 Another possible control variable is the ideological leaning of the party in government, which is frequently cited in the literature as a factor affecting subsidy levels. Theoretical claims and the empirical evidence from the EU countries and the US states on the impact of government ideology on subsidies have been mixed. Zahariadis (1997) argues that left governments are more likely to intervene in the economy, and finds that subsidy levels tend to be higher in EU member countries dominated by left governments in the period 1990-1993. Neven (1994), in contrast, argues that right governments tend to subsidize firms more, because subsidies primarily benefit businesses (rather than labor), which are among the constituency of the right parties. He finds support for this argument in his empirical study of EU members from 1981-1990. A recent paper with more up-to-date data suggests that the relationship between ideological leaning of the government and subsidies is more complicated (Cao, Prakash, and Ward 2007). Cao, Prakash and Ward (2007) explore the impact of government ideology and foreign competition on the governments’ choice between subsidies—referred to as corporate welfare in that paper—and social welfare policies. They find that left governments, when faced with foreign economic competition prefer social welfare policies to corporate welfare, while governments that are not dominated by left parties, when faced with foreign competition, prefer corporate welfare to social welfare. Given the complex relationship of party ideology and subsidies, I do not include government ideology as a control variable in the analysis.

13
percentage of government expenditure in each member state and year. 8 Data on subsidies is obtained from
the online State Aid Scoreboard (Commission, various years), and data on government expenditure is
obtained from the National Accounts dataset in Eurostat (Eurostat 2006)
The second dependent variable is the breadth of subsidies. I define two types of subsidies according to
their breadth, targeted and broad subsidies. Targeted subsidies are narrow in scope. They can be directed
towards particular sectors, regions and even to particular firms. Broad subsidies apply to a large number of
firms, thus they potentially benefit a large constituency. I employ data published by the European
Commission on the types of subsidy programs in the member states. The Commission distinguishes between
sectoral and horizontal subsidies, a distinction similar to the one I draw between targeted and broad
subsidies. Horizontal subsidies are those that are granted to “Research and development, safeguarding the
environment, energy saving, support to small and medium-sized enterprises, employment creation, the
promotion of training and aid for regional development” (Commission 2006). Sectoral subsidies include
“state aid granted to specific sectors (agriculture, fisheries, manufacturing, coal, transport except railways
and other services) and state aid given on an ad-hoc basis to individual companies e.g., for rescue and
restructuring” (Commission 2006).
In order to measure targeted and broad subsidies, I use these categories sectoral and horizontal
subsidies defined by the European Commission. The only difference between the categories of targeted and
broad subsidies and the Commission’s categories of sectoral and horizontal aid concerns regional aid. I do
not include regional aid in the broad subsidy category, since regional aid is more suited to targeting particular
areas of a country.9 The category of targeted subsidies includes subsidies directed to specific sectors and
regional subsidies. The category of broad subsidies includes R&D, environmental, SME, employment and
training subsidies. I also separately analyze regional subsidies as a type of subsidy used to attract mobile
capital.
In order to explore the impact of mobility of capital on subsidies, I create a measure that captures the
dominance in a region’s economy of relatively mobile and immobile factors of production. Immobile factors
8 This measurement of subsidies diverges from the general practice in the literature on EU state aid (Neven 1994, Thomas 2000, Commission , various years). In this literature, the level of subsidies in a country is measured as a percentage of GDP. I choose to measure subsidies as a percentage of government expenditure for two reasons. First, theoretically, this dependent variable better reflects the fact that governments make a trade-off between subsidies and various other expenditures. Second, practically, measuring subsidies as a percentage of government expenditure allows for a more meaningful distribution of the dependent variable. When measured as a percentage of GDP, all values of the dependent variable in the dataset tend to cluster close to zero, which complicates the regression model. 9 The EU rules seek to limit the use of regional subsidies to economically distressed regions of the member states. However, the limits on how much regional aid can be disbursed in which areas of a country are decided by a negotiation between the individual member state and the EU Commission, and until recently, this has meant that member states have been able to use regional aid in a relatively unconstrained manner.

14
are those that are tied to a specific location due to the nature of their production, such as capital in the
agriculture, mining, and certain service industries such as hotels, restaurants, real estate, and government
services. Mobile factors are those that can potentially move to another location, such as those in the
manufacturing industries and some services such as financial services (Bronfenbrenner 2000; Neumark,
Zhang, and Kolko 2006, 7). I measure the dominance of immobile factors in country’s economy by taking
the ratio of the country’s GDP accounted for by immobile factors to that of mobile factors. I include
manufacturing and financial sectors as mobile sectors, and agriculture, fishing, mining, utilities, construction,
transport, wholesale and retail trade, hotels and restaurants, real estate, government sector, healthcare and
education as immobile sectors. I collect data on the share of GDP by mobile and immobile sectors in each
EU member state from Eurostat National Accounts (Eurostat 2006) and take the ratio of production by
immobile factors to mobile factors in that economy to calculate a score of immobility for each state and year.
Data on electoral politics in the European Union member states are compiled from various sources. For
measuring district magnitude, which refers to the number of legislators elected from a typical electoral
district in the region, I use average district magnitudes in the lower legislative chambers of the EU member
states from the Database of Political Institutions (Beck et al. 2001).
Party unity refers to the extent to which the electoral faith of the candidates is tied to the party or to
their individual reputations. I adopt the ranking developed by Shugart (2001), which measures the extent to
which an electoral system is candidate centered. Shugart (2001) builds on the seminal article in this field by
Carey and Shugart (1995) and emphasizes the components of an electoral formula that push the electoral
system in a candidate or party centered direction, namely Ballot, Vote and District. Ballot refers to how
candidates gain access to the ballot and what the structure of the ballot is (Shugart 2001, 182). For example,
if the party leadership has firm controls over the nominations of the candidates for the ballot lists and voters
have no opportunity to disturb the rank order of candidates, then the candidates’ electoral faith is closely tied
to that of the party’s. The candidates are likely to show more loyalty to the party leadership and the party
line, and they have few incentives to create a personal reputation among the electorate. If, on the other hand,
access to the ballot may be gained through winning a primary election, or collecting some signatures, then
party unity is low (Shugart 2001, 182). In Finland, for instance, each prospective candidate must collect
signatures from voters, and their nominating papers identify other candidates with whom the candidate would
like to form an alliance. So multiple lists can appear within the same party, and the party leadership does not
have influence over which candidates are on the ballot list or their ranking on the list (Carey and Shugart
1995, 428). The candidates’ electoral faith is determined more strongly by their direct appeal to the voters
than their loyalty to the party.
15
The second component, Vote, captures the degree to which voters are casting list versus nominal votes.
“At one extreme voters cast only a list vote. At the other extreme voters cast a nominal vote that assists in the
election only of that candidate for whom it was cast” (Shugart 2001, 183). A closed list system such as in
Spain or Portugal would be an example of the former, and a single non-transferable vote system, such as the
pre-reform Japanese system would be an example of the latter. The former system would encourage party
unity, while the latter encourages politicians to build a personal reputation. The third component of party
versus personal centeredness is District, which captures “the differential effects of larger district magnitude
in systems that are basically party-centered or basically candidate-centered” (Shugart 2001, 183). Shugart
argues that the effect of District is to accentuate the impact of other two components, Ballot and Vote. This
component essentially takes account of the dichotomy between single seat districts and multi-seat districts.10
Shugart (2001) assigns scores from -2 to +2 to these three components of electoral formulas from the most
personalistic to the least personalistic (or most party centered). Each electoral formula then has three scores
assigned, one each for Ballot, Vote and District, ranging from -2 to 2. He then ranks all possible electoral
formulas based on these three scores, and creates an index from this ranking. The resulting index of
candidate versus party centeredness ranges between -1.00 to 1.00.11 I adopt the index scores that Shugart
calculates for most of the EU member states, and use the same criteria for calculating scores for those
countries that were not included in his paper.
In order to measure the ideological distance between major parties, I use the left-right index of the
Comparative Manifestos Project (Budge et al. 2001). Left-right index is a summary measure of the position
of a party on a left-right scale, calculated by combining the values parties receive on different dimensions
identified by the project (such as planned versus market economy) for each party in the Comparative
Manifestos Project (Budge et al. 2001; Laver and Budge 1992). The party left-right scores vary between -
100, the left-most position to 100, the right-most position. Using this index, I calculate the distance between
the positions of the two major parties on the left-right scale. I define the two major parties as the two parties
that got the highest share of the vote in the previous elections, and I take the distance between the ideological
values of these two parties to create an ideological distance score for each country and year.
The analysis includes three control variables discussed in the previous section, unemployment rate,
trade openness and asset specificity. Unemployment rate is measured as a percentage of the civilian labor
10 The inclusion of district magnitude as a component in Shugart’s index and as one of the independent variables in my model could potentially create a problem of multicollinearity. However, the correlation between Shugart’s index of party centeredness and the independent variable district magnitude is fairly low (0.23), therefore it would not bias the coefficients of the model. 11 The resulting index values represent the seven intervals between -1.00 and 0 and the five intervals between 0 and 1.00.

16
force, and obtained from the Eurostat database. Trade openness is measured as imports and exports as a
percentage of GDP and obtained from the Penn World tables (Heston et al. 2006). Finally, asset specificity is
measured by Research and Development (R&D) spending as a percentage of GDP—also termed as R&D
intensity—following Zahariadis (2001, 609-10) and Alt et al (1999), and data are obtained from the OECD
National Accounts.
Data on the level and type of subsidies are available for the period 1992 to 2005.12 Table 1A in the
Appendix presents a summary of the descriptive statistics for the independent and dependent variables
included in the study. Figures 1A, B and 2A and B visually summarize the trends in overall subsidy levels
and the share of broad subsidies in the EU member states. The average level of subsidies for the period in the
EU member countries was 1.1 percent of government expenditure. Figure 1A shows the trend in subsidies in
the EU member states from 1992 to 2005. There is an overall downward trend in subsidies during this period
in the European Union member states, with a slight increase from 1995 to 1997. Figure 1B shows the trend
of subsidies in each member state over this period. Some member states, such as Austria, the Netherlands
and the UK consistently have low levels of subsidies during this period. Others such as Greece, Germany and
Italy start off with a high level of subsidies and decrease their subsidy levels in time. In terms of the breadth
of subsidies, the level of broad subsidies as a share of total subsidies has been increasing in the European
Union countries. Figure 2A shows the trend in the average level of broad subsidies as a percentage of total
subsidies in the EU member states from 1992 to 2005. The share of broad subsidies, such as subsidies for
R&D, the environment and worker retraining have increased in the EU from around 40 percent to over 70
percent of total subsidies, due at least partly to the pressures from the European Commission on the member
states to shift subsidy programs from sector specific programs to broad measures. This representation of
average level of broad subsidies overlooks the significant variance among the EU countries, however. Figure
2B shows the level of broad subsidies in each of the EU countries, averaged for the period from 1992-2004.
Some member states, such as Denmark, Finland and Austria have high levels of subsidies with broad
coverage during this period. Other members, such as Greece, Portugal and Ireland devote a small share of
their subsidies to broad measures, and prefer subsidies with a narrow focus such as regional and sector-
specific subsidies.
-------------------- FIGURES 1A, B AND 2A, B ABOUT HERE-----------------
12 Data is available for Portugal and Spain from 1992 to 2004; for Austria from 1995-2004, for Finland from 1995-2005, for Denmark, Greece and Luxembourg from 1992-2003, and for Belgium, France, Germany, the Netherlands, Sweden and the UK until 2005.

17
Analysis
Table 1 presents the results of the regression analysis of the level of subsidies in the EU member states.
The level of subsidies is measured as a percentage of government spending. The OLS estimation is not
appropriate with data such as percentages, because the range of the data is bounded (0, 100) and the variance
across expected values is not constant. Therefore, the percentages were transformed using the logistic
transformation to provide an unbounded scale on the dependent variable. The model is estimated using a
normal linear model, estimating both the effects of the independent variables capital mobility, district
magnitude, party unity, and ideological distance, the control variables unemployment, trade openness and
asset specificity on the dependent variable. The model also includes fixed effects for countries, which are not
included in this table.13
------------------TABLE 1 ABOUT HERE ----------------------
The results mostly support the theoretical expectations laid out above. The coefficients for the
independent variables immobility, party unity and district magnitude have the expected sign, and the
coefficients for immobility and party unity are statistically significant at high confidence levels.14 The
coefficient for district magnitude has the expected sign; however, it is not statistically significant. The
coefficient for ideological distance has a positive sign, contrary to my theoretical expectation and is
statistically significant. The coefficients for the three control variables unemployment, trade openness and
asset specificity have negative signs and are all statistically significant at the 0.05 level. Since the dependent
variable was log transformed, the magnitude of the effects of these variables cannot be interpreted directly
from the coefficients. Instead, I illustrate the impact of the independent variables with plausible scenarios by
holding all the other variables at their mean or median values and changing the value of the variable of
interest.
13 Mixed effects models are considered to be more appropriate for describing relationships between a dependent
variable and some covariates in data that are grouped according to one or more classification factors, such as pooled time series analysis as the current one (Pinheiro and Bates 2000, 3). Mixed effects models associate common random effects to observations sharing the same level of a classification factor, such as countries in this data, and thus flexibly represent the covariance structure induced by the grouping of the data (Pinheiro and Bates 2000, 3). I estimate the current model with fixed effects for countries for ease of interpretation. However, I also estimate a random effects model, which gives essentially similar results. The signs of the coefficients are the same for the fixed and random effects models, as is their significance. There are very slight differences in the magnitude of the coefficients between these two models.
14 An alternative way to think about the relationship between electoral politics and subsidies would be to consider the interactions between these electoral variables. I run the basic model with different interaction variables, and none of the interaction variables have a statistically significant impact on subsidy levels.

18
The dominance of immobile assets in a country’s economy has a negative impact on the level of
subsidies. Figure 3 demonstrates the impact of asset mobility on the level of subsidies as a percentage of
government spending. For this simulation, I hold all variables expect for immobility at their mean or median
values (district magnitude= 10, party unity= 0.2, unemployment= 7.9, trade openness= 70, asset specificity=
1.8). Under these conditions, a country dominated by immobile assets such as Greece (immobility= 4.5)
allocates almost one percent of government spending to subsidies, while a country dominated by mobile
assets, such as Ireland (immobility= 2.0), spends three times as much, or approximately three percent on
subsidies. In countries such as Ireland, mobile asset holders are able to extract higher levels of subsidies due
to their negotiating power. When immobile assets dominate the economy, however, governments have a
large constituency that are opposed to subsidies to mobile capital, thus subsidy levels tend to be lower.
The cohesiveness of political parties in a country has a substantial negative impact on the levels of
subsidies in a country. Figure 4 illustrates the impact of party unity on the level of subsidies by holding
constant all other variables at their mean or median values. Under these conditions, a country with highly
unified parties, such as the Netherlands (unity=0.4), will spend about 1.2 percent of government expenditures
on subsidies, while a country with less cohesive parties, such as Finland (unity= -0.43), will spend more than
three times as much, or almost 4 percent of its total government spending on subsidies.
The variable ideological polarization has a positive impact on the level of subsidies. This finding is
contrary to my theoretical expectation that with larger ideological distance, we would expect to see more
emphasis on ideological issues and less emphasis on distributive policies such as subsidies. The model
predicts that in a country in which there is a large ideological distance between the major parties we are
likely to see higher levels of subsidies. The magnitude of the coefficient is fairly small, however. Holding all
other variables constant at their mean or median values, a country with a small ideological distance
(ideology=5) spends about 0.5 percent less of its government expenditure on subsidies compared to a country
with a relatively high level of ideological distance (ideology= 35).
The coefficients of three control variables, unemployment, trade openness and asset specificity all have
negative signs. The model predicts that a country with a five percent unemployment rate allocates
approximately 0.05 percent less of its government spending to subsidies than a country with twelve percent
unemployment rate. It is possible that governments, when faced with higher unemployment rates, shift their
spending from subsidy programs to other types of policies, such as active labor policies or social welfare
policies. Trade openness also has a slight negative impact on subsidy levels. An EU member country that has
relatively low levels of trade relative to its GDP (openness= 50), holding other factors constant, would spend
approximately 0.4 percent more on subsidies than a country that has relatively high levels of trade

19
(openness= 100). Finally, the variable asset specificity—measured as R&D intensity—has a negative and
relatively strong impact on subsidy levels. A country with a low asset specificity (r&d intensity=1) would
spend two percent of its total government expenditures on subsidies, while a country with high asset
specificity (r&d intensity= 3) spends less than one percent on subsidies. This goes against the argument and
findings of Zahariadis (2001) and Alt et al. (1999) that high asset specificity is associated with a high level of
subsidies.
I expect electoral and party politics to influence the types of subsidies that governments offer, in addition
to their financial commitment to subsidies. In hypotheses 4, 6 and 8 above, I argue that the level of broad
subsidies is influenced by the district magnitude, party unity and ideological distance in the region. I expect
high district magnitude, high party unity and a large ideological distance between the major parties to be
associated with a higher level of broad subsidies, because these factors create incentives for politicians to
appeal to a broad constituency with broad measures. The dependent variables broad and narrow subsidies are
expressed as percentages of the total subsidies. These data are proportions; however, since the values of the
dependent variables are not clustered at the boundaries (0,1), it is possible and advisable to use an OLS
regression without transforming the values of the dependent variables (Paolino 2001). I also include country
fixed effects in this estimation.15
Table 2 presents the results of the OLS regression analysis exploring the effect of the independent
variables district magnitude, party unity and ideological distance on the level of broad subsidies. The results
of the regression analysis mostly support the theoretical expectations laid out above. The coefficients of all
the variables are in the expected direction and the coefficients of district magnitude and party unity are
statistically significant. This suggests that the larger the average district magnitude in a country, the higher is
the share of broad subsidies in total subsidies. The model estimates that a country with single member
districts such as the UK will spend approximately 27 percent of its total subsidies on broad subsidy
measures, while a country with a district magnitude of ten, such as Denmark or Portugal will spend about
seven percent more, or 33 percent of all subsidies on broad measures, holding all other variables constant at
their mean or median values. The variable party unity also has a substantial positive impact on broad subsidy
levels. A country with highly cohesive parties such as the Netherlands (unity=0.4) allocates about 38 percent
of its total subsidies with broad subsidy programs, while a country with incohesive parties such as Finland
(unity= -0.43) will grant about 13 percent of is total subsidies as broad subsidies. These findings confirm the
15 An alternative way to think about the relationship between electoral politics and subsidies would be to consider the
interactions between these electoral variables. I run the basic model with different interaction variables, and none of the interaction variables have a statistically significant impact on broad subsidy levels.
20
expectation that in countries where electoral institutions encourage politicians to seek votes from a broad
constituency, politicians tend to choose subsidy programs that apply to many firms.
------------------TABLE 2 ABOUT HERE---------------------
Finally, in order to test the argument about the effect of capital mobility on the type of subsidies, I
analyze data from the EU countries on regional subsidies. Hypothesis 2 suggests that higher levels of mobile
capital in a region’s economy are associated with higher levels of subsidies directed towards mobile factors.
Regional subsidies are granted by member states in regions with levels of economic development below the
EU averages. The European Commission, in cooperation with the member states, designates the areas that
qualify as underdeveloped in the territory of member states. In these regions, member states are allowed to
grant subsidies in excess of what is allowed in other regions. Most observers within and outside the European
Commission suggest that regional aid is typically granted to attract mobile capital, and especially large
manufacturing firms (Cavallo and Junginger-Dittel 2004; Commission 2000; Groeteke and Heine 2004;
Yuill, Bachtler, and Wishlade 1999, 137). My expectation is that the higher the mobility of capital, the higher
will be the level of regional subsidies, as governments scramble to attract and maintain mobile capital in their
jurisdictions. I test for this argument using the data on regional subsidies as a percentage of total subsidies in
the EU countries. I also include the variables on electoral institutions, district magnitude, party unity and
ideological distance. I expect these variables to have a negative impact on the level of regional subsidies,
since as argued above, regional subsidies are narrow subsidy measures. I also include unemployment rate in
order to control for the impact of EU rules which allow for higher levels of regional aid in economically
distressed areas. I expect unemployment levels to have a positive impact on regional subsidy levels due to
these EU rules governing such subsidies.
Table 3 presents the results of the regression estimating the effects of the dominance of immobile capital
in an economy, district magnitude, party unity, ideological distance and unemployment rate on the level of
regional subsidies, expressed as a percentage of total subsidies in the EU member states. The model also
includes fixed effects for countries, which is not included in the table. All the coefficients are in the expected
direction, and the coefficients for immobility, party unity and unemployment variables are statistically
significant. The findings confirm that the more mobile the assets in a country’s economy, the higher is the
level of regional subsidies—a type of subsidy frequently directed towards mobile assets. Even though EU
rules mostly limit member states’ discretion on granting regional aid, the impact of asset mobility on regional
subsidies is still quite substantial. The model predicts that holding all other variables at their mean or median
values, a country with an economy dominated by highly mobile assets such as Ireland (immobility=2) spends
approximately 26 percent of its subsidies on regional subsidies, while a country dominated by immobile

21
assets such as Greece (immobility=4) spends half that much, or approximately 13 percent of its subsidies as
regional aid. Party unity has a statistically significant and negative impact on regional subsidies. In countries
where parties are highly cohesive, governments tend to distribute a smaller share of their subsidies on
targeted measures such as regional subsidies. The model predicts that a country with incohesive parties
allocates 32 percent of its total subsidies to regional purposes, while a country with highly cohesive parties
allocates 15 percent of its subsidies for regional purposes. Finally, the coefficient for the variable
unemployment has the expected positive sign and is statistically significant at a high level of confidence.
This is in line with the expectation that due to the EU rules governing regional aid—higher levels of regional
aid are allowed in economically distressed areas of the EU—regional subsidies are likely to be higher in
countries with higher unemployment levels. The impact of unemployment is not as strong as the impact of
asset mobility or party unity, however. The model predicts that a country with an unemployment rate of
fifteen percent spends approximately one percent more on regional subsidies than a country with a five
percent unemployment rate. The marginal impact of the variable unemployment on regional subsidy shares
compared to the effect of asset mobility suggests that within the boundaries of the EU rules governing how
regional aid should be spent, member states still continue to offer subsidies to highly mobile asset holders to
some extent.
--------------------- TABLE 3 ABOUT HERE---------------------------------
Conclusion
What do the results of the analyses in this paper tell us about the subsidy choices of governments? The
results of the empirical analyses mostly support the arguments developed in this paper. Capital mobility
influences the level and type of subsidies that EU member state governments offer. This supports the broader
argument that mobility bolsters the negotiating power of asset owners. The dominance of mobile capital
owners in a jurisdiction is associated with higher levels of subsidies, and especially subsidies that benefit
mobile capital. The evidence supports the arguments linking electoral and party politics to politicians’
incentives to grant subsidies, except for the proposed effect of ideological distance on subsidies. District
magnitude does not have a statistically significant impact on the total levels of subsidies; however, it
influences the types of subsidies. Countries that have a higher average district magnitude allocate more of
their subsidies towards broad subsidies that benefit a greater range of firms. This supports my expectation
that the larger the district magnitude in a country, the higher the incentives of politicians to target subsidies
towards larger constituencies. Moreover, the finding that district magnitude does not affect the overall
subsidy levels may be partly explained by the impact of the EU state aid policy. The EU Commission has
been pushing the member states to lower their subsidy levels, and most observers agree that it has been
22
successful in its efforts. It is possible that the impact of EU efforts is overshadowing the impact of domestic
factors such as district magnitudes on overall subsidy levels.
Party unity has the expected negative effect on subsidy levels and types, and the effect of this variable in
all regressions is fairly substantial. A country with a highly cohesive party system has lower overall levels of
subsidies, and higher level of subsidies with a broad scope compared to a country with incohesive parties.
This gives support to the underlying argument that when politicians’ incentives are tied to that of the party’s-
when party unity is high—politicians are less likely to offer targeted benefits such as subsidies. And when
they offer subsidies, these subsidies tend to be of a broad scope, thus benefiting a large constituency.
The proposed relationship between ideological distance and subsidies is not supported by the empirical
analysis. A large ideological distance between the major parties is associated with higher overall subsidy
levels, which goes against my argument that a large ideological distance between the major parties steers the
focus of parties away from targeted benefits such as subsidies and towards ideological issues. Neither does
ideological distance influence the types of subsidy programs that governments offer. A more detailed
analysis of the impact of electoral institutions on subsidies could explore alternative causal mechanisms that
can explain the positive relationship between ideological distance and subsidies.
What do the findings of this study imply for research on industrial policy and subsidies? Research on
subsidies has considered the role of domestic political institutions in shaping governments’ strategies of
supporting industries only to a limited extent so far. Verdier (1995) initially linked subsidies to electoral
politics, and recent research has put his theoretical insights to systematic empirical test (Zahariadis 2005).16
The scope of political institutions considered is narrow, however, and the empirical research is still limited.
This paper takes a broader range of electoral institutions into consideration, and extends the empirical scope
of this research to all European Union countries throughout the 1990s until 2005. My claim is not that
political institutions explain all or even most of the variation in governments’ subsidy policies. However, I
demonstrate in this paper that domestic institutions influence the level and type of subsidies, even when
controlling for factors such as capital mobility, unemployment rates, trade openness, and asset specificity.
Future research needs to take the impact of institutions into account in addition to these other international
and domestic economic factors.
Finally, what do the findings of this paper suggest about globalization, regionalization and domestic
policies in the member states of regional organizations such as the EU? The findings lend support to the
argument that asset mobility is altering the dynamics between governments and mobile assets. The owners of
mobile assets bargain with governments successfully to receive subsidies. This phenomenon is not limited to
16 See also Neven (1994).

23
the European Union member states, moreover. There is ample evidence that subsidies to mobile asset holders
are increasing in many different contexts globally, regionally and even domestically in federal systems
(Oman 2000, Chi and Hofman 2000). The empirical analysis in this paper demonstrates that within the EU,
economies dominated by highly mobile capital tend to have a higher level of subsidies than those dominated
by immobile assets. However, the findings of this paper suggest that domestic politics are not sidelined by
the increasing mobility of capital in the global economy. The characteristics of electoral systems and party
politics in a country significantly influence the level and types of subsidies EU governments offer. Moreover,
the backdrop to this analysis of subsidy policies in the EU member states is the declining levels of subsidies
in these countries since the early 1990s. This is at least partly a consequence of the pressures coming from
the European Commission and the European Court of Justice, which, in an effort to create a level playing
field in the single market, have constrained the autonomy of the member states to craft their industrial
support policies as they wish. This suggests that the impact of globalization in general, and capital mobility
in particular, is quite complex. While asset mobility creates strong pressures for governments to adopt
policies that favor mobile asset holders, pressures originating from domestic institutions and regional
supranational organizations can partly mute these effects.
24
References
Adserà, Alicia, and Carles Boix. 2002. Trade, Democracy, and the Size of the Public Sector: The Political Underpinnings of Openness. International Organization 56 (2):229-262.
Alt, James E., Fredrik Carlsen, Per Heum, and Kåre Johansen. 1999. Asset Specificity and the Political Behavior of Firms: Lobbying for Subsidies in Norway. International Organization 53 (1):99-116.
Aydin, Umut. 2007. Promoting Industries in the Global Economy: Subsidies in OECD Countries, 1989 to 1995. Journal of European Public Policy 14(1): 115-131.
Basinger, Scott J., and Mark Hallerberg. 2004. Remodeling the Competition for Capital: How Domestic Politics Erases the Race to the Bottom. American Political Science Review 98 (2):261-276.
Bawn, Kathleen, Gary W. Cox, and Frances Rosenbluth. 1999. Measuring the Ties that Bind: Electoral Cohesiveness in Four Democracies. In Elections in Japan, Korea, and Taiwan under the Single Non-Transferable Vote, edited by B. Grofman, S.-C. Lee, E. A. Winckler and B. Woodall. Ann Arbor: The University of Michigan Press.
Beck, Thorsten, George Clarke, Alberto Groff, Philip Keefer, and Patrick Walsh. 2001. New tools in comparative political economy: The Database of Political Institutions. World Bank Economic Review 15 (1):165-176.
Blais, André, Claude Desranleau, and Yves Vanier. 1986. A Political Sociology of Public Aid to Industry. Toronto: University of Toronto Press.
Budge, Ian, Hans-Dieter Klingemann, Andrea Volkens, Judith Bara, and Eric Tanenbaum. 2001. Mapping Policy Preferences: Estimates for Parties, Electors and Governments 1945-1998. Oxford and New York: Oxford University Press.
Cain, Bruce, John Ferejohn, and Morris Fiorina. 1987. The Personal Vote: Constituency Service and Electoral Independence. Cambridge, MA and London: Harvard University Press.
Cameron, David. 1978. The Expansion of the Public Economy: A Comparative Analysis. American Political Science Review 72 (4).
Carey, John M., and Matthew Soberg Shugart. 1995. Incentives to Cultivate a Personal Vote: A Rank Ordering of Electoral Formulas. Electoral Studies 14 (4):417-439.
Cavallo, Silvia , and Klaus-Otto Junginger-Dittel. 2004. The Multisectoral Framework 2002: new rules on regional aid to large investment projects. Competition Policy Newsletter (1):78-82.
Cerny, Philip G. 1995. Globalization and the Changing Logic of Collective Action. International Organization 49 (4):595-625.
Chi, Keon S. and Daniel J. Hofman. 2000. State Business Incentives: Trends and Options for the Future. Lexington, KY: The Council of State Governments.
Cini, Michelle, and Lee McGowan. 1998. Competition Policy in the European Union. New York: St Martin's.
Commission of the European Communities. 2000. XXXth Report on Competition Policy. Luxembourg: Office for Official Publications of the European Communities.
Commission of the European Communities. 2001. Ninth Survey of State Aid in the European Union. Available online: http://www.europa.eu.int/eur-lex/en/com/cnc/2001/com2001_0403en01.pdf.

25
Commission of the European Communities. 2006. State Aid Scoreboard [accessed February 13 2006]. Available from http://www.europa.eu.int/comm/competition/state_aid/scoreboard/.
Commission of the European Communities. various years. Survey on State Aids in the European Community [accessed December 15 2005]. Available from http://europa.eu.int/comm/competition/state_aid/scoreboard/.
Donahue, John D. 1997. Disunited States. New York: Basic Books.
Eurostat. 2006. National Accounts [accessed June 2006]. Available from http://epp.eurostat.ec.europa.eu/portal/page?_pageid=1996,45323734&_dad=portal&_schema=PORTAL&screen=welcomeref&open=/&product=Yearlies_new_economy&depth=2.
Franzese, Robert. 2002. Electoral and Partisan Cycles in Economic Policies and Outcomes. Annual Review of Political Science 5.
Franzese, Robert J., and Irfan Nooruddin. 2004. The Effective Constituency in (Re)Distributive Politics: Alternative Bases of Democratic Representation, Geographic versus Partisan Presented at Midwest Political Science Association, 15 April 2004, [accessed 01/13 2006]. Available from http://www-personal.umich.edu/~franzese/EffectiveConstituencies.BasesRepresentation.041404.pdf.
Frieden, Jeffry. 1991. Invested Interests: The Politics of National Economic Policies in a World of Global Finance. International Organization 45:425-51.
Frieden, Jeffry A., and Ronald Rogowski. 1996. The Impact of the International Economy on National Policies: An Analytical Overview. In Internationalization and Domestic Politics, edited by R. O. Keohane and H. V. Milner. New York: Cambridge University Press.
Garrett, Geoffrey. 1995. Capital Mobility, Trade and Domestic Politics of Economic Policy. International Organization 49 (4):657-687.
Garrett, Geoffrey. 1998. Partisan Politics in the Global Economy. Cambridge, UK and New York: Cambridge University Press.
Garrett, Geoffrey. 2001. Globalization and Government Spending around the World. Studies in Comparative International Development 35 (4):3-29.
Gourevitch, Peter A. 1978. The Second Image Reversed. International Organization 32 (4):881-912.
Groeteke, Friedrich, and Klaus Heine. 2004. "Institutional Rigidities" and European State Aid Control. European Competition Law Review (6):322-331.
Hallerberg, Mark , and Jurgen von Hagen. 1999. Electoral Institutions, Cabinet Negotiations and Budget Deficits in the European Union. In Fiscal Institutions and Fiscal Performance, edited by J. M. Poterba and J. von Hagen. Chicago and London: The University of Chicago Press.
Harrison, Kathryn. 2006. Provincial Interdependence: Concepts and Theories. In Racing to the Bottom? Provincial Interdependence in the Canadian Federation, edited by K. Harrison. Vancouver and Toronto: University of British Columbia Press
Hirschman, Albert O. 1970. Exit, Voice and Loyalty: Responses to Decline in Firms, Organizations and States. Cambridge, MA: Harvard University Press.
Hix, Simon. 2004. Electoral Institutions and Legislative Behavior: Explaining Voter Defection in the European Parliament. World Politics 56 (2):194-223.
Keohane, Robert O., and Helen V. Milner, eds. 1996. Internationalization and Domestic Politics. New York: Cambridge University Press.

26
Lancaster, Thomas D., and W. David Patterson. 1990. Comparative Pork Barrel Politics: Perceptions from the West German Bundestag. Comparative Political Studies 22 (4):458-477.
Laver, Michael, and Ian Budge, eds. 1992. Party Policy and Government Coalitions. London: Macmillan.
Lowi, Theodore L. 1964. American Business and Public Policy, Case Studies and Political Theory. World Politics 16 (4):677-715.
Milesi-Ferretti, Gian Maria , Roberto Perotti, and Massimo Rostagno. 2002. Electoral Systems and Public Spending. Quarterly Journal of Economics 117 (2):609-657.
Milner, Helen V., and Robert O. Keohane. 1996. Internationalization and Domestic Politics: An Introduction. In Internationalization and Domestic Politics, edited by R. O. Keohane and H. V. Milner. New York: Cambridge University Press.
Mosley, Layna. 2003. Global Capital and National Governments. Cambridge: Cambridge University Press.
Oates, Wallace E. 1972. Fiscal Federalism. New York: Harcourt Brace Jovanovich.
OECD, Organization for Economic Cooperation and Development. 1998. Spotlight on Public Support to Industry. Paris: OECD Publication Services.
Oman, Charles. 2000. Policy Competition for Foreign Direct Investment: A Study of Competition among Governments to Attract FDI. Paris: OECD Publications.
Paolino, Philip. 2001. Maximum Likelihood Estimation of Models with Beta-Distributed Dependent Variables. Political Analysis 9 (4):325-346.
Persson, Torsten , and Guido Tabellini. 2001. Political Institutions and Policy Outcomes: What are the Stylized Facts? [accessed September 2005. Available from ftp://ftp.igier.uni-bocconi.it/wp/2001/189.pdf.
Persson, Torsten , and Guido Tabellini. 2005. The Economic Effects of Constitutions. Cambridge, MA and London: MIT Press.
Persson, Torsten, Guido Tabellini, and Francisco Trebbi. 2003. Electoral Rules and Corruption. European Economic Review 1 (4):958-89.
Peterson, Paul E., and Mark C. Rom. 1990. Welfare Magnets: A New Case for a National Standard. Washington, D.C.: Brookings Institute.
Pinheiro, Jose C. , and Douglas M. Bates. 2000. Mixed-Effects Models in S and S-Plus. New York: Springer-Verlag.
Pontusson, Jonas. 1992. The Limits of Social Democracy: Investment Politics in Sweden. Ithaca and London: Cornell University Press.
Rodrik, Dani. 1998. Why do more open economies have bigger governments? Journal of Political Economy 106 (5):997-1031.
Rogowski, Ronald. 1989. Commerce and Coalitions: How Trade Affects Domestic Political Alignments. Princeton: Princeton University Press.
Shambaugh, George E. 2004. The Power of Money: Global Capital and Policy Choices in Developing Countries. American Journal of Political Science 48 (2):281-295.
Simmons, Beth A. 1994. Who Adjusts? Domestic Sources of Foreign Economic Policy During Interwar Years. Princeton: Princeton University Press.

27
Sinn, Stefan. 1992. The Taming of Leviathan: Competition among Governments. Constitutional Political Economy 3 (2):177-196.
Smith, Mitchell P. 1996. Integration in Small Steps: The European Commission and Member-State Aid to Industry. West European Politics 19 (3):563-582.
Smith, Mitchell P. (1998) '', 36:1, 55-78. 1998. Autonomy by the Rules: The European Commission and the Development of State Aid Policy. Journal of Common Market Studies 36 (1):55-78.
Strange, Susan. 1996. The Retreat of the state : the diffusion of power in the world economy. New York: Cambridge University Press.
Stratmann, Thomas, and Martin Baur. 2002. Plurality Rule, Proportional Representation, and the German Bundestag: How Incentives to Pork-Barrel Differ Across Electoral Systems. American Journal of Political Science 46 (3):506-14.
Thomas, Kenneth P. 2000. Competing for Capital: Europe and North America in a Global Era. Washington, D.C.: Georgetown University Press.
Tiebout, Charles M. 1956. A Pure Theory of Local Expenditures. Journal of Political Economy 64:416-424.
Trebilcock, M.J , M. Chandler, and R. Howse. 1990. Trade and Transitions: A Comparative Analysis of Adjustment Policies. London and New York: Routledge.
Verdier, Daniel. 1995. The Politics of Public Aid to Private Industry. Comparative Political Studies 28 (1):3-42.
Weingast, Barry R., Kenneth A. Shepsle, and Christopher Johnsen. 1981. The Political Economy of Benefits and Costs: A Neoclassical Approach to Distributive Politics. Journalof Political Economy 89 (4):642–664.
Wilson, John D. 1986. A Theory of Interregional Tax Competition. Journal of Urban Economics 19(3): 296-315.
Winters, Jeffrey A. 1996. Power in Motion: Capital Mobility and the Indonesian State. Ithaca and New York: Cornell University Press.
Yuill, Douglas, John Bachtler, and Fiona Wishlade. 1999. European Regional Incentives 1997-98. West Sussex: Bowler & Sons.
Zahariadis, Nicolaides. 1997. Why State Subsidies? Evidence from European Community Countries, 1981-1986. International Studies Quarterly 41 (2):341-354.
Zahariadis, Nicolaides. 2001. Asset specificity and state subsidies in industrialized countries. International Studies Quarterly 45 (4):603-616.
Zahariadis, Nicolaides. 2005. Policy Networks, Elections and State Subsidies. Review of Policy Research 22 (2):115-131.
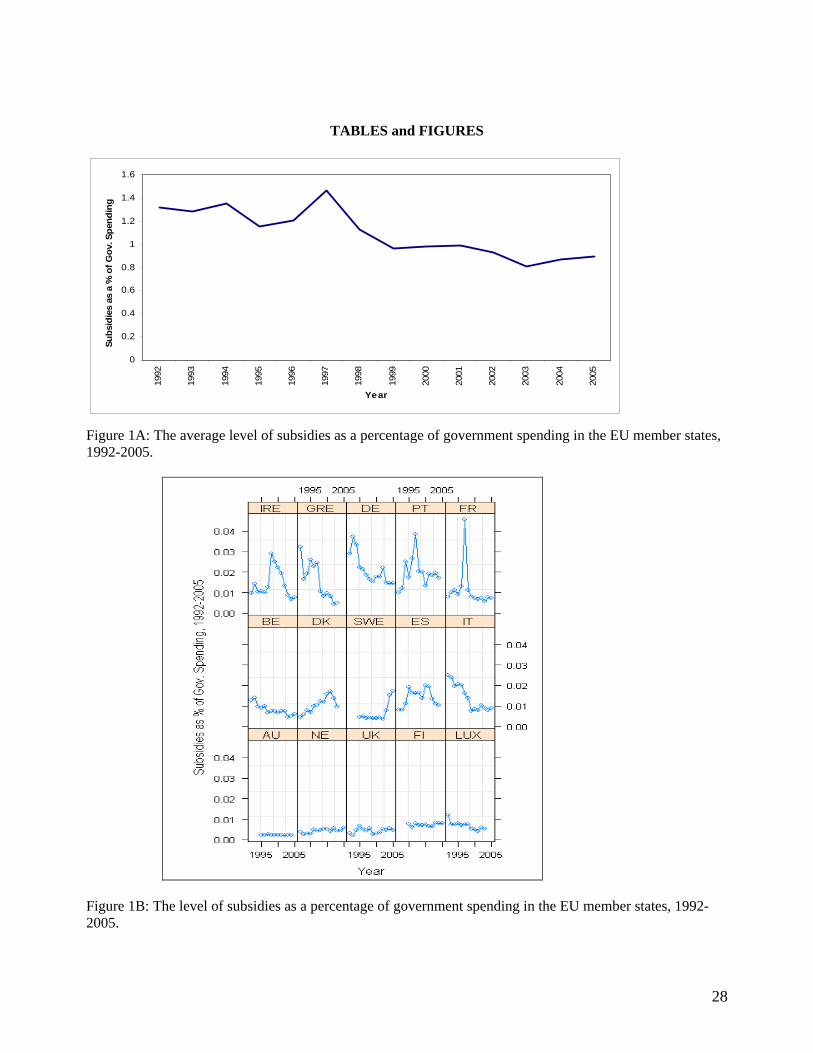
28
TABLES and FIGURES
0
0.2
0.4
0.6
0.8
1
1.2
1.4
1.6
1992
1993
1994
1995
1996
1997
1998
1999
2000
2001
2002
2003
2004
2005
Year
Subs
idie
s as
a %
of G
ov. S
pend
ing
Figure 1A: The average level of subsidies as a percentage of government spending in the EU member states, 1992-2005.
Figure 1B: The level of subsidies as a percentage of government spending in the EU member states, 1992-2005.

29
0
10
20
30
40
50
60
70
80
90
100
1992
1993
1994
1995
1996
1997
1998
1999
2000
2001
2002
2003
2004
2005
Hori
zont
al s
ubsi
dies
as
a %
of t
otal
sub
sidi
es,
EU a
vera
ges
Figure 2A: The average level of broad subsidies as a percentage of total subsidies in the EU member states, 1992-2005.
0
0.1
0.2
0.3
0.4
0.5
0.6
0.7
0.8
0.9
1
Gre
ece
Por
tuga
l
Irela
nd
Spa
in
Ger
man
y
Luxe
mbo
urg
Italy
Fran
ce UK
Bel
gium
Net
herla
nds
Aus
tria
Finl
and
Den
mar
k
Hor
izon
tal S
ubsi
dies
as
a %
of T
otal
Sub
sidi
es
Figure 2B: The level of broad subsidies as a percentage of total subsidies in the EU member states, averaged for the period 1992-2005.

30
Table 1: Factors that influence the level of subsidies offered by EU member states, 1992-2005
Variable Coefficient Standard Error Immobility -0.6 0.16 District Magnitude -0.009 0.01 Party unity -1.38 0.41 Ideological distance 0.1
0.003 Unemployment -0.04 0.02 Trade Openness -0.005 0.002 Asset specificity -0.38 0.17 N= 192

31
0 1 2 3 4 5
0.0
0.5
1.0
1.5
2.0
Projected Percentage Change in Subsidies
Low Mobility
High Mobility
Figure 3: Projected percentage change in subsidy levels with asset mobility. The graph shows that in a county dominated by mobile assets, we would expect subsidies to be 3% of government spending, holding all other variables constant. Under the same conditions, a country whose economy is dominated by immobile factors allocates approximately 1% of its government spending to subsidies.
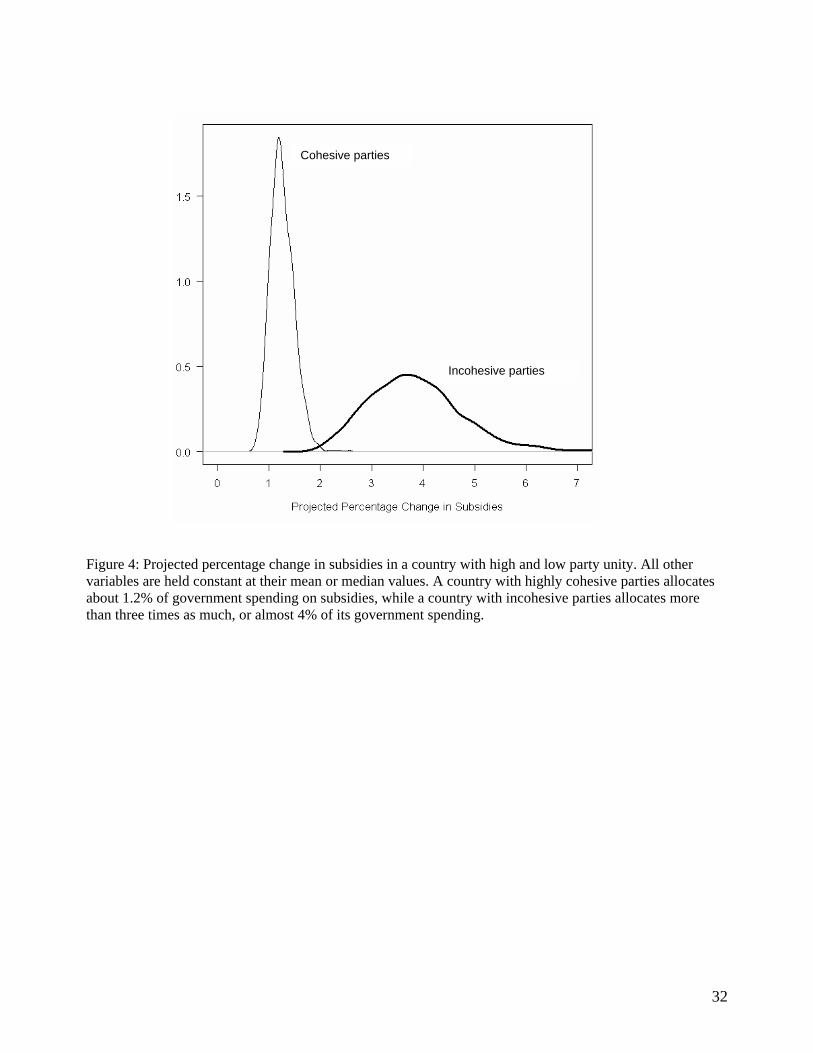
32
Cohesive parties
Incohesive parties
Figure 4: Projected percentage change in subsidies in a country with high and low party unity. All other variables are held constant at their mean or median values. A country with highly cohesive parties allocates about 1.2% of government spending on subsidies, while a country with incohesive parties allocates more than three times as much, or almost 4% of its government spending.

33
Table 2: Factors that influence the level of broad subsidies offered by EU member states, 1992-2005.
Variable Coefficient Standard Error District Magnitude 0.007 0.004 Party unity 0.31 0.15 Ideological distance 0.0002 0.001 N= 192
Table 3: Factors that influence the level of regional subsidies offered by EU member states, 1992-2005.
Variable Coefficient Standard Error Immobility -0.07 0.04 District Magnitude -0.0009 0.003 Party unity -0.23 0.11 Ideological distance -0.0005 0.0008 Unemployment 0.01 0.004 N= 192

34
Appendix:
Table 1A: Descriptive Statistics for Variables in the Model, EU Member States
Variable Unit Minimum Value
Maximum Value Mean Median
Capital (im)mobility Ratio 1.62 4.93 2.88 2.76
District Magnitude Count 1 150 19.97 10.5
Party Unity Index -0.71 0.8 0.08 0.2
Ideological Distance Index 0.32 56.38 18.06 13.81
Unemployment Percentage 2 19.50 7.89 8
Trade Openness Percentage 36 286 91.6 70.9
R&D Intensity (Asset specificity)
Percentage 0.47 4.25 1.77 1.79
Subsidy level Percentage 0.2 4.55 1.1 0.8
Subsidy type: Broad Percentage 0.2 99 46.3 44.7
Subsidy type: Regional Percentage 0.03 92.3 25.5 20.9
Top Related
Copyright © 2022 FDOKUMEN

