


Bahasa
Halaman
Hukum

arX
iv:a
stro
-ph/
0209
565v
2 2
7 M
ar 2
003
Supernova remnants and γ-ray sources∗
Diego F. Torres1†, Gustavo E. Romero2, Thomas M. Dame3, Jorge A. Combi4, and Yousaf M. Butt3
February 2, 2008
1Lawrence Livermore Laboratory, 7000 East Ave. L-413, Livermore, CA 94550, USA2Instituto Argentino de Radioastronomıa, C.C.5, 1894 Villa Elisa, Buenos Aires, Argentina
3 Harvard-Smithsonian Center for Astrophysics, 60 Garden Street, Cambridge, MA 02138, USA
Abstract
A review of the possible relationship between γ-ray sources and supernova remnants (SNRs) is pre-sented. Particular emphasis is given to the analysis of the observational status of the problem of cosmicray acceleration at SNR shock fronts. All positional coincidences between SNRs and unidentified γ-raysources listed in the Third EGRET Catalog at low Galactic latitudes are discussed on a case by casebasis. For several coincidences of particular interest, new CO(J=1-0) and radio continuum maps areshown, and the mass content of the SNR surroundings is determined. The contribution to the γ-ray fluxobserved that might come from cosmic ray particles (particularly nuclei) locally accelerated at the SNRshock fronts is evaluated. We discuss the prospects for future research in this field and remark on thepossibilities for observations with forthcoming γ-ray instruments.
Keywords: gamma-rays: observations, gamma-rays: theory, ISM: supernova remnants, ISM: clouds,cosmic rays.
∗Submitted to the Physics Reports, astro-ph/0209565†e-mail: [email protected]
1

Contents
1 Introduction 3
2 Phenomenological model for the hadronic γ-ray emission in SNRs and their environs 6
3 Relativistic Bremsstrahlung 10
4 Diffusion of CRs and γ-ray spectral evolution 11
5 Sample and correlation analysis 13
6 SNRs coincident with γ-ray sources 16
7 Pulsars within the EGRET error boxes 18
8 Variability 19
9 Observations and data analysis 229.1 CO data . . . . . . . . . . . . . . . . . . . . . . . . . . . . . . . . . . . . . . . . . . . . . . . . . . . . . 229.2 Radio continuum data and diffuse background filtering . . . . . . . . . . . . . . . . . . . . . . . . . . 22
10 Case by case analysis 2310.1 γ-ray source 3EG J0542+2610 – SNR G180.0-1.7 . . . . . . . . . . . . . . . . . . . . . . . . . . . . . . 2310.2 γ-ray source 3EG J0617+2238 – SNR G189.1+3.0 (IC443) . . . . . . . . . . . . . . . . . . . . . . . . 2310.3 γ-ray source 3EG J0631+0642 and 3EG J0634+0521 – SNR G205.5+0.5 (Monoceros nebula) . . . . 2610.4 γ-ray source 3EG J1013-5915 – SNR G284.3-1.8 (MSH 10-53) . . . . . . . . . . . . . . . . . . . . . . 2810.5 γ-ray source 3EG J1102-6103 – SNR G290.1-0.8 (MSH 11-61A)/289.7-0.3 . . . . . . . . . . . . . . . . 2910.6 γ-ray source 3EG J1410-6147 – SNR G312.4-0.4 . . . . . . . . . . . . . . . . . . . . . . . . . . . . . . 3110.7 γ-ray source 3EG J1639-4702 – SNR G337.8-0.1/338.1+0.4/338.3+0.0 . . . . . . . . . . . . . . . . . . 3210.8 γ-ray source 3EG J1714-3857 – SNR G348.5+0.0/348.5+0.1/347.3-0.5 . . . . . . . . . . . . . . . . . 3310.9 γ-ray source 3EG J1734-3232 – SNR G355.6+0.0 . . . . . . . . . . . . . . . . . . . . . . . . . . . . . . 3510.10 Near the Galactic Center: γ-ray source 3EG J1744-3011 – SNR G359.0-0.9/359.1-0.5 and γ-ray source 3EG J1746-2851 – SNR10.11 γ-ray source 3EG J1800-2338 – SNR G6.4-0.1 (W28) . . . . . . . . . . . . . . . . . . . . . . . . . . . 3710.12 γ-ray source 3EG J1824-1514 – SNR G16.8-1.1 . . . . . . . . . . . . . . . . . . . . . . . . . . . . . . . 3910.13 γ-ray source 3EG J1837-0423 – SNR G27.8+0.6 . . . . . . . . . . . . . . . . . . . . . . . . . . . . . . 4010.14 γ-ray source 3EG J1856+0114 – SNR G34.7-0.4 (W44) . . . . . . . . . . . . . . . . . . . . . . . . . . 4010.15 γ-ray source 3EG J1903+0550 – SNR G39.2-0.3 . . . . . . . . . . . . . . . . . . . . . . . . . . . . . . 4110.16 γ-ray source 3EG J2016+3657 – SNR G74.9+1.2 (CTB 87) . . . . . . . . . . . . . . . . . . . . . . . . 4310.17 γ-ray source 3EG J2020+4017 – SNR G78.2+2.1 (γ-Cygni Nebula, W66) . . . . . . . . . . . . . . . 4310.18 An example beyond |b| > 10: γ-ray source 3EG J0010+7309 – SNR G119.5+10.2 (CTA 1) . . . . . . 45
11 SNRs discovered by their likely associated high-energy radiation 46
12 SNRs and their neighborhoods as TeV sources 47
13 Concluding remarks 49
14 Appendix: Reviewing the prospects for the forthcoming GeV satellites 5014.1 INTEGRAL . . . . . . . . . . . . . . . . . . . . . . . . . . . . . . . . . . . . . . . . . . . . . . . . . . 5014.2 AGILE . . . . . . . . . . . . . . . . . . . . . . . . . . . . . . . . . . . . . . . . . . . . . . . . . . . . . 5114.3 GLAST . . . . . . . . . . . . . . . . . . . . . . . . . . . . . . . . . . . . . . . . . . . . . . . . . . . . . 52
15 Appendix: Future TeV telescopes and their look at SNRs - Adapted from Petry (2001) 53
2
Figure 1: Plot of source locations (galactic coordinates) in the COS-B catalog. The undashed region ofthe sky was surveyed by the satellite. Most of the sources had fluxes higher than 1.3× 10⁻⁶ photons cm−2
s−1 above 100 MeV. From Bignami & Hermsen (1983).
1 Introduction
Gamma-ray astronomy has unveiled some of the most exotic and energetic objects in the universe: fromsupermassive black-holes in distant radio galaxies to radio-quiet pulsars and the still enigmatic gamma-raybursts. However, it has been conspicuously less successful in achieving one of its original goals of sheddinglight on the sources of Galactic cosmic ray nuclei. In this report we focus on the remnants of galacticsupernovae, and their possible association with discrete sources of (> 70 MeV) γ-rays, as seen by the En-ergetic Gamma-ray Experiment Telescope (EGRET). In doing so, we attempt to lay a framework in whichthe long-standing question of the supernova remnant origin of Galactic cosmic rays may be addressed.
The first firm detection of celestial high-energy γ-rays was achieved by Clark, Garmire and Kraushaarusing the Orbiting Solar Observatory (OSO-3), when they discovered that the plane of the Galaxy was asource of photons with E > 70 MeV (Clark, Garmire & Kraushaar 1968; Kraushaar et al. 1972). Higherspatial resolution studies made with the SAS-2 satellite, launched in 1972, revealed individual sources ofγ-rays from the Vela pulsar (Thompson et al. 1975), and confirmed the high-energy emission from theCrab (Kniffen et al. 1974). The long life of ESA’s COS-B satellite (1975-1982) produced another majorbreakthrough in γ-ray astronomy: for the first time a significant number of γ-ray sources were seen whichcould not be identified with objects known at other wavelengths (see Bignami & Hermsen 1983, for areview of COS-B results). Figure 1 shows the region surveyed by COS-B and the point sources discovered,as reported in the second COS-B Catalog (Hermsen 1981, Swanenburg et al. 1981).
In 1991, the EGRET telescope was launched onboard the Compton Gamma-Ray Observatory (seeGehrels & Shrader 2001, for a recent review). The Compton satellite (1991-2000), the heaviest orbital sci-entific payload at the time of its launch, had three other experiments apart from EGRET. All of them havecontributed to our understanding of the γ-ray sky, although we shall particularly focus on EGRET resultsin this report. The Third EGRET (3EG) Catalog, whose point-like detections are shown in Figure 2, isnow the latest and most complete source of information on high-energy γ-ray sources. It contains 271detections with high significance, including 5 pulsars, 1 solar flare, 66 blazar identifications, 1 radio galaxy(Cen A), 1 normal galaxy (LMC), and almost two hundred unidentified sources, ∼ 80 of them located atlow galactic latitudes (see Grenier 2001 and Romero 2001 for recent reviews).
The detection of pulsed high-energy emission from some γ-ray sources, on one hand, and the identi-fication of Geminga as a radio quiet pulsar, on the other, have prompted several authors to explore thepossibility that all unidentified low-latitude sources contained in earlier versions of the EGRET Catalog(i.e. the Second EGRET –2EG– Catalog, Thompson et al. 1995, 1996) could be pulsars as well (exceptinga small extragalactic and isotropic component which should be seen through the disc of the Galaxy). Inparticular, Kaaret & Cottam (1996) used OB associations as pulsar tracers, finding a significant positionalcorrelation with 2EG unidentified sources. A similar study, including SNRs and HII regions (consideredas tracers of star forming regions and, hence, of possible pulsar concentrations) has been carried out byYadigaroglu & Romani (1997), who also concluded that the pulsar hypothesis for the unidentified 2EGsources was consistent with the available information.
3
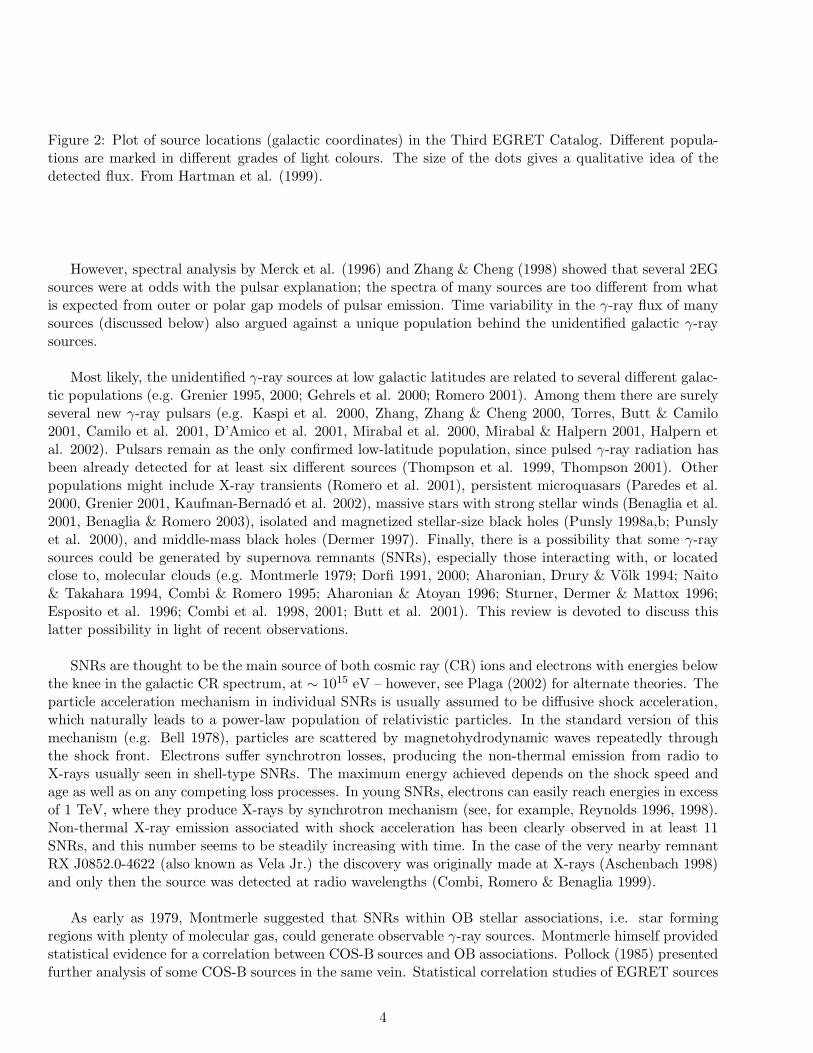
Figure 2: Plot of source locations (galactic coordinates) in the Third EGRET Catalog. Different popula-tions are marked in different grades of light colours. The size of the dots gives a qualitative idea of thedetected flux. From Hartman et al. (1999).
However, spectral analysis by Merck et al. (1996) and Zhang & Cheng (1998) showed that several 2EGsources were at odds with the pulsar explanation; the spectra of many sources are too different from whatis expected from outer or polar gap models of pulsar emission. Time variability in the γ-ray flux of manysources (discussed below) also argued against a unique population behind the unidentified galactic γ-raysources.
Most likely, the unidentified γ-ray sources at low galactic latitudes are related to several different galac-tic populations (e.g. Grenier 1995, 2000; Gehrels et al. 2000; Romero 2001). Among them there are surelyseveral new γ-ray pulsars (e.g. Kaspi et al. 2000, Zhang, Zhang & Cheng 2000, Torres, Butt & Camilo2001, Camilo et al. 2001, D’Amico et al. 2001, Mirabal et al. 2000, Mirabal & Halpern 2001, Halpern etal. 2002). Pulsars remain as the only confirmed low-latitude population, since pulsed γ-ray radiation hasbeen already detected for at least six different sources (Thompson et al. 1999, Thompson 2001). Otherpopulations might include X-ray transients (Romero et al. 2001), persistent microquasars (Paredes et al.2000, Grenier 2001, Kaufman-Bernado et al. 2002), massive stars with strong stellar winds (Benaglia et al.2001, Benaglia & Romero 2003), isolated and magnetized stellar-size black holes (Punsly 1998a,b; Punslyet al. 2000), and middle-mass black holes (Dermer 1997). Finally, there is a possibility that some γ-raysources could be generated by supernova remnants (SNRs), especially those interacting with, or locatedclose to, molecular clouds (e.g. Montmerle 1979; Dorfi 1991, 2000; Aharonian, Drury & Volk 1994; Naito& Takahara 1994, Combi & Romero 1995; Aharonian & Atoyan 1996; Sturner, Dermer & Mattox 1996;Esposito et al. 1996; Combi et al. 1998, 2001; Butt et al. 2001). This review is devoted to discuss thislatter possibility in light of recent observations.
SNRs are thought to be the main source of both cosmic ray (CR) ions and electrons with energies belowthe knee in the galactic CR spectrum, at ∼ 1015 eV – however, see Plaga (2002) for alternate theories. Theparticle acceleration mechanism in individual SNRs is usually assumed to be diffusive shock acceleration,which naturally leads to a power-law population of relativistic particles. In the standard version of thismechanism (e.g. Bell 1978), particles are scattered by magnetohydrodynamic waves repeatedly throughthe shock front. Electrons suffer synchrotron losses, producing the non-thermal emission from radio toX-rays usually seen in shell-type SNRs. The maximum energy achieved depends on the shock speed andage as well as on any competing loss processes. In young SNRs, electrons can easily reach energies in excessof 1 TeV, where they produce X-rays by synchrotron mechanism (see, for example, Reynolds 1996, 1998).Non-thermal X-ray emission associated with shock acceleration has been clearly observed in at least 11SNRs, and this number seems to be steadily increasing with time. In the case of the very nearby remnantRX J0852.0-4622 (also known as Vela Jr.) the discovery was originally made at X-rays (Aschenbach 1998)and only then the source was detected at radio wavelengths (Combi, Romero & Benaglia 1999).
As early as 1979, Montmerle suggested that SNRs within OB stellar associations, i.e. star formingregions with plenty of molecular gas, could generate observable γ-ray sources. Montmerle himself providedstatistical evidence for a correlation between COS-B sources and OB associations. Pollock (1985) presentedfurther analysis of some COS-B sources in the same vein. Statistical correlation studies of EGRET sources
4
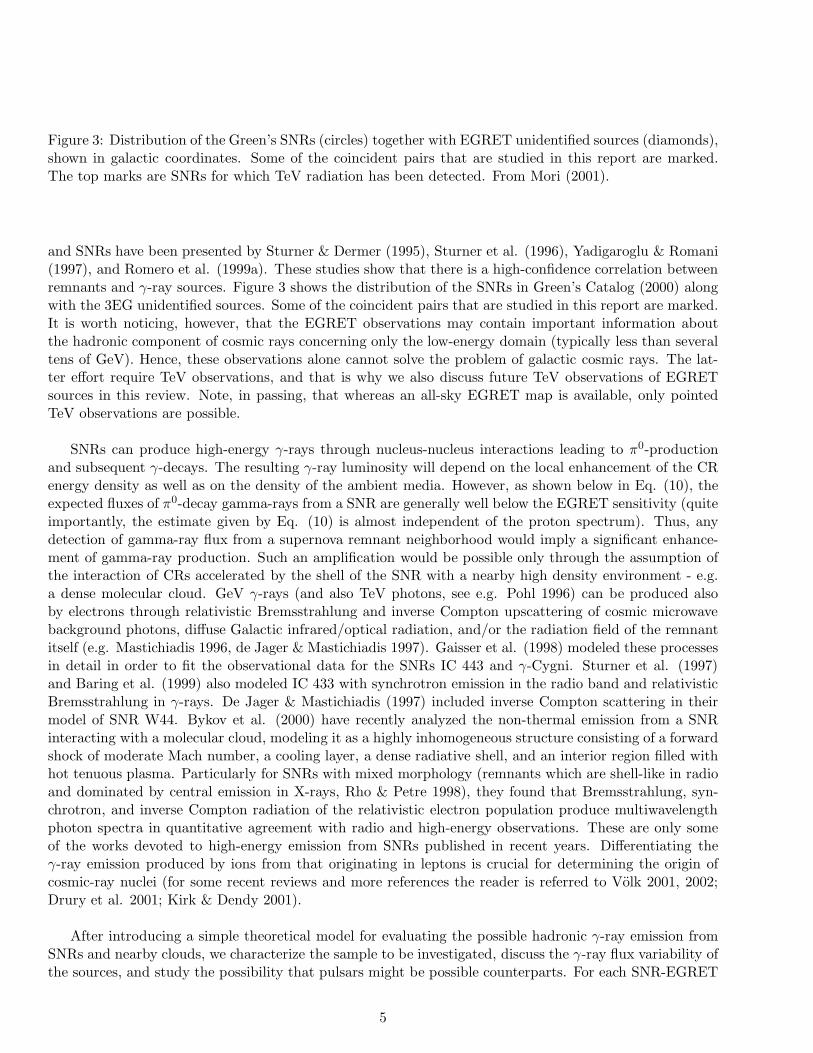
Figure 3: Distribution of the Green’s SNRs (circles) together with EGRET unidentified sources (diamonds),shown in galactic coordinates. Some of the coincident pairs that are studied in this report are marked.The top marks are SNRs for which TeV radiation has been detected. From Mori (2001).
and SNRs have been presented by Sturner & Dermer (1995), Sturner et al. (1996), Yadigaroglu & Romani(1997), and Romero et al. (1999a). These studies show that there is a high-confidence correlation betweenremnants and γ-ray sources. Figure 3 shows the distribution of the SNRs in Green’s Catalog (2000) alongwith the 3EG unidentified sources. Some of the coincident pairs that are studied in this report are marked.It is worth noticing, however, that the EGRET observations may contain important information aboutthe hadronic component of cosmic rays concerning only the low-energy domain (typically less than severaltens of GeV). Hence, these observations alone cannot solve the problem of galactic cosmic rays. The lat-ter effort require TeV observations, and that is why we also discuss future TeV observations of EGRETsources in this review. Note, in passing, that whereas an all-sky EGRET map is available, only pointedTeV observations are possible.
SNRs can produce high-energy γ-rays through nucleus-nucleus interactions leading to π0-productionand subsequent γ-decays. The resulting γ-ray luminosity will depend on the local enhancement of the CRenergy density as well as on the density of the ambient media. However, as shown below in Eq. (10), theexpected fluxes of π0-decay gamma-rays from a SNR are generally well below the EGRET sensitivity (quiteimportantly, the estimate given by Eq. (10) is almost independent of the proton spectrum). Thus, anydetection of gamma-ray flux from a supernova remnant neighborhood would imply a significant enhance-ment of gamma-ray production. Such an amplification would be possible only through the assumption ofthe interaction of CRs accelerated by the shell of the SNR with a nearby high density environment - e.g.a dense molecular cloud. GeV γ-rays (and also TeV photons, see e.g. Pohl 1996) can be produced alsoby electrons through relativistic Bremsstrahlung and inverse Compton upscattering of cosmic microwavebackground photons, diffuse Galactic infrared/optical radiation, and/or the radiation field of the remnantitself (e.g. Mastichiadis 1996, de Jager & Mastichiadis 1997). Gaisser et al. (1998) modeled these processesin detail in order to fit the observational data for the SNRs IC 443 and γ-Cygni. Sturner et al. (1997)and Baring et al. (1999) also modeled IC 433 with synchrotron emission in the radio band and relativisticBremsstrahlung in γ-rays. De Jager & Mastichiadis (1997) included inverse Compton scattering in theirmodel of SNR W44. Bykov et al. (2000) have recently analyzed the non-thermal emission from a SNRinteracting with a molecular cloud, modeling it as a highly inhomogeneous structure consisting of a forwardshock of moderate Mach number, a cooling layer, a dense radiative shell, and an interior region filled withhot tenuous plasma. Particularly for SNRs with mixed morphology (remnants which are shell-like in radioand dominated by central emission in X-rays, Rho & Petre 1998), they found that Bremsstrahlung, syn-chrotron, and inverse Compton radiation of the relativistic electron population produce multiwavelengthphoton spectra in quantitative agreement with radio and high-energy observations. These are only someof the works devoted to high-energy emission from SNRs published in recent years. Differentiating theγ-ray emission produced by ions from that originating in leptons is crucial for determining the origin ofcosmic-ray nuclei (for some recent reviews and more references the reader is referred to Volk 2001, 2002;Drury et al. 2001; Kirk & Dendy 2001).
After introducing a simple theoretical model for evaluating the possible hadronic γ-ray emission fromSNRs and nearby clouds, we characterize the sample to be investigated, discuss the γ-ray flux variability ofthe sources, and study the possibility that pulsars might be possible counterparts. For each SNR-EGRET
5
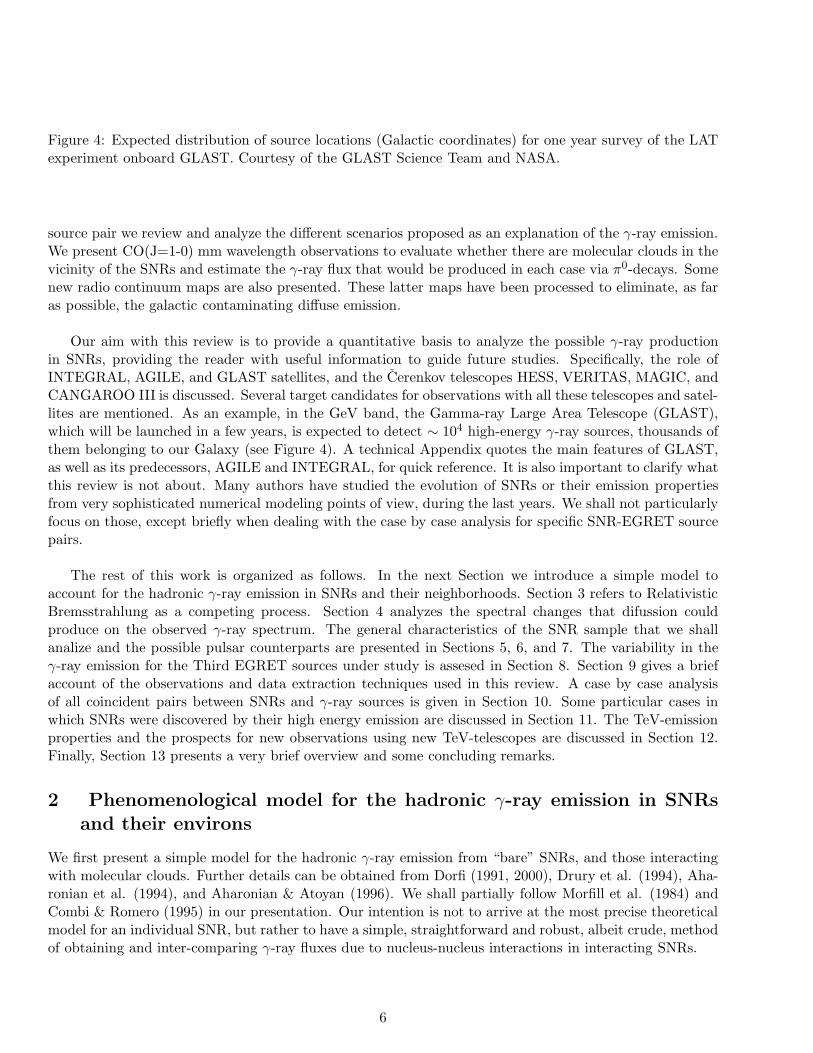
Figure 4: Expected distribution of source locations (Galactic coordinates) for one year survey of the LATexperiment onboard GLAST. Courtesy of the GLAST Science Team and NASA.
source pair we review and analyze the different scenarios proposed as an explanation of the γ-ray emission.We present CO(J=1-0) mm wavelength observations to evaluate whether there are molecular clouds in thevicinity of the SNRs and estimate the γ-ray flux that would be produced in each case via π0-decays. Somenew radio continuum maps are also presented. These latter maps have been processed to eliminate, as faras possible, the galactic contaminating diffuse emission.
Our aim with this review is to provide a quantitative basis to analyze the possible γ-ray productionin SNRs, providing the reader with useful information to guide future studies. Specifically, the role ofINTEGRAL, AGILE, and GLAST satellites, and the Cerenkov telescopes HESS, VERITAS, MAGIC, andCANGAROO III is discussed. Several target candidates for observations with all these telescopes and satel-lites are mentioned. As an example, in the GeV band, the Gamma-ray Large Area Telescope (GLAST),which will be launched in a few years, is expected to detect ∼ 104 high-energy γ-ray sources, thousands ofthem belonging to our Galaxy (see Figure 4). A technical Appendix quotes the main features of GLAST,as well as its predecessors, AGILE and INTEGRAL, for quick reference. It is also important to clarify whatthis review is not about. Many authors have studied the evolution of SNRs or their emission propertiesfrom very sophisticated numerical modeling points of view, during the last years. We shall not particularlyfocus on those, except briefly when dealing with the case by case analysis for specific SNR-EGRET sourcepairs.
The rest of this work is organized as follows. In the next Section we introduce a simple model toaccount for the hadronic γ-ray emission in SNRs and their neighborhoods. Section 3 refers to RelativisticBremsstrahlung as a competing process. Section 4 analyzes the spectral changes that difussion couldproduce on the observed γ-ray spectrum. The general characteristics of the SNR sample that we shallanalize and the possible pulsar counterparts are presented in Sections 5, 6, and 7. The variability in theγ-ray emission for the Third EGRET sources under study is assesed in Section 8. Section 9 gives a briefaccount of the observations and data extraction techniques used in this review. A case by case analysisof all coincident pairs between SNRs and γ-ray sources is given in Section 10. Some particular cases inwhich SNRs were discovered by their high energy emission are discussed in Section 11. The TeV-emissionproperties and the prospects for new observations using new TeV-telescopes are discussed in Section 12.Finally, Section 13 presents a very brief overview and some concluding remarks.
2 Phenomenological model for the hadronic γ-ray emission in SNRsand their environs
We first present a simple model for the hadronic γ-ray emission from “bare” SNRs, and those interactingwith molecular clouds. Further details can be obtained from Dorfi (1991, 2000), Drury et al. (1994), Aha-ronian et al. (1994), and Aharonian & Atoyan (1996). We shall partially follow Morfill et al. (1984) andCombi & Romero (1995) in our presentation. Our intention is not to arrive at the most precise theoreticalmodel for an individual SNR, but rather to have a simple, straightforward and robust, albeit crude, methodof obtaining and inter-comparing γ-ray fluxes due to nucleus-nucleus interactions in interacting SNRs.
6
Let us consider the expansion of a SNR in a homogeneous medium. If this expansion is adiabatic, wecan use the Sedov’s solutions (1959), which give the time since the explosion and the velocity of the shockfront, respectively, as
t ∼ 1.5 × 10³n1/2−1 E
−1/251 R
5/21 yr, (1)
vs ∼ 21.6 × 10²n−1/2−1 E
1/251 R
−3/21 km s−1. (2)
Here, E51 is the energy of the SN explosion in units of 1051 erg, R1 is the SNR radius in units of 10 pc,and n−1 is the medium density in units of 0.1 cm−3. The CR energy per time unit incoming to the SNR is
E(t) = ks ǫCR 4πRs(t)2 vs(t), (3)
where the dot means derivative with respect to time, Rs is the SNR time-dependent radius, ǫCR is thebackground CR ambient density (∼ 1 eV cm−3 in the solar neighborhood), and ks is the enhancementfactor due to re-acceleration by Fermi mechanism at the shock front (see Jones 2001 for a recent review andreferences on acceleration details). If we assume equipartition, i.e. that the energy flux from the unshockedmedium is converted in equal parts into electromagnetic energy, thermal energy, and CR enhancement(Morfill et al. 1984), we can write the previous expression as
E ∼ 4π
3
1 − ξ
1 − 2µnv3s
R2s , (4)
where ξ is the downstream to upstream ratio of kinetic energy flux in the shock frame (ξ ∼ 0.06 for strongshocks), µ is the mean molecular weight, and n is the unshocked particle density. This expression statesthat the power available for accelerating CRs is 1/3 of the mechanical energy flux across the shock.
When the SNR expands from a radius comprising a volume V (t1) to a volume V (t2), the energydecreases accordingly as
E(t2)
E(t1)=
(
V (t1)
V (t2)
)γ−1
, (5)
with the adiabatic index being γ = 4/3, Using the previous equations, the CR energy in the SNR betweentimes t1 and t2 is
ECR(t1, t2) =2πµn(1 − ξ)
3Rs(t2)3(γ−1)
∫ t2
t1dt v3
s Rs(t)3(γ−1). (6)
Through the Sedov solutions, this leads to a ratio
θ =ECR
ESN∼ π
5
(
1 −(
t1t2
)2/5)
. (7)
We shall adopt t2 as the actual age of the SNR, estimated from observational data and the Sedov solutions,and we shall assume the initial time t1 as that obtained when the SNR has swept about 5M⊙ of interstellarmaterial, starting then the Sedov phase (Lozinskaya 1992, pp. 205ff). The radius at which this happens isRs = (3 · 5M⊙/4πµmHn0)
1/3, and typical values for t1 are in the range 200-2000 years.
In simplified models of SNRs, the remnant is divided into three regions: an interior region filled withhot gas and accelerated particles but very little mass, an immediate post shock region where most of thematter is concentrated, and a shock precursor region where the accelerated particles diffusing ahead of theshock affect the ambient medium. Following Drury et al. (1994) the production rate of γ-rays per unitvolume can be written as
Qγ = Eγn = qγnECR, (8)
7
where n is the number density of the gas, ECR is the CR energy density, and qγ is the γ-ray emissivity nor-malized to the CR energy density, qγ = Eγ/ECR. The total gamma-ray luminosity is given by
∫
qγnECR d3r,which can be written as qγ (M1ECR 1 + M2ECR 2), where M1 is the total mass in the precursor region, M2
that in the immediate post-shock region, and ECR1,2 are the corresponding CR energy densities. Sinceparticle diffusion occurs across the shock front, we have ECR1 = ECR 2. This value is also probably notvery different from ECR,3, the energy density in the interior of the remnant, because of two reasons. First,there is diffusive coupling between the acceleration region around the shock and the interior of the remnant(Drury et al. 1994). Second, if the acceleration is efficient, CRs provide a substantial, if not the dominant,part of the interior pressure and the interior of the remnant has, for dynamical reasons, to be in pressureequilibrium. It follows that, to order of magnitude, the CR energy density throughout the remnant and inthe shock precursor can be taken as ECR1 = ECR 2 ≈ ECR3 ≈ 3θESN/4πR3, where θ is, again, the fractionof the total supernova explosion energy, ESN, converted to CR energy and R is the remnant radius. Thus,the γ-ray luminosity results
Lγ = qγ(M1 + M2)3θESN
4πR3≈ θqγESNn ≈ 1038θ
(
ESN
1051 erg
)(
n
1 cm−3
)
ph s−1, (9)
where n is the ambient density. The exact value of θ depends on the details of the model, for which Eq.(7) gives an example. For different plausible injection models, θ is roughly constant throughout the Sedovphase with only a moderate dependence on external parameters such as the ambient density (Markiewiczet al. 1990). If the SNR is located at a distance d, the hadronic γ-ray flux is
F (> 100MeV)SNR ∼ 4.4 × 10⁻⁷θ
(
ESN
1051erg
)(
d
kpc
)−2 ( n
cm3
)
ph cm−2s−1, (10)
where d is the distance to the remnant. Only for very high densities can the usually observed γ-ray sourcescan be due to the remnant itself. In general, the flux provided by the previous equation is far too low toproduce a detectable EGRET source (Drury et al. 1994), at typical galactic distances.
However, stronger emission can be produced if there are molecular clouds in the vicinity of the SNRwhere the locally accelerated protons interact with target ions, producing pions and hence enhancing theγ-ray flux (eg. Montmerle 1979; Dorfi 1991, 2000; Aharonian et al. 1994). The expected total flux is
Fγ =1
4πd2
∫
V0
n(r)qγ(r)d3r. (11)
Neglecting all possible gradients within the cloud, this equation reduces to
Fγ =Mcl
mp
qγ
4πd2, (12)
where Mcl is the mass of the cloud. In particular, we may write
F (> 100MeV)cloud ∼ 10−9M3
(
d
kpc
)−2
qγ(> 100MeV) ph cm−2s−1, (13)
where M3 is the mass of the target cloud in units of 103M⊙, and qγ is the γ-emissivity in units of 10−25
s−1 (H – atom)−1. The factor qγ will be enhanced in comparison with its normal value because of the localCR source. In a passive giant molecular cloud exposed to the same proton flux measured at the Earth, theγ-ray emissivity above 100 MeV is equal to 1.53 η q−25(≥ 100MeV)(H−atom)−1s−1, where the parameterη ≃ 1.5 takes into account the contribution of nuclei both in CRs and in the interstellar medium (Dermer
8
et al. 1986; Aharonian 2001). In clouds near CR accelerators, it may be much higher than this value. Ifthe shape of the CR spectrum in the cloud does not differ much from that existing near the Earth, we canapproximate
qγ
qγ,0∼ ǫCR
ǫCR,0∼ ks. (14)
Following Morfill & Tenorio Tagle (1983), we can use Eq. (6) to obtain
ks =3
20
ESN
Rs(t2)3
(
1 − Rs(t1)
Rs(t2)
)
1
ǫCR. (15)
The Sedov solutions for each of the SNRs considered below should be used in this latter expression toobtain ks, and thus F (E > 100MeV)cloud. One immediate test of energetic consistency is to check thatECR = ksǫCR/(4/3)πR3 < ESN, for the obtained value of ks and the assumed value of ESN. If the previousinequality is not valid, one or more of the simplifying assumptions of the model are not correct for theparticular case under analysis.
The expected γ-ray flux in the TeV region by a SNR is (Aharonian et al. 1994)
Fγ(> E) = fΓ 10−10(
E
TeV
)−Γ+1
A cm−2s−1, (16)
where the factor A is
A = θ
(
ESN
1051erg
)(
d
kpc
)−2 ( n
cm3
)
ph cm−2s−1, (17)
n is the medium density, and fΓ is a function of the index in the differential power-law proton spectrum (Γ),equal to 0.9, 0.43, and 0.19 for Γ=2.1, 2.2, and 2.3, respectively. This estimate, however, usually exceedsthat obtained when the GeV spectral index is extrapolated up to TeV energies. When that is the case, theextrapolated flux (with the same spectral index) will be considered a safer estimate. To extrapolate theGeV flux up to TeV energies we assume (Thompson et al. 1996)
dN
dE= K
(
E
E0
)−Γ
, (18)
where K is a constant, E is given in MeV, and E0 is a reference energy. This constant can be obtainedsimply by integrating the flux,
K ≡ Fph /
∫ 10GeV
100MeV
(
E
E0
)−Γ
dE, (19)
where Fph is the observed total flux (that quoted in the 3EG Catalog, for instance). Once K is known,the flux in any given energy interval E1 – E2 is just,
F (E1, E2) = K
∫ E2
E1
(
E
E0
)(−Γ+1)
dE. (20)
We are extrapolating, then, the measured spectral index at MeV-GeV energies assuming that there is nospectral change at higher energies. Actually, this assumption is a simplification not compatible with TeVobservations of several sources (see below). In any case, this extrapolation will always provide an upperbound to the high-energy photon flux.
9
3 Relativistic Bremsstrahlung
Since relativistic electron Bremsstrahlung and nucleus-nucleus induced pion-decay are competing processesin the generation of γ-rays from molecular clouds exposed to a nearby CR accelerator, it is necessary toassess the relative weight of each contribution if we are to quantitatively address the question of the pos-sible SNR origin of nucleonic CRs.
The γ-ray emissivity at a given energy E from relativistic Bremsstrahlung is (e.g. Longair 1994, p.267-269)
qB(E) =10−21
p − 1nm−3 KE−p m−3 s−1 GeV−1, (21)
where it is assumed an electron power-law distribution, Ne(E) = KE−p. We are interested in the γ-rayradiation above 100 MeV, so we integrate the previous expression to obtain
qB(E > 0.1GeV) =10−21
p − 1nm−3 K
∫ ∞
0.1GeVE−pdE m−3 s−1 =
10−21
(p − 1)2nm−3 K 0.1−(p−1) m−3 s−1. (22)
This same population of relativistic electrons will also radiate at radio wavelengths, via the synchrotronmechanism. The synchrotron spectrum of a power-law electron energy distribution is (Longair 1994, p.261)
J(ν) = 23.44 a(p) B(p+1)/2 K
(
1.253 × 1037
ν
)(p−1)/2
Jy m−1, (23)
where B is the magnetic field measured in Tesla, and
a(p) =
√π
2
Γ(p4 + 19
12)Γ(p4 − 1
12 )Γ(p4 + 5
4)
(p + 1)Γ(p4 + 7
4), (24)
is a numerical coefficient depending on the spectral index. Then, the ratio between the γ-ray flux emittedby relativistic Bremsstrahlung and the synchrotron emission results
R =qB(E > 100MeV)
J(ν)=
F (E > 100MeV)
Fν [Jy]=
4.3 × 10⁻²¹
b(p)ncm−3B
−(1+p)/2µG ν
(p−1)/2Hz Jy−1 cm−2 s−1, (25)
where we have definedb(p) = 10−5(1+p)(3.2 × 10¹⁵)(p−1)/2 (p − 1)2 a(p), (26)
and converted units to the cgs system.
If F (E > 100 MeV) is known, estimating the right hand side of Eq. (25) for the measured spectralphoton index and the derived density and magnetic field, the expected value of Fν [Jy] can be obtained.This is the radio emission that should be observed if the γ-rays are from relativistic Bremsstrahlung. Ifthe γ-ray source is not superposed with the bulk of the synchrotron radio/X-ray emission from the SNR,this tends to favor a nucleus-nucleus origin of the high-energy flux, rather than a electron Bremsstrahlungscenario. In general, at the high densities found in molecular clouds, inverse Compton scattering can beruled out as the main mechanism contributing to the γ-ray emission (e.g. Gaisser et al. 1998). Above 100MeV, the relevant cross sections and estimates of the electron-nucleon density ratio show that relativisticBremsstrahlung dominates over inverse Compton processes (see, for instance, Stecker’s 1977, Figure 1 and2). In particular, de Jager & Mastichiadis (1997) have shown that for molecular densities above 10 cm−3
γ-ray fluxes above 70 MeV are dominated by Bremsstrahlung when electrons are considered (see their Fig-ure 4). In what follows, since we shall mainly consider high-density scenarios, relativistic Bremsstrahlung
10
will be the main alternative to nucleonic interactions in evaluating the origin of the observed γ-ray flux inthe MeV-TeV energy range.
4 Diffusion of CRs and γ-ray spectral evolution
The spectrum of γ-rays generated through π0-decay at a source of proton density np is
Fγ(Eγ) = 2
∫ ∞
Eminπ
Fπ(Eπ)√
E2π − m2
π
dEπ, (27)
where
Eminπ (Eγ) = Eγ +
m2π
4Eγ, (28)
and
Fπ(Eπ) = 4πnp
∫ Emaxp
Eminp
Jp(Ep)dσπ(Eπ, Ep)
dEπdEp. (29)
Here, dσπ(Eπ, Ep)/dEπ is the differential cross-section for the production of π0-mesons of energy Eπ by aproton of energy Ep in a p − p collision. If the proton spectrum Jp(Ep) at the γ-ray production site is
Jp(Ep) = KE−Γp , (30)
we can also expect a power-law spectrum at γ-rays:
Fγ(Eγ) ∝ E−Γγ . (31)
However, the spectrum given by Eq. (30) is not necessarily the same proton spectrum at the accelerationsite. If there is diffusion, we shall have, instead
Jp(Ep, r, t) =c
4πf, (32)
where f(Ep, r, t) is the distribution function of protons at an instant t and distance r from the source.The distribution function satisfies the well-known diffusion equation (Ginzburg & Syrovatskii 1964):
∂f
∂t=
D(Ep)
r2
∂
∂rr2 ∂f
∂r+
∂
∂Ep(Pf) + Q, (33)
where P = −dEp/dt is the continuous energy loss rate of the particles, Q = Q(Ep, r, t) is the sourcefunction, and D(Ep) is the diffusion coefficient, for which we assume here no dependency on r or t, i.e. theparticles diffuse through an homogeneous, quasi-stationary medium.
We assume that D(Ep) ∝ Eδp and f ∝ E−Γ
p with continuous injection given by Q(Ep, t) = Q0E−Γp q(t),
which is appropriate for a supernova remnant (Aharonian & Atoyan 1996). Further simplicity can beachieved assuming that the source is constant after turning on at some instant, i.e. q(t) = 0 for t < 0 andq(t) = 1 for t ≥ 0. Atoyan et al. (1995) have found a general solution for Eq. (33) with arbitrary injectionspectrum, which with the listed assumptions leads to:
f(Ep, r, t) =Q0E
−Γp
4πD(Ep)r
(
2√π
)∫ ∞
r/Rdiff
e−x2dx. (34)
11
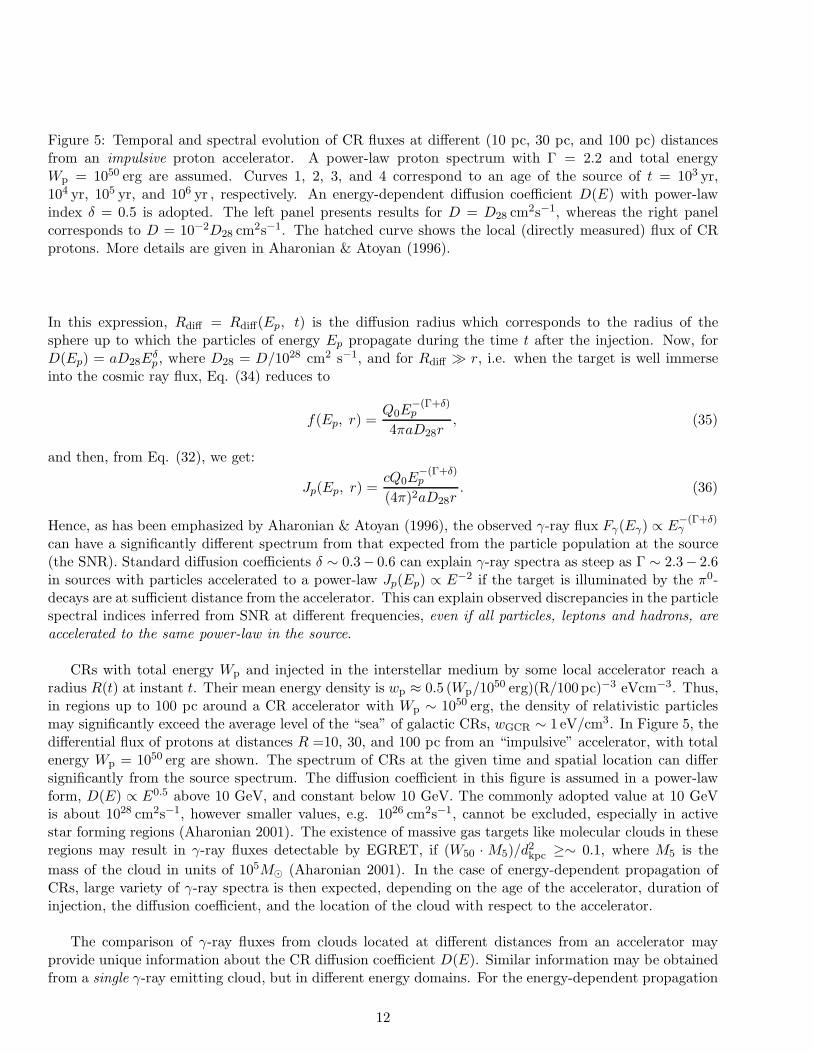
Figure 5: Temporal and spectral evolution of CR fluxes at different (10 pc, 30 pc, and 100 pc) distancesfrom an impulsive proton accelerator. A power-law proton spectrum with Γ = 2.2 and total energyWp = 1050 erg are assumed. Curves 1, 2, 3, and 4 correspond to an age of the source of t = 103 yr,104 yr, 105 yr, and 106 yr , respectively. An energy-dependent diffusion coefficient D(E) with power-lawindex δ = 0.5 is adopted. The left panel presents results for D = D28 cm2s−1, whereas the right panelcorresponds to D = 10−2D28 cm2s−1. The hatched curve shows the local (directly measured) flux of CRprotons. More details are given in Aharonian & Atoyan (1996).
In this expression, Rdiff = Rdiff(Ep, t) is the diffusion radius which corresponds to the radius of thesphere up to which the particles of energy Ep propagate during the time t after the injection. Now, forD(Ep) = aD28E
δp, where D28 = D/1028 cm2 s−1, and for Rdiff ≫ r, i.e. when the target is well immerse
into the cosmic ray flux, Eq. (34) reduces to
f(Ep, r) =Q0E
−(Γ+δ)p
4πaD28r, (35)
and then, from Eq. (32), we get:
Jp(Ep, r) =cQ0E
−(Γ+δ)p
(4π)2aD28r. (36)
Hence, as has been emphasized by Aharonian & Atoyan (1996), the observed γ-ray flux Fγ(Eγ) ∝ E−(Γ+δ)γ
can have a significantly different spectrum from that expected from the particle population at the source(the SNR). Standard diffusion coefficients δ ∼ 0.3− 0.6 can explain γ-ray spectra as steep as Γ ∼ 2.3− 2.6in sources with particles accelerated to a power-law Jp(Ep) ∝ E−2 if the target is illuminated by the π0-decays are at sufficient distance from the accelerator. This can explain observed discrepancies in the particlespectral indices inferred from SNR at different frequencies, even if all particles, leptons and hadrons, are
accelerated to the same power-law in the source.
CRs with total energy Wp and injected in the interstellar medium by some local accelerator reach aradius R(t) at instant t. Their mean energy density is wp ≈ 0.5 (Wp/1050 erg)(R/100 pc)−3 eVcm−3. Thus,in regions up to 100 pc around a CR accelerator with Wp ∼ 1050 erg, the density of relativistic particlesmay significantly exceed the average level of the “sea” of galactic CRs, wGCR ∼ 1 eV/cm3. In Figure 5, thedifferential flux of protons at distances R =10, 30, and 100 pc from an “impulsive” accelerator, with totalenergy Wp = 1050 erg are shown. The spectrum of CRs at the given time and spatial location can differsignificantly from the source spectrum. The diffusion coefficient in this figure is assumed in a power-lawform, D(E) ∝ E0.5 above 10 GeV, and constant below 10 GeV. The commonly adopted value at 10 GeVis about 1028 cm2s−1, however smaller values, e.g. 1026 cm2s−1, cannot be excluded, especially in activestar forming regions (Aharonian 2001). The existence of massive gas targets like molecular clouds in theseregions may result in γ-ray fluxes detectable by EGRET, if (W50 · M5)/d
2kpc ≥∼ 0.1, where M5 is the
mass of the cloud in units of 105M⊙ (Aharonian 2001). In the case of energy-dependent propagation ofCRs, large variety of γ-ray spectra is then expected, depending on the age of the accelerator, duration ofinjection, the diffusion coefficient, and the location of the cloud with respect to the accelerator.
The comparison of γ-ray fluxes from clouds located at different distances from an accelerator mayprovide unique information about the CR diffusion coefficient D(E). Similar information may be obtainedfrom a single γ-ray emitting cloud, but in different energy domains. For the energy-dependent propagation
12
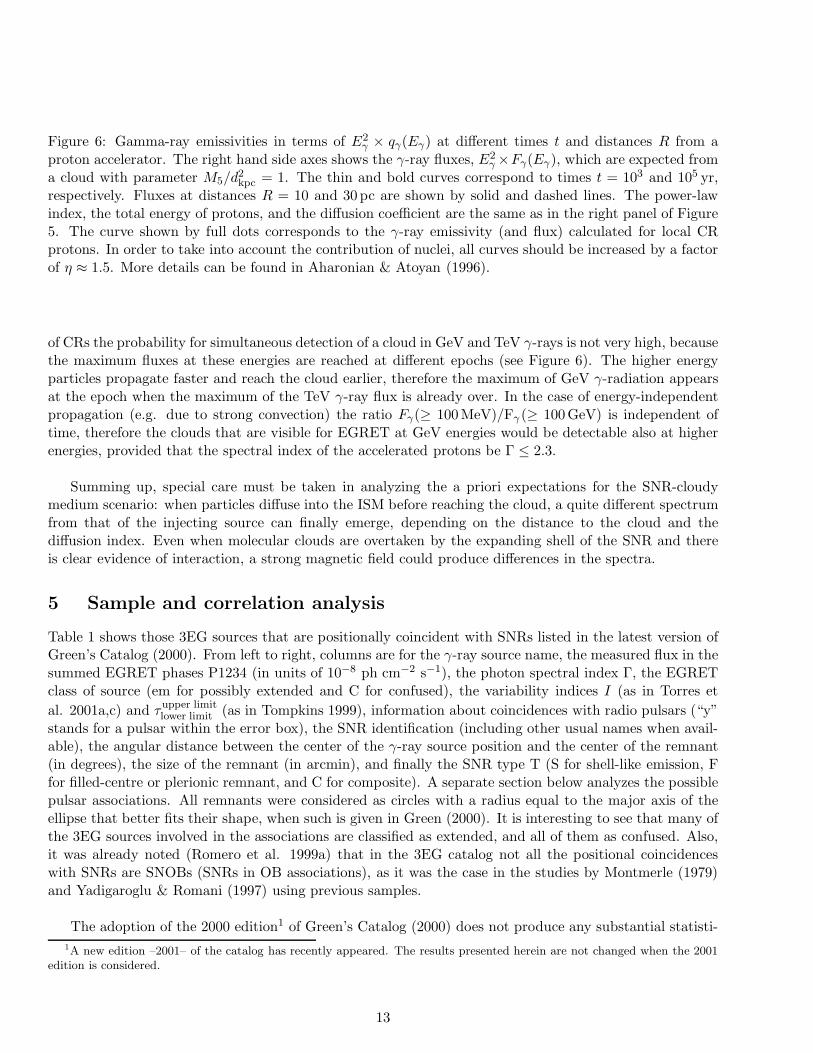
Figure 6: Gamma-ray emissivities in terms of E2γ × qγ(Eγ) at different times t and distances R from a
proton accelerator. The right hand side axes shows the γ-ray fluxes, E2γ ×Fγ(Eγ), which are expected from
a cloud with parameter M5/d2kpc = 1. The thin and bold curves correspond to times t = 103 and 105 yr,
respectively. Fluxes at distances R = 10 and 30pc are shown by solid and dashed lines. The power-lawindex, the total energy of protons, and the diffusion coefficient are the same as in the right panel of Figure5. The curve shown by full dots corresponds to the γ-ray emissivity (and flux) calculated for local CRprotons. In order to take into account the contribution of nuclei, all curves should be increased by a factorof η ≈ 1.5. More details can be found in Aharonian & Atoyan (1996).
of CRs the probability for simultaneous detection of a cloud in GeV and TeV γ-rays is not very high, becausethe maximum fluxes at these energies are reached at different epochs (see Figure 6). The higher energyparticles propagate faster and reach the cloud earlier, therefore the maximum of GeV γ-radiation appearsat the epoch when the maximum of the TeV γ-ray flux is already over. In the case of energy-independentpropagation (e.g. due to strong convection) the ratio Fγ(≥ 100MeV)/Fγ (≥ 100GeV) is independent oftime, therefore the clouds that are visible for EGRET at GeV energies would be detectable also at higherenergies, provided that the spectral index of the accelerated protons be Γ ≤ 2.3.
Summing up, special care must be taken in analyzing the a priori expectations for the SNR-cloudymedium scenario: when particles diffuse into the ISM before reaching the cloud, a quite different spectrumfrom that of the injecting source can finally emerge, depending on the distance to the cloud and thediffusion index. Even when molecular clouds are overtaken by the expanding shell of the SNR and thereis clear evidence of interaction, a strong magnetic field could produce differences in the spectra.
5 Sample and correlation analysis
Table 1 shows those 3EG sources that are positionally coincident with SNRs listed in the latest version ofGreen’s Catalog (2000). From left to right, columns are for the γ-ray source name, the measured flux in thesummed EGRET phases P1234 (in units of 10−8 ph cm−2 s−1), the photon spectral index Γ, the EGRETclass of source (em for possibly extended and C for confused), the variability indices I (as in Torres et
al. 2001a,c) and τupper limitlower limit (as in Tompkins 1999), information about coincidences with radio pulsars (“y”
stands for a pulsar within the error box), the SNR identification (including other usual names when avail-able), the angular distance between the center of the γ-ray source position and the center of the remnant(in degrees), the size of the remnant (in arcmin), and finally the SNR type T (S for shell-like emission, Ffor filled-centre or plerionic remnant, and C for composite). A separate section below analyzes the possiblepulsar associations. All remnants were considered as circles with a radius equal to the major axis of theellipse that better fits their shape, when such is given in Green (2000). It is interesting to see that many ofthe 3EG sources involved in the associations are classified as extended, and all of them as confused. Also,it was already noted (Romero et al. 1999a) that in the 3EG catalog not all the positional coincidenceswith SNRs are SNOBs (SNRs in OB associations), as it was the case in the studies by Montmerle (1979)and Yadigaroglu & Romani (1997) using previous samples.
The adoption of the 2000 edition1 of Green’s Catalog (2000) does not produce any substantial statisti-
1A new edition –2001– of the catalog has recently appeared. The results presented herein are not changed when the 2001edition is considered.
13

Table 1: Positional coincidences between supernova remnants quoted in Green’s Catalog (2000), and unidentified 3EG EGRET sources.See text for the meaning of the different columns.
γ-source Fγ Γ Class I τ P? SNR Other name ∆θ Size T
0542+2610 14.7±3.2 2.67±0.22 em C 3.16 0.701.400.34 G180.0−1.7 2.04 180 S
0617+22381,2 51.4±3.5 2.01±0.06 C 1.68 0.260.380.15 G189.1+3.0 IC443 0.11 45 S
0631+06421,3 14.3±3.4 2.06±0.15 C 1.52 75.8∞7.89 G205.5+0.5 Monoceros 1.97 220 S0634+0521 15.0±3.5 2.03±0.26 em C 1.02 72.0∞5.15 G205.5+0.5 Monoceros 2.03 220 S1013−5915 33.4±6.0 2.32±0.13 em C 1.63 0.220.46
0.00 y G284.3−1.8 MSH 10-53 0.65 24 S1102−6103 32.5±6.2 2.47±0.21 C 1.86 0.000.90
0.00 G290.1−0.8 MSH 11-61A 0.12 19 SG289.7−0.3 0.75 18 S
1410−61474 64.2±8.8 2.12±0.14 C 1.22 0.330.550.16 y G312.4−0.4 0.23 38 S
1639−4702 53.2±8.7 2.50±0.18 em C 1.95 0.000.380.00 y G337.8−0.1 Kes 41 0.07 9 S
G338.1+0.4 0.65 15 SG338.3+0.0 0.57 8 S
1714−3857 43.6±6.5 2.30±0.20 em C 2.17 0.150.380.00 y G348.5+0.0 0.47 10 S
G348.5+0.1 CTB 37A 0.50 15 SG347.3−0.5 0.85 65 S
1734−32325 40.3±6.7 – C 2.90 0.000.240.00 G355.6+0.0 0.16 8 S
1744−3011 63.9±7.1 2.17±0.08 C 1.80 0.380.620.20 G359.0−0.9 0.41 23 S
G359.1−0.5 0.25 24 S1746−28516 119.9±7.4 1.70±0.07 em C 2.00 0.500.69
0.36 G0.0+0.0 0.12 3.5 SG0.3+0.0 0.19 16 S
1800−23381,7 61.3±6.7 2.10±0.10 C 1.60 0.030.320.00 y G6.4−0.1 W28 0.17 42 C
1824−1514 35.2±6.5 2.19±0.18 C 3.00 0.000.510.00 y G16.8−1.1 0.43 30 –
1837−0423 <19.1 2.71±0.44 C 5.41 12.0∞2.17 y G27.8+0.6 0.58 50 F1856+01148 67.5±8.6 1.93±0.10 em C 2.92 0.801.51
0.50 y G34.7−0.4 W44 0.17 35 S1903+05504 62.1±8.9 2.38±0.17 em C 2.28 0.350.60
0.18 y G39.2−0.3 3C396, HC24 0.41 8 S2016+3657 34.7±5.7 2.09±0.11 C 2.06 0.370.75
0.08 G74.9+1.2 CTB 87 0.26 8 F2020+40171,9 123.7±6.7 2.08±0.04 C 1.12 0.070.18
0.00 ? G78.2+2.1 W66, γ-Cygni 0.15 60 S
1 Association proposed by Sturner & Dermer (1995) and Esposito et al. (1996). 2 GeV J0617+2237 3 GeV J0633+0645. 4 Association proposed by
Sturner & Dermer (1995). 5 GeV J1732−3130. 6 GeV J1746−2854. 7 GeV J1800−2328. 8 GeV J1856−0115. 9 GeV J2020+4023. GeV sources
compiled in the GeV ASCA Catalog (Roberts et al. 2001a).
14
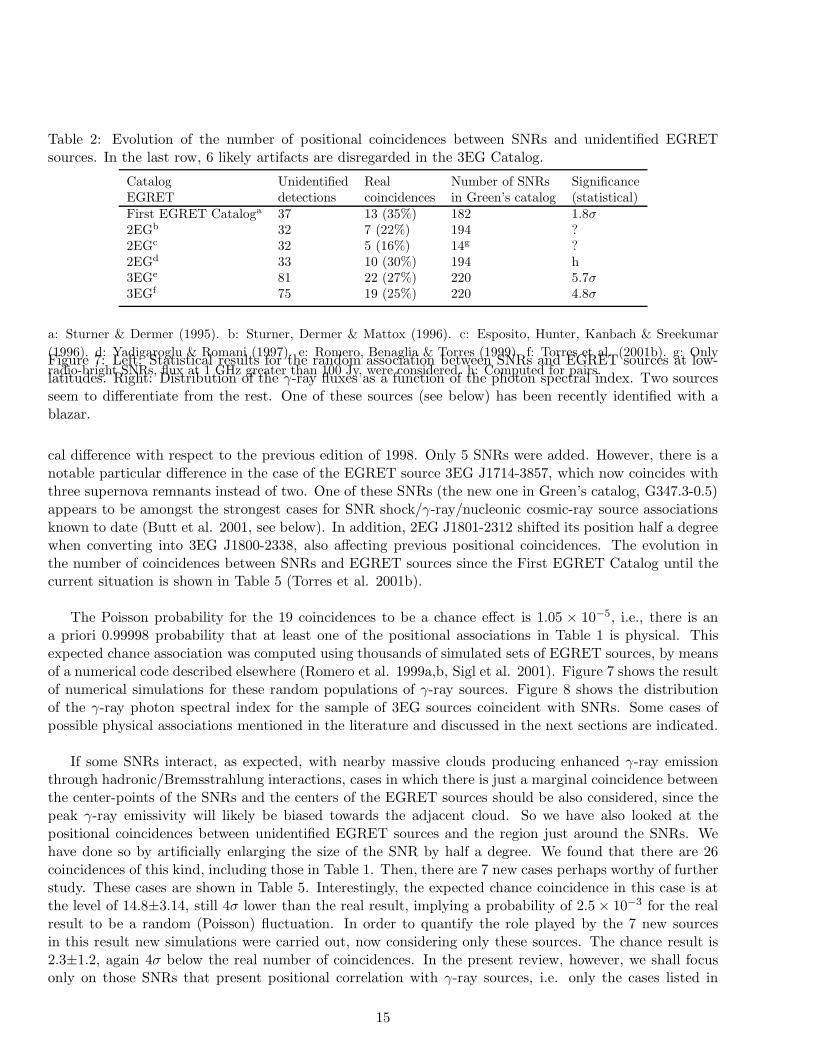
Table 2: Evolution of the number of positional coincidences between SNRs and unidentified EGRETsources. In the last row, 6 likely artifacts are disregarded in the 3EG Catalog.
Catalog Unidentified Real Number of SNRs SignificanceEGRET detections coincidences in Green’s catalog (statistical)First EGRET Cataloga 37 13 (35%) 182 1.8σ2EGb 32 7 (22%) 194 ?2EGc 32 5 (16%) 14g ?2EGd 33 10 (30%) 194 h3EGe 81 22 (27%) 220 5.7σ3EGf 75 19 (25%) 220 4.8σ
a: Sturner & Dermer (1995). b: Sturner, Dermer & Mattox (1996). c: Esposito, Hunter, Kanbach & Sreekumar
(1996). d: Yadigaroglu & Romani (1997). e: Romero, Benaglia & Torres (1999). f: Torres et al. (2001b). g: Only
radio-bright SNRs, flux at 1 GHz greater than 100 Jy, were considered. h: Computed for pairs.Figure 7: Left: Statistical results for the random association between SNRs and EGRET sources at low-latitudes. Right: Distribution of the γ-ray fluxes as a function of the photon spectral index. Two sourcesseem to differentiate from the rest. One of these sources (see below) has been recently identified with ablazar.
cal difference with respect to the previous edition of 1998. Only 5 SNRs were added. However, there is anotable particular difference in the case of the EGRET source 3EG J1714-3857, which now coincides withthree supernova remnants instead of two. One of these SNRs (the new one in Green’s catalog, G347.3-0.5)appears to be amongst the strongest cases for SNR shock/γ-ray/nucleonic cosmic-ray source associationsknown to date (Butt et al. 2001, see below). In addition, 2EG J1801-2312 shifted its position half a degreewhen converting into 3EG J1800-2338, also affecting previous positional coincidences. The evolution inthe number of coincidences between SNRs and EGRET sources since the First EGRET Catalog until thecurrent situation is shown in Table 5 (Torres et al. 2001b).
The Poisson probability for the 19 coincidences to be a chance effect is 1.05 × 10⁻⁵, i.e., there is ana priori 0.99998 probability that at least one of the positional associations in Table 1 is physical. Thisexpected chance association was computed using thousands of simulated sets of EGRET sources, by meansof a numerical code described elsewhere (Romero et al. 1999a,b, Sigl et al. 2001). Figure 7 shows the resultof numerical simulations for these random populations of γ-ray sources. Figure 8 shows the distributionof the γ-ray photon spectral index for the sample of 3EG sources coincident with SNRs. Some cases ofpossible physical associations mentioned in the literature and discussed in the next sections are indicated.
If some SNRs interact, as expected, with nearby massive clouds producing enhanced γ-ray emissionthrough hadronic/Bremsstrahlung interactions, cases in which there is just a marginal coincidence betweenthe center-points of the SNRs and the centers of the EGRET sources should be also considered, since thepeak γ-ray emissivity will likely be biased towards the adjacent cloud. So we have also looked at thepositional coincidences between unidentified EGRET sources and the region just around the SNRs. Wehave done so by artificially enlarging the size of the SNR by half a degree. We found that there are 26coincidences of this kind, including those in Table 1. Then, there are 7 new cases perhaps worthy of furtherstudy. These cases are shown in Table 5. Interestingly, the expected chance coincidence in this case is atthe level of 14.8±3.14, still 4σ lower than the real result, implying a probability of 2.5 × 10⁻³ for the realresult to be a random (Poisson) fluctuation. In order to quantify the role played by the 7 new sourcesin this result new simulations were carried out, now considering only these sources. The chance result is2.3±1.2, again 4σ below the real number of coincidences. In the present review, however, we shall focusonly on those SNRs that present positional correlation with γ-ray sources, i.e. only the cases listed in
15
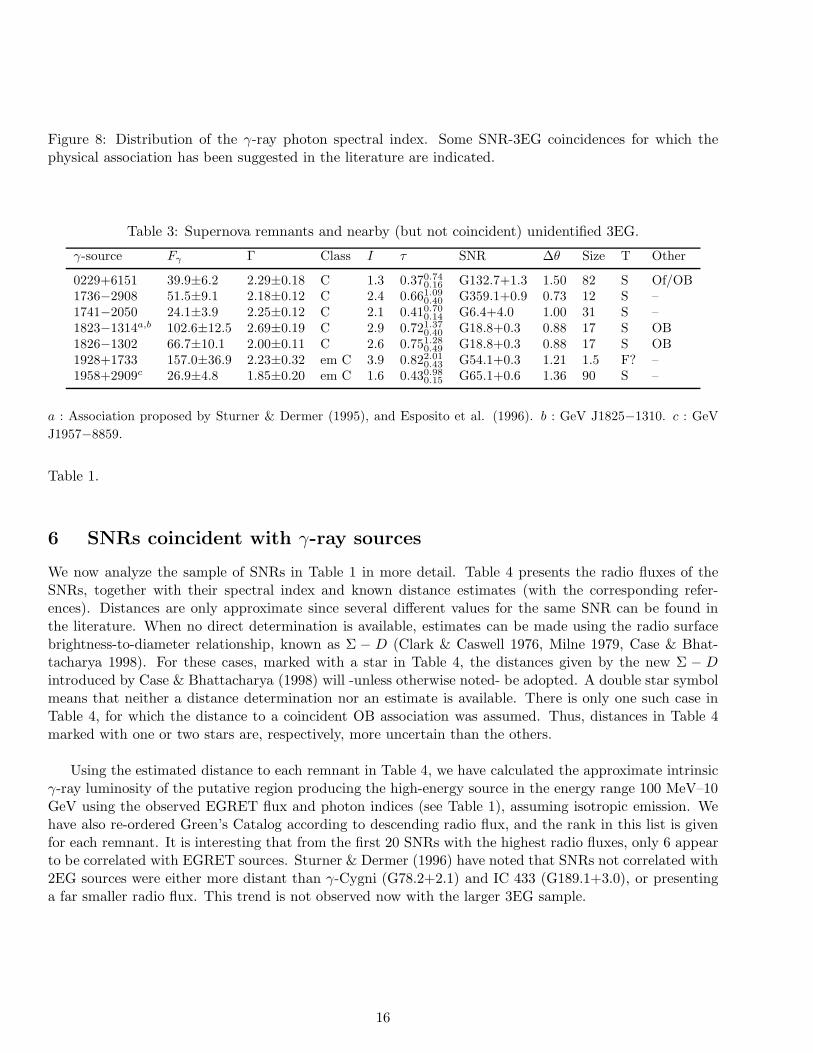
Figure 8: Distribution of the γ-ray photon spectral index. Some SNR-3EG coincidences for which thephysical association has been suggested in the literature are indicated.
Table 3: Supernova remnants and nearby (but not coincident) unidentified 3EG.
γ-source Fγ Γ Class I τ SNR ∆θ Size T Other
0229+6151 39.9±6.2 2.29±0.18 C 1.3 0.370.740.16 G132.7+1.3 1.50 82 S Of/OB
1736−2908 51.5±9.1 2.18±0.12 C 2.4 0.661.090.40 G359.1+0.9 0.73 12 S –
1741−2050 24.1±3.9 2.25±0.12 C 2.1 0.410.700.14 G6.4+4.0 1.00 31 S –
1823−1314a,b 102.6±12.5 2.69±0.19 C 2.9 0.721.370.40 G18.8+0.3 0.88 17 S OB
1826−1302 66.7±10.1 2.00±0.11 C 2.6 0.751.280.49 G18.8+0.3 0.88 17 S OB
1928+1733 157.0±36.9 2.23±0.32 em C 3.9 0.822.010.43 G54.1+0.3 1.21 1.5 F? –
1958+2909c 26.9±4.8 1.85±0.20 em C 1.6 0.430.980.15 G65.1+0.6 1.36 90 S –
a : Association proposed by Sturner & Dermer (1995), and Esposito et al. (1996). b : GeV J1825−1310. c : GeV
J1957−8859.
Table 1.
6 SNRs coincident with γ-ray sources
We now analyze the sample of SNRs in Table 1 in more detail. Table 4 presents the radio fluxes of theSNRs, together with their spectral index and known distance estimates (with the corresponding refer-ences). Distances are only approximate since several different values for the same SNR can be found inthe literature. When no direct determination is available, estimates can be made using the radio surfacebrightness-to-diameter relationship, known as Σ − D (Clark & Caswell 1976, Milne 1979, Case & Bhat-tacharya 1998). For these cases, marked with a star in Table 4, the distances given by the new Σ − Dintroduced by Case & Bhattacharya (1998) will -unless otherwise noted- be adopted. A double star symbolmeans that neither a distance determination nor an estimate is available. There is only one such case inTable 4, for which the distance to a coincident OB association was assumed. Thus, distances in Table 4marked with one or two stars are, respectively, more uncertain than the others.
Using the estimated distance to each remnant in Table 4, we have calculated the approximate intrinsicγ-ray luminosity of the putative region producing the high-energy source in the energy range 100 MeV–10GeV using the observed EGRET flux and photon indices (see Table 1), assuming isotropic emission. Wehave also re-ordered Green’s Catalog according to descending radio flux, and the rank in this list is givenfor each remnant. It is interesting that from the first 20 SNRs with the highest radio fluxes, only 6 appearto be correlated with EGRET sources. Sturner & Dermer (1996) have noted that SNRs not correlated with2EG sources were either more distant than γ-Cygni (G78.2+2.1) and IC 433 (G189.1+3.0), or presentinga far smaller radio flux. This trend is not observed now with the larger 3EG sample.
16
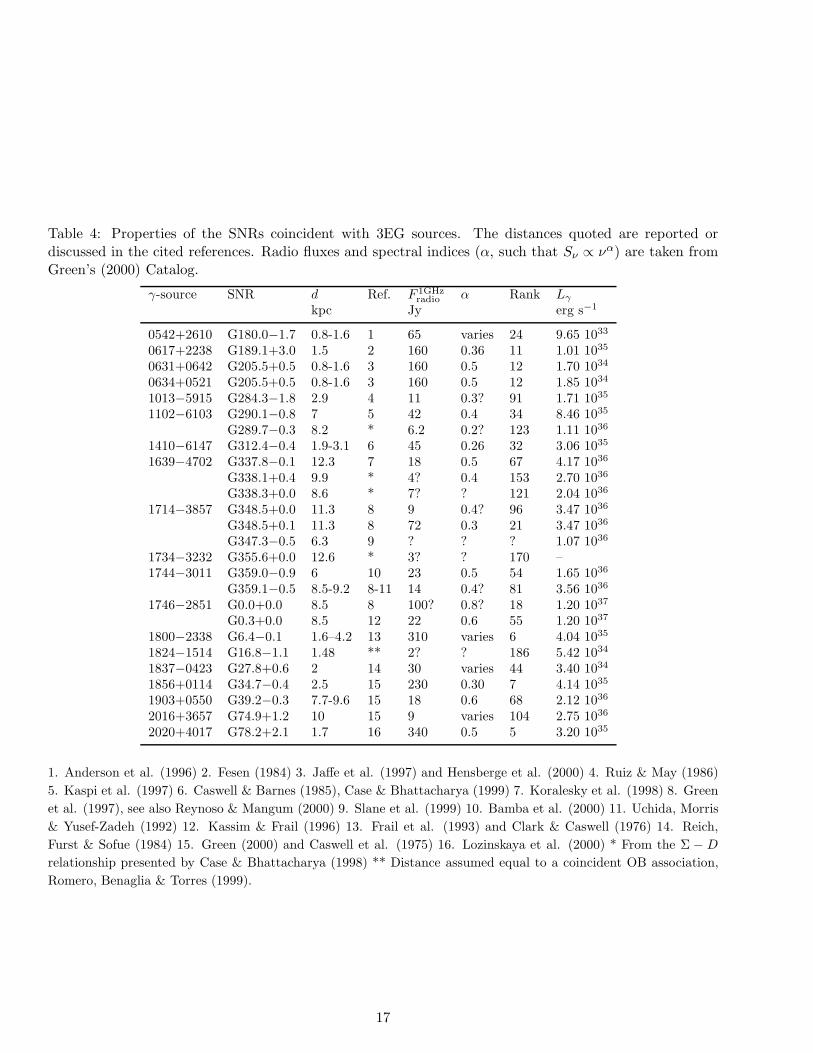
Table 4: Properties of the SNRs coincident with 3EG sources. The distances quoted are reported ordiscussed in the cited references. Radio fluxes and spectral indices (α, such that Sν ∝ να) are taken fromGreen’s (2000) Catalog.
γ-source SNR d Ref. F 1GHzradio α Rank Lγ
kpc Jy erg s−1
0542+2610 G180.0−1.7 0.8-1.6 1 65 varies 24 9.65 1033
0617+2238 G189.1+3.0 1.5 2 160 0.36 11 1.01 1035
0631+0642 G205.5+0.5 0.8-1.6 3 160 0.5 12 1.70 1034
0634+0521 G205.5+0.5 0.8-1.6 3 160 0.5 12 1.85 1034
1013−5915 G284.3−1.8 2.9 4 11 0.3? 91 1.71 1035
1102−6103 G290.1−0.8 7 5 42 0.4 34 8.46 1035
G289.7−0.3 8.2 * 6.2 0.2? 123 1.11 1036
1410−6147 G312.4−0.4 1.9-3.1 6 45 0.26 32 3.06 1035
1639−4702 G337.8−0.1 12.3 7 18 0.5 67 4.17 1036
G338.1+0.4 9.9 * 4? 0.4 153 2.70 1036
G338.3+0.0 8.6 * 7? ? 121 2.04 1036
1714−3857 G348.5+0.0 11.3 8 9 0.4? 96 3.47 1036
G348.5+0.1 11.3 8 72 0.3 21 3.47 1036
G347.3−0.5 6.3 9 ? ? ? 1.07 1036
1734−3232 G355.6+0.0 12.6 * 3? ? 170 –1744−3011 G359.0−0.9 6 10 23 0.5 54 1.65 1036
G359.1−0.5 8.5-9.2 8-11 14 0.4? 81 3.56 1036
1746−2851 G0.0+0.0 8.5 8 100? 0.8? 18 1.20 1037
G0.3+0.0 8.5 12 22 0.6 55 1.20 1037
1800−2338 G6.4−0.1 1.6–4.2 13 310 varies 6 4.04 1035
1824−1514 G16.8−1.1 1.48 ** 2? ? 186 5.42 1034
1837−0423 G27.8+0.6 2 14 30 varies 44 3.40 1034
1856+0114 G34.7−0.4 2.5 15 230 0.30 7 4.14 1035
1903+0550 G39.2−0.3 7.7-9.6 15 18 0.6 68 2.12 1036
2016+3657 G74.9+1.2 10 15 9 varies 104 2.75 1036
2020+4017 G78.2+2.1 1.7 16 340 0.5 5 3.20 1035
1. Anderson et al. (1996) 2. Fesen (1984) 3. Jaffe et al. (1997) and Hensberge et al. (2000) 4. Ruiz & May (1986)
5. Kaspi et al. (1997) 6. Caswell & Barnes (1985), Case & Bhattacharya (1999) 7. Koralesky et al. (1998) 8. Green
et al. (1997), see also Reynoso & Mangum (2000) 9. Slane et al. (1999) 10. Bamba et al. (2000) 11. Uchida, Morris
& Yusef-Zadeh (1992) 12. Kassim & Frail (1996) 13. Frail et al. (1993) and Clark & Caswell (1976) 14. Reich,
Furst & Sofue (1984) 15. Green (2000) and Caswell et al. (1975) 16. Lozinskaya et al. (2000) * From the Σ − D
relationship presented by Case & Bhattacharya (1998) ** Distance assumed equal to a coincident OB association,
Romero, Benaglia & Torres (1999).
17
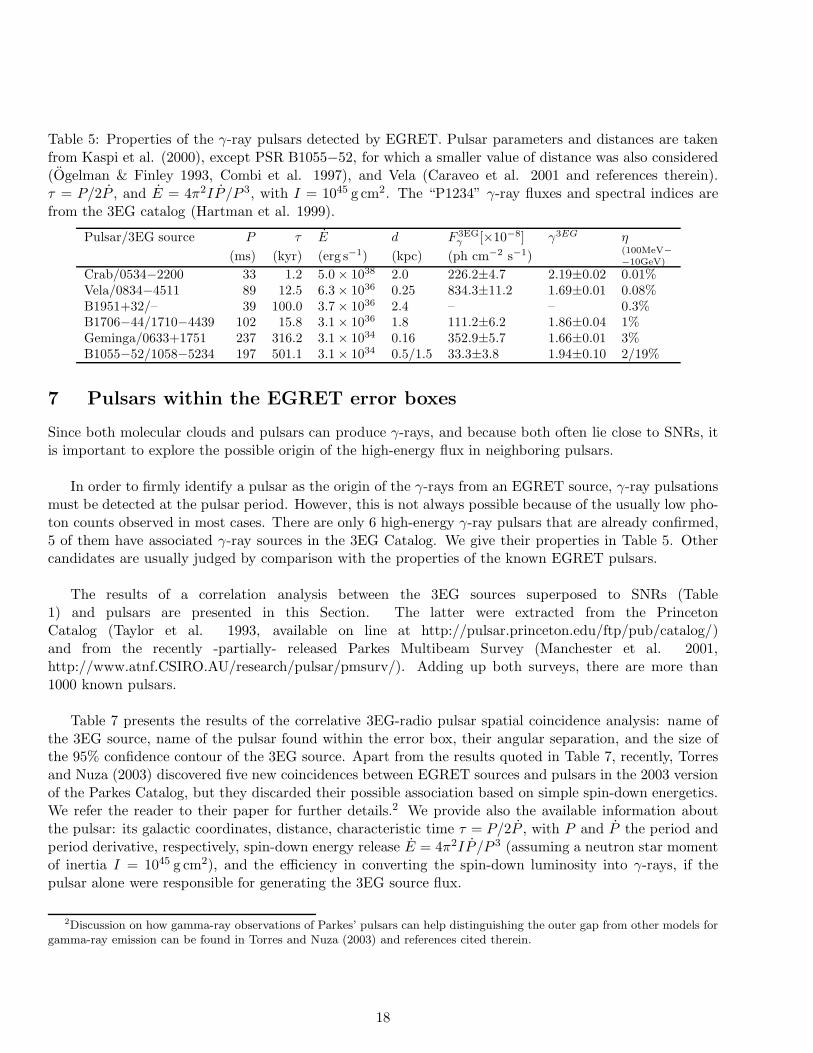
Table 5: Properties of the γ-ray pulsars detected by EGRET. Pulsar parameters and distances are takenfrom Kaspi et al. (2000), except PSR B1055−52, for which a smaller value of distance was also considered(Ogelman & Finley 1993, Combi et al. 1997), and Vela (Caraveo et al. 2001 and references therein).τ = P/2P , and E = 4π2IP /P 3, with I = 1045 g cm2. The “P1234” γ-ray fluxes and spectral indices arefrom the 3EG catalog (Hartman et al. 1999).
Pulsar/3EG source P τ E d F 3EGγ [×10−8] γ3EG η
(ms) (kyr) (erg s−1) (kpc) (ph cm−2 s−1)(100MeV−
−10GeV)
Crab/0534−2200 33 1.2 5.0 × 1038 2.0 226.2±4.7 2.19±0.02 0.01%Vela/0834−4511 89 12.5 6.3 × 1036 0.25 834.3±11.2 1.69±0.01 0.08%B1951+32/– 39 100.0 3.7 × 1036 2.4 – – 0.3%B1706−44/1710−4439 102 15.8 3.1 × 1036 1.8 111.2±6.2 1.86±0.04 1%Geminga/0633+1751 237 316.2 3.1 × 1034 0.16 352.9±5.7 1.66±0.01 3%B1055−52/1058−5234 197 501.1 3.1 × 1034 0.5/1.5 33.3±3.8 1.94±0.10 2/19%
7 Pulsars within the EGRET error boxes
Since both molecular clouds and pulsars can produce γ-rays, and because both often lie close to SNRs, itis important to explore the possible origin of the high-energy flux in neighboring pulsars.
In order to firmly identify a pulsar as the origin of the γ-rays from an EGRET source, γ-ray pulsationsmust be detected at the pulsar period. However, this is not always possible because of the usually low pho-ton counts observed in most cases. There are only 6 high-energy γ-ray pulsars that are already confirmed,5 of them have associated γ-ray sources in the 3EG Catalog. We give their properties in Table 5. Othercandidates are usually judged by comparison with the properties of the known EGRET pulsars.
The results of a correlation analysis between the 3EG sources superposed to SNRs (Table1) and pulsars are presented in this Section. The latter were extracted from the PrincetonCatalog (Taylor et al. 1993, available on line at http://pulsar.princeton.edu/ftp/pub/catalog/)and from the recently -partially- released Parkes Multibeam Survey (Manchester et al. 2001,http://www.atnf.CSIRO.AU/research/pulsar/pmsurv/). Adding up both surveys, there are more than1000 known pulsars.
Table 7 presents the results of the correlative 3EG-radio pulsar spatial coincidence analysis: name ofthe 3EG source, name of the pulsar found within the error box, their angular separation, and the size ofthe 95% confidence contour of the 3EG source. Apart from the results quoted in Table 7, recently, Torresand Nuza (2003) discovered five new coincidences between EGRET sources and pulsars in the 2003 versionof the Parkes Catalog, but they discarded their possible association based on simple spin-down energetics.We refer the reader to their paper for further details.2 We provide also the available information aboutthe pulsar: its galactic coordinates, distance, characteristic time τ = P/2P , with P and P the period andperiod derivative, respectively, spin-down energy release E = 4π2IP /P 3 (assuming a neutron star momentof inertia I = 1045 g cm2), and the efficiency in converting the spin-down luminosity into γ-rays, if thepulsar alone were responsible for generating the 3EG source flux.
2Discussion on how gamma-ray observations of Parkes’ pulsars can help distinguishing the outer gap from other models forgamma-ray emission can be found in Torres and Nuza (2003) and references cited therein.
18
The γ-ray efficiency was estimated as
η ≡ Lγ/E = f4πd2Fγ/E, (37)
where Fγ is the observed γ-ray flux between 100 MeV and 10 GeV, and f is the γ-ray beaming fraction(0 < f ≤ 1). This fraction is essentially unknown (see, e.g., Yadigaroglu & Romani 1995, Romero 1998),but it is common practice to assume f ≡ 1/4π (e.g. Thompson 2001, Kaspi et al. 2000, D’Amico et al.2001, Torres et al. 2001d). These efficiencies are uncertain also because they suffer (quadratically) theimprecise knowledge of the distance to the pulsar.
For the confirmed γ-ray pulsars, the observed efficiencies are in the range η ∈ (∼ 0.01%,∼ 3–19%),where the interval of upper limits is caused by the different estimates of the distance to PSR B1055−52(see Ogelman & Finley 1993, Combi et al. 1997, Romero 1998). It could be considered reasonable that apulsar generates γ-rays with efficiencies in the range η ∈ (∼ 0.01%,∼ 10%). For higher values the pulsarwould be too close to the so-called death line, where the high-energy emission is quenched (Usov 1994).
Two of the pulsars in Table (7), PSR J1800-2343 and PSR J1902+0615, lack a confident determinationof the period Derivative; for these it is impossible to assess their expected efficiencies. Based on the re-quired efficiencies and derived spin-down luminosities of the other members of the group shown in the first(Princeton) panel, none of the positional associations seem likely except that between 3EG 1856+0114 andPSR J1856+0113. For this case, the pulsar should have an efficiency of 13% in converting rotational energyinto γ-rays. PSR J1856+0113 was already mentioned as possibly associated with the EGRET source byde Jager & Mastichiadis (1996).
The bottom panel of Table (7) contains data that were analyzed elsewhere (Torres et al. 2001d, D’Amicoet al. 2001, Camilo et al. 2001); here are the main conclusions. 1. The physical association between 3EGJ1013-5915 and PSR J1016-5857 is possible, as first noted by Camilo et al. (2001). 2. The source 3EGJ1410-6147 and either PSR J1412-6145 or J1413-6141 might be physically associated if either of the latterlie closer than their dispersion measure distances, say at the estimated distance to G312.4-0.4 (2-3 kpc). 3.The pulsar PSR J1637-4642 could contribute part of the high-energy budget of the source 3EG J1639-4702.In addition to this, the pulsars J1015-5719, J1420-6048 and J1837-0604 are also possible counterparts fortheir respective EGRET sources.
8 Variability
Ift SNRs, molecular clouds, or pulsars are responsible for some EGRET sources, we would expect themto be non-variable on the time scale of EGRET observations, i.e. from weeks to a few years. Hence,variability analysis of the γ-ray emission is an important tool to test the original hypothesis, in the sensethat variable sources could be ruled out as being produced by SNRs (or pulsars).
Three variability indices for EGRET sources have been introduced in the literature so far. The first ofthem, dubbed V , was presented by MacLauglin et al. (1996), who computed it for the sources contained inthe Second EGRET Catalog. This method was later used, also, for short timescale studies by Wallace et al.(2000, 2002). The basic idea behind V is to find χ2 from the measured fluxes, and to compute V = − log Q,where Q is the probability of obtaining such a χ2 if the source were constant. Several critiques have beenmentioned concerning this procedure, among them, that the scheme gets complicated when the fluxes arejust upper limit detections. It can be shown that sources which have upper limits included in the analysiswill have a lower V than what is implied by the data (Tompkins 1999). In addition, a source can have
19

Table 6: Positional coincidences between 3EG unidentified sources superposed to SNRs and pulsars in thePrinceton Catalog and in the recently -partially- released Parkes Multibeam Survey. We show measuredand derived pulsar parameters as well. See text for details. In the case of 3EG J1410-6147, second andthird values of efficiency are given for two different estimates of the distance to G312.4-0.4, 1.9 kpc and 3.1kpc, respectively. All efficiencies are based on the new data of the 3EG Catalog (Hartman et al. 1999).
3EG J PSR J ∆θ θ (l, b) d τ P P E η (%)deg deg deg kpc kyr ms 10−15 erg s−1 (beamed)
Princeton1013−5915 1012−5857 0.29 0.72 283.7,−2.1 10.1 741 820 17.69 1.2 ×1033 > 1001639−4702 1640−4715 0.29 0.56 337.7,−0.4 7.2 188 518 42.02 1.3 ×1034 ≫ 1001800−2338 1800−2343 0.12 0.32 6.1,−0.1 4.8 – 1030 – – –1824−1514 1825−1446 0.46 0.52 16.8,−1.0 5.4 195 279 22.68 4.1 ×1034 > 1001837−0423 1836−0436 0.28 0.52 27.1,1.1 4.6 33 354 1.66 1.5 ×1033 ≫ 1001856+0114 1856+0113 0.05 0.19 34.5,−0.5 3.3 10 267 208.408 4.3 ×1035 131903+0550 1902+0556 0.26 0.64 39.5,0.2 3.9 912 746 12.896 1.2 ×1033 ≫ 100
1902+0615 0.48 – 39.8,0.3 10.1 – 673 – – –Parkes1013−5915 1016−5857 0.16 0.72 284.1,−1.9 3.0 21 107 0.806 2.6 × 1036 0.5
1013−5934 0.31 – 284.1,−2.6 11.3 12561 442 0.557 2.5 × 1032 ≫1001014−5705 1015−5719 0.30 0.67 283.69,−0.58 4.9 39 140 57.4 8.2 ×1035 51410−6147 1412−6145 0.15 0.36 312.3,−0.3 9.3 50 315 98.7 1.2 × 1035 > 100/12/301420−6038 1420−6048 0.16 0.33 313.54,+0.23 8 13 68.2 82.85 1.0×1037 2
1413−6141 0.28 0.36 312.4,−0.3 11.0 13 286 333.4 5.7 × 1035 80/3/61639−4702 1637−4642 0.46 0.56 337.8,+0.3 5.8 41 154 59.2 6.4 × 1035 12
1640−4648 0.37 – 338.1,−0.2 6.1 3501 178 0.806 5.6 × 1033 ≫1001637−4721 0.45 – 337.3,−0.1 5.9 4160 1165 4.44 1.1 × 1032 ≫ 100
1714−3857 1713−3844 0.30 0.51 348.1,0.2 6.5 143 1600 177.41 1.7 × 1033 ≫ 1001715−3903 0.23 – 348.1,−0.3 4.8 117 278 37.688 6.9 × 1034 72
1837−0423 1838−0453 0.50 0.52 27.1,+0.7 8.2 52 381 115.7 8.3 × 1034 < 551837−0606 1837−0559 0.14 0.19 26.0,+0.38 5.0 1045 201.0 3.304 1.5×1034 > 100
1837−0604 0.16 – 25.96,+0.27 6.2 34 96.3 45.170 2.0×1036 7
a large value of V because of intrinsic reasons or because of small error bars in the flux measurements.Similarly, a small value of V can imply a constant flux or big error bars. Each value of V is obtaineddisregarding those of a control population. Then, there could be pulsars with very high values of V , orvariable AGNs with very low ones. Hence, the use of V to classify the variability of γ-ray sources seems notto produce confident results. Two other indices have been computed for all γ-ray sources: the I index andthe τ index (Torres et al. 2001a; Tompkins 1999, respectively). See Torres et al. (2001c) for a comparisonamong the results obtained with them. The idea behind the index I is to carry out a direct comparison ofthe flux variation of any given source with that shown by pulsars, which is considered as instrumental. Itbasically establishes how variable a source is with respect to the pulsar population. Contrary to Tompkins’index, the I-scheme uses only the publicly available data of the 3EG Catalog, and is defined as follows.Firstly, a mean weighted value for the EGRET flux is computed as
〈F 〉 =
Nvp∑
i=1
F (i)
ǫ(i)2
×
Nvp∑
i=1
1
ǫ(i)2
−1
. (38)
20
Here Nvp is the number of single viewing periods for each γ-ray source, F (i) is the observed flux in theith-period, whereas ǫ(i) is the corresponding error in the observed flux. These data are taken directly fromthe 3EG Catalog. A fluctuation index, µ, is defined as (e.g. Romero et al. 1994): µ = 100 × σsd × 〈F 〉−1 ,where σsd is the standard deviation of the flux measurements. This fluctuation index is also computed forthe confirmed γ-ray pulsars in the 3EG Catalog, and then the averaged statistical index of variability, I,is introduced by I = µsource/ < µ >pulsars. We refer the reader to the work by Torres et al. (2001a,c) fordetails on the error estimates.
Since the I-scheme is a relative classification, a result like I = 3.0 says that the flux evolution isthree times more variable than (equivalently, 4σ above) the mean flux evolution for pulsars. Torres et al.(2001c) mentioned that in order to get more reliable results under the I-scheme at low-latitudes it seemssafer to consider a restrictive criterion. For instance, a source will be considered very variable only whenI−δI > [Ip]+3σp,I . Here δI ∼ 0.5I, [Ip] is the mean value of I for pulsars, σp,I is their standard deviation,and [Ip]+3σp,I = 2.5. Rephrasing the previous constraints just in terms of I, a source will be very variableif I > 5. This represents a deviation of 8σ from the mean I-value for pulsars. With this criterion, 3EGJ1837-0423, with I = 5.41, is a very variable source. We have 7 non-variable sources, those having I < 1.7in Table 1. The rest of the sources listed there are dubious under this classification scheme.
Tompkins (1999) used the 145 marginal sources that were detected but not included in the final official3EG list, and, simultaneously, all the detections within 25 deg of the source of interest. The maximumlikelihood set of source fluxes was then re-computed. From these fluxes, a new statistic measuring thevariability was defined as τ = σ/µ, where σ is the standard deviation of the fluxes and µ their averagevalue. The final result of Tompkins’ analysis is a table listing the name of the EGRET source and threevalues for τ : a mean, a lower, and an upper limit (68% error bars).
The mean value of τ for pulsars -again an assumed non-variable population- is very low, 0.09, but themean of the upper limits is ∼ 0.2. So pulsars are consistent with having values of τ up to 0.2. The deviationfor the mean value of pulsars is 0.08. A source will be likely variable under the τ scheme when the lowerlimit is at least 0.6, 3σ above the mean value of the τ upper limit for pulsars. A source will be considerednon-variable when the upper limit for τ is below that threshold. Sources not fulfilling either classificationwill be considered as dubious. This is also consistent with the fact that the mean τ value for the knownpopulation of AGNs is 0.9. Using this scheme, too, 3EG J1837-0423 is a variable source. In addition,3EG J0631+0642 and 3EG J0634+0521 are also variable under τ . However, Tompkins (1999) adds a wordof caution for these two sources: the fitted flux for them is zero. Such sources are most likely variable,but unknown instrument systematics or numerical problems within the τ scheme could conceivable changethese results. Also important is to note that many sources have a dubious classification: within the 68%error bars on τ , they can be as variable as an AGN, or as non-variable as a pulsar. This is, unfortunately,a common situation for many of the sources. For those ones, in particular, the I-index scheme can providesome additional information.
Based on the variability of the γ-ray flux, then, it is highly unlikely that 3EG J1837-0423 is caused bySNR G27.8+0.6, or by the pulsars PSR J1836-0436 (from Princeton Catalog) and PSR J1838-0453 (fromParkes Catalog). In addition, the spectral index for this 3EG source is very steep, possibly arguing againstthe pulsar hypothesis (Fierro et al. 1993), although it should be noted that Halpern et al. (2001) haverecently presented a strong argument for the association of PSR J2229+6114 with 3EG J2227+6122, whicha relatively soft index of 2.24± 0.14.
Out of 19 sources in Table 1, 12 have the same classification under the two schemes; in Table 2, 6
21
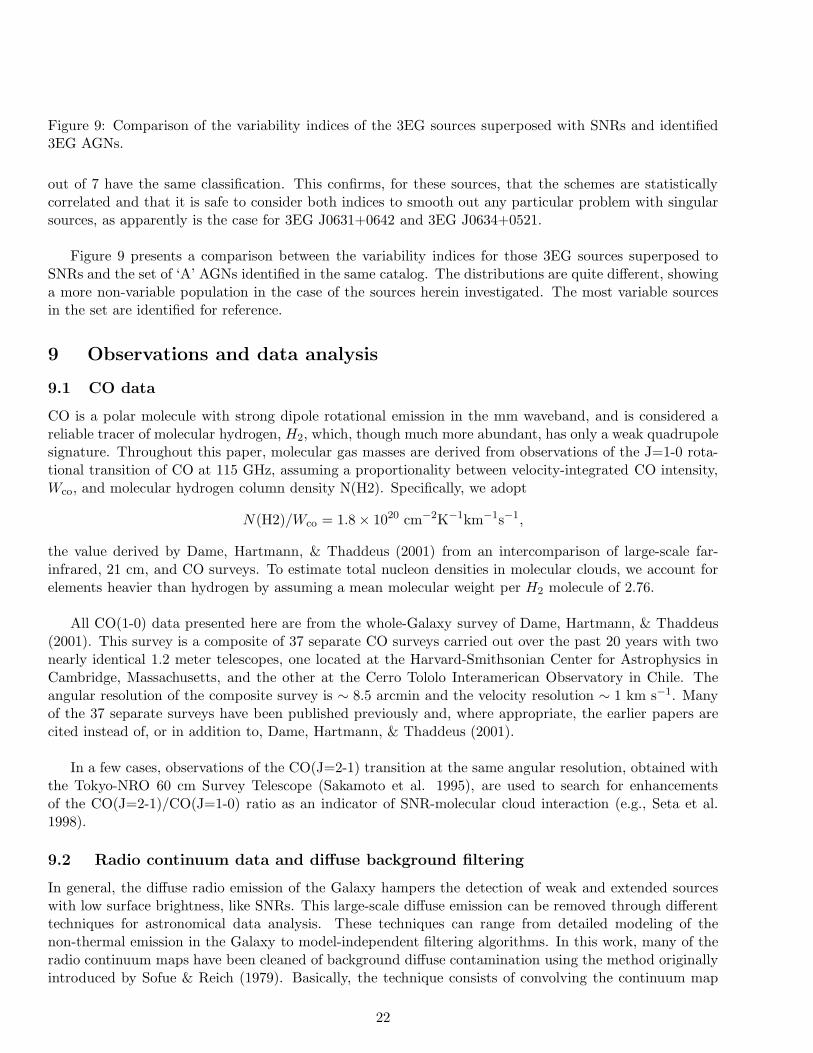
Figure 9: Comparison of the variability indices of the 3EG sources superposed with SNRs and identified3EG AGNs.
out of 7 have the same classification. This confirms, for these sources, that the schemes are statisticallycorrelated and that it is safe to consider both indices to smooth out any particular problem with singularsources, as apparently is the case for 3EG J0631+0642 and 3EG J0634+0521.
Figure 9 presents a comparison between the variability indices for those 3EG sources superposed toSNRs and the set of ‘A’ AGNs identified in the same catalog. The distributions are quite different, showinga more non-variable population in the case of the sources herein investigated. The most variable sourcesin the set are identified for reference.
9 Observations and data analysis
9.1 CO data
CO is a polar molecule with strong dipole rotational emission in the mm waveband, and is considered areliable tracer of molecular hydrogen, H2, which, though much more abundant, has only a weak quadrupolesignature. Throughout this paper, molecular gas masses are derived from observations of the J=1-0 rota-tional transition of CO at 115 GHz, assuming a proportionality between velocity-integrated CO intensity,Wco, and molecular hydrogen column density N(H2). Specifically, we adopt
N(H2)/Wco = 1.8 × 1020 cm−2K−1km−1s−1,
the value derived by Dame, Hartmann, & Thaddeus (2001) from an intercomparison of large-scale far-infrared, 21 cm, and CO surveys. To estimate total nucleon densities in molecular clouds, we account forelements heavier than hydrogen by assuming a mean molecular weight per H2 molecule of 2.76.
All CO(1-0) data presented here are from the whole-Galaxy survey of Dame, Hartmann, & Thaddeus(2001). This survey is a composite of 37 separate CO surveys carried out over the past 20 years with twonearly identical 1.2 meter telescopes, one located at the Harvard-Smithsonian Center for Astrophysics inCambridge, Massachusetts, and the other at the Cerro Tololo Interamerican Observatory in Chile. Theangular resolution of the composite survey is ∼ 8.5 arcmin and the velocity resolution ∼ 1 km s−1. Manyof the 37 separate surveys have been published previously and, where appropriate, the earlier papers arecited instead of, or in addition to, Dame, Hartmann, & Thaddeus (2001).
In a few cases, observations of the CO(J=2-1) transition at the same angular resolution, obtained withthe Tokyo-NRO 60 cm Survey Telescope (Sakamoto et al. 1995), are used to search for enhancementsof the CO(J=2-1)/CO(J=1-0) ratio as an indicator of SNR-molecular cloud interaction (e.g., Seta et al.1998).
9.2 Radio continuum data and diffuse background filtering
In general, the diffuse radio emission of the Galaxy hampers the detection of weak and extended sourceswith low surface brightness, like SNRs. This large-scale diffuse emission can be removed through differenttechniques for astronomical data analysis. These techniques can range from detailed modeling of thenon-thermal emission in the Galaxy to model-independent filtering algorithms. In this work, many of theradio continuum maps have been cleaned of background diffuse contamination using the method originallyintroduced by Sofue & Reich (1979). Basically, the technique consists of convolving the continuum map
22

Figure 10: CO distribution around the remnant IC443 (G189.1+3.0). The 3EG γ-ray source J0617+2238is superposed. Note the positional coincidence of the contours of the latter with part of the most denseregions of the CO distribution. The optical boundary of the SNR is superposed as a black contour. Theoptical emission seems to fade in regions where CO emission increases, this indicates that the molecularmaterial is likely located on the forground side of the remnant, absorbing the optical radiation. Opticalcontours are from Lasker et al. (1990).
with a Gaussian filtering beam, producing a new map with a different brightness temperature T 10 . A new
temperature distribution is computed as T ′10 = T − ∆T 1, for ∆T 1 > 0 and T ′1
0 = T for ∆T 1 < 0. In theseexpressions, T is the temperature distribution of the original map, and ∆T 1 = T − T 1
0 are the residualsbetween the original and the convolved maps. The procedure is repeated, now convolving the T ′1
0 map inorder to obtain T 2
0 , ∆T 2 and finally T ′20 . After n iterations, the difference |T n
0 − T n−10 | becomes smaller
than the rms noise, and a map of residuals ∆T n = T − T n0 is obtained where all diffuse emission with
size scales larger than the original filtering beam has been removed. The result is completely independentof the original mechanism that produced the large-scale emission. In the following sections we apply thistechnique to Effelsberg 100m-telescope data and to the MOST Galactic plane survey in order to get imagesof the SNRs as clean as possible at low galactic latitudes.
10 Case by case analysis
10.1 γ-ray source 3EG J0542+2610 – SNR G180.0-1.7
The possible counterparts of this γ-ray source were explored in detail in a recent paper (Romero et al. 2001).No known radio pulsar coincides with this source (see Table 3). Additionally, a radio-quiet Geminga-likepulsar origin is disfavored a priori because of the high variability and the steep spectral index that thissource presents (Γ = 2.67 ± 0.22, Hartman et al. 1999). We have searched the EGRET location error boxfor other compact radio sources. Although 29 point-like radio sources were detected, none of them is strongenough to be considered a likely counterpart (Romero et al. 2001). The strongest of the sources detectedhave a radio flux one order of magnitude less than those presented by known γ-ray blazars detected byEGRET. Moreover, the absence of an X-ray counterpart to this source suggest that it is not an accretingsource, like a microquasar.
Some of us suggested that the only object within the 95% error box capable of producing the requiredγ-ray flux is the X-ray transient A0535+26. This Be/accreting pulsar, not detected at all in the radioband, can produce variable hadronic γ-ray emission through the mechanism originally proposed by Cheng& Ruderman (1989, 1991). See Romero et al. (2001) for further details.
On the basis of results discussed in that paper we conclude that 3EG J0542+2610 and G180.0-1.7are most likely unrelated. An interesting comparison between this case and one of the EGRET sourcescoincident with the Monoceros Loop is made below.
10.2 γ-ray source 3EG J0617+2238 – SNR G189.1+3.0 (IC443)
A detailed description of SNR IC433 was given by Chevalier (1999). We have recently reviewed thespatially-resolved multiwavelength spectrum of IC443 and argued that the morphology and spectrum of
23

Figure 11: Hard energy band (3–10 keV) of the IC443 nebula. Most of the thermal emission associatedwith IC443 is not present in this band. The image shows several point sources, besides the plerion nebulaitself. The nebula can be represented by an ellipse of 8 arcmin × 5 arcmin. The 95% confidence EGRETerror circle for 3EG J0617+2238 is also shown. From Bocchino & Bykov (2001).
the γ-ray emission make it a likely hadronic cosmic-ray accelerator (Butt et al. 2002b.
Seta et al.(1998) have provided an analysis of the CO environment of this remnant. They concluded,as was previously reported by Scoville et al. (1977) and Cornett et al. (1977), that IC433 is interactingwith several ambient molecular clouds with a total mass of about 104M⊙. They also analyzed the ratioR=CO(J=2-1)/(J=1-0) in the environs of IC443 and concluded that parts of the clouds presented an ab-normally high value, consistent with shock interaction. The detected value of R exceeds 3 (the averagegalactic value is ∼ 0.6) in some regions. Interestingly, the peak of the CO(J=2-1)/(J=1-0) ratio is coin-cident with the location of the newly discovered pulsar wind nebula by Olbert et al. (2001), which mayindicate an alternate way of exciting molecular gas. Dickman et al. (1992) has estimated that the totalperturbed molecular gas has a mass of 500–2000 M⊙.
In recent years, X-ray observations of IC443 have been carried out. IC443 was a target for X-rayobservations with HEAO 1 (Petre et al. 1988), Ginga (Wang et al. 1992), ROSAT (Asaoka & Aschenbach1994), ASCA (Keohane et al. 1997), and more recently, with Chandra and Beppo-SAX; we discuss thelatter in more detail below. IC443 was believed to be mostly thermal in the X-ray band (Petre et al.1988, Asaoka & Aschenbach 1994), although it has been discovered to emit hard X-ray emission (Wanget al. 1992). Keohane et al. (1997) later found that the hard X-ray emission was localized and non-thermal. They concluded that most of the 2–10 keV photons came from an isolated emitting featureand from the South East elongated ridge of hard emission. Even more recently, Preite Martınez et al.(1999) and Bocchino & Bykov (2000) reported a hard component detected with the Phoswich DetectorSystem (PDS) on BeppoSAX and two compact X-ray sources corresponding to the ASCA sources detectedwith the BeppoSAX Medium-Energy Concentrator Spectrometer (MECS) (1SAX J0617.1+2221 and 1SAXJ0618.0+2227). 1SAX J0617.1+2221 has also been observed with the Chandra satellite by Olbert et al.2001, who also obtained VLA observations at 1.46, 4.86 and 8.46 GHz and a polarization measurement.The hard radio spectral index, the amount of polarization, and the overall X-ray and radio morphology ledthem to suggest that the source is a plerion nebula containing a point source whose characteristic cometaryshape is due to supersonic motion of the neutron star. Bocchino & Bykov (2001) have, in addition, recentlyobserved IC443 with XMM-Newton Observatory (see Figure 11). They resolve the structure of the nebulainto a compact core with a hard spectrum of photon index γ = 1.63+0.11
−0.10 in the 2–10 keV energy range,and found that the nebula also has an extended (∼ 8 arcmin ×5 arcmin) X-ray halo, much larger than theradio emission extension. The photon index softens with distance from the centroid, a behavior also foundin other X-ray plerions such as 3C58 and G21.5-0.9. Bocchino & Bykov (2001) also looked for periodicsignals from the NS but found none with 99% confidence level in the 10−4 − 6.5 Hz range. Assuming thatLX/E ∼ 0.002, the spin-down luminosity of the central object results in E = 1.3 × 1036 erg s−1. If thepower-law spectrum of the nebula core region were extrapolated up to the GeV regime, it would provide aflux of 2.0 (0.4–15.2)×10−7 ph cm−2 s−1, which is consistent with the EGRET flux from the IC443 region(see Table 1). However, the fact that the nebula lies outside the 95% confidence circle of the source arguesagainst an association. Further, the EGRET source luminosity would require a substantial fraction of theestimated spin-down power.
24
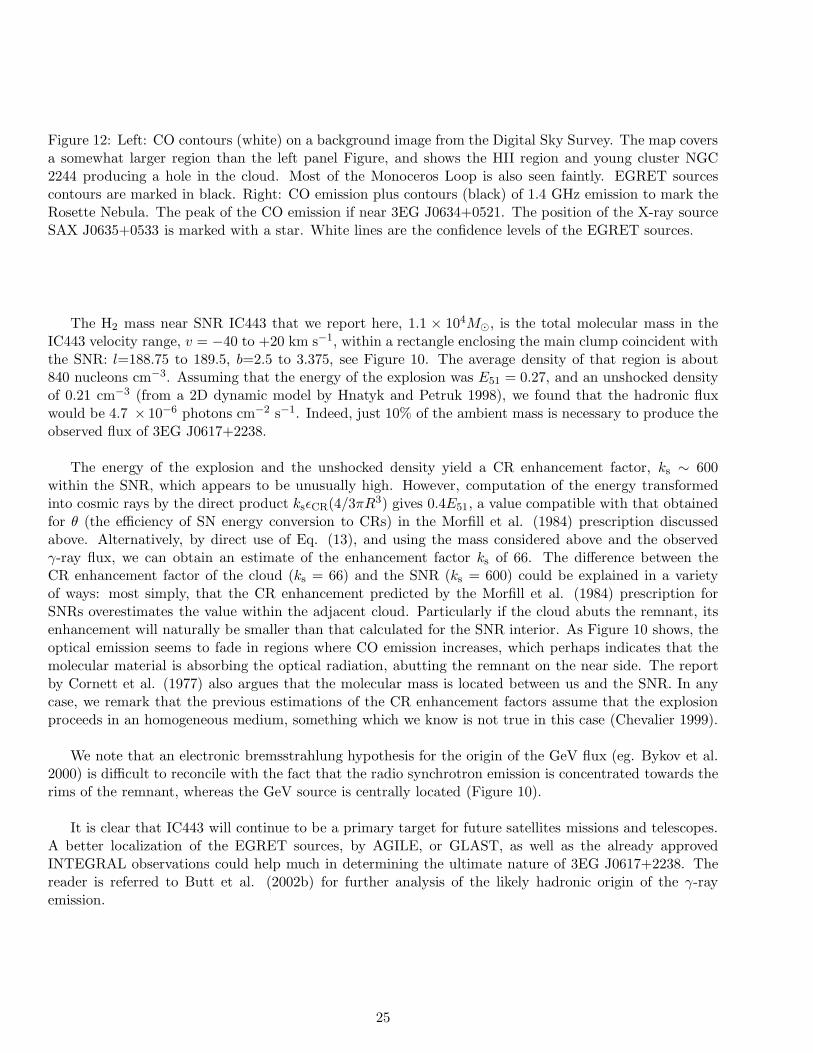
Figure 12: Left: CO contours (white) on a background image from the Digital Sky Survey. The map coversa somewhat larger region than the left panel Figure, and shows the HII region and young cluster NGC2244 producing a hole in the cloud. Most of the Monoceros Loop is also seen faintly. EGRET sourcescontours are marked in black. Right: CO emission plus contours (black) of 1.4 GHz emission to mark theRosette Nebula. The peak of the CO emission if near 3EG J0634+0521. The position of the X-ray sourceSAX J0635+0533 is marked with a star. White lines are the confidence levels of the EGRET sources.
The H2 mass near SNR IC443 that we report here, 1.1 × 10⁴M⊙, is the total molecular mass in theIC443 velocity range, v = −40 to +20 km s−1, within a rectangle enclosing the main clump coincident withthe SNR: l=188.75 to 189.5, b=2.5 to 3.375, see Figure 10. The average density of that region is about840 nucleons cm−3. Assuming that the energy of the explosion was E51 = 0.27, and an unshocked densityof 0.21 cm−3 (from a 2D dynamic model by Hnatyk and Petruk 1998), we found that the hadronic fluxwould be 4.7 × 10⁻⁶ photons cm−2 s−1. Indeed, just 10% of the ambient mass is necessary to produce theobserved flux of 3EG J0617+2238.
The energy of the explosion and the unshocked density yield a CR enhancement factor, ks ∼ 600within the SNR, which appears to be unusually high. However, computation of the energy transformedinto cosmic rays by the direct product ksǫCR(4/3πR3) gives 0.4E51, a value compatible with that obtainedfor θ (the efficiency of SN energy conversion to CRs) in the Morfill et al. (1984) prescription discussedabove. Alternatively, by direct use of Eq. (13), and using the mass considered above and the observedγ-ray flux, we can obtain an estimate of the enhancement factor ks of 66. The difference between theCR enhancement factor of the cloud (ks = 66) and the SNR (ks = 600) could be explained in a varietyof ways: most simply, that the CR enhancement predicted by the Morfill et al. (1984) prescription forSNRs overestimates the value within the adjacent cloud. Particularly if the cloud abuts the remnant, itsenhancement will naturally be smaller than that calculated for the SNR interior. As Figure 10 shows, theoptical emission seems to fade in regions where CO emission increases, which perhaps indicates that themolecular material is absorbing the optical radiation, abutting the remnant on the near side. The reportby Cornett et al. (1977) also argues that the molecular mass is located between us and the SNR. In anycase, we remark that the previous estimations of the CR enhancement factors assume that the explosionproceeds in an homogeneous medium, something which we know is not true in this case (Chevalier 1999).
We note that an electronic bremsstrahlung hypothesis for the origin of the GeV flux (eg. Bykov et al.2000) is difficult to reconcile with the fact that the radio synchrotron emission is concentrated towards therims of the remnant, whereas the GeV source is centrally located (Figure 10).
It is clear that IC443 will continue to be a primary target for future satellites missions and telescopes.A better localization of the EGRET sources, by AGILE, or GLAST, as well as the already approvedINTEGRAL observations could help much in determining the ultimate nature of 3EG J0617+2238. Thereader is referred to Butt et al. (2002b) for further analysis of the likely hadronic origin of the γ-rayemission.
25
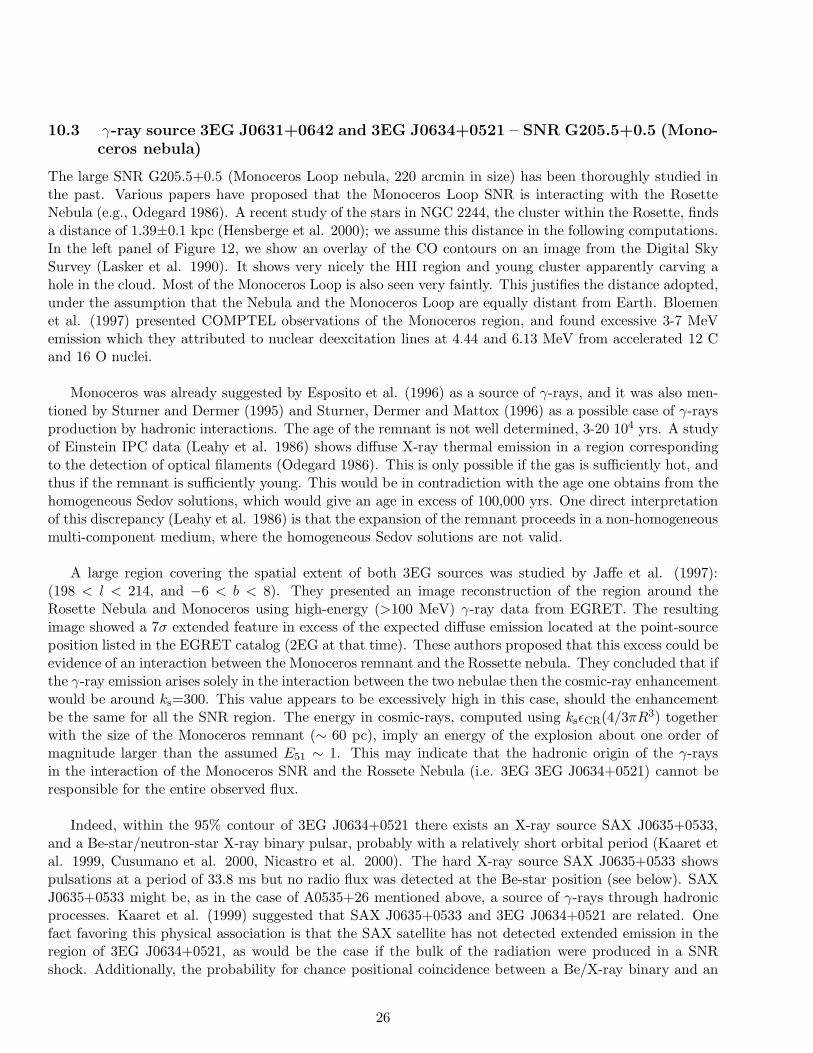
10.3 γ-ray source 3EG J0631+0642 and 3EG J0634+0521 – SNR G205.5+0.5 (Mono-ceros nebula)
The large SNR G205.5+0.5 (Monoceros Loop nebula, 220 arcmin in size) has been thoroughly studied inthe past. Various papers have proposed that the Monoceros Loop SNR is interacting with the RosetteNebula (e.g., Odegard 1986). A recent study of the stars in NGC 2244, the cluster within the Rosette, findsa distance of 1.39±0.1 kpc (Hensberge et al. 2000); we assume this distance in the following computations.In the left panel of Figure 12, we show an overlay of the CO contours on an image from the Digital SkySurvey (Lasker et al. 1990). It shows very nicely the HII region and young cluster apparently carving ahole in the cloud. Most of the Monoceros Loop is also seen very faintly. This justifies the distance adopted,under the assumption that the Nebula and the Monoceros Loop are equally distant from Earth. Bloemenet al. (1997) presented COMPTEL observations of the Monoceros region, and found excessive 3-7 MeVemission which they attributed to nuclear deexcitation lines at 4.44 and 6.13 MeV from accelerated 12 Cand 16 O nuclei.
Monoceros was already suggested by Esposito et al. (1996) as a source of γ-rays, and it was also men-tioned by Sturner and Dermer (1995) and Sturner, Dermer and Mattox (1996) as a possible case of γ-raysproduction by hadronic interactions. The age of the remnant is not well determined, 3-20 104 yrs. A studyof Einstein IPC data (Leahy et al. 1986) shows diffuse X-ray thermal emission in a region correspondingto the detection of optical filaments (Odegard 1986). This is only possible if the gas is sufficiently hot, andthus if the remnant is sufficiently young. This would be in contradiction with the age one obtains from thehomogeneous Sedov solutions, which would give an age in excess of 100,000 yrs. One direct interpretationof this discrepancy (Leahy et al. 1986) is that the expansion of the remnant proceeds in a non-homogeneousmulti-component medium, where the homogeneous Sedov solutions are not valid.
A large region covering the spatial extent of both 3EG sources was studied by Jaffe et al. (1997):(198 < l < 214, and −6 < b < 8). They presented an image reconstruction of the region around theRosette Nebula and Monoceros using high-energy (>100 MeV) γ-ray data from EGRET. The resultingimage showed a 7σ extended feature in excess of the expected diffuse emission located at the point-sourceposition listed in the EGRET catalog (2EG at that time). These authors proposed that this excess could beevidence of an interaction between the Monoceros remnant and the Rossette nebula. They concluded that ifthe γ-ray emission arises solely in the interaction between the two nebulae then the cosmic-ray enhancementwould be around ks=300. This value appears to be excessively high in this case, should the enhancementbe the same for all the SNR region. The energy in cosmic-rays, computed using ksǫCR(4/3πR3) togetherwith the size of the Monoceros remnant (∼ 60 pc), imply an energy of the explosion about one order ofmagnitude larger than the assumed E51 ∼ 1. This may indicate that the hadronic origin of the γ-raysin the interaction of the Monoceros SNR and the Rossete Nebula (i.e. 3EG 3EG J0634+0521) cannot beresponsible for the entire observed flux.
Indeed, within the 95% contour of 3EG J0634+0521 there exists an X-ray source SAX J0635+0533,and a Be-star/neutron-star X-ray binary pulsar, probably with a relatively short orbital period (Kaaret etal. 1999, Cusumano et al. 2000, Nicastro et al. 2000). The hard X-ray source SAX J0635+0533 showspulsations at a period of 33.8 ms but no radio flux was detected at the Be-star position (see below). SAXJ0635+0533 might be, as in the case of A0535+26 mentioned above, a source of γ-rays through hadronicprocesses. Kaaret et al. (1999) suggested that SAX J0635+0533 and 3EG J0634+0521 are related. Onefact favoring this physical association is that the SAX satellite has not detected extended emission in theregion of 3EG J0634+0521, as would be the case if the bulk of the radiation were produced in a SNRshock. Additionally, the probability for chance positional coincidence between a Be/X-ray binary and an
26

EGRET source is less than 4% (Kaaret et al. 1999).
The situation, however, is far from resolved. The EGRET source, for instance, is non-variable as itwould be expected for a binary with eccentric orbit. Recent results reported by Kaaret et al. (2000),comparing observations obtained with BeppoSAX and RXTE separated in time by 2 years, showed thatthe period derivative of the pulsar has a lower bound equal to 3.8 ×10⁻¹³. This value is 30 times largerthan values found from accreting neutron stars (Bildsten et al. 1997), and it implies a mass accretion rateof 6 ×10⁻⁷M⊙ yr−1 (Kaaret et al. 2000, Bildsten et al. 1997), which far exceeds the expected mass cap-ture rate of a neutron star ∼ 10−11M⊙ yr−1, and is even slightly larger than the average mass loss rate ofBe-stars (Kaaret et al. 2000). Apparently, this would indicate that the X-ray luminosity does not originatein the accretion disk, and argues in favor of SAX J0635+0533 being a rotation powered pulsar. In thiscase, the value of P would imply a characteristic age of only 1400 years and a high spin-down luminosityof 5 × 1038 erg s−1, out of which less than 0.05% could make a noticeable contribution to the observedγ-ray flux (assuming a distance of 4 kpc, Kaaret et al. 1999). Additionally, arguing against an accretionorigin of the radiation, the derived X-ray luminosity (7.7 × 1034 (dkpc/4 kpc)2 erg s−1) and magnetic fieldstrength (∼ 109 G) are too low in comparison to other Be-X-ray binaries such as A0535+26 (Cusumanoet al. 2000).
Very recently, Monoceros was the target of the HEGRA Cerenkov telescopes (see Lucarelli et al. 2001).HEGRA observed the Monoceros-Rossete region for about 120 hours, with an energy threshold of 500GeV and an angular resolution of 0.1 deg, and mapped a 2 × 2 deg2 region centered in the source SAXJ0635+0533. The EGRET source 3EG J0634+0521 is also within the field of view. Although the fluxand spectrum have not yet been officially reported, HEGRA found a tentative excess of counts in fourdifferent pixels (0.2 × 0.2 deg2) within the 3EG contours; interestingly, none of them coinciding with SAXJ0635+0533 (Lucarelli et al. 2001). It is possible that TeV emission coming from the binary is beingre-absorbed in its neighborhood, as in the case studied by Romero et al. (2001).
What HEGRA observations seem to imply is that the marginally significant TeV radiation has anextended origin, different from that producing GeV photons in the binary system SAX J0635+0533, butthis remains to be confirmed.
In the right panel of Figure 12 we show the CO emission plus contours of 1.4 GHz continuum emissionmarking the Rosette. Using the standard CO-to-H2 mass conversion and a mean molecular weight perH2 molecular of 2.76, we calculate a total H2 mass for the associated cloud (in the region l = 205 to209, b = −3 to −1, and velocity range v = −5 to 30 km s−1) of 1.2 × 10⁵ M⊙. We have calculated themolecular masses in small rectangles enclosing the two 3EG sources near the Rosette. Using a distance of1.39 kpc we get the following results: In the case of 3EG J0634+0521 the region considered is l = 205.5to 206.875 and b = −2.125 to −0.375, and the mass is 2.0 ×10⁴ M⊙. For 3EG J0631+0643, in the regionl = 204.25 to 205.5 and b = −2.125 to −0.75, the mass is 4.7 ×10⁴ M⊙. In both cases, the velocity rangeconsidered is v = −5 to 30 km s−1 and the formal error on these masses, based on the instrumental noise,is ∼ 0.2 × 10³ M⊙.
Because of uncertainties on the nature of this SNR (for instance, the controversy on the SNR age) Mor-fill et al.’s method is unreliable for estimating the SNR GeV-flux. However, using directly Eq. (13) andthe observed flux (Table 1), we can estimate the value of ks needed to generate the observed flux, resultingin ks ∼ 6.5 for 3EG J0634+0521. Because of the high molecular density, just a modest enhancement of thecosmic-ray density can explain a substantial part of the detected γ-ray flux. We suggest, then, that 3EGJ0634+0521 might be a composite source: SAX J0635+0533 might be responsible for part of the GeV flux,
27
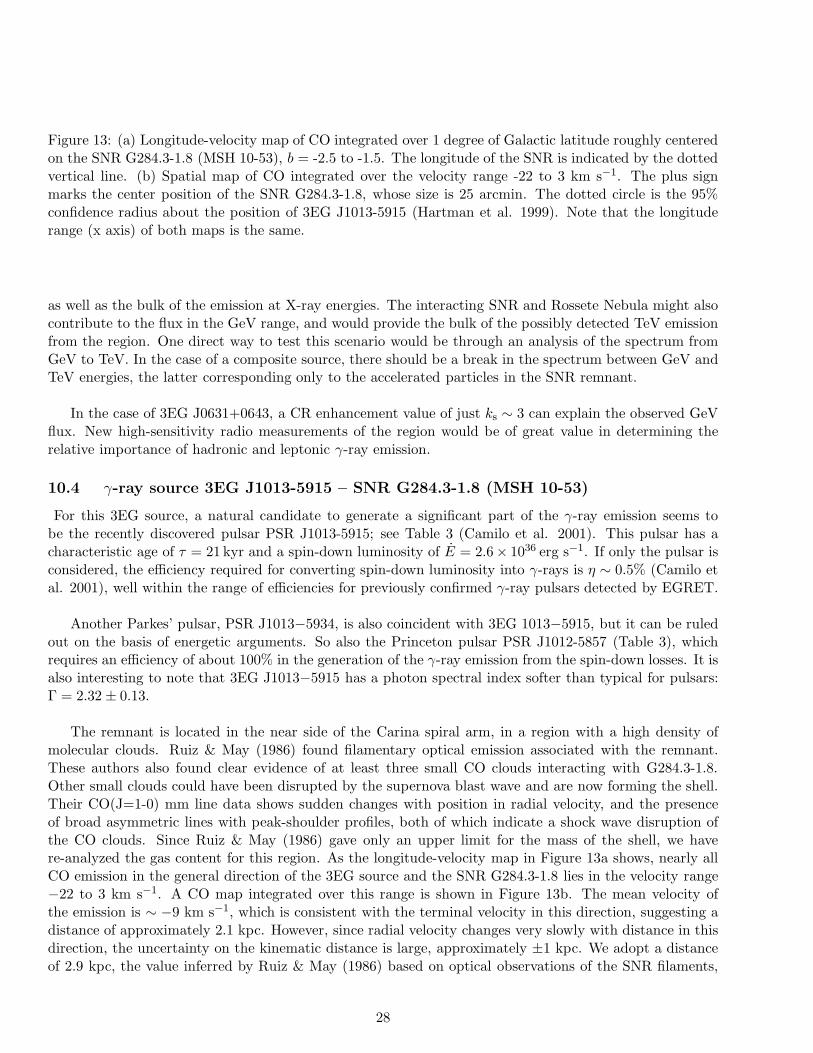
Figure 13: (a) Longitude-velocity map of CO integrated over 1 degree of Galactic latitude roughly centeredon the SNR G284.3-1.8 (MSH 10-53), b = -2.5 to -1.5. The longitude of the SNR is indicated by the dottedvertical line. (b) Spatial map of CO integrated over the velocity range -22 to 3 km s−1. The plus signmarks the center position of the SNR G284.3-1.8, whose size is 25 arcmin. The dotted circle is the 95%confidence radius about the position of 3EG J1013-5915 (Hartman et al. 1999). Note that the longituderange (x axis) of both maps is the same.
as well as the bulk of the emission at X-ray energies. The interacting SNR and Rossete Nebula might alsocontribute to the flux in the GeV range, and would provide the bulk of the possibly detected TeV emissionfrom the region. One direct way to test this scenario would be through an analysis of the spectrum fromGeV to TeV. In the case of a composite source, there should be a break in the spectrum between GeV andTeV energies, the latter corresponding only to the accelerated particles in the SNR remnant.
In the case of 3EG J0631+0643, a CR enhancement value of just ks ∼ 3 can explain the observed GeVflux. New high-sensitivity radio measurements of the region would be of great value in determining therelative importance of hadronic and leptonic γ-ray emission.
10.4 γ-ray source 3EG J1013-5915 – SNR G284.3-1.8 (MSH 10-53)
For this 3EG source, a natural candidate to generate a significant part of the γ-ray emission seems tobe the recently discovered pulsar PSR J1013-5915; see Table 3 (Camilo et al. 2001). This pulsar has acharacteristic age of τ = 21 kyr and a spin-down luminosity of E = 2.6× 1036 erg s−1. If only the pulsar isconsidered, the efficiency required for converting spin-down luminosity into γ-rays is η ∼ 0.5% (Camilo etal. 2001), well within the range of efficiencies for previously confirmed γ-ray pulsars detected by EGRET.
Another Parkes’ pulsar, PSR J1013−5934, is also coincident with 3EG 1013−5915, but it can be ruledout on the basis of energetic arguments. So also the Princeton pulsar PSR J1012-5857 (Table 3), whichrequires an efficiency of about 100% in the generation of the γ-ray emission from the spin-down losses. It isalso interesting to note that 3EG J1013−5915 has a photon spectral index softer than typical for pulsars:Γ = 2.32 ± 0.13.
The remnant is located in the near side of the Carina spiral arm, in a region with a high density ofmolecular clouds. Ruiz & May (1986) found filamentary optical emission associated with the remnant.These authors also found clear evidence of at least three small CO clouds interacting with G284.3-1.8.Other small clouds could have been disrupted by the supernova blast wave and are now forming the shell.Their CO(J=1-0) mm line data shows sudden changes with position in radial velocity, and the presenceof broad asymmetric lines with peak-shoulder profiles, both of which indicate a shock wave disruption ofthe CO clouds. Since Ruiz & May (1986) gave only an upper limit for the mass of the shell, we havere-analyzed the gas content for this region. As the longitude-velocity map in Figure 13a shows, nearly allCO emission in the general direction of the 3EG source and the SNR G284.3-1.8 lies in the velocity range−22 to 3 km s−1. A CO map integrated over this range is shown in Figure 13b. The mean velocity ofthe emission is ∼ −9 km s−1, which is consistent with the terminal velocity in this direction, suggesting adistance of approximately 2.1 kpc. However, since radial velocity changes very slowly with distance in thisdirection, the uncertainty on the kinematic distance is large, approximately ±1 kpc. We adopt a distanceof 2.9 kpc, the value inferred by Ruiz & May (1986) based on optical observations of the SNR filaments,
28
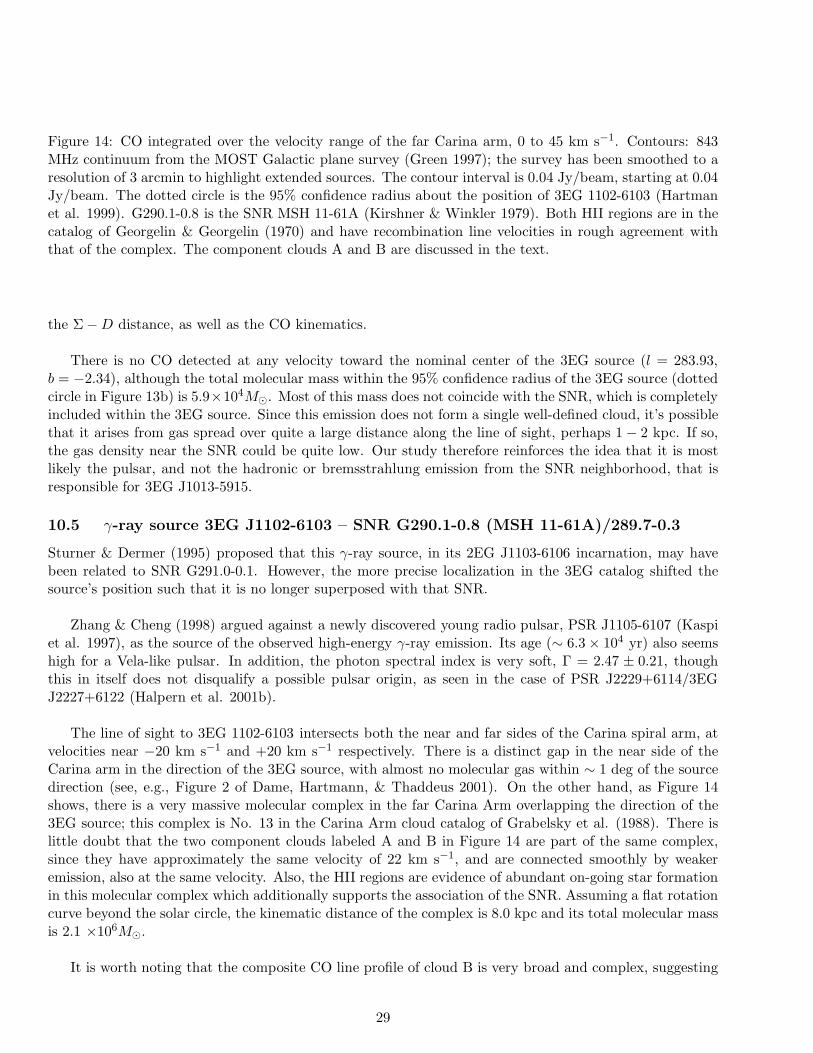
Figure 14: CO integrated over the velocity range of the far Carina arm, 0 to 45 km s−1. Contours: 843MHz continuum from the MOST Galactic plane survey (Green 1997); the survey has been smoothed to aresolution of 3 arcmin to highlight extended sources. The contour interval is 0.04 Jy/beam, starting at 0.04Jy/beam. The dotted circle is the 95% confidence radius about the position of 3EG 1102-6103 (Hartmanet al. 1999). G290.1-0.8 is the SNR MSH 11-61A (Kirshner & Winkler 1979). Both HII regions are in thecatalog of Georgelin & Georgelin (1970) and have recombination line velocities in rough agreement withthat of the complex. The component clouds A and B are discussed in the text.
the Σ − D distance, as well as the CO kinematics.
There is no CO detected at any velocity toward the nominal center of the 3EG source (l = 283.93,b = −2.34), although the total molecular mass within the 95% confidence radius of the 3EG source (dottedcircle in Figure 13b) is 5.9×10⁴M⊙. Most of this mass does not coincide with the SNR, which is completelyincluded within the 3EG source. Since this emission does not form a single well-defined cloud, it’s possiblethat it arises from gas spread over quite a large distance along the line of sight, perhaps 1 − 2 kpc. If so,the gas density near the SNR could be quite low. Our study therefore reinforces the idea that it is mostlikely the pulsar, and not the hadronic or bremsstrahlung emission from the SNR neighborhood, that isresponsible for 3EG J1013-5915.
10.5 γ-ray source 3EG J1102-6103 – SNR G290.1-0.8 (MSH 11-61A)/289.7-0.3
Sturner & Dermer (1995) proposed that this γ-ray source, in its 2EG J1103-6106 incarnation, may havebeen related to SNR G291.0-0.1. However, the more precise localization in the 3EG catalog shifted thesource’s position such that it is no longer superposed with that SNR.
Zhang & Cheng (1998) argued against a newly discovered young radio pulsar, PSR J1105-6107 (Kaspiet al. 1997), as the source of the observed high-energy γ-ray emission. Its age (∼ 6.3 × 10⁴ yr) also seemshigh for a Vela-like pulsar. In addition, the photon spectral index is very soft, Γ = 2.47 ± 0.21, thoughthis in itself does not disqualify a possible pulsar origin, as seen in the case of PSR J2229+6114/3EGJ2227+6122 (Halpern et al. 2001b).
The line of sight to 3EG 1102-6103 intersects both the near and far sides of the Carina spiral arm, atvelocities near −20 km s−1 and +20 km s−1 respectively. There is a distinct gap in the near side of theCarina arm in the direction of the 3EG source, with almost no molecular gas within ∼ 1 deg of the sourcedirection (see, e.g., Figure 2 of Dame, Hartmann, & Thaddeus 2001). On the other hand, as Figure 14shows, there is a very massive molecular complex in the far Carina Arm overlapping the direction of the3EG source; this complex is No. 13 in the Carina Arm cloud catalog of Grabelsky et al. (1988). There islittle doubt that the two component clouds labeled A and B in Figure 14 are part of the same complex,since they have approximately the same velocity of 22 km s−1, and are connected smoothly by weakeremission, also at the same velocity. Also, the HII regions are evidence of abundant on-going star formationin this molecular complex which additionally supports the association of the SNR. Assuming a flat rotationcurve beyond the solar circle, the kinematic distance of the complex is 8.0 kpc and its total molecular massis 2.1 ×10⁶M⊙.
It is worth noting that the composite CO line profile of cloud B is very broad and complex, suggesting
29
possible interaction with SNR G290.1-0.8. In the case of cloud A, its radius (∼48 pc) and compositelinewidth (17 km s−1 FWHM) are roughly consistent with the radius-linewidth relation found for largemolecular complexes by Dame et al. (1986). For cloud B, however, its linewidth (∼27 km s−1) is about afactor of 3 too large compared to its radius (∼28 pc). We can also see that the coinciding SNR G289.7-0.3is far from Cloud B, in a region of low molecular density. It is extremely unlikely that this SNR is relatedwith the 3EG source in question. The only remaining candidate is, then G290.1-0.8. The total molecularmass within the 95% confidence radius of the 3EG source (dotted circle in Figure 14) is 7.7 ×10⁵M⊙ andmost of it is localized in Cloud B (4.5 ×10⁵M⊙).
Assuming typical values for the energy of the explosion (E51=1) and the unshocked ambient density(n = 0.1cm−3) we obtain a CR enhancement factor of ∼ 250. Assuming that the same CR enhancementis applicable to the cloud overpredicts the EGRET flux by about a factor of 10. Thus, it is likely thatthe average CR enhancement factor within the cloud is ten times lower than within the SNR, a reason-able result. It is possible, then, that 3EG J1102-6103 and SNR G290.1-0.8 are indeed related. Notethat Bremsstrahlung, which we have neglected here, will contribute still more to the predicted flux fromSNR-cloud interactions. If the outlined scenario is correct, GLAST and AGILE ought to observe a strong,compact γ-ray source coincident with the position of Cloud B.
An alternative, and promising, hypothesis for explaining the high-energy emission is stellar windscollisions, as developed by Eichler & Usov (1993) and Benaglia & Romero (2003). Recently, Contreraset al. (1997) have provided convincing evidence for non-thermal radio emission from the colliding windsregion in the stellar system Cygnus OB2 No 5.3
The position of their radio-imaged shocked region is consistent with the inferred location of the contactdiscontinuity of the wind-wind interaction of the constituent stars. Benaglia et al. (2001) have argued thatthe source 3EG J2033+4118 could be mainly due to inverse Compton scattering of the stellar photons bythe locally accelerated electrons. Similarly, in the present case, 3EG J1102-6103 might be the result ofγ-ray production by the stellar winds of the early-type stars WR37, WR38, WR38B and WR39, all locatedwithin the 95% confidence contour of the γ-ray source and at 2 kpc from the Sun. In particular, WR39presents an unusually strong wind with a terminal velocity of about 3600 km s−1 (Romero et al. 1999a andreferences therein). Non-thermal radio emission at the mJy level has been recently detected at ∼3 arcsecfrom the optical position of the star by Chapman et al. (1999). This emission is a clear indication of theexistence of a population of relativistic electrons in the region. Chapman et al. (1999) have suggested thatparticle acceleration could be occurring at the region where the wind of WR39 collides with the wind of theneighboring Wolf-Rayet star WR38B. This hypothesis is supported by the fact that synchrotron radiationis located between both stars (2 arcsec from WR38B). The relativistic electrons should interact with UVphotons from the star, producing IC γ-rays that could explain part of the emission of 3EG J1102-6103.
Fortunately, the peak of the spectral energy distribution should be in the IBIS energy range, the Im-ager on-Board INTEGRAL. Using Benaglia et al.’s (2001) model with a spectral index of −2, we get anintegrated flux for the energy interval 100 keV - 200 keV of 1.2 × 10⁻⁴ ph s−1 cm−2. For the entire IBISenergy range (20 keV-10 MeV) the expected value is 1.2×10⁻³ ph s−1 cm−2. In addition to this wind-windcontribution, single stars might also be sources of γ-rays in the IBIS energy band through the IC emission
3The HEGRA Cherenkov telescope array group recently reported a steady and extended unidentified TeV gamma-raysource lying at the outskirts of Cygnus OB2, the most massive stellar association known in the Galaxy, estimated to contain2600 OB type members alone (Aharonian et al. 2002). Butt et al. (2003) reported on near-simultaneous follow-up observationsof the extended TeV source region with the CHANDRA X-ray Observatory and the Very Large Array (VLA) radio telescope.The broadband spectrum of the TeV source region favors a predominantly nucleonic rather than electronic origin of thehigh-energy flux, possibly in a way similar to that proposed by Romero and Torres (2003) in the case of NGC 253.
30

Figure 15: CO integrated over the velocity range of the Centaurus arm, -75 to -35 km s−1. Contours: 843MHz continuum from the MOST Galactic plane survey (Green et al. 1999); the survey has been smoothedto a resolution of 3’ to highlight extended sources. The contour interval is 0.01 Jy/beam, starting at 0.01Jy/beam. The dotted circle is the 95% confidence radius about the position of 3EG J1410-6147 (Hartmanet al. 1999). Many of the other radio sources in the map are unrelated HII regions discussed by Caswell& Barnes (1985).
of electrons locally accelerated in shocks at the base of the winds. These shocks are produced by line-driveninstabilities (see Chen & White 1991 for a discussion of γ-ray emission from single stars, and Benaglia etal. 2001 for a particular application).
Consequently, further study of the possible association of 3EG J1102-6103 with the SNR G290.1-0.8(MSH 11-61A) is of the utmost importance, since there are at least two scenarios (aside from the pulsarpossibility) that might well contribute to the observed γ-ray flux.
10.6 γ-ray source 3EG J1410-6147 – SNR G312.4-0.4
Although there is no correlated Princeton pulsar within the contours of 3EG J1410-6147, there are twoParkes pulsars near the γ-ray source (see Table 6 above). Both of them require an unreasonable efficiency,at their dispersion-measure distances, to explain the observed γ-ray flux. Both pulsars are located (atleast in projection) well within the boundaries of the incomplete shell of SNR G312.4−0.4 (Caswell &Barnes 1985), to which Yadigaroglu & Romani (1997) estimate a Σ−D distance of 1.9 kpc, whereas Case& Bhattacharya (1999) find 3.1±1.0 kpc. At either of these distances, the required efficiencies would besubstantially smaller. The photon spectral index of the γ-ray source, Γ = 2.12 ± 0.14, seems to be inthe range of other pulsar cases. More recently, Doherty et al. (2002) have provided important new HIabsorption measurements toward SNR G312.4-0.4 which indicate that it may be much further away, 8.1kpc (see below).
Case & Bhattacharya (1999) have made an in depth study of the possible association between the rem-nant and the γ-ray source and concluded that the γ-ray data alone cannot at present provide conclusiveevidence to decide whether the γ-ray emission from 2EG J1412-6211 is due to a pulsar or SNR-molecularcloud interaction, or both. They suggested that CO observations of the environment surrounding G312.4-0.4 would help in determining whether a molecular cloud of sufficient mass is present in the right locationto produce the observed γ-ray intensity. Such observations are presented here.
The CO emission toward 3EG 1410-6147 is extremely bright and complex, arising mainly from thetangent region of the Centaurus spiral arm at v < −30 km s−1. The line of sight also intersects the nearside of the Carina arm at less negative velocities and the far side of Carina at positive velocities. The cloudin the general direction of the 3EG source is also by far the most massive and dense. This cloud, with avelocity of −49 km s−1, is labeled A in Figure 15. The near and far kinematic distances of the cloud are3.3 kpc and 8.1 kpc respectively (Clemens 1985); we will adopt the far kinematic distance since it agreeswith the HI absorption measurements of Doherty et al. (2002) towards SNR G312.4-0.4.
The mass of Cloud A is quite uncertain owing to the fact that molecular gas in both the near and farsides of the Centaurus arm probably contribute to the CO emission at the cloud velocity; the high-velocity
31

Figure 16: Relative positions of 3EG J1639-4702 (which occupies all the box) and the SNRs G333.8-0.1,G338.1+0.4, and G338.3+0.0, which are very small in comparison. The superposed grey-scaled levels showthe radio emission at 843 MHz of the three SNRs as reported in the MOST Catalog prepared by Whiteoakand Green (1996).
Figure 17: CO integrated over the velocity range -65 to -45 km s−1. Contours: 843 MHz continuum fromthe MOST Galactic plane survey (Green et al. 1999); the contour interval is 0.2 Jy/beam, starting at 0.1Jy/beam. The dotted circle is the 95% confidence radius about the position of 3EG J1639-4702 (Hartmanet al. 1999).
limit of the cloud is also uncertain owing to blending with emission at higher (less negative) velocities. Ifwe assume that all of the emission in the velocity range of Figure 15 (−75 to −35 km s−1) arises from cloudA at 8.1 kpc, the total molecular mass within the 95% confidence radius of the 3EG source (dotted circlein Figure 15) is 3.3 ×10⁵M⊙; given the uncertainties just discussed, the actual mass might be as much asa factor of 2 lower.
Even at such a distance, the large quantity of molecular material is sufficient to explain a significantpart of the γ-ray flux observed. As in the case of 3EG 1102-6103, with the usual assumptions, a CRenhancement factor of ∼100 is necessary to explain the bulk of the γ-ray emission from 3EG J1410-6147.It is most likely, however, that this EGRET source is a composite. New X-ray observations could be usedto study the pulsars and evaluate their γ-ray emissivities. An extrapolation of the GeV spectrum to theTeV regime, if there is no break, would give a flux of 1 ×10⁻¹⁰ erg cm−2 s−1, which is above the HESSsensitivity in the range 500 GeV–10 TeV. Even with a substantial break in the spectrum the 3EG sourceshould be observable by HESS (see the study on SNR TeV observability below, Section 15).
10.7 γ-ray source 3EG J1639-4702 – SNR G337.8-0.1/338.1+0.4/338.3+0.0
Figure 16 shows the relative positions of these SNRs within the large location contours of 3EG J1639-4702. One Princeton pulsar is within the contour of 3EG 1639-4702, but it can be ruled out as a possiblecounterpart because of the required energetics. In addition, three Parkes pulsars coincide with the same3EG source (see Table 3). Two of them can be immediately discarded based on the same grounds: therequired efficiencies are unphysically high. However, PSR J1637-4642 seems to be a plausible candidate.Only a 12% efficiency would be needed to convert this pulsar into a plausible counterpart for the originof the γ-ray emission. Although the spectral index, Γ = 2.50 ± 0.18, seems quite soft in comparison withdetected EGRET pulsars, the work of Halpern et al. (2001) suggests that a soft spectral index does notautomatically rule out a pulsar origin of the γ-rays: they present a strong case for PSR J2229+6114 beingresponsible for 3EG J2227+6122, even though it has a high-energy spectral index of 2.24± 0.14.
Based on HI absorption seen all the way up to the terminal velocity, Caswell et al. (1975) placed theSNR G337.8-0.1 beyond the tangent point at 7.9 kpc. Koralesky et al. (1998) detected maser emission inthe SNR at −45 km s−1, implying a far kinematic distance of 12.4 kpc. As Figure 17 shows, there is avery massive giant molecular cloud adjacent to the SNR in direction and close to the associated maser invelocity (−56 km s−1). The far kinematic distance for this giant molecular cloud is favored by (1) its likely
32

Figure 18: Intensity map of the CO(J=1-0) transitions in the region around RX J1713.7-3946, from Buttet al. (2002a). Two massive clouds, called Cloud A and Cloud B, are indicated. The X-ray contours of theSNR (Slane et al. 1999) are superposed in black, as well as the location confidence contours of the GeVγ-ray source 3EG J1714-3857 (coincident with Cloud A) and the significance contours of the TeV detectionof the remnant by Enomoto et al. (2002), mostly coincident with the X-ray radiation.
association with both the far-side maser just mentioned and a group of far-side HII regions (group 5 inGeorgelin & Georgelin 1976); (2) its location very close to the Galactic plane; and (3) the radius linewidthrelation for giant molecular clouds (Dame et al. 1986). The mean velocity of the complex is −56 km s−1,implying a far kinematic distance of 11.8 kpc.
The giant molecular cloud has recently been discussed by Corbel et al. (1999) because an adjacentcloud (just outside the velocity integration range of Figure 17) apparently harbors the soft γ-ray repeaterSGR 1627-41. Corbel et al. suggest that collision or tidal interaction between these two giant molecularclouds may have set off the burst of star formation evident in both.
Taking the total CO luminosity of the giant molecular cloud to be that in the range l = 337.625 to338.25, b = −0.25 to 0.25, and v = −65 to −45 km s−1, the total molecular mass is 5 × 10⁶M⊙; this massmay be overestimated by 10-20% owing to the inclusion of emission from gas at the same velocity at thenear kinematic distance. Even with this correction, this giant molecular cloud ranks among the few mostmassive GMCs in the Galaxy (see, e.g., Dame et al. 1986); its composite CO linewidth of ∼ 20 km s−1 iscorrespondingly very large. Adopting a mean radius of 0.31 deg, or 65 pc at 11.8 kpc, the mean nucleondensity of the cloud is 176 cm−3. The total mass within the 95% confidence radius of the 3EG source is7.6 × 106M⊙; this mass too may be overestimated by 10-20% owing to inclusion of near-side emission.
The enhancement factor obtained from Eq. (15) is large for typical parameter values. However, sincethe SNRs seems to be immersed in the molecular cloud, the Morfill et al. (1984) prescription may be anoversimplification in this case. This case is similar to that of 3EG J1903+0550 in that we have a distantSNR that we would not expect to be able to detect with EGRET in the neighborhood of a very largemolecular cloud. AGILE observations, in advance of GLAST, would greatly elucidate the origin for this3EG source, since even a factor of 2 improvement in resolution would be enough to favor or reject the SNRconnection.
10.8 γ-ray source 3EG J1714-3857 – SNR G348.5+0.0/348.5+0.1/347.3-0.5
The supernova remnant RX J1713.7-3946 is probably the most convincing case for a hadronic cosmic-rayaccelerator detected so far in the Galaxy. Butt et al. (2001) noted the positional coincidence of the nearbyγ-ray source 3EG J1714-3857 with a very massive (∼ 3 × 10⁵ M⊙) and dense (∼ 500 nucleons cm−3)molecular cloud that is clearly interacting with the SNR RX J1713.7-3946 (G347.3-0.5) (Slane et al., 1999;Butt et al., 2001). Figure 18 shows the CO(J=1-0) line intensity distribution in the vicinity of the SNR.The remnant is a strong X-ray source (Slane et al. 1999) whose ROSAT contours are indicated in thefigure. Two massive clouds, which we called Cloud A and Cloud B, can be seen. The first one is coincidentwith the γ-ray source 3EG J1714-3857, whose location confidence contours are also superposed in thefigure. The X-ray emission is produced by TeV-range electrons radiating by the synchrotron mechanism inthe local magnetic field. These same electrons were suggested to be responsible, through IC up-scattering
33
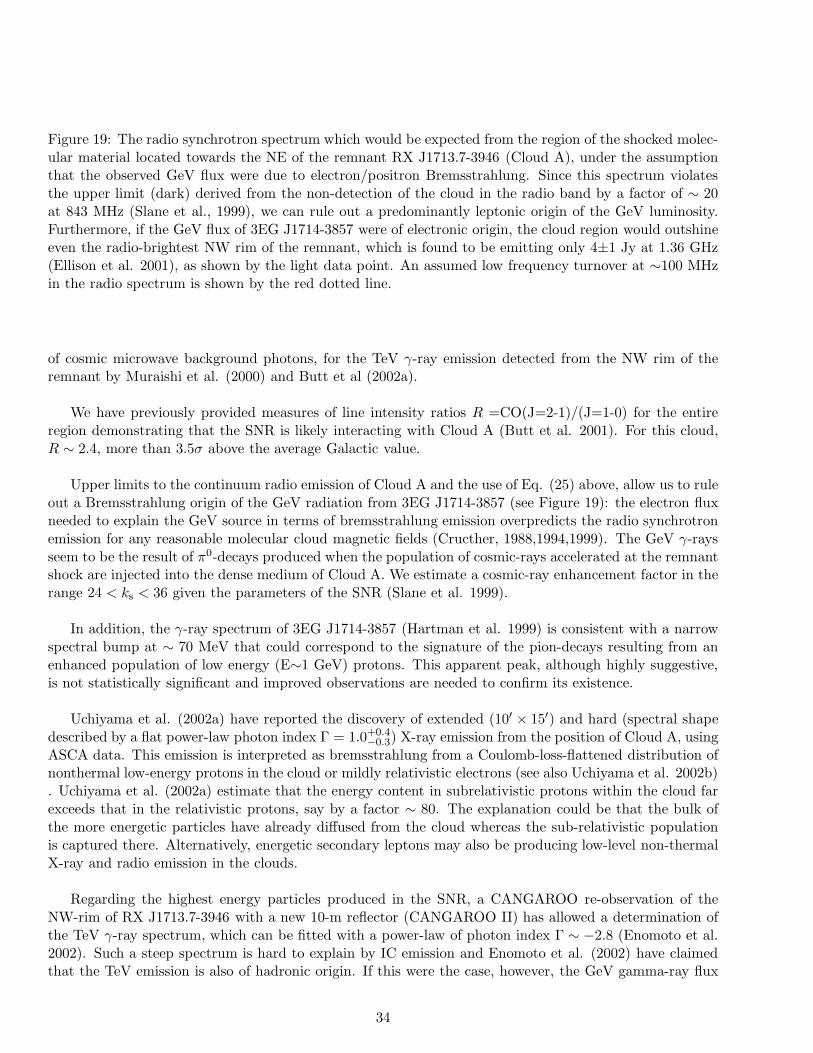
Figure 19: The radio synchrotron spectrum which would be expected from the region of the shocked molec-ular material located towards the NE of the remnant RX J1713.7-3946 (Cloud A), under the assumptionthat the observed GeV flux were due to electron/positron Bremsstrahlung. Since this spectrum violatesthe upper limit (dark) derived from the non-detection of the cloud in the radio band by a factor of ∼ 20at 843 MHz (Slane et al., 1999), we can rule out a predominantly leptonic origin of the GeV luminosity.Furthermore, if the GeV flux of 3EG J1714-3857 were of electronic origin, the cloud region would outshineeven the radio-brightest NW rim of the remnant, which is found to be emitting only 4±1 Jy at 1.36 GHz(Ellison et al. 2001), as shown by the light data point. An assumed low frequency turnover at ∼100 MHzin the radio spectrum is shown by the red dotted line.
of cosmic microwave background photons, for the TeV γ-ray emission detected from the NW rim of theremnant by Muraishi et al. (2000) and Butt et al (2002a).
We have previously provided measures of line intensity ratios R =CO(J=2-1)/(J=1-0) for the entireregion demonstrating that the SNR is likely interacting with Cloud A (Butt et al. 2001). For this cloud,R ∼ 2.4, more than 3.5σ above the average Galactic value.
Upper limits to the continuum radio emission of Cloud A and the use of Eq. (25) above, allow us to ruleout a Bremsstrahlung origin of the GeV radiation from 3EG J1714-3857 (see Figure 19): the electron fluxneeded to explain the GeV source in terms of bremsstrahlung emission overpredicts the radio synchrotronemission for any reasonable molecular cloud magnetic fields (Cructher, 1988,1994,1999). The GeV γ-raysseem to be the result of π0-decays produced when the population of cosmic-rays accelerated at the remnantshock are injected into the dense medium of Cloud A. We estimate a cosmic-ray enhancement factor in therange 24 < ks < 36 given the parameters of the SNR (Slane et al. 1999).
In addition, the γ-ray spectrum of 3EG J1714-3857 (Hartman et al. 1999) is consistent with a narrowspectral bump at ∼ 70 MeV that could correspond to the signature of the pion-decays resulting from anenhanced population of low energy (E∼1 GeV) protons. This apparent peak, although highly suggestive,is not statistically significant and improved observations are needed to confirm its existence.
Uchiyama et al. (2002a) have reported the discovery of extended (10′ × 15′) and hard (spectral shapedescribed by a flat power-law photon index Γ = 1.0+0.4
−0.3) X-ray emission from the position of Cloud A, usingASCA data. This emission is interpreted as bremsstrahlung from a Coulomb-loss-flattened distribution ofnonthermal low-energy protons in the cloud or mildly relativistic electrons (see also Uchiyama et al. 2002b). Uchiyama et al. (2002a) estimate that the energy content in subrelativistic protons within the cloud farexceeds that in the relativistic protons, say by a factor ∼ 80. The explanation could be that the bulk ofthe more energetic particles have already diffused from the cloud whereas the sub-relativistic populationis captured there. Alternatively, energetic secondary leptons may also be producing low-level non-thermalX-ray and radio emission in the clouds.
Regarding the highest energy particles produced in the SNR, a CANGAROO re-observation of theNW-rim of RX J1713.7-3946 with a new 10-m reflector (CANGAROO II) has allowed a determination ofthe TeV γ-ray spectrum, which can be fitted with a power-law of photon index Γ ∼ −2.8 (Enomoto et al.2002). Such a steep spectrum is hard to explain by IC emission and Enomoto et al. (2002) have claimedthat the TeV emission is also of hadronic origin. If this were the case, however, the GeV gamma-ray flux
34
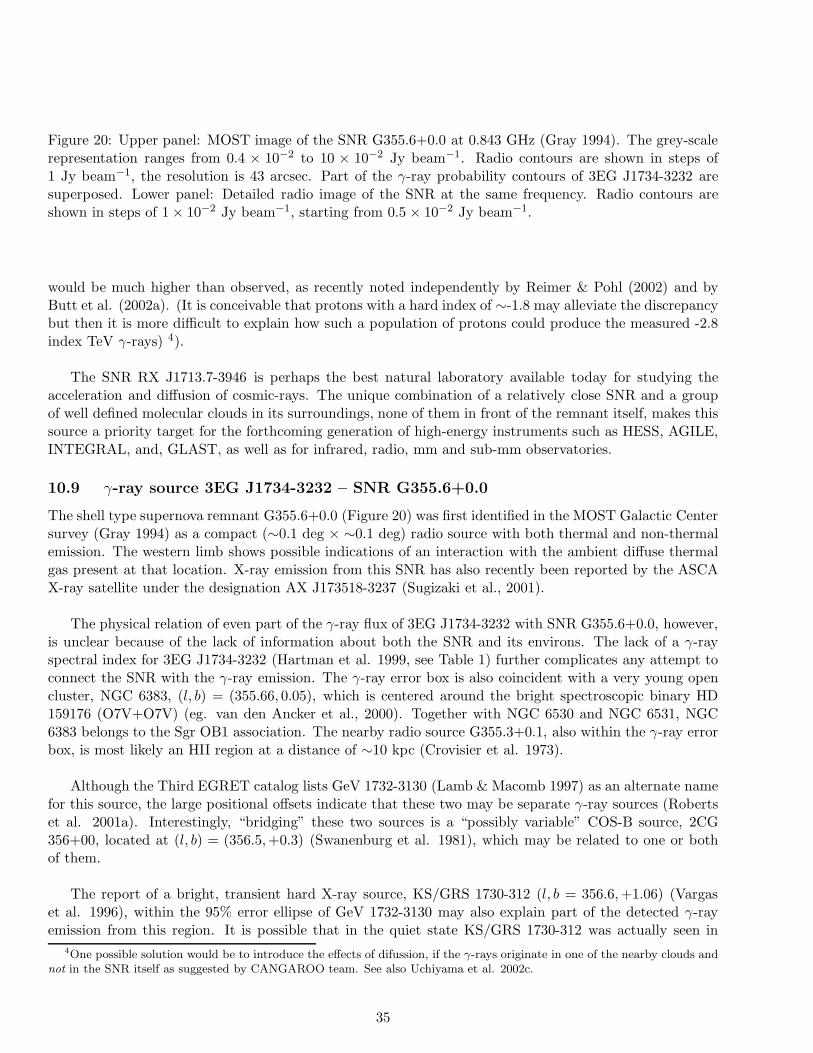
Figure 20: Upper panel: MOST image of the SNR G355.6+0.0 at 0.843 GHz (Gray 1994). The grey-scalerepresentation ranges from 0.4 × 10⁻² to 10 × 10−2 Jy beam−1. Radio contours are shown in steps of1 Jy beam−1, the resolution is 43 arcsec. Part of the γ-ray probability contours of 3EG J1734-3232 aresuperposed. Lower panel: Detailed radio image of the SNR at the same frequency. Radio contours areshown in steps of 1 × 10⁻² Jy beam−1, starting from 0.5 × 10⁻² Jy beam−1.
would be much higher than observed, as recently noted independently by Reimer & Pohl (2002) and byButt et al. (2002a). (It is conceivable that protons with a hard index of ∼-1.8 may alleviate the discrepancybut then it is more difficult to explain how such a population of protons could produce the measured -2.8index TeV γ-rays) 4).
The SNR RX J1713.7-3946 is perhaps the best natural laboratory available today for studying theacceleration and diffusion of cosmic-rays. The unique combination of a relatively close SNR and a groupof well defined molecular clouds in its surroundings, none of them in front of the remnant itself, makes thissource a priority target for the forthcoming generation of high-energy instruments such as HESS, AGILE,INTEGRAL, and, GLAST, as well as for infrared, radio, mm and sub-mm observatories.
10.9 γ-ray source 3EG J1734-3232 – SNR G355.6+0.0
The shell type supernova remnant G355.6+0.0 (Figure 20) was first identified in the MOST Galactic Centersurvey (Gray 1994) as a compact (∼0.1 deg × ∼0.1 deg) radio source with both thermal and non-thermalemission. The western limb shows possible indications of an interaction with the ambient diffuse thermalgas present at that location. X-ray emission from this SNR has also recently been reported by the ASCAX-ray satellite under the designation AX J173518-3237 (Sugizaki et al., 2001).
The physical relation of even part of the γ-ray flux of 3EG J1734-3232 with SNR G355.6+0.0, however,is unclear because of the lack of information about both the SNR and its environs. The lack of a γ-rayspectral index for 3EG J1734-3232 (Hartman et al. 1999, see Table 1) further complicates any attempt toconnect the SNR with the γ-ray emission. The γ-ray error box is also coincident with a very young opencluster, NGC 6383, (l, b) = (355.66, 0.05), which is centered around the bright spectroscopic binary HD159176 (O7V+O7V) (eg. van den Ancker et al., 2000). Together with NGC 6530 and NGC 6531, NGC6383 belongs to the Sgr OB1 association. The nearby radio source G355.3+0.1, also within the γ-ray errorbox, is most likely an HII region at a distance of ∼10 kpc (Crovisier et al. 1973).
Although the Third EGRET catalog lists GeV 1732-3130 (Lamb & Macomb 1997) as an alternate namefor this source, the large positional offsets indicate that these two may be separate γ-ray sources (Robertset al. 2001a). Interestingly, “bridging” these two sources is a “possibly variable” COS-B source, 2CG356+00, located at (l, b) = (356.5,+0.3) (Swanenburg et al. 1981), which may be related to one or bothof them.
The report of a bright, transient hard X-ray source, KS/GRS 1730-312 (l, b = 356.6,+1.06) (Vargaset al. 1996), within the 95% error ellipse of GeV 1732-3130 may also explain part of the detected γ-rayemission from this region. It is possible that in the quiet state KS/GRS 1730-312 was actually seen in
4One possible solution would be to introduce the effects of difussion, if the γ-rays originate in one of the nearby clouds andnot in the SNR itself as suggested by CANGAROO team. See also Uchiyama et al. 2002c.
35

ASCA data, as “src 1” in Roberts et al. (2001). A mild indication of variability for 3EG J1734-3232(I = 2.9, τ = 0.000.24
0.00) appears within the I-scheme, and would support the flaring hard X-ray source beingassociated with it, although this is not conclusive with the data now at hand. The transient source couldalso be separately connected to GeV 1732-3130/2CG 356+00. 2CG 356+00 is listed as “possibly variable”,supporting such an argument (Swanenburg et al. 1981).
It is clear that no conclusive determination can be made regarding possible association among SNRG355.6+0.0, GeV 1732-3130, 2CG 356+00, and 3EG J1734-3232 until the sizes of the γ-ray error boxesare significantly reduced by future GeV telescopes. It is almost certain that many GeV sources, especiallythose located towards the inner Galaxy, will eventually be resolved into several separate sources.
10.10 Near the Galactic Center: γ-ray source 3EG J1744-3011 – SNR G359.0-0.9/359.1-0.5 and γ-ray source 3EG J1746-2851 – SNR G0.0+0.0/0.3+0.0
Since the 3EG sources J1744-3011 and J1746-2851 lie near the very confused Galactic Center region, ananalysis of the sort we present for other SNR-EGRET source pairs is not possible in this case. GalacticCenter region sources must to be considered as possibly extended (most likely composite) and confused,embedded in high and structured background, and the analysis procedures used for other sources in theEGRET catalogs may not apply (Mayer-Hasselwander et al. 1998).
A detailed discussion of the Galactic Center region is beyond the scope of this report; for this the readeris referred to Markoff et al. (1999), Yusef-Zadeh et al. (2000), Melia & Falcke (2001), as well as the bookedited by Falke et al.(1999). Very recently, Goldwurm (2001) has presented a review of the high-energyemission detected from the direction of the Galactic center; the reader is referred to that paper for detailson different X-rays observations of the Galactic Center region.
A complete discussion of EGRET observations of the Galactic Center region was presented by Mayer-Hasselwander et al. (1998). They found 5488±516 counts above 30 MeV, representing a high significanceexcess. The region analyzed was larger than the position of the central EGRET sources by several degrees(see Figure 1 in Mayer-Hasselwander et al. 1998). They also re-analyzed COS-B data, showing that theCOS-B observations of the region were in agreement, despite previous claims, with the more recent EGRETdata. Several objects in the region are potential counterparts for the γ-ray radiation detected, including,for example, GRO 1744-28, 2S1743-2941, E1740-2942, PSR 1742-30, GRS 1736-297, GRS 1739-278, andGX 359+02. However, not all of these coincide with the positions of the 3EG sources we are considering.The γ-ray fluxes in different energy bands give only the hint of variability, which is consistent with 3EGCatalog estimates for I and τ (Table 1). The photon spectrum of the diffuse emission of the GalacticCenter region shows a clear break at energies about 1 GeV, with a significant steepening thereafter (itshifts from −1.3 to −3.1). The hard spectrum at energies above 100 MeV has to be compared with thealready hard values obtained with standard EGRET analysis techniques, quoted in Table 1 for the sourcesof interest. These hard values argue against γ-rays being produced in diffusive processes, i.e., by ambientmatter–cosmic-ray interactions. However, this is yet to be confirmed.
Yusef-Zadeh et al. (2002) have suggested that the central γ-ray source may be due to the interactionof the G0.13-0.13 molecular cloud with the diffuse and filamentary X-ray features discovered using Chan-dra, all lying within the 95% confidence location contours of 3EG J1746-2851. The hard spectrum of theEGRET source (−1.7) seems to match the cloud spectrum at about 10 keV when extended down to X-rayenergies. Electron Bremsstrahlung and inverse Compton may be responsible for the GeV emission. Pohl(1997) raised the possibility that the radio arc at the Galactic Center could be the counterpart of the
36
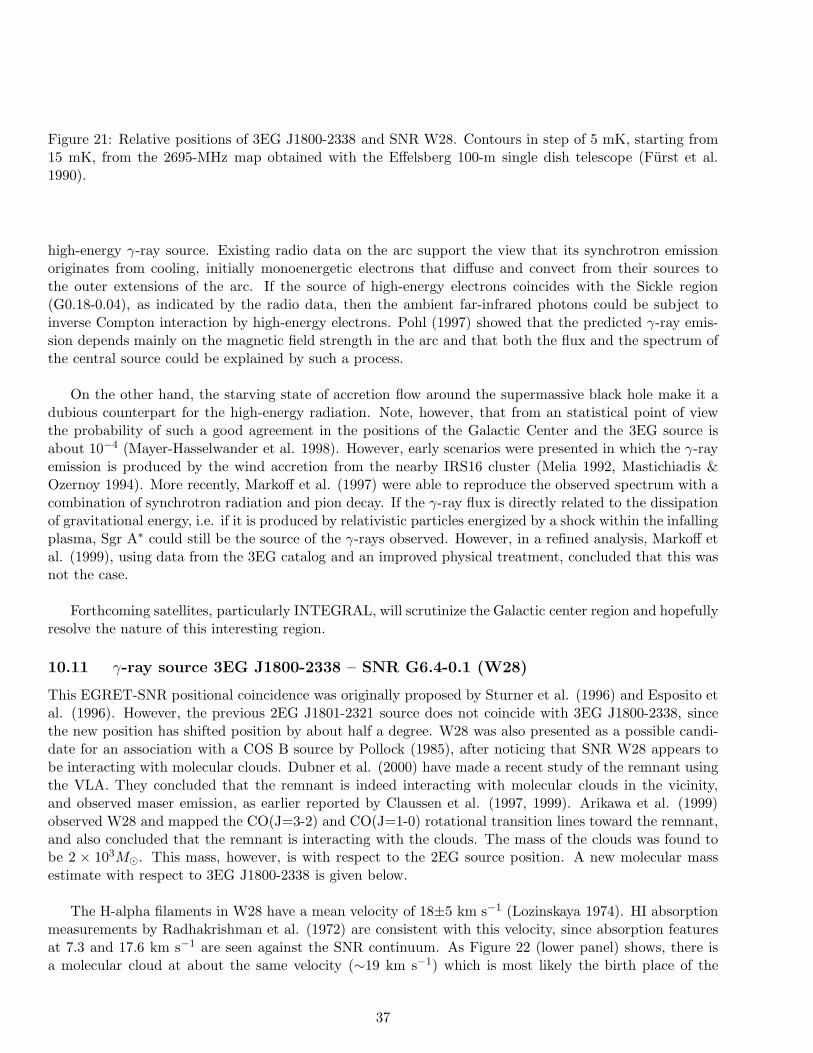
Figure 21: Relative positions of 3EG J1800-2338 and SNR W28. Contours in step of 5 mK, starting from15 mK, from the 2695-MHz map obtained with the Effelsberg 100-m single dish telescope (Furst et al.1990).
high-energy γ-ray source. Existing radio data on the arc support the view that its synchrotron emissionoriginates from cooling, initially monoenergetic electrons that diffuse and convect from their sources tothe outer extensions of the arc. If the source of high-energy electrons coincides with the Sickle region(G0.18-0.04), as indicated by the radio data, then the ambient far-infrared photons could be subject toinverse Compton interaction by high-energy electrons. Pohl (1997) showed that the predicted γ-ray emis-sion depends mainly on the magnetic field strength in the arc and that both the flux and the spectrum ofthe central source could be explained by such a process.
On the other hand, the starving state of accretion flow around the supermassive black hole make it adubious counterpart for the high-energy radiation. Note, however, that from an statistical point of viewthe probability of such a good agreement in the positions of the Galactic Center and the 3EG source isabout 10−4 (Mayer-Hasselwander et al. 1998). However, early scenarios were presented in which the γ-rayemission is produced by the wind accretion from the nearby IRS16 cluster (Melia 1992, Mastichiadis &Ozernoy 1994). More recently, Markoff et al. (1997) were able to reproduce the observed spectrum with acombination of synchrotron radiation and pion decay. If the γ-ray flux is directly related to the dissipationof gravitational energy, i.e. if it is produced by relativistic particles energized by a shock within the infallingplasma, Sgr A∗ could still be the source of the γ-rays observed. However, in a refined analysis, Markoff etal. (1999), using data from the 3EG catalog and an improved physical treatment, concluded that this wasnot the case.
Forthcoming satellites, particularly INTEGRAL, will scrutinize the Galactic center region and hopefullyresolve the nature of this interesting region.
10.11 γ-ray source 3EG J1800-2338 – SNR G6.4-0.1 (W28)
This EGRET-SNR positional coincidence was originally proposed by Sturner et al. (1996) and Esposito etal. (1996). However, the previous 2EG J1801-2321 source does not coincide with 3EG J1800-2338, sincethe new position has shifted position by about half a degree. W28 was also presented as a possible candi-date for an association with a COS B source by Pollock (1985), after noticing that SNR W28 appears tobe interacting with molecular clouds. Dubner et al. (2000) have made a recent study of the remnant usingthe VLA. They concluded that the remnant is indeed interacting with molecular clouds in the vicinity,and observed maser emission, as earlier reported by Claussen et al. (1997, 1999). Arikawa et al. (1999)observed W28 and mapped the CO(J=3-2) and CO(J=1-0) rotational transition lines toward the remnant,and also concluded that the remnant is interacting with the clouds. The mass of the clouds was found tobe 2 × 10³M⊙. This mass, however, is with respect to the 2EG source position. A new molecular massestimate with respect to 3EG J1800-2338 is given below.
The H-alpha filaments in W28 have a mean velocity of 18±5 km s−1 (Lozinskaya 1974). HI absorptionmeasurements by Radhakrishman et al. (1972) are consistent with this velocity, since absorption featuresat 7.3 and 17.6 km s−1 are seen against the SNR continuum. As Figure 22 (lower panel) shows, there isa molecular cloud at about the same velocity (∼19 km s−1) which is most likely the birth place of the
37
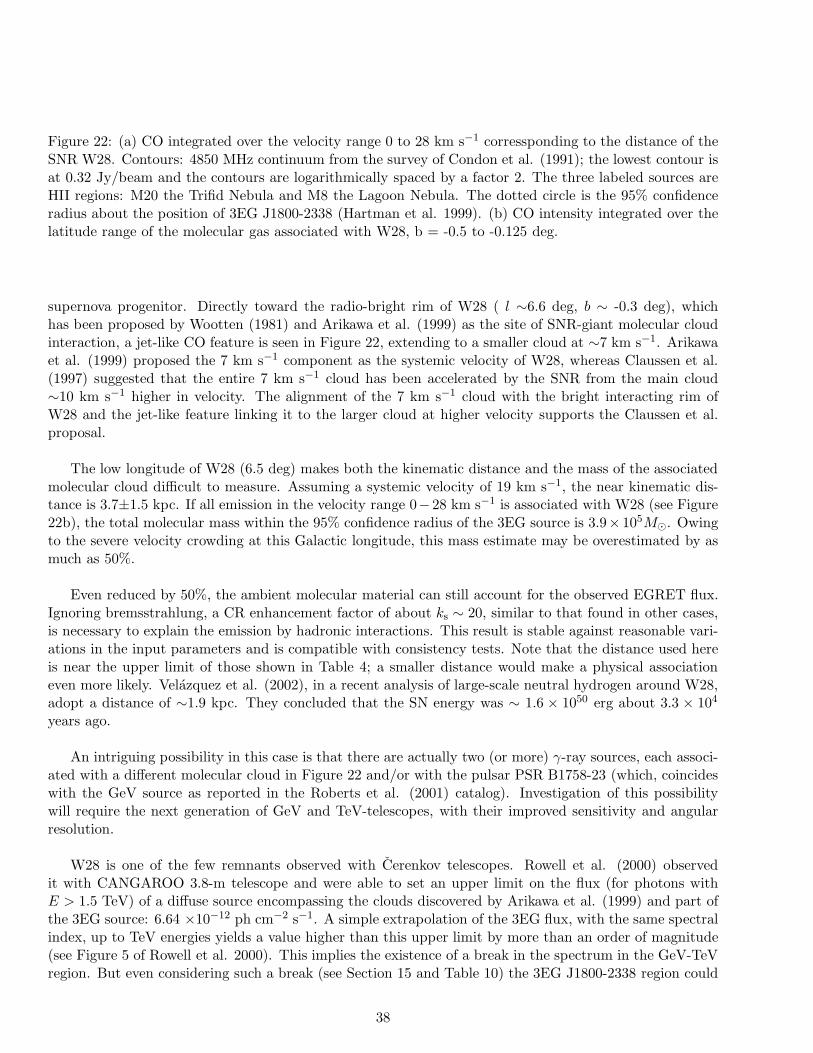
Figure 22: (a) CO integrated over the velocity range 0 to 28 km s−1 corressponding to the distance of theSNR W28. Contours: 4850 MHz continuum from the survey of Condon et al. (1991); the lowest contour isat 0.32 Jy/beam and the contours are logarithmically spaced by a factor 2. The three labeled sources areHII regions: M20 the Trifid Nebula and M8 the Lagoon Nebula. The dotted circle is the 95% confidenceradius about the position of 3EG J1800-2338 (Hartman et al. 1999). (b) CO intensity integrated over thelatitude range of the molecular gas associated with W28, b = -0.5 to -0.125 deg.
supernova progenitor. Directly toward the radio-bright rim of W28 ( l ∼6.6 deg, b ∼ -0.3 deg), whichhas been proposed by Wootten (1981) and Arikawa et al. (1999) as the site of SNR-giant molecular cloudinteraction, a jet-like CO feature is seen in Figure 22, extending to a smaller cloud at ∼7 km s−1. Arikawaet al. (1999) proposed the 7 km s−1 component as the systemic velocity of W28, whereas Claussen et al.(1997) suggested that the entire 7 km s−1 cloud has been accelerated by the SNR from the main cloud∼10 km s−1 higher in velocity. The alignment of the 7 km s−1 cloud with the bright interacting rim ofW28 and the jet-like feature linking it to the larger cloud at higher velocity supports the Claussen et al.proposal.
The low longitude of W28 (6.5 deg) makes both the kinematic distance and the mass of the associatedmolecular cloud difficult to measure. Assuming a systemic velocity of 19 km s−1, the near kinematic dis-tance is 3.7±1.5 kpc. If all emission in the velocity range 0−28 km s−1 is associated with W28 (see Figure22b), the total molecular mass within the 95% confidence radius of the 3EG source is 3.9× 10⁵M⊙. Owingto the severe velocity crowding at this Galactic longitude, this mass estimate may be overestimated by asmuch as 50%.
Even reduced by 50%, the ambient molecular material can still account for the observed EGRET flux.Ignoring bremsstrahlung, a CR enhancement factor of about ks ∼ 20, similar to that found in other cases,is necessary to explain the emission by hadronic interactions. This result is stable against reasonable vari-ations in the input parameters and is compatible with consistency tests. Note that the distance used hereis near the upper limit of those shown in Table 4; a smaller distance would make a physical associationeven more likely. Velazquez et al. (2002), in a recent analysis of large-scale neutral hydrogen around W28,adopt a distance of ∼1.9 kpc. They concluded that the SN energy was ∼ 1.6 × 1050 erg about 3.3 × 10⁴
years ago.
An intriguing possibility in this case is that there are actually two (or more) γ-ray sources, each associ-ated with a different molecular cloud in Figure 22 and/or with the pulsar PSR B1758-23 (which, coincideswith the GeV source as reported in the Roberts et al. (2001) catalog). Investigation of this possibilitywill require the next generation of GeV and TeV-telescopes, with their improved sensitivity and angularresolution.
W28 is one of the few remnants observed with Cerenkov telescopes. Rowell et al. (2000) observedit with CANGAROO 3.8-m telescope and were able to set an upper limit on the flux (for photons withE > 1.5 TeV) of a diffuse source encompassing the clouds discovered by Arikawa et al. (1999) and part ofthe 3EG source: 6.64 ×10⁻¹² ph cm−2 s−1. A simple extrapolation of the 3EG flux, with the same spectralindex, up to TeV energies yields a value higher than this upper limit by more than an order of magnitude(see Figure 5 of Rowell et al. 2000). This implies the existence of a break in the spectrum in the GeV-TeVregion. But even considering such a break (see Section 15 and Table 10) the 3EG J1800-2338 region could
38
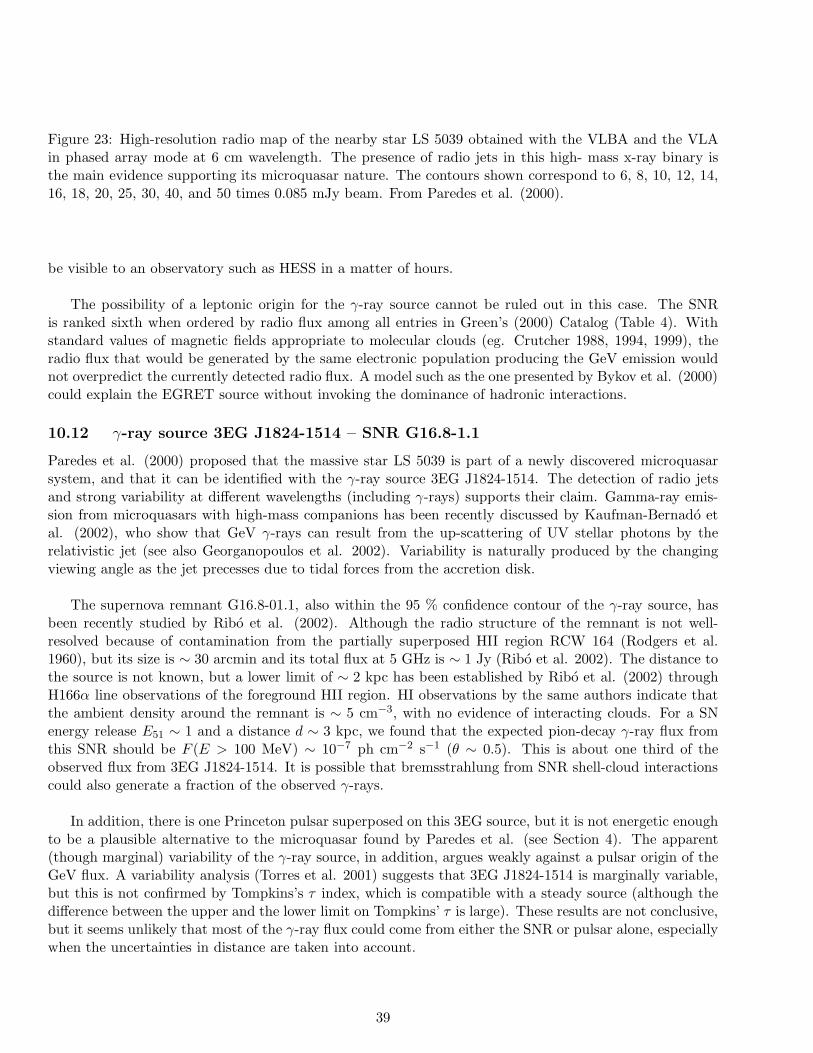
Figure 23: High-resolution radio map of the nearby star LS 5039 obtained with the VLBA and the VLAin phased array mode at 6 cm wavelength. The presence of radio jets in this high- mass x-ray binary isthe main evidence supporting its microquasar nature. The contours shown correspond to 6, 8, 10, 12, 14,16, 18, 20, 25, 30, 40, and 50 times 0.085 mJy beam. From Paredes et al. (2000).
be visible to an observatory such as HESS in a matter of hours.
The possibility of a leptonic origin for the γ-ray source cannot be ruled out in this case. The SNRis ranked sixth when ordered by radio flux among all entries in Green’s (2000) Catalog (Table 4). Withstandard values of magnetic fields appropriate to molecular clouds (eg. Crutcher 1988, 1994, 1999), theradio flux that would be generated by the same electronic population producing the GeV emission wouldnot overpredict the currently detected radio flux. A model such as the one presented by Bykov et al. (2000)could explain the EGRET source without invoking the dominance of hadronic interactions.
10.12 γ-ray source 3EG J1824-1514 – SNR G16.8-1.1
Paredes et al. (2000) proposed that the massive star LS 5039 is part of a newly discovered microquasarsystem, and that it can be identified with the γ-ray source 3EG J1824-1514. The detection of radio jetsand strong variability at different wavelengths (including γ-rays) supports their claim. Gamma-ray emis-sion from microquasars with high-mass companions has been recently discussed by Kaufman-Bernado etal. (2002), who show that GeV γ-rays can result from the up-scattering of UV stellar photons by therelativistic jet (see also Georganopoulos et al. 2002). Variability is naturally produced by the changingviewing angle as the jet precesses due to tidal forces from the accretion disk.
The supernova remnant G16.8-01.1, also within the 95 % confidence contour of the γ-ray source, hasbeen recently studied by Ribo et al. (2002). Although the radio structure of the remnant is not well-resolved because of contamination from the partially superposed HII region RCW 164 (Rodgers et al.1960), but its size is ∼ 30 arcmin and its total flux at 5 GHz is ∼ 1 Jy (Ribo et al. 2002). The distance tothe source is not known, but a lower limit of ∼ 2 kpc has been established by Ribo et al. (2002) throughH166α line observations of the foreground HII region. HI observations by the same authors indicate thatthe ambient density around the remnant is ∼ 5 cm−3, with no evidence of interacting clouds. For a SNenergy release E51 ∼ 1 and a distance d ∼ 3 kpc, we found that the expected pion-decay γ-ray flux fromthis SNR should be F (E > 100 MeV) ∼ 10−7 ph cm−2 s−1 (θ ∼ 0.5). This is about one third of theobserved flux from 3EG J1824-1514. It is possible that bremsstrahlung from SNR shell-cloud interactionscould also generate a fraction of the observed γ-rays.
In addition, there is one Princeton pulsar superposed on this 3EG source, but it is not energetic enoughto be a plausible alternative to the microquasar found by Paredes et al. (see Section 4). The apparent(though marginal) variability of the γ-ray source, in addition, argues weakly against a pulsar origin of theGeV flux. A variability analysis (Torres et al. 2001) suggests that 3EG J1824-1514 is marginally variable,but this is not confirmed by Tompkins’s τ index, which is compatible with a steady source (although thedifference between the upper and the lower limit on Tompkins’ τ is large). These results are not conclusive,but it seems unlikely that most of the γ-ray flux could come from either the SNR or pulsar alone, especiallywhen the uncertainties in distance are taken into account.
39
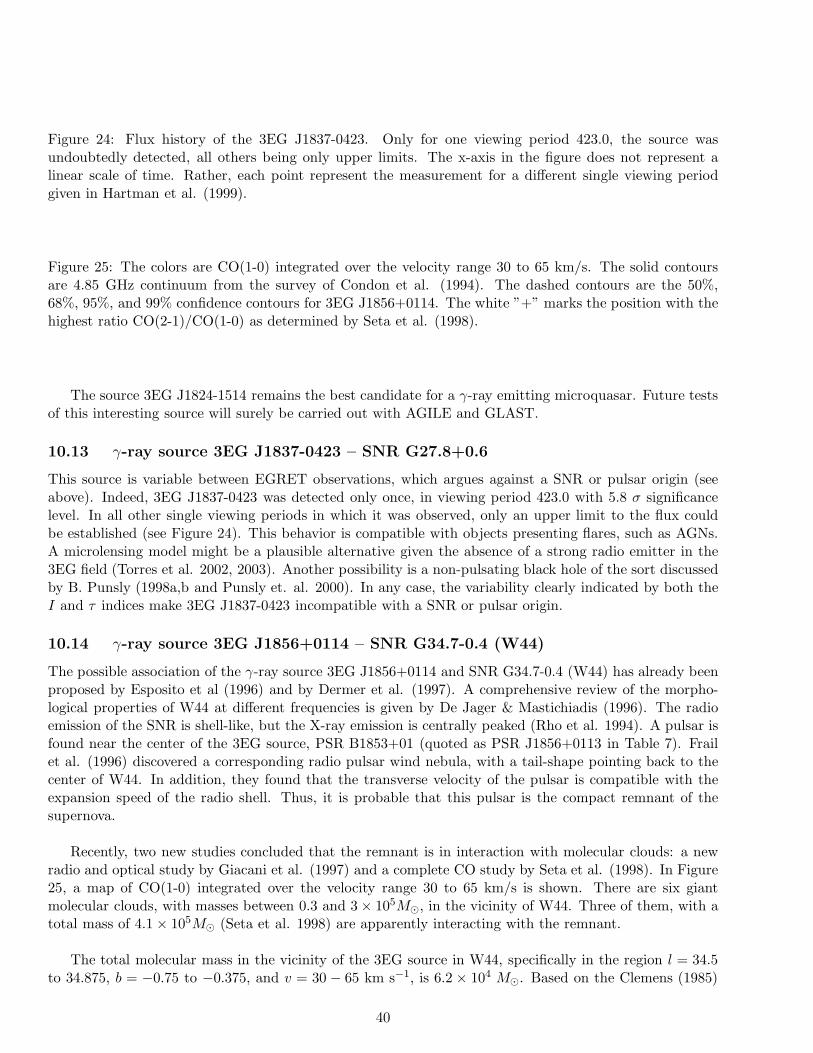
Figure 24: Flux history of the 3EG J1837-0423. Only for one viewing period 423.0, the source wasundoubtedly detected, all others being only upper limits. The x-axis in the figure does not represent alinear scale of time. Rather, each point represent the measurement for a different single viewing periodgiven in Hartman et al. (1999).
Figure 25: The colors are CO(1-0) integrated over the velocity range 30 to 65 km/s. The solid contoursare 4.85 GHz continuum from the survey of Condon et al. (1994). The dashed contours are the 50%,68%, 95%, and 99% confidence contours for 3EG J1856+0114. The white ”+” marks the position with thehighest ratio CO(2-1)/CO(1-0) as determined by Seta et al. (1998).
The source 3EG J1824-1514 remains the best candidate for a γ-ray emitting microquasar. Future testsof this interesting source will surely be carried out with AGILE and GLAST.
10.13 γ-ray source 3EG J1837-0423 – SNR G27.8+0.6
This source is variable between EGRET observations, which argues against a SNR or pulsar origin (seeabove). Indeed, 3EG J1837-0423 was detected only once, in viewing period 423.0 with 5.8 σ significancelevel. In all other single viewing periods in which it was observed, only an upper limit to the flux couldbe established (see Figure 24). This behavior is compatible with objects presenting flares, such as AGNs.A microlensing model might be a plausible alternative given the absence of a strong radio emitter in the3EG field (Torres et al. 2002, 2003). Another possibility is a non-pulsating black hole of the sort discussedby B. Punsly (1998a,b and Punsly et. al. 2000). In any case, the variability clearly indicated by both theI and τ indices make 3EG J1837-0423 incompatible with a SNR or pulsar origin.
10.14 γ-ray source 3EG J1856+0114 – SNR G34.7-0.4 (W44)
The possible association of the γ-ray source 3EG J1856+0114 and SNR G34.7-0.4 (W44) has already beenproposed by Esposito et al (1996) and by Dermer et al. (1997). A comprehensive review of the morpho-logical properties of W44 at different frequencies is given by De Jager & Mastichiadis (1996). The radioemission of the SNR is shell-like, but the X-ray emission is centrally peaked (Rho et al. 1994). A pulsar isfound near the center of the 3EG source, PSR B1853+01 (quoted as PSR J1856+0113 in Table 7). Frailet al. (1996) discovered a corresponding radio pulsar wind nebula, with a tail-shape pointing back to thecenter of W44. In addition, they found that the transverse velocity of the pulsar is compatible with theexpansion speed of the radio shell. Thus, it is probable that this pulsar is the compact remnant of thesupernova.
Recently, two new studies concluded that the remnant is in interaction with molecular clouds: a newradio and optical study by Giacani et al. (1997) and a complete CO study by Seta et al. (1998). In Figure25, a map of CO(1-0) integrated over the velocity range 30 to 65 km/s is shown. There are six giantmolecular clouds, with masses between 0.3 and 3 × 10⁵M⊙, in the vicinity of W44. Three of them, with atotal mass of 4.1 × 10⁵M⊙ (Seta et al. 1998) are apparently interacting with the remnant.
The total molecular mass in the vicinity of the 3EG source in W44, specifically in the region l = 34.5to 34.875, b = −0.75 to −0.375, and v = 30 − 65 km s−1, is 6.2 × 10⁴ M⊙. Based on the Clemens (1985)
40
rotation curve, the main clump near the 3EG source has a kinematic distance of 2.8 kpc. The molecularmass is obtained based on the usual assumption that the H2 column density is proportional to the COvelocity-integrated intensity. The mass in the velocity-perturbed wings can be a factor ∼100 less thanthe total mass of the cloud. With these values for the masses of passive targets and an CR enhancementfactor of ∼40, the entire GeV flux could, in principle, be explained by hadronic interactions, althoughan additional Bremsstrahlung component will be present also in the SNR shell-cloud interactions. Theenhancement factor of ∼40 is obtained assuming E51 = 0.67 and a pre-shock ambient density n0 = 1, butthe conclusions are robust for reasonable variations in these parameters.
We can compute mean densities for the well-defined clumps (lighter colors in Figure 25) by assum-ing they are roughly spherical. However, the 3EG source contours enclose less intense emission thatis spread throughout the whole W44 complex, which is about ∼ 1 deg across, (49 pc at the assumeddistance of 2.8 kpc). Thus it is reasonable to assume that the molecular gas enclosed by the 3EGcontours is spread over about 49 pc along the line of sight as well. The mean density would then ben ∼ 6.2 × 10⁴M⊙/[π(9pc)2 × 49pc] = 188 H/cm−3; here, 9 pc is the 95% location contour of the 3EGsource. This density is 6 times larger than that used by de Jager & Mastichiadis’ (1997) in computing thehadronic emission.
De Jager & Mastichiadis (1997) developed a specific model for this EGRET source (at the time, 2EGJ1857+0118) and proposed that the γ-ray radiation could be accounted for by relativistic Bremsstrahlungand inverse Compton scattering. One of their main motivations was to explain the hard spectral indexof the corresponding γ-ray source, ∼ −1.80, as well as the hard index of the radio source ∼ −0.3, bothdifficult to reconcile with the standard Fermi first order acceleration process. The model of de Jager &Mastichiadis (1997) propose the pulsar PSR B1853+01 as the source of the gamma-rays; indeed, the re-quired efficiency to produce all the γ-ray radiation is 13%, which appears marginally plausible, given theuncertainties. However, the luminosity of the pulsar wind nebula (PWN) is negligible in comparison withthe total X-ray luminosity of W44 (Harrus, Hughes, & Helfand 1996). The bulk of the X-ray emission fromW44 is thermal (Jones, Smith, & Angellini 1993, Rho et al. 1994). But even though the X-ray luminosityof the PWN is negligible, the pulsar could have injected a significant amount of electrons in an earlierstage. Mastichiadis’ paper Good fits of the 2EG spectrum were obtained for a range of particle density,whereas the magnetic field was required to be ∼ 10µ G and the synchrotron cutoff frequency, νb ∼ 1012.5
Hz. A reasonable field strength could then explain the γ-ray spectrum of W44 as originating in leptonicprocesses.
W44 is then a complicated case. While the γ-ray source may be due to SNR shock-cloud interactions(hadronic and leptonic), a significant part of the γ-ray flux observed – perhaps even all of it – could be due toa pulsar. Application of Eq. (25) does not allow us to discard, as in the case of SNR G347.3-0.5, a leptonicorigin for the high-energy radiation. Here, then, future satellites and telescopes will play an essential rolein disentangling the different possibilities. W44 was not observed to be emitting at TeV energies, wherean upper limit has been imposed by the Whipple observatory at (F (E > 250GeV) = 8.5 × 10⁻¹¹ cm−2
s−1, Leslard et al. 1995), implying that there is a possible break in the spectrum from GeV to TeV. Thiscan be tested by forthcoming higher sensitivity TeV-telescopes.
10.15 γ-ray source 3EG J1903+0550 – SNR G39.2-0.3
Figure 26 shows the relative positions of 3EG J1903+0550 and the SNR G39.2-0.3. The 3EG source is alsocoincident with two Princeton pulsars (Table 3). One of them can be readily discarded as the origin of theγ-ray emission because of the unrealistically high value required for the efficiency. The other pulsar, PSR
41

Figure 26: Left: Relative positions of 3EG J1903+0550 and the SNR G39.2-0.3. Radio contours in stepof 2 mK, starting from 5 mK, from the 2695-MHz map obtained with the Effelsberg 100-m single dishtelescope (Furst et al. 1990). Right: CO integrated over the velocity range of the far Sagittarius arm,48 to 70 km s−1. Contours: 4.85 GHz continuum from the survey of Condon et al. (1994). The angularresolution is 7 arcmin; the contour interval is 0.5 Jy/beam, starting at 0.3 Jy/beam. The dotted circle isthe 95% radius about the central position of 3EG J1903+0550 (Hartman et al. 1999).
J1902+0615, lacks a measurement of the period derivative and so we cannot judge the likelihood of thisparticular association. The SNR G39.2-0.3 has been searched for OH maser emission by Koralesky et al.(1998), but none was detected, although, of course, this does not imply a lack of possible interaction. TheSNR is more than 8 kpc away, which seems to be -a priori- a problem for generating the requisite flux viashock interactions. We find, however, that the large distance may be, at least partially, compensated forby the large amount of molecular material in the neighborhood.
Caswell et al. (1975) detected HI absorption all the way up to the terminal velocity towards the SNRG39.2-0.3, with almost continuous strong absorption between 60 km s−1 and the terminal velocity. Theytherefore concluded that the remnant was certainly beyond the tangent point, and most likely at the fardistance corresponding to 60 km s−1, ∼9.6 kpc. Such a large distance is consistent with the high foregroundhydrogen column inferred both by Becker & Helfand (1987) based on 21 cm absorption measurements withthe VLA, and by Harrus & Slane (1999) based on ASCA observations. A distance of 9.6 kpc would placethe SNR in the far Sagittarius arm, where as Figure 26 shows, the remnant is nearly coincident with amassive molecular complex. The complex is (40,59) in the catalog of Dame et al. (1986), who assignedthe far kinematic distance based on 2 associated HII regions. The mass of this complex is estimated to be2.1 × 106M⊙. The mass within the 95% confidence radius of the 3EG source (dotted circle in Figure 26)is even higher, 3.4× 10⁶M⊙, because the radius also includes part of another molecular complex at higherlongitude. If part of the mass contained in the molecular complex could serve as target material for therelativistic particles accelerated in the SNR shock, this 3EG detection could plausibly be produced by acombination of Bremsstrahlung and pion decay. With the mass quoted, a CR enhancement factor of lessthan 10 is all that is needed to produce the bulk of the observed γ-ray emission. However, it is clear thatnot all of the molecular mass can be illuminated by the SNR shock front. The SNR itself is less than 8arcmin in size, while the 3EG source is ∼1 deg in size. Only 0.1% of the molecular material need to serveas a target for the particles accelerated in G39.2-0.3 in order to produce the 3EG source. In this case,however, as in the case of 3EG J1639-4702, the enhancement factor (Eq.15) is very large (∼ 1000), as aresult of the use of the Sedov solutions with typical values for the energy of the explosion and ambientunshocked density.
There is an additional nearby SNR, G40.5-0.5 (Downes et al. 1980), which is also associated withthe same cloud complex as G39.2-0.3 and at a similar distance. Though the center of G40.5-0.5 doesnot coincide with the 3EG source herein analyzed, it is suggesstive that the location of the 3EG sourcelies between the two SNRs, and could thus have a composite origin. (SNR G40.5-0.5 does not appear inTable 1 due to the high ellipticity of the confidence level contours of 3EG J1903+0550.) A large region,−10 < b < 5, 38 < l < 43, comprising this latter SNR as well as the 3EG source was subject of a search forgamma-ray emission using the HEGRA system of imaging atmospheric telescopes (Aharonian et al. 2001).No evidence for emission from point sources was detected, and upper limits imposed were typically below0.1 Crabs for the flux above 1 TeV.
42
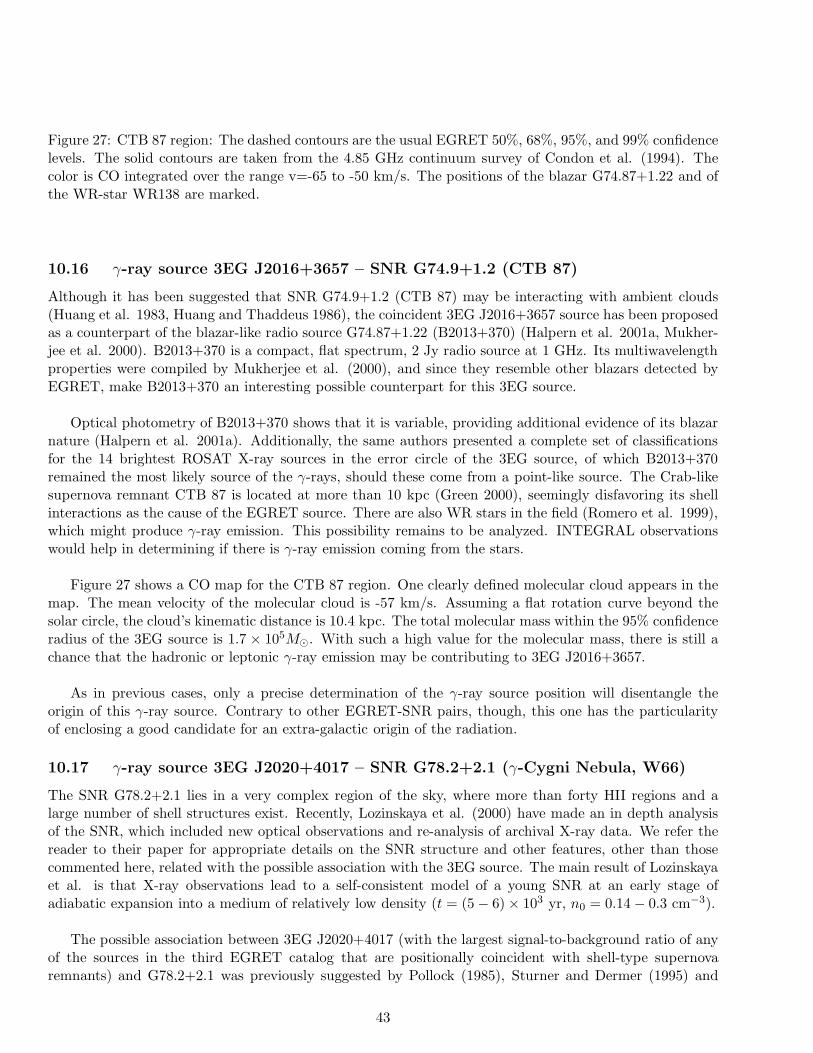
Figure 27: CTB 87 region: The dashed contours are the usual EGRET 50%, 68%, 95%, and 99% confidencelevels. The solid contours are taken from the 4.85 GHz continuum survey of Condon et al. (1994). Thecolor is CO integrated over the range v=-65 to -50 km/s. The positions of the blazar G74.87+1.22 and ofthe WR-star WR138 are marked.
10.16 γ-ray source 3EG J2016+3657 – SNR G74.9+1.2 (CTB 87)
Although it has been suggested that SNR G74.9+1.2 (CTB 87) may be interacting with ambient clouds(Huang et al. 1983, Huang and Thaddeus 1986), the coincident 3EG J2016+3657 source has been proposedas a counterpart of the blazar-like radio source G74.87+1.22 (B2013+370) (Halpern et al. 2001a, Mukher-jee et al. 2000). B2013+370 is a compact, flat spectrum, 2 Jy radio source at 1 GHz. Its multiwavelengthproperties were compiled by Mukherjee et al. (2000), and since they resemble other blazars detected byEGRET, make B2013+370 an interesting possible counterpart for this 3EG source.
Optical photometry of B2013+370 shows that it is variable, providing additional evidence of its blazarnature (Halpern et al. 2001a). Additionally, the same authors presented a complete set of classificationsfor the 14 brightest ROSAT X-ray sources in the error circle of the 3EG source, of which B2013+370remained the most likely source of the γ-rays, should these come from a point-like source. The Crab-likesupernova remnant CTB 87 is located at more than 10 kpc (Green 2000), seemingly disfavoring its shellinteractions as the cause of the EGRET source. There are also WR stars in the field (Romero et al. 1999),which might produce γ-ray emission. This possibility remains to be analyzed. INTEGRAL observationswould help in determining if there is γ-ray emission coming from the stars.
Figure 27 shows a CO map for the CTB 87 region. One clearly defined molecular cloud appears in themap. The mean velocity of the molecular cloud is -57 km/s. Assuming a flat rotation curve beyond thesolar circle, the cloud’s kinematic distance is 10.4 kpc. The total molecular mass within the 95% confidenceradius of the 3EG source is 1.7 × 10⁵M⊙. With such a high value for the molecular mass, there is still achance that the hadronic or leptonic γ-ray emission may be contributing to 3EG J2016+3657.
As in previous cases, only a precise determination of the γ-ray source position will disentangle theorigin of this γ-ray source. Contrary to other EGRET-SNR pairs, though, this one has the particularityof enclosing a good candidate for an extra-galactic origin of the radiation.
10.17 γ-ray source 3EG J2020+4017 – SNR G78.2+2.1 (γ-Cygni Nebula, W66)
The SNR G78.2+2.1 lies in a very complex region of the sky, where more than forty HII regions and alarge number of shell structures exist. Recently, Lozinskaya et al. (2000) have made an in depth analysisof the SNR, which included new optical observations and re-analysis of archival X-ray data. We refer thereader to their paper for appropriate details on the SNR structure and other features, other than thosecommented here, related with the possible association with the 3EG source. The main result of Lozinskayaet al. is that X-ray observations lead to a self-consistent model of a young SNR at an early stage ofadiabatic expansion into a medium of relatively low density (t = (5 − 6) × 103 yr, n0 = 0.14 − 0.3 cm−3).
The possible association between 3EG J2020+4017 (with the largest signal-to-background ratio of anyof the sources in the third EGRET catalog that are positionally coincident with shell-type supernovaremnants) and G78.2+2.1 was previously suggested by Pollock (1985), Sturner and Dermer (1995) and
43
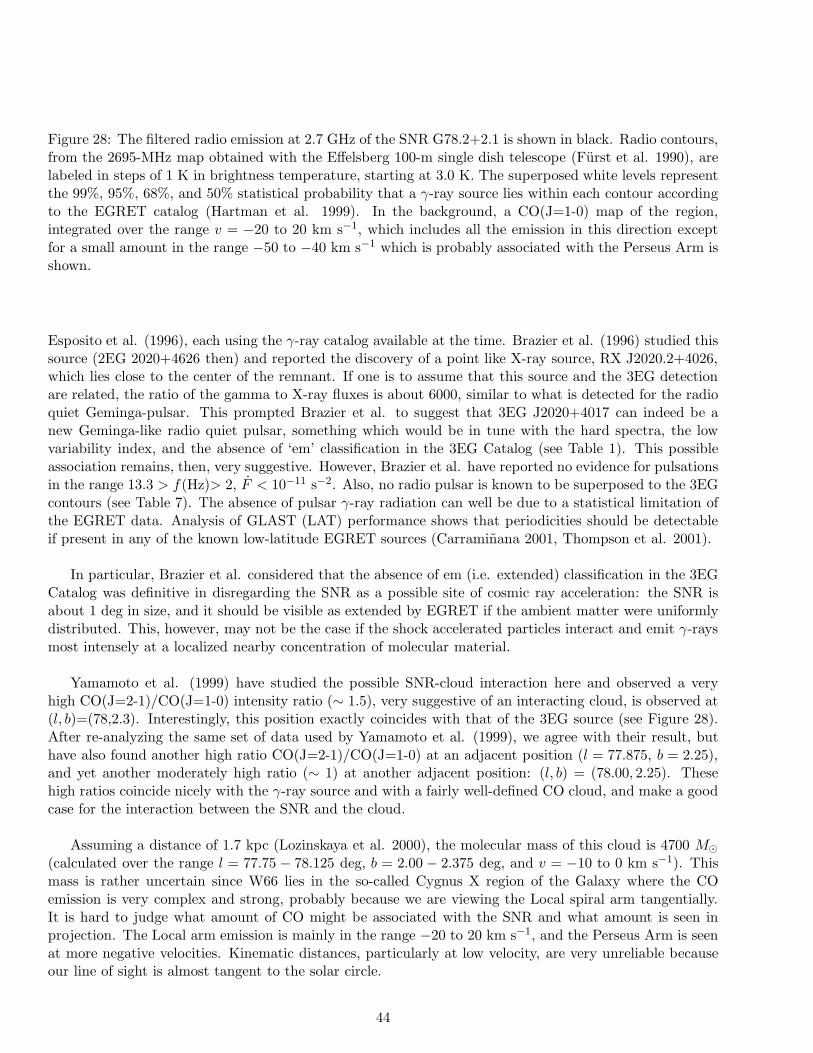
Figure 28: The filtered radio emission at 2.7 GHz of the SNR G78.2+2.1 is shown in black. Radio contours,from the 2695-MHz map obtained with the Effelsberg 100-m single dish telescope (Furst et al. 1990), arelabeled in steps of 1 K in brightness temperature, starting at 3.0 K. The superposed white levels representthe 99%, 95%, 68%, and 50% statistical probability that a γ-ray source lies within each contour accordingto the EGRET catalog (Hartman et al. 1999). In the background, a CO(J=1-0) map of the region,integrated over the range v = −20 to 20 km s−1, which includes all the emission in this direction exceptfor a small amount in the range −50 to −40 km s−1 which is probably associated with the Perseus Arm isshown.
Esposito et al. (1996), each using the γ-ray catalog available at the time. Brazier et al. (1996) studied thissource (2EG 2020+4626 then) and reported the discovery of a point like X-ray source, RX J2020.2+4026,which lies close to the center of the remnant. If one is to assume that this source and the 3EG detectionare related, the ratio of the gamma to X-ray fluxes is about 6000, similar to what is detected for the radioquiet Geminga-pulsar. This prompted Brazier et al. to suggest that 3EG J2020+4017 can indeed be anew Geminga-like radio quiet pulsar, something which would be in tune with the hard spectra, the lowvariability index, and the absence of ‘em’ classification in the 3EG Catalog (see Table 1). This possibleassociation remains, then, very suggestive. However, Brazier et al. have reported no evidence for pulsationsin the range 13.3 > f(Hz)> 2, F < 10−11 s−2. Also, no radio pulsar is known to be superposed to the 3EGcontours (see Table 7). The absence of pulsar γ-ray radiation can well be due to a statistical limitation ofthe EGRET data. Analysis of GLAST (LAT) performance shows that periodicities should be detectableif present in any of the known low-latitude EGRET sources (Carraminana 2001, Thompson et al. 2001).
In particular, Brazier et al. considered that the absence of em (i.e. extended) classification in the 3EGCatalog was definitive in disregarding the SNR as a possible site of cosmic ray acceleration: the SNR isabout 1 deg in size, and it should be visible as extended by EGRET if the ambient matter were uniformlydistributed. This, however, may not be the case if the shock accelerated particles interact and emit γ-raysmost intensely at a localized nearby concentration of molecular material.
Yamamoto et al. (1999) have studied the possible SNR-cloud interaction here and observed a veryhigh CO(J=2-1)/CO(J=1-0) intensity ratio (∼ 1.5), very suggestive of an interacting cloud, is observed at(l, b)=(78,2.3). Interestingly, this position exactly coincides with that of the 3EG source (see Figure 28).After re-analyzing the same set of data used by Yamamoto et al. (1999), we agree with their result, buthave also found another high ratio CO(J=2-1)/CO(J=1-0) at an adjacent position (l = 77.875, b = 2.25),and yet another moderately high ratio (∼ 1) at another adjacent position: (l, b) = (78.00, 2.25). Thesehigh ratios coincide nicely with the γ-ray source and with a fairly well-defined CO cloud, and make a goodcase for the interaction between the SNR and the cloud.
Assuming a distance of 1.7 kpc (Lozinskaya et al. 2000), the molecular mass of this cloud is 4700 M⊙
(calculated over the range l = 77.75 − 78.125 deg, b = 2.00 − 2.375 deg, and v = −10 to 0 km s−1). Thismass is rather uncertain since W66 lies in the so-called Cygnus X region of the Galaxy where the COemission is very complex and strong, probably because we are viewing the Local spiral arm tangentially.It is hard to judge what amount of CO might be associated with the SNR and what amount is seen inprojection. The Local arm emission is mainly in the range −20 to 20 km s−1, and the Perseus Arm is seenat more negative velocities. Kinematic distances, particularly at low velocity, are very unreliable becauseour line of sight is almost tangent to the solar circle.
44
Using the data obtained for the mass of the cloud in the vicinity of the 3EG source and apparentlyin interaction with the SNR, as well as the mean value for the unshocked density (n0 = 0.22 cm−3) anddistance (from Lozinskaya et al. 2000), it is possible to explain the γ-rays by hadronic processes. The useof Eq. (25) with plausible values of the magnetic fields in molecular clouds (Crutcher 1988, 1994, 1999)rules out leptonic processes as the source of most of the radiation.
We cannot discard, however, a composite origin for the γ-rays, with part of the radiation coming fromthe putative γ-ray pulsar proposed by Brazier et al. (1996) and part from cloud interactions with thenucleonic component of freshly accelerated CRs.
10.18 An example beyond |b| > 10: γ-ray source 3EG J0010+7309 – SNRG119.5+10.2 (CTA 1)
The SNR-EGRET connection that we have explored so far was based on the sample shown in Table 1,constructed using 3EG sources within 10o of the Galactic plane. Although most SNRs fall into this latituderange, there is the possibility of finding a few nearby SNRs related with γ-ray sources at higher latitudes.An example of such is briefly described in this section.
CTA 1 is a shell-type SNR, but its shell is incomplete and broken-out towards the NW. This breakoutphenomenon may be caused by more rapid expansion of the blast wave shock into a lower density regiontoward the NW. HI observations supported this interpretation (Pineault et al. 1993, 1997). Since CTA1 is located at a relatively high latitude (10 deg) and is nearby (1.4±0.3 kpc, Pineault et al. 1993), ithas a large angular size (90 arcmin), little foreground or background confusion, and it can be observedat exceptionally high linear resolution. The age of the SNR was estimated to be 104 yr by Pineault etal. (1993), but it could be younger by a factor of 2 (Slane et al. 1997). CTA 1 was subject of intenseobservational campaigns in the past years. There have been both ROSAT and ASCA X-ray observations(Seward et al. 1995, Slane et al. 1997), as well as optical, infrared and radio (see Pineault et al. 1997 andBrazier et al. 1998 for a review).
The ROSAT observation confirmed that CTA 1 belongs to the class of composite SNRs, which show ashell-type morphology in the radio band and are centre-filled in X-rays. Five point sources were detectedwith ROSAT, one of which was found to coincide with the EGRET source (at the time of the analysis, 2EGJ0008+7307). ASCA data later revealed that this source, named RX J0007.0+7302, has a non-thermalspectrum, suggesting that it is the pulsar left from the supernova explosion (Slane et al. 1997). Opticalobservations were carried out by Brazier et al. (1998), with a 2.12-m telescope, but no object was foundwithin the positional error box of the X-ray source. This allowed an upper limit to be set on the opticalmagnitude of any counterpart to the putative pulsar.
The 3EG J0010+7309 is a non-variable source under the I and τ schemes, and has a hard spectralindex of 1.85±0.10, compatible with those of the Vela pulsar. This source was also detected in the SecondEGRET Catalog, but with a shifted position which made it coincide with a nearby AGN – which was atthe time proposed as a possible counterpart (Nolan et al. 1996). This AGN is not coincident with the3EG source and can not be considered a plausible counterpart any longer. Based on positional coincidence,on the hard spectral index, and on physical similarities between the Vela pulsar and RX J0007.0+7302,Brazier et al. (1998) proposed that the 3EG source and this X-ray source were related. For an assumed 1sr beaming, the observed 100-2000 MeV flux corresponds to a luminosity of 4 × 1033 erg s−1, compatiblewith other γ-ray pulsar detections (see Table 5).
45
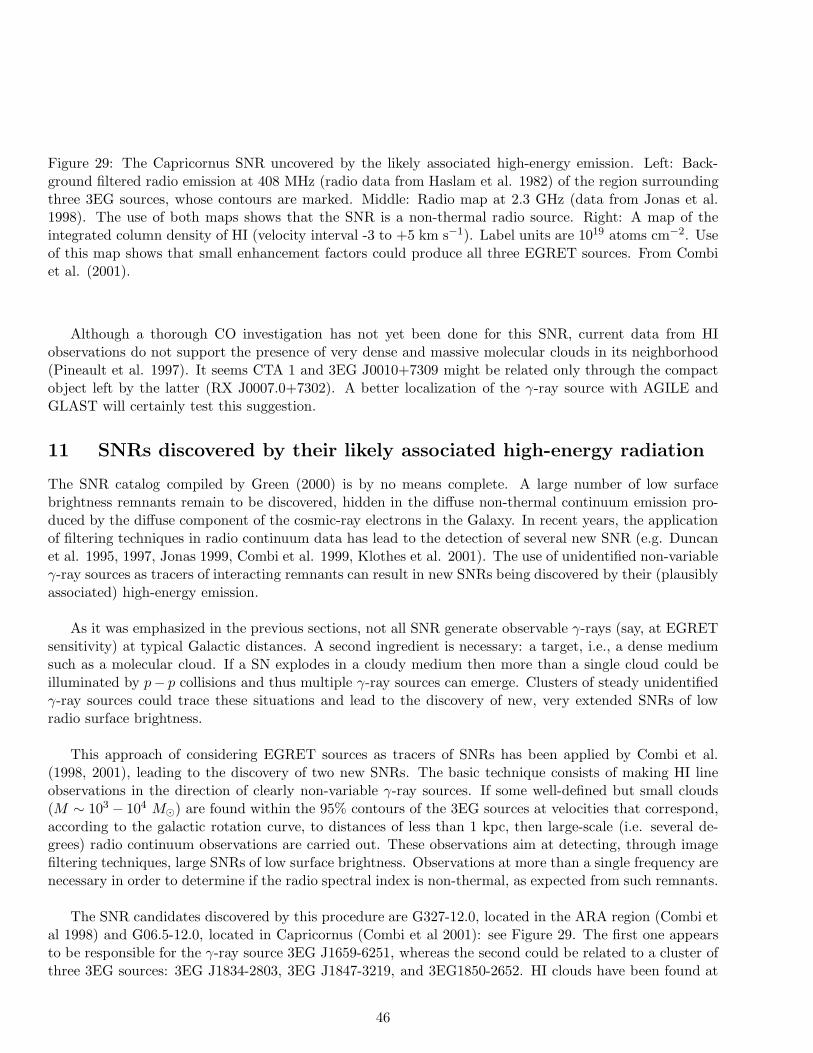
Figure 29: The Capricornus SNR uncovered by the likely associated high-energy emission. Left: Back-ground filtered radio emission at 408 MHz (radio data from Haslam et al. 1982) of the region surroundingthree 3EG sources, whose contours are marked. Middle: Radio map at 2.3 GHz (data from Jonas et al.1998). The use of both maps shows that the SNR is a non-thermal radio source. Right: A map of theintegrated column density of HI (velocity interval -3 to +5 km s−1). Label units are 1019 atoms cm−2. Useof this map shows that small enhancement factors could produce all three EGRET sources. From Combiet al. (2001).
Although a thorough CO investigation has not yet been done for this SNR, current data from HIobservations do not support the presence of very dense and massive molecular clouds in its neighborhood(Pineault et al. 1997). It seems CTA 1 and 3EG J0010+7309 might be related only through the compactobject left by the latter (RX J0007.0+7302). A better localization of the γ-ray source with AGILE andGLAST will certainly test this suggestion.
11 SNRs discovered by their likely associated high-energy radiation
The SNR catalog compiled by Green (2000) is by no means complete. A large number of low surfacebrightness remnants remain to be discovered, hidden in the diffuse non-thermal continuum emission pro-duced by the diffuse component of the cosmic-ray electrons in the Galaxy. In recent years, the applicationof filtering techniques in radio continuum data has lead to the detection of several new SNR (e.g. Duncanet al. 1995, 1997, Jonas 1999, Combi et al. 1999, Klothes et al. 2001). The use of unidentified non-variableγ-ray sources as tracers of interacting remnants can result in new SNRs being discovered by their (plausiblyassociated) high-energy emission.
As it was emphasized in the previous sections, not all SNR generate observable γ-rays (say, at EGRETsensitivity) at typical Galactic distances. A second ingredient is necessary: a target, i.e., a dense mediumsuch as a molecular cloud. If a SN explodes in a cloudy medium then more than a single cloud could beilluminated by p− p collisions and thus multiple γ-ray sources can emerge. Clusters of steady unidentifiedγ-ray sources could trace these situations and lead to the discovery of new, very extended SNRs of lowradio surface brightness.
This approach of considering EGRET sources as tracers of SNRs has been applied by Combi et al.(1998, 2001), leading to the discovery of two new SNRs. The basic technique consists of making HI lineobservations in the direction of clearly non-variable γ-ray sources. If some well-defined but small clouds(M ∼ 103 − 104 M⊙) are found within the 95% contours of the 3EG sources at velocities that correspond,according to the galactic rotation curve, to distances of less than 1 kpc, then large-scale (i.e. several de-grees) radio continuum observations are carried out. These observations aim at detecting, through imagefiltering techniques, large SNRs of low surface brightness. Observations at more than a single frequency arenecessary in order to determine if the radio spectral index is non-thermal, as expected from such remnants.
The SNR candidates discovered by this procedure are G327-12.0, located in the ARA region (Combi etal 1998) and G06.5-12.0, located in Capricornus (Combi et al 2001): see Figure 29. The first one appearsto be responsible for the γ-ray source 3EG J1659-6251, whereas the second could be related to a cluster ofthree 3EG sources: 3EG J1834-2803, 3EG J1847-3219, and 3EG1850-2652. HI clouds have been found at
46
the positions of all these sources except for 3EG J1847-3219. Both remnants are thought to be so close thatcosmic-ray enhancement factors in the range 5 < ks < 45 are sufficient to explain the γ-sources throughπ0-decays alone. Their low radio surface-brightnesses rule out electronic Bremsstrahlung as the source ofthe GeV flux.
We expect that the use of filtering techniques in interferometric radio observations could lead to thediscovery of more such remnants in the near future (see, eg., Klothes et al. 2001), and with the improvedcapabilities of the next generation satellites, γ-ray emission from far more distant interacting SNRs couldbe detected.
12 SNRs and their neighborhoods as TeV sources
As can be seen in Table 7, several observations of SNRs such as W44, W51, γ-Cygni, W63 and Tycho’sSNR, selected because of their possible association with molecular clouds and/or EGRET sources, haveonly produced TeV emission upper limits (Buckley et al. 1998). This, as discussed below, could indicatespectral cutoffs or breaks in the GeV-TeV energy range. For instance, the required differential source spec-trum would have to steepen to ∼ E−2.5 for γ-Cygni in order to escape detection at TeV energies (Fegan2001).
Very recently (Aharonian et al. 2002a), the HEGRA system of imaging atmospheric Cherenkov tele-scopes reported a survey of one quarter of the Galactic plane (−2 < l < 85). TeV gamma-ray emissionfrom point sources and moderately extended sources (diameter less than 0.8 deg), including 86 known pul-sars (PSR), 63 known supernova remnants (SNR) and 9 GeV sources, were searched with negative results.Upper limits range from 0.15 Crab units up to several Crab units, depending on the observation time andzenith angles covered: no TeV source was detected above 4.5σ in a total observation time of 115 h. Atthe same time, a search for point sources of radiation above 15 TeV has been conducted with HEGRAAIROBICC array (Aharonian et al. 2002b), but only flux upper limits of around 1.3 times the flux of Crabnebula were obtained for candidate sources (including SNRs), depending, again, on the observation timeand zenith angles covered.
Positive detections, however, already exist. SN1006 (Tanimori et al. 1998) and RXJ1713.7-3946 (Mu-raishi et al. 2000, Enomoto et al. 2002) were detected by the CANGAROO telescopes. Observations ofSN1006 in 1996 and 1997 show a significant excess from the NW rim of the SNR. The excess is consistentwith the location of non-thermal X-rays detected by ASCA (Koyama et al. 1995). Theoretical modelingfor SN 1006 has also been performed (e.g. Berezhko et al. 2003).
Cassiopeia A was recently announced as TeV source by the HEGRA collaboration (Aharonian et al.2001c). 232 hours of observations yield an excess at the 4.9σ level, and a flux of F = 5.8 ± 1.2stat ±2syst × 10−13cm−2s−1 at (E> 1 TeV). The origin of the γ-rays has been recently discussed by Berezhkoet al. (2003). Cas A has already been associated with a bright source of hard X-rays which indicates apopulation of non-thermal electrons with energies up to 100 TeV (Allen et al. 1999b). Nevertheless, CasA is not a 3EG source, but this could be due only to the small EGRET sensitivity.
There have also been observations of unidentified γ-ray sources whose identifications are, perhaps, moretentative. These observations were made with the Whipple 10-m telescope (Buckley et al. 1997) Two ofthem were related with the 3EG sources in our sample, and details are provided in Table 7.
47

Table 7: TeV Observations of SNRs. Plerions are shown in the first panel and shell-type SNRs in thesecond. The third panel shows results for two 3EG sources coincident with SNRs for which there have alsobeen TeV observations. Partially adapted from Fegan (2001) and Mori (2001).
Object Exposure time Flux/Upper Limit or spectrumName (hours) 10−11cm−2s−1 or 10−11 cm−2 s−1 TeV−1
All TeV ObservatoriesCrab Nebula → ∞ 7.0 (> 400GeV)CANGAROOPSR 1706-44 60 0.15 (>1TeV)Vela Pulsar 116 0.26 (E/2 TeV)−2.4 TeV−1
DurhamPSR 1706-44 10 1.2 (>300GeV)Vela Pulsar 8.75 <5.0 (>300GeV)CANGAROORXJ 1713.7-3946 66 0.53 (≥1.8 TeV)RXJ 1713.7-3946f 32 0.53 1.63 ± 0.15 ± 0.32)E−2.84±0.15±0.20
SN1006 34 0.46 (≥1.7 TeV)W28 58 <0.88 (> 5 TeV)a
HEGRACas A 232 0.058 (> 1 TeV)b
γ-Cygni 47 <1.1 (>500GeV)c
Monoceros 120 ?e
DurhamSN1006 41 <1.7 (>300GeV)WhippleMonoceros 13.1 <4.8 (>500GeV)Cas A 6.9 <0.66 (>500GeV)W44 6 <3.0 (>300GeV)W51 7.8 <3.6 (>300GeV)γ-Cygni 9.3 <2.2 (>300GeV)W63 2.3 <6.4 (>300GeV)Tycho 14.5 <0.8 (>300GeV)CATCasA 24.4 <0.74 (>400GeV)
J2016+3657 287 5.8d
J2020+4017 513 0.990d
aA different definition of Energy Threshold is used. bEvidence for emission at the 4.9σ level (Puhlhofer et al. 2001).cLimits converted from Crab units using flux of Hillas et al. (1998). dIntegral Flux Above 400 GeV. eNot yet
reported. fObservations made with CANGAROO-II (Enomoto et al. 2002).
48
The Crab Nebula has been detected by several Cherenkov observatories and it is often used to providea check on the calibration of new instruments (e.g. Aharonian et al. 2000). STACEE and CELESTE,on which we comment below, have published significant detections of the Crab Nebula in an energy rangelower than that obtained by others ground-based instruments, E > 190 ± 60 GeV (Oser et al. 2000) andE > 50GeV (De Naurois et al. 2001), respectively. The Crab’s energy spectrum between 300GeV and50TeV has been well established (see below), and it steepens with energy (Hillas et al. 1998, Aharonianet al. 2000). No pulsation has yet been seen (Gillanders et al. 1997, Burdett et al. 1999, Aharonian et al.1999).
The CANGAROO team has detected the pulsar PSR 1706-44 in 60 hours of observations (Kifune etal. 1995). They have also detected the Vela pulsar at the 6σ level, based on ∼ 120 hours of observation.Observations by the Durham group (Chadwick et al. 1997) also confirmed these detections. In the case ofVela, the VHE signal, which is offset from the location of the pulsar by 0.14◦, is thought to originate from asynchrotron nebula, powered by a population of relativistic electrons which were created in the supernovaexplosion and which have survived since then due to the low magnetic field in the nebula.
13 Concluding remarks
The coming years will be exciting times again for γ-ray astronomy – after the unfortunate forced demiseof the Compton Observatory. INTEGRAL, AGILE, MAGIC, and the new stereo-IACTs are or shouldbe on-line soon; and in the longer term, GLAST will surely bring about another revolution, answeringexisting questions, such as the one reviewed here, and posing further challenges. Ultimately, it will takea sensitive and high spatial-resolution MeV-GeV detector such as GLAST working in close consort withthe ground-based TeV and radio telescopes to address the Galactic cosmic ray origin problem: the singlemost definitive test that SNRs (or any other putative sources) are accelerating CR nuclei would be thestatistically significant detection of the signature neutral pion γ-ray hump centered at 67.5 MeV (in log Eγ),as has been seen already by EGRET in the diffuse γ-ray background (Hunter et al. 1997). Though sucha detection, by itself, only proves the existence of lower energy (∼1 GeV/n) nuclei, the detection allowsto normalize the hadronic vs. electronic contributions in a model–independent fashion at those ‘lower’energies. Thus, such a detection together with the extension of the spectrum into the TeV regime, and amultiwavelength spectrum inconsistent with an electronic origin, ought to be sufficient evidence to concludethat nuclei are being accelerated by SNRs. It remains to be seen if this will cleanly be borne out by thedata.
In any case, the SNR-EGRET connection looks stronger than ever. Several cases for a physical associa-tion, based on the analysis of gamma-ray data and the molecular environment of the SNR, has been shownpromising and a definite conclusion about the origin of cosmic rays in SNR shocks seems to be reachablein a nearby future. Very recently, Erlykin and Wolfendale (2003) have shown, in addition, that for somenearby SNRs, and even when there is no gamma-ray signature, the idea of cosmic ray production in theshocks cannot be discarded since there could be a possible evacuation of ambient gas by the stellar windof the progenitor star, or by the explosion of a nearby earlier supernova. The case by case analysis shows,moreover, that it is at least plausible that EGRET has detected distant (more than 6 kpc) SNRs. Thereare 5 coinciding pairs of 3EG sources and SNRs for which the latter apparently lie at such high values ofdistance (disregarding those related with SNRs spatially close to the galactic center). For all these cases,we have uncovered the existence of nearby, large, in some cases giant, molecular clouds that could enhancethe GeV signal through pion decay. It is possible that the physical relationship between the 3EG sourceand the coinciding SNR could provide for these pairs a substantial part of the GeV emission observed.
49
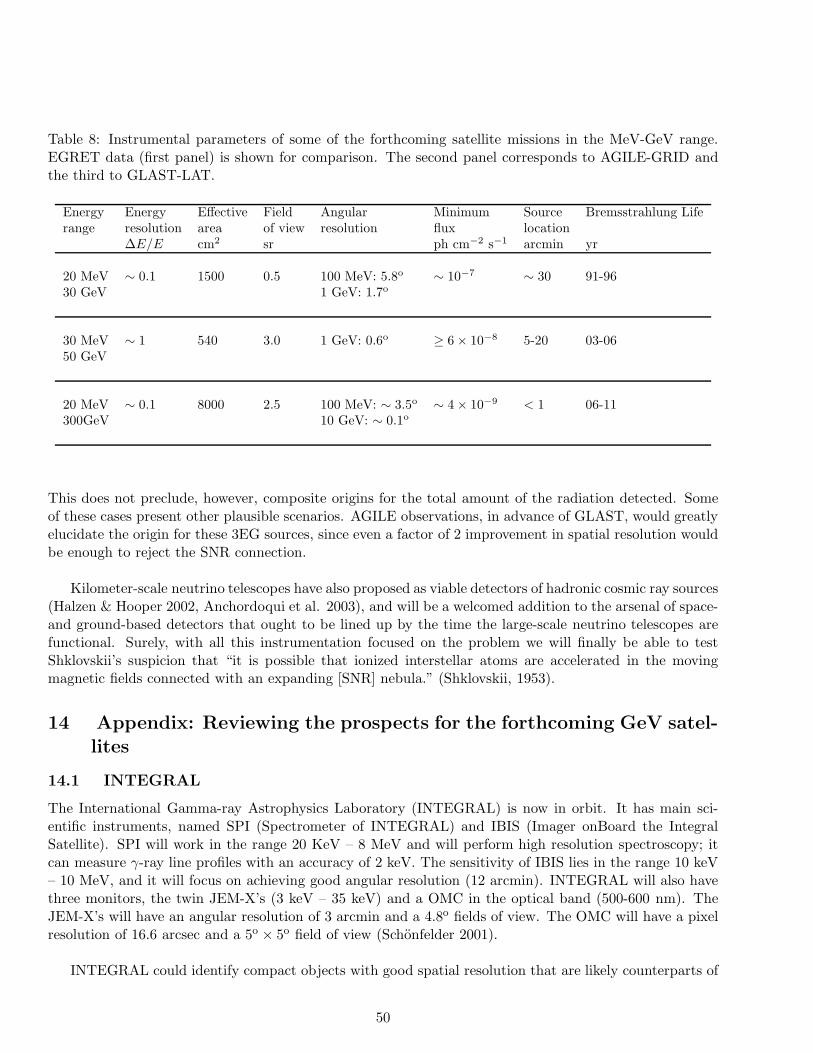
Table 8: Instrumental parameters of some of the forthcoming satellite missions in the MeV-GeV range.EGRET data (first panel) is shown for comparison. The second panel corresponds to AGILE-GRID andthe third to GLAST-LAT.
Energy Energy Effective Field Angular Minimum Source Bremsstrahlung Liferange resolution area of view resolution flux location
∆E/E cm2 sr ph cm−2 s−1 arcmin yr
20 MeV ∼ 0.1 1500 0.5 100 MeV: 5.8o ∼ 10−7 ∼ 30 91-9630 GeV 1 GeV: 1.7o
30 MeV ∼ 1 540 3.0 1 GeV: 0.6o ≥ 6 × 10⁻⁸ 5-20 03-0650 GeV
20 MeV ∼ 0.1 8000 2.5 100 MeV: ∼ 3.5o ∼ 4 × 10⁻⁹ < 1 06-11300GeV 10 GeV: ∼ 0.1o
This does not preclude, however, composite origins for the total amount of the radiation detected. Someof these cases present other plausible scenarios. AGILE observations, in advance of GLAST, would greatlyelucidate the origin for these 3EG sources, since even a factor of 2 improvement in spatial resolution wouldbe enough to reject the SNR connection.
Kilometer-scale neutrino telescopes have also proposed as viable detectors of hadronic cosmic ray sources(Halzen & Hooper 2002, Anchordoqui et al. 2003), and will be a welcomed addition to the arsenal of space-and ground-based detectors that ought to be lined up by the time the large-scale neutrino telescopes arefunctional. Surely, with all this instrumentation focused on the problem we will finally be able to testShklovskii’s suspicion that “it is possible that ionized interstellar atoms are accelerated in the movingmagnetic fields connected with an expanding [SNR] nebula.” (Shklovskii, 1953).
14 Appendix: Reviewing the prospects for the forthcoming GeV satel-lites
14.1 INTEGRAL
The International Gamma-ray Astrophysics Laboratory (INTEGRAL) is now in orbit. It has main sci-entific instruments, named SPI (Spectrometer of INTEGRAL) and IBIS (Imager onBoard the IntegralSatellite). SPI will work in the range 20 KeV – 8 MeV and will perform high resolution spectroscopy; itcan measure γ-ray line profiles with an accuracy of 2 keV. The sensitivity of IBIS lies in the range 10 keV– 10 MeV, and it will focus on achieving good angular resolution (12 arcmin). INTEGRAL will also havethree monitors, the twin JEM-X’s (3 keV – 35 keV) and a OMC in the optical band (500-600 nm). TheJEM-X’s will have an angular resolution of 3 arcmin and a 4.8o fields of view. The OMC will have a pixelresolution of 16.6 arcsec and a 5o × 5o field of view (Schonfelder 2001).
INTEGRAL could identify compact objects with good spatial resolution that are likely counterparts of
50

EGRET sources, and will help confirm or reject interpretations based, for instance, on microquasars andγ-ray blazars. The INTEGRAL galactic plane exposure will help to clarify the confused region near Vela.Another 1 Ms exposure, part of the satellite Open Program, will focus on the Carina region. That partof the sky is populated with five EGRET sources, two of which were analyzed above in the case-by-casestudy: 3EG J1102-6103 and 3EG J1013-5915. As an example of its potential, we will briefly discuss whatINTEGRAL can do in establishing the nature of these sources.
The former case, 3EG J1102-6103, was briefly mentioned in the corresponding section above. Althougha hadronic origin for the γ-ray emission is possible for this source, it could also be the result of inverseCompton up-scattering of UV photons by electrons accelerated in the winds of one or several Wolf-Rayetstars (particularly in the region where the winds of W39 and WR38B collide). If the latter explanation iscorrect, INTEGRAL should see a source where the winds collide.
In the latter case, the source 3EG J1013-5915 is likely mostly produced by PSR J1013-5915 (Camiloet al. 2001). The JEM-X monitor, in particular, could then probe the putative non-thermal emissionfrom this region, especially the tail of the synchrotron spectrum and, in this way, help to determine thehigh-energy cutoff of the electron population in the source.
In addition, there have been suggestions that INTEGRAL could detect the 0.511 MeV line from giantmolecular clouds (see e.g. Guessoum et al. 2001). Giant molecular clouds are typically surrounded by HIIregions, ionized in an uncertain fraction. If cosmic-rays are diffusing into the cloud, the cores, too, may beionized. If a sufficient density of cosmic-rays is present, they could excite CNO nuclei as well as lead to theproduction of nuclear gamma-rays lines and positron-production, the latter being emitted by radioactivenuclei. The fluxes and line separations predicted are on the verge of detectability by INTEGRAL (Gues-soum et al. 2001), but it will be an interesting arena to explore with forthcoming observations, particularlyfor those giant molecular clouds closer to Earth (regrettably not the ones we find superposed with the SNRsin Table 1).
Thus, although it is expected that no direct observations with INTEGRAL can prove that cosmic-rays are accelerated in SNR shocks (the energy range of the relevant phenomena, around 100 MeV andbeyond, is out of the INTEGRAL energy band), they can be used to explore alternative explanationsfor the unidentified EGRET sources, and so are important to get an overall picture of the SNR-EGRETsource connection. Nuclear gamma-ray line signatures in the 0.1-10 MeV band will certainly also provideimportant hints regarding the CR acceleration processes in the Galaxy.
14.2 AGILE
AGILE (Astro-rivelatore Gamma a Immagini Leggero), is expected to be launched in 2003 (for a recentreview see Tavani et al. 2001). AGILE will have a very large field of view, covering at one time approxi-mately 1/5 of the sky at energies between 30 MeV and 50 GeV. The angular resolution will be a factor oftwo better than that of EGRET, specifically due to the GRID instrument, whose parameters are given inTable 8. However, the sensitivity for point-like sources will remain comparable to that of EGRET. AGILEwill also have detection and imaging capabilities in the hard X-ray range provided by the Super-AGILEdetector. The main goals of Super-AGILE are the simultaneous γ-ray and hard X-ray detection of astro-physical sources (which was never achieved by previous γ-ray instruments), improved source positioning(1-3 arcmins, depending on intensity), fast burst alert, and on-board triggering capability.
AGILE is thus very well suited for studying compact objects, particularily those presenting γ-ray
51
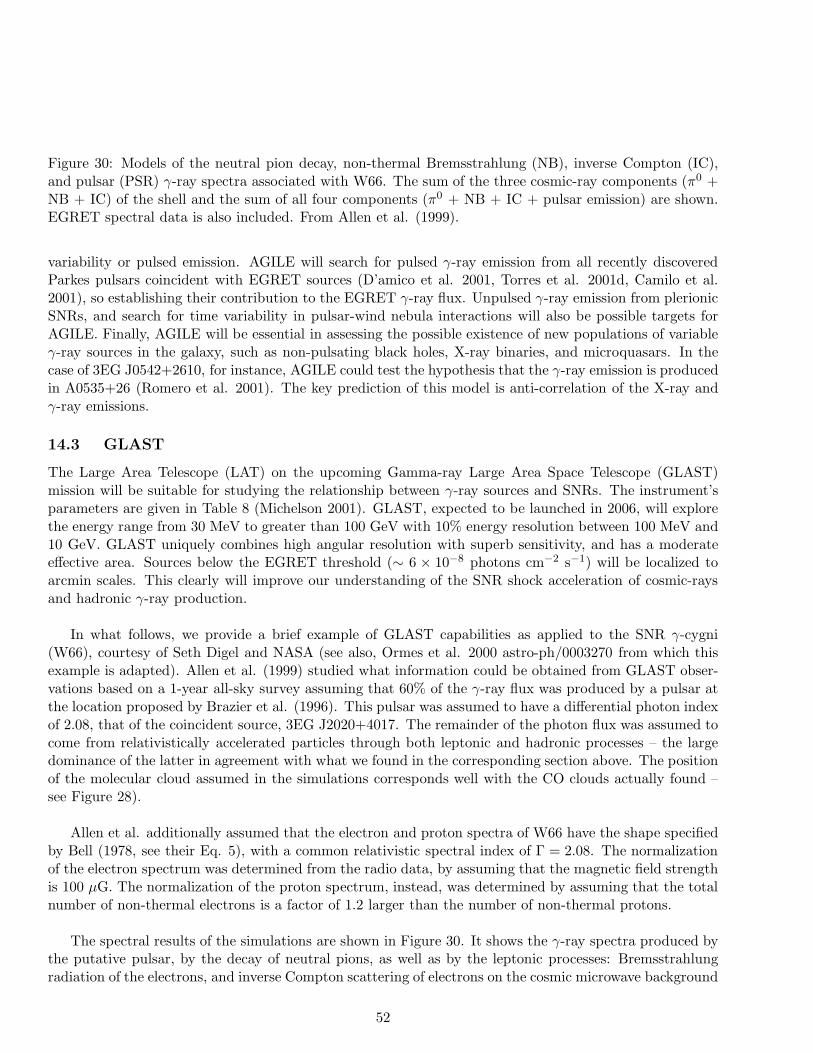
Figure 30: Models of the neutral pion decay, non-thermal Bremsstrahlung (NB), inverse Compton (IC),and pulsar (PSR) γ-ray spectra associated with W66. The sum of the three cosmic-ray components (π0 +NB + IC) of the shell and the sum of all four components (π0 + NB + IC + pulsar emission) are shown.EGRET spectral data is also included. From Allen et al. (1999).
variability or pulsed emission. AGILE will search for pulsed γ-ray emission from all recently discoveredParkes pulsars coincident with EGRET sources (D’amico et al. 2001, Torres et al. 2001d, Camilo et al.2001), so establishing their contribution to the EGRET γ-ray flux. Unpulsed γ-ray emission from plerionicSNRs, and search for time variability in pulsar-wind nebula interactions will also be possible targets forAGILE. Finally, AGILE will be essential in assessing the possible existence of new populations of variableγ-ray sources in the galaxy, such as non-pulsating black holes, X-ray binaries, and microquasars. In thecase of 3EG J0542+2610, for instance, AGILE could test the hypothesis that the γ-ray emission is producedin A0535+26 (Romero et al. 2001). The key prediction of this model is anti-correlation of the X-ray andγ-ray emissions.
14.3 GLAST
The Large Area Telescope (LAT) on the upcoming Gamma-ray Large Area Space Telescope (GLAST)mission will be suitable for studying the relationship between γ-ray sources and SNRs. The instrument’sparameters are given in Table 8 (Michelson 2001). GLAST, expected to be launched in 2006, will explorethe energy range from 30 MeV to greater than 100 GeV with 10% energy resolution between 100 MeV and10 GeV. GLAST uniquely combines high angular resolution with superb sensitivity, and has a moderateeffective area. Sources below the EGRET threshold (∼ 6 × 10⁻⁸ photons cm−2 s−1) will be localized toarcmin scales. This clearly will improve our understanding of the SNR shock acceleration of cosmic-raysand hadronic γ-ray production.
In what follows, we provide a brief example of GLAST capabilities as applied to the SNR γ-cygni(W66), courtesy of Seth Digel and NASA (see also, Ormes et al. 2000 astro-ph/0003270 from which thisexample is adapted). Allen et al. (1999) studied what information could be obtained from GLAST obser-vations based on a 1-year all-sky survey assuming that 60% of the γ-ray flux was produced by a pulsar atthe location proposed by Brazier et al. (1996). This pulsar was assumed to have a differential photon indexof 2.08, that of the coincident source, 3EG J2020+4017. The remainder of the photon flux was assumed tocome from relativistically accelerated particles through both leptonic and hadronic processes – the largedominance of the latter in agreement with what we found in the corresponding section above. The positionof the molecular cloud assumed in the simulations corresponds well with the CO clouds actually found –see Figure 28).
Allen et al. additionally assumed that the electron and proton spectra of W66 have the shape specifiedby Bell (1978, see their Eq. 5), with a common relativistic spectral index of Γ = 2.08. The normalizationof the electron spectrum was determined from the radio data, by assuming that the magnetic field strengthis 100 µG. The normalization of the proton spectrum, instead, was determined by assuming that the totalnumber of non-thermal electrons is a factor of 1.2 larger than the number of non-thermal protons.
The spectral results of the simulations are shown in Figure 30. It shows the γ-ray spectra produced bythe putative pulsar, by the decay of neutral pions, as well as by the leptonic processes: Bremsstrahlungradiation of the electrons, and inverse Compton scattering of electrons on the cosmic microwave background
52
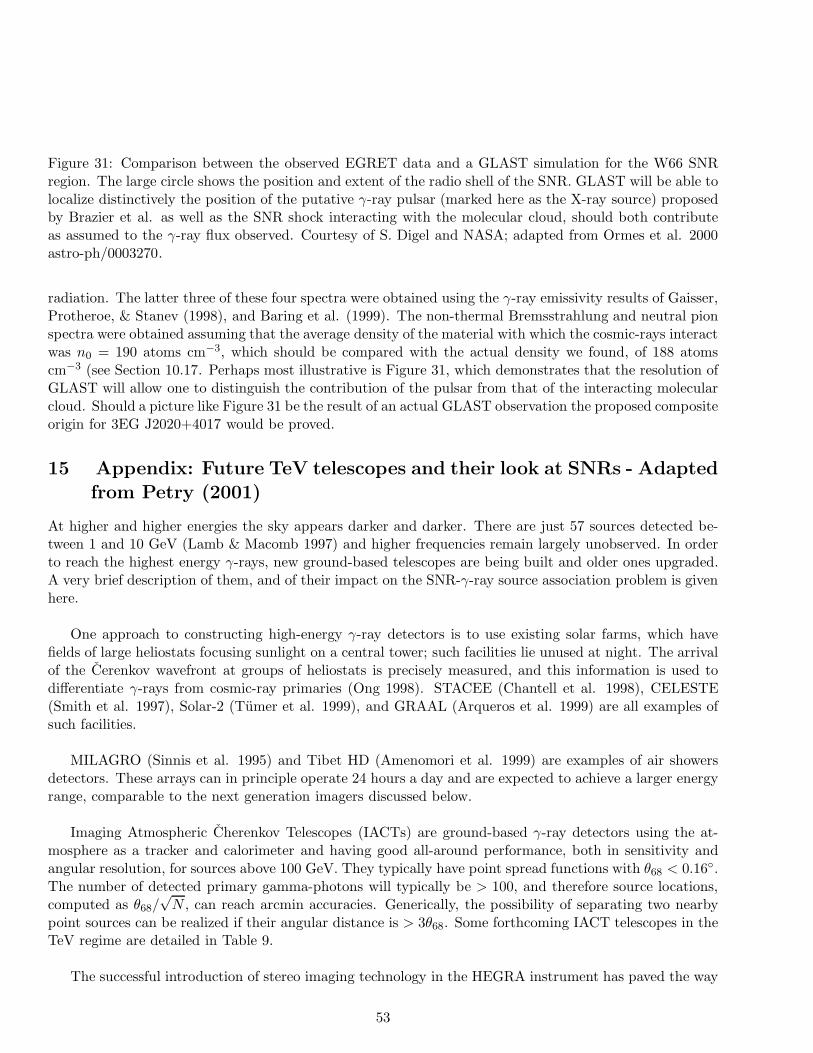
Figure 31: Comparison between the observed EGRET data and a GLAST simulation for the W66 SNRregion. The large circle shows the position and extent of the radio shell of the SNR. GLAST will be able tolocalize distinctively the position of the putative γ-ray pulsar (marked here as the X-ray source) proposedby Brazier et al. as well as the SNR shock interacting with the molecular cloud, should both contributeas assumed to the γ-ray flux observed. Courtesy of S. Digel and NASA; adapted from Ormes et al. 2000astro-ph/0003270.
radiation. The latter three of these four spectra were obtained using the γ-ray emissivity results of Gaisser,Protheroe, & Stanev (1998), and Baring et al. (1999). The non-thermal Bremsstrahlung and neutral pionspectra were obtained assuming that the average density of the material with which the cosmic-rays interactwas n0 = 190 atoms cm−3, which should be compared with the actual density we found, of 188 atomscm−3 (see Section 10.17. Perhaps most illustrative is Figure 31, which demonstrates that the resolution ofGLAST will allow one to distinguish the contribution of the pulsar from that of the interacting molecularcloud. Should a picture like Figure 31 be the result of an actual GLAST observation the proposed compositeorigin for 3EG J2020+4017 would be proved.
15 Appendix: Future TeV telescopes and their look at SNRs - Adapted
from Petry (2001)
At higher and higher energies the sky appears darker and darker. There are just 57 sources detected be-tween 1 and 10 GeV (Lamb & Macomb 1997) and higher frequencies remain largely unobserved. In orderto reach the highest energy γ-rays, new ground-based telescopes are being built and older ones upgraded.A very brief description of them, and of their impact on the SNR-γ-ray source association problem is givenhere.
One approach to constructing high-energy γ-ray detectors is to use existing solar farms, which havefields of large heliostats focusing sunlight on a central tower; such facilities lie unused at night. The arrivalof the Cerenkov wavefront at groups of heliostats is precisely measured, and this information is used todifferentiate γ-rays from cosmic-ray primaries (Ong 1998). STACEE (Chantell et al. 1998), CELESTE(Smith et al. 1997), Solar-2 (Tumer et al. 1999), and GRAAL (Arqueros et al. 1999) are all examples ofsuch facilities.
MILAGRO (Sinnis et al. 1995) and Tibet HD (Amenomori et al. 1999) are examples of air showersdetectors. These arrays can in principle operate 24 hours a day and are expected to achieve a larger energyrange, comparable to the next generation imagers discussed below.
Imaging Atmospheric Cherenkov Telescopes (IACTs) are ground-based γ-ray detectors using the at-mosphere as a tracker and calorimeter and having good all-around performance, both in sensitivity andangular resolution, for sources above 100 GeV. They typically have point spread functions with θ68 < 0.16◦.The number of detected primary gamma-photons will typically be > 100, and therefore source locations,computed as θ68/
√N , can reach arcmin accuracies. Generically, the possibility of separating two nearby
point sources can be realized if their angular distance is > 3θ68. Some forthcoming IACT telescopes in theTeV regime are detailed in Table 9.
The successful introduction of stereo imaging technology in the HEGRA instrument has paved the way
53
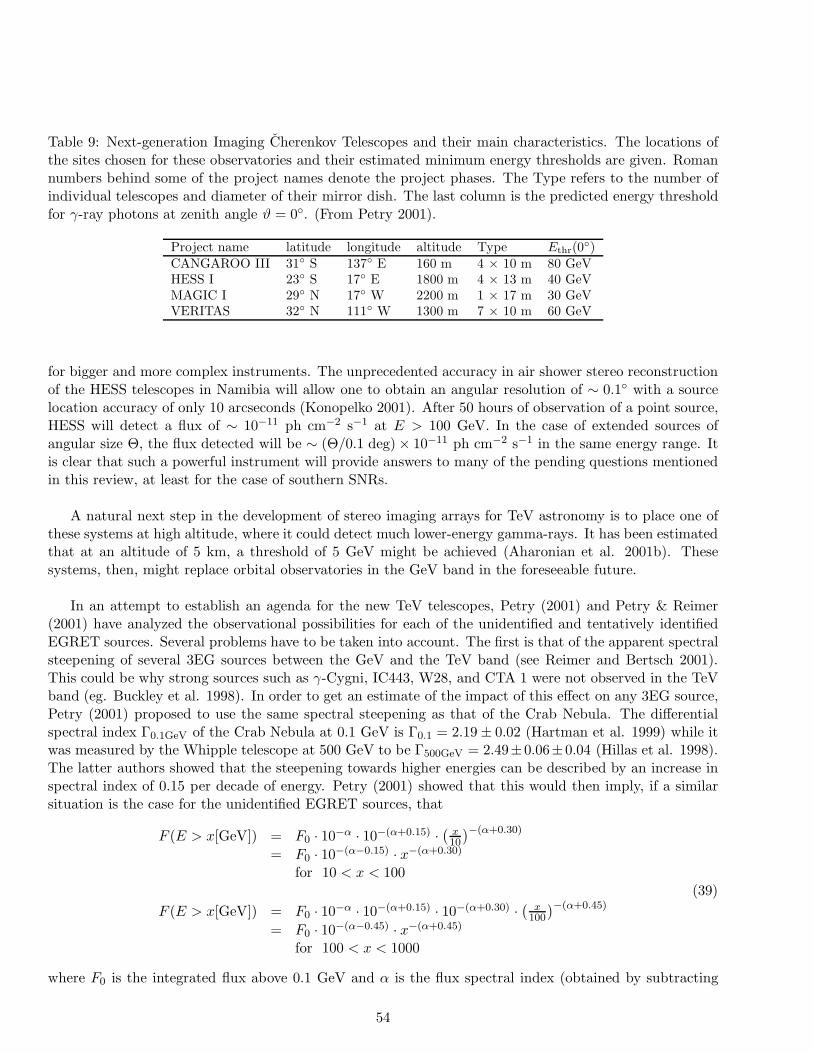
Table 9: Next-generation Imaging Cherenkov Telescopes and their main characteristics. The locations ofthe sites chosen for these observatories and their estimated minimum energy thresholds are given. Romannumbers behind some of the project names denote the project phases. The Type refers to the number ofindividual telescopes and diameter of their mirror dish. The last column is the predicted energy thresholdfor γ-ray photons at zenith angle ϑ = 0◦. (From Petry 2001).
Project name latitude longitude altitude Type Ethr(0◦)
CANGAROO III 31◦ S 137◦ E 160 m 4 × 10 m 80 GeVHESS I 23◦ S 17◦ E 1800 m 4 × 13 m 40 GeVMAGIC I 29◦ N 17◦ W 2200 m 1 × 17 m 30 GeVVERITAS 32◦ N 111◦ W 1300 m 7 × 10 m 60 GeV
for bigger and more complex instruments. The unprecedented accuracy in air shower stereo reconstructionof the HESS telescopes in Namibia will allow one to obtain an angular resolution of ∼ 0.1◦ with a sourcelocation accuracy of only 10 arcseconds (Konopelko 2001). After 50 hours of observation of a point source,HESS will detect a flux of ∼ 10−11 ph cm−2 s−1 at E > 100 GeV. In the case of extended sources ofangular size Θ, the flux detected will be ∼ (Θ/0.1 deg) × 10−11 ph cm−2 s−1 in the same energy range. Itis clear that such a powerful instrument will provide answers to many of the pending questions mentionedin this review, at least for the case of southern SNRs.
A natural next step in the development of stereo imaging arrays for TeV astronomy is to place one ofthese systems at high altitude, where it could detect much lower-energy gamma-rays. It has been estimatedthat at an altitude of 5 km, a threshold of 5 GeV might be achieved (Aharonian et al. 2001b). Thesesystems, then, might replace orbital observatories in the GeV band in the foreseeable future.
In an attempt to establish an agenda for the new TeV telescopes, Petry (2001) and Petry & Reimer(2001) have analyzed the observational possibilities for each of the unidentified and tentatively identifiedEGRET sources. Several problems have to be taken into account. The first is that of the apparent spectralsteepening of several 3EG sources between the GeV and the TeV band (see Reimer and Bertsch 2001).This could be why strong sources such as γ-Cygni, IC443, W28, and CTA 1 were not observed in the TeVband (eg. Buckley et al. 1998). In order to get an estimate of the impact of this effect on any 3EG source,Petry (2001) proposed to use the same spectral steepening as that of the Crab Nebula. The differentialspectral index Γ0.1GeV of the Crab Nebula at 0.1 GeV is Γ0.1 = 2.19 ± 0.02 (Hartman et al. 1999) while itwas measured by the Whipple telescope at 500 GeV to be Γ500GeV = 2.49±0.06±0.04 (Hillas et al. 1998).The latter authors showed that the steepening towards higher energies can be described by an increase inspectral index of 0.15 per decade of energy. Petry (2001) showed that this would then imply, if a similarsituation is the case for the unidentified EGRET sources, that
F (E > x[GeV]) = F0 · 10−α · 10−(α+0.15) ·(
x10
)−(α+0.30)
= F0 · 10−(α−0.15) · x−(α+0.30)
for 10 < x < 100
F (E > x[GeV]) = F0 · 10−α · 10−(α+0.15) · 10−(α+0.30) ·( x
100
)−(α+0.45)
= F0 · 10−(α−0.45) · x−(α+0.45)
for 100 < x < 1000
(39)
where F0 is the integrated flux above 0.1 GeV and α is the flux spectral index (obtained by subtracting
54

1.0 from the differential spectral index Γ, quoted for instance in Table 1) of a given source taken from theThird EGRET Catalog. An extrapolation without taking into account possible breaks in the spectrumcould give a large over-estimation of the high-energy flux. Although not valid for all sources, the previousscheme can be used to give an idea of the expected flux from interesting 3EG detections (Petry 2001, Petry& Reimer 2001). Nonetheless, not only the spectral cutoffs, but other technical problems affect actualobservation. 5
Taking these considerations into account it is possible to determine which of the 3EG sources analyzedhere might be detected by the next generation IACTs. 12 out of the 19 SNR-EGRET cases listed in Table 1can be considered likely candidates, from a practical point of view. The complete results for all 3EG sourcessuperposed to SNRs that might be detected in less than 50 hours is compiled in Table 10. Columns areas follows: 3EG name, radius of the 95% confidence contour, spectral index at 0.1 GeV, all from Hartmanet al. (1999), minimum zenith angle, IACTs minimum energy threshold, expected flux at the minimumenergy threshold, the integral spectral index at the IACTs minimum energy threshold for this source, theobservation time to obtain a detection with 5 σ significance (in brackets are the corresponding data if thespectrum at 0.1 GeV was steeper by one standard deviation). A ‡-mark indicates that the detection isphoton flux limited: the observation time was increased such that 100 photons are detected.
Many of the SNR-EGRET pairs studied will be primary candidates for one or several of the forthcomingIACTs. A combination of TeV and GeV observations, together with an understanding of the molecularmaterial distribution of the region, will be crucial in determining the nature of several of the unidentifiedEGRET sources analyzed here.
Acknowledgments
We thank Fumio Yamamoto, Masumichi Seta, Toshihiro Handa, and Tetsuo Hasegawa for providing CO(2-1) survey data toward the SNRs IC443, W44, and W66. We acknowledge F. Aharonian, M. Mori, F.Bocchino, J. Paredes and S. Digel for their kind permission to reproduce Figures 5 and 6, 3, 11, 23, and 31,respectively. We thank D. Petry for his permission to adapt part of his work (Petry 2001) in Section 15. Wefurther acknowledge Felix Aharonian, Seth Digel, Dave Thompson, Don Ellison, Paula Benaglia, MischaMalkov, Olaf Reimer, and Isabelle Grenier for useful comments. We remain grateful to the Referee, whoprovided a detailed review which made us improve the manuscript. D.F.T. was supported by Princeton
5Cherenkov telescopes typically cannot observe at zenith angles much larger than 70◦. The zenith angle ϑ at the upperculmination of an astronomical object depends on the the latitude φ of the observatory and the declination DEC of the objectaccording to ϑ = |φ − DEC|. Therefore, the condition |φ − DEC| ≤ 70◦ has to be imposed in the selection of observableobjects. The area perpendicular to the optical axis illuminated by the Cherenkov light at the position of the telescope isproportional to the square of the distance d to the shower maximum. d grows with ϑ as d ∝ 1/ cos(ϑ). The energy thresholdEthr of a Cherenkov telescope is equivalent to a Cherenkov photon density threshold ρthr at the position of the telescope. ρthr
is an instrumental constant determined by the trigger condition of the data acquisition system. These parameters depend onthe zenith angle ϑ and the primary photon energy, and impact directly on the required flux sensitivity for an observation tobe plausible. Under reasonable assumptions, ρ(E,ϑ) ∝ E · cos2(ϑ) (Petry 2001), and then, to satisfy the trigger conditionρ(E,ϑ) > ρthr, E has to increase with ϑ as Ethr(ϑ) = Ethr(0
◦) · cos−2(ϑ), with the values for Ethr(0◦) shown in Table 9. An
increase in effective collection area is accompanied by a proportional increase in hadronic background rate, such that the gain influx sensitivity is therefore only the square-root of the gain in area. If we define, F5σ(Ethr) as the integral flux above the energythreshold Ethr which results in a 5σ detection after 50 h of observation time, F5σ(Ethr(ϑ), ϑ) = F5σ(Ethr(0
◦), 0◦) · cos−1(ϑ).The last main ingredient that has to be considered is the needed observation time itself. It can be computed as (Petry 2001)
T5σ(Ethr) =(
F (Ethr)F5σ
(Ethr)
)−2
· 50h. Objects requiring much more than 50-100 hours will probably be excluded from the first
years of operation of the next generation IACTs, since, typically, the maximum expected duty cycle for these telescopes willbe about 1000 hours yr−1.
55
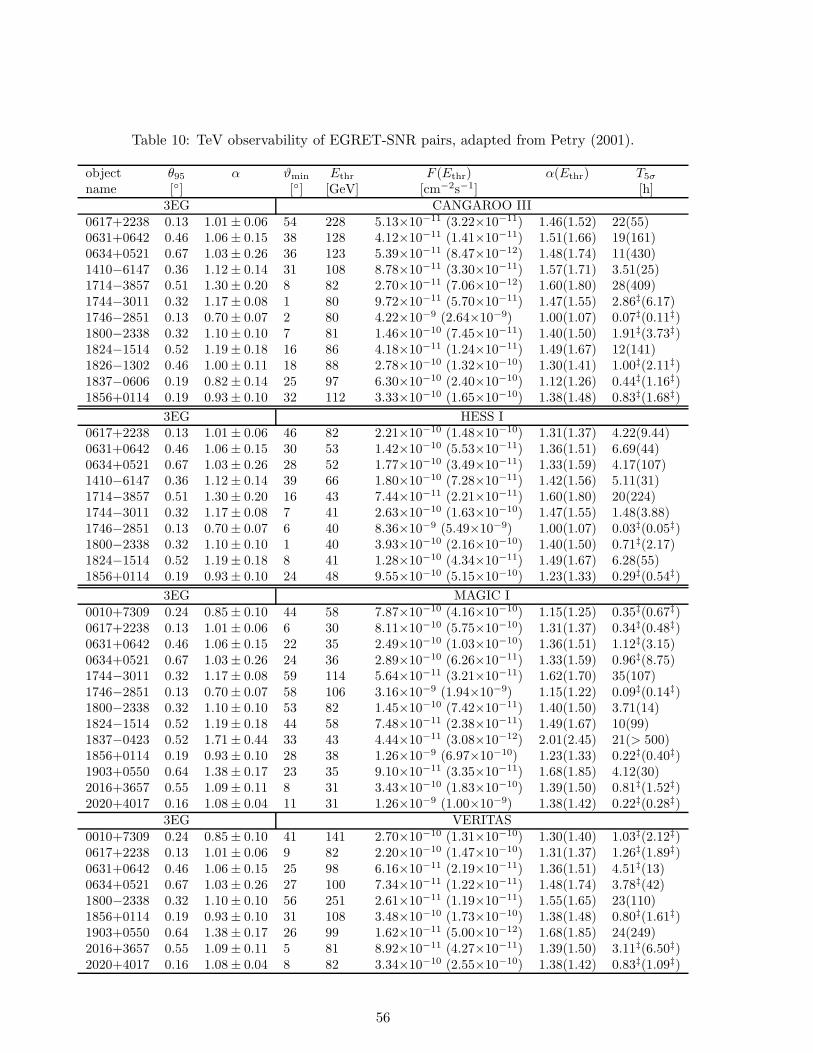
Table 10: TeV observability of EGRET-SNR pairs, adapted from Petry (2001).
object θ95 α ϑmin Ethr F (Ethr) α(Ethr) T5σ
name [◦] [◦] [GeV] [cm−2s−1] [h]3EG CANGAROO III
0617+2238 0.13 1.01 ± 0.06 54 228 5.13×10⁻¹¹ (3.22×10⁻¹¹) 1.46(1.52) 22(55)0631+0642 0.46 1.06 ± 0.15 38 128 4.12×10⁻¹¹ (1.41×10⁻¹¹) 1.51(1.66) 19(161)0634+0521 0.67 1.03 ± 0.26 36 123 5.39×10⁻¹¹ (8.47×10⁻¹²) 1.48(1.74) 11(430)1410−6147 0.36 1.12 ± 0.14 31 108 8.78×10⁻¹¹ (3.30×10⁻¹¹) 1.57(1.71) 3.51(25)1714−3857 0.51 1.30 ± 0.20 8 82 2.70×10⁻¹¹ (7.06×10⁻¹²) 1.60(1.80) 28(409)1744−3011 0.32 1.17 ± 0.08 1 80 9.72×10⁻¹¹ (5.70×10⁻¹¹) 1.47(1.55) 2.86‡(6.17)1746−2851 0.13 0.70 ± 0.07 2 80 4.22×10⁻⁹ (2.64×10⁻⁹) 1.00(1.07) 0.07‡(0.11‡)1800−2338 0.32 1.10 ± 0.10 7 81 1.46×10⁻¹⁰ (7.45×10⁻¹¹) 1.40(1.50) 1.91‡(3.73‡)1824−1514 0.52 1.19 ± 0.18 16 86 4.18×10⁻¹¹ (1.24×10⁻¹¹) 1.49(1.67) 12(141)1826−1302 0.46 1.00 ± 0.11 18 88 2.78×10⁻¹⁰ (1.32×10⁻¹⁰) 1.30(1.41) 1.00‡(2.11‡)1837−0606 0.19 0.82 ± 0.14 25 97 6.30×10⁻¹⁰ (2.40×10⁻¹⁰) 1.12(1.26) 0.44‡(1.16‡)1856+0114 0.19 0.93 ± 0.10 32 112 3.33×10⁻¹⁰ (1.65×10⁻¹⁰) 1.38(1.48) 0.83‡(1.68‡)
3EG HESS I0617+2238 0.13 1.01 ± 0.06 46 82 2.21×10⁻¹⁰ (1.48×10⁻¹⁰) 1.31(1.37) 4.22(9.44)0631+0642 0.46 1.06 ± 0.15 30 53 1.42×10⁻¹⁰ (5.53×10⁻¹¹) 1.36(1.51) 6.69(44)0634+0521 0.67 1.03 ± 0.26 28 52 1.77×10⁻¹⁰ (3.49×10⁻¹¹) 1.33(1.59) 4.17(107)1410−6147 0.36 1.12 ± 0.14 39 66 1.80×10⁻¹⁰ (7.28×10⁻¹¹) 1.42(1.56) 5.11(31)1714−3857 0.51 1.30 ± 0.20 16 43 7.44×10⁻¹¹ (2.21×10⁻¹¹) 1.60(1.80) 20(224)1744−3011 0.32 1.17 ± 0.08 7 41 2.63×10⁻¹⁰ (1.63×10⁻¹⁰) 1.47(1.55) 1.48(3.88)1746−2851 0.13 0.70 ± 0.07 6 40 8.36×10⁻⁹ (5.49×10⁻⁹) 1.00(1.07) 0.03‡(0.05‡)1800−2338 0.32 1.10 ± 0.10 1 40 3.93×10⁻¹⁰ (2.16×10⁻¹⁰) 1.40(1.50) 0.71‡(2.17)1824−1514 0.52 1.19 ± 0.18 8 41 1.28×10⁻¹⁰ (4.34×10⁻¹¹) 1.49(1.67) 6.28(55)1856+0114 0.19 0.93 ± 0.10 24 48 9.55×10⁻¹⁰ (5.15×10⁻¹⁰) 1.23(1.33) 0.29‡(0.54‡)
3EG MAGIC I
0010+7309 0.24 0.85 ± 0.10 44 58 7.87×10⁻¹⁰ (4.16×10⁻¹⁰) 1.15(1.25) 0.35‡(0.67‡)0617+2238 0.13 1.01 ± 0.06 6 30 8.11×10⁻¹⁰ (5.75×10⁻¹⁰) 1.31(1.37) 0.34‡(0.48‡)0631+0642 0.46 1.06 ± 0.15 22 35 2.49×10⁻¹⁰ (1.03×10⁻¹⁰) 1.36(1.51) 1.12‡(3.15)0634+0521 0.67 1.03 ± 0.26 24 36 2.89×10⁻¹⁰ (6.26×10⁻¹¹) 1.33(1.59) 0.96‡(8.75)1744−3011 0.32 1.17 ± 0.08 59 114 5.64×10⁻¹¹ (3.21×10⁻¹¹) 1.62(1.70) 35(107)1746−2851 0.13 0.70 ± 0.07 58 106 3.16×10⁻⁹ (1.94×10⁻⁹) 1.15(1.22) 0.09‡(0.14‡)1800−2338 0.32 1.10 ± 0.10 53 82 1.45×10⁻¹⁰ (7.42×10⁻¹¹) 1.40(1.50) 3.71(14)1824−1514 0.52 1.19 ± 0.18 44 58 7.48×10⁻¹¹ (2.38×10⁻¹¹) 1.49(1.67) 10(99)1837−0423 0.52 1.71 ± 0.44 33 43 4.44×10⁻¹¹ (3.08×10⁻¹²) 2.01(2.45) 21(> 500)1856+0114 0.19 0.93 ± 0.10 28 38 1.26×10⁻⁹ (6.97×10⁻¹⁰) 1.23(1.33) 0.22‡(0.40‡)1903+0550 0.64 1.38 ± 0.17 23 35 9.10×10⁻¹¹ (3.35×10⁻¹¹) 1.68(1.85) 4.12(30)2016+3657 0.55 1.09 ± 0.11 8 31 3.43×10⁻¹⁰ (1.83×10⁻¹⁰) 1.39(1.50) 0.81‡(1.52‡)2020+4017 0.16 1.08 ± 0.04 11 31 1.26×10⁻⁹ (1.00×10⁻⁹) 1.38(1.42) 0.22‡(0.28‡)
3EG VERITAS
0010+7309 0.24 0.85 ± 0.10 41 141 2.70×10⁻¹⁰ (1.31×10⁻¹⁰) 1.30(1.40) 1.03‡(2.12‡)0617+2238 0.13 1.01 ± 0.06 9 82 2.20×10⁻¹⁰ (1.47×10⁻¹⁰) 1.31(1.37) 1.26‡(1.89‡)0631+0642 0.46 1.06 ± 0.15 25 98 6.16×10⁻¹¹ (2.19×10⁻¹¹) 1.36(1.51) 4.51‡(13)0634+0521 0.67 1.03 ± 0.26 27 100 7.34×10⁻¹¹ (1.22×10⁻¹¹) 1.48(1.74) 3.78‡(42)1800−2338 0.32 1.10 ± 0.10 56 251 2.61×10⁻¹¹ (1.19×10⁻¹¹) 1.55(1.65) 23(110)1856+0114 0.19 0.93 ± 0.10 31 108 3.48×10⁻¹⁰ (1.73×10⁻¹⁰) 1.38(1.48) 0.80‡(1.61‡)1903+0550 0.64 1.38 ± 0.17 26 99 1.62×10⁻¹¹ (5.00×10⁻¹²) 1.68(1.85) 24(249)2016+3657 0.55 1.09 ± 0.11 5 81 8.92×10⁻¹¹ (4.27×10⁻¹¹) 1.39(1.50) 3.11‡(6.50‡)2020+4017 0.16 1.08 ± 0.04 8 82 3.34×10⁻¹⁰ (2.55×10⁻¹⁰) 1.38(1.42) 0.83‡(1.09‡)
56
University, CONICET, and Fundacion Antorchas during different stages of this research. Also, part ofhis work was performed under the auspices of the U.S. Department of Energy (NNSA) by Universityof California Lawrence Livermore National Laboratory under contract No. W-7405-Eng-48. He thanksPrinceton University, SISSA, and the University of Barcelona for their kind hospitality. G.E.R. and J.A.C.were supported by CONICET (under grant PIP No 0430/98), ANPCT (PICT 03-04881), as well as byFundacion Antorchas. G.E.R. also thanks the Max Planck Association for additional support at theMPIfK, Heidelberg, as well as the University of Paris VII and the Service d’Astrophysique, Saclay, for kindhospitality. Y.M.B. acknowledges the support of the High Energy Astrophysics division at the CfA and theChandra project through NASA contract NAS8-39073. This research would have been impossible withoutthe effort of D. A. Green at the Mullard Radio Astronomy Observatory, Camridge (UK) in providing aweb-based SNR catalog. NASA’s HESEARC, SIMBAD, Goddard’s EGRET archive and MPE’s ROSATAll-Sky Survey were also invaluable to this study. The optical (and part of the radio) data is from theDigitized Sky Survey, accessible through http://skyview.gsfc.nasa.gov/ Parts of this work were based onphotographic data obtained using The UK Schmidt Telescope. The UK Schmidt Telescope was operated bythe Royal Observatory Edinburgh, with funding from the UK Science and Engineering Research Council,until 1988 June, and thereafter by the Anglo-Australian Observatory. Original plate material is copyright(c) the Royal Observatory Edinburgh and the Anglo-Australian Observatory. The plates were processedinto the present compressed digital form with their permission. The Digitized Sky Survey was producedat the Space Telescope Science Institute under US Government grant NAG W-2166.
References
[1] Aharonian F.A., Drury L.O’C., & Volk H.J. 1994, A&A 285, 645
[2] Aharonian F.A., & Atoyan, A.M. 1996, A&A 309, 91
[3] Aharonian F.A., et al. 1999, A&A 346, 913
[4] Aharonian F.A. et al. 2000, ApJ 539, 317
[5] Aharonian F.A. 2001, Space Sci. Rev. 99, 187
[6] Aharonian F.A. et al. 2001b, A&A 375, 1008
[7] Aharonian et al., 2001c, A&A, 370, 112
[8] Aharonian F.A., Konopelko A.K., Volk H.J., & Quintana H., 2001b, Astrop. Phys. 15, 335
[9] Aharonian F.A., et al. 2002, A&A 395, 803
[10] Aharonian F.A., et al. 2002b, A&A 390, 39
[11] Aharonian F. et al. 2002, A&A 393, L37
[12] Allen G.E., Digel S.W., & Ormes J.F. 1999a, Proc. Int. Cosmic Ray Conf., Utah, 5, 515
[13] Allen G.E., Gotthelf E.V., & Petre R. 1999b, Proc. Int. Cosmic Ray Conf., Utah, 5, 480
[14] Amenomori M., et al. 1999, ApJ 525, L93
[15] Anchordoqui L.A., Torres D.F., McCauley T., Romero G.E. & Aharonian F.A., hep-ph/0211231, inpress in ApJ.
57
[16] Anderson S.B., et al. 1996, ApJ 468, L55
[17] Arikawa Y., Tatematsu, K., Sekimoto Y., & Takahashi, T. 1999, PASJ 51, L7
[18] Arqueros F. et al. 1999, Proc. Int. Cosmic Ray Conf., Utah, 5, 211
[19] Asaoka I., Aschenbach B. 1994, A&A 284, 573
[20] Aschenbach B. 1998, Nature 396, 141
[21] Atoyan A.M., Aharonian F.A., & Voelk H.J. 1995, Phys. Rev. D52, 3265
[22] Bamba A., Yokogawa J., Sakano M., & Koyama K. 2000, PASJ 52, 259
[23] Baring, M.G. et al. 1999, ApJ 513, 311
[24] Becker R.H., & Helfand D.J. 1987, AJ 94, 1629
[25] Bednarek W. 1993, A&A 278, 307
[26] Bell A.R. 1978, MNRAS 182, 147
[27] Benaglia P., Romero G.E., Stevens I. & Torres D.F. 2001, A&A 366, 605
[28] Benaglia P. & Romero G.E. 2003, A&A 399, 1121
[29] Berezhko E.G.; Puhlhofer G., & Volk, H.J. 2002, A&A 400, 971
[30] Berezhko E.G.; Ksenofontov L.T., & Volk, H.J. 2002, A&A 395, 945
[31] Bignami G.F., & Hermsen W. 1983, ARA&A 21, 67
[32] Bignami G.F., Bennet K., Buccheri R., Caraveo P., & Hermsen W. 1981, A&A 93, 71
[33] Bildsten L. 1997, ApJS 113, 367
[34] Bloemen H., et al. 1997, ApJ 475, L25
[35] Bocchino F., & Bykov A.M. 2000, A&A 362, L29
[36] Bocchino F., & Bykov A.M. 2001, A&A 376, 248
[37] Brazier K.T.S., Kanbach G., Carraminana A., Guichard J., & Merck M. 1996, MNRAS 281, 1033
[38] Brazier K.T.S., Reimer O., Kanbach G., & Carraminana A. 1998, MNRAS 295, 819
[39] Buckley J.H., et al. 1997, Proc. 25th Int. Cosmic Ray Conf., Durban, 3, 237
[40] Buckley J.H., et al. 1998, A&A 329, 639
[41] Burdett A., et al. 1999, Proc. Int. Cosmic Ray Conf., Utah, 5, 448
[42] Butt Y., Torres D.F., Combi J.A., Dame T., & Romero G.E. 2001, ApJ 562, L167
[43] Butt Y., Torres D.F., Romero G.E., Dame T., & Combi J.A. 2002a, Nature 418, 499
58

[44] Butt Y., Torres D.F, Combi J.A., Dame T., & Romero G.E. 2002b, To appear in the proceedingsof 22nd Moriond Astrophysics Meeting: The Gamma Ray Universe, Les Arcs, Savoie, France, 9-16Mar 2002. astro-ph/0206132
[45] Butt Y. et al. 2003, astro-ph/0302342, submitted to ApJ
[46] Bykov A.M., Chevalier R.A., Ellison D.C., & Uvarov Y.A. 2000, ApJ 538, 203
[47] Camilo F., et al. 2001, ApJ 557, L51
[48] Caraveo P.A., De Luca A., Mignani R.P., & Bignami G.F. 2001, ApJ 561, 930
[49] Carraminana A. 2001, in Proc. Int. Workshop on The Nature of Galactic Unidentified Gamma-raySources, O. Carraminana, O. Reimer, D. Thomson Eds., Kluwer Academic Press, p.107
[50] Case G., & Bhattacharya D. 1998, ApJ 504, 761
[51] Case G., & Bhattacharya D. 1999, ApJ 521, 246
[52] Caswell J.L., & Barnes P.J. 1985, MNRAS, 216, 753
[53] Caswell J.L., Murray J.D., Roger R.S., Cole D.J., & Cooke D.J. 1975, A&A 45, 239
[54] Chadwick P.M. et al. 1997, Proc. 25th Int. Cosmic Ray Conf. Durban, 3, 189
[55] Chantell M.C., et al. 1998, Nucl. Instrum. Methods A408, 468
[56] Chapman J.M., Leitherer C., Koribalski B., Bouter R., & Storey M. 1999, ApJ 518, 890
[57] Chen W. & White R. 1991, ApJ 381, L63
[58] Cheng K.S., & Ruderman M. 1989, ApJ 337, L77
[59] Cheng K.S., & Ruderman M. 1991, ApJ 373, 187
[60] Chevalier R.A. 1999, ApJ 511, 798
[61] Clark D.H., & Caswell J.L. 1976, MNRAS 174, 267
[62] Clark G.W., Garmire G.P. & Kraushaar W.L. 1968 ApJ 153, L203
[63] Claussen M.J., Frail D.A., Goss W.M., & Gaume R.A. 1997, ApJ 489, 143
[64] Clemens D.P. 1985, ApJ 295, 422
[65] Combi J.A., & Romero G.E. 1995, A&A 303, 872
[66] Combi J.A., Romero G.E., & Azacarate I. 1997, Ap&SS, 250, 1
[67] Combi J.A., Romero G.E., & Benaglia P. 1998, A&A 333, L91
[68] Combi J.A., Romero G.E., & Benaglia P. 1999, ApJ 519, L177
[69] Combi J.A., Romero G.E., Benaglia P., & Jonas J. 2001, A&A 366, 1047
[70] Condon, J.J., Broderick, J.J., & Seielstad, G.A. 1991, AJ 102, 2041
59

[71] Contreras M.E., et al. 1997, ApJ 488, L153
[72] Corbel S., Chapuis C., Dame T.M., & Durouchoux P. 1999, ApJ 526, L29
[73] Cornett R.H., Chin G., & Knapp G.R. 1977, A&A 54, 889
[74] Crovisier J., Fillit R., & Kazes I. 1973, A&A 27, 417
[75] Crutcher R.M. 1988, in “Molecular Clouds, Milky-Way & External Galaxies”, R. Dickman, R. Snell,& J. Young Eds., New York, Springer, p.105
[76] Crutcher R.M. 1994, “Clouds, cores and low mass stars”, Astronomical Society of the Pacific Con-ference Series, volume 65; Proceedings of the 4th Haystack Observatory, edited by D. P. Clemensand R. Barvainis, p.87
[77] Crutcher, R.M. 1999, ApJ 520, 706
[78] Cusumano G., Maccarone M.C., Nicastro L., Sacco B., & Kaaret P. 2000, ApJ 528, L25
[79] Dame T.M., Elmegreen B.G., Cohen R.S., & Thaddeus P. 1986, ApJ 305, 892
[80] Dame T.M., Hartmann D., & Thaddeus P. 2001, ApJ 547, 792
[81] D’Amico N., et al. 2001, ApJ 552, L45
[82] De Jager O.C., & Mastichiadis A. 1997, ApJ 482, 874
[83] De Naurois M., et al. 2001, Proc. Int. Symp. on High Energy Gamma-Ray Astro. (Heidelberg), F.Aharonian and H.J. Volk (Eds)., AIP, New York, p.540
[84] Dermer C.D. 1986, A&A 157, 223
[85] Dermer C.D., et al. 1997, AJ 113, 1379
[86] Dermer C.D. 1997, in Proceedings of the Fourth Compton Symposium, Editors Charles D. Der-mer, Mark S. Strickman, and James D. Kurfess, Williamsburg, VA April 1997: AIP ConferenceProceedings 410, p. 1275.
[87] Dickman R.L., Snell R.L., Ziurys L.M., & Huang Y.-L. 1992, ApJ 400, 203
[88] Doherty et al. 2002, MNRAS, submitted.
[89] Dorfi E.A. 1991, A&A 251, 597
[90] Dorfi E.A. 2000, Ap&SS. 272, 227
[91] Downes A.J.B., Pauls T, & Salter C.J. 1980, A&A 92, 47
[92] Drury L.O’C., Aharonian F., & Volk H.J. 1994, A&A 287, 959
[93] Drury L.O’C. et al. 2001. Report of working group number four at the ISSI workshop on Astrophysicsof Galactic Cosmic Rays: astro-ph/0106046
[94] Dubner G.M., Velazquez P.F., Goss W.M., & Holdaway M. A. 2000, AJ 120, 1933
[95] Duncan A.R., Stewart R.T., Haynes R.F., & Jones K.L. 1995, MNRAS 277, 36
60
[96] Duncan A.R., Stewart R.T., Haynes R.F., & Jones K.L. 1997, MNRAS 287, 722
[97] Eichler D., & Usov V.V. 1993, ApJ 402, 271
[98] Ellison D.C., Slane P., & Gaensler B.M. 2001, ApJ 563, 191
[99] Enomoto R., et al. 2002, Nature 416, 823
[100] Erlykin A.D., & Wolfendale A.W. 2003, astro-ph/0301653, accepted by J.Phys.G: Nucl.Part.Phys
[101] Esposito J.A., Hunter S.D., Kanbach G., & Sreekumar P. 1996, ApJ 461, 820
[102] Falcke H., Cotera A., Duschl W.J., Melia F., & Rieke M.J. 1999, “The Central Parsecs of the Galaxy”,ASP Conference Series, Vol. 186.
[103] Fegan S. 2001, Proc. Int. Workshop on The Nature of Galactic Unidentified Gamma-ray Sources, O.Carraminana, O. Reimer, D. Thomson Eds., Kluwer Academic Press, p.285
[104] Fesen R.A. 1984, ApJ 281, 658
[105] Fierro J.M., et al. 1993, ApJ 413, L27
[106] Frail D.A., Kulkarni S.R., & Vasisht G. 1993, Nature 365, 136
[107] Frail D.A., Giacani E.B., Goss W.M., & Dubner G. 1996, ApJ 464, L165
[108] Furst E., Reich W., Reich P., & Reif K. 1990, ApJS 85, 691
[109] Gaisser T.K., Protheroe R.J., & Stanev T. 1998 ApJ 492, 219
[110] Gehrels N., Macomb D.J., Bertsch D.L., Thompson D.J., & Hartman R.C. 2000, Nature 404, 363
[111] Gehrels N., & Shrader C.R. 2001, in 2001, in Gamma 2001, edited by S. Ritz, N. Gehrels, & C. R.Schader, AIP Conference Proceedings, New York, p.3
[112] Georganopoulos M., Aharonian F. A., & Kirk J. 2002, A&A 388, L25
[113] Georgelin Y.P. & Georgelin Y.M. 1970, A&A 7, 133
[114] Georgelin Y.P. & Georgelin Y.M. 1976, A&A 49, 57
[115] Giacani E.B., et al. 1997, AJ 113, 1379
[116] Gillanders G., et al. 1997, Proc. 25th Int. Cosmic Ray Conf. Durban, 3, 185
[117] Ginzburg V.L., Syrovatskii S.I. 1964, “The Origin of Cosmic Rays”, Pergamon Press, London
[118] Goldwurm A. 2001, In “Exploring the gamma-ray universe”, Proceedings of the Fourth INTEGRALWorkshop, Eds. B. Battrick, A. Gimenez, V. Reglero & C. Winkler. ESA SP-459, Noordwijk: ESAPublications Division, p.455
[119] Grabelsky D.A., Cohen R.S., Bronfman L., & Thaddeus P. 1988, ApJ 331, 181
[120] Gray A.D. 1994, MNRAS 270, 847
[121] Grenn A.J., Frail D.A., Goss W.M.,& Otrupcek R. 1997, AJ 114, 2058
61

[122] Green A.J., Cram L.E., Large M.I., & Ye T. 1999, ApJS 122, 207.
[123] Green D.A. 1997, PASA 14, 73
[124] Green D.A. 2000, A Catalogue of Galactic Supernova Remnants, Mullard Radio Astronomy Obser-vatory, Cambridge, UK (available at http://www.mrao.cam.ac.uk/surveys/snrs/)
[125] Grenier I.A. 1995, Advances in Space Research 15, 73
[126] Grenier I.A. 2000, A&A 364, L93
[127] Grenier I.A. 2001, in The Nature of Unindentified Galactic Gamma-Ray Sources, eds. A. Carrami-nana, O. Reimer & D. Thompson, Kluwer Academic Publishers, Dordrecht, p.51
[128] Guessoum N., Von Ballmoos P., Knodleseder J., & Vedrenne G., 2001, in Gamma 2001, edited by S.Ritz, N. Gehrels, & C. R. Schader, AIP Conference Proceedings, New York, p.16
[129] Halpern J.P., Eracleous M., Mukherjee R., & Gotthelf E.V. 2001a, ApJ 551, 1016
[130] Halpern J.P., et al. 2001, ApJ 552, L125
[131] Halpern J.P., Gotthelf E.V., Mirabal N., & Camilo F. 2002, ApJ 573, L41
[132] Halzen F. & Hooper D. 2002, Rept. Prog. Phys. 65, 1025
[133] Hartman R.C., et al. 1999, ApJS 123, 79
[134] Harrus I.M., Hughes J.P., & Helfand D.J. 1996, ApJ 464, L161
[135] Harrus I.M. & Slane P.O. 1999, ApJ 516, 811
[136] Haslam C.G.T., Salter C.J., Stoffel H., & Wilson W.E. 1982, ApJS 47, 1
[137] Hensberge H., Pavlovski K., & Verschueren W. 2000, A&A 258, 553
[138] Hermsen W., et al. 1981, in Proc. Int. Cosmic Ray Conf. 17th, Paris, 1, 320
[139] Hillas A.M., et al. 1998, ApJ 503, 774
[140] Hnatyk B., & Petruk O. 1998, Condensed Matter Physics 1, 655
[141] Huang Y.-L., Dame T.M., & Thaddeus P. 1983, ApJ, 272, 609
[142] Huang Y.-L., & Thaddeus P. 1986, ApJ, 309, 804
[143] Hunter, et al. 1997, ApJ 481, 205
[144] Jaffe T.R., Bhattacharya D., Dixon D.D., & Zych A.D. 1997, ApJ 484, L129
[145] Jonas J.L. 1999, PhD Thesis, Rhodes University
[146] Jones L.R., Smith A., & Angellini L. 1993, MNRAS 265, 631
[147] Jones T.W. 2001, in Proc. of the 7th Taipei Astrophysics Workshop on Cosmic Rays in the Universe,ASP Conference Proceedings, Vol. 241. Edited by Chung-Ming Ko. San Francisco: AstronomicalSociety of the Pacific, astro-ph/0012483
62
[148] Kaaret P., & Cottam J. 1996, ApJ 492, L35
[149] Kaaret P., Piraino S., Halpern J., & Eracleous M. 1999, ApJ 523, 197
[150] Kaaret P., Cusumano G., & Sacco B. 2000, ApJ 542, L41
[151] Kaspi V.M., et al. 1997, ApJ 485, 820
[152] Kaspi V.M., et al. 2000, ApJ 528, 445
[153] Kassim N.E., & Frail D.A. 1996, MNRAS 283, L51
[154] Kaufman-Bernado M.M., Romero G.E., Mirabel I.F. 2002, A&A 385, L10
[155] Keohane J.W., Petre R., Gotthelf E.V., Ozaki M., & Koyama K. 1997, ApJ 484, 350
[156] Kifune T., et al. 1995, ApJ 438, L91
[157] Kirk J.G., & Dendy R.O. 2001, J. Phys. G27, 1589
[158] Kirshner R.P., & Winkler P.F. 1979, ApJ 227, 853
[159] Klothes R., Landecker T.L., Foster T., & Leahy D.A. 2001, A&A 376, 641
[160] Kniffen D.A., et al. 1974, Nature 25, 397
[161] Koralesky B., Frail D.A., Goss W.M., Claussen M.J., & Green A.J. 1998, AJ, 116, 1323
[162] Konopelko A.K. 2001, in: High Energy Gamma-Ray Astronomy, F.A. Aharonian & H.J. Volk (eds.),AIP, Melville, p. 568
[163] Kraushaar W.L., et al. 1972, ApJ 177, 341
[164] Lamb R.C., & Macomb D.J. 1997, ApJ 488, 872
[165] Lasker B.M., et al. 1990, AJ 99, 2019
[166] Leahy D.A., Naranan S., & Singh K.P. 1986, MNRAS 220, L501
[167] Leslard R.W. et al. 1995, Proc. Int. Cosmic Ray Conference, Rome, 2, 475
[168] Longair M.S. 1994, “High Energy Astrophysics, Vol.2: Stars, the Galaxy and the InterstellarMedium”, Cambridge University Press, 2nd ed.
[169] Lozinskaya T.A. 1974, Soviet Astronomy 17, 603
[170] Lozinskaya T.A. 1992, “Supernovae and stellar wind in the interstellar medium”, AIP, New York
[171] Lozinskaya T.A., Pravdikova V.V., & Finoguenov A.V. 2000, AstL 26, 77
[172] Lucarelli F., Konopelko A., Rowell G, Fonseca V. & the HEGRA collaboration, 2001, in High-energygamma-ray astronomy, edited by F. Aharonian and H. Voelk, AIP Conference Proceedings, NewYork, p.779
[173] Manchester R.N., et al. 2001, MNRAS 328, 17
[174] Markiewicz W. J., Drury L. O’C., & Volk H J. 1990, A&A 236, 487
63
[175] Markoff S., Melia F., & Sarcevic I. 1997, ApJ 489, L47
[176] Markoff S., Melia F., & Sarcevic I. 1999, ApJ 522, 870
[177] Mastichiadis A. 1996, A&A 305, L53
[178] Mastichiadis A., & Ozernoy L.M. 1994, ApJ 426, 599
[179] Mayer-Hasselwander H.A., et al. 1998, A&A 335, 161
[180] McLaughlin M.A., Mattox J.R., Cordes J.M., & Thompson D.J. 1996, ApJ 473, 763
[181] Melia F. 1992, ApJ 387, L25
[182] Melia F., & Falcke H. 2001, ARA&A 39, 309
[183] Merck M., et al. 1996, A&AS 120, 465
[184] Michelson P.F. 2001, in Gamma 2001, edited by S. Ritz, N. Gehrels, & C. R. Schader, AIP ConferenceProceedings, New York, p.713
[185] Milne D. K. 1979, Aust. J. Phys., 32, 83
[186] Mirabal N., & Halpern J.P. 2001, ApJ 547, L137
[187] Mirabal N., & Halpern J.P., Eracleous M., & Becker R.H. 2000, ApJ 541, 180
Ray Conf., Paris, 1, 17
[188] Montmerle T. 1979, ApJ 231, 95
[189] Morfill G.E., Forman M., & Bignami G. 1984, ApJ 284, 856
[190] Morfill G. E., & Tenorio-Tagle G. 1983, Space Sci. Rev. 36, 93
[191] Mori M. 2001, J. Phys. Soc. Japan Suppl. B70, 22
[192] Mukherjee R., Gotthelf E.V., Halpern J., & Tavani M. 2000, ApJ 542, 740
[193] Muraishi H., et al. 2000, A&A 354, 57L
[194] Naito T. & Takahara F. 1994, J. Phys. G20, 477
[195] Nicastro L., Gaensler B.M., & McLaughlin M.A. 2000, A&A 362, L5
[196] Nolan P.L., et al. 1996, ApJ 459, 100
[197] Odegard N. 1986, ApJ 301, 813
[198] Ogelman H., & Finley J.P 1993, ApJ 413, L31
[199] Olbert C., Clearfield R.C., Williams N., Keohane J., & Frail D.A. 2001, ApJ 554, L205
[200] Oliver R.J., Masheder M.R.W., & Thaddeus P. 1996, A&A 315, 578
[201] Ong R.A. 1998, Phys. Rep. 305, 93
[202] Oser S., et al. 2000, ApJ 547, 949
64
[203] Paredes J.M., Martı J., Ribo M., Massi M., 2000, Science 288, 2341
[204] Petre R., Keohane J., Hwang U., Allen G., & Gotthelf E. 1998 in “The Hot Universe”, Proceedingsof IAU Symposium 188. Edited by Katsuji Koyama, Shunji Kitamoto, & Masayuki Itoh. Dordrecht:Kluwer Academic Press, 1998., p.117
[205] Petry D., & Reimer O. 2001, in Proceedings Gamma 2001 Workshop, edited by S. Ritz, N. Gehrels,& C. R. Schader, AIP Conference Proceedings, New York, p.696
[206] Petry D. 2001, Proc. Int. Workshop on The Nature of Galactic Unidentified Gamma-ray Sources, O.Carraminana, O. Reimer, D. Thomson Eds., Kluwer Academic Press, p.299
[207] Pineault S., et al. 1993, AJ 105, 1060
[208] Pineault S., et al. 1997, A&A 324, 1152
[209] Plaga R. 2002, New Astron. 7, 317
[210] Pohl M. 1996, A&A 307, 57
[211] Pohl M. 1997, A&A 317, 441
[212] Pollock A.M.T. 1985, A&A 150, 339
[213] Preite-Martinez A., Feroci M., Strom R.G., Mineo T. 2000, in Proceedings of the Fifth ComptonSymposium, American Institute of Physics (AIP), edited by Mark L. McConnell and James M. Ryan,AIP Conference Proceedings, Vol. 510., p.73
[214] Punsly B. 1998a, ApJ 498, 640
[215] Punsly B. 1998b, ApJ 498, 660
[216] Punsly B., Romero G.E., Torres D.F., & Combi J.A 2000, A&A 364, 556
[217] Radhakrishman V., Goss W.M., Murray J.D., & Brooks J.W. 1972, ApJS 24, 49
[218] Ribo M., et al. 2002, A&A 384, 954
[219] Reich W., Furst E., & Sofue Y. 1984, A&A 133, L4
[220] Reimer O., & Bertsch D.L. 2001, Proc. of Int. Cosmic Ray Conf., Hamburg, to appear.
[221] Reimer O., & Pohl M. 2002, A&A 390, L43
[222] Reynoso, E. & Mangum J.G. 2000, ApJ 545, 874
[223] Reynolds S.P. 1996, ApJ 459, L13
[224] Reynolds S.P. 1998, ApJ 493, 375
[225] Rho J., & Petre R. 1998, ApJ 503, L167
[226] Rho J., Petre R., Schlegel E.M., & Hester J.J. 1994, ApJ 430, 757
1999, ApJ 515, 712
[227] Roberts M.S.E., Romani R.W., & Kawai N. 2001, ApJS 133, 451
65

[228] Rodgers A.W., Campbell C.T., & Whiteoak J.B. 1960, MNRAS 121, 103
[229] Romero G.E., Combi J.A., & Colomb F.R. 1994, A&A 288, 731
[230] Romero G.E. 1998, Rev. Mex. A&A 34, 29
[231] Romero G.E., Benaglia P., & Torres D.F. 1999a, A&A 348, 868
[232] Romero G.E., Torres D.F., Andruchow I., Anchordoqui L.A., & Link B. 1999b, MNRAS 308, 799
[233] Romero G.E., Kaufman-Bernado M., Combi J., & Torres D.F. 2001, A&A 376, 599
[234] Romero, G. E. 2001, in The Nature of Unindentified Galactic Gamma-Ray Sources, eds. A. Carram-inana, O. Reimer & D. Thompson, Kluwer Academic Press, p.65
[235] Romero G.E., & Torres D.F. 2003, ApJ 586, L33
[236] Rowell G.P., et al. 2000, A&A 359, 337
[237] Ruiz M.T., & May J. 1986, ApJ 309, 667
[238] Sakamoto S., Hasegawa T., Hayashi M., Handa T., & Oka T. 1995, ApJS, 100, 125
[239] Seta M., et al. 1998, ApJ 505, 286
[240] Seward F.D., Schmidt B., & Slane P. 1995, ApJ 453, 284
[241] Schonfelder V. 2001, in Gamma 2001, edited by S. Ritz, N. Gehrels, & C. R. Schader, AIP ConferenceProceedings, New York, p.809
[242] Scoville N.Z., Irvine W.M., Wannier P.G., & Predmore C.R. 1977, ApJ 216, 320
[243] Sedov L.I. 1959, “Similarities and dimensional methods in mechanics”, Academic Press, New York
[244] Stecker F.W. 1977, ApJ 212, 60
[245] Shklovskii I. S. 1953, Dokl. Akad. Nauk SSSR 91,No. 3, 475
[246] Sigl G., Torres D.F, Anchordoqui L.A., & Romero G.E. 2001, Phys. Rev. D63, 081302
[247] Sinnis G., et al. 1995, Nucl. Phys. B (Proc. Suppl.) 43, 141
[248] Slane P., et al. 1997, ApJ 485, 221
[249] Slane P., et al. 1999, ApJ 525, 357
[250] Smith D.A., et al. 1997, Nucl. Phys. (Proc. Suppl) 54, 362
[251] Sofue Y., & Reich W. 1979, A&AS 38, 251
[252] Sturner S.J., & Dermer C.D. 1995, A&A 293, L17
[253] Sturner S.J., Dermer C.D., & Mattox J.R. 1996, A&AS 120, 445
[254] Sturner S.J., Skibo J. G., Dermer C. D., & Mattox J. R. 1997, ApJ 490, 617
[255] Sugizaki M., et al. 2001, ApJS 134, 77
66

[256] Swanenburg, et al. 1981, ApJ 243, L69
[257] Swanenburg, et al. 1978, Nature 275, 298
[258] Tanimori T., et al. 1998, ApJ 497, L25
[259] Tavani M., et al. 2001, in Gamma 2001, edited by S. Ritz, N. Gehrels, & C. R. Schader, AIPConference Proceedings, New York, p.729
[260] Taylor J.H., et al. 1993, ApJS 88, 529 (updated at ftp://pulsar.princeton.edu)
[261] Thompson D.J., et al. 1975, ApJ 200, L79
[262] Thompson D.J., et al. 1995, ApJS 101, 259
[263] Thompson D.J., et al. 1996, ApJS 107, 227
[264] Thompson D.J., et al. 1999, ApJ 516, 297
[265] Thompson D.J. 2001, Proc. Int. Symp. on High Energy Gamma-Ray Astro. (Heidelberg), F. Aharo-nian and H.J. Volk (Eds)., AIP, New York, p.103
[266] Thompson D.J., Digel S.W., Nolan P.L., & Reimer O. 2001, in Proc. Neutron Stars in SupernovaRemnants, ASP Conference Series, Vol. 9999, 2002, P. O. Slane and B. M. Gaensler Eds., in press.astro-ph/0112518
[267] Tompkins W. 1999, Ph.D. Thesis, Stanford University.
[268] Torres D.F., et al. 2001a, A&A 370, 468
[269] Torres D.F., Combi J.A., Romero G.E., & Benaglia P. 2001b, Proc. Int. Workshop on The Nature ofGalactic Unidentified Gamma-ray Sources, O. Carraminana, O. Reimer, D. Thomson Eds., KluwerAcademic Press, p.97
[270] Torres D.F., Pessah M.E., & Romero G.E. 2001c, Astronomische Nachrichten, 322, 223
[271] Torres D.F., Butt Y.M. & Camilo F. 2001d, ApJ 560, L155
[272] Torres D.F, Romero G.E., & Eiroa E.F. 2002, ApJ 560, 600
[273] Torres D.F, Romero G.E., Eiroa E.F., Wambsganss J., & Pessah M.E. 2003a, MNRAS 339, 335
[274] Torres D.F. & Nuza S.E. 2003b, ApJ 583, L25
[275] Tumer, T., et al. (1999), Astropart. Phys. 11, 271
[276] Uchida K., Morris M., & Yusef-Zadeh F. 1992, AJ 104, 1533
[277] Uchiyama Y., Takahashi T., & Aharonian F.A. 2002a, PASJ54, L73
[278] Uchiyama Y., Takahashi T., Aharonian F.A., & Mattox J.R. 2002b, ApJ 571, 866
[279] Uchiyama Y., Aharonian F.A. & Takahashi T. 2002c, to appear in A&A
[280] Usov V.V. 1994, ApJ 427, 394
[281] van den Ancker M.E., The P.S., & de Winter D. 2000, A&A 362, 580
67

[282] Vargas M. et al. 1996, A&A 313, 828
[283] Velazquez P.F., Dubner G.M., Goss W.M., & Green A. 2002. astro-ph/0207530
[284] Volk H.J. 2001, To appear in the proceedings of 21st Moriond Astrophysics Meeting: High energyastrophysical phenomena, Les Arcs, Savoie, France, 20-27 Jan 2001. astro-ph/0105356
[285] Volk H.J. 2002, in Proc. Int. Cosmic Ray Conf., Hamburg, to appear. astro-ph/0202421
[286] Wallace P.M., et al. 2000, ApJ 540, 184
[287] Wallace P.M., Halpern J.P., Magalhaes A.M., & Thompson D.J. 2002, ApJ 569, 36
[288] Wang Z.R., Asaoka I., Hayakawa S. & Koyama K. 1992, PASJ 44, 303
[289] Whiteoak J.B.Z. & Green A.J 1996 A&AS 118, 329
[290] Wootten, A. 1981, ApJ 245, 105
[291] Yadigaroglu I.-A., & Romani R.W. 1997, ApJ 476, 356
[292] Yamamoto F., Hasegawa T., Morino J., Handa T., Sawada T., & Dame T. M 1999, in Proc. of StarFormation 1999, T. Nakamoto Ed., Nobeyama Radio Observatory, p.110
[293] Yusef-Zadeh F., Melia F., & Wardle M. 2000, Science 287, 85
[294] Yusef-Zadeh F., Law C., & Wardle M. 2002, ApJ 568, L121
[295] Zhang L., & Cheng K.S. 1998, A&A 335, 234
[296] Zhang L., Zhang Y.J., & Cheng K.S. 2000, A&A 357, 957
68
Top Related
Copyright © 2022 FDOKUMEN

