


Bahasa
Halaman
Hukum


e-ISSN: 2582-5208 International Research Journal of Modernization in Engineering Technology and Science
( Peer-Reviewed, Open Access, Fully Refereed International Journal )
Volume:04/Issue:07/July-2022 Impact Factor- 6.752 www.irjmets.com
www.irjmets.com @International Research Journal of Modernization in Engineering, Technology and Science
[3237]
STUDIES ON CALIBRATION & STANDARDIZATION PROCESS OF SONIC
FINENESS METER FOR THE JUTE FIBER
Mohammad Abdullah Kaysar*1, Md. Fakhrul Abedin*2, Md. Anisur
Rahman Dayan*3, Md Mahmudul Habib*4, Md. Mahbubur Rahman*5
*1Senior Scientific Officer, Physics Department, Bangladesh Jute Research Institute,
Dhaka, Bangladesh.
*2,3Scientific Officer, Physics Department, Bangladesh Jute Research Institute, Dhaka, Bangladesh.
*4Scientific Officer, Electronics and Equipment Development and Maintenance Department,
Bangladesh Jute Research Institute, Dhaka, Bangladesh.
*5Senior Scientific Officer, Fibre Chemistry Department, Bangladesh Jute Research Institute,
Dhaka, Bangladesh.
ABSTRACT
Fineness is an important physical parameter for determining the processability of a particular fiber. The
fineness of jute fiber is determined through various processes. The Sonic Fineness meter which is specially
designed for wool fiber, in this study is investigated to standardize and calibrate for jute fiber varieties. The
Sonic values are correlated using the WIRA airflow fineness meter instrument commonly used for the fineness
of cotton fiber. The fineness of both White or Corchorus capsularis L. and Tossa or Corchorus olitorius L. jute
was measured by Airflow method (reading in micron) and Sonic fineness tester (reading in millivolts). The
values were correlated for standizatation so that the microns are readily obtained from the millivolt.
Keywords: White Jute, Tossa Jute, Sonic Fineness Tester, Micronaire Value, CSIRO Sonic Fineness Tester Model
A, WIRA Fineness Tester.
I. INTRODUCTION
Jute (Corchorus spp.) is the golden fiber of Bangladesh [1]. Jute, and allied fiber cultivation, trade, and industry
provide sustenance to over 4 million people of Bangladesh [2]. It is a kind of natural bast fiber [3]. Natural
fibers are categorized into three groups: vegetable (cellulose) fiber, animal hair (protein) fiber, and mineral
fiber [4]. Bast or stem fibers from plants such as flax, hemp, kenaf, jute, and ramie are more likely to be used for
functional and technical applications. Jute is found in two species of the genus Corchorus belonging to the
family Tiliaceae. Jute is often denoted for both the plant and fiber extracted from the plants, Corchorus
capsularis L. also known as the White Jute and Corchorus olitorius L. also known as the Tossa jute. Besides
these two, there are over 30 species, from the genus Corchorus [5]. These bast fibers are advantageous over the
other cellulose-based fibers (seed fiber, leaf fiber or fruit fiber) due to their high modulus, tensile strength and
low specific gravity [6]. Jute is abundantly available in tropical countries like India, Bangladesh, China, Nepal,
and Thailand [7]. For industrial, reinforcement, diversified and commercial purposes [8], the fineness of the
jute fiber is required to be investigated.
For the determination of fineness, the microscopic method of fiber cross-section is found to be the most
accurate process. But it is a time-consuming and lengthy process [9]. For the determination of the fineness of
cotton and jute fiber, the airflow method is commonly used. The airflow method is an indirect method of
determining fiber fineness. In the airflow method, air passes through a calculated passage of fiber mass
resulting in a perception of the cross-sectional area. The main problem of the airflow method is, the
unavailability of diameter variability as the average diameter is found as the output. So, this airflow method is
used for the conceptual result of fineness [10].
Using the concept of airflow method Sonic Fineness Testing has been developed for the measurement of fiber
diameter in micronaire value. The Sonic Fineness meter is developed for the measurement of wool fiber
diameter [11]. This section discusses the calibration and standardization process of the Sonic Fineness meter
for the jute fiber.
e-ISSN: 2582-5208 International Research Journal of Modernization in Engineering Technology and Science
( Peer-Reviewed, Open Access, Fully Refereed International Journal )
Volume:04/Issue:07/July-2022 Impact Factor- 6.752 www.irjmets.com
www.irjmets.com @International Research Journal of Modernization in Engineering, Technology and Science
[3238]
The airflow method uses the principle that through a uniform plug of fiber mass, the pressure difference
created by the constant airflow is proportional to the total volume of fiber mass and the same way to the fiber
cross-sectional area or the diameter [12]. Utilizing this principle, a sonic fineness tester was developed for the
fineness of the wool sample [13]. However, the sonic fineness tester has been standardized and calibrated for
the jute fiber in this study.
In this tester, the low-frequency sinusoidal audio signal is allowed to pass through a sample chamber of
adjusted dimension to give a volume that keeps the packing density constant for the testing sample. The
sinusoidal audio signal is used to achieve a better result and to overcome the limitation of airflow instruments
as the result given in the airflow instrument is derived through the manual method. The sinusoidal audio signal
being transmitted changed according to the average testing diameter. The signal is received by a transducer
and after amplification and rectification, the output is shown in terms of a digital millivolt meter [14]. The
millivolt is adjusted with the correspondent fiber diameter in micronaire value from the calibration chart [15].
The CSIRO Sonic Fineness Tester Model A is calibrated using the fleece samples.
For the survival of jute, it is necessary to diversify the uses of jute and development of new jute products by
blending jute with other natural and man-made fibers. One of the criteria for blending jute with other fibers is
their similarity in fineness. But there is no suitable way by which we can easily measure the fineness of jute
within a very short time. Fiber fineness can be defined in terms of micronaire value which measures units of
mass per unit of length to assess linear density. It is an indirect method of measuring fiber fineness [16].A sonic
fineness tester is used to measure the fineness of wool within a very short time. Jute fiber has a higher
micronaire value [17]. If we can calibrate and standardize this Instrument for jute, the fineness of jute can be
measured within a short time and with good accuracy.
II. METHODOLOGY
Materials:
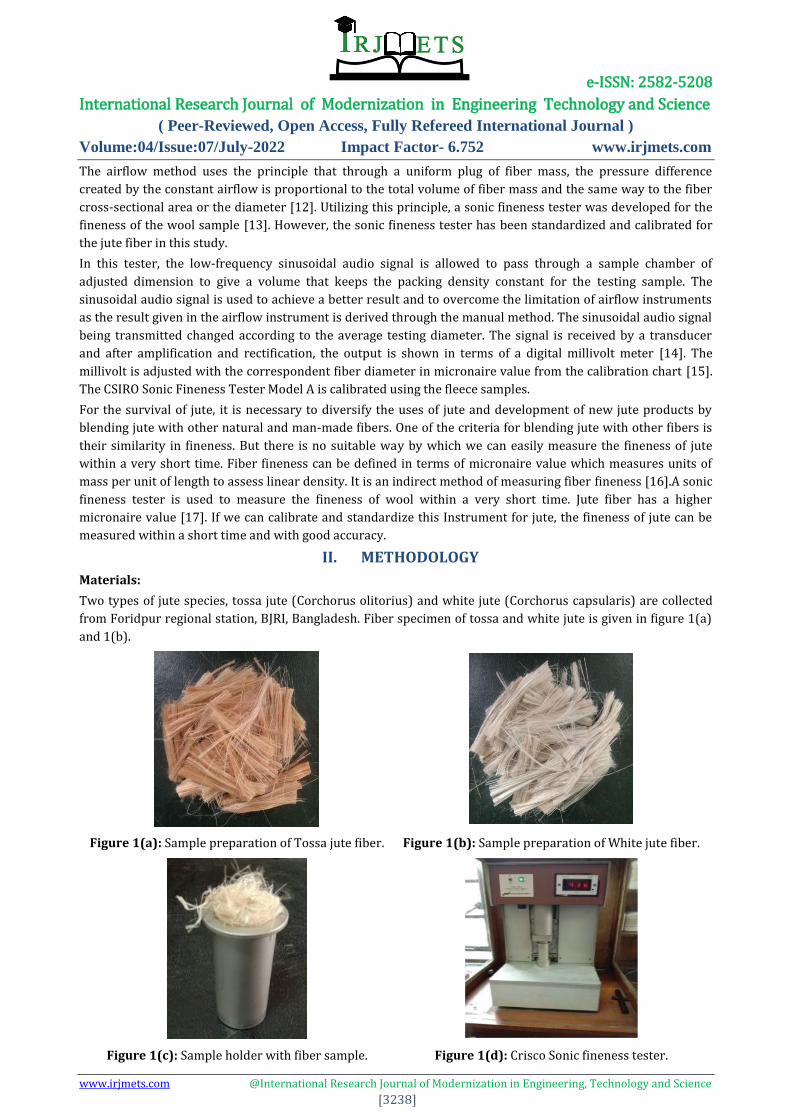
Two types of jute species, tossa jute (Corchorus olitorius) and white jute (Corchorus capsularis) are collected
from Foridpur regional station, BJRI, Bangladesh. Fiber specimen of tossa and white jute is given in figure 1(a)
and 1(b).
Figure 1(a): Sample preparation of Tossa jute fiber. Figure 1(b): Sample preparation of White jute fiber.
Figure 1(c): Sample holder with fiber sample. Figure 1(d): Crisco Sonic fineness tester.

e-ISSN: 2582-5208 International Research Journal of Modernization in Engineering Technology and Science
( Peer-Reviewed, Open Access, Fully Refereed International Journal )
Volume:04/Issue:07/July-2022 Impact Factor- 6.752 www.irjmets.com
www.irjmets.com @International Research Journal of Modernization in Engineering, Technology and Science
[3239]
Methods:
The Sonic fineness tester specially meant for the testing fineness of wool was calibrated using the calibration
chart. A calibration chart for wool was supplied by the manufacturer of sonic fineness tester that has been given
in Table 1. In order to standardize and calibrate this equipment for testing the fineness of jute, the fineness of
both white and tossa jute were first determined by airflow method. From previous experience, it is known that
fineness determined by a projection microscope always displays a higher value. Moreover, the value of fineness
measured by two different methods shows a large difference. Therefore, the fineness of jute fibre obtained by
the airflow method has been considered a known value of fineness for calibration.
Figure 2: Flow diagram of sonic fineness tester testing technique.
From each of the two different varieties of jute (white and tossa) specimen of 2.5gm was prepared by cutting
fibres of 7cm in length. Five readings of fineness were taken for each of the two varieties. The mean of the five
readings of each sample was calculated and recorded in millivolts. The fineness of both white and tossa jute
measured by the Airflow method (reading in micron) and Sonic fineness tester (reading in millivolts) has been
shown in two adjacent columns of Table 2 and Table 3.
III. RESULTS AND DISCUSSION
Table 1. Calibration Chart for Wool
d (micron) V (mv) d (micron) V (mv) d (micron) V (mv) d (micron) V (mv)
15.00 24.43 21.00 154.01 27.00 277.37 33.00 398.83
15.25 30.08 21.25 159.38 27.25 282.42 33.25 403.29
15.50 36.00 21.50 164.23 27.50 287.45 33.50 408.98
15.75 41.14 21.75 168.83 27.75 290.64 33.75 414.42
16.00 46.28 22.00 174.45 28.00 297.81 34.00 418.63
16.25 50.90 22.25 179.05 28.25 303.35 34.25 423.07
16.50 57.84 22.50 184.66 28.50 308.39 34.50 428.74
16.75 62.47 22.75 189.77 28.75 312.66 34.75 432.93
17.00 68.12 23.00 194.87 29.00 318.44 35.00 438.35
17.25 74.03 23.25 200.22 29.25 322.97 35.25 443.26
17.50 78.39 2350 205.20 29.50 328.24 35.50 448.42
17.75 83.27 23.75 210.15 29.75 333.50 35.75 453.82
18.00 88.66 24.00 214.73 30.00 338.51 36.00 458.48

e-ISSN: 2582-5208 International Research Journal of Modernization in Engineering Technology and Science
( Peer-Reviewed, Open Access, Fully Refereed International Journal )
Volume:04/Issue:07/July-2022 Impact Factor- 6.752 www.irjmets.com
www.irjmets.com @International Research Journal of Modernization in Engineering, Technology and Science
[3240]
18.25 94.05 24.25 219.57 30.25 343.52 36.25 463.37
18.50 100.98 24.50 223.89 30.50 347.77 36.50 467.78
18.75 106.11 24.75 229.23 30.75 352.53 36.75 472.18
19.00 110.98 25.00 234.81 31.00 358.02 37.00 476.81
19.25 116.62 25.25 239.89 31.25 363.26 37.25 481.93
19.50 122.01 25.50 245.73 31.50 368.00 37.50 487.05
19.75 127.64 25.75 255.30 31.75 372.74 37.75 491.67
20.00 133.02 26.00 255.87 32.00 378.21 38.00 497.26
20.25 138.65 26.25 260.43 32.25 382.94
20.50 143.26 26.50 261.94 32.50 387.66
20.75 148.12 26.75 272.32 32.75 393.87
Table 2. Comparative chart for White jute fineness measured between Airflow method (reading in micron) and
Sonic Fineness Tester (reading in millivolts)
Sample No Reading in micron by air flow method Reading in millivolt by sonic fineness
tester
1 31.70 235.00
2 32.00 247.00
3 32.40 255.30
4 32.75 264.50
5 33.10 275.00
6 33.40 285.50
7 33.75 300.50
8 34.00 312.00
9 34.40 325.00
10 34.70 339.00
11 35.00 350.00
12 35.20 363.00
l 3 35.50 375.00
14 35.75 387.00
Table 3. Comparative chart for Tossa jute fineness measured between Air flow method (reading in micron) and
sonic fineness (reading in millivolt)
Sample No Reading in micron by air flow method Reading in millivolt by sonic fineness
tester
1 38.25 445
2 38.75 455
3 39.00 460
4 39.50 470
5 40.00 485
6 40.55 496

e-ISSN: 2582-5208 International Research Journal of Modernization in Engineering Technology and Science
( Peer-Reviewed, Open Access, Fully Refereed International Journal )
Volume:04/Issue:07/July-2022 Impact Factor- 6.752 www.irjmets.com
www.irjmets.com @International Research Journal of Modernization in Engineering, Technology and Science
[3241]
7 41.00 505
8 41.50 516
9 41.75 520
10 42.00 524
11 42.50 536
12 42.75 545
13 43.00 550
14 43.25 561.3
Figure 3: Sonic values in millivolts (X-axis) vs average
fiber diameter (measured by Airflow Method) in micron
(Y axis) for white jute
Figure 4: Sonic values in millivolts (X-axis) vs.
average fiber diameter (measured by Air Flow
Method) in Micron (Y axis) for Tossa jute
The calibration chart for wool was given in table 1. The manufacturer of sonic fineness tester supplied this
chart. Two comparative charts (one for white jute and another for tossa jute) for the fineness of jute measured
by airflow method (reading in micron) and Sonic fineness tester (reading in millivolts) were given in table 2
and table 3. In figure 3 the values of fineness (for white jute) expressed in micron were plotted versus fineness
expressed in millivolt. It shows almost linear relationship between micron and millivolt readings. In figure 4 the
values of fineness (for tossa jute) expressed in micron were plotted versus fineness expressed in millivolt. It
also shows almost linear relationship between micron and millivolt readings. So correlation among sonic values
(mv) and micronaire values (um) for white jute is y = 0.0264x + 25.695. On the other hand, correlation among
sonic values (mv) and micronaire values(um) for Tossa jute is y = 0.0444x + 18.549. The diameter or fineness of
white is finer than that of Tossa jute fiber (Jute basic 2010).
IV. CONCLUSION
The fineness of both tossa and white jute were measured by sonic fineness tester in millivolts. Then micronaire
values of airflow method were plotted vs. sonic values in millivolt for both white and tossa jute and correlation
was found. From this correlation we can easily measure millivolt and convert to micronaire values.
V. REFERENCES
[1] D. P. Ray, “Perspective of Jute in a New Realm beyond Sacking,” Econ. Aff., vol. 63, no. 4, pp. 981–986,
2018.
[2] M. Mahbubul Islam, “Varietal Advances of Jute, Kenaf and Mesta Crops in Bangladesh: A Review,” Int. J.
Bioorganic Chem., vol. 4, no. 1, p. 24, 2019.
[3] M. M. A. Sayeed and A. Paharia, “Optimisation of the surface treatment of jute fibres for natural fibre
reinforced polymer composites using Weibull analysis,” J. Text. Inst., vol. 110, no. 11, pp. 1588–1595,
Nov. 2019.
[4] A. K. Mohanty, M. Misra, and G. Hinrichsen, “Biofibres, biodegradable polymers and biocomposites: An
overview,” Macromol. Mater. Eng., vol. 276–277, pp. 1–24, 2000.
[5] M. Islam, A. Bjri, M. M. Islam, and A. Saheb, “Economic Importance of Jute in Bangladesh: Production,

e-ISSN: 2582-5208 International Research Journal of Modernization in Engineering Technology and Science
( Peer-Reviewed, Open Access, Fully Refereed International Journal )
Volume:04/Issue:07/July-2022 Impact Factor- 6.752 www.irjmets.com
www.irjmets.com @International Research Journal of Modernization in Engineering, Technology and Science
[3242]
Research Achievements and Diversification,” Int. J. Econ. Theory Appl., vol. 4, no. 6, pp. 45–57, 2017.
[6] S. Ramakrishnan, K. Krishnamurthy, R. Rajasekar, and G. Rajeshkumar, “An experimental study on the
effect of nano-clay addition on mechanical and water absorption behaviour of jute fibre reinforced
epoxy composites,” J. Ind. Text., vol. 49, no. 5, pp. 597–620, 2019.
[7] S. Maity, “Jute Needlepunched Nonwovens: Manufacturing, Properties, and Applications,” J. Nat. Fibers,
vol. 13, no. 4, pp. 383–396, 2016.
[8] A. N. M. A. Ullah, A. B. M. Foisal, and N. Nahar, “Study on the Characteristics of Jute-Cotton Blended
Fabrics Study on the Characteristics of Jute-Cotton Blended Fabrics,” SEU J. Sci. Eng., vol. Vol. 10, no.
December 2016, pp. 12–16, 2017.
[9] A. Anton, K. A. Johson, and P. A. Jansson, “Characterization of Fabric Luster via Image Analysis,” Text.
Res. J., vol. 48, no. 5, pp. 247–251, 1978.
[10] G. K. Roy, S. C. Saha, and K. K. Satapathy, “Electronic fineness tester of jute and allied fibres,” 2013.
[11] N. G. Ly and E. B. Denby, “Objective measurement of wool fabrics,” vol. 14, no. 2, 1986.
[12] S. L. Anderson, “the Air-Flow Method of Measuring Wool Fibre Fineness,” J. Text. Inst. Proc., vol. 45, no.
7, pp. P312–P316, 1954.
[13] A. E. Stearn, “34—A sonic fineness tester for textile fibres,” J. Text. Inst., vol. 61, no. 10, pp. 485–492,
1970.
[14] A. E. Stearn, M. W. Andrews, F. Bloos, M. R. Bow, and K. A. Harley, “65—The csiro portable sonic
fineness tester, model B,” J. Text. Inst., vol. 65, no. 10, pp. 552–558, 1974.
[15] N. Jackson and H. Engel, “Calibration of the sonic fineness tester for use on pre-tared wool samples,” Jul.
2022.
[16] J. G. Montalvo, “Textile technology: Relationships between micronaire, fineness, and maturity. Part I.
Fundamentals,” J. Cotton Sci., vol. 9, no. 2, pp. 81–88, 2005.
[17] A. R. Kalyanaraman and N. Ramakrishnan, “Measurement of blend proportion in jute-cotton yarn with
the assistance of a high volume tester,” J. Text. Inst., vol. 86, no. 4, pp. 704–705, 1995.
Top Related
Copyright © 2022 FDOKUMEN

