


Bahasa
Halaman
Hukum

Epilepsia, 47(3):479–488, 2006Blackwell Publishing, Inc.C© 2006 International League Against Epilepsy
Status Epilepticus in 12-day-old Rats Leads to TemporalLobe Neurodegeneration and Volume Reduction: A Histologic
and MRI Study
∗Jaak Nairismagi, †‡Asla Pitkanen, §Mikko I. Kettunen, ∗§Risto A. Kauppinen, and ‖Hana Kubova
∗Department of Biomedical NMR, and †Epilepsy Research Laboratory, AI Virtanen Institute for Molecular Sciences, University ofKuopio, and ‡Department of Neurology, Kuopio University Hospital, Kuopio, Finland; §School of Sport and Exercise Sciences,University of Birmingham, Edgbaston, Birmingham, England; and ‖Institute of Physiology, Academy of Sciences of the Czech
Republic, Prague, Czech Republic
Summary: Purpose: Whether status epilepticus (SE) in earlyinfancy, rather than the underlying illness, leads to temporal lobeneurodegeneration and volume reduction remains controversial.
Methods: SE was induced with LiCl-pilocarpine in P12 rats.To assess acute neuronal damage, brains (five controls, five withSE) were investigated at 8 h after SE by using silver and Fluoro-Jade B staining. Some brains from the early phase were processedfor electron microscopy. To assess chronic changes, brains fromnine controls and 13 rats with SE at P12 were analyzed after3 months by using histology and magnetic resonance imaging(MRI).
Results: MRI analysis of the temporal lobe of adult animalswith SE at P12 indicated that 23% of the rats had hippocampal,15% had amygdaloid, and 31% had perirhinal volume reduc-tion. Histologic analysis of sections from the MR-imaged brainscorrelated with the MRI data. Analysis of neurodegeneration
8 h after SE by using both silver and Fluoro-Jade B staining re-vealed degenerating neurons located in the same temporal loberegions as the volume reduction in chronic samples. Electronmicroscopic analysis revealed irreversible ultrastructural alter-ations. As with the chronic histologic and MRI findings, interan-imal variability was seen in the distribution and severity of acutedamage.
Conclusions: Our data indicate that SE at P12 can causeacute neurodegeneration in the hippocampus as well as inthe adjacent temporal lobe. It is likely that acute neuronaldeath contributes to volume reduction in temporal lobe regionsthat is detected with MRI in a subpopulation of animals inadulthood. Key Words: Amygdala—Epileptogenesis—Hippocampus—Magnetic resonance imaging—Perirhinalcortex.
Status epilepticus (SE) is a neurologic emergency witha higher incidence in infancy and childhood than in anyother period of life (1). It remains controversial, however,whether SE causes injury to the developing brain. Prospec-tive imaging studies demonstrated volume reduction of thehippocampus between the two consecutive measurementsin a subpopulation of infants and children with prolongedfebrile seizures (2). Other studies, however, suggest thatthe association between prolonged seizures and structuralabnormalities can result from complex interactions be-tween developmental abnormalities, prenatal or perinatalinsults, and genetic factors [for review, see (3)].
In clinical studies, the causality between seizure activ-ity and structural damage is difficult to investigate because
Accepted October 21, 2005.Address correspondence and reprint requests to Dr. H. Kubova at
Institute of Physiology, Academy of Sciences of the Czech Repub-lic, Vıdenska 1083, Prague 4, CZ-142 20, Czech Republic. E-mail:[email protected]
of associated illnesses and treatments. Experimental stud-ies in which SE was induced in normal immature braindemonstrated that SE can cause hippocampal and amyg-daloid neurodegeneration resembling that in human tem-poral lobe epilepsy (TLE) in rats older than postnatal day(P) 14 (4). We recently extended these observations byshowing that convulsive SE for 2 h can cause neuronaldeath in the mediodorsal nucleus of the thalamus in 100%of animals as early as P12 (5). Further, rats with SE atP12 had impaired memory and emotional behavior whenassessed 3 months later, and ∼25% of animals developedspontaneous seizures within 3 to 6 months, which involvedthe hippocampus (6). These findings suggest that SE asearly as P12, corresponding to early infancy in humans, isassociated with structural alterations with an unfavorablefunctional outcome in a subpopulation of animals. It isnot known, however, whether SE at P12 causes the vol-ume reduction of the medial temporal lobe that is a typicalfeature of pathology in TLE patients with early-life SE.
479

480 J. NAIRISMAGI ET AL.
We designed a study to address four questions. First,can volume decrease be detected in hippocampus, amyg-dala, or the surrounding cortex in adult rats with SE atP12? Second, is neurodegeneration present in all animalsor only in a subpopulation? Third, does the volume de-crease revealed by magnetic resonance imaging (MRI)correlate with neurodegeneration assessed from histologicsections from the same animals? Fourth, does the chronicvolume reduction locate in the same regions as acuteneurodegeneration?
SE was induced with LiCl-pilocarpine in P12 rats. Inone group, neurodegeneration was studied 8 h after SE byusing Fluoro-Jade B and silver staining. A second group ofanimals was allowed to survive for 3 months, after whichthey underwent MRI and histologic analysis. Our dataindicate that SE at P12 can cause the acute neurodegen-eration in the hippocampus, as well as in the adjacenttemporal lobe, detected with MRI in a subpopulation ofanimals in adulthood.
METHODS
AnimalsForty-seven male P12 Wistar rats were used in the ex-
periments. The day of birth was defined as P0. Animalswere weaned at P28 and housed under controlled temper-ature (22 ± 1◦C) and humidity (50–60%) with a 12:12light/dark cycle. They had free access to food and water.Experiments were approved by the Animal Care and UseCommittee of the Institute of Physiology of the Academyof Sciences of the Czech Republic, by the Committee forthe Welfare of Laboratory Animals of the University ofKuopio, and by the Provincial Government of Kuopio.Animal care and experimental procedures were conductedin accordance with the guidelines of the European Com-munity Council directives 86/609/EEC.
Induction of SE with LiCl-pilocarpineForty-seven rats were intraperitoneally (i.p.) treated
with an aqueous solution of lithium chloride (3 mmol/kg)24 h before administration of pilocarpine [n = 31; 40mg/kg dissolved in saline (2 ml/kg, i.p.)]. After pilo-carpine injection, animals were housed in single cages, andtheir behavioral seizure activity was observed for ≥3 h.Two parameters were monitored: (a) latency to the begin-ning of continuous motor seizure activity (motor SE), and(b) occurrence of generalized tonic–clonic seizures. After2 h of motor SE, animals were treated with paraldehyde[0.3 ml/kg dissolved in distilled H2O (3 ml/kg, i.p.)]. Fourhours after the beginning of SE, rats were injected withsaline (≤2% of the body weight, s.c.) to restore volumeloss, and returned to their dams (the duration of isolationfrom dams in the control and SE groups was the same).During the experiments, rat pups were placed on an electri-cally heated pad (34◦C; corresponding to the temperaturein the nest). Only rats with motor SE without generalized
tonic–clonic seizures were included in the study. Controls(n = 16) were treated with saline instead of pilocarpine orparaldehyde at the corresponding time points.
Body weight was measured daily for 1 week after SE,and thereafter at 13, 21, and 40 days, and 3 months afterSE. These data were used to calculate relative body weight[(body weight at the time of measurement/body weight atP12) × 100%] during the course of the study to investigatethe effect of body weight on data obtained.
Nomenclature of various anatomic regions inhistology and MRI
The hippocampus was partitioned into different sub-fields along the septotemporal axis according to Amaraland Witter (7), the perirhinal cortex according to Burwell(8), and the amygdaloid complex according to Pitkanenet al. (9).
MRI and histology 3 months after SE
MRIMRI was performed in nine controls (391–512 g at the
time of imaging) and in 13 rats with SE (391–612 g).Three months after SE, animals were anesthetized with0.5 to 1.0% halothane in N2O/O2 (7:3) and fixed in a plas-tic MRI-compatible animal holder, which provided highlyreproducible positioning of the head. T2-weighted multi-slice images (repetition time, 2 s; echo time, 55 ms; fieldof view, 35 mm; data matrix, 256 × 128; slice thickness,1 mm) were acquired at a 4.7-T magnet (Magnex ScientificLtd, Abington, U.K.) by using a Varian UNITY INOVA con-sole (Palo Alto, CA, U.S.A.) and a birdcage-type volume-coil (diameter, 40 mm; length, 72 mm).
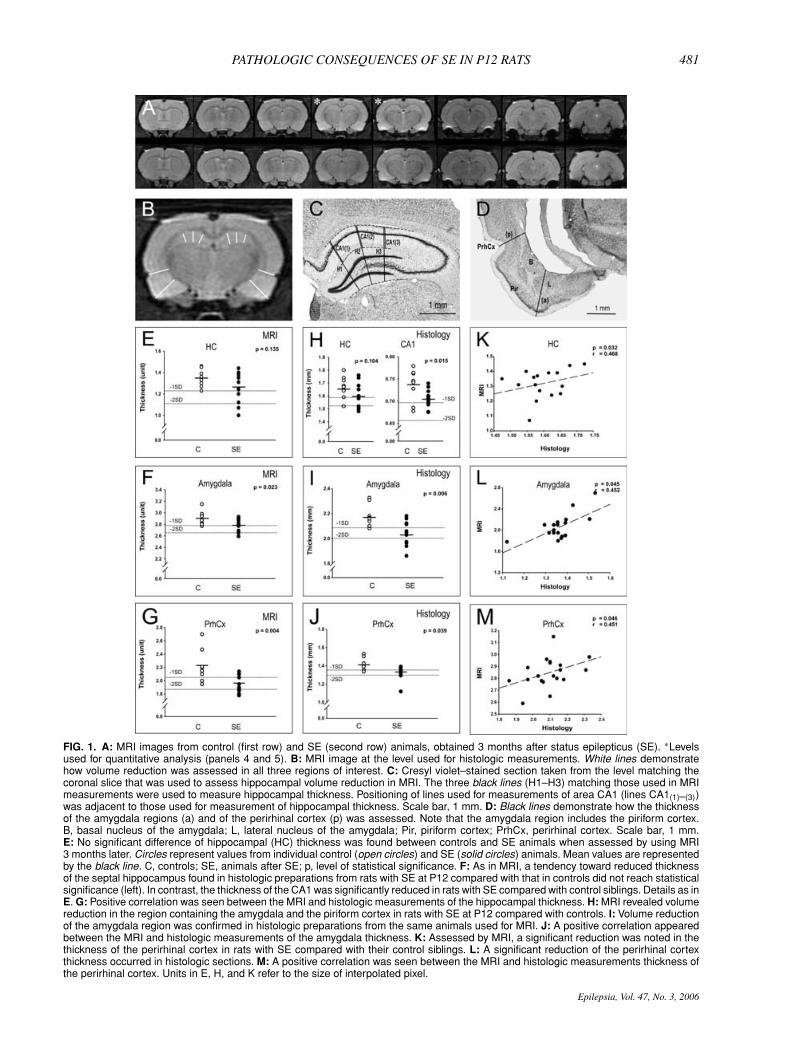
Eight 1-mm-thick slices were produced from each an-imal (Fig. 1A). Two of the eight slices containing the re-gion of interest (i.e., hippocampus, amygdala, piriformand perirhinal cortex) were chosen for quantitative mea-surements. The section and lines used to measure the thick-ness of each region are shown in Fig. 1A and B.
Volume reduction in the septal hippocampus and theperirhinal cortex (area 35) was assessed in the sectioncorresponding to level −3.8 from bregma [rat brain at-las of Paxinos and Watson (10); Fig. 1B]. For assessmentof hippocampal volume by MRI, three lines were drawnto partition the hippocampus into four equal segments,as shown in Fig. 1B. The three lines match those usedin the histologic measurements (see later). To assess vol-ume reduction of the perirhinal cortex, a line was drawnto connect the pial surface and the capsula externa in thefundus of the perirhinal cortex (Fig. 1B). Amygdala mea-surements were performed in the most caudal section (seeFig. 1A, upper row, the fifth section) and included thepiriform cortex because no landmarks in the MR imagesindicated the border between these two regions. To mea-sure amygdaloid volume, a line was drawn between theventricular surface (corresponding to the medial corner
Epilepsia, Vol. 47, No. 3, 2006
PATHOLOGIC CONSEQUENCES OF SE IN P12 RATS 481
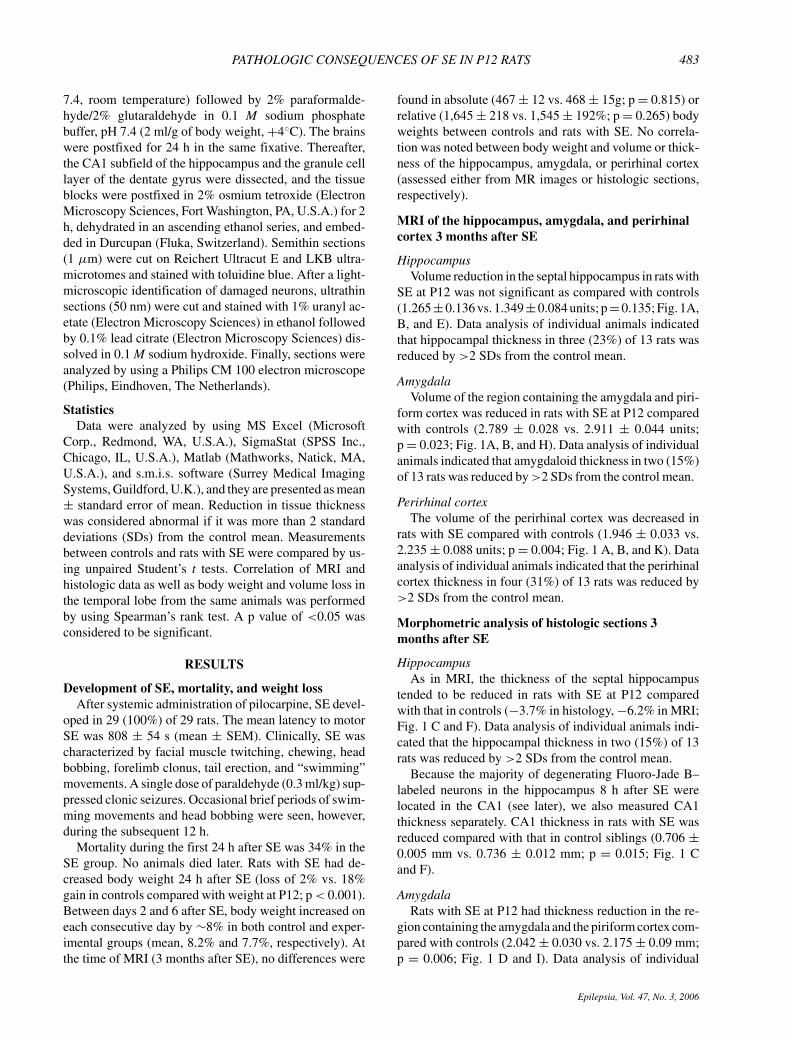
FIG. 1. A: MRI images from control (first row) and SE (second row) animals, obtained 3 months after status epilepticus (SE). ∗Levelsused for quantitative analysis (panels 4 and 5). B: MRI image at the level used for histologic measurements. White lines demonstratehow volume reduction was assessed in all three regions of interest. C: Cresyl violet–stained section taken from the level matching thecoronal slice that was used to assess hippocampal volume reduction in MRI. The three black lines (H1–H3) matching those used in MRImeasurements were used to measure hippocampal thickness. Positioning of lines used for measurements of area CA1 (lines CA1(1)–(3))was adjacent to those used for measurement of hippocampal thickness. Scale bar, 1 mm. D: Black lines demonstrate how the thicknessof the amygdala regions (a) and of the perirhinal cortex (p) was assessed. Note that the amygdala region includes the piriform cortex.B, basal nucleus of the amygdala; L, lateral nucleus of the amygdala; Pir, piriform cortex; PrhCx, perirhinal cortex. Scale bar, 1 mm.E: No significant difference of hippocampal (HC) thickness was found between controls and SE animals when assessed by using MRI3 months later. Circles represent values from individual control (open circles) and SE (solid circles) animals. Mean values are representedby the black line. C, controls; SE, animals after SE; p, level of statistical significance. F: As in MRI, a tendency toward reduced thicknessof the septal hippocampus found in histologic preparations from rats with SE at P12 compared with that in controls did not reach statisticalsignificance (left). In contrast, the thickness of the CA1 was significantly reduced in rats with SE compared with control siblings. Details as inE. G: Positive correlation was seen between the MRI and histologic measurements of the hippocampal thickness. H: MRI revealed volumereduction in the region containing the amygdala and the piriform cortex in rats with SE at P12 compared with controls. I: Volume reductionof the amygdala region was confirmed in histologic preparations from the same animals used for MRI. J: A positive correlation appearedbetween the MRI and histologic measurements of the amygdala thickness. K: Assessed by MRI, a significant reduction was noted in thethickness of the perirhinal cortex in rats with SE compared with their control siblings. L: A significant reduction of the perirhinal cortexthickness occurred in histologic sections. M: A positive correlation was seen between the MRI and histologic measurements thickness ofthe perirhinal cortex. Units in E, H, and K refer to the size of interpolated pixel.
Epilepsia, Vol. 47, No. 3, 2006
482 J. NAIRISMAGI ET AL.
of the border between the lateral and basal nuclei in thehistologic sections; see later) and the brain surface corre-sponding to the most ventrolateral corner of the piriformcortex (Fig. 1B). The means of measurements from bothhemispheres were used for statistical analysis.
HistologyAfter finishing the MRI study (16 weeks after SE),
rats were deeply anesthetized with sodium pentobarbital(60 mg/kg, i.p.) and chloral hydrate (100 mg/kg, i.p.) andtranscardially perfused by using 4% paraformaldehyde asdescribed before. The brains were removed from the skulland postfixed in buffered 4% paraformaldehyde for 3 hand then cryoprotected in a solution containing 20% glyc-erol in 0.02 M potassium buffered saline (pH, 7.4) for24 h at +4◦C. The brains were frozen in dry ice andstored at −70◦C until cut. The brains were sectioned in thecoronal plane (30 μm, one-in-five series) with a slidingmicrotome, and sections were stored in a cryoprotectanttissue-collecting solution (30% ethylene glycol, 25% glyc-erol in 0.05 M sodium phosphate buffer) at −20◦C untilprocessed.
To obtain histologic confirmation of the volume de-crease observed in MRI, one series of sections from MR-imaged animals was stained with cresyl violet. A stackof six consecutive sections (150 μm apart, total “slicethickness” 900 μm) matching the coronal slice that wasused to assess hippocampal volume reduction in MRI waschosen for analysis. In brief, cresyl violet–stained sec-tions were viewed under bright-field illumination with anOlympus AX70 microscope equipped with an OlympusDP70 digital camera and Olympus Micro Image Analy-sis Software (Media Cybernetics, L.P., Newburyport, MA,U.S.A.). Measurements were started at the level at whichthe suprapyramidal and infrapyramidal blades of the gran-ule cell layer form a continuous band of cells [−3.30 frombregma according to rat brain atlas of Paxinos and Wat-son (10)]. Three lines were drawn between the alveus andthe ventral surface of the infrapyramidal molecular layer,which resulted in partitioning of the granule cell layer intofour equal portions (Fig. 1C; lines H1, H2, H3). Then thelength of the three lines (i.e., thickness of the hippocam-pus) was measured in all six consecutive sections, and themean of all 18 measurements per animal was calculated.The mean value of the left and right hippocampus was usedfor statistical analysis (no differences were found betweenhemispheres in controls or rats with SE, data not shown).
The thickness of area CA1 was measured as the dis-tance between the alveus and the hippocampal fissure.Positioning of lines used for measurements [lines CA1(1), CA1 (2), CA1 (3) in Fig. 1C] was adjacent to thatused for measurement of hippocampal thickness (see ear-lier). Mean values from left and right CA1 were used forstatistical analysis.
Amygdala thickness was measured at the level corre-sponding to anteroposterior level −3.8 in the rat brain atlasof Paxinos and Watson (10). A line was drawn between themedial corner of the border between the lateral and basalnuclei and the most ventrolateral corner of the piriformcortex (line a, Fig. 1D; A). The mean of the measurementsin consecutive sections (150 μm apart) was calculated peranimal. The mean of the left and right measurements wasused for statistical analysis.
Perirhinal cortex thickness was measured at the levelcorresponding to anteroposterior level −3.8 in the rat brainatlas of Paxinos and Watson (10) in two consecutive sec-tions (150 μm apart). A line was drawn to connect thepial surface and the capsula externa in the fundus of theperirhinal cortex (line p, Fig. 1D; P). The mean of the leftand right hemisphere was calculated for each animal andused for statistical analysis.
All analyses were performed in a blinded manner.
Histology of acute neurodegeneration 8 h after SE
Fluoro-Jade B and silver histochemistryAn additional group of controls (n = 5) and rats with
SE (n = 5) were prepared for Fluoro-Jade B and silverstaining to confirm the occurrence of acute SE-inducedneurodegeneration in regions with volume reduction inchronic MR-imaged samples. Rats were perfused 8 h af-ter the onset of SE or saline injection, and brains werepostfixed and cryoprotected as described earlier. Tissuewas cut in the coronal plane (50 μm, one-in-five series)with a Leica CM 1900 cryocut (Leica Instruments GmbH,Nussloch, Germany), and sections were stored in a cry-oprotectant tissue-collecting solution until stained. To de-tect degenerating neurons, adjacent series of one-in-fivesections were processed for cresyl violet, Fluoro-Jade B,and silver staining.
Fluoro-Jade B histochemistry was performed accord-ing to Schmued et al. (11). To illustrate the distribu-tion of neuronal damage in different brain areas, Fluoro-Jade B–labeled cells were plotted from selected sectionswith a computer-aided digitizing system (MicroBright-field, Minnesota Datametrics, St. Paul, MN, U.S.A.).Anatomic boundaries were drawn from adjacent cre-syl violet–stained sections by using a stereomicroscopeequipped with a drawing tube, and then superimposedon scanned plots using CorelDraw (version 11) software(Corel Corporation Limited, Dublin, Ireland).
The silver-impregnation technique described byGallyas et al. (12) was used as a second method for de-tecting degenerating neurons.
Electron microscopyTo assess the ultrastructure of damaged neurons in the
hippocampus, an additional group of animals (two con-trols and two with SE) was perfused 24 h after SE with20 ml of 0.01 M sodium phosphate–buffered saline (pH
Epilepsia, Vol. 47, No. 3, 2006
PATHOLOGIC CONSEQUENCES OF SE IN P12 RATS 483
7.4, room temperature) followed by 2% paraformalde-hyde/2% glutaraldehyde in 0.1 M sodium phosphatebuffer, pH 7.4 (2 ml/g of body weight, +4◦C). The brainswere postfixed for 24 h in the same fixative. Thereafter,the CA1 subfield of the hippocampus and the granule celllayer of the dentate gyrus were dissected, and the tissueblocks were postfixed in 2% osmium tetroxide (ElectronMicroscopy Sciences, Fort Washington, PA, U.S.A.) for 2h, dehydrated in an ascending ethanol series, and embed-ded in Durcupan (Fluka, Switzerland). Semithin sections(1 μm) were cut on Reichert Ultracut E and LKB ultra-microtomes and stained with toluidine blue. After a light-microscopic identification of damaged neurons, ultrathinsections (50 nm) were cut and stained with 1% uranyl ac-etate (Electron Microscopy Sciences) in ethanol followedby 0.1% lead citrate (Electron Microscopy Sciences) dis-solved in 0.1 M sodium hydroxide. Finally, sections wereanalyzed by using a Philips CM 100 electron microscope(Philips, Eindhoven, The Netherlands).
StatisticsData were analyzed by using MS Excel (Microsoft
Corp., Redmond, WA, U.S.A.), SigmaStat (SPSS Inc.,Chicago, IL, U.S.A.), Matlab (Mathworks, Natick, MA,U.S.A.), and s.m.i.s. software (Surrey Medical ImagingSystems, Guildford, U.K.), and they are presented as mean± standard error of mean. Reduction in tissue thicknesswas considered abnormal if it was more than 2 standarddeviations (SDs) from the control mean. Measurementsbetween controls and rats with SE were compared by us-ing unpaired Student’s t tests. Correlation of MRI andhistologic data as well as body weight and volume loss inthe temporal lobe from the same animals was performedby using Spearman’s rank test. A p value of <0.05 wasconsidered to be significant.
RESULTS
Development of SE, mortality, and weight lossAfter systemic administration of pilocarpine, SE devel-
oped in 29 (100%) of 29 rats. The mean latency to motorSE was 808 ± 54 s (mean ± SEM). Clinically, SE wascharacterized by facial muscle twitching, chewing, headbobbing, forelimb clonus, tail erection, and “swimming”movements. A single dose of paraldehyde (0.3 ml/kg) sup-pressed clonic seizures. Occasional brief periods of swim-ming movements and head bobbing were seen, however,during the subsequent 12 h.
Mortality during the first 24 h after SE was 34% in theSE group. No animals died later. Rats with SE had de-creased body weight 24 h after SE (loss of 2% vs. 18%gain in controls compared with weight at P12; p < 0.001).Between days 2 and 6 after SE, body weight increased oneach consecutive day by ∼8% in both control and exper-imental groups (mean, 8.2% and 7.7%, respectively). Atthe time of MRI (3 months after SE), no differences were
found in absolute (467 ± 12 vs. 468 ± 15g; p = 0.815) orrelative (1,645 ± 218 vs. 1,545 ± 192%; p = 0.265) bodyweights between controls and rats with SE. No correla-tion was noted between body weight and volume or thick-ness of the hippocampus, amygdala, or perirhinal cortex(assessed either from MR images or histologic sections,respectively).
MRI of the hippocampus, amygdala, and perirhinalcortex 3 months after SE
HippocampusVolume reduction in the septal hippocampus in rats with
SE at P12 was not significant as compared with controls(1.265±0.136 vs. 1.349±0.084 units; p=0.135; Fig. 1A,B, and E). Data analysis of individual animals indicatedthat hippocampal thickness in three (23%) of 13 rats wasreduced by >2 SDs from the control mean.
AmygdalaVolume of the region containing the amygdala and piri-
form cortex was reduced in rats with SE at P12 comparedwith controls (2.789 ± 0.028 vs. 2.911 ± 0.044 units;p = 0.023; Fig. 1A, B, and H). Data analysis of individualanimals indicated that amygdaloid thickness in two (15%)of 13 rats was reduced by >2 SDs from the control mean.
Perirhinal cortexThe volume of the perirhinal cortex was decreased in
rats with SE compared with controls (1.946 ± 0.033 vs.2.235 ± 0.088 units; p = 0.004; Fig. 1 A, B, and K). Dataanalysis of individual animals indicated that the perirhinalcortex thickness in four (31%) of 13 rats was reduced by>2 SDs from the control mean.
Morphometric analysis of histologic sections 3months after SE
HippocampusAs in MRI, the thickness of the septal hippocampus
tended to be reduced in rats with SE at P12 comparedwith that in controls (−3.7% in histology, −6.2% in MRI;Fig. 1 C and F). Data analysis of individual animals indi-cated that the hippocampal thickness in two (15%) of 13rats was reduced by >2 SDs from the control mean.
Because the majority of degenerating Fluoro-Jade B–labeled neurons in the hippocampus 8 h after SE werelocated in the CA1 (see later), we also measured CA1thickness separately. CA1 thickness in rats with SE wasreduced compared with that in control siblings (0.706 ±0.005 mm vs. 0.736 ± 0.012 mm; p = 0.015; Fig. 1 Cand F).
AmygdalaRats with SE at P12 had thickness reduction in the re-
gion containing the amygdala and the piriform cortex com-pared with controls (2.042 ± 0.030 vs. 2.175 ± 0.09 mm;p = 0.006; Fig. 1 D and I). Data analysis of individual
Epilepsia, Vol. 47, No. 3, 2006
484 J. NAIRISMAGI ET AL.
animals indicated that the amygdaloid thickness in four(31%) of 13 rats was reduced by >2 SDs from the controlmean.
Perirhinal cortexThickness of the perirhinal cortex was reduced in rats
with SE compared with controls (1.332 ± 0.023 vs. 1.410± 0.022 mm; p = 0.039; Fig. 1D and L). Data analysisof individual animals indicated that the perirhinal cortexthickness in two (15%) of 13 rats was reduced by >2 SDsfrom the control mean.
Correlation between MRI and histologic measurementsThe MRI and histologic measurements were posi-
tively correlated in the hippocampus (Fig. 1G), amygdala–piriform region (Fig. 1J), and perirhinal cortex (Fig. 1M).Comparison of occurrence of damage in each case in dif-ferent brain areas analyzed with the two methods is sum-marized in Table 1.
Acute histologic damage in the medial temporal lobein rats with SE at P12
All animals with SE had degenerating neurons in sam-ples collected 8 h after SE, whereas there was no positivelabeling in control animals. The distribution and severityof damage was similar in Fluoro-Jade B and silver prepa-rations.
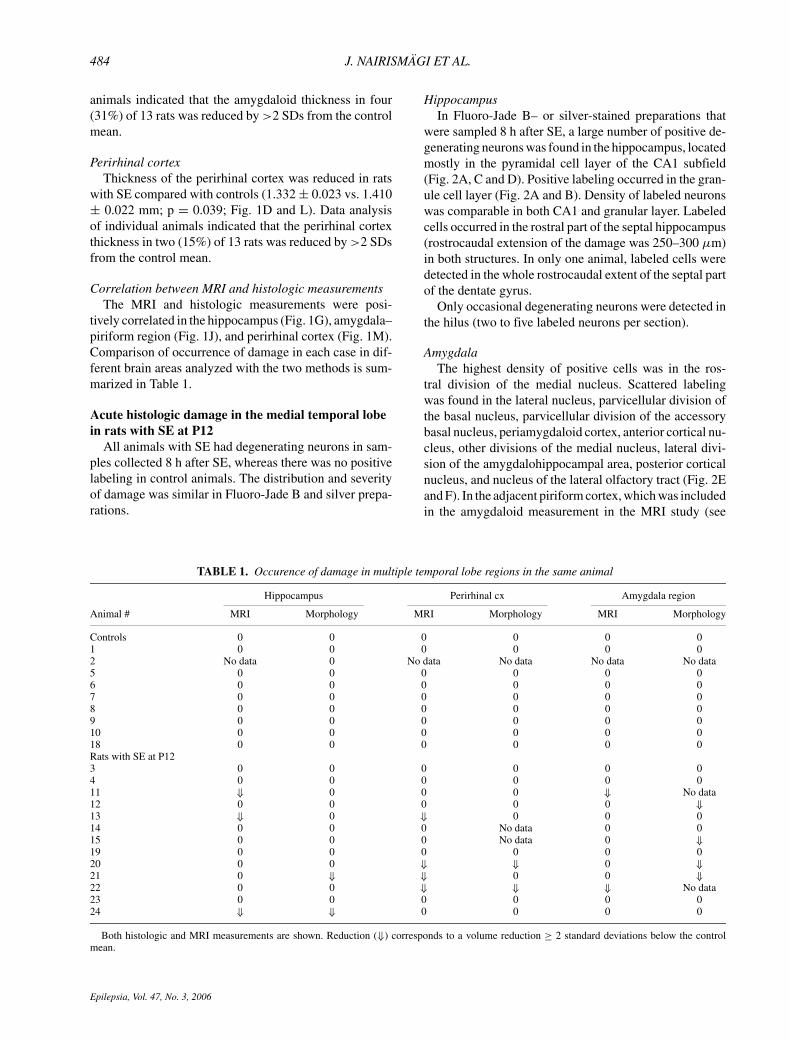
TABLE 1. Occurence of damage in multiple temporal lobe regions in the same animal
Hippocampus Perirhinal cx Amygdala region
Animal # MRI Morphology MRI Morphology MRI Morphology
Controls 0 0 0 0 0 01 0 0 0 0 0 02 No data 0 No data No data No data No data5 0 0 0 0 0 06 0 0 0 0 0 07 0 0 0 0 0 08 0 0 0 0 0 09 0 0 0 0 0 010 0 0 0 0 0 018 0 0 0 0 0 0Rats with SE at P123 0 0 0 0 0 04 0 0 0 0 0 011 ⇓ 0 0 0 ⇓ No data12 0 0 0 0 0 ⇓13 ⇓ 0 ⇓ 0 0 014 0 0 0 No data 0 015 0 0 0 No data 0 ⇓19 0 0 0 0 0 020 0 0 ⇓ ⇓ 0 ⇓21 0 ⇓ ⇓ 0 0 ⇓22 0 0 ⇓ ⇓ ⇓ No data23 0 0 0 0 0 024 ⇓ ⇓ 0 0 0 0
Both histologic and MRI measurements are shown. Reduction (⇓) corresponds to a volume reduction ≥ 2 standard deviations below the controlmean.
HippocampusIn Fluoro-Jade B– or silver-stained preparations that
were sampled 8 h after SE, a large number of positive de-generating neurons was found in the hippocampus, locatedmostly in the pyramidal cell layer of the CA1 subfield(Fig. 2A, C and D). Positive labeling occurred in the gran-ule cell layer (Fig. 2A and B). Density of labeled neuronswas comparable in both CA1 and granular layer. Labeledcells occurred in the rostral part of the septal hippocampus(rostrocaudal extension of the damage was 250–300 μm)in both structures. In only one animal, labeled cells weredetected in the whole rostrocaudal extent of the septal partof the dentate gyrus.
Only occasional degenerating neurons were detected inthe hilus (two to five labeled neurons per section).
AmygdalaThe highest density of positive cells was in the ros-
tral division of the medial nucleus. Scattered labelingwas found in the lateral nucleus, parvicellular division ofthe basal nucleus, parvicellular division of the accessorybasal nucleus, periamygdaloid cortex, anterior cortical nu-cleus, other divisions of the medial nucleus, lateral divi-sion of the amygdalohippocampal area, posterior corticalnucleus, and nucleus of the lateral olfactory tract (Fig. 2Eand F). In the adjacent piriform cortex, which was includedin the amygdaloid measurement in the MRI study (see
Epilepsia, Vol. 47, No. 3, 2006
PATHOLOGIC CONSEQUENCES OF SE IN P12 RATS 485
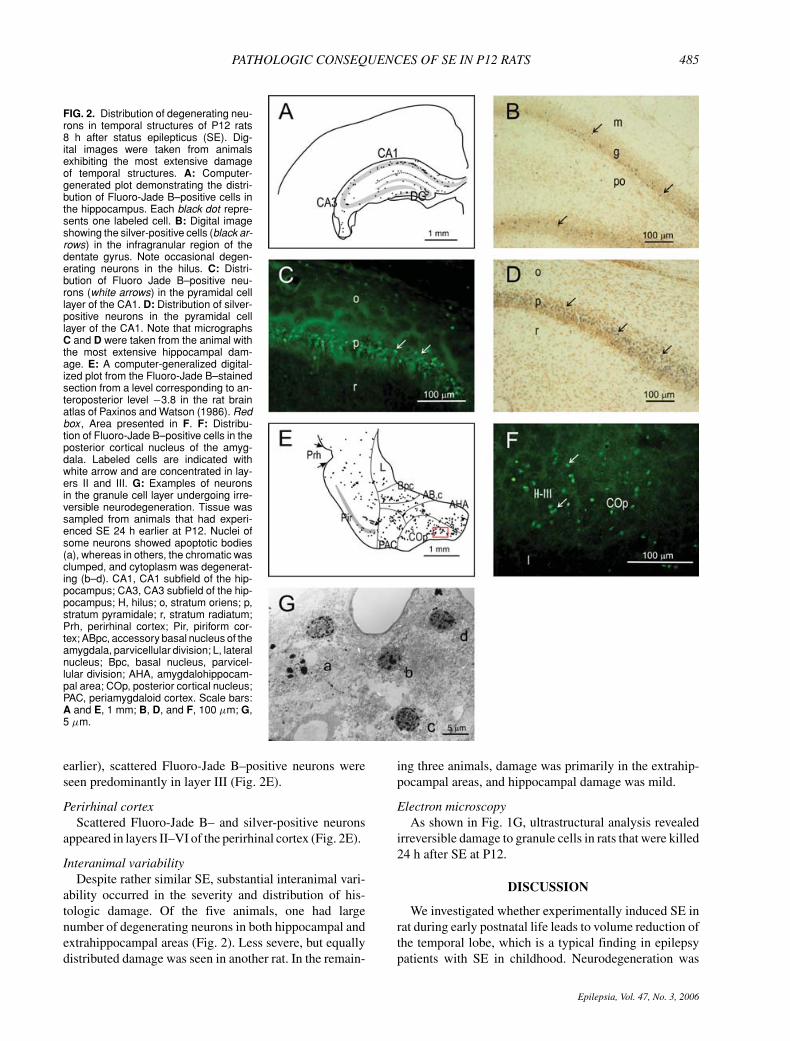
FIG. 2. Distribution of degenerating neu-rons in temporal structures of P12 rats8 h after status epilepticus (SE). Dig-ital images were taken from animalsexhibiting the most extensive damageof temporal structures. A: Computer-generated plot demonstrating the distri-bution of Fluoro-Jade B–positive cells inthe hippocampus. Each black dot repre-sents one labeled cell. B: Digital imageshowing the silver-positive cells (black ar-rows) in the infragranular region of thedentate gyrus. Note occasional degen-erating neurons in the hilus. C: Distri-bution of Fluoro Jade B–positive neu-rons (white arrows) in the pyramidal celllayer of the CA1. D: Distribution of silver-positive neurons in the pyramidal celllayer of the CA1. Note that micrographsC and D were taken from the animal withthe most extensive hippocampal dam-age. E: A computer-generalized digital-ized plot from the Fluoro-Jade B–stainedsection from a level corresponding to an-teroposterior level −3.8 in the rat brainatlas of Paxinos and Watson (1986). Redbox , Area presented in F. F: Distribu-tion of Fluoro-Jade B–positive cells in theposterior cortical nucleus of the amyg-dala. Labeled cells are indicated withwhite arrow and are concentrated in lay-ers II and III. G: Examples of neuronsin the granule cell layer undergoing irre-versible neurodegeneration. Tissue wassampled from animals that had experi-enced SE 24 h earlier at P12. Nuclei ofsome neurons showed apoptotic bodies(a), whereas in others, the chromatic wasclumped, and cytoplasm was degenerat-ing (b–d). CA1, CA1 subfield of the hip-pocampus; CA3, CA3 subfield of the hip-pocampus; H, hilus; o, stratum oriens; p,stratum pyramidale; r, stratum radiatum;Prh, perirhinal cortex; Pir, piriform cor-tex; ABpc, accessory basal nucleus of theamygdala, parvicellular division; L, lateralnucleus; Bpc, basal nucleus, parvicel-lular division; AHA, amygdalohippocam-pal area; COp, posterior cortical nucleus;PAC, periamygdaloid cortex. Scale bars:A and E, 1 mm; B, D, and F, 100 μm; G,5 μm.
earlier), scattered Fluoro-Jade B–positive neurons wereseen predominantly in layer III (Fig. 2E).
Perirhinal cortexScattered Fluoro-Jade B– and silver-positive neurons
appeared in layers II–VI of the perirhinal cortex (Fig. 2E).
Interanimal variabilityDespite rather similar SE, substantial interanimal vari-
ability occurred in the severity and distribution of his-tologic damage. Of the five animals, one had largenumber of degenerating neurons in both hippocampal andextrahippocampal areas (Fig. 2). Less severe, but equallydistributed damage was seen in another rat. In the remain-
ing three animals, damage was primarily in the extrahip-pocampal areas, and hippocampal damage was mild.
Electron microscopyAs shown in Fig. 1G, ultrastructural analysis revealed
irreversible damage to granule cells in rats that were killed24 h after SE at P12.
DISCUSSION
We investigated whether experimentally induced SE inrat during early postnatal life leads to volume reduction ofthe temporal lobe, which is a typical finding in epilepsypatients with SE in childhood. Neurodegeneration was
Epilepsia, Vol. 47, No. 3, 2006
486 J. NAIRISMAGI ET AL.
assessed by using histology and MRI. Three major find-ings occurred in the present study. First, MRI revealedvolume decline in the hippocampus, amygdala, and theperirhinal cortex in adult rats with SE at P12. Second, vol-ume decrease was apparent only in a subpopulation of an-imals. Third, volume reduction detected in MRI 3 monthsafter SE appeared in the same regions as the degeneratingneurons in preparations 8 h after SE. Irreversibility of earlyneuronal injury was confirmed by electron microscopy.
Methodologic considerationsExperimental models of SE provide several advantages
over clinical studies to examine the structural and func-tional consequences of SE in developing brain. For ex-ample, the study population can be made more homoge-neous regarding genetic background, age, duration of SE,follow-up, and outcome measures, yet the severity and dis-tribution of degenerating cells remains variable betweenanimals, as described in the present histologic and MRIanalysis, and which has also been shown in other studies(13,14). Such details are often obscure because the resultsare presented as mean values of a group of animals, andinteranimal variability in pathology is rarely discussed,although it might be a critical factor explaining the vari-ability in functional outcome after SE (i.e., duration of theepileptogenic period or seizure frequency and seizure typein animals that develop epilepsy after SE) (6,15).
Duration of SE is one of the major factors determiningthe severity of neurodegeneration (16). To standardize theduration of SE and reduce variability, we administered par-aldehyde at 2 h to stop SE. Our recent video-EEG studyconducted in parallel with the present analysis demon-strated that paraldehyde administration efficiently sup-presses behavioral seizures (6). Electrographic seizureswere, however, only transiently (<2 h) suppressed. Shortictal episodes in EEG could be recorded for ≤10 to 16 hafter the beginning of SE (6). Therefore we cannot excludethe possibility that interindividual variability both in theacute and chronic animal groups relates to variability inthe duration and severity of SE, despite paraldehyde ad-ministration. These data strengthen the view that despitetechnical difficulties, the quantification of SE with EEG inP12 rats provides valuable information about the associa-tion of duration and severity of SE with neurodegenerationand functional outcome. In contrast, interanimal variabil-ity in the present study provided us a valuable spectrumof changes that made it possible to assess the associationbetween the severity of damage in histologic preparationsand MRI findings.
It is unlikely that the volume reduction found in thisstudy in the various temporal structures is due to growthretardation. An 8% difference in body weight was foundbetween controls and experimental animals at the time ofweaning. Previous studies on the influence of malnutri-tion on growth of body and brain demonstrated that de-
crease of body weight by more than 25% did not affectthe wet weight of the brain of undernourished rats duringthe preweaning period (17).
SE at P12 in rats causes neurodegeneration in themedial temporal lobe
MRI analysis of the hippocampus 3 months after SE in-dicated that the mean thickness of the septal hippocampusdid not differ between controls and rats with SE at P12.This was in accord with histologic analysis of the samesections. A more detailed histologic analysis of differenthippocampal subfields, however, indicated mild decreasein the thickness of the CA1 subfield in rats with SE. Con-sistent with the present observations, SE-induced acutehippocampal neurodegeneration in selected subfields hasbeen demonstrated after prolonged seizures in immature(P10) rats in several previous studies (18–20). Neuronswere considered as “injured” rather than “degenerating”because authors did not observe neuronal loss in long-term samples. Consistent with previous observations, wedid not detect any clear neuronal loss in the CA1 pyra-midal cell layer or the dentate granule cell layer in visualscanning of Nissl-stained chronic sections 4 months afterSE. This was surprising because most of the animals likelyhad degenerating neurons in the CA1 at the acute phase.Further analysis, however, indicated that Fluoro-Jade B–positive neurons encompassed ≥50% of the length of theCA1 in only one of five rats. Probably a more substantialacute cell death is needed to detect laminated hippocam-pal neurodegeneration in routine histology of chronicsamples.
SE-induced damage in the CA1 hippocampal subfieldwas previously described in 2- to 3-week-old rats (14,15).In 1-week-old rabbits, Franck and Schwartzkroin (21) de-scribed loss of pyramidal neurons in the CA1 after sys-temic injection of kainate. They hypothesized that le-sion to the CA1 resembles that induced by hypoxia orischemia or both. More recently, however, in a model ofLiCl/pilocarpine-induced SE in P10 rabbits, Thomson andWasterlain (22) demonstrated vulnerability of CA1 neu-rons even though oxygen availability remained unchangedduring 1-h SE. Therefore they suggested that CA1 dam-age is likely to be due to seizure activity rather than tohypoxia.
As our data show, acute neuronal damage in the hip-pocampus of rats with SE at P12 can be detected as re-duction in hippocampal volume at the chronic phase byMRI or hippocampal morphometry. Unlike that in ani-mals with SE at an older age, chronic reduction in hip-pocampal volume in rats with convulsive SE at P12 isnot associated with laminated hippocampal cell loss thatwould be easily detectable in routine histology. Anotherimportant aspect of the analysis is that the measurement ofhippocampal volume or thickness included not only neu-rons but also extracellular space, glia, axons, dendrites,
Epilepsia, Vol. 47, No. 3, 2006

PATHOLOGIC CONSEQUENCES OF SE IN P12 RATS 487
and blood vessels. For example, Jiang and collaborators(23) found an almost 30% reduction in the dendritic spinedensity, and a 40% decrease in the diameter of dendriticarbors in CA3c pyramidal cells after recurrent seizuresinduced by intrahippocampal injection of tetanus toxin inP10 rats. Thus it remains to be studied whether pathologiesother than loss of neuronal somata contribute to volume re-duction in immature hippocampus exposed to SE at earlystages of postnatal development.
Based on MRI volumetry, amygdaloid damage ispresent in a subpopulation of patients with TLE with orwithout SE as an etiology for epilepsy (24). The presentdata demonstrate that convulsive SE can cause amygdaloiddamage at P12 that can be detected at 3 months after SE,both histologically and with MRI. Scattered degeneratingneurons were found in both the amygdala and piriformcortex 8 h after SE. Furthermore, a 13% reduction wasseen in total neuronal number in layer III of the piriformcortex 2 months after LiCl/pilocarpine-induced SE, as es-timated by unbiased stereology (Kubova and Pitkanen,unpublished data). It is likely that neurodegeneration inthe piriform cortex and the amygdala contributed to thevolume reduction in the amygdalopiriform region in MRIanalysis. It remains to be explored whether amygdaloiddamage is associated with emotional impairment in sub-jects with early-life SE.
MRI volumetry reveals atrophy of the perirhinal cortexin ∼30% of patients with drug-refractory TLE (25). Inadult rats, SE-induced damage in the perirhinal cortex hasnot been described in detail, but our unpublished obser-vations indicate neurodegeneration in layers II, III and VI(Lukasiuk and Pitkanen, unpublished data). Here we showthat SE at P12 can cause scattered neuronal degenerationin area 35 of the rat perirhinal cortex that can be detectedin histologic analysis acutely and in MRI 3 months later.The contribution of perirhinal neurodegeneration to mem-ory performance of subjects with early-life SE remains tobe studied.
Hippocampal and amygdaloid volume reduction ispresent in a subpopulation of adult rats with SE inearly life
As in humans, only a subpopulation of rats exhibits vol-ume reduction in the medial temporal lobe after SE. MRIanalysis of the temporal lobe 3 months after SE indicatedthat 23% of the rats had hippocampal, 15% amygdaloid,and 31% perirhinal volume reduction. Histologic analy-sis of sections from the MR-imaged brain was in goodagreement with the MRI data. Analysis of neurodegener-ation immediately (8 h after SE) indicated that damagedneurons were observed in the same temporal lobe regionsas the volume reduction in chronic samples. Interestingly,in three of five animals, most of the degenerating neu-rons were in the amygdaloid complex, whereas in two offive animals, a similar density of degenerating neurons
was noted in both hippocampal and extrahippocampal ar-eas. These data indicate that only a subpopulation of ratswith SE at P12 develops neurodegeneration and temporallobe volume reduction in long-term follow-up. Further,the distribution of neurodegeneration varies from case tocase. These observations are of interest regarding our re-cent analysis, which indicated that ∼25% of rats withLiCl/pilocarpine-induced SE at P12 develop epilepsy in3 months, and another 40% have interictal spiking (6).Further studies are needed to clarify whether early ab-normalities in MRI can be used as surrogate markers toassociate structural damage with epileptogenesis and poorcognitive and behavioral outcome.
Final commentSE at P12 leads to neurodegeneration in the medial tem-
poral lobe. Unexpectedly, the distribution of degenerat-ing neurons in the hippocampus was scattered rather thanlaminated. Dying cells in the amygdala also were not clus-tered into some subnucleus. The present data strengthenthe view that even though SE can induce neurodegener-ation as early as P12, factors other than major neuronalcell death might have a significant role in the develop-ment of brain-volume reduction and epileptogenesis afterearly-life SE (26,27). The contribution of mild neurode-generation to other outcome measures, like developmentaldelay or cognition, requires further study.
Acknowledgment: We gratefully acknowledge the experttechnical help by Mrs. Merja Lukkari (Kuopio, Finland) in his-tology and by Dr. Jirmanova (Institute of Physiology, Prague,Czech Republic) in electron microscopy. The help of Dr.Riitta Miettinen (Kuopio, Finland) in interpretation of electronmicroscopic images is greatly appreciated. The present studywas financially supported by the Exchange Visitor Program be-tween the Academy of Sciences of the Czech Republic and theAcademy of Finland (to H.K. and A.P.), grant 304/05/2582 of theGrant Agency of the Czech Republic (H.K.), Research ProjectAVOZ 50110509 (H.K.), the Academy of Finland (A.P.), and theSigrid Juselius Foundation (A.P. and R.A.K).
REFERENCES
1. Hauser WA. Status epilepticus: epidemiological considerations.Neurology 1990;40:9–13.
2. Scott RC, Gadian DG, King MD, et al. Magnetic resonance imag-ing findings within 5 days of status epilepticus in childhood. Brain2002;125:1951–1959.
3. Cendes F, Andermann F. Do febrile seizures promote temporal lobeepilepsy? Retrospective studies. In: Baram T, Shinnar S, eds. FebrileSeizures. New York: Academic Press, 2002:77–86.
4. Sankar R, Shin DH, Wasterlain CG. Serum neuron specific enolaseis a marker for neuronal damage following status epilepticus in therat. Epilepsy Res 1997;28:129–136.
5. Kubova H, Druga R, Lukasiuk K, et al. Status epilepticus causesnecrotic damage in the mediodorsal nucleus of the thalamus in im-mature rats. J Neurosci 2001;21:3593–3599.
6. Kubova H, Mares P, Suchomelova L, et al. Status epilepticus inimmature rats leads to behavioral and cognitive impairment andepileptogenesis. Eur J Neurosci 2004;19:3255–3265.
Epilepsia, Vol. 47, No. 3, 2006
488 J. NAIRISMAGI ET AL.
7. Amaral DG, Witter MP. The three-dimensional organization of thehippocampal formation: a review of anatomical data. Neuroscience1989;31:571–591.
8. Burwell RD. Borders and cytoarchitecture of the perirhinal andpostrhinal cortices in the rat. J Comp Neurol 2001;437:17–41.
9. Pitkanen A, Pikkarainen M, Nurminen N, et al. Reciprocal connec-tions between the amygdala and the hippocampal formation, perirhi-nal cortex, and postrhinal cortex in rat: a review. Ann N Y Acad Sci2000;911:369–391.
10. Paxinos G, Watson C. The Rat Brain in Stereotaxic Coordinates.New York: Academic Press, 1986.
11. Schmued LC, Albertson C, Slikker W Jr. Fluoro-Jade: a novelfluorochrome for the sensitive and reliable histochemical lo-calization of neuronal degeneration. Brain Res 1997;751:37–46.
12. Gallyas F, Wolff H, Bottcher H, et al. A reliable and sensitive methodto localize terminal degeneration and lysozymes in the central ner-vous system. Stain Technol 1980;55:299–306.
13. Dube C, Boyet S, Marescaux C, et al. Progressive metabolic changesunderlying the chronic reorganization of brain circuits during thesilent phase of the lithium-pilocarpine model of epilepsy in the im-mature and adult rat. Exp Neurol 2000;162:146–157.
14. Wu C-L, Huang C-W, Liou C-W, et al. Lithium-pilocarpine-induced status epilepticus in immature rats results in long-termdeficits in spatial learning and hippocampal cell loss. Neurosci Lett2001;312:13–117.
15. Sankar R, Shin DH, Liu H, et al. Patterns of status epilepticus-induced neuronal injury during development and long-term conse-quences. J Neurosci 1998;18:8382–8393.
16. Fujikawa DG. The temporal evolution of neuronal damagefrom pilocarpine-induced status epilepticus. Brain Res 1996;725:11–22.
17. Altman J, Das GD, Sudarshan K, et al. The influence of nutrition onneural and behavioral development, II: Growth of body and brainin infant rats using different techniques of undernutrition. Dev Psy-chobiol 1971;4:55–70.
18. Pineau N, Charriaut-Marlangue C, Motte J, et al. Pentylenetetrazolinduced seizures induce cell suffering but not death in the immaturebrain. Dev Brain Res 1999;112:139–144.
19. Chang D, Baram TZ. Status epilepticus results in reversible neuronalinjury in infant rat hippocampus. Dev Brain Res 1994;77:133–136.
20. Toth Z, Yan XX, Haftoglou S, et al. Seizure-induced neuronal injury:vulnerability to febrile seizures in an immature rat model. J Neurosci1998;18:4285–4294.
21. Franck JE, Schwartzkroin PA. Immature rabbit hippocampus is dam-aged by systemic but not intraventricular kainic acid. Brain Res1984;315:219–227.
22. Thompson K, Wasterlain C. Lithium-pilocarpine status epilepticusin the immature rabbit. Brain Res Dev Brain Res 1997;100:1–4.
23. Jiang M, Lee CL, Smith KL, Swann JW. Spine loss and other persis-tent alterations of hippocampal pyramidal cell dendrites in a modelof early-onset epilepsy. J Neurosci 1998;18:8356–8368.
24. Pitkanen A, Tuunanen J, Kalviainen R, et al. Amygdala damagein experimental and human temporal lobe epilepsy. Epilepsy Res1998;32:233–253.
25. Jutila L, Ylinen A, Partanen K, et al. MR volumetry of the entorhinal,perirhinal, and temporopolar cortices in drug-refractory temporallobe epilepsy. AJNR Am J Neuroradiol 2001;22:1490–1501.
26. Bender RA, Dube C, Baram TZ. Febrile seizures and mechanismsof epileptogenesis: insights from an animal model. Adv Exp MedBiol 2004;548:213–225.
27. Dube C, Yu H, Nalcioglu O, et al. Serial MRI after experimentalfebrile seizures: altered T2 signal without neuronal death. Ann Neu-rol 2004;56:709–714.
Epilepsia, Vol. 47, No. 3, 2006
Top Related
Copyright © 2022 FDOKUMEN

