


Bahasa
Halaman
Hukum


Behav, Ecol. Sociobiol. 2, 271-290 (1977) Behavioral Ecology and Sociobiology �9 by Springer-Verlag 1977
and Its Significance Sound Transmission for Animal Vocalization
I. Temperate Habitats
Ken Marten* and Peter Marler** The Rockefeller University, New York, New York 10021, USA
Received January 14, 1977
Summary. 1. Sound transmission was measured in open fields, mixed decid- uous forest with and without leaves and coniferous forest in Dutchess County, New York. Attenuation of white noise and pure tones was measured between one microphone close to a loudspeaker and another microphone 100 m away, at the same height. Graphs of excess attenuation (E.A. in dB/100 m) against frequency were obtained at 0.15, 1, 2, 5, and 10 m above the ground. An analysis of variance was conducted to estimate effects of height, frequency and habitat.
2. Height and frequency affect sound transmission more than habitat. With a sound source close to the ground (15 cm and 1 m) all frequencies were more attenuated than at greater heights. The patterns of E.A. as a function of sound frequency were basically similar in all habitats. At all source heights the lower the frequency the better the sound carried, with the exception that close to the ground, sounds below 2 kHz were excessively attenuated. Comparing open field and forest, trees improved transmission of frequencies below 3 kHz, especially close to the ground.
3. Some general trends can be predicted for maximization of transmission distances of animal sounds in these habitats. For an animal vocalizing higher than 1 m above the ground, the lower the frequency the further the sound travels. Close to the ground, low frequencies are again preferred for maxim- ization of transmission distances, but the frequencies must be pitched above a range of attenuated, low-pitched sounds, the limits of which vary to some extent with habitat, creating the 'sound window' of Morton. This 'window' of least-attenuated frequencies, only occurring close to the ground, tends to be pitched somewhat lower in forest than in open habitats. However, for an animal producing sounds in the habitats tested, perch height and sound frequency are more important than the habitat in determining how far the sound will carry.
* Present address: Department of Zoology, University of California, Berkeley, California 94720, USA ** To whom offprint requests should be sent

272 K. Marten and P. Marler
Introduction
I n s t u d i e s o f t h e r e l a t i o n s h i p b e t w e e n s o u n d t r a n s m i s s i o n in d i f f e r e n t e n v i r o n -
m e n t s a n d t h e p h y s i c a l p r o p e r t i e s o f b i r d a n d m o n k e y v o c a l i z a t i o n s M o r t o n
(1970, 1975), C h a p p u i s (1971) , a n d W a s e r a n d W a s e r ( i n p re s s ) h a v e p r e s e n t e d
e v i d e n c e o f a d a p t i v e r e l a t i o n s h i p s t o m a x i m i z e t h e t r a n s m i s s i o n d i s t a n c e s o f
c e r t a i n a n i m a l s o u n d s . T h e s e s t u d i e s w e r e c o n d u c t e d in t h e t r o p i c s , e spec i a l l y
in r a i n fo res t . E x i s t i n g d a t a o n s o u n d t r a n s m i s s i o n in n o r t h e r n e n v i r o n m e n t s
(e .g . , W i e n e r a n d K e a s t , 1959 ; E m b l e t o n , 1963) w e r e i n a d e q u a t e t o d e t e r m i n e
w h e t h e r s i m i l a r r e l a t i o n s h i p s p r e v a i l i n t e m p e r a t e h a b i t a t s . T h i s s t u d y w a s
u n d e r t a k e n t o p e r m i t a d i r e c t c o m p a r i s o n w i t h t h e s i t u a t i o n M o r t o n h a d de-
s c r i b e d in P a n a m a , w i t h t h e u l t i m a t e a i m o f f u r t h e r i n g u n d e r s t a n d i n g o f s t ruc -
t u r a l a d a p t a t i o n s o f a n i m a l v o c a l i z a t i o n s to t r a n s m i s s i o n in d i f f e r e n t n a t u r a l
e n v i r o n m e n t s .
Materials and Methods
All tests were conducted over a standard distance of 100 m, selected as appropriate to many vertebrate communication systems. Battery operation of equipment permitted complete portability. Figure 1 identifies the equipment used and diagrams the system, divided into three stations. The sending station consisted of a loudspeaker mounted on a 12 m pole supported by guy wires. A microphone was suspended 2.5 m from the loudspeaker in its far sound field. Pre-recorded tapes of white noise and of 24 pure tones ranging from 350 Hz to 11 kHz were played through the loudspeaker from a Nagra l l l B tape recorder. The white noise was recorded from a 1390-B General Radio Random Noise Generator. Each tone was broadcast 30 s at approximately 100 dB, measured at the microphone near the loudspeaker. It took about 30 min to run through all 24 tones so that one run sampled a variety of changing atmospheric conditions. Partly for this reason, and partly as a precaution against the creation of standing waves by sustained pure tones, white noise measurements were also taken, over a 4 s period, with an intensity of approximately 120 dB as measured at the near microphone.
At the receiving station an identical microphone was suspended from a 12 m pole. Both micro- phones were fitted with small windscreens, and the far microphone was also enclosed in a larger ellipsoid wind screen, virtually transparent to sound. All measurements were made on a horizontal course, with both microphones at the same height as the loudspeaker diaphragm. Transmission heights were 'ground level,' 1, 2, 5, and 10 m. At "ground level" the loudspeaker was laid on the substrate with its diaphragm 15 cm above the ground. The receiving equipment was always placed with the 'far ' microphone 100 m from the 'near ' microphone, and therefore 102.5 m from the loudspeaker.
The data station was connected to those microphones for sending and receiving by cables of equal length. During pure tone transmission, sound pressure levels at the two microphones were read on a sound level meter, switching systematically from one to the other. White noise was recorded simultaneously from bo th microphones on the two channels of a Nagra IVS stereo tape recorder for subsequent analysis. In both pure tone and white noise tests the near microphone channel incorporated a 40 dB attenuator, in series, to facilitate recording and analysis by keeping both near and far signals within the dynamic range of the recording and analyzing equipment. The Nagra input gain controls were locked together at maximum gain for all recordings.
During pure tone transmission, the lines from both microphones were passed through a 1/3 octave band pass filter centered on the transmitted frequency. A portable oscilloscope monitored the signal going to the sound level meter to verify presence of the transmitted tone and avoid confusion with environmental sounds. The sound level meter time constant was set at 0.5 s for all tests to stabilize the meter for reading in the face of large, rapid fluctuations of sound intensity at the far microphone. The weighting response of the sound level meter was set to the 'fiat ' mode for all measurements.

Temperate Sound Transmission and Animal Vocalization 273
/
12 Meter Lafayette / Collapsible T,V,
Antenna P01e
Shielded Coaxial ...4.
} - ~ 2,5 Met . . . . I< lOB Meters ~ ~,j 45( 25x40 crn.
...... ~ : ~ Ellipsoid Wind . . . . . .
Sennheiser MKH 105 Omnidirectional / A Condenser Microphone, ~ ]'
Near Microphone ~ MZS 105 Shock Mount, and ~ / MZW-3O Windscreen. Far Microphone
Cable
18 Volt Battery for Amplivox Hailer Model S-610 Amp tier and Loudspeaker
, ',,,,,;:::::::;.:;~;;:::~Mono Sendingj [Tape Recorder I
Z2 Meter Lafayette Collapsible T.V. Antenna Pole
S o u n d Leve! ] [General Radio ] ISony Tektronixl eter Needle ~ 1 9 3 3 Precision ~ 323 ) ime Constant Boxl ISound Level Meterl I Oscilloscope J
I General Radio I Model 1952 Variab e Fi ter
. . , d |
. . . . . . . . . . . . . /Sennheiser MZA 6-2 Battery Pack[ Switclfing Box ~ISennheise r MZA 6-2 Battery Pac~] .........
Nagra rt7-- S Stereo Receiving Tape Recorder
DATA STATrON
Fig. 1. A diagram of the portable system used for tests of sound transmission. It consists of three stations, one for sending, one for receiving, and a data station for sound measurement and recording. All items are commercially available other than the switching and time constant devices, and the t 8 volt battery pack, made at Rockefeller University
Because pure tone intensities varied temporally at the far microphone a time sampling procedure was adopted. Sound pressure levels were read once every 3 s, for a 30 s period, at the far microphone. When each tone stopped, the sound pressure level of background noise at the far microphone was also recorded. If the mean of the 10 readings at the far microphone in dB minus the background noise level was between 10 and 4 dB, a background noise correction term was substracted from the average. If the difference was less than 4 dB, the data were discarded as unreliable (Peterson and Gross 1972, page 179). Attenuation, measured in dB/100 m was calculated as the sound pressure level at the near microphone minus the average sound pressure level at the far microphone.
"Excess" attenuation is that above what would be expected during spherical spreading of the sound from its source according to the inverse square law. As excess attenuation increases, the distance of sound transmission shrinks. Under these experimental conditions the expected attenuation accord-
102.5 m ing to the inverse square law was 20 loglo 2.5 m = 32 dB. Thus excess attenuation (E.A.) was the measured attenuation in dB/100 m - 32.
All stereo recordings of white noise from the near and far microphones were fol lowed by 4 s recordings of background noise at the far microphone. Each channel was calibrated on the tape (Scotch 206) with a 1 kHz tone from a tone calibrator (General Radio 1567). Back in the laboratory a General Radio 1910-A wave analyzer was used to measure intensity versus frequency. The analyzer was first calibrated with the one kHz tone, and then given the output from 33/4 s tape loops of the field data. The analyzer integrated intensity over a 50 Hz bandwidth. For each

274 K. Marten and P. Marler
D e c i d u o u s F o r e s t W i t h o u t L e a v e s
80 l Far microphone:signal 6 0 3 ~ .~ Near microphone:signal \
~ 4O
20 l o , , , , - ~ . . . . ~ . . . . , ~~ - : . : ' - - : ; - ~ , - - - - ~ - - ,
0 I 2 3 4 5 6 7 8 9 I0
Frequency (kHz) Fig. 2. Sample analysis of a white noise t ransmission test f rom the General Radio 1910-A wave analyzer conducted at ground level in leafless deciduous forest site I (cf. Fig. 3 C). The display of intensity (vertical axis) against frequency in kHz shows three analyses: (a) the white noise signal at the near microphone reduced by 32 dB; (b) the white noise signal at the far microphone; (c) the background noise at the far microphone during the four second period following termination of the four second white noise signal. The difference between a and b, stippled in the Figure, shows excess at tenuation (E.A.) in dB/100 m at each frequency. Data were rejected, as indicated by the absence of stippling with frequencies greater than 7300 Hz in this test, if the difference between the far signal and background noise was less than 4 dB. A problem of a different kind limited usability of data for very low frequencies which were not t ransmit ted effectively by our speaker system below about 400 Hz, as seen in the curve for the near microphone signal
tape loop, of white noise or background, the window was swept from 0 to 10 kHz in 8 min, plotting intensity versus frequency. The 50 Hz window served to de-emphasize intensity variations that might result f rom standing waves set up in the field by a particular frequency. Three field data tape loops were thus analyzed from each test site and height. These were white noise from the near microphone, white noise f rom the far microphone, and background from the far micro- phone. Analyses of all three were plotted on one chart as illustrated in Figure 2. By at tenuating the near microphone signal by 32 dB on the record, the data curve for near and far microphones would coincide when E.A. was zero. Thus excess at tenuation could be read directly f rom the chart as the difference between these two curves. Analyses of white noise at the far microphone were compared to the background level, and if the difference was less than 4 dB the data were rejected, as indicated on the right side of Figure 2.
Tests were run at seven locations at the Rockefeller University Field Research Center in Millbrook, New York, and its environs in spring and summer 1973. The sites are described briefly in order of increasing density of the obstruction offered by the vegetation to sound transmission. All are at R .U.F .R.C. unless otherwise specified.
A. Open field sites (two). AI. (July 2) A large hay field with s t and ing dead and growing grasses to 20 cm. AII. (July 6) Another orientation and location in the same field. B. Coniferous forest (one). Hemlock forest (Tsuga canadensis) B1. (July 11) Cary Arboretum. A pure stand of mature hemlock with sparse undergrowth, chiefly young hemlock and black birch (Betula lenta), and an open canopy above 10 m, C. Deciduous forest without leaves (four). CI. (April 25) Mature, sparse sugar maple (Acer saccharum), chestnut oak (Quercus prinus), black oak (Quercus velutina), and many trees of intermediate size. Moderate woody undergrowth. The highest test height used, 10 m, was 2/3 of the way from the ground to the top of the canopy, just invading the crowns of taller trees. CII. (May 3-4) A dense s tand of mature sugar maple with little undergrowth. The canopy beginning above 10 m was almost closed with only intermittent breaks. CIII. (April 29) A mixed forest of large sugar maple, small black o a k and red maple (Acer rubrum) and much undergrowth, with young black birch. The 10 m transmission was through the crowns of many trees. CIV. (May 1) A dense stand of young sugar maple and white ash (Fraxinus americana) with leafy undergrowth. The 10 m t ransmission is across the treetops with many breaks in the canopy. D. Deciduous forest with leaves (two). DI. (August 3) Same site as CI. Leaves in full

Temperate Sound Transmission and Animal Vocalization 275
growth and much undergrowth, mainly young black birch. DII. (July 24) Same site as CII. Trees in full leaf, creating dense shade with some breaks in the canopy but no undergrowth.
For purposes of analysis there were thus nine sites at seven locations, two being used twice under different conditions. In most of the following results measurements in dB from two sites in the same habitat type are averaged. For the "two deciduous forest sites with leaves-and two without leaves" data are averaged over the same two sites (CI/DI + CII/DII) to permit compari- sons between the same site with and without leaves. Level sites were chosen to eliminate topography as a variable, and it should be kept in mind in discussion of the data that irregular topography, typical of many habitats, might give different results (cf. Wiener and Keast, 1959).
Although humidity and time of day were recorded in these experiments they are not treated as variables in the analysis and thus constitute sources of error. Tests were conducted in daylight, avoiding dawn and dusk. Under the conditions prevailing in these tests humidity variations probably cause changes in E.A. of less than 1 db/100 m though in extreme cases they may be much greater (Griffin 1971). Time of day effects probably correlate with humidity to some extent, and will be treated separately.
Results
G r a p h s o f excess a t t enua t ion vs. f requency were ob t a ined for 5 heights at all n ine sites. Only results wi th pure tones are p resen ted here. W h i t e noise tests gave similar , a l t hough less var iab le results. The 45 sets o f da t a po in ts are p resen ted in the A p p e n d i x where the X axis = f r e q u e n c y in k H z and the Y a x i s = E . A , in db/100 m.
F igure 3 presents a sampl ing o f 12 of the 45 graphs ob ta ined , f rom the 4 hab i t a t types studied. Cer ta in t rends are immed ia t e ly evident . Excess a t t enua- t ion was grea ter a t g r o u n d level than at o ther heights tested, m o r e so in open hab i t a t s t han w o o d e d ones. The greates t E.A. t ended to occur wi th the highest f requencies tested. W i t h sound sources well above g round level excess a t t enua- t ion t ended to fall more or less mono ton i ca l l y f rom the highest frequencies tes ted to the lowest ones (e.g. , a t 10 m in Fig. 3 A - D ) . This was t rue o f all habi ta t s .
A t g r o u n d level there is a different re la t ionsh ip be tween E.A. and s o u n d frequency. As descr ibed by M o r t o n (1970, 1975) a zone o f l o w frequencies was f o u n d in all habi ta t s , where E.A. was increased. The effect was to set a lower l imit on wha t M o r t o n calls a ' s o u n d window. ' This is a zone o f fre- quencies where E.A. is m in ima l for a given set of cond i t ions b o u n d e d above a n d be low by m o r e highly a t t enua ted frequencies. The ' w i n d o w ' was de tec tab le at g r o u n d level in all habi ta t s , t hough less s t r ik ing in w o o d e d than open ones. I t t ended to be p i tched at somewha t lower frequencies in forest than in open habi ta t s . W i t h sound sources above g r o u n d level a sl ight ' w i n d o w ' was some- t imes evident at 1 m, bu t higher than this the w i n d o w ceased to be clear ly evident , and there was a m o n o t o n i c increase o f E.A. with increas ing f requency be tween 350 Hz and 11 kHz.
A l t h o u g h the t rends jus t descr ibed can be d iscerned in the graphs of E.A. vs. f requency in the different habi ta t s , the da t a a re var iable , and the detai l is no t a lways easy to in terpret . F o r this reason the results were subjec ted to a th ree -way fac tor ia l analysis o f var iance o f E.A. (Sokal and Rohlf , 1969) for all 9 sites, 5 heights, and 18 o f the 24 frequencies measured . Since the c o m p u t e r p r o g r a m used (Biomed 02V) was cons t r a ined to a m a x i m u m of 9

276 K. Marten and P. Marler
+40 0 0
+30
._~ ~ +20
S + i O
)< w o
- I 0
A. Open Field(I)
Height:Ground level
oo.OO~176176 o~176176 o*~176176176176
~ ~ ~ e~ ~ I~176 ~ 1 7 6 1 7 6 ~ "~176176176176 ~176176176176176176 ~ ,*%o ~176176 ~ �9 ~ % o~ e , j %~ �9 .e
-0 . . . . . . . . . . . . . . . . . . . . . . . . . . . . . . . . . . . . . . . . . . . . . . . . . . . . . . . . . . . . . . . . . . . . . t
I I I I I I I I I I I 2 3 4 5 6 7 8 9 I0
Frequency(kHz)
B. Coniferous Forest
+40
�9 0 + 5 0
Q3
c + 2 0 o s ~ + I0
w _ 10
Height:ground level
,' , , / . - . , / : . . " " ' . . . ...-- ~ ~ ~.~Z::Z..~...~.;/.:.-..i:':'""" "". y'"" ~, t 10m -,:;,,: _-,....;X__ ;::;;; . . . . . . . . . . . . . . . . . . . . . . . . .
: - . . ' . :
I I I I I I I 2 3 4 5 6 7 8 9 110
Frequency(kHz)
C.Deciduous Forest without Leaves ( I )
+40
E 0 0 + 3 0
m
.~ + 20
c ~ + 1 0 D
~
w
- 1 0
Height:groundlevel / - - - - - " ' - ' - - - - - - -
\ ../ S - . , - ' = = - " - - .
_ _ - ~ - ~ . . . . . . . . . . . . . . . . . . . . . . . . . . . . . . . . . . . . . . . . . . . . . . . . . . . . . . . . . . . .
', ~ A ~ & ; -~ ~ ; ,S ,, Frequency (kHz)
Fig. 3 A - C

Temperate Sound Transmission and Animal Vocalization 277
D. Deciduous Forest wi th Leoves ( I )
+ 4 0 0 0
+30
g + 2 0
D + I0
o o x LO 0
Height :Ground level
Iota
l J ~ " * . o "~ I ~ " J ." ,,
.%. ~'.~ ~ _ . / " "
I ! % %
�9 ~ " ,.
. ; : _ _ - : . ~ ,~ - -
i I I I I I I r I I - I0 2 3 4 5 6 7 8 9 10
Frequency (kHz)
Fig. 3 A-D. Graphs of excess attenuation versus frequency for three source heights, ground level, 1 m and 10 m in examples of the four habitat types tested: A Open field (I). B Coniferous forest. C Deciduous forest without leaves (I). D Deciduous forest with leaves (I). These graphs present a sample of the data given in full in the appendix, which in turn provides the basis of the analysis of variance
levels or categories, the analysis was done as a 2-replication experiment. In the first replication the frequency categories f rom 1-9 were 500 Hz, and 1.0, 1.75, 2.5, 3.0, 4.0, 5.0, 7.0 and 9.0 kHz. In the second replication the nine frequency categories were 800 Hz and 1.25, 2.0, 2.75, 3.5, 4~ 6.0, 8.0 and 10.0 kHz. This is equivalent to mean frequencies for the 9 categories of 650 Hz, and 1.12, 1.87, 2.62, 3.25, 4.25, 5.50, 7.50 and 9.50 kHz. Thus data for six frequencies, 350 Hz, 400 Hz, 600 Hz, 1.5 kHz, 2.25 kHz and 11 kHz were not used in the analysis of variance. The results are indicated in Table 1. The focus in this analysis was on estimation of variables controlling sound attenuation. Analysis of variance can be used as a linear model in which additive ' t rea tment effects' of each variable and the interactions between variables modify the E.A. values f rom the grand mean. In the present case, the grand mean E.A. for all sites, heights and frequencies is 14.7 db/100 m. According to the model, E.A. for a given site, height and frequency is 1 4 . 7 + S + H + F + S x F + S x H + H x F + S x H x F + E p s i l o n
S = treatment effect for that site. H = treatment effect for that height. F = treatment effect for that frequency. S x F = treatment effect due to interaction of that site and frequency. S x H = treatment effect due to interaction of that site and height. H x F = the treatment effect due to interaction of that height and frequency. S x H x F = treatment effect due to interaction of that site, height and frequency.
E p s i l o n - a normally distributed variable with m e a n = 0 and var iance= 5.8 dB/ 100 m, the populat ion variance. That is to say, 5.8 dB/t00 m is the mean variance

278 K. Marten and P. Marler
Table t . A N O V A Table for a three way factorial analysis of excess at tenuation measurements for all 9 sites, 5 heights and 18 of the 24 sound frequencies tested (see text). Since the program used was limited to nine categories two replications were run with a different set of 9 frequencies for each (see text)
Source of variation Degrees of Sums of Mean freedom squares squares
1 Site 8 6598.25 824.78116 2 Height 4 22095.38 5523.84576 3 Frequency 8* 34310.69 4288.83638 1/2 Site x Height 32 8827.10 275.84691 1/3 Site x Frequency 64 4613.48 72.08563 2/3 Height x Frequency 32 2466.35 77.07331 1/2/3 Site x Height x Frequency 256 4932.31 19.26683
Within replicates 405 6222.31 15.36373
Total 809 90065.87 -
Grand m e a n = 14.66198 No. of var iables=3 No. of repl ica tes=2*
of the 10 sample E.A. measurements in a 30 second sample of pure tone data. By estimating these 'components ' of a given E.A. measurement and seeing how they behave as the three variables, site, height and frequency are changed, relationships between them are revealed.
Consider the '2 open field sites' graph in Figure 4A as an illustration of how analysis of variance results are used here. The Vertical axis is 'height effect,' whose major component is H. However, since we are interested in site to site variation, H x S is added to incorporate the effects of height-site interaction. Site (S) and frequency (F) treatment effects are excluded to focus on height effects only. Since frequency is unspecified, each value on the vertical axis is averaged over all frequencies. For each height, H + H x S is averaged over Open Field 1 and II to obtain the '2 open field sites' graph representing the open field habitat type. Similarly, for each height, H + H x S is averaged over all 9 sites to obtain the 'all 9 sites combined' graph in Figure 4A, and so on for other habitat types. Vertical axis values are obtained in an analogous manner for Figures 4B, 5 and 6. These vertical axis values do not represent E.A. but are the treatment effects on sound attentuation of the variables specified.
The relative importance of the variables in changing values from the grand mean can be determined from the mean squares (M.S.'s) in the analysis of variance (ANOVA) table (Table 1): Height is the most important variable (M.S.=5,524) closely followed by frequency (M.S.=4,289). Next, with a less important contribution to variation from the grand mean, is site (M.S. =825), followed finally by interactive effects, all with M.S.'s less than 276 ( S x H , S x F , H • and S x H xF) .
Thus for an animal producing sounds of equal intensity in the habitats tested, height and call pitch are more important than habitat in determining how far sound will carry.

Temperate Sound Transmission and Animal Vocalization 279
+2o A
+15
/2 open field sites
B C
I::: +10 o :
l~./All 9 sites combined ,.Coniferous forest site
-.--
~i12 Deciduous forest sites I\~i with leaves with leav I :~'.!
"" " ' " I ~r 7500 Hz-x~ " �9 "% ,,, ~ �9 o _o-" �9
~ / . : : ~ :f Eif2! :i~:]'~' t h e u t ii 0 ' 650Hz \ - - - - - - ' ' - .~ " ..... .......... I / " - freqoenoies
Ol i i i -012 5 I0 0 I OI 2 5 I0 Height (meters )
Fig .4A-C. Graphs of the 'height effect' plotted against source height for several habitat types (left and center) and for different frequencies (right). The 'height effect' is calculated as H + H x S averaged over the sites indicated in A and B, and H + H • F for the frequencies indicated in C. Of the two frequencies illustrated, 650 Hz represents the ground attenuation zone of frequencies, and 7500 Hz represents the zone of monotonically increasing attenuation. The vertical scale is marked in decibels/100 M, with zero equivalent to the grand mean of E.A. of 14.7 dB/100 m, indicating the contributions of different heights to variance in excess attenuation as measured over 100 m
Height of the Sound Source above the Ground
Height of the source and the receiver had the greatest treatment effect in modify- ing E.A. from its grand mean. Although height above ground level is undoubt- edly the major factor, it should be borne in mind that vegetation density also varies with height, differently between habitats, and that these variations are also included in the 'height variable.' Figures 4A and B are graphic displays of these treatment effects (H + H x S) averaged over the sites indicated. It must be re-emphasized that in Figures 4, 5, and 6 the vertical axes do not give values of E.A. Instead they represent so-called "height effect,' 'frequency effect,' and "site effect.' These are the quantities by which the grand mean E.A. is modified by the variables and their interactions as specified in each figure. For example, for all nine sites combined at ground level, attenuation is raised 9 dB/100 m over the grand mean of 14.7 dB/100 m as shown in Figure 4A. This display averages over all frequencies, since sound frequency is not specified in this particular graph.

280
+ 1 =
K. Marten and P. Marler
+ I,
-g o C)
r n + " o
o -
- I I Z o ,r.f D b I " U ~ I 0
Frequency (kHz)
Fig. 5. Graphs of the 'frequency effect' against sound frequency for three site conditions; both deciduous forest sites with leaves; both open field sites; and all 9 sites combined. The so-called frequency 'window' of Morton (B) is indicated by stippling bounded below by the zone where ground attenuation of low frequencies is strong (A) and above by the zone of monotonically increasing attenuation with increasing frequency (C). Vertical scale as in Figure 4
+9
+6
o O
c n
c1) 0
a) b~
-3
o~ground .olOm \ \ , / \ \ J /
/ / \ \ \ / /
\ / z
', ,.16m \
- - \ 7- -o lnf - X
/ \ / \
/ \ ,, \, ~ g r o u n d
\ogrbund / /
/
1o" -6 i I 20pen field 2Deciduous forest 2 Deciduous forest
sites without leaves with leaves
Increasing vegetation density
Fig. 6. Values of 'site effect' against increasing vegetation density at three source heights, ground level, 1 m and 10 m. Three site conditions, open field, leafless deciduous forest, and deciduous forest with leaves, are arranged in order of increasing vegetation density. Vertical scale as in F i g u r e 4

Temperate Sound Transmission and Animal Vocalization 281
Averaged over all nine sites, the 'height effect' is greatest at ground level, decreasing rapidly up to 2 m, and leveling off with higher source heights. The extremes are greatest in the open field sites (Fig. 4A) and least at the deciduous forest sites with leaves. That the greatest overall attenuation at ground level occurred in the open sites suggests that poor sound transmission close to the ground may be due not only to interaction with the ground surface but also to micrometeorological events at the air-ground interface, such as air turbulence and temperature gradients (cf. Mor ton 1975). These events and their effects are maximal in open habitats, and are decreased by the presence of trees. The latter also cause increased attenuation as the source approaches the canopy layer. As can be seen in Figure 4B, this effect was found in deciduous and not in coniferous forest. It was most evident when the deciduous trees were in leaf, although the same trend occurred when they were leafless. It appears that deciduous leaves blocked sound to a moderate degree and coniferous needles not at all at the sites tested.
Effects of Frequency on Sound Transmission
The magnitude of effects of frequency in modifying E.A. from its grand mean is almost as great as that of source height. Figure 5 shows the overall shape and magnitude of frequency treatment effects (F + F x S) for three site conditions, open field, deciduous forest with leaves, and for all nine sites together. Because height is unspecified, each point represents an average over all source heights. The great attenuation of higher frequencies is clearly evident. All sites also show a characteristic dip of around 5 dB/100 m between about 1 and 3 kHz. This frequency range is indicated in Figure 5 by stipling. This is Morton's sound 'window', indicating the frequency range that will transmit furthest. The center frequency of this 'window', where E.A. is minimal, is usually higher at ground level than at 1 m, and varies from site to site. According to our data, with source heights above 1 m, the 'window' effect disappears and E.A. increases monotonically with frequency. The shape of the curves in Figure 5 results from averaging source heights of ground level and 1 m with higher source heights where attenuation increases monotonically with frequency. The characteristic dip of the 'window' would be still more pronounced if the 'fre- quency effect' was plotted for 1 m and ground level only, as seen in Figure 3. This pattern, with a sound 'window' near the ground, and with monotonic increase of E.A. with frequency above 1 m resembles that obtained by Morton (1970, 1975) in Panama and confirmed by Marten, Quine and Marler (1977) at similar sites. This pattern of sound transmission versus frequency for varying source heights seems to be characteristic of many terrestrial habitats, both open and wooded, temperate and tropical.
Figure ~C shows 'height effects' (H + H x F, averaged over all sites) in rela- tion to sotlnd frequency. In addition to values averaged over all frequencies, two frequencies were selected to represent values above and below the frequency 'window', namely 650 Hz and 7500 Hz. It can be seen that, while both fre- quencies were attenuated at low source heights ( < 2 m), attenuation of the

282 K, Marten and P. Marler
low frequency was greater close to the ground. At greater source heights attenua- tion of the lower frequency continued decreasing whereas attenuation of the higher frequency was little affected by height above 2 m.
Sound Attenuation in Different Habitats
Although source height and sound frequency were the most important of the three variables studied, it is clear that the nature of the habitat affects variations of E.A. from the grand mean (cf. Linskens et al., 1976). We did not subject the vegetation to quantitative analysis. However, setting the study of the conif- erous forest site aside, we have arranged the other sites in a series of increasing vegetation density (see the horizontal axis of Fig. 6). The vertical axis represents treatment effects of site (S + S x H, averaged over each pair of sites). Values for three heights are graphed, ground level, 1 m and 10 m. First it will be noted that the range of values on the vertical axis has shrunk by comparison with the treatment effects of height and frequency, reflecting the lesser treatment effect of site (from - 6 to +7 dB/100 m). Figure 6 confirms some of the trends already detected. At 10 m sound carries less well as we pass from open sites, through leafless deciduous forests, to the same forests in leaf. By contrast, sound at ground level is more attenuated in the open sites than in the forest. At 1 m there is an intermediate relationship and sound carries equally well in all three habitat conditions.
The "Active Space' of a Vocal Signal
There are two phenomena causing the attenuation of sound: (1) in spherical spreading there is a quartering of energy(or power) or halving of pressure with each doubling of distance (the inverse square law), which applies in ideal frictionless environments; (2) there is also constant attenuation which, in an ideal homogeneous environment, would be linearly proportional to distance travelled. In real environments, this is labelled excess attenuation (E.A.) and as such, it often has a non-linear relation to distance. E.A. is superimposed on inverse square law attenuation to yield real attenuation. Since inverse square law attenuation is proportional to the square of the distance travelled by sound and E.A. comes closer to having a linear relationship to the distance (but see Aylor, 1971 ; Ingard 1951, 1953, for discussion of this point), inverse square law attenuation dominates at short distances, and E.A. becomes important at longer distances.
To translate estimates of sound attenuation into distances at which others can hear a vocal signal, several additional features must be considered, including source intensity of the sound, the auditory threshold of a listener, and how the listener's ear functions in hearing a sound against a background of masking noise.
In canary song, for example, the loudest frequency is around 2 kHz (Dooling, Mulligan and Miller, 1971). Direct measurements of male canary song revealed

Temperate Sound Transmission and Animal Vocalization 283
intensities of about 85 dB at 20 cm. Similar estimates of the intensity at the strongest frequency of songs of several bird species have been obtained (May- field, 1966). At this frequency a canary's hearing threshold is roughly similar to our own at the best frequency, namely about 0 dB SPL.
The level and spectral characteristics of background noise must also be known. As Waser and Waser (in press) have shown, background noise in tropical rain forest, both physical and biological in origin, is variable and complex, and must surely exert powerful selective influences on the evolution of acoustic communication systems of species living there. Features of background noise will vary from site to site, and with time of day, as well as with meteorological conditions. We did not analyze background noise in our studies, except as was necessary to assure reliability of measurements made at the far microphone.
For conditions in which the level of background noise is sufficient to cause some masking of the species vocalization, the determination of hearing distance is a complex matter requiring knowledge of masking functions and critical ratios for the auditory system in question (e.g., Scharf, 1970). Furthermore, these masking functions may differ considerably between species (Dooling and Saunders, 1975). However, for situations where the energy in a background noise is evenly distributed across frequency (as shown in Fig. 2) and the Sound Pressure Level of this broad band of noise is relatively low (ie 25-30 dB SPL), it is reasonable to assume that no masking is occurring and that the auditory system is operating essentially as in the quiet (Hirsh, 1952). Under these condi- tions, the 2 kHz component of a song would have to exceed the absolute threshold of the canary at 2.0 kHz to be heard (namely about 0 dB). The assumption of no masking is optimistic, and the range estimate derived from it should be viewed as maximal. More information on avian hearing in noise would make more accurate estimations possible.
The determinants of hearing distance will then be the source intensity (I o dB), inverse square attenuation (ISA dB for a given distance), excess attenuation (dB/distance), and the lowest intensity at which a sound can be heard (/hearing dB), which in the present case is the same as the threshold for a 2.0 kHz tone. For a given frequency I o can be measured at a certain distance, d o. If d = communication
d distance in meters, ISA=20 l o g ~ - decibels. When E.A. is known in dB/100 m
u o EA'd its contribution to attenuation can be calculated as ~ dB. If D R O P = sound
attenuation in dB over a travelling distance d, then
d EA-d D R O P = 20 log d~o + ~ decibels. (1)
To estimate the maximum communication distance, let D R O P = I o-/hearlng and solve for d. For each positive DROP and positive E.A. there is a unique d.
Solving this equation for a canary singing from a 10 m perch in deciduous forest in early spring before the leaves have opened, with ambient noise at 35 dB at the same frequency as that emphasized in the song (2 kHz), we get the following results.

284 K. Marten and P. Marler
D R O P - I o --/hearing = 85 dB--0 dB = 85 dB.
1.0+8.7+7.1+ 1.3 EA-- 4 - 4 . 5 d B / 1 0 0 m (as derived from Figure3C and
the Appendix). Thus Equation 1 is
d 4.5d 85 d B = 2 0 1 o g ~ - - ~ 100
Solving this equation we get a value for d of 416 m, estimated as the furthest distance at which another canary could hear the 2 kHz component of the song of a male perched at 10 m under quiet conditions.
Likewise, a spectral analysis could be made yielding intensities of all fre- quencies in a vocalization at a short distance, do, and of ambient background in the field. After checking hearing sensitivity curves to determine if background is limiting, a graph of communication distance vs. frequency could be drawn up frequency by frequency, utilizing the E.A. information in the Appendix.
Discussion
For a biologist attempting to predict how an animal might maximize the trans- mission distance of a vocalization some simple rules emerge. First, and most obviously, the sound should be produced as loudly as the vocal apparatus will permit. Secondly, the vocalizer should give voice from above the ground. Above about 1 m there is little further advantage or loss unless layers of dense foliage are invaded, such as the forest canopy. In closed-canopy forest intermedi- ate heights between ground level and treetops will be best, as Waser and Waser (in press) have indicated. Thirdly, in most situations, the lower the sound fre- quency the better. Exceptions to this rule arise when sounds are produced close to the ground, causing increased attenuation of low frequencies. For maxi- mal transmission near the ground sounds should be pitched just above this attenuated zone (Fig. 5). This optimum frequency will be somewhat lower in forest than in open habitats. Features of background noise both physical and biological will also exert an important influence on predictions of the frequencies that will be best for long-distance communication in any particular case (Waser and Waser, 1977).
Chappuis (1971) working in West Africa and Morton (1970, 1975) in Panama have documented differences in the frequency characteristics of songs of birds living in open country and within the forest. The latter tend to be lower pitched, to span a narrower range of frequencies, and to be more tonal than their open country counterparts. Both authors sought to explain these differences in terms of attenuation data they themselves obtained.
Using audibility to an experimenter as a criterion, presumably at about 2 m above the ground, Chappuis (1971) determined the distance at which sounds of constant intensity but varying frequency became inaudible as the experimenter walked away from the source. The height of the source is not stated. By another method, an observer stood at a constant distance from the source (not given) and the threshold intensity at the source was determined for hearing sounds

Temperate Sound Transmission and Animal Vocalization 285
of different frequencies. Comparing results in open and forested habitats, the results suggested to Chappuis that the main difference in acoustic transmission in the two habitats was greater attenuation of frequencies above about 1600 Hz in the forest. He attributes the lower average pitch he found in songs of forest birds to this effect.
Working with a different avifauna from Chappuis, in Panama, Morton found a very similar difference in the frequency properties of the songs of forest-living and grassland birds, with an intermediate condition in forest edge and canopy- living species. The differences were significant, with a clear tendency for below- canopy forest birds to be more tone-like, and more free of rapid frequency- modulations than their grassland counterparts. Objective tests of attenuation of random noise and pure tones of varying frequency were run, mostly at heights of one and five feet. Attenuation was measured over distances ranging from 75 to 275 feet. Measurements of excess attenuation in 3 habitat types, presented in detail in Morton (1970) and summarized in 1975 were much more precise than those of Chappuis (the latter also complicated by variations in human frequency sensitivity). Among measures of various aspects of sound attenuation, Mor ton concentrated especially on one feature as providing a poten- tial explanation for the low pitch and tonal purity of forest bird songs. This is the 'frequency window' phenomenon which he described in the Panamanian rain forest in very similar form to that which we found in all temperate habitat types. Morton 's tests in grassland habitats failed to reveal such a ' w i n d o w ' . On the basis of this finding he suggests that grassland birds, lacking a preferred intermediate frequency range for long distance transmission, should use low frequency sounds in their songs. However, his descriptive studies revealed that they are broad-band rather than tonal, and rich in rapid frequency modulations, with an emphasis on temporal design features. He attributes these trends instead to the likelihood that conditions in open habitats are more variable because of wind and temperature gradients, tending to distort the frequency composition of sounds.
The results presented here differ from Morton's in some respects. His data on sound transmission, like ours, manifest the clearest frequency 'window' when sound sources are close to the ground. Our exploration of effects of source height on attenuation led us to interpret the sound 'window' as essentially a ground effect (cf. Aylor, 1971; Embleton, Piercy and Olson, 1976; Embleton, Thiessen and Piercy, 1976). With sound sources more than a meter above ground level the window is replaced by a more or less monotonic increase of attenuation with rising frequency (Morton, 1975 ; Fig. 1, p. 22). It is not clear from Morton's (1975) report how many of the forest bird songs documented are delivered at these low elevations. His report distinguishes between lower-level and upper- level forest bird sounds, but this separates those singing in the canopy from those that sing at intermediate levels in the forest. Morton estimates that 35% of the latter, in fact, call within a meter of the forest floor. He notes the possibility of canopy reflection, but we lack information on whether a 'sound window' occurs under those conditions. Thus the question of a relationship between frequency 'windows' and the structure of forest bird songs must be viewed as still open.

286 K. Marten and P. Marler
A more serious p rob lem emerges f rom a compar i son of sound transmission in open and forested habitat . In temperate deciduous forest we obtained results very similar to those o f M o r t o n for P a n a m a n i a n rain forest. In grassland, M o r t o n failed to find a f requency 'w indow ' , even at g round level, and its absence is his basis for interpreting the contras t between grassland and forest bird songs. Our temperate studies revealed frequency 'w indows ' at g round level in open habitats just as striking as those in the forest.
At tempts to reinterpret the contrasts between forest and grassland bird songs demons t ra ted by Chappuis and M o r t o n in the tropics are constra ined by the possibility that our a t tenuat ion measures in temperate habitats are no t generaliz- able to tropical condit ions. This concern led us to conduc t a new series o f field studies in Panama , using the present methods. These were done at sites chosen, under M o r t o n ' s guidance, to be as close as possible to his original test locations (Marten, Quine and Marler, 1977). Results o f these tropical tests indicate tha t it is incorrect to interpret differences in the frequency structure o f vocalizations o f grassland and forest animals on the basis o f sound 'w indows ' presumed to b e present in one habi tat and not in others. However , our data conf i rm habi ta t differences in sound transmission, the nature, extent, and physi- cal basis of w h i c h deserve further investigation.
Acknowledgements. We are indebted to many in this project, especially to E. Morton who helped generously at all stages of research and preparation of the manuscript, to D. Griffin, M. Konishi, S. Rand and N. Smith who loaned equipment and advised on many technical problems, to D. Brillinger and R. Colwell who gave statistical counsel, to M. Baker, R. Dooling, H.C. Gerhardt, S. Green, D. Griffin, C. Kosciusco, R. Larkin, G. Marten, E. Morton, F. Nottebohm, D. Quine and H. Wiley who criticized the manuscript and made many valuable suggestions, and to L. Hobbet who assisted with the figures. We were allowed to use facilities of the Computer Center, University of California, Berkeley. The research was supported by NSF research grant GB 33102.

App
endi
x A
th
ree-
dim
ensi
on
al m
atri
x o
f ex
cess
att
enu
atio
n o
f p
ure
to
nes
in
dB/1
00 m
eter
s ov
er s
ite,
heig
ht,
and
fre
qu
ency
, x
=n
o d
ata
Hab
itat
O
pen
fie
ld
Op
en f
ield
C
on
ifer
ou
s fo
rest
Sit
e O
pen
fie
ld I
O
pen
fie
ld I
I H
emlo
ck f
ore
st
m
Hei
ght
G
lm
2m
5
m
10m
G
lm
2
m
5m
1
0m
G
lm
2
m
5m
1
0m
Fre
qu
enz/
kH
z ~
.
0.3
0
x x
x x
x x
x x
x x
x x
x x
x
0.35
14
.6
13.4
12
.4
0.2
-2.9
15
.8
16.6
16
.3
0.4
3.8
> 1
9.6
12.9
>
11.
7 3.
4 0.
1 0.
40
21.8
18
.9
10.5
1.
8 0.
7 20
.3
24.9
10
.8
-1.7
10
.5
>2
5.6
>
25
.8
16.0
-6
.6
1.6
0.50
25
.3
25.6
13
.4
-0.7
2.
2 28
.0
31.4
10
.7
3.5
-1.2
21
.9
16.2
14
.4
2.1
2.2
0.60
28
.6
22.4
11
.6
0.8
2.3
35.5
27
.7
7.6
-3.4
2.
1 17
.6
22.0
>
21
.5
-2.1
-2
.8
0.80
38
.4
16.2
9.
7 0.
6 4.
6 37
.6
25.6
6.
3 4.
8 1.
6 13
.1
5,3
0.3
14.8
10
.7
1,00
41
,8
26.4
5.
4 3.
1 3.
5 36
.4
19,4
1,
5 -1
.1
-1.8
>
21
.4
10.5
4.
8 3.
9 2.
7 1.
25
35.4
16
.4
5.1
0.6
1.6
36.9
1.
6 3.
1 -1
.5
3.2
16.9
4.
6 3.
6 8.
7 -3
,7
1.50
35
.0
22.8
7.
6 0.
4 4.
9 31
.2
17.6
0.
5 6.
7 0.
2 11
.4
8,9
10.3
-0
.1
-1.1
1.
75
30.4
13
.5
9.0
5.3
3.1
25.7
3.
3 1.
3 0.
4 2.
2 12
.1
17.0
9.
3 2.
4 -2
.9
2.00
26
.1
20.8
4.
4 2.
5 3.
3 27
.2
5.7
1.2
4.1
0.3
20.9
11
.8
�9 7.
1 5.
5 6.
6 2.
25
22.9
19
.1
1.9
2.0
6.1
28.8
6.
2 -1
.4
5.6
2.7
16.6
8.
9 8.
1 3.
9 -0
.9
2.50
22
.1
17.0
2.
8 5.
9 2.
5 27
.1
6.2
-0.2
0.
1 2.
3 22
.2
16.4
6.
9 8.
5 2.
0 2.
75
23.5
17
.4
4.6
2.8
3.7
31.8
9.
5 -0
.9
4.1
4.2
13.0
16
.6
4.4
7.8
5.9
3.00
24
.9
17.9
5.
9 1.
5 3.
8 31
.9
16.1
1.
7 2.
5 2.
3 20
.5
14.8
7.
5 8.
5 2.
5 3.
50
24.4
16
.8
4.0
5.8
5.7
29.1
14
.8
5.3
7.2
5.4
20.5
16
.9
14.6
21
.5
10.8
4.
00
27.3
12
.4
5.2
2.1
2.4
27.0
1,
7 =
0.3
-1.4
0,
5 19
.1
13.8
11
.2
7.0
5.0
4.50
27
.1
19.4
4.
1 4.
5 6.
0 20
,9
9.5
3.2
4.7
4.9
16.1
17
.1
12.7
3.
7 4,
9 5.
00
30.7
21
.4
4.8
8.0
8.4
28.0
15
.5
4.0
5.3
4.1
25.5
14
.4
14.1
10
.6
5.9
6.00
34
,2
21.2
9.
7 9.
9 10
.8
36.0
15
.2
8.9
7.3
7.5
28.1
15
.6
23.8
2
!.9
18
.1
7.00
33
.5
23.0
7.
3 6.
7 9.
0 30
.i
15.7
4.
9 6.
3 5.
7 26
.9
8.1
17.3
9.
9 9.
7 8.
00
36.4
28
.8
21.6
11
.4
11.3
39
.4
26.7
17
.8
11.6
13
.4
35.2
16
.4
26.5
11
.1
13.0
9.
00
32.6
29
.6
9.7
10.8
13
.6
39.6
28
.5
19.6
13
.4
14.1
32
.3
23.3
30
.2
13.6
21
.7
10.0
0 37
.3
32.6
17
.7
13.5
14
.4
>4
4.4
30
.0
10.6
13
.8
13.4
32
.7
25.5
28
.1
16.7
15
.2
11.0
0 33
.0
31.4
19
.2
17.0
17
.8
40.4
28
.6
13.8
16
.9
16.6
33
.3
24.2
26
.2
19.2
20
.5
0 = > g .<
O
--..1
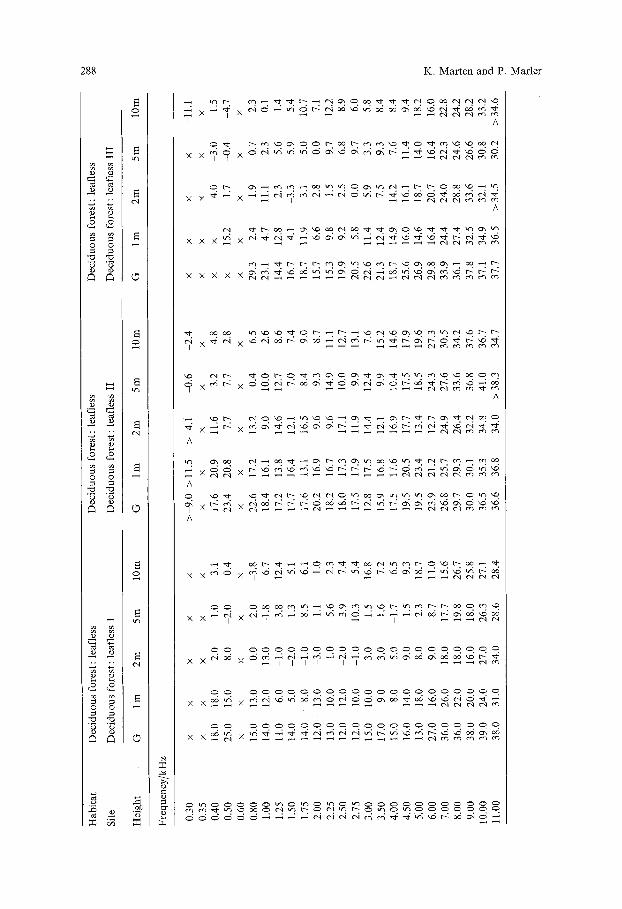
Dec
idu
ou
s fo
rest
: le
afle
ss
Dec
idu
ou
s fo
rest
: le
afle
ss I
Dec
idu
ou
s fo
rest
: le
afle
ss
Dec
idu
ou
s fo
rest
: le
afle
ss I
I
Dec
idu
ou
s fo
rest
: le
afle
ss
Dec
idu
ou
s fo
rest
: le
afle
ss I
II
Hab
itat
Site
Hei
ght
G
lm
2m
5
m
10m
G
lm
2
m
5m
10
m
G
lm
2m
5
m
10m
Fre
qu
ency
/kH
z
0.30
x
x x
x x
>-9
.0
>1
1.5
>
4,
1 ~
.6
2.4
x x
x x
-11.
1 0
.35
x
x x
x x
x x
x x
x x
x x
x x
0.40
18
.0
18.0
2.
0 1.
0 3.
1 1
7.6
20
.9
11.6
3.
2 4.
8 x
x 4.
0 3.
0 1.
5 0.
50
25.0
15
.0
8.0
~.0
0.
4 23
.4
20.8
7.
7 7.
7 2.
8 x
15.2
1.
7 -0
.4
-4.7
0
.60
x
x x
x x
x x
x x
x x
x x
x x
0.80
15
.0
13.0
0.
0 2.
0 -3
.8
22.6
17
.2
13.2
0.
4 6.
5 29
.3
2.4
1.9
0.7
2.3
1.00
14
.0
12.0
13
.0
-1.8
6.
7 18
.4
16.1
9.
0 10
.0
2.6
23.1
4.
7 11
.1
2.3
0.1
1.25
11
.0
6.0
-1.0
3.
8 12
.4
17.2
13
.8
14.6
12
.7
8.6
14.4
12
.8
2.3
5.6
1.4
1.50
14
.0
5.0
-2.0
1.
3 5.
1 17
.7
16.4
12
.1
7.0
7.4
16.7
4.
1 -3
.3
5.9
5.4
1.75
14
.0
8.0
1.0
8.5
6.1
17.6
13
.1
16.5
8.
4 9.
0 18
.7
11.9
3.
1 5.
0 10
.7
2.00
12
.0
13.0
-3
.0
1.1
1.0
20.2
16
.9
9.6
9.3
8.7
15.7
6.
6 ~
.8
0.0
7.1
2.25
13
.0
10.0
-1
.0
5.6
2.3
18.2
16
.7
9.6
14.9
11
.1
15.3
9.
8 1.
5 9.
7 12
.2
2.50
12
.0
12.0
-2
.0
3.9
7.4
18.0
17
.3
17.1
10
.0
12.7
19
.9
9.2
2.5
6.8
8.9
2.75
12
.0
10.0
-1
.0
10.3
5.
4 17
.5
17.9
11
.9
9.9
13.1
20
.5
5.8
0.0
9.7
6.0
3.00
15
.0
t0.0
3.
0 1.
5 16
.8
12.8
17
.5
14.4
12
.4
7.6
22.6
11
.4
5.9
3.3
5.8
3.50
17
.0
9.0
3.0
1.6
7.2
15.9
16
.8
12.l
9.
9 15
.2
21.3
12
.4
7.5
9.3
8.4
4.00
15
.0
8.0
5.0
-1.7
6.
5 17
.5
17.6
16
.9
10.4
14
.6
18.7
14
.9
14.2
7.
6 8.
4 4.
50
16.0
14
.0
9.0
1.5
9.3
19
.5
20.5
17
.7
17.5
17
.9
25.6
16
.0
16.1
11
.4
9.4
5.00
13
.0
18.0
8.
0 2.
3 18
.7
19.5
23
.4
13.4
18
.5
19.6
26
.9
14.6
18
.7
14.0
18
.2
6.00
27
.0
16.0
9.
0 8.
7 11
.0
23.9
21
.2
12.7
24
.3
27.3
29
.8
16.4
20
.7
16.4
16
.0
7.00
36
.0
26.0
18
.0
17.7
15
.6
26.8
25
.7
24.9
27
.6
30.5
33
.9
24.4
24
.0
22.3
22
.8
8.00
36
.0
22.0
18
.0
19.8
26
.7
29.7
29
.3
26.4
33
.6
34.2
36
.1
27.4
28
.8
24.6
24
.2
9.00
38
.0
20.0
16
.0
18.0
25
.8
30.0
3
0.1
32
.2
36.8
37
.6
37.8
32
.5
33.6
26
.6
28.2
10
.00
39,0
24
.0
27.0
26
.3
27.1
36
.5
35,3
34
.8
41.0
36
.7
37.1
34
,9
32.1
30
.8
33.2
11
.00
38.0
31
.0
34.0
28
.6
28.4
36
.6
36.8
34
.0
>3
8.3
34
.7
37.7
36
.5
>3
4.5
30
.2
>3
4.6
b~

Hab
itat
D
ecid
uo
us
fore
st:
leaf
less
D
ecid
uo
us
fore
st :
w/l
eave
s D
ecid
uo
us
fore
st:
w/l
eave
s
Site
D
ecid
uo
us
fore
st:
leaf
less
IV
D
ecid
uo
us
fore
st:
w/l
eave
s I
Dec
idu
ou
s fo
rest
: w
/lea
ves
II
Hei
gh
t G
lm
2
m
5m
10
m
G
lm
2m
5
m
10
m
G
lm
2m
5
m
10
m
Fre
qu
ency
/kH
z
0.30
>
20
.5
15.4
>
6.
9 10
.2
1.3
x x
x x
x x
x x
x x
0.35
x
x x
x x
20.2
14
.7
6.2
-2.8
1.
5 27
.5
21.5
16
.7
-5.7
4.
5 0.
40
13.3
17
.0
-4.2
8.
8 4.
9 23
.5
23.6
14
.9
-1.8
4.
3 25
.3
27.4
5.
2 20
.4
4.1
0.50
18
.5
13.0
-3
.1
-3.7
-0
.6
20.0
22
.8
15.8
2.
3 9.
8 22
.1
24.2
19
.5
6.0
-0.5
0.
60
x x
x x
x 25
.9
11.0
11
.3
1.6
-1.9
29
.4
18.3
8.
3 5.
9 0.
8 0.
80
19.4
0.
1 -2
.0
3.8
0.3
15.2
17
.0
4.7
5.8
1.0
21.9
25
.4
21.0
13
.4
6.6
1.00
18
.0
7.5
6.0
-5.7
-1
.1
12.9
13
.5
3.9
-1.4
-1
,3
17.8
11
.2
15.5
7.
6 7.
6 1.
25
18.3
-4
.9
6.4
1.2
1.5
27.6
8.
0 -1
.7
11.0
12
.5
26.0
25
.7
11.0
11
.0
4.7
1.50
10
.7
9.7
8.4
0.2
3.4
12.4
11
.1
7.3
-2.0
9.
9 20
.9
15.0
8.
0 12
.1
6.8
1.75
8.
4 4.
8 10
.4
0.1
2.0
10.2
10
.8
0.0
7.4
8,3
24.5
12
.1
7.1
11.8
13
.6
2.00
7.
2 4.
9 8.
9 0.
6 1.
3 19
.2
4.4
1.7
-0.1
14
.5
12.5
11
.7
14.0
8.
2 9.
3 2.
25
8.0
2.9
5.7
-0.1
3,
0 4.
5 3.
7 1.
6 1.
3 13
.8
6.2
19.8
14
.2
12.3
14
.5
2.50
12
.0
2,9
6.5
3.1
2.6
16.3
8.
8 0,
8 0.
1 6.
6 19
.7
22,8
8.
7 13
.4
20.0
2.
75
6.0
2.4
5.9
5.7
2.5
19.2
7.
1 2.
6 3.
9 x
15
.1
21.5
13
.7
22.1
9,
9 3.
00
11.8
4.
1 7.
7 -1
.3
3.0
12.2
10
.7
3.6
9.7
21,0
20
.7
21.3
15
.2
12.4
17
.6
3.50
14
.0
9.3
9.2
3.8
4.5
15.8
15
.2
16.7
11
.1
15.7
17
.3
10.1
9.
7 14
.3
22.0
4.
00
13.8
9.
7 11
.8
6.5
6.5
19.4
11
.3
6.2
6.3
15.8
14
.0
18.8
14
.9
17.8
25
,8
4.50
18
.4
11.7
11
.5
5.9
6.4
23.3
15
.7
19.2
8.
5 18
.1
19.7
21
.5
15.4
18
.2
18.5
5.
00
21.4
16
.6
12.3
10
.3
10.9
16
.2
13.1
15
.0
5.7
24,3
23
.7
21.7
17
.5
15.0
32
.8
6.00
25
.1
16.9
19
.4
14.5
11
.2
30.9
22
.9
15.2
12
.6
27.2
29
,1
20.7
19
.2
21.4
36
.6
7.00
28
.8
24.7
23
.3
19.7
17
.8
25.5
17
.6
16.8
12
.8
24.5
33
.4
30.0
23
.9
30.0
33
.7
8.00
31
.3
27.4
26
.2
23.2
21
.5
31.1
19
.8
17.3
15
.0
16,9
36
.7
35.3
3t
.6
34.4
36
.2
9.00
33
.7
28.3
30
.1
23.6
26
.8
27.1
26
.8
15.0
15
.0
28,4
3
6.1
32
.6
29.0
34
.6
34.9
10
.00
35.5
35
.4
37.6
31
.0
31.2
33
.3
25.2
23
.2
24.6
32
.6
40.9
32
.8
39.9
36
.5
37.7
11
.00
36.4
37
.7
38.5
33
.3
34.3
33
.8
33.3
22
.7
21.7
33
,7
40.7
36
.8
30.2
35
.7
34.3
�9 ,_
] ? g~
p~
r~
O ,<
g o

290 K. Marten and P. Marler
References
Aylor, D.: Noise reduction by vegetation and ground. J. acoust. Soc. Amer. 51, 197-205 (1971) Chappuis, C. : Un exemple de l'influence du milieu sur les +missions vocales des oiseaux : l'6volution
des chants en for~t 6quatoriale. Terre et Vie 25, 183-202 (1971) Dooling, R.J., Mulligan, J.A., Miller, J.D. : Auditory sensitivity and song spectrum in the common
canary (Serinus canarius). J. acoust. Soc. Amer. 50, 700-709 (1971) Dooling, R.J., Saunders, J.C.: Auditory intensity discrimination in the parakeet (Melopsittacus
undulatus). J. acoust. Soc. Amer. 48, 1308-1310 (1975) Embleton, T.F.W. : Sound propagation in homogeneous deciduous and evergreen woods. J. acoust.
Soc. Amer. 35, 1119-1125 (1963) Embleton, T.F.W., Piercy, J.E., Olson, N.: Outdoor sound propagation over ground of finite
impedance. J. acoust. Soc. Amer. 59, 267-277 (1976) Embleton, T.F.W., Thiessen, G.J., Piercy, J.E.: Propagation in an inversion and reflections at
the ground. J. acoust. Soc. Amer. 59, 278-282 (1976) Griffin, D.R. : The importance of atmospheric attenuation for the echolocation of bats (Chiroptera).
Anim. Behav. 19, 55-61 (1971) Hirsh, I.J. : The measurement of hearing. New York: McGraw Hill 1952 Ingard, U. : On the reflection of a spherical sound wave from an infinite plane. J. acoust. Soc.
Amer. 23, 329-335 (1951) Ingard, U. : A review of the influence of meteorological conditions on sound propagation. J.
acoust. Soc. Amer. 25, 405-411 (1953) Linskens, H.F., Martens, M.M.J., Hendriksen, H.J.G.M., Roestenberg-Sinnige, A.M., Brouwers,
W.A.J.M., Staak, A.L.H.C. van der, Strik-Jansen, A.M.J. : The acoustic climate of plant commu- nities. Oecologia (Bed.) 23, 165-177 (1976)
Marten, K., Quine, D., Marler, P. : Sound transmission and its significance for animal vocalization. II. Tropical forest habitats. Behav. Ecol. Sociobiol. 2, 291-302 (1977)
Mayfield, H. : Hearing loss and birdsong. Living Bird, 167-175 (1966) Morton, E.S. : Ecological sources of selection on avian sounds. Ph.D. diss. Yale University (1970) Morton, E.S.: Ecological sources of selection on avian sounds. Amer. Natur. 108, 17-34 (1975) Peterson, A.P.G., Gross, E.E., Jr.: Handbook of noise measurement. Concord, Mass.: General
Radio Co. 1972 Scharf, B.: Critical bands. In: Foundations of modern auditory theory, Vol. 1 (ed. J.V. Tobias),
pp. 159-202. New York: Academic Press 1970 Sokal, R.F., Rohlf. F.J. : Biometry : The principles and practice of statistics in biological research.
San Francisco: W.H. Freeman 1969 Waser, P.M., Waser, M.S. : Experimental studies of primate vocalization: specializations for long
distance propagation. Z. Tierpsychol. 43, 239-263 (1977) Wiener, F.M., Keast, D.N.: Experimental study of propagation of sound over ground. J. acoust.
Soc. Amer. 31, 724-733 (1959)
Top Related
Copyright © 2022 FDOKUMEN

