

Bahasa
Halaman
Hukum

This article appeared in a journal published by Elsevier. The attachedcopy is furnished to the author for internal non-commercial researchand education use, including for instruction at the authors institution
and sharing with colleagues.
Other uses, including reproduction and distribution, or selling orlicensing copies, or posting to personal, institutional or third party
websites are prohibited.
In most cases authors are permitted to post their version of thearticle (e.g. in Word or Tex form) to their personal website orinstitutional repository. Authors requiring further information
regarding Elsevier’s archiving and manuscript policies areencouraged to visit:
http://www.elsevier.com/copyright
Author's personal copy
Social rank and adult male nutritional status: Evidence of the socialgradient in health from a foraging-farming societyq
Victoria Reyes-Garcıa a,b,*, Thomas W. McDade c, Jose Luis Molina d, William R. Leonard c,Susan N. Tanner e, Tomas Huanca f, Ricardo Godoy g
a Institucio Catalana de Recerca i Estudis Avançats (ICREA)b Universitat Autonoma de Barcelona, Institut de Ciencia i Tecnologia Ambientals, Facultat de Ciencies, Bellaterra 08193, Spainc Department of Anthropology, Northwestern University, Evanston, Ill 60208, USAd Department of Social and Cultural Anthropology, Universitat Autonoma de Barcelona, 08193 Bellaterra, Barcelona, Spaine Department of Anthropology, University of Georgia, Athens, GA 30602, USAf CBIDSI-Centro Boliviano de Investigacion y de Desarrollo Socio Integral, Correo Central, San Borja, Beni, Boliviag Heller School for Social Policy and Management, Brandeis University, Waltham, MA 02454-9110, USA
a r t i c l e i n f o
Article history:Available online 20 October 2008
Keywords:BoliviaTsimane’ AmerindiansSocial gradientSocial rankBMINutrition
a b s t r a c t
Research with humans and non-human primate species has found an association betweensocial rank and individual health. Among humans, a robust literature in industrial societieshas shown that each step down the rank hierarchy is associated with increased morbidityand mortality. Here, we present supportive evidence for the social gradient in healthdrawing on data from 289 men (18þ years of age) from a society of foragers-farmers in theBolivian Amazon (Tsimane’). We use a measure of social rank that captures the locallyperceived position of a man in the hierarchy of important people in a village. In multi-variate regression analysis we found a positive and statistically significant associationbetween social rank and three standard indicators of nutritional status: body mass index(BMI), mid-arm circumference, and the sum of four skinfolds. Results persisted aftercontrolling for material and psychosocial pathways that have been shown to mediate theassociation between individual socioeconomic status and health in industrial societies.Future research should explore locally-relevant psychosocial factors that may mediate theassociation between social status and health in non-industrial societies.
� 2008 Elsevier Ltd. All rights reserved.
Introduction
Research with humans and non-human primate specieshas found an association between social rank, or position indominance hierarchies, and individual health (Marmot,2006; Sapolsky, 2004). When examining the associationbetween dominance hierarchy and individual healthamong humans, researchers have argued that socioeco-nomic status proxies for social rank (Sapolsky, 2004). Alarge and growing literature in industrial societies suggeststhat each step down the socioeconomic ladder is associatedwith increased morbidity and mortality (Adler, Boyce,Chesney, Folkman, & Syme, 1993; Marmot, 2004; Marmot,Ryff, Bumpass, Shipley, & Marks, 1997; Wilkinson, 2000).
q Research was funded by grants from the Cultural Anthropology andPhysical Anthropology Programs, National Science Foundation(BCS-0134225, BCS-0200767, BCS-0322380). We thank M. Aguilar, J. Cari,S. Cari, E. Conde, D. Pache, J. Pache, P. Pache, M. Roca, and E. Tayo for helpin collecting data and logistical support. Thanks also go to the Tsimane’and the Gran Consejo Tsimane’ for their continuous support, to ICRI-SAT-Patancheru for providing office facilities to Reyes-Garcıa, and toDominica Lizarazu and Jeff Schmit for fruitful discussions on the topic.
* Corresponding author. Universitat Autonoma de Barcelona, Institut deCiencia i Tecnologia Ambientals, Facultat de Ciencies, Bellaterra 08193,Q1 Spain. Tel.: þ34 93 581 4218; fax: þ34 93 581 3331.
E-mail address: [email protected] (V. Reyes-Garcıa).
Contents lists available at ScienceDirect
Social Science & Medicine
journal homepage: www.elsevier .com/locate/socscimed
0277-9536/$ – see front matter � 2008 Elsevier Ltd. All rights reserved.doi:10.1016/j.socscimed.2008.09.029
Social Science & Medicine 67 (2008) 2107–2115
Author's personal copy
Researchers have found evidence for social gradients inhealth in many industrialized societies that are indepen-dent of a wide range of confounders and risk factors (Wil-kinson, 2000).
Research on the social gradient in health suggests thatsocioeconomic status is a strong predictor of health. Bothmaterial and psychosocial causes contribute to healthdifferences between people. Differences in individualresources (e.g., income, access to health care) explain aboutone third of the variation in health outcomes in industrialnations (Wilkinson, 2000). Social epidemiologists haveproposed that psychosocial factors related to stress alsomediate the relation between socioeconomic status andhealth. For example, research in industrial nations suggeststhat job attributes might contribute to stress and poorhealth because different jobs have different physical andpsychological demands, risks, and rewards (Bosma, 1998;Sorenson et al., 1985). In addition, the strongest socioeco-nomic status gradients occur for diseases with the greatestsensitivity to stress (Wilkinson, 2000).
Researchers have also shown that the decline of socialcapital associated with the rise of income inequality mightcontribute to the relation between socioeconomic statusand health (Kawachi, 2002; Kawachi & Kennedy, 1999).Social capital refers to the trust, safety nets, membership inlocal organizations, and other expressions of pro-socialbehavior that enable people to act collectively (Coleman,1990; Kawachi, 2002; Ostrom, 2000). Men with highersocioeconomic status have a wider and thicker socialnetwork than men with lower socioeconomic status; thenetwork allows them to gain access to resources andinformation that might protect health (Mare, 1990; Moore& Hayward, 1990). For example, Marmot and Smith (1991)found that men of lower socioeconomic status were lesslikely to have a confidant in whom they could rely in timesof need. Research suggests that social capital may also playan important role in small-scale societies, where gift giving,communal work, and labor contributed to other house-holds represent pro-social expressions of generosity(Godoy et al., 2005a). Anthropological evidence from small-scale societies suggests that people with higher socioeco-nomic status might be more likely to receive help and giftsthan people with lower socioeconomic status (Henrich &Gil-White, 2001).
Prior research on the association between social rankand individual health comes from industrial societies andhas used economic (i.e., income, occupation) rather thansocial measures to assess social status (Deaton, 2003;Kawachi, 2002; Marmot, 2004, 2005; Subramanian &Kawachi, 2004; Wilkinson, 1996). Due to the paucity ofdata, little is known about how socioeconomic status mightaffect individual health in small-scale, rural societies.
The use of data from a small-scale society to study thesocial gradient in health allows one to circumvent relationsthat become harder to identify once societies grow incomplexity. For instance, in small-scale societies peopleenjoy high levels of job autonomy and social capital(Johnson, 2003; Kaplan & Hill, 1985). Such societies haverelatively little division of labor beyond the sexual divisionof labor. As a result, one can largely ignore the confoundingrole of occupations and stressful events associated with
occupations and focus on how social status itself mightshape health.
Here, we contribute to the literature on the socialgradient in health by exploring whether results fromindustrial societies hold up in a very different socioeco-nomic setting. Using cross-sectional data from the Tsimane’,a foraging-farming society of indigenous Amazonians inBolivia, we estimate the association between socioeco-nomic status and individual-level anthropometric indicesof short-run nutritional status among adult men. We use alocally-relevant measure of social rank that stresses indi-vidual position in the social hierarchy. We examinethe association between social rank and anthropometricindices of nutritional status controlling for three paths –individual resources, job autonomy, and social capital – thatprior research suggests may mediate the relation betweensocioeconomic status and individual health.
We hypothesize a positive association betweenanthropometric indices of short-run nutritional status andindividual social rank. Research in industrial populationshas found that higher levels of overweight and obesity aregenerally associated with low socioeconomic status,whereas in developing nations obesity and socioeconomicstatus are positively associated (McLaren, 2007; Sobal &Stunkard, 1989). Previous research among the Tsimane’suggests that the nutritional status of adults is low relativeto reference values from industrial nations (Godoy, Reyes-Garcıa, Byron, Leonard, & Vadez, 2005b), and in this contextof marginal nutrition higher levels of body mass index(BMI) indicate better health. We therefore expect to finda positive association between social rank and indices ofshort-run nutritional status: If higher social rank is asso-ciated with higher BMI, but without reaching levels asso-ciated with overweight and obesity, one could argue thatsocial rank is associated with higher levels of caloric andnutrient reserves, an important safety net that these indi-viduals can draw on during times of nutritional adversity.
Social hierarchies, job autonomy, and social capitalamong Tsimane’
One of the largest native Amazonian groups in Bolivia,the Tsimane’ number w8000 people (Censo Indıgena, 2001),live in w100 villages mostly in the department of Beni, andhave been in continuous contact with Westerners since the1950s (Daillant, 2003; Huanca, 2008). Tsimane’ in oursample reside in villages of w20 households settled alongriverbanks and logging roads. Villages consist of a loosenumber of households related by blood and marriage. Tsi-mane’ rely on slash-and-burn farming supplemented byhunting, gathering, and wage labor in logging camps, cattleranches, and in the homestead of colonist farmers. Theirchief sources of cash come from the sale of thatch palm fromthe forest and cultivated rice from their farms.
Tsimane’ nutritional status is comparable to otherlowland South American indigenous peoples (Dufour, 1994;Orr, Dufour, & Patton, 2001). Prior research suggests thatamong the Tsimane’ neither village income inequality norindividual income correlate systematically with nutritionalstatus, although individual variables (e.g., schooling)correlate with improved nutritional status (Godoy et al.,
V. Reyes-Garcıa et al. / Social Science & Medicine 67 (2008) 2107–21152108
Author's personal copy
2005a, 2005c; Reyes-Garcıa et al., 2008a, 2008b). Villagesocial capital and village income complement each otherand are associated with higher BMI: the rich who are stingyhave lower BMI than the rich who display generosity(Brabec, Godoy, Reyes-Garcıa, & Leonard, 2007).
Social hierarchies
Living for centuries at the doorsteps of a highly stratifiedempire, the Inkas, the Tsimane’ nonetheless managed toremain highly autarkic and egalitarian until recently (Ellis,1996). The only evidence of past formal, structured socialhierarchy is the presence of shamans – healer, priest, andpolitical leaders – called cocojsi’ in the Tsimane’ language(Huanca, 2008). Tsimane’ respected the cocojsi’ for theirpower to cure and communicate with humans, plants, andanimal spirits (Daillant, 2003; Huanca, 2008). However, thepower of the cocojsi’ declined with the arrival of traders andmissionaries in the 1950s. The last cocojsi’ died during the1980s.
At present, there are two sources of social status amongthe Tsimane’. First, informal social evaluations create socialhierarchies. For example, Tsimane’ show deference topeople with specific skills and qualities. Tsimane’ respectold, knowledgeable people (baba) whom they ask foradvice on multiple issues. Tsimane’ also show deference tosome young people (e.g., Protestant preachers) or to goodhunters. Second, new leaders have emerged as Tsimane’gain greater exposure to the outside world. During the1980s, the Tsimane’ started to organize politically. To electmembers for the umbrella Tsimane’ government, the GreatTsimane’ Council, each village elects a representative (cor-regidor) who mediates the relations between the villageand the outside world. Tsimane’ usually elect as villagerepresentatives schooled men who can speak Spanish,Bolivia’s national language.
Job autonomy
Like other native Amazonian societies (Johnson, 2003;),Tsimane’ individuals and households have traditionallyenjoyed high levels of autonomy in production andhousehold activities. Until the late 1940s, the Tsimane’ livedlike any other pre-contact Amazonian society. They hunted,fished, gathered wild plants, and practiced slash-and-burnagriculture with stone and wood tools. To this day, theyremain highly autonomous, freely allocating their time tovarious activities throughout the day.
With the arrival of highland colonists to the area in theearly 1970s, some Tsimane’ gave up some of their jobautonomy in exchange for jobs that provided a monetarywage. At present, some Tsimane’ seek employment in cattleranches, logging camps, and in the farms of colonist farmers.Tsimane’ also work as village teachers for the government oras professionals for various organizations active in theTsimane’ territory. Work for loggers, cattle ranchers,and colonists partially restricts the autonomy of Tsimane’,but the jobs are temporary, both because the jobs them-selves come and go in response to market prices for logs,and because Tsimane’ often take up the jobs temporarily,and do so chiefly during lulls in the agricultural season.
Social capital
As is true of other native Amazonian societies (Kaplan &Hill, 1985, Winterhalder, 1997), social capital is strongamong Tsimane’ (Brabec et al., 2007; Reyes-Garcıa, Godoy,Vadez, Huanca, & Leonard, 2006). For example, Tsimane’routinely share drinks and food with other Tsimane’ andoutsiders. In a previous study it was found that only 7% ofhouseholds reported not making any gifts to other house-holds, and only 39% of households did not do anycommunal work or offer any labor help during the weekbefore the day of the interview (Godoy et al., 2005a).However, social capital does not seem to get activated tohelp people cope with large-scale, covariant shocks (Godoyet al., 2007).
In sum, the Tsimane’ represent an ideal case to study therelation between social status and health for three reasons.First, social hierarchies are not new in Tsimane’ society, butthey are growing in importance as Tsimane’ increase theirparticipation in the national society. Second, Tsimane’enjoy high levels of autonomy in production and householdactivities and widespread sharing and reciprocity, so onecan test whether the social gradient holds up aftercontrolling for those explanatory paths. Third, Tsimane’share characteristics in common with other small-scaleindigenous groups, which suggests that results from thisresearch might apply to other non-industrial, indigenouspopulations around the world.
Estimation strategy
Our main aim is to estimate the association betweensocial rank and anthropometric indices of short-runnutritional status among adult men while controlling forthree paths that may explain the social gradient in health:individual resources, job autonomy, and social capital. Forthe empirical analysis, we assess the association between(a) three outcome variables: adult body mass index (weightin kg/height in m2), mid-arm circumference, and sum offour skinfolds (biceps, triceps, subscapular, and supra-iliac)and (b) individual social rank while controlling for thethree paths just noted. In subsequent analysis, we test therobustness of our findings by including (i) self-reportedpoor health, a standard covariate of BMI, (ii) smiles, anindicator of level of stress, and (iii) alcohol consumption,a risk factor for health. We use the following expression tomodel the association between anthropometric indices ofnutritional status (Y) and covariates:
logYihv ¼ aþglogSihvþ lPihvþJIihvþ zHhvþ hCv þ 3ihv (1)
Assume, first, that Y captures the BMI of an adult –transformed to logarithms – where i is the subject, h thehousehold, and v the village. We use BMI for ease ofexposition, but the expression also applies to the otherindicators of nutritional status. log Sihv refers to the loga-rithm of the social rank of the subject, defined as theposition of an individual within the social hierarchy in thevillage. Pihv is a vector of variables for the three paths thatresearchers have proposed to explain the social gradient inhealth in industrial nations (i.e., income, occupation, and
V. Reyes-Garcıa et al. / Social Science & Medicine 67 (2008) 2107–2115 2109

Author's personal copy
social capital). Iihv is a vector of variables for the subject(e.g., age and schooling) that directly affects nutritionalstatus. Hhv stands for household size. Cv stands for a set ofvillage indicator variables to control for factors that coulddirectly affect nutritional status and social rank (e.g.,proximity to market towns). 3ihv is a random error termwith standard properties. If the coefficient of the variablefor social rank (g) bears a positive association with indicesof nutritional status it will support the hypothesis thatsocioeconomic status might influence health through otherpathways beyond the ones examined here.
Potential biases and limitations of the study
Potential biases in our estimations relate to (1)measurement errors of dependent and explanatory vari-ables, (2) omitted variables, and (3) possible reversecausality. First, we find random measurement error inheight (Godoy et al., 2006a). Random measurement error inthe outcome variable would inflate the standard error.Since we find measurement error in height, we cannotdiscard the possibility that other outcome and explanatoryvariables might also be affected by random or systematicmeasurement error. For example, assume that in the studycontext power and prestige are different. Informants mighthave systematically named powerful (but not prestigious)people in the village, thus systematically increasing thenumber of nominations of powerful people. Unfortunately,we do not have information to detect measurement bias inthe variables used in the analysis.
Second, our estimations might be biased by the role ofomitted variables. For example, people with higher socialrank might have more access to outside resources (e.g.hospitals), which might improve their health or nutri-tional status. Failure to control for access to outsideresources might bias our estimation. It is also possible thatthe covariates we use are inadequate to measure theassociation between social status and health. For example,it is possible that social capital has a non-linear relationwith health, and by not including a quadratic term forsocial capital we might accidentally attribute some of theeffects of social capital to the social status measure,assuming they are positively associated. We include someof those confounders (i.e., self-reported health, mother’sheight, age squared), but we cannot rule out the possi-bility the existence of other omitted variables (i.e.,kinship).
Third, we do not have convincing instrumental variablesto control for the potential endogeneity of social rank. It ispossible that social rank contributes to improve nutritionalstatus, but the causality could also run in the other direc-tion. Therefore, we cannot speak about causality and limitour discussion to the association between the variablesexplored.
Two main limitations in our measurements make itdifficult to compare our results with previous research onthe social gradient of health. First, we focus on indices ofshort-run nutritional status rather than on mortality ormorbidity. Second, we use measures of psychosocial factorsadapted from research in industrial nations, but thosemeasures might be less relevant in small-scale societies.
The first limitation of our study is that we use anthro-pometric indices of nutritional status as a proxy for healthwhereas most of the previous literature on the socialgradient of health has used mortality or morbidity asoutcomes (Adler et al., 1993; Marmot, 2004; Marmot et al.,1997; Wilkinson, 2000). Differences in the outcomesmeasured make it difficult to compare the results of ourstudy with results from previous research. Furthermore, atleast one of our indices of short-run nutritional status, BMI,is not a good universal measure of under-nutrition andobesity (Garn, Leonard, & Hawthorne, 1986; Norgan, 1994).Previous research among indigenous peoples throughoutthe world suggests that the relationship between BMI andpercent body fat varies according to differences in bodyproportions (Charbonneau-Roberts, Saudny-Unterberger,Kuhnlein, & Egeland, 2005, Godoy et al., 2005b, Norgan,1994; Rode & Shephard, 1994; Shephard & Rode, 1996). Forexample, in a study among the Inuit population of Canada(Charbonneau-Roberts et al., 2005) Inuits were found tohave shorter legs than non-Caucasian people, which resultsin an overestimation of percent of body fat when calcu-lating BMI. Similarly, Shephard and Rode (1996) haveshown that among the traditionally-living Ingloolik Inuit ofthe Northwest Territories, percent body fat levels are quitelow, despite having BMIs of 24 kg/m2 and above. Incontrast, indigenous populations with more linear builds(e.g., Australian aboriginal and South Asian populations)appear to have relatively higher body fat levels than sug-gested by their BMIs (Deurenberg-Yap & Deurenberg, 2003;Norgan, 1994). Our own data suggest that BMI probablyoverestimates Tsimane’ percent of fatness and risk ofobesity (that is, they are actually leaner than their BMIwould suggest). For example, the mean BMI of Tsimane’men falls at about the 25th percentile relative to the USreference values (Frisancho, 1990), whereas their sum offour skinfolds (a direct measure of fatness) approximatesthe 15th. At the same BMI, Tsimane’, on average, have lessbody fat than their peers in the US. Because of the limita-tions of BMI, the results of this measure should be readwith caution.
The second important limitation of our study relates tothe measures chosen to proxy the psychosocial factors thatmight mediate the relation between social status andhealth. We use measures of psychosocial factors adaptedfrom research in industrial nations, i.e., job autonomy andsocial capital. Both measures might not be relevant insmall-scale societies. The measure of job autonomy isproblematic because it might clump together people withreal autonomy to decide how to allocate their time andpeople who want – but are unable – to obtain paid jobs.People unable to enter the wage system might feelmarginalized, and feelings of exclusion might offset thepredictable positive effect of job autonomy on health. Socialcapital might also be problematic. Social capital is strongamong the Tsimane’ and might not show enough variationacross individuals. Low variation in social capital limits theability of the measure to capture the lack of social inte-gration that is believed to be a risk factor for health inindustrialized nations. Lack of adequacy of our measures ofpsychosocial factors does not allow us to fully control forthis pathway.
V. Reyes-Garcıa et al. / Social Science & Medicine 67 (2008) 2107–21152110
Author's personal copy
Materials and methods
Data for this analysis come from a panel study inprogress among the Tsimane’ (2002–present). Experiencedinterviewers and translators conducted the 2005 survey.Previous publications describe methods used to collect dataon anthropometric measures (Godoy et al., 2005a), income(Godoy et al., 2005c), and social capital (Reyes-Garcıa et al.,2006). Those methods are covered briefly, and we explainin more detail methods used to collect information onsocial rank.
Sample
We collected data through a survey that took placeduring June–September 2005 among nearly all households(n¼ 252) in 13 Tsimane’ villages straddling the Maniquiriver. The villages surveyed differed in their proximity tothe market town of San Borja (pop w19,000)(mean¼ 25.96 km; SD¼ 16.70). We selected villages atvarying distances from market towns because previousresearch suggests that village-to-town distance mightaffect the nutritional status (Foller, 1995; Leonard &Thomas, 1988) and notions of social status (Reyes-Garcıaet al., 2008a) of indigenous populations.
We asked every person over 16 years of age (or youngerif they headed a household) (n¼ 611) to list ‘‘the name of allthe important people in the village’’. In results reportedshortly we found that participants were more likely toname men. We are not sure why women received fewnominations but this might reflect our poor understandingof how to ask about female social rank. Because womenreceived so few nominations, we limit the multivariateanalysis to men. The total sample with complete informa-tion included 289 adult men.
Anthropometric indices of short-run nutritional status
We trained surveyors on how to measure physicalstature, weight, mid-arm circumference, and skinfoldthickness (see Godoy et al., 2005a for a description of theprotocols). We use three different anthropometric indicesof short-run nutritional status as outcome variables: (a)body mass index, (b) mid-arm circumference (cm), and (c)sum of four skinfolds (biceps, triceps, subscapular, supra-iliac; mm). BMI is a measure of body composition and themost widely used measure of nutritional status amongadults (National Institutes of Health, 1998; Shetty & James,1994). Mid-arm circumference provides an index of bothprotein and energy status (Frisancho, 1990). The skinfoldmeasures are sensitive to short-term change in subcuta-neous fat stores and are thus good measures of energyreserves (Frisancho, 1990).
For (b) and (c), we use raw scores rather than age-stan-dardized z scores because many Tsimane’ do not know theirexact age so the variable age contains random measurementerror. Using age-standardized anthropometric indiceswould have inflated standard error and weakened statisticalpower. Instead, we include age as a covariate. Partialcorrelation coefficients between the three indices of short-term nutritional status were as follows: BMI and mid-arm
circumference¼ 0.74 (p< 0.0001), BMI and sum of fourskinfold¼ 0.69 (p< 0.0001), and mid-arm circumferenceand sum of four skinfold¼ 0.56 (p< 0.0001).
Social rank
To measure a person’s position in the social hierarchywe collected relational data. We asked participants toprovide an exhaustive list with ‘‘the name of all theimportant people in the village’’. To analyze the list ofnominations of ‘‘important people in the village’’ we usedsocial network analysis and calculated the centrality ofeach person in the village network of influence, defined asthe number of nominations received by a person. Themeasure, known as in-degree centrality, has been previ-ously used to identify influential people in communities(Costenbader & Valente, 2003). We then used the measureof in-degree centrality to construct a measure of socialrank. The variable social rank refers to the relative ratherthan to the absolute position in the hierarchy of nomina-tions in the village, where more nominations are equatedwith a higher value in our measure of social rank, and equalobservations are assigned the average rank. All the peoplein a village who were not nominated received the lowestranking in the village. For example, if four persons received15, 4, 0, and 0 nominations, the person with the mostnominations will be assigned rank 4, the person with thesecond highest number of nominations will be assignedrank 3, and the two people with the fewest nominationswill be assigned rank 1.5.
Income
Because Tsimane’ market purchases account for lessthan 3% of the value of household consumption (Godoyet al., 2002), production and consumption almost fullyoverlap. Therefore, we defined personal daily income as thesum of (a) the average monetary value of a basket of farmand forest items consumed during a day (i.e., excludingitems that were acquired through the market), which onaverage represented 73% of the daily income value, (b) theaverage monetary value of goods sold or bartered duringa day (17%), and (c) the daily average monetary earningsfrom wage labor (11%).
Job autonomy
To control for job autonomy we asked people whetherthey had engaged in any type of wage labor during the 2months before the day of the interview. Because wage laboris an uncommon activity, it is a well-remembered eventamong the Tsimane’. For the regression analysis we createda dummy variable that took the value of one if the partic-ipant had earned any cash from wage labor during the 2months before the interview, and zero otherwise.
Social capital
We asked participants to report all the times they hadreceived gifts from kin or other Tsimane’ inside or outsidethe village (but not gifts received from people in their
V. Reyes-Garcıa et al. / Social Science & Medicine 67 (2008) 2107–2115 2111
Author's personal copy
household) during the week before the day of the inter-view. We collected information on the receiver of the gift,independently of whether the gift was later shared in thehousehold.
Control variables
We controlled for age, schooling, household size, villageof residency, and hereditary factors. Previous studies haveshown that community attributes such as incomeinequality, institutions, or residential segregation con-tribute to health (Marmot, 2005). We could not control forthis wide range of variables, but village dummy variableshave the advantage of accounting for all of these commu-nity-level fixed confounders. We also attempted to controlfor hereditary factors. Since BMI includes weight andheight, and height has a strong hereditary component(Henneberg & van den Berg, 1990) we included mother’sheight as a control.
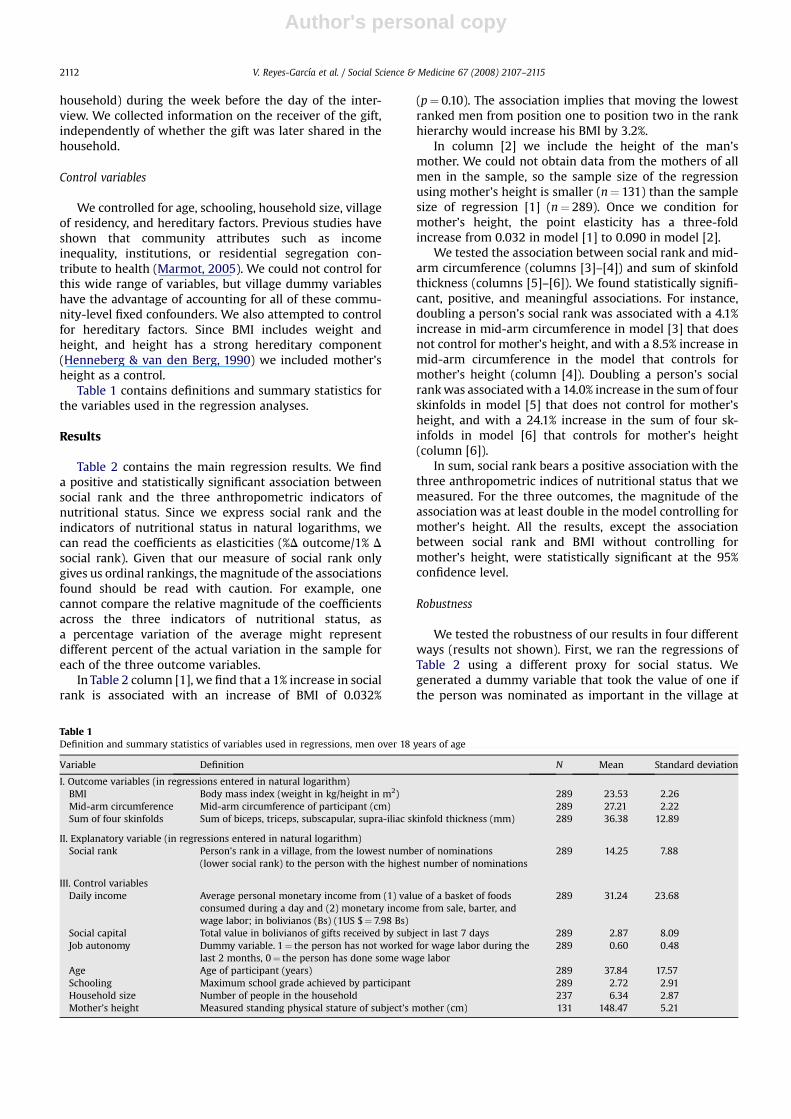
Table 1 contains definitions and summary statistics forthe variables used in the regression analyses.
Results
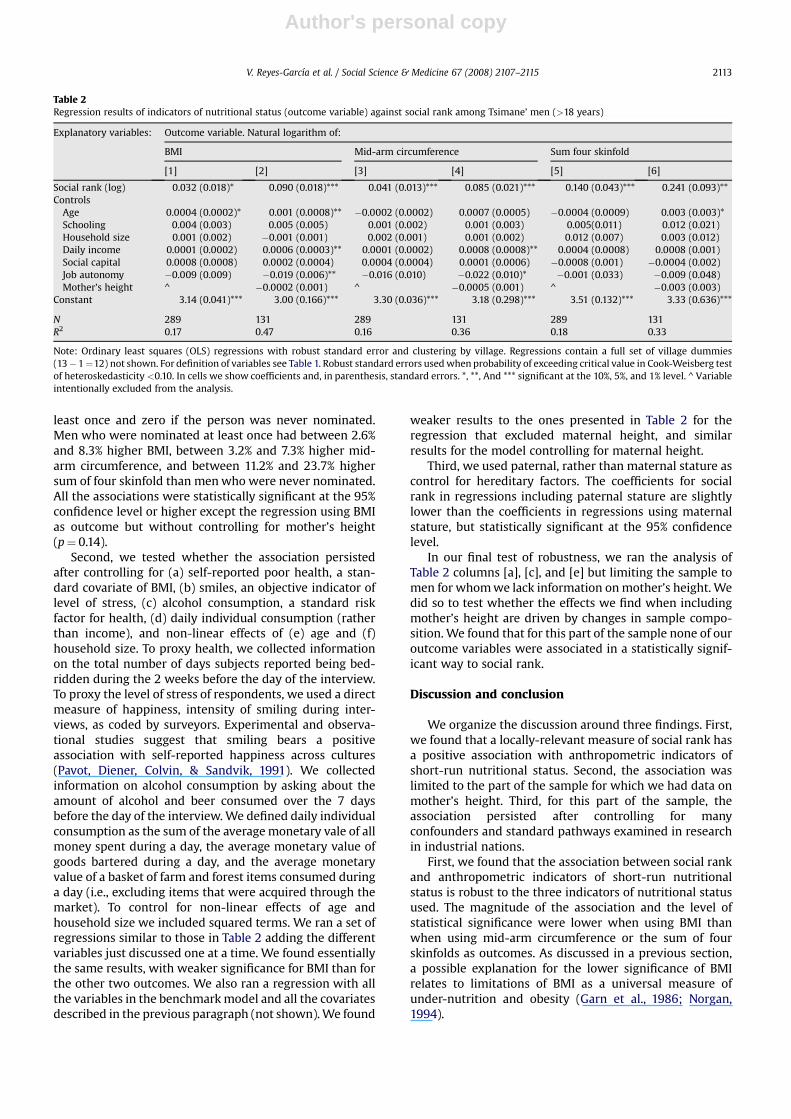
Table 2 contains the main regression results. We finda positive and statistically significant association betweensocial rank and the three anthropometric indicators ofnutritional status. Since we express social rank and theindicators of nutritional status in natural logarithms, wecan read the coefficients as elasticities (%D outcome/1% Dsocial rank). Given that our measure of social rank onlygives us ordinal rankings, the magnitude of the associationsfound should be read with caution. For example, onecannot compare the relative magnitude of the coefficientsacross the three indicators of nutritional status, asa percentage variation of the average might representdifferent percent of the actual variation in the sample foreach of the three outcome variables.
In Table 2 column [1], we find that a 1% increase in socialrank is associated with an increase of BMI of 0.032%
(p¼ 0.10). The association implies that moving the lowestranked men from position one to position two in the rankhierarchy would increase his BMI by 3.2%.
In column [2] we include the height of the man’smother. We could not obtain data from the mothers of allmen in the sample, so the sample size of the regressionusing mother’s height is smaller (n¼ 131) than the samplesize of regression [1] (n¼ 289). Once we condition formother’s height, the point elasticity has a three-foldincrease from 0.032 in model [1] to 0.090 in model [2].
We tested the association between social rank and mid-arm circumference (columns [3]–[4]) and sum of skinfoldthickness (columns [5]–[6]). We found statistically signifi-cant, positive, and meaningful associations. For instance,doubling a person’s social rank was associated with a 4.1%increase in mid-arm circumference in model [3] that doesnot control for mother’s height, and with a 8.5% increase inmid-arm circumference in the model that controls formother’s height (column [4]). Doubling a person’s socialrank was associated with a 14.0% increase in the sum of fourskinfolds in model [5] that does not control for mother’sheight, and with a 24.1% increase in the sum of four sk-infolds in model [6] that controls for mother’s height(column [6]).
In sum, social rank bears a positive association with thethree anthropometric indices of nutritional status that wemeasured. For the three outcomes, the magnitude of theassociation was at least double in the model controlling formother’s height. All the results, except the associationbetween social rank and BMI without controlling formother’s height, were statistically significant at the 95%confidence level.
Robustness
We tested the robustness of our results in four differentways (results not shown). First, we ran the regressions ofTable 2 using a different proxy for social status. Wegenerated a dummy variable that took the value of one ifthe person was nominated as important in the village at
Table 1Definition and summary statistics of variables used in regressions, men over 18 years of age
Variable Definition N Mean Standard deviation
I. Outcome variables (in regressions entered in natural logarithm)BMI Body mass index (weight in kg/height in m2) 289 23.53 2.26Mid-arm circumference Mid-arm circumference of participant (cm) 289 27.21 2.22Sum of four skinfolds Sum of biceps, triceps, subscapular, supra-iliac skinfold thickness (mm) 289 36.38 12.89
II. Explanatory variable (in regressions entered in natural logarithm)Social rank Person’s rank in a village, from the lowest number of nominations
(lower social rank) to the person with the highest number of nominations289 14.25 7.88
III. Control variablesDaily income Average personal monetary income from (1) value of a basket of foods
consumed during a day and (2) monetary income from sale, barter, andwage labor; in bolivianos (Bs) (1US $¼ 7.98 Bs)
289 31.24 23.68
Social capital Total value in bolivianos of gifts received by subject in last 7 days 289 2.87 8.09Job autonomy Dummy variable. 1¼ the person has not worked for wage labor during the
last 2 months, 0¼ the person has done some wage labor289 0.60 0.48
Age Age of participant (years) 289 37.84 17.57Schooling Maximum school grade achieved by participant 289 2.72 2.91Household size Number of people in the household 237 6.34 2.87Mother’s height Measured standing physical stature of subject’s mother (cm) 131 148.47 5.21
V. Reyes-Garcıa et al. / Social Science & Medicine 67 (2008) 2107–21152112
Author's personal copy
least once and zero if the person was never nominated.Men who were nominated at least once had between 2.6%and 8.3% higher BMI, between 3.2% and 7.3% higher mid-arm circumference, and between 11.2% and 23.7% highersum of four skinfold than men who were never nominated.All the associations were statistically significant at the 95%confidence level or higher except the regression using BMIas outcome but without controlling for mother’s height(p¼ 0.14).
Second, we tested whether the association persistedafter controlling for (a) self-reported poor health, a stan-dard covariate of BMI, (b) smiles, an objective indicator oflevel of stress, (c) alcohol consumption, a standard riskfactor for health, (d) daily individual consumption (ratherthan income), and non-linear effects of (e) age and (f)household size. To proxy health, we collected informationon the total number of days subjects reported being bed-ridden during the 2 weeks before the day of the interview.To proxy the level of stress of respondents, we used a directmeasure of happiness, intensity of smiling during inter-views, as coded by surveyors. Experimental and observa-tional studies suggest that smiling bears a positiveassociation with self-reported happiness across cultures(Pavot, Diener, Colvin, & Sandvik, 1991). We collectedinformation on alcohol consumption by asking about theamount of alcohol and beer consumed over the 7 daysbefore the day of the interview. We defined daily individualconsumption as the sum of the average monetary vale of allmoney spent during a day, the average monetary value ofgoods bartered during a day, and the average monetaryvalue of a basket of farm and forest items consumed duringa day (i.e., excluding items that were acquired through themarket). To control for non-linear effects of age andhousehold size we included squared terms. We ran a set ofregressions similar to those in Table 2 adding the differentvariables just discussed one at a time. We found essentiallythe same results, with weaker significance for BMI than forthe other two outcomes. We also ran a regression with allthe variables in the benchmark model and all the covariatesdescribed in the previous paragraph (not shown). We found
weaker results to the ones presented in Table 2 for theregression that excluded maternal height, and similarresults for the model controlling for maternal height.
Third, we used paternal, rather than maternal stature ascontrol for hereditary factors. The coefficients for socialrank in regressions including paternal stature are slightlylower than the coefficients in regressions using maternalstature, but statistically significant at the 95% confidencelevel.
In our final test of robustness, we ran the analysis ofTable 2 columns [a], [c], and [e] but limiting the sample tomen for whom we lack information on mother’s height. Wedid so to test whether the effects we find when includingmother’s height are driven by changes in sample compo-sition. We found that for this part of the sample none of ouroutcome variables were associated in a statistically signif-icant way to social rank.
Discussion and conclusion
We organize the discussion around three findings. First,we found that a locally-relevant measure of social rank hasa positive association with anthropometric indicators ofshort-run nutritional status. Second, the association waslimited to the part of the sample for which we had data onmother’s height. Third, for this part of the sample, theassociation persisted after controlling for manyconfounders and standard pathways examined in researchin industrial nations.
First, we found that the association between social rankand anthropometric indicators of short-run nutritionalstatus is robust to the three indicators of nutritional statusused. The magnitude of the association and the level ofstatistical significance were lower when using BMI thanwhen using mid-arm circumference or the sum of fourskinfolds as outcomes. As discussed in a previous section,a possible explanation for the lower significance of BMIrelates to limitations of BMI as a universal measure ofunder-nutrition and obesity (Garn et al., 1986; Norgan,1994).
Table 2Regression results of indicators of nutritional status (outcome variable) against social rank among Tsimane’ men (>18 years)
Explanatory variables: Outcome variable. Natural logarithm of:
BMI Mid-arm circumference Sum four skinfold
[1] [2] [3] [4] [5] [6]
Social rank (log) 0.032 (0.018)* 0.090 (0.018)*** 0.041 (0.013)*** 0.085 (0.021)*** 0.140 (0.043)*** 0.241 (0.093)**Controls
Age 0.0004 (0.0002)* 0.001 (0.0008)** �0.0002 (0.0002) 0.0007 (0.0005) �0.0004 (0.0009) 0.003 (0.003)*Schooling 0.004 (0.003) 0.005 (0.005) 0.001 (0.002) 0.001 (0.003) 0.005(0.011) 0.012 (0.021)Household size 0.001 (0.002) �0.001 (0.001) 0.002 (0.001) 0.001 (0.002) 0.012 (0.007) 0.003 (0.012)Daily income 0.0001 (0.0002) 0.0006 (0.0003)** 0.0001 (0.0002) 0.0008 (0.0008)** 0.0004 (0.0008) 0.0008 (0.001)Social capital 0.0008 (0.0008) 0.0002 (0.0004) 0.0004 (0.0004) 0.0001 (0.0006) �0.0008 (0.001) �0.0004 (0.002)Job autonomy �0.009 (0.009) �0.019 (0.006)** �0.016 (0.010) �0.022 (0.010)* �0.001 (0.033) �0.009 (0.048)Mother’s height ^ �0.0002 (0.001) ^ �0.0005 (0.001) ^ �0.003 (0.003)
Constant 3.14 (0.041)*** 3.00 (0.166)*** 3.30 (0.036)*** 3.18 (0.298)*** 3.51 (0.132)*** 3.33 (0.636)***
N 289 131 289 131 289 131R2 0.17 0.47 0.16 0.36 0.18 0.33
Note: Ordinary least squares (OLS) regressions with robust standard error and clustering by village. Regressions contain a full set of village dummies(13�1¼12) not shown. For definition of variables see Table 1. Robust standard errors used when probability of exceeding critical value in Cook-Weisberg testof heteroskedasticity <0.10. In cells we show coefficients and, in parenthesis, standard errors. *, **, And *** significant at the 10%, 5%, and 1% level. ^ Variableintentionally excluded from the analysis.
V. Reyes-Garcıa et al. / Social Science & Medicine 67 (2008) 2107–2115 2113
Author's personal copy
Our first finding, the association between social rankand nutritional status, is consistent with findings fromindustrial and non-human primate societies (Marmot,2006; Sapolsky, 2004; Wilkinson, 2000). The magnitude ofthe association was important in real terms, but probablynot equally significant for the entire sample. Since less thana third of the sample was nominated as important, we areunsure of how hard would it be for a person to go from thegroup of non-nominated to the group of people who atleast received one nomination.
Second, when splitting the sample between informantswith and without data on mother’s height, we found thatthe association between social status and indicators ofshort-run nutritional status persisted only for the sample ofpeople for whom we have data on mother’s height. Theassociation was not statistically significant for thesubsample of people for whom we do not have data onmother’s height. Why would the results of the twosubsamples be different? Using a series of t-test compari-sons of means, we analyzed the socio-demographic andphysical characteristics of the two subsamples (not shown).Men for whom we do not have data on mother’s heightwere older than men for whom we do have data (45 versus28 years of age, p< 0.00001), probably because it is morelikely that the mothers of older people were dead. We alsofound a positive and statistically significant associationbetween age and social rank for the two subsamples. Ourresults, suggest that the association between social rankand indices of short-run nutritional status might decreaseacross the life span.
The last finding that deserves discussion is the robust-ness of the association after controlling for standard path-ways. The finding supports the idea that dominancehierarchies might influence health through other channelsbeyond the channels examined in industrial societies, i.e.,perceived stress, social capital, and own resources. Becauseof the limitations of our proxies for psychosocial factors(discussed before), our results do not allow us to concludethat the psychosocial path does not explain the associationbetween social rank and nutritional status in a foraging-farming society, but rather it is possible that the proxies forthe psychosocial factors used might not be adequate in thiscontext. Which other channels might mediate the socialgradient?
We suggest two other potential paths: exemption fromsocial obligations, and psychological well-being associatedwith being respected. Ethnographic research and behavioralexperiments suggest that individuals with higher socialrank receive privileges and are excused from some socialobligations (Henrich & Gil-White, 2001). Using behavioralexperiments, researchers have also found that individuals ofhigh social rank are more likely to be exempted from socialsanctions (Bickman, 1971) and are more likely to beconferred special privileges (Ungar, 1981) than individualsof low social rank. Thus, it is possible that social rankchanges the allocation of tasks and occupations and, in sodoing, changes energy expenditures, which influencesanthropometric indices of short-run nutritional status.
Second, in a Foraging-farming society, the sense of beingrespected by the community might be a better measure ofthe psychosocial factors that mediate the relation between
socioeconomic status and health than job autonomy andsocial capital. Researchers have argued that poor healthreflects both the feeling of being poor and the objectivestatus of poverty. Subjective indicators of socioeconomicstatus are as good or better predictors than objectiveindicators of socioeconomic status for stress-relatedoutcomes (Goodman et al., 2003). Along the same lines,a subjective, culturally relevant indicator of respect mightbe a better measure of the pathway for the associationbetween social rank and health.
In conclusion, this study opens three lines for futureresearch on the social gradient in health among small-scalesocieties. First, further research should address the role ofculturally defined notions of respect as potential pathwaysto explain the relationship between social rank and health.Second, further research should also address causalitybetween the variables explored. Longitudinal surveys of thesame informants have the potential to control for unob-served person-level fixed effects correlated with theregressors and outcomes, and could therefore move theanalysis towards a causal interpretation. Last, results fromthis research point to the need for a better understanding ofthe association between social rank and indices of short-run nutritional status at different points in a lifetime.Further empirical research among small-scale societiesshould address the longitudinal dimension of the socialgradient in health.
References
Adler, N., Boyce, T., Chesney, M., Folkman, S., & Syme, S. (1993). Socio-economic inequalities in health: no easy solution. Journal of theAmerican Medical Association, 269, 3140–3145.
Bickman, L. (1971). The effect of social status on the honesty of other.Journal of Social Psychology, 85, 87–92.
Bosma, H. (1998). Two alternative job stress models and risk of coronaryheart disease. American Journal of Public Health, 88, 68–74.
Brabec, M., Godoy, R., Reyes-Garcıa, V., & Leonard, W. (2007). BMI,income, and social capital in a native Amazonian society: interactionbetween relative and community effects. American Journal of HumanBiology, 19, 459–474.
Censo Indıgena. (2001). Censo Indıgena del Oriente, Chaco, y Amazonıa.Secretaria de Asuntos Etnicos, de Genero y Generacionales. La Paz:Ministerio de Desarrollo Humano.
Charbonneau-Roberts, G., Saudny-Unterberger, H., Kuhnlein, H. V., &Egeland, G. M. (2005). Body mass index may overestimate the prev-alence of overweight and obesity among the Inuit. Journal ofCircumpolar Health, 64(2), 163–169.
Coleman, J. S. (1990). Foundations of social theory. Cambridge, Massa-chusetts: Harvard University Press.
Costenbader, E., & Valente, T. W. (2003). The stability of centralitymeasures when networks are sampled. Social Networks, 25, 283–307.
Daillant, I. (2003). Sens Dessus Dessous. Organization sociale et spatiale desChimane d’Amazonie boliviane. Nanterre: Societe d’ethnologie.
Deaton, A. (2003). Health, inequality, and economic development. Journalof Economic Literature, 41, 113–158.
Deurenberg-Yap, M., & Deurenberg, P. (2003). Is a re-evaluation of WHObody mass index cut-off values needed? The case of Asians in Sin-gapore. Nutrition Review, 61, S80–S87.
Dufour, D. (1994). Diet and nutritional status of Amazonian peoples. In A.Roosevelt (Ed.), Amazonian Indians from prehistory to the present.Tuczon: University of Arizona Press.
Ellis, R. (1996). A taste for movement: an exploration of the social ethicsof the Tsimane’ of Lowland Bolivia. Ph.D. Thesis. St Andrews Univer-sity, Scotland.
Frisancho, A. (1990). Anthropometric standards for the assessment of growthand nutritional status. Ann Arbor, MI: University of Michigan Press.
Foller, M. L. (1995). Future health of indigenous peoples: a human ecologyview and the case of the Amazonian Shipibo-Conibo. Futures, 27(9/10),1005–1023.
V. Reyes-Garcıa et al. / Social Science & Medicine 67 (2008) 2107–21152114
Author's personal copy
Garn, S., Leonard, W., & Hawthorne, V. (1986). Three limitations of theBody Mass Index. American Journal of Clinical Nutrition, 44, 996–997.
Godoy, R., Byron, E., Reyes-Garcıa, V., Vadez, V., Leonard, W., Apaza, L.,et al. (2005a). Income inequality and adult nutritional status:anthropometric evidence from a pre-industrial society in the BolivianAmazon. Social Science & Medicine, 61, 907–919.
Godoy, R., Leonard, W., Reyes-Garcıa, V., Goodman, E., McDade, T.,Huanca, T., et al. (2006a). Physical stature of adult Tsimane’ Amer-indian of the Bolivian Amazon in the 20th century. Economics andHuman Biology, 4, 184–205.
Godoy, R., Overman, H., Demmer, J., Apaza, L., Byron, E., Huanca, T., et al.(2002). Local financial benefits of rain forests: comparative evidencefrom Amerindian societies in Bolivia and Honduras. EcologicalEconomics, 40(3), 397–409.
Godoy, R., Reyes-Garcıa, V., Byron, E., Leonard, W., & Vadez, V. (2005b).The effect of market economies on the well-being of indigenouspeoples and on their use of renewable natural resources. AnnualReview of Anthropology, 34, 121–138.
Godoy, R., Reyes-Garcıa, V., Vadez, V., Leonard, W., Huanca, T., &Bauchet, J. (2005c). Human capital, wealth, and adult nutritionalstatus among a foraging-horticultural society of the Bolivian Amazon.Economics and Human Biology, 3, 139–162.
Godoy, R., Reyes-Garcıa, V., Leonard, W., Huanca, T., McDade, T., Tanner, S.,et al. (2007). On the measure of income in autarky and the economicunimportance of social capital. Journal of Anthropological Research,63(2), 239–260.
Goodman, E., Adler, N., Daniels, S., Morrison, J., Slap, G., & Dolan, L. (2003).Impact of objective and subjective social status on obesity in a biracialcohort of adolescents. Obesity Research, 11, 1018–1026.
Henneberg, M., & van den Berg, E. R. (1990). Test of socioeconomiccausation of secular trend: stature changes among favored andoppressed South Africans are parallel. American Journal of PhysicalAnthropology, 83, 459–465.
Henrich, J., & Gil-White, F. (2001). The evolution of prestige. Freelyconferred deference as a mechanism for enhancing the benefits ofcultural transmission. Evolution and Human Behavior, 22, 165–196.
Huanca, T. (2008). Tsimane’ oral tradition, landscape, and identity in tropicalforest. La Paz: Imprenta Wagui.
Johnson, A. (2003). Families of the forest: Matsigenka Indians of the Peru-vian Amazon. University of California Press.
Kaplan, H., & Hill, K. (1985). Food sharing among ache foragers: tests ofexplanatory hypotheses. Current Anthropology, 26, 223–245.
Kawachi, I. (2002). The health of nations. Why inequality is harmful to yourhealth. New York: The Free Press.
Kawachi, I., & Kennedy, B. (1999). Income inequality and health: pathwaysand mechanisms. Health Services Research, 34, 215–217.
Leonard, W., & Thomas, R. B. (1988). Changing dietary patterns in thePeruvian Andes. Ecology of Food and Nutrition, 21, 245–263.
Mare, R. (1990). Socio-economic careers and differential mortality amongolder men in the United States. In J. Vallin, S. D’Souza, & A. Palloni(Eds.), Measurement and analysis of mortality (pp. 362–387). Oxford:Clarendon Press.
Marmot, M. (2004). The Status Syndrome: How social standing affects ourhealth and longevity. Times Books.
Marmot, M. (2005). Social determinants of health inequalities. Lancet,365, 1099–1104.
Marmot, M. (2006). Health in an unequal world. The Lancet, 368, 2081–2094.Marmot, M., Ryff, C., Bumpass, L., Shipley, M., & Marks, N. (1997). Social
inequalities in health: next questions and converging evidence. SocialScience & Medicine, 44, 901–910.
Marmot, M., & Smith, G. (1991). Health inequalities among British civilservants: the Whitehall II study. Lancet, 337, 1387–1394.
McLaren, L. (2007). Socioeconomic status and obesity. EpidemiologicReview, 29, 29–48.
Moore, D., & Hayward, M. (1990). Occupational careers and the mortalityof elderly men. Demography, 27, 31–53.
National Institutes of Health. (1998). Clinical guidelines on the identifica-tion, evaluation, and treatment of overweight and obesity in adults: TheEvidence Report. 98-4083. Bethesda, MD: NIH.
Norgan, N. (1994). Population differences in body composition in relationto the body mass index. Journal of Clinical Nutrition, 48, S10–S25.
Orr, C. M., Dufour, D., & Patton, J. Q. (2001). A comparison of anthropo-metric indices of nutritional status in Tukanoan and Achuar Amer-indians. American Journal of Human Biology, 13, 301–309.
Ostrom, E. (2000). Social capital: a fad or a fundamental concept? In P.Dasgupta, & I. Sarageldin (Eds.), Social capital: A multifacetedperspective (pp. 172–214) Washington, DC: The World Bank.
Pavot, W., Diener, W., Colvin, R., & Sandvik, E. (1991). Further validation ofthe satisfaction with life scale: evidence for the cross-methodconvergence of well-being measures. Journal of Personality Assess-ment, 57, 149–161.
Reyes-Garcıa, V., Godoy, R., Vadez, V., Huanca, T., & Leonard, W. (2006).Individual and group incentives to invest in prosociality: a empiricalstudy in the Bolivian Amazon. Journal of Anthropological Research, 62,81–101.
Reyes-Garcıa, V., Molina, J. L., Broesch, J., Calvet, L., Huanca, T., Saus, J.,et al., TAPS study team. (2008a). Male ethnomedicinal plant knowl-edge, age, and prestige: a test of predictions from the prestige-biasmodel of cultural transmission. Evolution and Human Behavior, 29(4),275–281.
Reyes-Garcıa, V., Vadez, V., Godoy, R., Huanca, T., Leonard, W., McDade, T.,et al. (2008b). Non-market returns to traditional and modern humancapital: nutritional status in a native Amazonian society. Journal ofDevelopment Studies, 44(2), 206–221.
Rode, A., & Shephard, R. J. (1994). Prediction of percent body fat content inan Inuit community. American Journal of Human Biology, 6, 249–254.
Sapolsky, R. (2004). Social status and health in humans and other animals.Annual Review of Anthropology, 33, 393–418.
Shephard, R. J., & Rode, A. (1996). Health consequences of ‘modernization’:Evidence from circumpolar peoples. Cambridge University Press.
Shetty, P. S., & James, W. P. T. (1994). Body mass index: A measure of chronicenergy deficiency in adults. Food and nutrition paper 56. Rome: Foodand Agriculture Organization.
Sobal, J., & Stunkard, A. J. (1989). Socioeconomic status and obesity:a review of the literature. Psychological Studies, 105(2), 260–275.
Sorenson, G., Pirie, P., Folsom, A., Luepker, R., Jacobs, D., & Gillum, R.(1985). Sex differences in the relationship between work and health:the Minnesota Heart Survey. Journal of Health and Social Behavior, 26,379–394.
Subramanian, S. V., & Kawachi, I. (2004). Income inequality and health:what have we learned so far? Epidemiologic Review, 26, 78–91.
Ungar, S. (1981). The effects of status and excuse on interpersonal rela-tions to deviant behavior. Social Psychology Quarterly, 44, 260.
Wilkinson, R. G. (1996). Unhealthy societies: The affliction of inequality.London: Routledge.
Wilkinson, R. G. (2000). Mind the gap: Hierarchies, health, and humanevolution. London: Weidenfeld & Nicolson.
Winterhalder, B. (1997). Gifts given, gifts taken: the behavioral ecology ofnonmarket, intragroup exchange. Journal of Archeological Research,5(2), 121–168.
V. Reyes-Garcıa et al. / Social Science & Medicine 67 (2008) 2107–2115 2115
Top Related
Copyright © 2022 FDOKUMEN

