


Bahasa
Halaman
Hukum


Appendix 5THEMIS – Metadata Phase 1
THEMIS – Theorizing the Evolution of
European Migration Systems
Metadata Phase 1
Final version updated 4 February 2014
Authors:
Scoping studies in the Netherlands (EUR)
Godfried Engbersen; Erik Snel; Masja van Meeteren; Sanne van de Pol; and Rianne Dekker
Scoping studies in Norway (PRIO)
Cindy Horst; Jørgen Carling; and Rojan Ezzati
Scoping studies in Portugal (IGOT)
Lucinda Fonseca; Sónia Pereira; Alina Esteves; and Jennifer McGarrigle
Scoping studies in UK (IMI)
Agnieszka Kubal; Oliver Bakewell; and Hein de Haas
Countries of origin fact sheet (IMI)
Harriet Balance; and Dominique Jolivet
UK Data Archive Study Number 7771 - Theorizing the Evolution of European Migration Systems, 2010-2013: Special Licence Access

2THEMIS – Metadata Phase 1
Table of contents
I Research outline ............................................................................................................................. 3
1 Introduction to the research ....................................................................................................... 3
2 Research questions...................................................................................................................... 3
3 Central concepts.......................................................................................................................... 3
II Note on the scoping studies ........................................................................................................... 6
III Countries of origin: Brazil, Morocco and Ukraine .......................................................................... 6
1 Cross-country comparison........................................................................................................... 7
2 Longitudinal Cross Country Comparison ..................................................................................... 8
IV Appendix....................................................................................................................................... 10
Appendix 1: Scoping studies in the Netherlands
Appendix 2: Scoping studies in Norway
Appendix 3: Scoping studies in Portugal
Appendix 4: Scoping studies in UK
Appendix 5: between-country comparable indicators (Brazil, Morocco and Ukraine)

3THEMIS – Metadata Phase 1
I Research outline
1 Introduction to the research
To fill the theoretical and empirical gaps in scientific knowledge on migration, the THEMIS project
explores the conditions under which initial moves by pioneer migrants to Europe result in the
formation of migration systems, when this does not happen, or migration systems are in decline. This
is achieved through a substantially improved theorization of migration system dynamics by
integrating theories on the initiation and continuation of migration; and a comparative, multi-sited,
and longitudinal study of the evolution of heterogeneous migrant groups following different
settlement trajectories from three origin countries (Brazil, Morocco and Ukraine) to eight European
cities in the UK, Norway, the Netherlands and Portugal.
The THEMIS project began in January 2010 and is funded through to 2013 by the NORFACE Migration
Research Programme. There are four project partners: the Department of Sociology of the Erasmus
University Rotterdam (EUR), the Netherlands; the International Migration Institute (IMI) at the
University of Oxford, UK; the International Peace Research Institute Oslo (PRIO), Norway; and the
Institute of Geography and Spatial Planning, University of Lisbon (IGOT-UL), Portugal.
2 Research questions
The three main research questions of THEMIS are:
1. Under what conditions does initial (pioneer) migration establish precedents for the
establishment of migration systems?
In other words, when does migration of pioneers lead to a system that generates more migration?
2. Which factors explain why many initial migration movements might be followed by limited
chain migration of immediate family and friends but do not start processes of expanding
network migration leading to network formation and the establishment of migration
systems?
In some cases pioneer migration might lead to some migration of family members and close
acquaintances but not to migration of others. We cannot speak of a migration system in such a case.
What factors determine the start of a migration system?
3. Under what conditions do migrant networks and migration systems weaken or decline, or
does ‘spontaneous’ (pioneer) migration to new destinations occur?
Migration systems can start, grow and stabilise, but they can also decline. How does such a decline
come about? Does this have to do with the fact that people migrate elsewhere (new pioneers have
migrated to new destinations and this had led to a system).
These questions are concerned with the conditions under which initial moves of pioneer migrants to
Europe result in rapidly expanding network migration and the formation of migration systems, and
the conditions under which this does not happen.
3 Central concepts
Migration system and migration system dynamics
By framing our research questions around the concept of migration systems, we take existing
migration systems theory – with all its shortcomings – as our starting point. A fundamental aim of

4THEMIS – Metadata Phase 1
THEMIS is to refine and reshape migration systems theory, which has hardly moved forward since
Mabogunje’s work in the 1970s. Mabogunje saw migration systems (1970) as a ‘set of places linked
by flows and counter flows of people, goods, services, and information, which tend to facilitate
further exchange, including migration, between the places’. This definition remains quite open and
general. It focuses on the ways in which systems run (either expanding or declining, or simply self-
sustaining) and makes no claim to explain the genesis and decline of migration systems. Mabogunje’s
approach assumes that the system is already in place: it cannot explain why a system comes into
being in the first place.
It is precisely such an existential question that THEMIS aims to address: under what conditions does
the initial movement of pioneers result in an establishment of a migration system? Unfortunately,
since Mabogunje, no systematic attempts have been made to further advance and refine migration
systems theory drawing on later advances in general social theory. Migration systems theory remains
unable to explain the heterogeneity of migration system formation (the existence of different
trajectories), change (growth, decline, stagnation) within existing migration systems, or the role of
agency1 (vis-à-vis structure) in explaining such change. It is the ambition of THEMIS to address these
gaps.
Migration systems are not steady phenomena, but flexible. Different migration flows develop, then
change, and destinations and places of origin also change. In short, dynamics are at work within
migration systems. We conceptualise migration system dynamics as the ways in which the migration
system changes in relation to: i) external (to the system) factors, which in turn re-shape the initial
conditions under which migration takes place, ii) feedback mechanisms (within the system), and iii)
the exercise of the agency of social actors within the system.
These dynamics occur in different ways. Firstly, changes occur in relation to factors outside the
system. One could think of climate change or a natural disaster that pushes people to move, but also
an improvement in living conditions in the origin country. Secondly, feedback mechanisms
encompass feedback that is given through the system, it can be both negative and positive. One can
think of stories that encourage people to move to a certain place as apparently life is better there, or
migrants may also communicate to non-migrants their discontent with their situation. Lastly, the
agency of social actors refers to the capacity of people to act independently and to make their own
free choices (within the system).
Pioneers
THEMIS address pioneer migrants in establishing precedents for further migration to follow (and the
possible establishment of a migration system), and the conditions under which it would not happen.
The question here is the role of the pioneer migrants in influencing who from the origin community,
and to what extent, might follow their footsteps, and who would not?
Pioneers are not necessarily the first migrants who arrive in a certain country. Migration from A to B
can be divided in different waves, for instance, Moroccan migration to the Netherland could be
distinguished between labour migrants and family (reunification or formation) migrants. Pioneer
labour migrants are interesting, but we also focus on the first female migrants who arrived after 1974
for family reunification. The term pioneer should not be understood too strictly.
1Agency refers to the capacity of individuals to act independently and to make their own free choices.
Structure, by contrast, refers to the recurrent patterned arrangements which seem to influence or limit thechoices and opportunities that individuals possess.

5THEMIS – Metadata Phase 1
Migration threshold
A migration threshold is a hypothesised critical level beyond which migration becomes partly self-
sustaining – in other words, it gains its own momentum. Today, this concept is rather unexplored. It
is based on the idea that a ‘critical mass’ of migrants is needed to generate certain effects that create
more migration. For example, the creation of associations, religious institutions, or special businesses
that make the country in question a more attractive destination for migrants from a certain country.
It is unclear whether such a threshold level really exists and it is one of the central aims of THEMIS to
further theorise and investigate this matter.
Migration systems decline
The focus on migration dynamics in contemporary migration literature evolved around the
assumption that once started, migrations would continue and self-perpetuate. New conditions
arising in the course of migration would in turn make additional migration more likely. This implies
theoretically limitless new flows, further growth and expansion ad infinitum. Clearly, this circular
logic is a naïve assumption.
Studies of network migration usually ignore counterfactual cases in which initial moves by pioneer
migrants do not set in motion self-reinforcing migration dynamics. A second weakness of these
theories is their largely circular nature, according to which migration goes on forever. Little account is
taken of factors that may weaken migration systems over time.
THEMIS pays special attention to the possible decline of migration systems or waves. People might
stop offering help to new migrants, negative rumours could spread within the system discouraging
people to move or the changing conditions on the labour market could influence a possible decline.
Factors
We also focus on macro-, meso- and micro-level indicators of structural conditions facing migrants.
Examples of these are visualised in the following table.
Macro-levelMeso-level (partly affected by
migration processes)Micro-level
Socio-economic indicators e.g.
Income levels per head
Income stability
Employment levels
Labour market structure
Literacy / School enrolment
Access to health care / healthstatus of family members
Access to social rights (socialsecurity)
Political indicators e.g.
Political freedoms and rights(voting, citizenship)
Migration policies
Socio-economic indicators e.g.
Remittances
Community income inequality
Socio-ethnic hierarchies
Labour market segmentation
Economic growth
Migration culture (migration-proneness)
Political indicators, e.g.
Local implementation of migrationpolicies
Mobility indicators, e.g.
Labour recruitment
Personal characteristics e.g.
Household structure
Civil status
Gender
Age
Micro-level socio-economic, e.g.,
Household income
Ownership of land and otherproductive assets
Ownership of residential property
Education and skills
Employment status
Socio-cultural

6THEMIS – Metadata Phase 1
Macro-levelMeso-level (partly affected by
migration processes)Micro-level
Access to human rights
Economic rights (propertyrights, shareholding)
Conflict
Demographic indicators e.g.
Dependency ratios
Life expectancy
Fertility
Gender ratio
Environmental indicators, e.g.
Climate
Access to migrant networks
‘Migration industry’: Travel agents,smugglers, document forgers,traffickers, etc.
Access to migration-relevantinformation
Labour demand in ‘ethnic’ niches
Environmental indicators e.g.
Agro-ecological risks (droughts, floods,etc.)
Land degradation
Social status
Ethnicity, religion
Social networks
Access to information
Mobility indicators
Spatial distribution of familymembers
Personal migration history
Transnational activities
Figure 1. Macro, meso and micro level indicators of structural conditions facing migrants
II Note on the scoping studies
The first phase of THEMIS ran from January 2010 until September 2010. Research teams in the UK,
Norway, Netherlands and Portugal (the four THEMIS destination countries) carried out scoping
studies focusing on a shortlist of six origin countries: Ukraine, Bangladesh, India, Morocco, Egypt and
Brazil.
The studies–including detailed reviews of literature, national and local migration statistics and
interviews with key migrant organisations for six sending countries–were used to categorise the ways
in which migration systems to the destination countries have developed. The findings of the scoping
studies (cf. Appendix 1–4) helped the overall project team to choose Brazil, Morocco and Ukraine as
the three origin countries to be the focus of subsequent research.
III Countries of origin: Brazil, Morocco and Ukraine
The criteria considered to select the three countries of origin were the:
Heterogeneity of trends between localities of origin and destination
Size of the migrant groups in the destination countries
Evolution of migration flows (increasing, decreasing, stagnating, etc.)
Theory formation: How the case studies could be used to bring new theoretical insights onthe notions under study (e.g. case studies challenging the notion of migration systems orcorridor, or trends in particular groups that could be analysed in order to explain somemechanisms affecting the evolution of migration flows)
Migration history of the selected migrant groups in the countries/localities of destination
Diversity of migrant groups in terms of waves of migration and profiles as well as regardingparticular types of migration (e.g. step-wise or transit migration)
Practicalities that could ease the fieldwork and the analyses (e.g. availability of data)

7THEMIS – Metadata Phase 1
In each destination country the main factors considered for the selection of Brazil, Morocco and
Ukraine differed. Drawn from the scoping studies they are summarised in Table 1.
Morocco Brazil Ukraine
Netherlands Size of the group in the
destination country
Theory formation Theory formation
Evolution of migration flows Type of migration Evolution of migration flows
Migration history in the
destination country
Size of the group in the
destination country
Norway Migration history in the
destination country
Evolution of migration flows Evolution of migration flows
Type of migration Theory formation Migration history in the
destination country
Size of the group in the
destination country
Portugal Migration history in the
destination country
Size of the group in the
destination country
Migration history in the
destination country
Evolution of migration flows Evolution of migration flows Evolution of migration flows
Migration history in the
destination country
Type of migration
UK Theory formation Theory formation Theory formation
Type of migration Evolution of migration flows Type of migration
Evolution of migration flows
Table 1 - Main criteria retained to select the countries of origin of the THEMIS project
1 Cross-country comparison2
This section considers the similarities and differences in the demographic and socio-economic
characteristics of the three countries chosen for THEMIS (see Appendix 5 for between-country
comparable indicators).
Of the three countries selected, Morocco is the smallest with around 33 million people dispersed
across nearly 450,000 kms2. Brazil is the largest with a surface area of around 19 times that of
Morocco and a population of about six times its size. Ukraine is the most densely populated of the
three countries and Brazil the least. Brazil is, however, the most urbanised with around 85% of the
population living in urban areas, compared with 69% in Ukraine, and 57% in Morocco.
Brazil is the wealthiest country of the three with a GDP per capita of around USD 11,300 and is
classified as a high income country by the World Bank. Morocco and Ukraine are both classified as
lower middle income countries. Morocco is the poorer of the two with a GDP per capita of around
USD2900 compared with Ukraine’s USD 3900.
2Country level data is the most up to date information available at the time of writing (2009-2012) and is taken
from the World Bank, apart from HDI data which is taken from the UNDP (2012). Cf. Appendix 5 for more
details.

8THEMIS – Metadata Phase 1
In terms of development, Ukraine and Brazil are classified as countries of high human development,
and Morocco as medium human development. Of the three countries, Ukraine has the highest
measure on the UNDP’s development index with a score of 0.74, closely followed by Brazil’s 0.73 and
significantly higher than Morocco’s 0.591. Ukraine has close to full literacy for both men and women,
Brazil has 90% (roughly equal between men and women), and in Morocco the literacy rate is 56%
with a much higher rate among men (69%) than women (43%).
The three countries have quite different profiles in terms of migration as explained later in this
report. According to World Bank data, in 2012 Morocco had the largest net migration rate at -
450,000, with Brazil in the middle at -190,000 and Ukraine the smallest with a net migration rate of -
40,006 (shown as the rate of net migration per thousand population in Table 3). In terms of reliance
on personal remittances however, the picture is slightly different with remittances forming around
4.8% of Ukraine’s GDP, compared to 7.3% of Morocco’s and only 0.1% of Brazil’s.
Country Net migration rate per thousand population
Ukraine 0.88
Morocco 13.84
Brazil 0.96
Table 3 - Migration rate per thousand population
2 Longitudinal Cross Country Comparison
This section looks at the way in which certain key demographic and socioeconomic indicators have
changed over time.
As stated above, the population size of the three countries is very different. The population of Brazil
has risen sharply and steadily in the period since 1961 from around 75 million to 198 million. The
population of Morocco has risen from almost 13 million in 1961 to 32.5 million in 2012. The
population of Ukraine however, has risen and fallen in this period from 43 million in 1961 to 52
million in 1993 to around 45 million in 2012.
Fertility and death rates for the three countries provide some context to the population changes that
have taken place. Death rates in Morocco and Brazil have both steadily fallen from 18 and 12.9
(deaths per 1,000 population) respectively in 1961, to 6.3 and 6.4 in 2011. The death rate in Ukraine
has shown an opposite trend, rising from 8.41 in 1961 to a peak of 16.6 in 2005, and falling slightly to
14.5 in 2011. A World Bank report explains that this is attributable to a number of factors including
inadequate health care and a high rate of non-communicable disease amongst men.3 In addition, the
report explains that Ukraine has the highest mortality rate from infectious diseases in the European
region as designated by the World Health Organisation (with 90% of deaths from communicable
diseases attributable to HIV/AIDS and tuberculosis).
The fertility rate is highest in Morocco at 2.65 births per woman, having fallen from a peak of 7.1 in
the early 1960s. In Brazil there is a similar trend with a significant reduction in the fertility rate from
6.1 in the early 1960s to 1.8 in 2011. In Ukraine, there has been more fluctuation with the fertility
rate falling from 2.17 to 1.1 in the early 2000s and then growing again to 1.46 in 2011.
3Menon, R., Knowledge Brief: Combating Ukraine’s health crisis: lessons from Europe, The World Bank; January
2010

9THEMIS – Metadata Phase 1
In terms of financial context, GDP per capita (as measured by constant 2005 USUSD) has grown in
Brazil and Morocco from USD 1848 and USD 728 in 1961 to USD 5721 and USD 2,462 respectively in
2012. Data for Ukraine is only available from 1987 when its GDP per capita was USD 2,677 and shows
that GDP per capita has fallen since that time to a low of USD 1,131 in 1999, rising to USD 2,095 in
2012.
The three countries have diverse migration histories. Brazil and Ukraine were traditionally countries
of immigration. However, in Brazil, a new migratory trend for emigration emerged with the economic
crisis of the 1980s. In Ukraine, the trend reversed in the 1990s, with significant out-migration in the
late 1990s. Morocco has consistently been a country of emigration with some fluctuations including a
peak net migration rate in 2002 of -754,890. More information on the history of migration to the four
destination country is to be found in the scoping studies (Appendix 1 to 4).

Appendix 1THEMIS – Metadata Phase 1
IV Appendix
Appendix 1: Scoping studies in the Netherlands

Theorizing the Evolution of European Migration Systems
(THEMIS)
Destination Netherlands
The Evolution of Migration from six origin
countries to the Netherlands
Godfried Engbersen Erik Snel
Masja van Meeteren Sanne van de Pol
Rianne Dekker
February 2011

2 Destination Netherlands: The Evolution of Migration from six origin countries to the Netherlands

3 Destination Netherlands: The Evolution of Migration from six origin countries to the Netherlands
Table of Contents
1. Introduction ............................................................................................................................................... 5
2. A short history of immigration to the Netherlands ................................................................................... 5
3. Shifting paradigms in Dutch immigration and integration policies ........................................................... 8
3.1 Asylum migration ................................................................................................................................ 9
3.2 Labour migration ............................................................................................................................... 11
3.3 Family migration ................................................................................................................................ 13
3.4 Irregular migration ............................................................................................................................ 14
3.5 Policies on return .............................................................................................................................. 17
3.6 Policies on civic integration ............................................................................................................... 18
3.7 Policies on citizenship........................................................................................................................ 20
4. Morocco .................................................................................................................................................. 21
4.1 Theoretical framework of Themis ..................................................................................................... 21
4.2 Macro factors .................................................................................................................................... 24
4.3 Meso factors ...................................................................................................................................... 25
4.4 Micro factors ..................................................................................................................................... 26
4.5 Assessment ........................................................................................................................................ 29
5. India ......................................................................................................................................................... 30
5.1 Theoretical framework of Themis ..................................................................................................... 30
5.2 Macro factors .................................................................................................................................... 34
5.3 Meso factors ...................................................................................................................................... 35
5.4 Micro factors ..................................................................................................................................... 36
5.5 Assessment ........................................................................................................................................ 39
6. Egypt ........................................................................................................................................................ 40
6.1 Theoretical framework of Themis ..................................................................................................... 40
6.2 Macro factors .................................................................................................................................... 44
6.3 Meso factors ...................................................................................................................................... 45
6.4 Conclusion ......................................................................................................................................... 47
7. Brazil ........................................................................................................................................................ 48

4 Destination Netherlands: The Evolution of Migration from six origin countries to the Netherlands
7.1 Theoretical framework of Themis ..................................................................................................... 48
7.2 Macro factors .................................................................................................................................... 52
7.3 Meso factors ...................................................................................................................................... 53
7.4 Micro factors ..................................................................................................................................... 54
7.5 Assessment ........................................................................................................................................ 57
8. Bangladesh ............................................................................................................................................. 58
8.1 Theoretical framework of Themis ..................................................................................................... 58
8.2 Macro factors .................................................................................................................................... 61
8.3 Meso factors ...................................................................................................................................... 62
8.4 Assessment ........................................................................................................................................ 64
9. Ukraine .................................................................................................................................................... 65
9.1 Theoretical framework of Themis ..................................................................................................... 65
9.2 Macro factors .................................................................................................................................... 68
9.3 Meso factors ...................................................................................................................................... 69
9.4 Micro factors ..................................................................................................................................... 73
9.5 Assessment ........................................................................................................................................ 74
10. Conclusion ............................................................................................................................................. 75

5 Destination Netherlands: The Evolution of Migration from six origin countries to the Netherlands
1. Introduction This paper has been written for the research project ‘Theorizing the Evolution of European Migration Systems (THEMIS).1 The leading research question of this project is: ‘Under what conditions do initial moves by pioneer migrants to Europe result in rapidly expanding network migration and the formation of migration systems, and under which conditions does this not happen?’ In this exploratory paper we present six background (‘scoping’) studies of six migrant groups in the Netherlands. These six migrant groups have been selected by the THEMIS research team to uncover and explain different stages of migration: ‘starting’, ‘stagnating’, ‘establishing’, ‘declining’ and ‘expanding’ (see De Haas 2010). On the basis of these scoping studies three countries will be selected for subsequent research.
These six migrant groups mirror the increasing diversity of migration to the Netherlands (Engbersen et al. 2007). These groups come from different continents (Europe, Africa, Latin America, and Asia) and represent different stages of migration to and incorporation into Dutch society: Morocco (declining), Brazil (expanding), Egypt (established and declining), Ukraine (starting), Bangladesh (stagnating) and India (established and starting). These migrant groups represent also, to a certain degree, the classical patterns of migration (family migration, (temporary) labour migration, asylum migration) and also patterns of regular and irregular migration. Some of the migrant groups belong to the largest ethnic groups in the Netherlands and are well registered in the population statistics (e.g. Morocco), while others are very small and hardly registered (e.g. Ukraine).
In this paper we discuss the six migrant groups in terms of the theoretical framework of THEMIS. Therefore, we pay in particular attention to the role of pioneers, migration networks, and the way in which migration corridors are functioning. A migration corridor is, according to Carling (2010), “the hypothetical connection between two places, through which people may or may not migrate.” Moreover, we pay attention to the macro- meso- and micro factors that influence the patterns of migration. These factors derived from migration system theory should help us to understand divergent stages and patterns of migration.
The outline of our paper is as follows. Firstly, we give a short introduction to the history of immigration to the Netherlands. Secondly, we discuss the major policy developments in four policy domains of immigration. Finally, we present the scoping studies. The presentation order of the scoping studies is based on the principle of size, those groups that are the largest migrant groups in the Netherlands are analyzed first.
2. A short history of immigration to the Netherlands After the Second World War, the Netherlands was a country of emigration. Officially encouraged by the state-sponsored emigration policy of the Dutch government, many Dutch citizens emigrated to typical immigration countries such as Australia, Canada, and New Zealand, and to a lesser extent to Brazil and 1 THEMIS is financed by NORFACE (New Opportunities for Research Funding Agency Co-operation in Europe). NORFACE is a partnership between fourteen research councils to increase co-operation in research and research policy in Europe. NORFACE has funded twelve projects in its research programme on "Migration in Europe - Social, Economic, Cultural and Policy Dynamics".

6 Destination Netherlands: The Evolution of Migration from six origin countries to the Netherlands
South Africa. Between 1946 and 1969, nearly half a million Dutch citizens left the Netherlands. After Indonesia’s independence in 1949, the Netherlands experienced a massive influx of repatriates from the former Dutch East Indies (now Indonesia). In 2009, more than 380,000 first- and second-generation migrants2 with an Indonesian background live in the Netherlands.
A new migration pattern occurred in the early 1960s with the arrival of the so-called guest workers from the Mediterranean. As the term guest worker implies, these labour migrants were expected to stay in the Netherlands temporarily and to return to their countries of origin once they had done their jobs. Initially, in the early 1960s, Spain, Italy, and Portugal were the main sending countries of guest workers to the Netherlands. Later, many guest workers from Turkey and Morocco arrived. The formal recruitment of guest workers ended with the oil crisis of 1973. Although some guest worker groups returned to their home countries (for instance, contrary to Germany which has also experienced guest workers, the Netherlands does not have large Italian or Spanish communities), many others decided to stay, particularly Turkish and Moroccan guest workers. Migration from both countries continued after the stop of guest worker recruitment. They came individually (partly illegal) or through formal family reunification. Later, many Turkish and Moroccan youths brought spouses from their countries of origin. This led to an extensive marriage migration (also called migration for “family formation”). In 2009, there were almost 380,000 first and second-generation migrants from Turkey in the Netherlands (195,000 born in Turkey, 183,000 born in the Netherlands with at least one Turkish parent). In the same year, there were 340,000 first and second-generation migrants from Morocco in the Netherlands (167,000 born in Morocco, 176,000 born in the Netherlands with at least one parent born in Morocco). The idea that guest workers and their families would stay only temporary in the Netherlands, dominated official Dutch thinking on immigration and immigrant integration for many years (Van Amersfoort 1982; Muus 2004), appeared to be a myth.
A third wave of massive immigration to the Netherlands occurred after the independence of Surinam, a former Dutch colony in the Caribbean, in 1975. In the years following the independence of Surinam, almost 300,000 Surinamese persons – almost one third of the total population of the country – migrated to the Netherlands. In 2009, the Surinamese population in the Netherlands consisted of almost 340,000 persons (185,000 born in Surinam, 154,000 born in the Netherlands with at least one Surinamese parent). In the late 1980s, another wave of postcolonial migration started; the arrival of residents of the Dutch Antilles. As the Dutch Antilles are still part of the Netherlands, Antilleans are Dutch nationals and have free access to the Netherlands. In 2009, there were about 135,000 Antilleans living in the Netherlands (80,000 born in the Antilles, the others born in the Netherlands with at least one parent born in the Dutch Antilles).
A fourth major wave of immigration to the Netherlands was the arrival of asylum seekers. Up to the late 1980s, relatively few asylum seekers arrived in the Netherlands, but this changed in the early 1990s – particularly because of the wars in former Yugoslavia (1992-1995). In the period 1990-2001, the
2 First generation migrants (Dutch: ‘allochtonen’) are people born abroad with at least one parent born abroad. Second generation migrants are born in the Netherlands and have at least one parent born abroad. Often a distinction is made between people of western and non-western descent.

7 Destination Netherlands: The Evolution of Migration from six origin countries to the Netherlands
numbers of asylum seekers – with all fluctuations – increased strongly. In the years 1991-1992, about 21,000 individuals applied for asylum in the Netherlands annually. This number increased to about 43,000 annually in the years 1999-2000. After that, the number of asylum requests decreased steeply to ‘only’ 11,000 per year in the years 2003-2004. The main reason for the steep decline of the number of asylum seekers was the introduction of a new Aliens Act in 2001, which introduced stricter procedures for asylum seekers. Of course not all asylum requests were granted. In the early 1990s, almost half of all the requests were approved (particularly for refugees from former Yugoslavia). Later the approval rate of asylum requests decreased to a level of 10-12 per percent in the years after the introduction of the new Aliens Act (all figures from Engbersen et al. 2007). However, not all rejected asylum seekers left the country. It is estimated that about 20 percent of all rejected people remained in the Netherlands (De Boom et al. 2006; Engbersen et al. 2007). Over the years, most asylum seekers arrived from former Yugoslavia, the former Soviet Union, Turkey, Afghanistan, Iraq, Iran, Sri Lanka, Angola, Somalia, and Sierra Leone.
Although not really an immigration wave, a fifth type of immigration to the Netherlands consists of the continuous influx of immigrants in the Netherlands from other Western countries (including other EU-countries). The total number of foreign-born residents from Western countries in the Netherlands increased from 440,000 in the early 1970s to almost 600,000 in the period 2005-2009. More than half of these immigrants from other Western countries came from other EU-countries. The number of immigrants from the other EU-countries increased strongly in recent years, particularly after the EU enlargements of 2004 and 2007. However, Germany is still the most important EU-country sending migrants to the Netherlands. Ever since the early 1990s, at least 100,000 individuals born in Germany (with at least one German parent) reside in the Netherlands.
The influx of immigration to the Netherlands shows a gradual decline of immigration since the early 2000s, after the introduction of the new Aliens Act in 2001. However, in most recent years (2007-2008) there is again a steep increase of immigration to the country. Between 2007 and 2008, the number of immigrants was higher than in the late 1990s, when immigration to the Netherlands was at its peak and the Aliens Act was introduced. There are several reasons for this sudden increase of immigration flows. Firstly, there is a sharp increase of immigration from other EU-countries, particularly after Poland, Bulgaria, and Romania joined the EU in 2004 and 2007. In the period 2007-2008, about 20 thousand immigrants per year from these three countries settled in the Netherlands – almost – almost one sixth of the total immigration in these years. Another important factor is the regularization of more than 20,000 previously rejected asylum seekers in 2007. In that year, asylum seekers whose asylum request was rejected, but who nevertheless had managed to stay in the Netherlands illegally, received a residence permit. Thirdly, the re-entry to the Netherlands of Dutch emigrants has also increased in recent years, for reasons not yet known.
In general, the figures presented thus far show three crucial developments in the immigration to the Netherlands (Snel et al. 2000; Engbersen et al. 2007). Firstly, there is an ongoing diversity of migration flows to the Netherlands. In the early 1970s, three quarters of all foreign-born residents in the Netherlands came from a limited number of other Western countries. Nowadays, two thirds of all foreign-born residents arrived from various non-Western countries. But also within the category of non-

8 Destination Netherlands: The Evolution of Migration from six origin countries to the Netherlands
Western immigrants, there is a growing diversity. In the early 1970s, the majority of all non-Western immigrants came only from four non-Western countries, namely Turkey, Morocco, Surinam, and the Dutch Antilles, which have traditionally been the main sending countries to the Netherlands (Engbersen et al. 2007). Recently, (2007-2008), the share of these four countries in the total non-Western immigration to the Netherlands fell to only 25 percent. Between 2007 and 2008, immigration from countries such as Iraq, India, Somalia and China increased, whereas immigration from Turkey, Morocco, Surinam, and the Dutch Antilles decreased. All of this makes clear that the trend of ‘super-diversity’, as Vertovec (2007) showed for the UK, also applies to the Netherlands (see as an illustration appendix 1: the Dutch population by origin 1996-2010).
This relates to a second crucial trend in the immigration flows to the Netherlands, namely a ‘new geography’ of migration. There is an increase of long-distance migration to the Netherlands, from a growing number of countries. In addition, the traditional South-North migration is complemented by migration flows from east to west. A third general trend in contemporary migration patterns relates to new ‘types’ of migrants arriving in the Netherlands. The traditional labour migrants, family migrants, and immigrants from former colonies and their offspring, all of whom generally had strong residence statuses, have increasingly become supplemented with new categories of immigrants with weaker residence statuses such as asylum seekers, temporary labour migrants (mainly from new EU-member states in Central and Eastern Europe), and irregular migrants (Engbersen et al. 2007 and Engbersen et al. 2010). At the same time, the dividing lines between asylum seekers, commuting labour migrants, and irregular immigrants are sometimes diffuse.
3. Shifting paradigms in Dutch immigration and integration policies For decades, the Netherlands was a “reluctant country of immigration” (Cornelius et al. 1994). Although the Netherlands had a positive migration surplus since the early 1960s, successive governments denied officially that the Netherlands was a country of immigration. The official policy considered immigration as a temporary phenomenon to the Netherlands. Only in 1998 did the Dutch government officially acknowledge the “(…) unmistakable fact that the Netherlands has become an immigration country”.3
But ironically, although it was simply meant as a statement of fact, it led to heated debates in the Dutch parliament, where several political parties opposed the idea of mass immigration to the Netherlands. The terrorist attacks on New York and Washington in 2001, and the rise of populist Dutch politicians like Pim Fortuyn (who was assassinated in 2002), Ayaan Hirsi Ali and more recently Geert Wilders, contributed to the deepening of the resistance in the Dutch public opinion and political debate against immigration and multiculturalism. “The Netherlands is full” and “multiculturalism has failed” have become common slogans. Since 2002, for the first time in Dutch political history, issues of immigration and immigrant integration play a dominant role in local and national elections and in the Dutch political debate.
3 Nota Kansen krijgen, kansen nemen (Getting Chances, Taking Chances) cited in Dutch SOPEMI-report 2003

9 Destination Netherlands: The Evolution of Migration from six origin countries to the Netherlands
Migration and integration policies in the Netherlands have changed severely over the past forty years. Three phases can be distinguished in Dutch immigrant incorporation policies or what is now called ‘integration policies’ (Engbersen 2003). In each phase different aspects of ‘integration’ were emphasized. In the first phase (1970s-1980s), the emphasis was on self-organization and the cultural dimension of integration (cf. the arrangements for education in the minorities’ own languages). This multicultural emphasis was in line with the Dutch tradition of ‘pillarization’ (i.e. compartmentalization along socio-political lines). There were special arrangements for immigrants, financed by the state, such as Muslim and Hindu schools, and broadcasting and political consultation facilities for migrant communities. The immigrant incorporation policy aimed at ‘mutual adaptation in a multicultural society with equal opportunities for Dutch people and ethnic minorities’ (WRR 1979). The central idea of ‘integration while preserving ethnic identity’ became criticized in the 1990s because it might contribute to the unemployed and segregated position of many first and second generation immigrants from guest workers countries like Morocco and Turkey. In the 1990s, the emphasis was more on reducing unemployment and welfare dependency, particularly through improving labour market participation. Integration was interpreted as ‘equal participation in the major social institutions’ (WRR 1989). However, multicultural policies were still important, on the national as well as on the local level.
The millennium change brought another change in the nature and idiom of integration policies (third phase). Now, active citizenship with a strong emphasis on the social obligations of citizenship and individual responsibility of citizens became the main goal. More attention is paid now to the moral dimension of integration. Integration policies became not only strongly related to issues such as shared norms about the rule of law and the obligation to learn the Dutch language and know something about Dutch culture, but also to social problems of public order and crime. Particularly after the 2002 elections, which were marked by the rise and death of Pim Fortuyn, integration policies became more assimilistic, while immigration policies become more selective (De Boom et al. 2011). The Netherlands wants to attract more highly skilled to strengthen the Dutch economy.
In the following section we shall describe the main changes to the Dutch immigration policies since the early 2000s with regard to asylum migration, labour migration, marital migration, and irregular migration. These changes in immigration polices are strongly related to changes in integration policies.
3.1 Asylum migration A foreign national will be granted a residence permit for asylum in the Netherlands if:
• the alien is refugee as defined in the 1951 Convention (and the 1967 New York Protocol);
• there is a real risk of being subjected to torture or to inhuman or degrading treatment or punishment (Article 3, ECHR, CAT);
• he cannot, for pressing reasons of a humanitarian nature connected with the reasons for his departure from the country of origin, reasonably be expected, in the opinion of the Minister, to return to his country of origin;

10 Destination Netherlands: The Evolution of Migration from six origin countries to the Netherlands
• the return to the country of origin would, in the opinion of our Minister, constitute an exceptional hardship in connection with the overall situation there, or;
• the alien is considered for family reunification.
As in other Western countries, asylum policy continues to be a thorny political issue. In the Netherlands following the large influx of asylum seekers in the 1990s, the Dutch State adopted a new Aliens Act (2000). Its primary purpose is the formulation of a more efficient asylum policy. A crucial problem of the pre-2000 Dutch asylum policy was its lengthy procedure. It often took years before a final decision on an asylum request was made, especially if asylum seekers appealed against a negative decision of the immigration authorities (Dutch acronym: IND) or continued the procedure in an effort to obtain a better status. The Aliens Act 2000 aimed to shorten the asylum procedures in three ways.
First of all, measurements were taken to simplify and accelerate the asylum procedure. After a 48 hours-assessment asylum seekers will be informed on a direct rejection of the request. Furthermore, the possibility to lodge an application for review was abolished. Instead, the alien can now present his View to an Intended Decision. The purpose for this was to make the first instance decision more meticulous. After this decision, the alien can lodge an appeal at the Court. A possibility for further appeal at the Council of State was introduced. In short, efforts are made to have a decision on the asylum demand within 6 months.
Secondly, and most importantly, the Netherlands introduced a single asylum status. Prior to the Aliens Act 2000, the Netherlands had various asylum statuses with different rights and privileges depending on the grounds for asylum. As of April 1st, 2001, every asylum-seeker whose asylum request is approved receives the same temporary residence permit, regardless of the grounds for asylum. Each asylum-seeker who is admitted first receives a temporary residence permit for a maximum of five years. After a period of five years the permit can be converted into a permanent residence permit. Uniform rights and facilities are attached to this single status. All asylum migrants who have been admitted to the Netherlands (status holders) have the same rights. During the procedure, asylum seekers have only a limited right to engage in paid employment and have no access to the Dutch national assistance system. The basic principle is that asylum seekers remain outside Dutch formal social and economic society. If they were actively participating in Dutch society, it would only make it harder for them to leave again. However, since February 13, 2008 the employment opportunities for asylum applicants have been expanded from 12 weeks a year to 24 weeks a year. Asylum applicants whose procedure runs for a shorter period than 6 months are still not allowed to work. Asylum seekers who have finalized their legal proceedings are themselves responsible for their return to their country of origin. More on this topic in §3.5.
Between 2002 en 2005 several studies were carried out by the Research and Documentation Centre (WODC) of the Ministry of Justice and a number of other organisations to evaluate the new asylum procedure brought in by the Aliens Act 2000. One of the main conclusions was that, during the research period, the statutory periods of the asylum procedure were regularly exceeded. In other words, the new Aliens Act did not quite succeed in reducing the time it takes to complete the asylum process, which was one of the main aims of the new Act. To perform a quick settlement of the old Aliens Act, the Government decided on a special arrangement by which a residence permit was granted on civil-official

11 Destination Netherlands: The Evolution of Migration from six origin countries to the Netherlands
grounds. Asylum seekers, who met five objective requirements, received a residence permit. For example, the first asylum request must have applied before April 2001 and there should be no indications of a criminal history or war crimes. This regulation is generally known as the somewhat confusing term of ‘General pardon’. More than 20,000 asylum seekers obtained a residence permit this way (Van Meeteren 2010).
3.2 Labour migration The Dutch government prefers stimulating labour market participation of women and older employees to inviting foreign workers to the Netherlands. In the perception of the Dutch government, labour migration is only desirable for vacancies for which there are no Dutch job seekers or job seekers from other EU-countries available. An exception is made for highly skilled workers. The Dutch policy on highly skilled workers will be discussed later on in this paragraph.
The Aliens Employment Act (Dutch: Wet Arbeid Vreemdelingen, WAV) regulates the temporary work permit (Dutch: Tewerkstellingsvergunning, TWV) for the employer and employee. Before allowing an employer to recruit abroad, the UWV Werkbedrijf4 assesses whether jobseekers from the priority workforce are available. In many cases, not only a TWV is needed, but also a residence permit. To simplify the procedure, the cabinet proposed the implementation of one office for both permits, which has been open since October 2008.
Labour migrants must obtain a temporary residence permit to stay for work before leaving their home country. Once in the Netherlands, this will be changed in a permit to stay for the time of the labour contract. Work permits are issued for a maximum period of three years. A temporary work permit can become permanent. After three years, the foreign worker becomes eligible for a residence permit stating ‘no restrictions on work’. Around ten percent of all work permits are issued for three years and could lead to permanent residence.
Because the procedure of a so called provisional residence permit (Dutch: Machtiging tot Voorlopig Verblijf, MVV) is relatively time-consuming, bigger companies have the possibility to close on an agreement with the IND. The ambition is to end the procedure within two weeks, under certain conditions. The Netherlands try to block access to the formal labour market by heavy sanctions on employing illegal immigrants and by a protective ring of bureaucratic requirements.
3.2.1 Highly skilled migrants
Starting in October 2004, the Dutch government has relaxed the admission rules for highly-skilled migrants coming to the Netherlands. A more liberal entry policy is pursued for certain (highly qualified) labour groups who will get straightforward access to permanent residence because of their positive (financial) contribution to the Dutch economy and society, while at the same time the job and residence
4 On January 1st, 2009 the CWI (Centre for Work and Income) and UWV merged and now listen to the name UWV Werkbedrijf.

12 Destination Netherlands: The Evolution of Migration from six origin countries to the Netherlands
opportunities for low or medium skilled labour migrants are considered on a strictly temporal basis (Engbersen 2003).
Foreign workers are considered highly skilled if they earn a certain amount of income. Differing from other countries, the Netherlands does not use a list of occupations, which are considered to be highly skilled. The general income criterion from January 1st 2009 on is a salary of at least € 49,087 gross. If under 30 years it is € 35,997 and if it concerns a recently graduated student, it is € 25,800 gross (within one year after graduation).
Highly skilled foreign workers receive a residence permit for a period of five years if they are in possession of, or about to be granted, a work contract of unlimited duration. When having a work contract for a limited period, the residence permit will be granted for the duration of the contract, with a maximum of five years. The IND supplies the immigrant the residence permit: a distinctive TWV is not needed. The whole procedure should take two weeks. After five years these labour migrants are eligible to receive a permanent residence permit.
Until 2006, foreign students had limited opportunities to stay and find work in the Netherlands after graduating or receiving a degree. In fact, foreign students from outside the EU were often requested to leave the country directly after completing their studies. On January 1st, 2009, in anticipation of the implementation of the Modern Migration Policy, a new Admission Scheme for Highly Educated Migrants was introduced. Pursuant to this scheme, highly-educated foreign nationals who have attained at least a Master’s degree can obtain a residence permit with a maximum term of 1 year in the Netherlands in order to find a job as a highly-skilled migrant or to start an innovative company.
The foreign national who wants to take advantage of this scheme, will be tested on the basis of a scoring system. The British scoring system of the Highly Skilled Migrant Programme was used as a model for the Dutch scoring system. The foreign national will be tested on education, age, and indicators for succeeding in the Netherlands.
Highly-educated migrants who wish to make use of this scheme will not be assessed as regards their means of existence. Making use of public funds during the 1 year term of the residence permit (the so-called orientation year) may have consequences for this residence permit. If the highly-educated person wishes to bring his family members to the Netherlands as well, the regular requirements regarding family reunification (including sufficient means of existence) will apply.
As soon as the highly-educated person has found a job making him eligible for highly-skilled migrant status, i.e. within a term of at most 1 year, he can convert the one-year residence permit into a residence permit as a highly-skilled migrant. The highly-educated person may also start an innovative company in the Netherlands within the orientation year. If he has succeeded within one year, he may request conversion of the residence permit into a residence permit to work on a self-employed basis. The requirements set in this respect do have to be satisfied.
Finally, to make working in the Netherlands for highly qualified workers more attractive, the spouses, partners and underage children can also apply for a permit at the IND-office. This rule was implemented by December 2007. The partners of foreign workers with specialized skills have been exempted from the obligation to apply for a work permit since March 2005.

13 Destination Netherlands: The Evolution of Migration from six origin countries to the Netherlands
3.3 Family migration Dutch legislation concerning family migration distinguishes between family reunification and family formation. Family reunification is concerned when the relationship between the Dutch and foreign family members already existed while the Dutch family member lived in the country of origin. When the family relationship came into being while one partner resided in the Netherlands this is called ‘family formation’.
In the eyes of the Dutch government, immigration with the intention of family reunification and family formation should be limited. As a result of ongoing marital migration, new, often poorly-educated, immigrants are continually entering Dutch society where they have limited opportunities on the labour market. More generally, family formation is often taken as evidence of poor integration of immigrants into Dutch society.
Already in the Aliens Act of 2000 various measures to limit family migration were taken. In 2004, the regulations for family formation were tightened up. The minimum age for marital migration was set at 21 years, where it had previously been 18 years. The minimum income requirement for marital migration was increased from 100% to 120% of the official minimum subsistence level. The intention of this income requirement was that the Dutch government wished to prevent taxpayer’s money from being used to financially support partners or other family members coming to the Netherlands. The person already resident in the Netherlands – the referee – literally functions as the guarantor for the family and the partner. However, in March 2010 this income requirement was abolished because the European Court judged that it is contrary to the law on family reunification.
With the new Civic Integration Abroad Act (Dutch: Wet Inburgering, WIB) of March 2006, foreign nationals between the ages of 16 and 65 coming to the Netherlands for marriage or family reunification as well as immigrants who wish to reside in the Netherlands as a spiritual leader or religious teacher, must pass a civic integration test prior to entering the Netherlands. In §3.6 more can be read about this. These newcomers need to have acquired basic knowledge of both the Dutch language and Dutch society before they arrive in the Netherlands. This knowledge will be examined through a paid test taken in the Dutch embassy or consulate in the newcomer’s country of origin (or current country of residence) where the migrant applies for a provisional residence permit. As of March 2008, the requirements for passing the exam have been adjusted. The participant will have to answer more questions correctly in order to pass the exam. Only migrants who pass the test are eligible for a provisional residence permit that is necessary to enter the Netherlands. EU nationals and nationals from a specific group of industrialised countries are exempt from this test. Other exceptions are nationals who:
• are under 18 years,
• are nationals of Surinam and can prove that they have undertaken basic education in the Dutch language either in Surinam or the Netherlands,
• come to the Netherlands for a temporary objective, such as study, au pair, exchange, medical treatment,

14 Destination Netherlands: The Evolution of Migration from six origin countries to the Netherlands
• are family members of someone having an asylum-related residence permit,
• have a work permit, are self-employed, or highly qualified migrants.
Family members of an asylum applicant who has been admitted to the Netherlands on the basis of an asylum application may be considered for derivative residence permits. If there are no documents, the foreign national is responsible for demonstrating that there is a family relationship in a different way. One of the possibilities is to have a DNA test conducted.
Since 19 October 2008, the assessing of applications to extend a residence permit for (extended) family reunification is simplified. In the past, the foreign national and/or the person with whom the foreign national would stay had to prove that they had sufficient means of existence. This implied that the foreign national had to submit proof of income. From October 2008 on, it will only be refused if the foreign national or the person with whom this foreign national stays partly or entirely relies on public funds.
In a letter of 2 October 2009, the former Dutch Cabinet presented new measures in the area of family migration and integration in order to ensure that this integration proceeds more effectively. The new Cabinet intends to go along with these measures. The Cabinet presented the following policy intentions:
The Cabinet aims to intensify the monitoring and enforcement of the Aliens Act to combat fraud and abuse in respect of marriage migration, such as sham marriages.
Raising the level of the integration and training requirements. The Cabinet intends to raise the required level of the Spoken Dutch test in this Examination. The examination will also be supplemented by a written test. In addition, the Cabinet will examine whether it is possible to require additional educational efforts from family migrants after their entry in the Netherlands.
Strengthening emancipation and combating forced marriages, marriages between nephews and nieces, and polygamy.
3.4 Irregular migration As pointed out earlier, the IND implements the policies on immigration (Aliens Act) and is able to grant or refuse a residence permit. An immigrant is considered illegal if he has no right to stay (lawful residence) in accordance with art. 8 of the Aliens Act. That is: if the IND does not grant him an asylum or temporary residence permit and, when the whole procedure is ended, does not leave the country when ordered to.
The number of irregular migrants estimated to reside in the Netherlands in 2005 is at least 120.000 (Van der Heijden et al. 2006). The EU expansion had a large influence on the number of irregular migrants: it was only after the EU expansion in 2004 and 2007 that irregular residence diminished from about 200,000 to about 130,000, mostly because immigrants from the new member States can now come to stay in a legal way. Many irregular migrants come to the Netherlands on tourist visa and overstay these, others cross the border illegally or become illegal when they are refused refugee status (Burgers and Engbersen 1999; Staring 2001; Van Meeteren 2010). There are some figures on the number of expelled

15 Destination Netherlands: The Evolution of Migration from six origin countries to the Netherlands
(asylum) migrants, but it is not clear if for example the asylum seekers who by check of address are not met have actually left the Netherlands (see §3.5).
The regular tourist visa (C-visa) can be attained at the Schengen country of destination and is valid for three months. The visa procedure is more restrictive for persons with specific characteristics (nationality, sex, age) or with ‘weak ties’ to their country of origin (unemployment, family situation). They are expected to have an intention to stay in the country of destination when the visa is expired, or to take up employment. That is why, to obtain a tourist visa, several conditions have to be met – depending on the country of origin. A few examples are:
• A letter proving the goal of the stay (e.g. invitation by family members);
• Bank transcriptions of the past months and proof one has enough money to sustain him or herself during the stay. Also money for the journey elsewhere or back to the home country is required;
• Travel insurance with minimally €30.000 coverage.
When an irregular migrant who came to the Netherlands on a tourist visa wants to obtain access to the legal labour market and an employer is willing to apply for a work permit, the migrant first has to return to his home country until the permits are issued. This comes with large risks: Migrants who overstay their visa and try to return to their home country are regularly being fined, receive a deportation stamp in their passports and are put in to the Schengen Information System (SIS). Once a migrants name enters in SIS, he or she becomes a persona non grata for the Schengen countries with little chance to get a Schengen visa on the same name ever again. Due to this regulation, many illegal labour migrants have become trapped in the Netherlands (Kramer, 2008).
3.4.1 The ‘General Pardon’ of 2007
In recent years, there were lengthy policial debates on the issue of rejected asylum seekers who were still in the country. In 2006 the Association of Dutch municipalities (Dutch: Vereniging van Nederlandse Gemeenten, VNG) and various social organizations asked the Dutch Cabinet to solve the problem by means of a pardon for those asylum seekers who lodged their initial asylum request before April 1st, 2001 and were resident in the Netherlands.
Until 2006 the Dutch Cabinet maintained that a ‘General Pardon’ for this category of asylum seekers was undesirable and that rejected asylum seekers should leave the country. The phrase ‘General pardon’ is cause of somewhat confusion (also in the Netherlands), because after all, it is a pardon for a rather specific category of illegal residing immigrants in the Netherlands.
The new Cabinet after the elections of 2006, contained a majority of proponents of this measure. This Cabinet decided for a regulation which came into effect June 15th, 2007. The ‘General pardon’ gives those foreign nationals in the Netherlands a residence permit if they:
• Submitted their initial application for asylum before 1 April 2001 (before the New Aliens Act of 2000 came into effect);

16 Destination Netherlands: The Evolution of Migration from six origin countries to the Netherlands
• Have resided continuously in the Netherlands since April 1st 2001;
• Are not suspected of war crime;
• Don’t have criminal antecedents in the Netherlands;
• Have not repeatedly given false information about their identity; and
• Stop any pending legal procedures against the Dutch state when accepting residence under this regulation.
Around 28,000 individuals have received a residence permit in the Netherlands as a consequence of the ‘General pardon’. On the other hand, 6000 foreign nationals were refused a residence permit. If an immigrant does not meet the criteria for the ‘General pardon’, he has to return. The return policy will discussed in the next section.
3.4.2 Policy on treatment of illegally residing immigrants
If the immigrant is staying illegally in the Netherlands after all, the Dutch policy is focused on excluding these immigrants from public services, such as welfare, social security and public housing. Illegally residing immigrants will get urgent medical care and all children (within compulsory education-age) have the right to education. Since 1991, the use of social-fiscal numbers – the ‘entry ticket’ to legitimate work - was barred for irregular immigrants. Also, employers are sanctioned heavily if found guilty at employing illegally residing immigrants (Broeders 2009). If an employer employs a foreign national without a work permit, he will receive a penalty of €8,000 for each illegal foreign national. Private persons will receive a penalty of €4,000.
The Labour Inspection (who enforces the Labour Act for Foreign Nationals (Dutch acronym: WAV) performs approximately 10,000 inspections a year with 200 inspectors. These inspections are performed on the basis of a risk analysis and particularly in risk sectors. The percentage of companies that upon inspection are found to have breached the law has fallen considerably during the last few years, from 23% to 17% in 2009.
In a reaction to a publication concerning illegal stay in the Netherlands, the Ministry of Justice presented a new policy on the illegal stay of immigrants on June 20, 2008. Priority is given to illegally residing immigrants committing criminal offences or causing troubles. Policy on these aliens is based on the idea of ‘departure or detention’. If return is not yet possible, all efforts are aimed at putting or keeping them in detention. In 2007, approximately 13% of the total Dutch penitentiary capacity was intended for the detention of irregular immigrants (Van Kalmthout 2007:103). Moreover, aliens for which there is an indication that they have been staying illegally in the Netherlands, will be restricted in their freedom of movement and will be obliged to report to the authorities twice a day.
Detention of aliens will be enforced more often in the case of aliens who have exhausted all legal remedies and repeat their asylum applications without presenting new facts/developments or circumstances. There will also be an increased focus on vulnerable groups of illegally residing immigrants.

17 Destination Netherlands: The Evolution of Migration from six origin countries to the Netherlands
On January 1st, 2008, a pilot project regarding protected reception facilities for Unaccompanied Minor Foreign Nationals (UMFN’s) who had been victim of or who run the risk of becoming victim of human trafficking was launched. The purpose of the pilot is to prevent UMFN’s aged between 13 and 18 years from disappearing and possibly being exploited. The minister of Justice decided to continue this pilot from 2010 on.
On March 27th, 2009, the State Secretary informed the Lower House of Parliament about the intended extension of the powers in the context of aliens supervision. In order to ensure that the police and the Royal Netherlands Marechaussee can perform their tasks in respect of the identification of foreign nationals more efficiently and effectively, the Cabinet deemed it necessary to formulate legislative amendments. One is to create a power to search the house (or a dwelling belonging to a company) without permission from the foreign national for identity documents for the purpose of the identity investigation and the preparations for departure. The Cabinet also proposed an amendment to the Aliens Act to regulate the statutory power with respect to carrying out investigative activities during alien detention. Activities include e.g. ‘reading’ data carriers (digital or otherwise), such as mobile phones. This amendment has not yet came into effect.
3.5 Policies on return Return policies under the revised Aliens Act of 2000 imply faster and shorter procedures. Already at the start of the asylum procedure, asylum seekers will be notified about the possibility that his request might not be accepted and he will have to return. The alien will be informed about the feasibility of his request on asylum within five workdays. After a final decision, the asylum seeker has four weeks to arrange his departure. Rejected asylum seekers are responsible themselves for leaving the country on time. Assistance within voluntary return programmes, by IOM on behalf of the Dutch authorities, is available to all those asylum seekers. For example, if they are not able to pay for the journey themselves. After this period, the official reception will be ended and the authorities may enforce return by expulsion without further issuance of orders. Since January 2007, a special service, called the Service on Return and Departure (Dutch: Dienst Terugkeer en Vertrek, DT&V) fosters these departures.
Twenty-eight days after the alien has been informed that they must leave the country, a check is performed to establish whether this has actually happened. An ‘address check’ at the last known address of the alien is carried out. The alien is considered to be ‘administratively removed’ if they are not encountered at the address and it is assumed that they have departed. In the majority of cases this implies ‘departure with unknown destination’. If the alien is found at the last known address after 28 days and forced return is possible, then the person is taken into custody before being expelled or forced to depart under supervision. In the case of expulsion the alien is taken across the border under supervision and if necessary transported to the country of origin. In case of departure under supervision an alien can leave the country alone, but their travel documents are taken in and only given back at the place where the alien leaves the country.
If forced return is not possible, the alien can be evicted from their home or from reception centres for asylum seekers. In practice it is however possible that rejected asylum seekers end up on the street.

18 Destination Netherlands: The Evolution of Migration from six origin countries to the Netherlands
Without any formal support they have to survive by themselves, sometimes with help from so-called informal social safety nets (organized by, for example, churches or other private organizations).
In contrary to some other European countries, in the Netherlands, illegal residence as such is not an offence. The most important reason for non-penalization is that this can prolong illegal residence. Irregular immigrants may be detained – under specific conditions and with access to remedies and judicial review – and expelled on the basis of the Dutch Aliens Act. For families with children, some special arrangements are made. Thus, in a legal sense this type of detention is an administrative matter and not a penal measure. In enforcement priority is given to detention and expulsion of persons causing public order disturbances or who are involved in crime.
Under the Aliens Act 2000 it has become easier to arrest and detain illegally residing immigrants. On September 30th, 2009 the number of immigrants held in custody because of immigration laws had more than quadrupled since 1994 to 1750. This increase was partly aided by the construction of special repatriation centres at Schiphol and Rotterdam Airport.
In 2009 the Cabinet reported an increased number of migrants that demonstrably departed from the Netherlands following the departure procedure of the DT&V. There was also an observable increase in the number of migrants that had independently departed from the Netherlands with the support of the International Organization for Migration (IOM). The Cabinet committed itself to improve the possibilities to make foreign nationals return with a high priority to the departure of foreign nationals with criminal records.
3.6 Policies on civic integration Since 1998, the Netherlands has a Civic Integration Programme for newly arrived immigrants (‘newcomers’). Immigrants coming to the Netherlands were obliged to fulfill the civic integration obligation by passing an integration exam. The assumption is that by learning the Dutch language and some aspects about Dutch society, immigrants are better prepared to participate in Dutch society in general and the labour market in particular. In 2006 and 2007, the Dutch civic integration policies were drastically changed. The essence of the new measures is that the integration of non-Western immigrants is to be accelerated by making civic integration more compulsory. The changes are twofold. Firstly, the Civic Integration Abroad Act (Dutch Acronym: WIB) that came into effect in March 2006. Secondly, a new Civic Integration Act (Dutch Acronym: WI) that was introduced on January 1st 2007.
3.6.1 Civic Integration Abroad Act
In the terms of the Civic Integration Abroad Act, foreign nationals between the ages of 18 and 65 coming to the Netherlands for non-temporary purposes, such as marriage or family reunification as well as those who want to reside here as a spiritual leader or religious teacher, must pass a civic integration test prior to entering the Netherlands. These newcomers need to have acquired basic knowledge of both the

19 Destination Netherlands: The Evolution of Migration from six origin countries to the Netherlands
Dutch language and Dutch society before they arrive in the Netherlands. This knowledge will be examinated by an exam, taken in the Dutch embassy of consulate in the newcomer’s country of origin (or current country of residence) where the migrant applies for a provisional residence permit (Machtiging tot Voorlopig Verblijf, MVV). Only migrants that pass the test are eligible for a provisional residence permit that is necessary to enter the Netherlands. Exempted form this exam are EU nationals and nationals from a specific group of countries who are not MVV-obligated. As of March 2008, the requirements for passing the exam have been adjusted. The participant will have to answer more questions correctly in order to pass the exam.
3.6.2 The new Civic Integration Act
This new act regulates that civic integration is obligatory for both newcomers and ‘oldcomers’. The latter category is defined as non-Dutch nationals between 18 and 65 years old living in the Netherlands, who did not live in the country during the time span for compulsory education (in the Netherlands from 4 to 16 years) for at least eight years. Non-Dutch nationals that do not fulfill this requirement and do not have a certificate showing they have sufficient command of the Dutch language, have to fulfill their integration obligation by passing a civic integration test within three and a half or five years. This exam replaced the requirement of obligated participating in a civic integration program. A passed integration exam is a condition for naturalization.
The minimum level for writing and speaking for newcomers and ‘oldcomers’ are based on the Common European Framework of Reference for Languages (CEF). The introduction of the compulsory civic integration exam enables local authorities responsible for the implementation of civic integration to enforce sanctions (e.g. an administrative fine) when participants fail to pass the test.
Another major change in the Dutch system of civic integration is that individual participants themselves are in principle responsible for their own civic integration trajectories. Municipalities can play a role in informing participants about existing integration courses offered by education institutes or private suppliers of language and other courses. Participants can decide what course they will take if they follow a course of their own choice. The only obligation is that participants fulfil their obligation within the fixed period. Participants have to finance their own civic integration course, although they are eligible for a loan covering the costs.
The execution of the Civic Integration Act showed major difficulties. Therefore, the act was revised in 2007 under the Civic Integration Delta Plan. The participant now pays a personal contribution of €270, to stress the ‘own responsibility’ to integrate. In 2008, the Minister of Housing, Communities and Integration notified the House of Representatives that these efforts had not yet received the desired result, particularly in the four large cities of Amsterdam, Rotterdam, The Hague and Utrecht where approximately 50% of the foreign nationals who are obliged to participate in civic integration programmes live. For this reason the Minister announced additional measures and the Act was amended to such an extent that the foreign nationals who were obliged to participate in civic integration programmes could be forced to accept the civic integration facility offered by the municipality. A municipality is not permitted to impose a maximum fine of €500 if the foreign national –

20 Destination Netherlands: The Evolution of Migration from six origin countries to the Netherlands
imputably – fails to do this within the stipulated period of four weeks. The Civic Integration examination is a condition for granting a permanent residence permit.
3.7 Policies on citizenship
The last decade, (laws on) nationality and citizenship were topic of lengthy debates in the Netherlands. The Law of the realm on Dutch Citizenship (Dutch: Rijkswet op het Nederlanderschap, RWN) regulates the subject of Dutch nationality. This law regulates the subject of Dutch nationality. Becoming Dutch is possible through two procedures: the naturalization regulation and the option regulation. To obtain Dutch citizenship through naturalization foreign nationals have to meet the following conditions:
• You are of age;
• You have lived in the Netherlands, the Dutch Antilles or Aruba for an uninterrupted period of five years with a valid residence permit on time;
• You are sufficiently integrated in Dutch society and are able to read, write, speak and understand Dutch. You must prove this by passing a civic integration exam;
• In the last four years you have not been given any custodial sentence, training order, community service order of high monetary penalty;
• You are prepared to give up your current nationality. If you do not give up your current nationality, if asked, your Dutch nationality may be revoked;
• You have a residence permit for a non-temporary objective, such as family reunification.
Becoming Dutch via the naturalization procedure will take 6 months up to a year. The ‘option regulation’ takes up to three months. If someone belongs to one of eight categories, he may ‘opt’ for Dutch nationality. The idea is that these non-Dutch nationals are already at home in the country and they do not have to pass an integration exam. It is not compulsory to abandon his other nationality. The municipality of residence decides whether or not someone is eligible for the option regulation.
As of 2006, candidates will officially receive the Dutch nationality if they are present at a so-called obliged ‘naturalization ceremony’. With this ceremony the Dutch government wants to emphasize the importance of obtaining Dutch citizenship. The aim is to strengthen the immigrants’ link and loyalty to Dutch society. The naturalization day is on December 15th, Kingdom day.
A ‘Statement of Allegiance’ (Dutch: Verklaring van Verbondenheid) is since 1 March 2009 the final act of this ceremony. Anyone who wants to be considered for the acquisition of Dutch citizenship must declare himself or herself willing to make a Statement of Allegiance. By making this Statement, he or she states to respect the freedoms and rights attached to Dutch citizenship. Other adjustments from 2009 onwards are, firstly, the possibility to withdraw the Dutch citizenship because of causing severe damage to the essential interests of the Dutch Kingdom. Spying, for example, is one of these severe damages, as mentioned in the European Nationality pact. Secondly, minor children who are acknowledged by a

21 Destination Netherlands: The Evolution of Migration from six origin countries to the Netherlands
Dutch citizen after birth and who are younger than 7 years of age will acquire Dutch citizenship immediately, just as this was the case prior to April 1st 2003. The same applies to minor children who are legitimized by a Dutch citizen without acknowledgement. On May 1st 2009, the requirement regarding the submission of documents establishing nationality and identity was tightened.
The subject of double nationality became of sudden importance in 2007 when two candidate-members of the Government had, and still have a double nationality. Starting point of Dutch law is to limit plural nationalities, because a single nationality enhances a clear legal status, which is defined by the nationality of that person. In principle, one has to abandon his original nationality, but there are some exceptions to this rule. Some countries, for example Morocco, do not allow citizens to abandon the Moroccan nationality.
4. Morocco
4.1 Theoretical framework of Themis 4.1.1 Themis theoretical Framework
The migration flows from Morocco to the Netherlands are currently declining. As we can see in fig. 1 depictured below the population of first generation Moroccans in the Netherlands seems stable. If we take a closer look however, the immigration numbers have been on the decline for several years now.
Figure 1: Size population of first generation Moroccans in the Netherlands, 100=2009, 100=166,774 (Netherlands Statistics 2010)
Currently, the second generation is outnumbering the first generation, causing growth of the population of Moroccan origin despite of declining immigration rates.
Fig. 2 depicts the migration flows that move back and forth in the Dutch-Moroccan corridor. In this figure, it becomes clear that the Dutch-Moroccan migration is on the decline. From 1998 onwards, we see a general decline of Moroccan immigration to the Netherlands. Due to harshening Dutch immigration policies, immigration is likely to continue to decline in the future.

22 Destination Netherlands: The Evolution of Migration from six origin countries to the Netherlands
Figure 2: Immigration and emigration to and from the Netherlands of Moroccan born residents (Netherlands Statistics, 2010)
4.1.2 Types of migration and motives
Ever since the 1960s, the Netherlands (and other countries in Western Europe) have had a large amount of Moroccan labour migrants settling. The first Moroccan labour migrants came to the Netherlands in 1961; they did not come to the Netherlands directly but travelled through other European countries. In 1969 a treaty was signed by Morocco and the Netherlands to regulate the recruitment of labour migrants. Special agencies were set up to manage labour migration. Nowadays, it is clear that most labour migrants did not come through official channels. Mostly they were helped by family members, for example in France and Belgium (Fokkema & Harmsen 2009: 1). These workers were so-called guest workers because it was believed that after working in the Netherlands for a certain time, they would return to their home country. Many guest workers stayed in the Netherlands and the fundaments of a large Moroccan ‘community’ were laid. Until 1973 the number of Moroccan labour migrants in the Netherlands grew but the oil crisis changed the situation.
In 1974 an immigration stop came into force. This did not stop migration; on the contrary, the large exodus of Moroccan migrants only started at that time (Obdeijn, De Mas, Hermans 2002: 216). Whereas beforehand migration was labour-related, it now became family related. In the Netherlands a distinction is made between two kinds of family-related migration; family unification and family formation. Family unification means that the man (in theory it can of course also be a woman) initiated the unification of the family in the Netherlands. Regarding the average size of a Moroccan family, this meant that families of on average 5 or 6 persons could come to the Netherlands (Obdeijn et al. 2002: 211). Family formation meant that a future spouse came to the Netherlands to form a family here. Towards the end of the 70’s and the beginning of the 80’s many labour migrants decided to move their family to the Netherlands (Fokkema & Harmsen 2009: 2). Since the second half of the 80s, family formation has slowly but surely replaced family reunification. Due to this, Moroccan ‘community’ in the Netherlands grew mainly because of births (Obdeijn et al. 2002:216). The past years, 2/3 of Moroccan migrants motivated their migration by family formation whereas only 1/4 had family unification as their motive (Fokkema & Harmsen 2009: 2).

23 Destination Netherlands: The Evolution of Migration from six origin countries to the Netherlands
In the following graph the motives for migration are depicted from 1995-2007. It becomes clear how immigration from Morocco has declined. One could also see the great role that family related motives take up and have taken up in the past.
Figure 3: Immigration from Morocco divided by migration motives (Netherlands Statistics 2010)
4.1.3 Relevant statistical information
After 1973 migration feminised because labour migration was no longer necessary. In the following graph we see that the older first generation Moroccan men outnumber the women. However, in the age groups 20-30 and 30-40 we see a growth of the first generation Moroccan females.
Figure 4: Gender and age distribution of first generation Moroccans in the Netherlands in 2009 (Netherlands Statistics, 2010)
The number of irregular Moroccans in the Netherlands is hard to grasp. An estimate from 2002 ranges between 11,900 and 23,800 people (Hoogteijling 2002 in Van Praag 2006:6) Obdeijn estimates that the number of irregular Moroccan migrants is 10% of the official number (Obdeijn et al. 2002:216) which would give a population of about 16,000 people. According to an informant, there are less irregular

24 Destination Netherlands: The Evolution of Migration from six origin countries to the Netherlands
migrants from Morocco in the Netherlands than before (see also Van Meeteren et al. 2008; Van Meeteren 2010).
4.2 Macro factors 4.2.1 Political and economic shifts
There are a few economic and political developments that have influenced migration in the Dutch-Moroccan migration corridor.
In the 1960s the Moroccan state openly encouraged migration from certain regions in Morocco. Most of these regions were Berber-speaking and mountainous or semi-desert (De Haas 2007:9). In 1971 and 1972, after two failed coups d’état against King Hassan II, Morocco entered into a period of increasing political instability and repression. Furthermore, Morocco suffered even more from the high oil prices and the global economic downturn than European countries. This combination of factors explains why many migrants decided to stay in Europe or leave Morocco (De Haas 2009:3). In the years that followed the Moroccan state tried to control its citizens abroad. Through a network of control and spying networks consisting of Moroccan embassies, consulates, mosques and government-controlled migrant organisations such as the Fédération des Amicales des Marocains all across north-western Europe (Belguendouz 2006, Van Heelsum 2002 in De Haas 2007:17).
In 1989 the tendency changed from controlling migrants to ‘courting’ the Moroccan diaspora. Instead of discouraging naturalisation of its nationals abroad double citizenship was now encouraged. Besides that, integration in the receiving society is no longer seen as endangering the link with Morocco. Integration is now seen as favouring the sending of remittances and investment. Lastly, migrants are no longer seen as a political threat but more as a political tool (De Haas 2007:22). ‘Opération Transit’ is an example that illustrates the changed attitude towards migrants. This operation facilitates the summer holidays of Moroccan migrants and their descendants to Morocco. In 1995 migrants have been allowed to open foreign exchange banking accounts with Moroccan banks (Fellat 1996:316 in De Haas 2007:29). This facilitated migrants in sending their remittances to Morocco.
In 1969, the Netherlands signed a contract with the Moroccan state about labour recruitment. In 1974 the Dutch immigration policy changed drastically. During the oil crisis in 1974 an immigration stop came into force. The labour migrants where no longer demanded in the Netherlands. This did not lead to a stop of immigration but rather to a change. After 1974 labour migration changed into family related migration. In 2000 the Aliens Act came into force regulating migration for family related reasons. The person wishing to reunite (and form) a family needed to have a stable income 120% of the minimum wage. In 2010 this was conflicting with the European rights concerning family reunion. Hereafter, the demand of the 120% minimum wage was cancelled but replaced with a 21 year age limit to be able to form or reunite a family from abroad (Europa Decentraal 2010). Lastly, the immigration and integration policies called inburgering largely influenced immigration and requirements to obtain tourist visa are nowadays very difficult to meet because of a strong suspicion for irregular migration.

25 Destination Netherlands: The Evolution of Migration from six origin countries to the Netherlands
4.3 Meso factors 4.3.1 Transnational activities
Since there is a large number of Moroccans and people of Moroccan descent present in the Netherlands, there is also a rather large number of associations and foundations for and by Moroccans. Van Heelsum provides an overview of all organisations (2001). The focus of these organisations on life in the Netherlands could be an indication for the degree of settlement of Moroccans here.
Many businesses have been established to provide services to Moroccan migrants and their descendants. The industry of companies focussing on means of communication and travelling for Moroccans is well developed. People also tend to use Skype. Many people also go to a belhuis, a shop where one goes to call abroad. Rotterdam and Amsterdam have many of these establishments run by and for Moroccans (Gemeente Rotterdam 2005; Gemeente Amsterdam 2003).
The airline industry also serves the migrant population. Travelling to Morocco has become cheaper than before. An informant explains that nowadays, people tend to take planes throughout the year instead of driving to Morocco during the summer holidays. Examples of airlines flying to Morocco are Elite, Amsterdam Airlines and Royal Air Maroc but there are many more. Many companies have direct flights to cities in the North of Morocco. There are also companies that only sell plane tickets for destinations in Morocco; they function as a link between the traveller and the airline. Besides companies that deliver communication and transport services to Moroccans in the Netherlands, there are also many other businesses like Halal butchers and grocery stores. The wide array of transportation and communication possibilities encourages and allows for more transnational activities.
Remittances and investments of Moroccans abroad also constitute a transnational activity. In 2003, Morocco was the 4th largest remittance receiver in the world receiving $3,6 billion (De Haas 2005). Exact numbers about the amount of remittances are unknown but in 2002 migrants from different European countries among which the Netherlands, remitted on average €1000 per year. This includes children and the inactive population so the amount will be higher per remitting migrant. Remittances in kind (or via informal channels) are harder to monitor but estimates range from 25 to 50% of money transfers (De Haas 2009:1575). It is estimated that in 2004 an amount of 93-124 million euros was remitted through the Netherlands-Morocco corridor. This number, a best guess, is based on information from both the sending and the receiving end (Barendse et al 2006:34). Remittances are often cash carried or sent by money transfer organisations. ‘The Moroccan government has adopted a positive attitude toward the integration of Moroccans abroad, which is now seen as an instrument for attracting remittances’ (De Haas & Plug 2006:610). Remittances constitute by far the largest investments in Morocco, compared to official development assistance and foreign direct investments (De Haas & Plug 2006:611). The volume of remittances sent to Morocco is on the rise and a moderate growth is expected in the future (Barendse et al. 2006:38).
To conclude, migration networks functioning in the Dutch-Moroccan corridor used to work on the basis of work and family. Dutch companies would need more workers and the workers present would ask a family member. Brothers, nephews, uncles travelled to the Netherlands to find work and they were helped by family members or friends who already lived in the Netherlands. After the stop on labour immigration, family related reasons were almost the only reason to enter and reside in the Netherlands

26 Destination Netherlands: The Evolution of Migration from six origin countries to the Netherlands
legally. Moroccans in the Netherlands would usually marry a partner from the same region in Morocco (Esveldt, Kuli-Glasgow, Schoorl & van Solinge 1995). Family and friendship relations were very important in this respect. The functioning of networks like these has formed the Moroccan ‘community’ in the Netherlands into what it is today. An industry focuses on Dutch Moroccans and their descendants and the Moroccan organisations often focus on life in the Netherlands. This shows how the population has matured.
4.4 Micro factors 4.4.1 First migrants
As mentioned before, the first migrants who came to the Netherlands were labour migrants. Oficially, the first Moroccan came to the Netherlands in 1961 and this number grew until 1973. Of the migrants who came, the educational level is fairly low. 70% did not have any primary education. There is no real intellectual framework concerning the Moroccans in the Netherlands, unlike in France where the Moroccan migrant population is more varied (Obdeijn et al 2002: 211). Low skilled and often illiterate labour migrants were selected. Illiterate migrants were recruited because they would be less likely to join unions in the Netherlands. After pioneer migrants came to the Netherlands, this brought about chain migration. After a person left a family or village, others were likely to follow a comparable path (Obdeijn et al. 2002: 211).
Besides migrants from the Rif there was also a (much smaller) number of migrants from the cities like Casablanca, Rabat, Fes and Meknes. These migrants differed from the Rif migrants because they spoke Arabic. Their migration motives seem to have been labour related as well.
4.4.2 Where from
In this part we will describe the different sending regions of the Morroccan Dutch corridor. Most Moroccan migrants in the Netherlands are originally from the Rif Mountains in the North. Dutch recruitment agencies were directed towards this region where the population density was high in comparison to the available agricultural resources (Obdeijn et al. 2002:214). Besides that, this region was also known for its political turmoil (Obdeijn et al. 2002:211), so emigration from this region was advantageous for the Moroccan government at the time. 70% of Dutch Moroccans descents from this region (Obdeijn et al. 2002: 214) and some even mention a larger percentage (Cottaar, Bouras & Laouikili 2009:33). 55% of the first generation Moroccans now living in the Netherlands was born in the provinces of Al Hoceima, Taourit and Nador (Fokkema & Harmsen 2009:2).
Besides the Rif Mountains, Moroccans in the Netherlands originate also, although to a lesser extent, from the Souss valley in the South. Ouarzazate is specifically mentioned as a sending province. Around 10% is the Dutch Moroccans is said to come from the Souss. These migrants are called Soussi (De Mas & Haffmans 1985 in Van Heelsum 2001:1) and they speak a Berber language as well.

27 Destination Netherlands: The Evolution of Migration from six origin countries to the Netherlands
Lastly, there is a group of migrants from the larger cities of central Morocco like Casablanca, Rabat, Fes and Meknes. They are relatively high educated and they constitute a minority among Moroccans in the Netherlands. They settled relatively early after migration from Morocco to the Netherlands started (Van Heelsum 2001:1). They speak Arabic.
Figure 5: Map of several sending regions of the Morocco-Netherlands corridor
4.4.3 Where to
As depicted in fig. 6 Moroccans in the Netherlands are very spread out throughout the country. They are to be found in almost every municipality and the largest ‘communities’ live in the 4 large cities; Amsterdam, Rotterdam, Utrecht and the Hague.

28 Destination Netherlands: The Evolution of Migration from six origin countries to the Netherlands
Figure 6: Distribution of Moroccan born people in the Netherlands in 2009 (Netherlands Statistics 2010)
Amsterdam has 34,177 first generation Moroccans registered, Rotterdam 18,672, The Hague 13,357 and Utrecht 13,284 in June 2010. If we also take the second generation into account these numbers will be 68,077, 38,160, 26,249, and 26,431 for these four cities respectively.
When applying the corridor concept to migration from Morocco to the Netherlands, it becomes clear that within this corridor, migration flows could be identified from particular regions or cities in Morocco to specific regions or cities in the Netherlands. One interviewee for example mentioned that all migrated Moroccans from his village (Tazourakht) now live in the area Roosendaal, Bergen op Zoom, Rotterdam (North), and Oudenbosch. In the last village 20 to 25 families from Tazourakht reside. Besides this specific example we could also identify more general migration flows.
Fokkema and Harmsen researched this phenomenon in a more systematic manner, looking at the places of birth of Moroccan migrants. There are three provinces in the North of Morocco from which most Moroccans in the Netherlands originate. 55% of all first generation Moroccans was born in Nador, Al Hoceima or Tetouan. Still most Moroccans migrating to the Netherlands come from these provinces. (Fokkema & Harmsen 2009:2). Taza and Ouarzazate are other provinces that send many migrants.

29 Destination Netherlands: The Evolution of Migration from six origin countries to the Netherlands
Table 1: The most important ‘sending’ provinces of the Dutch-Moroccan corridor and the receiving cities. (Source: NIDI, Netherlands Statistics in Fokkema & Harmsen 2009:3)
Top 5 provinces of origin
Nador Al Hoceima Tetouan Taza Ouarzazate
Row percentage Amsterdam 22.1 14.2 15.5 2.0 8.0
Rotterdam 32.9 11.6 4.9 9.1 7.2
The Hague 29.8 22.6 5.1 12.6 1.9
Utrecht 49.8 8.4 11.9 6.4 2.6
Column percentage Amsterdam 19.9 30.6 40.0 9.5 47.5
Rotterdam 16.5 13.9 6.9 23.8 23.8
The Hague 9.8 17.8 4.8 21.8 4.1
Utrecht 17.6 7.1 12.0 11.8 6.2
This table shows that 50% of all first generation Moroccans in Utrecht have their roots in Nador. People from Al Hoceima tend to migrate to The Hague, 23% of the Moroccan population has roots in Al Hoceima. Of the people migrating from Tetouan and Ouarzazate, 40% and 47,7% have moved to Amsterdam. In 2009, 15,5% of the Amsterdam Moroccans originate from Tetouan and 8% from Ouarzazate. In smaller cities and in villages this phenomenon is even more clearly visible.
Moroccans generally prefer to live amongst fellow nationals. Fokkema and Harmsen show in their research how the tightness of the Moroccan ‘community’ is bound to provinces. The pioneers who settled in a certain region provided help not only for family and friends but also for people from the same village and region. This brought about chain migration that resulted in the fact that Moroccan migrants per municipality often originate from one or a few provinces in Morocco (Fokkema & Harmsen 2009: 4).
4.5 Assessment The corridor concept is well applicable to Moroccan migration to the Netherlands and it is even possible to identify smaller migration flows from region to region. However, in the larger cities we find a mix of Moroccan migrants from all different regions. It is easier and more straightforward to apply the concept to migration to villages or cities other than the largest four.
However, it is necessary to mention that it is difficult to do research among first generation Moroccans. The distinction between the two generations might not be that relevant. Families were formed before and after the migration process. This leads to families with children born in Morocco and in the Netherlands and to couples of first and second generation Moroccans. In the Netherlands, the Moroccan population is well established and the ‘Moroccan’ generation born in the Netherlands is even

30 Destination Netherlands: The Evolution of Migration from six origin countries to the Netherlands
larger than the first generation. Most organisations and associations exist for Moroccans in general and not specifically the first generation.
Furthermore, the Moroccan ‘community’ is large and very diverse. It is not possible to discuss the Moroccan community in general. If we continue researching this migrant group, attention must be paid to the heterogeneity and diversity.
In conclusion, when doing research amongst migrants in the Netherlands, it would be a striking decision, not to include Moroccans. They form the largest migrant ‘community’ and although much research has been done already, this group remains interesting for THEMIS. The immigration to the Netherlands is on the decline, but the ‘second’ generation is still growing. Besides that, in the sending regions in Morocco Dutch influences are visible which indicates a movement from the Netherlands to Morocco as well.
5. India
5.1 Theoretical framework of Themis 5.1.1 Themis theoretical Framework
The Netherlands is, after the UK, the country with the second largest population of people of Indian descent. Though, a distinction must be made between two historically formed groups from India. Firstly, there is a group of people born in India who have migrated to the Netherlands. They are often called Non-Resident Indians (NRIs). All Netherlands Statistics data deal with this group. Second however, the Netherlands hosts a group of people who have migrated from India to Surinam and afterwards to the Netherlands. They are called Hindustanis5 or, in Indian jargon, People of Indian Origin (PIOs). These people are descendants of the 34.000 British-Indian contract labourers who were brought to the former Dutch colony of Surinam between 1873 and 1917 to work on the plantations (Choenni & Adhin 2003:8). After 1917, when the flow of new migrants and their stories from the homeland stopped, they had to rely on their own cultural baggage (Choenni & Adhin 2003:14).
A substantial number of Indian migrants or their descendants have migrated to the Netherlands. In the official statistics they are registered as Surinamese. It is difficult to estimate the number of these people because not all migrants from Surinam are of Indian origin. The NRI and PIO groups are very distinct. If we consider the India-Netherlands migration corridor it is important to know the historical context. However, we will predominantly deal with the NRI migration from India to the Netherlands in this scoping study and elaborate on the Hindustani PIOs wherever relevant. The data shown below deals with the first group of Indian people, those born in India6.
5 Hindostan (sometimes written as Hindustan) is the Hindi name for British India and ‘Hindustani’ therefore has an ethnic connotation, no cultural religious connotation (Choenni & Adhin 2003:9). 6 People from India often obtain another nationality. Therefore looking at the country of birth might be a good option when dealing with Indian migration.

31 Destination Netherlands: The Evolution of Migration from six origin countries to the Netherlands
If we consider immigration from Indian born migrants in fig. 7 we see that the development has been relatively stable until 2004 (except for a sudden peak in 1987). The growth of 2004 is caused by a new policy for highly skilled labour. These people all have temporary residence permits and we cannot determine whether this trend will lead to a change in the general Indian population in the Netherlands. We therefore decided to analyse the Indian migration corridor in threefold. Firstly, the Hindustani population that has been in the Netherlands for several generations could be considered as established. Since the 1950s and 1960s, Hindustanis migrated from Surinam to the Netherlands and around 1973 a large wave came about (Choenni & Adhin 2003:11). Secondly, there is an Indian born population whose migration from India to the Netherlands started after India’s independence and the Second World War, although there are no statistics available to confirm this. The first information on migration from Indian nationals to the Netherlands dates from 1976. In that year 339 Indians came to the Netherlands. This population is characterised by stability on a low level. The last group, the highly skilled or knowledge migrants have only started to come in 2004 when this new policy came into force (see section 3 for details). In 2004, immigration numbers (especially on labour migration) suddenly grew significantly while emigration rates also grew fast. Before that time, labour migrants would come to the Netherlands but not in the high numbers that we observe now. Since this trend started recently it is not possible to determine the development for the future. This migration flow will be considered as starting in the framework set by THEMIS. In 2007, 3558 Indians migrated to the Netherlands, of which 1513 were knowledge migrants. In fig. 7, it is possible to see the ‘pioneer’ knowledge migrants causing the steep growth of the overall population of Indian born migrants.
Figure 7: Immigration of Indian born residents in the Netherlands (Netherlands Statistics 2010)
Fig. 8 depicts the migratory activity within the corridor. We notice that the immigration numbers have been growing for the past few years but that the development is accompanied by a growth of emigration as well. This could be caused by highly skilled labour migration. Often these people are very mobile and the knowledge migrants only obtain a residence permit for maximally 5 years.

32 Destination Netherlands: The Evolution of Migration from six origin countries to the Netherlands
Figure 8: Immigration and emigration to and from the Netherlands of Indian born residents (Netherlands Statistics 2010)
Today there are 13,445 first generation Indians in the Netherlands and the second generation comprises 5,852 people. The total population is around 20,000 people, adding the people in an irregular situation, this leads to 21,000 up to 22,000 people.
The number of Hindustanis is estimated at 130,000 to 160,000 people. The opinions differ on the exact size of the population because this group is not registered as such.
5.1.2 Types of migration and motives
A key informant mentions that for Hindustanis migrating from Surinam, the main motivation was the increased opportunity of higher education as compared to Surinam. Most authors mention economic and political reasons. Surinam used to be a colony of the Netherlands until 1975. The independence caused quite some political uncertainty and economic instability that encouraged migration to the Netherlands. All factors have had their influence.
Migration from India to the Netherlands developed differently over time. Migration started after India gained its independence in 1947. Predominantly students and highly educated people left for the Netherlands. Today, most of the migrants from India are highly skilled and stay in the Netherlands temporarily. The number of asylum seekers from India is fairly low and on the decline (Netherlands Statistics 2010). Besides that, India used to be a popular country for adoption but also the number of adopted children from India is on the decline (Netherlands Statistics 2010). Fig. 9 shows the different migration motives for Indians nowadays. We observe that all labour migration (including knowledge migration) is on a sharp rise while other kinds of migration have stayed relatively stable.
The development of migrants with other migration motives seems to be relatively stable. Students take up second place after labour migration (1,513 knowledge migrants). In 2007, 206 Indian students came to the Netherlands. In the same year 180 Indians migrated with family related motives. 34 people came

33 Destination Netherlands: The Evolution of Migration from six origin countries to the Netherlands
with other reasons, 7 people for an internship and only 2 were asylum seekers. Students are said to often stay in the Netherlands after having finished their studies.
Figure 9: Immigration from India divided by migration motives (Netherlands Statistics 2010)
5.1.3 Relevant statistical information
In fig. 10, a larger proportion of men is visible in the categories 20-30, 30-40 and 40-50. The reason for this is related to labour migration. The Indian population seems to be male dominated in certain age categories. Later on we will elaborate on a special policy for high skilled labour migrants of which Indian people benefit the most. 75% of the people who enter the Netherlands via this policy is male (IND 2009). In 2007, 68.5% of all Indian immigrants were male versus 31.5% of female migration (De Boom et al. 2009). Before the knowledge migration policy came into force in 2004, Indian migration to the Netherlands was not dominated by men as it is these days.
Figure 10: Gender and age distribution of first generation Indians in the Netherlands in 2009 (Netherlands Statistics 2010)

34 Destination Netherlands: The Evolution of Migration from six origin countries to the Netherlands
About irregular migration from India there is much uncertainty7. The Dutch Embassy in New Delhi mentions that irregular migrants are said to come from the regions of Punjab (north west) and Tamil Nadu (south east). A key informant estimates that there are about 3000 up to 4000 undocumented migrants in the Netherlands among which 1000 or even more are Sikhs. No evidence has been found for this assumption. Many irregular migrants from India leave from Tamil Nadu, some of them are Sri Lankan but stay in India before travelling further (UNODC 2009). This report does not discuss irregular Indian migration in the Netherlands but treats almost all other European countries. This could indicate that other countries constitute a more popular or easy destination for these migrants. The routes migrants follow differ. Some people are said to come via Eastern European countries but many others follow another track.
5.2 Macro factors 5.2.1 Policy changes
Two important policy changes have taken place, changing both Hindustani and Indian migration. Until November 1980, Surinam and the Netherlands had an agreement that allowed people from Surinam to reside and settle in the Netherlands freely (Choenni 2003:55). In 1980, this would end and this could be an extra reason for the migratory wave around 1980 besides the political unrest and the economic stagnation (Lalla Rookh 1983:21). In 1983, the migration from Surinam to the Netherlands was bound by requirements. Surinamese people are now obliged to obtain a visa and it has become very difficult to settle in the Netherlands.
For India, a particular policy change had a positive effect on migration. In 2004, a special policy came into force for high skilled labour migration. The goal of this policy is to facilitate the procedure of immigration for these migrants, to make it faster, more clear and accessible for all actors concerned and to attract highly skilled labour migrants. Knowledge migrants are highly skilled people from outside the EU who have a contract with a Netherlands based company and earn a certain minimal salary. The knowledge migrants can obtain a residence permit for 5 years. Most people obtain a residence permit for 1 to 3 years (39%) or for 4 to 5 years (31%) (IND 2009:20). From 2005 to 2008, the proportion of Indians who entered the Netherlands this way grew from 17% to 30% (of all knowledge migrants). Since men are mostly benefiting from this policy, male migration has relatively grown over the last few years. Knowledge migrants do not always come from India directly to the Netherlands. Sometimes they have worked in another country before. Therefore, numbers from India about these migrants might not encompass all of these migrants.
5.2.2 Political and economic shifts
Hindustani migration to the Netherlands could mainly be explained by the political instability that this country knew in the beginning of the 1970s. Migration had occurred since the 1950s and the 1960s but in the beginning of the 1970s a larger wave came about. In 1973, Arron became prime-minister and
7 Undocumented Hindustani migration from Surinam could be neglected.

35 Destination Netherlands: The Evolution of Migration from six origin countries to the Netherlands
declared that Surinam would become independent in 1975. The Hindustanis were generally not in favour of independence, especially out of fear for Creole domination. From 1972 onward until after the independence, the political climate was unstable. This kept generating large flows of migration for Hindustanis to the Netherlands and brought about chain migration. More people had relatives in the Netherlands and Hindustani in Surinam wanted to follow (Choenni 2003:16). In 1980, another migratory wave occurred. Economic stagnation and high inflation has led to this, together with more political issues. In 1980, a coup d’état was executed by Desi Bouterse and again this resulted in Hindustani migration. In 1983, it became much more difficult for Surinamese to settle in the Netherlands and to travel there (Lalla Rookh 1983:21).
India has known an economic growth of more than 6% over the past 25 years (Kolhi 2007:87). The country invests in education, especially in IT and scientific fields. The investments in this field can be observed in migration data. Highly qualified Indian IT-specialists are to be found all over the globe. It remains to be seen how migration will hold under the current economic crisis. The Ministry of Overseas Indian Affairs forecasts are not positive in terms of migration and remittances (Ministry of Overseas Indian Affairs 2009:4).
5.3 Meso factors 5.3.1 Transnational activities
When considering current migration from India to the Netherlands, the role of Indian companies is strikingly large. According to a representative Indian section of the Amsterdam municipality, about 100 Indian companies have settled in the Netherlands. Especially these companies attract knowledge migrants. 50 of these companies are to be found in and around Amsterdam. People do not arrange their trajectory to the Netherlands themselves. The companies, whose headquarters are often based in larger cities with universities such as Bangalore, Chennai, Hyderabad, chose the migrants and arrange their immigration affairs. Unlike in other types of migration, social networks do not seem to play any role in the migration of high skilled labour migrants.
For the knowledge migrants a new association has emerged in 2009, the Indian Expat Society. Today, this organisation has over 5,000 members. On the website we read: ‘We are here to serve the needs, represent the interests and address the concerns of the Indian expatriate community in the Netherlands. The IES is registered in the Netherlands as a foundation and its membership is open to all the Indian expats, professionals, businesspersons, and students alike’ (Indian Expat Society 2010). The website is comparable to Facebook. One can connect to friends and join discussions. Unlike Facebook however, the Indian Expat Society frequently organises events like Bollywood movie nights, hockey competitions and celebrates Indian festivities. They try to facilitate integration in the Dutch society and the Indian ‘community’ already present. Respondents mention contradictory issues on this. On the one hand the ‘Indian community’ would be a close knit community and everyone would know each other. This could hold for several individuals but certainly not for everyone. On the other hand, the expatriates and the ‘other migrants’ would live relatively separate from each other. Moreover, contacts would often occur between people from the same region which would imply a very scattered ‘community’. A key

36 Destination Netherlands: The Evolution of Migration from six origin countries to the Netherlands
informant illustrates this with the existence of different Yahoo groups of Indians in the Netherlands. There is a Tamil group, a group from Goa and from other cities of regions in India. These groups are mostly formed according to the place where the migrants originate from, illustrating the diversity of Indian migrants.
Besides the Indian migrants, there is another division within the people of Indian origin. The Hindustanis and Indian ‘communities’ are rather separated from each other. One informant tries to emphasise how they do get along and how they can communicate in the same language. According to him there are many mixed marriages, friendship and contacts. He does acknowledge however that there are frictions between the two groups. Indians would see themselves as the ‘owners’ of Indian culture and Hindustanis would be to progressive and contaminated with South American culture. This leads to tensions between the groups. Lynnebakke8 describes that the relations between Surinamese Hindus and Indian Hindus are not very good (Saleh 2003). Some organizations attempt to change this situation. The Global Organisation of People of Indian Origin (GOPIO) is active linking both NRIs and PIOs in the Netherlands to a global Indian network. According to their representative, they work together with other chapters of GOPIO, international businesses and other organisations and the Indian government while trying to unite PIOs and NRIs. .
Another Indian-Dutch organisation, the Netherlands-India Association, has been founded in 1951. This is a cultural organisation. At that time not many Indian lived in the Netherlands and the members were predominantly Dutch but nowadays they also have Indian members. Their goal is firstly to promote knowledge and understanding of the culture, history, philosophy, religions and social structure of India and the Netherlands among the peoples of both the countries and secondly to advance and promote friendly relations between the peoples of India and the Netherlands by widening and strengthening personal, cultural and social contacts. (Netherlands-India Association 2010).
5.4 Micro factors 5.4.1 First migrants
The first Hindustani migrants from Surinam to the Netherlands came in the 1950s and 1960s. These people had to be fortunate because the costs for the passage by boat were very high. Besides them, some students came to the Netherlands to study and a small number of nurses. Not all students really migrated to study, some of them used it as a way to enter the Netherlands and just wanted to try their luck elsewhere (Choenni & Adhin 2003:55)
8 Lynnebakke, B. (2005) Contested Equality. Social Relations between Indian and Surinamese Hindus in Amsterdam, thesis on Migration and Ethnic Studies; The International School of Humanities and Social Sciences, University of Amsterdam in Saleh (2010)

37 Destination Netherlands: The Evolution of Migration from six origin countries to the Netherlands
The first migrants from India to the Netherlands9 came after the Second World War. These migrants were predominantly highly educated and came for professional reasons. Often, they were scientists. Students also migrated to the Netherlands (Informant). It is unknown when the first Indian migrant settled in the Netherlands, but we know of someone who arrived in 1958.
5.4.2 Where from
The roots of Hindustanis in the Netherlands (and in Surinam for that matter) lie in the regions of Uttar Prasesh and Bihar in India. Between 1873 and 1917, people were recruited from these regions to work on the fields in Surinam. There, they mainly lived in the Paramaribo and in the Nickerie region, both northern regions of Surinam. Hindustanis were concentrated here so Hindustani migration from Surinam to the Netherlands logically originated from these regions.
The sending regions of the current India-Netherlands migration are less easy to depict. Informants indicate that people are leaving from Punjab (this region also delivers a share of irregular migration). Haryana and Delhi are also mentioned in this respect. Besides that, Indian people in the Netherlands are said to come from the South, namely the regions of Goa, Karnatake, Andhra Pradesh, Kerala and Tamil Nadu. Tamil Nadu is also linked to irregular migration. Lastly, people come from the larger cities like Mumbai, Delhi, Kolkota, Chennai, Hyderabat and Cochin. Knowledge migrants do not seem to come from a certain area but from cities all over India. Logically derived these cities should have good universities and internationally operating companies.
Figure 11: Map of several sending regions of the India -Netherlands corridor
9 Excluding Indians, who came to the Netherlands in earlier centuries, and soldiers during the Second World War, who left again.

38 Destination Netherlands: The Evolution of Migration from six origin countries to the Netherlands
5.4.3 Where to
Hindustanis had a different pattern of settlement than the Indians from India. Hindustanis are especially to be found in The Hague and Amsterdam. The Hague is said to host 25,000 Hindustanis. The pattern of settlement was predominantly caused by chain migration and the Dutch policy to spread Hindustanis over the country. When Hindustani migration started, people did not yet have family to settle nearby. It was judged important to settle close to other Hindustanis. The Hague was seen as a quiet city, pleasant to live in and this caused more and more people to move there. The Dutch government did not approve of large concentrations of Hindustanis together and implemented a policy to spread people in 1974 and 1975. This policy and the chain migration that was ‘directed’ to the more peripheral regions of the Netherlands explain the presence of relatively large Hindustani populations in the North of the Netherlands. Hindustani are for example said to live in Leeuwarden. A group of Hindustani with roots in Nickerie in Surinam lives in Hogezand-Sappemeer in the northern province of Groningen. Most Hindustani however, live in the larger cities like The Hague, Amsterdam, Utrecht and Rotterdam. Exact numbers are not known since the ethnic origin of Surinamese people is not registered.
Indians are spread throughout the Netherlands in a different manner. Fig. 12 shows that most Indian born people live in Amsterdam (3,121), The Hague (1,619) and Rotterdam (1,092). Utrecht has 613 Indian born residents. Amstelveen (part of the Amsterdam agglomeration) and Eindhoven both have 939 Indian born residents. Amstelveen has relatively the greatest population of Indian born people. According to a key informant, Indian companies have settled in the area of Amsterdam, Hoofddorp, Amstelveen and the airport Schiphol. This would have led to the large concentration of Indians in that particular region. The Hague also constitutes a key location for Indian expatriates according to a key informant. Eindhoven is the town of the technical university and electric corporation Philips. Many expatriates live in and around Eindhoven, including Indians. People especially live in and around cities where most companies are located.

39 Destination Netherlands: The Evolution of Migration from six origin countries to the Netherlands
Figure 12: Distribution of Indian born people per municipality in the Netherlands in 2009 (Netherlands Statistics, 2010)
5.5 Assessment India might not be the most interesting country of origin to explore further. The group is very diverse. Firstly, Hindustani migrants have come to the Netherlands and settled. This group is very well integrated and migration has come to an end by now. Their connection to India and Indian migrants seems to be of minor importance. Statistically, it is difficult to analyse this group because within the Surinamese nationality different groups are counted (for example Creoles, Javanese and Hindustani). Secondly, there is a group of knowledge migrants from India. Their number is high, but they are in the Netherlands only temporarily. They come individually, their stay is arranged by their employer and their contacts seem to be mainly within the expatriate community. It is a relatively large group but they are rather separated from the rest of the ‘Indian community’. Lastly, there is another group of Indians. Their population, mostly comprised of students and family migrants, is relatively small but stable.
The twofold differentiation among a group of people that is already rather scattered, the lack of ties to India of Hindustani migrants and the fact that Indian knowledge migrants are here only on a temporarily basis diminish the theoretical relevance of this particular group in the Netherlands. The small stable migration flow of Indians migrating from India to the Netherlands could be interested to look into. The question remains however whether it is practically possible and theoretically relevant to make such a distinction. The Indian-Dutch migration corridor seems to have little migration system dynamics.

40 Destination Netherlands: The Evolution of Migration from six origin countries to the Netherlands
6. Egypt
6.1 Theoretical framework of Themis According to the official data of Statistics Netherlands there are 11,317 first generation Egyptians in the Netherlands. Figure 13 shows that the population of first generation Egyptians in the Netherlands has mildly grown over the last years.
Figure 13: Size of the population of first generation Egyptians in the Netherlands, source: Statistics Netherlands. 100= 2009, 100=11.317
According to these same data, there are another 8,659 second generation Egyptians who reside in the Netherlands. This means that there are roughly 20,000 officially registered Egyptians in the Netherlands. This is confirmed by one of our informants who estimates that there are 20,000 to 25,000 Egyptians in the Netherlands, including irregular migrants. However, estimations based on Egyptian embassies and ministries’ records of cross-border flows and emigration permits indicate that the number of Egyptians in the Netherlands was around 40,000 after the turn of the century (CAMPAS 2001, as cited in Zohry and Harrel-Bond 2003: 36-37).
The Egyptian population of first generation migrants largely consists of men. In addition, they are relatively old: more than half of the population is over 40 years.
Figure 14 indicates that Egyptian immigration to the Netherlands had remained relatively stable in recent years, and that each year a substantial number of Egyptians leaves the Netherlands as well.
0
10
20
30
40
50
60
70
80
90
100
1990 1992 1994 1996 1998 2000 2002 2004 2006 2008

41 Destination Netherlands: The Evolution of Migration from six origin countries to the Netherlands
Figure 14: Immigration and emigration of foreign born Egyptians to and from the Netherlands, source: Statistics Netherlands 2010
At this point, it is difficult to classify the Egyptian migration to the Netherlands in terms of our theoretical framework. Our data only start during the nineties and the fluctuations in migration flows cannot be unambiguously interpreted. The literature review and interviews with informants that are discussed in the next sections provide us with better clues.
6.1.2 Migration history and migration motives
During the period of the British protectorate, Egyptian Copts enjoyed a preferential treatment. They occupied good positions in civil service and trade. This changed when Abdel Nasser became the second president of independent Egypt in 1954 (Choenni 1997). As a result, many of the Coptic elite started to emigrate looking for opportunities outside Egypt. The First Coptic church abroad was consecrated in New Jersey in 1964. The first Copts in the Netherlands arrived at the end of the sixties (De Wit 2002a). But it was not until the seventies that Egyptians started to migrate to the Netherlands in significant numbers (Choenni 1997).
In the 1970s, policies in Egypt actively promoted emigration and due to increased tensions with the government large groups of Copts emigrated (De Wit 2002b). In addition, it became popular for Egyptian students and recent graduates (both Copts and Muslims) to temporarily work abroad during the summer holidays to make some money (Choenni 1997). According to an informant, in the Netherlands many of these students and former students worked in Israeli owned shawarma businesses (see also De Wit 2002a). Shortly before the students came, Israeli business men had introduced shawarma, an oriental snack that the Egyptian students knew from their own country. Their culinary knowledge made the students welcome employees for the Israeli shawarma businesses. The snack turned out to be a big success on the Dutch market and Egyptian students had found themselves a niche. Egyptian students who had worked in other western European countries before, started to come to the Netherlands as well to perform this holiday labour (Choenni 1997). The car trade between the
-800
-600
-400
-200
0
200
400
600
800
100019
95
1996
1997
1998
1999
2000
2001
2002
2003
2004
2005
2006
2007
2008
2009
Emigration
Immigration

42 Destination Netherlands: The Evolution of Migration from six origin countries to the Netherlands
Netherlands and Egypt was also very lucrative at that time, but most Egyptians worked in shawarma (De Wit 2002a).
After having worked for a certain period most students returned to finish their studies and by word of mouth this type of holiday job became well known at Egyptian universities and raised the interest of other Egyptians to undertake the journey to the Netherlands (Choenni 1997). According to an informant, there was not enough work for graduated students in Egypt at that time, which made the shawarma business in the Netherlands a much welcomed alternative.
Some of these students noticed how lucrative a shawarma business could be and used the money they earned as employees to open up businesses themselves after their studies (De Wit 2002a). As the number of shawarma places grew, so did the job opportunities for Egyptian students and graduates. The Egyptians created their niche by working almost exclusively with fellow countrymen. They created an attractive career perspective for employees as they could open up their own business after they had earned enough money. This perspective became the main motivator for additional migration (Choenni 1997). The population of highly educated students and former students who came during the seventies has formed the basis of the Egyptian migration to the Netherlands.
During the eighties large groups of low skilled Egyptians migrated to the Netherlands (again, both Muslims and Copts) (De Wit 1997). These were mostly single male migrants who ended up as employees in the shawarma business as well (de Wit 2002a). Their choice for the Netherlands was accidental and dependent on the opportunities offered by migration brokers (De Wit 2002a). They lacked concrete information about the Netherlands but were drawn by what acquaintances, family members and friends who had been in the Netherlands told them. Arriving on a tourist visa, these migrants were informed by fellow countrymen about possibilities for work. This way, they ended up employed in the shawarma businesses (De Wit 2002a).
In the nineties, Egyptians had established hegemony in the shawarma niche. In 1993, three quarters of all businesses in Amsterdam were Egyptian owned, and 25% of all snackbars (including lunchrooms and cafeterias) were Egyptian owned (Choenni 1997). It is estimated that during the nineties, more than half of the Egyptians in the Netherlands worked as an entrepreneur or in a business owned by another Egyptian (Choenni 1997). According to an informant, by the end of the nineties, competition in the shawarma business had become fierce and the Dutch government increasingly exercised controls on illegal employment and tax evasion, which made if more difficult for Egyptian entrepreneurs to continue to make the huge profits they made during the seventies and eighties. Slowly, Egyptian entrepreneurship therefore started to spread to other sectors as well.
As it became more difficult for owners of shawarma businesses to employ illegal workers, the flow of migrants from Egypt started to decrease, an informant tells us. Especially for irregular migrants, the Netherlands seized to be an attractive country because employers became increasingly more afraid to hire illegal employees. However, this informant further specifies that Copts kept arriving during the nineties because of tensions in Egypt.

43 Destination Netherlands: The Evolution of Migration from six origin countries to the Netherlands
If we look at the official data on migration motives in fig. 15, we see that during the nineties student migration and asylum migration were more prominent than these have been in the last years. Family migration has been the most important motive from the mid nineties onwards.
Figure 15: Migration motives of first generation Egyptian immigrants in the Netherlands, source: Statistics Netherlands 2010
A small minority of Egyptians in the Netherlands has applied for asylum. Between 1995 and 1999, 201 Egyptians asked for political asylum in the Netherlands (De Wit 2004). These are small numbers compared to regular residence requests, as could be seen in figure 15. In the period 1995-1998 only 46 Copts applied for asylum. All requests made by Egyptian Copts have been denied except for one (De Wit 2002a). Many Egyptians made false asylum applications. Some Muslims pretended to be Copts, and others claimed they belonged to some religious Muslim minority.
All in all, both Egyptian Copts as Muslims have predominantly migrated to the Netherlands for economic reasons (De Wit 2002a). For Copts, political motives do play an indirect role in fostering these economic motivations as these migrants point at their religious background for their lack of economic opportunity in Egypt (De Wit 2002a). However, according to an informant, the same is true for some Egyptian Muslims. Most Egyptian Coptic migrants in the Netherlands have worked in Egypt but due to the low pay and lack of perspective they longed for a better life. Some said they wanted to see the world (De Wit 2002a). Although the Coptic community was initially mainly comprised of men, nowadays family formation and reunification brings Coptic women from Egypt (De Wit 2002a). According to an informant, Muslim Egyptian migration started off as primarily male migration as well, but females have started to come as well.
As said before, the shawarma business had become less lucrative during the nineties. After 2000, the Turcs also started with Dönner, a snack that is similar to shawarma, thereby increasing the competition. Many Egyptians had kept large parts of their sales off the books, but this had become increasingly more difficult. People used to have several illegal workers employed but as this became practically impossible,

44 Destination Netherlands: The Evolution of Migration from six origin countries to the Netherlands
the shawarma business turned into hard work for little money instead of a lucrative business. In the last ten years, many Egyptians have therefore either left the shawarma business or went bankrupt.
Some Egyptians quit their business and looked for a regular job because this offered them more peace and quiet than a seven day work week in shawarma. Some still continue because they do not have the skills and the experience to do anything else. This is especially true for the older generation. They have not learned anything else. They also lack Dutch language skills. Other people went bankrupt and now receive welfare benefits. According to an informant, unemployment has become problem among Egyptians. In addition, many Egyptians also worked for other people in the shawarma business. They do not have the skills or the legal status to do anything else. According to an informant, life has become very hard for this group, and some have returned to Egypt or tried their luck in another country. According to an informant, only people who own more upmarket restaurants or other type of businesses are still doing well. Small shawarma businesses make a living but they have to work seven days a week and do not earn much.
Nowadays, there is little new migration compared to the seventies and eighties. According to our informants you can tie the moment the migration started to become less to the more stringent policies. A few irregular migrants still come. These are usually former students who cannot find a job in Egypt and who are lured to the Netherlands in the prospect of finding a Dutch wife with blond hair. In addition, Copts still come because of their situation in Egypt and because the church helps them to find illegal employment.
Unlike Bangladeshis (next section), who move to other countries to continue their business there, Egyptians do not move to other countries because of their age. They have children here and do not want to take the challenge to start all over. Some people have returned to Egypt. According to an informant, the remigration arrangement makes it possible for people to return while they maintain benefits of 400 to 500 euro a month. But in order to get it people have to give back their Dutch passport. An informant says the Dutch government wants to lose unemployed Egyptians because they cost money and care. Some people have taken this arrangement. Most however, stay here even though they are unemployed because it is the most lucrative option.
6.2 Macro factors 6.2.1 Policy changes in the Netherlands
In the Netherlands, several policy changes has made life for Egyptians in the Netherlands more complicated. Our informants speak of increased controls on illegal employment and tax evasion which have become so frequent that Egyptians can no longer hire illegal workers in their shawarma businesses, and that they can no longer keep revenues off the books. Egyptains who had the skills to change to a regular job therefore did, while those who could not either went bankrupt or continued to struggle. Those who worked as employees and those who went bankrupt are now usually unemployed.
Furthermore, it has become more difficult to obtain a legal status. In the past, many marriages took place with Dutch women. Nowadays, if you want to marry as an irregular migrant you first have to go back to Egypt to make formal arrangements there. According to an informant, this is an obstacle for

45 Destination Netherlands: The Evolution of Migration from six origin countries to the Netherlands
many irregular migrants. In addition, asylum requests are usually rejected so Egyptians have stopped trying and it has become more difficult to live as an irregular migrant because of the lack of employment possibilities. As a result, marriage is still the dominant and most successful legalisation strategy (cf. Van Meeteren et al. 2007; Van Meeteren et al. 2009).
6.3 Meso factors 6.3.1 Community formation
Egyptian migrants in the Netherlands originate from different places in Egypt but many people come from Cairo or other cities. This is because half the population in Egypt lives in urban areas. Egyptians in the Netherlands do not come from all over Egypt because the population in Egypt lives in specific areas. There are no regions or cities except for Cairo that really stand out. Egyptian Copts come from areas in Egypt where most Copts live. They therefore more frequently originate from the south of Egypt than Muslims do. According to an informant, Egyptians from small cities cluster together in the Netherlands but those from cities do not do that.
Most Egyptians live in Amsterdam or the Hague as can be seen in figure 16. Exactly how many Egyptian immigrants in the Netherlands are Copts or Muslims is unknown as the Netherlands does not register the religion of newcomers. It is estimated that Copts make up around 30 percent of the Egyptian community in the Netherlands (De Wit 2002a). This is more than two times their percentage in Egypt, where they are estimated to comprise between 6 and 10% of the Egyptian population (De Wit 2004). Two third of all Copts live in Amsterdam or The Hague (De Wit 2004). Choenni (1997) estimates that more than half of the Egyptians in Amsterdam are Copts.
Figure 16: Distribution of Egyptian born people in the Netherlands in 2009, Source: Statistics Netherlands 2010
The number of Coptic churches worldwide lies around 180, of which 42 are to be found in the United States. The first Coptic church was opened in Amsterdam in 1985 (De Wit 2002a). In the Netherlands,

46 Destination Netherlands: The Evolution of Migration from six origin countries to the Netherlands
there are currently 7 Coptic Orthodox churches. They are located in Amsterdam, Utrecht, Eindhoven, The Hague, Leeuwarden, Assen and Enschede. The church plays a central role in the lives of Coptic migrants.
Copts are in general somewhat better educated than Egyptian Muslims in the Netherlands (De Wit 2002a). According to an informant, Copts are also better off financially. He says that the Coptic community in Amsterdam is a rich community consisting of many wealthy entrepreneurs. Furthermore, the number of mixed marriages is high among Copts. It is estimated that half of the Coptic men are married to a Dutch woman. This is reflected in the masses in church, which are also held in Dutch three times a week (Choeni 1997).
Even though Egyptian Copts and Muslims in the Netherlands do not differ much in terms of their daily activities, they consider themselves to be very different (De Wit 1997). They consider themselves to be different ethnic groups and do not have much contact. Egyptian Muslims do work for Shawarma businesses owned by Copts but vice versa hardly occurs (Choenni 1997). In addition, a marriage between a Copt and a Muslim Egyptian is not approved of (De Wit 1997).
Although Egyptian Muslims are also often entrepreneurs and they have the same migration-background, there are marked differences in the social lives they lead. Mixed marriages are not as frequent among Egyptian Muslims, although they do occur (Choeni 1997). They have only one Egyptian mosque in Amsterdam and usually visit Moroccan mosques (De Wit 2002a). In contrast, Coptic life is very much connected to the Coptic church. As a result, Copts in the Netherlands seem to form a tighter community than Muslim Egyptians. According to our informants, there is definitely no sense of an ‘Egyptian community’ in the Netherlands. In Amsterdam, the church is much visited and all kinds of activities are organised. Newcomers are shown around and provided with information. After a church service, they enjoy a meal together and information is exchanged (Choeni 1997).
Although it has become more difficult for new migrants to find work in the Netherlands, Copts usually manage to find employment because the church acts as a mediator. When someone looks for a job, they first go to the church. Mosques do not do that. According to an informant, this has religious reasons but it is also because mosques already receive more negative attention in general. They are consequently afraid to get a bad reputation. Churches not only help irregular migrants find a job but they also provide beds to irregular migrants in need. Mosques also do not do that because they are afraid of their reputation. Contrastingly, churches even help irregular migrants financially, yet they only help the Coptic and not the Muslim Egyptians.
The population of highly educated former students who came during the seventies to work in the shawarma business has formed the basis of the Egyptian migration to the Netherlands. This has been largely male migration as it is difficult in Egyptian culture for women to migrate on their own. They have started families in the Netherlands. Many married Dutch women (see also Choenni 1997). Some broke up after a few years but most have stayed together. Their children do not enter the shawarma business anymore but pursue other careers by means of higher education.
6.3.2 Transnational ties

47 Destination Netherlands: The Evolution of Migration from six origin countries to the Netherlands
There are three ways in which social networks facilitate Coptic migration from Egypt to the Netherlands. First, clergy from the Coptic church partly form the networks. The Coptic church in Egypt stresses the positive aspects of migration such as the founding of new churches and renewed international contacts and influence, but promoting emigration is not the official policy (De Wit 2002b). They support Copts abroad by setting up churches and in some cases help arrange migration by providing information about the destination, by writing letters and by providing material aid (De Wit 2002a). Second, Coptic churches in the Netherlands not only have a religious function, but they have a strong social function as well. After the religious ceremony, migrants discuss possibilities for employment, legal statuses and other practical matters, and these information channels extend to Egypt (De Wit 2002a). Third, family formation and reunification are on the rise among Copts in the Netherlands as these are practically the only legal means to enter the country these days (De Wit 2002a).
Egyptian Muslims lack the religious clergy as a migration-stimulating category of people and have to rely on their personal networks. As they have not formed a tight community in the Netherlands, information is less well circulated and transferred to Egypt.
According to an informant, Copts in the Netherlands do not invest in Egypt because they do not feel safe there. Instead they invest in the Netherlands and have become a wealthy community. Muslims do invest in Egypt. They buy a house there if they can. They want to have independent accommodation when they are on holidays instead of staying with family. Going on holidays to Egypt is more complicated for Egyptians Copts. Copts do send many remittances. In fact, they send more money than Muslims because due to their religious identity, their families are usually in a worse situation than Muslims. Both Coptic and Muslim Egyptians also send philanthropic remittances. They see this as a moral obligation.
Copts in the Netherlands, unlike in the US, are not politically organised (De Wit 1997). In the Netherlands, no Egyptian transnational political organisation exists. According to an informant, many Egyptians support basic human rights organisations but they are afraid to be active because they see Egypt as a police state and they do not want to endanger their family members in Egypt through their actions. Moreover, they feel they cannot change anything anyway.
Nowadays, Egyptians usually come to the Netherlands by paying human smugglers large amounts of money to arrange visa and a small journey overland. More recently, Egyptians have also started to illegally cross the Mediterranean Sea by boat. Some stay in the Southern European countries where they arrive (mostly Italy) and others continue north.
6.4 Conclusion It remains difficult to classify Egyptian immigration to the Netherlands. There appears to have been large flows during the seventies and eighties which have gone down during the nineties and after the turn of the century. However, because the available official data only start in the nineties this decrease remains invisible. Since the nineties Egyptian immigration seems to have stabilized or even mildly increased, while our informants accounts indicate that immigration has decreased. Perhaps the fact that Egyptian immigration usually starts off as irregular migration is one of the reasons for these contradictory findings. Irregular migrants may for example have arrived during the eighties but only

48 Destination Netherlands: The Evolution of Migration from six origin countries to the Netherlands
managed to legalise their status (and consequently end up in immigration statistics) during the nineties. If we follow the accounts of our informants, Egyptian immigration to the Netherlands should be classified as established or declining. Coptic and Muslim immigration from Egypt to the Netherlands seem to form different ‘migration systems’ within the Egyptian-Dutch corridor. Perhaps Muslim Egyptian immigration can be classified as declining and Coptic Egyptian immigration as established.
Our informants tell us that most Copts speak Dutch, but that it might be difficult to interview some of the older Muslim migrants who have worked in the shawarma business their entire lives. The latter lack Dutch language skills beyond the scope of strict business necessities and do not usually speak English well. This means we would probably have to work with Arabic speaking translators. Nevertheless, Egyptian migrants seem willing to talk.
7. Brazil
7.1 Theoretical framework of Themis 7.1.1 Themis theoretical Framework
The migration flow from Brazil to the Netherlands is expanding. In the following graph we see the growing development of the first generation Brazilian population in the Netherlands from 1996 onwards, immigration and emigration taken into account.
Figure 17: Size population of first generation Brazilians in the Netherlands, 100=2009, 100=10,074 (Netherlands Statistics 201010)
To give a proper overview of the recent development within the Brazil-Netherlands corridor, the following graph shows the immigration and immigration numbers for 1995-2009. The Brazilian population residing in the Netherlands is growing.
10 Statistics Netherlands provides different numbers than the Brazilian Consulate in the Netherlands and different experts. They mention a total population of 25,000 migrants, including undocumented migration and second generation Brazilians. Even if we include the CBS numbers on second generation migrants, a discrepancy of around 10,000 remains which cannot all be explained by undocumented migration. Please note this uncertainty concerning the numbers. The growth of the population of Brazilian origin should however be apparent.

49 Destination Netherlands: The Evolution of Migration from six origin countries to the Netherlands
Figure 18: Immigration and emigration to and from the Netherlands of Brazilian born residents (Netherlands Statistics 2010)
7.1.2 Types of migration and motives
It might be important to note that the Netherlands is not a particularly popular destination for Brazilian migrants. Due to the language barrier and cultural differences, Brazilians are more likely to go elsewhere. The Netherlands could constitute a second best destination for Brazilian migration (Key informant, 2010). Most Brazilians wish to migrate to the UK but, especially nowadays after 9/11, it is harder to enter. Therefore, people ‘end up’ in the Netherlands (legally or illegally), or they attempt to make the transit later. Therefore, especially the pioneer migrants are likely to have ended up in the Netherlands after passing through other countries. It is less probable that they had chosen the Netherlands as their country of destination before leaving Brazil11.
Motives of migration for the pioneer migrants of the 1960s and 1970s differ12. According to our informants, these migrants were likely to have fled the military dictatorship in Brazil that lasted from 1964 to 1985. Other motives mentioned for these early migrants are work, family or study related.
In the 1980s we observe a change in migration motives. The financial situation in Brazil worsened and by the end of 1982 the Brazilian government was ready to sign an agreement with the IMF (Diaz-Alejandro 1983:529). During the 1980s and 1990s, facing a stagnating economy and successive economic crises, a mostly young population began to seek better economic opportunities elsewhere (Bógus 2007 in Internal Briefing Paper Brazil).
The following graph shows the recent development of migration from Brazil to the Netherlands in terms of motives.
11 Except for migration due to family related motives. 12 Since there is not any information available on the Brazilian migrants of 1930 we chose to analyse the migration in the 1960s and 1970s as pioneer migrants.

50 Destination Netherlands: The Evolution of Migration from six origin countries to the Netherlands
Figure 19: Immigration from Brazil divided by migration motives (Netherlands Statistics 2010)
Here we see very clearly that family related migration (41%) dominates. The large number of Dutch-Brazilian marriages could be an explanation for this. Labour migration constitutes 37% followed by study related migration with 16%. 4% migrated for other reasons and 1% for an internship or as an au pair. Demands for asylum from Brazil can be neglected. Several informants mentioned that irregular migrants have a predominantly labour related motive which is however not visible in the figure. As we can see in the graph, Brazilian migration to the Netherlands is expanding and the different motives that migrants have grow along proportionally.
7.1.3 Relevant statistical information
When looking at the Brazilian population in the Netherlands considering different variables there is one that is particularly striking: gender. 63,6% of all Brazilians in the Netherlands is female and only 36,4% is male. Brazilian migration to the Netherlands is therefore female-dominated. This number could have resulted from the high number of marriages between Dutch citizens and Brazilian women that surpasses the number of Brazilian (male) labour migrants (Consulate Brazil 2009). Network theories are to a lesser extent applicable to the migration of these women, who usually settle where their husbands live. The following graph shows the gender and age distribution of first generation Brazilians in the Netherlands.

51 Destination Netherlands: The Evolution of Migration from six origin countries to the Netherlands
-1000
-500
0
500
1000
1500
200019
95
1996
1997
1998
1999
2000
2001
2002
2003
2004
2005
2006
2007
2008
2009
Emigration
Immigration
Figure 20: Gender and age distribution of first generation Brazilians in the Netherlands in 2009 (Netherlands Statistics 2010)
It is important to note that there might be more people with Brazilian nationality in the Netherlands than is counted today. Of course there are undocumented migrants who are difficult to monitor, but there is another group that might slip from the grasp of the statistical bureau. There is a number of Brazilians with double nationality. If they are born in Brazil, they will appear as such when countries of birth are analysed. When observing migrants according to nationalities they will probably not appear13. Many Brazilians with Spanish and Italian roots have relatively easy access to that particular nationality. Having a grandparent of one of these origins might be enough to obtain the passport in question14. When counting immigrants per nationality, this group will not be counted as Brazilians because European citizens have a different way of entering (and residing) in the EU. They are for example exempted for the demanding ‘integration courses’. The number of these Brazilians is hard to estimate but this group should not be neglected. There are 6,151 Brazilians with a Dutch nationality but the number of Brazilians with another EU nationality remains unknown.
Irregular migration is hard to grasp. 15% of all Brazilians in the Netherlands are undocumented according to the Consul. He admits that this is a rather conservative guess. This would lead to a number of around 3.000 irregular Brazilians. A key informant, who conducts research among mostly undocumented Brazilian migrants in the Netherlands estimates that there are around 20.000 undocumented Brazilian migrants in the Netherlands, most of them in Amsterdam. The actual number should lie between these estimates.
13 In the figure first generation migrants are depicted using the ‘group of origin’ variable. The CBS definition does not provide decisive information as to whether the Brazilians with double nationality appear in these data. 14 In Italy having an Italian grandparent with the Italian nationality is enough to obtain the Italian nationality. In Spain the parent should have the Spanish nationality so it is possible for a grandchild to obtain the Spanish nationality after the parent obtained it. Please note that the procedure is complicated. Proof of the nationality ancestors is not always available and is hard to obtain. There are enterprises specialized in tracking back family history to obtain a European passport if possible.

52 Destination Netherlands: The Evolution of Migration from six origin countries to the Netherlands
7.2 Macro factors 7.2.1 Political and economic shifts
In this part several political and economic shifts in the Brazilian-Dutch migration corridor will be dealt with. These turning points encompass Brazil, the Netherlands and Europe in their entirety because not much is known about changes on a more local scale.
The military dictatorship lasted from 1964-1985 has led to an emigration of Brazilians to Europe and probably also the Netherlands. On economic crises and the aftermath of 9/11 Sandoval says: ‘Today, the political, social and economic crises of the (South American) continent, combined with new control policies of visas of the United States after September 11, make Europe an attractive destination.’ (Sandoval 2008:6) ‘In fact, since 2001 there has been an increase in the Latin American population in the Netherlands of 47%, compared to previous years’ (Sandoval 2008:9). If we take British harshening migration policies into account we suppose that more Brazilian migrants come to the Netherlands than previous years (Key informant, 2010). Logically thinking, these migrants would predominantly be without documents because Dutch immigration policies have also become much harsher recently. In general, border checks have tightened because many people overstay their tourist visas. The economic crises of the late 1980s early 1990s also have functioned as a push factor for migration. During this period the economy stagnated and inflation was high. Many young migrants migrated for labour related reasons. In 1994, the (new) real was linked to the dollar which led to more economic stability. Due to this it was easier for Brazilians to travel abroad and this might as well have led to more migration from Brazil. On the other hand, a stable currency might also diminish the need to migrate so this shift is rather ambiguous in its consequences.
Brazilian emigration policy is does probably not influence migration in the Dutch-Brazilian corridor. According to a key informant there is no particular emigration policy, as he said: “we cannot stop it and we will not facilitate it”. However, Brazil did construct an instrument to have a dialogue between the Brazilian Ministry of Foreign Relations and the Brazilian community abroad, Brasileiros no Mundo (Ministério das Relações Exteriores 2010).
Regarding the shifts in the Netherlands, there is one that stands out: the 2006 Civic Integration Abroad Act. This has already been mentioned in the general introduction to the scoping studies. The policy filters out people who cannot afford to take the exam and people with less ability to learn. Migration from most countries, including Brazil, has probably declined due to this policy. Another program that fits in the idea of limiting immigration is developed by the IOM.
The IOM offers a program for voluntary assisted return and reintegration for migrants. ‘It aims at orderly, humane and cost-effective return and reintegration of migrants who are unable or unwilling to remain in host countries and wish to return voluntarily to their countries of origin.’ Assistance is for example offered to unsuccessful asylum seekers, migrants in an irregular situation, migrants stranded in transit, stranded students and other persons under similar circumstances. Also undocumented migrants can make use of this program (IOM 2010). Assistances are not only offered in the country of departure but also in the home country aimed at reintegration. From January to October 2009, 263 Brazilians have

53 Destination Netherlands: The Evolution of Migration from six origin countries to the Netherlands
left the Netherlands with this program, making Brazilians the second largest group to benefit from this policy (IOM NL 2009).
7.3 Meso factors 7.3.1 Transnational activities
There are several transnational links concerning Brazilians in the Netherlands and Brazil and particular organisations.
Firstly, Orkut connects Brazilians all over the globe. Orkut is a social networking site like Facebook where one can join (discussion) groups. In April 2008, Orkut reached the number of 120 million users (Socialnetworks 2008) and 50,6% of its users is from Brazil (Orkut 2010). Oosterbaan (2010) realised the importance of this network for Brazilian migrants. A large body of information regarding immigration, integration and all other aspects of migrant life can be found on Orkut and its communities. Apart from Orkut there are other websites of significant value for Brazilians in the Netherlands. www.brasileirosnaholanda.nl contains everything related to the life of Brazilians in the Netherlands from the assisted return to Brazil by the IOM to Brazilian dance parties. One needs to log in to see all information. Orkut and ‘brasileirosnaholanda.nl’ function as informal networks that connect people transnationally. People use it to prepare their migratory track and the importance for migrants should not be neglected.
Besides online communities, there are organisations that connect Brazilians in the Netherlands to Brazilians elsewhere. A good example is Casa Brasil Holanda, a cultural organisation that recently has broadened its activities. Nowadays they provide information and support in all kinds of fields for Brazilians, regardless of their legal status in the Netherlands. The board of Casa Brasil Holanda is in frequent contact with organisations, both NGOs and authorities, in Brazil and elsewhere. They are member of the ‘Brasileiros no Mundo’ network and of the ‘Plataforma de Organizações Latino-Americanas’ (Casa Brasil Holanda 2010).
Besides cultural organisations, there is a substantial number of Brazilian churches in the Netherlands. Most of them are based in Amsterdam and Rotterdam but we find also churches in Enschede, Eindhoven and elsewhere. Churches are mostly Pentecostal, Evangelical or Catholic. One example of a church community is Comunidade Christã which has churches in Amsterdam, Rotterdam and Enschede. A church does not only have a religious function, people could also find work via those networks according to Oosterbaan. Sometimes people even sell jobs. Cultural organisations and churches are of great importance for transnational contact and usually encompass more than the regular functions one would attribute to these organisations.
Furthermore, Brazilians are also united on a global and European scale. In Europe there is a Network for Brazilians in Europe (Rede Brasileira na Europa). This is a platform organized for the cooperation between associations, groups, collectivities, and partners of Brazilian migrants in Europe (Rede Brasileira 2010). It is a way for migrants to exercise power over the Brazilian government. Besides the ‘Rede’ there is also a previously mentioned global network called ‘Brasileiros no Mundo’. In contrast to the European network, ‘Brasileiros no Mundo’ has been set up by the government.

54 Destination Netherlands: The Evolution of Migration from six origin countries to the Netherlands
Transnational activities of Brazilians and organisations are numerous. It seems that the activities grow along the growth of the population and that existing organisations mature. This could have positive effects on migration. There seems to be a Brazilian infrastructure forming in the Netherlands. Together with the relatively high wages for undocumented migrants this could have a pulling function for further migration.
7.3.2 Migration industry
It is possible to fly to Brazil from almost every large airport in Europe and Brazil has some airports with connections to Europe. Therefore, we see more migration from areas that have a good connection to Europe, and consequently the Netherlands. The possibilities to travel greatly influence migration flows or migration through the corridor. From Surinam it is possible to take several flights to the Netherlands so many people from the North travel this way. There are also many migrants in the Netherlands from the North East because of the direct travel opportunities. People also often leave form the region of Goias. From Brasiliá there is a direct flight to Lisbon by the Portuguese carrier TAP. From the southern region, many airlines offer possibilities to fly to Europe.
Another aspect of the migration industry has to do with Internet. Because transnational contact via the Internet has expanded rapidly, this has opened new possibility of ‘meeting’ people abroad. It is not uncommon for Brazilian ladies to meet their future boyfriend or husband online in a chat box and it happens more and more often because Internet has become more accessible. According to two Brazilian migrants, this happens regularly. Besides chatboxes, there are also enterprises specialised in Brazilian ‘mail order brides’. This phenomenon seems to be less developed and widespread than in Russia or Ukraine. However, a substantial number of women looking for men abroad was found on different websites.
7.4 Micro factors 7.4.1 First migrants
Not much is known about the first migrants who came from Brazil to the Netherlands. One source says in 1930, 39 Brazilians resided in the Netherlands (Netherlands Statistics). However, who these people were is nowhere to be found. The next data available on Brazilian migration dates from 1972. In that year 139 Brazilians migrated to the Netherlands. In the previous years, there were probably Brazilian migrants settling in the Netherlands as well but the data supporting this is unavailable. As motives for this early migration, a key informant mentioned fleeing persecution resulting from the military dictatorship and marital migration. Labour migration would only have started on a larger scale after the economic crises of the 1980s and 1990s.
7.4.2 Where from

55 Destination Netherlands: The Evolution of Migration from six origin countries to the Netherlands
Interviews with several experts have given insight in where Brazilian migrants come from although it remains difficult to identify specific flows of migration within the Brazil-Netherlands corridor. Interviewees mentioned different regions, but some were mentioned by everyone. The figure below gives an illustration of this information. It should be noted however that people also come from other regions in Brazil that do not appear in the figure. The sending ends of the corridor where Brazilians often migrate from are shown in the figure below.
Figure 21: Map of several sending regions of the Brazil-Netherlands corridor
Firstly, migrants come from the region of Pará, sometimes extended to Manaus in Amazonas. This is related to the proximity of Surinam. People leave from Amazonas and Pará, more specifically from the region around Manaus in Amazonas and the entirety of Pará. The route leads them via Belém and Paramaribo and Surinam to the Netherlands. The consul explicitly links this to a questionable kind of migration. Drug traffickers, gold seekers and trafficked women said to come via this route (Hazeu 2008), probably amongst other migrants.
The second region where people are said to come from is the North East. A reason for migration nowadays could be the relatively easy journey to the Netherlands. The direct flight from Fortaleza facilitates migration from the North East of Brazil, the regions of Maranhão, Piauí, Ceará, Rio Grande do Norte, Paraíba, Pernambuco, Alagos, Sergipe and Bahia. This area is very large when one considers all these regions, but migrants predominantly come from the coastal areas, what largely limits the area. A possible explanation for migration could be tourism from the Netherlands. There are many women who migrated after meeting their future husband in the touristic coastal area, for example in Natal or Fortaleza.

56 Destination Netherlands: The Evolution of Migration from six origin countries to the Netherlands
Thirdly, migrants come from the region of Goias. These people not only migrate to the Netherlands, traditionally they go to the USA or Spain. Many of these migrants are undocumented. Strikingly, this is confirmed by every migrant or expert on Brazil. In the Netherlands, such a group is present as well although in smaller numbers than in the USA or Spain. Naturally, not all undocumented migration comes from this region, but a key informant mentions that there are human trafficking gangs operating in that area. However, it can certainly not be seen as a region that exclusively delivers irregular migrants to the Netherlands and the rest of Europe.
Lastly, the Southern region is not mentioned by all interviewees yet by several. This migration in the Netherlands is said to come from the South of Brazil (Espírito Santo, Rio de Janeiro, São Paulo, Paraná, Santa Catarina, and Rio Grande do Sul). Traditionally these people leave because they have ancestors from southern and Eastern European countries. However, there are also migrants from this region in the Netherlands. In Amsterdam there seems to be a group of (undocumented) migrants from Curitiba (Paraná). There are also migrants from Rio de Janeiro there. There are migrants from other cities and areas in this region but it is impossible to mention those with certainty.
7.4.3 Where to
In May 2009, the Netherlands count 22,196 legal Brazilians in the Netherlands. 16,035 have the Brazilian nationality and 6,161 have double nationality. This population is not evenly distributed throughout the Netherlands although most of them could be found in the larger cities. Please note that these figures only encompass the legal migrants. Adding the undocumented migrants, these numbers are expected to be significantly higher.
Most of the Brazilians can be found in the Western part of the Netherlands (9.964). Amsterdam is the home of 3,569 Brazilians while 1,449 live in Rotterdam. The Hague and Utrecht follow with 1,498 and 527 Brazilian inhabitants. The second group, comprising 2,799 people, lives in the east of the Netherlands. 498, 269 and 138 Brazilians live in Enschede, Arnhem and Apeldoorn respectively. The consul links the Brazilian presence in Enschede to human trafficking and prostitution. Because Enschede is a city on the Dutch/German borders, some Brazilian women were trafficked there to work in prostitution. This way, they could ‘serve’ two countries. The third group of Brazilians live in the southern provinces (Zeeland, Brabant and Limburg). The largest concentrations are to be found in Eindhoven (462), Tilburg (184) and Breda (181) (Consulate Brazil 2009). The next figure illustrates these numbers.
When the notion specific migration flows within corridors was discussed with informants, it turned out that there is a substantial number of Brazilians from the North East of Brazil in the Eastern part of the Netherlands, especially in Enschede. Regarding the number above, this could be a group of maximally 498 documented people. If we include the undocumented migrants, the group could be larger, as police documents show that many Brazilians are appended in the Twente region (around Enschede). This flow has not been verified but it could be interesting to look into in further research.

57 Destination Netherlands: The Evolution of Migration from six origin countries to the Netherlands
Figure 22: Distribution of Brazilian born people in the Netherlands in 2009 (Netherlands Statistics 2010)
7.5 Assessment It is difficult to apply the corridor concept to Brazilian migration to the Netherlands. Brazil is an
enormous country without a much organised migration network directed towards the Netherlands.
Labour migration is often arranged within families. People would bring their brother or sister with them
(Key informant, 2010). Besides that, marital migration is scattered. However, the people (mostly
females) often meet their (future) husband in touristic areas. It could be that there are groups of
migrants to be found in certain cities but it remains unclear whether this confirms the theoretical ideas
related to the corridor concept. The available information shows where migrants have settled in the
Netherlands, but the regions where migrants come from cannot exclusively be linked to these
destinations. Key informants have given their ideas but they do not always overlap.
Another difficulty is that the ‘group’ is rather scattered. It is not possible to talk about ‘the
Brazilians’ in the Netherlands. Brazil is a rather large country with different people, habits and practices
in different parts of the country. In Brazil, the population is not homogenous, neither is the Brazilian
population in the Netherlands. One particular divide among migrants here is the illegal/legal divide.
Often people emphasise the differences between these groups, implying that there is a ‘stupid’
undocumented group of Brazilians that only thinks about money (Key informant, 2010). Besides that the
population is, as it is in Brazil, divided by skin colour. This divide is less strong that the previous
mentioned. Also concerning religion we can find lines separating the migrants. Churches (Catholic,
Evangelic and Pentecostal) have different members who do not mingle within the community. All these

58 Destination Netherlands: The Evolution of Migration from six origin countries to the Netherlands
issues make it difficult to talk about Brazilians in the Netherlands in general because there is no average
type.
All in all we could say that further research into the Brazil-Netherlands corridor will be challenging but
very interesting for theory formation nonetheless. Especially the notion of the Netherlands as a transit
country for migration to the UK could theoretically be very interesting.
8. Bangladesh
8.1 Theoretical framework of Themis According to the official data of Statistics Netherlands, there are only 633 first generation Bangladeshi migrants who live in the Netherlands. Figure 23 shows that the population of first generation Bangladeshis in the Netherlands has mildly grown over the last years.
Figure 23: Size of the population of first generation Bangladeshis in the Netherlands, source: Statistics Netherlands. 100= 2009, 100 = 633
According to these same data, there are another 629 second generation Bangladeshis who reside in the Netherlands. This means that there are a little over 1,200 officially registered Bangladeshis in the Netherlands. However, our informants estimate that the number of Bangladeshis in the Netherlands is much higher than that. According to a Bangladeshi migrant organisation located in the Netherlands, the number lies somewhere between 4,500 and 5,000. Another Bangladeshi organisation estimates the number to be at least 2,500. According to an educated guess of government officials and migration experts, the number of Bangladeshis in the Netherlands was 2,500 shortly after the turn of the century (Siddiqui 2003).
There are two important reasons for the large differences between the official numbers on the one hand and the estimations on the other. The first has to do with the fact that Bangladesh only became an independent nation in 1971. Between 1947 and 1971, Bangladesh was a province of Pakistan. This means that Bangladeshis who were born before 1971 are registered as Pakistanis. If we look at the age distribution of the officially registered Bangladeshis in the Netherlands, we can see that they are strikingly young. Bangladeshis older than 40 hardly exist, as they are registered as Pakistanis.

59 Destination Netherlands: The Evolution of Migration from six origin countries to the Netherlands
The second reason why the official numbers deviate from the expert estimations is that there are a number of irregular migrants among the Bangladeshi population. These are primarily men as females bring shame to their families in Bangladesh by migrating (Dannecker 2005). Men travel on their own and only bring their wives once they have settled down and managed to legalise their status. It is difficult to say how many there are, but our informants say that this number has been declining over the last years due to changes in government policies. Because of these changes, it has become very difficult for irregular Bangladeshi migrants to settle down and find a job in the Netherlands. They prefer to go to Portugal, Spain, Italy or UK because it is easier to get an illegal job there. Between 1997 and 2003, the police arrested 94 irregular Bangladeshi migrants. Most arrests took place in Amsterdam and at the airport.
Figure 24 indicates that although new Bangladeshi migrants still arrive, many leave the Netherlands as well.
Figure 24: Immigration and emigration of foreign born Bangladeshis to and from the Nethelands, source: Statistics Netherlands 2010
According to our informants and as confirmed by these statistics, in the last three to four years Bangladeshis have been leaving the Netherlands. There are several reasons for this trend. First, there are older migrants who return to Bangladesh to retire. As explained before, these do not show up in the official statistics because they were born in Pakistan.
Second, many Bangladeshi entrepreneurs are leaving for the UK and Belgium. They prefer to go there because controls on illegal work and tax payments in the Netherlands have become very strict. In the UK and Belgium it is easier to start a business and to avoid paying taxes by keeping part of the sales of the books. If they head for Belgium, they especially move to Antwerp. They do very good business there because they can hire employees illegally and because they can keep part of their business off the books. For this group of migrants the Netherlands is no longer a lucrative country so if they get the chance they leave. Some Bangladeshis also start a business in the UK or Belgium while they still own businesses in the Netherlands.

60 Destination Netherlands: The Evolution of Migration from six origin countries to the Netherlands
Third, Bangladeshis leave the Netherlands because it has become very difficult for Bangladeshis to marry in Bangladesh and bring their partner to the Netherlands. Aggravated requirements for family formation makes this procedure arduous and lengthy. Bangladeshis who want to marry someone from Bangladesh therefore go to Belgium and the UK because the procedures are easier in these countries.
Fourth, for the UK as a specific destination, there are two additional reasons why Bangladeshis in the Netherlands go there. The first is that they want to give their children a good education and they think it is better in the UK than in the Netherlands. The second is that there are no possibilities for children to learn Bangla as a second language in the Netherlands, while these are plentiful in the UK.
Although the official data indicate that the number of Bangladeshi immigrants has been relatively stable or even growing in the last few years, our informants indicate that the number is declining. They assert that there are still migrants who come to Europe in spite of all the restrictions, but the Netherlands is not a target country for Bangladeshi migrants anymore. A possible reason for the increase in Bangladeshi immigration in 2008 and 2009 could be the amnesty for asylum seekers and rejected asylum seekers that was issued in 2007. Our informants indicate that there were some Bangladeshis who received this amnesty. This means that they are not newly arrived migrants, but older migrants who have managed to legalise their status. This does not mean that there are no new arrivals though. There are still migrants in Southern European countries who have a legal status there but they want to come here because the wages are higher. In contrast to these southern Europeans, irregular migrants or new migrants from Bangladesh hardly migrate to the Netherlands anymore.
According to the official data, Bangladeshi migration to the Netherlands can be classified as starting. However, the official data are probably incorrect. If we follow the accounts of our informants, Bangladeshi migration to the Netherlands can probably best be qualified as stagnating or declining. If we consider the fact that Bangladeshis are leaving because of the lack of Bangla language facilities and attractive employment options, it seems that Bangladeshi migration has not reached the necessary threshold level for migration to rapidly expand. It seems that Bangladeshi migration to the Netherlands has never really grown into a full blown ‘migration system’, which makes it likely that stagnating is the best description.
8.1.1 Migration history and motives
According to one of our informants, the first Bangladeshi migrant who arrived in the Netherlands had first come to England by boat and from there he continued to the Netherlands in 1963. Later that same year, a handful of other Bangladeshis arrived who had also travelled through England. It remained quiet for a few years and then after 1971, when Bangladesh was liberated from Pakistan, a few Bangladeshi migrants arrived, again via England. These pioneer migrants were students, artists, diplomats and political dissidents (see also Knights and King 1998). In 1975, one family applied for and received political asylum.
Bangladeshi migration to the Netherlands started to grow between 1985 and the early nineties. Mainly young men in their late twenties or early thirties arrived during this period. All of them applied for political asylum and most of them succeeded. Some had indeed migrated for political reasons while

61 Destination Netherlands: The Evolution of Migration from six origin countries to the Netherlands
other migrants had been inspired by economic motives (see also Khondker 2004). According to our informants, this appears to be the largest wave of Bangladeshi migrants to the Netherlands.
From the early nineties onwards, Bangladeshi immigration to Europe really started to take off and the Netherlands was one of the target destinations. This was a huge flow consisting largely of young men. Among them was a large number of false asylum applicants. They claimed to belong to a minority group in Bangladesh which they did not. Most asylum requests were denied and the Bangladeshi applicants continued their lives in the Netherlands as irregular migrants or they tried to apply for asylum in other European countries.
Bangladeshi migrants who came during the nineties started to work in restaurants to do cleaning work. After a few years of hard labour many became restaurant owners in Dutch large cities. This way, migrants who came through illegal ways managed to settle down legally. At that time it was a lot easier to become legalised than it is today. In the mid nineties many young Bangladeshis received amnesty and some engaged in bogus marriages in order to receive a legal status.
Apart from these larger flows, there were some minor flows of individuals who migrated to the Netherlands because they are professionals and had job opportunities in the Netherlands. After a few years they applied for permanent residency. In addition, there have been and continue to be some Bangladeshi students, but their numbers have never been large.
Research by Siddiqui (2003) indicates that migrants are attracted to Europe by better educational opportunities for their children, access to specialised jobs, better health care systems and wider opportunities for ‘self-actualization’. Our informants give similar accounts to those of Knights and King (1998: 305), who assert that Bangladeshis appear “surfers riding the waves of opportunity sweeping them from one part of Europe to another. Asylum opportunities, amnesties, immigrant training schemes, study bursaries, legislative loopholes, lax border controls, friendly administrations and, of course, job opportunities were the incentives luring Bangladeshis first to one country or city and then to another.” Before they leave Bangladesh, migrants collect information on where the best possibilities are to be found. Currently, migrants prefer to go to Southern European countries like Spain or Italy because it is relatively easy to find illegal employment and to legalise their status there. During the eighties and early nineties the Netherlands was an attractive country to go to apply for asylum. If they were denied, they would re-apply in another European country. This is not possible anymore because fingerprints are now registered in a European database.
8.2 Macro factors 8.2.1 Policy changes in the Netherlands
In the Netherlands, several policy changes has made life for Bangladeshis more complicated. Our informants speak of increased controls on illegal employment and tax payments which have become so frequent that Bangladeshi entrepreneurs can no longer keep illegal workers in their restaurants, and that they can no longer keep revenues off the books. The fines have also become very high, sometimes 24.000 euro. This is the main reason why Bangladeshis stop to do business in the Netherlands and move to the UK or Belgium.

62 Destination Netherlands: The Evolution of Migration from six origin countries to the Netherlands
Furthermore, it has become more difficult to get a legal status. In the past, many bogus marriages took place. As this has become more difficult, it hardly occurs anymore. Asylum requests are rejected on the first day and as fingerprints are registered it has become more difficult to live as an irregular migrant after that without running the risk of being expelled once caught.
In addition, it is very difficult to bring family members, a spouse, or a friend from Bangladesh to the Netherlands. The Dutch embassy in Bangladesh has a reputation for being strict. Some students manage to get a student visa but it is very difficult to get a tourist visa or family reunion or formation. Bangladeshis who want to marry a Bangladeshi spouse therefore move to other countries.
8.2.2 Political and economic shifts in Bangladesh
Bangladesh was colonised by the British until 1947. Pakistan’s neo-colonial rule over Bangladesh lasted until 1971 when Bangladesh became an independent nation. A few years later, military dictatorship gained power in Bangladesh. Civilian rule was returned in 1990 and transformed the country into a parliamentary democracy (Van Schendel 2009). Bangladesh is still a very poor country. Half of the population lives below the official poverty line. Wages are low and corruption and bureaucracy make life frustrating. Two-thirds of Bangladeshis work in agriculture, a sector generating only one-fifth of GDP. Furthermore, employment options for young well-educated people in Bangladesh are limited, while the level of education of the population has grown (Zeilyn 2006).
As there are not jobs for everyone, the Bangladesh government actively promotes labour emigration. Labour migration is seen as a way to alleviate unemployment and to generate foreign income (Jureidini 2001, cited in De Bruyn and Kuddus 2005). Bangladesh is now one of the major labour-sending countries of the world (Siddiqui 2005).
Although the Bangladesh government actively promotes labour migration of Bangladeshi men, laws have been put forward since the 1980s to keep women from emigrating (Dannecker 2005). It was argued that women’s honour could only be protected if women were not allowed to leave their families. In 1988 the order was lifted which led to an increase of women’s migration. In 1997 a new ban was announced, which was even stricter than the first, making “autonomous migration, which means crossing the border without male guardians”, absolutely forbidden (Dannecker 2005:657). This ban on female emigration has now been released again but the recruitment procedure remains more complicated for women than for men (Dannecker 2005), and women under 35 are still not allowed to migrate on their own (Siddiqui 2005). Due to these restrictions, few women migrate as contract workers (only 2% of the total flow). Instead, they primarily move as irregular migrants (De Bruyn and Kuddus 2005; Dannecker 2005).
8.3 Meso factors 8.3.1 The Bangladeshi community in the Netherlands
Most Bangladeshis in the Netherlands live in urban areas like Amsterdam, Rotterdam, The Hague, Eindhoven and Groningen. There are a good number of educated professionals in Eindhoven because of

63 Destination Netherlands: The Evolution of Migration from six origin countries to the Netherlands
the Electronics corporation Philips. In terms of migration, there are no links between specific sending areas in Bangladesh and receiving areas in the Netherlands. Bangladeshis in the Netherlands come from all over Bangladesh.
Many Bangladeshis have started their own business. They do this because otherwise they have to do cleaning or production work as they lack credentials they can use in the Netherlands. They start restaurants, cleaning businesses, small supermarkets, import-export businesses, and some trade in textiles. Most Indian restaurants in the Netherlands are in fact Bangladeshi-owned. There is no system according to which Bangladeshis help each other to set up a business.
Our informants refer to Bangladeshis in the Netherlands as a ´tight community´. They say Bangladeshis highly value this community and that social bonds are strong. For the older generation, there is also a strong sense of district identity. In addition, regular and irregular migrants associate with each other. The irregular migrants usually work for the regular migrants and they pay them less than minimum wage but our informants say that people are generally treated well. They are paid enough money so that they can send remittances.
The Bangladeshi population in the Netherlands is largely comprised of men, many of whom are single. According to the official data, 219 Bangladeshi first generation men are not married whilst 80 are. For women this is the other way around as 98 are not married and 214 are married. Families in the Netherlands are not very large.
Indian Bengoli migrants, who speak the same language and have the same cultural background as Bangladeshis, mostly live in Eindhoven because they once came to work as professionals for Philips and settled down. According to our informants, they are better qualified than the Bangladeshi migrants. There are some contacts between Bangladeshi and Indian Belgoli´s at a personal level. One informant says that the Indians think they are superior to Bangladeshis people so it is difficult to get along. And of course there is the difference in religion as the Indians are Hindus and Bangladeshis are mostly Muslims. There used to be an organisation of Indian Bengolis in Eindhoven of which Bangladeshis were also members but there were too many issues, so the Bangladeshis left the organisation.
8.3.2 Transnational ties
Bangladeshis in the Netherlands maintain strong ties to Bangladesh and keep frequent contacts with family members and friends there. According to one of our informants “everyone has satellite television”. If they can afford it, most people go on holidays to Bangladesh every other year. In addition, practically all Bangladeshi migrants send remittances.
Most Bangladeshis send remittances through informal channels which is riskier and illegal, and they are usually not aware of the facilities provided by the Bangladesh government. An informant tells us that in this sense there are two kinds of migrants: temporary and settled migrants. Temporary migrants send more remittances than migrants who settle down. Temporary migrants do not come from good backgrounds so what they do is save as much money as possible, and send almost 80% of their income to their family in Bangladesh. However, most migrants in the Netherlands are settled. Netherlands is not

64 Destination Netherlands: The Evolution of Migration from six origin countries to the Netherlands
an ideal country for temporary migrants. Temporary migrants can be found more in the UK or Italy as it is much easier to escape the police. The migrants who have settled down send fewer remittances because they have to have to keep a standard of living in the Netherlands and because their families in Bangladesh need it less. They send money occasionally, like twice a year. Apart from these personal remittances, Bangladeshis also send philanthropic remittances.
Remittances stimulate further migration from Bangladesh. This is because new migrants may have some problems in the initial stage but after a while they all send money back, also the irregular migrants. They pay back the loan they have taken out with middle men. They make for example 1,600 euro and they send 1,000 euro home each month. In spite of all the restrictions, migration to Europe therefore seems very much worthwhile.
Everywhere in Europe, Bangladeshi migrants fight amongst each other over political issues. There are two important parties in Bangladesh: the government party and the opposition. And there is Jamaat-e-islami which is not that big anymore. In the Netherlands people do not support this extremist party but the other two are very much present. They have their own committees here which are sponsored from Bangladesh. Leaders from Bangladesh come there to discuss at meetings. In this sense Bangladeshis are very much engaged in political transnational activities. Bangladeshis of the different parties frequently clash over political issues. In addition, within the party that is in power there are different divisions and they fight as well. During the last meeting they threw chairs at each other. But an informant says however that it is not as serious as in the UK or in the USA. The second generation is not that interested in politics. Only the ones who came during the 8os and 90s engage themselves in political transnational activities.
Most Bangladeshis in the Netherlands have family members in other European countries with whom they stay in touch and exchange information. They visit each other as well. They keep each other up to date about possibilities in different countries. They check and double check all information before moving to another country. This means that in order to understand Bangladeshi migration to the Netherlands, we should not only look at the transnational ties between Bangladesh and the Netherlands but include transnational ties between Bangladeshis other European countries as well.
Bangladeshi migrants use all means available to come to western Europe. They come through the Mediterranean sea, Morocco, through Eastern Europe, Poland. It is easy to obtain a visa for eastern European countries. Embassy staff is also involved in issuing visa for money (Key informant, 2010). Human smugglers ask between 10.000 and 20.000 euro for a journey to Europe. The human smugglers guide them and tell them what to do, when to do it and who will receive them.
8.4 Assessment Bangladesh seems an interesting case for studying stagnating migration. At the same time, even though Bangladeshi migration to the Netherlands has never really taken off, there seem to be ‘system dynamics’ at play on a European level. Through transnational social networks, Bangladeshis actively exchange information about attractive destinations and form tight communities in the destination

65 Destination Netherlands: The Evolution of Migration from six origin countries to the Netherlands
countries. While this may have led to a stagnating flow to the Netherlands, other destinations are on the rise.
However, there are some practical issues to bear in mind when studying Bangladeshi migration. Our informants do not agree on the feasibility of getting Bangladeshi migrants to talk to us. One informant raises serious doubts because as many Bangladeshis have somehow engaged in something illegal (tax evasion, illegal employment, false asylum applications) they are reluctant to talk. In addition, they do not like to talk about their sometimes difficult migration history. The other informant wants to help with contacts and does not think that migrants will be unwilling to talk. A concern we have is that most Bangladeshis do not speak any Dutch and that the lowly educated do not speak English well either. This would mean we would probably have to work with translators.
9. Ukraine
9.1 Theoretical framework of Themis 9.1.1 Themis theoretical framework
Migration from Ukraine to the Netherlands can be referred to as starter migration that has not yet established a clear pattern of growth or decline. Figure 25 shows recent developments in the Ukrainian-Dutch corridor.
In 1996, 21 Ukrainian migrants were registered in the Netherlands. This number grew to 578 in 2009 (Fig. 26). Yearly, twenty to a hundred Ukrainian migrants add up to this number. The total number of first generation Ukrainians in the Netherlands is slowly increasing, as is shown in figure 25 (Netherlands Statistics, 2010; Shakhno & Pool, 2005). Next to this registered number of Ukrainian migrants, there is a substantial number of irregular Ukrainian migrants residing in the Netherlands.
Figure 25: Immigration to and emigration from the Netherlands of Ukrainian born residents (Netherlands Statistics, 2010)
-40
-20
0
20
40
60
80
100
120
1995
1996
1997
1998
1999
2000
2001
2002
2003
2004
2005
2006
2007
2008
2009
Emigration
Immigration

66 Destination Netherlands: The Evolution of Migration from six origin countries to the Netherlands
Figure 26: Size population of first generation Ukrainians in the Netherlands, indexed (100=2009, 100=578) (Netherlands Statistics, 2010)
0
20
40
60
80
100
120
1996
1997
1998
1999
2000
2001
2002
2003
2004
2005
2006
2007
2008
2009
9.1.2 Statistical information
Retrieving statistical data on the Ukraine-Netherlands migration corridor is problematic. In the first place, statistics on the Ukrainian diaspora in the Netherlands do not include irregular migrants. Including irregular migrants, the total Ukrainian diaspora in the Netherlands has been estimated at 5,000 in april 2004 (Ukrainian Embassy in the Netherlands; Shakhno & Pool, 2005). This number makes a striking difference compared to the official statistic (378 in 2004 registered by Netherlands Statistics). Partly, this concerns irregular migrants and the other part can be explained by the second problem concerning data on Ukrainian migration to the Netherlands.
Figure 27: Estimated first generation Ukrainian population in the Netherlands (Based on Chkalova et al., 2008; Netherlands Statistics, 2010).
0
1 0 0 0
2 0 0 0
3 0 0 0
4 0 0 0
5 0 0 0
6 0 0 0
7 0 0 0
8 0 0 0
1 9 9 0 1 9 9 2 1 9 9 6 1 9 9 7 1 9 9 8 1 9 9 9 2 0 0 0 2 0 0 1 2 0 0 2 2 0 0 3 2 0 0 4 2 0 0 5 2 0 0 6 2 0 0 7 2 0 0 8 2 0 0 9

67 Destination Netherlands: The Evolution of Migration from six origin countries to the Netherlands
The second statistical problem lies in Ukraine’s recent independency. The numbers registered by Statistics Netherlands only represent migrants who were born in Ukraine. Migrants who were born before Ukraine existed as an independent state, are registered as citizens of the ‘former Soviet Union’. Therefore, the statistics underestimate the total number of migrants of Ukrainian origin in the Netherlands. Netherlands Statistics recognizes this ambiguity and has tried to divide migrants from the former Soviet Union countries according to what would be their current country of origin (Chkalova et al., 2008). This could be done by looking at their place of birth. In 2005, 35,060 first generation migrants were registered with ‘former Soviet Union’ as their home country. After the classification, the total number of Ukrainian migrants registered as coming from the former Soviet Union was approximately 5,600 in 2005. If we assume this share has been stable over the years and adding up registered Ukrainians, the population of first generation Ukrainians in the Netherlands has developed as illustrated in figure 2715.
9.1.3 Types of migration
The Netherlands have never been a traditional centre of Ukrainian settlement. Studies indicate that the earliest migration from the region we would now call Ukraine to the Netherlands took place in the 17th century when young Ukrainians came to study at Dutch institutions of higher education (Kohut, 1994). During the Russian civil war after the Russian revolution of 1917, probably a few hundred wealthy Ukrainians ended up in The Netherlands. The Ukrainian S.S.R. in the 20s and 30s suffered from famine. As a result, some Ukrainians migrated to the Netherlands. Amongst them, there were several political refugees who had openly pursued Ukrainian independence and were persecuted by the Stalinist regime. The exact number of Ukrainians who migrated before the Second World War remains unclear because they were registered as Russians (Key informant, 2010).
During the Second World War, Dutch men were employed in Germany: this was called ‘Arbeitseinsatz’. Also, young women from the conquered areas of the Soviet Republic were employed in Germany. A large share of those women came from the Ukrainian S.S.R. as this region was the first to be conquered by the advancing German armies. Although contact between people of the Slavic and Germanic race was prohibited, approximately 4000 Dutch men brought back Russian/Ukrainian brides to the Netherlands after the war. It is not clear how many of them were Ukrainian, because they were all registered as originating from the Soviet Union (Kalinka, 2004).
A subsequent flow of migration from the Ukrainian S.S.R. took place when ‘perestroika’ was instigated in 1985. The Chernobyl disaster of 1986 allowed complete Ukrainian families to migrate to the Netherlands based on humanitarian basis. Besides this event, some Jewish Ukrainians applied for asylum in the Netherlands because they were severely discriminated in Ukraine. Other Ukrainians strategically used discrimination as a reason to apply for asylum in the Netherlands. They have tracked back their Jewish roots in order to obtain a refugee status. A few thousand Ukrainians came to the Netherlands in the
15 Assuming that the share of Ukrainian migrants as part of all the migrants origination from the former Soviet Union has been a stable 16% as it was in September 2005 according to Chkalova et al. (2008). We added up the official numbers of first generation Ukrainian migrants according to the CBS (2010).

68 Destination Netherlands: The Evolution of Migration from six origin countries to the Netherlands
period from 1985 to 1991. They were also registered as coming from the Soviet Union (Key informant, 2010). When the Soviet Union dissoluted, it was no longer possible for Ukrainians to come to the Netherlands with a refugee status. Since then, migration of complete Ukrainian families to the Netherlands no longer took place.
After 1991, the importance of family formation and –reunification as a motive has been growing and asylum as a motive has been declining (Chkalova et al., 2008). Currently, the largest group of Ukrainians who migrate to the Netherlands concerns women. They come to the Netherlands to live with their Dutch partners (Chkalova et al., 2008; Netherlands Statistics 2010) This group consists of a few thousand migrants so far (Key informant, 2010). Ukrainian women tend to seek foreign (mainly Western) partners as a result of the Ukrainian history and the gender relations that stems from this history. Due to the Second World War, a quantitative women surplus arose in Ukraine. Competition amongst Ukrainian women to find a partner grew. Slavic men became lax, and continued to be in subsequent periods. Foreign men became attractive for Ukrainian women which led to emigration.
After 1985 when migration became possible and Ukraine was a poor country, an increasing amount of Ukrainian women looked for partners abroad. Most of the women who seek Western partners come from larger Ukrainian cities where internet is available. The internet – that over the last decade became accessible for a growing number of people - facilitated contacts abroad. Most Ukrainian women do not specifically aim for a Dutch partner. This is in contrast with homosexuals who aim for Dutch partners because they are aware of the Dutch tolerance towards homosexuals.
Next to this type of migration, migration motives are labour and education. Due to the restrictive Dutch immigration policy, it is hard for Ukrainian labour migrants to obtain a work permit (Shakhno & Pool, 2005). Therefore, most Ukrainian labour migrants work temporarily and illegally (Shakhno & Pool, 2005). They participate in agricultural work, construction, small-scale production and in the harbour. Sometimes they participate in illegal activities such as hemp farms (Katchour, 2008).
Lastly, several cases of human trafficking of Ukrainian women are known. A small number of them are expected to have ended up in The Netherlands, for example in prostitution (Hughes and Denisova, 2001). Most migrants originating from the Western Republics are between 20 and 30 years of age (Chkalova et al., 2008). These numbers confirm that migration mostly concerns individuals or partners instead of families with children.
9.2 Macro factors 9.2.1 Migration policy and visa
When Ukraine was a part of the Soviet Union, emigration to countries outside the Soviet Union was strictly limited (Malynovska, 2006; Cipko, 2006). When perestrojka was instigated in 1985, emigration became sparsely possible. After Ukraine became independent, emigration policy has been of laissez-faire nature (Shamshur & Malynovska, 1994). Factors impeding migration from Ukraine to the Netherlands are related to the Schengen agreement.

69 Destination Netherlands: The Evolution of Migration from six origin countries to the Netherlands
Reality is that only a few Ukrainian migrants use this visa-procedure to come to the Netherlands. The largest share of the current (legal) Ukrainian immigrants come to the Netherlands on the motive of family formation. In order to get a residence permit, both partners have to meet several terms and pass a procedure (see §3.3 for details). For Ukrainian labour migrants it is hard to obtain a work permit in the Netherlands via the legal procedure. As a result, most of their labour migrants reside in the Netherlands illegally. A case in point is a special agreement Ukrainian labour migrants use to work in the Schengen area. After Poland joined the European a special labour agreement between Ukraine and Poland remained in order. This made it possible for Ukrainian workers to work in Poland for a maximum of three months every half-year without needing a work permit (Van Heeckeren, 2008). Some of these workers make use of the open borders and come to work in other Schengen countries as the Netherlands. There are some reports on a few hundred Ukrainian labour migrants in the Westland region, where they participate in agricultural labour and the Rotterdam harbour (Key informant, 2010). Although those migrants do not have a legal status, this special visa protects them from being prosecuted or banished as a result of police checks.
9.2.2 Political and economic shifts
The most important turning point is Ukraine gaining independence in 1991. Since then, Ukraine has struggled with an arduous transformation towards a parliamentary democracy and market economy (Cipko, 2006). Ukraine experienced major recession during the 1990s when the Ukrainian government started economic reforms towards privatization. From 2000 on, the country’s GDP started to grow for several years, but its economy was greatly affected by the crisis of 2008. The unemployment rate increased and the socioeconomic situation of many Ukrainian households worsened (CIA, 2010). This context became an incentive for migration towards countries among which the Netherlands at the end of the 1990s. It is hard to obtain a work permit to come to the EU, but many Ukrainian women looked for a better future with a partner abroad.
Other political shifts occurred in 2001 and 2002 with the regularization of undocumented immigrant workers in respectively Portugal and Italy. This offered Ukrainian migrant workers a real alternative to an illegal stay in other EU countries (Baganha et al., 2004; Kramer, 2008). In the same year, the Netherlands introduced more strict immigration- and integration policies. Due to this shift, migration towards the Netherlands in general declined, it can be expected that this applies for migration from Ukraine as well. Also, police checks on illegal labour migrants intensified. As a result of those political changes, most Ukrainian labour migrants choose to migrate to Southern European countries (Kramer, 2008).
9.3 Meso factors 9.3.1 Ukrainian community in the Netherlands
There is no tightly knit Ukrainian community in the Netherlands (Kohut, 1994; Key informant, 2010). As explained in § 9.1.2, different flows of migration to the Netherlands can be distinguished. The oldest

70 Destination Netherlands: The Evolution of Migration from six origin countries to the Netherlands
living first generation Ukrainians in the Netherlands are the women who migrated to the Netherlands just after the Second World War to marry Dutch partners.
In the post-war years, rumour had it that Stalin would reprise the ‘Ostarbeiterinnen’ for patricide. He started a repatriation mission to force the women to return to the Soviet Union (Key informant, 2010). Because they feared to be forced to come back to Ukraine, the women were afraid to get in touch with their Ukrainian family members and friends, let alone visiting them. In the Netherlands they had to adjust to the Dutch culture. In the first years after the war, the women were lacking strong transnational ties with Ukrainians in their homeland or in other countries and were usually fully assimilated in Dutch society (Kohut, 1994). In the period of 1945-1951 only 35 Soviet citizens returned to the Soviet Union, among which 24 women (Kalinka, 2004).
In 1953, Chroestjov became leader of the Soviet Union. He proclaimed amnesty to all Soviet citizens who had worked in German labour camps. In 1955, Chroestjov set up a committee to urge those Soviet citizens to return to their home country. Only 41 Ukrainian-Dutch families returned in the period from 1955 until 1958. For many of them it was hard to settle down and they returned to the Netherlands (Kalinka, 2004). From the 1960s on, visiting the Soviet Union became possible as well as mail and telephone contact.
Despite all those setbacks, many Russian/Ukrainian women in the Netherlands gathered in Russian/Ukrainian dance and music groups. This way they could support each other and cherish their culture. Also some previous migrants who came to the Netherlands during the first World War and the Russian revolution joined. Russian/Ukrainian folklore groups existed in Rotterdam, The Hague, Amsterdam and Groningen. Besides those groups, the Ukrainian women were welcomed in the Russian orthodox church that has existed in the Netherlands since 1763 (Kalinka, 2004).
A number of recent migrants who came to the Netherlands after 1985 have joined the existing Russian/Ukrainian folklore groups and churches as well. Geographical and generational differences are partly overcome amongst Russian/Ukrainian migrants in the Netherlands. Through new flows of migrants and second generation Russians/Ukrainians, these organizations are kept alive. The two largest folklore groups in the Netherlands are Kalinka in Rotterdam and Roesalka in the region of Twente. There are Russian orthodox churches in Amsterdam, Rotterdam and other large Dutch cities.
9.3.2 Transnational ties
First generation Ukrainians in the Netherlands have ties with their home country. They are aware of political and economical events, sometimes use their right to vote in Ukraine and still consider themselves Ukrainian. Most of the ties with their country of origin involve family members and friends. They have contact by mail, email and telephone and try to visit Ukraine on a regular basis (Key informant, 2010).
Most Ukrainian migrants in the Netherlands also feel an obligation to support their families in Ukraine financially. This is most strongly felt by Ukrainian women who left older children who study or work in Ukraine. Next to this, the pension system in Ukraine is poorly developed and there are not many elderly

71 Destination Netherlands: The Evolution of Migration from six origin countries to the Netherlands
homes. Children have an official obligation to take care of their parents when they become needy (Key informant, 2010). This is why many Ukrainians in the Netherlands send back money to their families.
Money transfer services as Western Union are not used often. Most Ukrainian migrants open a bank account for this purpose and send a debit card to their relatives. This is a cheaper and safer way. Another way to send money and gifts to Ukrainian relatives is by courier. These are Ukrainian migrants with a residence permit who can travel back and forth (Katchour, 2008). Also, Ukrainians give their relatives gifts when they visit Ukraine. Sometimes they pay their family members to visit the Netherlands. How much money is sent back to relatives, differs between Ukrainian migrants in the Netherlands. The total amount of remittances sent from the Netherlands to Ukraine remains unclear. Only estimates on the total amount of remittances received in Ukraine are available (Internal Briefing Paper Ukraine, 2010).
There are some reports of business taking place by Ukrainian migrants between the Netherlands and their home country. There is some import/export and outsourcing of ICT services to Ukraine. An example of business by migrants is ‘Oost West Handel’, a Russian/Ukrainian/Dutch company that offers consultancy services for Western business in Russia and Ukraine (www.oostwesthandel.nl).
For Ukrainian women who seek a Western partner or vice versa, several mediation offices and websites exist. For example, there are www.agency-exclusive.com and www.crimeanpearls.com. They are websites from Ukrainian mediation offices that include Dutch pages to match Ukrainian women to Dutch men. The Ukrainian agency that exploits the websites, offers information about Ukraine, translation of letters, a gift service, Dutch language courses and advice concerning the Dutch immigration procedure. The agency also organizes trips on which Dutch men are introduced to several Ukrainian women in person. As our key informant confirms, not all of those organizations are trustworthy.
9.3.4 Transnational networks
It is difficult to draw a map of Ukrainian migration towards the Netherlands because the largest share of migrants who came to the Netherlands over the last decades, did not specifically aim or plan to come to the Netherlands.
Ukrainian women who met their Dutch partners in Germany during the Second World War, originated from different regions in Ukraine. In the Netherlands, most of them ended up in the Randstad region: Amsterdam, Rotterdam, Den Haag and Breda. These cities are indicated on the map of figure 28 by red circles. This is because most Dutch men who worked in Germany were recruited in those larger cities.
A second group of Ukrainians who ended up in the Netherlands in that period were Ukrainian prisoners of war who fled for the Stalinist regime after the Second World War. A large number of them were employed in the textile industry in Twente: in the municipalities of Enschede and Hengelo (Key informant, 2010). This is indicated in figure 28 by the green circle.
Women who migrated to the Netherlands after 1991 on the motive of family formation, mostly originate from larger Ukrainian cities, that are mentioned on the map of Ukraine. To meet a Western

72 Destination Netherlands: The Evolution of Migration from six origin countries to the Netherlands
partner, they need to have internet access, speak some English and come in contact with mediation offices. In the Netherlands they usually settle where their Dutch partner lives.
Figure 28: Map of several receiving regions from the Ukrainian-Dutch corridor
Literature suggests that most Ukrainian labour migrants in Western Europe come from Western parts of Ukraine. The main reason for this is regional differences in Ukraine, with in Western Ukraine a higher level of unemployment, lower salaries and closer links with European countries (Kramer, 2008; Shakhno & Pool, 2005). This region is indicated in fig. 29 in blue. In the Netherlands they settle in areas where work is available such as the Westland region and the Rotterdam harbour (both indicated in figure 28 by the blue circle).

73 Destination Netherlands: The Evolution of Migration from six origin countries to the Netherlands
Figure 29: Map of several sending regions from the Ukrainian-Dutch corridor
Overall, the geographical dispersal of migrants from Ukraine over the Netherlands differs for different flows of migration. Currently, most Ukrainian men settle in the Randstad and large cities, while women are more spread across the country.
9.4 Micro factors 9.4.1 Irregular migration
In practice it is difficult for Ukrainian citizens to obtain a visa in the Netherlands: they are seen as potential irregular migrants, unless proven otherwise. For example, Ukrainians who apply for a tourist visa are required to provide documents that prove that they will not stay in the Netherlands for work, such as a letter from their employer stating their current salary, a bank account statement and information about having a spouse and children (Shakhno & Pool, 2005).
Many Ukrainians applied to other Schengen embassies than the Dutch one as rumour goes along that it is harder to obtain a visa in the Netherlands. If one’s request is denied in one of the Schengen countries, it is harder to obtain a visa in one of the other Schengen countries afterwards. The fear of refusal makes migrants start to seek any kind of insurance in opening a visa by mediators. In 2002 the Dutch Embassy in Ukraine stopped cooperating with tour agencies. Now those kinds of mediators have raised their prices for organizing visa and some of them have widened their service with smuggling people abroad. In Austria and Greece for example, lively forgery circuits exist (Key informant, 2010). Often, Germany is the first country of entry and the majority of tour agencies organize tours and visa for Germany (Shakhno & Pool, 2005).
Except for labour migrants, there is also a group of female irregular Ukrainian migrants. They came to the Netherlands on the motive of family formation but split up before they achieved a permanent

74 Destination Netherlands: The Evolution of Migration from six origin countries to the Netherlands
residence permit. Some of those women did not return to Ukraine, but chose to stay in the Netherlands with an illegal status.
Police data on apprehensions of irregular migrants in the Netherlands show that in the period from 1997 up till 2003, 2077 irregular Ukrainians were apprehended. This number includes some people who were apprehended multiple times over that period. Most of them were apprehended in the Randstad and were between 20 and 30 years of age. This is in line with general data on Ukrainian immigrants (Chkalova et al., 2008) and the information we found on irregular labour migrants and women who were split up with their Dutch partners.
9.4.2 Labour migration
As a result of restrictive policy, the legal opportunities for Ukrainians to live and work in the Netherlands are limited. Also with the intensified monitoring of illegal employment in the Netherlands during the last few years, it became more difficult for irregular workers to find jobs, and nowadays they often have jobs for a shorter period than they used to have before. Also, new arriving labour migrants sometimes need to ‘buy’ their first job from an earlier migrant (Kramer, 2008). Nonetheless, many Ukrainians still try to gain a better future as zaboritsjani (labour migrants).
In the south of the EU (Italy, Portugal and Spain) there are better opportunities for legalization of the residence and work status. Numbers show that this prospective attracts large numbers of Ukrainian migrants. Despite this circumstance, Ukrainian workers keep coming to the Netherlands because of the higher salaries. They mostly settle in places with high demand for manual labour.
9.4.3 Family formation
The easiest way for Ukrainian irregular migrants to regularize in the Netherlands is (still) to marry a Dutch or other EU-citizen. In November 2004 though, this possibility was limited by aggravated requirements for family formation (Shakhno & Pool, 2005).
Most of the Ukrainian migrants that came to the Netherlands on the motive of family formation tell us they ended up here by chance. For example they came to the Netherlands to visit family members or on a holiday trip. They did not intend to find a Dutch partner. Afterwards they stay in touch by telephone- and internet contact and after a few visits back and forth they agree for the Ukrainian partner to migrate to the Netherlands.
9.5 Assessment It is difficult to apply the corridor concept to recent migration in the Ukraine-Netherlands corridor because many migration flows were short during and took place by chance. Current migration flows that can be distinguished are family formation of mainly Ukrainian women with Dutch partners and labour migration of mainly Ukrainian men that do not have a legal work permit. Although there have been

75 Destination Netherlands: The Evolution of Migration from six origin countries to the Netherlands
Ukrainian migrants in the Netherlands from the early twentieth century on, migration can be labelled as starting since there is no well established migration system of current migration flows yet.
It is interesting to observe if and how such a system might be establishing in the Netherlands. For this purpose we can look further into migration of Ukrainian women on the motive of family migration: do they advise other women from their home country to follow their example? Secondly, we should focus on recent flows of labour migrants from Ukraine to the Netherlands. Is there a migration system establishing and can we draw a map of this corridor?
In conclusion, it would be difficult to apply the corridor concept to the scattered Ukrainian migration flows towards the Netherlands. Nonetheless, it would be interesting to do research on this corridor to gain insight into starter migration systems.
10. Conclusion The scoping studies presented in this paper demonstrate the diversity of migration flows to the Netherlands. They also demonstrate that some migration flows are difficult to classify because of the limitations in reliable data. Many contemporary migrations flows from Ukraine, Brazil, Egypt and Bangladesh are unauthorized due to restrictive and selective migration policies. As a consequence, official data and expert opinions deviate to large extents. As a result, it has sometimes been difficult to classify migration from a certain country to the Netherlands in terms of the THEMIS theoretical framework. Nevertheless, the following diagram shows our main tentative findings:
Table 2: Overview of migration from 6 destination countries to the Netherlands
Country Stage Gender Main motive
Forced migration
Considerable Irregularity
System dynamics
Ukraine Starting Female Domination
Family, labour
In the past
Yes Little
Morocco Declining Equal Family No Moderate Yes
Brazil Expanding Female
domination
Family, labour
No Yes Yes
Egypt Established
Declining
Male
Domination
Family Very little Yes Among Copts
Bangladesh Stagnating Male domination
Family, labour
Very little Yes On European level
India Established
Starting
Male domination
Labour No Little Little

76 Destination Netherlands: The Evolution of Migration from six origin countries to the Netherlands
Our preliminary findings show different stages of migration. They also demonstrate that migrations flows are generated by different factors. In the Moroccan case state policies to recruit migrant workers stood at the base of migration flows, while in other cases other factors have produced specific migration flows. For the subsequent stages of the THEMIS research project it is essential to study more systematically the interaction between macro factors (labour markets and state polices) on the one hand and migration strategies from individual migrants (and the networks in which they are embedded) on the other hand. It also crucial to analyse the heterogeneity within migration groups. The Moroccan, Egyptian and Indian cases illustrate that there are substantial differences between migrants from specific countries in terms of generation, migration motives, religious background and education.

77 Destination Netherlands: The Evolution of Migration from six origin countries to the Netherlands
Theorizing the Evolution of European Migration Systems (THEMIS) is a four-year project looking at the way in which patterns of migration to Europe develop. The project is co-ordinated by the International Migration Institute (Robin Cohen), with project partners at the International Peace Research Institute (PRIO) in Norway (Cindy Horst), the Institute of Geography and Spatial Planning in Lisbon (Maria Lucinda Fonseca), and the Department of Sociology at Erasmus University in Rotterdam (Godfried Engbersen).
THEMIS is funded by the NORFACE (New Opportunities for Research Funding Agency Co-operation in Europe) research programme on Migration in Europe - Social, Economic, Cultural and Policy Dynamics.
The views expressed here are those of the author(s). They are not necessarily those of the THEMIS project or NORFACE.
For general enquiries or if you wish to receive updates on the THEMIS project, please contact us: T: +44 (0)1865 281745 / E: [email protected] / W: www.imi.ox.ac.uk/research-projects/themis

Appendix 2THEMIS – Metadata Phase 1
Appendix 2: Scoping studies in Norway

PRIO PAPER Independent • International • Interdisciplinary
Peace Research Institute Oslo (PRIO) Peace Research Institute Oslo (PRIO) Cindy Horst, Jørgen Carling & Rojan Ezzati
Cindy Horst, Jørgen Carling & Rojan Ezzati
Peace Research Institute O
slo (PRIO
) PO
Box 9229 Grønland, N
O-0134 O
slo, Norw
ay V
isiting Address: H
ausmanns gate 7
Centre for the Study of C
ivil War (C
SCW
) Peace R
esearch Institute Oslo (PR
IO)
PO Box 9229 G
rønland, NO
-0134 Oslo, N
orway
Visiting A
ddress: Hausm
anns gate 7
Immigration to Norway from Bangladesh, Brazil, Egypt, India, Morocco and Ukraine
Immigration to Norway from Bangladesh, Brazil, Egypt, India, Morocco and Ukraine Scoping studies for the project ‘Theorizing the Evolution of European Migration Systems (THEMIS)’
This report presents the findings of six scoping studies on immi-gration to Norway from Bangla-desh, Brazil, Egypt, India, Mo-rocco and Ukraine. The studies were carried out for the project Theorizing the Evolution of Euro-pean Migration Systems (THE-MIS). This project aims to study under which conditions initial moves by pioneer migrants to Europe result in rapidly expand-ing network migration and the formation of migration systems, and under which conditions this does not happen. The scoping studies thus focus on migration history and demographic charac-teristics, policy developments in
Norway and other explanatory factors for changes in the pat-terns, Institutions and commu-nity among these immigrant groups in Norway. We also dis-cuss remittances and other transnational ties the migrants maintain to their countries of origin. The report is based on analysis of publicly available statistics, interviews with a small number of key informants from each group, and a variety of written sources. Some of the immigrant groups we cover are very small or recent, and therefore poorly do-cumented. Among the six groups, Indians and Moroccans
are by far the largest groups in Norway. As of January 2010 In-dians are the 14th largest non-western group, and Moroccans follow on the 17th place. At the other extreme, Bangladeshis rank 55th. Absolute numbers range from 6888 Indian to 579 Bangladeshi immigrants. Brazil-ians and Ukrainians in Norway stand out because their numbers have grown very rapidly over the past decade and they are over-whelmingly female groups. Egyptians in Norway, on the oth-er hand, have a long migration history and are predominantly male.
Design: Studio 7 w
ww
.studoisju.no ISBN
: 978-82-7288-359-0 M
ela Festival. Photo: Lorenz K
hazaleh, Flickr.

August 2010 Independent • International • Interdisciplinary
Immigration to Norway from Bangladesh, Brazil, Egypt, India, Morocco and Ukraine
Scoping studies for the project ‘Theorizing the Evolution of European Migration Systems (THEMIS)’
Cindy Horst, Jørgen Carling and Rojan Ezzati Peace Research Institute Oslo (PRIO)
Cindy Horst is a senior researcher at PRIO. She is an anthropologist, whose research fo-cuses on transnational engagements in the context of forced migration. Her regional focus is on the Horn of Africa, in particular Somalia. E-mail: [email protected] Jørgen Carling is a senior researcher at PRIO, with a background in human geography and demography. He is doing research on migration aspirations, migration processes and migrant transnationalism. E-mail: [email protected] Rojan Ezzati is a sociologist and the Research Coordinator on Migration and Transnatio-nalism at PRIO. Current research involvement includes projects on diaspora engagement, migration systems, and migration aspirations. E-mail: [email protected] © Peace Research Institute Oslo (PRIO), 2010. All rights reserved. No part of this publication may be reproduced, stored in a retrieval system or utilized in any form or by any means, electronic, mechanical, photocopying, recording, or otherwise, without permission in writing from the copyright holder. ISBN: 978-82-7288-359-0

2
Contents
Introduction ........................................................................................................................................... 3 Methodology .......................................................................................................................................... 4
Statistical data ..................................................................................................................................... 4 Literature ............................................................................................................................................. 4 Interviews with key informants ........................................................................................................... 5
The Norwegian context ......................................................................................................................... 6 Bangladesh ............................................................................................................................................. 8
Migration history and demography ..................................................................................................... 8 Changes explained ............................................................................................................................ 10 Institutions and community ............................................................................................................... 12 Remittances and other transnational connections ............................................................................. 12 Assessment ........................................................................................................................................ 13
Brazil .................................................................................................................................................... 14 Migration history and demography ................................................................................................... 14 Changes explained ............................................................................................................................ 18 Institutions and community ............................................................................................................... 19 Remittances and other transnational connections ............................................................................. 19 Assessment ........................................................................................................................................ 20
Egypt ..................................................................................................................................................... 21 Migration history and demography ................................................................................................... 21 Changes explained ............................................................................................................................ 23 Institutions and community ............................................................................................................... 24 Remittances and other transnational connections ............................................................................. 24 Assessment ........................................................................................................................................ 25
India ...................................................................................................................................................... 25 Migration history and demography ................................................................................................... 25 Changes explained ............................................................................................................................ 29 Institutions and community ............................................................................................................... 30 Remittances and other transnational connections ............................................................................. 31 Assessment ........................................................................................................................................ 32
Morocco ................................................................................................................................................ 32 Migration history and demography ................................................................................................... 32 Changes explained ............................................................................................................................ 36 Institutions and community ............................................................................................................... 37 Remittances and other transnational connections ............................................................................. 38 Assessment ........................................................................................................................................ 38
Ukraine ................................................................................................................................................. 39 Migration history and demography ................................................................................................... 39 Changes explained ............................................................................................................................ 43 Institutions and community ............................................................................................................... 44 Remittances and other transnational connections ............................................................................. 45 Assessment ........................................................................................................................................ 46
Concluding Assessment ....................................................................................................................... 47 Comparison of immigration histories................................................................................................ 47 Comparison of current composition .................................................................................................. 50 Comparison of the research process .................................................................................................. 51 Conclusion ........................................................................................................................................ 52
Annex 1: Demographic indicators ..................................................................................................... 54 Annex 2: THEMIS Information Letter ............................................................................................. 56 Annex 3: Interview Topics .................................................................................................................. 57 References ............................................................................................................................................ 59

3
Introduction
The following report presents the findings of six scoping studies on immigration to Norway from Bangladesh, Brazil, Egypt, India, Morocco and Ukraine. These studies were carried out for the project Theorizing the Evolution of European Migration Systems (THEMIS)1. This project aims to study under which conditions initial moves by pioneer migrants to Europe result in rapidly expanding network migration and the formation of migration systems, and under which conditions this does not happen. The scoping studies thus focus on migration history and demographic characteristics, policy developments in Norway and other explana-tory factors for changes in the patterns. We also discuss institutions and community among these immigrant groups in Norway, and remittances and other transnational ties the migrants maintain to their countries of origin.
The six countries of origin examined in this report have been short-listed as possible in-depth case studies. On the basis of this report and similar reports from the Netherlands, Portu-gal and the United Kingdom, the project team will select three immigrant groups to be studied in detail across the four European countries.
Among the six groups, Indians and Moroccans are by far the largest groups in Norway. As of January 2010 Indians are the 14th largest non-western group, and Moroccans follow on the 17th place2. At the other extreme, Bangladeshis rank 55th. Absolute numbers range from 6888 Indian to 579 Bangladeshi immigrants. Brazilians and Ukrainians in Norway stand out be-cause their numbers have grown very rapidly over the past decade.
The report is based on analysis of publicly available statistics, interviews with a small number of key informants from each group, and a variety of written sources. Some of the im-migrants groups we cover are very small or recent, and therefore poorly documented. It is important to note that some of the information described in this report relies only on one or two interviews and will need to be explored further in a second phase. We have indicated where this is the case, and also compiled a list of interesting themes to explore when conduct-ing the full studies for the final three communities of study. We are confident that the analysis presented here provides a sound basis for the main aim of the scoping studies: finding the three most THEMIS-relevant immigrant groups. Those who read this report for other pur-poses, however, should take this limitation into account. We decided on a publicly available rather than an internal report because there is so little information on the smaller immigrant groups in Norway, and we hope our scoping studies can make a contribution in addressing this gap.
1 The THEMIS project is funded by NORFACE and co-ordinated by the International Migration Institute at the University of Oxford. www.prio.no/Research-and-Publications/Project/?oid=48088377. 2 In 2010 the ten largest groups from non-Western countries were Iraq (20,400), Somalia (18,300), Pakistan (17,100), Iran (13,500), Russia (13,500), Bosnia and Herzegovina (13,100), Vietnam (12,900), Philippines (12,100), Thailand (11,900) and Turkey (10,400). Half of these ten are populations that originate from conflict or post-conflict settings. Unless otherwise stated, all population statistics in this report are publically available data from Statistics Norway (www.ssb.no).

4
Methodology
The research on which this scoping study report is based consists of an analysis of three sources: available statistical data, relevant literature on the topic, and interviews with key informants.
Statistical data
Norway enjoys register data of high quality and with comparatively long time series. From 1974, standardised procedures for recording and gathering statistical data on the number of immigrants in Norway were introduced. These data are collected and coordinated by Statistics Norway. Accessibility is limited, however, for two overlapping reasons. First, data on specific immigrant groups is often analyzed and published for the groups that are judged to be most important. Consequently, comprehensive register-based statistics is published for large groups, but not for smaller groups (e.g. Henriksen 2007). The countries that are specified are not always the same; for instance, statistics on marriage migration might specify data for countries of origin that are particularly important in this form of migration but not for immi-gration overall.
Second, register data is governed by strict data protection concerns. One result of this is that certain data can only be obtained for aggregates such as immigrants from ‘Asia’ but not for individual countries. Similarly, it is possible to obtain figures for, say, Bangladeshis in Norway, and immigrants in Bergen, but not for Bangladeshis in Bergen.
After the scoping study phase of THEMIS, it will hopefully be possible to obtain more de-tailed data on the three groups that are selected. However, data protection concerns will re-main a restriction, as will the cost of purchasing processed data.
The most important data source outside Statistics Norway is the Directorate of Immigration (UDI). The directorate compiles data on the basis of case processing. Again, only certain fig-ures are published, but more detailed data can presumably be obtained for research on the three selected groups.
In each of the subsequent country studies, migration history is discussed with reference to a series of demographic indicators. These are intended to bring out key characteristics of each group’s migration history and current demographic profile. Most of these indicators require some explanation or contextualization, which is provided in annex 1.
Literature
A literature search on the six groups in Norway only produced limited results. It seems that there is very little research done on the selected groups, with the partial exception of Moroc-cans and Indians, although even here, there is not a lot of earlier work to draw on. Besides searches for literature we also searched for relevant information in the media and relevant internet sites, including for example those of the respective embassies and of migrant organi-zations. This first search has generated a list of potentially relevant references and will form the basis of a more systematic search in the second phase of the study.

5
A relatively recent report by Statistics Norway (Henriksen 2007) informs the sections on Morocco and India. This detailed report is a compilation of statistics on the 18 largest immigrant groups with non-western background3. Descriptions are based on available statistics that focus on demography, reasons for migration, in- and out-migration, duration of stay, citizenship, household composition, civil status and family composition, educational levels, employment, income and voting participation. A further publication of great relevance to THEMIS is Brochmann and Kjeldstadli’s (2008) ‘A history of immigration: The case of Norway 900-2000’, which is also available in a more elaborate Norwegian version. Not only does the study provide an excellent overview of changing migration patterns in Norway, but it also refers to a number of the short-listed groups, including Morocco and India. Finally, for India we have gained access to published and unpublished reports and articles written by social anthropologist Julian Kramer (1978, 1979a, b, c, 1980), who conducted the first study on Indians in Norway in 1976-1979. He studied the Indian labour migrants in the Drammen area, an industrial town near Oslo, and provides valuable insights to the early period of Indian immigration to Norway.
Interviews with key informants
Interviews were conducted with key informants who were selected and found through Internet searches and personal contacts. Informants included individuals at embassies, migrant organi-zations, migrant-owned businesses and pioneer migrants. Pioneer migrants were largely found through individual acquaintances and referrals by others interviewed. Potential key infor-mants who were found online received an email with an information letter (annex 2) and, where phone numbers were available; this first contact was then followed up by a phone call in order to secure a high response rate. Nevertheless, contacting and finding appropriate can-didates took considerable time, and in some instances, led us to interview only one individual whereas we had aimed for three informants per group. Informants were then interviewed us-ing a list of interview topics (annex 3).
For Bangladesh, we interviewed a well-known representative of the Norwegian-Bangladeshi community, and were advised by this person as well as the embassy to contact a Bangladeshi organization. We were invited to join a picnic and interviewed a pioneer migrant who came to Norway for the first time in the 1970s, a former leader of the Bangladesh Asso-ciation Norway and the child of a pioneer migrant who arrived in Norway in the 1980s. For Brazil, we had an interview at the Embassy, a leader of a cultural organization and a highly skilled labour led migrant. In the case of Egypt, interviews were conducted with the Embassy and with a pioneer migrant. For India, finding key informants willing to be interviewed proved a challenge and, finally, we managed to interview only one pioneer migrant who came to Norway in the 1970s. In the case of Morocco, we conducted one interview with two of the leaders of a Moroccan organization. Finally, for the scoping study on Ukraine we held inter-views with an employee at the Embassy, a representative of an association and a migrant who has been a part of the recent wave of Ukrainian migration to Norway.
3 The report partly is an update of an earlier report (2004/10), which focused on Pakistan, Iraq, Vietnam, Somalia, Bosnia-Herzegovina, Iran, Turkey, Sri Lanka, Serbia-Montenegro and Chile. The new report also includes Poland, Russia, Philippines, India, Morocco, Afghanistan, Ethiopia and Eritrea.

6
The Norwegian context
Norway is a country with a relatively recent migration history, and a relatively small but in-creasing migrant population. According to Statistics Norway, there were 459 000 immigrants, and 93 000 people of immigrant parents in Norway by 1 January 2010. This constitutes 11, 4 percent of the total population. However, about 257 000 of these are of European back-ground.4 Most of the people of immigrant background, and particularly those of non-western background, live in Oslo, which is the case for seven out of ten Pakistanis and Moroccans (Henriksen 2007: 30). Other cities with large numbers of non-western immigrants are Bergen, Stavanger, Trondheim, Drammen, Kristiansand and Fredrikstad.5
It was towards the end of the 1960s that the first labour migrants from third world coun-tries came to Norway. In fact, as Brochmann and Kjeldstadli (2008) remind us, ‘Norway did not become a net immigration country in modern times before 1968’. In 1970, only 1.3 per-cent of the population was not Norwegian, of which the large majority came from the Nordic countries, Europe and North America. Yet despite these low numbers, the post-war period was important in the sense that it introduced Norway to cold war refugees, a liberal political immigration regime, its first contact with immigration from non-OECD countries and, as a consequence, to a nationally felt need to establish a stricter regulation of the influx (Brochmann and Kjeldstadli 2008: 179).
Following the first oil findings in the North Sea in 1969, there was a period of improve-ment of the Norwegian economy. The expansion of the oil industry created many popular job opportunities for Norwegians, which resulted in a shortage of unskilled manual labour in low-paid jobs with difficult working conditions, in the industry, restaurant business, and farming and nursery garden sectors. Although the Norwegian authorities never actively recruited un-skilled labourers from abroad (Wist 2000: 43), Norway had been driven by a very liberal im-migration policy after the Second World War which made it easy and attractive for labour migrants to come to Norway in pursue of better opportunities. Still, and despite a booming economy and an officially welcoming atmosphere, very few came. Brochmann and Kjeld-stadli (2008: 192) suggest that this was because other European countries were more attrac-tive and pursued active recruitment policies.
The first labour migrants came from Turkey and Morocco, but it did not take long before the Pakistanis had boomed in this sector. In 1970, there were 434 Moroccan, 260 Turkish and 212 Indian/Pakistani citizens in Norway (Brochmann and Kjeldstadli 2008: 194). These were the main groups of so-called foreign workers (fremmedarbeidere), a term that was used to describe those whose physical features and non-western cultural background were different from Norwegians and other foreigners in Norway (Kramer 1978). The Labour Organization (LO) plays a central role in Norway, and right from the beginning there was a trace of reluc-tance in their position on foreign labour. The LO demanded that immigration policies took 4 For statistical information about immigration to Norway: www.ssb.no/innvandring 5 www.ssb.no/emner/02/01/10/innvbef/tab-2010-04-29-10.html.

7
care of potential structural problems that could undermine the position of organized labour, and insisted that foreign workers have the same salary as Norwegians and that residence per-mits be made conditional on prearranged work (Brochmann and Kjeldstadli 2008: 194).
As time passed, the financial depression that had struck the rest of Western Europe became increasingly noticeable in the Norwegian context. This combined with the fear of the ‘social problems’ that were assumed to accompany the increasing migration from Asia and Africa, eventually led to stricter immigration policies in Norway as well. From 1972 and onwards, tourists could no longer apply for a work- and residence permit while visiting Norway (Kramer 1979b: 11). However, in 1973, Norway was the only Western European country that still was open for individual immigration, so labour migrants kept coming to find work. The salaries were low, the working conditions tough, and the quality of accommodation poor. But even so, the level of salaries was significantly higher than even white collar jobs back home.
In 1975, the immigration restrictions were further expanded to a full migration stop for any unskilled labour migration (Brochmann and Kjeldstadli 2008: 198). No new work permits were to be issued to foreigners (from outside of Scandinavia) unless they were direct depend-ants of immigrants already residing in Norway, who could provide adequate accommodation for them. The immigration stop was originally imposed for a period of one year, but was then extended indefinitely, and is still implemented today.
For the first few years after the immigration stop for labour migrants was imposed, Nor-way was still leading a very open family reunion policy. Consequently, many of the immi-grant groups that had already established themselves in the Norwegian society were able to bring other family members, in addition to wives and children, to join them in Norway. One of the consequences of this was evident in that the previously almost exclusively male non-western foreign workers in Norway, were joined by increasing numbers of female migrants who came through family reunification (Kramer 1978: 662).
The third and most recent wave of migration to Norway was formed by asylum seekers. In Norway, ‘the beginning of the 1980s thus marked the start of a migration pattern that was going to prevail till the end of the century: an increasing number of refugees, in combination with continuous family immigration and labour migrants destined for expanding sections of the labour market (Brochmann and Kjeldstadli 2008: 214). The immigration stop introduced thus was not an actual stop or a closed door: the new regulations required selection of people according to categories of wanted and unwanted migrants. ‘The authorities exercising the dis-cretion of status assignment thus turned out to be national gatekeepers, when the position as refugee turned into a ‘scarce good’ (Brochmann and Kjeldstadli 2008: 222).
In 1987 and 1988 asylum to Norway peaked, with asylumseekers arriving from 60 coun-tries. This was also the period Norway became increasingly affected by and an actor in Euro-pean migration policy, being a member of Schengen though not of the EU. The increasing numbers of immigrants led to increasing call for restrictive policies, like elsewhere in Europe. From the early 1990s onwards, efforts were made to develop a comprehensive approach to refugee policy, resulting in a White Paper to the parliament (no. 17, 1994-5) with focus on temporary protection and containment in the region. Yet despite the overarching official aim of limited and regulated immigration, de facto immigration remained high.

8
Bangladesh
Migration history and demography
Bangladeshi migration to Norway is relatively recent and small-scale, with a somewhat un-usual development over time. Three groups make up the bulk of this migration: asylum seek-ers and refugees, those coming for family reunification / formation, and students. There were only a couple of Bangladeshis registered in Norway in 1970, at the time when Indians and Pakistanis were arriving in sizeable numbers and Bangladeshi communities were establishing elsewhere in Europe.6 Original migration was extremely sporadic: Bangladeshis came one by one and mostly did not know each other before coming to Norway. Informants indicate that Bangladeshis at that time came from various regions in Bangladesh and had both urban and rural backgrounds.
By 1980 there were still only 27 Bangladeshi immigrants living in Norway. In the late 1980s, however, a wave of immigration trebled the migrant population over the course of three years (Figure 1 and Figure 3).7 In fact, the years 1987, 1988 and 1989 account for almost
Figure 1. Stock of Bangladeshi immigrants in Norway, 1980–2010
Source: Compiled on the basis of data from Statistics Norway. The period 1980–1986 is interpolated due to missing data.
Figure 2. Proportion of women in the stock of Bangladeshi immigrants in Norway, 1980–2010
Source: Compiled on the basis of data from Statistics Norway. The period 1980–1986 is interpolated due to missing data.
6 For data protection reasons, statistics do not show whether the actual number was 1, 2 or 3 persons. 7 Since figures for the years 1981–1985 are interpolated from 1980 and 1986 numbers, the immigration wave may have started more abruptly than Figure 1 indicates.
0
100
200
300
400
500
600
1980 1985 1990 1995 2000 2005 2010
First-generation immigrants
Descendants (two foreign-born parents)
0
25
50
75
100
1980 1985 1990 1995 2000 2005 2010
Proportion women (%)

9
a fifth of total arrivals from Bangladesh in the period 1975–2009. Informants indicate that from the late 1970s and throughout the 1980s, Bangladeshis came to Norway because of po-litical and economic problems in Bangladesh. From 1975 to 1990, Bangladesh was ruled by military dictatorship and political conditions in Bangladesh were harsh. Indeed, towards the end of the short-lived immigration wave in the late 1980s, there was a sudden rise in the num-ber of asylum seekers from Bangladesh Figure 3. However, available statistics cannot reveal the grounds for admission of those who settled in 1987–1989.
Whereas there are without doubt Bangladeshis who came to Norway at the time because of persecution in Bangladesh, for example being active in opposition, others came to Norway for reasons not related to conflict or persecution. There were very likely students among them, but part of this wave remains unexplained by our data. Throughout the migration history from Bangladesh to Norway, a number of students who had come to Norway on a temporary basis stayed on because of finding a job or a partner. One informant indicates that students from Bangladesh had learned about the favourable conditions for studying in Norway, with state universities as a rule not charging tuition fees and students from Bangladesh being able to apply for scholarships.
For most of the 1990s, net immigration from Bangladesh was close to zero, and the stock of Bangladeshi immigrants declined substantially. Figure 3shows increased emigration flows in the 1990s coupled with reduced immigration flows. Since these migration figures refer to the country of departure/destination, however, it is likely that emigration of Bangladeshi citizens
Figure 3. Immigration and emigration to/from Bangladesh and asylum applications by Bangladeshis, Norway 1980–2010
Source: Compiled on the basis of data from Statistics Norway and the Norwegian Directorate of Immigration.
Figure 4. Migration to/from Bangladesh and of Bangladeshi citizens, Norway 2005–2009
Source: Compiled on the basis of data from Statistics Norway.
0
20
40
60
80
100
120
140
160
180
1980 1985 1990 1995 2000 2005 2010
Immigration Asylum applications
Emigration
0
50
100
150
200
250
300
350
400
Immigration Emigration Net migration
To/from Bangladesh Bangladeshi citizens

10
from Norway was substantially higher than what is visible in the figure. In other words, the decline in the migrant population 1991–1997 appears to have been caused primarily by on-ward migration of people who arrived during the 1987–1989 wave. Also in recent years, emi-gration of Bangladeshi citizens exceeds emigration to Bangladesh, indicating that onward migration persists (Figure 4). Informants observe that there has been outmigration of long-term Bangladeshi residents of Norway, in particular by a number of qualified ‘young adults’ who came to Norway as children and were educated there. They moved to Sweden, the UK, the US and Canada in order to make better use of their qualifications and live in more inclu-sive societies.
From its minimum level in 1997, the Bangladeshi population in Norway has grown stead-ily at an average of about 5 percent per year. However, it was not until 2008 that it regained the size it had in 1991. The growth might be accelerating: the Bangladeshi population has increased more rapidly during the past three years, and immigration from Bangladesh in 2009 was the highest in 20 years. Informants indicate that with European integration and increasing travel opportunities between countries in Europe, a number of Bangladeshi immigrants to Norway arrived from elsewhere in Europe. This number increased in recent years after the financial crisis, when many immigrants faced increasing economic difficulties, in particular in southern Europe. With 579 immigrants and 337 descendants in 2010, Bangladeshis neverthe-less remain a small group in Norway.
There is only a slight dominance of men in the current stock of immigrants, but this has not always been the case. In particular, the 1987–1989 immigration wave appears to have been primarily male, causing the proportion of women in the immigrant stock to dip below a quar-ter in 1990. Informants indicate that family migration took place mainly when those who re-ceived refugee status in the 1980s applied for their families to join them in Norway within a few years after their own arrival. Furthermore, informants indicate that family formation also occurred, but often with a delay of at least 7 years after arrival. Bangladeshis who arrive as asylum seekers are not allowed to travel to Bangladesh until they receive their Norwegian passport. A number of first generation migrants then returned to Bangladesh to find a partner and brought their wives back to Norway.8
Family migration is primarily for the purpose of being united with another foreigner, not a Norwegian citizen. Since the average length of stay among Bangladeshis in Norway is pre-sumably quite high, the Norwegian citizens bringing family members to Norway may also be of Bangladeshi origin. Even if relationships with Norwegians play a minor role in the migra-tion process, more than a third of the children of Bangladeshis born in Norway have a Nor-wegian-born parent (Table 1).
Changes explained
Migration patterns from Bangladesh to Norway are quite erratic, with very small numbers arriving in the 1970s up to the mid-1980s, a sudden take-off in the late 1980s, a phase of stag-nation and more recently, renewed growth. We do need to realize however, that numbers are
8 Our informants are more divided on the situation of the 1.5 and second generation migrants, but the general feeling is that family formation migration is less common among those generations.

11
Table 1. Overview of demographic indicators for Bangladeshis in Norway
Bangladesh
Average for the six groups (unweighted)1
Stock of immigrants (2010) 579 3032 Change in stock of immigrants (2005-2010) 39% 63% Stock of foreign citizens (2010) 323 1540 Change in stock of foreign citizens (2005-2010) 39% 59% Cumulated immigration by country of departure (1975-2009) 2167 5110 Cumulated naturalizations (1977-2009) 480 2180 Immigration by country of departure (annual average 2005-2009) 65 298 Migration effectiveness (2005-2009) 0.39 0.56 Immigration by citizenship (annual average 2005-2009) 67 281 Emigration by citizenship (annual average 2005-2009) 37 88 Proportion of immigrants not arriving from country of citizenship (2009) — 9% Proportion of emigrants not departing to country of citizenship (2009) — 52% Cumulated asylum applications (1995-2009) 289 549 Asylum applications per 100 immigrants (2005-2009) 25 15 Family migration permits per 100 immigrants (2009) 40 69 Proportion female among stock of immigrants (2010) 45% 53% Descendants per 100 immigrants (2010)2 58 64 Proportion of descendants with one Norwegian-born parent (2010)2 35% 59% Proportion of family migration with a Norwegian or Nordic citizen (2009) 20% 50%
Notes: 1) Refers to the six groups covered in this scoping study report 2) Descendants in this context refer to people born in Norway with one or two foreign-born parents. Source: Compiled on the basis of data from Statistics Norway and the Directorate of Immigration
still really small and thus, percentage-wise small changes seemingly have big impacts. An-other change is related to the mechanisms through which Bangladeshi immigrants have reached Norway. In the 1980s, a considerable number of Bangladeshi immigrants to Norway claimed asylum, whereas in the 1990s there were increasing numbers of people who came through family reunification. Furthermore, throughout the migration history from Bangladesh, there has been temporary migration by Bangladeshi students, of which a number has stayed after finding a job or a partner in Norway.
The number of asylum applications from Bangladesh is of course closely related to politi-cal conditions in the country, and from 1975 to 1990, Bangladesh was ruled by military dicta-torship. The sudden increase that took place in numbers of immigrants from Bangladesh be-tween 1985 and 1990 can partly be explained by asylum applications in that period – when political and economic conditions were tough. However, we would need to study this period in greater detail in a possible second phase in order to explain the sudden increase fully. This may be complicated by the fact that emigration of Bangladeshis from Norway has been high, and we are not sure yet whether the relevant statistics are available.
Not only conditions in Bangladesh but also migration policies in Norway have an impact on the number and kind of immigrants arriving. Almost all Bangladeshis came to Norway after the migration stop in 1975. This means that for the large majority, labour migration was not an entry point. Informants indicated that in the 1980s, it was relatively easy to enter Nor-way on asylum grounds. Indeed, in Norway, as in many other countries in Europe, ‘a rela-

12
tively high number of the asylum seekers were refused political asylum yet allowed residence on humanitarian grounds’ (Brochmann and Kjeldstadli 2008: 260). This changed in the 1990s, when prevention came in as a central dimension in European policy, in an attempt to stem emigration. The Norwegian Refugee Council at the time argued for a ‘holistic refugee policy’ where refugees could be taken care of much more effectively in sending regions (Brochmann and Kjeldstadli 2008: 262)
Institutions and community
The Bangladeshi community in Norway is largely a middle-class community with relatively high levels of education, compared to other migrant groups. Most Bangladeshis live in Oslo, and the Bangladesh Association Norway estimates the number (including descendants) to be about 500. Many moved to Oslo after obtaining citizenship, which takes 7 years in Norway.9 Other Bangladeshi immigrants live in Bergen, especially the first generation. Informants fur-thermore know of a few families in Kristiansand; and point out that in Trondheim there are a number of students, who will likely stay in Norway only for the duration of their studies.
In Norway, there are three organizations for Bangladeshis: the Bangladesh Association Norway (BDAN), Norsk Bangla Forum and Amaderjalsha. The Bangladesh Association Norway was founded in 1978 and has recently celebrated its 30th anniversary. When it was founded, in order to find the five people necessary to establish a board and found an organiza-tion, the founder included three Pakistanis.10 It functions as the main organization for Bangla-deshis in Norway nationally. The Norsk Bangla Forum was set up in 2007 and targets a younger audience, with a more active website use.
Bangladeshis are quite active in meeting on various socio-cultural occasions, such as wed-dings, national days, summer picnics and other events. A number of these events are private happenings, while others, including picnics, religious celebrations and cultural events like poetry readings, are organized by the associations. A picnic attended for THEMIS attracted about 150 Bangladeshis, including many families, and involved activities for all generations. Men and women were mainly sitting in separate groups, and a number of activities had been organized. There were games and sports for the second generation, a barbeque, a quiz on a Bangladeshi figure of importance, a musical chairs variation for adults and so on. A represen-tative of The Bangladesh Association Norway indicates that people did not know each other and the community was very small in the late 1970s, early 1980s, but when the association started, the connection between Bangladeshis started and their social life in Norway began.
Remittances and other transnational connections
In order to travel from Bangladesh to Norway, substantial resources are required. Those who arrived in Norway in the 1970s and 1980s very rarely had family or friends in Norway and had to use their own capital. Alternatively, informants pointed out that many also benefited from social networks encompassing relatives and friends elsewhere in Europe or in the US.
9 As many arrived as asylum seekers, they were not allowed to live where they wanted and many lived in various rural communities before coming to Oslo. 10 For more information on the history of BDAN, see www.bdanorway.com for an extensive description.

13
One informant interestingly mentioned a European activist who was working in Bangladesh who enabled flight from Bangladesh, but in general, it is likely that these networks largely encompassed Bangladeshi migrants.
As many of the Bangladeshi immigrants have come to Norway through the asylum route, this has had implications for their ability to travel to Bangladesh: until they obtained Norwe-gian citizenship, they were not allowed to travel to Bangladesh. Currently, however, many Bangladeshis travel back to their country. Informants indicate that there are a few Banglade-shis who travel yearly, but on average, most people travel no more than every two to three years – especially those with families, as the journey takes long and is expensive. There is one Bangladeshi travel agent in Norway – based in Drammen, which people may use. Nowadays, emails and phone calls have also become much more common ways of staying in touch fre-quently. On Internet, we also found a couple of requests for information or assistance from Bangladeshis planning to move to Norway – mainly from elsewhere in Europe.
As Bangladeshi immigrants to Norway are mostly of middle-class background and have been in Norway since the 1980s, it seems that a number of those who have been away for 20 years or more have fewer close family members in Bangladesh. They may communicate more with siblings or parents in Sweden, the UK and Canada, for example, than with family in Bangladesh. As a consequence, these people may also not send remittances anymore. At the same time, there are still Bangladeshi immigrants sending remittances from Norway – at the scoping study stage however it has been impossible to gain an understanding of how many and how much they send. The main mechanisms used for sending remittances are Western Union, banks and through people traveling to Bangladesh. Finally, political engagement with the sit-uation in Bangladesh is still pretty strong, in particular among the men, and there is a strong wish to remain updated. It is not allowed to have dual citizenship, which inhibits many from voting in Bangladesh (which would only be possible by traveling to Bangladesh anyway).
Assessment
Bangladeshi immigration to Norway is characterized by a migration take-off that is inter-rupted, followed by stagnation and renewed growth. Pioneer migrants arrived in the 1970s and there have been a few years of high increases in numbers, in particular from 1987 to 1989, but still, the community remains very small and in the 1990s there has been net outmi-gration from Norway. In general, Norway has not been a preferred destination for Banglade-shi immigrants and in a next phase it would be interesting to find out more about why. En-trance has mainly been obtained through asylum in the 1980s and ensuing family reunifica-tion, and by students who enjoyed the chances offered to them in Norway. Yet few Banglade-shi immigrants (except those who come for family reunification) seem to have come to Nor-way for the country itself. One reason for this is related to the fact that there is no Bangladeshi community in Norway – even though the few Bangladeshi who are here are quite active in terms of socio-cultural activities.
Outmigration is also a phenomenon that would be interesting to explore in the case of Bangladesh, as there has been a considerable flow throughout the years. Who are the people leaving (besides students who were planning to be in Norway temporary), where are they

14
leaving to and why? The pre-study suggests that people leave to Sweden, the US and Canada because there is no Bangladeshi community in Norway and because of looking for better eco-nomic opportunities there. Furthermore, informants indicated that few people return to Ban-gladesh, because the political situation is still considered unstable. Those who do, are said to have come to Norway relatively recently or have maintained strong ties, either having family or business there. The low numbers of Bangladeshis in Norway are particularly interesting considering the fact that there is a large community of people from Bangladesh in Sweden – it would be fascinating to find out why this difference occurred, despite so many similarities between the countries. Furthermore, the community is among the better-off migrant commun-ities from non-western background and also includes a large number of students who mainly come on a temporary basis.
The pre-study we conducted in Oslo gives us some confidence in our ability to conduct the study. There are entrance points through the organizations and we can make use of Facebook and other electronic media to locate people. Furthermore, there seem to be quite a number of events we may be able to participate in (during the relatively short period of the research, three such events were organized and another one announced for September). Cricket and universities could be other arenas to find Bangladeshis, and the advantage of the relatively large number of students is also that we would be able to find enumerators relatively easily. People have also generally been quite open to the research and helpful, although a bit more reluctant to talk about a number of topics in greater detail (remittances, parts of the migration history). If this group would be selected, research could best be conducted in Oslo and Ber-gen, where there is a relatively large group of the first wave of immigrants to Norway.
Brazil
Migration history and demography
Brazilian migration to Norway
Brazil has traditionally been a country of immigration. 11 A new migratory trend of emigration started with the economic crisis of the 1980s. In the Norwegian context, however, Brazilian immigration only started to take off at the beginning of the 21st century. Currently, there are more than 2700 Brazilian immigrants in Norway, and the number has more than doubled over the past five years (Table 2). The two most striking features of Brazilian migration to Norway are its long history and the recent exponential growth.
The first known Brazilian migrant in Norway was a composer who settled in Bergen in the 1890s and returned to Brazil in 1910.12 The first records available at the Embassy of Brazil in Oslo are from 1929, and have registered the births of children of diplomats posted in Norway in the years 1948, 1961, 1963 and 1967. The first record of the birth of a child born of Brazilian
11 This first section is largely based on information from the Embassy of Brazil in Oslo. 12 Alberto Nepomuceno married the Norwegian pianist Walborg Bang in 1893 after meeting her in Germany. Together, they moved to the Norwegian composer Edvard Grieg’s house in Bergen, Norway. The two composers influenced each other’s future work. The background for Nepomuceno return to Brazil is not known.

15
Figure 5. Stock of Brazilian immigrants in Norway, 1980–2010
Source: Compiled on the basis of data from Statistics Norway. The period 1980–1986 is interpolated due to missing data.
Figure 6. Proportion of women in the stock of Brazilian immigrants in Norway, 1980–2010
Source: Compiled on the basis of data from Statistics Norway. The period 1980–1986 is interpolated due to missing data.
Figure 7. Immigration and emigration to/from Brazil, Norway 1980–2010
Source: Compiled on the basis of data from Statistics Norway.
Figure 8. Migration to/from Brazil and of Brazilian citizens, Norway 2005–2009
Source: Compiled on the basis of data from Statistics Norway.
0
500
1000
1500
2000
2500
3000
1980 1985 1990 1995 2000 2005 2010
First-generation immigrants
Descendants (two foreign-born parents)
0
25
50
75
100
1980 1985 1990 1995 2000 2005 2010
Proportion women (%)
0
100
200
300
400
500
600
1980 1985 1990 1995 2000 2005 2010
Immigration
Emigration
0
500
1000
1500
2000
2500
Immigration Emigration Net migration
To/from Brazil Brazilian citizens

16
parents residing in Norway was in 1970. The couple came from the State of São Paulo in Bra-zil and lived in the city of Hamar (north of Oslo), but there is no information on when, why and how they came to Norway.
Over the years, there have been a few cases of children of Norwegian parents who had been living in Brazil for a long time, who returned to Norway. As the children were Brazilian citizens, they do make a small contribution to the statistics. Including these, in 1970 there were 67 Brazilian immigrants resident in Norway. This number grew steadily to 139 in 1980 and 386 in 1990. The number of Brazilians in Norway reached 1000 in 2003 and has been growing at 12–19 percent per year ever since (Figure 5). Since about 2000, not only the stock of migrants but also the immigration flow has grown rapidly. After quadrupling over a seven-year period, the inflow seems to have stabilized around 500 persons per year for the past three years (Figure 7), although it is too early to say whether this is just a temporary pause.
The gender balance of Brazilians has always been in favour of women, but increasingly so in the past two decades. Already in 1970, 57 percent were women. Since the mid-1990s, the proportion of women has been around three quarters (Figure 5).
There are not many Brazilians who come to the Brazilian Embassy to register, so the Em-bassy does not have data that supplements official population statistics. Most of the persons who do get in touch with the Embassy are Brazilians who need the correct papers in order to marry Norwegian citizens. A majority of these are from the Northeast region of Brazil. How-ever, this does not necessarily reflect the composition of the Brazilian population in Norway. There might also be many cases of people who meet their partners in for example Rio de Ja-neiro, but as the internal migration within Brazil is substantial, many of these might be inter-nal migrants from elsewhere in Brazil.
The vast majority of Brazilians in Norway come directly from Brazil. They arrive on inter-national flights through third countries such as Portugal, France, United Kingdom and Ger-many. Due to the financial crisis that has struck some of Brazilian migrants’ most popular destinations, some leave countries like Spain and Portugal to come to Norway in search of a job. In 2009, such stepwise migration accounted for 6 percent of arrivals (Table 2).
The number of immigrants arriving from Brazil substantially exceeds the number of Bra-zilian citizens migrating to Norway (Figure 8). This is probably linked to the fact that many Brazilians who originate from European countries have dual citizenship, so they enter the country with their European passports. There might also be some non-Brazilian migration from Brazil that can be accounted for by returning Norwegians, although it is not possible to see the extent of this on the basis of available statistics. In addition, it may be that Brazil is a transit country for migrants from other South American countries.
The large majority of Brazilian migrants in Norway can be divided into three main groups:
Migrants with Norwegian partners
Many Norwegians on holiday in Brazil, mostly men, have met and brought their Brazilian part-ners to Norway. This can partly explain the much higher number of Brazilian females than men. The socio-economic background of these women varies a lot, some come from poor families while others have had the possibility to pursue higher education. One of our interviewees told

17
Table 2. Overview of demographic indicators for Brazilians in Norway
Brazil
Average for the six groups (unweighted)1
Stock of immigrants (2010) 2728 3032 Change in stock of immigrants (2005-2010) 114% 63% Stock of foreign citizens (2010) 2164 1540 Change in stock of foreign citizens (2005-2010) 114% 59% Cumulated immigration by country of departure (1975-2009) 6059 5110 Cumulated naturalizations (1977-2009) 930 2180 Immigration by country of departure (annual average 2005-2009) 437 298 Migration effectiveness (2005-2009) 0.56 Immigration by citizenship (annual average 2005-2009) 376 281 Emigration by citizenship (annual average 2005-2009) 100 88 Proportion of immigrants not arriving from country of citizenship (2009) 6% 9% Proportion of emigrants not departing to country of citizenship (2009) 45% 52% Cumulated asylum applications (1995-2009) 10 549 Asylum applications per 100 immigrants (2005-2009) 0 15 Family migration permits per 100 immigrants (2009) 81 69 Proportion female among stock of immigrants (2010) 75% 53% Descendants per 100 immigrants (2010)2 57 64 Proportion of descendants with one Norwegian-born parent (2010)2 94% 59% Proportion of family migration with a Norwegian or Nordic citizen (2009) 71% 50%
Notes: 1) Refers to the six groups covered in this scoping study report 2) Descendants in this context refer to people born in Norway with one or two foreign-born parents. Source: Compiled on the basis of data from Statistics Norway and the Directorate of Immigration
us that, in the city where she lives, she knows of both women who had a regular job in Brazil at the time when they met their Norwegian husbands, and those who were sex workers.
No matter the reasons behind the migration, the statistics illustrate the importance of fam-ily formation with Norwegians in Brazilian migration to Norway (Table 2). First, the more than 80 family migration permits per 100 immigrants in 2009 indicate that most migration is family-based. Second, the reference person for more than 70 percent of the permits was a Norwegian (or Nordic) citizen. The fact that more than 90 percent of the children of Brazil-ians in Norway have a Norwegian parent underlines this pattern.
According to the Brazilian Embassy, due to a few problematic cases related to Norwegian citizens in Brazil (among these a serious case of money laundering), the tourism flow from Norway to Brazil has decreased in the past couple of years. But for now, this factor has not made itself evident in the statistics of Norwegians bringing partners with them from Brazil.
High-skilled migrants
There are many Brazilians working for companies in Norway. These are either Norwegian companies or companies that are established in both Norway and in Brazil. In the past decade, there has been a trend of an increasing number of Norwegian companies operating in Brazil. The Brazilians working in these companies are experts with an education at a Master’s or PhD level. Some of them live in Norway over a long period of time, but there are also exam-ples of people who work in companies that are established both here and in Brazil, who have

18
been travelling back and forth over a long period of time. In addition, there are also those who come to Norway for education purposes at a higher level. A very common way of first enter-ing Norway is to do internships at Norwegian companies as part of one’s education scheme.
Adopted children
In the 1990s, there was a sudden increase of adopted children being brought to Norway from Brazil. Most of these were not infants or toddlers at the time of the adoption, but older chil-dren of about 7/8 years of age, who are grown-ups in their mid-twenties by now. This trend has now slowed down and is practically non-existing, although the reasons for this are un-clear. Over the past decade 150 children have been adopted from Brazil (Statistics Norway 2010). These children are not counted as immigrants in population statistics.
Changes explained
It appears that the increase in Brazilian migration to Norway is correlated with the increasing tourism traffic of Norwegians to Brazil. In the past few decades, an increasing number of Norwegians have started travelling abroad, for the most part to countries with an agreeable climate as a remedy to the long, dark and cold Norwegian winters. As such, Brazil has be-come a very popular destination. In addition, the dynamism of bilateral relations between Brazil and Norway and the convergence of economic interests have strengthened the contact between Brazilians and Norwegians, particularly in the last decade. Growing business ties, bilateral trade and investments have enhanced the relationship between the two countries and peoples, fostering personal and professional contacts. This, in combination with the contact established between Norwegians on vacation and Brazilians, seems to have boosted the mi-gration flows from Brazil to Norway.
Visas and permits
Thanks to previous colonial ties, Brazilians with dual Brazilian and European citizenships are able to travel to Norway both for work and touristic purposes rather easily. With only a Bra-zilian citizenship, however, the ease with which to obtain the necessary documents may vary. High-skilled migrants in the fields of technology, a sector with a lack of experts, seem not to meet great difficulties when applying for work permits for Norway. As long as there is a company in Norway that is willing to provide them with a job opportunity as an expert, they will obtain the necessary documents. Moving to Norway for family reunification reasons does not seem to pose great problems either.
Nevertheless, in addition to the official figures for Brazilians in Norway, there are also an uncertain number of irregular Brazilian migrants. In the past year, the Embassy of Brazil in Oslo has been contacted regarding two cases of Brazilian citizens being deported from Nor-way due to lack of necessary papers. According to the Embassy, these were the first cases of this sort ever in the Norwegian context. In both cases the person had entered Norway after following a route through other European countries. One of the persons deported had entered Norway on a tourist visa, and then over-stayed. Of course, irregular migrants do not contact the Brazilian Embassy voluntarily, so that it is impossible to know the extent of irregular mi-

19
gration from Brazil to Norway. However, a Brazilian migrant interviewed informed us that he has met many Brazilians who are staying in Norway irregularly.
Institutions and community
Although Brazilians in Norway constitute a small part of the overall population, there are many Brazil-linked activities and associations in Norway. This seems to be linked to the in-terest of many Norwegians in different aspects of the Brazilian culture. For example, there are several Capoeira clubs in different parts of Norway. The largest one, with its 350 members, has only four Brazilian members. Furthermore, there are several Brazilian pubs/cafés. During the World Cup, these worked as gathering spots for both Brazilians and Norwegians who are fans of Brazil and the Brazilian culture.
There is also an association for Brazilians called Conselho de Cidadãos Brasileiros na Noruega (Council of Brazilian Citizens in Norway)13, which among other things organizes tutoring activities for children of Brazilian parents, teaching them Portuguese and allowing them to come together and play. Another relevant website is a ‘communication newspaper for Brazilians in Norway’14. Here, news and information about and related to Brazilians in Norway are posted.
The job of one of our informants involves travelling in all parts of Norway. As such, he meets Brazilians everywhere, from tourists to high-skilled migrants, and irregular migrants. He told us that Brazilians easily find and become friends with each other. They are happy to be able to speak their mother tongue, and meet other Brazilians far away from home. Both he and our female informant told us that they are contacted by e-mail or community sites as Facebook and Orkut by Brazilians who are either considering moving to or have just arrived in Norway.
Many of the people our informant talks to, say that they learned about the opportunities in Norway through different types of reporting on television. Many do not have permanent jobs in Brazil, and come to Norway for financial reasons. However, in his opinion, those reports leave out one important aspect: Norway is a very good country to live in, for Norwegians. For for-eigners, the bureaucracy of obtaining and renewing the necessary papers, learning the language, adjusting to the culture and structures, and adjusting to the cold weather often becomes difficult.
Although this is only the opinion of one single individual, the difficulties in adjusting to the Norwegian society might explain some of the background for why many Brazilians prefer to stay within a Brazilian community. Another migrant we spoke to, who has been working in a company in Central Norway for three years, liked living in Norway to the extent that she and her Brazilian partner have already bought a house here. Nonetheless, outside of work, she mainly spends time with other Brazilians and other foreigners. In her opinion, it is easier to get in touch with other foreigners, as they are in the same situation as her.
Remittances and other transnational connections
According to the migrants we spoke to, it is common for Brazilians to keep close ties with the extended family and friends in Brazil, which is an important part of the Brazilian culture. They do so through the Internet, by telephone, Skype and so on, in addition to vacations to Brazil.
13 www.conselhobrasil.no/index.htm 14 wordpress.pretonobranco.no

20
According to our informants, it is common for Brazilians to remit a bit of money to family in Brazil. Bank transfers, transferral agencies are used, as well as bringing some cash when one goes there for holiday. Transferring money to a Norwegian account that can be used once in Brazil, or giving one’s own credit card for family in Brazil to use were also mentioned as ways of remitting.
Assessment
Migration from Brazil to Norway is characterized by a gradual migration take-off from the 1980s with ever-increasing inflows in the last decade. This increase is mainly linked to high-skilled education/labour migration and family-related migration with Norwegian citizens. The main Brazilian migrants largely consists of women. It is also characterized by a great sense of community and a very high level of community life – Brazilians in Norway seem to be very well-connected and active in associations, clubs, businesses etc. There are a number of rea-sons why Brazilians would be a very interesting case to study in the Norwegian context.
Despite a growing Brazilian population in Norway, we have not found any research on Brazilians in Norway. Consequently, this report is mainly based on figures from Statistics Norway, conversations with the Embassy of Brazil in Oslo and two Brazilian migrants who reside in different parts of Norway, and Internet searches on Brazilian-linked activities in Norway. As it appears at this point, most of the Brazilian migrants do not have any prior links to Norway through for example family or close friend ties. Consequently, one of the interest-ing aspects worth further exploring would be why and who an increasing number of people choose to come to Norway.
There seems to be a great interest in our research at the Embassy and amongst other infor-mants, as they would like to have more knowledge on Brazilians in Norway. At this point, we do have quite a few possible entry points for conducting the interviews for the next phases of the project. There are separate groups for Brazilians and “Norwegian friends of Brazil” on both Facebook and Orkut, which we have been informed, are widely used by Brazilians. These could serve as important entry points for our research. Furthermore, the Brazilian Em-bassy is currently in the process of contacting Brazilians and encouraging them to register with them in order to vote at the upcoming presidential elections on October 3rd.15 We have been invited to observe this at the Embassy, which could be a good opportunity to meet Bra-zilians. In other interviews, we have also been invited to join Brazil-related clubs, and travel to other parts of Norway to meet with other Brazilians. On the whole, with most of the Brazil-ians we have contacted, the willingness and openness to share and help, as well as the level of knowledge on other Brazilians in Norway, has been striking.
At this point, we are not sure which locality other than the Oslo area would be suitable for studying this group. We know that there are at least a couple of hundred Brazilians in the technology university city of Trondheim, and probably about the same in the business and industry city of Stavanger, but we need to explore more in order to find the best options for.
15 According to Brazilian legislation, Brazilians are to either vote or justify for the elections, but so far, the Embas-sy has only succeeded to have 680 Brazilians register for this.

21
Egypt
Migration history and demography
Egyptian migration to Norway is a small-scale phenomenon, but has a relatively long history compared to migration from other non-European countries. In 1970, although they numbered only 81 individuals, Egyptians were the 12th largest among migrant groups from Africa, Asia or Latin America. By 2010, however, Egyptians had dropped to place 40 on the list. The cur-rent population of Egyptian immigrants is around 700 (Table 3).
In the period of guest worker migration to Norway (roughly 1967–1974) Egyptians formed part of a North African flow that also included Moroccans, Algerians and Tunisians. Infor-mants indicated that some came as highly skilled migrants to work as engineers or in the shipping industry; others came as low-skilled labour migrants.
The number of Egyptians has risen more rapidly since the late 1990s (Figure 9). This is also the period when immigration from Egypt to Norway has clearly exceeded migration in the opposite direction; for much of the 1980s and 1990s, the two flows almost cancelled each other out (Figure 11). Migration effectiveness remains comparatively low, meaning that the mobility between Norway and Egypt results in less settlement in Norway than what is the case with other migration corridors (Table 3).
Table 3. Overview of demographic indicators for Egyptians in Norway
Egypt
Average for the six groups (unweighted)1
Stock of immigrants (2010) 697 3032 Change in stock of immigrants (2005-2010) 48% 63% Stock of foreign citizens (2010) 286 1540 Change in stock of foreign citizens (2005-2010) 36% 59% Cumulated immigration by country of departure (1975-2009) 1752 5110 Cumulated naturalizations (1977-2009) 340 2180 Immigration by country of departure (annual average 2005-2009) 79 298 Migration effectiveness (2005-2009) 0.33 0.56 Immigration by citizenship (annual average 2005-2009) 53 281 Emigration by citizenship (annual average 2005-2009) 18 88 Proportion of immigrants not arriving from country of citizenship (2009) 11% 9% Proportion of emigrants not departing to country of citizenship (2009) 20% 52% Cumulated asylum applications (1995-2009) 117 549 Asylum applications per 100 immigrants (2005-2009) 28 15 Family migration permits per 100 immigrants (2009) 61 69 Proportion female among stock of immigrants (2010) 30% 53% Descendants per 100 immigrants (2010)2 76 64 Proportion of descendants with one Norwegian-born parent (2010)2 80% 59% Proportion of family migration with a Norwegian or Nordic citizen (2009) 66% 50%
Notes: 1) Refers to the six groups covered in this scoping study report 2) Descendants in this context refer to people born in Norway with one or two foreign-born parents. Source: Compiled on the basis of data from Statistics Norway and the Directorate of Immigration

22
Figure 9. Stock of Egyptian immigrants in Norway, 1980–2010
Source: Compiled on the basis of data from Statistics Norway. The period 1980–1986 is interpolated due to missing data.
Figure 10. Proportion of women in the stock of Egyptian immigrants in Norway, 1980–2010
Source: Compiled on the basis of data from Statistics Norway. The period 1980–1986 is interpolated due to missing data.
Figure 11. Immigration and emigration to/from Egypt and asylum applications by Egyptians, Norway 1980–2010
Source: Compiled on the basis of data from Statistics Norway and the Norwegian Directorate of Immigration.
Figure 12. Migration to/from Egypt and of Egyptian citizens, Norway 2005–2009
Source: Compiled on the basis of data from Statistics Norway.
0
100
200
300
400
500
600
700
1980 1985 1990 1995 2000 2005 2010
First-generation immigrants
Descendants (two foreign-born parents)
0
25
50
75
100
1980 1985 1990 1995 2000 2005 2010
Proportion women (%)
0
20
40
60
80
100
120
1980 1985 1990 1995 2000 2005 2010
Immigration Asylum applications
Emigration
0
50
100
150
200
250
300
350
400
450
Immigration Emigration Net migration
To/from Egypt Egyptian citizens

23
Furthermore, Egyptian migration to Norway has continuously been dominated by men (Figure 10). The highest registered proportion of women was the earliest available record: 38 percent in 1970. The share of women dipped below a quarter around 1990 and today stands at 30 percent (Table 3). This makes Egyptians one of the most male-dominated immigrant popu-lations in Norway, along with other North Africans (except Moroccans).16
Given the dominance of men among the migrants, it is not surprising that 80 percent of children of Egyptians in Norway have one Norwegian parent. Relationships between Egyptian men and Norwegian women clearly play a role in the migration process, although it is not possible to conclude from the statistics whether these relationships cause, enable, or result from the move to Norway. According to our informants, however, marrying European women on holiday in Egypt has been an important route out of Egypt since the 1980s, and has be-come increasingly evident in the Norwegian case since the early 2000s.
Asylum seeking has played a small role in Egyptian migration to Norway. In recent years, the number of Egyptians claiming asylum in Norway has been relatively high in relation to the Egyptian immigration flow: 28 applications per 100 immigrants (Table 3). However, very few are granted protection. Out of 29 applicants in 2008-2009, only one was granted permis-sion to remain in Norway (Directorate of Immigration 2010).
In addition to the official number of Egyptians in Norway, the Embassy assumes that there are a small number of irregular Egyptian migrants in Norway who are not registered in the official statistics. One Egyptian pioneer migrant informed us that he has come across people who apply for asylum on a false basis. According to him, some claim that even if they are not granted asylum in Norway, this still provides them with the chance to stay in Norway for a couple of years, before moving on to the next country where they can do the same.
Another interesting observation is that immigration from Egypt is roughly 50 percent lar-ger than immigration of Egyptian citizens (Figure 12). One reason for this could be that many refugees from the Horn of Africa have come to Norway after first living in Egypt. There is for example a considerable community of Somalis living in Cairo, which is considered a tempo-rary place of residence (Al-Sharmani 2004, 2006).
Changes explained
In the past, it was mainly well-off people from the Egyptian middle-class who came to Nor-way for educational or professional purposes. They often had higher education and the high degree of qualifications that Norway needed. Today, however, they tend to be people of working class background who come to Norway for a better standard of life than in Egypt, where the welfare benefits are few and the unemployment rate is relatively high.
A pioneer migrant who came to Norway in the late 1970s as a highly skilled migrant in the shipping industry observes great changes in both the Norwegian and Egyptian society over the past 30 years. In his view, Egypt was in many ways more developed than what he saw in the Norwegian society when he first arrived: There were more foreign restaurants there than in Norway, the shops had longer opening hours and many Egyptians had the expert qualifica-
16 Only nine immigrant groups of at least 100 people had a female proportion of less than 35 percent in 2010. These included Algerians, Egyptians, Libyans, Palestinians, and Tunisians. The other four groups were European.

24
tions that there was a great shortage of in Norway. However, over time, Norway has emerged as one of the most developed countries in the world. Egypt, in the eyes of the informant, has become increasingly characterised by corruption and religiosity, at the same time as the gap between the poor and the rich has become more and more evident. These changes in the Nor-wegian and Egyptian societies partly explain why Norway attracts Egyptians with a different background than what was the case at the beginning of the Egyptian migration to Norway.
Historically, Egyptians have preferred to go to the southern parts of Europe rather than the Scandinavian countries. Informants indicated that up until recently, Egyptians did not know much about Scandinavia. The recent growth in the number of Egyptians to Norway, then, can partly be explained by Egyptians learning more about Norway due to greater access to the Internet, TV broadcastings and the increasing number of Norwegian tourists who go on holi-day to Egypt. Through these channels, Egyptians learn more about the Norwegian culture and society. Norwegian women on holiday in tourist destinations such as Sharm el Sheik and Hurghada meet Egyptian men working at tourist locations, at times resulting in marriage, which can explain the statistical trends mentioned above.
At the same time, obtaining visas for educational and touristic purposes is becoming more difficult, which may be related to this alternative route of reaching Norway. In addition, al-though the Egyptian economy and infrastructure on an overall level has improved significantly over the past few years, one of our informants told us that Egyptians who are not well-educated are not able to benefit from such improvements, and assume their chances to be better abroad.
Institutions and community
There is only one Egyptian association in Norway, and it is located in Oslo. This is an arena where people meet to share Egyptian food and come together in different activities. Most of the members are Egyptians, but there are also a few Norwegian members who have links to Egypt and travel there often. Non-members can also participate in events organized by the associa-tion but people are encouraged to become members so that the association can receive grants from the Norwegian authorities, who support associations according to the number of members.
In the interviews, it was pointed out that many Egyptians find it difficult to find close Norwegian friends. Consequently, they stay in touch with other Egyptians as much as they can. However, these are informal ties of a few close friendships, rather than large-scale for-malized networks. This might partly, but not solely, be explained by the small numbers of Egyptians in Norway. After all, the Bangladeshi community is even smaller, but does have quite strong socio-cultural networks.
Remittances and other transnational connections
In general, many persons of Egyptian background in Norway maintain their contact with fam-ily and friends back in Egypt by going there during the holidays, keeping in touch by tele-phone or through the Internet. Many consider moving back there after a long life in Norway, and so maintaining the ties with Egypt is important in this respect as well. However, as one informant pointed out, in reality it is often very difficult to return to a life in Egypt after one has become used to the Norwegian way and standard of living.

25
Other possible ways of keeping informed about Egypt and other Egyptians abroad is through the Egyptian MFA’s website which publishes advisories for Egyptians abroad, and the Ministry of Labour and Emigration that publishes news about Egyptians abroad. To which extent these websites are consulted, however, is unknown.
As a whole, remittances from abroad rank third as the source of income for Egypt (Zohry and Harrell-Bond 2003:44), but there are no figures available on how much of this is remitted from Egyptians in Norway. According to one informant, most Egyptians who live in Norway at some point or another acquire assets such as real estate and land in Egypt.
Assessment
The Egyptian migration history to Norway can be characterized by recent growth after a his-tory of stagnation. Egyptians were among the first immigrants from non-Western countries to settle in Norway. However, the growth of the Egyptian population in Norway was present, but slow, over a long period of time before it really started taking off from the early 2000s on-wards. At this moment in time, it is not clear whether the pattern of Egyptian migration to Norway is in a take-off or stagnation period, as growth is slow but accelerating.
Although the actual number of Egyptians in Norway remains relatively small, Egypt would make an interesting case within the THEMIS framework because of its major shift from mainly educational and/or professional to family reunification migration-related reasons. In addition, Egyptian migration to Norway is male-dominated, which could be interesting to compare with the female-dominated migration from Brazil or Ukraine.
Whereas the background for including Egypt in the pre-study was the forced migration as-pect, in the research we have conducted so far it has become apparent that this plays a minor part in the migration history of Egyptians to Norway. Statistics show that an extremely small number of Egyptians are granted asylum in Norway. The Bangladeshi case would be much more interesting in this respect, as this is more truly a group with ‘mixed migration’ patterns.
When it comes to accessibility of this group for a next phase, we do have a couple of leads on possible entry points for access to initial “seeds”, such as for example an Egyptian associa-tion which also has a group site on Facebook. However, at this point, it is not clear where we could find a sufficient number of Egyptians to interview outside of Oslo.
India
Migration history and demography
Significant immigration from India to Norway only began towards the end of the 1960s (Kramer 1980: 4). In 1970, the roughly 250 Indians in Norway were the third largest immi-grant group from a developing country, outnumbered only by Moroccans and Chinese. In 1978, there were about 900 Indians in Norway, about two-thirds of whom were concentrated in Oslo and the surrounding industrial towns (Kramer 1978: 662), and by 1978, there were about 1 200 Indians in Norway (Kramer 1980). The majority of the Indians who came to Norway during this period were males in the age bracket of 20 – 49 years (Kramer 1980: 2),

26
and the growth of the Indian population in Norway was clearly part of the broader guest worker migration at the time. However, the labour migrant flows never reached the same pro-portions as among Pakistanis, Moroccans and Turks (Carling 1999). Furthermore, the Indian presence in Norway was diverse at an early stage, also including refugees from Uganda after the expulsion of Indians by Idi Amin in 1972, and low- as well as high-skilled workers.
Indians as low-skilled labour force
Most of this first group of labour migrants were people with aspirations to find jobs in other European countries, such as Great Britain, Germany and Denmark, where they had family and friends. But by the late 1960s and early 1970s, these countries had already stopped issuing residence and work permits to labour migrants. In search of alternative destinations, Norway began to emerge as an appropriate candidate: The liberal immigration policies meant that it was easy to obtain work and residence permits as long as you had a job, and the shortage of unskilled labour force meant that it was easy to find that job.
For many, the plan was to earn as much money as possible in the shortest time-span possi-ble in order to return to India to set up businesses and improve the life quality for themselves and their families (Kramer 1978). Consequently, most of them initially did not have any in-tention of staying in Norway. But as an increasing number brought families and wives to Norway, they had invested more in their stay than what they had originally anticipated and ended up staying in Norway (Kramer 1979b: 21).
The Indians who came to Norway were mainly people from the Punjab region. Despite popular understandings, the majority of them were educated (with either high school or uni-versity diplomas) from a middle-class background (Wist 2000:16). The financial and formal criteria (such as being able to document that someone in Norway would be able to support you during your stay, or the criterion of commanding a European language) could not be met by just anyone (Kramer 1979b).
The Indian migrants would often find work through different types of networks (Kramer 1979b, Wist 2000). Once established, the migrants would help other friends and relatives to find jobs in Norway, who then helped their friends and relatives to find jobs in Norway. One of the consequences of this chain migration was that many people of the same background (in this case, Indian Punjabi background) were concentrated in certain work places and areas.
The lack of knowledge of the Norwegian language and society meant that many of the In-dian migrants were overqualified for the job they were doing. However, some of the labour migrants managed to use their education here as well, by continuing their studies once in Norway, eventually finding a job in a company of relevance, or setting up their own busi-nesses (Kramer 1979b, Wist 2000).
In 1975, when the immigration stop no longer allowed room for labour migration, an in-creasing number of men began bringing their families to Norway (Kramer 1980: 6). Conse-quently, while the number of Indian males hardly increased in the first years following the immigration stop in early 1975, the number of women and children increased rapidly (Kramer 1978).

27
Figure 13. Stock of Indian immigrants in Norway, 1980–2010
Source: Compiled on the basis of data from Statistics Norway. The period 1980–1986 is interpolated due to missing data.
Figure 14. Proportion of women in the stock of Indian immigrants in Norway, 1980–2010
Source: Compiled on the basis of data from Statistics Norway. The period 1980–1986 is interpolated due to missing data.
Figure 15. Immigration and emigration to/from India and asylum applications by Indians, Norway 1980–2010
Source: Compiled on the basis of data from Statistics Norway and the Norwegian Directorate of Immigration.
Figure 16. Migration to/from India and of Indian citizens, Norway 2005–2009
Source: Compiled on the basis of data from Statistics Norway.
0
1000
2000
3000
4000
5000
6000
7000
1980 1985 1990 1995 2000 2005 2010
First-generation immigrants
Descendants (two foreign-born parents)
0
25
50
75
100
1980 1985 1990 1995 2000 2005 2010
Proportion women (%)
0
200
400
600
800
1000
1200
1980 1985 1990 1995 2000 2005 2010
Immigration Asylum applications
Emigration
0
500
1000
1500
2000
2500
3000
3500
4000
Immigration Emigration Net migration
To/from India Indian citizens

28
High-skilled migrants
Although most of the first Indian migrants to Norway came to take jobs as unskilled labour force, there were also quite a few who came to fill the shortage of engineers (Bø 1984), nurses, doctors and physiotherapists. For example, we spoke to an Indian pioneer migrant who came to Norway in the late 1970s when her husband got a job as a physiotherapist. After considering several job offers, he chose Norway because here he was able to run his own pri-vate practice in English, and so he could see the career possibilities for the future. Once he accepted the job and came to Norway, she could apply for a visa to follow him, and joined him within 30 days.
This informant could also tell us that from 1977 onwards, there were quite a few Indians who came to Norway as county college students. These were mainly relatives of persons al-ready residing in Norway, who could have their education paid by the closest family. Many of these continued their studies in Norway, and ended up staying here. One possible way of stay-ing was to go back to India to marry for example nurses or physiotherapists, and then join them in Norway as family reunification.
Recent immigration
The population of Indians grew rapidly through the 1970s and 1980s to just under 4000 peo-ple in 1990 (Figure 13). Through much of the 1990s, however, the number of Indians in Nor-way stagnated. There appears to have been a marked shift around 1990 with a sudden drop in immigration from India combined with an increase in emigration to India (Figure 15). There is reason to believe that the number of Indian immigrants leaving Norway was substantially higher, since many probably went to other destinations rather than back to India. In 2005–2009, the emigration of Indian citizens from Norway was markedly higher than emigration to India (Figure 16). The importance of Norway as a transit country is further illustrated by mi-gration data from 2009, showing that more than half of Indian citizens leaving Norway did not go to India (Table 4).
There has been a remarkable growth in immigration from India in the past five years, with a record of 1121 immigrants in 2008. The spike in emigration to India the following year however indicates that not all came to Norway to stay. This might be related to the fact that part of the recent immigration of Indians is work- and education related, so that people tend to return to India once their business in Norway has been completed. According to our infor-mant, these are mainly people from the big Indian cities such as New Delhi, Bombay and Cal-cutta, who have completed higher education within the fields of technology and finance.
Currently, many Indians come as students, either at a Master’s degree or PhD level, others as specialists within the fields of engineering and IT. In fact, 1 out of 5 specialists who were given work permits in the first half of 2007 were Indians. The number of Indian specialists who obtained work permits was doubled ten times in the course of 2006/2007, in comparison to 2005 (Directorate of Immigration 2007). Similar to the labour migrants in the 1970s, these also come from higher class backgrounds, with higher education. However, they have an even higher level of education than what was the case in the 1970s, and are able to go straight into high-status jobs with very high levels of income.

29
Table 4. Overview of demographic indicators for Indians in Norway
India
Average for the six groups (unweighted)1
Stock of immigrants (2010) 6888 3032 Change in stock of immigrants (2005-2010) 50% 63% Stock of foreign citizens (2010) 3652 1540 Change in stock of foreign citizens (2005-2010) 82% 59% Cumulated immigration by country of departure (1975-2009) 12012 5110 Cumulated naturalizations (1977-2009) 5900 2180 Immigration by country of departure (annual average 2005-2009) 745 298 Migration effectiveness (2005-2009) 0.58 0.56 Immigration by citizenship (annual average 2005-2009) 752 281 Emigration by citizenship (annual average 2005-2009) 270 88 Proportion of immigrants not arriving from country of citizenship (2009) 9% 9% Proportion of emigrants not departing to country of citizenship (2009) 56% 52% Cumulated asylum applications (1995-2009) 366 549 Asylum applications per 100 immigrants (2005-2009) 6 15 Family migration permits per 100 immigrants (2009) 55 69 Proportion female among stock of immigrants (2010) 47% 53% Descendants per 100 immigrants (2010)2 62 64 Proportion of descendants with one Norwegian-born parent (2010)2 33% 59% Proportion of family migration with a Norwegian or Nordic citizen (2009) 17% 50%
Notes: 1) Refers to the six groups covered in this scoping study report 2) Descendants in this context refer to people born in Norway with one or two foreign-born parents. Source: Compiled on the basis of data from Statistics Norway and the Directorate of Immigration
Family-related migration, which is primarily between foreigners rather than with Norwe-gian citizens, is also of great importance today (Table 4). Still, a third of the children of Indi-ans born in Norway have a Norwegian-born parent, which could indicate that many of those who do not come to Norway for family reasons later settle with Norwegian partners.
About 250 of the Indian immigrants in Norway originally came as refugees or asylum seekers. Including their family members, the population with a refugee background stands at 533 persons, or about 8 percent of all Indian immigrants. The majority came to Norway more than 10 years ago (Statistics Norway 2010). Despite having a large Indian network in all parts of Norway, the Indian pioneer migrant we spoke to knew of very few cases of Indian asylum seekers, and the ones she did know of, had come to Norway because of political issues in Kashmir or Pakistan. The current number of asylum seekers from India is low, and 98 percent of those who did apply in 2008–2009 were either rejected or not examined (Directorate of Immigration 2010).
Changes explained
The very start of the history of Indian migration to Norway was characterised by Indians com-ing as manual labour migrants, although it did not take long before a different group consist-ing of high-skilled migrants and higher education students were also visible. After the immi-gration stop, family reunification was added as a significant part of the Indian immigration. More recently, many Indians come to Norway for higher education or professional purposes.

30
As Norwegian companies have increasingly established themselves in, and outsourced many of their tasks to, India, both parties have started to learn more about the possibilities of mak-ing use of each other’s resources. The Norwegian Government has recently even developed a strategy for this and other kinds of cooperation between Norway and India (Departementene 2009).
In addition to these highly skilled migrants coming to Norway as students or specialists, there are still a significant number of persons who come to Norway through family reunifica-tion. However, in comparison to other non-western immigrant groups, there is a relatively large share of Indians who marry someone with a non-immigrant background, both among the males and females of Indian origin (Daugstad in Henriksen 2010: 29).
Visas and permits
As the case of Indian migration to Norway illustrates particularly well, the visa, work and residency permits legislations in Norway have changed massively over time. For example, our informant recalls that when she first came to Norway, marrying someone residing here while visiting as a tourist was accepted, whereas now this is illegal. Today, on the other hand, even as a student or an expert it is very difficult to obtain the necessary papers to come to Norway. The long procedures of having the papers accepted by the Norwegian Directorate of Immigra-tion makes the conditions for job applicants very difficult. In addition, there is a jungle of legislations, which are constantly changing, that most people do not have sufficient knowl-edge of. Nonetheless, this does not seem to affect the extent of the migration too significantly, as the number of people coming from India to Norway was kept at a rather stable level for about 20 years, until the recent period of expansion.
Institutions and community
During the period of chain-migration until the immigration stop in 1975, Kramer (1980) found that one of the reasons why Drammen had the second largest concentration of Punjabis in Norway, next to Oslo, was that it was so easy to find jobs in farms or nursery gardens in the district that sorely needed this kind of labour force. In fact, 30 years later, this municipality still has the second largest Indian community (575 persons), after the municipality of Oslo (3 107 Indian immigrants) (Henriksen 2007: 170). Furthermore, as time passed, the migrants helped each other obtain better paid jobs in for example factories. This indicates that the im-portance of community has been great among Indians ever since their arrival in Norway.
The sense of community became of even greater importance when the immigration stop was introduced, as having a network in Norway was now necessary in order to work one’s way around the restrictions implemented. Many did so by coming to Norway as tourists, find-ing a job, and then returning to the country where they had been residing for the past six months in order to apply for a work permit in Norway. Finding a job through the help of family and friends who were already in Norway was very important in this process (Kramer 1980: 5).
Historically, Indians have been very active in establishing associations in Norway, both of religious and non-religious character. For instance, there is the Norwegian-Indian Associa-tion, which was established in 1959 to expand the mutual understanding and interest between

31
Norway and India. The Indian Welfare Society of Norway was established by the first Indian migrants in 1971 as a mean to advance the interests of Indian immigrants in Norway (Kramer Not Dated). The association has transformed since its early days, but still exists today. Very early on in the history of Indian migration to Norway, there were also attempts of forming Gurdwara societies (Kramer 1980), and today, there are two Gurdwaras in the Oslo area. Other examples include the Indian Cultural Association, established in Central Norway in 1986; and Indian Welfare Society Kristiansand, which was established in Southern Norway more recently.
Despite the numerous Indian associations, however, our informant told us that Indians were more active in these kinds of formalized associations previously. In her opinion, this has to do with the high degree of integration among the Indian population in the Norwegian soci-ety. In general, there are a relatively high percentage of the Indian first generation immigrants who have higher education (Henriksen 2007), and the young Indian descendents are among the highest groups in the population overall to invest in higher education (Henriksen 2007, Schou 2006). This has allowed Indians to integrate very well into the Norwegian labour mar-ket. However, it should be added that the first generation of Indians seem to be more active in these kinds of associations than what is the case for the second generation.
In terms of less formalized groupings and activity centres, there are many Indian cricket and football teams and dance groups, which appear to be popular in all ages. The tradition of the showing of Indian films in theatres goes back to the first period of Indian migration to Norway (Kramer 1978), and is still kept alive today. As Kramer’s reports show, from the be-ginning, it was common for Indian migrants to form smaller groupings based on kinship or place of origin. In the opinion of our informant, the tie between Indians in these kinds of in-formal settings is still very strong today, as it is common to have a small group of friends and families that one invites to dinners and parties, such as for example big weddings.
Finally, there are several travel agencies operating between Norway and India17, and India has been a relatively popular tourist destination for Norwegians in the past years. Interest-ingly, this does not seem to have resulted in the same family reunification patterns between ethnic Norwegians and Indians, as it has elsewhere.
Remittances and other transnational connections
According to our informant, the first generation of Indians in Norway keeps a stronger tie to relatives and contacts back in India. They spend most of their holidays in India, and many keep themselves informed about the Indian society through the Embassy’s websites, newspa-pers, both online and at libraries, and on the Internet more general. Many also have satellite dish TVs through which they can gain access to Indian television broadcasted both from India and the United Kingdom.
Furthermore, many feel responsible for family and relatives who are still in India, and so it is common to remit a small part of one’s income to siblings and parents through bank trans-fers. Some, for example, pay parts of or the total of siblings’ education in India.
17 See for example: www.indianadventures.no

32
Assessment
There is a long history of Indian immigration to Norway, with a high degree of mobility, and after a long period of stability, it has experienced renewed growth in the past few years. Fur-thermore, Indian immigration to Norway is of a diverse character, consisting of both unskilled and skilled migrants, those who come to Norway for family reunification purposes, and a small number of refugees and asylum seekers.
It was due to stricter immigration policies in other European countries that Indians first discovered Norway as a country of destination. Here, they were able to obtain better paid jobs and achieve a better standard of living than in India. Ever since the first arrivals of Indians to Norway, they have adjusted well to the Norwegian society, and are among the well-integrated immigrants from developing countries both in terms of higher education and level of em-ployment. At the same time, right from the start, Indians have been very active in socio-cultural associations.
Although Indians can be reckoned as a medium-sized immigrant group in Norwegian stan-dards, since the 1970s, Indians have not been among the largest immigrant groups in Norway. This might be an indication of Indian migrants having other favourite destinations than Nor-way, and exploring the reasons behind this could be interesting in the next phase of our pro-ject. On the other hand, although India has been emerging as a tourist destination for many Norwegians, there is not a visible pattern of ethnic Norwegians finding partners while on holiday in India, like we have seen in the case of for example Brazil and Egypt. This might be partially linked to the restrictions of the caste system in India, but further exploring this issue in comparison to other groups in a next phase might prove interesting for our purposes.
Within the six selected groups in the scoping studies, Indians appear to be the group which has been most frequently subject to research in Norway. This started already in the 1970s by social anthropologist Julian Kramer. Among the most recent studies where Indians have been included, most seem to focus on educational achievements. In our experience, it has been very difficult to get in contact with Indians willing to take part in the research, and formal organi-zations and institutions have also been extremely unhelpful. Based on this pre-study, then, it seems that conducting research within this community in Norway will be difficult, despite the many possible entry points. However, was this group to be selected for a next phase, the most probable choices for research locations would be Oslo and Drammen, where the largest groups of Indian immigrants reside.
Morocco
Migration history and demography
The Moroccan community is one of the oldest migrant communities in Norway. In 2006, thirty percent had lived in Norway for twenty years or more, whereas fifty percent had lived in Norway for fifteen years or more (Henriksen 2007: 189). The community mainly consists of those who came as labour migrants, for family reunification and for family formation. Many came to Norway as labour migrants before the changed legislation restricted entry for

33
work in 1975, as well as in relation to family reunification options after this change in legisla-tion. The maturity of the Moroccan immigrant population is further illustrated by the high number of descendants: Moroccans are among the migrant groups with the largest second generation.18 Persons with at least one Moroccan-born parent now outnumber Moroccan im-migrants in Norway (Table 5).
Moroccans are one of the two larger immigrant groups selected for the THEMIS study, al-though they are gradually being overtaken by groups with a more recent migration history. The number of Moroccans in Norway has grown very steadily, but not very rapidly compared to other immigrant groups. Over the period 1970–2010, the Moroccan population increased at an average of 6 percent per year, compared to 10 percent for Turks and 12 percent for Paki-stanis. In 1977, Moroccans were the fifth largest group of non-western migrant groups, whereas in 2006, Moroccans formed the 17th largest community (Henriksen 2007: 189).19 The number of Moroccan immigrants has stagnated in the sense that the growth is slowing down and that the level of immigration is low in relation to the stock of immigrants (Figure 17). There are close to 5000 Moroccan immigrants living in Norway, and an inflow of just over 100 Moroccan citizens per year.
Moroccan immigration to Norway began in the 1960s. By 1970, there were 401 Moroccans living in the country. Moroccans were one of the three large non-European groups in the early guest worker migration to Norway, along with Pakistanis and Turks. Until 1971, when Pakistanis
Figure 17. Stock of Moroccan immigrants in Norway, 1980–2010
Source: Compiled on the basis of data from Statistics Norway. The period 1980–1986 is interpolated due to missing data.
Figure 18. Proportion of women in the stock of Moroccan immigrants in Norway, 1980–2010
Source: Compiled on the basis of data from Statistics Norway. The period 1980–1986 is interpolated due to missing data.
18 www.ssb.no/emner/02/02/statsborger/tab-2010-05-27-02.html. 19 Compared to 5 267 from Pakistan, 1 735 from Yugoslavia, 1 392 from Turkey and 897 from India.
0
1000
2000
3000
4000
5000
6000
1980 1985 1990 1995 2000 2005 2010
First-generation immigrants
Descendants (two foreign-born parents)
0
25
50
75
100
1980 1985 1990 1995 2000 2005 2010
Proportion women (%)

34
Figure 19. Immigration and emigration to/from Morocco and asylum applications by Moroccans, Norway 1980–2010
Source: Compiled on the basis of data from Statistics Norway and the Norwegian Directorate of Immigration.
Figure 20. Migration to/from Morocco and of Moroccan citizens, Norway 2005–2009
Source: Compiled on the basis of data from Statistics Norway.
arrived in large numbers, Moroccans were by far the largest of the three (Carling 1999). Most Moroccans came from the North, and in particular the Rif Mountains. They mainly came, as one informant puts it, because ‘they wanted to have a better life for themselves and their fami-lies’. In the late 1960s and early 1970s, ‘the openings in other, more attractive places in Europe were tightening, both in terms of labour demand, and subsequently also in terms of regulation barriers’ (Brochmann and Kjeldstadli 2008: 193). In Norway, however, it was still possible to come to the country to find a job and only then get a residence permit. The Mo-roccans who came at that time managed to find a job, enjoyed Norway and the fact that it was a small society, and stayed. The large majority were men, which has been true throughout the decades but especially in the 1960s and early 1970s, when less than 20 percent were women.
After the end of guest worker migration in 1975, the immigration flow from Morocco con-tinued virtually unchanged in terms of size, but drastically changed composition (Carling 1999). While the labor migration route was closed, except for a few immigrants with high levels of education in certain fields, from then on there were largely two groups who came to Norway: those who came for family reunification with their spouses and fathers who had moved to Norway as labor migrants before 1975, and those who came to Norway through a Norwegian partner. According to our informants, this last group came from elsewhere in Mo-rocco, and in particular Casablanca, Marrakech, Rabat and Agadir. These are all bigger cities where there was a higher degree of education, young men were eager to explore the world and came in contact with tourists, such as those from Scandinavia. Our informants indicate that this generation of youth in Morocco, and especially those with some education, found it very
0
50
100
150
200
250
300
1980 1985 1990 1995 2000 2005 2010
Immigration Asylum applications
Emigration
0
100
200
300
400
500
600
700
800
900
Immigration Emigration Net migration
To/from Morocco Moroccan citizens

35
difficult to find an appropriate job in Morocco at the time and had better chances in Norway. While 80–90 percent of the Moroccan immigrants arriving in the early 1970s were men,
the proportion of women among arrivals grew rapidly to more than half towards the end of the decade (Figure 18). This was a logical consequence of the shift from labour migration to fam-ily reunification. The volume of family-related migration was such that total immigration from Morocco was much larger in the late 1970s than it had been during the guest worker period. The gender ratio of the immigrant population has gradually moved towards parity but women still constitute only 43 percent (Table 5).
Recent immigration of Moroccans is completely dominated by family-related migration. In most cases, the reference person is a Norwegian (or Nordic) citizen. However, there is reason to believe that many are originally Moroccan. Our informants indicate that the large majority of Moroccans coming to Norway marry Moroccans with a Norwegian passport. Some still marry Norwegian women, but the number is reducing. Slightly more than a third of children of Moroccans born in Norway have a Norwegian-born parent. Given the long history of Mo-roccan immigration in Norway many of these Norwegian-born parents could be of Moroccan origin. According to one informant, in the mid-1990s, family reunification became more re-stricted and reduced, and because of the coming of age of the second generation now the most common entrance into Norway is through family formation.
Our informants indicate that in recent years, since the latest financial crisis, there have also been Moroccans who have lived in France, Italy and Spain who moved to Norway. These are
Table 5. Overview of demographic indicators for Moroccans in Norway
Morocco
Average for the six groups (unweighted)1
Stock of immigrants (2010) 4861 3032 Change in stock of immigrants (2005-2010) 12% 63% Stock of foreign citizens (2010) 1061 1540 Change in stock of foreign citizens (2005-2010) –20% 59% Cumulated immigration by country of departure (1975-2009) 5992 5110 Cumulated naturalizations (1977-2009) 4910 2180 Immigration by country of departure (annual average 2005-2009) 157 298 Migration effectiveness (2005-2009) 0.58 0.56 Immigration by citizenship (annual average 2005-2009) 126 281 Emigration by citizenship (annual average 2005-2009) 31 88 Proportion of immigrants not arriving from country of citizenship (2009) 13% 9% Proportion of emigrants not departing to country of citizenship (2009) 81% 52% Cumulated asylum applications (1995-2009) 286 549 Asylum applications per 100 immigrants (2005-2009) 28 15 Family migration permits per 100 immigrants (2009) 106 69 Proportion female among stock of immigrants (2010) 43% 53% Descendants per 100 immigrants (2010)2 105 64 Proportion of descendants with one Norwegian-born parent (2010)2 37% 59% Proportion of family migration with a Norwegian or Nordic citizen (2009) 70% 50%
Notes: 1) Refers to the six groups covered in this scoping study report 2) Descendants in this context refer to people born in Norway with one or two foreign-born parents. Source: Compiled on the basis of data from Statistics Norway and the Directorate of Immigration

36
mainly people with a valid European residence permit or passport. Besides those moving to Norway from third countries, there are also those moving out of Norway. Emigration has played a role throughout the years (Figure 19), but only modestly. Statistics do not allow us to draw conclusions on whether emigration means return to Morocco or on-ward migration, as in the case of Morocco, naturalizations are high so figures on the proportion of emigrants not departing to country of citizenship, which are very high, do not reveal much (Table 5).
A small part of the Moroccan population in Norway consists of refugees. There has been a steady inflow of asylum seekers from Morocco, and marked increase over the past two years. This still has minimal impact on the Moroccan population in Norway, since 98 percent of the cases have either been rejected or not processed (Directorate of Immigration 2010).
A large proportion of Moroccans in Norway have become Norwegian citizens. Available statistics do not show how many, but it is striking that the stock of Moroccan immigrants is lower than the number of Moroccans who have naturalized since 1977. Another indication is the small number of Moroccan citizens in Norway: only about a fifth of the number of Mo-roccan immigrants (Table 5).
Changes explained
When explaining the shifts in the migration history from Morocco to Norway, conditions in Norway and the nature of the Moroccan migrant community play a central role. Difficult cir-cumstances in Morocco and in particular the difficulty of generating a livelihood has been a reason for people to move to Norway, alongside France, Spain, Italy, Belgium, the Nether-lands, Germany, Scandinavia, Canada, the US and the Middle East. Conditions in Morocco have of course changed over the last few decades and may be much closer to European ones than they were in the 1960s, but in general many prospective migrants see conditions in Europe to be better than in Morocco (Sandbæk 2007). As our informants recount, the first Moroccans who went to Europe, mainly to Italy, France and Spain, returned with resources to buy a house and a car, instigating others to move. More recently, there are also negative im-ages appearing in Morocco on life in Europe. After the financial crisis, for example, reports have appeared that indicated that conditions in Spain are worse than they are in Morocco. This may have an effect on migration patterns that will be interesting to explore further.
At the same time, however, Norwegian migration-related policies have a great impact on whether and how people gain entrance into Norway and are mentioned by our informants as turning points. Restrictions in regulations related to labour migration that were put in place in 1975 limited the ease with which Moroccans could enter, and shifted focus on family reunifi-cation. In fact, as Brochmann and Kjeldstadli (2008: 209) argue, these restrictions led people to focus more instead of less on a permanent stay in Norway, as return became increasingly risky. At the same time, we must remember that different migrants are differently positioned in relation to these entrance policies, for example in relation to their life phase – whether they are married, have children etc. For example, Moroccans who came between 1975 and 1995 largely were either families who had been left behind by the head of household in earlier years, or they were young unmarried men who found a Norwegian partner.
A third factor of impact is indeed the existence of a larger community of Moroccans in

37
Europe in general and in Norway in particular. This has an impact both in terms of stimulat-ing the will to move as well as in terms of creating opportunities to do so. Moroccan immi-grants to Norway, especially from the 1970s to 1990s, benefitted greatly from having relatives in Norway. They could provide information and resources, and where possible an entrance point into the country. When studying the migration corridor Morocco-Norway, it is further-more important to take into account that immigration and emigration to and from Norway does not only relate to Morocco. Recently, for reasons related to worsening economic condi-tions after the financial crisis, Moroccans have come to Norway from Italy and Spain. Simi-larly, when Moroccans move out of Norway this is not just to return to Morocco.
Institutions and community
In Norway, 75 percent of the Moroccan population lives in Oslo (Henriksen 2007: 191).20 There is no other non-western migrant group that has such a high concentration in the capital city. This makes Moroccans the 8th largest non-western migrant group in Oslo in 2010.21 Al-though statistics are incomplete, available data suggest that the level of education among Mo-roccans is very low, in particular among women (Henriksen 2007: 192). Furthermore, second generation Moroccans so far participate in very low rates in higher education, with in this case more women than men participating (Henriksen 2007: 193). Unemployment rates are high, in particular among the first generation. Common areas of employment include hotels and res-taurants; service sector; transport and communication; and the health sector.
There are two to three mosques for Moroccans in Oslo and a number of organizations that were founded on religious grounds, such as the Norsk Marokkansk Trossamfunn. In terms of organizational life not related to religion, Moroccans have only recently increased activity and there are two organizations we were able to trace: Moroccans in Norway (MIN) and the Mo-roccan Student Association (MSF).
MIN was established in 2008 but functioned since 2004 as the Norwegian Moroccan Asso-ciation of Friends (NMVF) with similar goals and a similar board. This organization was set up by a group of men who came to Norway in the 1980s and 1990s, mainly from urban areas. The main reason they set up the organization was that they found a need for a Moroccan or-ganization in Norway that was not just focused on religion, but on culture. They were inter-ested in creating a better understanding between the Norwegian society, including authorities, media and the public at large, and Moroccans in Norway. Furthermore, they express views on the situation in Morocco, and focus in particular on the conflict over Western Sahara. While the board and members meet socially frequently, they have recently also established a Face-book site (170 members) to reach second generation Moroccans. They indicate that it is par-ticularly difficult to motivate this group, as they do not have the same connections to Morocco and lead very Norwegian lives.
The MSF is a politically and religiously independent organization that was set up in 2007. This organization was established by second generation Moroccans and has the goal of being a meeting place for students and highschool pupils in Norway, contributing to increased inter-
20 There are 5 300 Moroccans in Oslo, 165 in Bergen, 121 in Stavanger, 100 in Bærum and 99 in Drammen. 21 www.ssb.no/emner/02/01/10/innvbef/tab-2010-04-29-10.html.

38
est in higher education, facilitating social and job-related networking and in general, fighting for the interests and needs students with a Moroccan background in Norway have. The MSF organizes motivational days, they operate a blog and have a Facebook group (129 members) and as such are clearly targeting younger generation Moroccans. Outside these organizations, many younger Moroccans can be found in a number of cafes, as well as in some clubs whereas those who arrived in the 1960s and 1970s mainly come together through religious channels.
Remittances and other transnational connections
Our informants indicated that the first generation has remained very connected to Morocco throughout the years, whereas the second generation is less engaged. The only available sta-tistics on remittance sending among Moroccans in Norway are from 200322, and are based on estimates comparing data from the Central Bank in Morocco with numbers of adult Moroc-cans in Norway and estimates of how many people might be sending remittances. Moroccans are mainly using banks to transfer money, and have been for long.23 At the same time, with people traveling back to Morocco quite frequently, money can also be carried personally or handed to close contacts when they travel. Whereas the use of data from the Central Bank in Morocco may allow for a reasonable estimation of total amounts, it is much more difficult to know how many people send money, and how frequently, as we do not have statistical infor-mation on this. Assuming 100, 60 or 25 percent of the adult population sending remittances, monthly sums sent in 2003 were 880 NOK, 1470 NOK and 3520 NOK, which at any rate is quite substantial.24
Moroccans in Norway travel to Morocco quite frequently and on average, most people visit Morocco one time per year, especially if they have family there. Nowadays ‘Norwegian’, a low-cost airline, flies directly to Marrakech, which makes travel much more affordable than when Moroccans needed to use Air France or KLM. Also, with a large portion of the Moroc-can population in Norway having obtained Norwegian citizenship, temporary travel back to Morocco for many has no implications for one’s legal status in Norway. In fact, as one of our informants pointed out, many of those who have been in Norway for decades own a flat or a house in Morocco.
Assessment
The case of Moroccan immigration to Norway can be characterized by a long migration history and gradual stagnation. Research on Moroccan migration to Norway suggests that, purely looking at the Norwegian situation, it would be an interesting country to add to our THEMIS study. It is an interesting community as there is some but not too much variation in terms of who moved and for what reasons – we can discern three main waves: labour migration before 1975, family reunification following labour migration, and family formation in more recent years. It is a good group to study historically, as the first people arrived in the late 1960s and early 1970s, and we do have statistics available on this group. Furthermore, quite a number of
22 www.ssb.no/samfunnsspeilet/utg/200406/08/tab-2004-12-09-01.html 23 Originally, in the 1960s and 1970s, also using post. 24 8 NOK is roughly 1 EUR, so this means sums of 110 EUR, 184 EUR and 440 EUR per month.

39
these pioneer migrants are still in the country and can be interviewed. At the same time, Moroc-cans in Norway have not been studied extensively in relation to the topic we are interested in.
The fieldwork we have done for the scoping study, though resulting in only one interview, has provided us with some good insights into where we could find the initial ‘seeds’ for our larger survey. We would include religious organizations and mosques, MIN, MSF, a number of cafes and clubs, as well as events organized by the Moroccan Embassy. Other events can be found through the two Facebook groups and electronic media may also be useful for the research – we could consider advertising THEMIS through these groups and possibly trying to locate potential interview candidates through them as well. Responses to the research have been mixed, with a few people very open to taking part but a number also being considerably more sceptical. The research would most likely be conducted in Oslo and Bergen, where the largest number of Moroccans can be found.
Ukraine
Migration history and demography
The Ukrainian community in Norway is a growing, largely recent, immigrant group. There are very few Ukrainian families who have lived here across generations. The Ukrainian popu-lation in Norway has grown rapidly to about 2500 people in 2010. Since 2003, the first year that we know the number of Ukrainian-born immigrants in Norway with certainty, the stock has grown at an average of 24 percent per year (Figure 21). This is a very high figure, al-though many other immigrant groups have grown even faster over the same period.25 The shortcomings of data on Ukrainians in Norway before 2003 are discussed in the section ‘Assessment’ on page 46.
The recent immigration wave is characterized by a gradually increasing inflow, to a record 350 people in 2009. Migration effectiveness for 2005–2009 is very high (0.79), indicating that this is largely a one-way flow. In other words, relatively few Ukrainians have formally immi-grated to Norway and then left the country again. The majority of Ukrainian citizens who do leave Norway, however, go to third countries rather than back to Ukraine (Table 6).
Most of the Ukrainians in Norway are females who have travelled to Norway alone, or who have come to Norway with Norwegian partners who they have met abroad or through the Internet (Figure 22). The average age among the female Ukrainian migrants is very low. In an interview, it was estimated that it might be as low as 25 years. This, combined with the rela-tively recent nature of this migration, may explain the fact that despite many Ukrainians mar-rying Norwegian men, there are still no more than 484 children born with one Ukrainian and one Norwegian parent (Statistics Norway 2010).
Historically, people from the Western parts of Ukraine have been more active in travelling and migrating to Western Europe than what has been the case for Eastern Ukrainians. In Norway today, however, the Ukrainian community is largely represented by different parts of Ukraine. The migration from Ukraine to Norway can be divided into three waves: 25 Including Poles, Lithuanians, Afghans, Eritreans, Latvians and Palestinians.

40
Figure 21. Stock of Ukrainian immigrants in Norway, 1980–2010
Source: Compiled on the basis of data from Statistics Norway. The period 1980–1986 is interpolated due to missing data.
Figure 22. Proportion of women in the stock of Ukrainian immigrants in Norway, 1980–2010
Source: Compiled on the basis of data from Statistics Norway. The period 1980–1986 is interpolated due to missing data.
Table 6. Overview of demographic indicators for Ukrainians in Norway
Ukraine
Average for the six groups (unweighted)1
Stock of immigrants (2010) 2440 3032 Change in stock of immigrants (2005-2010) 118% 63% Stock of foreign citizens (2010) 1756 1540 Change in stock of foreign citizens (2005-2010) 100% 59% Cumulated immigration by country of departure (1975-2009) 2677 5110 Cumulated naturalizations (1977-2009) 520 2180 Immigration by country of departure (annual average 2005-2009) 302 298 Migration effectiveness (2005-2009) 0.79 0.56 Immigration by citizenship (annual average 2005-2009) 314 281 Emigration by citizenship (annual average 2005-2009) 71 88 Proportion of immigrants not arriving from country of citizenship (2009) 7% 9% Proportion of emigrants not departing to country of citizenship (2009) 56% 52% Cumulated asylum applications (1995-2009) 2227 549 Asylum applications per 100 immigrants (2005-2009) 5 15 Family migration permits per 100 immigrants (2009) 68 69 Proportion female among stock of immigrants (2010) 77% 53% Descendants per 100 immigrants (2010)2 27 64 Proportion of descendants with one Norwegian-born parent (2010)2 75% 59% Proportion of family migration with a Norwegian or Nordic citizen (2009) 56% 50%
Notes: 1) Refers to the six groups covered in this scoping study report 2) Descendants in this context refer to people born in Norway with one or two foreign-born parents. Source: Compiled on the basis of data from Statistics Norway and the Directorate of Immigration
0
500
1000
1500
2000
2500
1980 1985 1990 1995 2000 2005 2010
First-generation immigrantsFirst-generation immigrants (uncertain)Descendants (two foreign-born parents)
0
25
50
75
100
1980 1985 1990 1995 2000 2005 2010
Proportion women (%)Uncertain data 1993-2002

41
Figure 23. Immigration and emigration to/from Ukraine and asylum applications by Ukrainians, Norway 1980–2010
Source: Compiled on the basis of data from Statistics Norway and the Norwegian Directorate of Immigration.
Figure 24. Migration to/from Ukraine and of Ukrainian citizens, Norway 2005–2009
Source: Compiled on the basis of data from Statistics Norway.
Ukrainian prisoners in Norway during World War II
The first Ukrainian settlers came to Norway during World War II. More than 16 000 Ukraini-ans were kept in prisons in Norway in the period 1941-1945. They were mostly soldiers of the Red Army, and came from all parts of Ukraine. After the war, they were to be sent back to Siberia in the Soviet Union. Most of them did not want this, but only a very small number managed to escape and stay in Norway. They dispersed to villages and small harbour towns in different parts of Norway. In order to stay, they kept their Ukrainian identities hidden. Marianne Neerland Soleim at Falstadsenteret, a foundation in memory of World War II and a centre for human rights, is currently working on a project identifying Ukrainian prisoners from World War II who were killed or have died in Norway.26 But for the time being, the number of Ukrainian prisoners in Norway from that period is unclear.
Political migrants after World War II27
The second small wave of Ukrainian migrants to Norway came after World War II. They came to Norway as the result of national struggles in the West of Ukraine, which had become a part of the Soviet Union right before World War II. They were among those who were fight-ing for an independent Ukraine after the war, and consequently, faced persecution in the pe-riod of 1947-1953. Quite a number of these were killed in the 1950s, but a small number 26 http://falstadsenteret.no/ 27 The term political migrants is used here rather than the term refugee, since although their experience qualified them to be called refugees, they were not in a legal sense as they chose to keep their identities hidden. It is also the term used by Ukrainian informants themselves.
0
100
200
300
400
1980 1985 1990 1995 2000 2005 2010
Immigration Asylum applications
Emigration
Asylum applications numbered 1027 in 2001
0
200
400
600
800
1000
1200
1400
1600
1800
Immigration Emigration Net migration
To/from Ukraine Ukrainian citizens

42
managed to escape to Europe and the US. Nobody knows for sure how many came to Nor-way, as they mostly kept their identities hidden, but according to speculations, it might have been about 15-20 individuals.
Mykola Radejko (1920-2005) was one of the leaders of this movement, and spent most of his life in Norway as a political migrant. According to the Ukrainian Embassy, he himself has expressed that he ended up in Norway more or less by accident. But once he was in Norway, he managed to bring and gather a few politically involved Ukrainians around him, although he did keep his presence in Norway hidden for as long as possible. Nonetheless, all along he claimed that the KGB was aware of his presence in Norway.
Current wave of Ukrainian migrants to Norway
It was not until the 1990s, after the fall of the Soviet Union, that Ukrainians were to a greater extent able to migrate abroad. People in the Western parts of Ukraine have traditionally been more focused on Western Europe and North America, whereas people in the East of Ukraine have tended to migrate to Russia and other Soviet countries. This trend has continued even after the fall of the Soviet Union. The labour migration from Ukraine fully started in 1994/95 as the result of the total collapse of the Ukrainian economy. At the time, most Ukrainians chose to go to Southern European countries such as Italy, Spain and Greece. Apart from a few Ukrainian children who were brought to Norway by Norwegian religious missions, there were not many Ukrainians migrating to Norway during the 1990s. Ukrainian migration to Norway started expanding in 1998/1999 and is still increasing (Figure 21).
In the period 2000-2002, there was a significant increase in the number of asylum-seekers from Ukraine to Norway (Figure 23). The year 2001 represented the peak of this wave, when 1030 Ukrainians applied for asylum in Norway, constituting seven percent of the total number of asylum seekers that year. One possible explanation of this sudden wave of Ukrainian asy-lum seekers to Norway is that in 1999 and 2000, four Ukrainian citizens had been granted the right to stay in Norway for technical reasons (Godzimirski 2004: 25). Hearing about these cases, other Ukrainians may have decided to apply for asylum. As only one person was al-lowed to stay in Norway for humanitarian reasons in 2003, the number of Ukrainian asylum seekers quickly decreased again.
The current wave can roughly be divided in three groups:
AU PAIRS AND/OR STUDENTS
There are quite a few Ukrainians who come to Norway either as students or au pairs. A very common route among Ukrainian females is to come as an au pair, and then stay as a student at a Norwegian educational institution. As working as an au pair or studying at a Norwegian institution requires quite a good level of English skills, these are usually persons who already have completed higher education back in Ukraine, which also means that they are among the better off. Working as an au pair for a couple of years provides an excellent opportunity to practice English, as well as learning the Norwegian language and adjusting to the Norwegian society. In fact, a Ukrainian website recommends professionals to stay with a Norwegian fam-ily as au pair for at least two years in order to improve language skills and get acquainted with the Norwegian system before applying for other jobs (Godzimirski 2004: 25-26).

43
WOMEN WITH NORWEGIAN PARTNERS
In 2001, there were 46 women with Ukrainian background who married someone in Norway, and 78 % of these married an ethnic Norwegian (Godzimirski 2004: 25). According to an in-formant, within this group there is great variation in the reasons to come to Norway; it can be anything from finding true love to finding a partner who can provide the socio-economic sta-bility that the person has been looking for. As Ukrainians in general travel more than what they used to previously, many meet their partners while on holiday abroad (either in Norway or in other countries), while others meet through the Internet.
PROFESSIONAL EXPERTS
This group is mainly centred in the Oslo area, where there are greater job opportunities. To come to Norway as a professional expert, a minimum of a Bachelor’s degree is required. As obtaining higher education requires access to resources in Ukraine, these are mainly persons of higher-class background, They are scientists who work in research institutes, and medical service employees such as nurses and doctors. Many of them worked in the public sector in Ukraine, which does not pay well and felt working conditions in Ukraine were insufficient. Our informants indicate that quite a few people working in the IT sector have also moved to Norway, preferring to go abroad despite good salaries in Ukraine.
Changes explained
According to informants, during the inflation period of 1994/1995, many Ukrainians took the fastest and easiest way possible to Europe. Up until the mid 2000s, there were no direct travel links from Ukraine to Norway, and the route to South European countries was a lot easier. Furthermore, at that time most Ukrainians did not know much about Scandinavia. However, as the number of Ukrainian labour migrants to Southern Europe kept increasing, the competi-tion over jobs became tight and people started looking for other options. It was also around this time that Norwegian companies, the most important one being the telephone company Telenor, started establishing themselves in Ukraine. Today, there are many bilateral agree-ments and terms of trade in for example the fishing industry between Norway and Ukraine. In addition, an increasing number of students from Norway have started to go to Ukraine for studies. At the same time, people who have some resources in Ukraine have been able to travel more, and an increasing number have discovered Norway. All of these factors com-bined have resulted in the fact that people in Ukraine have learned more about Norway and the opportunities that they can be provided with there.
According to an informant, unskilled Ukrainians have preferred to go to Southern Europe, where they knew that it was easy to get a job. Norway, on the other hand, has been more at-tractive to people who have/wish to have higher education and a high quality job. This be-came even more evident after the expansion of the Regime for Migration of Skilled Labour to Norway (Spesialistordningen)28.
After the Orange Revolution in Ukraine in 2004, there was an optimistic atmosphere among Ukrainians and many chose to stay in Ukraine while Ukrainian migrants returned and 28 The so-called Spesialistordningen facilitates for people who are skilled or have particular qualifications needed, to come to work in Norway.

44
bought real estate in Ukraine. People developed trust in the Ukrainian systems, and for the first time, Ukrainians started using bank accounts for their savings. The Ukrainian economy was experiencing a substantial growth and people increasingly bought on credit. With the international financial crisis that struck Ukraine very severely, the exchange rate for the dollar rocketed and it became difficult to pay back these debts. Consequently, many people travelled abroad to earn money for this purpose.
Visas and permits
Obtaining a visa to come to Norway is often difficult. Ukraine has agreements with other Schengen countries through the EU that enables certain groups, such as business men, family members and professional experts and scientists, to migrate to those countries relatively eas-ily. Norway, however, only has an agreement regarding Ukrainian scientists. In addition, the criterion of having large amounts of money in a bank account in order to apply for the visa complicates the visa obtainment.
Furthermore, there are many companies in Norway that hire Ukrainian seasonal workers. As the Ukrainians are rather close to the Polish community (which is currently the largest non-Western community in Norway), quite a few Polish companies and construction workers hire Ukrainians. In the period 1991-2003 there were 630 Ukrainian applicants for seasonal work in Norway, with a peak in 2000 (Godzimirski 2004: 26). Yet in practice, it is very diffi-cult to obtain the necessary permits. One of the requirements, for example, is a note from the office of the Norwegian Labour and Welfare Administration (NAV) explaining that the fac-tory or company needs this exact expertise because they cannot find it in Norway. Even though many factories would like to employ seasonal workers, this requirement often pre-vents them from doing so. All things taken into consideration, however, obtaining visas and certain kinds of permits has become easier for Ukrainians over the years.
Institutions and community
The fact that a Ukrainian Embassy was established in Norway in 2004 only, illustrates that the activities between Norway and Ukraine have increased in the past few years. Ukrainian mi-grants have mainly settled down in the most urban areas of Norway, in the counties of Oslo, Akershus (in Eastern Norway) and Rogaland (in Western Norway) (Godzimirski 2004: 23). As a whole, however, informants suggested that one characteristic of Ukrainians is that they do not tend to stick together in large communities once they are abroad.
Today, there are two main Ukrainian associations in Norway. There is one situated in the city of Bergen (in Rogaland county), which has about 15 members, and can among other things offer the services of a Ukrainian priest. The members of this association are mostly women who have married Norwegian men, and who would like to stay together and teach their children the Ukrainian language and values.
The other Ukrainian association is situated in Oslo, and was established in 2004. Today, it has about 60 members who pay a membership fee, but at events organized by the Association, there are usually about 100 people present. In total, messages sent by e-mail or SMS regard-ing forthcoming events are sent out to a database of about 350-400 people. The largest events

45
organized are linked to the yearly happenings such as the celebrations of Ukrainian Christmas and Easter, the Ukrainian National Day and Constitution Day, etc. There is also a Ukrainian church that is a part of this association.
In addition, there are large communities of Ukrainian students in both Bergen and Oslo, who keep in touch in more or less formal settings. Many of the Ukrainian students in Oslo are here through an agreement between the Norwegian School of Management (BI), which is a private institution, and the University of Kiev.
There is also a website in Russian for Eastern Europeans in Norway29 which is widely used, especially among the younger people within the Eastern European population in Nor-way. Here, information about different events and happenings are given, in addition to discus-sion forums where one can meet other Eastern Europeans with similar interests.
Remittances and other transnational connections
Remittances are a high percentage of the Ukrainian GDP, although exact numbers are difficult to obtain. Many of the migrants abroad go back to Ukraine and buy apartments, cars and other “luxury” items, which is also important for the sustainability of the economy.
According to our sources, those who do remit money to friends and relatives in Ukraine, do so in three ways: 1) wire through mechanisms such as Forex and Western Union, 2) trans-fer from one bank account to another, and 3) bring cash personally when they go to visit fam-ily and friends in Ukraine. Due to the history of instability in the Ukrainian banking system on the one hand, and the high fees for using formal transferral mechanisms, bringing the money cash when travelling to Ukraine is the most common option. This is further eased by the fact that the vast majority of Ukrainians abroad can travel back and forth more or less freely. One informant told us that she and two of her trusted Ukrainian friends in Norway take turns in bringing money and other goods for each other’s families in Ukraine. As each of them travels to Ukraine approximately once a year, their respective families receive remit-tances three times a year.
There are many travel agents and communications providers that operate between Ukraine and Norway, among these two au pair agencies run by Ukrainians. Another example is a web-site that provides information on travels to East and Central Europe30. Furthermore, the Inter-net is widely used to find information on how to reach Norway, in addition to consulting any migrants that one might know of. Both the Ukrainian Embassy in Norway and the Norwegian Embassy in Ukraine post information on Norway, Ukrainians in Norway, legislations etc. on their websites, and are visited by Ukrainians who have or would like to have a link to Norway.
Overall, there seems to be a rather strong bond between Ukrainians and relatives and friends in Ukraine and elsewhere. It is very common to spend holidays in Ukraine, or travelling to visit friends and relatives elsewhere, as well as having them come to visit in Norway. On a more everyday basis, it is very common to stay in touch by phone, through Skype or e-mail.
To our knowledge, most Ukrainians do plan their journey themselves, although some might come through the services of for example an au pair agency. There probably is a small
29 www.dom.no 30 www.kalinkatours.no/?gclid=CNaKgbL7hqMCFQI9ZgodZmWTbw

46
number of irregular Ukrainian migrants in Norway, as there is elsewhere. But the Ukrainian Embassy informed us that since these irregular migrants usually enter the country legally and then become over-stayers at a later point, they are relatively easy to trace. There have also been a few cases of people who were falsely being promised a job while still in Ukraine, which has its similarities to human trafficking. A few years ago, Eastern European prostitu-tion was on the increase in Norway, but has largely been replaced by African prostitution.
Assessment
The case of Ukrainians in Norway is characterized by an ongoing migration take-off. As such, it is an interesting case of study within the context of THEMIS. However, there are major issues related to uncertainties in the migration history of this goup. Ukraine has only existed as an independent country since the break-up of the Soviet Union in 1991. Statistics Norway has made attempts at reclassifying immigrants who came to Norway as citizens of the Soviet Union. However, it was not until 2003 that all these immigrants had been allocated a national origin, and that the number of Ukrainians in Norway could be verified. Stock figures from before 1991 have also been amended to include national origin. The number of registered Ukrainians in Norway before 1991 is consequently not zero, although it is very low.
Figure 25 illustrates the scope of uncertainty. Before 2003, we know that the true number of Ukrainians in Norway lies somewhere between two extremes: the minimum number is those who are registered as Ukrainians; the maximum number also includes all the people with undefined Soviet origins. We know that the majority of the latter are Russians, and that the true number of Ukrainians therefore lies in the lower bounds of the interval. Still, the un-certainty is considerable. As such, although the group is interesting, we feel that a reliable long-term historical assessment will be impossible to do in the case of the Ukraine.
Figure 25. Stock of Ukrainian-born persons in Norway 1980–2006
Source: Calculated on the basis of data from Statistics Norway (Statistikkbanken).
0
200
400
600
800
1000
1200
1400
1600
1980
1982
1984
1986
1988
1990
1992
1994
1996
1998
2000
2002
2004
2006
Certain Ukrainians only
Ukrainians plus undefind Soviet Union
Verified Ukrainian total
?

47
When it comes to the accessibility of Ukrainians, the persons we have contacted have been very quick to respond, and very helpful and interested in contributing to our project. We have found a general curiosity on learning more about other Ukrainians in Norway, among other things in that all three informants have requested to read our finalized report. In addition, they all have already provided us with the contact information of a number of persons that we could interview in the future.
Despite interesting characteristics of the Ukrainian migration to Norway, however, we have observed that there are several similarities in the Ukrainian and Brazilian migration pat-terns in the Norwegian context. Consequently, it would be adequate to only study one of these groups. As such, due to the uncertainties of the Ukrainian case as explained above, we believe that Brazil would make a significantly better case.
Concluding Assessment
After presenting the six scoping studies with their individual assessments, we now compare the groups in terms of their migration histories, current composition and ease with which we expect to be able to do research on them in a second phase.
Comparison of immigration histories
Figure 26 illustrates the growth of the six immigrant populations 1970–2010 from three dif-ferent perspectives. The differences help bring out the characteristics of each group. Panel A shows how the absolute numbers have grown, inspiring a threefold classification:
1. India and Morocco — Groups that have grown steadily and become big 2. Brazil and Ukraine — Groups that are currently taking off 3. Bangladesh and Egypt — Groups that have remained small
Panel B ignores the differences in absolute numbers, sets the current size to 100 and shows how the groups have reached their current number over time. This inspires another categorization:
4. Brazil and Ukraine — Groups that are currently taking off 5. Morocco — A group that has grown very steadily over time 6. Bangladesh — A group with a peculiar pattern of take-off, decline and new growth 7. Egypt and India — Intermediate groups without a distinct pattern
Panel C illustrates the same type of index, but with 1980 instead of 2010 as the reference year. In other words, the curves show the size of each migrant group relative to its size in 1980. The short history of Ukrainian migration statistics makes it impossible to include Ukraine in this panel. The remaining five groups fall into three categories:
8. Brazil — A group that displays a remarkable migration take-off 9. Bangladesh — A group with a peculiar pattern of take-off, decline and new growth 10. Egypt, India and Morocco — Groups that have grown very modestly

48
Figure 26. Comparison of stock of immigrants, 1970–2010.
Source: Compiled on the basis of data from Statistics Norway. The periods 1970–1980 and 1980–1986 is interpolated due to missing data.
0
1000
2000
3000
4000
5000
6000
7000
1970 1975 1980 1985 1990 1995 2000 2005 2010
Bangladesh
Brazil
Egypt
India
Morocco
Ukraine
Ukraine (uncertain)
Panel A
0
10
20
30
40
50
60
70
80
90
100
1970 1975 1980 1985 1990 1995 2000 2005 2010
Bangladesh
Brazil
Egypt
India
Morocco
Ukraine
Ukraine (uncertain)
Index. 2010=100
Panel B
0
200
400
600
800
1000
1200
1400
1600
1800
2000
1970 1975 1980 1985 1990 1995 2000 2005 2010
Bangladesh
Brazil
Egypt
India
Morocco
Index. 1980=100
Panel C

49
This last panel illustrates how it is possible to describe Moroccans and Indians as groups that have stagnated, despite their relatively large numbers.
A possible operationalization of migration take-off would be ‘five-year periods during which the migrant stock at least doubled in size’, based on year-by-year comparison of the migrant stock with its size five years earlier.31 In conclusion, regarding the demographic as-pects of migration histories, we can say that Brazil and Ukraine are similar, but that Brazil has the great advantage (for researchers) of a long migration history before take-off occurred. Moroccans are the most consistent contrasting case: a long history of gradually slower growth, never experiencing take-off. Figure 27 illustrates the contrast between the two cases. Egyptians are an intermediate case of slow, but accelerating growth, while Bangladeshis and Indians show more irregular growth patterns.
Beyond the purely demographic, there are differences in the dominant grounds for migra-tion settlement. Published statistics do not give us details for all groups. However, summary conclusions can be made: Asylum seeking has been an element in the migration histories for all six groups except Brazilians. The proportion of the current immigrant population who ar-rived as asylum seekers is low, however. In the case of the Ukraine, informants do not refer to refugees but to political migrants after World War II, as those who fled persecution largely kept their identities hidden and thus in a legal sense are not refugees. It may be difficult to trace any of these people. Most asylum-seekers from a second wave after 2000 are no longer in Norway, as their cases were rejected. Egypt, India and Morocco are countries from where
Table 7 displays the experience of the six groups with reference to this definition. Neither Egyptians nor Moroccans in Norway have ever experienced a migration take-off; Brazilians and Ukrainians are undergoing take off; Bangladeshis and Indians have experience take-off in the past. The take-off episodes among Bangladeshis, Ukrainians and (possibly) Indians appar-ently began as soon as those groups started arriving in Norway, but the beginning of each take-off is uncertain because of missing data. The Brazilian case is different because take-off occurred after a long, well-documented period of slower growth.
In conclusion, regarding the demographic aspects of migration histories, we can say that Brazil and Ukraine are similar, but that Brazil has the great advantage (for researchers) of a long migration history before take-off occurred. Moroccans are the most consistent contrast-ing case: a long history of gradually slower growth, never experiencing take-off. Figure 27 illustrates the contrast between the two cases. Egyptians are an intermediate case of slow, but accelerating growth, while Bangladeshis and Indians show more irregular growth patterns.
Beyond the purely demographic, there are differences in the dominant grounds for migra-tion settlement. Published statistics do not give us details for all groups. However, summary conclusions can be made: Asylum seeking has been an element in the migration histories for all six groups except Brazilians. The proportion of the current immigrant population who ar-rived as asylum seekers is low, however. In the case of the Ukraine, informants do not refer to refugees but to political migrants after World War II, as those who fled persecution largely kept their identities hidden and thus in a legal sense are not refugees. It may be difficult to
31 This implies maintaining an average annual growth rate of 15 percent or more over five years.

50
trace any of these people. Most asylum-seekers from a second wave after 2000 are no longer in Norway, as their cases were rejected. Egypt, India and Morocco are countries from where
Table 7. Periods of migration take-off.
Country of origin Period of migration take-off1 Fastest recorded five-year growth2
Bangladesh 1985 to 1992 313 % (1985–1990)
Brazil Ongoing since 2002 114 % (2005–2010)
Egypt None
India 1970 (or before3) to 1978 (uncertain) 277% (1970–1975, estimate4)
Morocco None
Ukraine Ongoing (uncertain beginning) 293% (1998–2003, uncertain5) 148% (2003–2008, certain)
Source: Compiled on the basis of data from Statistics Norway. Notes: 1) Defined as five-year periods during which the migrant stock at least doubled in size, from a starting point of at least 100 people. The take-off period begins with the first year of the first five-year period and the last year of the last five-year period. 2) Excluding five-year periods starting with a stock of less than 100 individuals. 3) Earliest five-year period on record. 4) End of period based on interpolation of migrant stock 1970–1980. 5) Until 2003 the stock of Ukrainian immigrants was uncertain because not all people who immigrated from the Soviet Union had been assigned a post-Soviet country of origin.
Figure 27. The contrasting cases of Brazil (speeding up) and Morocco (slowing down)
Source: Compiled on the basis of data from Statistics Norway. Note: Change in stock ‘1984 and earlier’ displays the migrant stock at the beginning of 1985.
the large majority came as labour migrants or, subsequently, for family-related reasons. Asy-lum plays a minor role here, and it is likely that only in the case of Morocco we may be able to trace some of the people involved. In the case of Bangladesh, a considerable proportion of the population was granted permission to stay in Norway based on asylum applications.
0
500
1000
1500
2000
2500
2005-2009
2000-2004
1995-1999
1990-1994
1985-1989
1984 and
earlier
Population 2010 by period of arrival
Change in stock during period
Immigration during period
Brazil
0
200
400
600
800
1000
1200
1400
1600
2005-2009
2000-2004
1995-1999
1990-1994
1985-1989
1984 and
earlier
Morocco

51
Family reunification with Norwegians has been important for the migration of Brazilians, Egyptians, and Ukrainians, less so for the other three groups. Labor migration of mainly low-skilled laborers has been important for the migration of Moroccans, Indians and to some ex-tent Egyptians. High-skilled laborers have come to Norway from India, Brazil, and Ukraine. Migration of students has taken place from all countries – it will be interesting at a later stage to study to what extent this type of migration has led to a permanent stay in Norway, as well as to what extent this was a deliberate strategy.
Comparison of current composition
The current composition of the six groups reflects their disparate migration histories. Statis-tics on age and length of stay are unfortunately not published for all six groups, but other fig-ures provide bases for comparison.
First, some are more mature and established than others. The relative number of descen-dants gives an indication of this (Figure 28). Moroccan and Egyptian immigrants stand out as having many descendants in Norway (the combined height of the light grey and dark grey bars), while Ukrainians have relatively few. This reflects differences in average length of stay as well as differences in fertility levels.
Figure 28. Number of descendants relative to migrants, 2009
Source: Compiled on the basis of data from Statistics Norway.
Figure 29. Gender balance of stock of immigrants, 2010
Source: Compiled on the basis of data from Statistics Norway.
Second, the gender-balanced groups have not formed families with Norwegians to the same extent as the groups with a skewed gender balance. This is largely because in the latter groups, migration is often linked to family formation with Norwegians. Figure 29 shows that
0
50
100
150
200
250
Bang
lade
sh
Braz
il
Egyp
t
Indi
a
Mor
occo
Ukr
aine
Descendants (one Norwegian-born parent)Descendants (two foreign-born parents)Immigrants
Index. Stock of immigrants=100
0
25
50
75
100
Bang
lade
sh
Braz
il
Egyp
t
Indi
a
Mor
occo
Ukr
aine
Female
Male

52
Brazilians and Ukrainians are overwhelmingly female groups, Egyptians are predominately male, and the remaining three groups are closer to being balanced. These differences are re-flected in the proportion of descendants who are half Norwegian (the light grey bars in Figure 28). Brazilians, Egyptians and Ukrainians have most of their children with a Norwegian part-ner, while the other three groups tend to have children with other foreigners. Presumably, this is in most cases with another person from the same country of origin.
Comparison of the research process
Research in phase 2 on most of the six short-listed groups is going to be a challenge in Nor-way in terms of their relatively small size. Two of the six short-listed groups, Bangladesh and Egypt, are small groups with currently less than 1000 immigrants in Norway. Two, Brazil and Ukraine, are middle-size groups of about 2500 immigrants in Norway, whereas the remaining two, Morocco and India, are reasonably large groups of beyond 5000. Studying the small groups is going to be resource-demanding, and as such we would prefer to include only one such group.
Besides the size of the group, the level of contact between community members as well as the perceived openness towards the research is of importance. Most of the groups selected, with the exception of Egypt and to some extent Ukraine, seem to have relatively strong social networks within their own community. In some instances, such as in the case of India, there seems to be a split between those who came during different waves. Our experiences during the first phase of the research suggest that the Brazilian, Ukrainian and Bangladeshi commu-nities are very open to the research, being willing to participate and interested in the results. Experiences from the scoping studies on Egypt and Morocco are a bit more mixed – for Mo-rocco we have found a number of possible entry points but also perceived a certain degree of skepticism towards the research. The research on Indians in Norway has been particularly difficult to conduct, due to a great degree of skepticism.
Conclusion
From the above, we wish to suggest a short-list that would be most relevant, interesting and do-able in Norway. Firstly, we feel that Ukraine is very problematic to include as we do not have reliable statistics before 2003. Secondly, we are of the impression that in that case, Bra-zil should definitely be selected: there are many similarities in migration histories and compo-sition, whereas in the Brazilian case longer time series of statistics are available. In order to have sufficient variation in terms of migration patterns, current composition, geographical location, size, and ability to do the research, we suggest selecting India or Bangladesh and Egypt or Morocco. In order to guarantee inclusion of asylum migration, and because of our
Table 8. Summary assessments
Pros Cons
Bangladesh Interesting pattern of ‘aborted take-off’, stagnation and renewed growth; Most relevant group in terms of asylum migration; Easily
Small numbers, in particular outside Oslo;

53
accessible community; High degree of out-migration and small numbers in Norway compared to Sweden;
Brazil Exemplary case of migration take-off; Possibility of tracing migration history before and during take-off; Under-researched in relation to numerical importance; Easily accessible community; Interesting female-dominated aspect;
No clear research location outside Oslo;
Egypt Long, but slowly growing history; Interesting male-dominated flow (complementary to Brazilians of Ukrainians);
Difficult to find outside Oslo; Half-way pattern between stagnation and take-off; The forced migration aspect not as strong as originally anticipated;
India Interesting aspect of high-skilled labour migration; Relatively large numbers in Drammen, making data collection in two cities feasible;
Highly heterogeneous group; Complex migration patterns involving third countries; Relatively difficult research process in the first phase;
Morocco Exemplary case of maturity and stagnation; Under-researched in relation to numerical importance;
Mixed responses to the research in the first phase;
Ukraine Exemplary case of migration take-off; Interesting female-dominated aspect; Easily accessible community;
Difficult to examine beginning of migration take-off due to data limitations; No clear research location outside of Oslo;
concerns with the difficulty to do research on Indians in Norway, our preference goes to the Bangladesh community. In order to avoid having to study two small groups, our third choice then is Morocco. As such, PRIO suggests the final three groups of study to be Brazil, Bangla-desh and Morocco.

54
Annex 1: Demographic indicators
Stock of immigrants is the number of legal residents who are born abroad and do not have Norwegian parents. This figure differs slightly from the foreign-born, which would also in-clude adopted infants and children born abroad by Norwegian parents. When ‘population’ as in ‘the Bangladeshi population in Norway’ is used in the text, it refers to this figure.
Change in the stock of immigrants (2005-2010) is a simple comparison of how the stock has changed over the past five years, expressed in percentage terms. This is a good indica-tor of whether there is a ‘take-off’ of migration, or a tendency of stagnation.
Stock of foreign citizens largely reflects recent immigration. The general rule is that im-migrants can naturalize after living in Norway for seven years. However, there are excep-tions that can allow for earlier naturalization, and circumstances that may delay or prevent naturalization. Some migrants also prefer to retain their original citizenship. The stock of foreign citizens is not a good indicator of demographic processes.
Change in stock of foreign citizens (2005-2010) reflects the balance of net migration, natural increase and naturalizations over the past five years. In mature migrant populations, the number of foreign citizens is typically declining, since immigration is often outnum-bered by naturalization.
Cumulated immigration by country of departure (1975-2009) gives the total number of people who have immigrated to Norway from the country in question since 1975. This includes people who have later emigrated or died, and is therefore larger than the current stock of immigrants. Since the data is collected on the basis of country of departure, it in-cludes Norwegians who return to Norway after living abroad, as well as citizens of other countries who have come to Norway after living in the country in question.
Cumulated naturalizations (1977-2009) is the total number of people with a specific for-mer citizenship who have acquired Norwegian citizenship since 1977. It is likely that many of them remain in Norway, but some may have returned, migrated elsewhere, or died. We do not have statistics on current residents by former citizenship.
Immigration by country of departure is the number of people immigrating to Norway from the country in question, regardless of their citizenship or country of birth. Country of departure refers to their country of residence before settling in Norway.
Migration effectiveness is a measure of how much of the total cross-border movement leads to growth in the migrant population.32 If there are large flows in both directions that almost cancel each other out, migration effectiveness is close to zero. If there was only immigration and no emigration, migration effectiveness would be 1.00. Negative migration effectiveness indicates that emigration is higher than immigration. Here, migration effec-tiveness is calculated in the basis of immigration and emigration by country of depar-ture/destination, not citizenship.
32 Migration effectiveness is calculated as net migration divided by gross migration. (Net migration is the differ-ence between immigration and emigration; gross migration is the sum of immigration and emigration).

55
Immigration by citizenship is the number of citizens of a given country immigrating to Norway, regardless of their country of birth or country of departure.
Emigration by citizenship is the number of citizens of a given country emigrating from Norway, regardless of their country of birth or country of destination. Immigrants who leave Norway after acquiring Norwegian citizenship are not covered.
Proportion of immigrants not arriving from country of citizenship indicates the importance of indirect migration to Norway. In most cases, the majority of foreign citizens immigrating to Norway come directly from their country of citizenship.
Proportion of emigrants not departing to country of citizenship indicate the impor-tance of onward migration, or the use of Norway as a stepping-stone to other destinations. In many cases immigrants leaving Norway do not return to their country of origin.
Cumulated asylum applications (1995-2009) gives the volume of asylum applications over the period in question, regardless of the outcome. Consequently, this is not an indica-tion of the importance of forced migration in the growth of the migrant population.
Asylum applications per 100 immigrants provides a cross-nationally comparable figure by relating asylum claims to the number of immigrants. This is not a proportion, but sim-ply a reflection of how important attempts at asylum are in relation to the actual migration flow from the country.
Family reunification33 permits per 100 immigrants is an indication of the importance of family-based migration. The number can exceed 100 since permits given do not neces-sarily result in immigration in the same year. Some permits may also not be used at all.
Descendants per 100 immigrants is an indication of the maturity of the immigrant popu-lation. While Statistics Norway generally defines descendants as children of two foreign-born parents, this indicator refers to children with one or two foreign-born parents. As a migrant population matures, the number of descendants in relation to immigrants typically rises (Carling 2008). Although descendants of immigrants are not a target group of the THEMIS project, their numbers thus illustrate the group’s demographic development.
Proportion of descendants with one Norwegian-born parent indicates the degree to which immigrants are having children with Norwegian-born partners, or with other immi-grants. In the absence of information about cohabitation, and limited publically available information about marriages, this indicator can give important information about family formation patterns. (Note that the statistics can only identify children who are half Norwe-gian, not those who have foreign-born parents from different countries. Thus, descendants of Egyptians, for instance, with two foreign-born parents could either have two Egyptian-born parents or an Egyptian-born mother and a father from another country.)
Proportion of family migration with a Norwegian or Nordic citizen is another indi-cation of how family formation takes place. The data refer to the citizenship of the refer-ence person in Norway—usually the spouse or parent of the immigrant. If the reference person is a Norwegian citizen, it is not necessarily a Norwegian-born person, but could also be a naturalized immigrant.
33 Including family formation. Published statistics do not distinguish between family reunification and family formation.

56
Annex 2: THEMIS Information Letter
Dear Sir/ Madam I am writing from the Peace Research Institute Oslo (PRIO). We are at the early stages of a new international research project on the changing patterns of migration and I am writing to ask for your help in this. This project ‘Theorizing the Evolution of Migration Systems’ (THEMIS) is a joint initiative between researchers in the UK, the Netherlands, Portugal and Norway. Our aim is to compare historical developments of migration movements to the above four European countries from Ukraine, Bangladesh, India, Morocco, Egypt, Brazil -- and see what are the various factors that both facilitated and hindered the human mobility. For more information please visit our website: www.imi.ox.ac.uk/research/themis We believe that your experience will be an important contribution to help us cast some more light on the history, patterns, trends and changes of migration movements between X and Norway. We would greatly appreciate it if you would be willing to share some of your in-sights and thoughts in an interview with me. The proposed interview would be based on open questions focused around the following issues:
‐ When did migration from X to Norway start? ‐ Who were the first people to migrate? ‐ What were the causes for this migration? ‐ Where did the migrants come from within X? ‐ Where did people settle on arrival in Norway? ‐ What were the significant events or time periods in the migration history? ‐ What factors made migration possible and what made it more difficult?
Your responses in the interview of the interviews will be kept private and anonymous for the purpose of the analysis. We would not anticipate that the interview will take longer than one hour. Ideally we would like to visit you to conduct the interview at your convenience. If you prefer, we can conduct the interview over the telephone. If you are not able to assist in this way, we would be very grateful if you point us in the direc-tion of others who might be willing and able to spare some time and talk with us. Thanks you for your help in this matter. We look forward to hearing from you. Yours sincerely, Cindy Horst - Senior Researcher/Rojan Ezzati - Research Coordinator, PRIO
Oslo, 06.07.2010
Subject: Research on Migration from X to Norway

57
Annex 3: Interview Topics
For interviews with key informants in the scoping-study phase.
Personal Information
‐ Age, Gender ‐ First entry to Norway (subsequent entries- if relevant)
Migration patterns from X to Norway34
‐ Who were the first people from x to migrate to Norway? o When did they come? o Why did they come? o From where in X did they come? o How many of them came? o How did they travel? o Where did people from x settle on arrival in Norway? o Where did people from X go, beside Norway?
‐ How has the migration to Norway changed over the years? o The numbers of people migrating to Norway o The regions they come from in X o The socio-economic class – wealth, education, skills o The reasons for their migration o The routes used
‐ What – in your opinion - caused these changes? o When did the major changes take place? o What were the significant events or time periods in the migration history? o What factors facilitated or hindered the migration? o What was the state of the economy in X when you left? Declining, improving, unchanging? o What migration policies of the government of X were you aware of before you left?
Type of migration
‐ What were the causes for the initial migration? ‐ What were the causes of your migration? ‐ What was the main reason for someone from X to move to Norway in 1970, 1980, 1990,
2000, 2010? ‐ What sort of visas do people use on first arrival? ‐ How easy is it obtain visas? ‐ Has this changed over the years? How? Why? ‐ What has been the role of immigration regulation in shaping migration to Norway? ‐ What other factors have been important? ‐ What about your family decisions? ‐ Why did you move?
34 Legend : X denotes Ukraine, Bangladesh, India, Morocco, Egypt, Brazil

58
Transnational Links
Associations
‐ What do you think are the main associations involving people from X? ‐ Of which of these are you a member? ‐ Which other ways of organizing/coming together in Norway are there among people from X? Networks
‐ How strong are the contacts between people from X in Norway? How do they stay in touch? ‐ How strong are the contacts between people from X and those still in X? How do they
stay in touch? ‐ What do you think are the main websites concerning people from X? ‐ What other ways of getting information / networking / staying in touch with people from
and in X are there? Remittances
‐ Do people ever transfer money to family or friends in your homeland? If so: how common is this, how frequent, to whom?
‐ What mechanisms do they use for sending? ‐ Do you send money or other forms of support (incl goods) to X or relatives elsewhere? ‐ Who do you sent it to? ‐ How often do you send it? How? Migration Industry
‐ Can you list the travel agents and communications providers that operate between X and Norway?
‐ How do people generally find out about how to reach Norway? ‐ Is it common people plan their own journey, or are there commonly others helping them?
If so, who? ‐ Do you know whether there are people using informal travel agencies (smugglers)?
Own Migration (if not covered already)
‐ Can you briefly tell me your own migration history (find out what they were doing in X, their reasons and ways of moving – and what they are doing currently)
‐ Are there people in your circle of friends and family who have migrated to Norway / Europe before you?
‐ Do you know people from X in Norway? ‐ Did you have contact with anyone in Norway / Europe while still in X? ‐ Have these friends or relatives played a role in your decision to migrate? ‐ What support did you receive for your journey to/ and residence in Norway and from whom? ‐ Why did you move to this locality in Norway? ‐ Do you keep in touch with people back in X? How? ‐ With whom do you mostly keep in touch (family, friends, business partners, others)? ‐ Are there other ways in which you keep informed about you homeland?

59
References
Al-Sharmani, M. (2004) Refugees and Citizens: The Somali Diaspora in Cairo. Dissertation, John Hopkins University.
Al-Sharmani, M. (2006) 'Living Transnationally: Somali Diasporic Women in Cairo.' International Migration, 44(1):55-77.
Bø, B.P. (1984) Arbeidsvandringen til Norge Del I. Fremmedarbeidere og det nroske arbeidsmarked. Forskningsrapport, 6. Oslo: Diakonhjemmets Sosialhøgskole.
Brochmann, G. and Kjeldstadli, K. (2008) A history of immigration: The case of Norway 900-2000. Oslo: Universitetsforlag.
Carling, J. (1999) Arbeidsinnvandring og familiegjenforening 1967-1980. En oversikt med hovedvekt på statistikk. Bergen: Norges forskningsråd and Senter for kulturstudier.
Carling, J. (2008) 'Towards a demography of immigrant communities and their transnational potential.' International Migration Review, 42(2):449-475.
Departementene (2009) Opportunities in diversity. The Norwegian Government's strategy for cooperation between Norway and India. Strategy, 08/2009. Oslo: the Ministries.
Directorate of Immigration (2007) Tidoblet antall faglærte indere som jobber i Norge (www.udi.no). Popular article. Oslo: Directorate of Immigration.
Directorate of Immigration (2010) Statistikk og analyse (www.udi.no). Oslo: Directorate of Immigration.
Godzimirski, J.M. (2004) The Evaluation of the Results of the Introduction of the New Regime for Migration of Skilled Labour to Norway (Spesialistordningen) The Case of Ukraine. FoU report. Oslo: Norwegian Institute of International Affairs.
Henriksen, K. (2007) Fakta om 18 innvandrergrupper i Norge, 2007/09. Oslo: Statistics Norway. Henriksen, K. (2010) Familieinnvandring og ekteskapsmønster 1990-2008. Rapporter, 10/2010. Oslo:
Statistics Norway. Kramer, J. (1978) 'Ethnicity and Community. Indian Migrants in a Norwegian Town. .' paper
presented at Asie du Sud. Traditions et changements., Sèvres 8-13 July. Kramer, J. (1979a) Hushold, bolig og kontaktmønster blant inderne i Drammen. Skriftserie, 15.
Bergen: University of Bergen. Kramer, J. (1979b) 'Indiske fremmedarbeidere i Drammen. Middelklasse på permisjon?' in Ringen, A.
(ed.) Migration to and within the Nordic countries. Oslo: Nordisk ministerråd / INAS. Kramer, J. (1979c) 'Utvandringen fra indisk Punjab.' in Grønhaug, R. (ed.) Migrasjon, utvikling og
minoriteter. Bergen: Universitetsforlaget, 55-60. Kramer, J. (1980) A community in the making. Punjabi migrants in a Norwegian town. Working
paper. Bergen: University of Oslo. Kramer, J. (Not Dated) Indernes kultur, bakgrunn og forhold til nordmenn. Rapport fra
Fremmedarbeiderprosjektet, 3. Bergen: Sosialantropologisk institutt, Universitetet i Bergen. Sandbæk, M.L. (2007) "Everybody wants to go abroad". An ethnographic analysis of migration
motivations in Morocco, Copenhagen: Anthropology, University of Copenhagen. Schou, L.A. (2006) Valg av grad eller grader av valg? etniske forskjeller i valg av høyere utdanning i
Norge, Unpublished thesis, Oslo: Institute for Sociology and Human Geography, University of Oslo. Statistics Norway (2010) Statistikkbanken (www.ssb.no). Oslo: Statistics Norway. Wist, K.K. (2000) Pakistanere og indere i Norge - på vei oppover? Om pakistanere og indere i norsk
arbeidsliv fra 1960-tallet til 2000., Unpublished thesis, Oslo: The Faculty of Humanities, University of Oslo.
Zohry, A. and Harrell-Bond, B. (2003) Contemporary Egyptian Migration: An Overview of Voluntary and Forced Migration. Working Paper, C3. Brighton: Development Research Centre on Migration, Globalisation and Poverty.

PRIO PAPER Independent • International • Interdisciplinary
Peace Research Institute Oslo (PRIO) Peace Research Institute Oslo (PRIO) Cindy Horst, Jørgen Carling & Rojan Ezzati
Cindy Horst, Jørgen Carling & Rojan Ezzati
Peace Research Institute O
slo (PRIO
) PO
Box 9229 Grønland, N
O-0134 O
slo, Norw
ay V
isiting Address: H
ausmanns gate 7
Centre for the Study of C
ivil War (C
SCW
) Peace R
esearch Institute Oslo (PR
IO)
PO Box 9229 G
rønland, NO
-0134 Oslo, N
orway
Visiting A
ddress: Hausm
anns gate 7
Immigration to Norway from Bangladesh, Brazil, Egypt, India, Morocco and Ukraine
Immigration to Norway from Bangladesh, Brazil, Egypt, India, Morocco and Ukraine Scoping studies for the project ‘Theorizing the Evolution of European Migration Systems (THEMIS)’
This report presents the findings of six scoping studies on immi-gration to Norway from Bangla-desh, Brazil, Egypt, India, Mo-rocco and Ukraine. The studies were carried out for the project Theorizing the Evolution of Euro-pean Migration Systems (THE-MIS). This project aims to study under which conditions initial moves by pioneer migrants to Europe result in rapidly expand-ing network migration and the formation of migration systems, and under which conditions this does not happen. The scoping studies thus focus on migration history and demographic charac-teristics, policy developments in
Norway and other explanatory factors for changes in the pat-terns. We also discuss institu-tions and community among these immigrant groups in Nor-way, and remittances and other transnational ties the migrants maintain to their countries of origin. The report is based on analysis of publicly available statistics, interviews with a small number of key informants from each group, and a variety of written sources. Some of the immigrant groups we cover are very small or recent, and therefore poorly do-cumented. Among the six groups, Indians and Moroccans
are by far the largest groups in Norway. As of January 2010 In-dians are the 14th largest non-western group, and Moroccans follow on the 17th place. At the other extreme, Bangladeshis rank 55th. Absolute numbers range from 6888 Indian to 579 Bangladeshi immigrants. Brazil-ians and Ukrainians in Norway stand out because their numbers have grown very rapidly over the past decade and they are over-whelmingly female groups. Egyptians in Norway, on the oth-er hand, have a long migration history and are predominantly male.
Design: Studio 7 w
ww
.studoisju.no ISBN
: 978-82-7288-359-0 M
ela Festival. Photo: Lorenz K
hazaleh, Flickr.

Appendix 3THEMIS – Metadata Phase 1
Appendix 3: Scoping studies in Portugal

1
Scoping Study Report – Portugal
Centre of Geographical Studies, IGOT
University of Lisbon
Lucinda Fonseca
Sónia Pereira
Alina Esteves
Jennifer McGarrigle
Contents
Introduction ....................................................................................... 2
Ukraine ............................................................................................ 4
Bangladesh ....................................................................................... 21
India ............................................................................................... 30
Morocco ........................................................................................... 39
Egypt .............................................................................................. 46
Brazil .............................................................................................. 51
Concluding Remarks ............................................................................ 61
Annex 1 – Summary Table – Evolution Stock foreign nationals 1999-2009 .............. 63
Annex 2 – Map with Main Regions of Origin in Ukraine ..................................... 64
Annex 3 – Individual Migration History from Ukraine ....................................... 65
Annex 4 – Map with Main Regions of Origin in Bangladesh ................................ 66
Annex 5 – Individual Migration History from Bangladesh .................................. 67
Annex 6 – Map with Main Regions of Origin in India ........................................ 68
Annex 7 – Map with Main Regions of Origin in Morocco .................................... 69
Annex 8 – Map with Main Regions of Origin in Brazil ....................................... 70
Annex 9 - Individual Migration History from Brazil ......................................... 71

2
Introduction
The present report results from literature review, available statistics at the national level
and qualitative, exploratory, interviews conducted by team members with privileged
informants and some immigrants. We have also occasionally included information that
team members have collected in a survey carried out within the realm of a different
project (GEITONIES - http://geitonies.fl.ul.pt/).
In Portugal, official statistics about immigration are collected and treated mainly by the
National Statistics Institute (INE) through Population Census (which only registers
persons that have resided in Portugal for one year or have the intention of staying for at
least one year) and Demographic Statistics and by the Aliens and Borders Service
(SEF). In addition, there are a number of Public Administration Services that gather
partial information regarding immigration. These are under the responsibility of
different Ministries - Labour, Education, Health, Foreign Affairs, Interior and Justice -
which collect information that is relevant for their respective fields of intervention. The
main criteria used in the collection of data is the country of nationality. The application
of this criteria does not allow us to make a distinction between individuals that hold
Portuguese nationality but are originally from other countries and native Portuguese
nationals. The highest proportion of foreign-born that hold Portuguese nationality is
registered amongst individuals that came to Portugal from previous colonies in Africa,
particularly from Angola and Mozambique, who usually have Portuguese ancestry. The
proportion is also high amongst individuals of Indian and Brazilian origins (as we shall
see in the respective sections). Amongst more recent immigrants the percentage of
foreign-born with Portuguese nationality is lower and therefore the nationality criteria is
a good proxy for the number of foreign-born. However, the number of immigrants from
‘new’ immigration countries that obtain Portuguese citizenship has been rising (SEF’s
report for 2009), particularly as a result of a new law from 2006 - Law no 2/2006, from
17th April - which facilitates the acquisition of Portuguese citizenship.
Since 2008 an integrated information service has been introduced to overcome
information dispersal and inconsistencies that existed previously. This is the Integrated
Information System from SEF (SIISEF), which became the only statistical information

3
source about foreign residents in Portugal, and includes all data regarding entry,
permanence and removal of foreign citizens in the country, including yearly renewals of
visas/permanence or residence permits (which were not included in previous statistics).
For this reason, data from previous years will not be entirely comparable to that of 2008
and subsequent years.
The change in immigration law that took place in 2001 - when Decree-Law 4/2001 of
10th January replaced previous legislation resulting from the Decree-Law 244/98 -
corresponded to a very large increase in the number of immigrants in the country. This
is visible in all short-listed origins, as we shall see. Indeed, many immigrants have
mentioned that the likelihood of regularisation in Portugal constituted an incentive to
migrate to this country (further references will be made in each section). Following the
entry into force of this legislation, irregular immigrants were able to obtain a
permanence permit by presenting a working contract validated by labour inspection
authorities. This permanence permit needed to be renewed every year during a period of
5 years, after which the immigrants would gain access to a residence permit. Available
statistics record only the accumulated number of permanence permits granted in those
years (the majority was granted in 2001) and not the yearly renewals. As a result, one is
unable to calculate the number of immigrants that did not renew the permit between
2002 and 2004. Only in 2005 do we have data for the number of foreigners that did
renew their title. This year most nationalities show a sharp decrease but it is very likely
that most did not leave the country between 2004 and 2005 but began to do so in
previous years (particularly following the crisis in the construction sector in 2003).
We were able to include some Census data based on the country of birth but this is only
available for Census years 1981, 1991 and 2001. For the most part, the data we use
refers to foreign-nationals that reside legally in Portugal. Additionally, it is important to
highlight that the category ‘immigrant’ or ‘immigration flow’ is not easily applicable to
all foreign-born or foreign nationals that reside in Portugal. Given historical colonial
relations ‘immigrants’ of Indian origin that arrived through Mozambique, for example,
tend to identify themselves as ‘Portuguese of Indian origin’ that moved from one
Portuguese territory to another and not as ‘immigrants of Indian origin’ (this was
mentioned in an interview with a representative of the Hindu Community as well as by

4
the researcher S. Pereira Bastos1). Other ‘immigrants’ may also not identify themselves
as ‘immigrants’ (this was referred in an interview with a pioneer from Brazil) because
their mobility was not motivated by the prospect of improving living conditions. They
may see themselves more as citizens that move in a global world.
Given these limitations in terms of sources of data and the fact that Portugal is for the
most part a ‘new country of immigration’, trends regarding the evolution of the flows
from short-listed countries are difficult to identify and categorize with accuracy. We
have nevertheless attempted to do so with the available data2.
Ukraine
1. THEMIS Theoretical Framework
a. Categories
Ukrainians are a recent immigrant group in Portugal only beginning to arrive at the end
of the 1990s. They constitute the second largest immigrant group (by country of
nationality), with 52,293 nationals residing regularly in Portugal in 2009 (SEF). Some
Ukrainians have also obtained Portuguese nationality (SEF’s report for 2009: 81
highlights a noteworthy increase in the requests for Portuguese nationality lodged by
Ukrainian citizens)3. The flow from the Ukraine may be classified as
‘declining/stagnant’ due to its recent declining tendency (since 2004, albeit it increased
slightly in 2008), followed by a stagnation trend in the past year (see figure 1).
It is important to highlight that there is a substantial difference between the number of
documented Ukrainian immigrants recorded by SEF and the estimates of the Ukrainian
Embassy. In 2004, Malynovska indicated that the number of Ukrainians in Portugal was
approximately 115 thousand while in Portuguese official records the number was only
slightly over 66 thousand. More recently, the latter number has decreased to around 53
1 Quoted in a newspaper article: http://www.supergoa.com/pt/read/news_noticia.asp?c_news=624, from 8/1/2007. 2 Graphic representations of this evolution are available in each section and a summary table with corresponding figures may be found in Annex 1. 3 Ukraine does not recognize dual nationalities; however, at the same time it does not forbid it either (information obtained from an interview at the Cultural Centre of the Embassy).

5
thousand. The president of Spilka believes that there may be around 5 thousand waiting
for regularisation (most in family reunification processes) but the patriarchate estimates
that the number of irregular immigrants is around 50 thousand. The president of this
association believes this is overestimated as currently immigrants have no reason to be
irregular.
This immigration is mainly labour related or for purposes of family reunification
(particularly the most recent arrivals).
The population is in the majority male, however, there has been an increasing
feminisation of the flow. In 2009, around 56% of the registered stock was comprised of
men (falling from 62% in 2006) (SEF). This flow was initially constituted mainly of
men that came to work in Portugal in the construction sector, industry and agriculture
(Baganha et al 2004, Santana & Serranito 2005) but these were soon followed by
women and children (Wall et al 2005). According to a full-scale sample population
survey on labour migration carried out in Ukraine in 20084, Ukrainians that had
travelled to Portugal between 2005 and 2008 for work purposes were still
predominantly male (67.5%) (information from O. Malynovska).
Research with Ukrainian immigrants has pointed to quite high age levels within this
immigrant group (Baganha et al 2004 indicate that the average age of the sample
surveyed was 36 years old). Indeed, data from SEF for 2006 reveals that around 69% of
legal residents from this origin were 30 years of age or older with the highest
concentration in the interval of 30-34 (18%) followed by 35-39 (15%). Currently, it is
4 Information regarding this survey may be found here: http://www.openukraine.org/en/programs/migration/research-program/
Figure 2 - Evolution - stock of born in Ukraine resident in Portugal
in 1981, 1991, 2001
Source: INE (Census data, by country of birth)
Figure 1 - Evolution - stock of Ukrainian nationals 1999-2008
0
20
40
60
80
100
120
140
1999 2000 2001 2002 2003 2004 2005 2006 2007 2008 2009
Source: SEF (country of nationality)2009=100
0
2000
4000
6000
8000
10000
12000
1981 1991 2001
URSS/Ukraine (2001)

6
estimated that the average age is between 40 to 45 years old, according to the president
of the Association of Ukrainian Immigrants in Portugal (Spilka). In the large-scale
survey mentioned above, 42,5% of respondents that had made at least one trip to
Portugal to find work between 2005 and 2008 were older than 40 and 30% were aged
between 30 and 39 years.
Ukrainian immigrants in Portugal are mostly of Ukrainian ‘ethnicity’ (speak Ukrainian
and have Ukrainian culture, in opposition to those Ukrainians that have Russian
ancestry, speak Russian and have a Russian culture) and are from the Western part of
Ukraine, particularly from L’viv, Ternopil and Ivanofrankivsk5 (in the large scale
survey conducted in Ukraine mentioned previously the authors found a large percentage
of immigrants from the Chernovitskaja oblast and from the countryside – 67.5%); a
large proportion are Greek-Catholics – Byzantine Rite Catholics - and a smaller number
are Orthodox (Orthodox Churches of Moscow and Ukraine) (see for example Vilaça
2008 on the importance of religious associations among Eastern European immigrants).
According to the president of Spilka the Ukrainian group in Portugal is very
homogeneous, without substantial differences between pioneers and subsequent
migrants (indeed, times of arrival do not differ significantly between them).
b. Evolution of the migratory flow and settlement
Immigration from the Ukraine to Portugal began at the end of the 1990s and occurred
mostly during the early 2000s with the formation of a sudden and intense migratory
flow. In 1999, only 123 Ukrainian nationals were registered in the country by the Aliens
and Borders Service (SEF). By 2001, following an extraordinary regularisation process
that will be discussed below, this figure had risen to 45,829. In 2004 the equivalent
number was 66,281, the highest recorded to date (figure 1 - above). However, other
estimates point to an immigrant population between 150 and 200 thousand at that time
(Rios 2006).
These migrants settled throughout Portugal (their dispersal into the rural area of
Alentejo, for example, was explored by Fonseca 2004), but with higher concentration in
5 See Annex 2 – Map with Main regions of origin in Ukraine

7
the districts of Faro – around 20% in 2005 –, Lisbon – around 20% in 2005 -, Santarém
- around 12% in 2005 - and Leiria - around 10% in 2005 (SEF). However, with time we
observe an increasing concentration in Lisbon (in 2009, data from SEF records around
26% in this district) and a decrease in Santarém (7% in 2009) . According to qualitative
data from interviews conducted with the president of Spilka and the Secretary of the
Ukrainian Embassy, Ukrainian immigrants do not tend to cluster in geographical areas,
like other immigrant groups; rather the search for good living conditions determines
where they settle. However, they do maintain in contact with their fellow countrymen.
No connections between particular regions of origin and destination were identified.
Ukrainian immigrants were employed in several activities including construction (the
majority of male immigrants), agriculture (the representative from the cultural centre of
the Embassy mentioned that there are Ukrainians from villages in Ukraine that settled in
rural areas in Portugal), industry (namely textile, garments and footwear), commerce
and hotels and restaurants (Carneiro et al 2006: 44). These immigrants showed a higher
level of occupational dispersion in comparison to immigrants from other origins. A
large proportion of them performed low skilled jobs in spite of their qualifications. This
was confirmed in a survey conducted in 2002, whereby 62% were found to work in
unskilled jobs, (Baganha et al 2004:34). Precarious working conditions prevailed for
many of these immigrants. In the same survey the authors found that 24% were working
without a contract (Baganha et al 2004: 36). With time, a number of them were able to
obtain jobs more in tune with their qualifications. The average education level of these
immigrants was high in comparison with both the Portuguese population and other third
country immigrants. In accordance, the large scale survey conducted in Ukraine
indicated that the majority of Ukrainians working in Portugal had secondary education
and 10% had a university degree (information from O. Malynovska). One such example
was the program for the recognition of competencies for medical doctors in 2002 (109
Eastern European doctors completed the course successfully) and again in 2008
(ongoing), sponsored by the Foundation Calouste Gulbenkian6. The legislation put in
place in 2007 regarding the recognition of academic qualifications obtained abroad has
also contributed to the same end (interview with Spilka’s president). More recently, an
increasing number of Ukrainian immigrants have also begun to set up their own
6 See Annex 3 for one example of migration history of Ukrainian medical doctors.
8
businesses: selling Ukrainian products (produced mostly in Germany), restaurants,
cafes, cleaning services, car repair, construction and sewing services (interview with
Spilka’s president).
Important turning points in this migration flow, according to official statistics, were as
follows:
a) In 2001, when Ukrainian immigrants that had begun to arrive at the end of the
1990s were made visible through the extraordinary regularisation process that
took place during that year (see policy changes below).
b) In 2005, when it became evident that a large number of such immigrants had
failed to renew their permanence permits granted in previous years, mostly
because they left the country (between 2004 and 2005 SEF records a decrease in
the number of Ukrainians from 66,281 to 43,849), either to return to Ukraine or
to migrate to another European country. Spain appears to have been a popular
destination at the time due to a booming construction sector. However,
according to the representative from the cultural centre of the Embassy, re-
migration to other European countries was only temporary, for work purposes,
whilst the family stayed in Portugal.
c) In 2008, when immigration statistics showed a recovery in the number of
Ukrainians that had been in decline since 2005 (as a result, the Ukrainian group
moved from third to second place in the ranking of the most numerous foreign
groups in Portugal). This is likely to be related to family reunification and new
returns to Portugal. According to the president of Spilka many migrants that had
returned to Ukraine failed in their business ventures and as a result migrated to
Portugal again. Fedyuk (2006: 2) also mentions that “Many labour migrants,
coming back from abroad, choose to migrate again after a few years at home”.
Furthermore, a proportion of those Ukrainian immigrants that had regularised
their immigration status in Portugal and migrated to Spain due to the higher
wages offered there (mostly in construction) returned to Portugal because
regardless of lower wages, living conditions are more stable and attitudes
towards immigrants are friendlier both on the part of the authorities and civil
society (the president of Spilka).

9
2. Policy Changes
Recent mobility out of Eastern European countries and of Ukraine in particular followed
the collapse of the Soviet Union, which led to a legal framework that allowed freedom
of movement to Ukrainian citizens (in 1994) (Malynovska 2004: 12). During the 1990s
the Ukraine went through a severe economic crisis, with unemployment,
underemployment, low salaries and delays in salary payments (Malynovska 2004: 12).
Both the political and economic context in the Ukraine at this time acted as catalysts of
international migration that continued throughout the 2000s. In a survey,7 conducted in
2008 (involving 48,000 able citizens, representing 22,000 households in all regions of
the country; women aged 15–54 and men aged 15–59), the authors found that between
1st January 2005 and 1st June 2008 nearly 1.5 million Ukrainian citizens, corresponding
to 5.1% of the country’s population, made at least one trip abroad for employment
purposes. Nearly half of them (48.5%) went to the Russian Federation and
approximately as many to EU countries: Italy (13.4%), Czech Republic (12.8%), Poland
(7.4%), Spain (3.9%), and Portugal (3%), corresponding to 43.9 thousand individuals,
of whom the majority travelled to Portugal once to find employment and stayed more
than 12 months)8 (Libanova9).
In Portugal, Ukrainian immigrants benefited largely from the change in legislation that
took place in 2001, mentioned in the Introduction. This change was the result of a
political recognition that a large number of immigrants were living and working
irregularly in the country (the increase in the number of Ukrainian immigrants in
Portugal between 2000 and 2001 was around 28016%). Moreover, a number of
Ukrainian immigrants were attracted to the country following the adoption of this
legislation. In a survey conducted in 2002 with Eastern European immigrants mostly
from Ukraine (Baganha et al 2005), 13% of the respondents indicated that the
possibility of obtaining a legal document in Portugal motivated their migration to the
7 This survey was conducted by the State Statistics Committee of Ukraine, the Ukrainian Center for Social Reforms supported by Arsenii Yatseniuk’s Open Ukraine Foundation, the International Organization for Migration Mission in Ukraine, and the Country Office of the International Bank for Reconstruction and Development in Ukraine. 8 Olena Malinovska attributes the low percentage of migration to Portugal during these years due to the fact that most migration to Portugal occurred before 2005. If migrants who left earlier did not visit Ukraine between 2005 and 2008 they were not included in the research 9 Document available on http://openukraine.org/doc/migration/Brief_results/Libanova_En.doc on 24th June 2010.

10
country. The majority of immigrants interviewed in this survey had arrived in Portugal
at some point during 2001.
The entry of significant numbers of immigrants from non-‘traditional’ countries of
origin in Portugal (i.e. those other than the former Portuguese colonies in Africa) was
also largely motivated by economic opportunities generated by strong public investment
in infrastructures that followed Portugal’s entry in the EEC in 1986. The construction of
the site of EXPO 98 and, nearby the Vasco da Gama bridge, in particular, attracted a
large immigrant workforce to the country. Also, the wage level in Portugal was
substantially higher than that of Ukraine. In a survey conducted in 2002 (Baganha et al
2005), the authors found that most workers (65%) declared to have earned less than 100
Euros/month in Ukraine, while in Portugal the average minimum wage for a janitor in
construction was 458 Euros/month.
Throughout 2001, irregular immigrants who were working in the country were able to
obtain a permanence permit and regularise their situation through the presentation of a
working contract. The reduction in the number of legal residents with Ukrainian
nationality, after 2004, shows that a percentage of those that had obtained a permanence
permit in 2001 failed to renew it or left the country. Indeed, a survey with Eastern
European immigrants mostly from Ukraine (Baganha et al 2005) showed that a large
proportion of them had short-term migratory projects and intended to return to the
country of origin. Also Malynovska and Libanova (2008: 324) indicate that the average
length of stay in Portugal is 1.5 to 2 years. The Ukrainian inflow appears to have been
halted by the economic crisis from 2003 onwards. Nonetheless, there remained a large
number of immigrants from this origin in the country, rendering it the second largest
immigrant group in 2009 (SEF). The apparent recovery of the flow in 2008 may
indicate that the immigration pattern from this country to Portugal has not yet stabilised.
New immigration legislation came into force in 2007, the Law No. 23/2007 of 4th July,
which governs the conditions and procedures for the entry, residence, exit and removal
of foreign nationals in Portuguese territory, as well as the status of long-term residents
(together with Regulatory-Decree No 84/ 2007 of 5th November, that regulates the
application of the immigration law). This legislation changed the conditions for

11
regularisation10 and may have influenced the regularisation of Ukrainian immigrants
that were already undocumented in the country or attracted new ones.
In 2003, the Ukrainian Parliament ratified the "Treaty on Temporary Labour Migration"
with Portugal, which allows Ukrainian citizens to be placed in jobs offered by
Portuguese employers (Malynovska 2006). On 27th March 2005, the agreement came
into force. As stated on the web-portal of the Ukrainian government11: “… according to
the agreement, Ukrainian citizens will travel to Portugal after already signing
employment agreements and obtaining work visas. Moreover, Ukrainians will be able to
officially work in their professions in Portugal while enjoying all the relevant social
rights and protections. Among other things, Ukrainians will be entitled to the guaranties
of health and labour protection stipulated for Portuguese citizens in the Portuguese
legislation.” However, this agreement has not had a notable impact in terms of
providing an efficient vehicle for immigration from that country (interview with Spilka
and information from O. Malinovska). Other important agreements between Portugal
and the Ukraine or legislation which produced effects that were felt by the Ukrainian
community, according to the president of Spilka, include: i) in 2000, The Convention
between Ukraine and the Portuguese Republic on the Avoidance of Double Taxation
and the Prevention of Fiscal Evasion with Respect to Taxes of Income and Capital; ii)
in 2007, the Decree-Law 341/2007 of 12th October regarding the recognition of
qualifications obtained in foreign institutions, on the basis of which many Ukrainian
immigrants have been able to obtain the recognition of their diplomas and gain access to
jobs/wage levels that match their education levels; and iii) in 2009 (entered into force in
2010), The Agreement on Social Security, which, according to the president of Spilka,
will enable immigrants in Portugal to receive retirement pensions with the inclusion of
working years prior to their migration to Portugal.
Political attitudes towards Ukrainian labour migrants in the country of origin have also
been changing. While in 2002 the Ukrainian president Leonid Kuchma called Ukrainian
women working in Italy “prostitutes” (Fedyuk 2006: 5) positive changes occurred after
10 This legislation created the ‘residence visa’ which is the most relevant for immigrants wishing to enter the country. This visa allows the holder to stay in Portugal for 4 months so that he/she may file an application for a residence permit at SEF – Foreign Nationals and Border Control Service. 11 http://www.kmu.gov.ua/control/en/publish/article?art_id=14605724&cat_id=32598

12
the election of Yushchenko in 2004 and Ukrainian immigrants have begun to receive
greater support from their government (interview with the president of Spilka).
According to the same interviewee migratory pressure in the Ukraine continues and has
become more intense after the general elections that took place in early 2010 (with the
victory of the pro-Russia candidate). Since last year Spilka has been receiving an
increasing number of requests from Ukrainians who wish to leave the Ukraine and are
interested in exploring opportunities to migrate to Portugal. The flow is being halted by
difficulties in obtaining visas to travel to the Schengen area and by the current economic
crisis in Europe.
Portugal has had a diplomatic representation in Ukraine since 1993 and the Ukraine
established its Embassy in Lisbon in 2000. As a result of a large number of Ukrainians
that reside in the North and Central regions of Portugal, a Consulate was also opened in
the northern city of Porto in 200612.
3. Institutions
a. Transnational Links (Associations, Websites, Organizations)
In 2003 a study alluded to the insipient degree of association between Ukrainian
immigrants in Portugal, however, as immigrants settled in the country and regularized
their immigration status, the situation began to change (Rios 2006: 124). The
Association of Ukrainian Immigrants in Portugal (Spilka) has 12 branches spread
throughout the country and promotes numerous Ukrainian celebrations and cultural
encounters (sometimes involving artists that come from abroad as well as conferences
with relevant themes from Ukrainian History). The association has also established a
protocol with Ukrainian Universities to create an International School with the objective
of promoting Ukrainian education for young people of Ukrainian origin in Portugal.
There are Ukrainian schools that function on Saturdays and Sundays where students are
taught in Ukrainian and learn Ukrainian History and Literature. At the end of the course
professors from the International School of Ukraine come to Portugal to examine the
students and grant diplomas which give access to the continuation of studies in Ukraine,
12 Information available at http://www.mfa.gov.ua/portugal/port/publication/content/6187.htm, on 18th May 2010.

13
for example at the University. This year in the Ukrainian school in Lisbon, 15 students
completed secondary education and 8 wish to pursue higher education in Ukraine.
The Ukrainian World Congress founded in New York in 1967 now includes a
representation of Ukrainian immigrants in Portugal (Rios 2006: 125). Associations of
Ukrainian immigrants in different countries maintain intense contact with each other,
particularly in the case of the newest countries of Ukrainian immigration: Greece, Italy,
Spain, Poland and Portugal (interview with the president of Spilka). There is an annual
general assembly involving representatives of Ukrainian Associations worldwide and a
European Congress of Ukrainians (interview at the Cultural Centre from the Ukrainian
Embassy).
Transnational business activities conducted by Ukrainian immigrants in Portugal are
very rare mostly due to the geographical distance between the two countries. Some
major companies import cork (according to the president of Spilka and indeed official
statistics show that cork is one of the few products exported to Ukraine). There is also
wine import (the president of Spilka knows of one Portuguese that opened a wine store
in Ukraine, where he sells Portuguese wine) and olives, but to a lesser extent. The
president of Spilka mentioned that one firm started to import stones and tiles from
Portugal but without success. However, due to the distances the profit was very low and
consequently it was cheaper to import from Spain or Italy. There have been some
official initiatives to stimulate business contacts between the two countries – the
Ambassador of Ukraine participated in an Economic Forum that took place in Alcácer
do Sal, in Portugal, in 2009 (interview with Spilka) – and the number of firms exporting
to Ukraine registered a steady increase between 2000 and 2007 (from 33 to 441) but the
trading balance was only -42,069 thousand Euros in 2008 (the Ukraine occupied the 58th
place in Portugal’s exports and the 52nd in its imports). Thus, despite some positive
advancements, trade relations between both countries are still weak.
Some Ukrainians travel to other countries – Spain, France, England and even Angola –
within the realm of their work in Portugal. They are sent by their employers (interview
at the Embassy).

14
b. Networks
Social networks have become increasingly more important in the sustenance of the
flow, particularly in association with family reunification processes (see below for more
details of how the flow was initiated). According to the president of Spilka it would be
difficult for individual Ukrainians to migrate to Portugal at present without previous
contacts in the country. O. Malinovska advances as well that networks used by
Ukrainian immigrants are informal and built on interpersonal ties (family, village,
region). In the survey conducted in 2008, 78,4% of Ukrainians who were immigrants in
Portugal between 2005 and 2008 found their job with the help of relatives and friends.
c. Migration Industry (Travel Agents, Phone Cards, Airlines – map of the
corridor)
As mentioned previously, immigration from Ukraine to Portugal began at the end of the
1990s with the constitution of a sudden and intense migratory flow. In the absence of
historical relations with Portugal or social networks that could mediate the migration
process, most of this migration flow was constituted and sustained through organised
businesses and criminal organisations (see for example Peixoto et al 2005 on the
trafficking of Eastern European immigrants to Portugal). Travel agents in Ukraine and
neighbouring countries (Russia, in particular) were active agents in the constitution of
the migration flow of Ukrainians to Portugal. Pioneer migrants who arrived in Portugal
had bought a ‘travel package’ in one of these travel agents that included: 1) the trip to
Portugal, usually with other immigrants in a mini-van that made several stops
throughout Europe on route; 2) a passport; 3) a tourist visa for the Schengen area and 4)
(often) the contact of someone in Portugal who would assist the migrant in finding
accommodation and work. These travel packages were widely advertised in newspapers
and by ‘sellers’ in rural areas. There are several cases reported of continued extortion
after the immigrants started working by organised criminal organisations that began
operating in Portugal (Peixoto et al 2005). The price of this ‘travel package’ varied
between 450 and 1500 USD and sometimes for the work placement the immigrant
would pay an additional amount of 300 to 400 USD (Pereira and Vasconcelos 2007 and
Peixoto et al 2005). Subsequent immigration, particularly of women and children,
became more reliant on established social networks and less on organised businesses.
According to the president of Spilka, currently, Ukrainians that wish to migrate to
Portugal out with processes of family reunification) need to pay around 3 thousand

15
Euros for the necessary documents. The alternative is to use one of the travel agents in
Ukraine and try to enter as a tourist.
Most Ukrainian immigrants maintain strong links with the country of origin. Since the
average age of Ukrainian immigrants in Portugal is 40 to 45 years old, most still have
family in Ukraine – parents, siblings, children. Therefore, contacts are regular, by
telephone and through the internet – skype is used widely (interview with the president
of Spilka). Portugal Telecom, the largest national telecommunication company,
recognizes the relevance of Ukrainian immigrants in Portugal and has two phone cards
which enable phone calls to Ukraine (‘PT Hello East’ - for Eastern European
immigrants and ‘Easy Talk’ to Eastern Europe, Brazil and Europe).
Most immigrants travel to Ukraine once a year, usually in summer time. Frequently they
fly to Ukraine - nowadays, Ukraine International Airlines operates a direct flight
between Lisbon and Kiev, L’viv, Simferopol and Odessa, and has a contact line in
Portugal; the Portuguese national airline – TAP – also operates flights to Kiev and
Simferopol via other European cities; and KLM and Lufthansa are also often chosen by
Ukrainian immigrants – but it is not uncommon that migrants drive there in their own
cars. According to the president of Spilka the number of migrants that take their cars to
Ukraine has been rising in recent years; if the migrant has Portuguese nationality the car
can stay in Ukraine for unlimited periods of time, but for Ukrainian citizens the stay is
limited to 10 days. As a result, both Spilka and the Embassy in Portugal referred to the
fact that they are trying to influence the Ukrainian Government to change this rule. The
distance between Lisbon and L’viv is approximately 3,700 km, which takes 2 to 3 days
driving. There is also one bus service linking Portugal to Ukraine and numerous mini-
buses (8/9 places) that travel regularly between the two countries. These mini-buses are
operated by Ukrainian individuals or private firms, most of them illegally, and are used
to take products from Portugal to Ukraine and bring typical Ukrainian food products
that are difficult to find in Portugal and books (interview with Spilka).
4. Remittances
The empirical evidence available shows that the majority of Ukrainian immigrants send
remittances home (in the survey conducted in 2008, the authors found that 78,4% of
migrants send remittances home)

16
Data from the Bank of Portugal (see table 1 below) shows a very sharp increase in the
volume of remittances from Portugal to the Ukraine in 2001 and a declining tendency
thereafter. The volume of remittances showed some stability between 2008 and 2009.
Table 1- Remittances sent to Ukraine from Portugal 1999-2009
1999 2000 2001 2002 2003 2004 2005 2006 2007 2008 2009
Remittances
- Ukraine 29 2.132 148.216 134.545 92.737 63.564 63.342 57.076 50.683 49.104 49.037
Thousands Euros
Source: Bank of Portugal; Information available on 08-07-2010
One major Portuguese bank – Banco Espírito Santo – developed the service BESXpress
to facilitate bank transfers to Ukraine (and also to Moldova and Brazil) through an
agreement with the Ukrainian institution Ukreximbank (Dias et al 2009: 90). Both
Banco Espírito Santo and a second bank, Millenium BCP, have information in
Ukrainian regarding their financial products and have created adverts in both this
language and other Eastern European languages to attract Eastern European clients.
Bank Espírito Santo has also made its website available in Ukrainian (as well as in
Romanian and Russian) and also operates a help line in Ukrainian (as well as in Russian
and Moldovan) (Dias et al 2009: 97).
In 2004, Western Union agreed to reduce its commission by 40% on remittances of up
to 200 Euros from Portugal. Also in December 2004, Pryvatbank, one of the ten largest
banks in Ukraine, reached an agreement with the Portuguese bank Caixa Central de
Crédito Agrícola Mútuo to cooperate in money transfers (Rios 2006: 124). According to
the president of Spilka the majority of immigrants send remittances through Western
Union and MoneyGram. Also, O. Malinovska found that the majority of Ukrainians
who migrated to Portugal between 2005 and 2008 sent money through bank channels
(37,8%) and that 30% relied on the help of friends, whilst others personally delivered
remittances to family themselves.
Three years ago a Ukrainian bank opened a branch in Portugal, but Ukrainians preferred
to use Portuguese banks or other foreign banks in Portugal because the services offered
were better and these banks were seen as more reliable, according to the president of
Spilka. At the beginning this bank offered competitive conditions in terms of house

17
loans for investments in Ukraine, but with the rise in real estate prices, mostly after
2003, this investment became unattractive to Ukrainian immigrants (interview with
Spilka).
Remittances are mostly used to support the daily expenses of the family in the country
of origin (parents, siblings and children). “… it is practically impossible for a labour
migrant to earn a sum of money that would allow them to start a business in Ukraine.”
(Fedyuk 2006: 2). Furthermore, migrant workers also lack the necessary social networks
to set up businesses since most businesses are run by the political elite and extended
family (Fedyuk 2006: 2). Investments in residential property in the country of origin,
common among labour migrants worldwide, have also been halted by the rise in prices
(interview with Spilka). For example, Fedyuk (2006: 3) reports that in Ivano-Frankivsk,
one of the main cities of origin of Ukrainian immigrants in Portugal, prices for new
apartments have been consistently increasing for years, reaching approximately USD
370-390 per square meter.
Only in 2004, when a large number of Ukrainians left the country to return to Ukraine
(many also went to Spain at this time due to employment opportunities in construction),
were there investments in small businesses in the country of origin. However, according
to the president of Spilka, many of these businesses failed due to unfavourable
legislation. As a result, many of these returned migrants ended up migrating to Portugal
again.
5. Recent Trends and Future
It is likely that one important part of the flow from Ukraine will be sustained by
processes of family reunification. In its early stages, the flow was predominantly male,
as was mentioned before, but it is probable that a large proportion of these men had
families in the country of origin. In a survey conducted by Furtado Sousa with 102
Ukrainian immigrants the majority were married but around 80% had migrated without
family (Furtado Sousa 2006: 165). In 2005, in a study about processes of family
reunification Fonseca et al anticipated the likelihood of this evolution (2005: 146). At
the time of the study, 10% of Eastern European immigrants surveyed held a visa for
temporary stay, which is used in processes of family reunification. In 2005, SEF’s
statistics show that around 13% of Ukrainian residents had this visa, of which 72% were

18
women13. Also the president of Spilka states that the flow from Ukraine has been
growing very slowly and is mostly constituted by families of immigrants that already
reside in the country (same information was transmitted by the Secretary of the
Embassy).
According to Ukrainian official statistics on migration, in 2009 only 57 individuals left
Ukraine for Portugal and 26 entered Ukraine from Portugal. In 2008, these figures were
38 and 15, respectively (O. Malynovska).
Presently, the group of Ukrainian residents in Portugal is stable, most have conducted
family reunification processes or have Portuguese partners. The president of Spilka is
unaware of families that were unable to bring their children to Portugal. The same
interviewee maintains that children are well integrated in schools, achieve good results
and generally do not face discrimination.
Regarding the future, it is difficult to predict if a strong immigration flow similar to the
one of the early 2000s will occur. It is expected that the number of Ukrainian emigrants
to countries outside the former Soviet Union will fall as compared to 2004, while the
return flow will grow (Malynovkska and Libanova 2008: 308). Improving working
conditions and wage levels in Ukraine will be an important contribution to the reduction
of large outflows of Ukrainian emigrants. However, as long as these transformations are
not fully in place motives for emigration will be maintained according to Malynovska
and Libanova (2008: 307/325). Thus, in a context of continued migratory pressure in
Ukraine and given the large Ukrainian community that resides in Portugal, if political
restrictions on immigration are waved and job opportunities are created in Portugal (for
example in construction) it is possible that another large inflow of Ukrainian
immigrants may occur.
6. Assessment
Expected Difficulty Level of the Research: Easy
Easier Aspects:
13 Statistics previously available on www.sef.pt.

19
� There is a high number of Ukrainian immigrants in the country, which would
be easy to sample.
� Ukrainian immigrants have by and large learned the Portuguese language
well, which would enable surveys without interpreters.
� There are a number of Ukrainian associations, which could facilitate access
to potential ‘seeds’.
� The contacts of Spilka with Ukrainian Universities, as well as with Prof.
Olena Malynovska and the Open Foundation Ukraine, which has a vast
experience of research in Ukrainian migration, would facilitate fieldwork in
the country of origin.
More Difficult Aspects:
� Higher geographical dispersion in comparison to other immigrant
groups (thus, lower concentration levels in selected cities)
References
Baganha, M. I., J. C. Marques, et al. (2004). The unforeseen wave: migration from Eastern Europe to Portugal. New Waves: Migration from Eastern to Southern Europe. M. I. Baganha and M. L. Fonseca. Lisboa, Luso American Foundation: 23-40. Baganha, M. I., J. C. Marques, et al. (2005). "Imigrantes de Leste em Portugal." Revista de Estudos Demográficos 38: 31-45. Carneiro, R., A. C. d. Almeida, et al. (2006). A mobilidade ocupacional do trabalhador migrante em Portugal, Direcção-Geral de Estudos Estatística e Planeamento (DGEEP). Dias, B., E. Silva, et al. (2009). Acesso dos imigrantes aos serviços bancários em Portugal. Lisboa, ACIDI. Fedyuk, O. (2006). "Ukrainian Labour Migrants: visibility through stereotypes." Migrationonline.cz. Fonseca, M. L., M. Ormond, et al. (2005). Reunificação Familiar e Imigração em Portugal. Lisboa, ACIME. Fonseca, M. L. (2004). Immigration to Medium Sized Cities and Rural Areas: The case of Eastern Europeans in the Évora Region (Southern Portugal). New waves: migration from Eastern to Southern Europe. M. I. Baganha and M. L. Fonseca. Lisboa, Fundação Luso-Americana: 91-118.
20
Furtado Sousa, J. (2006). Os imigrantes ucranianos em Portugal e os cuidados de saúde. Lisboa, ACIME. Malynovska, O. (2004). International Labour Migration from the Ukraine: the last 10 years. New waves: migration from Eastern to Southern Europe. M. I. Baganha and M. L. Fonseca. Lisbon, Luso-American Foundation: 11-22. Malynovska, O. (2006). Caught Between East and West, Ukraine Struggles with Its Migration Policy. Migration Information Source. Malynovska, O. and E. Libanova (2008). Ukraine. Permanent or Circular Migration? Policy Choices to Address Demographic Decline and Labour Shortages in Europe. E. Hönekopp and H. Mattila. Budapest, IOM: 301-338. Peixoto, J., A. G. Soares, et al. (2005). O Tráfico de Migrantes em Portugal: Perspectivas Sociológicas, Jurídicas e Políticas. Lisboa, ACIME. Pereira, S. and J. Vasconcelos (2007). Combate ao Tráfico de Seres Humanos e Trabalho Forçado: Estudos de Caso e Respostas de Portugal. Genebra, Organização Internacional do Trabalho (OIT). Rios, R. R., Ed. (2006). Migration Perpectives: Eastern Europe and Central Asia. Planning and managing labour. Vienna, IOM. Santana, V. and P. Serranito (2005). Percursos de vida de imigrantes de Leste. Imigração e Etnicidade. Vivência e Trajectórias de Mulheres em Portugal. S. Racismo. Lisboa, SOS Racismo: 235-250. Santos, P. F. (2004). Vento de Leste: A nova imigração em Portugal. Lisboa, Edeline. Vilaça, H. (2008). Imigração, Etnicidade e Religião: o papel das comunidades religiosas na integração dos imigrantes da Europa de Leste. Lisboa, ACIDI. Wall, K., C. Nunes, et al. (2005). Immigrant Women in Portugal: migration trajectories, main problems and policies. Lisboa, European Observatory of Family Policies.
Interviews
President of the Association of Ukrainian Immigrants in Portugal - Spilka
Professor Olena Malynovska - by e-mail
Representative of Ukrainian Cultural Centre, Secretary of the Embassy of Ukraine
in Portugal.

21
Bangladesh
1. THEMIS Theoretical Framework
a. Categories
Bangladeshis comprise a small immigrant group (with 1,346 Bangladeshi nationals
recorded by SEF in 2009). They represent the 4th largest group with Asian origins (after
China, India and Pakistan, according to SEF). However, the number of Bangladeshis
registered at the Consulate of Bangladesh (4,868 registered on the 11th June 2010)
suggests a high number of undocumented migrants as well as a mobile population
within Europe. Indeed, according to the former Consul, not all the Bangladeshis
registered are permanent residents in Portugal, however, they are obliged to register
when they take or intend to take residence in a different country. The same interviewee
also stated during the interview that around 300 Bangladeshis hold a Portuguese
passport.
It is a recent immigrant group. In 1988 SEF only recorded 2 Bangladeshis in the
country, in 1995 there were 47, and the equivalent number was 128 in 1999 – see figure
3. It may be classified as ‘starter’ with a current trend of expansion (despite the slight
decrease between 2008 and 2009) and with potential for further increase (Consul of
Bangladesh).
Figure 4 - Evolution - stock of born in Bangladesh 1981, 1991, 2001
0
50
100
150
200
250
300
1981 1991 2001
Bangladesh
Source: INE (Census data, by country of birth)
Figure 3 - Evolution - stock of Bangladeshi nationals 1999-2008
0
20
40
60
80
100
120
140
1999 2000 2001 2002 2003 2004 2005 2006 2007 2008 2009
Source: SEF (by country of nationality)2009=100

22
Figure 5 – Yearly Variations in the Number of Registered Bangladeshis 1992-2010
Source: Former Consul of Bangladesh in Portugal
Note: registrations from 2006 were closed on 31st March 2007, which accounts for the larger than usual increase in that year
It is mostly an inflow of labour migration with increasing family reunification.
According to SEF, in 2009 the Bangladeshi population was mostly male (74%). Indeed,
there are almost no individual migration projects of women (the former Consul records
only 2 women in the first regularisation processes). Women began to arrive as part of
the process of family reunification. Mapril14 highlights that processes of family
reunification only take place when all of the necessary material conditions are in order
to ensure that when the wife comes to Portugal she has full rights and is documented in
the country. It is a costly and long process as the necessary documents can only be
issued by the Portuguese Consulate in New Delhi. During the interview, Mapril stated
that immigrants who arrived in Portugal in the 1990s only began family reunification
processes in the 2000s (data from INE for 2001, based on country of birth, registered
around 93% males in 2001).
In 2006, data from SEF shows that this is mostly an adult population of working age.
Around 55% of legal residents from this origin are 25 to 39 years old. The former
Consul indicated that at the time of arrival most Bangladeshis were aged between 20
and 30 years.
14 Researcher on the Bangladeshi immigrants in Lisbon, interviewed for the scoping study.
928892
0
100
200
300
400
500
600
700
800
900
1000
1992 1993 1994 1995 1996 1997 1998 1999 2000 2001 2002 2003 2004 2005 2006 2007 2008 2009 2010

23
Bangladeshi immigrants are Muslim and Bengali. Geographically, they originate from
multiple regions in Bangladesh: from urban districts such as Dhaka and Chittagong to
villages like Faridpur and Comilla. Other regions of origin identified by Mapril in
interviews with 70 Bangladeshi immigrants that reside in Lisbon include: Noakhali,
Sylhet, Rangpur, Chandpur, Khulna, Shatkira, Tangail and Gopalgong15. However,
Dhaka and Faridpur seem to be slightly more important than other regions of origin
(Mapril 2008: 87/88).
b. Evolution of the migratory flow and settlement
According to Mapril (2008: 111), the first Bangladeshi immigrant arrived in Portugal in
198616; in 1988 SEF’s statistics included only two Bangladeshi immigrants. The first
Bangladeshi immigrants that settled in Portugal seem to have ended up in the country
‘by chance’. Their objective upon leaving Bangladesh was to reach Europe, first, and
the Schengen area next. Only after the first pioneers settled in Portugal did immigrants
start aiming directly to Portugal as a destination country. Pioneers were mostly male
that were subsequently followed by an increasing number of women (Mapril 2008: 86),
but also by other family members and friends from the same region.
As for settlement patterns in the destination, in 2009, data from SEF shows that 58% of
documented Bangladeshi immigrants resided in the district17 of Lisbon, their main
destination. Mapril (2008: 125) highlights also the relevance of Costa da Caparica and
Setúbal (close to Lisbon, on the southern bank of river Tagus – 7% according to SEF) as
well as Faro (8%, SEF’s data) and Porto18, (12% SEF’s data) as settlement destinations
of Bangladeshi immigrants in Portugal.
Pioneer immigrants started working in Portugal in some of the most marginalised
segments of the labour market, as dustmen, construction painters, bricklayers, cooks or
peddlers. It is also not uncommon to see Bangladeshis working in businesses owned by
Indians, restaurants for example. With time, many Bangladeshis have set up their own
business (often small telecommunication, clothes or grocery shops and restaurants).
15 See Annex 4 – Map with main origins in Bangladesh 16 See Annex 5 with individual migration history of pioneer immigrant from Bangladesh. 17 This is an administrative unit which comprises 16 municipalities and an area of 2,797Km2. 18 The consulate of Bangladesh operated in this city until January 2010.

24
Mapril (2008:149) refers to the fact that 25% of shops in Martim Moniz and nearby
areas belong to five pioneer Bangladeshi immigrants in Lisbon. Bangladeshi immigrants
also trade in weekly fairs namely in the north (information from Mapril and the former
Consul of Bangladesh). The former Consul of Bangladesh referred to the fact that there
are connections between the kind of products sold in Portugal and the region of origin in
Bangladesh: for example, traders in leather products are usually from the Eastern part of
Bangladesh (Chittagong, for example) while those that sell textiles have contacts in the
regions where these are produced, which often coincide with their region of origin.
Women usually do not work and if they do so is in the family shop.
Pioneer immigrants have by and large assumed leading roles within the Bangladeshi
community thereby creating strong power differences between the more established
pioneers and the newly arrived immigrants. Mapril indicated in the interview that the
relationship established between the two is often characterised by tensions. Newly
arrived immigrants usually also start working in more marginalised occupations,
however, now they have the option of finding employment in one of their countrymen’s
shops (Mapril 2008: 125-126). In fact, pioneer immigrants frequently mediate the
process of insertion of new arrivals in Portuguese society and control access to work
and documentation, for example. Status differences result, for instance, in different
contributions to the mosque built by the Bangladeshis (for their community) which was
mostly financed by the more affluent pioneer immigrants.
Pioneer as well as subsequent Bangladeshi immigrants in southern Europe appear to
originate from a similar social class, namely the educated, English-speaking urban
middle class. Divisions within the ‘Bangladeshi community’ result mostly from i)
political membership/sympathy between the three most important political parties -
Awamis, B.N.P. or Jammati –, ii) the region of origin in Bangladesh (there are
numerous regional associations, the majority of a very small size, indeed, Mapril
identified a recent trend of businesses clustering in different parts of Lisbon on the basis
of regional origin in Bangladesh – a process which requires further research), iii) time
of arrival in Portugal (we have discussed the different status and power of pioneer
immigrants, who are usually older, versus subsequent migrants, mostly younger) and iv)
religious differences within Islam (but to a lesser extent than the former).

25
Important turning points in this flow that correspond to sudden increases coincide with
extraordinary regularisations carried out in Portugal, particularly in 1996 and 2001.
Certainly, this is also evident in the increases in the number of Bangladeshis registered
by the Consul in Portugal (see figure 5 above), but also, by the smaller numbers in
1992. Mapril highlights the importance of such processes in attracting Bangladeshi
immigrants to Portugal.
2. Policy Changes
According to Mapril (2008) migration from Bangladesh to Portugal is a result of
contemporary migration movements that have led Bangladeshis to explore new routes
of migration, outside traditional destinations. Moreover, it is part of a common
migratory flow to southern European countries, namely to Italy and Spain. Mapril’s
fieldwork has in fact revealed that a number of current Bangladeshi immigrants in
Portugal had had previous migratory experiences in the Middle East, Southeast Asia and
even Italy and Spain, before reaching Portugal. When tracing family histories of the
migrants found in Lisbon, the author identified changes that occurred in migratory
destinations of its members across generations, reflecting not only transformations in
the global economy and international labour market needs but also opportunities for
regularisation in different countries. Indeed, the latter were more pronounced in
southern Europe, in the last two decades, in comparison to northern Europe. A number
of Bangladeshi immigrants interviewed by Mapril (2008) revealed the role of the
regularisation process that took place in 2001 in attracting Bangladeshi immigrants to
the country. The constitution of the ‘Schengen’ area facilitated intra-European mobility
in such a way that Bangladeshi immigrants who reached one country within this area
could travel to others in search of work as well as opportunities for regularisation.
Mapril (2008: 110) refers to the fact that some Bangladeshi immigrants who worked in
other European countries obtained a permanence permit in Portugal and returned to the
country where they worked. They thereby guaranteed that in the instance they were
caught by the authorities they would be returned to Portugal rather than their country of
origin. Also the extraordinary regularisation process that took place in 1996 led to an
increase in the number of Bangladeshi nationals registered by SEF and by the consulate
of Bangladesh in Lisbon (Mapril 2008: 110). According to the same researcher the
regularisation of their immigration status is very much valued by Bangladeshi
immigrants.

26
3. Institutions
a. Transnational Links (Associations, Websites, Organizations)
Mapril’s (2008) research found several aspects of transnational living among
Bangladeshi immigrants in Lisbon. These include mobilisation for political participation
in Bangladesh. The author illustrates this, for example, through the party membership or
sympathies which are frequently maintained in Portugal - particularly towards Awamis,
B.N.P. or Jammatis. Such political activity results in differentiations within the
‘community’, whilst at the same time Bangladeshi immigrants negotiate political space
for their ‘community’ in Portugal. Members of Bangladeshi political parties visit
immigrant communities abroad, including Portugal, and attempt to mobilize support.
Migrant support is important in terms of financial resources, but also as a way of
influencing the voting options of families back home. There are also religious activities
involving both origin and destination countries (the author analyses the feast Qurban).
Immigrants also conduct celebrations of their home country in Portugal – for example,
the celebration of ‘Mother Language Day’, frequently with musicians that travel directly
from Bangladesh (information from the former Consul in Portugal).
Bangladeshis also maintain strong commercial relations with their country of origin;
they often import from Bangladesh and sell the products in their shops in Portugal. In
addition, at times they also import from other European countries (interview with the
former Consul).
Most Bangladeshis have family in other European countries: London, Brussels, Milan,
Genoa, Rome, Madrid and Switzerland with who they keep in close contact with.
Certainly, according to the former Consul of Bangladesh, there are strong links among
the Bangladeshi community in Europe.
b. Networks
Following the pioneers, social networks developed leading to the further immigration of
friends and family, namely of women and children whose number has increased in
recent years (Mapril 2008: 86). According to the former Consul, most immigrants
arrived in the country following the contacts of other Bangladeshis in Portugal. Mapril
also illustrates the importance of networks constituted by other Bangladeshis that reside
in Portugal and other European countries in the settlement processes of these

27
immigrants, particularly to find work, set up businesses or regularize their legal status
(Mapril 2008: 119-122). In what regards commercial activities, networks involving
other nationalities are also maintained and even stimulated, particularly with Chinese,
Pakistani, Portuguese and Ukrainian nationals (Mapril 2008: 156). The same researcher
maintains that access to vast social networks is a paramount source of resources for the
establishment of a business in Lisbon (Mapril 2008: 164-165).
c. Migration Industry (Travel Agents, Phone Cards, Airlines – map of the
corridor)
Migration was by and large facilitated by intermediaries paid to arrange the trip and
necessary documents. Wealthier immigrants travel by air, which is a long and expensive
journey due to the absence of direct flight connections between Portugal and
Bangladesh, others by land (there are rumours that Bangladeshi immigrants reach
Western Europe through Central Asia and Eastern Europe), or by boat from North
Africa, entering Europe through Italy. The former Consul of Bangladesh in Portugal
recalls that most immigrants either arrived in Portugal with Schengen visas for Belgium
or Italy (visas for Portugal were more difficult to obtain because Portugal does not have
a resident Embassy in Bangladesh, the closest is in New Delhi, implying a journey of 3
or 4 days) or directly from Moscow with flights from Aeroflot, which used to be the
cheapest way of travelling to Portugal by air. Travelling via Madrid was also common,
with Qatar Airlines (with a stopover in Doha or Dubai), followed by a bus journey to
Portugal. Still, at the present time, there are no direct flight connections between
Bangladesh and Portugal.
Contacts by telephone with the home country are also common. Portugal Telecom, the
largest national telecommunication company, recognizes the relevance of Bangladeshi
immigrants in Portugal and offers a phone card for calling Bangladesh - ‘PT Hello
Asia’, which allows calls to Bangladesh (and also India and Pakistan, and, at a higher
rate, to the Philippines and Indonesia). Mapril (2008:120) also confirms that there is a
variety of low-cost cards available for Bangladeshi immigrants that wish to call home.
Immigrants also use the internet to remain in contact with their home country through
programs such as ‘messenger’, yahoo and skype (Mapril 2008: 304). Furthermore,
immigrants also read Bangladeshi newspapers online and watch BBC News in Bengali
(information from the former Consul).

28
To visit Bangladesh, which may happen once or more times per year, immigrants
usually travel by air (Mapril 2008). The cheapest trip (around 500 Euros) was via
Madrid, which involved travelling by car or bus to Madrid and then on to Bangladesh
on a charter flight from Qatar Airlines, however, this was often a difficult journey with
a long stopover in Dubai/ Abu Dhabi. This route has now been cancelled. The fastest,
and more expensive, route was through London with British Airways, but similarly this
is no longer available. Currently, the option is to fly via the Middle East or on one of the
occasional flights from Frankfurt and Amsterdam to Dhaka.
4. Remittances
The Bangladeshi immigrants in Lisbon, interviewed by Mapril (2008: 304-05), send
remittances to Bangladesh regularly through friends that travel there or the Western
Union, usually 100 to 200 Euros at a time or goods: watches, cosmetics, perfumes,
laptops, clothes, toys, etc. Products obtained abroad are seen as status symbols and are
attributed more value. Bangladeshi immigrants also send DVDs, personal letters and
photographs that document their life abroad – particularly attractive/modern locations,
special occasions, etc (Mapril 2008: 306). Money is sent to the domestic unit of origin
(parents, with whom, in some cases, the wife of the migrant may also live) and is used
to: 1) support the education of younger siblings, 2) buy new properties, 3) set up
businesses, 4) buy and rent new houses and 5) build houses. These remittances
correspond to the expectation of the family that stayed in Bangladesh. Europe is seen as
a wealthy place and migrants are expected to share that wealth (Mapril 2008: 306).
The former Consul in Portugal referred to the fact that the Portuguese Bank Millenium
BCP opened a small branch in Bangladesh which facilitates the process of sending
remittances to the family there.
5. Recent Trends and Future
The flow is less intense today than it was in the 1990s and has mostly been constituted
by family reunification processes. Mapril contends that the flow is consolidating at a
slower pace. Nevertheless, the researcher believes that if new regularisation processes
take place in Portugal the inflow of immigrants might increase both directly from
Bangladesh and from other European countries where Bangladeshi immigrants are
irregular. A further trend includes both migration to other European countries and

29
circulation between different European countries, sustained by social networks made up
of Bangladeshi residents. The former Consul of Bangladesh in Portugal added that there
are signs of an increasing flow that is a result of information circulating amongst
Bangladeshis regarding the public construction projects planned by the current
Portuguese government (construction of an airport, TGV railway, new bridge and
highway). These will constitute a stimuli for the further immigration of Bangladeshis,
mostly from Europe, principally those who are ‘floating around’ in the EU, according to
the former Consul, but also directly from Bangladesh (in 2001, data from the Census
shows that this was a very important economic activity for Bangladeshi nationals that
resided in mainland Portugal, 44% were employed in this sector).
Immigrants that currently reside in Portugal do not have return projects and appear
settled in the country. The former Consul knows, nonetheless, of two Bangladeshis with
Portuguese passports who recently settled in Madrid. One opened a warehouse,
importing products from Bangladesh and distributing to Portugal and Spain.
6. Assessment
Expected Difficulty Level of the Research: Medium
Easier Aspects:
� Previous in-depth research among Bangladeshi immigrants in Lisbon
could facilitate some contacts.
� Most Bangladeshi immigrants are English speakers.
� Concentration in Lisbon would facilitate survey in this city.
More Difficult Aspects:
� Low number of immigrants from this origin which makes sampling
difficult.
� Since most immigrants are concentrated in one single city – Lisbon –
survey in the second city would be more complicated.
References
Mapril, J. (2008). 'Modernidade' do Sacrifício Qurban: Lugares e Circuitos entre Bangladeshis. Antropologia. Lisboa, Instituto de Ciências Sociais [tese de doutoramento].

30
Interviews
José Mapril (PhD) – researcher on the Bangladeshi immigrants in Portugal
Axel Wolter – former Consul of Bangladesh in Portugal (from 1985 until January
2010 – without replacement at the time of the interview)
India
1. THEMIS Theoretical Framework
a. Categories
The stock of Indian immigrants comprises the second largest group of immigrants of
Asian origin in Portugal (after China), on the basis of country of nationality. Data from
SEF recorded 5,782 Indian nationals in Portugal, in 2009. However, these figures,
which only register those Indian immigrants without Portuguese citizenship, ignore a
much larger population of Indian origin that holds Portuguese nationality, mostly as a
result of colonial links between Portugal and India (see policy changes below). In 2001,
the Report of the High Level Committee on Indian Diaspora19 indicates that the number
of persons from India in Portugal is around 70 thousand (including 65 thousand with
Portuguese nationality). At the same time, a percentage of more recent immigrants is
likely to be undocumented. In 2008, India appeared in 6th place in number of identified
undocumented immigrants (1.008 individuals) by SEF (SEF’s report for 2008) and in
2009, 320 Indian nationals were notified by SEF to abandon Portugal (SEF’s report for
2009).
This flow has shown an overall growing trend (see figure 6 below), according to official
statistics, and may be classified as ‘expanding’. However, interviewees from Hindu and
Sikh communities referred the recent occurrence of re-emigration to other European
countries combined with a reduction in the number of new arrivals as a result of the
economic crisis.
19 Report available online: http://www.indiandiaspora.nic.in/contents.htm on 28th April 2009.

31
The flow of persons of Indian origin has included students, professionals, civil servants,
political migrants - as a result of political instability due to the independence of
Mozambique - labour migration and some family reunification (more recent
immigrants).
Data from SEF indicates that this is mostly a male group (76% in 2009). However, on
the basis of country of birth there is a more balanced distribution of male and female
Indian immigrants. Men correspond to only 54% of the stock.
With regards to age, even though there is a noteworthy concentration in the age groups
25-29 and 30-34, the age concentration is more widespread than is the case for other
origins: around 63% of legal foreign residents in 2006 (SEF) are aged between 25 and
44.
In terms of religious and ethnic origins, the Indian group is very diverse and includes:
Catholics (mostly from Goa), Hindus (currently around 12 thousand according to the
interviewee from this community and from several castes, including: fudamia´, khania,
kori, suthar, lohana, vania, darji20), Muslims (Ismailis and Sunnis) and Sikhs (5 to 6
thousand according to the interviewee from the community). Geographical origins are
Goa, Gujarat (particularly from Daman and Diu – but most came to Portugal from
20 Pereira Bastos and Pereira Bastos 2005 : 82
Figure 6 - Evolution - stock of Indian nationals 1999-2008
0
20
40
60
80
100
120
1999 2000 2001 2002 2003 2004 2005 2006 2007 2008 2009
Source: SEF (by country of nationality)2009=100
Figure 7 - Evolution - stock of born in India resident in
Portugal 1981, 1991, 2001
Source: INE (Census data, by country of birth)
5400
5600
5800
6000
6200
6400
6600
6800
1981 1991 2001

32
Mozambique after the decolonisation of 1975), Punjab, Delhi and Jammu and
Caxemire21 (the last three constitute important regions of origin of Sikh immigrants).
b. Evolution of the migratory flow and settlement
The pioneer Indian immigrants in Portugal arrived before 1961 directly from the then
Portuguese territories of Goa, Daman and Diu. These were mostly students and
professionals. Following the annexation of the Portuguese territories by the Indian
Union, in 1961, a number of Indians also arrived in Portugal. This was a more
concentrated migratory flow (Malheiros 2008:146) and also more heterogeneous than
previous immigration (Narana Coissoró quoted by Pereira 200422). However, the largest
inflow arrived after the independence of Mozambique (and, to a lesser extent, Angola)
in 1975, where a large population of Indian origin (the majority from Gujarat and
Maharashtra) had settled (80% of the Hindus that reside in Portugal arrived during this
phase, according to the interviewee from the Hindu community). The third phase of
Indian immigration, according to Malheiros (2008: 147), occurred after the mid 1980s
and has been constituted not by the previous elites and political migrants but by labour
migrants, a large proportion of whom, in the case of Hindus, arrived directly from Diu
(Malheiros 2008:147) and also from other states such as Punjab (report of the High
Level Committee 2001). This third phase has been increasingly consolidated as a
migratory flow in which previous colonial links have been losing importance. One
percentage of this recent flow is constituted by Sikhs who began to arrive in Portugal
only in the early 1990s, both directly from India as well as from other European
countries where they resided (Pereira Bastos and Pereira Bastos 2006: 180).
In Portugal, Indians have mostly settled in Lisbon, its surrounding suburbs and Porto
(report of the High Level Committee on Indian Diaspora 2001: 148/49). Members of the
Sikh and Hindu communities also referred the Algarve as a location of residence.
Following the decolonization of Mozambique, Gujarati Hindus followed similar
economic strategies in Portugal to those they had applied in Mozambique (Pereira
Bastos and Pereira Bastos 2005: 82). Thus, “… men from Diu belonging to castes of
21 See Annex 6 – Map of main regions of origin in India. 22 Article available online: http://www.oi.acidi.gov.pt/modules.php?name=News&file=article&sid=279

33
masons (fudamia´, khania, kori ) and carpenters (suthar) soon became active in
construction, both in Portuguese firms and in firms owned by same-caste Indians; they
also invested in hawking (in street markets across the whole country), while Gujaratis of
lohana, vania, darji and other castes became active in traditional commerce, often in the
same branch as previously (mostly ready-to-wear and the sale and import of Far Eastern
products)” (Pereira Bastos and Pereira Bastos 2005: 82). Machado and Abranches
(2005) refer that Hindus, mainly from Mozambique and with Portuguese nationality, are
for the most part self-employed or small entrepreneurs in retailing and services. It is
also common that, when employed by others, they work for other Hindus in these
activities. In the survey analysed by the same authors, around 7% worked in
construction in 2004, down from 21% registered in the year after arrival in Portugal.
In Lisbon there is a strong concentration of retailers of Indian origin in the area
surrounding Martim Moniz, near the historical centre of the city. This process of
concentration began in the aftermath of the decolonization of Mozambique, mostly
between 1976 and 1980, with Ismailis trading in furniture and Hindu and other Muslim
traders wholesaling products such as toys, electronic devices, etc, imported from the Far
East (Malheiros 2008: 150). Around 1989, the presence of Indian traders in this area of
the city began to consolidate (Malheiros 2008: 150) and in subsequent years it has
become increasingly diverse, with a noteworthy increase in the number of Chinese
immigrants.
Many of those Gujarati Hindus whose activity extended to industry, banking or various
learned professions were also able to resume their previous occupations in Portugal
(Pereira Bastos and Pereira Bastos 2005: 82).
Thus, a large proportion of Indian immigrants, in particular those that arrived from
Mozambique, constitute well integrated prosperous business communities. Gujarati
Hindus are in the most part active in the wholesale and retail sector, as mentioned
previously, and Ismailis, the most affluent group, in hotels and other tourism related
activities (report of the High Level Committee 2001: 149). Goans are more assimilated
into mainstream Portuguese society, with a high level of participation in the civil
service, for example. A high percentage of Sikhs (80%) work in construction and are
mostly workers (employed by Portuguese, Hindus and Africans), whilst Hindus are also
34
subcontractors. Sikhs also work in retail and catering, owning small shops or restaurants
(interview with member of the Sikh community and GEITONIES survey).
2. Policy Changes
The largest inflow of immigrants of Indian origin to Portugal followed the
independence of Mozambique in 1975 and was mostly concentrated in the first half of
the 1980s. This former Portuguese colony in East Africa had a large Indian population
from Goa - who had settled in Mozambique as civil servants in the public
administration, following the annexation of Goa by the Indian state in 1961 – as well as
Gujarati traders from the ex-Portuguese colonies of Daman and Diu23. Following the
change in the legal framework that regulated the entitlement to Portuguese nationality in
1975 (Decree-Law 308-A/75 of 24th June), citizens from the former Portuguese
territories in India who were residing in the ex- colonies in Africa were allowed to keep
Portuguese nationality if they wished.
Recent immigrants from India appear to have benefited from the regularisation process
following the change of legislation in 2001 (see Introduction for more details), which
increased the number of regular immigrants from this origin in the country. Indeed, the
interviewee from the Sikh community pointed to the fact that Portugal was attractive
due to the existence of regularisation opportunities and the inflow of these immigrants
was high during regularisation periods. However, in 2005, a percentage of these
immigrants had failed to renew their permanence permit or had left the country.
Nonetheless, the number of immigrants from this country has continued to increase.
3. Institutions
a. Transnational Links (Associations, Websites, Organizations)
There are over twenty associations of immigrants of Indian origin, formed on the basis
of either regional or communal lines (ibid.). Indian immigrants, especially the more
established, maintain a strong involvement with the Indian Diaspora and the Indian
state. The report of the High Level Committee states that “The community responded
spontaneously whenever there has been a national calamity in India like the recent
earthquake in Gujarat.” (2001: 149). Other examples of involvement include
23 See Report of the High Level Committee On Indian Diaspora 2001.

35
contributions following the floods in Mozambique and the organization of blood
donation camps by the Hindu community. Pereira Bastos and Pereira Bastos (2005: 83)
indicate that “Ties with the place of origin (Diu and some villages in Gujarat) are
maintained and Mozambique continues to be a significant satellite in the transnational
organisation of the Hindus established in Portugal.”
Indian immigrants in Portugal, mainly from Gujarat, maintain strong connections to the
community spread worldwide, but in particular with those that settled in the United
Kingdom, and more specifically in London. This connection includes the exchange of
information about opportunities that arise there, trade and matrimonial relations.
Furthermore, it is facilitated by the intra-European mobility that those who have
Portuguese citizenship have right to (Malheiros 2008: 148; Pereira Bastos and Pereira
Bastos 2005:83). In fact, transnational modes of life date back to the colonial times and
the settlement of Indians in Mozambique. In the words of Pereira Bastos and Pereira
Bastos (2005:82): “Mozambican Hindus also belonged to a polynuclear spatial
organisation. The networks they maintained allowed the circulation of people, material
goods, capital, information, etc. between their regions and groups of origin in Gujarat
and Diu on the one hand, and the various groups of Gujarati Hindus settled in the
British colonies of East and South Africa on the other. Indo-Portuguese Hindus
gradually established small satellite communities in Uganda, Kenya, Tanzania and
Malawi.” Current relations with co-religionists currently residing in various areas of the
United Kingdom are indeed the result of previous ties with the Gujarati Hindus who
migrated from East Africa to the United Kingdom since the late 1960s (Pereira Bastos
and Pereira Bastos 2005: 83). Sunnis and Ismailis also maintain contacts with India,
Mozambique and other East African countries as well as with their respective
communities in other countries, particularly in the UK, Canada and United States
(Pereira Bastos and Pereira Bastos 2006: 172).
Business owners, retailers and wholesalers in particular, who comprise an important
proportion of Indian immigrants in Portugal, are also integrated in transnational
business networks through which they acquire the products that are sold in Portugal
(Malheiros 2008: 159).

36
The different Sikh communities spread out throughout the world keep in close contact
and support each other. The Gurdwara built recently in a municipality of the District of
Lisbon received financial contributions from Sikh communities in other countries.
According to the member of the Sikh community interviewed this kind of support is
very common.
b. Networks
The continuation of an immigration flow to Portugal, particularly in the case of the
Hindu community, has mostly resulted from social networks that link Portugal to India
and facilitate the immigration of family members. The interviewee from the Hindu
community emphasised that other Hindus usually do not choose Portugal as a
destination. Indeed, Portugal was only chosen because the Indian families that resided
in Mozambique became connected to Portugal’s culture and citizenship (interview with
representative of Hindu community).
Social networks of both Hindus and Sikhs in other European countries have facilitated
migration to those countries following the crisis in the construction sector, particularly
for holders of Portuguese nationality (interviews with representatives of both
communities).
c. Migration Industry (Travel Agents, Phone Cards, Airlines – map of the
corridor)
Sikhs have travelled to Portugal through other European countries (Germany, Belgium,
Italy or France), because of the absence of direct flights between India and Portugal.
Sometimes they stayed in those countries for one or two years before reaching Portugal
(interview with member of the community and also Sikh immigrants enquired for the
GEITONIES: one indicated that he had spent one year in Italy before coming to
Portugal and another had lived in Belgium and Germany and had short stays in
Luxemburg and Spain).
During the visit of the High Level Committee on the Indian Diaspora to Portugal in
2001 the Indian community requested direct flights between Portugal and India thereby
revealing their discontent with the necessity to travel through other European capitals

37
(report of the High Level Committee 2001: 151). Presently, none of India’s airlines flies
to Lisbon and TAP offers no flights to India.
Sikh immigrants may go to India on holidays for 2 or 3 months after the first two or
three years in Portugal but the members of the Sikh community usually do not visit the
country of origin regularly, in particular if the family is already in Portugal (interview
with member of the Sikh community). The majority of Hindus does not visit India
regularly but is possible that other contacts, through telephone and internet are
maintained with family members that reside there (interview with representative of the
Hindu community).
Portugal Telecom recognizes the relevance of Indian immigrants in Portugal and has
one phone card which enables phone calls to India: ‘PT Hello Asia’, which allows calls
to India (and also Bangladesh, Pakistan, Philippines and Indonesia).
4. Remittances
Data from the Bank of Portugal reveals a strong increase in remittances sent to India
from 2002 onwards. This increase is likely to reflect a raise in the number of recent
immigrants from India. On the contrary, older immigrants of Indian origin do not appear
to remit much.
Table 2 - Remittances sent to India from Portugal 1999-2009
1999 2000 2001 2002 2003 2004 2005 2006 2007 2008 2009
Remittances - India 88 32 186 1.196 1.689 1.733 1.585 4.536 5.563 6.644 7.057
Thousands Euros Source: Bank of Portugal; Information available on 08-07-2010
In 2001, the Indian community in Portugal requested the High Level Committee to
support the establishment of a branch of an Indian bank to facilitate remittances (report
of the High Level Committee 2001: 151).
The interviewee from the Sikh community indicated that immigrants usually send
remittances while the family (wife and children) is in the country of origin but stop
doing so after they join the immigrant in Portugal. This is because wages in Portugal are
low and employers sometimes are dishonest and do not pay the agreed wages.

38
5. Recent Trends and Future
Interviews with members of both the Hindu and Sikh communities indicated that
immigrants from their respective religious groups are not choosing Portugal as a
destination. This is because Portugal is unattractive at the moment, since both labour
and regularisation opportunities are scarce. In the case of Hindus, many have recently
left Portugal to work in other European countries (England, Germany, Belgium, the
Netherlands) following the crisis in the construction sector, whilst the flow of new
arrivals has been weak and involving mostly family members or resulting from
marriages. However, families tend to stay in Portugal. As for Sikhs, the interviewee
from the community indicated that those who have Portuguese nationality have also
sought work in other European countries. However, for the most part, the Sikh
community is well settled in Portugal and has no intention of returning to India (even
though the knowledge of the Portuguese language appears to be very limited).
6. Assessment
Expected Difficulty Level of the Research: Medium
Easier Aspects:
� Large enough to enable sampling
� Group sufficiently researched to enable the identification of ‘seeds’
More Difficult Aspects
� Language difficulties with more recent immigrants
� Difficulty to classify Portuguese of Indian origin as Indian
immigrants and approach them with this research framework
References
Machado, F. L. and M. Abranches (2005). "Caminhos limitados de integração social: trajectórias socioprofissionais de cabo-verdianos e hindus em Portugal." Sociologia, Problemas e Práticas 48: 67-89. Malheiros, J. (2008), “Comunidades de origem indiana na Área Metropolitana de Lisboa – iniciativas empresariais e estratégias sociais criativas na cidade”, in Oliveira, C. R. and Rath, Jan (org.), Revista Migrações - Número Temático Empreendedorismo Imigrante, Outubro 2008, n.º 3, Lisboa: ACIDI, pp. 139-164 High Level Committee on the Indian Diaspora (2001). Report.

39
Pereira Bastos, S. and J. G. Pereira Bastos (2006). Filhos Diferentes de Deuses Diferentes - Manejos da Religião em Processos de Inserção Social Diferenciada: Uma Abordagem Estrutural Dinâmica. Lisboa, ACIME. Pereira Bastos, S. and J. Pereira Bastos (2005). "'Our colonisers were better than yours': identity debates in greater London." Journal of Ethnic and Migration Studies 31(1): 79-98.
Interviews
Representative of the Ismaili Community – Aga Khan Development Network
Member of the Hindu Community in Portugal
Member of the Sikh Community in Portugal
Morocco
1. THEMIS Theoretical Framework
a. Categories
The migration flow of Moroccans to Portugal can be classified as ‘starter’, yet
expanding (see figure 8), as well as being a recent immigrant group. Indeed, in 1999,
SEF only recorded 336 individuals. It is still small, representing the second largest
group of other African origins (except PALOP countries24), after Senegal. However, the
dimension of the population recorded by SEF (1,933 in 2009) may be substantially
inferior to the real number of Moroccan immigrants in the country. There are estimates
that point to the presence of between 4 to 5 thousand Moroccan immigrants in Portugal
(Faria 2008). A Moroccan Professor interviewed (M. Zekri) estimates that the number is
between 3 and 4 thousand. In addition, some Moroccans are occasional immigrants,
mostly peddlers that come to Portugal from Spain or Italy (or other countries) during the
summer months. Economic immigrants do not stay in Portugal, according to the same
interviewee, because the wage level for a common worker is very low. Some leave the
country after their immigration status is regularised. In actual fact, in some cases
Portugal may serve as a refuge for some irregular immigrants when immigration
authorities are more aggressive in Spain, for example. However, this type of stay
usually only lasts a few weeks (M. Zekri). In 2008, Moroccans were the third 24 Cape Verde, Angola, Mozambique, Guinea-Bissau, St. Tome and Principe.

40
nationality in number of removals from the country (after Brazil and Ukraine, the two
most numerous immigrant groups) by SEF, with 56 recorded cases. This reinforces the
possibility of, at least occasional, irregular immigration from this country to Portugal
(in 2009, Morocco was not amongst the most numerous removals).
The flow from Morocco is mostly labour migration with some family reunification.
The group is comprised of a large proportion of men, namely 63% in 2009 (SEF); data
from INE on the basis of country of birth registered around 62% males in 2001.
Data from the former source for 2006 shows that this is by and large an adult population
of working age, with around 62% of the population aged between 25 and 39 years old.
In terms of religious background and ethnic origin this is by and large Muslim.
Moroccans have arrived from different parts of the country: fishermen from Doukhala25,
agriculture workers from Kenitra and other immigrants from Casablanca, Agadir, Al
Jadida, Ourzazate, Meknes, Tánger and Ouxda.
b. Evolution of the migratory flow and settlement
The pioneers of the Moroccan flow to Portugal arrived in the country in the 1980s
(Faria 2008). On the one hand, there was an urban elite made up of employees in
Portuguese-Moroccan firms and, on the other, peddlers that entered through Galicia to
the north of Portugal (see for example Cabral 2003 and 2007). Still, in the region of
Porto today, Moroccans are usually peddlers. Some traders have shops whilst others sell
25 See Annex 7 – Main regions of origin in Morocco (note that the capital of Doukhala-Abda is Safi).
Figure 8 - Evolution - stock of Moroccan nationals 1999-2008
0
20
40
60
80
100
120
140
1999 2000 2001 2002 2003 2004 2005 2006 2007 2008 2009
Source: SEF (by country of nationality)2009=100
Figure 9 - Evolution - stock of born in Morocco resident in
Portugal 1981, 1991, 2001
Source: INE (Census data, by country of birth)
0
200
400
600
800
1000
1200
1400
1600
1981 1991 2001

41
crafts in fairs throughout the country (M. Zekri). Data from the 2001 Census showed
that retail trade was the most important economic activity for Moroccan nationals in
mainland Portugal (38%). Before the entry of Portugal into the EEC bilateral fishing
agreements between Portugal and Morocco also brought a number of Moroccan workers
to Portugal, mostly to the Algarve, to Fuzeta and Olhão in particular, but also some to
the region of Sesimbra and further north. These were men with different occupations in
the fishing industry, including qualified technicians, who in some cases also brought
their families26. At this time, men spent a lot of their time on the fishing boats (M.
Zekri). It was only at the end of the 1980s/early 1990s that the fishermen who remained
in the country after the end of the fishing agreements between the Portuguese and
Moroccan governments, initiated a more permanent residency in the country27.
The first Moroccan women with independent migratory projects arrived from the region
of Kenitra within the framework of collective hiring schemes to work in agriculture in
the south of Portugal (1992 and 1996). After their settlement, both these groups of
fishermen and rural workers began to bring their families to the country (Faria 2008).
Zekri made reference to the fact that Moroccan immigrants working in agriculture,
mainly women often with previous experience in the sector, are often hired by Spanish
entrepreneurs. In some cases they were brought directly from Morocco where the
employer had previous investments, also in agriculture, in others they are seasonal
workers who migrated individually through network mechanisms.
In 2001, the attribution of permanence permits to a high number of irregular Moroccan
immigrants represents a diversification of regions of origin, as well as of economic
activities and regions of settlement in Portugal. The regions of origin include
Casablanca, Agadir, Al Jadida, Ourzazate, Meknes, Tánger and Ouxda. Concerning
employment Moroccan immigrants may be found in a wide range of sectors such as:
26 Connections between Portugal (the region of the Algarve in particular) and Morocco related to the fishing industry date back to the 16th Century (Cavaco 1971: 44). In particular between the end of the 1st World War and 1965 a large number of persons from the Algarve (both men and women sometimes accompanied by children) migrated to Morocco to work in the fishing and canning industries, particularly in Casablanca, Rabat, Tangier, Kenitra, Larache, Punta Negra and Cap Spartel. These migrants were mostly from the Eastern part of Algarve - Sotavento – and were attracted by the better earning opportunities available in Morocco (Cavaco 1971). 27 Given the ongoing relations between both countries in the fishing activity – namely through the constitution of ‘mixed companies’- it is likely that a number of Moroccans still travel to Portugal within the framework of this activity.

42
construction28, tourism/catering and factory work. The settlement patterns in Portugal
have also changed from previous concentration in Faro, Lisboa/Setúbal and Porto to
greater geographical dispersal (Faria 2008). Nevertheless, in 2009, these were still the
most important areas of residence of Moroccan immigrants according to data from SEF.
Zekri maintained that in some cases immigrants know each other from the country of
origin; at times coming from the same city and sometimes even from the same
neighbourhood. Faria (2008) also contends that there is a high degree of internal
mobility within Europe, often the result of migrants taking advantage of social networks
comprised of Moroccan immigrants in other European countries (particularly in France,
Italy and Spain).
2. Policy Changes
In the extraordinary regularisation process that took place in 1996 it was already clear
that a number of irregular immigrants from Morocco were present in Portugal. These
were mostly peddlers from the northern regions of Beni Mellal, Khouribga, Agadir and
Settat that had arrived from Italy (Faria 2008).
Moroccan immigration to Portugal was firstly influenced by fishing agreements
between Portugal and Morocco (Faria 2008). The first agreement dates from 1976, the
“Acordo em Matéria de Pesca Marítima” and subsequently its cessation following the
entry of Portugal into the EEC in 1986, led to the more permanent settlement of
Moroccan immigrants in Portugal (Faria 2008). It is also as a result of collective hiring
agreements for agricultural work in the south of Portugal in 1992 and 1996 that the first
Moroccan women arrived alone to the country. Many of these women broke the
contracts that obliged them to return to Morocco and ended up staying in the country
(Faria 2008).
Moroccan immigrants appear to have also benefited from the regularisation process
following the change of legislation in 2001 (see the introduction for more details).
Indeed, following this, the number of regular immigrants from this country of origin
increased in Portugal. However, by 2005 a percentage of these immigrants had failed to
28 In 2001, data from the Census shows that 24% of Moroccan men residing in mainland Portugal worked in construction.

43
renew their permanence permit or had left the country. The number of Moroccans
increased slightly after 2005 and has been essentially stable thereafter.
3. Institutions
a. Transnational Links (Associations, Websites, Organizations)
In the case of the Moroccan peddlers mobility and transnational living is shaped by the
celebrations and markets that take place in different locations (Faria 2008).
Important Islamic celebrations take place in Portugal, including Ramadan, and
constitute an occasion to meet not only Moroccans but also other Muslims. These
celebrations and encounters are more related to religion than to nationality. Moroccans
have established cultural associations to gain access to spaces (made available by local
authorities) that are used as places of worship (Zekri).
There are a number of twinned cities in the Algarve and Morocco: Silves and
Marrakech, São Brás de Alportel and Ouezzane, Tavira and Kenitra, Albufeira and El
Jadida (the fomer Portuguese Mazagão) and Castro Marim and Safi (upcoming) (news
from Barlavento Online, on the occasion of the visit of the Moroccan Ambassador to the
Algarve in June 201029). As was briefly mentioned before there are historical links
between Morocco and the region of Algarve, namely as a result of previous migration
from this Portuguese region to Morocco (Cavaco 1971, Borjes 2000).
b. Networks
Social networks and information that circulates within these networks regarding job
opportunities in different countries, including Portugal, has been an important vehicle
for the constitution of Moroccan immigration to Portugal and mobility within Europe.
c. Migration Industry (Travel Agents, Phone Cards, Airlines – map of the
corridor)
Some Moroccan immigrants came to Portugal directly from Morocco, whilst others
arrived through other European countries, particularly in the case of traders, as was
mentioned before. There is also some empirical information that points to mobility of
29 Available online: http://www.barlavento.online.pt/index.php/noticia?id=42718 on 6th July 2010.

44
other Moroccans between Spain and Portugal – one immigrant enquired for the
GEITONIES project mentioned that he had arrived in Portugal through Spain to work in
construction – but further research is needed regarding this movement.
Royal Air Maroc operates in Portugal and has one contact line in the country. This
presence is more likely to be related to the flow of tourists from Portugal to Morocco
than to immigration from that country. There is, in fact, an official delegation of
Tourism of Morocco in Lisbon.
Portugal Telecom does not have specific phone cards to call Morocco due to the small
size of the population present in Portugal.
4. Remittances
Data from the Bank of Portugal (see table 3 below) shows an unclear growth pattern of
remittances sent to Morocco. However the volume increased between 2006 and 2009,
therefore appearing to be unaffected by the recent economic crisis. Furthermore, this
evolution is also consistent with the evolution of the stock of immigrants from this
origin recorded by SEF
Table 3 - Remittances sent to Morocco from Portugal 1999-2009
1999 2000 2001 2002 2003 2004 2005 2006 2007 2008 2009
Remittances - Morocco 2.186 1.625 1.401 1.842 2.517 2.883 3.480 2.546 2.957 3.412 3.523
Thousands Euros
Source: Bank of Portugal; Information available on: 08-07-2010
5. Recent Trends and Future
Zekri contends that there are some Moroccan entrepreneurs investing in the north of
Portugal in the textile sector and also in real estate due to lower prices than in Morocco.
Nevertheless, data from AICEP30 indicated that Moroccan investment in Portugal has
been very limited and in 2009 it was even non-existent. As for other developments it is
difficult to say given that the number of Moroccans is very low and patterns of
settlement recent. In Morocco, Zekri believes that migratory pressure has diminished as
a result of economic growth over the past 7 or 8 years under the present King Mohamed
VI and awareness programs carried out by civil society, also supported by the European 30 Ficha de Mercado de Marrocos from May 2010, available online: www.aicep.pt

45
Union, aimed at reducing emigration. The relationship of Morocco with the EU and its
advanced status is also likely to influence the development of outmigration.
6. Assessment
Expected Difficulty Level of the Research: Difficult
Easier Aspects:
� Previous research with Moroccan immigrants could facilitate some
contacts.
More Difficult Aspects:
� Small number of immigrants makes sampling difficult
� A large number of Moroccan immigrants are peddlers that are very
mobile and therefore hard to reach.
� Geographical dispersal in the country.
� Insufficient contacts to identify a reasonable number of ‘seeds’
References
Borjes, M. J. (2000). "Migration Systems in Southern Portugal: Regional and Transatlantic Circuits of Labor Migration in the Algarve (Eighteenth-Twentieth Centuries)." International Review of Social History 45: 171-208. Cabral, A., Ed. (2003). Imigração Marroquina. Porto, Edições Universidade Fernando Pessoa.
Cabral, A., Org.(2007), Marroquinos na Venda Ambulante, Porto: Edições Universidade Fernando Pessoa Cavaco, C. (1971). "Migrações internacionais de trabalhadores do Sotavento do Algarve." Finisterra 11: 41-83. Faria, R. G. (2008). "Identidades en tránsito: Portugal como nuevo país de inmigración marroquí." Revista de Estudios Internacionales Mediterráneos 6: 145-50.
Interviews
Professor M. Zekri, from Morocco, living and working in Portugal
Contact with Rita Gomes Faria – by e-mail

46
Egypt
1. THEMIS Theoretical Framework
a. Categories
The status of the migration flow from Egypt to Portugal can be characterised as
‘starter’, with only 57 persons registered in 1999, and an unclear pattern of growth.
After experiencing high growth in 2001, and a decline after 2004, there was an apparent
recovery in 2008 (see figure 10). It constitutes a very small immigrant group: SEF
indicates that there were 394 Egyptian nationals present in the country in 2009 and the
equivalent estimate by the Egyptian Embassy in Lisbon is around 800 persons. The
latter number includes some who, according to the Consul, do not reside permanently
in Portugal. Egyptians tend to exercise the right to free movement within the European
Union and work in other countries. The types of activities they engage in include
contract based work (technicians, freelancers), on a case by case basis and business
relations with other European countries. For instance, there are traders in Portugal that
have business relations with countries like Spain and France. Egyptian immigrants also
have basis in other countries.
Egyptian immigrants are mostly traders, professionals (university professors, bank
officers, according to the Consul at the Embassy in Lisbon) as well as construction
workers (data from Census 2001) and almost exclusively male, precisely 84% in 2009,
according to data from SEF.
Figure 10 - Evolution - stock of Egyptian nationals 1999-2008
0
50
100
150
200
250
1999 2000 2001 2002 2003 2004 2005 2006 2007 2008 2009
Source: SEF (by country of nationality)2009=100
Figure 11 - Evolution - stock of born in Egypt 1981, 1991, 2001
Source: INE (Census data, by country of birth)
0
20
40
60
80
100
120
1981 1991 2001

47
In 2006, data from SEF shows that this is predominantly an adult population of working
age. Around 58% of legal residents from this origin are aged between 25 to 39.
In terms of the religious and ethnic origins of this small immigrant group, they are
mostly either Muslims or Copts (Christian). Geographically, Egyptians are original
from diverse regions in Egypt, including rural and urban backgrounds, however, the
majority are from Greater Cairo (interview at the Embassy).
b. Evolution of the migratory flow and settlement
Until 2000 the number of Egyptians residing in Portugal was extremely reduced – 63
Egyptian nationals registered with SEF in 2000 and 102 persons born in Egypt
according to the 2001 Census. Among these are university professors in Évora and
Lisbon who have been in Portugal most of their lives and whose migration to Portugal
was probably the result of scholarships obtained (interview at the Embassy). The most
important increase in the number of Egyptian immigrants registered by Portuguese
authorities was in 2001, following the extraordinary regularisation process mentioned
before.
Currently, Egyptian immigrants are of diverse socio-economic backgrounds and include
the upper, lower and middle classes. Usually migrants are single men, most of them in
their youth. The majority have settled in Lisbon (60% in 2009, according to SEF),
though there are Egyptian immigrants also in Évora, the Algarve and Porto, related with
the fact that business opportunities in the north are thought to be better. They work in
hotels, travel agents, indeed, there are 2 or 3 travel agents owned by Egyptians, tour
operators or as traders of Egyptian crafts and bank clerks (interview at the Embassy).
Data from the Census of 2001, indicates that construction, hotel and catering and public
administration were the most important sectors for immigrants with this nationality in
mainland Portugal.
Some of the traders were based in other European countries and decided to move to
Portugal attracted by prospects of better work opportunities generated by tourism. There
is a dimension of chain migration as traders tend to attract more traders and assistants.
These usually start coming on a case to case basis, to participate in trade fairs or other

48
events of limited duration and then start to establish business ties, visits are repeated,
and the process of establishing residence started (interview at the Embassy).
According to the Consul, there is no problem of undocumented migration from Egypt; it
is only on a limited basis that the Embassy receives notification from the airport in
Lisbon that some Egyptians were returned to the country of origin. The Consul has been
in Portugal for 2 years and has only received 2 or 3 such notifications about Egyptians
coming to Portugal without a visa.
2. Policy Changes
Impressions and attitudes related to Portuguese immigration policies transmitted by
Egyptian immigrants as well as the Embassy in Lisbon appear to be positive, according
to the Consul. Egyptian immigrants reveal a preference for Portugal as far as
immigration policies go. The same source, based on his conversations with immigrants,
contends that as long as they are inside the EU the system in Portugal is more neutral
and offers more opportunities for legalization. However, he added that the work load of
immigration officers is very demanding; bureaucratic procedures take time and
processes of legalization or obtaining residence permits is not easy for immigrants.
Indeed, to miss an appointment because a specific document is missing may cost the
immigrant 2 or 3 months in the legalization process (interview at the Embassy). As is
true with other recent immigrants, Egyptian immigrants also seem to have benefited
from the regularisation process following the change of legislation that took place in
2001 (see the Introduction for more details), which led to an increase in the number of
regular immigrants from this origin in the country. However, by 2005 a percentage of
these immigrants had failed to renew their permanence permit or had left the country.
The number of Egyptians increased slightly thereafter but has been well below the
numbers seen in the period between 2001 and 2004 (see figure below).
There may be also a cultural aspect: there is a general impression that the Portuguese
people are very civilized (the Consul maintained that this was not a policy statement).
The shared history between both countries also gives mutual respect. Otherwise,
Portugal is not very close to Egypt, unlike Italy for example, where there are more
Egyptian immigrants (interview at the Embassy).

49
Regarding work opportunities, it is common knowledge that there are not a great many
working opportunities in Portugal and when immigrants have jobs the returns are
limited. The Consul believes that this explains the small dimension of the flow from
Egypt to Portugal. However, in the case of trade it is a different situation altogether as
the immigrant is the decision-maker and there are links to other countries as well.
3. Institutions
a. Transnational Links (Associations, Websites, Organizations)
There are Egyptian traders in Lisbon who sell products (crafts) from Egypt and other
countries. These traders usually maintain intense business relations with other European
countries and travel within Europe (interview at the Embassy).
Egyptian immigrants in Portugal do not have an organized structure, though immigrants
get together and share feasts and rituals. Friday prayers at the mosque constitute a
common meeting place. There are also working relationships especially among traders.
These relationships involve both Muslims and Copts as well as immigrants from
different socio-economic backgrounds and more established immigrants as well as new
arrivals (interview at the Embassy).
b. Networks
As was mentioned before social networks involving traders are important both to foster
immigration and businesses.
c. Migration Industry (Travel Agents, Phone Cards, Airlines – map of the
corridor)
Egyptair operates in Portugal and has one contact line in the country. However, this is
most likely related to the flow of Portuguese tourists to Egypt. In fact, Portuguese travel
agencies offer a variety of travel packages to Egypt. Furthermore, Egyptian immigrants
tend to travel by air, according to the Consul.
Portugal Telecom has no specific phone cards available to call Egypt given the small
size of the group.

50
4. Remittances
According to the Consul, Egyptian immigrants probably do not remit much because of
lower earnings. Furthermore, support relations are from parents to sons and not the
other way around. Support of siblings may be more common, but still limited.
Data from the Bank of Portugal indeed shows that remittances to Egypt are very low
and with unclear patterns of evolution. The years 2004 and 2007 stand out as peak years
in terms of the volume of remittances sent to Egypt. These were also years when the
number of Egyptians registered by SEF was higher. However, between 2007 and 2009
the volume of remittances substantially decreased while the number of Egyptians
increased. This discrepancy may be related to an economic downturn with impacts on
the income received by immigrants.
Table 4 - Remittances sent to Egypt from Portugal 1999-2009
1999 2000 2001 2002 2003 2004 2005 2006 2007 2008 2009
Remittances – Egypt 4 342 350 134 478 692 413 193 530 337 264
Thousands Euros Source: Bank of Portugal; Information available on 08-07-2010
5. Recent Trends and Future
According to the Consul in Lisbon the future of the migration flow from Egypt to
Portugal is hard to predict. The Consul believes that as long as the factors that limit
migration now – such as language and distance - are in place no major changes in the
flow are to be expected.
6. Assessment
Expected Difficulty Level of the Research: Very Difficult
More Difficult Aspects:
� Very small immigrant group makes sampling almost impossible
� Difficult to find ‘seeds’
� Language barriers
� High mobility among a large proportion of Egyptian immigrants

51
Interviews
First Secretary acting as Consul at the Embassy of Egypt in Lisbon.
Brazil
1. THEMIS Theoretical Framework
a. Categories
The Brazilian population corresponds to the largest immigrant group, by country of
nationality, at present in Portugal, with 116,220 Brazilian nationals registered by SEF in
2009. The flow from Brazil to Portugal can be classified as ‘expanding’, according to
the pattern of evolution revealed by official statistics (see figure 12 below), although the
president of the House of Brazil in Lisbon contended that the flow has been growing at
a slower pace since 2007, as a result of the juxtaposition of economic growth in Brazil
with the economic crisis in Europe. Recent increases in official statistics (2007-2008
and 2008-2009) are most likely to be the result of regularisations of undocumented
immigrants that were already in the country.
Figure 12 - Evolution - stock of Brazilian nationals 1975-2009
Source: SEF (by country of nationality); INE, Demographic Statistics (by country of nationality) 2009=100
0
20
40
60
80
100
120
19
75
19
76
19
80
19
83
19
84
19
85
19
86
19
87
19
88
19
89
19
90
19
91
19
92
19
93
19
94
19
95
19
96
19
97
19
98
19
99
20
00
20
01
20
02
20
03
20
04
20
05
20
06
20
07
20
08
20
09

52
Figure 13 - Evolution - stock of born in Brazil resident in Portugal 1981, 1991, 2001
Source: INE (Census data, by country of birth)
This flow includes labour migration, students (mostly postgraduates), tourists, and an
economic elite.
This group has a female majority both when considering country of nationality, 55% in
2009 (SEF), and country of birth data. Census data from INE confirms that women have
corresponded to a larger proportion of the Brazilian stock in 1981, 1991 and 2001.
Research with Brazilian immigrants has shown that they are, on average, younger than
other immigrants (Casa do Brasil/Acime 2004). In 2006, data from SEF shows that
around 62% of the legal residents from Brazil are aged between 20 and 39 years old.
The ethnic background of Brazilians in Portugal is largely homogeneous and the main
religious affiliations include Catholics and Evangelicals. According to the president of
HBL, churches of these faiths have become an important source of association and
support for Brazilian immigrants in Portugal. Geographically, immigrants are
predominantly from the southwest of Brazil31 and nearby regions: mostly Minas Gerais
and Paraná, but also Espírito Santo, São Paulo and Goiás (Casa do Brasil/Acime 2004:
8)32.
31 See Annex 8 with main regions of origin in Brazil. 32 There is some empirical evidence pointing to internal migration in Brazil prior to international migration, usually rural-urban or small city-large city.
0
10000
20000
30000
40000
50000
60000
1981 1991 2001
Brazil

53
b. Evolution of the migratory flow and settlement
Brazilian immigration is rooted in the colonial links that connected the two countries in
the past33. Before the 1980s immigration from Brazil was not particularly significant
and was constituted mainly of political expats (interview with pioneer immigrant –
more details in Annex 9) some women and executives. During the 1980s the flow grew,
but was less intense in comparison with its growth during the 2000s and was constituted
mainly of skilled and highly skilled professionals (dentists, marketing and IT experts,
engineers, etc) who arrived in Portugal to work in their respective professions. These
immigrants, from diverse regions in Brazil, including Rio de Janeiro, Rio Grande do Sul
and Pernambuco, settled near Lisbon, in upper-middle and upper class neighbourhoods
in Cascais and Estoril and also in Porto and other northern regions following the origins
of their Portuguese ancestors who had migrated to Brazil. Indeed, an important part of
Brazilian pioneers were descendents of previous Portuguese emigrants in Brazil
(Malheiros 2007).
At the end of the 1990s a different kind of flow emerged, known as the ‘second wave of
Brazilian immigration’ (Casa do Brasil/Acime 2004), which was much more intense
than the previous wave. It is likely that immigration with the same characteristics of the
first wave was maintained with its small numbers. This ‘second wave’ included workers
mainly in low skilled occupations in the hotel and catering sector, construction and
domestic work. These immigrants were predominantly from the southwest of Brazil and
nearby regions: mostly Minas Gerais and Paraná, but also Espírito Santo, São Paulo and
Goiás (Casa do Brasil/Acime 2004: 8)34. They settled mostly in the Lisbon Metropolitan
Area - with concentrations in Costa da Caparica, Barreiro, Seixal, Setúbal, Amadora,
Queluz, Ericeira/Mafra, locations that differ from those where previous immigrants had
settled, and other smaller cities like Leiria. The president of HBL alluded to the fact that
patterns of geographical clustering on the basis of the region of origin exist in Portugal
due to the action of social networks, however, he was unable to elaborate. Immigrants
from the second wave may also be found in Lisbon and Cascais, where, according to the
same interviewee, there is a greater mix of Brazilian immigrants in socio-professional
terms and according to time of arrival in Portugal. In the Algarve there is also a
33 The first Portuguese arrived in Brazil in 1500 and the country gained independence in 1822. 34 There is some empirical evidence pointing to internal migration in Brazil prior to international migration, usually rural-urban or small city-large city.

54
significant number of Brazilians, particularly during the summer months, which,
according to the president of HBL, should result from greater seasonality of job offers
(data from SEF indicates that in 2009 Faro had the third largest concentration of
Brazilian nationals in Portugal). There is also some degree of internal mobility among
Brazilian immigrants; the said interviewee recalls having met one Brazilian that had
resided in 4 or 5 different Portuguese cities.
The character of ‘countercurrent’ of the previous wave was also attenuated in the
‘second wave’, where a smaller proportion was made up of descendents of Portuguese
emigrants in Brazil (HBL still has contact with such immigrants in Portugal who seek
their assistance to obtain Portuguese nationality). As a result, a smaller number settled
in the northern part of Portugal.
Unlike other flows which tend to be dominated by male pioneers, the flow from Brazil
has revealed a high percentage of independent women, who do not migrate within
family reunification schemes (Padilla 2007), in both waves. The numerical importance
of independent immigrant women is also revealed in the increase in mixed marriages
between Portuguese men and Brazilian women. Between 1996 and 2008 the number
rose from 122 to 2,613, corresponding to 67.8% of all marriages between Portuguese
men and foreign women that year (Demographic statistics, INE; Malheiros 2007:30).
Contrary to the case with pioneers from the ‘first wave’, the ‘second wave’ of Brazilian
immigration included a large proportion of undocumented migrants. In 2003, the survey
conducted by Casa do Brasil (Casa do Brasil/Acime 2004) revealed that the percentage
of irregular immigrants in the sample was 36%. As a result, the authors estimated that
the number of Brazilian immigrants in the country would be between 30 and 42%
higher than official figures indicated. Subsequent regularisation processes revealed that
indeed a large number of Brazilian immigrants had been undocumented in the country.
The interaction between immigrants from the first and second waves is limited and
indeed some immigrants from the first wave look down on immigrants from the second
and feel uncomfortable with the image that they brought from Brazil (interview at
HBL). This is the greatest division within the Brazilian group even though regional
differences and others may exist as well.

55
The inflow from Brazil also includes a number of students mostly at postgraduate level,
but there are also some exchange programs with Portuguese universities at the
undergraduate level.
2. Policy Changes
The economic crisis in Brazil during the 1980s and 1990s constituted a stimulus for
emigration, mostly to the United States but also to Europe and Portugal in particular.
The flow to Portugal is by and large the result of historical relations between the two
countries. Indeed, many pioneer immigrants followed the origins of their Portuguese
ancestors that had migrated to Brazil, as was mentioned before. Following Portugal’s
entry into the EEC in 1986 and the subsequent inflow of European funds a number of
economic opportunities were generated in the country attracting immigrants. According
to one pioneer immigrant interviewed, it was after Portugal joined the EEC that the
country began to appear in the media in Brazil and became attractive to both
entrepreneurs and potential migrants. During the 1990s Brazilian investment in Portugal
was also a vehicle for immigration (Peixoto e Figueiredo 2007).
The entrance of Brazilian immigrants was eased by a treaty between the two countries
that established equality of rights and duties between Portuguese and Brazilian citizens
(Pinho 2007). Nevertheless, during the 1990s Portugal tightened its border controls,
which even led to the repatriation of Brazilian nationals suspected of attempting to enter
the country as tourists to find employment (Pinho 2007). This treaty was revoked in
2000, but even today the fact that Brazilian citizens do not need to obtain tourist visas in
the country of origin (this visa is obtained at the border for a maximum of 90 days)
facilitates their entry into the country.
The recent immigrants from Brazil have benefited from changes in legislation involving
extraordinary regularisations (2001, 2004 and 2008) as well as from a specific
regularisation programme for Brazilian immigrants, known as the ‘Lula Agreement’
(2003), named after Brazil’s president Inácio Lula da Silva. Data from SEF shows sharp
increases in the number of Brazilian immigrants after these were put in place; in (2001
there was a 113.14% increase; 2003 and 2004 - joint 10.82% increase; 2008 and 2009 –
joint 70.12% increase).

56
The president of the HBL stresses that immigrants are not attracted to Portugal due to its
immigration policies or regularisation programmes. In fact, most immigrants arrive in
the country with the perspective of becoming irregular. Previous knowledge of
immigration policy before arrival is rare, at the most they know that it is difficult to
obtain ‘documents’. As long as there was work immigrants arrived from Brazil. The
flow was more intense at a time when regularisation possibilities were closed
(2002/2003) (interview at HBL). General knowledge regarding entitlements once they
have necessary documents to remain in Portugal legally is also sometimes limited.
Brazilian immigrants have been found in other European countries (namely in Belgium)
with Portuguese documents that do not entitle the immigrant to live and work in other
countries (interview at HBL).
More recently, the flow appears to have been affected by the economic crisis in Europe,
and Portugal in particular, as well as the current economic growth in Brazil. Both have
contributed to slow down the flow and increase the return of Brazilian immigrants.
Indeed, according to the president of the HBL, the program of voluntary return
conducted by IOM shows an increase in the number of Brazilian immigrants that return
to Brazil (interview at HBL).
3. Institutions
a. Transnational Links (Associations, Websites, Organizations)
The House of Brazil in Lisbon was established in the early stages of Brazilian
immigration by a small group of people with the intention of creating a meeting space
in Lisbon. Following the increase in Brazilian immigration the HBL grew to become an
institution offering support to the community. Apart from this association there are a
number of more or less organised smaller associations of Brazilian immigrants
throughout the country. HBL belongs to a platform of Brazilian associations in Europe
who exchange information regularly through the internet and organise meetings. HBL,
for example, maintains intense connections with Brazil and exerts pressure in defence of
the rights of Brazilian emigrants abroad. According to the interviewee from this
association, the current president, Lula da Silva has shown receptivity to the claims of
Brazilian emigrants and has welcomed the organisation of two conferences in Rio de
Janeiro to debate their issues. There is also the possibility of the creation of a world

57
council of Brazilian emigrants. These forums of representation are fundamental because
Brazilian emigrants do not elect their own representatives in the parliament.
Individually, Brazilian immigrants in Portugal are not involved, for the most part, in
transnational organisations or business activities.
b. Networks
Social networks have played an essential role in the constitution and sustenance of this
flow, but some organised and business oriented mediators have also been involved
(Peixoto et al 2005). The survey conducted in 2003 indicated that 78% of respondents
had relied on the support of friends and family to migrate to Portugal (Casa do
Brasil/Acime 2004: 9).
The web based social network Orkut is very popular among Brazilians worldwide and is
also used by Brazilians that reside in Portugal. However the average Brazilian
immigrant, according to the president of HBL, does not use the internet much due to a
lack of access. More recently the use of internet has increased as potential migrants seek
information about migration opportunities, although some negative and misleading
information can be found online as well (interview at HBL).
c. Migration Industry (Travel Agents, Phone Cards, Airlines – map of the
corridor)
Brazil is one of the most important destinations of TAP – the Portuguese national airline
– with 49 weekly direct flights to this country (information on www.tap.pt). TAP is the
leading European airline operating in this country (according to the airline’s report for
2008). However, according to the president of HBL most immigrants travel to Brazil
through other European cities where airlines offer cheaper flights. A route through
Madrid is popular for both arrivals and departures (and also France). Migrants usually
arrange their travels through travel agents. However, it is not uncommon that
immigrants from the second wave stay in Portugal for a number of years (4 or 5)
without travelling to Brazil. This may be due to a lack of savings for such a trip or from
the expectation that they will return for good after a short time. Most immigrants from
the second wave see their migratory project as temporary even though a large
proportion of those that arrived in the early 2000s are still in the country (interview at

58
HBL). Nevertheless, when immigrants do travel to Brazil they usually stay for long
periods of time. Irregular immigrants mostly do not travel. On the contrary, immigrants
from the first wave travel to Brazil regularly (interview at HBL).
Portugal Telecom, the largest national telecommunication company, recognizes the
relevance of Brazilian immigrants in Portugal and has two phone cards for calls to
Brazil: Easy Talk’ (allows phone calls to Brazil but also to Ukraine, Russia and a
number of European countries); PT Hello Brazil’ (for Brazilian immigrants; their
families in Brazil and Portuguese travelling in Brazil).
4. Remittances
Data from the Bank of Portugal reveals a sharp increase in the amount of remittances to
Brazil between 1999 and 2006 that reflects the considerable rise in the number of
Brazilian immigrants in Portugal during these years. While in 1999 the amount of
remittances was around 8 million Euros, in 2006 the value had risen to around 349
million (see table 5 below). However, during the last year the volume of remittances
declined, both from Portugal and worldwide. Remittances to Brazil, globally, have
registered a 34% reduction according to the Inter-American Development Bank. This
evolution is probably related to the economic crisis and/or also to some return migration
given the current economic growth in Brazil.
Table 5 - Remittances sent to Brazil from Portugal 1999-2009
1999 2000 2001 2002 2003 2004 2005 2006 2007 2008 2009
Remittances - Brazil 8.061 33.792 52.661 87.003 168.984 216.468 267.587 348.664 311.835 331.713 309.961
Thousands Euros Source: Bank of Portugal; Information available on 08-07-2010
Rossi (2007) conducted a survey, in 2004, with 400 Brazilian clients of the Bank of
Brazil in Portugal (92% had arrived in the preceding 5 years) and discovered that a high
percentage sent regular remittances to Brazil, more specifically 86% declared to send
one or more times per month. The main reasons of the surveyed immigrants to remit
were: to help the family (58%), save (28.9%) and pay debts (9.2%) (Rossi 2007: 146).
Also the survey conducted by Casa do Brasil in 2003 revealed that a high number of
Brazilians send remittances: 61.8%. According to the president of HBL, remittances are
mostly sent by immigrants from the ‘second wave’, to parents back home. Usually

59
husbands and wives do not stay in Brazil because family reunification tends to occur
quite rapidly.
The president of HBL believes that formal channels are preferred by Brazilian
immigrants. One of the largest Portuguese banks – Millenium BCP – established an
agreement with Caixa Económica Federal do Brasil in 2008 to offer advantages to
Brazilian immigrants that open an account in this bank. Another major Portuguese bank
– Banco Espírito Santo – developed the service BESXpress to facilitate bank transfers
to Brazil (as well as to Ukraine and Moldova) through an agreement with the Brazilian
institution Bradesco (Dias et al 2009: 90). Also the Bank of Brazil, through its office in
Portugal, developed a product named ‘BBRemessa’ (‘BBRemittance’) specifically for
Brazilian immigrants that reside in Portugal. For its clients, the first remittances of the
month are free of charge and there are a range of instruments aimed to facilitate bank
transfers to Brazil (Dias et al 2009: 91). In 2004, the Bank of Brazil had 21,704
registered Brazilian clients in one of its remittance services. Of these, 13,755 had sent
money during the first 4 months of 2004. Each client sent, on average, 1158 Euros in
this period. The average monthly amount of remittances per individual was 289 Euros
(Rossi 2007: 144).
5. Recent Trends and Future
According to Carneiro et al (2007) the inflow of Brazilian immigrants is likely to
continue and will include an important component of family reunification, but also
return flows will be more intense and re-emigration to other countries is also probable.
The second wave of Brazilian immigration to Portugal seems to be connected to flows
to other European countries, which suggests the occurrence of intra-European mobility
of Brazilian immigrants after they reach one European country. For example, Schiltz
(2007) illustrates in her MA thesis the flow of Brazilian immigrants between Portugal
and Luxembourg. There is also empirical evidence (Bógus 2007: 39) of the connection
of Brazilian immigrants to both Portugal and Italy (a number of Brazilians are
descendents of Italians and therefore entitled to obtain Italian citizenship). Also the
president of HBL referred to the fact that a number of Brazilians had migrated to Spain
and many to England. In face of the recent economic crisis and high unemployment in
Spain the flow has stopped and some Brazilians are even returning to Portugal while
migration to England is still maintained.

60
Improvements in the economic situation in Brazil, together with an appreciation of the
Brazilian currency against the Euro and the maintenance of economic stagnation or
weak growth in Portugal will probably weaken the intensity of the flow. More
restrictive migration regulations in Brazil (as the example in Governador Valares) as
well as in Portugal might also contribute to weakened flows and irregular migration
(Carneiro et al 2007: 191-92). The president of the HBL indicates that this change is
already in place and likely to continue if the economic and political context in both
countries of origin and destination are maintained.
6. Assessment
Expected Difficulty Level of the Research: Easy
Easier Aspects:
� Very large group would make sampling easy
� Easy to find a reasonable number of ‘seeds’
� Common language
� Geographical concentration in specific areas
References
Bógus, L. (2007). Esperança Além-Mar: Portugal no “arquipélago migratório” brasileiro. Imigração Brasileira em Portugal. J. M. Malheiros. Lisboa, ACIDI: 39-58. Carneiro, R., F. Cristovão, et al. (2007). O futuro da imigração brasileira para Portugal: olhares, perspectivas e interrogações. Imigração Brasileira em Portugal. J. M. Malheiros. Lisboa, ACIDI. Casa do Brasil/ACIME (2004). A '2ª vaga' de imigração brasileira para Portugal (1998-2003): Estudo de opinião a imigrantes residentes nos distritos de Lisboa e Setúbal. Lisboa, ACIME/ Casa do Brasil. Dias, B., E. Silva, et al. (2009). Acesso dos imigrantes aos serviços bancários em Portugal. Lisboa, ACIDI. Malheiros, J. M., Org. (2007). Imigração brasileira em Portugal. Lisboa, ACIDI. Malheiros, J. M. (2007). Os brasileiros em Portugal – a síntese do que sabemos. Imigração brasileira em Portugal. J. M. Malheiros (org.). Lisboa, ACIDI: 11-38. Padilla, B. (2007). Acordos bilaterais e legalização: o impacte na integração dos imigrantes brasileiros em Portugal Imigração brasileira em Portugal. J. M. Malheiros. Lisboa, ACIDI: 217-223

61
Peixoto, J., A. G. Soares, et al. (2005). O Tráfico de Migrantes em Portugal: Perspectivas Sociológicas, Jurídicas e Políticas. Lisboa, ACIME. Peixoto, J. e A. Figueiredo (2007). Imigrantes brasileiros e mercado de trabalho em Portugal. Imigração brasileira em Portugal. J. M. Malheiros. Lisboa, ACIDI: 87-112. Pinho, F. (2007). A imprensa na construção do processo migratório: a constituição de Portugal como destino plausível da emigração brasileira. Imigração Brasileira em Portugal. J. M. Malheiros (org.). Lisboa, ACIDI: 59-86. Rossi, P. (2007). Remessas de imigrantes: estudo de caso de brasileiros em Portugal. Imigração Brasileira em Portugal. J. M. Malheiros. Lisboa, ACIDI: 135-153. Schiltz A. (2007). Ruptures et continuités d’un champ migratoire. Analyse de l’immigration brésilienne au Luxembourg. (tese de mestrado)
Interviews
President of the House of Brazil in Lisbon (HBL)
Pioneer Immigrant
Concluding Remarks
The countries of origin analyzed, mostly with data based on country of nationality but
taking into account information on countries of birth, represent diverse trajectories and
stages, that reflect the history of Portugal as a country of immigration. The majority are
recent countries of origin of immigrants in Portugal – Ukraine, Bangladesh, Morocco
and Egypt – while the other two – India and Brazil – constitute older regions of origin
as a result of Portugal’s colonial past. Based on the proposed theoretical framework for
THEMIS we identified three ‘starters’: Bangladesh, Morocco and Egypt. The immigrant
stock from all three countries registered a significant increase during 2001, followed by
a decline evident in 2005 and signs of slower growth thereafter. The stock of
immigrants from both Bangladesh and Morocco is estimated to be between 1 thousand
and 5 thousand (slightly higher in the case of Morocco) while the stock from Egypt is
less than 1 thousand (which would make a study based on a quantitative approach
difficult to implement). We have also identified two ‘expanding’ origins: Brazil and
India. Albeit, at different rates. The flow from Brazil has been substantially more
intense and growing more rapidly than that of India. Additionally, immigration from

62
Brazil corresponds to a contemporary migration flow, shaped by current contingencies
and potentials and substantially understudied, where we believe there is significant
leeway for important theoretical contributions. On the contrary, immigration from India
is a historical migration flow, for the most part inscribed in colonial and postcolonial
relations, that has been considerably studied. Ukraine constitutes an interesting case,
also in face of the present context, that may be currently classified as
‘declining/stagnating’. However this flow went through a very rapid transformation -
from a short period of very intense growth to decline/stagnation in only a few years -
which is combined with uncertainty regarding the potential for future growth.
Furthermore, the empirical information gathered also puts in evidence the centrality of
intra-European mobility for immigrants from third countries. This should, therefore, be
taken into account in our theoretical framework.

63
Annex 1 – Summary Table – Evolution Stock foreign nationals 1999-
2009
Source: SEF
1999 2000 2001 2002 2003 2004 2005 2006 2007 2008 2009
Brazil 20.851 22.202 47.321 60.034 64.428 66.681 63.608 65.463 66.354 106.704 116.220Ukraine 123 163 45.829 62.448 65.220 66.281 43.849 37.851 39.480 52.472 52.293Morocco 336 439 1.588 2.020 2.177 2.273 1.544 1.704 1.871 1.870 1.933Bangladesh 128 171 1.069 1.312 1.390 1.441 1.063 1.030 1.180 1.577 1.346Egypt 57 63 668 743 776 783 251 278 351 409 394India 1.211 1.290 4.123 4.841 4.997 5.075 3.665 3.614 4.104 5.519 5.782

64
Annex 2 – Map with Main Regions of Origin in Ukraine
Source: http://www.geographicguide.net/europe/maps-europe/maps/ukraine-map.jpg

65
Annex 3 – Individual Migration History from Ukraine
Migration History of a Ukrainian couple (Bogdan and Halyna) - from a collection of
life histories by Santos 2004: migration to Portugal in 2001, following a recent trend in
Ukrainian emigration that had Portugal as its destination.
Both were Paediatricians in Ukraine and worked in Chervonograd. Following the severe
economic crisis of early 2000 the couple decided to emigrate. A friend told them of a
friend that had settled in Portugal a few years before. The information communicated to
them about Portugal was that wages were higher, medical doctors were needed and
regularisation was easier than in other countries. They obtained a visa for the Schengen
area through an ‘agency’ and, in 2001, travelled to Portugal by bus. The husband
(Bogdan) was the first to arrive and his wife (Halyna) followed a few months later. The
first destination of the couple was a village in the southern part of Portugal, in Alentejo,
near Évora. The friend of their friend helped Bogdan to find a job and settle in Portugal.
He started working as a construction janitor. He had a working contract that enabled his
regularisation in the process carried out in 2001. Halyna was hired as a live-in domestic
worker in the house of her husband’s employer. They worked there for 2 years without
complaints. At the end of 2002 the couple heard about the program initiated by the
Gulbenkian Foundation aimed at the recognition of previous qualifications of immigrant
medical doctors, they applied and were accepted. At the time of the interview the couple
was preparing for the exam and waiting for the arrival of their daughter who had stayed
in Ukraine. From the initial two years the couple now plans to stay at least ten years in
Portugal (Santos 2004).

66
Annex 4 – Map with Main Regions of Origin in Bangladesh
Source: http://greenspotbd.org/gso/Portals/0/BangladeshMap.gif

67
Annex 5 – Individual Migration History from Bangladesh
Migration History of Pioneer ‘Immigrant’: Arrived in Portugal in the 1980s
(information transmitted by the former Consul of Bangladesh in Portugal). R. had been
hired by a Bangladeshi textile company to come to Portugal to establish business
contacts. Portugal made an impression on him to the extent that he decided to return to
Bangladesh to terminate his job contract and return to Portugal. He is currently an
established Bangladeshi holding a Portuguese passport. In employment terms, he runs a
copy shop and an internet café. He is one of the leaders of the Bangladeshi community
in Portugal and is often asked to mediate between Bangladeshis and Portuguese public
services.

68
Annex 6 – Map with Main Regions of Origin in India
Source: http://jihaan.hpcl.co.in/booking/MapLocator/images/map-india.gif

69
Annex 7 – Map with Main Regions of Origin in Morocco
Source: www.geographicguide.net/africa/images/morocco-map.gif

70
Annex 8 – Map with Main Regions of Origin in Brazil
Source: www.brazil-travel-northeast.com/images/map_brazil_by_state.gif
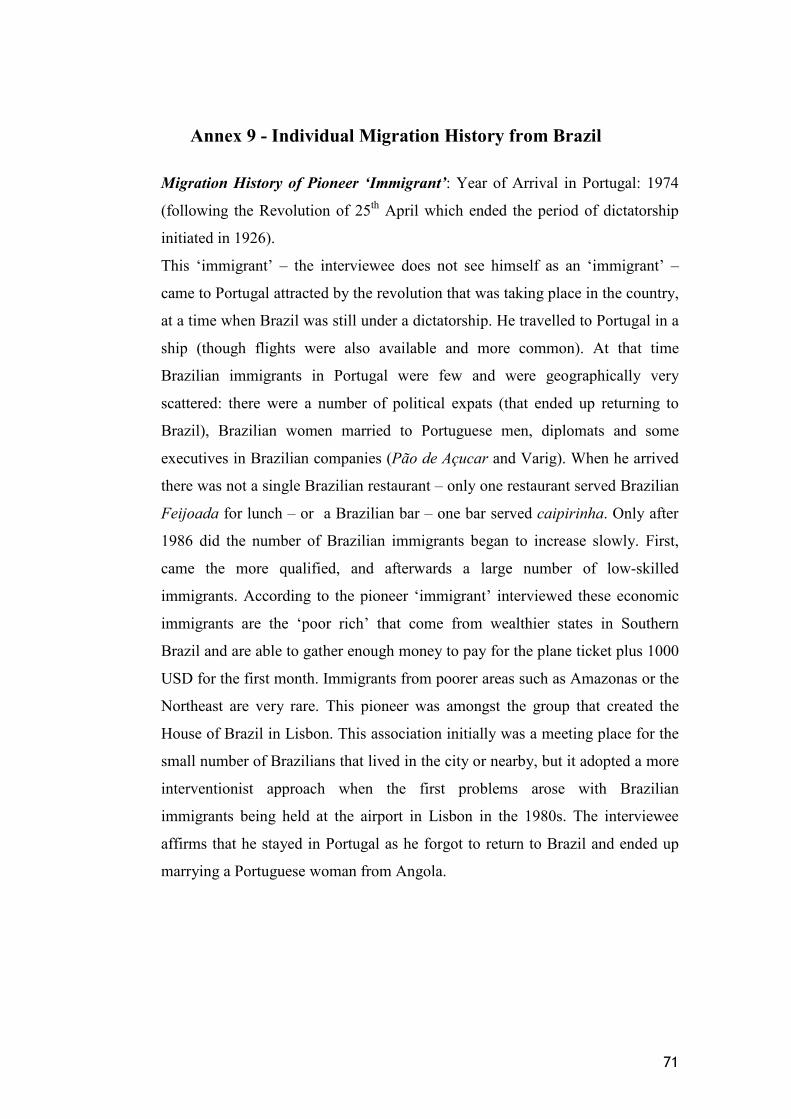
71
Annex 9 - Individual Migration History from Brazil
Migration History of Pioneer ‘Immigrant’: Year of Arrival in Portugal: 1974
(following the Revolution of 25th April which ended the period of dictatorship
initiated in 1926).
This ‘immigrant’ – the interviewee does not see himself as an ‘immigrant’ –
came to Portugal attracted by the revolution that was taking place in the country,
at a time when Brazil was still under a dictatorship. He travelled to Portugal in a
ship (though flights were also available and more common). At that time
Brazilian immigrants in Portugal were few and were geographically very
scattered: there were a number of political expats (that ended up returning to
Brazil), Brazilian women married to Portuguese men, diplomats and some
executives in Brazilian companies (Pão de Açucar and Varig). When he arrived
there was not a single Brazilian restaurant – only one restaurant served Brazilian
Feijoada for lunch – or a Brazilian bar – one bar served caipirinha. Only after
1986 did the number of Brazilian immigrants began to increase slowly. First,
came the more qualified, and afterwards a large number of low-skilled
immigrants. According to the pioneer ‘immigrant’ interviewed these economic
immigrants are the ‘poor rich’ that come from wealthier states in Southern
Brazil and are able to gather enough money to pay for the plane ticket plus 1000
USD for the first month. Immigrants from poorer areas such as Amazonas or the
Northeast are very rare. This pioneer was amongst the group that created the
House of Brazil in Lisbon. This association initially was a meeting place for the
small number of Brazilians that lived in the city or nearby, but it adopted a more
interventionist approach when the first problems arose with Brazilian
immigrants being held at the airport in Lisbon in the 1980s. The interviewee
affirms that he stayed in Portugal as he forgot to return to Brazil and ended up
marrying a Portuguese woman from Angola.

Appendix 4THEMIS – Metadata Phase 1
Appendix 4: Scoping studies in UK

The Evolution of Bangladeshi
Migration to the UK
THEMIS Scoping Study Report
International Migration Institute
University of Oxford

Theoretical Framework of THEMIS 2
Table of Contents
Sources ................................................................................................................................................... 3
1. Theoretical Framework of THEMIS................................................................................................... 4
Trends and Types of Migration ............................................................................................................ 5
Current Trends – Diversification ........................................................................................................ 10
Quantitative Picture .......................................................................................................................... 10
2. Policy Changes............................................................................................................................... 15
1948 British Nationality Act: Free Movement of British Subjects........................................................ 16
1960s: First Limitations in Admission Criteria towards Commonwealth Citizens................................. 17
1971 Immigration Act: Further Tightening of Entry Requirements ..................................................... 18
1980s: Closing the Gates.................................................................................................................... 20
1990s and 2000s: Managed Migration Approach and Points-Based System ....................................... 21
3. Institutions .................................................................................................................................... 24
Nineteenth and Early Twentieth Century: Charitable Organisations................................................... 24
1950s–1960s: Self-help Groups and Welfare for Fellow Bengalis........................................................ 25
1960s–1970s: Transnational Political Engagement – Liberation War .................................................. 25
1980s–2000s: Bengalis as Part of the Local Community ..................................................................... 26
Scoping Study Experience with Bangladeshi Organisations................................................................. 27
4. Remittances................................................................................................................................... 30
5. Individual Migration Histories – Trends and Patterns ..................................................................... 33
Where To? – Where From?................................................................................................................ 34
6. Assessment and Identification of Issues to be Explored in Phase 2..................................................... 39
Bibliography .......................................................................................................................................... 42

Theoretical Framework of THEMIS 3
Sources:
A number of sources were used for the writing of this report. The quantitative picture was
provided by the analysis of the UK census data between 1901 and 2001, and Annual Population
Surveys (2004–2008) using the country of birth variable. The qualitative analysis was based on
existing academic publications, reports and in-depth interviews with key experts in the
Bangladeshi community.
Due to the long history of colonial ties with Britain, and the large volume of Bangladeshi
migration to the UK, we encountered a lot of already existing mapping exercises and reports,
which provided quite a detailed picture of the community (cf. the Bibliography). In
producing this report we relied on many of them, which we duly acknowledge in the text.
However, in order not to duplicate the work that has already been done, in the interviews with
the experts we therefore did not focus that much on the mapping of migration between
Bangladesh and the UK, but on exploring issues and questions that have so far been neglected,
yet might have relevance for THEMIS theoretical contribution. We were particularly interested
in questions beyond the general, well known and well established migration narrative between
Bangladesh and the UK (although the latter is also presented in this report). We selected our
interviewees carefully – they represented different interests and various groups of the diaspora –
to help us in this task.
Exploring the historical, transnational ties between Bangladesh and the UK we spoke to Said
Rahman, Civil Servant from the Bangladesh Centre London (http://bangladeshcentre.org/).
Bangladesh Centre London is one of the oldest Bangladeshi voluntary community organizations.
It was established in 1974 under the auspices of the Bangladesh High Commission to maintain
and develop transnational links with Bangladesh. Before the official establishment in 1974,
the founding members of the organisation were actively involved (political campaigns, welfare
and charity support) in the independence movement in Bangladesh in 1971.
To find out more about the micro-community structures in the specific destination localities,
we interviewed Misbah Ahmed from the Marylebone Bangladesh Society (MBS)
(http://marylebonebangladeshsociety.org/). MBS represents the interests and serves the welfare

Theoretical Framework of THEMIS 4
needs of the very local Bangladeshi community of Church Street, Marylebone and St John’s
Wood in north-west London.
Exploring the links between Bangladeshi migration to the UK and wider Bangladeshi
migration in Europe (in the context of a migration system approach), we interviewed Ansar
Ahmed Ullah, a community activist who has lived and worked in the UK since the late 1970s.
He has worked as a youth, social and community worker and is Co-Convener of the Brussels-
based European Bangladesh Forum, a network of Bangladeshi Europeans.
Ansar is also the head of the Swadhinata Trust, a London-based secular Bengali heritage group
that works to promote Bengali history and heritage amongst young people in London’s East End.
Located in the famous Brick Lane in Bangla Town (Tower Hamlets), the Swadhinata Trust co-
ordinated an important Oral History Project recording and voicing the agency and
experiences of three generations of Bengalis in London’s East End. The project resulted in a
book with the telling title Tales of Three Generations of Bengalis in the UK: Bengali Oral
History Project. The rationale behind this project can tell us something about the dynamics
within the Bengali community in the UK, as well as their participation and contributions to
mainstream culture. Most recently Ansar co-ordinated a project unlocking the history of Britain’s
first Bengali settlers (pioneer migrants), seamen known as lascars, who served on British
naval and merchant ships from the eighteen century onwards. The book published as a result of
this project is entitled Bengalis in London’s East End, and it provides an extremely rich map of
the migration dynamics in the corridor between Sylhet (Bangladesh) and London’s East End
over the last four centuries (1700–2000s).
1. Theoretical Framework of THEMIS
According to the census data (1981–2001), Bangladeshi-born migrants have been present in the
UK since the 1980s. This is an inaccurate picture, as people of Bangladeshi origin have been
present in the UK at least since the eighteen century. The appearance of Bangladesh on the
census map has to do with the Independence of Bangladesh as a political unit (from Pakistan)
only in 1971.

Theoretical Framework of THEMIS 5
The curve reveals that the number of Bangladeshis in the UK increased rapidly throughout the
1980s and 1990s up to 2006.
Chart 1: Bangladeshis in the UK, Source: Census Data, Annual Population Survey
(Indexed 2008 = 100, 2008= ~ 202,000)
The quantitative data reveals that it would perhaps be justified to term Bangladeshis in the UK as
recently declining (since 2006); however, due to discrepancies between census (1901–2001) and
Annual Population Survey (2004–2008) methodologies, we would need to wait for the 2011
census results in order make this conclusion more than an ‘informed guess’.
Trends and Types of Migration
The earliest Bengali migrants to England were sailors (lascars) recruited in India to work on
merchant ships for the East India Company, and later ayahs (Indian nannies, nursemaids and
servants) who accompanied the families of the colonial memsahibs (wives of senior officials) of
the Raj back to Britain from 1700.1 Lascars came principally from East Bengal (Bangladesh),
particularly Sylhet (and Chittagong), and were recruited from the port of Calcutta.
1For a more detailed history of Bangladeshi migration see K. Gardner and A. Shuker (1994) ‘“I’m Bengali, I’m Asian
and I’m living here”: the changing identity of British Bengalis’, in R. Ballard (ed) (1994) Desh Pardesh: The SouthAsian Presence in Britain, Hurst and Company; Adams (1994) and Chowdhury (1993) – a vivid account of some ofthe colourful early pioneers of the Bengali community in Britain.
0
20
40
60
80
100
120
140
160
1900 1920 1940 1960 1980 2000 2020
Declining Migration System

Theoretical Framework of THEMIS 6
Photo 1: A group of lascar seamen probably at East India Dock, 1908. Original out of copyright; digital image andrecord copyright Museum of London, PLA Collection, Source:http://www.movinghere.org.uk/galleries/histories/asian/working_lives/working_lives.htm
The numbers of lascars arriving in the Port of London on East India Company ships – and later
on P&O, Clan Line Steamers and British India Steamship Company vessels – grew to over a
thousand by the Napoleonic War and to many more thousands through the nineteenth century.
Some of these seamen began to settle in London’s East End from the 1850s onwards. British
direct rule over India was established in 1857, and the subcontinent was opened to wider
commerce. Bengali sailors, who had already been coming to Britain on board East India
Company ships, arrived in increasing numbers to work in the British merchant navy or as
soldiers maintaining the British Raj in its various overseas colonies (Ullah and Eversley 2010, p.
17). Many arrivals were Bengalis who returned home on the next passage. However, some

Theoretical Framework of THEMIS 7
jumped ship. Others were just abandoned at British ports without wages by unscrupulous
employers.
The Communities (2009) report on the history of the Bangladeshi community in the UK reveals
that the lascars were accompanied by naval cooks, many of whom came from Sylhet. There are
records of Sylhetis working in London restaurants as early as 1873. Adams (1994), in her book
on pioneer Bangladeshi migrants, recalled a story pointing to the ethnic food industry as the most
characteristic feature of the early arrivals. In 1925, an early settler had been hungry, thirsty, cold
and lost in London. He was desperately looking for his own people. He asked a policeman for
help. The policeman replied: ‘I don’t know. You better go on until you smell curry.’ Arriving in
the London Docks, lascars would seek out other Asians with whom to stay. Bengali seamen and
many Bengali lascars also joined the British Navy during the Second World War (Communities
2009; cf. Adams 1994 and Chowdhury 1993).
The economic (migrant worker) migration from Bangladesh dominated in the 1950s and
1960s, when economic hardship in East Pakistan and labour shortages in the UK resulted in an
influx of predominantly low-skilled and semi-skilled migrant workers. More and more Bengali
men came to the UK to earn a living, and relied on the old links with the settled Bengali
community in London (lascars and their descendants). The Bengali men who came were
generally from rural backgrounds (Ullah and Eversley 2010, p. 48). Their families owned land
and were middle-income earners. The men who arrived were young, adventurous and were
looking for a better life. Their plan was to make a significant amount of money in order to return
and settle in Bangladesh (Ullah and Eversley 2010, p. 48). During the 1971 war for
independence a further wave of mostly male Sylhetis migrated to London for work and to escape
political instability (Communities 2009, p. 24). This wave of Bengalis in the UK settled in big
cities with industrial employment. In London Bengalis settled in the East End (Tower
Hamlets).
The profile of the group changed from the late 1960s, when the ‘myth of return’ was abandoned
and when the first male migrants brought their families to the UK, which resulted in a rapid
expansion in the population of wives and dependants, who joined their husbands in Britain
(Communities 2009, p. 25). Family reunification of the first generation of Bengali migrant

Theoretical Framework of THEMIS 8
workers, as the most dominant type of migration, peaked in the 1970s and continued at reduced
levels during the 1980s and 1990s. This wave of Bangladeshi migrants created the core of the
Bangladeshi community in the UK, and the great majority of them are now British citizens.

Theoretical Framework of THEMIS 9
Map 1: Bangladesh, administrative regions, Source: http://www.topnews.in/law

Theoretical Framework of THEMIS 10
Current Trends – Diversification
In the 1990s, migration from Bangladesh became much more diversified. The low-skilled
channels of legal entry to the UK become severely limited (Somerville 2007). In response to
these new institutional arrangements, family migration continued, as the 1.5 generation2 and the
second generation of Bangladeshis entered the ‘marriage’ market. The majority of 1.5 generation
young Bangladeshis (boys in particular) had their marriages arranged back in Bangladesh
(interview with Misbah). Via the family migration, the trend towards permanent settlement
continued among the Bangladeshi community in the UK. Between 2000 and 2006 an average of
5,119 Bangladeshi nationals acquired British citizenship every year (when compared to 2,181
during the 1990s) (Communities 2009, p. 26).
The Communities report suggests that currently it is mostly students, skilled and highly skilled
migrants who arrive from Bangladesh into the UK. In contrast to the major wave of low-skilled
workers (and their families, who followed them) recruited predominantly from Sylhet, most of
the new migrants come from non-Sylhet areas (such as the capital city of Dhaka, and Chittagong
and Comilla).
Until 1996 asylum applications to Britain had traditionally been low except for the years 1991–
92, possibly as a result of the cyclone in April 1991 which killed over 100,000 Bangladeshis
(Communities 2009, p. 25). Since then there has been a marked increase. However, at a total of
6,221 granted asylum applications since 1980, this figure still remains relatively low when
compared to grants of settlement via other channels (Communities 2009, p. 25).
Quantitative Picture
According to the 2001 Census there were 154,363 persons in the UK with Bangladesh as their
place of birth.3 The Annual Population Survey (APS) estimates (2004–2008) reveal that the
21.5 generation refers to migrants who arrived in the destination country as children, with their parents as the
primary migrants.3
Census 2001, for England, Scotland, Wales, Northern Ireland according to NeSS Geography Hierarchyhttp://neighbourhood.statistics.gov.uk/dissemination/viewFullDataset.do?step=4&productId=85&instanceSelection=043&timeId=1&containerAreaId=276699&startColumn=1&numberOfColumns=82&viewAction=fullScreen&maxi=1

Theoretical Framework of THEMIS 11
numbers were increasing up to 2006 (256,000), and then rapidly declining. In 2008, the APS
estimated the number of Bangladeshi-born persons in the UK at 202,000.
Year Number Source
1981 48,517 Census Data
1991 105,012 Census Data
2001 154,363 Census Data (OECD)
2004 225,000 Annual Population Survey (estimates)
2005 236,000 Annual Population Survey (estimates)
2006 256,000 Annual Population Survey (estimates)
2007 205,000 Annual Population Survey (estimates)
2008 202,000 Annual Population Survey (estimates)
Table 1: Bangladeshi-born persons in the UK, Source: Census Data, APS
The 2001 Census also gives an indication of the age structure of Bangladeshis in the UK. The
great majority of Bangladeshis were between 15 and 44 years old (68.1 per cent of the entire
Bangladeshi population in the UK).
Age Number
0–14 12,423
15–29 56,896
30–44 48,231
45–59 20,750
60 – 69 12,241
70 or older 3,822
Table 2: Age structure of Bangladeshi-born persons in the UK, Source: Census 2001 (OECD)

Chart 2: Age structure of Bangladeshi
Chart 3: Sex ratio of Bangladeshi-born persons in the UK, Source: Census 2001
0 10000
0-14
15-29
30-44
45-59
60 - 69
70 or older
Age Structure of Bangladeshis in the UK
Female49%
Theoretical Framework of THEMIS
tructure of Bangladeshi-born persons in the UK, Source: Census 2001 (OECD)
born persons in the UK, Source: Census 2001 (OECD)
20000 30000 40000 50000
Age Structure of Bangladeshis in the UK(2001)
Male51%
Sex Ratio
Theoretical Framework of THEMIS 12
(OECD)
50000 60000
Age Structure of Bangladeshis in the UK

Theoretical Framework of THEMIS 13
The statistical picture reveals that it is a young population. The number of women and men
above 15 is fairly equal (69,670 and 72,270, respectively). These data as well as figures of rapid
population expansion until 2006 and subsequent decline between 2006 and 2008 are however
difficult to reconcile with the view of the respondents stemming from the qualitative evidence.
Our interviewees suggested that the population of Bangladeshis in the UK has been in decline at
least since the mid 1990s, and that the inflows of newcomers literally stopped in the last five
years (interview with Ansar Ahmed Ullah). The interlocutors pointed to two, interrelated speeds
of community decline: one, concerning the inflow rates of newcomers from Bangladesh, and the
other the levels of relative deprivation of the Bangladeshi community in the UK. Bangladeshi
men and women are under-represented in the labour market, and unemployment and economic
inactivity rates are significantly above the national average (cf. Chart 4). Bangladeshis are the
most highly socially housed ethnic group, and are also more likely to experience dissatisfaction
with housing arrangements than other ethnic groups (Communities 2009, p. 35).
Given THEMIS theoretical framework, the movement between Bangladesh and the UK seems to
therefore represent the migration system in decline. As far as the growth rate is concerned, this
represents however an ‘informed guess’ (as far as the available data enables us to conclude), as
the relative decline in numbers of the Bangladeshi-born population might also be attributed to the
differences in methodologies between the census (up to 2001) and APS (2004–2008). The
decline in population numbers between 2006 and 2007 was also very sharp, hence – if taken at
its face value – contradicts THEMIS hypothesis of decline as following the gradual
establishment of the community (alongside the ‘bell shaped’ curve).
The qualitative evidence seems also to suggest that despite their long historical presence in the
UK (Bangladeshis are an inseparable part of the contemporary British ethnic structure), the
Bangladeshi community might also be long experiencing qualitative decline, as far as social
cohesion and labour market outcomes are concerned. The Bangladeshi community is the most
concentrated and ethnically segregated community in England, with 43 per cent of the population
concentrated in only seven London boroughs (Communities 2009, p. 28). The interviews
revealed that it is also a socially deprived community, with 55 per cent of its members above the

Theoretical Framework of THEMIS 14
age of 15 being economically inactive, and well established evidence of welfare dependence
(social security benefits and social housing) (cf. Communities 2009, pp. 27–37).
Chart 4: Labour Force Status, Source: Census 2001 (OECD)
There are differences in community dynamics and development visible between those
Bangladeshis who stay within their traditional neighbourhoods in East London and those who
move out from them. Those Bangladeshis within Banglatown are considered disadvantaged and
under-achievers in terms of education, employment and housing (interview with Ansar Ahmed
Ullah) – they are ‘at the bottom’ of the community ladder. Moving out from the neighbourhood
geographically is an important indicator of a step upwards also in terms of social mobility –
those Bangladeshis living outside represent the middle-class, and professionals (solicitors,
teachers, restaurateurs) (cf. Peach 1996).
The attempts over the last couple of years to revive Banglatown, brought about by the expansion
of the ‘city’ with its businesses and night life, paradoxically resulted in a situation where Brick
Lane, the heart of the Bangladeshi community in Tower Hamlets, is now a place of strict social
contrasts. Popular clubs, bars, and art galleries, where London’s bohemians socialize, are
situated next door to small Bangladeshi restaurants which are struggling to survive (interview
with Ansar Ahmed Ullah). City businesses – banks, solicitors, and architects’ offices – are
35%
8%
55%
2%
Labour Force Status
Employed
Unemployed,
Inactive
Unknown labour forcestatus

Policy Changes 15
neighbours with social housing estates where the majority of Bangladeshis in this neighbourhood
live (cf. Eade 2006, Eade et al. 1996).
2. Policy Changes
The large number of Bangladeshi lascars arrived in the UK when the 1816 Regulations of Aliens
Act was in force.4 However, the Act applied to everyone except seamen (hence lascars might
have been excluded from it), ambassadors and their domestic servants, and children under the
age of 14.5
Paradoxically some lascars might have started settling in the docks of London’s East End as a
result of the 1660 Navigation Act (repealed in 1849), which stipulated that three-quarters of the
crew of any ship importing goods and returning to Asia had to be English. As a result, if a ship
arrived in Britain with a crew made up of more than a quarter Asians, some would inevitably be
forced out of employment and become stranded in London (Wemyss 2009). Despite the fact that
the East India Company had, in most cases, brought the seamen to London, it was reluctant to
take the responsibility for them.
In 1855 a Merchant Shipping Amendment Act was passed when the government intervened with
initiatives to return the lascars to Bengal (Ullah and Eversley 2010, p. 22). In 1894 another law
was passed to ensure that lascars returned to Bengal. The 1894 Merchant Shipping Act reiterated
the fact that lascar contracts bound them to return to Bengal. Section 125 gave ship owners
enhanced powers to place lascars in crews heading back to India. However, in fact only a few
4 The act made the first provision for any central system of registration of migrants in the UK. This requiredmasters of ships to declare in writing to the Inspector of Aliens or Officer of Customs, the number of foreigners onboard with their names and descriptions (Migration Histories 2010). Each individual was to be issued on arrivalwith a certificate, showing the ship's name, and his or her own name, description, place of departure, destinationand profession, with space for references and remarks. Unless he or she was a servant, each person was toproduce the certificate within one week to a magistrate or a justice of the peace, and copies of the entries on thecertificates were to be sent both by the port and by the magistrate or justice to the Secretary of State in London(Migration Histories 2010). The Act was confined to those arriving in the country from abroad and did not apply tothose already here. No certificates of arrival of aliens survive for this period.5
A relaxation of these requirements was introduced by the 1836 Registration of Aliens Act, whereby a migrant
living in the UK no longer had to report his or her address every six months, and would in future become exemptfrom the provisions of the Act after three years instead of seven.

Policy Changes 16
shipping companies made warrants against the lascar deserters. By 1937 there were only two
shipping companies (P&O and the Ellerman Lines) which took out warrants concerning Indian
seamen deserting their ships.
Lascars, as pioneer migrant workers from Bangladesh (then part of the British Empire), were
also excluded from the 1905 Aliens Act, 1914 Aliens Restriction Act, and 1919 Aliens
Restriction (Amendment) Act. The acts applied only to Aliens but not Commonwealth Citizens.
Some ex-seamen felt free to apply to the High Commissioner for India to obtain Certificates of
Nationality and the British Indian Seamen’s Certificates of Identity (Ullah and Eversley 2010, p.
26). These documents – as argued by Ullah and Eversley – could be considered passports and
were regarded as such by their holders.
1948 British Nationality Act: Free Movement of British Subjects
The review of the early immigration policies demonstrates that they were directed mostly at
Aliens and not at British subjects recruited from the Commonwealth. Although the latter – like
lascars – might have been subject to specific laws preventing their free settlement in the UK, the
historical accounts of acquiring Certificates of Nationality and Identity lead us to conclude that
de facto the movement of persons and their right of residence in the UK were neither heavily
regulated nor restricted. British subjects were free to come and go from the UK as they wished
under what might have been described as a Common Law right of abode (MacDonald et al.
2010).
The institutionalisation of this common-law derived policy found its statutory legal support and
confirmation in the 1948 British Nationality Act. Under the Act, all British subjects or
commonwealth citizens (terms used interchangeably until 1983, MacDonald et al. 2010) had
constitutionally guaranteed free movement of persons between the colonies and the UK and right
of abode in the UK. They enjoyed this right whether they lived in the UK or elsewhere, and
whether or not they were citizens of the United Kingdom and Colonies (CUKCs).

Policy Changes 17
1960s: First Limitations in Admission Criteria towards Commonwealth
Citizens
Things have changed dramatically with the 1962 Commonwealth Immigrants Act, whereby
Commonwealth citizens were first made subject to statutory immigration control in the UK. This
Act was brought into force mainly as a result of a campaign against black Commonwealth
citizens already here (MacDonald et al. 2010). The Act made a distinction between CUKCs and
citizens of independent Commonwealth countries, and based control upon the kind of passport
held by the would-be immigrant. All Commonwealth citizens became subject to immigration
control except the following:
(a) persons born in the UK;
(b) holders of UK passports issued by the UK government, as opposed to those issued on
behalf of the government of a Crown colony or of some other part of the
Commonwealth;
(c) other persons included in the passport of one of the persons excluded from immigration
control under (a) or (b) above (MacDonald et al. 2010).6
On the basis of the 1962 and 1968 Commonwealth Immigrant Acts, before arriving in the UK
the Commonwealth workers must have been in a possession of an entry certificate and voucher
(limited by quota). No work permit was necessary (in contrast to Alien Workers). Vouchers for
the employment of Commonwealth citizens were issued under the 1962 Commonwealth
Immigrants Act and 1968 Commonwealth Immigrants Act. The vouchers were issued in two
categories: category A for Commonwealth citizens with a definite offer of a job, and category B
for those who held certain specified professional qualifications (Migration Histories 2010).
Application for a category A voucher was made by the prospective employer.
According to the legislation in place (except for Malta and the Dependent Territories) the
vouchers were to be issued for: those holding professional qualifications and managerial and
6The 1962 Commonwealth Immigrants Act was followed by the 1968 Commonwealth Immigrants Act, the main
aim of which was to bring the East African Asians under immigration control (MacDonald et al. 2010).

Policy Changes 18
executive staff; skilled craftsmen and experienced teachers; specialised clerical and secretarial
staff; and those coming for work which, in the opinion of the Secretary of State for Employment,
was of substantial economic and social value to the UK (Migration Histories 2010). It is
considered that the latter actually denoted the low-skilled workers, who came to fill the UK’s
numerous job vacancies, in the years of Britain’s economic boom (as vouchers were not issued if
the vacancy offered could be filled by resident labour).
Special arrangements existed for the admission, without vouchers, of doctors and dentists.
Although only a limited number of vouchers were issued annually, based on fixed quotas for the
various countries of the Commonwealth (Migration Histories 2010), many Bengalis like others
from the Indian sub-continent took this opportunity and used their old links with the settled
Asian community. As more jobs were available more and more men came from South Asia to
work (Ullah and Eversley 2010).
Upon being admitted, however, Commonwealth Workers received absolute right of settlement,
and were not subject to any further controls after entry.
Dependent spouses of Commonwealth Workers had to produce an entry certificate (issued in the
territory of origin after tests of eligibility) in order to pass the entry requirements. Upon being
admitted they had the right to join their spouses (Primary Commonwealth Workers) in their
absolute right of settlement, and to take up a job. In the same way as the primary applicants, the
dependent spouses were not subject to any controls after admission.
Commonwealth Dependent Children (and other Commonwealth Dependants – parents, distressed
elders) were admitted on the basis of an entry certificate, again issued in the territory of origin.
Children under the age of 16 had absolute right of settlement; for those aged between 18 and 21
the right was at the discretion of the Home Office. Parents over 65 were admitted for settlement,
and other dependants had the right of settlement granted in specified circumstances.
Commonwealth Dependent Children and Commonwealth Dependants did not experience any
further controls upon being admitted to the UK.
1971 Immigration Act: Further Tightening of Entry Requirements
Although in the literature the 1962 and 1968 Commonwealth Immigrants Acts are considered to
restrict significantly movement between the UK and its former colonies, the actual results of

Policy Changes 19
these acts are difficult to grasp. This is because it was only during the 1950s and 1960s – in spite
of those acts being in place – when the majority of Bangladeshi workers came to the UK and
formed the beginning of the community as we know it today. The present Bengali communities
are the descendants of those 1950s–1960s arrivals. The 1971 Immigration Act, on the other hand,
changed the face of the Bangladeshi community. It repealed all previous legislation, with minor
exceptions, and spelled the end of large-scale primary immigration for settlement from the ‘new
Commonwealth’. The benefits of the right of abode had shrunk to a small, exclusive, largely
white group of ‘patrials’, defined by their connection to the UK through their ancestry.
Due to limitations in channels of legal entry and settlement for economic migrants
(Commonwealth Workers), it was the family unification – migration of spouses, children and
other dependants – that dominated the flow of persons between Bangladesh and the UK in the
1970s.
With regard to the newcomers, the rights of residence and settlement of Commonwealth Workers
were restricted in the sense that they were made equal to those of Alien Workers (from outside
the Commonwealth). Indeed when we compare the rights of Commonwealth Workers before and
after 1971 they are significantly different. The privilege of absolute right of settlement for
primary workers arriving in the UK after 1971 was abolished and replaced by a four-year period
upon which settlement might have been granted on conditions.
This does not mean however that the new entry requirements were particularly restrictive (when
compared with those in operation nowadays, for example). To enter the UK to work, the
Commonwealth Workers were required to possess an entry certificate and work permit; however,
the qualitative evidence demonstrated that those requirements were not all that difficult to obtain,
and British companies were willing to recruit workers from outside the UK and supply them with
work permits well into the 1970s (interview with Mostafa Ragab – Egyptian experience and
Alien Worker perspective; and Rama Murthy – Indian experience and Commonwealth Worker
perspective).
The Commonwealth Workers, although denied the absolute right of settlement, were still
allowed to settle in the UK after four years (and many of them did). They were also obliged from
then on to register with the police and report any changes of address.

Policy Changes 20
The analysis of the new legal environment after 1971 raises some striking questions relating to
THEMIS theoretical framework and the impact of policies (as well-established macro factors) on
migration movements. It is commonly accepted that due to the changes in the legislation (1971
Immigration Act) and restrictions for Commonwealth Workers willing to come and work in the
UK, the main inflow of migrant workers to the UK stopped and was replaced by the family
reunification movements (cf. Somerville 2007). However, if one digs deeper into the migration
policy, it is actually the spouses and dependent children whose rights became particularly
acutely restricted by the 1971 Immigration Act.
Commonwealth Dependent Wives joining their husbands were denied the right to employment
(which they had enjoyed since 1948); and before being admitted to the country they had to prove
that their husbands would be able to support them. They were also denied their – previously
absolute – right of settlement, and they might have been admitted to the UK only temporarily for
the same period as their husbands. Commonwealth Dependent Children below the age of 18
were also denied their absolute right of settlement according to the new legislation. They were
granted conditional residence if they were joining both parents. Those aged between 18 and 21
were however admitted only in exceptional circumstances. Other Commonwealth Dependants
(parents and other distressed persons) were admitted to the UK only after the head of the family
became resident (after four years). As a result, the policy restrictions following from the 1971
Immigration Act, although perhaps originally directed at Commonwealth Workers particularly
concerned (and hit) the dependants of the primary migrant workers (spouses and children).
The fact that, despite these serious immigration policy restrictions, the profile of the Bangladeshi
community in the UK changed significantly in the 1970s (in the sense that the number of females
and younger people increased) presents a certain paradox, and a puzzle to be explained. It
strongly challenges the simple causation models between the change in policy and the changing
pattern of migration. The immigration policy impacts cannot therefore be properly understood
unless migrants’ agency and responses towards it are taken into account.
1980s: Closing the Gates
The 1981 British Nationality Act attempted to re-align nationality with immigration rights, and
in doing so created further confusion and anger. The 1981 Act created out of the former UK and
Colonies citizenship several different types of British nationality, only the first of which, British

Policy Changes 21
citizenship, carried the right of abode. The other main category of former Commonwealth UK
Citizens (CUKCs) was given lesser citizenship status by the 1981 Act; the British Overseas
Citizens (BOCs) – Commonwealth – became a category with no right of entry (MacDonald et al.
2010).
By the mid 1980s the first visa controls had been imposed on Commonwealth citizens (1988
Immigration Act) and these were swiftly followed by the first carriers’ liability measure, the
1987 Immigration (Carriers’ Liability) Act, pushed through in response to the arrival of visa-less
Tamils fleeing Sri Lanka.
The introduction of visa controls on Commonwealth citizens, and of carrier sanctions, were the
first domestic manifestations of a pan-European policy to deal with the increasing numbers of
asylum seekers arriving in Europe, and it is asylum which has become the big issue in the past
two decades.
Developments in immigration law in the 1980s and 1990s reflected the battle between the
exclusionary imperatives of European immigration policy to the poor countries of the world, on
the one hand, and the humanitarian imperatives of international human rights law on the other
(MacDonald et al. 2010). Visa controls and carrier sanctions were thus calculated to stop
refugees and others arriving in Europe. Non-British and non-EU travellers from ‘refugee-
producing’ countries required visas and could not get them. Airlines would not sell tickets to
those without visas. Thus the trade in false passports and documents began, and the trafficking
trade, with which many of the laws of the 1990s and the early years of the new century are
concerned (MacDonald et al. 2010). The 1996 Asylum and Immigration Act reduced the rights
of immigrants and asylum seekers, without any compensatory improvements. Accelerated appeal
procedures were extended from third-country cases to whole new categories of asylum seekers
(MacDonald et al. 2010).
1990s and 2000s: Managed Migration Approach and Points-Based System
With regard to Bangladeshi immigrants, the last three immigration acts – the 1999 Immigration
and Asylum Act, the 2002 Nationality, Immigration and Asylum Act and the 2006 Immigration
and Nationality Act – present a compilation of different measures, but have at their heart four
main themes:

Policy Changes 22
a) tidying up measures
b) removing and restricting rights of appeal
c) creating a new system of employer sanctions to stop illegal working by migrants
d) monitoring, surveillance, and more co-ordinated policing of migrants old and new on
the basis of seeking out crime, people-smuggling and terrorism, and collecting vast
new databases on all third-country nationals (i.e. those who are not British or
European Economic Area [EEA] citizens) (MacDonald et al. 2010).
In practical terms under the Labour Government (1997–2010) the changes in the immigration
policy resulted in:
1) tightening of immigration controls
2) selective admission focused solely on highly skilled migrants and migrants with
skills that are in deficit in the UK
3) severe limitations in legal channels of entry for low-skilled migrants from outside the
EEA
4) access to labour market by students limited to 20 hours per week
5) unlimited access to labour market by spouses of primary workers (usually admitted
under Work Permit or Highly Skilled Migrant Programme [HSMP] scheme, since June
2008 – Tier 1 and Tier 2).7
These changes undoubtedly had their impact on the changing character and profile of migration
from Bangladesh to the UK. The tightening of immigration controls resulted in fewer visa
applications being accepted for processing (and many migrants in possession of a visa actually
being turned back at the airports – anecdotal evidence, interview with Misbah).
These changes reflected the broader turn in the EU migration policy with the decision at the
European Council in Tampere, 1999, to develop a common EU migration and asylum policy. In
its communication on a Community Immigration Policy (COM (2000) 757) of November 2000,
the European Commission explicitly proposed abandoning the zero immigration policies of the
7A broad overview of these schemes was presented in the Scoping Study Report on Ukraine. They are of course
also applicable with regard to any future migration from Bangladesh. Therefore, in order not to duplicate theanalysis, this section refers the reader to the respective sections of the Ukrainian report.

Policy Changes 23
past 30 years. Instead, new immigration policies would be devised with which to better regulate
migration through orderly and regular channels that were themselves responsive to labour market
needs, reflecting the realities of labour market demand for immigrant workers, continuing
migration pressures from the developing world and demographic trends in European countries,
particularly declining birth rates and ageing populations (Pellegrino 2004, p. 8).
The profile of newcomers has changed, from the large pool of low-skilled manual workers,
which wasdominant among the Bangladeshi migrant workers arriving in the UK in the 1950s and
1960s, to fewer, ‘carefully selected’ yet highly skilled professionals and students arriving in the
1990s and 2000s. Highly skilled migrants continued to bring their spouses with them due to no
restrictions in their access to the labour market. Students were allowed to bring their spouses and
dependants with them (if they were studying in the UK for more than six months) provided that
they were able support themselves financially for the entire length of their stay without needing
help from state benefits (also known as public funds) (UKBA 2010).
The limitations in the legal channels of admission of migrant workers might have led to the
increased attempts at irregular (or semi-legal) entry and subsequent employment, particularly
filling in the need for skilled chefs and ancillary staff in the flourishing Indian restaurant
businesses well beyond London’s East End.8 The UK’s immigration policy of admitting low-
skilled labour only from the Accession State (A8) countries has left many restaurateurs without
properly qualified employees to carry out various duties. ‘Whilst a Polish waiter might in theory
sound like a “fair enough” substitute for a Bangladeshi one, it would take at least five years to
train a Slovakian chef to cook real, traditional North-Indian curry’ (interview with Nick Clark,
Working Lives, IMISCOE Conference 2008, Oxford).
The managed migration approach under Labour did not intend any quotas or caps of non-EEA
nationals admitted to the UK (including Bangladeshi nationals). With the change of government
in April 2010, the Conservative-Liberal Democrat government announced the introduction of
caps on the number of non-EEA nationals admitted to the UK, administered on a monthly basis
8Right from the start, Indian restaurants in the UK were owned and run by Bangladeshi chefs (Chowdhury 1993;
Adams 1994).

Institutions 24
by the UK Border Agency. The interim cap for Tiers 1 and 2 came into effect on 19 July 2010
and is to last until March 2011. After this, the government proposes to introduce, following
consultation, the final system (UKBA 2010).
3. Institutions
As already mentioned in Section 1 of this report, Bangladeshi immigrants in the UK have a long
and well-documented history of arrival and settlement, dating back to 1700. Therefore the
institutions they established should be presented in a historical perspective, and we should not
consider only those migrant organisations currently in operation.
Nineteenth and Early Twentieth Century: Charitable Organisations
Throughout the eighteenth and nineteenth centuries lascars’ lives were often poverty-stricken
and hard. The East India Company records show lascars arriving at their Leadenhall Street
offices ‘reduced to great distress and applying to us for relief’ (1782). Therefore the first
organisations for and of stranded Bengali seamen in England were particularly directed at
alleviating poverty, and other charitable work.
As early as 1786 a ‘Committee for the Relief of the Black Poor’ had been set up to organise
relief for the distressed lascars, including plans to resettle them in Sierra Leone (Ullah and
Eversley 2010, p. 23). From 1795 onwards, lascar hostels and seamen’s homes were set up in
Shoreditch, Shadwell and Wapping (Communities 2009).9 In the winter of 1850 ‘some 40 sons
of India’ were found dead of cold and hunger on the streets of London. The Society for the
Protection of Asian Sailors was founded at the Stranger’s Home in Limehouse in 1857.
Although lascars had been a significant presence in Britain since the eighteenth century, it was
not until the inter-war period (1918–1939) that any attempts were made to organise them into a
trade union. After several name changes, the title International Oriental Seafarers Union or
Union of Eastern Seamen was adopted. However, it was not until the Second World War that
lascars began to show signs of challenging their inferior position by orchestrating a series of
9The lascar hotels in London’s East End have a long standing tradition. One lodging house in Code Street, off Brick
Lane (established by Mr Munshi who arrived in London in 1922) proved a safe haven for newly arrived Bengalis.The hostel still exists nowadays, catering for the needs of local homeless people (Ullah and Eversley 2010, p. 38).

Institutions 25
strikes for better pay and conditions. Many were locked up in British prisons, and workers were
forced to accept a 25 per cent pay increase, significantly lower than they had originally
demanded. Despite this hollow victory the episode does mark the beginning of South Asian trade
union activity in Britain (Migration Histories 2010).10
1950s–1960s: Self-help Groups and Welfare for Fellow Bengalis
The origins of the self-help groups could well be traced back to the tradition of hostels and cafés
for Bengali seamen in the early 1920s. Apart from fulfilling the immediate lodging needs, these
often also turned into advice institutions helping with letter writing and form filling, and offering
educational and travel agency services (Ullah and Eversley 2010, p 38). One such café – Shah
Jalal Coffee House (run by Mr Ayub Ali Master established in the 1920s) gave foundation for
the establishment of the Indian Seamen’s Welfare League as early as 1943 (Ullah and Eversley
2010, p. 38).
In the 1950s the Bengali community was expanding, and so was the demand for support. The
newcomers – both seamen and others – established the Pakistan Welfare Association, which
after the independence of Bangladesh changed its name to the Bangladesh Welfare
Association, which exists still today and is the largest Bengali community organisation (Ullah
and Eversley 2010, p. 50).
1960s–1970s: Transnational Political Engagement – Liberation War
During the political unrest in the 1960s in Bangladesh (then East Pakistan) resulting from
resentment against the Pakistani ruling, Bengali immigrants in the UK supported the political
actions towards greater autonomy. When the leader of the political organisation back in
Bangladesh – Sheikh Mijib Rahman from Awami League – was arrested by Pakistani authorities
in1968, UK Bengalis sent the English QC, Sir Thomas Williams, to defend Sheikh Mujib, and
others who had been charged with treason (interview with Said Rahman).
During the Liberation War in Bangladesh in 1971 the UK’s Bengali community played an
important role in highlighting the atrocities taking place in Bangladesh, lobbying the British
government and the international community, and raising funds for refugees and Bengali
resurgents (interview with Said Rahman). The Bengali community organised a collection among
10Migration Histories, http://www.movinghere.org.uk/galleries/histories/asian/politics/politics.htm

Institutions 26
its members involving a significant percentage of one’s week’s wages to provide help for their
fellow Bengalis affected by the conflict (interview with Said Rahman). One of the most famous
campaigns was the Bangladesh independence demonstration in Trafalgar Square, London in
1971, and the establishment of the UK Awami League (corresponding to the main opposition
party to Pakistan rule in Bangladesh under the same name) (Ullah and Eversley 2010, p. 51).
1980s–2000s: Bengalis as Part of the Local Community
Ullah and Eversley in their history of Bengalis in London’s East End report that by the 1980s 34
out of the 112 community groups listed by the local education authority were led by Bengalis. In
the Spitalfields ward of Tower Hamlets, Brick Lane became the centre of Bengali activism
(2010). There are now a significant number of Bangladeshi organisations that reflect diverse
interests, ranging from political, generational, health and social welfare to social and cultural
activities. By the 1980s many of the Bengali immigrants who had arrived in the 1950s and 1960s
already had British citizenship and were well settled in the UK. Their activism and political
interests outgrew the narrow focus on self-help among their fellow Bengalis, or Bengalis back
home, and turned more to community issues. Bengalis become an inseparable part of the East
End ethnic mosaic. Their activism reveals how they started transforming the East End into truly
‘their’ locality.
Section 1 of this report already alluded to the housing issue as particularly acute for the
Bangladeshi migrants in London’s East End. From late 1974, the Tower Hamlets Squatters’
Union and Race Today organisation began to campaign among the Bengalis over the issue of
discrimination in housing (Ullah and Eversley 2010, p. 52). The aims of the movement largely
reflected the fact that from the mid 1970s many Bangladeshi migrants – despite their acquired
British citizenship – have been experiencing racism, social deprivation and high levels of
unemployment. These led to the formation of the Federation of Bangladeshi Youth
Organizations (FBYO) in 1980 as an umbrella organisation for various youth campaigns for
better housing, health and education, and against racism (Ullah and Eversley 2010, p. 52). The
FBYO was considered the first truly national campaigning body that represented Bengali
interests and spoke on behalf of Bengalis not only across the East End but also nationally (Ullah
and Eversley 2010, p. 52).

Institutions 27
To address the educational depravation the Bangladeshi Educational Needs in Tower
Hamlets (BENTH) was formed in 1983 to lobby the Inner London Education Authority to
improve educational infrastructure for the community.
Gender issues and the needs of Bengali women were put to the fore when the Jagonari
Women’s Education Resource Centre was built by an Asian women’s collective in the 1980s.
The political involvement of Bangladeshi women resulted in the short-lived yet successful
Women Unite Against Racism organisation (1993–95), which responded to the racist attacks on
Bengali students in the early 1990s (Ullah and Eversley 2010). The organisation contributed
significantly to the defeat of the British National Party (BNP) in Tower Hamlets, by ensuring
that women registered to vote, and encouraging women to take part in the local elections.
The Greater Sylhet Development and Welfare Council (GSDWC) was formed in the 1990s with
the aim of developing a common platform for the Sylhetis living in UK. Since its inception, it
has provided leadership in nation-wide programmes ranging from campaigns for voting rights to
combating racial discrimination. GSDWC has twelve regional committees in England and
Ireland. It also has branch offices in four districts in greater Sylhet (Communities 2009, p. 61).11
Bengalis were also actively engaged in local politics. The year 1982 saw the first Bengali elected
to Tower Hamlets Council. Right up until today, Tower Hamlets Council has the largest number
of Black, Asian and Bengali councillors in the country (Ullah and Eversley 2010). In 2010 the
first Bengali representative – Rushnara Ali (from Bethnal Green and Bow constituency) – was
elected to the House of Commons. Rushnara Ali emigrated from Bangladesh with her parents at
the age of 7; she received her education in the UK, and was involved in the life of the local
Bangladeshi community via voluntary work particularly focusing on anti-discrimination and
prevention of conflict and ethnic unrest.
Scoping Study Experience with Bangladeshi Organisations
Among the current Bangladeshi organisations studied in the scoping phase, Bangladesh Centre
London in spite of its clear welfare aims seemed to be focused more on highlighting and re-
living the ‘glorious’ past of the UK Bangladeshi community and its political involvement in the
11For an elaborate list of Bangladeshi organizations in the UK cf. Communities 2009, pp. 62-64

Institutions 28
1971 Liberation War in Bangladesh. The organisation has strong institutional support from the
Bangladesh High Commission; its building is located in the area of Notting Hill Gate, a place
where few Bangladeshis actually live. Its chairman is a former civil servant from Bangladesh
recruited in the open process. He does not necessarily know the local community, nor does he
have experience in volunteering and community work. Perhaps the Bangladesh Centre London
now serves a rather representative role, as most of its community projects are currently on hold.
The local Marylebone Bangladesh Society of Church Street, Marylebone and St John’s Wood
in north-west London is a typical local community welfare organisation (as opposed to a migrant
organisation). It started off as a branch of the local Citizens Advice Bureau, and now primarily
serves the Bangladeshi community in addressing issues of: benefit applications and eligibility,
housing, settlement matters and application for UK citizenship, personal and emotional distress
or debt cases. It also organises social events for the elderly as well as responding to the needs of
the youngest members of the community, born and brought up in London. It comes as no
surprise therefore that it is primarily staffed by second-generation Bangladeshis, who either
arrived in the UK as children or were born and educated here.
As far as the mapping exercise was concerned, it was very helpful talking to the representative of
MBS; however, Misbah was ‘carefully’ selected by the MBS managing committee to talk to me.
He was the only one of the active committee members who actually arrived in the UK with his
parents. Others were born and brought up here, and expressed no interest in ‘yet another’
migration project. It is obvious therefore that trying to address the THEMIS research question in
this local community organisation was a difficult task, not because of lack of information (this
being largely available in many printed and online reports), but due to the fact that the
organisation members did not consider themselves migrants, or even objected when this
categorisation was implied in the interview invitation letter. An organisation in the UK which
has Bangladeshi in its name might not necessarily be a migrant organisation or one that could
provide a researcher with in-depth insights into the migration processes, trends and patterns of
settlement, beyond the general narrative.
What the research among the members of this organisation nevertheless seems to have
contributed to THEMIS theoretical framework was a reminder that migration always remains a
time-bound phenomenon. It involves the decision to migrate, the migration process and then

Institutions 29
the transition in the host country. It is difficult to quantify how long Bangladeshis considered
themselves migrants in the UK. Pioneer and early Bangladeshi migrants in the UK used to
receive absolute settlement rights from day one of arrival, and yet the feeling of temporality of
their stay in the UK, and transition, accompanied them for more than a decade (cf. Visram 2002).
Since 1971 Bangladeshis have been able to consider themselves British citizens after four years
of residence, and family reunification probably contributed a lot to the new sense of belonging.
Bangladeshis have a long settlement history in London, which has its own problems, question
marks and ambiguities to be addressed. As a result the institutions they bring to life – like the
Marylebone Bangladeshi Society – serve their current welfare needs corresponding to their
identity as a community not necessarily from Bangladesh or Sylhet but as a community from
north-west London. The theoretical frames we tend to invoke while looking at Bangladeshis
might skew our perception of the group. For example, although transnationalism contributed a
lot to migration theory, it might also have left the false impression that migrants will always
remain migrants due to their transnational lifestyles. This does not seem to be the case with
regard to all the Bangladeshis studied here.
The Swadhinata Trust, although again directed at second- or third- (even fourth-) generation
British citizens of Bangladeshi origin is in turn trying to re-explore the Bangladeshi or Sylheti
link of the current community in Tower Hamlets. The Swadhinata Trust is a London-based
secular Bengali heritage group that works to promote Bengali history and heritage among young
people. The Trust has been operating since November 2000 offering seminars, workshops,
exhibitions and educational literature to young people in schools, colleges, youth clubs and
community centres. Their Oral History Project (2005–2006) offered a unique opportunity to
Bengali young people to research, document and celebrate Bengali heritage and history by
recording the experience of three generation of Bengalis in the UK.
The Oral History Project voiced the three generations’ experience of being Bengalis in
multicultural Britain. The project consisted of a collection of around hundred oral histories (the
interviews are publicly available) with a focus on three specific themes: ‘roots and memory’
(dialogue between first- and third-generation Bengalis on the history of Bangladesh and the 1971
war of independence); ‘community creativity’ (dialogue between second- and third-generation
Bengalis on welfare and community involvement in the UK from the 1970s to the 1980s); and

Remittances 30
‘popular culture: between tradition and innovation’ (across three generations, mainly
focusing on traditional and more recent British Bengali musical heritage, from the 1970s to the
1980s). The project concluded with a book publication.
The most recent project (2009–2010) was aimed at documenting the experiences of Bengali
settlement in East London. The project was aimed at engaging young people in discovering
their own history and heritage through active participation in the research of the Tower Hamlets
Bengali community. It therefore contributed to the re-engagements of current Bangladeshis in
London with the immigration history of their ancestors and their immigrant roots – beyond the
sole focus on current matters and welfare needs of the community. The conclusion of the project
was a book documenting the history of Bengalis in London’ East End, providing an overview
of the settlement trends and patterns over the last 400 years.
The Swadhinata Trust also has links with Bengalis across Europe via the European Bangladesh
Forum, which is a loose informal network with occasional meetings and workshops (e.g. on
climate change, Islam, remittances). The Trust co-operates with the Dutch Bengali Association –
Basug (http://www.basug.nl ), as well as Belgian, Italian and German groups.
The migration industry (travel agents, phone cards, etc.) is also an inseparable part of the
mapping exercise of Bangladeshi institutions in the UK. Walking down Brick Lane in Tower
Hamlets one can see that almost every corner shop is selling and advertising cheap phone cards.
There are also a couple of travel agents (particularly advertising and stressing their links with
Sylhet) strategically placed along the street. However, the richness of material flowing from the
analysis of the established Bangladeshi organisations far exceeded the role of the migration
industry in the mapping exercise.
4. Remittances
For Bangladesh the data on remittance inflows exists since 1976. The data gathered by the World
Bank only capture remittances sent through formal channels such as banks and money transfer
operators. Currently, no uniform and authoritative historical data on informal flows exist. Given

Remittances 31
the widespread use of informal remittance channels in many countries, the remittance data
presented should be regarded as underestimates of the total flows.
Year Bangladesh
1976 191977 791978 1151979 1711980 3391981 3811982 5261983 6421984 5011985 5021986 5761987 7481988 7641989 7581990 7791991 7691992 9121993 1,0071994 1,1511995 1,2021996 1,3451997 1,5271998 1,6061999 1,8072000 1,9682001 2,1052002 2,8582003 3,1922004 3,5842005 4,3152006 5,4282007 6,5622008 8,9952009 10,738
Table 3: Remittance Inflows to Bangladesh US$ (millions), Source: World Bank (2009)

Remittances 32
Chart 4: Remittance Inflows to Bangladesh (US$ millions), Source: World Bank (2009)
It is very difficult to find longitudinal, bilateral information on how much of Bangladesh’s
remittance inflows are actually contributed by Bangladeshi migrants in the UK. The World Bank
bilateral remittance estimates using Migrant Stocks, Host Country Incomes, and Origin Country
Incomes (in US$ millions)12 revealed that in 2005 Bangladesh received from the UK remittances
amounting to $538m, which constituted 12.5 per cent of all the remittance inflows to Bangladesh
during that year. This made UK the third largest source of remittances (after India, in 2005 –
$1,837m, and Saudi Arabia – $715m, but before the US – $369m and Italy – £103m).
12These data are estimated using assumptions and arguments as explained in Ratha and Shaw (2006) ‘South–
South Migration and Remittances’, Development Prospects Group, World Bank(www.worldbank.org/prospects/migrationandremittances).
-
2,000
4,000
6,000
8,000
10,000
12,0001
976
197
71
978
197
91
980
198
11
982
198
31
984
198
51
986
198
71
988
198
91
990
199
11
992
199
31
994
199
51
996
199
71
998
199
92
000
200
12
002
200
32
004
200
52
006
200
72
008
200
9
Re
mit
tan
ceIn
flo
ws
US
$(m
illio
ns)
Bangladesh Remittance Inflows

Individual Migration Histories – Trends and Patterns 33
Remittance Sending Country Remittance Receiving Country – Bangladesh
India 1,837
Saudi Arabia 715
UK 538
US 369
Italy 103
Table 4: Bilateral Remittance Estimates using Migrant Stocks, Host Country Incomes, and Origin Country Incomes(US$ millions), Top 5 Remittance Sending Countries. Source: World Bank 2005
5. Individual Migration Histories – Trends and Patterns
The trends and patterns of Bangladeshi migration to the UK have already been partially
presented in Section 1, when THEMIS theoretical concepts were confronted with the empirical
reality, and in Section 2, where UK immigration policy outcomes were presented in parallel with
the history of Bangladeshi movements to the UK.
Misbah’s migration history is quite representative of his generation of Sylheti migrants. He
arrived in London at the age of 9 in the late 1960s with his mother. They joined their father who
sent for them. He had already been in the UK for quite some time. Misbah’s father arrived to
earn some money and make a good living for his family. Misbah and his mother moved in with
his father, who could now afford to rent a one-bedroom apartment. Before that he was renting a
room in a shared house in Tower Hamlets. Misbah went to school in London. He grew up
surrounded by his uncles, aunties and cousins. Most of the latter were born and brought up here.
He went out with different girlfriends – one British, one Pakistani. ‘I was quite open-minded. But
it didn’t work out. The values were different. So my family sent me to Bangladesh to get married.
I brought my wife from Sylhet. It was arranged marriage but it worked out well.’

Individual Migration Histories – Trends and Patterns 34
Misbah works as a Welfare Adviser in the Marylebone Bangladeshi Society. He is quite popular
and has many clients who speak well of him. He is an active community worker, conscious of his
roots. What worries him is the following: ‘I took my children to Bangladesh last year. To show
them where we come from. You know, when we landed back at Heathrow my children said: home
at last, home sweet home. Initially I laughed, come on – we have just been to Bangladesh. Both
your parents are from Bangladesh. But later on it made me think, well it is true – my children
were born here. This might well be their home.’
Where To? – Where From?
To systematise the argument: the first pioneer migration from Bangladesh to the UK started back
in 1700, when the East India Company recruited large numbers of seamen, who formed the first
sizeable Bengali community in Britain – they settled in London’s East End. Many took jobs on
the merchant ships, which carried goods between Assam, Bengal and beyond (Ullah and
Eversley 2010, p. 18). These Bengali seamen were commonly referred to as ‘lascars’ (which
comes from the Persian lashkar, meaning ‘military camp’ and al-askar, the Omani word for a
guard or soldier) (Ullah and Evesley 2010, p. 18). They were employed on European ships from
the eighteen to the early twentieth century, yet in all cases they tended to be at the bottom of
British Merchant Navy hierarchies (Wemyss
2009).
The great majority of the Asian seamen from
Bengal came from one district – Sylhet, the
north-eastern area of modern day
Bangladesh, which had fallen under British
rule in 1765. It is not entirely sure why so
many seamen came from Sylhet. Yosuf
Chowdhury, a seaman himself, casts some
light on the particular importance of Sylhet
as the main province through which
mercantile boats filled with tea gathered in
Assam could reach the ports of India
(Chowdhury 1993, p. 29). Sylhet had only waterway communications with the rest of India. As a

Individual Migration Histories – Trends and Patterns 35
result, local people from Sylhet, in response to demands from the flourishing tea trade, boarded
steam ships, enrolled as seamen, and used this opportunity to provide income for their families.
A related explanation, popular among the Bengali seamen themselves, was that it was because
the serangs who were responsible for the recruitment of
lascars on the streets of Calcutta tended to pick their crew
from their own birthplace, which was also Sylhet (Ullah and Eversley 2010, p. 21). This is very
much in line with a more recent narrative of the phenomenon of chain migration of Sylhetis to
London that continued in the 1950s and 1960s up to the 1980s. Adams (1994) in her book Across
Seven Seas and Thirteen Rivers observed the early stages of the formation of chain migration
patterns among the Sylhetis: ‘The Sylhet people were in the ship because they tend to follow each
other, and some went there and others saw them, and they thought they could get jobs too’
(Adams 1994, p. 28).
The chain migration from Sylhet picked up from the mid 1950s. The predominantly male
workers, who arrived in the UK in the 1950s, initially with the intention of earning money and
saving for the future, tended to wait longer than their Pakistani and Indian counterparts before
bringing their families to the UK. However, the 1970s saw a rapid expansion in the Bangladeshi
population as wives and dependants joined their husbands in Britain (Communities 2009, p. 25).
Family migration as a dominant trend continued well into the 1980s and 1990s, when the 1.5 and
second generation of Bangladeshis reached the age when they were considered suitable to marry.
Consequently another wave of Bangladeshi brides followed.
As a result, among all the groups within the Scoping Study, Bangladeshis have the strongest
patterns of particular localities where migration originated from. Within Sylhet in the north-
east area of modern day Bangladesh, they come from a couple of smaller administrative sub-
districts (thanas) – specifically Beani Bazaar, Maulvi Bazaar, and Sunamganj. The Communities
(2009) report shows that Sylhetis constitute 95 per cent of Bangladeshis living in Britain. The
remaining come from the regions of Chittagong and Comilla (Communities 2009, p. 24, cf. Maps
1 and 2).
With regard to the places of settlement in the UK, as already mentioned the great majority of
Bengalis clustered around London’s East End, particularly in the Bethnal Green and
Map 2: Present-day Bangladesh

Individual Migration Histories – Trends and Patterns 36
Spitalfields (Banglatown) Wards of Tower Hamlets. Brick Lane is the heart of Banglatown
(popularised among a wider audience thanks to book of the same name by Monica Ali (2003).)
Kenneth Leech, one of the interviewees in the Swadhinata’s Oral History Project describes the
street in a following manner:
‘In the mid-14th century there was a plan to build a brickchurch. It was the second Christian church in East London.They carried the bricks from an old Roman cemetery calledthe Old Lulworth’s cemetery. They carried the brick fromLulworth field which is [now] Spitalfields. They carried itto Whitechapel Road and The Highway. They carried thebricks [along what later] became known as Brick Lane.Because the church was made of White bricks, peoplecalled it the White Chapel and then gave its name to thearea and eventually to the main road.’ (Eade et al. 2006, p.56).
Other respondents whose individual migration histories were recorded by the Swadhinata Trust
were also very fond, yet not uncritical of Brick Lane. Brick Lane and Banglatown as destination
localities were an inseparable part of their migration experience:
‘Brick Lane? Me and other colleagues … like Jalal, Shiraj and all, we dream about Brick Lane.And Brick Lane is still our pride, especially Banglatown is our pride – that [is] something noother community has done. … As long [as] Brick Lane is there, Bengalis will be there. We [have]got about 30 or 40 restaurants there and we are proud of [this]’ (Akikur Rahman, in Eade et al.2006, p. 56)
‘Brick Lane was quite grotty. I mean back in 1978 it was not as colourful as it is now. The curryhouses by spending their own money have made the area colourful. The shop fronts are colourfuland, of course, a lot of public money has been invested in this area as well. Regeneration moneyfrom the government has [made a] … lot of improvements in the area. But back in 1978 it wasnot such a nice place. So it has improved significantly. (…) a lot of rich people have moved intothe area. They have taken over Victorian places and given them new meanings. The rich peoplethat have moved into the area are not Bengali people. If anything, a lot of Bengali people haveleft the area. I am not against new people coming to the area but Bengali people and also manyworking class White people have moved out of the area, just because they can’t afford to stayhere any more. They have been priced out of the area. That is the significant contrast between1976-78 and now.’ (Rajonuddin Jalal, in Eade et al. 2006, p. 56)

Individual Migration Histories – Trends and Patterns 37
‘Brick Lane has got [a] long history of immigrant workers coming and working. Back in the1930s there was a substantial number of Chinese people [there] … involved in the rag trade –the clothing industry. This was gradually taken over by the Jewish community, all through the’40s and ’50s. In the mid ’60s … it was the Bengali Sylheti community who responded to the callgiven by the government [to] come as there [was] work to be done. I am talking about late ’50s.(…) The Jewish community [was] handing over the clothing industry to the Asian communityback in the mid ’60s. That phenomenon continued right until the end of the 1970s and then webegan to see the Turkish community getting into this trade towards the end of the ’70s and ’80s.Now you will see [that] the majority of the workshops are run by the Turks and there are fewAsians and a few Jews in the rag trade. … There was not [the] significant number of restaurantsthat we see today. There were two known restaurants – The Clifton owned by a non-Bengali[and] The Nazrul owned by a Bengali, [who] we used to call mama and that’s where we used tohave our food.’ (Aloke Biswas in Eade et al. 2006, p. 57).
According to an IOM report
in 2006, 153,000
Bangladeshis resided in
Greater London. 21,000 of
those Bangladeshis clustered
in and around Birmingham,
and a further 15,000 were
distributed among Bradford
and Oldham in the Midlands
(IOM 2007).
Map 3: Banglatown in London, place of highest density of
Bangladeshi population. Detailed Guide of Banglatown is attached as
an Annex to this report (prepared by the council of Tower Hamlets).

Individual Migration Histories – Trends and Patterns 38
Map 3: Geographic Spread of the Bangladeshi Community in the UK, 2006, Source: IOM 2007 based on Census2001

6. Assessment and Identification of Issues to be Explored in Phase 2 39
6. Assessment and Identification of Issues to be Explored in Phase 2
The Scoping Study exercise revealed that Bangladeshis in the UK represent a community that
has been largely (if not over-)studied and mapped in many possible ways (Adams 1994;
Asghar 1996; Carey 2004; Chowdhury 1993, 1995, 2001; Crang 2005; Eade et al. 2006; Fisher
2006a, 2006b; Fishman 2006; Jones 2004; Lamarche 2003; Lichtenstein 2007; Migration
Histories 2010; Sherwood 1991, 2007; Taylor 2004; Ullah 2008; Visram 1986, 2002; Wemyss
2009). It was difficult to add anything new to the richness of the existing material. The migration
‘corridor’ between Sylhet and East London (Tower Hamlets) saw a very well-documented and
intensive population movement from the eighteen century onwards, which initiated a relatively
large-scale low-skilled, chain labour migration and establishment of a Bangladeshi–UK (in
particular Sylhet–East End London) migration system.
If Bangladesh is to be among our three countries of choice, our research must be more theory
focused, well beyond the identification of the macro, meso and micro factors that might have
played a role in affecting the migration system dynamics. There are several points worth noting:
To address our main research question (on the role of pioneer migrants in the expansion
and development of a migration system) in the particular context of Bangladesh means
going back to eighteen-century sources and carrying out primarily historical work with
archives and secondary sources. This is because the migration history between
Bangladesh and the UK goes back 400 years, with the first pioneers arriving around
1700. Unless we propose a different conceptualisation of ‘pioneers’ (e.g. by making them
wave specific, and therefore more recent – limiting their role to the development of the
‘main’ migration from Bangladesh from the 1940s to the 1950s onwards), we cannot see
how relevant this research would be for THEMIS theoretical ambitions.
Bangladeshis nevertheless present an interesting case where the agency of migrants (in
interplay with structural immigration policy factors) could be explored particularly in the
context of the turn in British immigration policy in 1971, and the changing profile of the
Bangladeshi community. The 1971 Immigration Act introduced severe limitations to the
admission of the dependants of Commonwealth Workers, and yet it was in the 1970s that
family migration was considered to be most dominant among the Bangladeshis. The

6. Assessment and Identification of Issues to be Explored in Phase 2 40
interesting question to ask is why has it happened? (Why have male Bangladeshi
migrants – in response to the restrictive requirements – not decided to go back?)
The long history of the settlement of Bangladeshis in the UK presents another related
issue, which became quite crucial during the scoping study: how justified is it still to
term the Bangladeshis ‘migrants’? The first generation of Bangladeshis, indeed born in
Asia, settled in the UK over the course of the 1960s and 1970s, when they were joined by
their families. Their settlement was of course ambiguous, as the majority of them
originally planned to go back to Bangladesh. Many of the first settlers are now elderly
(some have already passed away). It is not the second generation of Bengalis, but the
third, and sometimes even the fourth who form (and are heard in) the community. Not
surprisingly, young Bengalis born and brought up in the UK do not consider themselves
migrants. The term ‘migrant’ for them is negatively loaded, and when used in general
terms might actually contribute towards a sense of marginalisation, exclusion and
alienation, for young people in particular. Bangladeshis in the UK are more of an ethnic
minority, an ethnic community within the wider society rather than a ‘migrant group’.
This is not solely an academic discussion about the labels and applicability of different
terms. It is crucial from the perspective of our final country group selection, as the
groups we select should reflect THEMIS theoretical aims. The settlement issue comes in
here as a factor that needs to be taken into account. The theoretical frames which we rely
upon are crucial. Transnationalism contributed a lot to migration theory, but it may
also have left the false impression that migrants will always remain migrants due to
transnational lifestyles. With regard to many Bangladeshis in the UK, who represent a
very settled community, migration as a process has proven to be strictly time bound and
one which does not continue ad infinitum.
Since the 2000s – despite the continuing rise in numbers of Bangladeshis in the UK
(according to the statistical data) – the feeling we received from the interviewed
community workers was that the community was in decline. The decline took place at
two interrelated speeds: one reflecting the relative deprivation, ethnic segregation and
concentration of the existing Bangladeshi community in the UK, the second reflecting a
reduced growth rate of Bangladeshis in the UK, which statistically became visible only in
the last three years (2007-2009) (yet was referred to in the interviews as characteristic for

6. Assessment and Identification of Issues to be Explored in Phase 2 41
the entire last decade). There is therefore a mismatch between how Bangladeshis perceive
the development of their community, and the official quantitative data. Although this is
always the case (to a certain extent), it is particularly striking with regard to this group.
The decline observable in national statistics was very sharp, and did not follow a bell
shaped curve, as hypothesised in THEMIS. One explanation is of course the inaccuracy
of data. However, the decline in Bangladeshis coming to the UK has been the dominant
discourse within the community over the last ten years. Does this imply a situation of
quantitative evidence ‘catching up’ with community decline, independently of deliberate
immigration policies? (It could be a kind of self-fulfilling prophecy mechanism: ‘People
say no-one is coming from Bangladesh any more, which might in turn negatively
influence the choice of the UK as a destination for prospective Bangladeshi migrants.’)
Bangladeshis are present not only in the UK, but also in other European countries. The
existence of the European Bangladeshi Forum points to links between them. Perhaps it
would be worth exploring these links more deeply, in the context of a Bangladesh–
European migration system.

Bibliography 42
Bibliography
Adams, C. (1994) Across Seven Seas and Thirteen Rivers, London: Eastside Books
Anwar, M. (1979) The myth of return: Pakistanis in Britain since 1800, London: Heinemann
Ashghar, M. A. (1996) Bangladeshi Community Organizations in East London, London: Bangla
Heritage
Carey, S. (2004) Curry Capital: The Restaurant Sector in London’s Brick Lane, London: Young
Foundation
Chowdhury, Y. (1993) Sons of Empire, Birmingham: Sylheti Social History Group
Chowdhury, Y. (1995) The Roots and Tales of the Bangladeshi Settlers, Birmingham: Sylheti
Social History Group
Chowdhury, Y. (2001) Sylhetis in the UK, London: Siloti Translation and Research Centre
Communities (2009) Understanding Muslim Ethnic Communities:The Bangladeshi Muslim
Community in England , London: Communities and Local Government,
www.communities.gov.uk
Crang, P. (2005) Fashioning Diaspora Space: Textiles, Pattern and Cultural Exchange Between
Britain and South Asia 1850-80s, 1980s-2000s, London: Royal Holloway University of
London
Eade, J., A. Ullah, J. Iqbal, and M. Hey (2006) Tales of Three Generations of Bengalis in
Britain, London: Nirmul Committee
Eade, J., C. Peach, and T. Vamplew (1996) ‘Bangladeshis in Britain: The Encapsulated
Community’, in C. Peach (ed.) Ethnicity in the 1991 Census, London: HMSO, pp.150–
60.
Eade, J. (2006) Class and Ethnicity in a Globalising City: Bangladeshis and Contested Urban
Space in London’s East End, London
Eade, J. (2006) ‘The Brick Lane test’, from Embracing Globalisation to the Limits of
Tolerance, pp. 78–91
Fisher, M. (2006a) ‘Working across the seas: Indian maritime labourers in India, Britain and in
between 1600–1857’, Internatioanl Review of Social History 12
Fisher, M. (2006b) Counterflows to Colonialism: Indian Travellers and Settlers in Britain 1600–
1857, Delhi: Permanent Black

Bibliography 43
Fishman, W. (2006) The Streets of East London, Nottingham: Five Leaves Publications
Jones, D. (2004) Exploring Banglatown in London’s East End, London: Tower Hamlets
Lamarche, D. (2003) Bengalis in East London – a Community in the Making for 500 Years,
London: Swadhinata Trust
Lichtenstein, R. (2007) On Brick Lane, London: Penguin Books
Macdonald, I. A. and R.Toal (2010) Macdonald’s Immigration Law and Practice, London: Lexis
Nexis UK
Migration Histories (2010) Moving Here: 200 Years of Migration in England, online source:
www.movinghere.org.uk
Peach, C. (1996) ‘Does Britain have ghettos?’, Transactions of the Institute of British
Geographers 22(1): 216–35.
Sherwood, M. (1991) ‘Race, nationality and employment among lascar seamen 1660–1945’,
New Community 17( 2)
Sherwood, M. (2007) ‘Lascar struggles against discrimination in Britain 1923–1945’ (Public
Lecture, accessed via Ansar A. Ullah)
Somerville, W. (2007) Immigration Under New Labour, Bristol: The Policy Press
Taylor, R. (2004) Walks Through History: Exploring the East End, Derby: Breedon Books
UKBA (2010) UK Border Agency, Students,http://www.ukba.homeoffice.gov.uk/studyingintheuk/adult-students/family/#
Ullah, A. (2008) ‘The Bengali Community and the Docks – the Role of Lascars’, paper presented
at the Museum in Docklands conference, 14 June 2008
Ullah, A. and J. Eversley (2010) Bengalis in London’s East End, London: Swadhinata Trust
Visram, R. (1986) Ayahs, Lascars and Princes: Indians in Britain 1700–1947, London: Pluto
Press
Visram, R. (2002) Asians in Britain – 400 Years of History, London: Pluto Press
Wemyss, G. (2009) The Invisible Empire – White Discourse, Tolerance and Belonging,
Farnham: Ashgate

Bibliography 44
The Evolution of Brazilian
Migration to the UK
THEMIS Scoping Study
International Migration Institute
University of Oxford

Bibliography 45
Table of Contents
Sources ................................................................................................................................................. 46
1. Theoretical Framework of THEMIS................................................................................................. 47
Trends and Types of Migration .......................................................................................................... 49
Current Trends – Diversification ........................................................................................................ 53
Quantitative Picture .......................................................................................................................... 55
2. Policy Changes............................................................................................................................... 59
1960s: British Asylum Policy .............................................................................................................. 59
1980s: Policy paradox........................................................................................................................ 60
1990s and 2000s: Managed Migration Approach and Points-Based System ....................................... 61
The Student-Visitor Category............................................................................................................. 63
3. Institutions .................................................................................................................................... 64
From Personal Ties to Institutional Structures.................................................................................... 64
4. Remittances................................................................................................................................... 69
5. Individual Migration Histories ........................................................................................................ 71
Where to? – Where from?................................................................................................................. 73
6. Assessment and Identification of Issues to be Explored in Phase 2................................................. 75
Bibliography .......................................................................................................................................... 78

Sources 46
Sources
The quantitative picture was provided by the analysis of UK census data between 1901 and 2001,
and Annual Population Surveys (2001–2007) using the country of birth variable.
There is not much research on Brazilians in the UK. Mapping exercises have so far been
attempted by IOM in 2005, and by Evans et al. in 2007 for the Strangers into Citizens campaign.
Both mapping exercises focused on Brazilians in London. A monograph like that of Margolis
(1998) An Invisible Minority: Brazilians in New York City, presenting the history and the
presence of Brazilian migration in a particular destination locality is still non-existent for the UK
context.
There a were few studies which looked at Brazilian migrants via the anthropological lens; they
looked into how Brazilian migrants perceive and structure their time (Cwerner 2001, and PhD
Thesis), their language and identity (Souza 2007, 2008, 2009, 2010a,b), ethnic food and culinary
culture (Aguiar 2009, Barcellos et al. 2009), as well as psychological and psychoanalytical
understandings of the Brazilian migration experience (Garcia 2000, 2002). Sheringham is
currently looking into the role of religion in the everyday lives and imaginations of Brazilian
migrants in London, and the ways in which it enables them to create or maintain links with ‘back
home’ in Brazil within the paradigm of everyday transnationalism (PhD project).
The research on undocumented Brazilian migrants in the UK (London) was pioneered by
Jordan and Duvell (2002) in Irregular Migration: The Dilemmas of Transnational Mobility.
Their book compares the experiences of Brazilian, Polish and Turkish migrants – with the first
group being particularly understudied in Britain. The authors try to understand why these
migrants came to the UK, how they survive here, and the role of support organisations. More
recently the topic of irregular Brazilian migration to London has been attempted by Bloch et al.
(2009) in No Right to Dream. The Social and Economic Lives of Young Undocumented Migrants
in Britain. The most recent mapping study by Evans et al. revealed that 53 per cent of all those
Brazilian respondents who took part in their study shared the ‘visa expired’ immigration status
(2007, p. 11). With no doubt therefore the topic of undocumented Brazilian migration to London

Theoretical Framework of THEMIS 47
is an important one, with some empirical attempts at its exploration, but significantly lacking any
coherent theoretical analysis.
This handful of reports and academic research demonstrates that the phenomenon of Brazilian
migration to the UK is an understudied one. During the scoping study we therefore primarily
relied on first-hand experiences and interviews with community workers and Brazilian media
experts. We interviewed: Carlos Mellinger from Casa do Brasil (a non-profit immigration advice
centre); Roberto Alves and Milena Alves, who run a website for Brazilians in the UK Che con
Leite; Rodrigo Lopes, an author and developer of Lista Brazil (a website where Brazilian
entrepreneurs in London can advertise their businesses for free in English and Portuguese);
Carmen Caberlon (Dialogo Brasil – a platform where different Brazilian organisations can meet
and talk to each other – Carmen represents Naz Project London, which looks after sexual health
and education); Marcello Mortimer (chief editor of Brazilian News, the second most popular
Brazilian newspaper in London); and Francini Mendonça (Executive Director of London Help 4
U, a business establishment for immigration matters). We also contacted researchers on Brazilian
immigration to the UK, Saul Cwerner, Olivia Sheringhan, and Ana Souza (Ana is a convener of
Brazilian Migration to the UK Research Group at Goldsmiths College in London), and they
expressed their interest in and availability to help with our project (capacity building). We did
not manage to speak to the director of ABRAS, the largest Brazilian organisation in London
(however, we did manage to make some links), or the Chief Editor and owner of Leros (the
oldest Brazilian magazine in London; the editor remains in Brazil until September). However,
these organisations were included in the mapping exercise, and the contacts for further potential
research have been established.
1. Theoretical Framework of THEMIS
Unlike with the other THEMIS Scoping Study countries (e.g. Ukraine, Bangladesh or Morocco),
where the available census data starts from a particular year and does not tell us anything about
the history of migration prior to this date (suggesting that migration was non-existent and making
us rely on qualitative or historical accounts), the data with regard to Brazil is longitudinal. It
dates back to 1901.

Theoretical Framework of THEMIS 48
There is however another problem, concerning the reliability of the data.The Census and Annual
Population Surveys give the figures for Brazilians who are legally resident in the UK (born in
Brazil); however with such a large scale of irregular or undocumented migration (cf. Cwerner
2001, Evans et al. 2007, Bloch et al. 2009, and Scoping Study Interviews 2010), the data
seriously misrepresent the actual numbers of Brazilians in the UK.
One thing is however worth noting: while the numbers might be wrong, the general migration
trend curve (with acceleration of migration from 1990s onwards) might still hold true (and has
been largely confirmed in the interviews, and other qualitative sources).
Chart 1: Brazilians in the UK, Source: Census Data, Annual Population Survey (Indexed, 2008 = 100, 2008 =
~56,000)
As we can see from the graph, Brazilian migration to the UK has been expanding since the 1990s
and particularly accelerated in the 2000s. The most recent official figures reveal that in 2008 the
number of Brazilian-born persons in the UK was estimated around 56,000 (APS).
0
20
40
60
80
100
120
140
160
1900 1920 1940 1960 1980 2000 2020
Expanding Migration System

Theoretical Framework of THEMIS 49
Various other sources demonstrate how highly inaccurate this picture may actually be. While the
census of 2001 enumerated just over 8,000 Brazilians in London, the unofficial estimates at that
time indicated that they might number anything from 15,000 to 50,000 people (Cwerner 2001).
In 2007 UK-based Brazilian organisations and analysts estimated the community size to be
around 200,000 in the whole of the UK. The majority of these people (between 130,000 and
160,000) were based in London (Evans et al. 2007, p. 5). Out of this number 30,000 Brazilians
lived in the London borough of Brent.
Three years on (2010), and the figures we received are as follows: 150,000–200,000 Brazilians
in Greater London; 250,000 Brazilians in the whole of the UK (interview with Carlos Mellinger,
Francini Mendonça, Marcelo Mortimer). The most recent UK figures on flows (2007–2010)
reveal that Brazilians continue to come to the UK, yet at a lower rate (decline). In 2007 and
2008, there were 7,040 and 7,715 entry clearances granted, respectively. In 2009 only 5,880
Brazilians were allowed to enter the UK, and in the first quarter of 2010 only 1,275 Brazilians
were admitted (ONS 2010).13
The clustering of Brazilians in London has not changed much: they can be found in the London
boroughs of Brent, Haringey, Hackney, Lambeth and Hounslow.14 The specific localities might
have changed (due to rises in accommodation costs): Brazilians once popular around Seven
Sisters in North London, moved to Bayswater in Central London (now referred to as
Brazilwater); Stockwell in South London is thought to have another sizeable population of
Brazilians (Evans et al. 2007, p. 5).
Trends and Types of Migration
While conducting the Scoping Studies for all shortlisted countries, we discovered a certain
paradox. The lack of quantitative data on the migratory movements between e.g. Bangladesh and
the UK, Morocco and the UK beyond a certain date, was usually compensated by the availability
of historical and other resources which helped to cast some light on the past trends and types of
13This last figure is the lowest, in terms of the first quarter, of the last three years, the numbers for first quarter of
2007 – 1,590, 2008 – 1,940, 2009 – 1,605 (Source: ONS 2010)14
Hounslow due to its proximity to Heathrow airport, and an availability of jobs in services (interview with MarceloMortimer).

Theoretical Framework of THEMIS 50
migration. With respect to Brazil, we have an almost complete series of quantitative data;
however there is no written evidence on the history of Brazilian migration to the UK.
This section of the Brazilian Scoping Study report is therefore solely based on the information
received during the interviews.15 As a result it is incomplete and, due to heavy reliance on
personal memories, it takes us back only to the 1960s.
Our interviewees could recall that the period of military dictatorship in Brazil (1964–1985)
resulted in thousands of Brazilians being deported, imprisoned or tortured. Official censorship
also led many artists into exile. Some of those émigrés who left (or were force to leave) Brazil
have sought asylum in the UK. One of them was Caetano Veloso, a composer, singer, guitarist,
writer, and political activist whose leftist political stance earned him the enmity of Brazil’s
military dictatorship. He was forced to seek refuge in London between 1969 and 1972. When
Caetano was asked about his experience there he said: ‘London felt dark, and I felt far away from
myself’ (Pareles 1992). Nonetheless among the present-day Brazilians in London he is
remembered for his famous song ‘London, London’ describing the serenity of the city in the late
1960s, its calmness, politeness, as well as strangeness and isolation due to… the lack of any
fellow Brazilians:
‘I’m wandering round and round nowhere to go
I’m lonely in London and London is lonely so
I cross the streets without fear
Everybody keeps the way clear
I know, I know no one here to say hello’
(Veloso, London London)
This source, although peculiar, and non-academic in its nature, nevertheless enables us to
observe that in the late 1960s and early 1970s there were very few Brazilians in London. They
mainly consisted of political asylum seekers who fled Brazil during the times of its authoritarian
regime. Their numbers, according to the available census data, oscillated between 2,000 and
4,000 all over the UK. The accounts of loneliness and isolation found in the works of Veloso
15More research into the historical aspects of immigration from Brazil to the UK is definitely needed. Many may
therefore consider this section as incomplete, and we acknowledge this.

Theoretical Framework of THEMIS 51
might well suggest that the Brazilians were dispersed all over England, with few personal links,
and no organisations which could represent their interests and respond to their needs.
This is very different from the contemporary presence of Brazilians in London. Common
knowledge has it that a Brazilian can be ‘found’ in every coffee shop, in every office (during the
cleaning hours), in every kitchen, in every restaurant. Francini Mendonça, who has first-hand
experience of many contemporary Brazilian migrants in London, recalls: ‘Out of all the places I
recently went to dine in the Ivy, one of the most exclusive and expensive restaurants in London.
And fair enough, I found three Brazilians working there. Go to the kitchens, you will definitely
find Brazilians there.’ (interview)
The situation as remembered by Veloso changed in the 1980s, but the number of migrants didn’t
increase at that time to the scale that is observable today. Carmen Caberlon, who lived in London
in the second half of the 1980s, remembers that there was a sizeable Brazilian community, yet
the ties were stronger and ‘everybody seemed to know everybody’ (interview). This
characteristic, stressing personal ties and face-to-face contacts, suggests that the Brazilian
community in London could not have been particularly large. The official figures of the 1980s
record numbers between 7,000 and 9,500.
At that time the Brazilian migrant community mostly consisted of students, or young people who
came to the UK for a couple of years to learn English and ‘to see the world’. ‘It was part of our
growing up experience. Money was important, but not to the extent it is now. Now everybody
seems to work, work and work.’ (interview) This was also confirmed by Francini Mendonça’s
experiences of London in the 1990s: ‘There were mostly students coming here, for a short
period. They would stay in London, learn English, and then perhaps travel a bit around Europe.
Then go home, to Brazil.’ (interview)
When Carmen returned to the UK in the early 2000s she remembers how everything, including
the size of the Brazilian community, had changed: ‘you could hear Brazilian everywhere. There
are Brazilians everywhere. The personal feeling and connectedness are gone. But nowadays
there are many more organisations where Brazilians can turn for institutional help.’ (interview)
Francini, who works with the Brazilian community in London, estimates that the numbers of
Brazilians increased 1000 per cent throughout the 2000s.

Theoretical Framework of THEMIS 52
The change in the scale and the profile of migration became particularly noticeable from 2002
onwards. It was a time of economic crisis in Brazil (interview with Francini Mendonça); many
Brazilians were therefore emigrating. They came to the UK to find work and earn money. They
worked on farms but also in services (restaurants, bars, coffee shops, cleaning).
Many of the interviewees pointed to the change in US immigration policy after 9/11 to explain
why there was such an increase in Brazilian immigration to the UK over the course of the 2000s.
The US has been the traditional destination for economic migration from Brazil (cf. Margolis
1998), and it has restricted its immigration policies resulting in greater securitisation and
criminalisation of migration (being an ‘illegal’ immigrant it the US is a felony according to US
immigration law).
As the channel of economic (largely irregular, cf. Margolis 1998) migration to the US became
severely restricted, many Brazilians might have well decided to embark on the journey across the
Atlantic in order to fulfill their economic needs. Many sources (Jordan and Duvell 2002; Evans
et al. 2007; Margolis 1998; as well as the interviews) indeed point to the fact that the nature of
Brazilian migration has changed. Most recent migration of Brazilians to the UK is
economically driven (cf. the data on labour force status below). Nonetheless the major legal
channels of entry have remained student and tourist visas (invariably throughout the 1990s
and 2000s – interview with Francini Mendonça).
The most recent economic downturn (the 2007–2009 recession), on the one hand, saw many
Brazilians leaving the UK (interview with Rodrigo Lopes, Francini Mendonça). Those who have
been living in the UK for the last five or six years, often with expired visas and undocumented
immigration status, saw their return to Brazil as the only response to the tightening of
immigration controls (i.e. the introduction of the Points-Based System and the 2006 Immigration
and Nationality Act) and to the frequent deportations, which they learn about by word of mouth.
On the other hand, the reduction of the value of the British pound in relation to the Brazilian real
might have made many other Brazilians more determined to stay longer in order to achieve their
economically driven aims of migration. Other community workers observed that although indeed
there was a decrease in the rate of Brazilian newcomers to the UK, those who ‘make it’ are more
determined to stay: ‘Many Brazilians come here with a certain goal – to earn enough to buy a

Theoretical Framework of THEMIS 53
car, to buy a flat, to build a house, to support their families financially – all these back in Brazil.
They come with the idea to earn and save money. The fact that the pound is now worth less than
it was when they arrived doesn’t mean that Brazilians go back. On the contrary, instead of three
years they will stay here four, five, seven years. Whatever it takes...’ (interview with Carlos
Mellinger).
Current Trends – Diversification
The sheer volume of Brazilian migration to London demonstrates that throughout the 1990s and
2000s ‘to emigrate’ has become a much more accessible and popular livelihood strategy for of
many Brazilians. It is no longer exclusively the experience of political opposition or artists
(1960s, 1970s), nor can it only be pursued by young, independent, single people like students or
business persons (1980s). Although it is still predominantly young people who decide to migrate
(as the statistics reveal), it is more common to see among them single mothers (with or without
their children) or fathers providing for their families back in Brazil (Carlisle 2006) from many
different regions of the country, smaller towns and big cities. Francini Mendonça observed that
with the rise of migration from Brazil since 2002 there were entire Brazilian families who
embarked on the decision to migrate to the UK: ‘They would have sold their houses, their boats,
their flats, and with the help of their friends or immigration brokers moved to the UK.’
(interview with Francini Mendonça).
The diversification of immigration from Brazil is perhaps not that difficult to explain, as Brazil is
very diverse. It experienced immigration from Europe in the nineteenth and early twentieth
centuries, particularly to the south of the country (to the states of Rio Grande do Sul, Santa
Catarina, and Parana – see Map 1). Now the descendants of Portuguese, Spanish, Italian and
German settlers look back to their roots and many use their European link to come to the UK.
There are business establishments in London (like London Help 4 U), which specialise in
documenting the European ancestry of many Brazilian immigrants and help them apply for EU
citizenship. Obtaining an EU passport results in legal residence and unrestricted employment in
the UK.
However, migration to the UK is also part of a livelihood strategy for many ‘native’ Brazilians.
For example, regions in the north-east of Brazil, where between the sixteenth and eighteen
centuries slaves were brought from Africa in order to work on sugar-cane plantations, are now

Theoretical Framework of THEMIS 54
also sending migrants to the UK. So is Minas Gerais and the relatively poorer states of the
central west region of Brazil, like Goias (evidence from the interviews).
This corresponds with recent observations that UK immigration has also become much more
diverse. Since the early 1990s the UK has experienced a new immigration flow that – contrary to
that of the post-war years – is mostly from non-Commonwealth countries. Vertovec (2006)
observed that the UK is increasingly characterised by: a sizeable migrant population from
developing countries with no direct colonial link to the UK; a greater linguistic diversity (over
300 languages spoken in London); a proliferation of ‘new’ immigrant groups (e.g. Brazilians,
Colombians, etc.) alongside large and longstanding ‘ethnic communities’; a more fluid duration
and greater variety of legal statuses; the sustenance of greater transnational connections (social,
religious, political etc.) on the part of migrants.
This emerging scenario suggests that it is no longer appropriate to treat the UK as a ‘post-
immigration’ country as much research and policy-making activity has been doing (Pero 2007).
The UK is a country of new immigrations – like Italy or Spain – but with a greater pre-existing
ethno-cultural heterogeneity. This development in British society has been named by Vertovec as
‘super-diversity’ (2006).

Theoretical Framework of THEMIS 55
Map 1: Brazil, Administrative Divisions, Source: Wikimedia Commons
Quantitative Picture
We have already discussed the problems there are with the quality of quantitative data, and
whether the figures reflect the real situation (especially when contrasted with ‘on the ground’
evidence from Brazilian community workers and experts). Despite the huge difference in the
estimated number of Brazilians, the trend represented by the data and agreed by the experts,
seems to be largely shared.

Theoretical Framework of THEMIS 56
There is a consensus that Brazilian immigration to the UK is expanding (or has been over the
last two decades of the 1990s and 2000s). Where the official data significantly differs from the
unofficial estimates is on the speed of that expansion.
Year Number Source
1901 392 Census Data
1911 2433 Census Data
1921 2353 Census Data
1931 2439 Census Data
1951 2289 Census Data
1961 2361 Census Data
1966 2880 Census Data
1971 4254.6 Census Data
1981 7003.8 Census Data
1991 9753 Census Data
2001 13992 Census Data (OECD)
2004 28000 Annual Population Survey (Estimates)
2005 33000 Annual Population Survey (Estimates)
2006 49000 Annual Population Survey (Estimates)
2007 45000 Annual Population Survey (Estimates)
2008 56000 Annual Population Survey (Estimates)
Table 1: Brazilian-born persons in the UK, Source: Census 2001, Annual Population Survey
It is therefore possible to assume that since the expanding trend is a largely shared observation,
so might be the demographic profile of Brazilians as represented in the available data. In other
words, while the numbers might be wrong, the proportions and relations they indicate might well
be representative of the Brazilian community in the UK.
The age structure of Brazilians, according to the census data (2001), revealed that 78 per cent of
the Brazilian-born population in the UK was below 44 years old (between 15 and 44 years).

Chart 2: Age structure of Brazilian-born persons in the UK, Source: OECD, Census 2001
This was largely confirmed in the mapping exercise prepared by Evans
Strangers into Citizens Campaign
revealed that 82 per cent of their respondents were below 40 years old.
The 2001 census reveals a significant femini
women, and 39 per cent men). This was again confirmed by Evans
qualitatively by Carlisle (2006).
Chart 3: Sex ratio of Brazilian-born p
0 1000 2000
0-14
15-29
30-44
45-59
60-69
70 or older
Age Structure of Brazilians in the UK
Female61%
Sex Ratio
Theoretical Framework of THEMIS
born persons in the UK, Source: OECD, Census 2001
This was largely confirmed in the mapping exercise prepared by Evans
Strangers into Citizens Campaign. The survey data they gathered over the course of 2006
of their respondents were below 40 years old.
2001 census reveals a significant feminisation of immigration from Brazil (61
men). This was again confirmed by Evans et al. (2007), and re
qualitatively by Carlisle (2006).
born persons in the UK, Source: OECD, Census 2001
2000 3000 4000 5000 6000 7000
Age Structure of Brazilians in the UK(2001)
Male39%
Sex Ratio
Theoretical Framework of THEMIS 57
This was largely confirmed in the mapping exercise prepared by Evans et al. (2007) for the
. The survey data they gathered over the course of 2006
ation of immigration from Brazil (61 per cent
(2007), and re-affirmed
7000

Theoretical Framework of THEMIS 58
As far as the labour force status is concerned, in 2001 Brazilians came to the UK mostly to find
work (55 per cent). This could have been an indicator of the expansion of economic migration
throughout the 1990s. This is again in line with what the other sources have suggested. Margolis
(1998) reported that economic and professional considerations had motivated some two-thirds of
those surveyed to leave Brazil and seek their fortunes in the US. An uncertain economic future in
Brazil, along with the prospect of being able to earn and save abroad had combined to produce
what Margolis (1998, p. 12) termed a ‘What have I got to lose?’ alternative for many Brazilians.
For the UK, Jordan and Duvell (2002) found that Brazilians had been motivated to come to
London by economic gain, and also the desire to acquire knowledge or to gain experience. In the
survey by Evans et al. (2007), 49.4 per cent of the respondents indicated that they came to the
UK to study (with the idea of working) or (openly) to work and save money.
With regard to the THEMIS theoretical framework the numerous sources point to a conclusion
that Brazilians in the UK is an expanding migration. The picture is however in many places
unclear due to the scarcity of empirical evidence (no randomly sampled survey, only small-scale
qualitative evidence). THEMIS empirical research tools therefore provide a unique opportunity
to gather more data and analyse more in-depth the relatively recent phenomena of Brazilian
migration to the UK.
Chart 4: Labour force status of Brazilian-born persons in the UK, Source OECD, Census 2001
55%
5%
36%
4%
Labour Force Status
employed
unemployed
inactive
unknown labour forcestatus

Policy Changes 59
2. Policy Changes
As already noted in Section 1, the qualitative evidence gathered from the interviews has it that
the few Brazilians who migrated to the UK in the 1960s were asylum seekers. There is limited
documentation of the history of refugees and asylum seekers in London, and it is therefore
impossible to provide a comprehensive overview of refugee migration to the city, although
London was definitely the place where the majority of them would stay. Much of the literature
provides a national perspective of the history; London-specific references have been extracted
from the national context to provide the basis for much of this piece (Price 2006). Price observes
that much of the literature focuses on the settlement of specific national or ethnic groups, and
some groups – like Brazilians – are under-researched, if not left out altogether; this is particularly
true for newer refugee movements.
1960s: British Asylum Policy
The notion of ‘asylum’ or ‘refuge’ has existed in the UK since the Middle Ages, yet those who
we would today call ‘refugees’ were subsumed under the generic term ‘alien’ well into the
twentieth century. The 1905 Aliens Act was the first piece of legislation to enshrine the concept
of asylum in British law, although neither this term nor ‘refugee’ were stated in the statute (Price
2006). The 1914 and 1919 Acts were attempts to control entry, facilitated by the introduction of
passports. The coupling of direct and indirect surveillance (customs officials and frontier guards,
plus the central co-ordination of passport information) becomes one of the distinctive features of
the nation-state.
No legal category of a refugee existed until the 1951 UN Convention on the Status of Refugees,
and no formalised asylum system was established until 1993; hitherto asylum had been dealt
with under immigration laws. Admission of refugees meant in practice that they were ‘left alone’
and not expelled or forced to leave the country. Nonetheless, the practice of granting refuge was
commonplace, although the numbers arriving were relatively few and no well-defined criteria
applied to those seeking asylum (Dallal, Stevens 2004).
The immigration policy of that time stated that when an asylum applicant was successful, the
residence permit was issued for an initial period of five years (‘leave to remain’). When an

Policy Changes 60
applicant was not recognised as a refugee or as in need of humanitarian protection s/he could still
be given a temporary residence permit (‘discretionary leave to remain’). During this time, s/he
could not travel to the country of origin. Limited leaves to remain, if criteria are met, can
eventually be translated into an indefinite leave to remain (ILR), which is a permission to stay
and settle down permanently in the UK (UKBA 2010a).
Asylum in Britain has always been granted at the discretion of the Home Office, and is therefore
susceptible to the whims of the holder of that office and to the government of the day. Shifts in
public opinion towards refugees can quickly result in new legislation and influence the
implementation of asylum policy. Gradually, the modern practice of asylum, recognising the
territorial integrity of states and the right to control entry to one’s territory, was recognised as the
norm: no state had the right to enter another state in pursuit of a fugitive (cf. Schuster 2002).
1980s: Policy paradox
It was in the 1980s when the profile of Brazilian immigration to the UK changed. From the few
political asylum seekers in the 1960s and 1970s, it was now mostly students, entrepreneurs and
workers who became more and more visible. The decade of the 1980s (particularly its second
half) therefore presents a certain paradox. While the general trend in British immigration
policy was towards restricting immigration and ‘closing the gates’ (especially with respect to
‘traditional’ sending countries), Brazil made steps towards the liberalisation of emigration
policy for its citizens.
The British focus on New Commonwealth immigration could perhaps be held responsible for the
UK’s ‘ignorance’ (in the context of respective immigration policy) of the migration flows from
new sending countries, like Brazil. This observation has many important consequences
especially in the light of the hypothesis that it was the more intensified flows (of students, and
‘economic’ pioneers) in the late 1980s which gave rise to the current volumes of Brazilian
migrants in Britain.
The developments in immigration law in Britain in the 1980s and 1990s reflected the battle
between the exclusionary imperatives of immigration policy to the poor countries of the world,
on the one hand, and the humanitarian imperatives of international human rights law on the other

Policy Changes 61
(Macdonald et al. 2010). Visa controls (introduced for Commonwealth citizens in 1986) and
carrier sanctions (1987 Immigration (Carriers’ Liability) Act) were thus calculated to stop
refugees and others arriving in Europe. British immigration policy since the 1980s has severely
restricted the legal channels of admittance of refugees and asylum seekers from the ‘traditional’
refugee sending countries. As a result, the new immigrant groups started becoming more
noticeable on the British map.
From the Brazilian perspective, the political situation made emigration a more widely accessible
experience. During the authoritarian rule it was very difficult to obtain a passport and permission
to leave the country (interview with Marcelo Mortimer). Before departure one had to pay a high
amount of levy to the state authorities as a ‘guarantee’ of one’s return. There were fewer airlines
in operation, therefore the voluntary emigration experience, particularly to Europe, could have
been enjoyed only by a ‘chosen’ few (usually known to the authorities). On the other side of the
coin of emigration were the politically persecuted persons who were forced to go into exile.
In 1985 Brazil returned to civilian rule. In the democratic processes of liberalisation, the state
policy towards its citizens who wanted to leave the country also changed. It became easier to
emigrate, passports became more popular, and the state no longer required people to leave a
substantial financial deposit. Economic liberalisation contributed to the fact that the travel
infrastructure improved greatly – the number of airlines, travel agencies, and visa facilitation
services has mushroomed since the late 1980s (interview with Marcelo Mortimer). English, as a
language, has an important place in the national educational curriculum; it has also became more
widely taught in numerous private schools in bigger towns and cities (interview with Roberto
and Milena Alves).
1990s and 2000s: Managed Migration Approach and Points-Based System
With regard to immigrants from Brazil, the last three immigration Acts – the 1999 Immigration
and Asylum Act, the 2002 Nationality, Immigration and Asylum Act, and the 2006 Immigration
and Nationality Act – present a compilation of different measures, but have at their heart four
main themes:
e) tidying up measures
f) removing and restricting rights of appeal (in an event of denial of entry)

Policy Changes 62
g) creating a new system of employer sanctions to stop illegal working by migrants and
h) monitoring, surveillance, and more co-ordinated policing of migrants old and new on
the basis of seeking out crime, people smuggling and terrorism, and collecting vast
new databases on all third-country nationals (i.e. those who are not British or
European Economic Area [EEA] citizens) (Macdonald et al. 2010).
In practical terms under the Labour Government (1997–2010) the changes in immigration policy
resulted in:
6) tightening of immigration controls
7) selective admission focused solely on highly skilled migrants and migrants with
skills that are in deficit in the UK
8) severe limitations in legal channels of entry for low-skilled migrants from outside the
EEA
9) access to labour market by students limited to 20 hours per week
10) unlimited access to labour market by spouses of primary workers (usually admitted
under the Work Permit or Highly Skilled Migrant Programme [HSMP] schemes, since
June 2008 – Tier 1 and Tier 2).16
Therefore Brazilians who wish to undertake any forms of paid employment in the UK need to
apply for entry clearance (visa) either under the Work Permit Scheme (since 2008 – Tier 2), or
the Highly Skilled Migrant Programme (since 2008 – Tier 1).
Another way for Brazilians to come to the UK in the 1990s and 2000s was on a Student Visa.
Many would register with the help of a local (to Brazil) agency for an English course in London.
The course had torun during the week and involve at least 15 hours of organised daytime study a
week (UKBA 2008). It had to be offered either by a publicly funded institution of further or
higher education (a university) with maintained records of enrolment and attendance, a genuine
private education institution; or an independent fee-paying school. The student had tobe
registered with the UK awarding body if s/he wanted topursue a degree at a private education
16A broad overview of those was presented in the Scoping Study Report on the Ukraine. They are of course also
applicable with regard to any future migration from Brazil. Therefore, in order not to duplicate the analysis, thissection refers the reader to the respective sections of the Ukrainian report.

Policy Changes 63
institution. The student also had to be able to demonstrate the ability to pay for the fees and
accommodation for him or herself and any dependants, without full-time work or help from
public funds (UKBA 2008).
Coming to the UK as a student would allow Brazilians to work for 20 hours a week for the
duration of their course. This Student Visa was discontinued in 2008 and replaced by Tier 4 –
Students within the Points-Based System. This also means tighter immigration checks and the
necessity to apply for a Student Visa from Brazil. Under the new system, colleges and
universities who wanted to teach non European Economic Area (EEA) nationals must have
obtained a licence issued by the UK Border Agency. Only licensed institutions could then
sponsor non EEA students to come to study in the UK (UKBA 2008). This significantly limited
the number of institutions which could admit international students to come and pursue a course
(e.g. English language tuition).
Other immigration channels, which could lead to temporary employment, and were in operation
in the 1990s and 2000s (e.g. the Au Pair or the Working Holidaymakers Scheme), were also
discontinued in 2008. They were replaced by the Youth Mobility Scheme within Tier 5 of the
Points-Based System for immigration to the UK, and opened to young people only from few,
carefully selected participating countries (Australia, Canada, Japan, New Zeland, Monaco).
Brazil is not among the participating countries (UKBA 2010b).
The Student-Visitor Category
Nonetheless Brazilian nationals who intend to stay in the UK for less than six months as a
tourist, business visitor or student do not normally need to apply for a visa before
travelling. At the UK border they would need to show a return ticket, as evidence that they
intend to leave the UK at the end of their stay. They are also required to submit evidence of
sufficient funds (to pay for their stay and accommodation).
Brazilians who wish to enter the UK as student-visitors (for less than six months) need to prove
at the UK border that they have enrolled on a course, have adequate accommodation and
sufficient funds to pay for their upkeep and university/college fees throughout their stay. As
student-visitors they are not allowed to work in the UK (UKBA 2010c). Therefore if the
course includes a work placement or if they intend to work while in the UK (up to 20 hours a

Institutions 64
week) or extend their stay for more than six months they will not be eligible to enter as a student-
visitor. As a result they would need to apply for a regular student visa (back in Brazil) under
Tier 4. Student-visitors must leave the UK upon the completion of their course (within six
months of admission), and cannot re-apply for extension within the UK.
The evidence from the interviews seems to suggest that since the Points-Based System has been
in operation (2008), it has become more and more difficult to be admitted to the UK under the
student-visitor scheme. Tightening of immigration controls resulted in less ‘at the border’ visa
applications being accepted for processing, and many Brazilians wishing to enter the UK in this
way actually being turned back at the airports (source: anecdotal, personal evidence, interview
with Rodrigo Lopes).
The importance of the student-visitor status (less than six months’ stay) stems from the fact that
this appears to be the main channel through which Brazilians enter the UK and then slip into the
irregular, undocumented (‘visa-expired’) status. Evans et al. in their London survey
demonstrated (echoing the findings of Margolis [1998] in the US) that over one half of all
Brazilians in London were in fact undocumented, with ‘visa expired’ status indicated by the
majority of the respondents – 53 per cent (Evans et al. 2007, p. 11). As these findings indicate,
Brazilians tend to remain in the UK beyond the time limit on their visas (cf. Bloch et al. 2009, p.
16).
3. Institutions
From Personal Ties to Institutional Structures
The interviews revealed an interesting shift in the types of institutions Brazilians established in
the UK over the course of their relatively recent migration (1960s–2000s). The personal ties,
informal gatherings, parties, few clubs and a shop, where Brazilians used to hang around with
each other in the late 1980s have gradually been transformed into a vibrant and lively network of
non-profit organisations, churches, business establishments, and media.
Carmen Caberlon remembers that when she used to live in London in the late 1980s, there was
more of ‘a connection’ among Brazilians: ‘We all used to know each other, if not on a personal

Institutions 65
basis then at least you would recognise different faces. People were much more relaxed, they did
not think that much about money as they do now. We all treated London as an interesting
experience, as a way to learn English and meet new people.’ (interview). With the intensification
of migration movements in the 1990s, and the changes of the migration patterns towards
economically driven migration, the face of the Brazilian institutions in the UK has changed.
In the mid 1990s the first Brazilian magazine in the UK was established – Leros. It was
distributed for free and relied on income solely from the advertisers. This would suggest that
there was a significant Brazilian population in London already, as the services and goods
advertised in Leros were primarily targeted towards the Brazilians in London. As the magazine
developed, new companies were willing to advertise their businesses on its pages. The fact that
Leros celebrated its 18-year anniversary (in 2009), and is still primarily driven by the will of
businesses to advertise on its pages, would seem to indicate that the consumer needs of the
Brazilian community in London are also expanding. Since the 2000s Leros has not been the sole
magazine available for Brazilians in London. It has increasing competition from Jungle Drums,
Brasil.Net, REAL magazine, Brazilian News and others. The main advertisers are: Brazilian
travel agencies, money sending companies, flight operators, Brazilian shops, cafes and
restaurants in London.
The rate and source of advertisements in the Brazilian media in the UK allows for an observation
that the Brazilian migration business is doing well. It increased rapidly from 2002 onwards
(interviews). Many Immigration Advice Offices, Recruitment Agencies, and Travel Agencies
started their operation in Brazil and in London. They charged money for arranging immigration
papers, tourist visas (cf. Bloch et al. 2009: Case Study – Berenice, p. 71), plane tickets,
accommodation upon arrival and jobs in the UK. Others would go further and ‘arrange’ bogus
European passports, false documents, or National Insurance Numbers for those already in the
UK (interviews with Carlos Mellinger, Francini Mendonça). One of our interviewees referred to
this phenomenon as the Immigration Mafia. Regardless of its type (migration industry or migrant
organisation) the evidence gathered during the Scoping Study seems to suggest that the Brazilian
community in the UK throughout the 1990s came a long way from one based on intimate,
personal relations to one connected via various institutional structures.

Institutions 66
Many Brazilians in London are also gathered around churches (Catholic and Pentecostal). There
is a Brazilian Chaplaincy in East London. The main Brazilian mapping exercise in London
(Evans et al. 2007) relied on churches in East and Central London for the distribution of their
survey questionnaires. This exercise resulted in 423 returns,17 and although it was not
representative of the whole Brazilian community it nevertheless reflected the situation of many
Brazilians living in London.
The website of the Brazilian Embassy in London has a database of various Brazilian
organisations in the UK, subdivided into Academic Institutions and Organizations, Art
Organizations, Charities and Community Associations, Sport, Music and Dance, and Cuisine
(Brazilian Specialties).
The largest platform of interaction for Brazilians in the UK (London) is Diálogo Brasil. This
organisation brings together different entities (Brazilian or interacting with Brazilians) and
individuals in the UK, with the objective of acting as a platform for discussion of the interests of
Brazilians living here, as well as helping to increase the participation of Brazilians in the effort to
promote Brazil in the UK in various sectors: political, economic, commercial, religious,
academic, cultural and social.
One of the members of Diálogo Brasil is ABRAS, Brazilian Association in the United Kingdom.
ABRAS is by far the largest of the community associations; it provides various social services
for the Brazilian community in London, targeting the general welfare of Brazilians, and creating
a community spirit and union, as well as increasing the sense of citizenship and ‘Brazilianness’
among immigrants. In 2006 ABRAS was successfully registered as a company limited by
guarantee, not for profit, according to the status recorded. With the move to new headquarters in
2007, it was possible to increase the number of services offered to members and visitors, such as
photocopying, fax transmissions and receptions, scanning, mail boxes and a room for smaller
events such as lectures, courses and seminars. As per the information on the website
(http://www.abras.org.uk/ ) ABRAS has 600 members.
17 As a comparison, a similar exercise by IOM in 2006, which did not rely on churches as the survey distribution
points, resulted in 65 returns (IOM 2006).

Institutions 67
Another member of Diálogo Brasil is Naz Project London, which provides sexual health and
HIV prevention and support services to targeted Black and Minority Ethnic (BME) communities
in London. NPL aims to educate and empower communities to face up to the challenges of
sexual health and the AIDS pandemic, and to mobilise the support networks that exist for people
living with HIV/AIDS. NPL also provides training services to voluntary, community and
statutory organisations, as well as a wide range of free resources.
The major need of Brazilians in the UK (London) is to address matters related to immigration
law. The interviews with the community workers revealed that approximately 60 per cent of all
the problems that Brazilians seek help with are focused around one question: How to be legal?
Within ABRAS there is a section responsible for helping Brazilians in this respect. Due to the
volume of the phenomenon, this particular service has expanded in recent years. In London there
are a couple of organisations dedicated solely to helping with immigration matters. The Scoping
Study revealed that these could, in turn, be subdivided into non-profit and business
establishments.
Casa do Brasil em Londres (registered in 2009) is a non-profit organisation which provides
services of legal advice by lawyers registered with the Law Society or OISC. It also provides
psychological counselling; social assistance; help with searching for jobs and accommodation;
teaching; and general well-being. According to its website: ‘The main purpose of Casa do Brasil
em Londres is to unite the Brazilian Community, encouraging them to debate experiences in
talks or open chats, as a way to help the newcomers – tourists, students or workers – to
understand how is life out their own country and the best way to live here feeling “at home” just
as in Brazil’. The organisation also promotes cultural events, in a daily space for the community
to socialise in, where they will be able to find a coffee shop, internet access, a library, a Brazilian
products shop and items of interest to the community.
During the Scoping Study we interviewed Carlos Mellinger, the president of the organisation. He
confirmed that attending to immigration-law related matters is indeed the main concern of the
majority of his clients: ‘We are busy five, six days a week. You will always find someone waiting
to be seen. And this is without any advertising’.

Institutions 68
While not disclosing the credentials of his clients Carlos reckoned that since the Liberal
Democrats scrapped their earlier ideas of regularisation, the main route to legal immigration
status for many of his clients is marriage, either to British or EU nationals. In the majority of
cases this is not a bogus marriage. The case work reveals that most of the clients ‘slipped’ into
irregularity – they were cohabiting with their British or European partners for many years but
had not regularised their position. This seems to confirm the observation made by Evans et al.
(2007) that Brazilians in London generally do not think of themselves as settlers. It is usually
serious settlement plans that bring with them questions of legality of one’s status and
regularisation. Instead of attending to the immigration matters first, Brazilians think of their stay
as temporary, one that will take only as long as it is necessary to save money and go back home.
In practice, the planned duration of their stay varies over time, and Brazilians who planned to
stay abroad for few months end up staying for many years without attending to immigration
matters enabling them to settle permanently (Evans et al. 2007, p. 11).
An example of an immigration advice business establishment is London Help 4 U. It was set up
in 2001 by Francini Mendonça, in 2007 it opened branch in São Paulo. We interviewed Francini
for the Scoping Study. London Help 4 U specialises in Visa Renewal and Visa Application
under Tier 1, 2, 5 and 5, same-sex partnership visas and family reunification. It offers help
relating to setting up a company (self-employment), P45 and P60 tax form-filling in the UK. The
legal advisers who work for the company are OISC certified. London Help 4 U also offers help
in obtaining British or European (Italian) citizenship. The services offered have prices attached
to them which range from £85 (tax return) to £400 (visa application). Each month the agency is
responsible for the renewal of more than 40 study visas for students already living in the UK and
20 travelling in different countries. Currently, many similar agencies are in operation both in
London and in Brazil (Interview with Roberto Alves).
The Scoping Study also revealed a thriving niche of various websites and internet gateways for
Brazilians in the UK (London) aimed at networking, advertising, help with immigration matters
and exchange of migration experiences, such as:
Lista Brasil (http://www.listabrasil.com/)
Cha con Leite (http://www.chacomleite.com/)

Remittances 69
Brazil Link (http://www.brazilink.org/tiki-index.php )
Oi Londres (http://www.oilondres.com.br/)
Brasilieros em Londres (http://www.brasileirosemlondres.co.uk/ )
4. Remittances
For Brazil the data on remittance inflows exists since 1975. The data gathered by the World
Bank only capture remittances sent through formal channels such as banks and money transfer
operators. Currently, no uniform and authoritative historical data on informal flows exist. Given
the widespread use of informal remittance channels in many countries (which is particularly true
with the high rate of undocumented Brazilian immigrants in the UK), the remittance data
presented should be regarded as underestimates of the total flows.
Year 1971 1972 1973 1974 1975 1976 1977 1978 1979 1980
Brazil 82 81 61 113 73 111
Year 1981 1982 1983 1984 1985 1986 1987 1988 1989 1990
Brazil 124 57 29 46 40 40 42 32 120 573
Year 1991 1992 1993 1994 1995 1996 1997 1998 1999 2000
Brazil 1,110 1,791 1,247 2,068 3,315 2,527 1,982 1,642 1,862 1,649
Year 2001 2002 2003 2004 2005 2006 2007 2008 2009 2010
Brazil 1,775 2,449 2,821 3,575 3,540 4,253 4,382 5,089 4,234Table 3: Remittance inflows US $ (millions), Source: World Bank (2009)

Remittances 70
Chart 5: Remittance inflows US $ (millions), Source: World Bank (2009)
Brazil experienced a sharp rise in remittances from the late 1980s up to the mid 1990s. This
reflects the earlier observations about the rise in emigration rate among Brazilians, due to re-
democratisation and the accessibility of migration as a livelihood experience from 1985. The
second half of the 1990s brought with it a decline in remittances, only to be followed by a sharp
rise throughout the last decade (2000s).
It is very difficult to find longitudinal, bilateral information on how much of Brazil’s remittance
inflows is actually contributed by Brazilian migrants in the UK. The World Bank bilateral
remittance estimates (see Table 4) using Migrant Stocks, Host Country Incomes, and Origin
Country Incomes18 (in millions of US$) revealed that in 2005 Brazil received from the UK
remittances for the amount of $59m, which would constitute only 1.7 per cent of all the
remittance inflows in 2005. This placed the UK in 11th place among the remittance-sending
countries.
18These data are estimated using assumptions and arguments as explained in Ratha and Shaw (2006) ‘South–
South Migration and Remittances’, Development Prospects Group, World Bank(www.worldbank.org/prospects/migrationandremittances).
0
1,000
2,000
3,000
4,000
5,000
6,000
1975 1977 1979 1981 1983 1985 1987 1989 1991 1993 1995 1997 1999 2001 2003 2005 2007 2009
Brazil

Individual Migration Histories 71
According to World Bank remittance estimates for 2005, the largest amount of remittances was
sent to Brazil from Japan ($1,054m), the US ($921m), Spain ($225m), Paraguay ($161m),
Portugal ($159m), Germany ($122m), Italy ($113m), France ($73m), Argentina ($72m), and
Switzerland ($64m).
Country Sending Remittances Country Receiving Remittances – Brazil
Japan 1,054
US 921
Spain 225
Paraguay 161
Portugal 159
Germany 122
Italy 113
France 73
Argentina 72
Switzerland 64
UK 59
Table 4: Bilateral Remittance Estimates using Migrant Stocks, Host Country Incomes, and Origin Country Incomes(millions of US$), Top 10 Remittance Sending Countries and the United Kingdom. Source: World Bank 2005.
5. Individual Migration Histories
Rodrigo Lopes arrived in the UK in the early 2000s as a student. He was a university student
back in Brazil. He initially wanted to come to the UK only for a couple of months to better his
English. He was therefore advised to choose the student route. With the help of a specialist
agency back in Brazil, he enrolled on an English course, and arranged for his travel and

Individual Migration Histories 72
immigration documents. He travelled to the UK with another person, also a client of the agency.
Although they did not know each other at that point, Rodrigo found out later (from the personnel
of that specialist agency), that although he was admitted to the UK, the other student was send
back to Brazil. Rodrigo used his story to explain the risk and precariousness connected with
entering the UK, even then – in the early 2000s: ‘You never knew whether they would let you in
or not. It was always a mystery to me, why I was allowed in and he was not’. He and his travel
companion used the same agency, had the same papers, were both men and around the same age.
But Rodrigo was granted entry clearance at the British airport, while the other Brazilian was not.
Rodrigo was studying English in London. He also worked. However, unlike his fellow Brazilians
he met during his stay, he preferred not to work beyond the 20 hours he was allowed to by law.
He remembers that life was hard back then, and the money he earned working four hours per day
hardly sufficed to cover his accommodation in London: ‘It was hard, it was very hard. You
cannot support yourself financially in London if you work only for 20 hours a week.’
Rodrigo, although born and brought up in Brazil, has Italian roots. When his visa for the UK was
about to expire he moved to Italy in order to arrange for his Italian passport. He spent about a
year in Italy, as the process was very bureaucratic, time-consuming and took a lot of effort.
Rodrigo learnt Italian while in Italy and reconnected with his family.
Upon receiving his Italian passport he decided, now without any fear of immigration officers, to
return to London. Rodrigo therefore represents a significant proportion of the ‘visible’ Brazilian
population in London, who – in contrast to the undocumented Brazilian immigrants (cf. Bloch et
al. 2009) – openly admit their Brazilian nationality, participate in cultural events and engage in
community life as they have dual citizenship. The mapping exercise by Evans et al. revealed that
Brazilians with European Citizenship constituted 11 per cent of all the surveyed immigrants
(2007, p. 11).
Rodrigo liked being back in the UK: ‘You know London has got the thing. And I could speak
English better than Italian to look for job in my profession.’ Changing his legal status – from
temporary visa to residency based on his EU citizenship – made a big difference to him and his
family. Rodrigo has been living in London for five years now. He secured a job in a high-profile
company. This year he and his wife are buying a flat in South-West London.

Individual Migration Histories 73
Rodrigo does not have serious settlement plans (however the fact that he is buying a flat might
actually suggest the opposite); he and his wife think of returning to Brazil at some stage. To what
extent these are real plans, and to which extent they seem to reflect the Brazilian ‘myth’ of return
(cf. Evans et al. 2007) – it is difficult to tell. Nevertheless Rodrigo observed that many of his
friends left London over the last two years: ‘Many people went back to Brazil. We don’t know
whether it is for good or just until they realise that life in Brazil has changed and they would try
to come back to London. Like people on a swing, really long swing. We don’t have many
Brazilian friends who stayed in London; most of them went back over the last two years. They
overstayed their visas, and when the economic downturn hit England, they said enough is
enough.’
Where to? – Where from?
There has not been much research in the UK documenting the specific localities accompanying
the trends and patterns of Brazilian migration and settlement.
Those Brazilians with European passports and therefore European ancestry are said to come
from the south of Brazil, from states such as Rio Grande do Sul, Parana, Santa Catarina, São
Paulo, and Minas Gerais. They are the descendants of the many European settlers who arrived
in Brazil in the nineteenth and twentieth centuries. Although completely reliable data are not
available, Szymanski and Bogus estimate that between 1836 and 1968 the largest contingents of
immigrants to Brazil were Portuguese and Italians, totalling 3.38 million people. This group was
followed by Spanish, German and Japanese immigrants, who together accounted for 1.22
million, and a third group, comprising Russians, Austrian, Turks, Poles and French immigrants
totaling 400,000 (Szymanski and Bogus 2005, p. 53). It is said that most of these settlers headed
for the rich regions of south-eastern and southern Brazil. In the south-eastern states of São Paulo,
Minas Gerais, and Rio de Janeiro they were housed on the coffee farms, where they worked and
received salaries. In the southern states – Parana, Santa Catarina, and Rio Grande do Sul – they
typically formed the middle class of landowners (settled on land of their own) (Szymanski and
Bogus 2005, p. 53). Their descendants, who invoke the ius sanguinis and claim their European
citizenships mainly therefore come from these southern and south-eastern states of Brazil.
It is also said that the majority of Brazilian immigrants come to the UK (Europe) from the
southern and south-eastern states because the density of the population there is the highest in

Individual Migration Histories 74
the whole of Brazil (interview with Marcelo Mortimer). The tourist and travel agency
infrastructure is well developed there (much better than in the state of Amazonas or Para for
example), and numerous schools of English and immigration agencies give the impression that
the ‘migration experience’ is within reach of many Brazilians (not only those with European
ancestors).
Also, due to the change in US immigration policy after 2001, and the tightening of the border
controls, people from Minas Gerais, who traditionally used to go to the US, have in the 2000s
turned to the UK, instead. ‘These people they have mobility in their blood. If they can no longer
go to the US, they will come to the UK and make others to follow their footsteps.’ (interview with
Francini Mendonça). The bottom-up migration industry, consisting of travel agents; informal
immigration offices; immigration brokers charging money for ‘arranging’ a plane ticket,
‘arranging’ immigration papers, or ‘arranging’ a job, with the main focus on the UK,
mushroomed in Minas Gerais.
However, as mentioned already Brazil is very diverse (culturally and ethnically). The Brazilian
immigrants come therefore from a wide range of localities in Brazil. The ethnic composition of
Brazilians in London seems to suggest that a large group of them comes from the north-eastern
states (interview with Marcelo Mortimer). They are the descendants of the Africans who were
brought there by Portuguese colonisers to work on the sugar-cane plantations. Immigrants
coming from these traditionally agricultural states work on farms all over the UK (particularly in
Norfolk and Sussex).
Also many of the Brazilan agricultural workers in England come from the Brazilian state of
Goiás (in the central west region, neighbouring Minas Gerais). Goiás is the Brazilian leader in
crop production. Agriculture represented 2 per cent of the GDP of the state, with great
production of sugar cane, soybeans, corn, tomato, rice, cotton, manioc and beans.
In the UK the great majority of Brazilians settle in London. As mentioned in Section 1, they can
be found in the London boroughs of Brent, Haringey, Hackney, Lambeth and Hounslow.
Outside London, according to IOM estimates the other localities where Brazilians cluster are: the
Midlands (Birmingham), Norfolk, the north of England (Manchester), and the south coast
(Brighton).

Assessment and Identification of Issues to be Explored in Phase 2 75
Map 3: Geographic spread of the Brazilian community in the UK, 2005, Source: IOM 2005 based on Census 2001(note: figures are highly underestimated).
6. Assessment and Identification of Issues to be Explored in Phase 2
Out of the all six countries shortlisted for the Scoping Study immigration from Brazil (perhaps
together with Egypt) is the most understudied one. It could be said (with some authority) that
the literature review on Brazilian immigration to the UK (London), as presented in the
introduction to this report is an exhaustive one. This seems to suggest that the Brazilian
presence has not been properly analysed.

Assessment and Identification of Issues to be Explored in Phase 2 76
As per the quantitative data there are only two surveys on Brazilians in London (UK). One
was carried out by IOM in 2005. It attracted 65 returns, yet the sampling method has not been
explained.19 The second survey was carried out under the auspices of the Strangers into Citizens
campaign by Evans et al. in 2007. As already mentioned, it attracted 423 returns. The
questionnaires were left in several Catholic and Pentecostal churches in Central and East London
where Brazilians are known to worship. Again, the sampling was not randomised.
On the other hand however, there is fairly good information on the evolution of the Brazilian-
born community in the UK that stems from the census data (1901–2001) (which, in contrast to
the other Scoping Study reports is a rare, yet welcome exception). Nonetheless no publication
has officially interpreted nor ‘made sense’ of this data. While the most recent figures (1990s,
2000s) might be highly underestimated, some general trends could be discerned and analysed in
more depth.
THEMIS with its research techniques, especially the large-scale survey in Phase 3, might
be able to contribute much more to closing the gap in the current research about the
Brazilian population in London (and the UK in general, due to different survey
localities).
With regard to the qualitative research, the sources demonstrated a few ethnographic,
anthropological yet rather fragmented approaches to researching Brazilians in the UK
(London). None of them however looked at the population holistically to map and
explain its history of migration to the UK, trends and patterns of settlement,
institutions, or responses to particular immigration policy changes (as Cherti 2008
did for Morocco, for example).
19IOM reveals that information was gathered using in-depth interviews with multipliers and by asking people to fill
in questionnaires. The term ‘multipliers’ has been used to indicate individuals or organisations that were well knownamong diaspora groups and could therefore play a key role in delivering information (IOM 2005). In other words theterm ‘mulitpliers’ refers to community workers and experts.

Assessment and Identification of Issues to be Explored in Phase 2 77
With the exception of Jordan and Duvell (2002), who attempted to place irregular
Brazilian migration in London (in comparative perspective with Turkish and Polish
populations) in the context of the theories of transnational mobility, the Brazilian
migration processes have been also significantly under-theorised.
While the evidence of a Brazilian presence in London could be dated back to the 1960s (like the
Moroccan migration, cf. Moroccan Scoping Study), there is therefore a severe discrepancy
between the availability of academic sources documenting and analysing Brazilian and
Moroccan migrations, respectively. This therefore calls for putting the evolution of Brazilian
migration in London (as a locality) under greater research scrutiny.
Also although the timescale of these two migrations (Moroccan and Brazilian) might be fairly
similar, there are many striking differences between their types (routes) of migration and
settlement in the UK.
While the Moroccans were admitted in 1960s as migrant workers, Brazilians of that time
were mainly political refugees seeking asylum from the authoritarian rule back home.
The conditions of their admission were therefore different. While the majority of
Moroccans settled in the UK and acquired British citizenship, the Brazilian population
had a more ambiguous legal status. There is a fraction of Brazilians who hold
European citizenship, and therefore enjoy legal residence in the UK; however, the
majority of Brazilians (as per the available estimates) are undocumented or irregular. As
a result they cannot settle in the UK permanently, nor enjoy the right of stay and abode.
These two populations are also vastly different with regard to their migration
dynamics. While the Moroccans started arriving in significant numbers from the 1960s,
the Moroccan migration ‘lost’ its momentum in the late 1980s and early 1990s. Brazilians
represent the completely opposite trend. The large-scale Brazilian migration to the UK
expanded in the 1990s, with particularly high estimates since 2002.

Bibliography 78
As a result, their community profile is different. The institutions and migrant
organisations run by Moroccans have mainly been established by the 1.5 or second
generation of migrants. The dynamic mosaic of the Brazilian institutional structures in
London has been designed by the most recent arrivals, those who came to the UK in the
late 1990s or early 2000s.
As mentioned above, the ambiguous legal status of many Brazilians in London calls
for more in-depth insights into their relationship with the law in the UK. The interviews
with the community workers point to the desire among many Brazilians to regularise
their stay. Who are those who attempt legalisation after many years of living in the UK
with the ‘visa-expired’ status? What are their reasons for it? How does law impinge on
the lives of Brazilians in the UK, and what are their responses towards the legal state
immigration framework?
Bibliography
Aguiar, Luís K. (2009) ‘The expanding demand of Brazilian groceries: the case of cachaça’, in
A. Lindgreen and M. Hingley (eds.) The New Cultures of Food: Marketing Opportunities
from Ethnic, Religious and Cultural Diversity, Gower.
Barcellos, M.D., L.K. Aguiar, G.C. Cardozo, and L.M. Vieira (2009) ‘Willingness to try
innovative food products: a comparison between British and Brazilian consumers’, Brazilian
Administration Review 6(1)4: 50–61.
Bloch, A., N. Sigona, and R. Zetter (2009) No Right to Dream. The social and economic lives of
young undocumented migrants in Britain, London and Oxford: City University London,
Refugee Studies Centre.
Carlise F. (2006) Marginalisation and ideas of community among Latin American migrants to
the UK, Gender and Development, Vol. 14, No. 2
Cherti, M. (2008) Paradoxes of Social Capital. A Multi-Generational Study of Moroccans in theUK, Amsterdam: Amsterdam University Press, IMISCOE Dissertations

Bibliography 79
Cwerner, Saulo B. (2001) ‘The times of migration’, Journal of Ethnic and Migration Studies
27(1): 7–36.
Dallal and Stevens (2004) UK Asylum Law and Policy: Historical and Contemporary
Perspectives, London: Sweet & Maxwell.
Evans, Y., Wills, J., Datta, K., Herbert, J., McIlwaine, C., May, J., Araújo, J.O., França, A.C.,
França, A.P. (2007) Brazilians in London: a report for the Strangers into Citizens
Campaign, Department of Geography, Queen Mary, University of London. See
http://www.geog.qmul.ac.uk/docs/staff/4418.wmv for TV coverage in Brazil on 12 January
2008 by the Brazilian Channel (Sistema Brasileiro de Televisão), the third largest
broadcaster in the country.
Jordan and Duvell (2002) Irregular Migration: the Dilemmas of Transnational Mobility,
Cheltenham: Edward Elgar.
Garcia, Denise M.B. (2002) ‘Dis (In) tegration in a Foreign Land: Psychoanalytical
Explorations on Migration’, MA in Psychoanalytical Studies dissertation (unpublished),
Tavistock & Portman NHS Trust and University of East London.
Garcia, Denise M.B. (2000) ‘The Mourning After: Psychoanalytical Understanding on
Migration and Loss’, MA in Psychoanalytical Studies essay (paper awarded Distinction,
unpublished), Tavistock & Portman NHS Trust and University of East London.
IOM (2005) Brazilians in London. Mapping Exercise, London: IOM.
Macdonald, Ian A. and R. Toal (2010) Macdonald’s Immigration Law and Practice, London:
Lexis Nexis UK.
Margolis, M. (1998) An Invisible Minority: Brazilians in New York City, Ally and Bacon:
Massachusetts.
Pero, D (2007) ‘Anthropological Perspectives on Migrants Political Engagements’, Working
Paper No. 50, Centre for Migration, Policy and Society, University of Oxford
Price, J. (2006) History of Asylum in London, London: Researching Asylum in London,
http://www.researchasylum.org.uk/?lid=21
Schuster, L. (2002) ‘Asylum and the Lessons of History’, Race and Class 40(2).

Bibliography 80
Souza, A. (2010a) ‘Migrant Languages in a Multi-Ethnic Scenario: Brazilian Portuguese in
London’, Portuguese Studies 26( 1): 79–93.
Souza, A. (2010b) ‘Language choice and identity negotiations in a Brazilian Portuguese
community school’, in V. Lytra and P. Martin (eds.) Sites of Multilingualism:
Complementary Schools in Britain Today, London: Trentham, pp.97–107.
Souza, A. (2009) ‘Language choices: portraits of children’s identity negotiations in a Brazilian
Community Language School’, in V. Lytra and P. Martin (eds.) Multilingual Spaces:
Complementary Schools in Contemporary Britain, London: Multilingual Matters.
Souza, A. (2008) ‘How Linguistic and Cultural Identities Are Affected by Migration’, Language
Issues 19(1): 36–42.
Souza, A. (2007) ‘Language and Identity in a Community Language School’, Community
Languages Bulletin 20, p. 6.
Szymanski, Bogus (2006) ‘Brazil’ [in:] Gibney, M. , Hansell R. (2006) Immigration and Asylum
from 1900 to the present, Santa Barbara, California: ABC CLIO
UKBA (2010a) Asylum, http://www.ukba.homeoffice.gov.uk/asylum/
UKBA (2010ba) Youth Mobility Scheme,
http://www.ukba.homeoffice.gov.uk/workingintheuk/tier5/youthmobilityscheme/
UKBA (2010c) Studying in the UK,
http://www.ukba.homeoffice.gov.uk/studyingintheuk/quickguideforstudent/typeofstudentvis
a/
UKBA (2008) National Archives of UK Border Agency Website:
http://webarchive.nationalarchives.gov.uk/20081215180846/http://www.ukvisas.gov.uk/en/ ,
http://webarchive.nationalarchives.gov.uk/20081215180846/http://www.ukba.homeoffice.go
v.uk/studyingintheuk/
Vertovec, S (2006) ‘The Emergence of Super-Diversity in Britain’ Working Paper No. 25,
Centre for Migration, Policy and Society, University of Oxford

Bibliography 81
The Evolution of Egyptian
Migration to the UK
THEMIS Scoping Study Report
International Migration Institute
University of Oxford

Bibliography 82
Table of Contents
Sources ...............................................................................................................................83
1. Theoretical Framework of THEMIS...............................................................................83
Trends and Types of Migration ........................................................................................86
Diversification of Egyptian Migration ...............................................................................89
Quantitative Picture ........................................................................................................90
2. Policy changes .............................................................................................................92
Sending Country Perspective ...........................................................................................93
British Immigration Policy Perspective .............................................................................95
3. Institutions ..................................................................................................................96
4. Remittances.................................................................................................................98
5. Individual Migration Histories ....................................................................................100
Where To? – Where From?............................................................................................101
6. Assessment and Identification of Issues to be Explored in Phase 2.............................103
Bibliography ......................................................................................................................104

Sources 83
Sources
This report presents the finding of the scoping study undertaken within the THEMIS project. It is
based on a review of the literature and information provided in key-informant interviews (Dr.
Phil Marfleet, University of East London, Mostafa Ragab – President of the Egyptian UK
Association, Noha Gebaly from the Egyptian Consulate in the UK).
It is important to emphasise that this report makes no claim to be comprehensive. Its very limited
aim is to provide basic data on the movements of Egyptians to the UK over time and the reasons
for these changes with a view to the possibility of undertaking a much more comprehensive
study. Therefore, it should not be cited as authoritative but only taken as suggestive.
Such cautions are particularly important in the case of Egyptian migration. One of the first
findings of this study is that there is very limited literature available on this theme. This might be
explained by the apparently small number of Egyptians in the UK, the particular mix of
immigrants, which for many years was dominated by professionals, and their high levels of
integration. Hence, in crude terms, Egyptians have perhaps been seen as a small and
unproblematic migrant group, which has not commanded much academic attention, compared to
many others.
1. Theoretical Framework of THEMIS
There is no consensus on the number of Egyptians living in the UK; the estimates vary
enormously depending on the sources. Karmi, writing in 1997, cites figures ranging from nearly
23,000 – in the 1991 Census and a similar number registered at the Egyptian Consulate – to
estimates of 100,000 up to 200,000.20 By 2001, there were 24,705 Egyptian born persons in the
UK according to the 2001 Census, but the Egyptian sources claimed a total of 35,000. Today
estimates based on registrations with the Egyptian consulate suggest there may be about 200,000
Egyptians in the UK. Interview sources suggested a figure of about 250,000. However, it is
important to note that the census records Egyptian-born people (cf. chart 1), whereas the other
20He also mentions a figure of half a million suggested by a journalist.

Theoretical Framework of THEMIS 84
sources are focused on Egyptian nationals (possibly born in the UK) or descendants of migrants
(born in the UK and not necessarily holding Egyptian nationality).
Chart 1 Egyptians in the UK, Census Data, Annual Population Survey (Indexed, 2008 = 100, 2008 = ~29,000)
At first glance the figures from the Egyptian sources may appear to indicate a dramatic rise in the
number of Egyptians in the UK, but this rise in their figures is more likely to reflect renewed
efforts to encourage people to make contact with the consulate, especially with the introduction
of online registration. None of the sources consulted supported the view that there has been a
significant increase in migration from Egypt to the UK in the last fifteen years. One interviewee
argued that the numbers reached a peak in the mid 1980s. Zohry, citing figures for the rise in
stock of Egyptian immigrants in the UK suggest that there were very modest rises from 1997-99
(the only years for which he had data) compared the much large growth of Egyptian migrant
stocks in other European countries, especially Germany, Spain, Italy and the Netherlands (Zohry
2007, p. 19 cf. Table 1).
0
20
40
60
80
100
120
140
160
1900 1920 1940 1960 1980 2000 2020
Egypt

Theoretical Framework of THEMIS 85
Country of Destination Difference
Destination count Egyptian count Absolute Relative
Austria 4,721 14,000 9,279 197%
France 15,974 36,000 20,026 125%
Germany 14,477 25,000 10,523 73%
Greece 7,448 60,000 52,552 706%
Italy 40,879 90,000 49,121 120%
Netherlands 10,982 40,000 29,018 264%
Spain 1,567 12,000 10,433 666%
United Kingdom 24,705 35,000 10,295 42%
Australia 33,370 70,000 36,630 110%
Canada 35,975 110,000 74,025 206%
Jordan 124,566 226,850 102,284 82%
Switzerland 1,369 14,000 12,631 923%
United States 113,395 318,000 204,605 180%
Sub-total 429,428 1,050,850 621,422 145%
Other countries n.a. 1,685,879
Total 2,736,729
Table 1: Comparison between numbers of Egyptian migrants counted by Egyptian sources and destination countries.
All Egyptian figures from 2001, UK figures from 2001 census. Source: Adapted from Fargues 2005: 21 (Table 3-
EGY)
If we focus only on the most recent accounts of the numbers of Egyptian born people in the UK,
we might conclude that we are seeing a stagnant migration system. However, the history of
Egyptian migration to the UK is much more variegated than this dull image offered by these
aggregate figures. Closer inspection suggest that it may be more helpful to consider a migration
system, as consisting of a number of migration waves, which started at different times, evolved
in different ways and only intermittently connect. While there is little agreement about the
numbers of Egyptian migrants, there seems to be much greater consensus about the changing
profile of migrations to the UK over the years. Also, similarly to the Brazilian migration to the

Theoretical Framework of THEMIS 86
UK, we see that we have figures describing the evolution of the population covering the time
period over the last ten decades. However the qualitative evidence and analysis of these figures
in historical perspective is virtually non-existent.
Trends and Types of Migration
There is a long history of migration in the Egypt-UK corridor and it is worth remembering that
until the last century, there were many more British (and other Europeans) moving to Egypt than
vice-versa. Indeed, until the 1950s, Egypt was widely seen as an immigration country, attracting
people from southern Europe and elsewhere in North Africa.21
With the construction of the Suez Canal, the trade in cotton and sugar in. connect and British
colonial control from 1882, there were large British populations in Egypt. Such interaction
inevitably stimulated a reverse movement from Egypt to Britain. While some Egyptians may
have been included among the many Asian and Arab seamen employed on British boats – widely
and often pejoratively referred to as lascars in early 20th century Britain (see www.lascars.co.uk
for sources).
The migration of Egyptian professionals from the end of the 19th century is much better
documented. Administrators, doctors, bankers and other groups emigrated from Egypt to the UK
for education and training. This small movement of people predominantly drawn from the elite,
grew more significant after the Second World War. Since this is the period on which are
focusing in THEMIS and this movement has continued since that time, for our purposes this
might be seen as the first migration wave.
During the 1940s and 50s there was a growing Arab nationalist movement in Egypt, which
culminated in the rise to power of Nasser in 1956. This stimulated the Suez Crisis and
accelerated the withdrawal of the British from Egypt. Nasser’s regime was committed to
nationalisation and also full employment, provision of housing and other social policies that
improved opportunities for the peasants and low skilled labourers within the country. As a result,
21According to the Change Institute (2009: 6), a significant number (9,861) of the Egyptian-born population in
England have described themselves as ‘White British’ in the 2001 census (over one third of the total). This wouldeither refer to people of British origin who were born in Egypt and then returned to the UK or indicate the self-perception of Egyptian origin respondents.

Theoretical Framework of THEMIS 87
their economic incentives to emigrate may have been moderated. At the same time, their
possibilities for emigration were reduced by exit restrictions controlling access to passports and
requiring exit visas.
While such policies made it more difficult for the elites, Nasser’s socialist policies increased
their incentives to leave and it was during this period that the stream of elite migration to the UK
was established. In the 60s and 70s, exit restrictions started to be lifted and there was growth in
student migration, particular from middle class families on government scholarships.
The Sadat government brought a dramatic change in the early 1970s with a marked shift away
from centralised state control of the economy through the ‘Open Doors Policy’, which broke up
monopolies, reduced tariff barriers and opened up to foreign capital – an early form of the
neoliberal policies that later spread round the world through structural adjustment programmes.
At the same time, the government also abandoned exit controls with a new constitution providing
the right to emigrate and allowing dual nationality (Interview).
The more open economy broadened both people’s financial ambitions and their horizons,
encouraging people to leave in search of better opportunities. Another wave of migration
followed. These were mainly university graduates and young professionals who left for UK in
early 1970’s in search of better economic and work opportunities. They primarily arrived in the
UK on work permits arranged for them by the British employers. Also they were familiar with
Britain, as they used to study in the UK, or work temporarily as students during the summer
months. The majority of them settled in the UK and/or established their own businesses here.
This gave new stimulus to the migration of business people, doctors, university lecturers and
other professionals to the UK (among other countries). Many of these people settled
permanently in the UK. They form the core of the Egyptian migrant community in London
(Interview). Until the mid 1980s, this movement of professionals (and recent university
graduates) accounted for the vast majority of the migration of Egyptians to the UK.
The movement of unskilled labour migrants to the UK from the early 1980s might be seen as
a third migration wave, with a different but related set of drivers. According to many accounts,
the start of labour migration to the UK from Egypt was a response to growing blockages in the

Theoretical Framework of THEMIS 88
Egypt-Gulf migration corridor.22 According to one respondent this was sparked by the start of
the war in Lebanon, which closed off a major holiday destination for the Arab world. A perhaps
more important factor for the rise in Arab visitors to London is the circulation of ‘petrodollars’
generated by the 1973 oil crisis and the resultant rapid and massive increase in wealth of the oil
producing Gulf states. London therefore saw a large influx of wealthy Arabs tourists. There was
therefore a huge structural need for Arabic speaking waiters, chamber maids, hotel personnel,
taxi drivers, musicians, artists and entertainers. These jobs were largely performed by Egyptians
(and shared between them and Moroccans, cf. Souad Talsi’s interview on Moroccans in London
in 1980’s).
It is said that throughout the 1980s and into the 1990s, this emigration route played an important
role in providing an outlet for surplus labour, which helped to reduce political tensions, and
generating huge volumes of remittances. However, with the Iran-Iraq war in the mid 80s and a
reduced demand for labour, the numbers of migrants started to contract. This decline accelerated
with the 1990 Gulf War.
According to some observers (Zohry 2007), the reduction in opportunities for migration to the
Gulf resulted in lower skilled migrant looking more towards Europe as a destination. Many
thousands of unskilled Egyptians have moved into Europe in the last decade, many staying
irregularly either overstaying on tourist visas or resorting to crossing the Mediterranean by boat.
This neat correlation between the arrival of labour migrants in the UK and closing off of the Gulf
option reinforces the idea that we reasonably consider these as two distinct, yet linked
subsystems within the Egyptian migration system. That view might be further reinforced by
Karmi’s (1997) observation that the Egyptian population in the UK remains largely segregated
along class lines.
However, there is little evidence of many Egyptians being illegally resident in the UK; according
to the consulate it is not a major issue, especially compared to other EU countries such as Italy.
The start of lower skilled migration to the UK was in the 1980s and was primarily legal
22From the 1960s, with the easing of exit restriction there was a much larger migration towards the Gulf and Libya.
This included the elites and middle class Egyptians, but also peasants, many of who worked as labourers inconstruction. Millions of Egyptians left.

Theoretical Framework of THEMIS 89
migration, which was much easier then. While it might have been stimulated by the reduced
opportunities in the Gulf, it was also in response to a strong demand for labour in the UK.
Diversification of Egyptian Migration
Whatever the cause of this growth in lower-skilled migration, it did appear to set in train a
pattern of migration which was sustained over the following decade. These migrants were less
likely to settle permanently in the UK, compared to their wealthier middle class and elite
compatriots. As one interviewee commented those who came into the service industries in the
UK came into a very competitive job market, where other immigrant groups had established
strong positions. In particular, south Asians, Bangladeshis, Indians and Pakistanis had better
connections and language skills. The Egyptians were very late into this job market. The
Egyptians were relatively latecomers to this sector and many found it hard to find a niche. The
ever increasing restrictions on immigration and the spiralling cost of visas have reduced the
number of lower skilled migrant arriving in the UK over the last decade. No doubt the number of
Egyptians arriving illegally or overstaying their visas is increasing in the face of these barriers.
However, according to the consulate, the numbers of undocumented Egyptians is small. The
illegal immigration of Egyptians is not a major issue in the UK compared to other countries such
as Italy (Egyptians have recently died in boats trying to get to Italy causing great concern).
Two further sets of migrations can be identified, both associated with forced movement. First,
there is the emigration of religious minorities, Jews and Christians, particular between 1940 and
the 1970s. In the 1940s, a significant number of the Egyptian Jewish population emigrated to
some to Israel but others to Europe and the US in the face of the uncertain future as Egypt moved
towards a policy of Arab nationalism and political oppression. This exodus continued in the
1950s and 60s (see ‘The dispersion of Egyptian Jewry’ by Joel Beinin 1998). Only a small
number of Egyptian Jews moved to the UK. From the 1970s, with the opening up of emigration
and increasing religious intolerance, large numbers of Coptic Christians left Egypt. There UK
Census figures suggest that nearly one third of the Egyptian born people in the UK describe
themselves as Christian (excluding the White British – see footnote above). In contrast,
community surveys suggest a much higher proportion of Muslims in the Egyptian population in
the UK, close to the 90% found in Egypt. Some anecdotal evidence from community interviews
suggests that the proportion of Egyptian Copts is higher (Change Institute 2009). Whatever the

actual figures, it seems that there is a significant group of Egyptian Christ
migrants in the UK.
Finally, in the wake of the assassination of President Sadat in 1981, there was a violent
crackdown on radical Islamist movements, in particular the Muslim Brotherhood which resulted
in many Islamic activists seeking asy
of them were granted asylum in Britain through the 1980s and 1990s.
Quantitative Picture
In all these different forms of migration, men have been in the majority, especially among the
lower skilled labour migrants. While the initial movement of elites and some of the wealthier
refugees to the UK may have included whole families, the movement of professionals and
students was undertaken primarily by young men. Some, who were married before, have been
joined by their families while many others have married in the UK, mostly to Egyptians or
Europeans. There is reportedly little marriage into non
groups (cf. Chart 2).
Chart 2 Sex Ratio of Egyptian-born persons in the
In general, the average age of emigrants from Egypt to all destinations across the world is young
– overall 30% aged 18-24, 11% 40
this might reflect the age structure
Female46%
Sex Ratio
Theoretical Framework of THEMIS
actual figures, it seems that there is a significant group of Egyptian Christ
Finally, in the wake of the assassination of President Sadat in 1981, there was a violent
crackdown on radical Islamist movements, in particular the Muslim Brotherhood which resulted
Islamic activists seeking asylum in many parts of the world, including Britain. Some
of them were granted asylum in Britain through the 1980s and 1990s.
In all these different forms of migration, men have been in the majority, especially among the
abour migrants. While the initial movement of elites and some of the wealthier
refugees to the UK may have included whole families, the movement of professionals and
students was undertaken primarily by young men. Some, who were married before, have been
oined by their families while many others have married in the UK, mostly to Egyptians or
Europeans. There is reportedly little marriage into non-Egyptian Arab or other non
born persons in the UK, Source: OECD, Census 2001
In general, the average age of emigrants from Egypt to all destinations across the world is young
24, 11% 40-49, and only 2% over fifty (figures from consulate)
this might reflect the age structure of Egyptians at their point of departure from Egypt (and
Male54%
Sex Ratio
Theoretical Framework of THEMIS 90
actual figures, it seems that there is a significant group of Egyptian Christian and Jewish
Finally, in the wake of the assassination of President Sadat in 1981, there was a violent
crackdown on radical Islamist movements, in particular the Muslim Brotherhood which resulted
in many parts of the world, including Britain. Some
In all these different forms of migration, men have been in the majority, especially among the
abour migrants. While the initial movement of elites and some of the wealthier
refugees to the UK may have included whole families, the movement of professionals and
students was undertaken primarily by young men. Some, who were married before, have been
oined by their families while many others have married in the UK, mostly to Egyptians or
Egyptian Arab or other non-European
In general, the average age of emigrants from Egypt to all destinations across the world is young
fifty (figures from consulate). While
of Egyptians at their point of departure from Egypt (and

Theoretical Framework of THEMIS 91
arrival in the host country) these figures do not reflect the current situation of Egyptian migrants
in the UK.
According to the Census figures (2001), by far the largest proportion of Egyptians in the UK
(approximately 40%) were between 45 and 59 years old. The Census 2001 figures fit well with
the dominant narrative of the trends and patterns of Egyptian migration to the UK. The core of
the Egyptian community is constituted the professionals and (at that time) university graduates
who left Egypt in 1970s in their early to mid 20s. At the time of the Census 2001 (30 years on),
they were in their late 40s and mid 50’s (cf. Chart 3).
Chart 3: Age Structure of Egyptian-born persons in the UK, Source: OECD, Census 2001
As far as the labour status is concerned, the large proportion of Egyptians in the UK is employed
(48%), with only 4% unemployed (according to the Census 2001 data).
0 2000 4000 6000 8000 10000
0-14
15-29
30-44
45-59
60-69
70 or older
Age Structure of Egyptians in the UK(2001)

Policy changes 92
Chart 4 Labour Force Status of Egyptian-born persons in the UK, Source OECD, Census 2001
2. Policy changes
The previous section has already highlighted the key policy changes which have shaped
migration in the Egypt-UK corridor. According to all respondents and sources, the major
dramatic changes have been brought about by Egyptian policy shifts over the years. As noted in
the introduction, Egyptian migration to the UK has always been rather small and seen as
relatively unproblematic, so there are no changes in immigration policies that refer specifically to
these movements.
Major changes in the economic and political context and migration policy changes since 1945
that have been discussed in the literature and scoping study interviews can be summarised as
follows.
48%
4%
36%
12%
Labour Force Status
employed
unemployed
inactive
unknown labour force status

Policy changes 93
Sending Country Perspective
Date Location Details
1956 Egypt The rise to power of Nasser: programme of nationalisation and
Suez Crisis resulting in withdrawal of British and exodus of
elites. Promises/policies of full employment and provision of
housing reducing incentives for emigration by poorer
Egyptians. Emigration restricted with limited access to
passports and exit visa requirements.
1960s Gulf and
Libya
Development of oil resources and growth of strong demand for
skilled and unskilled labour in the emerging Arab oil nations.
1960s Egypt Easing of exit visas. Start of large scale migration to the Gulf
with introduction of temporary worker programmes.
1967-
1974
Egypt,
Israel
Ongoing tensions in Middle East flaring up in two major
conflicts in 1967 Six Days War and the 1973 Arab-Israeli War.
This exacerbated Egypt’s economic problems creating
conditions for labour migration to the Gulf. It also heighted
religious tensions which hastened the departure of the
Egyptian Jewish population and Copts.
1974 Egypt Sadat introduced the Open Door Policy liberalising economy
and removing restrictions to emigration. Growth of middle
class and professional emigration to the UK.
1973 Gulf OPEC price rises creating oil crisis and growth of petrodollars –
stimulating surge of wealthy Arab tourists and visitors to
London, creating demand for lower-skilled Arab speaking staff

Policy changes 94
in service industries.
1974- Lebanon Start of conflict in Lebanon culminating in Israel invasion and
siege of Beirut, diverting Gulf tourist business to London.
1981 Egypt Assassination of Sadat led to repression of Islamists, some of
whom sought asylum in UK.
1980s Egypt Introduction of main emigration law which established a
Ministry of Emigration (now part of the Ministry of Labour and
Manpower). This works with the Ministry of Foreign Affairs and
Ministry of Interior on issues such as military service and ID
papers.
1980-
88
Iran-Iraq
War
Conflict reduced the demand for Egyptian labour in the Gulf,
especially in Iraq; this stimulated growth of lower skilled
migration to the UK.
1990 Gulf War Iraqi invasion of Kuwait and subsequent expulsion by US led
coalition, resulted in further disruption of migrant labour
markets in Gulf.
2000s Egypt Requirement that dual nationals had to do national service, is
dropped; this prevented some migrants going back to Egypt
while they were of eligible age.
These are the major changes in the Egyptian and regional context which have shaped major
shifts in migration patterns to the UK. There are an underlying set of economic problems,
including gross inequality of wealth distribution and extreme poverty, which continue to
encourage emigration, by those who can afford it. Nonetheless, since the mid-1990s, as
immigration has become a major public policy issue in the UK, it is perhaps the changes in the
UK legislation (such as the introduction of English language requirements) and context –

Policy changes 95
especially the current economic crisis – which have started to moderate the flow of Egyptian
migrants to the UK more markedly.
British Immigration Policy Perspective
With regard to the British immigration policy toward Egyptians, the latter could be classified
under ‘Alien’ category (due to the lack of any immediate colonial ties with Egypt). Therefore the
majority of them (first wave of professionals in the early 20th century, professionals and students
from 1970s, and the low-skilled economic migrants in early 1980s) came to the UK under the
‘Alien Workers’ work permit scheme. The work permit scheme evolved over the years in the
United Kingdom.
The pioneer Egyptian migrants’ (professionals from the end of the 19th century) entry and
residence in the UK were administered by the 1905 Aliens Act, 1914 Aliens Restriction Act,
and 1919 Aliens Restriction (Amendment) Act (which later became Aliens Order 1953). These
provided a system of work permits for aliens seeking employment in the UK, registration with
the police and deportation for the public good. It applied to aliens but not to commonwealth
citizens.
The wave of professionals and university graduates (from 1970s onwards) and the wave of low-
skilled migrants who filled the vacancies in the hospitality and service industry in London
(during the 1980s) arrived under the 1971 Immigration Act. The Act as such did not bring any
significant changes in the situation of admission of alien migrant workers. They were admitted to
the UK on the basis of having a work permit which allowed them to work for a named employer
(on condition that no suitable British person was available to fill the vacancy). Their work permit
was valid for one job only, therefore each time they changed their employment they had to ask
their employers to apply for a new work permit on their behalf. The controls after entry stayed
the same with regard to primary work-permit holders: they had to register with the police and
report any change of address. They had no right of settlement, but might have been allowed to
settle after four years. The majority of them did, and subsequently applied for British citizenship.

Institutions 96
These Egyptian migrants – predominantly British citizens are at core of the Egyptian community
in the UK (as we know it today).23
3. Institutions
Egyptian associations in the UK started to be formed in the mid-1980s but many more were
founded in the 1990s. Before this time, most Egyptian migrants arranged their own emigration
and found their own way in the UK, rather than drawing on family or other social networks in
the UK.
Much of the impetus for establishing associations appears to have arisen as migrants settled
permanently and established families in the UK. The first associations were concerned with
organising the Egyptian community to offer mutual support and sustain social and cultural links
with Egypt, especially for the children of migrants. Activities included providing professional
help from Egyptian lawyers, doctors, Arabic classes and managing funerals (as many expatriate
Egyptians want to be buried in Egypt). Such organisations active today include the Anglo-
Egyptian Society (www.angloegyptian.co.uk) founded in 1995 and the Egyptian-UK Association
(www.egyptianuk.org) was founded in London in 1997. There are also some much smaller
regional associations such as the Egyptian Association in Scotland and Egyptian Association in
Northern Ireland.
A number of Egyptian professional associations have also been established in the UK drawing
together migrants and their descendants engaged in the same field of work. For example, the
Egyptian Medical Society (www.emsuk.org) was founded in 1985 with the aims of assisting the
professional advancement of Egyptian medical personnel in the UK and supporting the training
of health staff in Egypt. It has contacts with the Egyptian Ministry of Health and organises the
secondment of placement of doctors from the UK to Egypt and other support, including
fundraising, for Egyptian health facilities. University students of Egyptian origin (second and
23As of 1990s and 2000s Egyptians fall under the same regulations as other ‘Alien’ workers, like Moroccans or
Ukrainians. The immigration regulations have been presented in some detail in Moroccan and Ukrainian Scoping
Study Reports. In order not to duplicate the work, for the current trends please refer to the abovementioned reports.

Institutions 97
third generation) are also forming new associations with a focus on supporting welfare and
development activities in Egypt.
In general such migrant associations are formed on a secular national basis, rather than being
restricted to particular religious or regional groups. One exception is the association of the Nuba
people from the south of Egypt; however, this is reportedly very well integrated with the other
associations.
Apart from such secular migrant organisations, Egyptians also come together around other forms
of associations, in particular religious activities. For example, the Islamic Centre at St Johns
Wood was founded on the initiative of Egypt in 1944 under an agreement between the UK and
Egypt in exchange for land for the Anglican church in Cairo. The first director was the Egyptian
ambassador. Now Saudi pays for its ongoing development but there are some Egyptian preachers
there. In general Egyptian Muslims tend to join the Sunni congregations with other Muslims and
one does not find Egyptian mosques.
Egyptian Christians gather at the Coptic churches, of which there are 25 across the UK (four in
London). There is little evidence of other Coptic associations focused on support for Copts in the
UK; instead, Coptic associations have been formed to argue for rights in Egypt
(www.copts.co.uk).
It is not clear how far the different Egyptian organisations in the UK communicate with each
other. The consulate made reference to Co-ordination Council for Egyptian Associations in the
UK but it is uncertain if this is widely recognised. Moreover, there is little evidence of
transnational linkages between associations in the UK and other parts of the world. They do
come together occasionally at conferences in Egypt but there is little sustained contact.
For the most part the Egyptian embassy has not sponsored associations and has only got involved
with them on request. However, in recent years, it has become more active in encouraging
migrants and their descendants, many of whom now hold other nationalities and often do not
even speak Arabic, to maintain links with Egypt. One of the consulate’s initiatives is to organise
a conference for Egyptian young people abroad in Egypt in July 2010. Most of those involved
are graduates and tend to see themselves as international citizens – so they can move
comfortably between their citizenship and other nationalities.

Remittances 98
While various Egyptian associations and organisations have been created over the years, there is
little evidence of strong institutionalised networks among the Egyptian community. The
institutions discussed here might all be described as migrant institutions but they are not
concerned with perpetuating migration. While migrants may be inspired to come to the UK by
hearing of the example of those who have gone before and succeeded, there is little suggestion
that their migration is directly facilitated by any institutions in the UK. Both the consulate and
one of the migrant associations said that they discouraged lower skilled migrants from coming to
the UK in the current economic climate. This suggests that if we want to investigate the role of
networks in sustaining migration, we would have to focus on the informal, embedded institutions
which do not necessarily have any organisational form, may be highly contested and are much
more difficult to ‘pin down’ through empirical research.
4. Remittances
According to the World Bank the available data on Egyptian remittances goes back to 1977 (Cf.
Table 2)
Year 1971 1972 1973 1974 1975 1976 1977 1978 1979 1980
Egypt 928 1,773 2,214 2,696
Year 1981 1982 1983 1984 1985 1986 1987 1988 1989 1990
Egypt 2,181 2,439 3,666 3,963 3,212 2,506 3,604 3,770 3,293 4,284
Year 1991 1992 1993 1994 1995 1996 1997 1998 1999 2000
Egypt 4,054 6,104 5,664 3,672 3,226 3,107 3,697 3,370 3,235 2,852
Year 2001 2002 2003 2004 2005 2006 2007 2008 2009 2010
Egypt 2,911 2,893 2,961 3,341 5,017 5,330 7,656 8,694 7,150
Table 2 Remittance Inflows US $ (millions), Source: World Bank (2009)

Remittances 99
Chart 5 Remittance Inflows US $ (millions), Source: World Bank (2009)
The time series reveals that the steady increase in the remittances received by Egypt significantly
declined in the second half of 1990, to pick up again from 2005. The available data is also
indicative of the increase in the amount of remittances in the first half of 1980s, which
corresponds with the increase of labour out-migration from Egypt to various European countries
(including the UK).
There is little information available about the remittances of Egyptian migrants in the UK.
Overall remittances from the UK to Egypt are relatively small compared to those from other
destinations. In 2007, remittances from the UK to Egypt totalled $167 million, just 3.1% of
the global remittances to Egypt (Zohry 2007). While the scale of remittances from the UK is
quite low, the actual amount sent per migrant is quite substantial; Zohry (2007) estimates an
average of over $2,700 per head was remitted by Egyptians in the UK in 2001. This is double the
amount sent by Egyptians in France and six times the average sent from the Netherlands. The
vast majority of remittances from the UK are thought to be sent for families and property
investments. The amount sent as collective remittances is thought to be extremely low.
0
1,000
2,000
3,000
4,000
5,000
6,000
7,000
8,000
9,000
10,000
1977 1979 1981 1983 1985 1987 1989 1991 1993 1995 1997 1999 2001 2003 2005 2007 2009
Egypt

Individual Migration Histories 100
5. Individual Migration Histories
Mostafa came to the UK in 1973. He was a university graduate from Cairo University. He did
not plan to come to London: ‘I got my bachelors degree in Sports, and PE. And I was planning to
work in Egypt, as I did see a future for myself in Egypt. But at the end Intercontinental offered
me a job in the UK. ‘
There were nevertheless many people leaving Egypt at that time. His personal narrative stresses
that in the immediate aftermath of the war between Israel and Egypt (1973 Yom Kippur war) left
the Egyptian economy in shambles. Many of Mostafa’s friends, who like him, graduated from
universities wanted to leave the country and try their luck elsewhere. Many left for Italy or
Greece. Even if people were saying: you must be joking, why are you going to the UK, press is
talking about unemployment in the UK – you know, but things were different for us. People were
saying – go to Italy and Greece. Others said - there are a lot of Egyptians in Italy and Greece.
We have been to Italy and Greece let’s try the UK.
Like him, other Egyptians started coming to the UK: So Intercontinental offered me work permit,
I talked to them and came to the UK to do my degree. At the same time there were people coming
for different reasons. These were all individuals, coming according to their own plan, at their
own expense. They all individually were trying to search to get themselves better future.
Mostafa stayed in the UK, he renewed his work permit on yearly basis. Upon four years he was
allowed to settle permanently. He settled in London and obtained British citizenship.
In early 1980s when the ‘rich Arab tourists’ started coming to London to spend their holidays
Mostafa run a rather successful, medium-sized taxi company. He employed fellow Egyptians
who came to the UK at that time to respond to the labour shortages in the hospitality sectors and
to meet the demands for Arab speaking workers. 50% of his employees in the 1980s were
Egyptians. He remembers that at that time many Egyptians came to London to work in the tourist
infrastructure: Someone had to staff all these clubs and pubs that opened. In London 50 Arabic
night clubs opened. There was a need for entertainers, musicians, and waitressing staff.
Mostafa married in the United Kingdom. His children were born and brought up here. In early
2000s Mostafa sold his taxi company, retired and devoted himself solely to community work. He

Individual Migration Histories 101
is the chairman of the Egyptian UK, the largest association of Egyptian community in the United
Kingdom. The association was established
in mid 1990s; the reason for it was lack of
any similar structures, which could deal
with welfare, housing, education issues that
occupied many Egyptians in the UK, and
represent the community in negotiations
with British authorities. Mostafa explains
the origins of Egyptian UK: Don’t get me
wrong, there were many Egyptian
associations before the Egyptian UK, but
there were all oriented toward celebrating
festivals and socializing. There was no
body which could represent the Egyptian
community to the wider world, take care of
its problems and highlight some issues which were at the heart of many Egyptians in the UK.
Mostafa, in an interview, considered his story a ‘typical’ one, shared by many other Egyptian
migrants who arrived in the UK in 1970s and settled here.
Where To? – Where From?
The early migrants who were more highly educated and drawn from the elites and middle classes
tend to originate from the major cities, with the majority from Cairo. This is hardly surprising. In
the 1970s, people started arriving from smaller towns and villages across Egypt, particularly
from the Nile Delta. A significant Nubian community from Upper Egypt has also been
established in the UK. People in other parts of Egypt have been less likely to migrate. One
explanation for this offered in interviews was that in many rural parts of Egypt beyond the Delta,
people are very attached to their land and
their tradition is to stay in their place of
origin; there is no ‘culture of mobility’. A move to Cairo is as far as many people are willing to
go. One respondent drew a contrast between the general very sedentary Egyptian population and
Map 1: Present-day Egypt

Individual Migration Histories 102
the Nubians, who are seen as more mobile. Another contrasted Egyptians to Moroccans, for
whom migration is much more part of the way of life.
Of course such explanations for the behaviour of poor people offered by the well-educated elite
respondents must be treated with caution. While such cultural considerations may play an
important role in determining migration patterns from these different origin areas in Egypt, there
are many other social, economic and political factors that are likely to be much more significant,
According to all sources, by far the largest concentration of Egyptian migrants is found in
London; this is confirmed by the 2001 census figures (see Table 3 below). Within London, they
are clustered around the western boroughs, in particular the Edgware Road, where there is
reportedly a referred to as ‘Little Cairo’. Despite such clustering, the Egyptian population forms
a tiny percentage of the population in all London boroughs, with less than a thousand in the City
of London and Westminster, which has the largest population (Change Institute 2009: 28-29).
Outside London, the numbers of Egyptians are much lower. According to the Egyptian
Consulate, there are only 120 Egyptian families registered in Scotland and a similar number in
Northern Ireland. Respondents reported that there were groups of Egyptian professionals,
especially doctors, who settled in Glasgow and Birmingham during the 1970s. Many of these
came to finish their studies in the UK and then stayed on when they were offered jobs.
GO Region Egypt-bornpopulation
Egypt-bornMuslims
% of Egypt-bornpopulationwho areMuslim
% of totalEgypt-bornMuslimpopulation inEngland
Egypt-bornMuslims as% ofregionalMuslimpopulation
London 6,663 3,893 58 52.9 0.6
South East 1,737 751 43 10.2 0.7
North West 983 608 62 8.3 0.3
East 831 414 50 5.6 0.5
West Midlands 807 419 52 5.7 0.2
Yorkshire and theHumber
649 418 64 5.7 0.2

Assessment and Identification of Issues to be Explored in Phase 2 103
East Midlands 586 359 61 4.9 0.5
South West 575 296 51 4.0 1.3
North East 284 207 73 2.8 0.8
Total 13,115* 7,365 56 100 0.5
Table 3: Distribution of Egyptian born Muslim population in UK Government Office Region Source: Change
Institute 2009: 28 Table 1.
*Note: These figures do not match the census total as the Change Institute report subtracted the Egyptian-born
White British (9,861) from the total.
6. Assessment and Identification of Issues to be Explored in Phase 2
The patterns of migration from Egypt to the UK suggest the development of a number waves
operating in parallel within the Egyptian-UK migration system, which can be analysed along
class lines rather than with respect to particular localities. Like in the case of Moroccans or
Ukrainians the waves seem to be quite disentangled from each other. The synergies between
them are identifiable only at certain levels (e.g. national identification).
The linkages between the elites, the well-educated and the low-skilled labour migrants appear to
be quite limited. This would make for a potentially very interesting case study. It is also one on
which there has been very little research, which only adds to the interest.
However, the small scale of Egyptian migration and its rather fractured nature might present
formidable obstacles to undertaking a detailed case study of the UK.

Bibliography 104
Bibliography
Applied Research on International Migration (CARIM).http://www.carim.org/index.php?callContent=484&callText=256
Change Institute (2009) The Egyptian Muslim Community in England: UnderstandingMuslim Ethnic Communities, London: Local Communities & Government
Fargues (2005) How Many Migrants from, and to, Mediterranean Countries of theMiddle East and North Africa? Analytic and Synthetic Notes – Demographic &Economic Module, CARIM-AS 2005/16, Euro-Mediterranean Consortium
Gang I, Bauer T (1998) Temporary Migrants from Egypt: How Long do they stay abroad? IZAWorking Paper, IZA DP. No. 3
Karmi, G. (1997) ’The Egyptians of Britain : a migrant community in transition.’,
Working Paper. University of Durham, Centre for Middle Eastern and Islamic Studies,
Durham.
Zohry A, Harol-Bond, B (2003) Contemporary Egyptian Migration: An Overview of
Voluntary and Forced Migration, , Forced Migration & Refugee Studies Program
American University in Cairo
Zohry A (2005) Interrelationships between Internal and International Migration in
Egypt: A Pilot Study, Forced Migration & Refugee Studies Program American University
in Cairo
Zohry A (2007) Migration and Development in Egypt, Paper Prepared For Project
on Migration as a Potential and Risk Funder by Robert Bosch Foundation Institute for Mi
gration and Cultural Studies (IMIS), Berlin, 16-17.12.2007
Zohry A (2007) Egypt – A new player in the Euro-Mediterranean Migration System,
Forced Migration & Refugee Studies Program American University in Cairo

Bibliography 105
The Evolution of ‘Indian’
Migration to the UK
THEMIS Scoping Study Report
International Migration Institute
University of Oxford

Bibliography 106
Table of Contents
Introduction ......................................................................................................................107
Sources .............................................................................................................................108
1. Theoretical Framework of THEMIS.............................................................................109
Trends and Patterns of Migration: Gujarat.....................................................................109
Trends and Patterns of Migration: Kerala.......................................................................111
Quantitative Picture: India.............................................................................................114
2. Policy Changes...........................................................................................................117
1948 British Nationality Act: Free Movement of British Subjects....................................118
1960s: British Immigration Policy toward Indians from Independent India.....................118
1960s: British Immigration Policy toward Indians (Gujaratis) in East Africa ....................120
1971 Immigration Act: Unification and Tightening of Entry Requirements .....................121
1980s: Closing the Gates................................................................................................122
1990s and 2000s: Managed Migration Approach and Points-Based System ...................123
3. Institutions ................................................................................................................124
Historical Perspective ....................................................................................................125
Types of Engagement ....................................................................................................126
Scoping Study Experience with Gujarati and Malayalee Organizations ...........................127
4. Remittances...............................................................................................................129
5. Individual migration histories.....................................................................................131
Where to? – Where From? Gujaratis .............................................................................132
Where To? – Where From? Malayalees .........................................................................133
6. Assessment and Identification of Issues to be Explored in Phase 2.............................135
Bibliography ......................................................................................................................137

Introduction 107
Introduction
The migration of Indians to the UK is remarkable for its scale, its duration and its complexity.
The official Census data (2001) talk of 467,634 Indian-born persons in the United Kingdom, the
Annual Population Survey estimates for 2008 circulate around 632,000 persons. The Community
workers, organization leaders and migration experts we interviewed estimate the numbers around
1,500,000 (and these are conservative, rather cautious estimates). The time scale of Indian
migration to the UK goes back to the eighteenth century with the Ayahs, Lascars and Princes, as
documented by Vizram (1986).
It is however the super-diversity of Indian migration to the UK (along the geographical, class,
caste and sub-caste, ethnic and religious lines) which almost prevents the meaningful
employment of the THEMIS theoretical categories. The aim of researching migration from a
particular locality in the origin country to a particular locality in a destination country was
exceptionally difficult to achieve in this context. India with its area of 3,287,263 square
kilometers covers the geographical area equal to 1/3 of Europe (9,940,000 sq km). In preparing
this report we therefore sub-divided the vast and therefore not particularly useful category of
‘Indian’ into smaller, more ‘manageable’ State/Ethnic categories.
The research review demonstrated that the two largest groups of ‘Indians’ in the UK are that of
Punjabis (from Punjab in North-West India) and Gujaratis (from Gujarat in Western India)
(Peach 2006). We therefore focused on Gujaratis, as representative of the large-scale, well
documented example of ‘Indian’ migration to the UK, from a particular locality of the state of
Gujarat.
But among the 'Indians' in the UK there are also smaller groups which have not been properly
studied. As a result of the fact that the researchers were sampling on the dependant variable – the
groups of 'Indians' which were the largest and most widely present in the UK – they missed out
on the other, perhaps smaller, groups’—nonetheless inseparable part of the Indian migration
system. Also due to the sole focus on these two, most visible communities, the picture of 'Indian'
migration to the UK is actually one of Punjabis and Gujaratis. In fact, the Indian migration
system is in fact much more multifaceted than that.

Sources 108
There are very little sources on the migration from the South or Central of India, particularly the
states of Karnataka (Kannadigan community), Kerala (Malayalee community), Andhrapradesh
(Telugu community), or the northern states. Does it mean that the migration from these regions
was non-existent? Kannadigans, Malayalees and Telugus have ‘disappeared’ within the
aggregate level, under the category of ‘Indian’ or ‘Asian’. However little (if anything) has been
said about their trends and patterns of migration in the context of their specific localities within
the Indian migration system.
In the scoping study we therefore attempted to narrow this research gap, and look at the
understudied migration movements between Kerala and the United Kingdom (London). The
Malayalees from the state of Kerala form part of the Indian migration system. It is a smaller
group, and therefore it would perhaps be interesting to see how similar/ different was its
evolution in the UK from that of well established and well documented Gujaratis. Have
Malayalees, as a smaller group within the Indian-UK migration system, developed distinct to that
of Gujaratis migration and settlement patterns?
These two case studies presented in this report look at the evolution of migration of Gujaratis
and Malayalees in the United Kingdom. Although perhaps not representative of the whole
Indian migration system, they nevertheless fulfill the aims of the scoping study by providing
initial insights into the growth trajectories of two different migrant groups between India
and the UK. The case studies therefore cast some light on the studied and under-studied migrant
groups pointing to the extreme heterogeneity of Indian migration to the UK.
Sources
With regard to the sources used for this report, in the case of Gujaratis we relied on the available
literature (cf. Bibliography) and interviews with the experts: Mr. CB Patel, the chairman of the
National Congress of Gujarati Associations UK (the largest, umbrella organization gathering the
majority of Gujarati associations in the UK), Mr. Cel Solanki from Gujarati Arya Association
(association of Gujaratis from a particular cast – Mochi – and locality – Surat – in Gujarat, who
arrived in the United Kingdom via Kenya and Uganda) and Dr. Thomas Lacroix, from IMI,

Theoretical Framework of THEMIS 109
specializing in the ‘Indian’ migrant associations in the UK. As far as Malayalee part of the report
is concerned, due to lack of academic sources, we primarily relied on interviews with the
members of the community. For the purpose of this report we employed the interview with Mr.
Ashok Kumar, Secretary of the Kerala Cultural and Welfare Association.
1. Theoretical Framework of THEMIS
Trends and Patterns of Migration: Gujarat
The migration of Gujaratis to the UK is remarkable for its scale, its duration and its complexity,
in particular its relation to East Africa. Today Gujaratis claim to form the largest ‘minority’
group in the UK with an estimated population of 750,000 (Interview with CB Patel); over half
have been born in the UK and many do not speak Gujarati.
While Gujaratis have been in the UK for well over a hundred years, the most significant increase
came in the second half of the 20th century, when thousands of Gujaratis were forced out many
of the newly independent states of East Africa. Hence, it is open to question to what extent we
should be considering this as migration in the India-UK corridor.
The first Gujaratis to come to the UK are thought to be Parsis who came from Saurashtra to be
trained as interpreters as the British started to establish their presence in India from the mid 17th
century. During the first half of the 20th century, there was some growth in the immigration of
Gujaratis, stimulated by the involvement of Indian troops in the First World War (at one stage,
250,000 Indian soldiers were billeted in the Brighton area) and the labour demand in mills and
mines. Some of the Gujarati families in the English Midlands arrived before the Second World
War. However, by 1947, there were still only about 5,000 people of Indian origin in the UK, of
which about one quarter were Gujaratis. These were involved in import and export businesses,
banking and service industry. The post-war demand for labour in Europe increased the level of
migration in the 1950s. Many Gujaratis were also unhappy with the socialist policies of the new
government of independent India from 1947 which they saw as restricting their business
interests; this was also a factor in increasing movement to the UK.

Theoretical Framework of THEMIS 110
The largest expansion of Gujarati immigration came in the 1960s and 70s but this was movement
from Africa rather than India. This was the result of the widespread expulsion of Asians from
East Africa, a large proportion of whom were Gujarati. The historical conditions for this massive
displacement lay in the forced movement of Indian labourers by the British colonial
administration in the previous (19th) century. Under the indentured labour system, sometimes
known as the ‘coolie’ system, established in the 1830s, Indian labourers were signed up to
extremely exploitative contracts for labour across the empire. Under this system, over 1.5
millions Indians had moved to colonies in the Caribbean, Pacific, African and Asia. Others
moved more freely as traders and skilled workers in the colonial administration.
Many Gujaratis were in the latter category and settled in east and southern Africa, where they
came to play a major role in the professions and trade: about 70% of the Asians in East Africa
were Gujarati Hindus. In the years immediately after the war, they did particularly well in East
Africa as the economy was relatively strong compared to war damaged Europe and in the 1950s
there was also rapid growth in sisal and cotton production to meet the demand created by the
Korean War.
However, as Africa moved towards independence in the late 1950s, the future of Gujaratis in
Africa started to look less certain. CB Patel, in the interview, highlighted the British Prime
Minister, Neville Chamberlain’s famous ‘winds of change’ speech in 1959 which heralded the
end of British rule in Africa as a very significant moment for the Asian population in Africa.
Given their ambivalence about India’s socialist polices, many of the wealthier Gujaratis started
to look towards the UK as a future home, for example, sending their children there for schooling.
For many of the Indians in British colonies there were no bureaucratic barriers to moving to the
UK as they held British passports.
The warning signs for Asians in East Africa built up through the 1960s. Some of the lower
skilled and lower caste Hindus left first, to work in the light industries of the English Midlands,
especially in the town of Leicester. In 1969, there was an exodus of Gujaratis from Kenya as
Kenyatta’s Africanisation policy took hold excluding Asians from jobs and businesses.
This was followed by the larger and much more brutal expulsion of the whole Asian population
of Uganda by Idi Amin in 1972. Gujaratis formed the majority of those expelled and many of

Theoretical Framework of THEMIS 111
them came to settle in the UK. This was by far the most dramatic of the expulsions of Asians
from Africa. During the 1970s more groups of Gujaratis left other ex-colonies to head for the UK
as their conditions of life deteriorated, including those from Malawi (expelled in 1976) and some
from Mozambique (via South Africa) after its independence. Such expulsions were not unique to
Africa. For example, large numbers of Gujaratis moved to the UK in the aftermath of the Aden
crisis in 1964. More recently, the 1987 coup in Fiji which deposed an Indian dominated
government stimulated further migration to the UK.
Many of these Gujarati migrants had been born in the countries from which they were being
expelled. Nonetheless, they had retained strong links with India and formed a diasporic
consciousness was sustained and even strengthened by the experience of expulsion from these
former colonies to the UK, US, Canada and elsewhere (Nair 2001).
As a result, in the UK the arrival of Gujaratis from East Africa stimulated further migration from
India as people looked to reunite families over the following years. However, there have also
been other sets of movements directly from Gujarat which are not so clearly related to events in
Africa. In particular, there has been significant growth in the number of Muslims from Gujarat
who have migrated directly to the UK over the last fifty years.
It also important to note that today the Gujaratis in the UK are widely seen as the most successful
group of recent immigrants (Independent 1992). In particular, those who arrived from Uganda,
having lost everything, rapidly built up businesses, invested in education for their children and
have managed to establish a very strong reputation for enterprise in the UK. This success has no
doubt facilitated further immigration of Gujaratis as they move within a relatively wealthy
network that is well established in the UK.
Trends and Patterns of Migration: Kerala
Whilst the migration of Gujaratis to the UK was not a straightforward one and brought large
numbers of Gujaratis to the UK via East Africa, the Malayalees came to the UK via Singapore.
In the 1930s and 1940s many Malayalees (particularly men) left Kerala to work in the British
Navy which stationed in Singapore. They were recruited by their ‘British masters’ (this is how
the generation of Ashok Kumar’s parents would refer to the British rulers) due to their skills and

Theoretical Framework of THEMIS 112
familiarity with the marine industry. Kerala had ports and harbors which were administered by
the British.
The Malayalees who migrated to Singapore to work usually came alone (however some brought
their wives with them, and their children were born in Singapore). They worked for the British
Navy as auxiliary, support service. This ranged from clerical work in offices and in the Navy
communication to manual jobs like welding or working in the various workshops, helping on
board of the ships, in cleaning or in the catering. During the WWII many Malayalees from
Kerala served in the British Army, however not on the front line, but again in the auxiliary role.
According to the interviewees the main reason why the Malayalees came to Britain was because
of their British citizenship. After WWII, the 1948 Nationality Act stated that all British subjects
were citizens and were free to come to and go from the UK as they wished under what might
well be described as a Common Law right of abode. Many of the Malayalees who left Singapore
during the times of de-colonization of India came back to Kerala. The 1950s are preserved in the
community memory as the decade of ‘home coming’. Many however did not stay in Kerala for
long. They applied for British passports with the local High Commissions and on the basis of
their British citizenship came to the UK. The main reason for leaving Kerala was to look for
better opportunities. Whilst some of the Malayalees who came back from Singapore found jobs
in their professions and did well, others could not find work. Having once experienced the work
for their ‘British masters’, they wanted to come and see the life in the UK.
The first Malayalees arrived in the UK in 1950s. These ‘pioneer’ migrants largely knew each
other from their previous engagements in Singapore. They consisted of loose networks of friends
and colleagues, many of those worked together in Singapore. Due to their previous experience of
working for the Navy the Malayalee pioneers first stationed in Kent, with the British Naval Base.
According to Ashok Kumar the Malayalee community in the 1950s counted around 6 families.
With time the idea of migration to the UK was spread by the ‘word of mouth’ among the
Malayalees back in Kerala (Interview with Ashok Kumar). Similarly, like in Singapore, only few
of the men who arrived in the United Kingdom brought families with them. Most of the
Malayalees found jobs in the factories within Greater London; they primarily clustered around

Theoretical Framework of THEMIS 113
Croydon and East Ham. They found work in the local factories (e.g. Ford Motor Company in
East Ham, or Philips Electronics in Croydon).
The families (spouses and children) followed their footsteps from 1970s onwards. Our
interviewee pointed to certain resentment among the pioneer population of Malayalee men in the
UK toward being joined by their families. The ‘Western Culture’ was not considered appropriate
environment to bring up their children in by many first-generation Malayalees. They did not
want their wives and children to experience it. Also the men were sometimes themselves victims
of racism. This could explain why many of them waited 5 or 6 years before being joined by their
families.
There was an observable social mobility between the first and the 1.5 or second generation of
Malayalees in the UK. Whilst the parents might have been mainly manual workers, who stayed
working for the same factory all their lives, the young generation – whilst initially joining their
parents at their workplaces would then usually be promoted and move forward. Kerala people
will better themselves – this was often invoked by our respondents pointing the cultural source
(Malayalee, not necessarily Indian!) of this urge to progress. The Malayalees, who arrived in the
UK in their teens or as children would make use of the educational facilities available to them,
study and advance their careers.
In 1980s another wave of family migration took place – this time it was mainly marriage
migration when the 1.5 and second generation of Malayalees reached suitable, ‘marriageable’
age. According to our interviewees around 90% of all Malayalees who came to the UK with their
parents had their marriages ‘arranged’ for them back in Kerala. During the decade of 1980s the
profile of Malayalee migration to UK has changed. From semi-skilled and low-skilled workers
and craftsmen who came to the UK ‘on their own’ and devoted their time to work, Malayalees
became a community in the UK, with their own associations, youth clubs and cultural classes for
the children.
In the 1990s it became very difficult for Malayalees to migrate to the UK. From mid-1080s UK
introduced visas toward the Commonwealth nationals. With the changes in the British
immigration policy toward selective admission of high skilled migrants it was now mainly the
Malayalee highly educated medical and IT professionals or students who came to the UK for

Theoretical Framework of THEMIS 114
short-term contracts and dominated the migration corridor between Kerala and the UK. The
migration movements became much more diverse. Malayalees in the UK no longer come
from particular families with migration history in Singapore, they no longer settle in East Ham or
Croydon but are spread all over the UK depending on their job locations.
Quantitative Picture: India
Although the trends and patterns of migration can well be discerned at the state (locality) level, it
is much more difficult to build the quantitative picture of Gujaratis and Malayalees. In this
section we therefore rely on the aggregate picture with the data available on the national level.
They have been based on the Census data (1921 – 2001) using country of birth variable, and the
Annual Population Survey (2003 – 2008) estimates. What proportion of the ‘Indians’ in the UK
is constituted by Gujaratis and Malayalees? It is difficult to tell.
The Gujarati interviewees mentioned that out of the 750,000 Gujaratis in the UK, half of them
(approx. 375,000) were born outside of the UK – either in Gujarat or East Africa. Using the place
of birth variable, which is the only indicator used in the Census data does not therefore take us
far in estimating the number of Gujarati-Indians in the UK.
As far as the Malayalee population is concerned, between 1960s and mid 1970s approximately
500 families settled in London. Between mid 1970s and mid 1980s (due to family and marriage
migration) the community quadrupled. In the 1990s and 2000s the community was joined by IT
and medical professionals; however the scale of this migration is not large and strictly controlled
by the British state. As of today, the community workers speak of 150,000 Malayalees in the UK
(many of whom were again born in the UK).
The trend curve, reflecting the evolution of the Indian-born persons in the United Kingdom
according to the Census data, largely supports however the observations of the significant
increase of the population from 1960s onwards (cf. Chart 1). The rising trend was maintained
well into 1970s -- with Gujaratis fleeing East Africa, whilst other ‘Indian’ groups were being
joined in the UK by their families. The significant ‘bump’ in the population increase rate in the
1980s could be attributed to the widely popular marriage migration (and the culture of arranged
marriages according to cast and social status in India). The 1990s saw again the increase (yet at a
lower rate) of Indian professionals coming to the UK helping to fill in the high-skilled gaps in

Theoretical Framework of THEMIS 115
the British labour market. With regard to the most recent data – via APS estimates – the rise in
the population might well reflect the different (to the Census) methodology, but also adjustments
of the figures to reflect the more ‘realistic’ numbers. The community workers and organization
representatives agree that the official data on Indian migration to the UK is underestimated.
Chart 1: Indians in the UK, Source: Census Data, Annual Population Survey (Indexed 2008 = 100, 2008= ~632,000)
According to the Census 2001 the Indian-born population in the UK was female dominated at
52%.
0
20
40
60
80
100
120
140
160
1900 1920 1940 1960 1980 2000 2020
India

Chart 2: Sex ratio of Indian-born persons in the UK, Source: Census 2001 (OECD)
The age statistics revealed that in 2001 Indians were a predominantly middle
with 56% of them aged between 30 and 59 years (Cf. Chart 3).
Chart 3: Age structure of Moroccan
Female52%
Sex Ratio
0 20000 40000
0-14
15-29
30-44
45-59
60-69
70 or older
Theoretical Framework of THEMIS
born persons in the UK, Source: Census 2001 (OECD)
he age statistics revealed that in 2001 Indians were a predominantly middle
with 56% of them aged between 30 and 59 years (Cf. Chart 3).
Age structure of Moroccan-born persons in the UK, Source: Census 2001 (OECD)
Male48%
Sex Ratio
40000 60000 80000 100000 120000 140000
Age Structure
Theoretical Framework of THEMIS 116
he age statistics revealed that in 2001 Indians were a predominantly middle-aged population,
born persons in the UK, Source: Census 2001 (OECD)
160000

Policy Changes 117
As per the labour market status, 50% of the Indian-born population was employed, followed by
38% economically inactive (which could be related to the traditional family structure and
division of labour among the Indian-born men and women in the UK).
Chart 4: Labour force status of Indian-born persons in the UK, Source: Census 2001 (OECD)
With regard to the THEMIS framework Indians are the ‘ideal’ type case of an established (or
still expanding) migration system.
2. Policy Changes
The British immigration policy should be analyzed in a two-fold way. There was the British
immigration policy toward Indians- British subjects from the Indian subcontinent (Gujaratis and
Malayalees coming from India), and toward Indians- British subjects (Gujaratis) in East Africa.
British immigration policy toward Indians coming directly from India largely resembled that
toward other Commonwealth citizens (e.g. Bangladeshis).
The review of the early immigration policies demonstrates that they were directed mostly at
Aliens and not at British subjects recruited from the Commonwealth. Although the latter – like
lascars – might have been subject to specific laws preventing their free settlement in the UK, the
historical accounts of acquiring Certificates of Nationality and Identity lead us to conclude that
de facto the movement of persons and their right of residence in the UK were neither heavily
50%
4%
38%
8%
Labour Force Status
employed
unemployed
inactive
unknown labour forcestatus

Policy Changes 118
regulated nor restricted. British subjects were free to come and go from the UK as they wished
under what might have been described as a Common Law right of abode (MacDonald et al.
2010).
1948 British Nationality Act: Free Movement of British Subjects
The institutionalization of this common-law derived policy found its statutory legal support and
confirmation in the 1948 British Nationality Act. Under the Act, all British subjects or
commonwealth citizens (terms used interchangeably until 1983, MacDonald et al. 2010) had
constitutionally guaranteed free movement of persons between the colonies and the UK and right
of abode in the UK. They enjoyed this right whether they lived in the UK or elsewhere, and
whether or not they were citizens of the United Kingdom and Colonies (CUKCs).
1960s: British Immigration Policy toward Indians from Independent India
Things have changed with the 1962 Commonwealth Immigrants Act, whereby Commonwealth
citizens were first made subject to statutory immigration control in the UK. This Act was brought
into force mainly as a result of a campaign against black Commonwealth citizens already here
(MacDonald et al. 2010). The Act made a distinction between
Commonwealth UK Citizens (CUKCs) and
citizens of independent Commonwealth countries, and based control upon the kind of
passport held by the would-be immigrant.
Indians (Gujaratis and Malayalees) coming to the UK directly from India (upon its independence
in 1947) and not having the British passport issued by the British High Commissioner fell under
the second category. This means that they become subjects to immigration control. 24
On the basis of the 1962 and 1968 Commonwealth Immigrant Acts, before arriving in the UK
the Commonwealth workers (here: Gujaratis and Malayalees coming to the UK directly from
24Those Malayalees, who before 1962 applied for the British passport with the British High Commissioner in India
were exempted from the control, and had right of settlement in the UK.

Policy Changes 119
India, without British passport) must have been in a possession of an entry certificate and
voucher (limited by quota). No work permit was necessary (in contrast to Alien Workers).
Vouchers for the employment of Commonwealth citizens were issued under the 1962
Commonwealth Immigrants Act and 1968 Commonwealth Immigrants Act. The vouchers were
issued in two categories: category A for Commonwealth citizens with a definite offer of a job,
and category B for those who held certain specified professional qualifications (Migration
Histories 2010). Application for a category A voucher was made by the prospective employer.
According to the legislation in place (except for Malta and the Dependent Territories) the
vouchers were to be issued for: those holding professional qualifications and managerial and
executive staff; skilled craftsmen and experienced teachers; specialised clerical and secretarial
staff; and those coming for work which, in the opinion of the Secretary of State for Employment,
was of substantial economic and social value to the UK (Migration Histories 2010). It is
considered that the latter actually denoted the low-skilled workers, who came to fill the UK’s
numerous job vacancies, in the years of Britain’s economic boom (as vouchers were not issued if
the vacancy offered could be filled by resident labour).
Special arrangements existed for the admission, without vouchers, of doctors and dentists.
Although only a limited number of vouchers were issued annually, based on fixed quotas for the
various countries of the Commonwealth (Migration Histories 2010), many Gujaratis and
Malayalees like others from the Indian sub-continent took this opportunity and used their old
links with the settled Asian community. As more jobs were available more and more men came
from South Asia to work (Ullah and Eversley 2010).
Upon being admitted, however, Commonwealth Workers received absolute right of settlement,
and were not subject to any further controls after entry.
Dependent spouses of Commonwealth Workers had to produce an entry certificate (issued in the
territory of origin after tests of eligibility) in order to pass the entry requirements. Upon being
admitted they had the right to join their spouses (Primary Commonwealth Workers) in their
absolute right of settlement, and to take up a job. In the same way as the primary applicants, the
dependent spouses were not subject to any controls after admission.

Policy Changes 120
Commonwealth Dependent Children (and other Commonwealth Dependants – parents, distressed
elders) were admitted on the basis of an entry certificate, again issued in the territory of origin.
Children under the age of 16 had absolute right of settlement; for those aged between 18 and 21
the right was at the discretion of the Home Office. Parents over 65 were admitted for settlement,
and other dependants had the right of settlement granted in specified circumstances.
Commonwealth Dependent Children and Commonwealth Dependants did not experience any
further controls upon being admitted to the UK.
1960s: British Immigration Policy toward Indians (Gujaratis) in East
Africa
As stated in the above section, the 1962 Commonwealth Immigration Act aimed to make
Commonwealth citizens subject to British statutory immigration control, and therefore
differentiated between the legal status of Commonwealth UK Citizens (CUKCs) and citizens of
independent Commonwealth Countries. CUKCs who were born in independent Commonwealth
countries and who retained that status after independence (like Gujaratis in East Africa) were
exempted from control provided they had a UK passport. A passport issued by the High
Commissioner would normally qualify.
This category of CUKC comprised, among others, large sections of the Asian community in
Kenya, who had expressly been given the option of UK citizenship by the Kenya Independence
Act 1963 on exactly the same basis as the European settlers.
Similar provisions had been made when Uganda became independent. Under the Commonwealth
Immigrants Act 1962 all of these persons were entitled to come to Britain as of right, and many
did so, because of the policy of Kenyanisation adopted by the Kenyan government and a similar
policy of preference to their own citizens adopted by other East African countries (MacDonald et
al. 2010).
The Commonwealth Immigrants Act 1968 sought to change all this. Its aim was to bring the East
African Asians under immigration control; its method was to divide holders of UK passports into
two separate categories, those who could enter Britain without restriction and those who could
not.

Policy Changes 121
Ancestral connection to the UK became the key factor in determining which CUKCs were
subject to immigration control. The intention was to keep out East African Asians and it was
not difficult to see that the mechanism for doing this was the section defining the necessary
ancestral connection.
The immediate precedent was to be found in the British Nationality Act 1964, the main aim of
which had been to preserve the right to resume UK citizenship to white settlers in Africa (who
were then under pressure to assume the citizenship of newly-independent African countries). It
was a formula which enabled politicians and officials to proclaim that there was nothing racist
about such laws (MacDonald et al. 2010).
In East African Asians v United Kingdom complaints by a large number of applicants, that their
human rights had been infringed by the operation of the 1968 Act, were upheld, and in particular
the Commission found as a fact that, notwithstanding the neutrality of the language of the statute,
it had racial motives and targeted a racial group, and that the racial discrimination in its operation
constituted degrading treatment. The huge opposition to the 1962 and 1968 Acts, and the real
sense of grievance within the immigrant communities, may have been among the factors leading
to the setting up of the Committee on Immigration Appeals, whose report led to the Immigration
Appeals Act 1969 (MacDonald et al. 2010).
1971 Immigration Act: Unification and Tightening of Entry Requirements
The Immigration Act 1971 repealed all previous legislation, with minor exceptions, and spelled
the end of large-scale primary immigration for settlement from the 'new Commonwealth'.
Commonwealth UK Citizens became subject to immigration control. The benefits of the right of
abode had shrunk to a small, exclusive, largely white group of 'patrials', defined by their
connection to the UK through their ancestry. The main route of coming to the UK for
Commonwealth nationals has become the family migration (or one by the virtue of marriage).
On the same day that the 1971 Act came into force, 1 January 1973, the Treaty of Rome
provisions came into force in the UK, giving rights of free movement for work and establishment
in business or self-employment to all citizens of the EEC's Member States. The dominant policy
model was created and entrenched: emphasizing the integration of immigrants (through a `race
relations’ approach), and the restriction of immigration (a ‘zero-migration’ approach).

Policy Changes 122
Due to limitations in channels of legal entry and settlement for economic migrants
(Commonwealth Workers), it was the family unification – migration of spouses, children and
other dependants – that dominated the flow of persons between India and the UK in the 1970s
(cf. trends and patterns of Gujarati or Malayalee migrations).
With regard to the newcomers, the rights of residence and settlement of Commonwealth Workers
were restricted in the sense that they were made equal to those of Alien Workers (from outside
the Commonwealth). Indeed when we compare the rights of Commonwealth Workers before and
after 1971 they are significantly different. The privilege of absolute right of settlement for
primary workers arriving in the UK after 1971 was abolished and replaced by a four-year period
upon which settlement might have been granted on conditions.
The Commonwealth Workers, although denied the absolute right of settlement, were still
allowed to settle in the UK after four years (and many of them did). They were also obliged from
then on to register with the police and report any changes of address.
The analysis of the new legal environment after 1971 raises some striking questions relating to
THEMIS theoretical framework and the impact of policies (as well-established macro factors) on
migration movements. It is commonly accepted that due to the changes in the legislation (1971
Immigration Act) and restrictions for Commonwealth Workers willing to come and work in the
UK, the main inflow of migrant workers to the UK stopped and was replaced by the family
reunification movements (cf. Somerville 2007). However, if one digs deeper into the migration
policy, it is actually the spouses and dependent children whose rights became particularly
acutely restricted by the 1971 Immigration Act (cf. the discussion in the Bangladeshi Scoping
Study Report, pp. 20-21).
1980s: Closing the Gates
The 1981 British Nationality Act attempted to re-align nationality with immigration rights, and
in doing so created further confusion and anger. The 1981 Act created out of the former UK and
Colonies citizenship several different types of British nationality, only the first of which, British
citizenship, carried the right of abode. The other main category of former Commonwealth UK
Citizens (CUKCs) was given lesser citizenship status by the 1981 Act; the British Overseas

Policy Changes 123
Citizens (BOCs) – Commonwealth (i.e. newcomers from Gujarat and Kerala without family
links in the UK) – became a category with no right of entry (MacDonald et al. 2010).
By the mid 1980s the first visa controls had been imposed on Commonwealth citizens (1988
Immigration Act) and these were swiftly followed by the first carriers’ liability measure, the
1987 Immigration (Carriers’ Liability) Act, pushed through in response to the arrival of visa-less
Tamils fleeing Sri Lanka.
The introduction of visa controls on Commonwealth citizens, and of carrier sanctions, were the
first domestic manifestations of a pan-European policy to deal with the increasing numbers of
asylum seekers arriving in Europe, and it is asylum which has become the big issue in the past
two decades.
1990s and 2000s: Managed Migration Approach and Points-Based System
With regard to new Indian immigrants, the last three immigration acts – the 1999 Immigration
and Asylum Act, the 2002 Nationality, Immigration and Asylum Act and the 2006 Immigration
and Nationality Act – present a compilation of different measures, but have at their heart four
main themes:
i) tidying up measures
j) removing and restricting rights of appeal
k) creating a new system of employer sanctions to stop illegal working by migrants
l) monitoring, surveillance, and more co-ordinated policing of migrants old and new on
the basis of seeking out crime, people-smuggling and terrorism, and collecting vast
new databases on all third-country nationals (i.e. those who are not British or
European Economic Area [EEA] citizens) (MacDonald et al. 2010).
In practical terms under the Labour Government (1997–2010) the changes in the immigration
policy resulted in:
11) tightening of immigration controls
12) selective admission focused solely on highly skilled migrants and migrants with
skills that are in deficit in the UK

Institutions 124
13) severe limitations in legal channels of entry for low-skilled migrants from outside the
EEA
14) access to labour market by students limited to 20 hours per week
15) unlimited access to labour market by spouses of primary workers (usually admitted
under Work Permit or Highly Skilled Migrant Programme [HSMP] scheme, since June
2008 – Tier 1 and Tier 2).25
These changed evidently had their impact on the different profile of the ‘newcomers’ from
Gujarat and Kerala to the UK. The corridor has now become dominanted by high skilled
professionals (IT boom in late 1990s, medical staff, business persons), contract-workers and
students. Many of them bring their families with them and join the settled and established Asian
community in the United Kingdom.
The managed migration approach under Labour did not intend any quotas or caps of non-EEA
nationals admitted to the UK (including Indian nationals). With the change of government in
April 2010, the Conservative-Liberal Democrat government announced the introduction of caps
on the number of non-EEA nationals admitted to the UK, administered on a monthly basis by the
UK Border Agency. The interim cap for Tiers 1 and 2 came into effect on 19 July 2010 and is to
last until March 2011. After this, the government proposes to introduce, following consultation,
the final system (UKBA 2010).
3. Institutions
The United Kingdom hosts over a thousand Indian organisations (Khadria 2008; Van Hear et
al 2004, Lacroix 2010). The largest ones have chapters in various settlement countries, thus
drawing an interlocked diaspora-wide civil society. Because of its sheer diversity, there has been
no attempt to create any overarching institutions representing overseas Indians. Indian
25A broad overview of these schemes was presented in the Scoping Study Report on Ukraine. They are of course
also applicable with regard to any future migration from Bangladesh. Therefore, in order not to duplicate theanalysis, this section refers the reader to the respective sections of the Ukrainian report.

Institutions 125
organisations are clustered in distinct but interconnected organisational fields structured
according to religious, ethnic (caste) or political background.26
The base of the overseas Indian institutions in the UK is formed by plethora of more or less
formal village networks (among Sikhs) and caste organisations (among Hindus). This
organisational level was, for long, confined to informality and was mostly acting as a bridgehead
for chain migration. Kinship and village-based networks are now gaining visibility as a growing
number of these organisations are engaged in development practices for the benefit of the origin
community.
Historical Perspective
Prior to the Second World War, only a handful of associations were active. A sizeable formal
Indian migrant organizations emerged in the sixties, when religious, welfare and cultural
organisations appeared to meet the needs of the then growing population. Religious and
community-help organisations still constitute the bulk of Indian associations.
Religious organisations constitute the backbone of the overseas Indian migrant organizations.
Beside their religious activities stricto sensu, they provide a physical space for social gatherings.
The control for places of worship set the background for factional disputes between community
leaders. There were 193 gurudwaras, more than 610 mosques and 111 mandirs in 1999 in Britain
(Peach 2006). Welfare organisations of various sorts (nurseries, week-end schools, sport clubs,
elderly care, etc.) form the second largest category. Welfare organisations aim to ease integration
within the wider society while preserving cultural cohesion.
Political organisations are relatively numerous due to the troubled history between the Diaspora
and India. These organisations can be divided in three categories: the oldest, dating back to the
1930s and 1940s, are the remnant of the independence movement efforts (the Indian Overseas
Congress, Akali Dal); in the sixties and the seventies, the structuring of the Asian working class
was conducive to the creation of leftist organisations (the Indian Workers Association); the most
recent organisations were created during the civil war in the Punjab, at the end the eighties. The
26This section largely rests on the research done within the Transnational Migrant Organisation programme
funded by the Volkswagen Foundation. The programme includes partners from the University of Bochum, Oxford,Granada and Warsaw. It was adapted from: Simona Vezzoli, Thomas Lacroix (2009) Indian Diaspora Policies, GTZReport, IMI: University of Oxford

Institutions 126
so-called Kalistan movement emerged in the wake of the attack of the Golden Temple by the
Indian Army (the holiest Sikh shrine) to support the creation of an independent state of Punjab
(International Sikh Youth Federation, the Sikh Brotherhood). After the end of the war, a part of
Kalistani activists changed of focus of activity and reoriented their involvement toward the
promotion of Sikhs interests in the world. The post-Khalistani movement developed in the UK,
USA or Canada to defend religious and social rights of the Sikh community (Sikh Human Right
Group, United Sikhs).
In the nineties, the rise of extremist Hinduist movements in India has had important repercussion
in the Diaspora. The Swaminarayan movement opened branches all over Britain and the BJP has
an office in London. Several affairs in the US or in Britain involving fake NGOs tapping the
Diaspora to provide funding to extremist groups also hint for the dynamism of such groups
outside India. A transversal category is composed of the party branches which, until today, have
been a common form of migrant organisation. For example, the Indian Overseas Congress, the
Indian Communist Party and the Akali in the 1980s, IOC and BJP today are the main Indian
parties holding branches in Britain.
Finally, with the improvement of the socio-professional situation of Indian immigrants, a large
number of business and professional organisations emerged in the nineties, e.g. British
association of Physicians of Indian origin.
Types of Engagement
The analysis of the cross border activities of the organisations investigated allows us to
distinguish three types of involvement:
Political activities: UK-based organisations support political movements abroad either
financially or through awareness-raising campaigns. The Sikh human rights group or the
various Indian political organisations (the Indian Workers association, the Akali Dal, the
International Sikh Youth Association) develop such activities. Hindu nationalist
organisations such as the Swaminarayan also fall into this category.
Network activities: organisations affiliated to transnational federations or networks
participate in international meetings and activities. This is the case of a number of

Institutions 127
religious organisations such as the Arya Samaj, the National council of Sikh Gurudwaras,
the British Organisation of Sikh Students, etc.
Development/philanthropic activities: they constitute the bulk of transnational activities
of Indian organisations. Development projects can be the main objectives of a wide array
of organisations, ranging from village-based organisations (e.g. the Pakowal village
association, the Bilga General Hospital Charitable Trust) to large NGOs (Alternative for
India Development, Asian Foundation for Philanthropy and Indicorps, Sikh Aid
International, United Sikhs). But development initiatives can also be secondary activities
of Temples (Namdhari Sangat Birmingham, Ramgarhia Sikh Temple, Guru Nanak
Nishkam Sewak Jatha, etc.) and welfare organisations (Azan Nisar Dwawah trust, Azad
Kashmir welfare association, Kerala catholic association).
The forms of the transnational connections vary greatly. They can be translocal, in particular in
the case of small development project, trans-state or even global: one of the specificity of the
Indian Diaspora is to maintain ties not only with the origin country, but also among Indian
communities in the main receiving countries (USA, Canada, etc.) or even with communities in
former important host countries (the development projects supported in Kenya or Uganda by
Indian organisations illustrate this specificity).
With regard to the migrant institutions, due to their heterogeneity it is again clearer to present
them at the level of particular communities, Gujaratis and Malayalees respectively.
Scoping Study Experience with Gujarati and Malayalee Organizations
There is a National Conference of Gujarati Associations, which claims to have 105 groups
and be the largest organisation of the Gujarati community in the UK. However, lots of these
associations are not very active. The Congress is a non-political, non-religious and non-profit
organization. It aims to inform, advice involve and represent the Gujarati speaking population of
the United Kingdom on all issues which affect them and generally to work for their social,
economic, educational, cultural, linguistic and religious advancement. In order to achieve this it
acts as a national forum and central communication platform to assist the Gujaratis in the
dealings with statutory and voluntary organizations. It also represents the interests of Gujaratis to
the wider audience, and hopes to foster a better understanding and relationship between the
various communities and organizations.

Institutions 128
Moreover, 37 are associations of Patels (denouncing a family name and caste) originating from
the two districts of Gujarat: Anand and Kheda. There are no Muslim organisations represented
and there is a strong geographic focus on London, especially the boroughs of Brent and Harrow.
With regard to the Malayalees, due to their size, they are primarily centered around two main
community organizations: Kerala Cultural and Welfare Association (in Croydon, London)
and Malayalee Cultural and Welfare Association (in East Ham, London). These associations
collaborate with each other on various levels. Their members celebrate together different
religious and cultural festivals, but also compete with each other in sporting and cultural
competitions (e.g. traditional dance and singing). They also send to Kerala collective
remittances. After the tsunami of 2004 the Malayalees from London (both Croydon and East
Ham) not only financed but also managed and administered the building of a Primary and
Secondary School in the affected area, in a village in Kerala, in Kollam district.
Each of the association has also special sections for women, children and the youth (e.g. Youth
Club). The Kerala Cultural and Welfare Association started in 1975 as a Youth Club. It mainly
consisted of 1.5 generation of Malayalees who wanted to socialize together or play sport
(badminton, football, and cricket). The club however played also important role in assisting ‘the
elders’ in the community with various welfare-related matters (like filling in forms concerning
immigration matters – applications for permanent settlement, applications for family reunion,
helping the families to use the services like registering with a GP). The Youth Club was also an
important point of support for those Malayalees who experienced racism in the UK in late 1970s
and early 1980s. In 1988 the club developed into full association under its present name. The
members of the association are now the second (or even third) generation of Malayalees in the
United Kingdom.
The Malayalees would stress that they form one community in the UK. They celebrate their
festivals together, also in an event of a wedding there is the obligation to invite ‘everyone’ from
the community. Although the associations are based in two localities (Croydon and East Ham)
the Malayalees stay connected throughout the UK.
Malayalees from Croydon and East Ham in London are also well connected with Malayalees in
Germany or other European Countries. The community is not stagnant but it is thriving. The UK

Remittances 129
Malayalee Forum is a platform which connects Malayalees all over the globe to share their
experiences, expertise, skills, and facilities. It develops projects which help the second
generation, born and brought up in the host countries to go back to their roots and preserve their
cultural customs.
4. Remittances
Since 2003, India has been the world's largest recipient, at least in absolute terms, of remittances,
defined as the inflow of private transfers. From a modest US$ 121 million in 1970, remittances
through formal channels were pegged at US$ 49,941 million in 2008 (World Bank 2009).
Also, in relative terms, remittances gained considerable importance since they now make up a
larger chunk of India's gross domestic product: 4.1 per cent in 2008 according to the World Bank
versus 0.7 percent in 1990-1991 according to the Reserve Bank of India (RBI). In addition to
remittances, India has seen growth in capital inflows. In the 1970s, the government authorized
special deposit schemes for non-resident Indians (NRIs) to increase its foreign-exchange
reserves; depositors can hold their money in foreign currencies or in Indian rupees. NRI deposits
grew steadily from US$14 billion in 1991 to US$ 43.7 billion in 2008.
The World Bank bilateral remittance estimates using Migrant Stocks, Host Country Incomes, and
Origin Country Incomes (in US$ millions)27 revealed that in 2005 India received from the UK
remittances amounting to $2,008m, which constituted 8.5 per cent of all the remittance inflows
to India during that year. This made the UK the fourth largest remittance sending country after
the United Arab Emirates (UAE – $6,426 million), United States ($4,840 million), Saudi Arabia
($2,591 million) but before Canada ($1,224 million).
27These data are estimated using assumptions and arguments as explained in Ratha and Shaw (2006) ‘South–
South Migration and Remittances’, Development Prospects Group, World Bank(www.worldbank.org/prospects/migrationandremittances).

Remittances 130
Chart 4: Remittance Inflows to India (US$ millions), Source: World Bank (2009)
Remittance Sending Country Remittance Receiving Country – India
United Arab Emirates 6,426
United States 4,840
Saudi Arabia 2,591
United Kingdom 2,008
Canada 1,224
Table 1: Bilateral Remittance Estimates using Migrant Stocks, Host Country Incomes, and Origin Country Incomes(US$ millions), Top 5 Remittance Sending Countries. Source: World Bank 2005
-
10,000
20,000
30,000
40,000
50,000
60,000
India Remittance Flows

Individual migration histories 131
5. Individual migration histories
The trends and patterns of Gujarati and Malayalee migration to the UK have already been
partially presented in Section 1, when THEMIS theoretical concepts were confronted with the
empirical reality, and in Section 2, where UK immigration policy outcomes were presented in
parallel with the history of Indian movements to the UK.
CB Patel’s individual migration history is somewhat illustrative of the large population of
Gujaratis who came to the United Kingdom via East Africa. CB Patel moved from Gujarat to
Tanganyika for six year. After Chamberlain’s ‘Winds of Change’ speech in 1959, he applied for
a postgraduate scholarship at Imperial College. This was not successful but he was offered a
place at university in New Zealand. However, he did not have sufficient funds to go there.
Instead, elected to do an LLB in London and has lived in UK since then. He has been very active
in working with Gujarat community, especially as his children have got older and he wanted
them to know about Gujarat, the language and customs. That said, he is very firmly declaring
himself to be British and expressed some surprise at those who might put their religious or ethnic
identity first; he cited the example of a local politician in a London borough describing himself
as a Muslim British Gujarati with disapproval. He maintains very strong links with Gujarat and
the wider Indian community, including government contacts. This is essential for his business as
he runs a publishing company which produces magazines and weekly newspapers targeting the
south Asian population in the UK. However, he also told stories of directing friends and others
towards his village for visits and to provide support there; this appeared to be on an ad hoc basis
as the opportunities presented themselves.
Ashok Kumar considers himself as a representative of the 1.5 generation of Malayalees who
came to the United Kingdom from Kerala to join their fathers. His father arrived in the UK (as a
British citizen) in 1973. Ashok, his brother and his mother arrived six years later, in 1979. Ashok
joined his father to work in the local factory, back in Kerala he just finished college. In Croydon,
during the day he was working on the assembly line. In the evenings however he was studying,
he went to Croydon College and qualified as a technician. He was promoted, and climbed up the
management ladder in the local factory. He then left the factory to study economics and gain
certifications in accountancy. He now works as a civil servant and specializes in financial

Individual migration histories 132
accounting. Ashok is also pursuing a part-time PhD in complexity management. Why he thinks
his story vividly resembles the story of many Malayalees who like him came to the UK as
children or teenagers? We are all hard-working people. Our children have great achievements at
school. This is special for Kerala. It is our ethos. Back in India Kerala is the only state with
100% literacy. Perhaps therefore it is in our culture that we must study, we must compete, and
we must better ourselves. (Interview).
Where to? – Where From? Gujaratis
As noted above, while many of the Gujaratis in the UK have arrived via Africa, they still refer to
a home area within Gujarat as their place of origin. In the Gujarati population in the UK today
(many of whom were born in the UK, therefore the links to particular localities of origin are
more family-type or cultural), about 150,000 are Hindus from Kheda and Anand districts,
mostly Patels, whose families moved from East Africa. There are a further 50,000 from the
poorest district Kachchh, again mainly Hindus. 150,000, mostly Muslims, originate from
Bharuch district. The rest (300-350,000) are from the richest areas of Gujarat, Saurashtra (cf.
Map 1). There was some clustering in the original emigration from Gujarat to the colonies and as
a result, some districts of origin are associated more frequently with different colonies.
More Gujaratis from East Africa settled first in Leicester rather than London, They were
originally
attracted by
the light
industry, such
as hosiery,
typewriters
production in
the 1960s. The
Gujarati
population of
Leicester had
already grown
significantly
Map 1: Present-day Gujarat

Individual migration histories 133
by 1972 when Amin issued orders to expel the Uganda Asians. This prompted the city council to
place advertisements in the Ugandan Argos in Kampala advising people not to come to Leicester
as it was full. Despite such discouragement (or perhaps because of it) people still went there in
large numbers. Gujaratis are still the largest immigrant population in Leicester today. Large
numbers also settled in north-western towns such as Blackburn and Bootle. As they became
more established and economically successful, many moved further south to London and the
South-East.
Leicester, which also already had a large Asian community, went so far as to advertise in September 1972
in the Ugandan Argos, saying it was already over- stretched and warning 'settlers' to go to 'places less
overcrowded', an advert that had the effect of planting the name 'Leicester' more firmly in many heads.
About 6,000 ended up there, much to the town's initial dismay. (Independent 1992)
Where To? – Where From? Malayalees
The majority of Malayalees came to the UK via Singapore. Ashok Kumar estimated in the
interview that those Malayalees who previously worked in Singapore constituted 80% of the
population of migrant workers who started arriving in the UK from Kerala from 1960s. They
therefore knew each other, and the idea of migrating further, this time to the UK, spread by the
‘word of mouth’. The dominant population of Malayalees came therefore from two particular
districts of Kerela – Thiruvananthapuram and Kollam. Within these districts our respondents
pointed to two particular towns/ villages in the West coast of Kerala: Paravur in Kollam and
Verkallai in Thiravananthapuram (cf. Map 2). Due to the cultural ties the marriage migration
which took place from Kerala in the 1980s also originated largely from these two districts. This
observation therefore supports one of THEMIS hypotheses that migration (or at least the trends
and patterns of migration dominant in the previous century) were likely to occur from particular
localities in the place of origin.

Individual migration histories 134
In the
UK the
Map 2: Present-day Kerala, red circle highlights the specificlocality where the core of the Malayalee community in the UKoriginates from.

Assessment and Identification of Issues to be Explored in Phase 2 135
Malayalees from Paravur and Verkallai settled within Greater London, again clustering around
two major locations: East Ham (in East London) and Croydon (in South London). A small
proportion of Malayalees also settled in Southall. The main reason for the clustering would be
proximity of factories where first Malayalees found work, and were then followed by other
members of their community from Kerala. Out of the estimated 150,000 of Malayalees in the UK
East Ham nowadays hosts approximately 60% of the Malayalee population in the UK. When
they arrived in the 1960s they worked predominantly for Ford Motor Company. In Croydon the
Malayalee population is smaller (approx. 35%), and the workers primarily found employment in
Philips Electronics and two plastic factories (Stewart Plastic in Purley and Mitcham Plastic). The
first migrant workers worked in these companies all their lives, the factories were also the main
places where they socialized with their workmates, shared information or even arranged
marriages. The settlement in Southall (unusual locality, as traditionally inhabited by Punjabis)
would be reasoned by proximity to Heathrow airport, where Malayalees found work in auxiliary
services.
Since 1990s Malayalee professionals coming from Kerala became dispersed all over UK,
depending on their workplace and locality specified in their contracts.
6. Assessment and Identification of Issues to be Explored in Phase 2
In some ways the migration of ‘Indians’ to the UK would appear to make a useful case study for
THEMIS. ‘Indians’ in the UK seem like the ideal-type of established (and in many places still
expanding) migration system. However due to the complexity and diversity of the ‘Indian’
migration system certain empirical categories do not seem really reconcilable with the
conceptual tools we have at hand and with the aims we set ourselves in the project proposal.
There are THEMIS categories which are more meaningfully studied if presented at the local
level, like migration trends and patterns (from a particular locality to a particular locality), or
migrant institutions. It is impossible to list particular localities for the ‘Indian’ migration to the
UK, as the migration system is so complex and vast. All Indian states at some point would have
sent migrants to the UK. The category of ‘Indian’ in the UK would then need to be reconstructed
to a smaller, better manageable unit like state or ethno-linguistic group. This is how we did it in

Assessment and Identification of Issues to be Explored in Phase 2 136
the report with the case studies of Gujaratis (well studied group) and Malayalees (under-studied
group).
In many ways the migration of Gujaratis and Malayalees to the UK would appear to make a
useful case study for THEMIS. Charting the numbers of migrants might show a classic S curve,
with the steepest rise in the 1970s for Gujaratis and 1980s for Malayalees. Moreover, the arrival
of Gujaratis to the UK appears to be well documented, especially for those who arrived from
East Africa in the 1970s.28
However, another problem emerges. There are other THEMIS categories (like quantitative data
or migration policies) which are best (or only possible) to analyze at the nation-state level. The
UK figures do not disaggregate between Gujaratis or Malayalees but treat them under one –
Indian – category. The numbers we received and presented in the report come from estimates of
community workers and representatives of migrant institutions. Similarly the migration policies
(British immigration policy or Indian policy toward its diaspora) do not disaggregate across
ethnic lines, but distinguish between different types of former `British Commonwealth’
citizenship (British Citizenship, British Dependent Territories’ citizens, British Overseas citizens
(BOCs), British subjects without citizenship, and British Nationals Overseas). It might therefore
be interesting to see more in-depth why the Malayalees stress so much in their narratives that
they came to the UK largely on the virtue of their British citizenship? Why this issue does not
appear to be so important for Gujaratis?
The crucial problem is to make these different levels of analysis talk to each other. This would
make it very difficult to use ‘Indians’ as a case study without significant changes to our
approach. From the UK perspective, it would be better to adopt case studies of migrants who
have followed more straightforward (and less complex) trajectory than the one presented by the
‘Indian’ migration system.
28At the same time one has to bear in mind that while Gujaratis may look to the same area as a place of origin,
they have moved to the UK from many different countries. They are not moving within one migration ‘corridor’.

Bibliography 137
Bibliography
Barkan JD, Mcnulty ML, Ayeni MAO. 1991. Hometown Voluntary-Associations, Local
Development, and the Emergence of Civil Society in Western Nigeria. Journal of
Modern African Studies 29:457-80
Catani M, Palidda S, eds. 1987. Le rôle du mouvement associatif dans l'évolution des
communautés immigrées. Paris: Fas, Ministère des Affaires Sociales
Cheetham J. 1988. Ethnic associations in Britain. In Ethnic associations and the Welfare state,
ed. S Jenkins. New York: Columbia University Press
Chishti M. 2007. The Rise in Remittances to India: A Closer Look In Migration Information
Source. Washington: Migration Policy Institute
Daum C. 1998. Les associations de Maliens en France. Migrations, développement et
citoyenneté. Paris: Karthala
Fox J. 2005. Mapping Mexican migrant civil society. p. 43: Latin American and Latino studies
department, University of California, Santa Cruz
Goldring L. 2004. Family and collective remittances to Mexico: a multi-dimensional typology.
Development and Change 35:799-840
Gonin P. 1997. D'entre deux territoires. Circulations migratoires et développement entre le
bassin du fleuve Sénégal et la France. HDR. Université des sciences et techniques, Lille.
Independent (1992) ‘From grief and fear to over here’ Report in theIndependent 1st August 1992. http://www.independent.co.uk/life-style/from-grief-and-fear-to-over-here-on-6-august-1972-idi-amin-pronounced-his-expulsion-order-and-30000-embattled-ugandan-asians-headed-for-britain-what-did-they-find-here-and-what-have-they-made-of-it-sandra-barwick-reports-1537251.html
Jenkins S. 1988. Ethnic associations and the welfare state : services to immigrants in five
countries. New York ; Guildford: Columbia University Press. x, 299 p p.
Kapur D. 2003. Indian Diaporic Philanthropy: some observations. In Workshop on Diaspora
Philanthropy to China and India, ed. GE Initiative, p. 24. Harvard University
Khadria B. 2008. India: skilled migration to developed countries, labour migration to the Gulf. In
Migration and Development. Perspectives from the South, ed. S Castles, RD Wise, pp.
79-112. Geneva: IOM
Koopmans R, Statham P. 1999. Challenging the liberal nation-state? Postnationalism,
multiculturalism, and the collective claims making of migrants and ethnic minorities in
Britain and Germany. American Journal of Sociology 105:652-96

Bibliography 138
Lall M. 2003. Mother India´s forgotten children. In International migration and sending
countries, ed. E Ostergaard Nielsen, pp. 121-39. Houndsmill, Basingstoke: Palgrave
Macmillan
Landolt P, Autler L, Baires S. 1999. From Hernano Lejano to Hermano Mayor: the dialectics of
Salvadoran transnationalism. Ethnic and Racial Studies 22:290-315
Macdonald, Ian A. and Toal, R. (2010) Macdonald’s Immigration Law and Practice, London:Lexis Nexis UK
MOIA. 2009. Annual report 2008-2009, Minister of Overseas Indian Affairs, New Delhi
Nair, S. (2001), "Moving life histories: Gujarat, East Africa, and the Indian Diaspora,1880-2000" (January 1, 2001). Dissertations available from ProQuest. PaperAAI3015348. http://repository.upenn.edu/dissertations/AAI3015348
Orozco M. 2003. Hometown associations and their present and future partnerships: new
development opportunities?, US Agency for International Development, Interamerican
Dialogue, Washington D.C.
Østergaard-Nielsen E. 2003. Transnational politics : Turks and Kurds in Germany. London:
Routledge. xiv, 178 p. p.
Peach C. 2006. South Asian migration and settlement in Great Britain, 1951-2006.
Contemporary South Asia 15:133-46
Portes A, Escobar C, Renelinda A. 2009. Divided or Convergent Loyalties?: The Political
Incorporation Process of Latin American Immigrants in the United States. International
Journal of Comparative Sociology 50:103-36
Quiminal C. 1991. Gens d’ici, gens d’ailleurs. Paris: Christian Bourgeois
Rex J, Joly D, Wilpert C, eds. 1987. Immigrant associations in Europe. Aldershot: Gower. 239
p.
Roy J, Banerjee P. 2007. Attracting FDI from the Indian Diaspora: the way forward. p. 36. New
Delhi: Confederation of Indian Industry
Van Hear N, Pieke F, Vertovec S. 2004. The contribution of UK-based diasporas to development
and poverty reduction, Report by the ESRC centre on Migration, policy and society
(COMPAS), University of Oxford for the Department for International Development
Vermeulen F. 2006. The immigrant organising process : Turkish organisations in Amsterdam
and Berlin and surinamese organisations in Amsterdam, 1960-2000. p. 191. Amsterdam:
Amsterdam University press

Bibliography 139
The Evolution of Moroccan
Migration to the UK
THEMIS Scoping Study Report
International Migration Institute
University of Oxford

Bibliography 140
Table of Contents
Sources ............................................................................................................................................... 141
1. Theoretical Framework of THEMIS............................................................................................... 141
Trends and Types of Migration ........................................................................................................ 142
Current Trends – Diversification ...................................................................................................... 147
Quantitative Picture ........................................................................................................................ 147
2. Policy Changes............................................................................................................................. 152
1960s: Early Years Work Permit Scheme.......................................................................................... 153
1970s and 1980s: Family reunification as a result of the 1971 Immigration Act?.............................. 154
1990s and 2000s: Managed Migration Approach and Points-Based System ..................................... 156
3. Institutions .................................................................................................................................. 158
4. Remittances................................................................................................................................. 160
5. Individual Migration Histories – Trends and Patterns ................................................................... 162
Where To? – Where From?.............................................................................................................. 164
6. Assessment and Identification of Issues to be Explored in Phase 2............................................... 164
Bibliography ........................................................................................................................................ 169

Theoretical Framework of THEMIS 141
Sources
Moroccan migration to the UK has been well documented in a number of sources. Therefore for
the purpose of this Scoping Study we primarily relied on reports and publications which have
already mapped the corridor between Morocco and the UK/ London (cf. the Bibliography).
The quantitative picture was provided by the existing UK census data between 1981 and 2001,
and Annual Population Surveys (2004–2008) using the country of birth variable.
For the qualitative part we interviewed academics (Myriam Cherti, specialist in Moroccan
migration to the UK, author of the project: Moroccan Memories in Britain) and community
workers (Ahmed Bhairien – Moroccan Community Welfare Group, Souad Talsi – Al Hasaniya
Moroccan Women Project, and Ali Bahajoub from the British Moroccan Society).
However, in order not to duplicate the work that has already been done, in the interviews we
tried to approach the mapping exercise from the perspective of the THEMIS theoretical
framework. The theoretical questions that proved particularly interesting with relation to
Moroccan migration to the UK focused around the migration dynamics. There is a long history
of Moroccan migration to the UK, with different waves of more or less intensified movement. It
was interesting to investigate the relationship between the various migration waves, and how
they corresponded with the concepts of establishment and decline of a migration system.
1. Theoretical Framework of THEMIS
Moroccans ‘appeared’ on the UK census only in 1981, although they have been present in the
UK at least since the large-scale labour migration in the 1960s.
The analysis of the curve tracing the Moroccan-born persons in the UK reveals that migration
from Morocco to the UK rose steadily from the 1980s, then declined in the early 2000s, to restart
at a much higher speed in the mid 2000s. The differences in figures might however be attributed
to the different sources of data – the census (1981–2001) and APS (2004–2008) and their
respective methodologies and data collection techniques. After 2006 up to 2008, we can observe

Theoretical Framework of THEMIS 142
a small decline in the population of Moroccan-born persons in the UK, but it does not go as low
as the levels before the surge in the 2000s.
Chart 1: Moroccans in the UK, Source: Census Data, Annual Population Survey (Indexed 2008 = 100, 2008= ~
16,00)
Trends and Types of Migration
Moroccan merchants had established links with Great Britain dating back to the seventeenth
century, when Morocco was partially controlled by Britain (1662–1684). During the nineteenth
century, as English cotton goods entered Morocco via Gibraltar and Tangier, Farsi merchants
began to settle in urban centres such as London, Liverpool and Manchester in England, and
Cardiff in Wales (Cherti 2008). Hayes (1905) claims that in the last decade of the nineteenth
century over a dozen pioneer Moroccan families lived in Manchester, in a community of about
150 persons at its height. Cherti (2008), who documented the history of Moroccans in the UK
reveals that the pioneer Moroccan community of Manchester dissipated in the interwar period,
when the competition from Japanese goods prevented the export of Lancashire textiles to
Morocco. In 1936 the community returned to Morocco and adopted Moroccan citizenship when
the country became independent twenty years later (Cherti 2008, p. 75). Those who remained
largely anglicised their names and became assimilated into the community (Halliday 1992). The
0
20
40
60
80
100
120
140
160
1900 1920 1940 1960 1980 2000 2020
Morocco

Theoretical Framework of THEMIS 143
early pioneer community consisted not only of Moroccan Muslims but also of Moroccan
Sephardic Jews, who had links with Britain going back to the eighteenth century. The beginning
of the migration could be traced to the times when the city of Mogador, now known as
Essaouira, came under British influence at the end of the eighteenth century. At that time,
English merchants started to trade with Moroccan Jews in Mogador, exchanging Argan oil and
Arabic gum for English cloth and silverware (Cherti 2008, p. 76). Most Jewish traders sent their
sons at the age of around sixteen to London, Manchester or Birmingham, to work in the textile
factories, to learn new skills or to set up a business. The majority of them stayed in England
(Cherti 2008, p. 76).
As far as the twentieth century is concerned, the northern region of Morocco (Tangier) – due to
its legal status as an international zone (1912–1956) and its proximity to British Gibraltar –
started sending migrants to the
UK well before Moroccan
independence in 1956. Ali
Baijahoub from the British
Moroccan society explains:
‘Tangier was an international
city, administered by 14 powers,
famous for smuggling,
contraband and bohemia. It had
a romantic reputation. People
were coming and going from
Tangier. They were more mobile
than in the rest of Morocco.’
Indeed, as the most recent report
on the emigration from Morocco
suggests, the increase of
immigration in Tangier, from
different cities and rural areas of
Morocco has led to a specific
urban culture for the city of Tangier heavily influenced by Spanish heritage, which is reflected in
the daily life style. In addition to sub-Saharan migrants in transit and tourists from Europe who
Map 1: Historical Map of Morocco with Tangier as an international zone,1912 - 1956.

Theoretical Framework of THEMIS 144
settled in the city over a long period of time, the population tends toward a certain palpable
cosmopolitanism and cultural diversity (Berriane et al 2010).
However, in the late 1960s a significant migration started when Moroccan workers, mostly
Muslims, came to Britain, hired predominantly by Spanish nationals, to work in the service
industries such as hotels and small businesses that prospered during the economic growth during
this period (Cherti 2008, p. 77). The Spanish blockade of its border with Gibraltar in 1969 might
also have influenced the fact that in Gibraltar itself Moroccan workers replaced Spanish workers
in various manual jobs in the British naval base. Via Gibraltar they would then travel to the UK.
Although Cherti demonstrates that this major wave of Moroccan migration to the UK in the
1960s was predominantly an individual initiative based on social networks of friends and
families, there is also evidence that it was encouraged by the existence of a migration industry
(interview with Ali Bahajoub). The important link between the Moroccans and the British labour
market was constituted by employment agencies established in Gibraltar and run mostly by
Spaniards, who responded to the labour skill shortages in the UK, and recruited Moroccan
labourers to come and work in the service sector in London (interview with Ali Bahajoub).
Although at that time Britain had no bilateral migrant workers agreement with Morocco, the
bottom-up migration industry in Gibraltar responded to the demands created by the British
labour market and largely facilitated the recruitment of migrant labour:
At that time, the person who wanted to immigrate to England had first to buy an address of a
recruiting agency, then one had to go to Melilla to pay a small fee so that a work contract was
sent to him (H.M quoted in Cherti 2008, p. 82)
In a Spanish newspaper, I saw an advert which said that England was offering jobs as waiters,
cooks, and domestic chambermaids for foreign people. That was a great opportunity for me to
apply for one of those jobs and travel to England. I did apply through a British Continental
Agency in New Bond Street in London. I paid for the work permit in a bank in Ceuta. Once they
received the money, they forwarded me the work permit [as a waiter] (H.A quoted in Cherti
2008, p. 82).

Theoretical Framework of THEMIS 145
Cherti (2008) also mentions the employment
agencies which specialised in the recruitment
of Moroccan labourers in London itself:
‘Three main agencies – all based at Oxford
Circus/Piccadilly – played a key role in
recruiting Moroccan workers. The Mascot
Agency recruited workers from Meknes
especially to work in Crawley and West
London. Guilbert and Castano recruited
many workers from the north of Morocco,
especially Larache region, to work
throughout London’ (Cherti 2008, p. 82).
They recruited Moroccans to work in the
hotel and catering industries, for which
they were granted work permits.
The main wave of Moroccan economic migration (migrant workers) to the UK in the 1960s
consisted predominantly of unskilled and semi-skilled workers, mostly from northern Morocco
– specifically the Jbala region, especially Larache, Tetouan, Tangier and the surrounding areas,
with a smaller community from Meknes and Oujda.
The majority of these immigrants settled in cities such as London and Edinburgh, with smaller
concentrations in towns like Slough, St Albans, Crawley and Trowbridge (Cherti 2008, p. 77).
Villages such as Beni Garfat, Beni Arouss, Sahel and Smata, from which a large number of
Moroccans migrated, are part of the municipality of Larache, therefore most migrants
interviewed by Cherti said that they were from Larache (Cherti 2008, p. 78).
The numbers of these early Moroccan migrant workers were not high; Cherti portrays the
community as ‘relatively small’ (Cherti 2008, p. 88). The anecdotal evidence has it that the
figure could be estimated at around 12,000 (interview with Ahmed Bhairien, who talks
specifically about 73–74 big families) or 15,000–20,000 (interview with Myriam Cherti). Cherti
Map 2: Morocco since 1956

Theoretical Framework of THEMIS 146
demonstrates that in contrast to the dominant narratives of labour migration it was not solely men
who arrived to the UK from northern Morrocco, but this wave of migration had a certain degree
of feminisation. Morrocan migrant women in Britain played a major role in the economic life of
the family. In many cases, they came first with work permits, and their spouses and children
joined them later (Cherti 2008, p. 80).
The profile of the group changed significantly when the process of family reunification started in
the 1970s. This wave of Moroccan migrants created the core of the Bangladeshi community in
the UK, the great majority of whom are now British citizens. The family migration continued
well into the 1980s, when the generation of Moroccans who arrived in the UK as children (in the
first wave of family reunion) reached marriageable age. Souad Talsi is a community worker and
chair of the Moroccan women’s organisation Al-Hasaniya. She arrived in the UK at the age of 7
and recalls how her friends, when they reached the age of 16, were married to cousins and
‘suitable parties’ from Morocco, who then came and joined their spouses in the UK (Interview
with Souad Talsi).
The 1980s saw yet another wave of Moroccan migration to the UK. The ‘oil boom’ in the Gulf
and the fortunes of Arab businessmen made the London tourist industry boom in the early 1980s
(interview with Souad Talsi, Mostafa Ragab). As a result there was a demand for Arabic-
speaking workers who could staff numerous restaurants, clubs, bars and hotels where the tourists
from the Gulf used to socialise. Quite a significant number of Egyptians and Moroccans came to
work in low-skilled and semi-skilled jobs in the cityCherti observed that this wave of economic
migration constitutes some sort of a blank (‘shameful’) page in the Moroccan shared memory, as
some of the women who came to London from Morocco during the 1980s ended up working in
the sex industry in the city (interview with Myriam Cherti). As Cherti observes, this wave of
semi-skilled workers was accompanied by young professionals and entrepreneurs, mostly from
Casablanca and other larger cities. The regions in Morocco where the migration originated from
became more diversified, and were no longer limited to the northern part of Tangier and Larache
(Cherti 2008, p. 77). According to Cherti the number of Moroccans who came to the UK in the
1980s was around 10,000 people (interview).

Theoretical Framework of THEMIS 147
Current Trends – Diversification
The UK imposed visas on Moroccans in the late 1980s, which significantly cut the number of
low-skilled and skilled workers and young people travelling to the UK to ‘try their luck’.
According to Cherti (2008), the most recent migration wave of Moroccans, which started in the
early 1990s, consists mainly of highly skilled Moroccan professionals, both from Morocco itself
and from France. Many of these recent immigrants currently work in the finance sector in
London. They were joined by other highly skilled students and business persons. Cherti
indicated that this wave of migration is also rather small, with a maximum of 5,000 people
(interview with Cherti).
Quantitative Picture
According to the 2001 census there were 10,036 Moroccan-born persons in the UK. The number
rose to 18,000 (estimates) in 2006, and then declined to 16,000 throughout 2007 and 2008.
However, other official and Moroccan community sources estimate the number of Moroccans in
the UK as significantly higher.
Year Number Source
1981 5818 Census Data
1991 9073 Census Data
2001 11867 Census Data (OECD)
2004 11000 Annual Population Survey (estimates)
2005 16000 Annual Population Survey (estimates)
2006 18000 Annual Population Survey (estimates)
2007 16000 Annual Population Survey (estimates)
2008 16000 Annual Population Survey (estimates)
Table 1: Moroccan-born persons in the UK, Source: Census Data, APS
There were 30,000 Moroccans registered with the consulate in 2004 but the overall official
residence figure cited for the UK by the Migration Information Source is approximately 50,000
(Collyer 2004 in de Haas 2005). According to the Migrant Refugees Communities Forum
(MRCF), which in 2009 undertook an oral history project on Moroccans in the UK, there were

Theoretical Framework of THEMIS 148
approximately 35,000 Moroccan migrants living in London (Communities 2009, p. 27). The
most generous estimates given by some Community Workers and referred to in the Communities
(2009) study estimate the number of Moroccan migrants in London as high as 100,000
(Communities 2009, p. 27).
The census 2001 data also gives an indication of the age structure of Moroccans in the UK.
Persons aged between 30 and 44 constituted 51 per cent of the Moroccan population in the UK.
Their age profile largely corresponds to that of the children of the primary Moroccan migrant
workers from the 1960s, who arrived on the wave of family migration in the 1970s, and then
married partners also born and brought up in Morocco, who then joined them in the UK. It could
also comprise those workers and young professionals who arrived from Morocco in the 1980s,
while in their 20s.
Age Number
0–14 8
15–29 1922
30–44 6058
45–59 2988
60–69 652
70 or older 239
Table 2: Age structure of Moroccan-born persons in the UK, Source: Census 2001 (OECD)

Chart 2: Age structure of Moroccan
As far as the gender ratio is concerned, Moroccan migration in 2001 tended to be dominated by
males. They constituted 55 per cent
Chart 3: Sex ratio of
As far as labour force status is concerned
Moroccans are employed in the UK (51
data again seem to correspond largely with the major wave of economic migration from
Morocco, when migrants displayed the rather traditional division of labour in the family. Except
0
0-14
15-29
30-44
45-59
60-69
70 or older
Theoretical Framework of THEMIS
tructure of Moroccan-born persons in the UK, Source: Census 2001 (OECD)
is concerned, Moroccan migration in 2001 tended to be dominated by
per cent of the Moroccan-born population in the UK.
atio of Moroccan-born persons in the UK, Source: Census 200
As far as labour force status is concerned, the 2001 census revealed that the majority of
Moroccans are employed in the UK (51 per cent), with 40 per cent economically inactive. The
data again seem to correspond largely with the major wave of economic migration from
displayed the rather traditional division of labour in the family. Except
1000 2000 3000 4000 5000 6000
Age Structure
Male55%
Female45%
Sex Ratio
Theoretical Framework of THEMIS 149
persons in the UK, Source: Census 2001 (OECD)
is concerned, Moroccan migration in 2001 tended to be dominated by
born population in the UK.
born persons in the UK, Source: Census 2001 (OECD)
ensus revealed that the majority of
economically inactive. The
data again seem to correspond largely with the major wave of economic migration from
displayed the rather traditional division of labour in the family. Except
6000 7000

Theoretical Framework of THEMIS 150
for the cases presented by Cherti (2008), the dominant model of the family was that it was the
men who provided for the family, with women staying at home and looking after the children
(interview with Souad Talsi).
Chart 4: Labour force status of Moroccan-born persons in the UK, Source: Census 2001 (OECD)
The statistical picture reveals a lower employment rate among Moroccans aged between 16 and
74, as compared to the capital’s average (66.6 per cent) (London Authority Data Management
and Analysis Group 2005). As Cherti observes, there is however, a slight diversification of the
employment sectors partly due to the entry of the younger generation to the job market, and the
subsequent migration of semi-skilled and skilled migrants from the 1980s onwards. The hotel
and catering industries are still taking the lead with 23.7 per cent.
Since 1991, the UK Home Office has made 8,525 grants of settlement to Moroccan nationals.
These figures have been relatively consistent apart from a small increase between 1998 and 2003
before returning to previous levels. British citizenship acquisition by Moroccans peaked in the
second half of the 1980s (at 1500 per year), but has remained relatively stable since 1990, at
approximately 600 awards per year (Communities 2009, p. 26).
51%
7%
40%
2%
Labour Force Status
employed
unemployed
inactive
unknown labour forcestatus

Theoretical Framework of THEMIS 151
Chart 5: Industry Percentage, Source: London Authority Data Management and Analysis Group 2005 (based on UK
2001 Census)
With regard to the THEMIS theoretical framework, despite the growing figures suggested by the
statistical sources, the feeling given to us by our respondents and community workers is that the
traditional Moroccan community in the UK is in decline, as ‘nowadays it is very difficult for
Moroccans to make it to the UK’.
Ahmed Bhairien, who came to the UK as a child and then married in Morocco, summarised the
situation in the following way: ‘Hardly anybody is coming now. There are these odd students,
whom I see on the streets around Portobello market, who came here to study, but actually to
work, and they overstay their visas. Maybe they make up these numbers? We are joined by our
families, my mother-in-law came to stay with us for couple of months. But she went back. This
is it.’ (interview with Ahmed Bhairien).
This notable quote suggests that the different waves of Moroccan migration are quite
separate from each other. This seems to confirm an observation made in other reports that
migration as a process is time-bound. Ahmed – representing the major wave of economic
2.6
2.8
4.5
6.1
6.3
7.2
8.3
9.9
13.9
14.6
23.7
0.0 5.0 10.0 15.0 20.0 25.0
Construction
Public administration and defence
Financial intermediation
Education
Manufacturing
Other
Health and social work
Transport and communications
Real estate, renting
Wholesale and retail trade
Hotels and restaurants
Industry Percentage

Policy Changes 152
migrants and their children from the 1960s to the 1970s, and a prominent member of his
community – openly says that the newcomers do not mingle with the ‘old’ people except perhaps
occasionally in the mosques. However, it should be pointed out that his organisation (MCWG),
oriented mostly towards the second and third generation of Moroccans in the UK (sporting
events, Arabic lessons, an Arabic library and the occasional English lessons for the elderly) does
not have much to offer to the newly arrived migrants in terms of practical assistance.
His generation, termed by Cherti as a ‘self-contained community’ (Cherti 2008), also seems not
to pay very much attention to the arrival of highly skilled Moroccans and business persons, who
started coming to the UK in large numbers in the 1990s. Perhaps the fact that the Moroccan
community is internally divided is not all that surprising. The paths of the ‘old’ and ‘new’
Moroccan migrants in London do not necessarily cross with each other. While the latter
commute to work to Canary Wharf, or Westminster, the ‘traditional’ Moroccan community does
its daily shopping in the Portobello Market, visits the mosque in Ladbroke Grove or drinks
coffee in one of the many Moroccan-owned cafes and restaurants in Golborne Road.
It is naive to believe that any migrant group, once settled in a host country, will intuitively merge
with other migrant groups from the same country of origin, overlooking their different class,
religious, political, or other divisions. It could be concluded, based on the relatively recent
migration history and Moroccan presence in the UK, that the internal dynamics within the
community suggests that this is not a homogenous group. Despite the relatively small numbers
there are nevertheless many ‘Moroccan communities’ in London with their own members and
distinct organisations. Their presence is an indicator of the existence of a fairly visible
community, willing to bring change and yet separately to address the distinctive needs of its
various groups (Cherti 2008, p. 107).
2. Policy Changes
The pioneer Moroccans arrived in the UK when the 1905 Aliens Act, 1914 Aliens Restriction
Act, and 1919 Aliens Restriction (Amendment) Act (which later became Aliens Order 1953)

Policy Changes 153
were in place. Moroccans fell under these policies as they were aliens (in contrast to
Commonwealth subjects) according to the British immigration law of that time. These Acts
provided a system of work permits for aliens seeking employment in the UK; registration with
the police; and deportation for the public good.
1960s: Early Years Work Permit Scheme
As a result of the 1905, 1914 and 1919 Acts, individual aliens seeking employment in Britain
had to be in possession of a work permit, which was granted by the government to a named
employer on a condition that no suitable British person was available to fill the vacancy. This
requirement largely explains the operation of the migration industry in the major phase of
Moroccan migration to the UK in the 1960s. Moroccans with no personal ties to Britain relied on
the agencies to put them in touch with employers, who then – on their behalf – applied to the
Home Office for work permits. The work permits were then – via the agency – sent to
Moroccans, who could apply to their Ministry of Interior for the passport to be issued.
Moroccans arriving in the UK with a work permit had no right of settlement. They were allowed
to settle only after four years of residency and documented employment. Their work permit was
valid for one job only, so each time they changed job (within the four years) they employers had
to apply for a new permit on their behalf with the Home Office. The Moroccans, as alien workers
according to the British immigration law, were also subjects to the controls after entry; they had
to register and report any change of address to the police.
Alien dependent spouses were allowed to enter the UK based on a proof of marriage to the
permit holder. They had no right of settlement, and were admitted temporarily for the same
period as the primary work-permit holders. As a result they could permanently settle in the UK
after four years of residence. They had, however, no right to work. Like the primary work-permit
holders they were subject to controls after entry; they had to register and report any change of
address to the police.
Alien dependent children were admitted to the UK on the basis of proof of relationship to their
parents. If they were under 18 years of age they were admitted for conditional settlement; if they
were between 18 and 21 they were granted settlement after four years of conditional residence.
They were subject to control after entry on the same conditions as their parents.

Policy Changes 154
Other alien dependants (defined by law as parents over 60 and other ‘distressed’ relatives) were
admitted to the UK on the basis of proof of relationship to the primary work-permit holders.
They were allowed to settle if the head of the family was resident in the UK for four years or
more. Again, like the head of the family, they were subject to the same controls after entry.
1970s and 1980s: Family reunification as a result of the 1971 Immigration Act?
The change in the immigration law in 1971 (1971 Immigration Act) with regard to alien workers
did not bring any significant changes in the legal situation of Moroccan migrants. They
were still only admitted to the UK on the basis of having a work permit which allowed them to
work for a named employer (on condition that no suitable British person was available to fill the
vacancy). Their work permit was valid for one job only, therefore each time they changed their
employment they had to ask their employers to apply for a new work permit on their behalf.
They had no right of settlement, but might have been allowed to settle after four years. The
controls after entry stayed the same with regard to primary work-permit holders: they had to
register with the police and report any change of address.
Where the 1971 Immigration Act brought significant changes was with regard to the admission
of dependants – spouses, children and other dependants. The conditions under which alien
workers could bring their dependants with them to the UK became harsher. Somewhat
surprisingly, Cherti (2008) and others observed that a large-scale family reunion took place in
the 1970s, with wives, husbands and children joining the primary applicants. An interesting
question to ask is why this happened, especially in the light of the stricter conditions of
admission and entry for dependants which resulted from the 1971 Immigration Act.
In order to be admitted into the UK, alien dependent spouses, children and other dependants had
now to be able to prove not only their relationship to the primary work-permit holder, but also
that the latter was able to support them without access to public funds (the welfare benefit
system).
In addition, alien dependent children had no rights of settlement; conditional residence might
have been granted to children up to 18 if they were joining both parents. Those between 18 and
21 were given conditional residence (at the discretion of Home Office) only in exceptional

Policy Changes 155
circumstances. As a result, this rule in practice lowered the age of children who might have been
allowed to join their parents from 21 to 18.
The 1971 Act also introduced serious limitations in the admittance of other alien dependants
(particularly the parents of the primary work-permit holders). They were not admitted to the UK
until the head of the family gained full settlement rights (after four years of residency on the
basis of a work permit). The UK government therefore significantly limited the period when the
alien worker might have been allowed to be joined by his or her elderly parents. Upon admission,
however, the parents were no longer subject to any controls after entry due to the legal status
(settlement) of the head of the family.
An in-depth analysis of the British immigration policy that was put in place after 1971
significantly challenges assumptions that family reunification (which became an inseparable part
of the trends and patterns of Moroccan migration to the UK in the 1970s and 1980s) was a direct
result of this policy. The 1971 Act did not make it easier for the primary work-permit holders to
bring dependants with them; if anything it made it more difficult. They now had to prove to the
Home Office that they would be able to support their families coming from Morocco without
recourse to public funds.
Moreover, the immigration policy towards the alien workers themselves did not change.29
Bringing families over, as in response to tightening of immigration controls for the main
category of migrants (migrant workers) is therefore difficult to explain (from the sole focus on
the British immigration policy perspective). An analysis of British immigration policy reveals
that it was not more difficult for primary migrant workers to come to work to the UK in the
1970s, nor for a large part of the 1980s.
Significant restrictions regarding the admission of migrant workers from Morocco were
introduced in the UK only in the late 1980s, when a visa system was put in place (interview with
Ali Baijahoub). Before this, Moroccans could have entered the UK on the basis of their valid
passport. From the mid 1980s they started requiring a visa and entry clearance.
29This would explain the occurrence of the second major wave of economic migration from Morocco to the UK
(London) in the early 1980s (cf. Cherti 2008).

Policy Changes 156
As a result, from the mid 1980s it therefore became more and more difficult for Moroccans to
come to work in the UK. As the work-permit conduits became severely limited, it would be
reasonable to suggest that more family migration followed. Rational choice theorists and
economists would argue that when one channel for migration becomes closed, people tend to
turn to other available channels.
This is not however the picture we get from qualitative studies on the trends and patterns of
Moroccan migration to the UK. As observed in Section 1, Cherti and others reveal that the
limited migration of Moroccans in the 1990s primarily encompassed highly skilled professionals
from Morocco and France, joined by students and other business persons.
1990s and 2000s: Managed Migration Approach and Points-Based System
With regard to immigrants from Morocco, the last three immigration acts – the 1999
Immigration and Asylum Act, the 2002 Nationality, Immigration and Asylum Act and the 2006
Immigration and Nationality Act – present a compilation of different measures, but have at their
heart four main themes:
m) tidying up measures
n) removing and restricting rights of appeal (in an event of denial of entry)
o) creating a new system of employer sanctions to stop illegal working by migrants
p) monitoring, surveillance, and more co-ordinated policing of migrants old and new on
the basis of seeking out crime, people smuggling and terrorism, and collecting vast
new databases on all third-country nationals (i.e. those who are not British or
European Economic Area citizens) (MacDonald 2010).
In practical terms under the Labour Government (1997–2010) the changes in the immigration
policy resulted in:
16) tightening of immigration controls
17) selective admission focused solely on highly skilled migrants and migrants with
skills that are in deficit in the UK
18) severe limitations in legal channels of entry for low-skilled migrants from outside the
EEA

Policy Changes 157
19) access to the labour market by students limited to 20 hours per week
20) unlimited access to the labour market by spouses of primary workers (usually admitted
under the work permit or Highly Skilled Migrant Programme [HSMP] scheme, since
June 2008 – Tier 1 and Tier 2).30
These changes undoubtedly had their impact on the changing character and profile of migration
from Morocco to the UK. Tightening of immigration controls resulted in fewer visa applications
being accepted for processing (and many migrants in possession of a visa actually being turned
back at the airports – anecdotal evidence, interview with Ahmed Bhairien).
These changes reflected a broader turn in EU migration policy with the decision at the European
Council in Tampere, 1999, to develop a common EU migration and asylum policy. In its
communication on a Community Immigration Policy (COM (2000) 757) of November 2000, the
European Commission explicitly proposed abandoning the zero immigration policies of the past
30 years. Instead, new immigration policies would be devised with which to better regulate
migration through orderly and regular channels that were themselves responsive to labour market
needs, reflecting the realities of a labour market demand for immigrant workers, continuing
migration pressures from the developing world, and demographic trends in European countries,
particularly declining birth rates and ageing populations (Pellegrino 2004, p. 8).
The profile of newcomers has changed, from the large pool of low-skilled manual workers –
dominant among the Moroccan migrant workers arriving in the UK in the 1960s – towards
fewer, ‘carefully selected’ yet highly skilled professionals and students entering in the 1990s and
2000s. Highly skilled migrants continued to bring their spouses with them due to no restrictions
in their access to the labour market. Students were allowed to bring their spouses and dependants
with them (if they were studying in the UK for more than six months), provided that they were
able support themselves financially for the entire length of their stay without needing help from
state benefits (also known as public funds) (UKBA 2010).
30A broad overview of those was presented in the Scoping Study Report on Ukraine. They are of course also
applicable with regard to any future migration from Morocco. Therefore, in order not to duplicate the analysis, thissection refers the reader to the respective sections of the Ukrainian report.

Institutions 158
The limitations in channels of legal entry for low-skilled workers from Morocco resulted in some
of them resorting to coming to the UK as students, but then overstaying their visas and finding
work in the low-skilled, low-wage labour market sectors in London (services, catering,
construction industry). The evidence of these practices stems from the interviews and was not
confirmed in any written sources on Moroccan migration to the UK (interview with Ahmed
Bhairien, Myriam Cherti).
3. Institutions
Despite the relatively long-term presence of Moroccans in the UK (the major wave took place in
the 1960s), the most significant community organisations and institutions which we encountered
during the scoping study date from the 1980s, and were established not by Moroccan migrants,
but by second-generation Moroccans in the UK. As Ahmed Bhairien, a community worker from
Ladbroke Grove, explains: ‘Our parents did not have ideas of establishing organisations. They
were too busy providing for their families.’ (interview). When he arrived in the UK during the
family reunification phase in the early 1970s there were not many Moroccan organisations which
he and his friends could join.
A network of Widadias – organisations linked with the Moroccan Consulate – existed before
1982 (they started around 1969 – interview with Ahmed Bhairien). However, at that time
Widadias were not particularly active, nor are they remembered as providing much welfare
support to the first generation of Moroccan migrants (interviews with community workers). The
Widadia was a place where young people socialised once a week, usually on Saturdays.
Widadias organised sporting activities for Moroccan children: ‘We were mostly playing football
there.’ (interview with Ahmed Bhairien).
Although the British Moroccan Society has existed since 1975, it was always more of an
exclusive association that primarily consisted of diplomats and people connected to the
Moroccan Consulate and Embassy. This is how it is still perceived among Moroccans, which
makes it difficult for member Ali Baijahoub to popularise its events among the settled Moroccan
community. The organisation could best be described as an international charity. The British
Moroccan Society aims to raise awareness and knowledge of Morocco in the UK. In the area of

Institutions 159
collective remittances and development work it financially supports many Moroccan charities
back in Morocco. It aims to establish ten learning centres in various areas of Morocco, in the
Toubkal region, Tafraoute, Ait bouguemez and others, with facilities to accommodate a library
and a multi-purpose room. The libraries will provide books in Arabic, French and English, as
well as computers. The project involves the training and employment of local young people, who
would be responsible for the upkeep of the books and equipment and for popularising the
educational programmes among the wider population. The first centre was opened in June 2010
in Talatast village (60km from Marrakech) (British Moroccan Society website,
www.britishmoroccansociety.org ).
The majority of the institutions which are currently important for the London Moroccan
community were established throughout the 1980s and 1990s. Al-Manaar mosque has been
cited as a place where young people, women and men are able to meet and discuss their
problems in a supportive environment. The mosque (also known as the Muslim Cultural Heritage
Centre opened by Prince Charles) provides the Muslim and wider community with a focal point
for a range of spiritual, social, cultural, economic, educational and training activities
(Communities 2009, p. 48). It has played a role in enabling the civic engagement of young
people.
During the 1980s, there was increasing awareness of issues concerning young people and under-
achieving Moroccan children. This awareness led to the establishment of two youth
organisations, the Al Noor Youth Association and the Moroccan Community Welfare Group
(MCWG), which secured funding from various sources and have made a significant impact on
the community (Communities 2009, p. 48). MCWG is a user-led voluntary organisation and
offers a range of services for the Moroccan and wider Arabic-speaking community in the
Kensington and Chelsea area and has a specific focus on Moroccan youth, in particular
organising events and trips.
The MCWG Youth Activity Centre has been running since January 1995. Its main objective is
to provide young Moroccans and Arabic-speakers with a positive environment, various
educational activities, and courses and recreational activities for character building. The Centre
also provides informal educational and sports activities to enhance young people’s personal

Remittances 160
development, and focuses on discouraging anti-social behaviour and providing culturally
appropriate and accessible youth work. It provides accredited IT courses for 14–21-year-olds to
give them essential skills recognised by employers. In 2002, a purpose-built study library room
was set up, consisting of literature relevant to the National Curriculum and academic subjects;
Arabic books and religious literature; as well as internet facilities. The MCWG also runs English
classes for elderly members of the Moroccan community.
In the reporting year of 2009/2010 the Al-Hasaniya Moroccan Women’s Centre celebrated its
25th anniversary. It is a grassroots organisation that provides advice and assistance for Moroccan
and Arabic-speaking women and their families concerning benefits, housing, homelessness,
domestic violence, education, health, and mental health. The organisation also runs social and
cultural activities (e.g. lunch club) and offers English and Arabic classes, as well as specialist
activities for young people and the elderly (Communities 2009, p. 49). The Centre aims at
providing referral advice and information to enable clients to access mainstream services. Most
users are residents in Kensington and Chelsea and Westminster but the organisation also serves
women and families from other areas. The organisation accepts self-referrals and referrals from
other voluntary and statutory agencies.
4. Remittances
For Morocco the data on remittance inflows exists since 1975. The data gathered by the World
Bank only capture remittances sent through formal channels such as banks and money transfer
operators. Currently, no uniform and authoritative historical data on informal flows exist. Given
the widespread use of informal remittance channels in many countries, the remittance data
presented should be regarded as underestimates of the total flows.
Year 1970 1972 1973 1974 1975 1976 1977 1978 1979 1980
Morocco 533 547 590 763 948 1,054
Year 1981 1982 1983 1984 1985 1986 1987 1988 1989 1990
Morocco 1,014 850 917 874 973 1,400 1,589 1,305 1,337 2,006
Year 1991 1992 1993 1994 1995 1996 1997 1998 1999 2000
Morocco 1,990 2,170 1,959 1,827 1,970 2,165 1,893 2,011 1,938 2,161
Year 2001 2002 2003 2004 2005 2006 2007 2008 2009 2010

Remittances 161
Morocco 3,261 2,877 3,614 4,221 4,590 5,451 6,730 6,895 6,264Table 3: Remittance inflows US $ (millions), Source: World Bank (2009)
Chart 5: Remittance inflows US $ (millions), Source: World Bank (2009)
There was a steady rise in remittances coming to Morocco throughout the 1990s. The most
significant rise took place in the early 2000s and continued up to 2008. The most recent dip
could be explained by the last World Recession (2008–2009).
It is very difficult to find longitudinal, bilateral information on how much of Morocco’s
remittance inflows is actually contributed by Moroccan migrants in the UK. The World Bank
bilateral remittance estimates (see Table 4) using Migrant Stocks, Host Country Incomes, and
Origin Country Incomes31 (in millions of US$) revealed that in 2005 Morocco received from the
UK remittances for the amount of $28m, which would constitute only 0.6 per cent of all the
remittance inflows in 2005. This made the UK the tenth largest remittance sender to Morocco in
31These data are estimated using assumptions and arguments as explained in Ratha and Shaw (2006) ‘South–
South Migration and Remittances’, Development Prospects Group, World Bank(www.worldbank.org/prospects/migrationandremittances).
0
1,000
2,000
3,000
4,000
5,000
6,000
7,000
8,000
1975 1977 1979 1981 1983 1985 1987 1989 1991 1993 1995 1997 1999 2001 2003 2005 2007 2009
Morocco

Individual Migration Histories – Trends and Patterns 162
2005. According to World Bank remittance estimates for 2005, the largest amount of remittances
was sent from France ($1,523m), Spain ($1,171m), Italy ($527m), Israel ($332m), the
Netherlands ($315m), Germany ($214m), Belgium ($151m), the USA ($97m), and Canada
($53m).
Country Sending Remittances Country Receiving Remittances – Morocco
France 1,523
Spain 1,171
Italy 527
Israel 332
Netherlands 315
Germany 214
Belgium 151
USA 97
Canada 53
UK 28
Table 4: Bilateral remittance estimates using Migrant Stocks, Host Country Incomes, and Origin Country Incomes(millions of US$), Top 10 Remittance Sending Countries. Source: World Bank 2005.
5. Individual Migration Histories – Trends and Patterns
Souad Talsi, born in Oujda, Morocco is a founding member of Al-Hasaniya Moroccan Women’s
Centre, a civil-society activist and member of the London Council on minority groups. She is on
the board of the Advisory Council for Ethnic Minorities. In 2010 she was named member of the
Order of the British Empire (MBE) in recognition for her services to the Moroccan community
in London.

Individual Migration Histories – Trends and Patterns 163
Souad arrived in the UK as a girl in the late 1960s. Her father came to the UK for work; she and
her mother joined him a few years later. Souad grew up in London. When her friends, who like
Souad came to the UK to join their parents, reached the age of 16, the main priority of their
parents was to get them married. Due to subsequent family migration the community grew
bigger and the area changed a lot: ‘You have certainly heard about Julia Roberts’ Notting Hill.
Well, it is not just a movie, but a place where our Moroccan community have settled for more
than four decades. Taza Snack, Bab Marrakech, Casablanca Halal Meat Butchers, L’Etoile de
Sousse Patisserie. Such names make you feel you are in one of Casablanca’s neighbourhoods.
This is not Morocco but Golborne Road, North Kensington, London W10.’ (interview with Souad
Talsi).
Unlike her friends who got married at a young age, brought their spouses from Morocco and
devoted themselves to family life, Souad focused on her education and training. She started
working as an immigration adviser at the local Citizens’ Advice Bureau. Due to her fluency in
Arabic, she was particularly involved in helping women and men from the Arabic-speaking
communities. However, she felt that to a certain extent the structures of the Citizens’ Advice
Bureau were not fully meeting the needs of the community.
In response to this gap she founded Al-Hasaniya Moroccan Women’s Centre, which was
designed to help the local community in terms of its relations with local authorities, central
administration and support services, and in terms of its integration as a minority within the body
of London. She claimed in an interview with the Morocco Times that the number of success
stories is very sporadic and is greatly outnumbered by the failures.
One of the great successes is undoubtedly the documentary produced by Al-Hasaniya detailing
the lives of three Moroccan women who migrated to Britain in the 1980s. They came from
completely different social backgrounds, yet shared a common history of early Moroccan female
migration to the UK. This documentary was produced to ‘pay homage to all those women who
came before us and ventured into the unknown as the ultimate sacrifice to support their loved
ones. It is a true testimony of their courage, unbroken spirit, self denial and utter determination’
(Al-Hasaniya 2010). The documentary is an important attachment to this report. It was uploaded
on Share Point for other partners to watch.

Assessment and Identification of Issues to be Explored in Phase 2 164
Where To? – Where From?
It has already been noted that the major wave of Moroccans who came to the UK in the 1960s
came from ‘Jbala’ of northern Morocco, which used to be under Spanish occupation: from
Larache, Azilla, Melilla and from the nearby villages. Many of them also came from Tangier,
which till 1956 was administered by 14 powers, and was known for its international links. As Ali
Baijahoub maintains: ‘The migration to England started because of the proximity of Gibraltar,
the British post in the south of Spain. This is the link.’ According to most recent report on the
emigration from Morocco (Berriane et al 2010) Gibraltar has absorbed the largest flow of
workers from the region of Tangier after the withdrawal of Spanish workers in the British
colony.
In the 1970s and 1980s the emigration from Morocco was no longer limited to its northern
territories, but also included cities like Meknes, Oujuda, Fez and Casablanca (and the nearby
villages).
The predominant destination for Moroccans in England has overwhelmingly been London, with
69 per cent of the total Moroccan-born population. Outside London there are significant
communities in Crawley, St Albans, Slough (still in relative proximity to London), but also in
Trowbridge (South-East of England) and Edinburgh (Scotland).
The most popular area of settlement in London is North Kensignton, especially the London
Borough of Kensington and Chelsea, with Golborne Road (in the vicinity of Ladbroke Grove)
known as the ‘Little Morocco’. There are also some smaller communities in the boroughs of
Westminster, Hammersmith, Lambeth, Barnet and Croydon (Communities 2009, p. 29).
Cherti (2008) observed rather strong settlement patterns: those living in Crawley originate
mainly from Meknes, those in Slough primarily came from central and southern Morocco and
Moroccans in Trowbridge are known to originate from Oujda in the north-east (quoted in
Communities 2009, p. 28).
6. Assessment and Identification of Issues to be Explored in Phase 2

Assessment and Identification of Issues to be Explored in Phase 2 165
The Scoping Study revealed that migration between Morocco and the UK has been studied and
the trends and patterns within this particular corridor have been well documented primarily by
Cherti (2008) (who has pioneered investigation on the subject of Moroccan migration to the
UK), but also in other studies (e.g. Communities 2009).
Theoretically, Cherti (2008) looked at the Paradoxes of Social Capital (the title of her book)
within the Moroccan community, portraying its strong internal links and self-containment, but
also the weaker and less prevalent linkages with the ‘outside’, wider community. The tendency
of Moroccans to be inward-looking, with traditionally rather high levels of bonding social
capital, could partially explain their relative lack of social mobility: ‘why a significant section of
first-generation Moroccans remains still very isolated and disengaged from the mainstream
society; and secondly, why some of these characteristics persist amongst the younger generation
too’ (Cherti 2008, p. 285).
To explain this phenomena, Cherti looked into the nexus between social capital and migrant
networks: ‘The strong family and friendship networks, along with high solidarity levels amongst
the first generation, explain to a large extent how several families who originated from the
northern part of Morocco ended up settling in similar parts of London. These same networks
continued to provide an unbroken source of mutual support, especially in searching for
employment. However, because of the restricted mastery of language and skills, these closed
friendship and family networks provided a safety-net for their members, thereby decreasing their
likelihood of upward socio-economic mobility. Therefore, given the importance of informal
networks, differences in access to social capital between the social classes have operated to
reinforce rather than reduce social exclusion and inequalities of opportunity’ (Cherti 2008, p.
285).
The issues which we suggest as worth exploring further in relation to Moroccan migration to the
UK are as follows:
Cherti (2008) also used social capital to explain the self-preservation of the Moroccan
community in the UK. The community self-preservation could be related to THEMIS

Assessment and Identification of Issues to be Explored in Phase 2 166
conceptual framework, as one of the mechanisms which could help to explain the
relative stagnation, and perhaps even decline of a migration system (as an unintended
consequence). The self-preservation mechanism aimed at preventing the second
generation from assimilation (through the development of norms to monitor the
behaviour of the younger members within the community) in practice contributes to a
degree of its exclusion in relation to the host society. In such circumstances the younger
generation living within the community experiences subjugation by the group norm; and
instead of actively contributing to community development, the more ambitious
individuals are forced to break away from the group. As a result the community might
find itself in decline despite its initial efforts aimed at its preservation. This points to the
fact that stagnation (and decline) could be subjectively experienced without the
reference to (further) migration flows, but also the community’s relations within the
wider society (assimilation versus breakdown of ties).
Another important question worth clarifying (with respect to all settled migrant
populations in the UK, and elsewhere) is how justified is it to call the group in question a
‘migrant group’? (cf. the Scoping Study report on Bangladeshi migration to the UK).
Indeed among the Moroccans in the UK (as well as other migrant groups) there will
always be the ‘first generation’ of migrants, however many of those who feel Moroccan
were actually born and brought up in the UK. Perhaps it is more theoretically relevant to
refer to them as the ‘Moroccan community’ or ethnic minority? (Do they therefore ‘fit’
within THEMIS theoretical framework and ambitions? How can we escape the
conundrum of historical perspective on migration, while the latter is inevitably time-
bound? As migrants largely become citizens and settle, they yet retain ethnic (racial?)
distinctiveness well into the third and fourth generations, a distinctiveness which is
perhaps mistaken for the latter generations’ migratory past?)
Cherti’s (2008) analysis of the major group of Moroccan migrants to the UK (in the
1960s) particularly focused on close-knit networks of family and friends as responsible
for the migration process. However, the Scoping Study revealed that it might well have
been the bottom-up migration industry of Spanish-run employment agencies which

Assessment and Identification of Issues to be Explored in Phase 2 167
largely facilitated the first wave of Moroccans to the UK (consisting mostly of migrant
workers). In looking at the Moroccan migration dynamics it might perhaps be
interesting to investigate the relationship between the migrant networks and
migration industry?
As already noted in Section 2 of this report the second major wave of Moroccan
migration to the UK was family migration, which took place largely during the 1970s.
The existing sources explain it as a response to tightening immigration controls on the
side of the UK. This narrative needs challenging, as the in-depth insights into the
immigration laws and acts of that time actually demonstrate that while the requirements
for migrant workers to come to the UK remained largely unchanged (between the 1960s
and 1970s) it was the conditions of entry of spouses and children that became subject
to tighter regulations. If anything it became more difficult to bring spouses and children
to the UK after the 1971 Immigration Act. THEMIS could therefore focus on how
migrants’ agency, their individual needs and choices (although the category of choice
vastly oversimplifies the matter) interplay with the state’s legal frameworks designed
to govern their entry and residence (for interesting parallels cf. Scoping Study Report
on Bangladeshi migration to the UK).
Moroccans (as well as other groups studied in the UK, e.g. Ukrainians) seem to
complicate the theoretical notion of a migration system. While we can distinguish
different waves of Moroccan migration to the UK, the newcomers have not necessarily
joined the ‘established’ community but created their own organisations (or not). It is
also false to assume that the first generation of migrants established the community
structures and organisations, while their power over the community might be largely
symbolic in nature. With respect to Moroccans, it is rather the second and third
generations who established and sustain various organisational structures. Not
surprisingly therefore, the newcomers, representing different backgrounds (class,
education) and motivations for migration do not join the existing structures but start their
own.

Assessment and Identification of Issues to be Explored in Phase 2 168
As a result the waves are quite disentangled from each other. The concept of a system
(in terms of links and linkages?) does not hold empirically, and perhaps could be more
used as a heuristic device? But then the immediate question follows: heuristic device for
what? To describe different waves of people coming from a specific locality to a specific
locality? To describe different waves of people coming from a specific nation-state, to a
specific nation-state? While the first could best be captured with qualitative methods and
research techniques, we need to purposefully employ our quantitative techniques – not
only in terms of their cost-effectiveness, but their comparative potential with the existing
data, (which have largely been gathered at the national level).

Bibliography 169
Bibliography
Al-Hasaniya (2010) Unsung Heroines, a documentary film, London: Al-Hasaniya
Agoumy, T. and M. Tamim (2009) ‘Migration, Networks and Territories in the Ouneine Valley,High Atlas, Morocco’, Journal of Ethnic and Migration Studies 35(10): 1679–97
Cherti, M. (2008) Paradoxes of Social Capital. A Multi-Generational Study of Moroccans in theUK, Amsterdam: Amsterdam University Press, IMISCOE Dissertations
— (2009) British Moroccans. Citizenship in Action. London: Runnymede Community Study
Communities (2009) The Moroccan Muslim Community in England. Understanding MuslimEthnic Communities, London: Communities and Local Government,www.communities.gov.uk
de Haas, H. (2005) ‘Morocco: From Emigration Country to Africa’s Migration Passageto Europe’, Migration Information Source, www.migrationinformation.org
Hayes, L.M. (1905) Reminiscences of Manchester and of its local surroundings from the year1840, London: Sherrat & Hughes
Halliday, F. (1992) ‘The millet of Manchester. Arab merchant and cotton trade’, British Journalof Middle Eastern Studies 19(2): 159–76
London Authority Data Management and Analysis Group (2005), London country of birthprofiles, the Arab League: an analysis of census data. London: Census reportcommissioned by the Greater London Authority, DMAG Briefing, 2005/19.
Macdonald, Ian A. and Toal, R. (2010) Macdonald’s Immigration Law and Practice, London:Lexis Nexis UK
Pellegriono A (2004) Migration from Latin America to Europe: Trends and Policy Challenges,Geneva: IOM
UKBA (2010) UK Border Agency, Students,http://www.ukba.homeoffice.gov.uk/studyingintheuk/adult-students/family/#
Van der Erf, R. and L. Heering (2002) Moroccan Migration Dynamics. Prospects for the Future,Geneva: IOM

Theorizing the Evolution of European Migration Systems (THEMIS)
The Evolution of Ukrainian Migration to the UK
Scoping Study Report
Agnieszka Kubal, Oliver Bakewell and Hein de Haas (International Migration Institute, University of Oxford)
January 2011

2 The Evolution of Ukrainian Migration to the UK (THEMIS Scoping Study)
Table of Contents
Sources .......................................................................................................................................................... 3
1. Theoretical Framework of THEMIS ....................................................................................................... 3
Trends and Types of Migration ................................................................................................................. 3
Current Trends – Diversification ............................................................................................................... 8
Quantitative Picture .................................................................................................................................. 9
2. Policy Changes .................................................................................................................................... 12
1900–1945: Aliens Restriction Acts ........................................................................................................ 12
1945–1951: European Volunteer Worker Scheme ................................................................................. 13
Sending-Country Perspective – Relaxing Emigration Policy ................................................................... 14
1980s–1990s: UK Response – Tightening Immigration Control ............................................................. 14
1990s and 2000s: Managed Migration Approach and Points-Based System ......................................... 16
Limitations in Legal Channels of Admission and Irregular Migration ..................................................... 18
3. Institutions .......................................................................................................................................... 20
Migrant Organisations Among the ‘Old’ Diaspora .................................................................................. 20
Migration Industry Among the ‘New’ Migrants ...................................................................................... 22
4. Remittances ........................................................................................................................................ 25
5. Individual Migration Histories – Trends and Patterns ........................................................................ 27
Where To? – Where From? ..................................................................................................................... 28
Ukrainian Pioneers in the UK (early twentieth Century) .................................................................... 28
Major Wave of Ukrainian migrants (1946–1951) ............................................................................... 28
New wave of Ukrainians (post-1991) .................................................................................................. 31
6. Assessment and Identification of Issues to be Explored in Phase 2 ................................................... 34
Bibliography ................................................................................................................................................ 35

3 The Evolution of Ukrainian Migration to the UK (THEMIS Scoping Study)
Sources
A number of sources were used for the writing of this report. The quantitative picture was provided by
the analysis of UK census data between 1901 and 2001, and Annual Population Surveys (2001–2007)
using the country of birth variable. The data on the Ukrainian arrivals in the UK in the immediate
aftermath of the Second World War were provided by the European Volunteer Worker scheme sources.
The qualitative analysis was based on in-depth interviews with key actors from the Association of
Ukrainians in Great Britain (the largest organisation of the Ukrainian community in the UK): Lubomyr
Mazur (former President of the Association), Oleksa Semenchenko (Editor of the AUGB journal –
Ukrainska Dumka), Ludmila Pekarska (Curator of the Taras Shevchenko Library and Archive, the largest
collection of books about the Ukrainian diaspora in Europe outside Ukraine itself) and Lessia Dejakowska
(PR Officer for the Association of Ukrainian Women in the United Kingdom). The picture was completed
with the use of academic publications and online reports on Ukrainian migration to Europe (cf. the
Bibliography).
1. Theoretical Framework of THEMIS
With the available data on Ukrainian migration to the UK, based on the census data (1901–2001), it is
difficult to place Ukraine definitely within one of the THEMIS theoretical categories. The available data
(from 1991, when Ukraine gained its formal independence from the Soviet Union) seem to suggest that
this is a ‘starter’ migration to the UK, one which has not yet established a clear pattern of growth (cf.
Chart 1).
Trends and Types of Migration
However, the qualitative part of the scoping study demonstrated how far from the actual situation this
initial categorisation would be. The fieldwork revealed that Ukrainian-born persons (despite the formal
lack of Ukraine on the European map), or people calling themselves Ukrainians have been present in the
UK at least since the beginning of the twentieth century. A group of Ukrainians from Eastern Galicia
(Galicya – Ukrainian) – then part of Austro-Hungarian Empire (cf. Map 1) – bound originally for the US,
landed in Liverpool, and began their new life around the city of Manchester instead (AUGB 2010). This
initial pioneer migration had very much a labour character.

4 The Evolution of Ukrainian Migration to the UK (THEMIS Scoping Study)
Chart 1: Ukrainians in the UK, Source: Census Data, Annual Population Survey (Indexed, 2008 = 100, 2008 = ~15,000)
After the First World War, through the 1920s and 1930s, there were Ukrainian diplomatic missions in
Great Britain (AUGB 2010), although Ukraine did not officially exist on the map of Europe (cf. Map 2),
except for the Ukrainian Socialist Republic (Eastern Ukraine, cf. Map 3). Economic emigration was
complemented by political emigration to the West. With the disintegration of the Russian and Austro-
Hungarian Empires in 1917 and 1918, Ukraine declared its independence in 1918. In 1919, the state had
to defend itself on three fronts: from the ‘Red Bolsheviks’ and their puppet Ukrainian Soviet Republic,
from the ‘White’ czarist forces, and from Poland. Ukraine lost the war. In 1920 Eastern Ukraine was
occupied by the Bolsheviks and in 1922 it was incorporated into the Soviet Union. Western Ukraine was
partitioned between Poland, Romania, Hungary and Czechoslovakia (cf. Maps 2 and 3).
Further economic and political migration following the failed attempt to establish an independent
Ukrainian state took place. Pirozhkov (2006) estimates that forced migrations of the 1920s–1950s cost
Ukraine the best of its intelligentsia and also many workers and farmers. Entire ethnic groups were
deported on the basis of their nationality, including Crimean Tatars, Germans, Greeks, Armenians and
others. Although the UK might not have been the most natural destination for most of these refugees,
some of them might well have settled in the UK, perhaps abandoning the original idea of heading for the
US or Canada. We cannot however make an informed statement, as the initial pioneer economic
migration and the political migrations during the Soviet rule are both absent from the quantitative
British census picture.
0
20
40
60
80
100
120
140
160
180
200
1950 1960 1970 1980 1990 2000 2010 2020
Ind
ex
Years 2008 = 100
Ukraine: Starter (?) Migration System

5 The Evolution of Ukrainian Migration to the UK (THEMIS Scoping Study)
Map 1: Austro-Hungarian Empire, Eastern Galicia where the Ukrainian pioneers came from to the United Kingdom (light green colour – north-east of Austro-Hungarian Empire), Source: http://www.lib.utexas.edu/maps/historical/shepherd/austria_hungary_1911.jpg

6 The Evolution of Ukrainian Migration to the UK (THEMIS Scoping Study)
Map 2: Europe after the First World War, Source: Infoukes.com
Map 3: Ukrainian lands during the interwar years (1918–1939), Source: Historical Atlas of Ukraine (1991)

7 The Evolution of Ukrainian Migration to the UK (THEMIS Scoping Study)
The major population of Ukrainian migrants in the UK, absent from the quantitative statistics, is the
post-1945 wave of displaced persons from the camps in Germany, Austria and Italy. They were mostly
recruited from Western Ukraine, Poland until 1939 (cf. Map 3 – white field to the west of Ukrainian SSR,
within the light grey borders). They created the core of the Ukrainian community in the UK (with its
institutions as we know it today). Between 1946 and 1951, after registration and screening, Ukrainians
were awarded European Volunteer Worker (EVW) status and allowed to come to work in Britain (AUGB
2010). The EVW scheme attracted relatively large labour migration to the UK after 1945. The scheme
was put in place with the aim of rebuilding the UK after the the Second World War.
Tannahill (1958) reveals that out of the 91,151 EVWs who arrived in Britain between October 1946 and
December 1949, the largest group were Ukrainians – 29,250 (32 per cent). The group was, however,
internally diversified: it consisted both of the Ukrainians captured by Germans, as well as Ukrainian ex-
prisoners of war (POWs), who fought with the Germans and surrendered to British troops in May 1945.1
The latter were brought to the UK by the War Office in March 1947 and given civilian status as EVWs.
The qualitative evidence has it that Ukrainians who arrived in the UK in the post-Second World War
wave were mostly young people, up to their mid forties, both female and male (interview 1, 2010). They
must have been young and fit, when forcibly recruited by Nazis to work in the labour camps during the
war. The dominant discourse has it that the post-Second World War Ukrainian migrants were mostly
males, while the migration of women has frequently been assumed to be due to the fact that they were
dependants. However, over a quarter of the Ukrainians who came to the UK in the 1940s under the EVW
scheme were women recruited in their own right for the textile industries and hospital domestic work
(cf. Table 1).
Table 1: Ukrainian European Volunteer Workers, Total Arrivals in the UK by National Origin (Oct 1946–Dec 1949), Source: Tannahill 1958, p. 139
Category Male Female Total
Ukrainian 16,210 4,720 20,930
Ukrainian ex-POWs 8,320 - 8,320
29,250
As for the type of migration, there is again some ambiguity here. Although Ukrainians – after the Second
World War – found themselves as displaced persons in various Western European countries, where they
were forcibly transferred during the war, they did not come to the UK as refugees, but as workers. While
the political origins of the incomers could not be ignored completely, in the public discourse official
1 The 14th Grenadier Division of the Waffen SS (popularly named SS-Galizien, later 1st Ukrainian) was a Second
World War German military formation made up of volunteers initially from the region of Galicia. Ethnically it was made up mainly of volunteers of Ukrainian ethnic background from Galicia (Armstrong 1963) but also incorporated Slovaks, Czechs and Dutch volunteers and officers (Logusz 1997). Formed in 1943, it was largely destroyed in the battle of Brody, reformed, and saw action in Slovakia, Yugoslavia and Austria before being renamed the first division of the Ukrainian National Army and surrendering to the Western Allies by 10 May 1945.

8 The Evolution of Ukrainian Migration to the UK (THEMIS Scoping Study)
emphasis on the EVWs as either ‘refugees’ or ‘workers’ shifted according to context and audience. The
most contentious was the question of the deportability of EVWs. The migration of the EVWs to Britain is
an earlier instance of political struggle over these labels, although the specific economic and political
context of the migration ensured a rather different set of claims and counter-claims by the protagonists
(Kay and Miles 1992, p. 7). While deportation was regarded by the Home Office as a final control
mechanism, in this context the Home Office encountered the legal difficulty of deporting stateless
persons, who could not therefore be returned to their country of origin (Kay and Miles 1988, p. 218).
The Ukrainians who arrived in the UK as EVWs created the core of the post-Second World War Ukrainian
community in the UK. Any future movement between Ukraine and the UK was halted until 1991, due to
the political situation in the Ukrainian Socialist Republic.
Current Trends – Diversification
The fall of the Berlin Wall in 1989, the break-up of the Soviet Union and the independence of Ukraine in
1991 saw a renewal of Ukrainian immigration to the UK. Between 1991 and 2004, the Ukrainian
government counted 2,537,400 individuals who emigrated; 1,897,500 moved to other post-Soviet
states, and 639,900 moved to other, mainly Western, states (Malynovska 2006).
The number of Eastern Europeans admitted for settlement in the UK doubled between 1990 and 1991.
The figures were not however particularly high (in 1990: 640 persons; in 1991: 1110 persons; in 1992:
1180 persons), and it is difficult to draw any meaningful conclusions about the actual number of
Ukrianian settlers due to the aggregated nature of the data (Home Office 1993, p. 15). Kyambi (2005)
reports that between 1991 and 2001 the number of Ukrainians born in the USSR and living in Britain
increased by 16,000.
Although since 1991 Britain has seen a rapid growth in communities from non-traditional immigration
countries – the number of immigrants from the former Yugoslavia has tripled to 33,500 persons; those
from Sierra Leone, China, South Africa and Sweden have doubled (Kyambi 2005) – Ukrainians were not
particularly noticeable among them.
The immigration of Ukrainians to the UK became more diversified: the legal economic migrants (migrant
workers) stopped being the predominant category among the Ukrainian migrants, due to limitations in
the UK immigration policy towards low-skilled migrants. That is not to say that the economic migrants
from Ukraine are non-existent in the UK – instead they are largely found in the irregular sphere. As a
result, the number of ‘illegal’ economic migrants surfaced as an issue that needs to be addressed
(interviews 1, 2, 2010). The 1990s and 2000s saw more tourists, professionals, students and posted
workers coming to the UK (interview 4, 2010). Many of them are here as visitors or contract workers;
some are classified as highly skilled migrants and business people. There were 300 Ukrainian citizens
seeking asylum in 2003, 120 in 2004 and 55 in 2004. Asylum, exceptional leave or humanitarian
protection was refused in almost all cases (Home Office 2005a).

9 The Evolution of Ukrainian Migration to the UK (THEMIS Scoping Study)
Quantitative Picture
According to the 2001 Census there were 11,204 Ukrainian-born persons in the UK. According to the
Annual Population Survey estimates the number of Ukrainian-born persons in the UK between 2004 and
2008 fluctuated between 12,000 and 15,000.
Table 2: Ukrainian-born persons in the UK, Source: Census 2001, Annual Population Survey
Year Number Source
2001 11,204 Census Data (OECD)
2004 12,000 Annual Population Survey (estimates)
2005 14,000 Annual Population Survey (estimates)
2006 19,000 Annual Population Survey (estimates)
2007 21,000 Annual Population Survey (estimates)
2008 15,000 Annual Population Survey (estimates)
The census data also gives some indication of the age structure among the surveyed Ukrainian-born
persons in the UK (as of 2001). The majority of them (6,537) were in their sixties and seventies. This
group comprised those people who arrived in the UK after the Second World War under the EVW
scheme (and their families) from the displaced persons camps in Germany, Austria and Italy. Another
significant cluster was of Ukrainians between 15 and 44 years old (4,158), most probably representing
the immigration after Ukrainian independence in 1991.
Table 3: Age Structure of Ukrainian-born persons in the UK, Source: OECD, Census 2001
Age Number
0-14 699
15-29 2,310
30-44 1,844
45-59 518
59-74 1,587
75 or older 4,950

10 The Evolution of Ukrainian Migration to the UK (THEMIS Scoping Study)
Chart 2: Age Structure of Ukrainian-born persons in the UK, Source: OECD, Census 2001
The Census 2001 data also reveals that the majority of Ukrainian immigrants were male; the ratio of
men to women was 58 per cent to 42 per cent. The Census figures demonstrate also that there was a
large proportion of Ukrainians in the UK with unknown labour force status. As the responses given in the
Census are largely declaratory, this could indicate that large proportions of Ukrainians worked in the UK,
but due to the irregular character of their employment preferred to conceal this information from the
surveyor.
Chart 3: Sex Ratio of Ukrainian-born persons in the UK, Source: OECD, Census 2001
0 1000 2000 3000 4000 5000 6000
0-14
15-29
30-44
45-59
59-74
75 or older
Age Structure of Ukrainians in the UK (2001)
Male58%
Female42%
Sex Ratio

11 The Evolution of Ukrainian Migration to the UK (THEMIS Scoping Study)
Chart 4: Labour Force Status of Ukrainian-born persons in the UK, Source OECD, Census 2001
The International Organization for Migration (IOM) estimated in their mapping exercise of 2007 that at
the end of 2005, 100,000 Ukrainians and Ukrainian-speaking people lived in the UK. By December 2006,
there were about 120,000 who considered themselves Ukrainian, and called Britain home (IOM 2007, p.
7). These are however unofficial and highly approximate estimates, which are not formally confirmed by
any authority, including the Home Office. According to Ukrainian sources there are about 70,000
Ukrainians in the UK (Bilan et al. 2010, p. 1).
IOM produced its estimates on the basis of figures relating to other aspects of migration. One analysis,
for example, took into account the numbers of issued visas, approximate numbers of Ukrainian citizens
returning to their country (giving a rough estimation of how many have overstayed) and numbers of
asylum applications approved and refused (IOM 2007, p. 7). In 2000, for example, 87,000 visas were
granted to Ukrainians; by 2003, the number had increased by 46 per cent (to 127,020) (IOM 2007, p. 7).
Due to these complexities, as well as the availability of data, it is therefore extremely difficult to place
Ukraine within the theoretical categories of THEMIS. The qualitative study demonstrates that the
‘starter’ category attributed to Ukrainians initially, after the analysis of the available census data, is
completely inadequate, as the Ukrainian community in the UK has a well-established history and its own
institutions (associations, newspaper, archives, community Saturday school, etc.). The various functions
within the community associations are now carried out mostly by the children of the original post-
Second World War migrants (British born), who are in their fifties and sixties.
Just how arbitrary and misleading the ‘starter’ category is, could be demonstrated by the views of the
migrant organisation representatives on the shape of the Ukrainian community in the UK. Many say that
the ‘golden years’ of community evolution and development might well be gone, and – with the
exception of religious gatherings – the community is actually in decline or stagnation. The newcomers
who arrive from Ukraine display different patterns of settlement and community involvement. While the
22%
3%
30%
45%
Labour Force Status
Employed
Unemployed
Inactive
Unknown

12 The Evolution of Ukrainian Migration to the UK (THEMIS Scoping Study)
Association of Ukrainians in Great Britain (AUGB – the largest umbrella organisation of Ukrainians in the
UK) clearly stated that it ‘has seen and welcomed the arrival of a new wave of Ukrainians to live and
work in the UK and has tried to embrace the different needs of young people who are of Ukrainian
descent but also British’, the two major waves of Ukrainian immigration to the UK seem to be rather
disengaged from each other. As one of our interviewees stated: ‘My parents and the Ukrainians who
arrive now – they came from two different Ukraines. We even speak different languages.’
2. Policy Changes
The importance of broader migration policy – the legal environment as both enabling and constraining
international movements – is well known.
1900–1945: Aliens Restriction Acts
The pioneer Ukrainian migrants’ entry and residence in the UK were administered by the 1905 Aliens
Act, 1914 Aliens Restriction Act, and 1919 Aliens Restriction (Amendment) Act (which later became
Aliens Order 1953). These provided a system of work permits for aliens seeking employment in the UK,
registration with the police and deportation for the public good. It applied to aliens but not to
commonwealth citizens.
It is worth noting that in British immigration law, aliens have traditionally been divided into alien friends
and alien enemies (Macdonald and Toal 2010). Alien enemies had no civil rights or privileges unless they
found themselves in the UK under the protection and by the permission of the Crown. Alien friends, on
the other hand, have long since been treated, with regard to civil rights, as if they were British subjects.
All British subjects or commonwealth citizens (terms used interchangeably until 1983) as set out in the
Nationality Act 1948 were free to come and go from the UK as they wished under what might well be
described as a Common Law right of abode.
Ukrainians were in the other category and for the purpose of British immigration law were considered
aliens (alien workers). As a result of the Aliens Act 1905, 1914 and 1919, individual aliens seeking
employment in Britain had to be in possession of a work permit, which was granted by the government
to a named employer on a condition that no suitable British person was available to fill the vacancy (Kay
and Miles 1992, p. 2). These measures ensured a level of protection for the domestic labour market and,
inasmuch as work permits were restricted to certain sectors of employment, a degree of direction of
foreign labour (Kay and Miles 1992, p. 2).
On the sending side, the emigration of Ukrainians was not regulated by any particular policy. The
pioneers who landed in Liverpool, and settled in and around the Manchester area in the early twentieth
century, constituted part of the over 10 per cent of the population of Western Ukraine (then part of the
Austro-Hungarian Empire) who due to poverty and lack of land emigrated to the US, Canada, and Latin
American countries between the end of the nineteenth and the beginning of the twentieth century. In
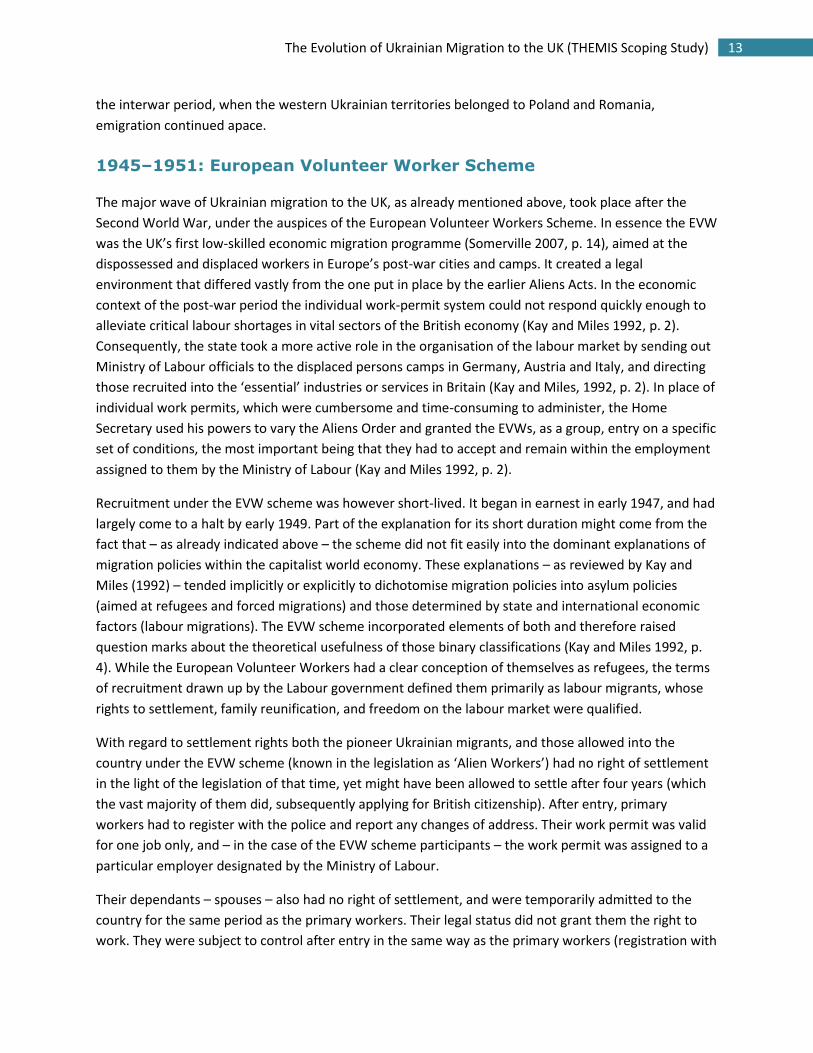
13 The Evolution of Ukrainian Migration to the UK (THEMIS Scoping Study)
the interwar period, when the western Ukrainian territories belonged to Poland and Romania,
emigration continued apace.
1945–1951: European Volunteer Worker Scheme
The major wave of Ukrainian migration to the UK, as already mentioned above, took place after the
Second World War, under the auspices of the European Volunteer Workers Scheme. In essence the EVW
was the UK’s first low-skilled economic migration programme (Somerville 2007, p. 14), aimed at the
dispossessed and displaced workers in Europe’s post-war cities and camps. It created a legal
environment that differed vastly from the one put in place by the earlier Aliens Acts. In the economic
context of the post-war period the individual work-permit system could not respond quickly enough to
alleviate critical labour shortages in vital sectors of the British economy (Kay and Miles 1992, p. 2).
Consequently, the state took a more active role in the organisation of the labour market by sending out
Ministry of Labour officials to the displaced persons camps in Germany, Austria and Italy, and directing
those recruited into the ‘essential’ industries or services in Britain (Kay and Miles, 1992, p. 2). In place of
individual work permits, which were cumbersome and time-consuming to administer, the Home
Secretary used his powers to vary the Aliens Order and granted the EVWs, as a group, entry on a specific
set of conditions, the most important being that they had to accept and remain within the employment
assigned to them by the Ministry of Labour (Kay and Miles 1992, p. 2).
Recruitment under the EVW scheme was however short-lived. It began in earnest in early 1947, and had
largely come to a halt by early 1949. Part of the explanation for its short duration might come from the
fact that – as already indicated above – the scheme did not fit easily into the dominant explanations of
migration policies within the capitalist world economy. These explanations – as reviewed by Kay and
Miles (1992) – tended implicitly or explicitly to dichotomise migration policies into asylum policies
(aimed at refugees and forced migrations) and those determined by state and international economic
factors (labour migrations). The EVW scheme incorporated elements of both and therefore raised
question marks about the theoretical usefulness of those binary classifications (Kay and Miles 1992, p.
4). While the European Volunteer Workers had a clear conception of themselves as refugees, the terms
of recruitment drawn up by the Labour government defined them primarily as labour migrants, whose
rights to settlement, family reunification, and freedom on the labour market were qualified.
With regard to settlement rights both the pioneer Ukrainian migrants, and those allowed into the
country under the EVW scheme (known in the legislation as ‘Alien Workers’) had no right of settlement
in the light of the legislation of that time, yet might have been allowed to settle after four years (which
the vast majority of them did, subsequently applying for British citizenship). After entry, primary
workers had to register with the police and report any changes of address. Their work permit was valid
for one job only, and – in the case of the EVW scheme participants – the work permit was assigned to a
particular employer designated by the Ministry of Labour.
Their dependants – spouses – also had no right of settlement, and were temporarily admitted to the
country for the same period as the primary workers. Their legal status did not grant them the right to
work. They were subject to control after entry in the same way as the primary workers (registration with

14 The Evolution of Ukrainian Migration to the UK (THEMIS Scoping Study)
the police, reporting any change of address). Similarly to the primary workers, the spouses had the right
to settle permanently in the UK after four years. Alien dependent children up to the age of 18 were
admitted conditionally for the purpose of settlement; those between 18 and 21 received conditional
residence after four years. Other alien dependants – parents who were over 60 in particular – were
allowed in to the UK for the purpose of settlement only if the head of the family had been resident for
four years. With regard to the Ukrainian post-Second World War migrants, the regulations concerning
the admission of other family members for the purpose of residence were effectively an empty law,
because after four years the political situtation in the Ukrainian Socialist Republic meant that family
reunion was practically impossible.
Sending-Country Perspective – Relaxing Emigration Policy
As for the sending country, strict exit restrictions were put in place, and obtaining a visa was very
difficult, with the nearest British embassy situated in Moscow (interview 4, 2010). The Soviet regime
relaxed its emigration policies only during perestroika in the 1980s. In 1987, 5,400 Ukrainian residents
received permission to emigrate, and, in 1989, 36,500 were allowed to leave. By 1990, this number had
already reached over 90,000 including minors (Malynovska 2006).2
Ukraine declared itself an independent state on 24 August 1991, following the dissolution of the Soviet
Union, and was a founding member of the Commonwealth of Independent States. On 1 December 1991
Ukrainian voters overwhelmingly approved a referendum formalising independence from the Soviet
Union. The Union formally ceased to exist on 25 December 1991, and with this Ukraine’s independence
was officially recognised by the international community. The Ukrainian government abolished all exit
restrictions in January 1993, and, in February 1994, the ‘Law on the Order of Exit from Ukraine and
Entrance to Ukraine for the Citizens of Ukraine’ was adopted. It guaranteed Ukrainian citizens the right
to depart and return to its territory freely. Additional guarantees of free movement were provided by
the 2003 ‘Law on Freedom of Movement and Free Choice of Residence in Ukraine’.
1980s–1990s: UK Response – Tightening Immigration Control
The relaxation of the emigration policy in Soviet Ukraine in the 1980s, and then the independent
Ukrianian state in the 1990s, were however met with a tightening of the borders and a limiting of the
channels of entry on the part of the British immigraiton authorities.
The tightening of the visa controls (and their extension even to Commonwealth citizens in the 1988
Immigration Act), was the first domestic manifestation of a pan-European policy to deal with the
increasing numbers of asylum seekers arriving in the UK, and it is asylum which has become the big issue
in the past two decades. Britain and most European countries had signed up to the 1951 Refugee
Convention and its 1967 Protocol. For the UK throughout the 1980s more than anything else the issue of
2 Most of these migrants planned to move to Israel. In reality, only 76,500 actually left due to the 1990 Gulf War
and international tensions in the Middle East.

15 The Evolution of Ukrainian Migration to the UK (THEMIS Scoping Study)
asylum rather than immigration per se became the concern. The legislation in this period bears the
imprint of an attempt to curtail and control these new movements.
More significantly, the 1987 Immigration (Carriers’ Liability) Act meant that carriers (particularly
airlines) were liable to civil penalties if they carried passengers who did not have a valid visa to come to
the UK. The strategy behind these Acts was to extend UK borders beyond the existing physical borders
of the sea, sharing the responsibility for control with carriers (Somerville 2007, p. 19). As a result, airlines
would not sell tickets to those without visas. Thus the trade in false passports and documents began, as
well as the trafficking trade, which many of the laws of the 1990s and the early years of the twenty-first
century have dealt with.
The work-permit system was formalised in the 1980s, with set criteria for gaining a work permit based
on local labour market conditions. However, as Somerville observed, it was barely changed from the
system that had operated in the period 1948–1976, with the 1971 Immigration Act as the cornerstone of
this policy (Somerville 2007, p. 20). A work permit was a strict entry requirement for alien workers. Alien
dependent spouses and children had to present proof that they were married or related to the permit
holder, and a proof of the primary worker’s ability to support them so that they did not become a
burden on public funds. Alien dependent spouses had no right of settlement, but could be temporarily
admitted for the same period as the primary workers (with no right to work). Alien dependent children
were denied the right of settlement, and could be considered only as conditional residents up to the age
of 18 if they were joining both parents. Those between the ages of 18 and 21 were only allowed to join
their parents in exceptional circumstances. Under the legislation other alien dependants (i.e. parents
over 60 and other ‘distressed’ dependants) could not be admitted to the UK until the head of the family
gained full residency rights.
In the 1990s and 2000s the work-permit scheme brought with it a strong labour market test, if
employers wanted to employ a migrant from outside the resident work force (UK, or EEA – European
Economic Area) for a job that was not on the list of shortage occupations. The job vacancy must have
been advertised to settled workers. If the salary was £40,000 or under, the job must be advertised for a
minimum of two weeks. If the salary was over £40,000, the job must be advertised for a minimum of
one week.3
The other available routes to enter the UK for the Ukrainians in the early 1990s were via a tourist visa,
business visa, or student visa.
3 The job must be advertised according to the code of practice specific to the sector and job. Each code of practice
explains: a) the skilled jobs at National or Scottish Vocational Qualification (NVQ or SVQ) level 3 or above in each occupation that sponsors are allowed to issue a certificate of sponsorship for; b) the minimum appropriate salary rates, as defined by the 25th percentile of the Annual Survey of Hours and Earnings (ASHE) or by an alternative code of practice; c) the acceptable media and methods for meeting the resident labour market test. If there is no code of practice for the sector or job at the time of advertising, the employer must advertise the job using Jobcentre plus.

16 The Evolution of Ukrainian Migration to the UK (THEMIS Scoping Study)
1990s and 2000s: Managed Migration Approach and Points-Based
System
Significant reforms and changes in British immigration policy took place under the Labour government
between 1997 and 2010. A few important trends can be distinguished:
1) tightening of immigration controls
2) selective admission focused solely on highly skilled migrants and migrants with skills that are
in deficit in the UK
3) severe limitations in legal channels of entry for low-skilled migrants from outside the EEA
4) access to the labour market for students limited to 20 hours per week
5) unlimited access to the labour market for spouses of primary workers (usually admitted under
the work-permit scheme or the Highly Skilled Migrant Programme [HSMP]).
A particularly important aspect of British immigration policy, in terms of Ukrainian migration, was
encapsulated in the White Paper ‘Fairer, Faster and Firmer: A Modern Approach to Immigration and
Asylum’ (Home Office 1998), which led to the 1999 Immigration and Asylum Act. Cohen (1997, p. 134)
argues that the 1999 Act represents ‘what is probably the greatest tightening of controls since 1905’,
with the significantly extended use of civil and criminal sanctions in immigration matters. This included
expanding existing offences of entering the country by deception; sanctions on carriers, particularly road
hauliers; and greater policy powers, including the use of force for immigration officers.
Further changes – departing from a sole focus on restrictions and reattaching economics to migration
policy – took place with the 2002 White Paper ‘Secure Borders, Safe Havens: Immigration with Diversity
in Modern Britain’ (Home Office 2002). The year 2002 also saw the introduction of the Highly Skilled
Migrant Programme (HSMP) – an attempt to direct admission for residence with the prospect of
settlement only towards highly skilled migrants.
As a result, for the HSMP, in contrast to the existing work-permit scheme, the applicant did not require a
job offer to apply under the highly skilled worker category. Applicants were awarded points based on
their qualifications, previous earnings, UK experience, age, English language skills, and available
maintenance (funds). The HSMP did not attract a labour market test before the admission of a migrant
to the UK. There were also other routes developed to attract skilled labour into the UK (e.g. business
people; Fresh Talent: Working in Scotland; innovators, International Graduates Scheme; investors;
writers, composers and artists). There were also separate schemes in place for temporary workers (e.g.
au pairs, voluntary workers or working holiday makers).
These changes reflected the broader turn in the EU migration policy with the decision at the European
Council in Tampere, 1999, to develop a common EU migration and asylum policy. In its communication
on a Community Immigration Policy (COM (2000) 757) of November 2000, the European Commission
explicitly proposed abandoning the zero immigration policies of the past 30 years. Instead, new
immigration policies would be devised with which to better regulate migration through orderly and
regular channels that were themselves responsive to labour market needs, reflecting the realities of
labour market demand for immigrant workers, continuing migration pressures from the developing

17 The Evolution of Ukrainian Migration to the UK (THEMIS Scoping Study)
world and demographic trends in European countries, particularly declining birth rates and ageing
populations (Pellegrino 2004, p. 8).
The developments in Labour’s third term continued along the same policy line, with the five-year
departmental plan on asylum and immigration entitled ‘Controlling our Borders: Making Migration Work
for Britian’ (Home Office 2005a). The five-year plan was followed by a major consultation on the detail
of economic migration: ‘Selective Admission: Making Migration Work for Britain’ (Home Office 2005c),
and the following year by a policy plan and introduction (since 2008): ‘A Points-Based System: Making
Migration Work for Britian’ (Home Office 2006). These policy changes are important from the
perspective of new Ukrainian migrants to the UK. The Highly Skilled Migrant Programme was
discontinued on 29 June 2008, and was replaced by Tier 1 (General) Highly Skilled Worker Programme
(operating on generally the same bases as the pilot HSMP). The General Work Permit Scheme was
suspended on 29 June 2008 and replaced by Tier 2 (General), embracing people coming to the UK with a
skilled job offer to fill a gap in the work force that cannot be filled by a settled worker. Tier 2 also
embraces ministers of religion, intra-company transfers and sports persons. For an explanation of
further Tiers see Table 4.
The managed migration approach under Labour did not intend any quotas or caps of non-EEA nationals
admitted to the UK (including Ukrainian nationals). With the change of government in April 2010, the
Conservative-Liberal Democrat government announced the introduction of caps for non-EEA nationals,
administered on a monthly basis by the UK Border Agency. The interim cap for Tiers 1 and 2 came into
effect on 19 July 2010 and is to last until March 2011. After this, the Government proposes to introduce,
following consultation, the final system (UKBA 2010).
Table 4: Explanation of New Points-Based System

18 The Evolution of Ukrainian Migration to the UK (THEMIS Scoping Study)
Limitations in Legal Channels of Admission
and Irregular Migration
The tightening of the immigration controls limited the legal channels
for Ukrainians to enter the UK. The 1990s and 2000s saw significant
restrictions in programmes focused on the admission of migrants for
residence and settlement. The dominant trend was towards
selective admission largely focused on highly skilled migrants (either
on HSMP or work permit bases), with the practical exlcusion of low-
skilled migrants on anything other than a temporary basis (e.g. via
the Seasonal Agricultural Workers Scheme, until 2004). The trend
found its conclusion in the introduction of the Points-Based System
in 2008, and the indefinite suspension of Tier 3 – focused on low-
skilled workers filling specific temporary labour shortages.
In this way the UK closed itself to legal inflows of low-skilled labour
from outside the EU. At the same time, with the 2004 EU
Enlargement, the pool of low-skilled labour in the UK was largely
thought of to be filled by the A8 migrant workers from the Accession
States, i.e. Poland, Czech Republic, Slovakia, Lithuania, Latvia,
Estonia, Hungary, Slovenia (cf. Map 4).
As a result of the specific design of the British immigration policy
therefore, almost by definition any inflows of low-skilled labour
from Ukraine to the UK take place on irregular bases.4 In terms of
legal low-skilled work the only exceptions are made for students,
who are allowed to work in the UK for a maximum of 20 hours per week (in any type of job) and to
spouses of primary applicants for Tier 1, Tier 2 and Tier 4, who have unlimited access to the labour
market (tied to the duration of the original spouse’s permit).
Due to the existing state legal frameworks for admitting contemporary migrants from Ukraine it is
therefore not surprising that the Home Office estimates that most Ukrainians presently residing in the
UK are family reunification migrants or irregular migrants (IOM 2007, p. 7). Düvell argues that
Ukrainian illegal immigrants seem to take over the jobs at the bottom of EU labour markets from the
now legalised EU-8 nationals, including those in EU-8 countries (Düvell 2006). Thus, he sees Ukraine not
only as the major supplier of migrant labour to Europe, but also the major sending country of irregular
immigrant workers (Düvell 2006). This data suggests that migration policy significantly influences the
dynamics of the migration flows between Ukraine and the UK.
The wider legal environment created by specific British immigration policy is however ambivalent.
Official black letter law limitations and restrictions in the available legal channels of entering the UK for
4 The youth mobility schemes (Tier 5) are also reserved for nationals of Australia, Canada, Japan, New Zealand and
Monaco.
Map 4: The Accession States and Ukraine

19 The Evolution of Ukrainian Migration to the UK (THEMIS Scoping Study)
work purposes for Ukrainian nationals are met with inconsistent law enforcement of the immigration
regulations for employing illegal workers. The law enforcement – thoughout the 1990s and up to 2008
– has always been low in the UK, and therefore did not effectively disourage the illegal employment of
migrants. According to British law the enforcement of immigration regulations is passed to the
employer. Until 2008, the law said that the employer who continues to employ unauthorised workers
(or those whose status precludes them from undertaking the employment in question) may be
committing a criminal offence, and could face legal sanctions up to £5,000 (Home Office 2005d).
Although the British government introduced measures to strengthen the enforcement of section 8 of
the Asylum and Immigration Act 1996 (as amended by section 147 of the Nationality, Immigration and
Asylum Act 2002), which made employers in general responsible for ensuring that they were authorised
to employ a worker from outside of the EEA, prosecution rates following section 8 convictions remained
very low. Between 1998 and 2005, 17 employers (including eight employers in 2004) were successfully
prosecuted for illegally employing migrants under section 8. More than half of section 8 convictions in
2004–2005 resulted in fines of less than £700, with four employers fined the maximum of £5,000 (Home
Office 2005d).
According to the Home Office 2006 report on employers’ use of migrant labour, employers expressed no
knowledge of illegal working, whereas actually some of them were (or had been) recruiting illegally. This
was reportedly owing to their ignorance concerning registration procedures and their responsibilities as
employers. Some employers admitted the procedures were too time consuming to deal with and that
they sometimes ‘turned a blind eye’ to workers of unknown legality (Dench et al. 2006). On the other
hand many employers who recruited through recruitment agencies assumed that agencies made
appropriate checks (Dench et al. 2006).
In 2006, the newly introduced Immigration, Asylum and Nationality Act 2006 (section 15) changed the
legal qualification of employing illegal workers from a criminal to civil offence (it came into force on 29
February 2008). As a result, the UK Border Agency could issue ‘on the spot’ fines to employers if the
latter were found to employ an illegal worker and had not copied and kept the right identity and work
permit documents. If a UK employer is found to be employing illegal workers, it is issued with a notice of
potential liability by UK Border Agency officers. The civil penalties compliance team will then consider
the evidence and decide whether to issue the employer with a notice of liability and a civil penalty of up
to £10,000 per illegal worker. The charge of criminal offence still exists for those employers who
knowingly employ illegal workers. They carry a maximum custodial sentence of two years, and/or an
unlimited fine. Since the change in the legal qualification of the act of employing illegal workers from
criminal to civil offence, the prosecution rates increased significantly. Since the implementation of the
Immigration, Asylum and Nationality Act 2006, between 29 February and 13 June 2008 notices of
liability were served to 265 employers and penalties totaling £2,350,000 were exacted (Home Office
2008).

20 The Evolution of Ukrainian Migration to the UK (THEMIS Scoping Study)
3. Institutions
In Section 1 where Ukrainian migration to the UK was analysed with reference to the THEMIS theoretical
framework, it was noted that the two major waves of Ukrainian migration have been quite distinct from
each other. Each of the waves – post-Second World War and post-1991 – represents their own, separate
dynamics. This is particularly visible with regard to the Ukrainian migrant institutions in the UK. The
different role and character of the established institutions reflects the internal divisions within the
Ukrainian community.
In short, the ‘old’, established Ukrainian migration to the UK (post-Second World War) focused more on
establishing migrant institutions in the traditional sense of the term: structures offering self-help,
welfare advice and organisation of cultural activities. Over time the organisations developed and
sustained transnational links with other Ukrainian diasporic organisations – particularly in the US and
Canada. Links with Ukraine were practically non-existent until the late 1980s. With the perestroika
movement in the Soviet Union and, more importantly, the Chernobyl catastrophe (1986), the Ukrainian
institutions in the UK became involved in welfare and humanitarian aid for fellow Ukrainians ‘back
home’. Transnational links with Ukraine were fully revived after the independence of Ukraine in 1991.
The new, post-1991 migration did not add much to the existing structure of Ukrainian migrant
institutions in the UK in the sense of establishing new migrant organisations that could represent the
new migrants’ specific interests or identity. Some of the newly arrived migrants joined the well-
established associations, and became involved and engaged in the life of the community. However, this
is not a widespread phenomenon, as we have learnt from the interviews with the Ukrainian community
representatives (Scoping Study Interviews 2010). The general view is that the ‘new’ migrants do not get
involved, ‘they do not have time’, as their priorities on arrival in the UK are quite different. The
interviewees stressed the ‘target-oriented’ strategy of the newcomers: students tend to lean more
towards the international student community, while the – largely irregular – migrant workers prioritise
their earnings, and due to their legal status largely prefer to ‘keep a low profile’. Among the recent
group of Ukrainian migrants it is rather the migration industry that takes precedence over voluntary
migrant organisations.
Migrant Organisations Among the ‘Old’ Diaspora
Ukrainian migrants who arrived in the UK as displaced persons after the Second World War were initially
accommodated in camps all over the country and worked on local farms. In the camps, they organised
themselves and established educational programmes, choirs, folk dance groups, drama groups and even
orchestras. The Ukrainian Relief Association, based at 218 Sussex Gardens in London, headed by Colonel
Panchuk (a Canadian-Ukrainian), provided support and welfare services to those who needed it (AUGB
2010).

21 The Evolution of Ukrainian Migration to the UK (THEMIS Scoping Study)
By autumn 1945, the resettled Ukrainian community was ready to organise itself and the idea of a
national association was born. The inaugural meeting of the Association of Ukrainians in Great Britain
(AUGB) was held in Edinburgh on 19–20 January 1946 and set itself three main tasks:
To represent the membership and the Ukrainian community generally
To act on behalf of the community in dealings with the authorities and the host community in
the UK
To work with similar Ukrainian community organisations around the world.
A key principle of the Association was that of mutual support and assistance. The vast majority of
Ukrainian settlers had no family, so the community became an extended family for them. Members
contributed 1/- (a shilling, 5p in decimal coinage but worth much more then) a week to a mutual aid
fund which helped individuals and families in need (AUGB 2010).
A lasting example of the practical application of the mutual aid philosophy is the Association’s
Sydenhurst residential home, which was bought in 1949 through donations from members, to provide a
home and light agricultural work for those Ukrainians who were too badly wounded or shell-shocked to
find work, and who risked deportation (AUGB 2010).
In 1948, the needs of the Ukrainian community had outgrown Sussex Gardens, and the Association of
Ukrainians bought 49 Linden Gardens, which is still the Association’s headquarters today. In 1949, the
library from Sussex Gardens was transferred to Linden Gardens, and is now a highly respected reference
library. The Ukraine-related publications in the UK are therefore accessible from two major sources:
Shevchenko Library and Archive (www.augb.co.uk/library-and-archive.php) , with the largest
collection of diaspora publications in Europe (administered by Dr Ludmila Pekarska, the
Curator).
Ukrayinska Dumka (www.augb.co.uk/ukrayinska-dumka.php) was first published in 1945 and is
still the only Ukrainian-language newspaper in the UK. Many other periodicals and books were
published over the years. Dr Oleksa Semenchenko has been the editor of Ukrainska Dumka since
the late 1990s.
The Association of Ukrainians in Great Britain (www.augb.co.uk/about-the-augb.php) is by far the
largest association of Ukrainians in the UK with branches in many UK cities
(www.augb.co.uk/branches.php) .5
From 1948, special interest groups were established, including:
The Association of Ukrainian Women (www.augb.co.uk/ukrainian-women.php).
5 I would like to express my deepest gratitude to the members of the Association of Ukrainians in Great Britain,
Lubomyr Mazur, Ludmila Pekarska, Oleksa Semenchenko for their invaluable help in preparing this report. Also I would like to acknowledge that all the information about AUGB history and development (except where specified) comes from the AUGB website, www.augb.co.uk/a-brief-history.php

22 The Evolution of Ukrainian Migration to the UK (THEMIS Scoping Study)
The Association of Ukrainian Teachers (www.augb.co.uk/association-of-ukrainian-teachers-and-
educators.php).
There is a whole range of related Ukrainian organisations located in the same area of West London, such
as:
The Ukrainian Brotherhood
The Organisation of Ukrainian Veterans
The Ukrainian Book Society (IOM 2007, p. 21)
The Ukrainian Community School and Nursery (www.augb.co.uk/ukrainian-community-
schools.php)
The Ukrainian Youth Association in Great Britain (CYM) (www.cym.org/uk), which organises
and promotes cultural and social events for young Ukrainians from throughout the diaspora.
As Ukrainians left the camps and settled in industrial towns and cities all over the country, they began to
establish churches and community centres so that they could maintain their cultural and religious
traditions, and pass these on to their children. The Ukrainian Greek-Catholic Church and the Ukrainian
Orthodox Church in London are important meeting points for many Ukrainians in Britain.
Migration Industry Among the ‘New’ Migrants
As noted above, the post-1991 Ukrainian migration to the UK has not been particularly active in
establishing new organisations or institutions separate from the existing structures. Some of the post-
1991 migrants joined and revived the established institutions, adjusting them to the needs of the newly
arrived. This was very much what happened in the case of the Ukrainian community schools, which went
from teaching Ukrainian to second-generation post-Second World War migrants, to also accommodating
children of work permit holders, students and other highly skilled migrants (interview 2, 2010). AUGB
itself is now run jointly by children of EVW scheme participants, who themselves are British nationals,
and newly arrived, established professionals.
As observed by the representatives of the AUGB, this is not however the case with regard to the
majority of newcomers. The latter are very much selectively engaged in the established institutions,
displaying more of a ‘consumer’ attitude towards the plethora of organisations – preferring ad hoc
actions or gatherings, and preferring socialising over engagement and commitment. For this wave of
Ukrainian migration it is the migration industry that has replaced the old voluntary and welfare
organisations, and which currently dominates among the newcomers.
The ‘migration business/industry’ concept has been put forward by Cohen in his book, Global Diasporas,
where he states that: ‘…despite the rigorous official control of immigration, there has been an extensive
and rapid development of a “migration industry” comprising private lawyers, travel agents, recruiters,
organizers, fixers and brokers who sustain links with origin and destination countries’ (Cohen 1997, p.
163). For Cohen it was a proof of diasporas being a very successful and highly adaptive form of social
organisation, suited perfectly to operate in postmodern globalisation times.

23 The Evolution of Ukrainian Migration to the UK (THEMIS Scoping Study)
With regard to the Ukrainians it would perhaps be equally justified to say that the adaptation took place
also the other way round – it was the migrant institutions that had to adapt in order to serve the
different, more specific needs of the newly arrived migrants. The shape and character of migrant
institutions reflects therefore – to a certain extent – the different needs and type of the migrant group
in question.
Despite the group’s diversity, one could detect a certain pattern of organisation and identity. The new
migrants come from a different Ukraine than the post-Second World War migrants. Some of them
remember the Soviet period (1919–1991 in Eastern Ukraine, 1945–1991 in Western Ukraine) and its
survival strategies. To most of them the experience of political and economic transition after 1991 is
common – with its volatile politics, rapid economic changes and bewildering legislation. And although
formal rules may change overnight as a result of political or juridical decisions, informal constraints
embodied in customs, traditions, and codes of conduct are much more impervious to deliberate policies
(North 1990).
During the Soviet period, mobilisation became the essential tool of the state in integrating the people
around centralised organisational structures. However, due to the almost complete subordination of
social relations (political parties, voluntary organisations, trade unions, professional associations, local
community associations) to the state, the side effect was a growing social isolation and atomisation of
groups and individuals at the intermediary level of social tissue (civil society) (Wnuk-Lipinski 1991, p. 5).
With the transition to democracy and market economy since 1991, the rules of the game were suddenly
changed, and often without due procedures in place. This required specific adaptation strategies, to
‘catch up’ with the new realities of the market economy. The adaptations were abrupt and revealed
more strongly the internal divisions within the society – those who lagged behind became socially
excluded. Ukrainians adapted to the new political and economic situation, but the adaptation was a
specific one. In fashioning their responses to the new social realities the acceptance of crude free
market rules was combined with reliance on close-knit networks of friends and family, as a familiar
adaptation strategy ‘inherited’ from the Soviet past.
This could partially explain why the post-1991 Ukrainian migrants in the UK are not particularly proactive
in creating their own organisations or engaging in sustaining the ones that have already been created.
People disheartened by the forced participation in various organisations during the Soviet past seem to
build mini-communities of friends, acquaintances and colleagues and refrain from getting involved more
seriously with larger associations – they rely on friends and colleagues, or simply on people they know, if
help or consultation is needed.
Their specific, forced and quick adaptation to the hard rules of the free market economy during the time
of post-Soviet transition may instead help to explain why the majority of ‘new’ Ukrainian migrants
display a ‘consumer’, passive attitude to the existing organisations and treat them as options on the
market, part of an economic transaction or wider exchange system. They ‘take what they like, usually
come and socialise, but do not want to take responsibility for sustaining the organisations’ (interview 2,
3, 2010). Not surprisingly therefore, to cater for their specific needs it is the migration business – rather

24 The Evolution of Ukrainian Migration to the UK (THEMIS Scoping Study)
than voluntary migrant organisations – that is flourishing. It includes travel agents, informal employment
agencies (including the bogus ones), ‘Ukrainian’ houses (run by Ukrainians or other Eastern Europeans
for Ukrainians), immigration advice offices (some respectful office venues, others run by human
traffickers, and gangs of document forgers), Eastern European and Russian delicatessens, and tele-
operators (selling region-specific phone cards). An IOM report (2007) suggested that in London alone
there is a rapidly increasing number of ‘advice’ centres, legal practices and charities that assist people
from Ukraine and the CIS, or even specialise in working with them. Forums and establishments, such as
bookshops and video stores, restaurants, social clubs, language schools and nurseries are also constantly
increasing.
This is not to say that the newly arrived immigrants have no interest in the political or social matters of
their compatriots. The interviews revealed that during the time of the Orange Revolution in Ukraine
(2004–2005), there was a massive, ad hoc and spontaneous mobilisation of Ukrainian migrants in
London (interview 2, 2010) echoing the events in Lviv and Kiev, expressing solidarity with the opposition.
Migrants themselves organised demonstrations in front of the Ukrainian Embassy against the corruption
in the government, which were attended by many Ukrainians, who found out about the events via text
messages received from their friends and colleagues. The interviewers remembered the special
atmosphere of these events, the high hopes, and the ‘wind of change’. However, after the success of the
Revolution this human potential ‘somehow’ dispersed, and was not channelled into any form of social
organisation, again demonstrating the ad hoc character of the engagement dominant among the newly
arrived migrants.
The only form of social institution that somehow stands out from either ad hoc, short-term mobilisation
or a passive, ‘consumer’ attitude is the religious activity of Ukrainian migrants. The Ukrainian Catholic
and Orthodox churches are usually full on Sundays, and the services are well attended (interviews 1, 3,
2010).

25 The Evolution of Ukrainian Migration to the UK (THEMIS Scoping Study)
4. Remittances
For Ukraine the data on remittance inflows exists since 1996. The data gathered by the World Bank only
capture remittances sent through formal channels such as banks and money transfer operators.
Currently, no uniform and authoritative historical data on informal flows exist. Given the widespread use
of informal remittance channels in many countries, the remittance data presented should be regarded
as underestimates of the total flows.
Table 5: Remittance Inflows (US$ millions), Source: World Bank (2009)
Ye
ar
19
96
19
97
19
98
19
99
20
00
20
01
20
02
20
03
20
04
20
05
20
06
20
07
20
08
20
09
Ukr
ain
e
6
12
12
18
33
141
209
330
411
595
829
4,503
5,769 4,972
Chart 3: Remittance Inflows Patterns to Ukraine (US$ millions) Source: World Bank (2009)
0
1000
2000
3000
4000
5000
6000
1996 1997 1998 1999 2000 2001 2002 2003 2004 2005 2006 2007 2008 2009
Rem
itta
nce
Infl
ow
s U
S $
(m
illio
ns)
Ukraine Remittance Inflows

26 The Evolution of Ukrainian Migration to the UK (THEMIS Scoping Study)
There was a huge rise in remittance inflows to Ukraine between 2006 and 2007 (443 per cent).
According to the World Bank in 2008 remittances in Ukraine provided for a 3.2 per cent share of the
country’s GDP. Düvell (2006) finds these figures implausible considering that the figure for just one
oblast,6 Ternopil, is $100 million annually. In contrast, Keryk (2004) suggests that the figure could be €7
billion annually (state budget: €6.9 billion), calculating that migrants send an average of $100/month.
That would place Ukraine third among remittances receiving countries, just after India and Mexico, but
before the Philippines.
It is very difficult to find longitudinal, bilateral information on how much of the Ukraine’s remittance
inflows is actually contributed by Ukrainian migrants in the UK. The World Bank bilateral remittance
estimates (see Table 6) using Migrant Stocks, Host Country Incomes, and Origin Country Incomes7 (in
millions of US$) revealed that in 2005 Ukraine received from the UK remittances amounting to $2
million, which would constitute only 0.3 per cent of all the remittance inflows in 2005 (for comparative
purposes the Ukrainian diaspora in the US remitted $64 million in 2005, 10.8 per cent of the country’s
total remittance inflows, and the Ukrainian diaspora in Russia remitted $309 million in 2005, 52 per
cent of the country’s total remittance inflows).
Table 6: Bilateral Remittance Estimates using Migrant Stocks, Host Country Incomes, and Origin Country Incomes (US$ millions), Top 10 Remittance Sending Countries and the United Kingdom. Source: World Bank 2005
6 Oblast is the English formal term for a region or province, also popularly and widely used in Ukrainian.
7 These data are estimated using assumptions and arguments as explained in Ratha and Shaw (2006) ‘South–South
Migration and Remittances’, Development Prospects Group, World Bank (www.worldbank.org/prospects/migrationandremittances).
Country Sending Remittances Country Receiving Remittances – Ukraine
Russian Federation 309
United States 64
Israel 30
Germany 28
Poland 27
Kazakhstan 17
Moldova 14
Belarus 12
Canada 10
Spain 8
UK 2

27 The Evolution of Ukrainian Migration to the UK (THEMIS Scoping Study)
5. Individual Migration Histories – Trends and Patterns
The trends and patterns of Ukrainian migration to the UK have already been partially presented in
Section 1, when THEMIS theoretical concepts were confronted with the empirical reality, and in Section
2, where UK immigration policy outcomes were presented in parallel with the history of Ukrainian
movements to the UK.
Andrij’s8 migration history is atypical of migrants of his generation (he himself admitted before the
interview), and therefore fits perfectly in the wider narrative of Ukrainian migration to the UK, which so
much escapes generalisation and lacks clearly distinguishable patterns. Andrij comes from Kiev, and
before coming to the UK he studied Polish literature in Warsaw in late 1980s. He travelled a lot across
Central and Eastern Europe. He first came to the UK as a tourist in 1987, having been invited by a friend
he met during one of his international sojourns in the Czech Republic. At that time one still had to go to
Moscow in order to apply for a UK visa. Andrij remembers long queues in front of the British Embassy:
‘ I would need to wait two weeks in front of the Embassy in order to have my meeting. No system of
appointments was in place. People were managing themselves, there was a Queue Committee
spontaneously formed by those who were at the top of the queue. They were reading out your name
every morning. If you did not confirm your presence – your name was crossed out from the list, and you
had to start queuing anew. I could not afford to spend that much time in Moscow. Two weeks! Well, I
sneaked in one morning…’
A remembers that upon arrival in the UK he liked it here. He came to B, a city in the north of England. At
that time in the late 1980s British streets looked completely different than they look now – ‘to a
Ukrainian’ – he explains. ‘Now there are so many Polish people here, you have shops, and many clubs.
Then, streets got empty in the evenings at least in B. There were no clubs.’
Nevertheless Andrij liked it in the UK, and he came once more – this time to start his PhD in Russian
Literature and Philosophy. He defended his PhD in the late 1990s and started working first for the local
council as Eastern European Adviser and then for a radio station, as a Eastern European correspondent.
‘Since 2004 things have changed a lot, there are a lot of Polish people, particularly in the north of
England where I live. England feels more like home now, I hear Polish on the streets, it feels nice.’ In the
mid 2000s Andrij received the offer to work as an editor of one of the journals published by the
Ukrainian community in the UK, which he accepted. He now shares his time between B and London,
where he works. He admits he is an atypical migrant; he is not like those Ukrainians who have been
arriving in London in particular since the 1990s. ‘I did not come to the UK to earn money. This is of course
important, but I wanted to see the world, see the West. And I wanted to be legal, as ultimately I wanted
to settle. It wouldn’t be possible to do so, if I was working illegally. I have British citizenship now.’
8 Name changed.

28 The Evolution of Ukrainian Migration to the UK (THEMIS Scoping Study)
Where To? – Where From?
Ukrainian Pioneers in the UK (early twentieth century)
To reiterate, and systematise the argument, the dominant community narrative has it that its pioneers
in the UK could be traced back to the beginning of the twentieth century, when a group of Ukrainians,
bound originally for America, landed in Liverpool, and began their new life around the city of
Manchester instead (AUGB 2010). The pioneers came from Western Ukraine (Eastern Galicia,
Ukrainian – Galicya Region), which was then part of the Austro-Hungarian Empire. They were part of
the larger emigration of over 10 per cent of the population of Western Ukraine at that time, who
emigrated to the US, Canada, and Latin American countries between the end of the nineteenth and the
beginning of the twentieth century (Malynovska 2006). During the scoping study we did not manage to
get hold of any of the pioneers.
Major Wave of Ukrainian Migrants (1946–1951)
After the Second World War the Ukrainian diaspora in the UK was significantly enlarged by refugees
from the displaced persons camps in continental Europe, who were recruited to come to work under the
European Volunteer Worker scheme between 1946 and 1951. The majority of the migrants again came
from Western Ukraine: Galicya – Volyn, Bukovina, and Carpathian region (cf. Map 5). During the war
they were forcibly deported to labour camps in Germany and Austria (20,930 people). Some of the
Ukrainian migrants to the UK were recruited from the prisoners of war who fought with the Germans
and surrendered to the British troops in May 1945 (8,320 people).
Map 5: Map of Contemporary Ukraine (post-1991), with regional divisions. Source: Bilan et al. (2010)

29 The Evolution of Ukrainian Migration to the UK (THEMIS Scoping Study)
The general feeling was that Ukrainians who arrived in the UK after the Second World War were
involuntarily uprooted and torn away from their families and neighborhoods in Western Ukraine. In the
UK upon arrival they were dispersed to different camps and then sent to work in mills, mines,
agriculture and textile factories in the British regions that particularly suffered from a lack of work force
– the Midlands, north Manchester, Bradford, Bolton, and Nottingham. IOM (2007) reveals the
demographic spread of the Ukrainian community in the UK, which largely reflects this historical
argument (cf. Map 6). There are still relatively numerous Ukrainian communities in the old industrial
regions in the north of England, particularly consisting of the original EVW workers and their children
(second generation).
By far the greater cluster of Ukrainian diaspora is in London. Although the post-Second World War
workers were usually sent to work in the Midlands (and the majority of them could not even afford to
settle in London – interview 1, 2010), the turning point that attracted more Ukrainians to London was
the establishment of the Association of Ukrainians in Great Britain, initially with the base in 218 Sussex
Gardens in London (then known as the Ukrainian Relief Association), and since 1948 relocated to 49
Linden Gardens, which is still the Association’s headquarters today.
The concentration of the ‘old’ wave of Ukrainian diaspora in a couple of specific locations in the UK
largely stems from the fact that the migrants longed to stay together within the diaspora; to create
structures and organisations for educational purposes; to fulfill their emotional and welfare needs; and
to represent the Ukrainian people to British authorities. It was important to them to build churches, to
practise their religion, to teach their children the Ukrainian language, to celebrate festivals, and to pass
the tradition and culture on to their second generation. All these aims could be better fulfilled if
geographical proximity was maintained. During the scoping study we did not speak directly to this first
generation of Ukrainian migrants, but to their children, born in the UK in the 1950s, who also very much
consider themselves as part of the Ukrainian diaspora despite the fact that they are all British citizens.
Their parents established the migrants’ organisations and institutional structures, as we know them
today, which the second generation is now sustaining.

30 The Evolution of Ukrainian Migration to the UK (THEMIS Scoping Study)
Map 6: Geographic Spread of the Ukrainian Community in the UK, 2007. Source: IOM 2007

31 The Evolution of Ukrainian Migration to the UK (THEMIS Scoping Study)
New Wave of Ukrainians (post-1991)
With regard to the new Ukrainian migrants, the qualitative evidence has it that the majority of them also
come from Western Ukraine. Despite the lack of practical ties between the ‘old’ diaspora and Ukraine
during the Soviet times, the memory of ‘those who left these lands’ has been preserved in the
neighborhoods, among friends, families, and in the community narrative (partially real, partially
imagined) (interview 1, 2010). After Ukrainian independence in 1991, when the relationship between
the Ukrainian diaspora and their homelands was re-established, some Ukrainians decided to follow in
the emigrants’ footsteps to try their luck, ‘see the world’ (interview 4, 2010). The anecdotal evidence
has it that while the majority of economic migrants (migrant workers) in the 1990s indeed came from
Western Ukraine, and mainly originated from rural areas, in recent years the movement of the
population has changed. The new Ukrainian migration is far more diverse with regard to specific
localities in Ukraine. Students, business persons and professionals come from big cities (like Kiev and
Lviv) and also from Eastern Ukraine (e.g. Donetsk).
Map 7: Ternopilska oblast.
The research conducted by Bilan et al. (2010) showed that one particular region in Western Ukraine has
been a traditional area of emigration to the West (Bilan et al. 2010, p. 10, cf. Map 7) – Ternopilska
oblast. Since 1995 the balance of migration in this region has been negative, and is also constantly
decreasing due to negative fertility rates and natural population decrease (Bilan et al. 2010, p. 10).
Labour migration became a crucial factor of socio-economic transformation and an efficient tool in the
regulation of the labour force. Over the last decade, labour emigration has taken on a global character in
Ukraine. Among emigrants from Ternopilska oblast, there is a significant number who leave for seasonal
work – mostly bound for Poland, the Czech Republic, and the Russian Federation – but also for the UK
(Bilan et al. 2010, p. 10). The identification of this specific locality in Ukraine arises from the scoping
study; however it would be useful to confront this conclusion in Phase 2 (in-depth interviews).
As for the destination of the new wave of Ukrainian migrants in the UK, London is the place of greatest
clustering (cf. IOM 2007; Bloch et al. 2009). With regard to where in London, Map 8 presents the

32 The Evolution of Ukrainian Migration to the UK (THEMIS Scoping Study)
clustering of Ukrainians (classified as Other Eastern Europeans) in the Greater London Area, based on
names and addresses of all adults entitled to vote (2001–2006).9
Of course this does not reflect the number of undocumented Ukrainian migrants; however, the
experience of researchers working on the social and economic lives of young undocumented migrants in
Britain (Bloch et al. 2009) seems to suggest that this specific Ukrainian community proved to be much
easier to make contact with in London than elsewhere.10 The interviewers were largely recruited
through snowball sampling either among interviewer’s contacts, or through online social networks
(odnoklasniki.ru), the Ukrainian Orthodox Church, and the Ukrainian Migrant Network (Bloch et al. 2009,
p. 118).
9 www.londonprofiler.org has been prepared by the Centre for Advanced Spatial Analysis (UCL). The source of
peoples’ names used in this atlas is the UK Electoral Register; the version used here is a running cumulative register from 2001 to 2006. It is based on an innovative technique to classify populations through the origin of their forenames and surnames as a proxy for their probable ethnicity. UCL has developed its own classification of names according to their cultural, ethnic and linguistic origin, termed Onomap.
10 Bloch et al. (2009) demonstrate that there were however practical difficulties in accessing the interviewers.
Researchers with language skills found, however, that people were very protective about their identity and even when contacted did not want to participate in a formal interview.

33 The Evolution of Ukrainian Migration to the UK (THEMIS Scoping Study)
Map 8: Ukrainians (Other Eastern Europeans) in London, 200 –2006. Source: www.londonprofiler.org

34 The Evolution of Ukrainian Migration to the UK (THEMIS Scoping Study)
6. Assessment and Identification of Issues to be Explored
in Phase 2
While the case of Ukrainian migrants in the UK does not constitute an exact fit within the THEMIS
theoretical categories, and lacks quantitative data prior to 1991 (with the exception of the EVW figures),
it nevertheless presents an interesting case for further exploration:
It challenges the clear-cut categories of the ideal type of migration system (starter,
established, declining, etc.) – Why do Ukrainians perceive themselves as a declining community,
when the figures suggest otherwise? What does it say about the role of the pioneers – aren’t
they wave-specific? What does it say about the relationship between the ‘old’ (post-Second
World War) and the ‘new’ (post-1991) migrations? What, in this context, does ‘Ukrainian
migration system’ mean? Doesn’t the holistic picture simplify things too much?
Ukrainian migration to the UK was abruptly stopped in the late 1940s, with the Cold War and
the establishment of the Ukrainian Socialist Republic as part of the USSR, despite the settlement
of a relatively large population of Ukrainians in the UK between 1946 and 1951. What does this
say about the meaningful employment of the ‘migration threshold’ concept in explaining the
development of a migration system? What is therefore the relationship between the internal and
contextual feedback mechanisms? What does it say about the role of Ukrainian migrant
networks?
Studying Ukrainian migration to the UK equally makes the well-defined migration categories
(refugee, migrant worker, and student) more ambiguous – Who were the post-Second World
War Ukrainian migrants to the UK? Were they workers? Were they refugees? How did they
identify themselves, and why? Who are the newcomers? Are they really largely irregular?
Perhaps their legal status should not be considered in black and white categories (legal-illegal),
but denote various other shades of grey? What does it say about the Ukrainian migrants’ agency
vis-à-vis state legal frameworks?
Ukrainians in the UK are an understudied migrant group (in contrast to Indians, Bangladeshis
and Moroccans), and the project was welcomed with interest by the Ukrainian organisation
representatives who were interviewed for the scoping study.
The qualitative, in-depth analysis could cast more light on the picture, explaining the different trends –
escaping the clear-cut categories – of Ukrainian migration to the UK.

35 The Evolution of Ukrainian Migration to the UK (THEMIS Scoping Study)
Bibliography
Armstrong, J.A. (1963) Ukrainian Nationalism, New York: Columbia University Press
AUGB (2010) Association of Ukrainians in Great Britain: A Brief History, AUGB website: www.augb.co.uk/a-brief-history.php
Bilan, Y., Lapshyna, I., Vdovtsova, S. and Vollmer, B. (2010) ‘Ukraine: Justification of Selection of Regions’, EUMAGINE Project Paper, Centre of Sociological Research (Ukraine)
Bloch, A., Sigona, N., and Zetter, R. (2009) No Right to Dream. The social and economic lives of young undocumented migrants in Britain, London and Oxford: City University London, Refugee Studies Centre
Cipko, S. (2006) ‘Contemporary migration from Ukraine’, in IOM (ed.) Migration Perspectives: Eastern Europe and Central Asia, London: IOM
Cohen, R. (1997) Global Diasporas: An Introduction. London: University College London Press
Dench, S., Hurstfield, J., Hill, D. and Akroyd, K. (2006) ‘Employers’ Use of Migrant Labour, Summary Report’, Home Office Online Report 03/06
Düvell, F. (2006) ‘Ukraine – Europe’s Mexico?’, Research Resources Report 1/3: Country Profile, COMPAS, University of Oxford
Home Office (1993) Control of Immigration Statistics, http://rds.homeoffice.gov.uk/rds/immigration-asylum-publications.html
Home Office (1998) ‘Fairer, Faster and Firmer: A Modern Approach to Immigration and Asylum’, London: Home Office
Home Office (2002) ‘Secure Borders, Safe Havens: Immigration with Diversity in Modern Britain’, London: Home Office
Home Office (2005a) ‘Asylum Statistics United Kingdom’, HOSB 14/06, pp.34, 39 Immigration, Asylum and Nationality Bill. Tech. rep., UK Home Office, London.
Home Office (2005b) ‘Controlling our Borders: Making Migration Work for Britian’, London: Home Office
Home Office (2005c) ‘Selective Admission: Making Migration Work for Britain’, London: Home Office
Home Office (2005d) ‘Illegal Working Taskforce Regulatory Impact Assessment’
Home Office (2006) ‘A Points-Based System: Making Migration Work for Britian’, London: Home Office
Home Office (2008) ‘Enforcing the Deal: Our Plans for Enforcing the Immigration Laws in the United Kingdom’s Communities’, London: Home Office
IOM (2007) ‘Ukraine – London. Mapping Exercise, August 2007’, London: IOM
Kay, D. and Miles, R. (1988) ‘Refugees or Migrant Workers? The Case of the European Volunteer Workers in Britain (1946–1951)’, Journal of Refugee Studies 1: 3 / 4
Kay, D. and Miles, R. (1992) Refugees or Migrant Workers: European Voluneer Workers in Britain, London: Routledge
Keryk, M. (2004) ‘Labour Migrant: Our Savior or Betrayer?’, Ukrainian discussions concerning labour migration, www.migrationonline.cz/article_f.shtml?x=200479

36 The Evolution of Ukrainian Migration to the UK (THEMIS Scoping Study)
Kyambi, S. (2005) ‘Beyond Black and White: Mapping New Immigrant Communities’, Southampton: IPPR
Logusz, Michael O. (1997) Galicia Division: The Waffen-SS 14th Grenadier Division, 1943–1945, Altglen, Pennsylvania: Schiffer Military History
Macdonald, Ian A. and Toal, R. (2010) Macdonald’s Immigration Law and Practice, London: Lexis Nexis UK
Malynovska, O. (2006) Caught Between East and West, Ukraine Struggles with Its Migration Policy, National Institute for International Security Problems, Kyiv: MPI, www.migrationinformation.org/Profiles/display.cfm?ID=365
North, D. (1990) Institutions, Institutional Change and Economic Performance, Cambridge: Cambridge University Press
Pirozhkov, S. (2006) Trends in Ukrainian Migration and Short-term Work Trips, Kiev: National Institute of Strategic Studies of the Presidency of Ukraine
Pellegrino, A. (2004) Migration from Latin America to Europe: Trends and Policy Challenges. IOM Working Paper, University of the Republic of Urugway
Somerville, W. (2007) Immigration Under New Labour, Bristol: The Policy Press
Tannahill, J. A. (1958) European Volunteer Workers in Britain, Manchester: Manchester University Press
UKBA (2010) ‘Working in the UK’, www.ukba.homeoffice.gov.uk/workingintheuk/
Wnuk-Lipinski, E. (1991) ‘Polish society after the communist experiment’, in R.R. George Blazyna, ed., Poland into the 1990s: Economy and Society in Transition, London: Printer Publishers
World Bank (2009) ‘Migrant Remittance Flows: Findings from a Global Survey of Central Banks’, World Bank, http://econ.worldbank.org/WBSITE/EXTERNAL/EXTDEC/EXTDECPROSPECTS/0,,contentMDK:21121930~menuPK:3145470~pagePK:64165401~piPK:64165026~theSitePK:476883,00.html

37 The Evolution of Ukrainian Migration to the UK (THEMIS Scoping Study)
Theorizing the Evolution of European Migration Systems (THEMIS) is a four-year project looking at the
way in which patterns of migration to Europe develop. The project is co-ordinated by the International
Migration Institute (Robin Cohen), with project partners at the International Peace Research Institute
(PRIO) in Norway (Cindy Horst), the Institute of Geography and Spatial Planning in Lisbon (Maria Lucinda
Fonseca), and the Department of Sociology at Erasmus University in Rotterdam (Godfried Engbersen).
THEMIS is funded by the NORFACE (New Opportunities for Research Funding Agency Co-operation in
Europe) research programme on Migration in Europe - Social, Economic, Cultural and Policy Dynamics.
The International Migration Institute is a member of the Oxford Martin School at Oxford University, and
recently received additional funding from Dr James Martin (founder of the School) to match the grant
from NORFACE.
The views expressed here are those of the author(s). They are not necessarily those of the THEMIS project or NORFACE.
For general enquiries or if you wish to receive updates on the THEMIS project, please contact us: T: +44 (0)1865 281745 / E: [email protected] / W: www.imi.ox.ac.uk/research-projects/themis

Appendix 5THEMIS – Metadata Phase 1
Appendix 5: between-country comparable indicators (Brazil, Morocco and
Ukraine)
Ukraine Morocco Brazil
Surface area (sq. km) 603,550 446,550 8,514,880
Population (Total) (2012) 45,593,300 32,521,143 198,656,019
Income level - World BankClassification Lower middle Lower middle Upper middle
Urban population (% of total) (2012) 69.08 57.41 84.87
Population density (people per sq. km)(2011) 78.90 71.83 23.28
Fertility rate (births per woman) (2011) 1.46 2.65 1.82
Death rate (per 1000 people) (2011) 14.50 6.34 6.41
Infant mortality rate (per 1,000 livebirths) (2012) 9.2 26.8 12.9
Life expectancy at birth, total (years)(2011) 70.81 70.41 73.35
Literacy total 99.71 (2010) 56.08 (2009) 90.30 (2009)
Literacy (male/female) 99.8%/99.6% (2010) 68.9%/43.9% (2009) 90.2%/90.4% (2009)
Table 1 - Country level data4
Ukraine Morocco Brazil
GDP (2012) USD176.3 billion USD95.98 billion USD2.,253 trillion
GDP per capita (current USUSD) (2012) 3,867.02 2,902.33 11,339.52
Unemployment, total (% of total labour force) 7.9% (2011) 8.9% (2011) 8.3% (2009)
Unemployment, youth total (% of total labour force
ages 15-24) 18.60 (2011) 17.90 (2011) 17.80 (2009)
Unemployment Rate (male/female) 8.8%/6.8% (2011) 8.4%/10.2% (2011) 6.1%/11% (2009)
Net migration (2012) -450,000 -450,000 -190,000
Personal remittances, received (current USUSD)
(2011) 7,822,000,000 7,256,318,198 2,798,456,999
Remittances as % of GDP (2011) 4.79 7.31 0.11
HDI (2012) 0.74 0.591 0.73
Gini index 25.62 (2010) 40.88 (2007) 54.69 (2009)
Table 1 - Country level data (part 2)
4Country level data is the most up to date information available at the time of writing and is taken from the
World Bank, apart from HDI data which is taken from the UNDP

Longitudinal trends (SourceWorld Bank)
Figure 1 - Population (in millions)
Figure 2 - Urban population (% of total)
Figure 3 - Population density (people per sq. km of land area)
0
50
100
150
200
2501
96
1
19
63
19
65
19
67
19
69
19
71
19
73
19
75
19
77
19
79
19
81
19
83
19
85
19
87
19
89
19
91
19
93
19
95
19
97
19
99
20
01
20
03
20
05
20
07
20
09
20
11
Brazil
Morocco
Ukraine
0
10
20
30
40
50
60
70
80
90
19
61
19
63
19
65
19
67
19
69
19
71
19
73
19
75
19
77
19
79
19
81
19
83
19
85
19
87
19
89
19
91
19
93
19
95
19
97
19
99
20
01
20
03
20
05
20
07
20
09
20
11
Brazil
Morocco
Ukraine
0
10
20
30
40
50
60
70
80
90
100
19
61
19
63
19
65
19
67
19
69
19
71
19
73
19
75
19
77
19
79
19
81
19
83
19
85
19
87
19
89
19
91
19
93
19
95
19
97
19
99
20
01
20
03
20
05
20
07
20
09
20
11
Brazil
Morocco
Ukraine

Figure 4 - Crude birth rate (per 1,000 people)
Figure 5 - Fertility rate, total (births per woman)
Figure 6 - Crude death rate (per 1,000 people)
0
10
20
30
40
50
60
19
61
19
63
19
65
19
67
19
69
19
71
19
73
19
75
19
77
19
79
19
81
19
83
19
85
19
87
19
89
19
91
19
93
19
95
19
97
19
99
20
01
20
03
20
05
20
07
20
09
20
11
Brazil
Morocco
Ukraine
0
1
2
3
4
5
6
7
8
19
61
19
63
19
65
19
67
19
69
19
71
19
73
19
75
19
77
19
79
19
81
19
83
19
85
19
87
19
89
19
91
19
93
19
95
19
97
19
99
20
01
20
03
20
05
20
07
20
09
20
11
Morocco
Ukraine
Brazil
0
2
4
6
8
10
12
14
16
18
20
19
61
19
63
19
65
19
67
19
69
19
71
19
73
19
75
19
77
19
79
19
81
19
83
19
85
19
87
19
89
19
91
19
93
19
95
19
97
19
99
20
01
20
03
20
05
20
07
20
09
20
11
Brazil
Morocco
Ukraine

Figure 7 - Infant mortality rate (per 1,000 live births)
Figure 8 - GDP per capita (current USUSD)
0
20
40
60
80
100
120
140
160
19
61
19
63
19
65
19
67
19
69
19
71
19
73
19
75
19
77
19
79
19
81
19
83
19
85
19
87
19
89
19
91
19
93
19
95
19
97
19
99
20
01
20
03
20
05
20
07
20
09
20
11
Brazil
Morocco
Ukraine
0
2000
4000
6000
8000
10000
12000
14000
19
61
19
63
19
65
19
67
19
69
19
71
19
73
19
75
19
77
19
79
19
81
19
83
19
85
19
87
19
89
19
91
19
93
19
95
19
97
19
99
20
01
20
03
20
05
20
07
20
09
20
11
Brazil
Morocco
Ukraine
0
1000
2000
3000
4000
5000
6000
7000
19
61
19
63
19
65
19
67
19
69
19
71
19
73
19
75
19
77
19
79
19
81
19
83
19
85
19
87
19
89
19
91
19
93
19
95
19
97
19
99
20
01
20
03
20
05
20
07
20
09
20
11
Brazil
Morocco
Ukraine

Figure 1 - GDP per capita (constant 2005 USUSD)
Figure 10 - Unemployment, total (% of total labour force)
Figure 11- Net migration
Figure 12 - Personal remittances received (% of GDP)
0
5
10
15
20
25
Brazil
Morocco
Ukraine
-1000000
-800000
-600000
-400000
-200000
0
200000
400000
600000
1962 1967 1972 1977 1982 1987 1992 1997 2002 2007 2012Brazil
Morocco
Ukraine
0
1
2
3
4
5
6
7
8
9
10
Brazil
Morocco
Ukraine
Top Related
Copyright © 2022 FDOKUMEN

