


Bahasa
Halaman
Hukum


1
Author: Smoot, Jennifer A. Title: Measuring Intercultural Sensitivity within a Company’s Organizational
Structure Utilizing The Development Model of Intercultural Sensitivity The accompanying research report is submitted to the University of Wisconsin-Stout,
Graduate School in partial completion of the requirements for the
Graduate Degree/ Major: MS Technical and Professional Communications
Research Advisor: Joleen Hanson, Ph.D.
Submission Term/Year: Fall 2017
Number of Pages: 91
Style Manual Used: American Psychological Association, 6th edition I have adhered to the Graduate School Research Guide and have proofread my work. I understand that this research report must be officially approved by the Graduate School.
Additionally, by signing and submitting this form, I (the author(s) or copyright owner) grant the University of Wisconsin-Stout the non-exclusive right to reproduce, translate, and/or distribute this submission (including abstract) worldwide in print and electronic format and in any medium, including but not limited to audio or video. If my research includes proprietary information, an agreement has been made between myself, the company, and the University to submit a thesis that meets course-specific learning outcomes and CAN be published. There will be no exceptions to this permission.
I attest that the research report is my original work (that any copyrightable materials have been used with the permission of the original authors), and as such, it is automatically protected by the laws, rules, and regulations of the U.S. Copyright Office.
My research advisor has approved the content and quality of this paper. STUDENT:
NAME: Jennifer Smoot DATE: 8-23-17
ADVISOR: (Committee Chair if MS Plan A or EdS Thesis or Field Project/Problem):
NAME: Joleen R. Hanson, Ph. D. DATE: 2 Dec 2017
This section for MS Plan A Thesis or EdS Thesis/Field Project papers only Committee members (other than your advisor who is listed in the section above) 1. CMTE MEMBER’S NAME: Marya L. Wilson, Ph. D. DATE: 26 Sept 2017
2. CMTE MEMBER’S NAME: Daniel Ruefman, Ph. D. DATE: 26 Sept 2017
3. CMTE MEMBER’S NAME: DATE:
--------------------------------------------------------------------------------------------------------------------- This section to be completed by the Graduate School This final research report has been approved by the Graduate School.
Director, Office of Graduate Studies: DATE:

2
Smoot, Jennifer A. Measuring Intercultural Sensitivity within a Company’s Organizational
Structure Utilizing the Development Model of Intercultural Sensitivity
Abstract
In a fast-paced world of constantly emerging new technologies, it has become easier for
companies of all sizes to venture into the world of international business, whether they have the
knowledge and skills to succeed or not. Recognizing that many American businesses have some
level of ethnocentrism (or lack of intercultural sensitivity) in their corporate culture that can be
detrimental to a company’s international growth, it would be beneficial for a company to
recognize and eliminate or at least minimize their ethnocentric attitudes.
To examine these attitudes, this thesis surveyed 326 employees from an international
food company using research based from Milton J. Bennett’s Development Model of
Intercultural Sensitivity to look at the levels of ethnocentrism within their hierarchal structure.
The results suggest that there are areas where the company can improve the level of intercultural
sensitivity amongst all hierarchal levels and that time and international experience are the best
indicators for levels of intercultural sensitivity. Mitigating intercultural risk both from an
employee perspective and from a business perspective is key to the success of a company’s goals
for international or global growth.

3
Acknowledgments
I would like to thank my husband, Chip, and my kids, Charlie, Tim and Hannah for their
support and encouragement in working towards my master’s degree and, in particular, during the
writing of this thesis. I absolutely need to thank my advisor Joleen Hanson for encouraging and
teaching me along the way how to be a researcher. Your teaching skills helped me make this
thesis one I am proud to put my name on. It took a little longer than expected but it is done!
Finally, thank you to UW Stout for offering this master’s program online and supporting the
students in your distance education programs. Not everyone is within driving distance of a
University with the program/degree you desire. I would not have reached this major life goal
without this opportunity.

4
Table of Contents
Abstract ........................................................................................................................................... 2
List of Tables .................................................................................................................................. 6
List of Figures ................................................................................................................................. 7
Chapter I: Introduction .................................................................................................................... 8
Statement of Problem .......................................................................................................... 9
Research Questions ........................................................................................................... 15
Purpose of the Study ......................................................................................................... 15
Assumptions of the Study ................................................................................................. 16
Definition of Terms........................................................................................................... 16
Limitations of the Study.................................................................................................... 18
Methodology ..................................................................................................................... 19
Chapter II: Literature Review ....................................................................................................... 21
Globalization ..................................................................................................................... 21
Cross Cultural Risk ........................................................................................................... 22
Understanding Ethnocentrism ........................................................................................... 24
Measuring Ethnocentrism ................................................................................................. 26
Similar Research ............................................................................................................... 28
Chapter III: Methodology ............................................................................................................ 31
Subject Selection and Description .................................................................................... 31
Instrumentation ................................................................................................................. 33
Data Collection Procedures ............................................................................................... 35
Data Analysis .................................................................................................................... 36

5
Limitations ........................................................................................................................ 37
Chapter IV: Results ....................................................................................................................... 38
Survey Data Analysis ........................................................................................................ 38
Interview Analysis Including a Comparison to Survey Data............................................ 47
Chapter V: Discussion, Conclusion and Recommendations......................................................... 63
Discussion ......................................................................................................................... 63
Conclusions ....................................................................................................................... 72
Recommendations ............................................................................................................. 75
References ..................................................................................................................................... 77
Appendix A: Denial Means and Percentage of Scores 4 or Above .............................................. 80
Appendix B: Defense Means and Percentage of Scores 4 or Above ............................................ 81
Appendix C: Minimization Means and Percentage of Scores 4 or Above ................................... 82
Appendix D: Acceptance Means and Percentage of Scores 4 or Above ...................................... 83
Appendix E: Adaptation Means and Percentage of Scores 4 or Above ....................................... 84
Appendix F: Integration Means and Percentage of Scores 4 or Above ........................................ 85
Appendix G: Survey Questions .................................................................................................... 86
Appendix H: Interview Questions ................................................................................................ 90
Appendix I: Interview Questions from Hammer, M.R. et al (2003)............................................. 91

6
List of Tables
Table 1: Ethnocentric Definitions - Inexperience ..........................................................................25
Table 2: Ethnocentric Definitions - Any Two Countries ...............................................................25
Table 3: Ethnocentric Definitions - Us Versus Them ....................................................................26
Table 4: Time Spent Working with Company Partners Outside of their Home Country ..............40
Table 5: Number of Potential Participants by Hierarchal Level ....................................................40
Table 6: Statistically Significant Differences when Comparing "First Language" .......................44
Table 7: Statistics Based on Time Spent Living Outside of Home Country .................................47
Table 8: Number of Years Working at The Company ...................................................................48
Table 9: Hours Spent Working with Partners Outside of Their Home Country ............................48
Table 10: Survey Scores Compared to Interviews: Denial Stage ..................................................50
Table 11: Leadership and International Work Experience Comparing Interview to Survey:
Defense ..............................................................................................................................53
Table 12: Leadership and International Work Experience Comparing Interview to Survey:
Minimization ......................................................................................................................55
Table 13: Leadership and International Work Experience Comparing Interview to Survey:
Acceptance .........................................................................................................................57
Table 14: Leadershi pand International Work Experience Comparing Interview to Survey:
Adaptation ..........................................................................................................................59
Table 15: Leadership and International Work Experience Comparing Interview to Survey:
Integration ..........................................................................................................................60
Table 16: Comparing International Experience and Language Experience to the DMIS Levels ..62

7
List of Figures
Figure 1: Length of Time Employed by The Company Based on Hierarchal Levels ...................39
Figure 2: Means for Hierarchal Levels Within The Company. .....................................................43
Figure 3: Means Based on First Language ....................................................................................45
Figure 4: Means for Time Spent Living Outside of Home Country ..............................................46

8
Chapter I: Introduction
The business world of today is one of constant change. There are many different
components to this change, including international business opportunities, but the dramatic
increase in the use of technology to communicate, especially internet usage, over the last fifteen
to twenty years allows businesses to reach further across the globe for less money and time than
ever before (Popescul, 2009). A few words typed into a search engine can bring a wealth of
information and knowledge never accessible before, especially information about doing business
in other countries. International markets, once only open to large companies with deep pockets,
are now accessible to companies as small as one person. A meeting that only a few years ago
would have meant airfare, hotel costs, and many days away from the office to meet, can now
happen through video conferencing in an hour. Even social media platforms, such as LinkedIn,
make reaching out to potential business partners faster and easier.
To understand how much has changed both in the impact of burgeoning international
markets and increased technology opportunities, we will look at several areas. One indicator is
the governmental statistic for the United States (US) Exports of Goods and Services (Trading
Economics, 2016). As the name implies, this is the value of goods and services exported by U.S.
companies to other countries. The dollar amounts went from a record low of $772 Million in
March of 1950 to a record high of more than $2 Trillion in October of 2014, an increase of more
than 25,000%. This increase was relatively slow until 1985 and has climbed steadily since, with
a few sharp spikes in 1998, 2007 and 2014. Coincidentally, the Internet (World Wide Web) as
we know it, was open to the public in 1993 with 36% of American adults using it by 1998, 73 %
in 2007 and 87% in 2014 (Pew Research Center, 2014). At the same time, the percentage of
American adults with access to high speed internet (versus using dial-up modems) increased to

9
67% by 2015 (Pew Research Center, 2015). Finally, education and research around this
globalization movement has also increased. The last fifteen years show a dramatic increase in
searchable scholarship using the terms “Intercultural Sensitivity” or “Global Competency” two
terms you will see throughout this thesis. A search in Google Scholar and the UW-Stout Library
for the term “Intercultural Sensitivity” increased 1342% and 802% respectively for items
published between 1900-2000 versus 2001-2016. The search for the term “Global Competency”
in published works increased 1900% on Google Scholar and 805% from the UW-Stout Library
for the same periods of time.
The items listed above are just a few of many different factors in play around the same
time as a result of globalization efforts. Those in the field of Technical and Professional
Communications are in an important position in this movement and must stay on top of all the
changes to stay current. Increased interaction with companies outside of the U.S. creates an
increased need for strong intercultural communications skills with an emphasis in intercultural
sensitivity or global competence (Olson & Kroeger, 2001).
Statement of Problem
Miscommunication is likely to happen when a company first begins to work outside their
home country. As stated earlier, technology allows for easier access to the international markets
for less time and money than in years past. Therefore, there is a good chance companies are not
as experienced in international business when they start and most likely have not built up strong
international communication skills at the outset. Some communication adjustments are relatively
simple, but the company needs to be aware that they need to make the changes in the first place.
The following examples show a few common problem areas that can make a big impact on
communication when acknowledged. If you sit back and just listen to normal, everyday

10
conversation here in the U.S. you will likely hear phrases such as “Don’t drop the ball,” or, “I am
between a rock and a hard place,” or, “Those are a dime a dozen.” Analogies, idioms and
metaphors are very common in our language, especially sports related ones. One that I personally
use all the time and did not realize was related to sports is “hands down” (this term comes from
horse racing when a jockey is so far ahead he can relax the reigns and drop his hands down).
Some of these are such a part of our language (or even culture, when we are talking about sports)
that we have no problem understanding what the speaker means. On the other hand, if you are
from China and English is not your first language, you may not understand what your business
partner is trying to say. You may even take offense at the phrase because when you mentally
translate it, it means something inappropriate in your language. Literal language is key when
communicating with those using English as a lingua franca (ELF).
Another common communication problem for ELF in our country, as well as many
others, are multiple words with the same meaning: Fall vs Autumn; couch vs sofa; dog vs canine;
strong can be stable, secure, solid, tough. Some vocabulary is also hard to translate into other
languages. When writing emails, important documents or even technical documents that are
going to be used in other countries but not translated, it is very important to be consistent in your
terminology and to be careful about getting overly wordy, which can easily confuse those who
use ELF.
There are also verbal communications issues for ELF. Anyone with at least a little bit of
experience speaking in another language has probably had the chance to listen to a native
speaker in that language. If they talk slowly in their language, you can generally follow or get
the general idea of the conversation. If you hear them speak at their normal pace, you may find it
hard to grasp anything they are saying. This is no different in the business world.
11
Communicating at a slower pace, one that matches the language skills of the person you are
speaking with, can help ease language miscommunications associated with ELF.
These examples may seem like common sense but in a company without international
experience coming from a strong English language background, these mistakes are common. In
my personal experience educating a company making similar mistakes, they were surprised how
a simple change in thought could make a large impact. It made sense to them once they were
made aware of why they should make the changes.
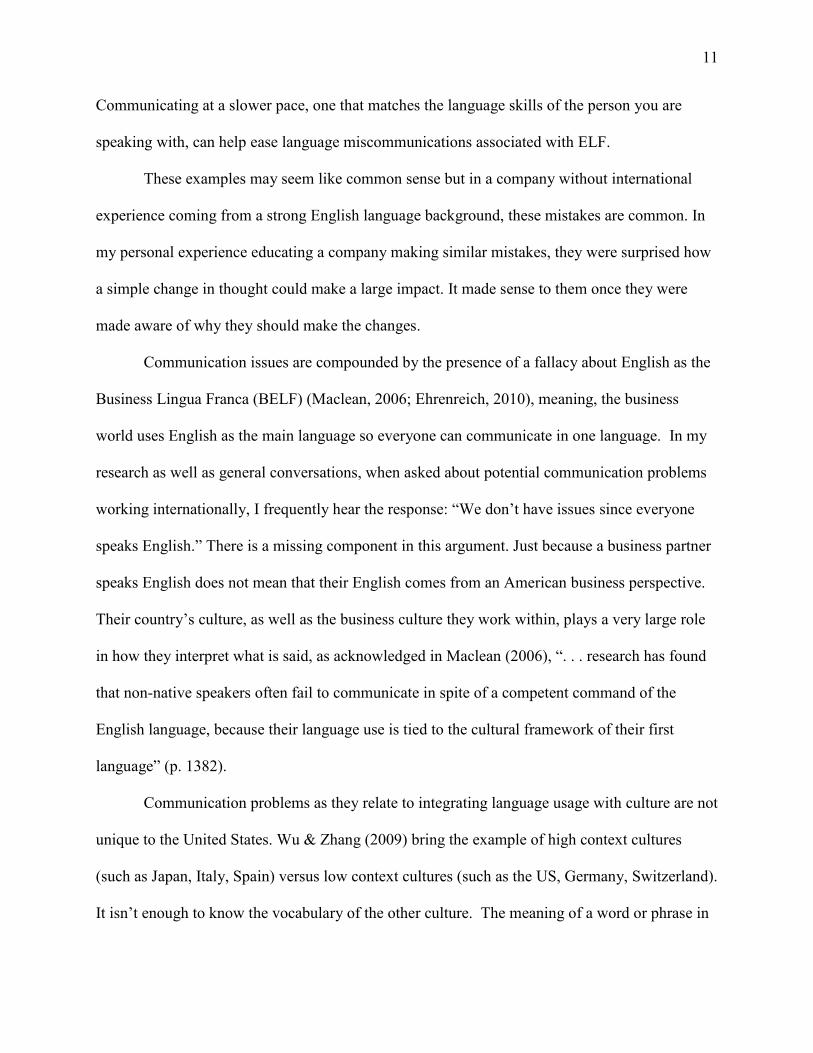
Communication issues are compounded by the presence of a fallacy about English as the
Business Lingua Franca (BELF) (Maclean, 2006; Ehrenreich, 2010), meaning, the business
world uses English as the main language so everyone can communicate in one language. In my
research as well as general conversations, when asked about potential communication problems
working internationally, I frequently hear the response: “We don’t have issues since everyone
speaks English.” There is a missing component in this argument. Just because a business partner
speaks English does not mean that their English comes from an American business perspective.
Their country’s culture, as well as the business culture they work within, plays a very large role
in how they interpret what is said, as acknowledged in Maclean (2006), “. . . research has found
that non-native speakers often fail to communicate in spite of a competent command of the
English language, because their language use is tied to the cultural framework of their first
language” (p. 1382).
Communication problems as they relate to integrating language usage with culture are not
unique to the United States. Wu & Zhang (2009) bring the example of high context cultures
(such as Japan, Italy, Spain) versus low context cultures (such as the US, Germany, Switzerland).
It isn’t enough to know the vocabulary of the other culture. The meaning of a word or phrase in

12
a high context culture has just as much to do with how it was said, the context of it, as it does a
direct translation of the word. The example earlier was several words having the same meaning.
In this case, it would be one word having several meaning and context is vital to the end
meaning: “In some intercultural business negotiations, when the American partner thinks it will
become a deal, the Japanese partner is expressing refusal indirectly” (Wu & Zhang, 2009, p. 4).
The common occurrence of this language and culture barrier is, as many researchers agree, due
to a lack of experience or a lack of acknowledgement of cross-cultural issues in communication.
This attitude is what researchers consider “Ethnocentrism”, a phase within the intercultural
sensitivity realm.
Ethnocentrism has been defined by numerous researchers. For the purposes of this
research the focus will be on two definitions: Leininger & Yuan (1988) definition, “Expecting
the many to accommodate the few” (p. 20); and Bennett’s (2004) definition, “the experience of
one’s own culture as ‘central to reality’ . . . the beliefs and behaviors that people receive in their
primary socialization are unquestioned; they are experienced as ‘just the way things are’” (p. 62).
In my own personal observations, while working at a small manufacturing company that was
new to international markets, I noticed that even within one company an observer can find
different levels of ethnocentrism between upper level management and those lower on the
organizational chart. In this case, upper management did not feel language or culture was a
potential block to growth and development. This was very tied into the assumption of BELF.
Everyone they communicated with (generally fellow upper level management partners) did
speak English. On the other hand, the U.S. employees working the help desk and the U.S. tech
writers creating the manuals for their products had very different experiences. They were
working directly with the off-shore technicians installing the equipment. The technical

13
documents were not translated into any other language, nor were they optimized for anyone
outside of the United States to use. Therefore, the help desk employees not only had language
barriers but were also trying to explain complicated technical directions without any international
communication training. They noticed communication problems on a daily basis.
Not only can ethnocentrism affect the way a company from the United States deals with
its international partners, but if those higher up in the organization don’t recognize their
ethnocentric behavior, and those lower down the organizational chart experience the effect of
lack of recognition on a daily basis, this can cause internal strife within an organization.
Through these observations and further course work, I developed a strong interest in
intercultural sensitivity, ethnocentrism and, in particular, the use of the Development Model of
Intercultural Sensitivity (DMIS) created by Milton Bennet (Bennet, 2004). The DMIS describes
a six-stage journey from the most ethnocentric “Denial of cultural differences” to the opposite
end of the scale (what Bennett calls the “ethnorelativism” side) “Integration of cultural
difference into identity”. As a business woman with a personal focus on how to help companies
grow, especially new companies, I resonate strongly with Bennett’s reason for creating the
DMIS: “I wanted to explain why some people seemed to get a lot better at communicating across
cultural boundaries while other people didn’t improve at all, and I thought that if I were able to
explain why this happened trainers and educators could do a better job of preparing people for
cross cultural encounters” (Bennet, 2004, p. 62).
Without strong communication practices, American businesses will struggle to get ahead
in any market, much less an international one. It is true that there seem to be many large
companies based in the United States that appear to have mastered the art of communication in
all areas and at all levels (Proctor and Gamble, Kimberly Clark, Coca-Cola, Pepsi, etc.). They

14
have had an international side to their business for many decades and have systems and methods
that work for them when doing business in many different parts of the world. How about other
companies just starting to venture into the international market with their products? While going
through a learning curve is an important part of the process of growing as a company, some
“learning” situations have pitfalls that are too great to overcome for an inexperienced
international business. Is there a way to help a company just starting out avoid learning by trial
and error? Professional and technical communicators often have roles as members of teams that
work within several areas, and different levels of the organizational chart of a company,
including project management, internal communications, marketing, sales or even design teams.
With their specialized background in communications, they are in a prime position to recognize
and help solve communication issues such as ethnocentrism. Even better, if they were trained on
specific tools that would help them both in their own educational process but also allow them to
educate those in their company, they could potentially escalate their own company’s venture into
international markets with less risk of failure as far as culture and communications are
concerned.
Recognizing that many American businesses have some level of ethnocentrism in their
corporate culture and that, depending on how ethnocentric a company is, it can be detrimental to
that company’s growth internationally, it would be beneficial to a company to eliminate (or at
least minimize) the ethnocentric attitudes. If a company recognizes their level of ethnocentrism
early on, it would be reasonable to project that the learning curve involved in becoming an
international/multi-national/global company will be shorter and harmful missteps as they relate
to intercultural communication can be avoided.

15
Research Questions
This thesis will examine the following research questions:
1. Will drawing on Milton Bennett’s 6-stage Development Model of Intercultural
Sensitivity (DMIS) to measure the levels of ethnocentrism within an American
company doing business outside of the United States show multiple stages of
ethnocentrism between employees at different hierarchal levels within the company?
2. If the first language of the employee is not English, will there be a significant
difference between the six stages of the DMIS categories of denial, defense,
minimization, acceptance, adaptation or integration compared to those who speak
English as their first language?
3. Will a comparison of length of time an employee has lived outside of the United State
show a significant difference between the six stages of the DMIS categories of denial,
defense, minimization, acceptance, adaptation or integration?
Purpose of the Study
The purpose of this study is to determine if there are different levels of ethnocentrism
within one company’s hierarchal organization. Since this research specifically looks at
ethnocentrism from an Intercultural Sensitivity point of view it was important to research a
company that does business internationally. It was also important to select a company that is
large enough to have enough employees at different hierarchal levels of their organizational chart
to get an appropriate sample size. The company chosen for this research project was a private
label food company headquartered in Wisconsin with more than 7000 employees worldwide. An
electronic Qualtrics survey was sent out to 1129 employees located in the United States and
Spain. This survey gathered information to get a baseline idea of where individuals fall within

16
their employment level on the DMIS scale. Finally, follow-up interviews were conducted with
ten of the survey participants.
Assumptions of the Study
Several assumptions were made when doing this research:
1. Honesty and truthfulness from the survey and interview participants in answering the
questions
2. Ethnocentrism can be an unconscious bias. It is not an intentional approach when
doing business internationally.
3. Ethnocentrism can be hard to measure without a tool such as the DMIS so it is
generally not a focus point for many companies.
Definition of Terms
There are several terms that will be used throughout this paper. The following are the
definitions of those terms:
Business culture. Every company, no matter the size, industry or location, has a distinct
look and feel to the way they do business. They may have a very casual environment (dress
requirement, look of the work environment, even the attitudes of those in the company) or very
formal. There may be a lot of people milling about or a very quiet, strict work-focused
environment. These traits are what make up the business culture of a company on the surface.
Business culture can go deeper as well. It can be the mission statement and how closely it is
followed. It can be the internal ethics of how the company requires its employees to conduct
business or how it perceives the growth of its employees. The business culture is typically
similar throughout the company even if they are spread out through numerous locations. It can
both benefit and hurt the company based on how well it is perceived by the employees. Business

17
Culture is what makes two companies distinctive from each other even if they are manufacturing
and selling the same product in the same market.
Business English as a lingua franca (BELF). This term references the fact that English
is the common language for doing business in a country that does not use English as its primary
language.
Cross cultural communication/intercultural communication. According to Baraldi
(2006) “communication is intercultural when different cultural perspectives prevent the creation
of a single, shared culture” (p. 54).
Development model of intercultural sensitivity (DMIS). This is the model created by
Milton J. Bennet to measure ethnocentrism within an organization: “. . . it is a model of changes
in worldview structure, where the observable behavior and self-reported attitudes at each stage
are indicative of the state the underlying worldview” (Hammer et al., 2003, p. 423). The model
includes six levels: Denial, defense, minimization, acceptance, adaptation, integration
Ethnocentrism. There are numerous different definitions (see p. 25 of this paper for a
complete list). Bennett’s (2004) definition expresses the thoughts of many researchers: “the
experience of one’s own culture as ‘central to reality.’ By this I mean that the beliefs and
behaviors that people receive in their primary socialization are unquestioned; they are
experienced as ‘just the way things are’” (p. 62).
Global competency. “A globally competent person has enough substantive knowledge,
perceptual understanding, and intercultural communication skills to effectively interact in our
globally interdependent world” (Olson & Kroeger, 2001, p. 117).

18
Globalization. A company will have business internationally but not be considered
Global until they “have significant investments and profit centers in many countries, with no
single center of dominance” (Fidelity, 2017). Globalization is the process of becoming global.
Intercultural sensitivity. The level of recognition one has towards the differences of
other cultures. The more sensitive you are to a culture other than your own, the more you can
relate and integrate yourself directly into that other culture.
Risk management. “Risk management is the continuing process to identify, analyze,
evaluate, and treat loss exposures and monitor risk control and financial resources to mitigate the
adverse effects of loss. Loss may result from the following: financial risks such as cost of claims
and liability judgments; operational risks such as labor strikes; perimeter risks including weather
or political change; strategic risks including management changes or loss of reputation”
(Marquette University Risk Unit, n.d.).
Limitations of the Study
There were several limitations to this study.
1. Utilizing one company to conduct the research with was informative but if more than
one company was researched as a comparison, the results for both may have been
more generalizable.
2. During follow-up interviews, cultural issues as they related to gender were brought up
quite frequently. It would have been interesting to analyze the data based on gender.
3. The final limitation involves the participants comprehension of the survey questions
themselves. These were obtained from an existing published research paper. Since
this survey was sent to some employees in Spain, with the help of the company’s
Spanish-speaking HR representative (the primary company contact during the

19
research phase), modifications were made to the questions so they were easier for
those who don’t speak English as a primary language to understand. The modified
questions were sent to all participants but there is a possibility that those who don’t
speak English as a primary language may have still misinterpreted those questions.
Methodology
The company that was chosen for this research is a food manufacturer with their
headquarters in Wisconsin and locations throughout North America, South America, Europe and
Asia. This employee-owned company (hereafter referred to as The Company) was founded more
than 70 years ago and currently has over 7000 employees worldwide. The Company produces
and sells their products to fast food chains, restaurants, grocery stores, among other areas, and is
exported to over 55 countries across the world annually.
This current research study involved both a quantitative survey and a qualitative
interview with survey participants that indicated their willingness to participate in the interviews
on the survey. The survey was comprised of demographic questions, questions directly from
Olson & Kroeger’s (2001) research, and some questions from Olson & Kroger (2001) that were
modified per The Company’s request. Olson & Kroeger’s (2001) research questions were
modeled after Milton Bennet’s DMIS model and revolved around the six categories of denial,
defense, minimization, acceptance, adaptation and integration. The survey was sent to 1129 of
The Company’s employees throughout their home office and the Madrid, Spain location within
the four job classification categories: Executive, Directors/Plant Managers, Leader, Individual
Contributors. The purpose of the survey is to find out if there is a difference in ethnocentrism
between hierarchal levels, language skills and international experience. The data was analyzed
using SPSS with Anova testing.

20
The qualitative open-ended interview questions were from Hammer et al. (2003). The
questions specifically from this research were designed with the DMIS in mind and are loosely
associated with the six categories. Demographic questions were created by the researcher to find
out more about the interview participant and to garner a deeper understanding of the culture at
The Company as it pertained to working with their international partners. The survey data was
used in conjunction with the interview information to draw several conclusions. Most notably,
the more experience a partner has with international cultures, the more sensitive they are to
intercultural issues affecting business decisions.

21
Chapter II: Literature Review
This research draws from several related areas of scholarship, including, intercultural
communications, intercultural sensitivity, professional communications, globalization and multi-
culturalism. The following literature review explores the topics of cross-cultural risk,
understanding and measuring ethnocentrism as they pertain to the related areas of scholarship.
Globalization
International, multinational, global, transnational. These are all different classifications
in the business world that, to the average person, seem to represent the exact same thing – doing
business somewhere outside of the United States. In personal observations watching a debate
unfold between two business people, it became apparent that there is much more to this
terminology and the actual progression a company goes through as they gain experience in the
international world. The argument over classifying a company may seem like a fairly new,
modern phenomenon but as far back as 1969, when Howard Perlmutter (1969) wrote “The
Torturous Evolution of the Multinational Corporation”, we see the debate over business
classification developing. His paper starts with humorous examples of the thought process
behind companies describing why they are multinational. At the core, Perlmutter (1969), uses
these examples to show how difficult it is to classify organizations and why it is so important to
these same organizations: “part of the difficulty in defining the degree in multi-nationality comes
from the variety of parameters along which a firm doing business overseas can be described” (p.
11). For companies in the United States just starting to venture into the globalized world, these
classifications can be used as a guide for their progress. In turn, each classification employs a
different set of communication “rules” so it is important for companies to understand where they
fall within the matrix of this classification system. Hout, Porter & Rudden (1982) also discuss in

22
depth the parameters of a globalized company, in particular those that have been successful.
Numerous times throughout the article they describe successful globalized companies as those
who have “…accommodated local differences…” (p. 104), a trait that is missing within
ethnocentric companies. Finally, financial company Fidelity discusses the trouble of classifying
organizations but has more straightforward descriptions, primarily for financial reasons:
“Domestic firms operate mostly or completely within the United States
International firms are headquartered in the United States but maintain significant
investments outside the country and have geographically diverse profit centers
Global firms have significant investments and profit centers in many countries, with no
single center of dominance” (para. 2-4) (Emphasis added)
For the purposes of this paper, the focus will be on Fidelity’s definition of “International Firms.”
Cross Cultural Risk
If this relatively “simple” task of classification can lead to confusion and debate, it is
understandable how easy it is to make communication mistakes all along the way when a
company just starts venturing into the world of international business. When cultures not
normally associated with each other are now relying on each other (because of globalization) to
do business, cross-cultural communication is the connection (Baraldi, 2006). Anytime a
company starts a new venture, there will be a level of risk associated it. Managing risk is an
important process in business. Many companies have entire Risk Management departments
dedicated to the task. For many companies first venturing into international markets, managing
cross-cultural risk is not usually a priority (Wu & Zhang, 2009). It may not even cross their
minds that there is such a thing as cross-cultural risk and, therefore, they may not plan for risk
related problems by asking questions about how they will do business internationally. Risk

23
related questions companies expanding overseas should ask might include the following: Do they
modify their policies and practices to include or recognize the way the employees they will be
hiring are used to communicating? Will they train or educate off-shore employees on the
American way of doing business? Will they just assume that the way a business overseas is run
is the same as it is in the U.S., purely because those at the management level speak English?
Even more importantly, have those at the management levels stopped to consider the
communication issues employees lower on the organizational scale might run into as they, too,
need to communicate with the international partners? Ehrenreich (2010) described just such a
situation: “recent research suggests that top management in large MNC’s [Multi-National
Companies] is not sufficiently aware of the existence of language-related problems on the lower
hierarchal levels” (p. 412). Unfortunately, learning about risk in this haphazard manner can be
very detrimental, time consuming and financially costly.
Additional risk associated with intercultural communications is high context societies vs
low context societies (Wu & Zhang, 2009; Meyer, 2014). In a high context society, there are a
lot of shared experiences that allow one communicator to be able to understand the meaning of
another communicator even if meaning is not expressed explicitly. They tend to be countries
with centuries of history, such as China, Japan or India. Meyer (2014) shows that high context
“…messages are often conveyed implicitly, requiring the listener to read between the lines . . . it
is subtle, layered and may depend on copious subtext” (p. 30). Low context culture, on the other
hand is typically seen in countries that are younger with not as much history (the United States,
for example). According to Meyer (2014) communicators in Low Context cultures “ . . .
communicate as literally and explicitly as possible . . . [communication] is all about clarity” (p.
29). High context versus low context communication styles may not be acknowledged until one

24
side misunderstands the intentions of the other side. Some of these misunderstandings are
avoidable and unnecessary when businesses are able to understand the issues and plan for this
risk.
The phenomena of not recognizing the need to change business practices to accommodate
all, which can be both between international partners and within the hierarchy of an international
company, is the emphasis of this thesis.
Understanding Ethnocentrism
Many researchers are interested in the subject of cross-cultural communications from the
perspective of trying to define and understand ethnocentrism. Ethnocentrism is a communication
phenomenon that happens when interacting with cultures other than your own. In a broad sense,
we are talking about the cultures of at least two countries. However, ethnocentrism can just as
easily happen in one country, especially in different geographical regions in a country as large as
the U.S., or within a company as well. Differences can show up even in the mere daily tasks that
an executive performs versus a production line employee. If the production line employees don’t
agree with an executive decision, issues can quickly escalate into an “Us versus Them”
mentality.
Various definitions of ethnocentrism have been used by scholars who study this
phenomenon. The following tables are put together to show a few common themes identified
from the literature that stand out. First, companies may not even realize they have an
ethnocentric attitude since they do not have the international experience to be able to see how
their behavior could be construed as ethnocentric (Bennett, 2004; Leininger & Yuan, 1998).

25
Table 1
Ethnocentric Definitions - Inexperience
Authors Definitions
Leininger & Yuan (1998) The ethnocentric approach is a traditional strategy, reflecting the belief that “what worked at home will work abroad” (p. 20)
Bennett (2004) . . . the experience of one’s own culture as ‘central to reality’. By this I mean that the beliefs and behaviors that people receive in their primary socialization are unquestioned; they are experienced as ‘just the way things are’ (p. 62)
Second, ethnocentrism is not exclusive to the United States (Washington, 2013; Neuliep,
2014). These definitions could be applied to any two cultures across the world:
Table 2
Ethnocentric Definitions - Any Two Countries
Authors Definitions
Washington (2013) . . .this view of things in which one’s own group is the center of everything, and all others are scaled and rated with reference to it . . . (p. 21) Ethnocentrism is deceptive precisely because members of any culture view their own behavior as correct (p. 22)
Neuliep (2014) The attitudes and behaviors of ethnocentric persons are biased in favor of the in-group, often at the expense of the out-group. (p. 205)
Third, and by far the largest theme, is the “Us vs Them” mentality (Baraldi, 2006;
Qingwen, Day, & Collaço, 2008; Wu & Zhang, 2009). The definitions from Washington, 2013,
Nuliep, 2014, in table 2 could also be grouped here (see Table 3):

26
Table 3
Ethnocentric Definitions - Us Versus Them
Authors Definitions
Baraldi (2006) Ethnocentrism means the interpretation and evaluation of another’s behavior using one’s own standard, i.e. distinguishing between a positive Us and a negative Them. (p. 57)
Qingwen, Day, & Collaço (2008)
Ethnocentrism is viewed as lacking acceptance of cultural diversity and intolerance for outgroups (p. 29)
Wu & Zhang (2009) Ethnocentrism is the risk that people believe their behavior is superior to others from different cultures, and treat the other culture with prejudice, due to the difference of cultural orientation in psychology. Both individuals and organizations may have the sense of superiority.
In this grouping, the reference to “Us versus Them” is a potentially treacherous situation that
may very well be the cause of many major conflicts, not just in business but in world affairs as
well. There is no attempt, in these scenarios, to recognize other cultures and their beliefs. If a
business starts their international branch with this attitude, it will be a very short-lived
experience.
Measuring Ethnocentrism
Since this research focuses on the extent of ethnocentrism within one organization, it is
important to recognize and/or measure ethnocentrism. There are numerous models measuring or
classifying ethnocentrism described in the literature. Perlmutter (1969) and Leininger & Yuan
(1998) describe a model that is more observational and qualitative based – not necessarily
measurable on a quantitative scale. Both focus on a model that moves from ethnocentric to
polycentric (moving away from ethnocentrism and trying to work towards a combined business
model supporting all cultures), to geocentric (the ultimate goal of fully integrated, intercultural

27
business model recognizing all similarities and differences to be able to work together). The
strengths of this model include acknowledging that as a company grows, so, too, do its
ethnocentric attitudes. It acknowledges the importance of culture in moving away from
ethnocentrism.
Louhiala-Salminen & Kankaanranta (2011) developed a model they call “Global
Communicative Competence (GCC)” which is based on three layers: “Multicultural competence,
competence in English as a Business Lingua Franca (BELF) and the communicator’s business
know-how” (p. 244). This model discusses what many international companies in the U.S.
already agree to: the English language is prevalent enough to be able to do business overseas
without much trouble communicating. The authors also acknowledge that looking exclusively at
common language without taking culture of the native speaker into consideration does not add to
an individual’s level of GCC (p. 248). Strictly looking at common language would not be
completely functional in business, either, since having common language competence is not the
same as understanding the culture you are doing business in. With the inclusion of the
multicultural competence and business know-how, this model pulls together all the important
aspects of measuring ethnocentrism within a business context and parts of this model were
applied to this research.
Finally, we come to Bennett’s (2004) research and his Developmental Model of
Intercultural Sensitivity (DMIS). Bennett created this model after years of observing interactions
between people of different cultures and how some people were just better at communicating in
this environment than others. He specifically noticed that there were different levels of
experience that people moved through as they became more aware and sensitive to other
cultures. His six-stage model works to categorize people and businesses along a scale from

28
ethnocentrism, “to refer to the experience of one’s own culture as ‘central to reality’.” (p. 62), to
ethnorelativism, a term coined by Bennett that means “the opposite of ethnocentrism - the
experience of one’s own beliefs and behaviors as just one organization of reality among many
viable possibilities” (p. 62). Those six stages are denial, defense and minimization on the
ethnocentric side and acceptance, adaptation and integration on the ethnorelative side. Bennett
doesn’t look at any of the stages as bad versus a good, rather it is about the quality of the
experience individuals have:
In general, the more ethnocentric orientations can be seen as ways of
avoiding cultural difference, either by denying its existence, by raising defenses
against it, or by minimizing its importance. The more ethnorelative worldviews are
ways of seeking cultural difference, either by accepting its importance, by adapting
perspective to take it into account, or by integrating the whole concept into a
definition of identity. (p. 63)
Bennett’s model is more detailed and comprehensive than the other models outlined above.
Specifically, it acknowledges the complexity of the progression from one side to the other and
six stages allows for explicit detail and description of the levels of ethnocentrism versus a three-
step model, such as Louhiala-Salminen & Kankaanranta’s (2011). By drawing on the DMIS
model, this research looks to measure the different levels of ethnocentrism a company has, even
within their own organization.
Similar Research
The research study most similar to this thesis is Milton J. Bennett’s comprehensive
studies on intercultural sensitivity (Bennett, 1998; Bennett 2004), in particular, the research
outlined above from Bennett (2004). In one of Bennett’s earlier works (Bennett, 1998), he starts

29
to lay the groundwork for concept of a developmental model and even describes the six stages
that are eventually in his formal DMIS. His 2004 research explores and develops the sequence of
the different levels of development in intercultural sensitivity, eventually leading to the creation
of the DMIS. In using a grounded theory approach to develop the DMIS, Bennett explains not
only the different stages of developing a more comprehensive intercultural sensitivity but also
what behavior, comprehension, knowledge or attitudes an individual or group (i.e.: The
Company) must evolve from before they are considered interculturally competent at that
particular level. My research adds to this model by looking at intercultural sensitivity from
within one large group and seeing how the individual parts add to, or take away from, the
evolution of the group as a whole. My research also explores if The Company does anything to
move the evolution of those less experienced in intercultural sensitivity along to help the group
as a whole become more competent and sensitive as far intercultural communications is
concerned.
Additional research similar to this thesis is from Qingwen, et al. (2008). Their research
looks at three different areas: ethnocentrism, intercultural communication sensitivity, and
multiculturalism. Their specific goal is to study whether a person’s level of intercultural
communication sensitivity or their level of multiculturalism are, more or less, effective at
overcoming ethnocentrism. This research, similar to those described above, considers
ethnocentrism to be correlated to a lower level of understanding of culture and its importance in
a globalized world. They strive to find a way to measure, educate and diminish the effects of
ethnocentrism and, therefore, conflict, between groups of different cultures. Their study
involved a survey of 419 undergraduates from both a small private university and a large state
university and included sections with instruments to measure their three main focus areas of

30
ethnocentrism, intercultural communication sensitivity and multiculturalism. Their results show
they made a correlation between higher levels of both intercultural communication sensitivity
and multiculturalism with lower levels of ethnocentrism, and hope the impact of their study will
encourage further research into intergroup communications.
Finally, the Olson & Kroeger (2001) research uses survey data from 52 faculty and staff
at an American university to identify international backgrounds, global competency and
intercultural sensitivity. The objective of this research is to understand the international
competency and sensitivity of their own faculty and staff, with the end goal to further the campus
competency through curriculum and professional development with an international focus,
meeting the needs of a more globalized word.
They rely on Bennett’s descriptions of the ethnocentric and ethnorelative stages to
evaluate the respondent’s answers. They combined answers from the DMIS questions with their
own global competency questions to get a more thorough understanding of the impact of
proficiency in more than one language and experience abroad have on the survey results. The
survey questions provided in Olson & Kroger’s (2001) research were used in this current
research project. The interpretations of the survey data were also fundamental in clarifying the
results of this current research.

31
Chapter III: Methodology
The purpose of this study is to determine if there are different levels of ethnocentrism
within one company’s hierarchal organization. The methodology for this research is based on
Bennett’s (2004) DMIS model and uses questions developed by Olson & Kroeger (2001). The
research data was collected via a survey sent out to 1129 potential research participants and a
follow-up interview conducted with ten of those survey participants. This chapter will describe
the research participants, the methods used for data collection and data analysis as well as
describe further limitations of the study.
Subject Selection and Description
This research is broken into two different parts: the survey and the interviews. For this
reason, there are two different methods used to select the subjects. The following sections break
down the process for each part of the research process.
The survey. To participate in the qualitative survey, an email invite from the HR
department with a link to the Qualtrics survey was sent to 1129 company partners. The Company
partners asked to participate in this research were located in the U.S. Home Office, the U.S. plant
locations (the majority of the survey invitations, 1079, were sent to these locations) as well as in
the Madrid location (50 survey invitations were sent here). Other company locations were
excluded for various reasons, including: limiting the size of the study while still getting
international partners involved; some locations were not conducive to the study because of
strong language barriers; the company itself was most interested in seeing results from the ones
described above. The same survey was sent to all participants. The research participants were
from four different hierarchal levels of the company: 19 Executives; 54 Director’s/Plant
Manager’s (Directors/Plant Managers); 571 Leaders; and 539 Individual Contributors. These

32
partners were in 10 different company departments including: International, Finance, HR,
Enterprise Quality, Legal/Regulatory, Operations, Supply Chain, Sales, Information Systems,
Product Life Cycle Strategies. The survey was completely voluntary and anonymous and was
open for 3 weeks. At the mid-way point and closer to the end of the survey time-frame, a
reminder email was sent by the HR department to all participants to remind them of the survey
time-frame and encourage participation for those who had not taken the survey yet. Partner’s
needed to be 18 to participate but otherwise there were not any other restrictions to participation.
The interviews. At the end of the survey, participants were asked to volunteer for the
follow-up interview. To narrow down the research participant pool from the 75 that originally
agreed to participate, they were sent an email directly to re-confirm their willingness to
participate. From this list, a total of nine research participates were chosen based on their
hierarchal level within the company. Aside from hierarchal level, the possible participants were
chosen based upon who replied first from the follow-up email with a maximum of one from the
Executive Level, three from the Directors/Plant Managers level, three from the Leadership level
and three from the Individual Contributor level. Due to the lack of response at the leadership
level from the original responses, it was necessary to send an email to a few specific participants
at the leadership level known to have taken the survey but who did not originally volunteer for
the interview. From this, one additional participant was found for the Leadership level to fill all
possible positions for a total of ten interview participants. This mix of participants were from
Madrid, the U.S. home office and from the U.S. plants with a variety of length of time working
at the company from 5-22 years.

33
Instrumentation
This research uses a mixed methods format. The instrumentation for the qualitative
survey and the qualitative interviews are broken down independently in the following
paragraphs.
The survey. The first part of this mixed methods research involved a twenty-eight
question Qualtrics electronic survey, a survey tool provided for by UW-Stout. The survey
included ten demographic questions and eighteen core questions. The ten demographics
questions were multiple choice with some questions allowing for more than one answer. These
questions asked for length of time at The Company, level and department at The Company, and
whether the research participants have any international experience (working, living outside of
the U.S. and if they have multiple language skills). This information was used to better
understand the level of experience, in terms of general work experience and international
experience, within The Company. The eighteen core questions were from Olson & Kroger’s
(2001) research and break down to include three each for the six DMIS categories. On the
ethnocentric side of the scale are denial, defense, and minimization; on the ethnorelative side,
acceptance, adaptation and integration. The questions were scored on a 5-point Likert scale with
1= Disagree, 2= Somewhat Disagree, 3= Neither agree or disagree 4= Somewhat Agree and 5=
Agree (see Appendix B for the actual questions asked on the survey). A couple of the questions
were modified from the original questions in Olson & Kroger (2001), as suggested by the contact
at The Company, to allow for those speaking a language other than English as their primary
language and to understand the meaning of the questions. The survey was needed to gauge where
the company was along the progression line from ethnocentrism to ethnorelativism.

34
The interview. The open-ended qualitative interviews were conducted with ten
participants from the survey who volunteered, or were asked, to be a part of the interviews.
Questions 1-13 (see Appendix C) were developed by the researcher with the purpose of getting
more in-depth information than the survey provided. The questions surrounded what the research
participant specifically did for The Company; how communication in The Company was
perceived by the participant; if the participant was located outside of the U.S. or worked with
those located outside of the US, how was the communication; and to describe any training
provided to help the partners communicate appropriately with the partners not located in the US.
Questions 14-21 were from research by Hammer et al. (2003) (See appendix D). These
questions were chosen specifically because they were interview questions categorized within the
six DMIS stages. One each was chosen from the six categories (for the adaptation stage, the
question, as presented in Hammer et al. (2003), was a three-part question and was used in its
entirety). Again, the purpose of using questions revolving around the DMIS was to allow for the
research participants to go into further detail than what the survey would allow, giving them
room to show their thought process where it involves communications and the DMIS scale.
It was possible to correlate the survey responses to the interview participants, with the
exception of one interview participant added at a later date. For this participant, extra questions,
repeated from the survey, were added to gather similar information to the other participants but
the scores from the official survey could not be correlated to this individual due to lack of name
or contact information added at the end of the survey. The correlated information between the
survey and the interview was used more in the analysis of all of the data rather than in a way to
guide any conversation during the interviews.

35
Data Collection Procedures
Data collection for this mixed methods research is described separately in the next few
paragraphs based on whether it was for the survey versus the interviews.
The survey. An email with an introduction to the survey, information about the research
and the researcher and the link to the survey itself was sent through the company's Human
Resources department. This survey was sent to 1129 potential participants at the company's
home office, U.S. plant locations, as well as their Madrid office. The survey was administered
digitally through Qualtrics and was open for three weeks, allowing for participants to take the
survey from any location and at any time. Several email reminders were sent out by The
Company’s HR representative to all potential participants during this period to engage as many
participants as possible to take the survey. Once the survey was closed, any unfinished surveys
were cleared from the system and were not part of the final results. There was a survey response
rate of 326 or 28.9% for this research.
The interviews. At the end of the survey there was an opportunity to volunteer for a
follow-up interview. The twenty-one question, open ended interview was conducted at the
convenience of the participants. The participants were asked to reserve an hour of time for the
interview and the most interviews averaged about forty-five minutes in length, depending on
how much the participant expanded on the questions or, in some cases, as time permitted based
in the participants schedule. The interviews were conducted on site at The Company or via
SKYPE, an online video conferencing service, for those not located near The Company. Notes
were taken during the interview and the interviews were recorded (with participant permission)
to allow for re-playing during analysis.

36
Data Analysis
Data Analysis is also different based on whether it was the survey or the interviews. The
following paragraphs show how the data was analyzed for each part of this mixed methods
research.
Survey data. This data was analyzed with the IBM SPSS Version 23 data analysis
software. The one-way ANOVA test was used to compare several variables against the six DMIS
categories, including: Employment level within the company; length of time at the company;
which department the employee works in; how much time the employee has spent living outside
the US; and whether the interviewee spoke a language other than English as their first language.
Interview data. The interviews were analyzed for any possible similarities and
differences between the interview participants within the same variables as the survey question:
Employment level within the company; length of time at the company; which department the
employee works in; how much time the employee has spent living outside the US; and whether
the interviewee spoke a language other than English as their first language. Some of the survey
questions had a direct correlation with the six DMIS categories and with the voluntary addition
of personal information it was possible to compare the interview participants survey answers
with their interview answers (with the exception of the participant that was added last). This
allowed for a more in-depth analysis of where The Company’s partners were on the
ethnocentrism scale.

37
Limitations
Limitations for the survey include:
1. The time it took to take the survey may have been too long for some of the potential
research participants and therefore fewer finished the survey than would have if the
survey was shorter.
2. The survey was set up to require answers to all the questions. Some people may have
gotten to a question they did not want to answer or know how to answer and therefore
stopped and did not finish the survey. If questions were optional, there may have been
a higher percentage of completed surveys.
Limitations for the Interviews include:
1. For some potential participants, finding forty-five minutes in already busy schedules
to sit down for the interview was difficult. Therefore, participation in the interview
process was limited.
2. Some of the interview questions asked employees to point out flaws or problems The
Company has with communications. The interview participants may not have been as
open with their answers in a face to face setting, even though they were told their
answers were anonymous and confidential.

38
Chapter IV: Results
The purpose of this study is to determine if there are different levels of ethnocentrism
within one company’s hierarchal organization and whether language or international experience
influences levels of ethnocentrism. A total of 326 (or a 28.9% return rate) surveys were
completed. Ten follow-up interviews were conducted during an eight-week period after the
survey was closed with participants from the survey who volunteered for the interviews. The
following paragraphs are an analysis of the data collected in this mixed-methods study.
Survey Data Analysis
The survey comprised the largest amount of data in this research. The following
information describes the participant backgrounds, analysis of the survey itself and analysis of
the results based on each research question.
Participant background information. There were several demographics questions
asked in the survey to better understand the make-up of The Company. Overall, the largest group
of The Company partners was comprised of those employed for 0-5 years (31.9%). The
breakdown of time at The Company versus hierarchal level shows a distinct correlation between
the partners level of employment with the number of years they have been employed at The
Company: of the Executives, the majority have worked for The Company 21+ years; the larger
majority of Directors/Plant Managers have been at The Company for 16-20 years; The majority
of Leaders are split between 0-5 years and 6-10 years; for Individual Contributors the largest
group have an average length of time of 0-5 years with The Company (see Figure 1 for a detailed
breakdown for the length of time employed at The Company).

39
Figure 1. Length of time employed by The Company based on hierarchal levels.
To understand the international experience the U.S. and Madrid partners bring to The
Company, they were asked if they have lived outside of their home country. The majority of
participants (72.9%) have never lived outside their home country. The rest of the participants
were close to evenly split between a year or less (10.7%) and more than a year (11.3%) living
outside of their home country.
The Company is an international company with responsibilities crossing borders and
divisions (domestic or international). Even if a partner is in the international division, this does
not necessarily mean they will have actual communication with a partner outside of their home
country. It is also true that if a partner is in the domestic division, they may still communicate
with a partner in a different country. Therefore, it was important to find out what percentage of
partners spend some of their work-week communicating with partners from a different country.
0%
5%
10%
15%
20%
25%
30%
35%
40%
45%
50%
Executives Directors/PlantManagers
Leaders GeneralContributors
Overall
% o
f h
eira
rch
al le
vel
Heirarchal Level
0-5 years 6-10 years 11-15 years 16-20 years 20+ years

40
Table 4
Time Spent Working with Company Partners Outside of their Home Country
Hours per week Percent of Employees per Category
Never 57.4%
5 hours or less each week 27.3%
6-15 hours each week 8%
More than 15 hours per week 7.4%
At The Company, there are four main hierarchal levels for the day to day operations that
are included in this study: Executives; Directors/Plant Managers; Leaders; Individual
Contributors. It is typical in many U.S. based businesses, especially ones as large as The
Company, for their organizational structure to look like a pyramid with executives comprising
the smallest number of employees and the next levels each increasing in size. That is the case
with this company as well. This research compares intercultural sensitivity within the different
hierarchal levels and was, therefore, necessary to know the numbers of participants from each
level.
Table 5
Number of Potential Participants by Hierarchal Level
Hierarchal Level
Number of people at The Company from U.S.
and Madrid locations asked to participate in
the survey
Number of survey
participants
Percentage of each level that participated
in the survey
Executives 19 8 42%
Directors/Plant Managers 54 26 48.1%
Leaders 517 114 22%
Individual Contributors 539 178 33%

41
Survey information. The eighteen core questions of the survey break down to include
three for each of the six DMIS categories. Appendices A thru F show the three questions
grouped within their category, the overall mean of the category as well as the mean of each
individual question. There is also a breakdown of the percent of those replying with 4 or 5 for
each question, correlating with a “somewhat agree” or “agree” answer.
The variables in this research are non-continuous but when looking at the average means,
there is a steady increase in the overall mean through the first three DMIS stages of denial,
defense, and minimization (the ethnocentric stages) with 1.74, 2.44 and 3.41 respectively. The
mean peaks at the acceptance stage with a 4.32 and goes back down for adaptation (3.73) and
integration (3.29), the three ethnorelative stages. The results show, on average, all levels of
employees disagreed with statements that expressed denial and defense and represent a stronger
agreement with the three ethnorelative stages, in particular, the acceptance category questions.
The implication is The Company is more rooted in the acceptance stage of the DMIS scale.
Research question 1. Will drawing on Milton Bennett’s 6-stage development model
of intercultural sensitivity (DMIS) to measure the levels of ethnocentrism within an
American company doing business outside of the United States show multiple stages of
ethnocentrism between employees at different hierarchal levels within the company?
Comparing the overall means for each organizational level (See Figure 2), on the ethnocentric
side of the scale, the denial and defense categories had the lowest means or lowest levels of
agreement with the questions. Acceptance, the first category on the ethnorelative side of the
scale, had the highest means, or highest level of agreement with the questions, for all four
hierarchal levels.

42
There is a statistically significant difference between “Leaders” and “Individual
Contributors” at the integration level (alpha =.05; p=.009; std deviation .10606). This shows that
a higher percentage of Leaders were in agreement with the questions at the integration level than
the Individual Contributors. The number of responses for the Executives, while a high
percentage of the total number of partners at this level, is still a very low number and, therefore,
there was not sufficient statistical power to measure statistical significance. On the other hand,
looking at Figure 2, the actual means do show large gaps in several subsets when comparing
Executives to the other levels: at denial, Executives (mean of 1.29) compared to all other levels
(Directors/Plant Managers 1.86; Leaders 1.68; Individual Contributors 1.79) were lower in
agreement with denial questions; at minimization, Executives (mean of 3.04) compared to both
Directors/Plant Managers (3.53) and Leaders (3.52) were still lower in agreement with the
questions pertaining to this stage; at integration, Executives (3.67) when compared to Individual
Contributors (3.14) were much higher in agreement with integration stage questions. For all
other stages (defense, acceptance and adaptation), there was not an observable difference in the
means between the hierarchal levels. In other words, The Company partners were similar in their
levels of agreement with the questions at these stages, but the Executives were overall more in
agreement at the higher ethnorelative stages (adaptation and integration) than the other hierarchal
levels.

43
Figure 2. Means for hierarchal levels within The Company.
Research question 2. If the first language of the employee is not English, will there
be a significant difference between the six stages of the DMIS categories of denial, defense,
minimization, acceptance, adaptation or integration? For the purposes of this study,
participants were asked “What language is your first language.” The majority of the answers
were English (94.3%) and Spanish (3.9%) with a small group (1.8%) from French, Italian,
German, Portuguese and Russian. This final group is put together as “other” in the data analysis.
There were two areas that showed a statistically significant difference. Responses at the
adaptation and integration levels indicate that partners who speak English as a first language
show more ethnocentrism than those who speak Spanish or other languages (see Table 6).
1.00
1.50
2.00
2.50
3.00
3.50
4.00
4.50
Denial Defense Minimization Acceptance Adaptation Integration
Mea
ns
DMIS Levels
Executive Director/Plant Manager Leader Individual Contributor
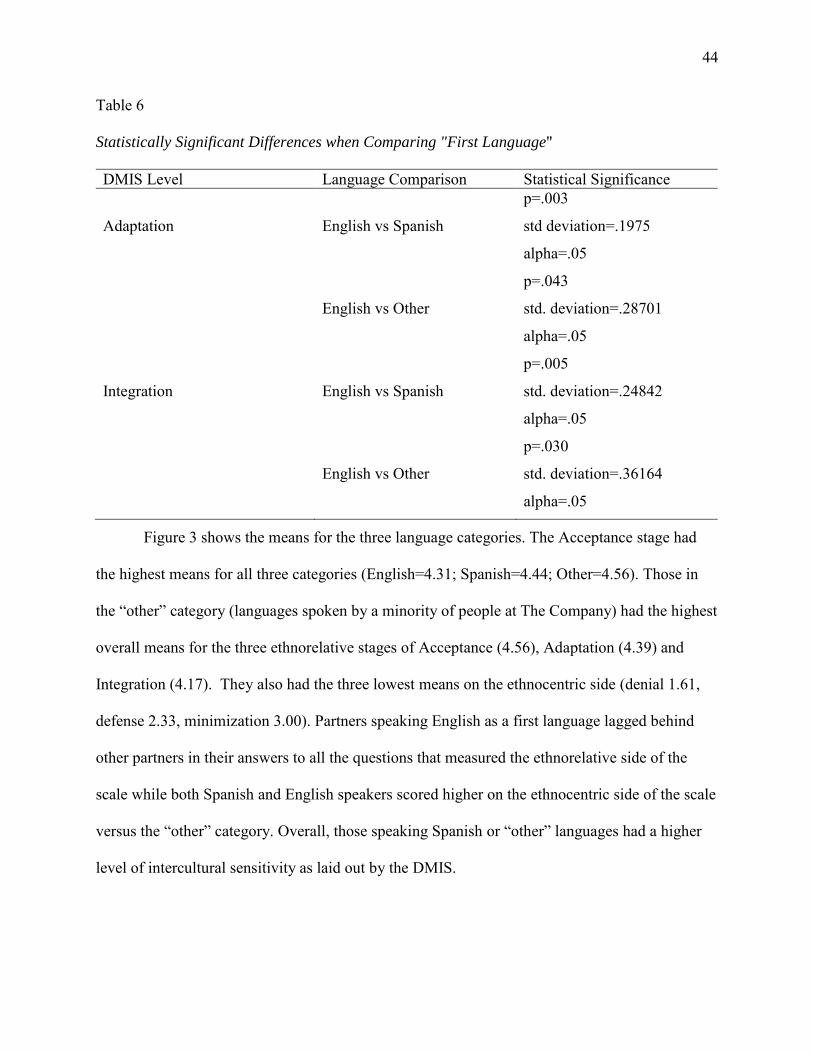
44
Table 6
Statistically Significant Differences when Comparing "First Language"
DMIS Level Language Comparison Statistical Significance
Adaptation English vs Spanish
p=.003
std deviation=.1975
alpha=.05
English vs Other
p=.043
std. deviation=.28701
alpha=.05
Integration English vs Spanish
p=.005
std. deviation=.24842
alpha=.05
English vs Other
p=.030
std. deviation=.36164
alpha=.05
Figure 3 shows the means for the three language categories. The Acceptance stage had
the highest means for all three categories (English=4.31; Spanish=4.44; Other=4.56). Those in
the “other” category (languages spoken by a minority of people at The Company) had the highest
overall means for the three ethnorelative stages of Acceptance (4.56), Adaptation (4.39) and
Integration (4.17). They also had the three lowest means on the ethnocentric side (denial 1.61,
defense 2.33, minimization 3.00). Partners speaking English as a first language lagged behind
other partners in their answers to all the questions that measured the ethnorelative side of the
scale while both Spanish and English speakers scored higher on the ethnocentric side of the scale
versus the “other” category. Overall, those speaking Spanish or “other” languages had a higher
level of intercultural sensitivity as laid out by the DMIS.

45
Figure 3. Means based on first language.
Research question 3. Will a comparison of length of time an employee has lived
outside of the United State show a significant difference between the six stages of the DMIS
categories of denial, defense, minimization, acceptance, adaptation or integration? For this
question, the data is grouped into those that never lived outside of their home country, those that
lived outside for six months or less, more than six months but less than one year, more than one
year but less than two years, and more than two years. There are numerous significant data
points for this variable (see Figure 4).
1.00
1.50
2.00
2.50
3.00
3.50
4.00
4.50
5.00
Denial Defense Minimization Acceptance Adaptation Integration
Mea
ns
DMIS Level
English Spanish Other

46
Figure 4. Means for time spent living outside of home country.
The data shows that the acceptance stage has the highest means with the most participants
in agreement with the questions in this stage. Those who have lived outside their home country
for two years or more had the highest mean levels for all three ethnorelative stages (acceptance
4.53, adaptation 4.26, integration 4.24). The data in figure 4 also shows a pattern in five of the
six stages: those with 2 or more years of living outside their home country have the lowest
ethnocentric means and the highest ethnorelative means compared to all other data points. The
exception is the defense stage where the 2 years or more group was .03 higher than the Never
group. Table 7 shows the areas where there was a statistically significant difference between the
different time frames of living outside of their home country.
1.00
1.50
2.00
2.50
3.00
3.50
4.00
4.50
Denial Defense Minimization Acceptance Adaptation Integration
Mea
ns
DMIS Level
Never 6 mo or less >6 mo to <1 yr >1 yr to <2 2 yrs plus

47
Table 7
Statistics Based on Time Spent Living Outside of Home Country
DMIS Level Time Spent Outside Home Country Statistical Significance
Denial >6mo to <1 yr vs 2 yr plus
p=.028
std deviation=.21643
alpha=.05
Never vs >6 mo to <1 yr
p=.002
std. deviation=.18532
alpha=.05
Adaptation Never vs 2 yr plus
p=.000
std. deviation=.14201
alpha=.05
Integration 6 mo or less vs 2 yr plus
p=.010
std. deviation=.23894
alpha=.05
Never vs 2 yr plus
p=.000
std deviation=.17381
alpha=.05
Interview Analysis Including a Comparison to Survey Data
The following information is a breakdown of the demographic answers from the survey
as they pertain to the interview participants. The length of time working at The Company varied
with the largest percentage of the participants currently working between 6-10 years, (40%).
Compared to the total group of research participants, where the majority have worked at The
Company for 0-5 years, the interview group has been at The Company longer (Table 8).

48
Table 8
Number of Years Working at The Company
Interview Participants Total Participants 21+ years 10% 11.9%
16-20 years 20% 14.4%
11-15 years 20% 12.3%
6-10 years 40% 29.4%
0-5 years 10% 31.9%
The participants from the interviews have a wide range of hours working with partners
outside of their home country with the majority working more than 15 hours per week (See Table
9).
Table 9
Hours Spent Working with Partners Outside of Their Home Country
Hours Per Week Interview Participants Total Participants
0 hours per week 10% 57.4%
1-5 hour per week 20% 27.3%
6-10 hours per week 0% 27.3%
10-15 hours per week 30% 4.3%
More than 15 hours per week 40% 7.4%
Of the interview participants, 50% use a language other than their primary language on a
regular basis or every day (versus 9.8% of the total participants) but only one out of the ten
speaks a language other than English as their primary language. 30% of the interview
participants are currently working on location at one of the international locations and 60% have

49
spent at least 6 months living outside of their home country at some point in their lives
(compared to 14.7% of the total participants). Overall, the interview participants are more
experienced than the rest of the participants, not only based on length of time working at The
Company, but also with direct contact with international experience including language, living
outside of their home country and amount of time working directly with international partners.
Responses to interview questions related to ethnocentric DMIS stages (denial,
defense, minimization). Denial is a stage in which people are not generally against cultures
other than their own but rather do not even recognize other cultures (Bennett, 2004). The
answers here follow the same trend as the survey data: the higher up the hierarchal scale, the
more the participants notice culture and therefore have a lower level of denial. The few
exceptions include the Executive level and for two participants at the Individual Contributor
level. During the interview, the Executive felt there was not much cultural difference at The
Company (a denial based comment) because the business culture was strong and similar
throughout the company. The interviews for Individual Contributor 1 and Individual Contributor
2 show less of an awareness of culture, putting them higher in the denial category than their
survey score shows. Table 10 shows the comparisons between the interviewees survey and
interview scores along with their level of leadership (for Tables 10-15, leadership experience is
scored as high for Executives and Directors/Plant Managers, medium for Leaders and low for
Individual Contributors. International Experience was scored high, medium and low based on the
combination of what their first language was (higher score for anything other than English), time
living outside of their home country, number of hours working with partners outside of their
home country, and how often they use a language other than their primary language. The levels
of agreement in the interviews are scored as low, medium, and high. The culmination of these

50
scores was based on the number of positive, negative or neutral answers to the questions in
Appendix D. The survey scores came directly from the survey where 1 is the lowest and 5 is the
highest.)
Table 10
Survey Scores Compared to Interviews: Denial Stage
Interviewee Leadership Experience
International Experience
Level of agreement with denial: Interviews
Survey Score
Executive High High Medium 1.67
Director/Plant Manager 1 High High Low 2.33
Director/Plant Manager 2 High High Low 2.33
Director/Plant Manager 3 High High Low 1.67
Leader 1 Medium High Low 1.0
Leader 2 Medium Low Low 1.0
Leader 3 Medium Low High NA*
Individual Contributor 1 Low Low High 2.0
Individual Contributor 2 Low Low High 3.33
Individual Contributor 3 Low Medium Low 2.33
* Note. Leader 3 took the survey but was added to the interview at a later time not allowing for
correlation to survey scores.
The defense stage is the stage in which culture is recognized but the people believe their
culture is superior to others (Bennett, 2004). According to the survey scores, the interview
participants score on the lower end of the defense scale, meaning they are not in “defense”.
During the interviews, it was also clear that many of the participants want to recognize, or at

51
least understand the importance of recognizing, other cultures, another indication of a lower
agreement with the defense stage questions.
The partners with not only leadership training but strong international experience utilized
their skills and experience to work through the communication barriers or avoid them altogether.
Here is an example from a partner at the Director/Plant Manager level currently living and
working in Madrid:
It happened once between Spain, Portugal [and the Czech Republic]. They [a
partner from the Czech Republic] came to me and said: ‘I don’t understand? We
wanted them to do this and they said ‘Yes’ but then they didn’t [do it]’ And I said
‘yeah, in Spain and in Portugal, ‘Yes’ doesn’t always mean ‘Yes’. Someone might
say yes to you because they don’t want to say no. . . there [Portugal or Spain],
saying no is somehow worse than saying yes. That can be really upsetting to
someone in the Czech Republic where it is much more direct” (Director/Plant
Manager 1, October 21, 2016).
Another example comes from a partner at the Leader level with numerous years of
international experience “In regards to Germany, your speaking can be more direct. It is better if
you are more direct. . . India, on the other hand, if you are too direct you are going to hurt
somebody’s feelings . . .” (Leader 1 Interview, October 24, 2016).
At the Individual Contributor level, it is more of a learn as you go scenario at The
Company. This is the experience one of the Individual Contributor partners had during an
integration process with a new plant overseas:
At the start I didn’t know enough. . . and I think I approached him [the overseas
vendor], unfortunately a little harshly . . . he didn’t have a comfort level, once he

52
gained that I think we both kind of adapted to a point. Before that, I think, we kind
of butt heads. . . Its more adapted now. I would say that I have learned more”
(Individual Contributor 1 Interview, October 24, 2016).
In some cases, the interviewees really do not recognize the cultural perspective of some
of these interactions. In a scenario similar to the Director/Plant Manager partner’s experience,
here is the perspective from an Individual Contributor partner:
With the partners in India, especially at a certain level . . .that person kept telling us ‘yup,
yup, its done, its done, its done’ . . . they really want to please you . . .and they want to
tell you want you want to hear . . . it almost comes across as dishonesty to us [U.S.
partners]” (Individual Contributor 3 Interview, October 24, 2016).
In this next example of an interaction between one of the Leaders and a French
representative, the representative was not used to being questioned on the details of how to do her
job and it caused some initial strife with the partner: “The hardest trade show is Paris but the French
aren’t very easy to work with to begin with . . . She [the trade show representative] told me I ask
too many questions”. (Leader 3 Interview, December 28, 2016).
Overall, based on the survey scores of all the participants, the more leadership experience
combined with international experience a partner had, the more likely they were to recognize
cultural differences for what they were and not that one culture was correct (or superior) and the
other wasn’t, therefore having lower scores at the defense stage (see Table 11). The survey
statistics for the interviewees, on the other hand, show a different trend. The mean for both the
Directors/Plant Managers and Leaders was 3.0 for each group (see Table 11). In comparison, the
mean for all participants, separated by hierarchal level was 2.4 (see Figure 2) for both the
Directors/Plant Manager level and Leader level. This represents a more ethnocentric view point

53
for the interviewees at the defense stage compared to the total group of Director/Plant Managers
or total group of Leaders.
Table 11
Leadership and International Work Experience Comparing Interview to Survey: Defense
Interviewee Leadership Experience
International Experience
Level of agreement with defense: Interviews
Survey scores
Executive High High Low 2.33
Director/Plant Manager 1 High High Low 3.00
Director/Plant Manager 2 High High Low 2.33
Director/Plant Manager 3 High High Low 3.33
Leader 1 Medium High Low 3.0
Leader 2 Medium Low Low 3.0
Leader 3 Medium Low High NA*
Individual Contributor 1 Low Low High 3.0
Individual Contributor 2 Low Low High 2.0
Individual Contributor 3 Low Medium Medium 2.33
* Note. Leader 3 took the survey but was added to the interview at a later time not allowing for
correlation to survey scores
According to Bennett (2004), those in the minimization stage are more apt to notice
cultural similarities. Minimization is also a transitional stage between the ethnocentric and
ethnorelative phases. The scores on the survey bounced around from a low of 1.67 to a high of
4.67 (out of 5), with no clear trend amongst the hierarchal levels. The interviews allowed for a
little more clarification about the beliefs of the partners for this stage: The three leadership levels
all agreed, with one exception (a partner that has been a leader for less than a year), that it is

54
important to focus on differences, or both similarities and differences. One Director/Plant
Manager put it this way: “I think it is dangerous to not acknowledge the differences . . .
otherwise, the marginalized groups never get the attention they need to be successful”
(Director/Plant Manager 2 Interview, November 21, 2016). A Leader said it this way when asked
if it was more important to pay attention to cultural differences or similarities: “Both! . . . But
you need to know what the differences are in order to be an effective leader” (Leader 2
Interview, October 24, 2016).
Individual Contributors all said it is more important to look at similarities, a view in line
with the minimization stage. The following comment was similar to comments from the other
Individual Contributors: “Focus on the similarities . . . People are people. We just need to figure
out how to get along” (Individual Contributor 2 Interview, October 21, 2016).
Based on the interviews, the trend in this ethnocentric stage is similar to the other two
stages: Those with leadership and international experience are lower on the minimization scale
than the Individual Contributors.

55
Table 12
Leadership and International Work Experience Comparing Interview to Survey: Minimization
Interviewee Leadership Experience
International Experience
Level of agreement with Minimization: Interviews Survey Score
Executive High High Medium 4.67
Director/Plant Manager 1 High High Low 3.00
Director/Plant Manager 2 High High Low 1.67
Director/Plant Manager 3 High High Medium 3.33
Leader 1 Medium High Medium 2.33
Leader 2 Medium Low Low 4.00
Leader 3 Medium Low High NA*
Individual Contributor 1 Low Low High 1.67
Individual Contributor 2 Low Low High 3.33
Individual Contributor 3 Low Medium High 4.0
* Note. Leader 3 took the survey but was added to the interview at a later time not allowing for
correlation to survey scores
Responses to interview questions related to ethnorelative DMIS stages (acceptance,
adaptation, integration). The acceptance stage question, “Do you make any special effort to
find out more about the cultures around you?”, had similar answers from the interview
participants. Without exception, those in one of the three leadership areas were very eager to
explore other cultures in depth: “That is one of the things I love most about my job! I get to meet
people from different places. I get to pay attention to the way they greet each other or what they
eat. . . I ask questions about their culture. . . just by showing interest then that goes a long way”
(Leader 2 Interview, October 24, 2016). Similarly, from another Leader:
56
That is one of the reasons that I took this international role so I could work with
people who speak different languages and have different backgrounds, that is very
interesting to me. When I travel to different areas I ask questions, try the local food
the local drink, get people taking about their area and what they know. They like to
talk about themselves and where they are from. If you can find that common
ground, people are more likely to open up to you.” (Leader 1 Interview, November
21, 2016)
At the Individual Contributor level, there is still a general curiosity of other cultures,
especially the countries where The Company is located: “As we add new plants, I spend time on
Google Maps and look at where all our plants are” (Individual Contributor 3 Interview, October
21, 2016). The depth of the effort to find out more about cultures is related to the necessity of
working with the international partners, which, coincidently, seems to correlate to the leadership
levels of the interviewees.

57
Table 13
Leadership and International Work Experience Comparing Interview to Survey: Acceptance
Interviewees Leadership Experience
International Experience
Level of agreement with acceptance: Interviews Survey Score
Executive High High High 4.33
Director/Plant Manager 1 High High High 4.33
Director/Plant Manager 2 High High High 5.00
Director/Plant Manager 3 High High High 4.00
Leader 1 Medium High High 4.67
Leader 2 Medium Low High 4.67
Leader 3 Medium Low Low NA*
Individual Contributor 1 Low Low Low 4.33
Individual Contributor 2 Low Low Low 3.33
Individual Contributor 3 Low Medium Low 4.67
* Note. Leader 3 took the survey but was added to the interview at a later time not allowing for
correlation to survey scores
At the adaptation stage, a person should accurately understand another culture from that
culture’s perspective. The three-part question asked of the interviewees, “Do you try to adapt
your communication to people from other cultures? Does it mean anything to you to look at the
world through the eyes of a person from another culture? Do you feel you have two or more
cultures?”, is to get an in-depth understanding of where the interviewees stand when it comes to
really understanding other cultures.
The majority of the interviewees at all levels (80% total) say they make some sort of
effort to adapt their communication to other cultures. Seeing the world through the eyes of

58
another person (worldview) is a little more difficult for those at the Individual Contributor level
as well as the one newer Leader (#3). One participant at the Individual Contributor level
mentioned that it is easier to see the worldview in hindsight, not in the heat of a project: “I think
that is really hard to do. It is very challenging when you are specifically working on something. I
think you almost have to step back and re-analyze” (Individual Contributor 3 interview, October
24, 2015). The Executive feels he can see a worldview from the perspective of another culture
but it isn’t always easy: “I think I do. Do I struggle with it at times? I do. What I struggle with
mostly are the groups of people that are oppressed. I see it, I accept it, I don’t respect it but I
accept it” (Executive interview, October 24, 2016). The only interviewee who thinks they are
part of more than one culture is the participant with the most experience internationally (Leader
1). The Executive and two of the Director/Plant Manager’s sense they are close to having more
than one culture but not all the way there yet (See Table 14).
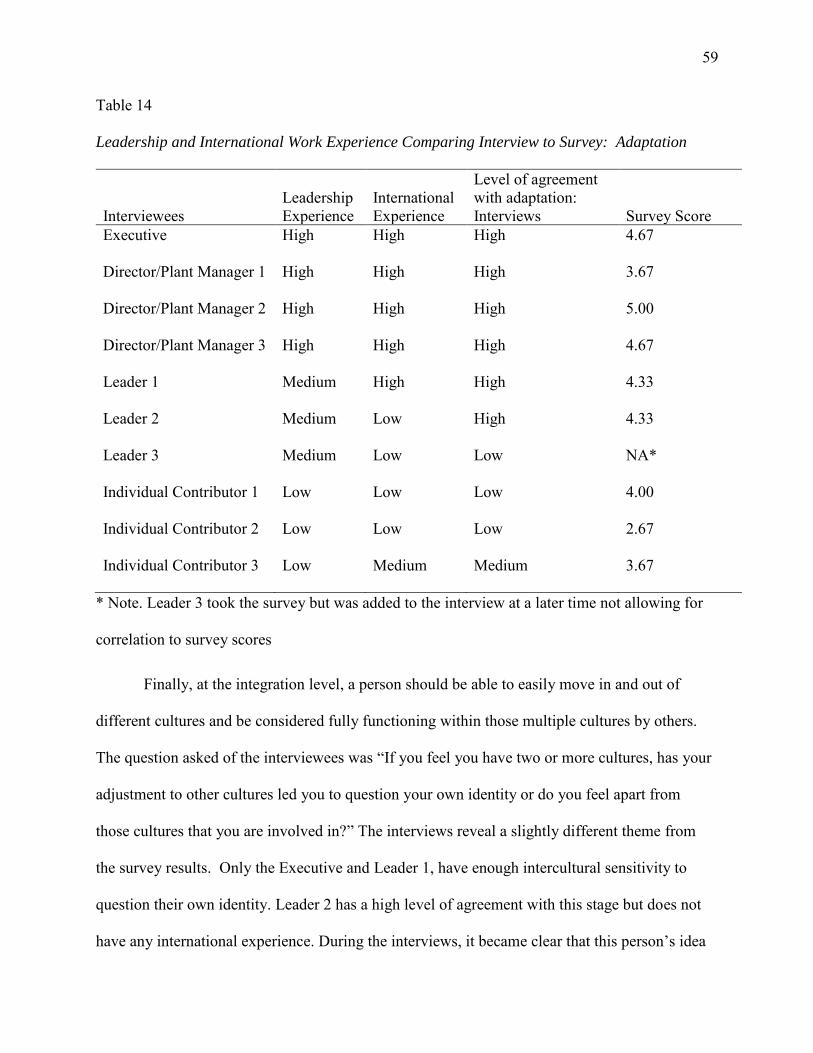
59
Table 14
Leadership and International Work Experience Comparing Interview to Survey: Adaptation
Interviewees Leadership Experience
International Experience
Level of agreement with adaptation: Interviews Survey Score
Executive High High High 4.67
Director/Plant Manager 1 High High High 3.67
Director/Plant Manager 2 High High High 5.00
Director/Plant Manager 3 High High High 4.67
Leader 1 Medium High High 4.33
Leader 2 Medium Low High 4.33
Leader 3 Medium Low Low NA*
Individual Contributor 1 Low Low Low 4.00
Individual Contributor 2 Low Low Low 2.67
Individual Contributor 3 Low Medium Medium 3.67
* Note. Leader 3 took the survey but was added to the interview at a later time not allowing for
correlation to survey scores
Finally, at the integration level, a person should be able to easily move in and out of
different cultures and be considered fully functioning within those multiple cultures by others.
The question asked of the interviewees was “If you feel you have two or more cultures, has your
adjustment to other cultures led you to question your own identity or do you feel apart from
those cultures that you are involved in?” The interviews reveal a slightly different theme from
the survey results. Only the Executive and Leader 1, have enough intercultural sensitivity to
question their own identity. Leader 2 has a high level of agreement with this stage but does not
have any international experience. During the interviews, it became clear that this person’s idea

60
of culture had to do with gender and racial diversity, not based on international culture. While an
important aspect of any company’s internal culture, gender and race were not a focus of this
research and that background information was not gathered during the survey or interviews. In
either case, he did feel it was his responsibility as a leader to make sure he understood the
cultures in his environment and did understand the concept of the integration stage. The rest of
the participants are not quite in agreement with this category even though the survey data results
how a high level of agreement with questions pertaining to integration.
Table 15
Leadership and International Work Experience Comparing Interview to Survey: Integration
Interviewees Leadership Experience
International Experience
Level of agreement with integration: Interviews Survey Score
Executive High High High 4.67
Director/Plant Manager 1 High High Low 4.33
Director/Plant Manager 2 High High Low 5.00
Director/Plant Manager 3 High High Low 4.00
Leader 1 Medium High High 4.33
Leader 2 Medium Low High 5.00
Leader 3 Medium Low Low NA*
Individual Contributor 1 Low Low Low 2.67
Individual Contributor 2 Low Low Low 2.33
Individual Contributor 3 Low Medium Low 2.67
*Note. Leader 3 took the survey but was added to the interview at a later time, not allowing for
correlation to survey scores

61
Results based on international experience including language. The partners with a
high level international experience were coincidently also all at the leadership level or higher.
The partner with the most international experience is the only participant whose first language is
not English (he speaks Portuguese as his first language and also Spanish). Four of the partners
with international experience had survey scores that put them in the Adaptation or Integration
categories. Again, they were also all Leaders or higher on the hierarchal scale for The Company.
One partner at the Leadership level and one at the Individual Contributor level were both at
Acceptance based on the survey. The interviews reveal similar results. The partners with
international experience were at a higher level of intercultural sensitivity at the Adaptation and
Integration stages than the rest of the participants. For the Leader who scored higher at the
Acceptance level on the survey, the interview answers are more consistent with an Integration
level. The interview for the Individual Contributor level partner with international experience
shows consistency with the survey results (see table 16).

62
Table 16
Comparing International Experience and Language Experience to the DMIS Levels
Interviewees International Experience
Experience with language other than primary
DMIS Level based on Interviews*
DMIS level based on Survey*
Executive High Low Ada Ada/Int
Director/Plant Manager 1 High High Acc/Ada Ada/Int
Director/Plant Manager 2 High High Ada Int
Director/Plant Manager 3 High High Acc/Ada Ada
Leader 1 High High Int Acc
Leader 2 Low Low Acc Acc
Leader 3 Low Low Min NA**
Individual Contributor 1 Low Low Acc Acc
Individual Contributor 2 Low Low Min Acc
Individual Contributor 3 Medium High Acc Acc
Note. *Min=minimization; Acc=Acceptance; Ada=Adaptation; Int=Integration
** Leader 3 took the survey but was added to the interview at a later time not allowing for
correlation to survey scores

63
Chapter V: Discussion, Conclusion and Recommendations
Up to this point in the paper we have laid the ground work for measuring intercultural
sensitivity through a discussion of the problem a lack of intercultural sensitivity can cause for a
company. We have reviewed the literature and similar studies to this research and we have
explored the survey and interview data for this research. This next section is a discussion and
interpretation of what the research data means as well as recommendations for companies to help
improve their level of sensitivity and for further research.
Discussion
There is a general understanding in the business world that as an employee moves up the
hierarchal scale within their company, their leadership skills will improve. Employees not only
bring their own experiences to the table, a company’s focus on training leaders should also train
them for handling all types of communication issues, including intercultural sensitivity. If, in
fact, a company is functioning this way, you would likely see a stair step pattern similar to the
one in Figure 2. At the left side of the chart, the ethnocentric stages, the Executives have lower
means (or less ethnocentrism) than the Individual Contributors. At some point, it levels out (as
we currently see at the acceptance level), where the majority of the company reaches its highest
level of intercultural sensitivity based on the DMIS scale and then the steps would reverse for the
ethnorelative side of the scale with Executives with the highest means (more interculturally
sensitive) and the means go down with the next few stages but still remain higher than the
Individual Contributors. Or, in a very interculturally sensitive company, the chart would only
continue to go up through at least the adaptation stage.
The company in this research has a goal of growing beyond just an international
company; they are on their way to becoming a Global company. As a reminder, global

64
companies are “firms have significant investments and profit centers with no single center of
dominance” (Fidelity, 2017). Based on the data from both the survey and the interviews, The
Company is in what Bennett would consider the intermediate DMIS stage of acceptance when it
comes to intercultural sensitivity. Bennett (2004) shows that the adaptation stage will offer a
stronger global connection and success for companies like the one in this research: “Adaptation
involves the extension of your repertoire of beliefs and behaviors, not a substitution of one set
for another” (p.71).
Research question 1. Will drawing on Milton Bennett’s 6-stage development model
of intercultural sensitivity (DMIS) to measure the levels of ethnocentrism within an
American company doing business outside of the United States show multiple stages of
ethnocentrism between employees at different hierarchal levels within the company? The
first research question looks at the different levels of ethnocentrism within the hierarchal
organization of The Company. With the survey results and the follow-up interviews, several
conclusions can be drawn. The company follows the trend of Executives having less agreement
with denial and more agreement with integration (again, showing less ethnocentrism than the
other levels). The same could be said about the Individual Contributors who are more in
agreement than the other hierarchal levels at the ethnocentric side and less in agreement at the
ethnorelative side. The interview conversations also show a similar pattern with Individual
Contributors. At the Executive level, however, the interviews reveled a slightly different angle,
one that could be considered more ethnocentric than the other leaders at The Company.
At this company, the Executives are ultimately responsible for the success of The
Company through strategic growth of the business as well as strategic growth of the team
members they are responsible for. It is important to look at the big picture at this level, to have a

65
more visionary outlook. That is not to say intercultural sensitivity issues are not their
responsibility. The Executive interviewed for this research made it very clear that strong local
leadership, whether in the U.S. or abroad is vital to the success of The Company. They are not
trying to replace local culture but, rather, embrace it. At the same time, The Company has a very
strong internal business culture, one they are not willing to give up just to have an international
(or global) business. There are certain company culture practices that may be considered
American (or more ethnocentric) but will follow The Company to every location. This looks like
denial and a lack of acceptance of another culture, but this executive brings up an interesting
point, one that does not fit neatly within the boundaries of a model like the DMIS:
The mindset is Glocal which is the blend of Global and Local . . .come in and re-
assess over time everything to try and conclude the local practices that must sustain
to be viable. The Global is . . . around values and certain standards that have to be
done [The Company] way, for lack of a better word, because we believe so strongly
in them. . .Companies that go abroad and they come in too heavy handed, and they
just Americanize it or make it their way, don’t make it. The other side, if you just
literally buy it. . . if you are not providing the leadership of what the company
stands for, you are too hands off. Its finding this balance of respect local,
understand it but you need to bring in some global standards and say over time, if
you are going to be a part of [The Company] family. (Interview with Executive,
October 24, 2016)
The business culture standards as well as any systems they put in place (such as safety, HR,
Finance or even branding) are what make The Company who they are and not just any other food
company. Again, this may look or sound like a denial or an ethnocentric attitude but as the

66
Executive explained, it is necessary to have some pushback on accepting every cultural aspect of
the international country you are moving your business into and instead keeping some of the
American culture to truly succeed at keeping your identity as an international company. The
question becomes if this thought process is what is keeping the company from moving into the
adaptation stage, which is important to becoming truly global, or does it bring up a bigger issue
in today’s world of corporate branding that the DMIS ignores?
There are several DMIS categories where the ideal trend is disrupted (see Figure 2). At
the category of denial, while the means are overall very low (not ethnocentric for any hierarchal
level) the Directors/Plant Managers have the highest mean, or, the least amount of disagreement
with those survey questions. At minimization, both Directors/Plant Managers and Leaders have
higher means than the other two groups, implying a more ethnocentric belief system. One
possible explanation for the ethnocentric leaning trend may have to do with the placement on the
hierarchal scale for Directors/Plant Managers and Leaders. As a rule of thumb, Executives
manage the Directors/Plant Managers who manage the Leaders who, in turn, manage the
Individual Contributors. As the Directors/Plant Manager and Leaders grow and learn in their
own roles, they may be more concerned with instilling the strong company culture where there is
more of an attitude of “we are one team.” According to the overall low scores, they don’t ignore
cultures or are in defense against them, but they are working to find common ground, a necessary
leadership skill. This may lead to a more ethnocentric view point at these two stages than the
rest of the hierarchal levels.
There is another possible explanation. What became apparent through the interviews is
that the term “culture” represents many different possibilities to the partners. The survey
questions for minimization, such as “I understand that differences between people from different

67
cultures exist but believe that we should focus on the similarities. We are all human” are more
generic. They do not specifically reference culture as in one country versus another. Not all the
partners work internationally and without the benefit of a face to face explanation of which
culture the questions were referencing, as in the interviews, there is a good chance that the
participants were looking at a more localized version of culture such as the plant culture versus
home office, or culture as it relates to gender. They could also be thinking of culture in terms of
the people on their own team, not in a broader, more worldly sense. Both Leaders and
Directors/Plant Managers working closely with those they are responsible for, are more likely to
want to keep the peace when there are employee issues and will likely look at similarities versus
differences which is considered more ethnocentric for the minimization stage.
Finally, at integration, Leaders have a higher mean that Directors/Plant Managers. At The
Company, Leaders work very closely with a variety of partners, not just one level of The
Company. The group also has less experience with The Company (32.5% have worked for The
Company for 0-5 years). Some might be switching jobs from a different company but many in
the Leader bracket are just out of college. When comparing someone coming out of college
today (the Leaders) versus 15-20 years ago (the Directors/Plant Managers), the business world
has become more globalized, more technological, and there is more disbursement of cultural
information. All the aspects of today’s business world are part of the collegiate experience,
giving newer graduates more exposure to global issues. This may explain why they are stronger
in the integration stage than Directors/Plant Managers.
There are anomalies that need to be pointed out. In Table 16, the means for questions 2.2
and 2.3 were 1.5 and 1.94 consecutively. Question 2.1 has a much higher mean of 3.87. A
couple of modifications were made to the original question. The Original Question was: “I have

68
lived for at least 2 years in another country and believe that American society should embrace
the values of this other culture in order to address the problems of American contemporary
society” (Olson & Kroeger, 2001, p. 126). The contact at The Company for this research
suggested removing the first part of the question about living in a different country for two years
(this made the question a confusing two-part question) and modifying to acknowledge the
partners who speak English as a second language. Also, since the survey included the Madrid
partners, the references to “America” in the original question was replaced with “my country”
(see Table 19, Q 3.1 for modified version of the question). Removing this question from the
research would have brought the average mean down for the minimization stage but since the
mean even with this question included is still in the low category (a low level of ethnocentrism),
the results would not change so the question was left in the data results.
There is also an anomaly with question 3.2: “I think that all human beings are subject to
the same historical forces, economic and political laws or psychological principles. These
forces, laws or principles are invariable across cultures” (see table 19). This question has a
considerably lower mean (2.55) than question 3.1 (mean=3.87) or question 3.3 (mean=3.8).
There was a comment sent to the company representative suggesting that some of the questions
were two questions in one, which were hard to answer. This was one of those questions. If they
agreed with one part of the question but not the other, it is likely they went with a lower answer.
What is interesting to note is the survey was conducted during the final months of a very
divided and highly emotional American political campaign, especially where it pertained to the
acceptance of other cultures. This also could have had an impact on the response to question 3.2,
or a number of the other questions in the survey that relate to getting along with other cultures,
such as question 3.1: “I understand that cultural differences between people from different

69
cultures exist but believe that we should focus on similarities. We are all human.” Since it is not
possible to say exactly why the mean is lower, the decision was made to keep the question in the
data.
For research question 1, using Milton Bennett’s 6-stage DMIS does show significant
differences in all three ethnocentric stages and adaptation and integration on the ethnorelative
stages within the company’s hierarchal levels. The acceptance level on the ethnorelative side was
not significantly different across the hierarchal levels. This information was verified with follow-
up interviews.
Research question 2. If the first language of the employee is not English, will there
be a significant difference between the six stages of the DMIS categories of denial, defense,
minimization, acceptance adaptation and integration? The research participants were from
the U.S. home office or the Madrid location but some partners may travel to multiple company
locations throughout Europe. Several more have transferred to Madrid from the U.S. or to the
U.S. from other countries. Of the partners speaking a language other than English as their first
language, 68.4 % work in the international department at The Company. The Company also has
a requirement that anyone in a leadership role must speak English.
Partners that can speak multiple languages have also most likely been exposed to
multiple cultures along the way, whether through family members or their own personal
experiences, such as living abroad during college. Along the same lines, if there are partners that
grew up in any of the European countries, for example, there is a high likelihood that they have
been exposed to multiple cultures over time purely because of the proximity to other countries
and the freedom to travel easily between those countries. As Bennett (2004) states, “a
sophisticated sojourner can observe subtle differences in nonverbal behavior or communication

70
style, while a naïve traveler may notice only differences in the money, the food, or the toilets. As
categories for cultural difference become more complex and sophisticated, perception becomes
more interculturally sensitive” (p. 73). It should not be surprising, then, that at the ethnorelative
side of the DMIS scale, both Spanish and “Other” languages have the highest means for the three
categories but especially notable at adaptation and integration: they are more interculturally
sensitive than their English as a first language counterparts.
The anomaly comes in with Spanish speakers at the ethnocentric side of the scale. They
have the highest means for all three DMIS categories. There are numerous possibilities for this
trend. Since the Madrid plant was included in the survey but not the Mexico plant, it is more
likely that the Spanish speakers are coming from Madrid. According to a U.S. partner at the
Director/Plant Manager level currently working in Madrid: “Spain is not an English-speaking
country. Movies are dubbed into Spanish versus using captions. Partners in Spain don’t speak it
[English] very much so language is more of a barrier here” (Director/Plant Manager 1 Interview,
November 21, 2016). Whether this is because of a more monoculture society, like the US, or for
some other reason, their weaker disagreement with the ethnocentric side of the scale could be a
correlation to language usage. The fact that they are similar to the “Other” language speakers on
the ethnorelative side could represent that they are still part of Europe and do have exposure to
other cultures on a more regular basis.
For research question 2, there is a significant difference between those from the “other”
category versus the English speakers for all six DMIS stages. The significant difference between
Spanish speakers and English speakers does not appear until the last two ethnorelative stages.
Without more interview information from multiple non-English speakers, it is difficult to say

71
with any level of certainty that it is just the difference in first language that causes the
statistically significant differences.
Research question 3. Will a comparison of length of time an employee has lived
outside of the U.S. show a significant difference between the six stages of the DMIS
categories of denial, defense, minimization, acceptance adaptation and integration? To help
employees working with international partners, The Company does offer some small bits of
cultural educational information through various means (printable materials, information in their
internal newsletter, classes for expats). When asked during the interviews, only two interviewees
took advantage of these materials and most of the other interviewees didn’t know about the
resources or did not feel they were very helpful. Most of the partners working internationally
have had to learn lessons through trial and error, not always in a positive way, or through past
personal experience such as living abroad. One of the interviewees from the Director/Plant
Manager level, who has lived outside of the U.S. for two plus years and has years of company
and leadership experience was even caught off-guard in a situation with a new but very direct
boss who didn’t like a project she had done for him. She took it personally until a co-worker
reminded her that her new boss comes from a culture where directness is expected. With that
context in mind she moved past the original conflict.
Bennett (2004) does make it clear that intercultural sensitivity comes with exposure to
other cultures more than any other way. It can’t always be taught in a classroom. This final
research question, looking at the amount of time partners have spent living outside their home
country, shows just that. In general, the more experience a partner had with living somewhere
outside of their home country, the more advanced they were in intercultural sensitivity. This is
especially pronounced with partners who have lived two or more years outside of their home

72
country for five of the six stages and particularly at the integration stage compared to all other
categories.
One of the interviewees was a Leader who is originally from Brazil, worked for five
years in the U.S. and has been in Madrid for the last two years. He describes how long it took to
really feel integrated into the U.S. culture: “Probably after two or three years in the U.S. Before
that you are experiencing and learning about the other cultures but that is not enough to change
the way you do things. After two to three years it starts to stick” (Leader 1 interview, October 24,
2016).
For research question 3, the data does show that the longer a person has lived outside of
their home country, the more interculturally sensitive (ethnorelative) they are. There is a
significant difference between the six stages of the DMIS. Information from several of the
interviewees also verified what the survey data shows.
Conclusions
There are several key take-aways from this research. This first one does conflict with
some of the research from Bennett (2004). It is very clear Bennett argues that to progress to a
more interculturally sensitive company, a company needs to find a way of not just accepting of
other cultures but also have two cultures working at the same time (adaptation). While it is
logical that a company would need to evolve and transform to work with overseas partners, there
is a strong argument that a company IS its culture. In today’s competitive business world, brand
or company identity is an important piece to the success of a company. How does a company
“adapt” yet keep that identity in place? Is a more globalized business world more accepting of
business culture and therefore less evolution is necessary? I do feel it is very important to evolve
to the adaptation stage, and a company truly in this stage described by Bennett (2004) will be

73
able to resolve a lot of the cultural issues. That said, there is a new reality in the business world,
including globally, and separating brand identity from its culture may not work anymore. It is
still a progression within the adaptation stage but with more recognition of a singular cultural
identities.
A second point brought out in this research is that a company must also be able to
recognize when the culture of a potential international partner conflicts too much with their own.
They need to consider whether venturing into a particular country is the right business decision.
Several times, during the interviews, the Caste system in India (one of The Company locations)
was brought up as a difficult cultural aspect to watch from an American point of view but also
recognizing that The Company had to accept it since they weren’t able to change the country’s
culture. While cultures need to be accepting of each other to be considered ethnorelative, if there
is a cultural behavior in another part of the world that is detrimental to the people a company
would be working with, that is a risk they need to take seriously in making the business decision
to expand internationally.
Jumping into overseas markets without much thought to the cultural risks is a mistake
that less interculturally sensitive companies or companies new to international markets, will
make. If the right leadership is not in place, a Glocal one (a combination of global and local
practices with a local expert on site to guide the global experts), as the Executive points out, the
risk of failure due to cross-cultural issues is high. At the same time, a company needs to
understand that the risk is there at all in order to educate themselves on how to succeed
internationally They need to know what they don’t know. Training needs to happen on both sides
but in this case, The Company does not go into new markets, or at least ones they are not

74
intimately familiar with, without an advisor of some sort on the ground in that potential new
market.
This leads into another point from similar research by Bennett (2004). The more
experience an individual, or a company has with other cultures, the more interculturally sensitive
(more ethnorelative and less ethnocentric) they are. It takes exposure and hands-on experience to
truly advance to the ethnorelative side of the DMIS scale. Over and over similar comments were
made during the interviews that problems with intercultural communication were diminished
with the opportunity to meet face to face: “There is nothing better than breaking bread with
people around the world to learn about their culture and what motivates them” (Director/Plant
Manager 2 Interview, November 21, 2016).
Intercultural sensitivity does not happen overnight. This research has good evidence
correlating the amount of time a partner has spent living outside their home country with where
they are on the DMIS scale. The company in this research has been doing business in
international markets since 1992. They now have plants in 13 countries and export goods to over
55 countries. Even with this experience they readily admit they are still learning and working
towards becoming a truly global company.
The final point brought out by the research is looking at cross-cultural risk from the
standpoint of the people in The Company. While the statistics show that the overall trends for
intercultural sensitivity within the hierarchal levels are similar, there is still enough of a
difference between the hierarchal levels to recognize that those lower on the hierarchal scale are
not being exposed to the proper information to help them through intercultural issues. The
interviews showed the difference between leaders that had experience dealing with intercultural
issues and Individual Contributors that were really learning as they go. The less global a

75
company is, the less this risk may affect them. To go global, though, the people at all levels of
the organization must have a broader understanding of the issues revolving around intercultural
sensitivity. The risk needs to be managed.
Recommendations
The Company has goals to become a Global company, a step beyond where they
currently are. It is the partners of The Company that will help them get there more than any other
aspect of doing business. To reach the goal of continued expansion globally, The Company will
want to educate and expose their partners to a wider variety of world views to recognize and
minimize conflicts surrounding intercultural sensitivity in the workplace. Training programs are
a piece of this puzzle and should be available for all partners in The Company, not just those at
the leadership levels. When a company is global, even if all employees don’t technically work in
the international side of the business, they will still have direct contact with international partners
from other cultures no matter which department they work in. It was also made clear in this
research that direct exposure to other cultures is better than learning in a classroom. On a large
scale, that may be difficult to do for all partners at The Company. It may be important, in the
future, to hire partners that already come to the table with international experience either through
living with multiple cultures or having traveled and lived internationally for a significant amount
of time. Managing the intercultural risk is vital to The Company’s long term Global goals.
The company used for this research has had several decades of international growth and
experience, much of it before technology was as widespread as it is today. Further research
would benefit from comparing a company with experience to one just starting the international
business journey. The research should focus on the differences younger international companies
experience versus the more established and experienced international companies. While it may

76
be easier than in the past to start an international business, it would be interesting to find out if it
is also easier to succeed or if technology has just increased the level of competition for
businesses.

77
References
Baraldi, C. (2006). New forms of intercultural communication in a globalized
world. International Communication Gazette, 68(1), 53-69.
doi:10.1177/1748048506060115
Bennett, M. J. (1998). Intercultural communication: A current perspective. In Milton J. Bennett
(Ed.) Basic concepts of intercultural communication: Selected readings. (pp. 1-34).
Yarmouth, ME: Intercultural Press.
Bennett, M. J. (2004). Becoming interculturally competent. In J.S. Wurzel (Ed.) Toward
Multiculturalism: A Reader in Multicultural Education. (pp. 62-77). Newton, MA:
Intercultural Resource Corporation.
Ehrenreich, S. (2010). English as a business lingua franca in a German multinational corporation:
Meeting the challenge. Journal of Business Communication, 47(4), 408-421.
doi:10.1177/0021943610377303
Fidelity (2017). Understanding the differences between domestic, international, and global
companies. Retrieved from https://www.fidelity.com/learning-center/trading-
investing/fundamental-analysis/domestic-international-global-companies
Hammer, M. R., Bennett, M. J.,Wiseman, R. (2003). Measuring intercultural sensitivity: The
intercultural development inventory. International journal of intercultural relations, 27,
421-443. Doi:10.1016/S0147-1767(03)00032-4
Hout, T. M., Porter, M. E., & Rudden, E. (1982). How global companies win out. Harvard
Business Review, 60(5), 98-108.
Leininger, C. & Yuan, R. (1998). Aligning international editing efforts with global business
strategies. IEEE Transactions on Professional Communication, 41(1), 16-23.

78
Louhiala-Salminen, L., & Kankaanranta, A. (2011). Professional communication in a global
business context: The notion of global communicative competence. Professional
Communication, IEEE Transactions on, 54(3), 244-262. doi: 10.1109/TPC.2011.2161844
Maclean, D. (2006). Beyond English. Management Decision, 44(10), 1377-1390.
doi:http://dx.doi.org/10.1108/00251740610715704
Marquette University Risk Unit. (n.d.). What is risk management. Retrieved from
http://www.marquette.edu/riskunit/riskmanagement/whatis.shtml
Meyer, E. (2014). The culture map: Breaking through the invisible boundaries of global
business. Philadelphia, PA: Public Affairs.
Neuliep, J. W. (2014). The necessity of intercultural communication. Intercultural
communication: A contextual approach. New York, NY: Sage Publications.
Olson, C. L., Kroeger, K. R. (2001). Global competency and intercultural sensitivity. Journal of
Studies in International Education, 5(2), 116-137. Doi:10.1177/102831530152003
Perlmutter, H. V. (1969). The torturous evolution of the multinational corporation. Columbia
Journal of World Business, 9-18.
Pew Research Center. (2014, March 11). World wide web timeline. Retrieved from
http://www.pewinternet.org/2014/03/11/world-wide-web-timeline/
Pew Research Center. (2015, December 21). Home broadband 2015. Retrieved from
http://www.pewinternet.org/2015/12/21/home-broadband-2015/
Popescul, D. (2009). Information and communication technologies: One engine of
globalization. CES Working Papers, 1(2), 20-36.
79
Qingwen, D., Day, K. D., & Collaço, C. M. (2008). Overcoming ethnocentrism through
developing intercultural communication sensitivity and multiculturalism. Human
Communication, 11(1), 27-38.
Trading Economics. (2016). United States exports of goods and services. (2016). Retrieved from
http://www.tradingeconomics.com/united-states/exports
Washington, M. C. (2013). Intercultural business communication: An analysis of ethnocentrism
in a globalized business environment. Journal of Business & Management, 1(1), 20-27.
Wu, X., & Zhang, S. (2009, September). Identification of cross-cultural risk in multicultural
interactions of transnational corporations. In Management and Service Science, 2009.
MASS'09. International Conference on (pp. 1-4). IEEE.

80
Appendix A: Denial Means and Percentage of Scores 4 or Above
Denial Questions
% scoring 4 or above (Somewhat Agree or Agree) Mean
1.1 I do not really notice cultural differences. 14.1% 1.83 1.2 I have intentionally sought to live in a racially or
culturally separate community 11.7% 1.91
1.3 I think that cultural diversity really only exists in other places.
3.4% 1.48
Averages for the category 9.7% 1.74

81
Appendix B: Defense Means and Percentage of Scores 4 or Above
Defense Questions
% scoring 4 or above (Somewhat Agree or Agree) Mean
2.1 I believe that people from my country should embrace the values of other cultures in order to address the problems of my country's contemporary society.
71.5% 3.87
2.2 I am surrounded by culturally diverse people, and I feel like my cultural values are threatened.
4.3% 1.50
2.3 I sometimes find myself thinking derogatory things about people who look or act differently from me.
14.7% 1.94
Averages for the category 30.1% 2.44

82
Appendix C: Minimization Means and Percentage of Scores 4 or Above
Minimization Scores
% scoring 4 or above (Somewhat Agree or Agree) Mean
3.1 I understand that differences between people from different cultures exist but believe that we should focus on similarities. We are all human.
69.4% 3.87
3.2 I think that all human beings are subject to the same historical forces, economic and political laws, or psychological principles. These forces, laws or principles are invariable across cultures.
32.2% 2.55
3.3 I believe that physical displays of human emotions are universally recognizable: A smile is a smile wherever you go.
73.4% 3.80
Averages for the Category 58.3% 3.41

83
Appendix D: Acceptance Means and Percentage of Scores 4 or Above
Acceptance Questions
% scoring 4 or above (Somewhat Agree or Agree) Mean
4.1 I believe that verbal and nonverbal behavior vary across cultures and that all forms of such behavior are worthy of respect.
94.5% 4.64
4.2 I acknowledge and respect cultural difference. Cultural diversity is a preferable human condition.
90.0% 4.43
4.3 I think that cultural variations in behavior spring from different worldview assumptions.
75.7% 3.88
Averages for the Category 86.7% 4.32

84
Appendix E: Adaptation Means and Percentage of Scores 4 or Above
Adaptation Questions
% scoring 4 or
above (Somewhat
Agree or Agree) Mean
5.1 I have added to my own cultural skills new verbal
and nonverbal communication skills that are
appropriate in another culture.
60.1% 3.69
5.2 I believe that culture is a process: One does not have
culture, one engages in culture.
64.7% 3.67
5.3 I am able to temporarily give up my own worldview
to participate in another worldview.
70.0% 3.84
Averages for the category 64.9% 3.73

85
Appendix F: Integration Means and Percentage of Scores 4 or Above
Integration Questions
% scoring 4 or above (Somewhat Agree or Agree) Mean
6.1 I can act as a cultural mediator and serve as a bridge between people of different cultures.
39.0% 3.02
6.2 I am able to analyze and evaluate situations from one or more chosen cultural perspectives.
51.9% 3.42
6.3 When faced with a choice about how I am going to respond to a given situation, I am able to shift between two or more cultural perspectives and consciously make a choice to act from one of these cultural contexts.
50.3% 3.43
Averages for the category 47.0% 3.29

86
Appendix G: Survey Questions
1. How long have you worked for The Company? 0-5 years (1) 6-10 years (2) 11-15 years (3) 16-20 years (4) 21 or more years (5)
2. Please choose which location you are currently working from:
US Home Office (including those working remotely) (1) U.S. Production Plant (2) Outside of the U.S. (3)
3. Which area(s) are you currently working in? (Choose all that apply)
International (1) Finance (2) HR (3) Enterprise Quality (4) Legal/Regulatory (5) Operations (6) Supply Chain (7) Sales (8) Information Systems (9) Product Life Cycle Strategies (10)
4. Choose the selection below that best matches your current position:
Executive (1) Director/Plant Manager (2) Leader (3) Individual Contributor (4)
5. I have lived outside of my home country for: Six months or less (1) more than six months but less than one year (2) more than one year but less than two years (3) more than two years (4) I have never lived outside of my home country (5)
6. Which language is your first language:
English (1) Spanish (2) French (3) Italian (4) German or German Dialect (5) Chinese or Chinese Dialect (6) Portuguese (7) Russian (8) Japanese (9) Hindi (10) Arabic or Arabic Dialect (11) Bengali (12) Other (13) If you chose "Other", please write in your language below
7. I use a language other than my first language:
occasionally (1) on a regular basis but not every day (2) every day (3) I don't use another language (4)
8. I am currently engaged in professional work with at least three people in another country
(or countries): 1-5 hours per week (1) 6-10 hours per week (2) 0-15 hours per week (3) more than 15 hours per week (4) I do not engage with professionals in any other countries (5)
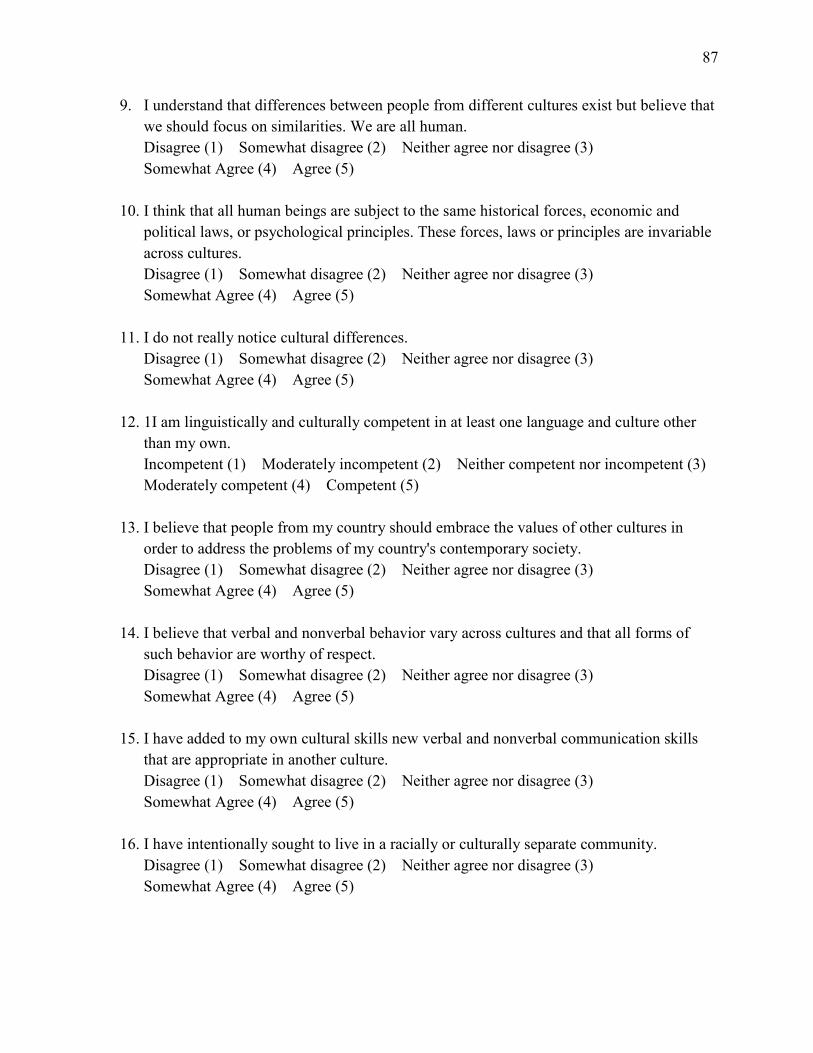
87
9. I understand that differences between people from different cultures exist but believe that we should focus on similarities. We are all human. Disagree (1) Somewhat disagree (2) Neither agree nor disagree (3) Somewhat Agree (4) Agree (5)
10. I think that all human beings are subject to the same historical forces, economic and
political laws, or psychological principles. These forces, laws or principles are invariable across cultures. Disagree (1) Somewhat disagree (2) Neither agree nor disagree (3) Somewhat Agree (4) Agree (5)
11. I do not really notice cultural differences.
Disagree (1) Somewhat disagree (2) Neither agree nor disagree (3) Somewhat Agree (4) Agree (5)
12. 1I am linguistically and culturally competent in at least one language and culture other
than my own. Incompetent (1) Moderately incompetent (2) Neither competent nor incompetent (3) Moderately competent (4) Competent (5)
13. I believe that people from my country should embrace the values of other cultures in
order to address the problems of my country's contemporary society. Disagree (1) Somewhat disagree (2) Neither agree nor disagree (3) Somewhat Agree (4) Agree (5)
14. I believe that verbal and nonverbal behavior vary across cultures and that all forms of
such behavior are worthy of respect. Disagree (1) Somewhat disagree (2) Neither agree nor disagree (3) Somewhat Agree (4) Agree (5)
15. I have added to my own cultural skills new verbal and nonverbal communication skills
that are appropriate in another culture. Disagree (1) Somewhat disagree (2) Neither agree nor disagree (3) Somewhat Agree (4) Agree (5)
16. I have intentionally sought to live in a racially or culturally separate community.
Disagree (1) Somewhat disagree (2) Neither agree nor disagree (3) Somewhat Agree (4) Agree (5)

88
17. I can act as a cultural mediator and serve as a bridge between people of different cultures. Disagree (1) Somewhat disagree (2) Neither agree nor disagree (3) Somewhat Agree (4) Agree (5)
18. I think that cultural diversity really only exists in other places.
Disagree (1) Somewhat disagree (2) Neither agree nor disagree (3) Somewhat Agree (4) Agree (5)
19. I am surrounded by culturally diverse people, and I feel like my cultural values are
threatened. Disagree (1) Somewhat disagree (2) Neither agree nor disagree (3) Somewhat Agree (4) Agree (5)
20. I feel self-confident and comfortable socializing with people from other cultures.
Disagree (1) Somewhat disagree (2) Neither agree nor disagree (3) Somewhat Agree (4) Agree (5)
21. I believe that physical displays of human emotions are universally recognizable: A smile
is a smile wherever you go. Disagree (1) Somewhat disagree (2) Neither agree nor disagree (3) Somewhat Agree (4) Agree (5)
22. I am able to analyze and evaluate situations from one or more chosen cultural
perspectives. Disagree (1) Somewhat disagree (2) Neither agree nor disagree (3) Somewhat Agree (4) Agree (5)
23. I believe that culture is a process: One does not have culture, one engages in culture.
Disagree (1) Somewhat disagree (2) Neither agree nor disagree (3) Somewhat Agree (4) Agree (5)
24. I acknowledge and respect cultural difference. Cultural diversity is a preferable human
condition. Disagree (1) Somewhat disagree (2) Neither agree nor disagree (3) Somewhat Agree (4) Agree (5)
25. I sometimes find myself thinking derogatory things about people who look or act
differently from me. Disagree (1) Somewhat disagree (2) Neither agree nor disagree (3) Somewhat Agree (4) Agree (5)

89
26. When faced with a choice about how I am going to respond to a given situation, I am able
to shift between two or more cultural perspectives and consciously make a choice to act from one of these cultural contexts. Disagree (1) Somewhat disagree (2) Neither agree nor disagree (3) Somewhat Agree (4) Agree (5)
27. I am able to temporarily give up my own worldview to participate in another worldview.
Disagree (1) Somewhat disagree (2) Neither agree nor disagree (3) Somewhat Agree (4) Agree (5)
28. I think that cultural variations in behavior spring from different worldview assumptions.
Disagree (1) Somewhat disagree (2) Neither agree nor disagree (3) Somewhat Agree (4) Agree (5)
If you would be willing to participate in a follow-up interview, please add your name and contact information below. All personal information and responses will be kept private and confidential. Name (1) Phone Number (2) Email Address (3)

90
Appendix H: Interview Questions
1. Could you tell me what you do here?
2. Do you personally have any communication with partners outside of the US?
3. Which country are they located in?
4. What form of communication do you use (Email, phone, video conferencing, in person)?
5. When looking at the organizational levels, can you choose where they fall on the chart?
Do you know which department they are in?
6. How would you describe the level of communication with the partner(s)?
7. Do you run into any complications when trying to communicate with partners outside of
the US? Either language or business misinterpretations? Can you give an example?
8. Do you feel your co-workers (at all levels of the organization) who also work with
international partners have the same communication experiences you do? Please explain.
9. Can you describe what kind of training The Company offers to prepare you to work with
those outside of the United States?
10. On a scale of 1-5 with five being excellent and 1 being poor, how would you rate The
Company in terms of keeping partners informed of what is going on with The Company
as a business as well as general internal communications?
11. Do you have an example of something positive?
12. Do you have an example of where internal communications need improving?
13. Do you feel your organization is responsive to change when employees have brought up
suggestions or solutions to potential communication issues? Please elaborate on an
experience you have personally had or know of.

91
Appendix I: Interview Questions from Hammer, M.R. et al (2003)
1. Do you think there is much cultural differences around here? (Denial)
2. What kinds of difficulties or problems associated with having cultural differences around
here exist? (Defense)
3. When it comes down to the bottom-line, is it more important to pay attention to cultural
differences or similarities among us. If respondent emphasizes the importance to pay
attention to similarities, follow-up with, “What do you think the similarities are?”
(Minimization)
4. Do you make any specific efforts to find out more about the cultures around you?
(Acceptance)
5. Do you try to adapt your communication to people from other cultures? (Adaptation)
6. Does it mean anything to you to look at the world through the eyes of a person from
another culture? (Adaptation)
7. Do you feel you have two or more cultures? (Adaptation)
8. Has your adjustment to other cultures led you to question your identity? Do you feel apart
from those cultures that you are involved in? (Integration).
Copyright © 2022 FDOKUMEN

