


Bahasa
Halaman
Hukum

1
Satisfaction Levels of International Patients Seeking Medical Care
From Tertiary Care Hospitals In New Delhi, India
Authors: Indu Grewal*, JK Das*, J Kishore**, Deoki Nandan*
Institution: *National Institute of Health & Family Welfare, Munirka, New Delhi, India
**Maulana Azad Medical College, New Delhi, India
Corresponding address: Dr. Indu Grewal, MD (Community Health Administration) 2nd
Year
student National Institute of Health & Family Welfare (Government of India) New Delhi
110067; email: [email protected], phone:00-98-18-11-03-46
Abstract
Background: Medical Tourisms is fast growing sector in which international patients are
receiving treatments at various destination sites including India. Objective: To assess the
satisfaction of international patients who were getting medical services in tertiary care hospitals
in New Delhi, India. Methods: In a cross-sectional study 49 patients were approached in 6
tertiary care hospitals in New Delhi for interviews. Out of these, 44 (89.8%) had given written
consents for the interview. The information was collected by using pre-tested interview schedule
and analyzed by SPSS version 16. Results: Out of 44 international patients, 17 (36.6%) came
were from South-Asian Association for Regional Corporation (SAARC) countries, 12 (27.3%)
from Africa, 5 (11.4%) from USA and Canada, 2 (4.5%) from Gulf, and 8 (18.2%) from other
countries. Their average age was 45.3 years (range from 18 to 80 years). 68.2% of them were
working. Two third patients (68.2%) had visited New Delhi on medical visa for their treatment.
Most of the patients were satisfied with doctors, nursing care, room and toilet cleanliness, and
reception services, except for the taste of food. Conclusions: Overall services provided to
International patients in New Delhi were satisfactory. However, there were scopes for
improvement in nursing care, better room facilities and food taste.
Key words: Patients’ satisfaction, International patient, Quality of service, Medical tourism
2
INTRODUCTION
Traveling to other countries for medical treatment is an emerging concern for health and tourism
sectors throughout the world. This is due to the fact that in last two decades globalization and
advancement in technologies throughout the world including India brought many reforms in management of medical
conditions. Technological advancement improved the quality but at a very high cost, which resulted in many fold
increase in the cost of medical treatment.1-3
Whereas in comparison to the Western world the cost of these services
was still lower in the developing countries due to various reasons, such as availability of resources and professional
manpower at lower cost. 3-5
Asian countries like Thailand, Singapore, India, South Korea and
Malaysia are attracting 1.3 million medical tourists per year from around the world, and this
number is increasing annually. The estimated worth of medical tourism in Asia alone would be
“at least $4 billion” by 2012. India attracted an estimated 100,000 medical tourists in 2005.6-7
Confederation of Indian Industries (CII)-McKinsey report8 states that the medical tourism market in the country
pegged a 30% growth in 2000. Medical tourism is likely to increase faster in the future as cost of medical care
continues to increase.
India although a developing country, good quality of health care is achieved due to availability of highly skilled and
qualified human resources. Delhi, the capital of India, has large number of hospitals providing medical services.
Quality of medical care in hospitals of Delhi is an important concern. Patient’s satisfaction is one of the core
outcome measures for quality of medical care9 and better indicator than measures of health care
effectiveness or efficiency.10
It is a fully subjective assessment of the quality of health care and,
as such, is not a measure of final outcome. Evidence has suggested that care, which is less than
satisfactory to the patients, is also less effective and may reflect a failure to answer patients’
needs, meet their expectations, or provide an acceptable standard of service.11
The patients’
satisfaction can be measured by qualitative or quantitative methods12
but personal interview
3
survey is well accepted. However, very little is known about the satisfaction of international patients
coming as medical tourists in India. Hence, the present study was undertaken to determine the
satisfaction among international patients visiting Delhi for medical care.
MATERIAL AND METHODS
In a cross sectional study, out of 34 tertiary-care hospitals 14 (41.1%) were randomly selected.
Of these, only eight (57%) hospitals were providing health care services to international patients.
Two hospitals out of eight didn’t give permission to conduct interview of international patients.
Hence from these 6 hospitals, 49 patients were selected for interview that had come primarily for
treatment and were in the recovery phase. The data was collected from the month of August
2008 to October 2008. Patients with following criteria were excluded: a) who had come
primarily as a tourist and during their stay in India, fell ill and thus sought medical care; b) who
were living in India because of their Indian assignment or job or working in Embassies in India
and fell ill; and c) international patients who were seriously ill and could not provide reliable
information or admitted in intensive care unit. To collect the information on the patient’s
satisfaction, a pre-tested interview schedule was used. Individual responses were recorded on
five points Likerts’ scale. A written consent was obtained from each patient before starting the
interview. In case of difficulty in getting information due to language problem help of interpreter
appointed by the concerned hospital or the attendant of the patient was taken. Out of 49
international patients contacted, only 44 patients could be interviewed by using pre-tested
interview schedule because 5 patients didn't give their consent for interviews.
Analysis: Collected data was tabulated in Microsoft excel sheet and analyzed using the software
Statistical Package of Social Science (SPSS) version 16.0. The international Patients’ satisfaction
4
with hospital care was measured using a 5-point Likert evaluation rating scale (poor, average,
good, very good, excellent). Poor quality of services was scored as 1 and for excellent quality it
was scored 5. They addressed satisfaction with doctors, resident doctors, sisters, hospital rooms
and other services. For some parameters international patients were asked to give their
observation in average time as per their experience. These items were analyzed by taking their
average and range.
RESULTS
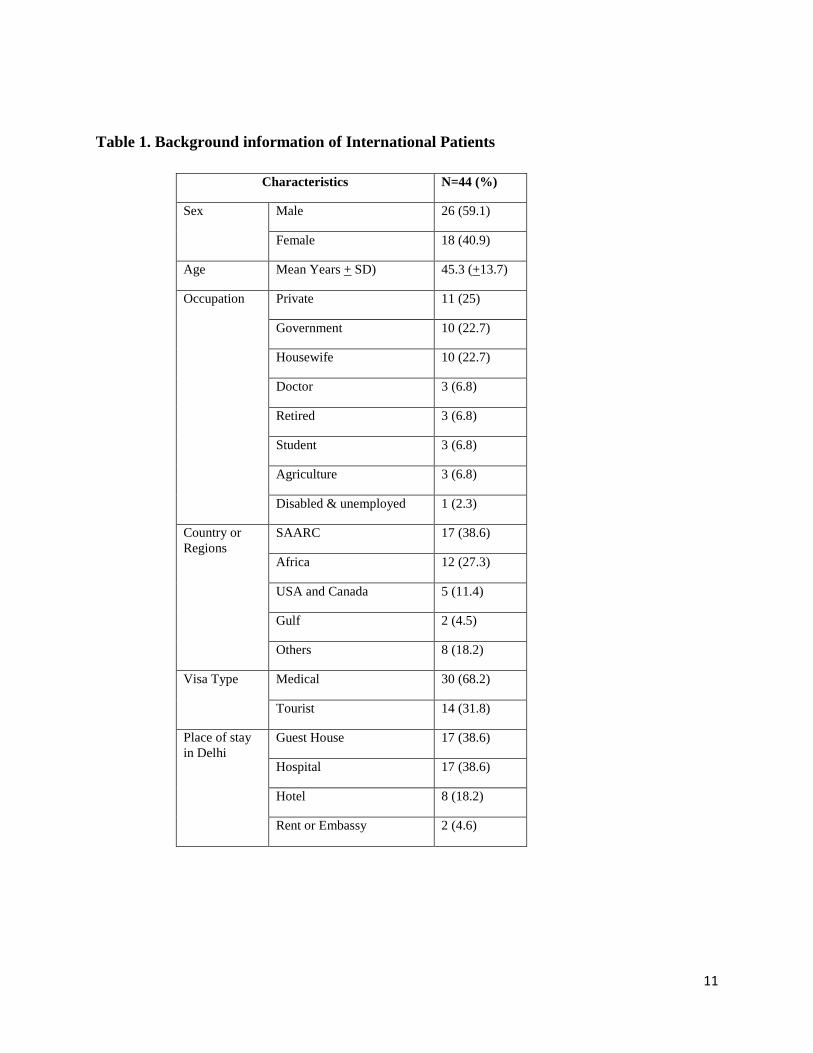
Forty-four among 49 international patients agreed to be the part of this study. Thus the response
rate was 89.8%. Among the 44 international patients 26 (59.1%) were male and 18 (40.9%) were
female. The average age was 45.3 years (±13.7SD) with the range between 18 years and 80
years. 25% patients were in private jobs, 22.7% each were in Government service and
housewives, 6.8% each were medical doctors, retired, students and agriculture. Of the total 44
international patients interviewed, 17 (38.6%) were from the SAARC countries, 12 (27.3%) were
from African countries, 5 (11.4%) were from USA & Canada, 2 (4.5%) were from Gulf countries
and 8 (18.2%) from other countries that include Iraq, Dubai, Russia, and Myanmar. 68.2%
patients came on Medical Visa whereas 31.8% had come on Tourist Visa. Most of them were
staying in guesthouse (38.6%) and hospitals (38.6%). However, 18.2% were staying in Hotels
and few in Embassies or rented accommodation (4.6%). They were admitted to various inpatient
departments of the selected hospitals i.e. Gastroenterology (25%), urology (15.9%), Cardiology
(13.6%), Orthopedics (11.4%), Gynecology (4.5%), Hematology (2.3%), Nephrology (2.3%),
General Surgery (2.3%) and Ophthalmology (2.3%).
5
Perception regarding the quality of services
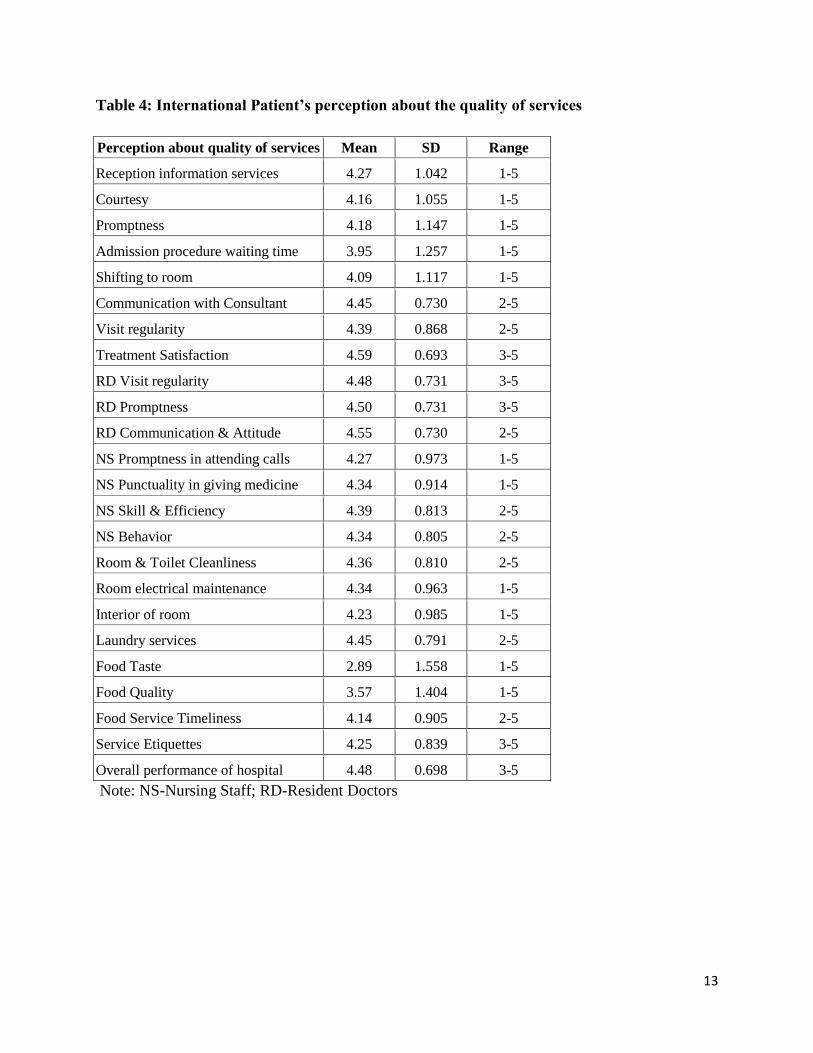
Reception services and Admission procedure: Reception services included provision of
information at reception counter, courteousness of staff and promptness in service for any query
were scored 4.27 (SD±1.04), 4.16 (SD±1.05), 4.18 (SD±1.14) respectively that indicates very
good to excellent grading for these services by the patients. Mean scores for admission
procedures that included waiting time for admission and shifting to room were 3.95 (SD±1.25)
and 4.09 (SD±1.11) respectively (Table 2).
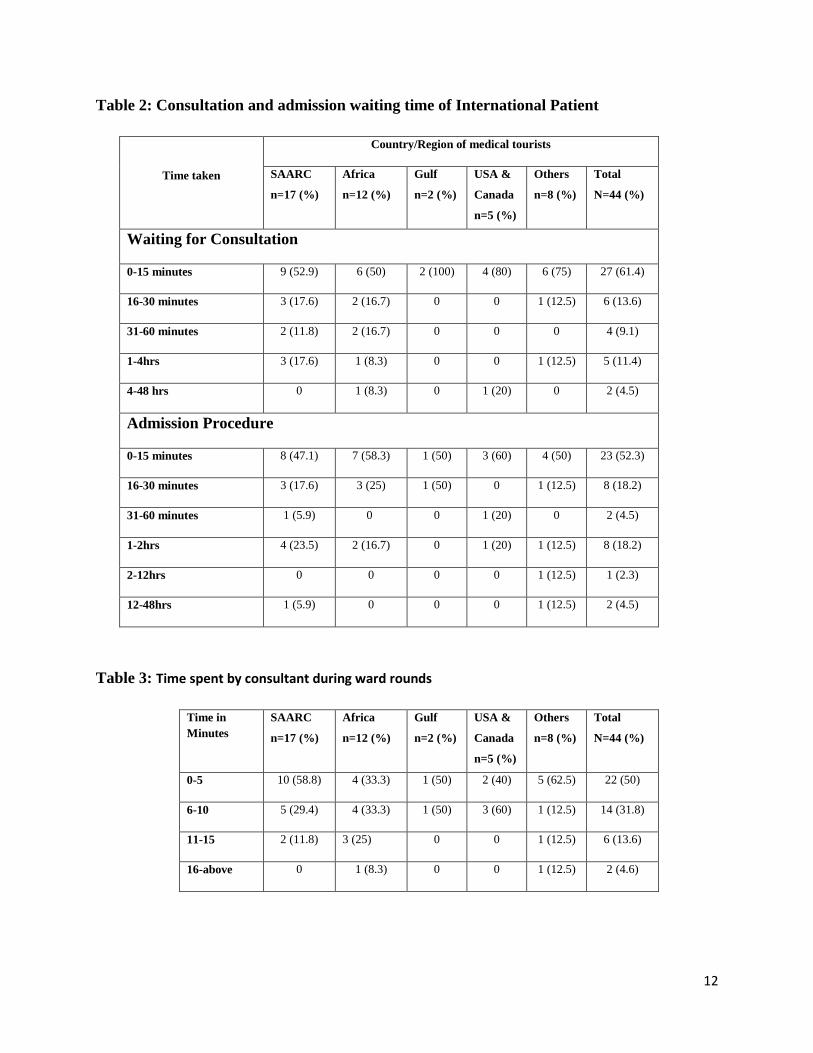
Average time taken in admission procedure was 15 minutes with the range from 0 minute to 48
hours. When patients’ responses were split according to time interval then it was found that
70.5% of the patients were admitted within 30 minutes time. Only in 2 cases the duration was
more than 12 hours. Majority had given good and very good scores except in some cases where
grading was poor for time taken in admission (Table 2).
Waiting Time for Consultation: Waiting time for consultation was on an average of 10 minutes
with wide range. In two cases they had to wait for more than 12 hours (Table 2).
Time spent during ward rounds: Time spent by consultant on each patient during the ward
round was on an average of 7.5 minutes (Range from 2 minutes to 60 minutes) (Table 3).
Perception about medical service: A) Consultant: According to the average scores given by
international patients the Communication skills of the treating consultant were excellent (4.45;
SD±0.73). The consultant’s visiting regularity for ward rounds had been rated as 4.39 (SD±0.86).
Similarly the means score for treatment satisfaction and behavior of consultant were 4.59
(SD±0.69) each (Table 4).
6
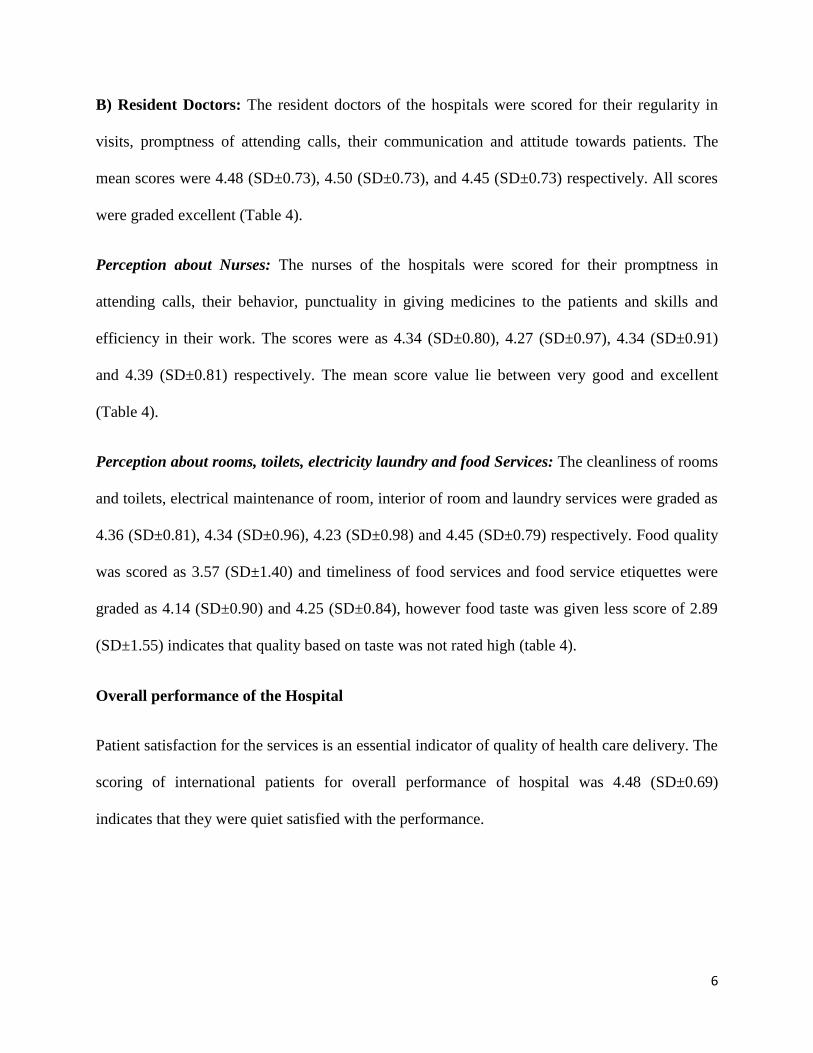
B) Resident Doctors: The resident doctors of the hospitals were scored for their regularity in
visits, promptness of attending calls, their communication and attitude towards patients. The
mean scores were 4.48 (SD±0.73), 4.50 (SD±0.73), and 4.45 (SD±0.73) respectively. All scores
were graded excellent (Table 4).
Perception about Nurses: The nurses of the hospitals were scored for their promptness in
attending calls, their behavior, punctuality in giving medicines to the patients and skills and
efficiency in their work. The scores were as 4.34 (SD±0.80), 4.27 (SD±0.97), 4.34 (SD±0.91)
and 4.39 (SD±0.81) respectively. The mean score value lie between very good and excellent
(Table 4).
Perception about rooms, toilets, electricity laundry and food Services: The cleanliness of rooms
and toilets, electrical maintenance of room, interior of room and laundry services were graded as
4.36 (SD±0.81), 4.34 (SD±0.96), 4.23 (SD±0.98) and 4.45 (SD±0.79) respectively. Food quality
was scored as 3.57 (SD±1.40) and timeliness of food services and food service etiquettes were
graded as 4.14 (SD±0.90) and 4.25 (SD±0.84), however food taste was given less score of 2.89
(SD±1.55) indicates that quality based on taste was not rated high (table 4).
Overall performance of the Hospital
Patient satisfaction for the services is an essential indicator of quality of health care delivery. The
scoring of international patients for overall performance of hospital was 4.48 (SD±0.69)
indicates that they were quiet satisfied with the performance.
7
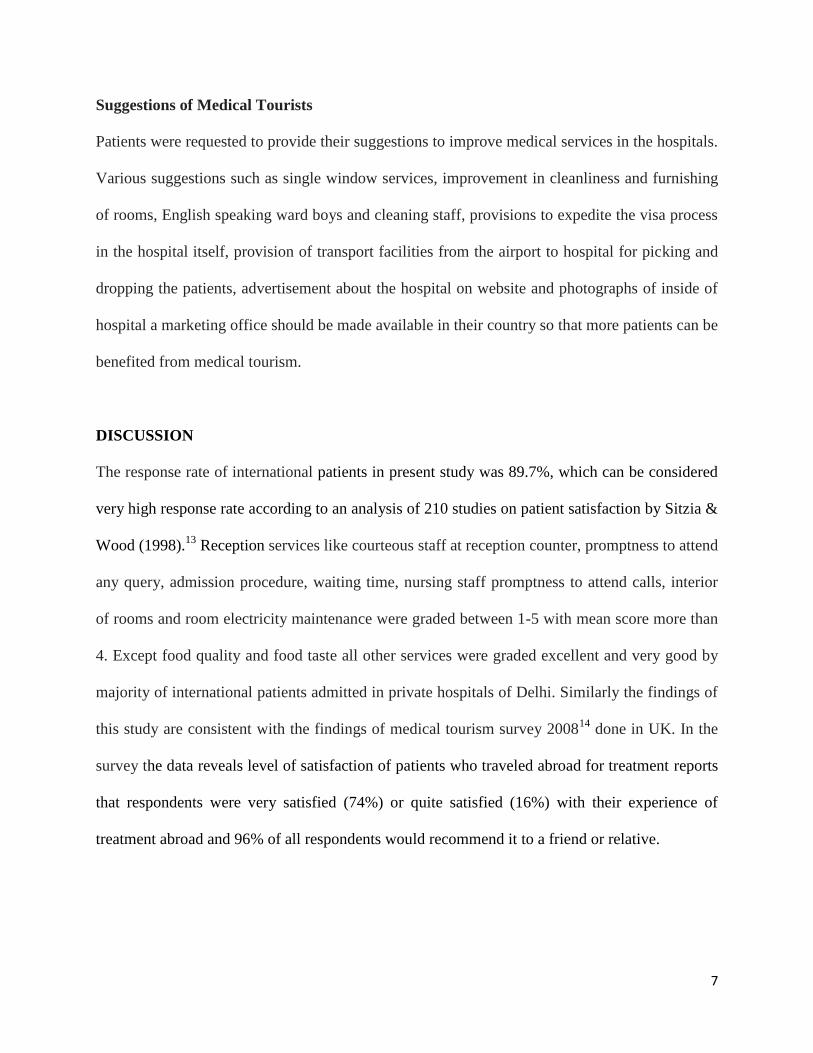
Suggestions of Medical Tourists
Patients were requested to provide their suggestions to improve medical services in the hospitals.
Various suggestions such as single window services, improvement in cleanliness and furnishing
of rooms, English speaking ward boys and cleaning staff, provisions to expedite the visa process
in the hospital itself, provision of transport facilities from the airport to hospital for picking and
dropping the patients, advertisement about the hospital on website and photographs of inside of
hospital a marketing office should be made available in their country so that more patients can be
benefited from medical tourism.
DISCUSSION
The response rate of international patients in present study was 89.7%, which can be considered
very high response rate according to an analysis of 210 studies on patient satisfaction by Sitzia &
Wood (1998).13
Reception services like courteous staff at reception counter, promptness to attend
any query, admission procedure, waiting time, nursing staff promptness to attend calls, interior
of rooms and room electricity maintenance were graded between 1-5 with mean score more than
4. Except food quality and food taste all other services were graded excellent and very good by
majority of international patients admitted in private hospitals of Delhi. Similarly the findings of
this study are consistent with the findings of medical tourism survey 200814
done in UK. In the
survey the data reveals level of satisfaction of patients who traveled abroad for treatment reports
that respondents were very satisfied (74%) or quite satisfied (16%) with their experience of
treatment abroad and 96% of all respondents would recommend it to a friend or relative.
8
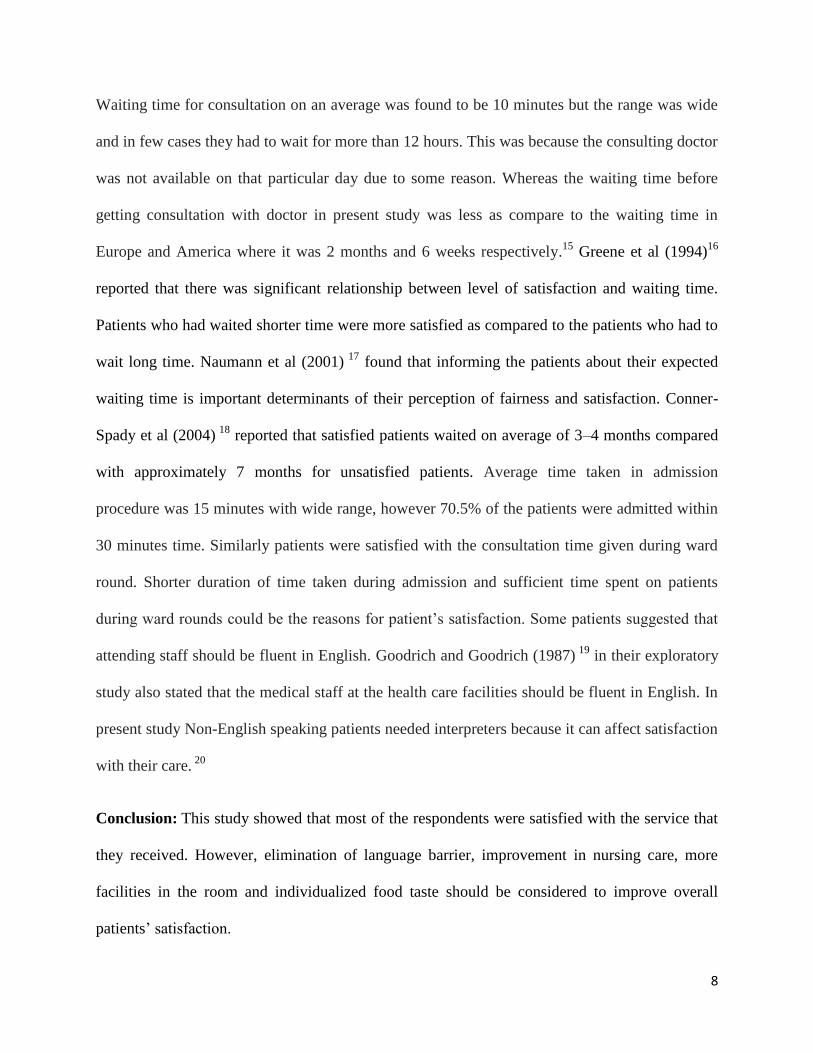
Waiting time for consultation on an average was found to be 10 minutes but the range was wide
and in few cases they had to wait for more than 12 hours. This was because the consulting doctor
was not available on that particular day due to some reason. Whereas the waiting time before
getting consultation with doctor in present study was less as compare to the waiting time in
Europe and America where it was 2 months and 6 weeks respectively.15
Greene et al (1994)16
reported that there was significant relationship between level of satisfaction and waiting time.
Patients who had waited shorter time were more satisfied as compared to the patients who had to
wait long time. Naumann et al (2001) 17
found that informing the patients about their expected
waiting time is important determinants of their perception of fairness and satisfaction. Conner-
Spady et al (2004) 18
reported that satisfied patients waited on average of 3–4 months compared
with approximately 7 months for unsatisfied patients. Average time taken in admission
procedure was 15 minutes with wide range, however 70.5% of the patients were admitted within
30 minutes time. Similarly patients were satisfied with the consultation time given during ward
round. Shorter duration of time taken during admission and sufficient time spent on patients
during ward rounds could be the reasons for patient’s satisfaction. Some patients suggested that
attending staff should be fluent in English. Goodrich and Goodrich (1987) 19
in their exploratory
study also stated that the medical staff at the health care facilities should be fluent in English. In
present study Non-English speaking patients needed interpreters because it can affect satisfaction
with their care. 20
Conclusion: This study showed that most of the respondents were satisfied with the service that
they received. However, elimination of language barrier, improvement in nursing care, more
facilities in the room and individualized food taste should be considered to improve overall
patients’ satisfaction.
9
References
1. Garud AD. Medical Tourism and its impact on our healthcare. National Medical Journal of
India 2005; 18 (6): 318-319.
2. Graham K. It was a big leap of faith. Guardian 2005; 21: 8-9.
3. Burkett L. Medical Tourism: Concerns, benefits, and the American Legal Perspective. The
Journal of Legal Medicine 2007; 28: 223-245.
4. Karen P. Insurers Investigate Medical Tourism to Save Money on Care. Business Insurance
2006; 40 (50): 17-18.
5. Bethely JG. Exploring patients: Money versus possible safety issues. Am Med News, Sept 18,
2006 [accessed on 14.9.2007]. Available from: http://www.ama-assn.org/amednews /2006/09/18 /bisa0918.htm/
6. Healthtourisminasia.com [homepage on the Internet]; 2009 [cited 2009 Oct 20]. Available
from: http://www.healthtourisminasia.com.
7. Lambart T. A Brief history of medicine. [cited 2009 Oct 20]. Available from:
http://www.localhistories.org/medicine.html/
8. CII-Mckinsey. Healthcare in India: The Road Ahead–A Report by CII-Mckinsey & Co; 2002.
9. Cleary PD, McNeil BJ. Patient satisfaction as an indicator of quality care. Inquiry 1988; 25
(1): 25-36.
10. Guadignino C. Role of patient satisfaction. Physician’s News Digest 2003 [cited 2009 Oct
20]. Available from: http://www.physiciansnews.com/cover/1203.htm/
11. Wilkin D, Hallam L and Doggett M: Measures of need and outcome for primary health care.
Oxford: Oxford Medical Publications; 1992
12. Ford RC, Bach SA and Fottler MD: Measuring of patients satifaction in health care
organizations. Health Care Management Review 1997; 22, 74-89
13. Sitzia J, Wood N. Response rate in patient satisfaction research: an analysis of 210 published
studies. International Journal for Quality in Health Care 1998; 10 (4): 311-317.
14. Medical Tourist Survey 2008. The motivations and experiences of 648 medical tourists,
Herts: Intuition Communication Ltd 2008.
15. Srivastava R. Indian Society for Apheresis and Apheresis tourism in India-Is there a future?
Transfusion and Apheresis Science 2006; 36: 139-144
16. Greene MG, Adelman RD, Friedmann E, Charo R. Older patients satisfaction with
communication during an initial medical encounter. Social Sciences and Medicine 1994;38(9):
1279- 1288
17. Naumann S, Miles JA. Managing waiting patients' perceptions: The role of process control. J Manag
Med. 2001;15:376–86.

10
18. Conner-Spady BL, Sanmugasunderam S, Courtright P, et al. Determinants of patient
satisfaction with cataract surgery and length of time on the waiting list. Br J Ophthalmol
2004;88:1305–9.
19. Goodrich G, Goodrich J. Health care tourism – an exploratory study. Tourism Management.
1987; 8: 217-222.
20. Carrasquillo O, Orav EJ, Brennan TA, Burstin HR. Impact of language barriers-on patient
satisfaction in an emergency department. Journal of General Internal Medicine 1999; 14 (2): 82-
87.
11
Table 1. Background information of International Patients
Characteristics N=44 (%)
Sex Male 26 (59.1)
Female 18 (40.9)
Age Mean Years + SD) 45.3 (+13.7)
Occupation Private 11 (25)
Government 10 (22.7)
Housewife 10 (22.7)
Doctor 3 (6.8)
Retired 3 (6.8)
Student 3 (6.8)
Agriculture 3 (6.8)
Disabled & unemployed 1 (2.3)
Country or
Regions
SAARC 17 (38.6)
Africa 12 (27.3)
USA and Canada 5 (11.4)
Gulf 2 (4.5)
Others 8 (18.2)
Visa Type Medical 30 (68.2)
Tourist 14 (31.8)
Place of stay
in Delhi
Guest House 17 (38.6)
Hospital 17 (38.6)
Hotel 8 (18.2)
Rent or Embassy 2 (4.6)
12
Table 2: Consultation and admission waiting time of International Patient
Time taken
Country/Region of medical tourists
SAARC
n=17 (%)
Africa
n=12 (%)
Gulf
n=2 (%)
USA &
Canada
n=5 (%)
Others
n=8 (%)
Total
N=44 (%)
Waiting for Consultation
0-15 minutes 9 (52.9) 6 (50) 2 (100) 4 (80) 6 (75) 27 (61.4)
16-30 minutes 3 (17.6) 2 (16.7) 0 0 1 (12.5) 6 (13.6)
31-60 minutes 2 (11.8) 2 (16.7) 0 0 0 4 (9.1)
1-4hrs 3 (17.6) 1 (8.3) 0 0 1 (12.5) 5 (11.4)
4-48 hrs 0 1 (8.3) 0 1 (20) 0 2 (4.5)
Admission Procedure
0-15 minutes 8 (47.1) 7 (58.3) 1 (50) 3 (60) 4 (50) 23 (52.3)
16-30 minutes 3 (17.6) 3 (25) 1 (50) 0 1 (12.5) 8 (18.2)
31-60 minutes 1 (5.9) 0 0 1 (20) 0 2 (4.5)
1-2hrs 4 (23.5) 2 (16.7) 0 1 (20) 1 (12.5) 8 (18.2)
2-12hrs 0 0 0 0 1 (12.5) 1 (2.3)
12-48hrs 1 (5.9) 0 0 0 1 (12.5) 2 (4.5)
Table 3: Time spent by consultant during ward rounds
Time in
Minutes
SAARC
n=17 (%)
Africa
n=12 (%)
Gulf
n=2 (%)
USA &
Canada
n=5 (%)
Others
n=8 (%)
Total
N=44 (%)
0-5 10 (58.8) 4 (33.3) 1 (50) 2 (40) 5 (62.5) 22 (50)
6-10 5 (29.4) 4 (33.3) 1 (50) 3 (60) 1 (12.5) 14 (31.8)
11-15 2 (11.8) 3 (25) 0 0 1 (12.5) 6 (13.6)
16-above 0 1 (8.3) 0 0 1 (12.5) 2 (4.6)
13
Table 4: International Patient’s perception about the quality of services
Perception about quality of services Mean SD Range
Reception information services 4.27 1.042 1-5
Courtesy 4.16 1.055 1-5
Promptness 4.18 1.147 1-5
Admission procedure waiting time 3.95 1.257 1-5
Shifting to room 4.09 1.117 1-5
Communication with Consultant 4.45 0.730 2-5
Visit regularity 4.39 0.868 2-5
Treatment Satisfaction 4.59 0.693 3-5
RD Visit regularity 4.48 0.731 3-5
RD Promptness 4.50 0.731 3-5
RD Communication & Attitude 4.55 0.730 2-5
NS Promptness in attending calls 4.27 0.973 1-5
NS Punctuality in giving medicine 4.34 0.914 1-5
NS Skill & Efficiency 4.39 0.813 2-5
NS Behavior 4.34 0.805 2-5
Room & Toilet Cleanliness 4.36 0.810 2-5
Room electrical maintenance 4.34 0.963 1-5
Interior of room 4.23 0.985 1-5
Laundry services 4.45 0.791 2-5
Food Taste 2.89 1.558 1-5
Food Quality 3.57 1.404 1-5
Food Service Timeliness 4.14 0.905 2-5
Service Etiquettes 4.25 0.839 3-5
Overall performance of hospital 4.48 0.698 3-5
Note: NS-Nursing Staff; RD-Resident Doctors
Top Related
Copyright © 2022 FDOKUMEN

