


Bahasa
Halaman
Hukum

HYDRO NEPAL | ISSUE NO. 18 | JANUARY 2016 30
Road Transportation Energy Demand and Environmental Emission: A Case of Kathmandu Valley
Introduction
The road vehicles are considered one of the main sources of urban air pollution and the consumer
of fossil fuel energy in a large number of cities, particularly in the developing countries of Asia. The Kathmandu valley, the home of 2.5 million people, is one of the fastest growing metropolitan cities in South Asia (The World bank, 2014)1. There are 18 numbers of municipalities, 3 numbers of sub-metropolis and one metropolitan city in the Kathmandu valley. This rapid urbanization in the valley has caused the tremendous increase in the vehicle numbers, especially personal vehicles in the recent years. For example, 24,003 numbers of vehicles were registered in the Kathmandu valley in the year 2000 which increased to 67,449 in 2014. This is almost 3 times increase in the vehicles registration in the Kathmandu valley compared to the year 2000. The vehicles registered in the Kathmandu valley comprises 66% of the total vehicles registered in Nepal2,3. Out of the total registered vehicles in the valley, more than 90 % are personal vehicles, mainly motorbikes (80%) and light duty vehicles like car, jeep, van and taxi (12.5%). The annual average growth rate of registered vehicles in the valley for the last 10 years has been 17%. This unprecedented growth of vehicles in the valley has put tremendous pressure on local environment. Studies have shown that one of the major reasons of air pollution in the Kathmandu valley is the growing numbers of vehicles in the valley4,5. Vehicular emission contributes to about 38% of PM10 emission in the valley6 and the concentration of this emission level is several times higher than WHO safer limit7,8.
In Nepal, transport sector consumes about 63% of total imported petroleum fuel9 and the majority of this fuel is consumed by vehicles in Kathmandu valley. In 2012, the valley consumed 46% of the total petrol and 16 % of the total diesel sales in Nepal10,
which were largely consumed in the transport sector. Nepal does not have its own sources of petroleum fuel but its contribution on the transport sector is virtually 100% and therefore, each year the country is spending a huge amount of currency earned from export earnings and remittance in the import of fuel. The import of petroleum fuel, which was 34% of the total annual earnings from the export in 2000/01 has increased to 143% of the total annual earnings from the export in 2012/1311,12 and it is increasing each year. Therefore, the economy of Nepal cannot sustain the use of petroleum fuel in the long run. Moreover, the repeated official or unofficial fuel blockade imposed by India on Nepal has created acute fuel crisis in the country. For example, the recent unofficial fuel blockade imposed by India since last September, 2015 has created severe fuel crisis in the country halting more than 75% of vehicle movement in the country. However, the government of Nepal so far has not proposed any plans to reduce the over reliance on the petroleum fuel. Therefore, it is necessary to study various options to reduce the dependency on petroleum fuel for the energy security of the country.
There are some studies in the past related to environmental emission and energy demand from transportation in the Kathmandu Valley. Shrestha and Malla4 studied the sectoral energy-use patterns, including transport sector and the associated emissions in the Kathmandu valley. The focus of the study was to build the inventory of pollutant emissions in the valley. Pradhan et al.13 studied the extension of trolley bus in the Kathmandu valley and its impact on the reduction of petroleum fuel consumption and greenhouse gas emission up to the year 2025. However, the trolley bus service was already shut down in 2009 and therefore, this study has no relevance to the present context. Ale et al.14 studied the feasibility of the introduction of hydrogen vehicles in the Kathmandu valley and its impact on the reduction of fossil fuel emissions from vehicles and import of fossil fuels for the period 2005-2020. This study was made to utilize the surplus electricity in the
Abstract: The current trade embargo imposed by India has created an acute fuel crisis in Nepal which has stranded more than 50% of public vehicles affecting the supply of all the necessities and daily life of people. This study has shown some alternative ways to manage the vehicle fuel demand especially for urban transportation in the Kathmandu valley, Nepal. The modeling tool, Long-range Energy Alternative Planning System (LEAPS) has been used to develop a bottom-up model to estimate the energy demand and environmental emissions in the Kathmandu valley for the period 2016-2030 AD. Besides the Reference scenario, four alternative scenarios (Public Bus Penetration, Improved Fuel Economy, Electric Motorbike and Hybrid Electric Car) have been developed. In the Reference scenario, the cumulative energy demand will reach 142,092 thousand GJ within the analysis period. About 65% of this demand comes from motorbikes and light duty vehicles. If all of the alternative scenarios are implemented together, about 38% of energy demand and 54% of CO2 emission can be avoided compared to the reference scenario within the study period. About 1641 million US$ at the current market price can be avoided within the analysis period if all of these four options are applied together.
Keywords: Urban transportation, LEAPS, Environmental emissions, Energy demand, Kathmandu, Nepal
Nawraj BhattaraiDr. Iswor Bajracharya and Dr. Nawraj Bhattarai Iswor Bajracharya
HYDRO NEPAL | ISSUE NO. 18 | JANUARY 2016 31
country in 2003 to produce hydrogen. However, there is a shortage of electricity in the country since 2006 and therefore, the production of hydrogen to run the automobiles will not be the priority in the present situation. Shrestha and Rajbhandari15 analyzed the sectoral energy consumption, including transport sector and emissions in the Kathmandu Valley for the period 2005-2050. Shakya and Shrestha16 studied the electrification of transport system, mainly electric train, in Nepal using the hydropower resource of the country and the resulting reduction in greenhouse gas emission and improvement in energy security for the period 2015-2050. The focus of this study was the electrification of the transport sector. However, given the present situation in the country the electrification of transport sector will not be realized at least for a foreseeable future. Dhakal17 analyzed the implications of different transportation policies on future energy demand and environmental emissions from passenger vehicles in Kathmandu valley up to the year 2020. This study does not cover the freight vehicles and the various possible scenarios such as the fuel efficiency improvement of vehicles, introduction of hybrid car, electric bikes etc.
This study has been undertaken to estimate the road transportation energy demand and associated environmental emissions from both passenger and freight vehicles in the Kathmandu valley for the period 2016-2030 and to analyze the various possible transportation policies and their impact on energy demand and environmental emissions. Long-range Energy Alternative Planning System (LEAPS) has been widely used around the world to estimate the future energy demand and greenhouse gas emission, for integrated energy planning, supply side management and transportation policy analysis18,19,20,21,22,23,24,25. This study has been also done in the LEAPS framework. This paper has been structured as follows: the first section describes the introduction and objectives of the paper; second section explains the methodology and data; the third section is about the result and analysis; discussions and conclusion are presented in fourth and fifth section respectively.
Methodology and DataThe modeling tool, LEAPS (Long-range Energy Alternative Planning System) has been used to develop a bottom-up road transportation model and analyze various transportation policies. Four parameters are required to model the transportation energy demand in LEAPS: present and future vehicle stock, vehicle-use intensity expressed in kilometers travelled by a vehicle per year (VKT), vehicle fuel-use intensity and emission factors. The vehicles have been classified as (i) bus, (ii) minibus, (iii) heavy duty vehicles (HDV) which includes truck/tripper/tanker, (iv) mini truck, (v) light duty vehicles (LDV) which includes car/jeep/van and taxi, (vi) microbus (vii) pickup and (viii) motorbikes. The registered vehicle data in the Kathmandu valley have been collected from the Department of Transport Management3 and actual gasoline and diesel consumption data have been taken from Nepal Oil Corporation26. In this study, the base year is 2010 and the first scenario year
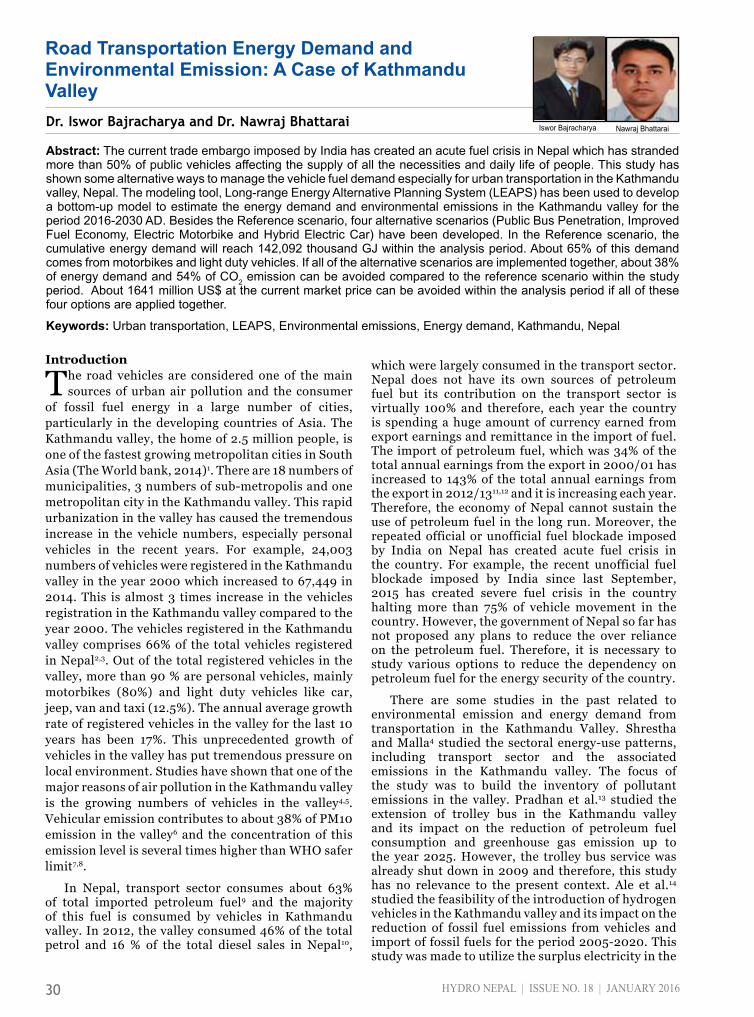
is 2016. The study period is from 2016 to 2030. Figure 1 shows the framework of bottom-up LEAPS model used in this study. The following sections describe the modeling process in LEAPS framework.
Evolution of Vehicle StockTo model the energy demand and emissions made
by vehicles, the actual vehicle fleet plying on the road has to be calculated. The statistics of the vehicle data provided by Department of Transport Management, Nepal is only the cumulative number of vehicle since their first registration and therefore, do not represent the actual vehicle fleet existing and plying on the road each year. Each year, a large number of vehicles are scrapped due to their age. If the annual scrapping rate is known, the actual vehicle fleet plying on the road can be estimated by subtracting the scrapped vehicles from the annually registered vehicles numbers. However, such data do not exist in Nepal. Therefore, the first step in the modeling of transportation energy demand is to estimate of the evolution of existing vehicle stocks plying on the road each year. The existing vehicle stock in each year can be estimated by using the following equation (1)27.
(1)
Where, Di,y is the number of vehicles of type i registered in year y, øi(y-x) is the survival probability of vehicle of type i of age (y-x). Registered vehicle data since 1990 to 2010 have been taken into account to model the vehicle stock. The survival probability of vehicle can be estimated by using following Weibull function (2) 28.
Scenario Evaluation Policy Implication
Alternative Scenarios
Energy Demand & Emission Analysis for Reference Scenario
Vehicle Life CycleProfile
Mileage degradation
profile Vehicle
Use Intensity
LEAP (Long Range Energy Alternative Planning
System) Future Vehicle Stock
Projection
Emission factors
Assumptions
Vehicle SurvivalProfile
Fuel Use Intensity
Figure 1: Framework of bottom-up LEAPS transportation energy demand model
HYDRO NEPAL | ISSUE NO. 18 | JANUARY 2016 32
(2)
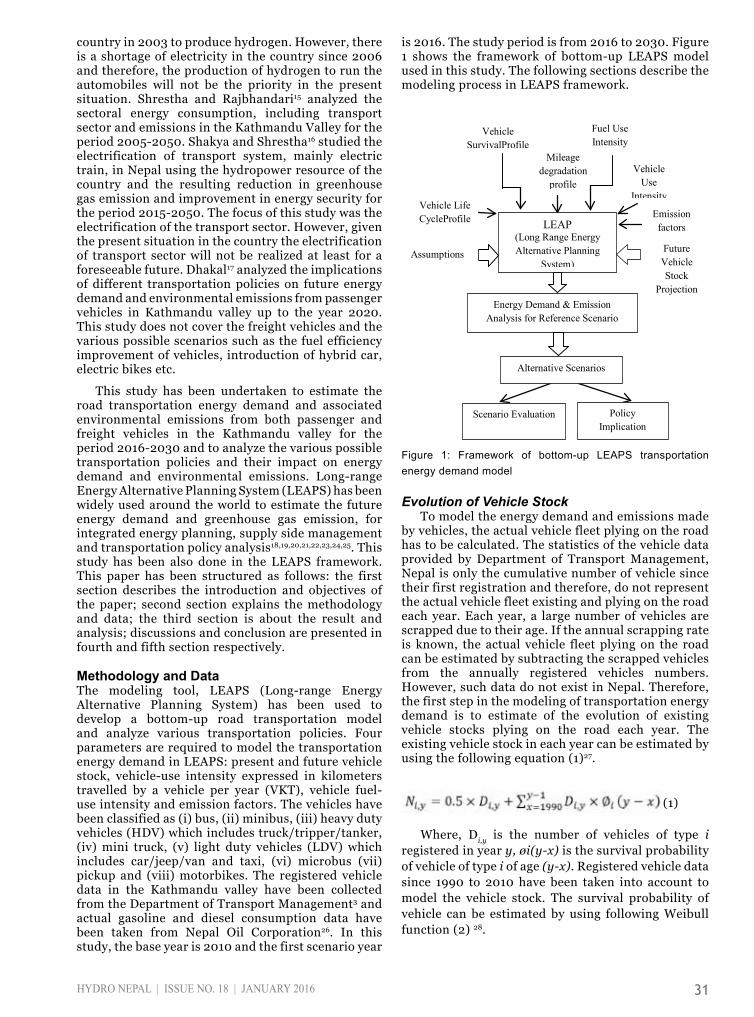
Where øi(k) is the survival probability of vehicle of type i having age k, k is the age of vehicles expressed in years, bi is the failure steepness for vehicles of type i (bi >1, i.e., the failure rate increases with age and Ti is the service life for vehicles of type i. The value of parameters b and T are important to model the in-use vehicle fleet and their values can be estimated by iterative process by matching with the actual data provided that the annual vehicle scrap data are available. But such data do not exist in Nepal and therefore, the values of b are taken as a proxy from Indian context27 as the vehicles’ origin, road and driving conditions in Nepal are similar to India. The values of T are estimated from authors’ field survey. Altogether 300 numbers of vehicles of different types were surveyed in the Kathmandu valley in 2013 and the value of T was estimated based upon the survey data. Table 1 presents the values of b and T. Survival profiles of different vehicles are presented in Figure 2. Each year's survived vehicles are calculated by multiplying the survival probability from equation (2) and the registered vehicles in each year.
Figure 2: Vehicle survival profile
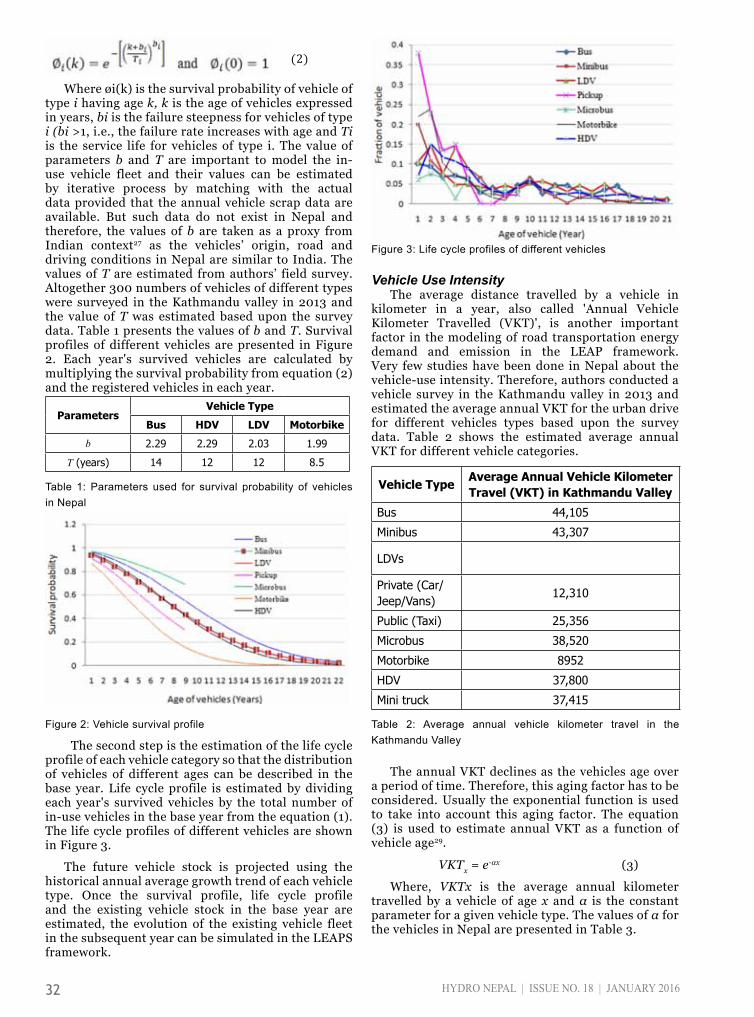
The second step is the estimation of the life cycle profile of each vehicle category so that the distribution of vehicles of different ages can be described in the base year. Life cycle profile is estimated by dividing each year's survived vehicles by the total number of in-use vehicles in the base year from the equation (1). The life cycle profiles of different vehicles are shown in Figure 3.
The future vehicle stock is projected using the historical annual average growth trend of each vehicle type. Once the survival profile, life cycle profile and the existing vehicle stock in the base year are estimated, the evolution of the existing vehicle fleet in the subsequent year can be simulated in the LEAPS framework.
Figure 3: Life cycle profiles of different vehicles
Vehicle Use IntensityThe average distance travelled by a vehicle in
kilometer in a year, also called 'Annual Vehicle Kilometer Travelled (VKT)', is another important factor in the modeling of road transportation energy demand and emission in the LEAP framework. Very few studies have been done in Nepal about the vehicle-use intensity. Therefore, authors conducted a vehicle survey in the Kathmandu valley in 2013 and estimated the average annual VKT for the urban drive for different vehicles types based upon the survey data. Table 2 shows the estimated average annual VKT for different vehicle categories.
The annual VKT declines as the vehicles age over a period of time. Therefore, this aging factor has to be considered. Usually the exponential function is used to take into account this aging factor. The equation (3) is used to estimate annual VKT as a function of vehicle age29.
VKTx = e-αx (3)
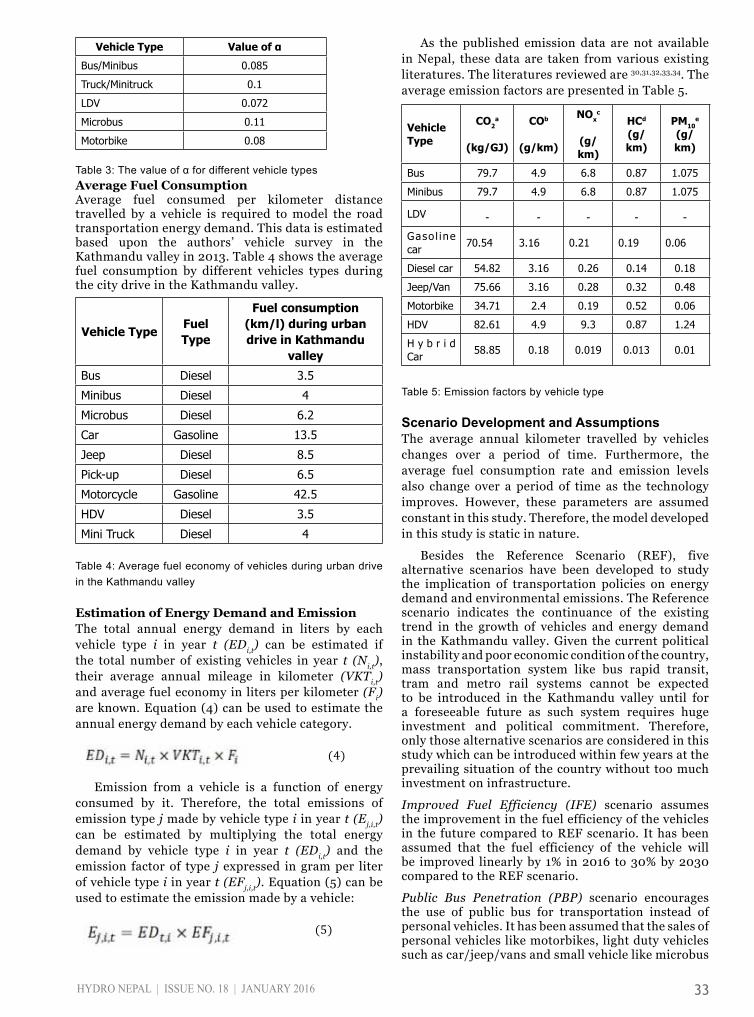
Where, VKTx is the average annual kilometer travelled by a vehicle of age x and α is the constant parameter for a given vehicle type. The values of α for the vehicles in Nepal are presented in Table 3.
ParametersVehicle Type
Bus HDV LDV Motorbike
b 2.29 2.29 2.03 1.99
T (years) 14 12 12 8.5
Table 1: Parameters used for survival probability of vehicles in Nepal
Vehicle TypeAverage Annual Vehicle Kilometer Travel (VKT) in Kathmandu Valley
Bus 44,105
Minibus 43,307
LDVs
Private (Car/Jeep/Vans)
12,310
Public (Taxi) 25,356
Microbus 38,520
Motorbike 8952
HDV 37,800
Mini truck 37,415
Table 2: Average annual vehicle kilometer travel in the Kathmandu Valley
HYDRO NEPAL | ISSUE NO. 18 | JANUARY 2016 33
Average Fuel ConsumptionAverage fuel consumed per kilometer distance travelled by a vehicle is required to model the road transportation energy demand. This data is estimated based upon the authors’ vehicle survey in the Kathmandu valley in 2013. Table 4 shows the average fuel consumption by different vehicles types during the city drive in the Kathmandu valley.
Estimation of Energy Demand and EmissionThe total annual energy demand in liters by each vehicle type i in year t (EDi,t) can be estimated if the total number of existing vehicles in year t (Ni,t), their average annual mileage in kilometer (VKTi,t) and average fuel economy in liters per kilometer (Fi) are known. Equation (4) can be used to estimate the annual energy demand by each vehicle category.
(4)
Emission from a vehicle is a function of energy consumed by it. Therefore, the total emissions of emission type j made by vehicle type i in year t (Ej,i,t) can be estimated by multiplying the total energy demand by vehicle type i in year t (EDi,t) and the emission factor of type j expressed in gram per liter of vehicle type i in year t (EFj,i,t). Equation (5) can be used to estimate the emission made by a vehicle:
(5)
As the published emission data are not available in Nepal, these data are taken from various existing literatures. The literatures reviewed are 30,31,32,33,34. The average emission factors are presented in Table 5.
Scenario Development and AssumptionsThe average annual kilometer travelled by vehicles changes over a period of time. Furthermore, the average fuel consumption rate and emission levels also change over a period of time as the technology improves. However, these parameters are assumed constant in this study. Therefore, the model developed in this study is static in nature.
Besides the Reference Scenario (REF), five alternative scenarios have been developed to study the implication of transportation policies on energy demand and environmental emissions. The Reference scenario indicates the continuance of the existing trend in the growth of vehicles and energy demand in the Kathmandu valley. Given the current political instability and poor economic condition of the country, mass transportation system like bus rapid transit, tram and metro rail systems cannot be expected to be introduced in the Kathmandu valley until for a foreseeable future as such system requires huge investment and political commitment. Therefore, only those alternative scenarios are considered in this study which can be introduced within few years at the prevailing situation of the country without too much investment on infrastructure.
Improved Fuel Efficiency (IFE) scenario assumes the improvement in the fuel efficiency of the vehicles in the future compared to REF scenario. It has been assumed that the fuel efficiency of the vehicle will be improved linearly by 1% in 2016 to 30% by 2030 compared to the REF scenario.
Public Bus Penetration (PBP) scenario encourages the use of public bus for transportation instead of personal vehicles. It has been assumed that the sales of personal vehicles like motorbikes, light duty vehicles such as car/jeep/vans and small vehicle like microbus
Vehicle Type Value of α
Bus/Minibus 0.085
Truck/Minitruck 0.1
LDV 0.072
Microbus 0.11
Motorbike 0.08
Table 3: The value of α for different vehicle types
Vehicle TypeFuel Type
Fuel consumption (km/l) during urban drive in Kathmandu
valley
Bus Diesel 3.5
Minibus Diesel 4
Microbus Diesel 6.2
Car Gasoline 13.5
Jeep Diesel 8.5
Pick-up Diesel 6.5
Motorcycle Gasoline 42.5
HDV Diesel 3.5
Mini Truck Diesel 4
Table 4: Average fuel economy of vehicles during urban drive in the Kathmandu valley
Vehicle Type
CO2a
(kg/GJ)
COb
(g/km)
NOxc
(g/km)
HCd (g/km)
PM10e
(g/km)
Bus 79.7 4.9 6.8 0.87 1.075
Minibus 79.7 4.9 6.8 0.87 1.075
LDV - - - - -
Gaso l ine car 70.54 3.16 0.21 0.19 0.06
Diesel car 54.82 3.16 0.26 0.14 0.18
Jeep/Van 75.66 3.16 0.28 0.32 0.48
Motorbike 34.71 2.4 0.19 0.52 0.06
HDV 82.61 4.9 9.3 0.87 1.24
H y b r i d Car 58.85 0.18 0.019 0.013 0.01
Table 5: Emission factors by vehicle type
HYDRO NEPAL | ISSUE NO. 18 | JANUARY 2016 34
and minibus will be decreased linearly by 1% in 2016 to 75% by 2030 and accordingly the number of public buses will be increased compared to the REF scenario.
Introduction of hybrid electric car (HEC) scenario assumes that the hybrid electric (plug in hybrid) car will be introduced in Nepal by 2016 and its sales will be increased by 1% in 2016 to 75% by 2030 and that of the conventional car will be decreased by a similar percentage compared to the REF scenario.
Use of electric motorbikes (EM) scenario encourages the use of electric motorbikes instead of conventional gasoline motorbikes. Therefore, it has been assumed that the sales of electric motorbikes will be increased by 1% in 2016 to 75% by 2030 compared to REF scenario and that of the conventional motorbikes will be decreased by a similar percentage.
Combined scenario (COM) assumes the collective efforts of all of the aforementioned scenarios for better results.
ResultsEvolution of Surviving Vehicle Fleet in Kathmandu Valley
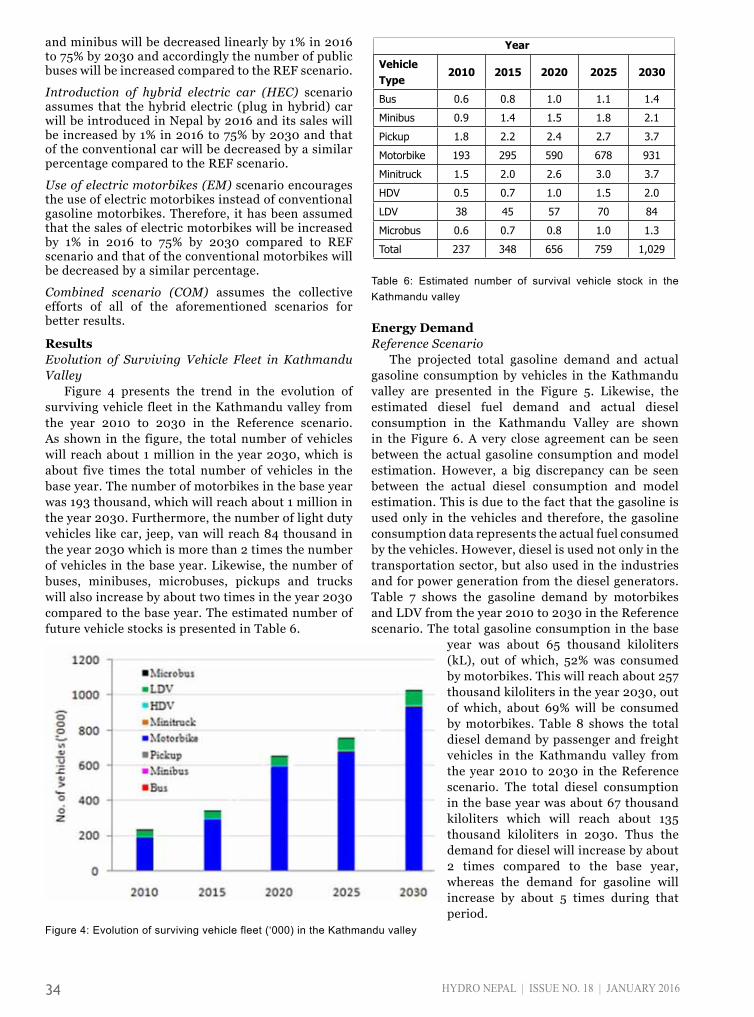
Figure 4 presents the trend in the evolution of surviving vehicle fleet in the Kathmandu valley from the year 2010 to 2030 in the Reference scenario. As shown in the figure, the total number of vehicles will reach about 1 million in the year 2030, which is about five times the total number of vehicles in the base year. The number of motorbikes in the base year was 193 thousand, which will reach about 1 million in the year 2030. Furthermore, the number of light duty vehicles like car, jeep, van will reach 84 thousand in the year 2030 which is more than 2 times the number of vehicles in the base year. Likewise, the number of buses, minibuses, microbuses, pickups and trucks will also increase by about two times in the year 2030 compared to the base year. The estimated number of future vehicle stocks is presented in Table 6.
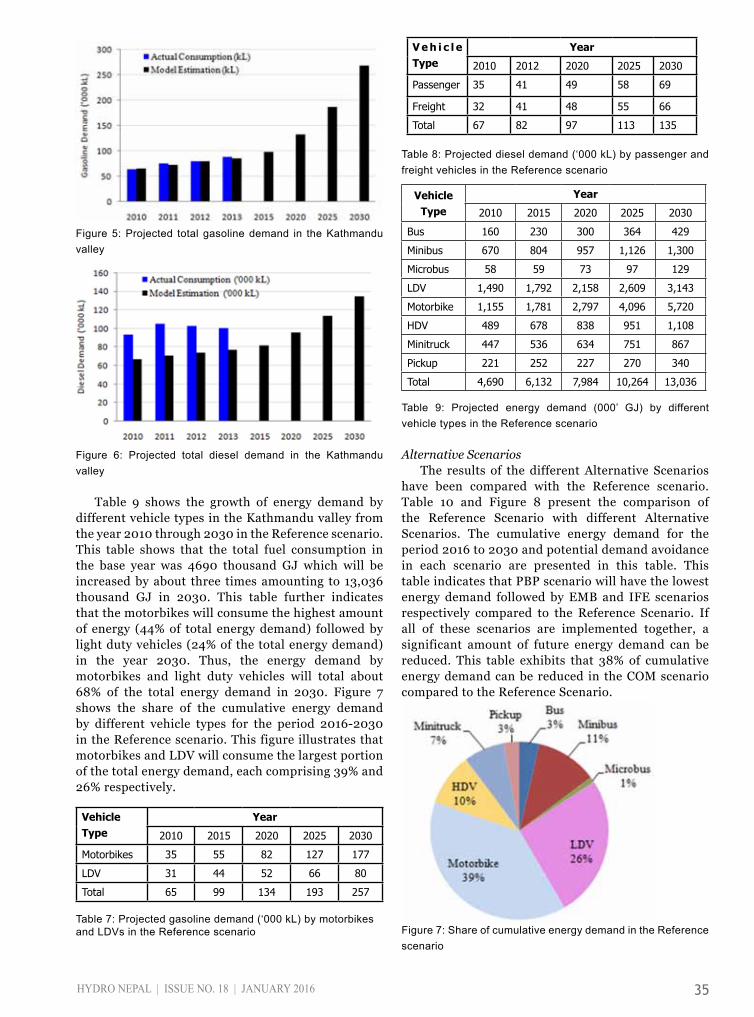
Energy DemandReference Scenario The projected total gasoline demand and actual gasoline consumption by vehicles in the Kathmandu valley are presented in the Figure 5. Likewise, the estimated diesel fuel demand and actual diesel consumption in the Kathmandu Valley are shown in the Figure 6. A very close agreement can be seen between the actual gasoline consumption and model estimation. However, a big discrepancy can be seen between the actual diesel consumption and model estimation. This is due to the fact that the gasoline is used only in the vehicles and therefore, the gasoline consumption data represents the actual fuel consumed by the vehicles. However, diesel is used not only in the transportation sector, but also used in the industries and for power generation from the diesel generators. Table 7 shows the gasoline demand by motorbikes and LDV from the year 2010 to 2030 in the Reference scenario. The total gasoline consumption in the base
year was about 65 thousand kiloliters (kL), out of which, 52% was consumed by motorbikes. This will reach about 257 thousand kiloliters in the year 2030, out of which, about 69% will be consumed by motorbikes. Table 8 shows the total diesel demand by passenger and freight vehicles in the Kathmandu valley from the year 2010 to 2030 in the Reference scenario. The total diesel consumption in the base year was about 67 thousand kiloliters which will reach about 135 thousand kiloliters in 2030. Thus the demand for diesel will increase by about 2 times compared to the base year, whereas the demand for gasoline will increase by about 5 times during that period.
Vehicle Type
2010 2015 2020 2025 2030
Bus 0.6 0.8 1.0 1.1 1.4
Minibus 0.9 1.4 1.5 1.8 2.1
Pickup 1.8 2.2 2.4 2.7 3.7
Motorbike 193 295 590 678 931
Minitruck 1.5 2.0 2.6 3.0 3.7
HDV 0.5 0.7 1.0 1.5 2.0
LDV 38 45 57 70 84
Microbus 0.6 0.7 0.8 1.0 1.3
Total 237 348 656 759 1,029
Figure 4: Evolution of surviving vehicle fleet (‘000) in the Kathmandu valley
Year
Table 6: Estimated number of survival vehicle stock in the Kathmandu valley
HYDRO NEPAL | ISSUE NO. 18 | JANUARY 2016 35
Alternative ScenariosThe results of the different Alternative Scenarios
have been compared with the Reference scenario. Table 10 and Figure 8 present the comparison of the Reference Scenario with different Alternative Scenarios. The cumulative energy demand for the period 2016 to 2030 and potential demand avoidance in each scenario are presented in this table. This table indicates that PBP scenario will have the lowest energy demand followed by EMB and IFE scenarios respectively compared to the Reference Scenario. If all of these scenarios are implemented together, a significant amount of future energy demand can be reduced. This table exhibits that 38% of cumulative energy demand can be reduced in the COM scenario compared to the Reference Scenario.
Figure 5: Projected total gasoline demand in the Kathmandu valley
Figure 6: Projected total diesel demand in the Kathmandu valley
Table 9 shows the growth of energy demand by different vehicle types in the Kathmandu valley from the year 2010 through 2030 in the Reference scenario. This table shows that the total fuel consumption in the base year was 4690 thousand GJ which will be increased by about three times amounting to 13,036 thousand GJ in 2030. This table further indicates that the motorbikes will consume the highest amount of energy (44% of total energy demand) followed by light duty vehicles (24% of the total energy demand) in the year 2030. Thus, the energy demand by motorbikes and light duty vehicles will total about 68% of the total energy demand in 2030. Figure 7 shows the share of the cumulative energy demand by different vehicle types for the period 2016-2030 in the Reference scenario. This figure illustrates that motorbikes and LDV will consume the largest portion of the total energy demand, each comprising 39% and 26% respectively.
Vehicle Type
Year
2010 2015 2020 2025 2030
Motorbikes 35 55 82 127 177
LDV 31 44 52 66 80
Total 65 99 134 193 257
Table 7: Projected gasoline demand (‘000 kL) by motorbikes and LDVs in the Reference scenario
V e h i c l e Type
Year
2010 2012 2020 2025 2030
Passenger 35 41 49 58 69
Freight 32 41 48 55 66
Total 67 82 97 113 135
Vehicle Type
Year
2010 2015 2020 2025 2030
Bus 160 230 300 364 429
Minibus 670 804 957 1,126 1,300
Microbus 58 59 73 97 129
LDV 1,490 1,792 2,158 2,609 3,143
Motorbike 1,155 1,781 2,797 4,096 5,720
HDV 489 678 838 951 1,108
Minitruck 447 536 634 751 867
Pickup 221 252 227 270 340
Total 4,690 6,132 7,984 10,264 13,036
Table 9: Projected energy demand (000’ GJ) by different vehicle types in the Reference scenario
Table 8: Projected diesel demand (‘000 kL) by passenger and freight vehicles in the Reference scenario
Figure 7: Share of cumulative energy demand in the Reference scenario
HYDRO NEPAL | ISSUE NO. 18 | JANUARY 2016 36
Figure 8: Comparison of different scenarios
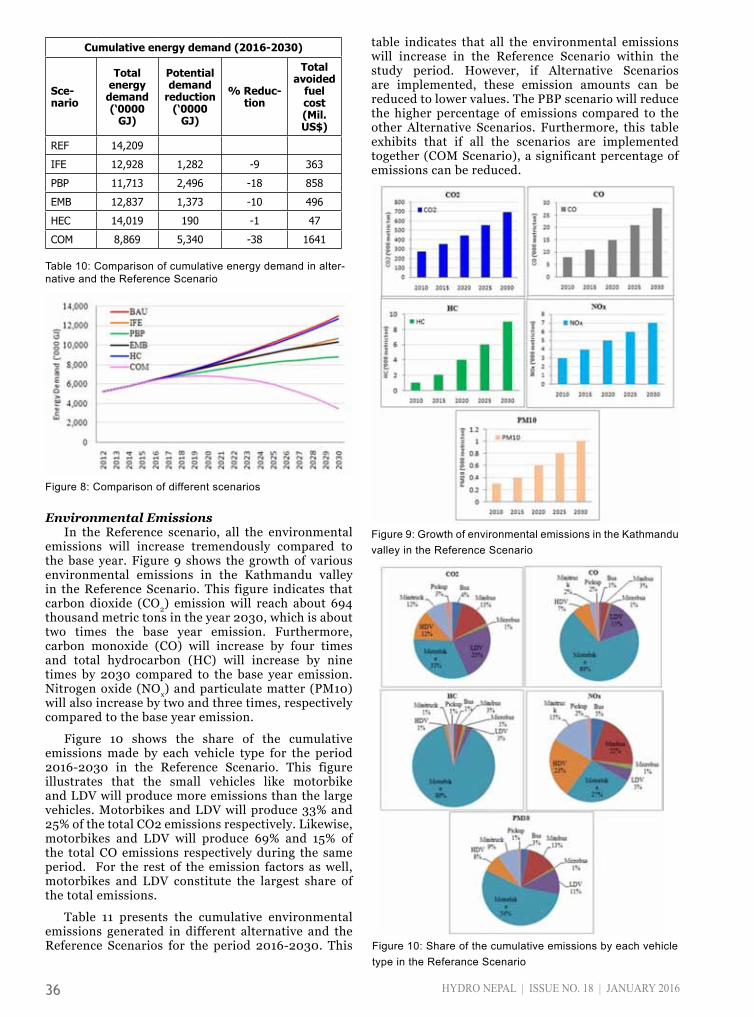
Environmental EmissionsIn the Reference scenario, all the environmental
emissions will increase tremendously compared to the base year. Figure 9 shows the growth of various environmental emissions in the Kathmandu valley in the Reference Scenario. This figure indicates that carbon dioxide (CO2) emission will reach about 694 thousand metric tons in the year 2030, which is about two times the base year emission. Furthermore, carbon monoxide (CO) will increase by four times and total hydrocarbon (HC) will increase by nine times by 2030 compared to the base year emission. Nitrogen oxide (NOx) and particulate matter (PM10) will also increase by two and three times, respectively compared to the base year emission.
Figure 10 shows the share of the cumulative emissions made by each vehicle type for the period 2016-2030 in the Reference Scenario. This figure illustrates that the small vehicles like motorbike and LDV will produce more emissions than the large vehicles. Motorbikes and LDV will produce 33% and 25% of the total CO2 emissions respectively. Likewise, motorbikes and LDV will produce 69% and 15% of the total CO emissions respectively during the same period. For the rest of the emission factors as well, motorbikes and LDV constitute the largest share of the total emissions.
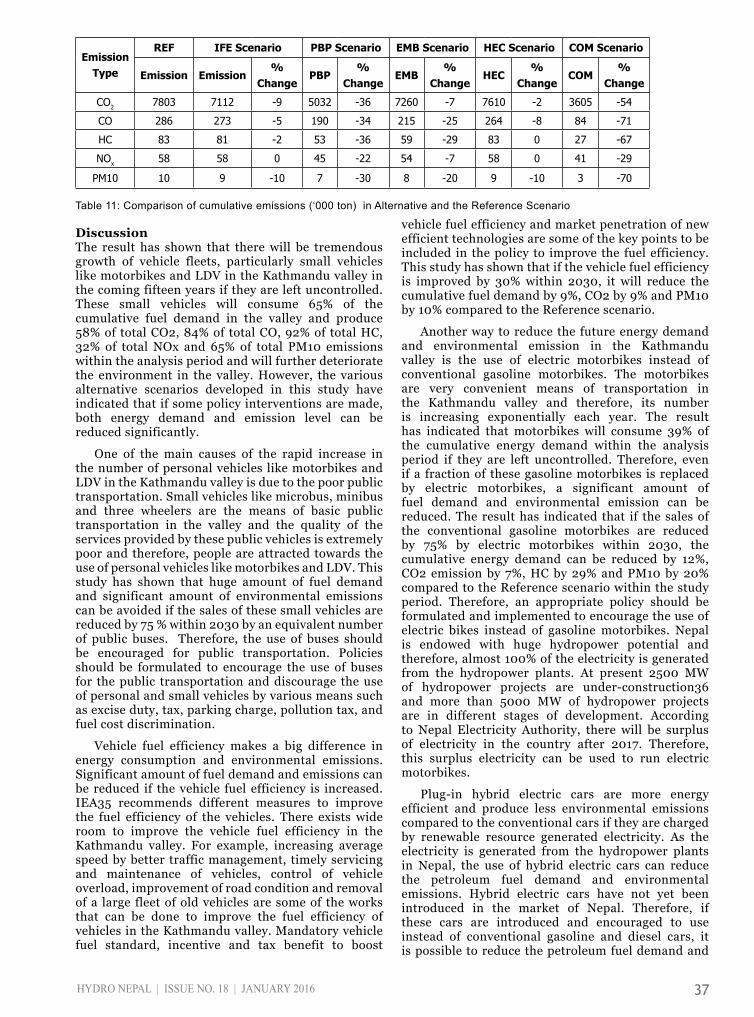
Table 11 presents the cumulative environmental emissions generated in different alternative and the Reference Scenarios for the period 2016-2030. This
table indicates that all the environmental emissions will increase in the Reference Scenario within the study period. However, if Alternative Scenarios are implemented, these emission amounts can be reduced to lower values. The PBP scenario will reduce the higher percentage of emissions compared to the other Alternative Scenarios. Furthermore, this table exhibits that if all the scenarios are implemented together (COM Scenario), a significant percentage of emissions can be reduced.
Figure 9: Growth of environmental emissions in the Kathmandu valley in the Reference Scenario
Cumulative energy demand (2016-2030)
Sce-nario
Total energy demand (‘0000
GJ)
Potential demand
reduction (‘0000
GJ)
% Reduc-tion
Total avoided
fuel cost (Mil. US$)
REF 14,209
IFE 12,928 1,282 -9 363
PBP 11,713 2,496 -18 858
EMB 12,837 1,373 -10 496
HEC 14,019 190 -1 47
COM 8,869 5,340 -38 1641
Table 10: Comparison of cumulative energy demand in alter-native and the Reference Scenario
Figure 10: Share of the cumulative emissions by each vehicle type in the Referance Scenario
HYDRO NEPAL | ISSUE NO. 18 | JANUARY 2016 37
DiscussionThe result has shown that there will be tremendous growth of vehicle fleets, particularly small vehicles like motorbikes and LDV in the Kathmandu valley in the coming fifteen years if they are left uncontrolled. These small vehicles will consume 65% of the cumulative fuel demand in the valley and produce 58% of total CO2, 84% of total CO, 92% of total HC, 32% of total NOx and 65% of total PM10 emissions within the analysis period and will further deteriorate the environment in the valley. However, the various alternative scenarios developed in this study have indicated that if some policy interventions are made, both energy demand and emission level can be reduced significantly.
One of the main causes of the rapid increase in the number of personal vehicles like motorbikes and LDV in the Kathmandu valley is due to the poor public transportation. Small vehicles like microbus, minibus and three wheelers are the means of basic public transportation in the valley and the quality of the services provided by these public vehicles is extremely poor and therefore, people are attracted towards the use of personal vehicles like motorbikes and LDV. This study has shown that huge amount of fuel demand and significant amount of environmental emissions can be avoided if the sales of these small vehicles are reduced by 75 % within 2030 by an equivalent number of public buses. Therefore, the use of buses should be encouraged for public transportation. Policies should be formulated to encourage the use of buses for the public transportation and discourage the use of personal and small vehicles by various means such as excise duty, tax, parking charge, pollution tax, and fuel cost discrimination.
Vehicle fuel efficiency makes a big difference in energy consumption and environmental emissions. Significant amount of fuel demand and emissions can be reduced if the vehicle fuel efficiency is increased. IEA35 recommends different measures to improve the fuel efficiency of the vehicles. There exists wide room to improve the vehicle fuel efficiency in the Kathmandu valley. For example, increasing average speed by better traffic management, timely servicing and maintenance of vehicles, control of vehicle overload, improvement of road condition and removal of a large fleet of old vehicles are some of the works that can be done to improve the fuel efficiency of vehicles in the Kathmandu valley. Mandatory vehicle fuel standard, incentive and tax benefit to boost
vehicle fuel efficiency and market penetration of new efficient technologies are some of the key points to be included in the policy to improve the fuel efficiency. This study has shown that if the vehicle fuel efficiency is improved by 30% within 2030, it will reduce the cumulative fuel demand by 9%, CO2 by 9% and PM10 by 10% compared to the Reference scenario.
Another way to reduce the future energy demand and environmental emission in the Kathmandu valley is the use of electric motorbikes instead of conventional gasoline motorbikes. The motorbikes are very convenient means of transportation in the Kathmandu valley and therefore, its number is increasing exponentially each year. The result has indicated that motorbikes will consume 39% of the cumulative energy demand within the analysis period if they are left uncontrolled. Therefore, even if a fraction of these gasoline motorbikes is replaced by electric motorbikes, a significant amount of fuel demand and environmental emission can be reduced. The result has indicated that if the sales of the conventional gasoline motorbikes are reduced by 75% by electric motorbikes within 2030, the cumulative energy demand can be reduced by 12%, CO2 emission by 7%, HC by 29% and PM10 by 20% compared to the Reference scenario within the study period. Therefore, an appropriate policy should be formulated and implemented to encourage the use of electric bikes instead of gasoline motorbikes. Nepal is endowed with huge hydropower potential and therefore, almost 100% of the electricity is generated from the hydropower plants. At present 2500 MW of hydropower projects are under-construction36 and more than 5000 MW of hydropower projects are in different stages of development. According to Nepal Electricity Authority, there will be surplus of electricity in the country after 2017. Therefore, this surplus electricity can be used to run electric motorbikes.
Plug-in hybrid electric cars are more energy efficient and produce less environmental emissions compared to the conventional cars if they are charged by renewable resource generated electricity. As the electricity is generated from the hydropower plants in Nepal, the use of hybrid electric cars can reduce the petroleum fuel demand and environmental emissions. Hybrid electric cars have not yet been introduced in the market of Nepal. Therefore, if these cars are introduced and encouraged to use instead of conventional gasoline and diesel cars, it is possible to reduce the petroleum fuel demand and
Emission Type
REF IFE Scenario PBP Scenario EMB Scenario HEC Scenario COM Scenario
Emission Emission%
ChangePBP
% Change
EMB%
ChangeHEC
% Change
COM%
Change
CO2 7803 7112 -9 5032 -36 7260 -7 7610 -2 3605 -54
CO 286 273 -5 190 -34 215 -25 264 -8 84 -71
HC 83 81 -2 53 -36 59 -29 83 0 27 -67
NOx 58 58 0 45 -22 54 -7 58 0 41 -29
PM10 10 9 -10 7 -30 8 -20 9 -10 3 -70
Table 11: Comparison of cumulative emissions (‘000 ton) in Alternative and the Reference Scenario
HYDRO NEPAL | ISSUE NO. 18 | JANUARY 2016 38
environmental emissions. Policy has to be formulated and implemented to encourage the use of hybrid cars.
If all of the aforementioned four alternatives are implemented together, a significant amount of energy and environmental emission can be avoided. This study has shown that 38% of the cumulative energy demand with a cost of about 1641 million US dollars at the current market price can be avoided within the analysis period if all of these four options are applied together. Moreover, 54% of CO2 and 70% of PM10 can be avoided within the analysis period. A good transportation policy should include all of these four options.
ConclusionThis study is very important in the present context of Nepal as the country is facing severe fuel crisis due to the trade embargo imposed by India. This study has presented the growth trend in the evolution of different vehicle types, their energy demand and associated environmental emissions in the Kathmandu valley in the coming 15 years and also shown the various possible mitigation scenarios to manage the growth of these vehicles, reduce energy demand and environmental emissions. The concept of vehicle survivability has been used to estimate the evolution of the actual vehicles existing on the road due to the lack of the annual vehicle scrap data. Weibull distribution function along with the life cycle profile of the vehicle has been used for this purpose. These estimated vehicle numbers has been used to project the future energy demand and emissions by vehicles.
This study has shown that the fuel demand and environmental emissions will increase sharply in the Reference Scenario. However, the different mitigation scenarios discussed in this study can be used to reduce the energy demand and environmental emissions in the Kathmandu valley. Although the systems like bus rapid transit, tram and metro rail system can be analyzed, these systems cannot be implemented in the Kathmandu valley at least for a foreseeable future due to the political instability and poor economic condition of the country. The mitigation scenarios discussed in this study have shown a good result and can be introduced without much investment on infrastructure.
The reference scenario has shown that the motorbikes and LDVs are the major sources of pollutants and energy consumer in the Kathmandu valley. The gasoline motorbike will consume the highest amount of fuel (39%) followed by the LDVs (26%). Moreover, gasoline motorbike will produce 33% and LDV will produce 25% of total CO2 emissions in the Kathmandu valley. Out of the considered mitigation scenarios, public bus penetration scenario will help for a modal shift from gasoline motorbikes, LDVs and microbus to large bus which helps reduce the significant amount of energy demand and emissions. The result has shown that the cumulative energy demand will be reduced by 19%, CO2 emission by 36%, CO by 34% and PM10 by 30 % compared to the Reference Scenario if this scenario is
implemented. Likewise, the improved fuel economy, electric motorbike and hybrid electric car scenarios will reduce the cumulative energy demand by 9%, 12% and 1% respectively compared to the Reference Scenario. If all the scenarios are implemented together (combined scenario), the cumulative energy demand can be reduced by 38% within the analysis period. Likewise, all the environmental emissions will be reduced significantly if this scenario is implemented.
- -
AcknowledgementsThe authors would like to acknowledge Mr. Rupak Ghimire and Mrs. Sarita Bajracharya from Kathmandu for helping the vehicle survey in Kathmandu. The authors also acknowledge COMMEND team, Stockholm Environment Institute-US Center for waiving the license fee for the use of LEAPS energy modeling software.
Iswor Bajracharya, obtained his PhD in 2015 from the Department of Mechanical Engineering, Vienna University of Technology, Austria. He holds master's degree in Mechatronics from Gwangju Institute of Science and Technology, South Korea and Bachelor's degree in Mechanical Engineering from Institute of Engineering, Tribhuvan University, Nepal. Currently, he is working as a visiting lecturer at Institute of Engineering, Pulchowk Campus, Nepal. His area of interest is energy system modeling & simulation, renewable energy system, energy planning, energy mapping with GIS and energy energy resource assessment and hydrological modeling
Corresponding E-mail: [email protected]
Nawraj Bhattarai holds PhD from the Department of Mechanical Engineering, Vienna University of Technology, Austria. He has done M.Sc. in Renewable Energy Engineering and B.E. in Mechanical Engineering, both from Institute of Engineering, Tribhuvan University, Nepal. He is working as an Assistant Professor at Institute of Engineering, Central Campus, Tribhuvan University, Nepal. His area of research is the energy system planning and policy analysis and renewable energy system design. He has supervised a number of M.Sc. students at department of Mechanical Engineering, Tribhuvan University. Dr. Bhattarai has also served as a Deputy Director of the Center for Energy Studies, Tribhuvan University.
E-mail: [email protected]
Referance1. The World Bank, Managing Nepal's Urban
Transition. Accessed on December 19, 2014; <http://www.worldbank.org/en/news/feature/2013/04/01/
HYDRO NEPAL | ISSUE NO. 18 | JANUARY 2016 39
13. Pradhan S, Ale BB, Amatya VB, Mitigation potential of greenhouse gas emission and implications on fuel consumption due to clean energy vehicles as public passenger transport in Kathmandu Valley of Nepal: A case study of trolley buses in Ring Road. Energy 31(12), 1748-1760.
14. Ale BB, Bade SO, Introduction of hydrogen vehicles in Kathmandu Valley: A clean and sustainable way of transportation, Renewable Energy 34(6), 1432-1437.
15. Shrestha RM, Rajbhandari S, Energy and environmental implications of carbon emission reduction targets: Case of Kathmandu Valley, Nepal, Energy Policy 38(9), 4818-4827.
16. Shakya SR, Shrestha RM, Transport sector electrification in a hydropower resource rich developing country: Energy security, environmental and climate change co-benefits, Energy for Sustainable Development 15(2), 147-159.
17. Dhakal S, Implications of transportation policies on energy and environment in Kathmandu Valley, Nepal, Energy Policy 31(14), 1493-1507.
18. Bose RK, Srinivasachary V, Policies to reduce energy use and environmental emissions in the transport sector: A case of Delhi city, Energy Policy25(14-15), 1137-1150.
19. El-Fadel M, Chedid R, Zeinati M, Hmaidan W, Mitigating energy-related GHG emissions through renewable energy, Renewable Energy 28(8), 1257-1276.
20. Ahanchian M, Biona JBM, Monitoring Transportation, Air Pollution and Energy Demand in Philippines using LEAP, Proceedings of the ASME 2011 International Mechanical Engineering Congress & Exposition, Denver, Colorado, IMECE2011-64995.
21. Bautista S, A sustainable scenario for Venezuelan power generation sector in 2050 and its costs, Energy Policy 44(2012), 331-340.
22. Islas J, Manzini F, Omar M, A prospective study of bioenergy use in Mexico, Energy 32(12), 2306-2320.
23. Huang Y, Bor YJ, Peng CY, The long-term forecast of Taiwan's energy supply and demand: LEAP model application, Energy Policy 39(11), 6790-6803.
24. Hosier RH, Urban energy systems in Tanzania: A tale of three cities, Energy Policy 21(5), 510-523.
25. Mustonen SM, Rural energy survey and scenario analysis of village energy consumption: A case study in Lao People's Democratic Republic, Energy Policy 38(2), 1040-1048.
26. The World Bank, Diesel power generation: inventories and black carbon emissions in Kathmandu valley, Nepal, 2014. Accessed: September 9, 2014; < http://www.indiaenvironmentportal.org.in/files/file/Diesel%20Power%20Generation.pdf >.
27. Bidya S, Borken-Kleefeld J, Atmospheric emissions from road transportation in India, Energy Policy 37(10), 3812-3822.
28. Zachariadis T, Ntziachristos L, Samaras Z, The effect of age and technological change on motor
managing-nepals-urban-transition>2. Ministry of Physical Infrastructure and Transport,
Department of Transport Management, Government of Nepal, Registration of Transport in Bagmati, Fiscal Year 2046/47-070/71 office wise. Accessed: October 21, 2014; <http://www.dotm.gov.np/ uploads/files/transport_registration_fiscal_year_2046_47_070_71_typewise.pdf >.
3. Ministry of Physical Infrastructure and Transport, Department of Transport Management, Government of Nepal, Registration of Transport in Bagmati, Fiscal Year 2046/47-070/71. Accessed: October 20, 2014; <www.dotm.gov.np/uploads/files/ Registration%20of20Transport%20inBagmati.pdf >.
4. Shrestha RM, Malla S, Air pollution from energy use in a developing country city: The Case of Kathmandu Valley, Energy 21(9), 785-794.
5. Shakya P, Department of Environment, Kathmandu Metropolitan City Office, Air Pollutionin Kathmandu Valley. Accessed: August 13, 2012, <http://www.unescap.org /esd/ environment/kitakyuu/urban_air/city_report/kathmandu.pdf >.
6. Gautam, C, Final Report on Action Program on Air Quality Management of Kathmandu Valley, Ministry of Environment, Science and Technology, Government of Nepal, Kathmandu, 2006.
7. World Health Organization (WHO),Ambient (outdoor) air pollution in cities database 2014. Accessed: December 22, 2014; < http://www.who.int/phe/health_topics /outdoorair/databases/cities/en>
8. World Health Organization (WHO), Ambient (outdoor) air quality and health, 2014. Accessed: December 22, 2014; < http://www.who.int/media centre/ factsheets/fs313/en/ >.
9. Water and Energy Commission Secretariat (WECS), Energy Sector Synopsis Report. Government of Nepal, 2010. Accessed: July 19, 2012, < http://www.wecs.gov.np/pdf/snyopsis.pdf >.
10. Nepal Rastra Bank, Research Department, Economic Development, Survey Report on the share of Kathmandu Valley in the national economy, 2012. Accessed: December 25, 2014; < http://www.red.nrb.org.np/publications/study_reports/Study_Reports--The_Share_of_Kathmandu_Valley_in_theNational_Economy.pdf >.
11. Government of Nepal, Ministry of Finance (MoF), Economic Survey, Table 10, Vol. 1; 2010/11. Accessed: August 23, 2012, < http://www.mof.gov.np/uploads/ document/file/english_full_20130715042623.pdf >.
12. Government of Nepal, Ministry of Commerce and Supplies, Trade and Export Promotion Center, Foreign Trade Statistics of Nepal, Comparison of total imports of some major commodities in the first ten months of the Fiscal Year 2012/13 and 2013/14. Accessed: December 20, 2014; <http://www.tepc.gov.np/news-events/details.php?id=26 >.
HYDRO NEPAL | ISSUE NO. 18 | JANUARY 2016 40
vehicle emissions, Transportation Research Part D: Transport and Environment 6(3), 221-227.
29. U.S. Department of Transportation, NHTSA, National Center for Statistics and Analysis, Technical Report 2006, Vehicle Survivability and Travel Mileage Schedules. Accessed: August 9, 2012, < http://www-nrd.nhtsa.dot.gov/Pubs/ 809952.pdf>.
30. Air Quality Monitoring Project-Indian Clean Air Program (ICAP),Source Profiling for Vehicular Emissions 2009. Accessed: October 24, 2012, < http://www.cpcb.nic.in/ Source_Profile_Vehicles.pdf >.
31. Nepal Vehicle Mass Emission Standard (NVMES), 1999. Accessed: September 11, 2012, <http:// www.propublic.org/tai/download/vehicle2000.pdf>.
32.Ramachandra TV, Shwetmala, Emissions from India's transport sector: Statewise synthesis, Atmospheric Environment 43(34): 5510-5517.
33.Howey DA, Martinez-Botas RM, Cussons B, Lytton L.
Comparative measurement of energy consumption of 51 electric hybrid and combustion engine vehicles. Transportation Research D 16 (6), 459-464.
34. United Nations Environment Program (UNEP). Hybrid Electric Vehicles: An overview of current technology and its application in developing and transitional countries 2009. Accessed: August 23, 2012, < http://www.unep.org/transport/pcfv/PDF/ HEV_ Report.pdf >.
35. International Energy Agency (IEA), Improving the Fuel Economy of Road Vehicles: A Policy Package, Policy Pathway, OECD/IEA2012. Accessed: June 25, 2014: < http://www.iea.org/publications/freepublications/publication/PP5_Fuel_Economy_FINAL_WEB.pdf >.
36. Nepal Electricity Authority (NEA), Annual Report 2015, pp.111.Accessed: August 10, 2015. Available at: < http://www.nea.org.np/images/supportive_docs/ year-review-2014-15.pdf >
Top Related
Copyright © 2022 FDOKUMEN

