


Bahasa
Halaman
Hukum


Journal of Marketing and Consumer Research www.iiste.org
ISSN 2422-8451 An International Peer-reviewed Journal
Vol.17, 2015
65
Relationship between Marketing Strategies and Firms’ Financial
Performance in Food Producers Sector of Pakistan
Muhammad Waseem Ur Rehman Talha Shaikh Muhammad Shadab Abdul Sattar
MS-Scholar, Mohammad Ali Jinnah University, Karachi
Abstract
Study reflects the effect of marketing strategies on the firm’s financial performance. Marketing strategy is not
just evaluating the external and internal factors, but it also needs to be financed efficiently to develop an
attractive product and distribution channel, and to hire an effective sales team to generate business support for
the firm. The study incorporates secondary data of 14 firms of Food Producers Sector for the period of five year
from 2009 to 2013. The study compared low marketing cost firms and high marketing cost firms in the terms of
their sales revenue and financial performance. The findings of this research paper contribute to marketing
theories, by using the marketing expense as a variable to know the influence on financial performance of a firm.
Overall descriptive and econometric results suggest that firms can achieve financial performance through
appropriate marketing strategy. The study is a contribution in the field of marketing research and provides
managers useful insight in their own strategic decisions.
Keywords: Financial Performance, Low and High Marketing Costs Firms, Sales Revenue, Selling and
Marketing Expenses.
JEL Classification: M31, G39
1. Introduction
The research is attempted to know the importance of selling and marketing expense in the firms and its financial
benefits. Marketing strategy is not just evaluating the external and internal factors, but it also needs to be
financed efficiently to develop an attractive product and distribution channel, and to hire an effective sales team
to generate business support for the firm. A firm with efficient marketing strategy could achieve its long term
objectives, higher returns from financial aspect, and un-substitutable advantage in the market. There is a
significant relationship between capabilities and performance (Barney, 1986; Peteraf, 1993; Makadok, 2001).
Cross functional relationships exist in different departments, therefore it also exist between marketing
and operations. According to Porter (1985) marketing and operations are the two key functional areas that affix
and create value to customers. According to Wind, 2005, it is broadly accepted even among business leaders that
skill to incorporate cross-functional know-how is essential for continued enlargement and profitability. The
concept of strategic marketing also defines that before developing a strategy the departments which are stake
holders of the company should give opportunity to develop their own strategy, and then all those strategies to be
analyzed as whole to develop an effective and long term beneficial strategy. In this context marketing
department is financed on the basis of the strategy provided by them to develop and generate new business
opportunities using marketing mix techniques. According to Hitt, Hoskisson and Kim (1997) argued that the
ability of an organization to manage diversification depends on their cross-functional capabilities and
coordination activities.
Evaluation of internal strength is necessary in order to establish distinctive capabilities in the market.
Resource Based Value (RBV) is a concept which determines that company needs to evaluate their internal
strength in order to achieve opportunities available in the market. According to Amit and Schoemaker (1993),
they define resource as “stocks of available factors that are owned or controlled by the firm”. RBV theory
proposes that every firm has a unique set of resources and potential, and some capabilities will have greater
impact on financial performance than the others (Song, Benedetto & Nason, 2007).
Market oriented strategies gives firm an advantage to accept changing in the market and create new
opportunities to achieve competitive advantages. Firm finds market gaps or demand which are not fulfilled and
through their distinctive capabilities in order to achieve superior performance. Marketing capability creates a
strong brand image that allows firms to produce superior performance (Ortega & Villaverde, 2008).
1.1. Objectives of Study
The work is done to describe the relationship between marketing strategies and firms’ financial performance and
the importance of marketing strategies in Food Producers Sector of Pakistan. The study can be used in future for
decision making by the experts and professionals in the sector of Food Producers. With the help of this work
they can study the impact of marketing strategies on the firms’ financial performance. The study is for academic
purposes therefore the scope is not too much broad. The basic aims and objectives of the study are as under:
i. Compare the high and low marketing costs firms on the basis of last five years data.
ii. Compare the sales revenue between low and high marketing costs firms.

Journal of Marketing and Consumer Research www.iiste.org
ISSN 2422-8451 An International Peer-reviewed Journal
Vol.17, 2015
66
iii. Study the impact of marketing strategies on financial performance.
iv. Does financial performance creates the ways to increase marketing expenditures?
1.2. Hypotheses of Study
a. H0a: µlow = µhigh (Sales revenue of both groups A and B is equal)
H1a: µlow ≠ µhigh (Sales revenue of both groups A and B is unequal)
b. H0b: ρ ≤ 0 (Relationship between marketing costs and sales revenue may be negative)
H1b: ρ > 0 (Relationship between marketing costs and sales revenue is positive)
c. H0c: ϑn = 0 (Insignificant impact studies between sales revenue and marketing costs)
H1c: ϑn ≠ 0 (Significant impact studies between sales revenue and marketing costs)
d. H0d: ₣ = 0 (Selling and marketing expenses do not Granger cause sales revenue)
H1d: ₣ ≠ 0 (Selling and marketing expenses Granger cause sales revenue)
e. H0e: ϐn = 0 (Marketing strategies insignificantly impact the financial performance)
H1e: ϐn ≠ 0 (Marketing strategies significantly impact the financial performance)
2. Literature Review
In the light of Research Problems, this study represents the most appropriate literature on relationship between
marketing strategies and firm’s financial performance. According to Porter (1985), he disagreed that all practical
areas of business contribute towards goods delivery and services but marketing and operations are the two key
functional areas that affix and create value to customers.
According to Ho and Tang (2004), difference between these two functions direct to production
incompetence and customer dissatisfaction; whereas a proper fit lead to better competitive benefit and
sustainable returns.
According to Wind (2005), it is broadly accepted even among business leaders that skill to incorporate
such cross-functional know-how is essential for continued enlargement and profitability.
Resource Base View theory proposes that every firm has a unique set of resources and potential, and
some capabilities will have greater impact on financial performance than the others (Song, Benedetto & Nason,
2007).
According to Liebermann & Dhawan, 2005, efficiency is described as the ratio of a firm’s return to that
of its input is measured in terms of the most feasible output which can be acquired with a given set of inputs.
According to Ittner and Larcker (1996), senior executives distinguish the value of customers. They still
believe heavily on financial measures because customer metrics are not clearly defined. Furthermore, techniques
exist for evaluating the financial return from particular marketing expenditures (e.g. advertising, direct mailing
and sales promotion) given a longitudinal history of expenditure.1
According to Schultz and Gronstedt (1997), the condition of an extensive record of longitudinal data
has made the application of return on investment (ROI) models fairly unusual in marketing. As a result, Upper
Management has too often viewed marketing expenditures as short term costs rather than long term investments
and as financially inexplicable.
Strategic marketing literature has studied widely the costs and the benefits of diversification strategy
and its impact on competitive advantage for an organization (see Chakrabarti, Singh & Mahmood, 2007; Palich,
Cradinal & Miller, 2000; Ramanujam & Varadarajan, 1989).
Researchers have particularly focused on the effect of product/service diversification which is defined
as the synergy in different lines of business (Berger & Ofcek, 1995; Bettis & Mahajan, 1985).
According to Hitt, Hoskisson and Kim (1997), they argued that the ability of an organization to manage
such diversification depends on their cross-functional capabilities and coordination activities.
It is widely accepted that efficient linkage of various internal functions within an organization and
interactions among them is crucial to manage the ‘curvilinear effects’ of diversification on performance (see
Narasimhan & Kim, 2002; Palich et al., 2000).
According to Amit and Schoemaker (1993), they define resource as “stocks of available factors that are
owned or controlled by the firm”. According to Barney, 1986; strategic marketing researchers have used RBV to
understand the inter-firm difference in performance.
In addition, the result suggests that there is a significant relationship between capabilities and
performance. Strategic management researchers have used Resource Base View to understand the inter-firm
difference in performance. (see Barney, 1986; Peteraf, 1993; Makadok, 2001).
According to Resource Base View a coordinated effort by the firm to make these two capabilities as
“immovable and inimitable” can bring the competitive edge (Dutta et al., 1999; Liebermann & Dhawan, 2005;
Narsimhan, Rajiv, & Dutta, 2006).
1 For a review, see article by Berger et al. 2002

Journal of Marketing and Consumer Research www.iiste.org
ISSN 2422-8451 An International Peer-reviewed Journal
Vol.17, 2015
67
The role of being “market driven” and its impact on firm performance has been an active area of
research in marketing discipline (Songetal, 2008). The marketing capability creates a strong brand image that
allows firms to produce superior performance (Ortega & Villaverde, 2008).
3. Data and Methodology
The study is all about the relationship between marketing strategies and firms’ financial performance. The study
focuses on descriptive and explanatory research designs. The study incorporates secondary data of 14 firms of
Food Producers Sector for the period of five year from 2009 to 2013. In starting 17 firms those are listed on
Balance Sheet Analysis of State Bank of Pakistan were selected for the study but unavailability of complete data
3 firms had to be dropped. The study incorporates data from 2009 to 2013 because State Bank of Pakistan only
published data up to 2013 and study avoided to collect the data from different sources to reduce the variation in
observations. In this study the total 14 firms were qualified for further analysis and study distributes these firms
in two groups (Group A and Group B). In Group A the seven firms are included on the basis of their selling and
marketing expenses, the firms those average selling and marketing costs were less than 300 million are in Group
A and the firms those spend more than 300 million on selling and marketing are in Group B. The details of both
groups are given in table 1.
Table 1
Group A Firms Group B Firms
1. Clover Pakistan Ltd. 1. Engro Food Ltd.
2. Mitchell's Fruit Farms Ltd. 2. Ismail Industries Ltd.
3. Murree Brewery Co. Ltd. 3. National Foods Ltd.
4. Noon Pakistan Ltd. 4. Nestle Pakistan Ltd.
5. Punjab Oil Mills Ltd. 5. Rafhan Maize Products Co. Ltd.
6. Quice Food Industries Ltd. 6. Shezan International Ltd.
7. S.S. Oil Mills Ltd. 7. Unilever Pakistan Ltd.
The study first describes the relationship between marketing and selling expenses and sales revenue. In
section 4.1 the relationship in firms of ‘Group A’ was described and in section 4.2 the relationship in firms of
‘Group B’ was described with the help of bar charts. Furthermore, the section 4.3 describes the difference
between low and high marketing costs firms with respect to their sales revenue. Study also compares the means
of both groups to test the difference between sales revenue of low and high marketing costs firms. The study
uses multi-stage regression first the simultaneous regression models were run to study the relationship between
sales revenue and marketing and selling expenses respectively and secondly the study uses simple regression to
study the impact of marketing costs on firms’ financial performance. Details relevant to the regression model and
variables are as under:
Flow Diagram 1: Theoretical Framework
бi,t = ϐ0 + ϐ1Ъi,t + ₰i,t ........................ (1)
Where; б = Dependent variable performance
Ъ = Independent variable capital structure
i,t = Script for the panel data
ϐ1 = Slope coefficient
ϐ0 = Intercept
₰ = Stochastic disturbance term

Journal of Marketing and Consumer Research www.iiste.org
ISSN 2422-8451 An International Peer-reviewed Journal
Vol.17, 2015
68
Table 2
Dependent Variables (б) Independent Variable (Ъ)
Proxy. Proxy.
1. Inventory Turnover
2. Return on Assets
3. Return on Equity
4. Net Profit Margin
5. Earnings per Share
INVT
ROA
ROE
NPM
EPS
1. Log of Selling & Marketing
Expenses LSME
4. Empirical Results and Discussion
4.1. Descriptive Analysis of Low Marketing Costs Firms
In the first section of results the study emphasizes the sales performance of low marketing costs firms those are
in ‘Group A’. According to figure A-1 given in appendix section, Clover Pakistan Limited had high sales
revenue in 2009 and 2010 due to spending more on selling and marketing further thereafter from 2011 they
reduced their selling and marketing costs due to which a measure decline studied in their sales revenue. Figure
A-2 given in appendix represents the sales revenue and marketing trends of Mitchell’s Fruits Farms Limited
which clearly describes the growth in sales revenue due to increase in selling and marketing expenses. In
Appendix section, the bar diagrams relevant to all companies of ‘Group A’ are presented and all figures
approximately explain the positive relationship between marketing costs and sales revenue.
4.2. Descriptive Analysis of High Marketing Costs Firms
In this section the firms those marketing expenditure is more than 300 million are included and described
simultaneously with the help of descriptive bar charts (see figures given in appendix section). High marketing
costs firms’ sales revenue has been gradually increasing since 2009. Engro Foods Limited which was recently
entered into the market and now today a measure competitor of existent firms Nestle Pakistan Limited and
Unilever Pakistan Limited just because of best marketing plans. Moreover, study focuses on the relationship
between marketing costs and sales revenue in ‘Group B’ firms which is also positive and is discussed further in
detail with help of correlation analysis in section 4.3.
4.3. Comparison between Low and High Marketing Costs Firms
The study divided the firms in two categories with respect to a benchmark of 300 million Rupees expenditure on
selling and marketing. The firms those spend less than the benchmark have been placed in ‘Group A’ and firms
those spend more than benchmark have been placed in ‘Group B’.
Figure 1
Multiple-bar diagram (in Figure 1) is based on the average selling and marketing expenses and sales
revenue of ‘Group A’ and ‘Group B’ firms. Firms those spend less on selling and marketing would avail low
sales revenue instead of firms those selling and marketing expenses are high. In Figure 1, the amount sales
revenue of the firms of ‘Group B’ is very large than ‘Group A’ firms. The comparison in the form of percentage
Journal of Marketing and Consumer Research www.iiste.org
ISSN 2422-8451 An International Peer-reviewed Journal
Vol.17, 2015
69
is covered in Figure 2 and 3.
Figure 2
The comparison between low and high selling and marketing expenses firms in the terms of percentage
is covered in Figure 2. The figure 2 explains that the portion of ‘Group A’ firms is very small with respect to
total expenditure on selling and marketing. The Group ‘A’ firms’ portion is just 5% and remaining 95% is taken
by Group ‘B’ firms.
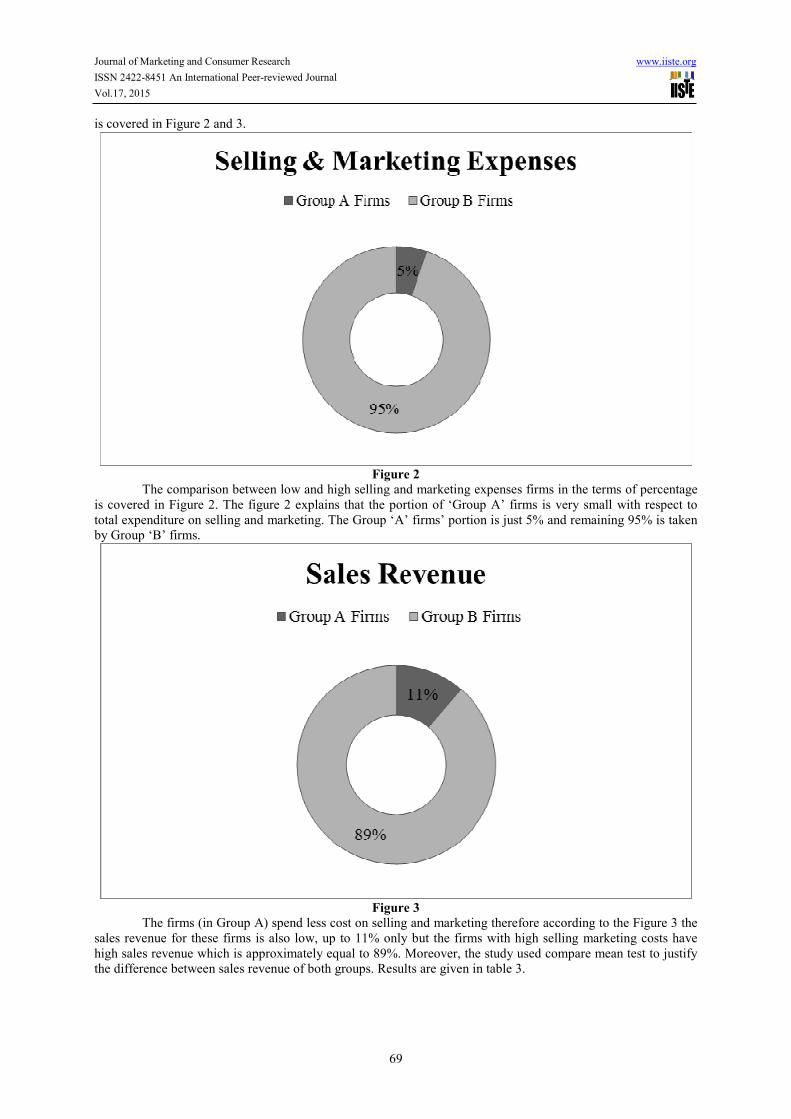
Figure 3
The firms (in Group A) spend less cost on selling and marketing therefore according to the Figure 3 the
sales revenue for these firms is also low, up to 11% only but the firms with high selling marketing costs have
high sales revenue which is approximately equal to 89%. Moreover, the study used compare mean test to justify
the difference between sales revenue of both groups. Results are given in table 3.

Journal of Marketing and Consumer Research www.iiste.org
ISSN 2422-8451 An International Peer-reviewed Journal
Vol.17, 2015
70
Table 3: Comparison between average sales revenue of Group A and Group B firms:
t-statistic p-value
-4.269 0.0000
There was no evidence studied to accept H0a, so it can be concluded from this evidence that the selling
and marketing expenses create differences in the sales revenue and it was also explained by descriptive analysis.
Furthermore, to test the relationship between selling and marketing expenses and sales revenue, the study uses
Pearson’s correlation the results are given in table 4.
Table 4: Results of Pearson’s correlation:
Correlation Matrix Sales Revenue
Selling & Marketing Expenses 0.963736
The results explained the strongly positive correlation between selling and marketing expenses and
sales revenue. It means that due to increase in marketing cost the sales revenue would also increase. Therefore,
the study has no evidence to accept H0b. Furthermore to confirm this relationship the study uses two
simultaneous regression models.
ᵴi,t = φ0 + φ1ᵯi,t + ęi,t ........................ (2)
ᵯi,t = φ0 + φ1ᵴi,t + ęi,t ........................ (3)
The simultaneous models were used to study the impact between marketing and sales both. ᵴ represents
the sales revenue, ᵯ represents the selling and marketing expenses, φ used for intercept and slope coefficient,
and ę is error term in above two models. The models were regressed with the help of E-views simultaneously
and results are as under:
ᵴi,t = 1691650 + 8.155ᵯi,t + ęi,t ........................ (4)
ᵯi,t = -117575 + 0.1138ᵴi,t + ęi,t ........................ (5)
The 3rd model explains the impact of selling and marketing expenses on sales revenue. The 3rd model is
highly significant with F-statistic 860.8 and R-square 98.88% which means that the marketing costs strongly
impact the sales revenue because t-statistic of selling and marketing expenses is 29.34 with p-value near to zero.
The 4th model explains the impact of sales revenue on selling and marketing expenses. The F-statistic of 4th
model is also 860.8 with R-square 98.88% and sales revenue highly impact selling and marketing expenses
because t-statistics is 29.34 with very small near to zero p-value therefore, no evidence studied to accept H0c.
Both regression and correlation clearly explained that the relationship between sales and marketing expenses and
sales revenue is significant in Food Producers sector of Pakistan. With the help of regression and correlation the
impact between both variables is studied but for causal relationship between both variables the study used
Granger Causality Test and results are given in Table 5.
Table 5:
Null Hypothesis Obs. F-statistic p-value
Selling & marketing expenses do not Granger cause sales
revenue
35 16.4078 0.000000
There were highly significant causal impact of selling and marketing expenses studied on sales revenue,
therefore, the study also explains positive relationship between both variables and study cannot accept H0d. It the
also a fact that the sales revenue can be maximized by improving marketing strategies but the study rises another
question related to the impact of selling and marketing expenses on performance indicators.
4.4. Significance of Relationship between Marketing Strategies and Firms’ Financial Performance
The study uses simple regression model which is given in equation 1. For testing the impact of selling and
marketing expenses on performance indicators the study run five models with respect to change in dependent
variables.
INVTi,t = -1.307 + 2.612 LSMEi,t + ₰i,t ........................ (6)
First model regressed with dependent variable inventory turnover and independent variable log of
selling and marketing expenses in equation 6. The model regressed under ordinary least square method with
cross-section weights and results explained that selling and marketing expenses significantly impact the
inventory turnover with t-statistic 2.52 and p-value 0.015. Therefore, the marketing costs positively impact the
inventory turnover at level of significance 0.05. The F-statistic of model is 21.17 with p-value 0.0000 and
weighted R-square is 84.83% and un-weighted R-square is 38.07%. Note that all models from equation 6 to 10
were regressed under ordinary least square method with Panel EGLS (Cross-section weights).
ROAi,t = -22.114 + 7.002 LSMEi,t + ₰i,t ........................ (7)
In equation 7, the dependent variable is return on asset and independent variable is log of selling and
marketing expenses. The log of selling and marketing expenses significantly impact the return on assets with t-
statistic 2.54 and p-value 0.0142. Furthermore, the impact is positive. F-statistic of model is 17.45 with p-value
0.0000 means that the model is highly significant and goodness of fit of model on the basis of weighted R-square
is 82.17% and un-weighted is 56.63%.

Journal of Marketing and Consumer Research www.iiste.org
ISSN 2422-8451 An International Peer-reviewed Journal
Vol.17, 2015
71
ROEi,t = -134.055 + 32.108 LSMEi,t + ₰i,t ........................ (8)
In equation 8, the dependent variable is return on equity the model explains the impact of marketing
costs on return on equity. Selling and marketing expenses positively impacts the return on assets and the impact
is significant with t-statistic 6.184 and p-value 0.0000. The F-statistics of model is also highly significant up to
the value of 17.08 with near to zero p-value and weighted R-square is 81.86% and un-weighted is 66.77%.
NPMi,t = -10.744 + 9.967 LSMEi,t + ₰i,t ........................ (9)
For testing the impact of marketing costs on net profit margin the study used equation 9. The model
conveys the insignificant positive impact with t-statistic 1.807 having p-value 0.0764. F-statistic of the model is
2.10 with weighted R-square 35.39% and un-weighted R-square 20.91%. Net profit margin does not depend on
selling and marketing expenses because profitability may not be affected due to selling and marketing expenses.
EPSi,t = -12.205 + 9.802 LSMEi,t + ₰i,t ........................ (10)
Furthermore, the study incorporated earnings per share as a dependent variable through which the
significance of marketing costs can be tested. According to equation 10, the marketing costs positively impact
earnings per share with t-statistic of 4.299 and p-value of 0.0001. The model in equation 10 is also highly
significant with F-statistic 23.1 and the goodness of fit of the model in weighted R-square is 85.92% and un-
weighted R-square is 89.19%.
4.5. Discussion of Results
The study based on different types of analysis to explain the relationship between firms’ financial performance
and marketing strategies. For this regards the study incorporated two different stages of analysis. At first stage
the relationship between sales revenue and selling and marketing expenses was studied with the help of
descriptive diagrams, compare mean test, Pearson’s correlation, ordinary least square regression and Granger
causality test. All analysis clearly explained the significant relationship between sales revenue and marketing
costs. The firms which spends less on selling and marketing can captured less sales revenue and market shares
instead of the firms those marketing expenditures are high can avail high sales revenue and new opportunities to
defend external threats. Study is not only limited to test the relationship between marketing strategies and sales
volume, the study also contributes the information related to the marketing strategies and firms’ financial
performance. For this relationship the study incorporated five dependent variables; inventory turnover, return on
assets, return on equity, net profit margin and earnings per share. All models are highly significant at level of
significance 0.01 instead of the model of net profit margin which is insignificantly related with selling and
marketing expenses. There was no evidence studied to accept H0e therefore it can be concluded from the results
that marketing strategies boost sales as well as play an important role in improving financial performance.
5. Conclusion and Recommendations
Study reflects the effect of marketing strategies on the firm’s financial performance. The appropriate strategy has
an impact on overall performance of the organization, helpful in the development of competency to develop
better relationships in the market. Marketing strategy at least minimizes various challenges or threat and
maximizes the chance to avail opportunities. Most of the businesses are in the race of gaining competitive
advantages against their competitors through distinctive capabilities in order to get superior performance.
Competitive advantage can be achieved through application of appropriate marketing strategy with technological
support and strong investments.
The relationship between marketing strategy and firm’s financial performance has been a topic of major
discussion for scholars. In this research paper we focused to know the use of marketing strategy and its impact
on firm’s financial performance, and overall descriptive and econometric results suggest that firms can achieve
financial performance through appropriate marketing strategy. The findings of this research paper contribute to
marketing theories, by using the marketing expense as a variable to know the influence on financial performance
of a firm. Our study contributes in the field of marketing research and provides managers useful decision tools to
guide their own strategic decisions.
References
Porter, M. (1985). Competitive advantage. New York: Free Press.
Ho, T. H., & Tang, C. S. (2004). Introduction to the special issue on marketing and operations management
interfaces and coordination. Management Science, 50(4), 430-430.
Wind, Y. (2005). Marketing as an engine of business growth: A cross functional perspective. Journal of
Business Research, 58(7), 863−872.
Desarbo, W. S., Benedetto, C. A. D., Song, M., & Sinha, I. (2005). Revisiting the Miles and Snow strategic
framework: Uncovering interrelationships between strategic types, capabilities, environmental
uncertainty, and firm performance. Strategic Management Journal, 26, 47−74.
Liebermann, M. B., & Dhawan, R. (2005). Assessing the resource base of Japanese and US auto producers: A

Journal of Marketing and Consumer Research www.iiste.org
ISSN 2422-8451 An International Peer-reviewed Journal
Vol.17, 2015
72
stochastic frontier function production approach. Management Science, 51(7), 1060−1075.
Ittner, Christopher, David Larcker. (1998). Are non-financial mea-sures leading indicators of financial
performance? An analysis of customer satisfaction. Journal of Accounting Research, 36(3), 1–35.
Berger, Paul D., Ruth N. Bolton, Douglas Bowman, Elten Briggs, V. Kumar, A. Parasuraman, and Creed Terry
(2002), “Marketing Actions and the Value of Customer Assets: A Framework for Customer Asset
Management,” Journal of Service Research, 5 (1), 39–54.
Schultz, Don E. and Anders Gronstedt (1997). Making Marcom an Investment. Marketing Management, 6 (3),
40–49.
Chakrabarti, A., Singh, K., & Mahmood, I. (2007). Diversification and performance: Evidence from East Asian
firms. Strategic Management Journal, 28(2), 101−120.
Berger, P. G., & Ofek, E. (1995). Diversifications effect of firm value. Journal of FinancialEeconomics, 37,
39−65.
Hitt, M. A., Hoskisson, R. E., & Kim, H. (1997). International diversification: Effects of innovation and firm
performance in product diversified firms. Academy of Management Journal, 40, 767−798.
Narasimhan, R., & Kim, S. W. (2002). Effects of supply chain integration on the relationship between
diversification and performance: Evidence from Japanese and Korean firms. Journal of Operations
Management, 20, 303−323.
Amit, R., & Schoemaker, P. J. (1993). Strategic assets and organisational rent. Strategic Management Journal,
14(1), 33−46.
Barney, J. B. (1986). Strategic factor markets: Expectations, luck and business strategy. Management Science,
32, 1231−1241.
Songetal, (2008). Relationships between strategic types and firm performance. Strategic Management Journal,
26, 47−75.
Dutta, S., Narashiman, O., & Surendra, R. (1999). Success in high technology markets: Is marketing capability
critical? Marketing Science, 18(4), 547−568.
Ortega, & Villaverde, 2008, marketing strategies and firm profitability index, Management Journal, 19(A), 596
796.
Narsimhan, O., Rajiv, S., & Dutta,S. (2006). Absorptive capacity in high technology markets:
The competitive advantage of the haves. Marketing Science, 25(5), 510−524.
Appendix
Group ‘A’ Firms: Firms those selling and marketing expenses are less than 300 million Rupees:
Figure A-1

Journal of Marketing and Consumer Research www.iiste.org
ISSN 2422-8451 An International Peer-reviewed Journal
Vol.17, 2015
73
Figure A-2
Figure A-3

Journal of Marketing and Consumer Research www.iiste.org
ISSN 2422-8451 An International Peer-reviewed Journal
Vol.17, 2015
74
Figure A-4
Figure A-5

Journal of Marketing and Consumer Research www.iiste.org
ISSN 2422-8451 An International Peer-reviewed Journal
Vol.17, 2015
75
Figure A-6
Figure A-7
Group ‘B’ Firms: Firms those selling and marketing expenses are more than 300 million Rupees:

Journal of Marketing and Consumer Research www.iiste.org
ISSN 2422-8451 An International Peer-reviewed Journal
Vol.17, 2015
76
Figure B-1
Figure B-2

Journal of Marketing and Consumer Research www.iiste.org
ISSN 2422-8451 An International Peer-reviewed Journal
Vol.17, 2015
77
Figure B-3
Figure B-4

Journal of Marketing and Consumer Research www.iiste.org
ISSN 2422-8451 An International Peer-reviewed Journal
Vol.17, 2015
78
Figure B-5
Figure B-6

Journal of Marketing and Consumer Research www.iiste.org
ISSN 2422-8451 An International Peer-reviewed Journal
Vol.17, 2015
79
Figure B-7
Top Related
Copyright © 2022 FDOKUMEN

